UNITED STATES SECURITIES AND EXCHANGE COMMISSION
Washington, D.C. 20549
FORM 10-Q
☒ QUARTERLY REPORT PURSUANT TO SECTION 13 OR 15(d) OF THE SECURITIES
EXCHANGE ACT OF 1934
For the quarterly period ended June 30, 2017
OR
☐ TRANSITION REPORT PURSUANT TO SECTION 13 OR 15(d) OF THE SECURITIES
EXCHANGE ACT OF 1934
Commission File Number 1-11758

(Exact Name of Registrant as specified in its charter)
Delaware (State or other jurisdiction of incorporation or organization) | 1585 Broadway New York, NY 10036 (Address of principal executive offices, including zip code) | 36-3145972 (I.R.S. Employer Identification No.) | (212) 761-4000 (Registrant's telephone number, including area code) |
Indicate by check mark whether the Registrant (1) has filed all reports required to be filed by Section 13 or 15(d) of the Securities Exchange Act of 1934 during the preceding 12 months (or for such shorter period that the Registrant was required to file such reports), and (2) has been subject to such filing requirements for the past 90 days. Yes ☒ No ☐
Indicate by check mark whether the Registrant has submitted electronically and posted on its corporate Web site, if any, every Interactive Data File required to be submitted and posted pursuant to Rule 405 of Regulation S-T (§ 232.405 of this chapter) during the preceding 12 months (or for such shorter period that the Registrant was required to submit and post such files). Yes ☒ No ☐
Indicate by check mark whether the Registrant is a large accelerated filer, an accelerated filer, a non-accelerated filer, smaller reporting company, or an emerging growth company. See the definitions of "large accelerated filer," "accelerated filer," "smaller reporting company," and "emerging growth company" in Rule 12b-2 of the Exchange Act. (Check one):
Large Accelerated Filer ☒ | Accelerated Filer ☐ | |
Non-Accelerated Filer ☐ | Smaller reporting company ☐ | |
(Do not check if a smaller reporting company) | Emerging growth company ☐ |
If an emerging growth company, indicate by check mark if the Registrant has elected not to use the extended transition period for complying with any new or revised financial accounting standards provided pursuant to Section 13(a) of the Exchange Act. ☐
Indicate by check mark whether the Registrant is a shell company (as defined in Rule 12b-2 of the Exchange Act). Yes ☐ No ☒
As of July 31, 2017, there were 1,836,580,691 shares of the Registrant's Common Stock, par value $0.01 per share, outstanding.
QUARTERLY REPORT ON FORM 10-Q
For the quarter ended June 30, 2017
| Table of Contents | Part | Item | Page | |||||||||
Financial Information | I | 1 | ||||||||||
Management's Discussion and Analysis of Financial Condition and Results of Operations | 2 | 1 | ||||||||||
Introduction | 1 | |||||||||||
Executive Summary | 2 | |||||||||||
Business Segments | 7 | |||||||||||
Supplemental Financial Information and Disclosures | 18 | |||||||||||
Accounting Development Updates | 18 | |||||||||||
Critical Accounting Policies | 19 | |||||||||||
Liquidity and Capital Resources | 19 | |||||||||||
Quantitative and Qualitative Disclosures about Market Risk | 3 | 31 | ||||||||||
Controls and Procedures | 4 | 41 | ||||||||||
Report of Independent Registered Public Accounting Firm | 42 | |||||||||||
Financial Statements | 1 | 43 | ||||||||||
Consolidated Financial Statements and Notes | 43 | |||||||||||
Consolidated Income Statements (Unaudited) | 43 | |||||||||||
Consolidated Comprehensive Income Statements (Unaudited) | 44 | |||||||||||
Consolidated Balance Sheets (Unaudited at June 30, 2017) | 45 | |||||||||||
Consolidated Statements of Changes in Total Equity (Unaudited) | 46 | |||||||||||
Consolidated Cash Flow Statements (Unaudited) | 47 | |||||||||||
Notes to Consolidated Financial Statements (Unaudited) | 48 | |||||||||||
1. Introduction and Basis of Presentation | 48 | |||||||||||
2. Significant Accounting Policies | 49 | |||||||||||
3. Fair Values | 50 | |||||||||||
4. Derivative Instruments and Hedging Activities | 62 | |||||||||||
5. Investment Securities | 67 | |||||||||||
6. Collateralized Transactions | 71 | |||||||||||
7. Loans and Allowance for Credit Losses | 73 | |||||||||||
8. Equity Method Investments | 76 | |||||||||||
9. Deposits | 76 | |||||||||||
10. Long-Term Borrowings and Other Secured Financings | 77 | |||||||||||
11. Commitments, Guarantees and Contingencies | 77 | |||||||||||
12. Variable Interest Entities and Securitization Activities | 82 | |||||||||||
13. Regulatory Requirements | 85 | |||||||||||
14. Total Equity | 87 | |||||||||||
15. Earnings per Common Share | 89 | |||||||||||
16. Interest Income and Interest Expense | 90 | |||||||||||
17. Employee Benefit Plans | 90 | |||||||||||
18. Income Taxes | 90 | |||||||||||
19. Segment and Geographic Information | 91 | |||||||||||
20. Subsequent Events | 92 | |||||||||||
Financial Data Supplement (Unaudited) | 93 | |||||||||||
Other Information | II | 96 | ||||||||||
Legal Proceedings | 1 | 96 | ||||||||||
Unregistered Sales of Equity Securities and Use of Proceeds | 2 | 98 | ||||||||||
Exhibits | 6 | 98 | ||||||||||
Signatures | 99 | |||||||||||
Exhibit Index | E-1 | |||||||||||
i
Available Information
We file annual, quarterly and current reports, proxy statements and other information with the U.S. Securities and Exchange Commission (the "SEC"). You may read and copy any document we file with the SEC at the SEC's public reference room at 100 F Street, NE, Washington, DC 20549. Please call the SEC at 1-800-SEC-0330 for information on the public reference room. The SEC maintains an internet site, www.sec.gov , that contains annual, quarterly and current reports, proxy and information statements and other information that issuers file electronically with the SEC. Our electronic SEC filings are available to the public at the SEC's internet site.
Our internet site is www.morganstanley.com . You can access our Investor Relations webpage at www.morganstanley.com/about-us-ir . We make available free of charge, on or through our Investor Relations webpage, our Proxy Statements, Annual Reports on Form 10-K, Quarterly Reports on Form 10-Q, Current Reports on Form 8-K and any amendments to those reports filed or furnished pursuant to the Securities Exchange Act of 1934, as amended (the "Exchange Act"), as soon as reasonably practicable after such material is electronically filed with, or furnished to, the SEC. We also make available, through our Investor Relations webpage, via a link to the SEC's internet site, statements of beneficial ownership of our equity securities filed by our directors, officers, 10% or greater shareholders and others under Section 16 of the Exchange Act.
You can access information about our corporate governance at www.morganstanley.com/about-us-governance. Our Corporate Governance webpage includes:
| • | Amended and Restated Certificate of Incorporation; |
| • | Amended and Restated Bylaws; |
| • | Charters for our Audit Committee, Compensation, Management Development and Succession Committee, Nominating and Governance Committee, Operations and Technology Committee, and Risk Committee; |
| • | Corporate Governance Policies; |
| • | Policy Regarding Communication with the Board of Directors; |
| • | Policy Regarding Director Candidates Recommended by Shareholders; |
| • | Policy Regarding Corporate Political Activities; |
| • | Policy Regarding Shareholder Rights Plan; |
| • | Equity Ownership Commitment; |
| • | Code of Ethics and Business Conduct; |
| • | Code of Conduct; |
| • | Integrity Hotline Information; and |
| • | Environmental and Social Policies. |
Our Code of Ethics and Business Conduct applies to all directors, officers and employees, including our Chief Executive Officer, Chief Financial Officer and Deputy Chief Financial Officer. We will post any amendments to the Code of Ethics and Business Conduct and any waivers that are required to be disclosed by the rules of either the SEC or the New York Stock Exchange LLC ("NYSE") on our internet site. You can request a copy of these documents, excluding exhibits, at no cost, by contacting Investor Relations, 1585 Broadway, New York, NY 10036 (212-761-4000). The information on our internet site is not incorporated by reference into this report.
ii
 |
Financial Information
Management's Discussion and Analysis of Financial Condition and Results of Operations
Introduction
Morgan Stanley, a financial holding company, is a global financial services firm that maintains significant market positions in each of its business segments-Institutional Securities, Wealth Management and Investment Management. Morgan Stanley, through its subsidiaries and affiliates, provides a wide variety of products and services to a large and diversified group of clients and customers, including corporations, governments, financial institutions and individuals. Unless the context otherwise requires, the terms "Morgan Stanley," "Firm," "us," "we," or "our" mean Morgan Stanley (the "Parent Company") together with its consolidated subsidiaries.
A description of the clients and principal products and services of each of our business segments is as follows:
Institutional Securities provides investment banking, sales and trading, lending and other services to corporations, governments, financial institutions, and high to ultra-high net worth clients. Investment banking services consist of capital raising and financial advisory services, including services relating to the underwriting of debt, equity and other securities, as well as advice on mergers and acquisitions, restructurings, real estate and project finance. Sales and trading services include sales, financing and market-making activities in equity and fixed income products, including prime brokerage services, global macro, credit and commodities products. Lending services include originating and/or purchasing corporate loans, commercial and residential mortgage lending, asset-backed lending, financing extended to equities and commodities customers, and loans to municipalities. Other services include investment and research activities.
Wealth Management provides a comprehensive array of financial services and solutions to individual investors and small to medium-sized businesses/institutions covering
brokerage and investment advisory services, financial and wealth planning services, annuity and insurance products, credit and other lending products, banking and retirement plan services.
Investment Management provides a broad range of investment strategies and products that span geographies, asset classes, and public and private markets to a diverse group of clients across institutional and intermediary channels. Strategies and products include equity, fixed income, liquidity and alternative/other products. Institutional clients include defined benefit/defined contribution plans, foundations, endowments, government entities, sovereign wealth funds, insurance companies, third-party fund sponsors and corporations. Individual clients are serviced through intermediaries, including affiliated and non-affiliated distributors.
The results of operations in the past have been, and in the future may continue to be, materially affected by competition; risk factors; and legislative, legal and regulatory developments; as well as other factors. These factors also may have an adverse impact on our ability to achieve our strategic objectives. Additionally, the discussion of our results of operations herein may contain forward-looking statements. These statements, which reflect management's beliefs and expectations, are subject to risks and uncertainties that may cause actual results to differ materially. For a discussion of the risks and uncertainties that may affect our future results, see "Forward-Looking Statements" immediately preceding Part I, Item 1, "Business-Competition" and "Business-Supervision and Regulation" in Part I, Item 1, "Risk Factors" in Part I, Item 1A of our Annual Report on Form 10-K for the year ended December 31, 2016 (the "2016 Form 10-K") and "Liquidity and Capital Resources-Regulatory Requirements" herein.
| 1 | June 2017 Form 10-Q |
| Management's Discussion and Analysis | |
Executive Summary
Overview of Financial Results
Consolidated Results
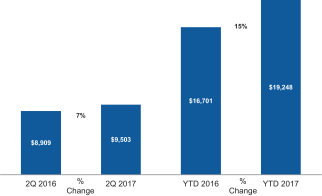
Net Revenues
($ in millions)
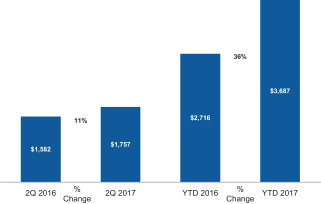
Net Income Applicable to Morgan Stanley
($ in millions)
Earnings per Common Share 1
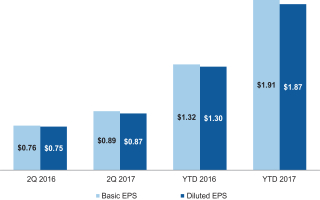
| 1. | For the calculation of basic and diluted earnings per common share, see Note 15 to the consolidated financial statements. |
| • | We reported net revenues of $9,503 million in the three months ended June 30, 2017 ("current quarter," or "2Q 2017"), compared with $8,909 million in the three months ended June 30, 2016 ("prior year quarter," or "2Q 2016"). For the current quarter, net income applicable to Morgan Stanley was $1,757 million, or $0.87 per diluted common share, compared with $1,582 million, or $0.75 per diluted common share, in the prior year quarter. |
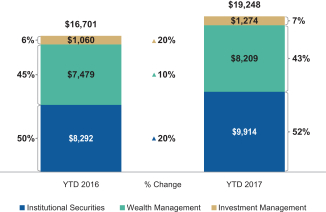
| • | We reported net revenues of $19,248 million in the six months ended June 30, 2017 ("current year period," or "YTD 2017"), compared with $16,701 million in the six months ended June 30, 2016 ("prior year period," or "YTD 2016"). For the current year period, net income applicable to Morgan Stanley was $3,687 million, or $1.87 per diluted common share, compared with income of $2,716 million, or $1.30 per diluted common share in the prior year period. |
Non-interest Expenses
($ in millions)
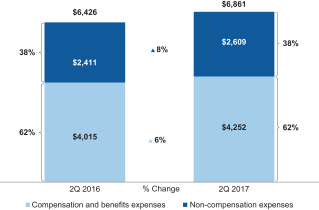
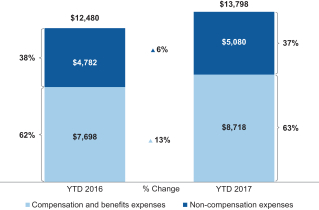
| • | Compensation and benefits expenses of $4,252 million in the current quarter and $8,718 million in the current year period increased 6% and 13%, respectively, from $4,015 million in the prior year quarter and $7,698 million in the prior year period, primarily due to increases in incentive compensation driven mainly by higher revenues and |
| June 2017 Form 10-Q | 2 |
| Management's Discussion and Analysis | |
the fair value of investments to which certain deferred compensation plans are referenced. |
| • | Non-compensation expenses were $2,609 million in the current quarter and $5,080 million in the current year period compared with $2,411 million in the prior year quarter and $4,782 million in the prior year period, representing an 8% and a 6% increase, respectively. These increases were primarily as a result of higher Brokerage, clearing and exchange fees expense and other volume-driven expenses and a provision related to a United Kingdom ("U.K.") indirect tax (i.e. value-added tax or "VAT") matter. In addition to these drivers, non-compensation expenses increased in the current year period due to higher litigation costs. For further discussion of the U.K. VAT matter, see "Institutional Securities-Investments, Other Revenues, Non-interest Expenses and Other Items-Other Items" herein. |
Expense Efficiency Ratio
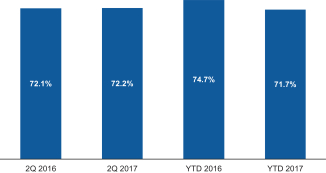
| • | The expense efficiency ratio was 72.2% in the current quarter and 71.7% in the current year period. The expense efficiency ratio was 72.1% in the prior year quarter and 74.7% in the prior year period (see "Selected Non-Generally Accepted Accounting Principles ("Non-GAAP") Financial Information" herein). |
Return on Average Common Equity
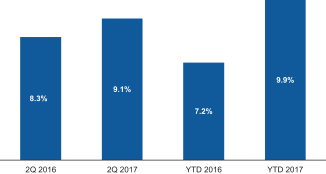
| • | The annualized return on average common equity ("ROE") was 9.1% in the current quarter and 9.9% in the current |
year period. The annualized ROE was 8.3% in the prior year quarter and 7.2% in the prior year period (see "Selected Non-Generally Accepted Accounting Principles ("Non-GAAP") Financial Information" herein). |
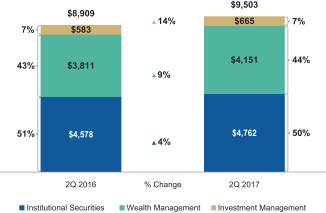
Business Segment Results
Net Revenues by Segment 1, 2
($ in millions)
| 3 | June 2017 Form 10-Q |
| Management's Discussion and Analysis | |
Net Income Applicable to Morgan Stanley by Segment 2, 3
($ in millions)
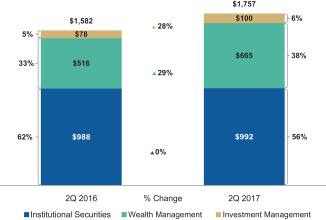
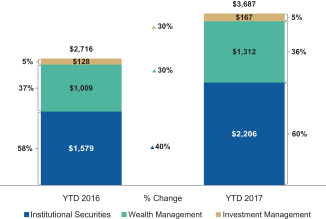
| 1. | The total amount of Net Revenues by Segment also includes intersegment eliminations of $(75) million and $(63) million in the current quarter and prior year quarter, respectively, and $(149) million and $(130) million in the current year period and prior year period, respectively. |
| 2. | The percentages on the sides of the charts represent the contribution of each business segment to the total. Amounts do not necessarily total to 100% due to intersegment eliminations, where applicable. |
| 3. | The total amount of Net Income Applicable to Morgan Stanley by Segment also includes intersegment eliminations of $2 million in the current year period. |
| • | Institutional Securities net revenues of $4,762 million in the current quarter and $9,914 million in the current year period increased 4% from the prior year quarter and increased 20% from the prior year period. The current quarter results primarily reflected higher revenues from underwriting and strength in equity sales and trading. The current year period results primarily reflected higher revenues from fixed income sales and trading and underwriting. |
| • | Wealth Management net revenues of $4,151 million in the current quarter and $8,209 million in the current year period increased 9% from the prior year quarter and increased 10% from the prior year period. The current |
quarter and the current year period results reflected growth in asset management fee revenues and Net interest income. In addition to these drivers, the current year period results reflected higher transactional revenues. |
| • | Investment Management net revenues of $665 million in the current quarter and $1,274 million in the current year period increased 14% from the prior year quarter and increased 20% from the prior year period. The current quarter results primarily reflected higher investment gains and carried interest and growth in asset management fee revenues. Current year period results primarily reflected investment gains compared with losses in the prior year period and positive carried interest in the current year period. |
Net Revenues by Region 1
($ in millions)
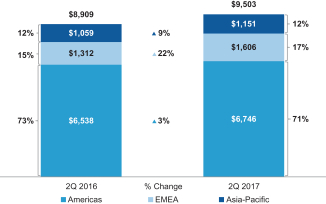
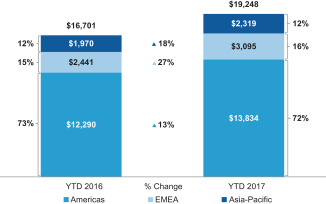
EMEA-Europe, Middle East and Africa
| 1. | For a discussion of how the geographic breakdown for net revenues is determined, see Note 21 to the consolidated financial statements in Item 8 of the 2016 Form 10-K. |
| June 2017 Form 10-Q | 4 |
| Management's Discussion and Analysis | |
Selected Financial Information and Other Statistical Data
| Three Months Ended June 30, | Six Months Ended June 30, | |||||||||||||||
| $ in millions | 2017 | 2016 | 2017 | 2016 | ||||||||||||
Income from continuing operations applicable to Morgan Stanley | $ | 1,762 | $ | 1,586 | $ | 3,714 | $ | 2,723 | ||||||||
Income (loss) from discontinued operations applicable to Morgan Stanley | (5 | ) | (4 | ) | (27 | ) | (7 | ) | ||||||||
Net income applicable to Morgan Stanley | 1,757 | 1,582 | 3,687 | 2,716 | ||||||||||||
Preferred stock dividends and other | 170 | 157 | 260 | 235 | ||||||||||||
Earnings applicable to Morgan Stanley common shareholders | $ | 1,587 | $ | 1,425 | $ | 3,427 | $ | 2,481 | ||||||||
Effective income tax rate from continuing operations | 32.0 | % | 33.5 | % | 30.5 | % | 33.4 | % | ||||||||
At June 30, 2017 | At December 31, 2016 | |||||||
Capital ratios (Transitional-Advanced) 1 |
| |||||||
Common Equity Tier 1 capital ratio | 16.6 | % | 16.9 | % | ||||
Tier 1 capital ratio | 19.0 | % | 19.0 | % | ||||
Total capital ratio | 21.9 | % | 22.0 | % | ||||
Capital ratios (Transitional-Standardized) 1 |
| |||||||
Tier 1 leverage ratio 2 | 8.5 | % | 8.4 | % | ||||
| in millions, except per share and employee data | At June 30, 2017 | At December 31, 2016 | ||||||
Loans 3 | $ | 97,639 | $ | 94,248 | ||||
Total assets | $ | 841,016 | $ | 814,949 | ||||
Global Liquidity Reserve 4 | $ | 188,296 | $ | 202,297 | ||||
Deposits | $ | 144,913 | $ | 155,863 | ||||
Long-term borrowings | $ | 184,112 | $ | 164,775 | ||||
Common shareholders' equity | $ | 70,306 | $ | 68,530 | ||||
Common shares outstanding | 1,840 | 1,852 | ||||||
Book value per common share 5 | $ | 38.22 | $ | 36.99 | ||||
Worldwide employees | 56,187 | 55,311 | ||||||
| 1. | For a discussion of our regulatory capital ratios, see "Liquidity and Capital Resources-Regulatory Requirements" herein. |
| 2. | See Note 13 to the consolidated financial statements for information on the Tier 1 leverage ratio. |
| 3. | Amounts include loans held for investment (net of allowance) and loans held for sale but exclude loans at fair value, which are included in Trading assets in the consolidated balance sheets (see Note 7 to the consolidated financial statements). |
| 4. | For a discussion of Global Liquidity Reserve, see "Management's Discussion and Analysis of Financial Condition and Results of Operations-Liquidity and Capital Resources-Liquidity Risk Management Framework-Global Liquidity Reserve" in Part II, Item 7 of the 2016 Form 10-K. |
| 5. | Book value per common share equals common shareholders' equity divided by common shares outstanding. |
Selected Non-Generally Accepted Accounting Principles ("Non-GAAP") Financial Information
We prepare our consolidated financial statements using accounting principles generally accepted in the United States of America ("U.S. GAAP"). From time to time, we may disclose certain "non-GAAP financial measures" in this document, or in the course of our earnings releases, earnings and other conference calls, financial presentations, Definitive Proxy Statement and otherwise. A "non-GAAP financial measure" excludes, or includes, amounts from the most directly comparable measure calculated and presented in accordance with U.S. GAAP. We consider the non-GAAP financial measures we disclose to be useful to us, investors and analysts by providing further transparency about, or an alternate means of assessing, our financial condition, operating results, prospective regulatory capital requirements, or capital adequacy. These measures are not in accordance with, or a substitute for, U.S. GAAP and may be different from or inconsistent with non-GAAP financial measures used by other companies. Whenever we refer to a non-GAAP financial measure, we will also generally define it or present the most directly comparable financial measure calculated and presented in accordance with U.S. GAAP, along with a reconciliation of the differences between the U.S. GAAP financial measure and the non-GAAP financial measure.
The principal non-GAAP financial measures presented in this document are set forth below.
Non-GAAP Financial Measures by Business Segment
| Three Months Ended June 30, | Six Months Ended June 30, | |||||||||||||||
| $ in billions | 2017 | 2016 | 2017 | 2016 | ||||||||||||
Pre-tax profit margin 1 | ||||||||||||||||
Institutional Securities | 30 | % | 33 | % | 32 | % | 29 | % | ||||||||
Wealth Management | 25 | % | 23 | % | 25 | % | 22 | % | ||||||||
Investment Management | 21 | % | 20 | % | 19 | % | 15 | % | ||||||||
Consolidated | 28 | % | 28 | % | 28 | % | 25 | % | ||||||||
Average common equity 2 |
| |||||||||||||||
Institutional Securities | $ | 40.2 | $ | 43.2 | $ | 40.2 | $ | 43.2 | ||||||||
Wealth Management | 17.2 | 15.3 | 17.2 | 15.3 | ||||||||||||
Investment Management | 2.4 | 2.8 | 2.4 | 2.8 | ||||||||||||
Parent Company | 10.1 | 7.7 | 9.7 | 7.3 | ||||||||||||
Consolidated average common equity | $ | 69.9 | $ | 69.0 | $ | 69.5 | $ | 68.6 | ||||||||
Return on average common equity 2 |
| |||||||||||||||
Institutional Securities | 8.5 | % | 8.0 | % | 9.9 | % | 6.4 | % | ||||||||
Wealth Management | 14.6 | % | 12.9 | % | 14.6 | % | 12.7 | % | ||||||||
Investment Management | 16.3 | % | 10.6 | % | 13.7 | % | 8.8 | % | ||||||||
Consolidated | 9.1 | % | 8.3 | % | 9.9 | % | 7.2 | % | ||||||||
| 5 | June 2017 Form 10-Q |
| Management's Discussion and Analysis | |
Reconciliations from U.S. GAAP to Non-GAAP Consolidated Financial Measures
| Three Months Ended June 30, | Six Months Ended June 30, | |||||||||||||||
$ in millions, except per share data | 2017 | 2016 | 2017 | 2016 | ||||||||||||
Net income applicable to Morgan Stanley
|
| |||||||||||||||
U.S. GAAP | $ | 1,757 | $ | 1,582 | $ | 3,687 | $ | 2,716 | ||||||||
Impact of discrete tax provision 3 | 4 | - | 18 | - | ||||||||||||
Net income applicable to Morgan Stanley, excluding discrete tax provision-non-GAAP | $ | 1,761 | $ | 1,582 | $ | 3,705 | $ | 2,716 | ||||||||
Earnings per diluted common share
|
| |||||||||||||||
U.S. GAAP | $ | 0.87 | $ | 0.75 | $ | 1.87 | $ | 1.30 | ||||||||
Impact of discrete tax provision 3 | - | - | 0.01 | - | ||||||||||||
Earnings per diluted common share, excluding discrete tax provision-non-GAAP | $ | 0.87 | $ | 0.75 | $ | 1.88 | $ | 1.30 | ||||||||
Effective income tax rate
| ||||||||||||||||
U.S. GAAP | 32.0 | % | 33.5 | % | 30.5 | % | 33.4 | % | ||||||||
Impact of discrete tax provision 3 | (0.1 | )% | - | (0.4 | )% | - | ||||||||||
Effective income tax rate from continuing |
| |||||||||||||||
operations, excluding discrete tax provision-non-GAAP | 31.9 | % | 33.5 | % | 30.1 | % | 33.4 | % | ||||||||
| 1. | Pre-tax profit margin represents income from continuing operations before income taxes as a percentage of net revenues. |
| 2. | Average common equity for each business segment is determined at the beginning of each year using our Required Capital framework, an internal capital adequacy measure (see "Liquidity and Capital Resources-Regulatory Requirements-Attribution of Average Common Equity According to the Required Capital Framework" herein) and will remain fixed throughout the year until the next annual reset. Each business segment's return on average common equity equals annualized net income applicable to Morgan Stanley less an allocation of preferred dividends as a percentage of average common equity for that segment. Consolidated return on average common equity equals annualized consolidated net income applicable to Morgan Stanley less preferred dividends as a percentage of average common equity. |
| 3. | Beginning in 2017, with the adoption of the accounting update Improvements to Employee Share-Based Payment Accounting , the income tax consequences related to share-based payments are required to be recognized in Provision for income taxes in the consolidated income statements upon the conversion of employee share-based awards, which primarily occur in the first quarter of each year. The impact of the income tax consequences upon conversion of the awards may be either a benefit or a provision and is treated as a discrete item. The non-GAAP financial measures for net income applicable to Morgan Stanley, earnings per diluted common share and effective income tax rate above exclude discrete tax provisions other than income tax consequences arising from conversion activity as we anticipate conversion activity each quarter. See Note 2 to the consolidated financial statements for information on the adoption of the accounting update Improvements to Employee Share-Based Payment Accounting . For further information on the discrete tax provision, see "Supplemental Financial Information and Disclosures-Income Tax Matters" herein. |
Consolidated Non-GAAP Financial Measures
| Three Months Ended June 30, | Six Months Ended June 30, | |||||||||||||||
| $ in billions | 2017 | 2016 | 2017 | 2016 | ||||||||||||
Average common equity 1, 2, 3
|
| |||||||||||||||
Unadjusted | $ | 69.9 | $ | 69.0 | $ | 69.5 | $ | 68.6 | ||||||||
Excluding DVA | 70.5 | 69.1 | 70.1 | 68.7 | ||||||||||||
Excluding DVA and discrete tax provision (benefit) | 70.5 | 69.1 | 70.1 | 68.7 | ||||||||||||
Return on average common equity 1, 2, 4, 5
|
| |||||||||||||||
Unadjusted | 9.1 | % | 8.3 | % | 9.9 | % | 7.2 | % | ||||||||
Excluding DVA | 9.0 | % | 8.3 | % | 9.8 | % | 7.2 | % | ||||||||
Excluding DVA and discrete tax provision (benefit) | 9.0 | % | 8.3 | % | 9.8 | % | 7.2 | % | ||||||||
Average tangible common equity 1, 2, 3 , 6
|
| |||||||||||||||
Unadjusted | $ | 60.7 | $ | 59.5 | $ | 60.2 | $ | 59.1 | ||||||||
Excluding DVA | 61.3 | 59.6 | 60.8 | 59.2 | ||||||||||||
Excluding DVA and discrete tax provision (benefit) | 61.3 | 59.6 | 60.8 | 59.2 | ||||||||||||
Return on average tangible common equity 1, 2, 5
|
| |||||||||||||||
Unadjusted | 10.4 | % | 9.6 | % | 11.4 | % | 8.4 | % | ||||||||
Excluding DVA | 10.3 | % | 9.6 | % | 11.3 | % | 8.4 | % | ||||||||
Excluding DVA and discrete tax provision (benefit) | 10.4 | % | 9.6 | % | 11.3 | % | 8.4 | % | ||||||||
Expense efficiency ratio 7 | 72.2 | % | 72.1 | % | 71.7 | % | 74.7 | % | ||||||||
| At June 30, 2017 | At December 31, 2016 | |||||||
Tangible book value per common share 6 | $ | 33.24 | $ | 31.98 | ||||
DVA-Debt valuation adjustment represents the change in the fair value resulting from fluctuations in our credit spreads and other credit factors related to liabilities carried at fair value under the fair value option, primarily certain Long-term and Short-term borrowings.
| 1. | When excluding DVA, it is only excluded from the denominator. When excluding the discrete tax provision (benefit), both the numerator and denominator are adjusted to exclude that item. |
| 2. | Beginning in 2017, with the adoption of the accounting update Improvements to Employee Share-Based Payment Accounting , the income tax consequences related to share-based payments are required to be recognized in Provision for income taxes in the consolidated income statements upon the conversion of employee share-based awards, which primarily occur in the first quarter of each year. The impact of the income tax consequences upon conversion of the awards may be either a benefit or a provision and is treated as a discrete item. When excluding discrete tax provision (benefit) from average common equity, return on average common equity, average tangible common equity and return on average tangible common equity above only discrete tax provisions (benefits) other than income tax consequences arising from conversion activity are excluded as we anticipate conversion activity each quarter. See Note 2 to the consolidated financial statements for information on the adoption of the accounting update Improvements to Employee Share-Based Payment Accounting . |
| 3. | The impact of DVA on average common equity and average tangible common equity was approximately $(612) million and $(106) million in the current quarter and prior year quarter, respectively. The impact of DVA on average common equity and average tangible common equity was approximately $(599) million and $(128) million in the current year period and prior year period, respectively. |
| 4. | The calculation used in determining the Firm's "ROE Target" is return on average common equity excluding DVA and discrete tax items as set forth above. |
| 5. | Return on average common equity equals annualized consolidated net income applicable to Morgan Stanley less preferred dividends as a percentage of average common equity. Return on average tangible common equity equals annualized net income applicable to Morgan Stanley less preferred dividends as a percentage of average tangible common equity. |
| June 2017 Form 10-Q | 6 |
| Management's Discussion and Analysis | |
| 6. | For a discussion of tangible common equity, see "Liquidity and Capital Resources-Tangible Equity" herein. Tangible book value per common share equals tangible common equity divided by common shares outstanding. |
| 7. | The expense efficiency ratio represents total non-interest expenses as a percentage of net revenues. |
Return on Equity Target
We have an ROE Target of 9% to 11% to be achieved by 2017. Our ROE Target and the related strategies and goals are forward-looking statements that may be materially affected by many factors, including, among other things: macroeconomic and market conditions; legislative and regulatory developments; industry trading and investment banking volumes; equity market levels; interest rate environment; legal expenses and the ability to reduce expenses in general; capital levels; and discrete tax items. For further information on our ROE Target and related assumptions, see "Management's Discussion and Analysis of Financial Condition and Results of Operations-Executive Summary-Return on Equity Target" in Part II, Item 7 of the 2016 Form 10-K.
Business Segments
Substantially all of our operating revenues and operating expenses are directly attributable to the business segments. Certain revenues and expenses have been allocated to each business segment, generally in proportion to its respective net revenues, non-interest expenses or other relevant measures.
As a result of treating certain intersegment transactions as transactions with external parties, we include an Intersegment Eliminations category to reconcile the business segment results to our consolidated results.
Net Revenues, Compensation Expense and Income Taxes
For discussions of our net revenues, see "Management's Discussion and Analysis of Financial Condition and Results of Operations-Business Segments-Net Revenues" and "Management's Discussion and Analysis of Financial Condition and Results of Operations-Business Segments-Net Revenues by Segment" in Part II, Item 7 of the 2016 Form 10-K. For a discussion of our compensation expense, see "Management's Discussion and Analysis of Financial Condition and Results of Operations-Business Segments-Compensation Expense" in Part II, Item 7 of the 2016 Form 10-K. For a discussion of our Income Tax expense, see "Management's Discussion and Analysis of Financial Condition and Results of Operations-Business Segments-Income Taxes" in Part II, Item 7 of the 2016 Form 10-K.
| 7 | June 2017 Form 10-Q |
| Management's Discussion and Analysis | |
Institutional Securities
Income Statement Information
| Three Months Ended June 30, | ||||||||||||
| $ in millions | 2017 | 2016 | % Change | |||||||||
Revenues | ||||||||||||
Investment banking | $ | 1,413 | $ | 1,108 | 28% | |||||||
Trading | 2,725 | 2,498 | 9% | |||||||||
Investments | 37 | 76 | (51)% | |||||||||
Commissions and fees | 630 | 607 | 4% | |||||||||
Asset management, distribution and administration fees | 89 | 69 | 29% | |||||||||
Other | 126 | 138 | (9)% | |||||||||
Total non-interest revenues | 5,020 | 4,496 | 12% | |||||||||
Interest income | 1,243 | 966 | 29% | |||||||||
Interest expense | 1,501 | 884 | 70% | |||||||||
Net interest | (258 | ) | 82 | N/M | ||||||||
Net revenues | 4,762 | 4,578 | 4% | |||||||||
Compensation and benefits | 1,667 | 1,625 | 3% | |||||||||
Non-compensation expenses | 1,652 | 1,447 | 14% | |||||||||
Total non-interest expenses | 3,319 | 3,072 | 8% | |||||||||
Income from continuing operations before income taxes | 1,443 | 1,506 | (4)% | |||||||||
Provision for income taxes | 413 | 453 | (9)% | |||||||||
Income from continuing operations | 1,030 | 1,053 | (2)% | |||||||||
Income (loss) from discontinued operations, net of income taxes | (5 | ) | (4 | ) | (25)% | |||||||
Net income | 1,025 | 1,049 | (2)% | |||||||||
Net income applicable to noncontrolling interests | 33 | 61 | (46)% | |||||||||
Net income applicable to Morgan Stanley | $ | 992 | 988 | -% | ||||||||
| Six Months Ended June 30, | ||||||||||||
| $ in millions | 2017 | 2016 | % Change | |||||||||
Revenues | ||||||||||||
Investment banking | $ | 2,830 | $ | 2,098 | 35% | |||||||
Trading | 5,737 | 4,389 | 31% | |||||||||
Investments | 103 | 108 | (5)% | |||||||||
Commissions and fees | 1,250 | 1,262 | (1)% | |||||||||
Asset management, distribution and administration fees | 180 | 142 | 27% | |||||||||
Other | 299 | 142 | 111% | |||||||||
Total non-interest revenues | 10,399 | 8,141 | 28% | |||||||||
Interest income | 2,367 | 2,019 | 17% | |||||||||
Interest expense | 2,852 | 1,868 | 53% | |||||||||
Net interest | (485 | ) | 151 | N/M | ||||||||
Net revenues | 9,914 | 8,292 | 20% | |||||||||
Compensation and benefits | 3,537 | 3,007 | 18% | |||||||||
Non-compensation expenses | 3,204 | 2,871 | 12% | |||||||||
Total non-interest expenses | 6,741 | 5,878 | 15% | |||||||||
Income from continuing operations before income taxes | 3,173 | 2,414 | 31% | |||||||||
Provision for income taxes | 872 | 728 | 20% | |||||||||
Income from continuing operations | 2,301 | 1,686 | 36% | |||||||||
Income (loss) from discontinued operations, net of income taxes | (27 | ) | (7 | ) | N/M | |||||||
Net income | 2,274 | 1,679 | 35% | |||||||||
Net income applicable to noncontrolling interests | 68 | 100 | (32)% | |||||||||
Net income applicable to Morgan Stanley | $ | 2,206 | $ | 1,579 | 40% | |||||||
N/M-Not Meaningful
| June 2017 Form 10-Q | 8 |
| Management's Discussion and Analysis | |
Investment Banking
Investment Banking Revenues
| Three Months Ended June 30, | ||||||||||||
| $ in millions | 2017 | 2016 | % Change | |||||||||
Advisory | $ | 504 | $ | 497 | 1% | |||||||
Underwriting revenues: | ||||||||||||
Equity | 405 | 266 | 52% | |||||||||
Fixed income | 504 | 345 | 46% | |||||||||
Total underwriting | 909 | 611 | 49% | |||||||||
Total investment banking | $ | 1,413 | $ | 1,108 | 28% | |||||||
| Six Months Ended June 30, | ||||||||||||
| $ in millions | 2017 | 2016 | % Change | |||||||||
Advisory | $ | 1,000 | $ | 1,088 | (8)% | |||||||
Underwriting revenues: | ||||||||||||
Equity | 795 | 426 | 87% | |||||||||
Fixed income | 1,035 | 584 | 77% | |||||||||
Total underwriting | 1,830 | 1,010 | 81% | |||||||||
Total investment banking | $ | 2,830 | $ | 2,098 | 35% | |||||||
Investment Banking Volumes
| Three Months Ended June 30, | Six Months Ended June 30, | |||||||||||||||
| $ in billions | 2017 1 | 2016 1 | 2017 1 | 2016 1 | ||||||||||||
Completed mergers and acquisitions 2 | $ | 205 | $ | 241 | $ | 356 | $ | 538 | ||||||||
Equity and equity-related offerings 3 | 20 | 14 | 30 | 21 | ||||||||||||
Fixed income offerings 4 | 67 | 62 | 142 | 113 | ||||||||||||
| 1. | Source: Thomson Reuters, data at July 12, 2017. Completed mergers and acquisitions volumes are based on full credit to each of the advisors in a transaction. Equity and equity-related offerings and fixed income offerings are based on full credit for single book managers and equal credit for joint book managers. Transaction volumes may not be indicative of net revenues in a given period. In addition, transaction volumes for prior periods may vary from amounts previously reported due to the subsequent withdrawal or change in the value of a transaction. |
| 2. | Amounts include transactions of $100 million or more. |
| 3. | Amounts include Rule 144A issuances and registered public offerings of common stock and convertible securities and rights offerings. |
| 4. | Amounts include non-convertible preferred stock, mortgage-backed and asset-backed securities, and taxable municipal debt. Amounts include publicly registered and Rule 144A issuances. Amounts exclude leveraged loans and self-led issuances. |
Investment banking revenues are composed of fees from advisory services and revenues from the underwriting of securities offerings and syndication of loans, net of syndication expenses.
Investment banking revenues of $1,413 million in the current quarter and $2,830 million in the current year period increased 28% and 35% from the comparable prior year periods. The increase in the current quarter primarily reflected higher underwriting revenues. The increase in the current year period was due to higher underwriting revenues, partially offset by lower advisory revenues.
| • | Advisory revenues were relatively unchanged in the current quarter and decreased in the current year period reflecting the lower volumes of completed merger, acquisition and restructuring transactions (see Investment Banking Volumes table), offset by the positive impact of higher fee realizations. |
| • | Equity underwriting revenues increased in the current quarter and current year period as a result of higher global market volumes in both follow-on and initial public offerings (see Investment Banking Volumes table). In the current year period, equity underwriting revenues also increased as a result of higher fee realizations. Fixed income underwriting revenues increased in the current quarter and current year period primarily due to higher non-investment grade loan fees and bond fees. |
Sales and Trading Net Revenues
By Income Statement Line Item
| Three Months Ended June 30, | ||||||||||
| $ in millions | 2017 | 2016 | % Change | |||||||
Trading | $ | 2,725 | $ | 2,498 | 9% | |||||
Commissions and fees | 630 | 607 | 4% | |||||||
Asset management, distribution and administration fees | 89 | 69 | 29% | |||||||
Net interest | (258 | ) | 82 | N/M | ||||||
Total | $ | 3,186 | $ | 3,256 | (2)% | |||||
| Six Months Ended June 30, | ||||||||||
| $ in millions | 2017 | 2016 | % Change | |||||||
Trading | $ | 5,737 | $ | 4,389 | 31% | |||||
Commissions and fees | 1,250 | 1,262 | (1)% | |||||||
Asset management, distribution and administration fees | 180 | 142 | 27% | |||||||
Net interest | (485 | ) | 151 | N/M | ||||||
Total | $ | 6,682 | $ | 5,944 | 12% | |||||
N/M-Not Meaningful
| 9 | June 2017 Form 10-Q |
| Management's Discussion and Analysis | |
By Business
| Three Months Ended June 30, | ||||||||||
| $ in millions | 2017 | 2016 | % Change | |||||||
Equity | $ | 2,155 | $ | 2,145 | -% | |||||
Fixed income | 1,239 | 1,297 | (4)% | |||||||
Other | (208 | ) | (186 | ) | (12)% | |||||
Total | $ | 3,186 | $ | 3,256 | (2)% | |||||
| Six Months Ended June 30, | ||||||||||
| $ in millions | 2017 | 2016 | % Change | |||||||
Equity | $ | 4,171 | $ | 4,201 | (1)% | |||||
Fixed income | 2,953 | 2,170 | 36% | |||||||
Other | (442 | ) | (427 | ) | (4)% | |||||
Total | $ | 6,682 | $ | 5,944 | 12% | |||||
Sales and Trading Activities-Equity and Fixed Income
Following is a description of the sales and trading activities within our equities and fixed income businesses as well as how their results impact the income statement line items, followed by a presentation and explanation of results.
Equities-Financing. We provide financing and prime brokerage services to our clients active in the equity markets through a variety of products including margin lending, securities lending and swaps. Results from this business are largely driven by the difference between financing income earned and financing costs incurred, which are reflected in Net interest for securities and equity lending products and in Trading revenues for derivative products.
Equities-Execution services. We make markets for our clients in equity-related securities and derivative products, including providing liquidity and hedging products. A significant portion of the results for this business is generated by commissions and fees from executing and clearing client transactions on major stock and derivative exchanges as well as from over-the-counter ("OTC") transactions. Market-making also generates gains and losses on inventory, which are reflected in Trading revenues.
Fixed income- Within fixed income we make markets in order to facilitate client activity as part of the following products and services.
| • | Global macro products. We make markets for our clients in interest rate, foreign exchange and emerging market products, including exchange-traded and OTC securities, loans and derivative instruments. The results of this market-making activity are primarily driven by gains and losses from buying and selling positions to stand ready for and satisfy client demand, and are recorded in Trading revenues. |
| • | Credit products. We make markets in credit-sensitive products, such as corporate bonds and mortgage securities |
and other securitized products, and related derivative instruments. The values of positions in this business are sensitive to changes in credit spreads and interest rates, which result in gains and losses reflected in Trading revenues. Due to the amount and type of the interest-bearing securities and loans making up this business, a significant portion of the results is also reflected in Net interest revenues. |
| • | Commodities products and Other. We make markets in various commodity products related primarily to electricity, natural gas, oil, and precious metals, with the results primarily reflected in Trading revenues. Other activities include the results from the centralized management of our fixed income derivative counterparty exposures, which are primarily recorded in Trading revenues. |
Sales and Trading Net Revenues-Equity and Fixed Income
| Three Months Ended June 30, 2017 | ||||||||||||||||
| $ in millions | Trading | Fees 1 | Net Interest 2 | Total | ||||||||||||
Financing | $ | 1,166 | $ | 88 | $ | (227 | ) | $ | 1,027 | |||||||
Execution services | 601 | 580 | (53 | ) | 1,128 | |||||||||||
Total Equity | $ | 1,767 | $ | 668 | $ | (280 | ) | $ | 2,155 | |||||||
Total Fixed Income | $ | 1,114 | $ | 48 | $ | 77 | $ | 1,239 | ||||||||
| Three Months Ended June 30, 2016 | ||||||||||||||||
| $ in millions | Trading | Fees 1 | Net Interest 2 | Total | ||||||||||||
Financing | $ | 1,039 | $ | 90 | $ | (82 | ) | $ | 1,047 | |||||||
Execution services | 576 | 549 | (27 | ) | 1,098 | |||||||||||
Total Equity | $ | 1,615 | $ | 639 | $ | (109 | ) | $ | 2,145 | |||||||
Total Fixed Income | $ | 1,018 | $ | 37 | $ | 242 | $ | 1,297 | ||||||||
| Six Months Ended June 30, 2017 | ||||||||||||||||
| $ in millions | Trading | Fees 1 | Net Interest 2 | Total | ||||||||||||
Financing | $ | 2,097 | $ | 177 | $ | (415 | ) | $ | 1,859 | |||||||
Execution services | 1,265 | 1,148 | (101 | ) | 2,312 | |||||||||||
Total Equity | $ | 3,362 | $ | 1,325 | $ | (516 | ) | $ | 4,171 | |||||||
Total Fixed Income | $ | 2,712 | $ | 102 | $ | 139 | $ | 2,953 | ||||||||
| Six Months Ended June 30, 2016 | ||||||||||||||||
| $ in millions | Trading | Fees 1 | Net Interest 2 | Total | ||||||||||||
Financing | $ | 1,925 | $ | 176 | $ | (42 | ) | $ | 2,059 | |||||||
Execution services | 1,085 | 1,149 | (92 | ) | 2,142 | |||||||||||
Total Equity | $ | 3,010 | $ | 1,325 | $ | (134 | ) | $ | 4,201 | |||||||
Total Fixed Income | $ | 1,573 | $ | 77 | $ | 520 | $ | 2,170 | ||||||||
| 1. | Includes Commissions and fees and Asset management, distribution and administration fees. |
| 2. | Funding costs are allocated to the businesses based on funding usage and are included in Net interest. |
| June 2017 Form 10-Q | 10 |
| Management's Discussion and Analysis | |
We manage each of the sales and trading businesses based on its aggregate net revenues, which are comprised of the consolidated income statement line items quantified in the previous table. Trading revenues are affected by a variety of market dynamics, including volumes, bid-offer spreads, and inventory prices, as well as impacts from hedging activity, which are interrelated. We provide qualitative commentary in the discussion of results that follow on the key drivers of period over period variances, as the quantitative impact of the various market dynamics typically cannot be disaggregated.
For additional information on total Trading revenues, see the table "Trading Revenues by Product Type" in Note 4 to the consolidated financial statements.
Sales and Trading Net Revenues during the Current Quarter
Equity
Equity sales and trading net revenues of $2,155 million in the current quarter were relatively unchanged from the prior year quarter, reflecting higher results in execution services, offset by lower results in our financing business.
| • | Financing revenues decreased 2% from the prior year quarter as Net interest revenues declined from higher net interest costs, reflecting increased liquidity requirements and an increased proportion of lower spread transactions, partially offset by higher client activity in equity swaps reflected in Trading. |
| • | Execution services increased 3% from the prior year quarter primarily reflecting higher revenues from derivative products and improved commissions and fees driven by increased client activity, partially offset by higher net interest costs. |
Fixed Income
Fixed income net revenues of $1,239 million in the current quarter were 4% lower than the prior year quarter, driven by a decrease in Net interest revenues across all three product areas, partially offset by an increase in Trading revenues.
| • | Credit products decreased due to a lower level of interest realized in securitized products and tighter bid-offer spreads in the current quarter. |
| • | Global macro products decreased due to higher interest costs in the current quarter which resulted from interest rate products inventory management. This was partially offset by improved performance in foreign exchange and emerging markets trading activity principally due to specific market events. |
| • | Commodities products and Other increased due to the absence of losses from counterparty risk management incurred in the prior year quarter, partially offset by a decrease in Commodities structured transactions. |
Sales and Trading Net Revenues during the Current Year Period
Equity
Equity sales and trading net revenues of $4,171 million in the current year period were relatively unchanged from the prior year period, reflecting lower results in our financing business, offset by higher results in execution services.
| • | Financing revenues decreased 10% from the prior year period as Net interest revenues declined from higher net interest costs, reflecting increased liquidity requirements and an increased proportion of lower spread transactions, partially offset by higher client activity in equity swaps reflected in Trading. |
| • | Execution services increased 8% from the prior year period primarily reflecting improved results in Trading revenues compared with the prior year period when increased volatility resulted in inventory losses. |
Fixed Income
Fixed income net revenues of $2,953 million in the current year period were 36% higher than the prior year period, driven by an increase in Trading revenues, partially offset by a decline in Net interest revenues.
| • | Credit products increased due to the absence of inventory losses driven by a widening spread environment in the prior year period. This was partially offset by a lower level of interest realized in securitized products in the current year period. |
| • | Global macro products increased due to a more favorable environment across products compared with the prior year period when results were impacted by inventory losses. This was partially offset by higher interest costs in the current year period which resulted from interest rate products inventory management. |
| • | Commodities products and Other increased due to improved energy trading and the absence of losses from counterparty risk management incurred in the prior year period. |
| 11 | June 2017 Form 10-Q |
| Management's Discussion and Analysis | |
Investments, Other Revenues, Non-interest Expenses and Other Items
Investments
| • | Net investment gains of $37 million in the current quarter decreased from the prior year quarter primarily as a result of lower gains on equities business related investments. |
| • | Net investment gains of $103 million in the current year period decreased from the prior year period primarily reflecting lower gains on business related investments, partially offset by gains on investments associated with our compensation plans compared with losses in the prior year period. |
Other
| • | Other revenues of $126 million in the current quarter were relatively unchanged from the prior year quarter. Other revenues of $299 million in the current year period increased from the prior year period primarily reflecting mark-to-market gains on loans held for sale in the current year period compared with mark-to-market losses in the prior year period and a decrease in the provision on loans held for investment. |
Non-interest Expenses
Non-interest expenses of $3,319 million in the current quarter increased from the comparable prior year period primarily reflecting a 3% increase in Compensation and benefits expenses and a 14% increase in Non-compensation expenses. Non-interest expenses of $6,741 million in the current year period reflect an 18% increase in Compensation and benefits expenses and a 12% increase in Non-compensation expenses.
| • | Compensation and benefits expenses increased in the current quarter and current year period primarily due to increases in discretionary incentive compensation driven mainly by higher revenues and the fair value of investments to which certain deferred compensation plans are referenced. |
| • | Non-compensation expenses increased in the current quarter and current year period primarily due to higher Brokerage, clearing and exchange fees expense and other volume-driven expenses and a provision related to the U.K. VAT matter (see Other Items below). In addition to these drivers, non-compensation expenses increased in the current year period due to higher litigation costs. |
Other Items
The Firm self-identified an issue regarding VAT on intercompany services provided by certain overseas affiliates to our U.K. Group. The Firm is reviewing the reporting of U.K. VAT as additional support service centers were added to our operations over the years, and the focus and nature of their intended services shifted among geographic locations. During the current quarter, we have recorded a provision of $86 million that incorporates potential additional VAT, interest and penalties for this exposure. We are actively working with Her Majesty's Revenue and Customs to resolve this matter. The provision reflected is based on currently available information and analyses, and our review of this matter is continuing.
| June 2017 Form 10-Q | 12 |
| Management's Discussion and Analysis | |
Wealth Management
Income Statement Information
| Three Months Ended June 30, | % Change | |||||||||||
| $ in millions | 2017 | 2016 1 | ||||||||||
Revenues | ||||||||||||
Investment banking | $ | 135 | $ | 123 | 10% | |||||||
Trading | 207 | 252 | (18)% | |||||||||
Investments | 1 | - | N/M | |||||||||
Commissions and fees | 424 | 423 | -% | |||||||||
Asset management, distribution and administration fees | 2,302 | 2,082 | 11% | |||||||||
Other | 73 | 102 | (28)% | |||||||||
Total non-interest revenues | 3,142 | 2,982 | 5% | |||||||||
Interest income | 1,114 | 920 | 21% | |||||||||
Interest expense | 105 | 91 | 15% | |||||||||
Net interest | 1,009 | 829 | 22% | |||||||||
Net revenues | 4,151 | 3,811 | 9% | |||||||||
Compensation and benefits | 2,297 | 2,152 | 7% | |||||||||
Non-compensation expenses | 797 | 800 | -% | |||||||||
Total non-interest expenses | 3,094 | 2,952 | 5% | |||||||||
Income from continuing operations before income taxes | 1,057 | 859 | 23% | |||||||||
Provision for income taxes | 392 | 343 | 14% | |||||||||
Net income applicable to Morgan Stanley | $ | 665 | $ | 516 | 29% | |||||||
| Six Months Ended June 30, | % Change | |||||||||||
| $ in millions | 2017 | 2016 1 | ||||||||||
Revenues | ||||||||||||
Investment banking | $ | 280 | $ | 244 | 15% | |||||||
Trading | 445 | 446 | -% | |||||||||
Investments | 2 | (2 | ) | 200% | ||||||||
Commissions and fees | 864 | 835 | 3% | |||||||||
Asset management, distribution and administration fees | 4,486 | 4,136 | 8% | |||||||||
Other | 129 | 160 | (19)% | |||||||||
Total non-interest revenues | 6,206 | 5,819 | 7% | |||||||||
Interest income | 2,193 | 1,834 | 20% | |||||||||
Interest expense | 190 | 174 | 9% | |||||||||
Net interest | 2,003 | 1,660 | 21% | |||||||||
Net revenues | 8,209 | 7,479 | 10% | |||||||||
Compensation and benefits | 4,614 | 4,240 | 9% | |||||||||
Non-compensation expenses | 1,565 | 1,594 | (2)% | |||||||||
Total non-interest expenses | 6,179 | 5,834 | 6% | |||||||||
Income from continuing operations before income taxes | 2,030 | 1,645 | 23% | |||||||||
Provision for income taxes | 718 | 636 | 13% | |||||||||
Net income applicable to Morgan Stanley | $ | 1,312 | $ | 1,009 | 30% | |||||||
N/M – Not Meaningful
| 1. | Effective July 1, 2016, the Institutional Securities and Wealth Management business segments entered into an agreement, whereby Institutional Securities assumed management of Wealth Management's fixed income client-driven trading activities and employees. Institutional Securities now pays fees to Wealth Management based on distribution activity (collectively, the "Fixed Income Integration"). Prior periods have not been recast for this new intersegment agreement due to immateriality. |
Statistical Data
Financial Information and Statistical Data
| $ in billions | At June 30, 2017 | At December 31, 2016 | ||||||
Client assets | $ | 2,239 | $ | 2,103 | ||||
Fee-based client assets 1 | $ | 962 | $ | 877 | ||||
Fee-based client assets as a percentage of total client assets | 43% | 42% | ||||||
Client liabilities 2 | $ | 77 | $ | 73 | ||||
Bank deposit program | $ | 139 | $ | 153 | ||||
Investment securities portfolio | $ | 53.5 | $ | 63.9 | ||||
Loans and lending commitments | $ | 74.2 | $ | 68.7 | ||||
Wealth Management representatives | 15,777 | 15,763 | ||||||
| Three Months Ended June 30, | ||||||||
| 2017 | 2016 | |||||||
Annualized revenues per representative | ||||||||
(dollars in thousands) 3 | $ | 1,052 | $ | 959 | ||||
Client assets per representative | ||||||||
(dollars in millions) 4 | $ | 142 | $ | 128 | ||||
Fee-based asset flows 5 | ||||||||
(dollars in billions) | $ | 19.9 | $ | 12.0 | ||||
| Six Months Ended June 30, | ||||||||
| 2017 | 2016 | |||||||
Annualized revenues per representative | ||||||||
(dollars in thousands) 3 | $ | 1,041 | $ | 941 | ||||
Client assets per representative | ||||||||
(dollars in millions) 4 | $ | 142 | $ | 128 | ||||
Fee-based asset flows 5 | ||||||||
(dollars in billions) | $ | 38.7 | $ | 17.9 | ||||
| 1. | Fee-based client assets represent the amount of assets in client accounts where the basis of payment for services is a fee calculated on those assets. |
| 2. | Client liabilities include securities-based and tailored lending, residential real estate loans and margin lending. |
| 3. | Annualized revenues per representative equal Wealth Management's annualized revenues divided by the average representative headcount. |
| 4. | Client assets per representative equal total period-end client assets divided by period-end representative headcount. |
| 5. | Fee-based asset flows include net new fee-based assets, net account transfers, dividends, interest and client fees and exclude institutional cash management-related activity. |
| 13 | June 2017 Form 10-Q |
| Management's Discussion and Analysis | |
Transactional Revenues
| Three Months Ended June 30, | % Change | |||||||||||
| $ in millions | 2017 | 2016 | ||||||||||
Investment banking | $ | 135 | $ | 123 | 10% | |||||||
Trading | 207 | 252 | (18)% | |||||||||
Commissions and fees | 424 | 423 | -% | |||||||||
Total | $ | 766 | $ | 798 | (4)% | |||||||
| Six Months Ended June 30, | % Change | |||||||||||
| $ in millions | 2017 | 2016 | ||||||||||
Investment banking | $ | 280 | $ | 244 | 15% | |||||||
Trading | 445 | 446 | -% | |||||||||
Commissions and fees | 864 | 835 | 3% | |||||||||
Total | $ | 1,589 | $ | 1,525 | 4% | |||||||
Net Revenues
Transactional Revenues
Transactional revenues of $766 million in the current quarter decreased 4% from the prior year quarter primarily reflecting lower Trading revenues, partially offset by higher Investment banking revenues.
Transactional revenues of $1,589 million in the current year period increased 4% from the prior year period primarily reflecting higher revenues in Investment banking and Commissions and fees.
| • | Investment banking revenues increased in the current quarter primarily due to higher revenues from structured products and equity syndicate activities, partially offset by lower fixed income revenues as a result of the Fixed Income Integration and lower preferred stock underwriting activity. The increase in the current year period was due to higher revenues from structured products and equity syndicate activities, partially offset by lower preferred stock underwriting activity. |
| • | Trading revenues decreased in the current quarter primarily due to the Fixed Income Integration, partially offset by gains related to investments associated with certain employee deferred compensation plans. Trading revenues in the current year period were relatively unchanged as lower revenues related to the Fixed Income Integration were largely offset by gains related to investments associated with certain employee deferred compensation plans. |
| • | Commissions and fees were relatively unchanged in the current quarter. Commissions and fees increased in the current year period primarily due to the Fixed Income Integration and to higher equities activity, partially offset by lower annuity product revenues. |
Asset Management
| • | Asset management, distribution and administration fees of $2,302 million in the current quarter and $4,486 million in the current year period increased 11% from the prior year quarter and increased 8% from the prior year period. The increase in each respective period is primarily due to market appreciation and net positive flows, partially offset by lower average client fee rates. See "Fee-Based Client Assets Activity and Average Fee Rate by Account Type" herein. |
Net Interest
| • | Net interest of $1,009 million in the current quarter and $2,003 million in the current year period increased 22% and 21%, respectively, from the comparable prior year periods primarily due to higher interest rates and higher loan balances, partially offset by lower investment portfolio balances. |
Other
| • | Other revenues of $73 million in the current quarter and $129 million in the current year period decreased 28% and 19%, respectively, from the comparable prior year periods, due to lower realized gains from the available for sale ("AFS") securities portfolio. |
Non-interest Expenses
Non-interest expenses of $3,094 million in the current quarter and $6,179 million in the current year period increased 5% and 6%, respectively, from the comparable prior year periods.
| • | Compensation and benefits expenses in the current quarter and current year period increased primarily due to higher revenues and increases in the fair value of investments to which certain deferred compensation plans are referenced. |
| • | Non-compensation expenses were relatively unchanged in the current quarter. Non-compensation expenses decreased in the current year period primarily due to lower litigation and information processing costs, partially offset by higher deposit insurance expenses. |
| June 2017 Form 10-Q | 14 |
| Management's Discussion and Analysis | |
Fee-Based Client Assets Activity and Average Fee Rate by Account Type
For a description of fee-based client assets, including descriptions for the fee based client asset types and rollforward items in the following tables, see "Management's Discussion and Analysis of Financial Condition and Results of Operations-Business Segments-Wealth Management-Fee-Based Client Assets Activity and Average Fee Rate by Account Type" in Part II, Item 7 of the 2016 Form 10-K.
At March 31, 2017 | Inflows | Outflows | Market Impact | At 2017 | Average for the Three Months Ended June 30, 2017 | |||||||||||||||||
| $ in billions, Fee Rate in bps | Fee Rate 1 | |||||||||||||||||||||
Separately managed accounts 2, 3 | $ | 230 | $ | 8 | $ | (7 | ) | $ | 6 | $ | 237 | 17 | ||||||||||
Unified managed accounts 3 | 217 | 13 | (7 | ) | 5 | 228 | 98 | |||||||||||||||
Mutual fund advisory | 21 | - | (1 | ) | 1 | 21 | 118 | |||||||||||||||
Representative as advisor | 133 | 10 | (8 | ) | 3 | 138 | 84 | |||||||||||||||
Representative as portfolio manager | 305 | 23 | (11 | ) | 4 | 321 | 96 | |||||||||||||||
Subtotal | $ | 906 | $ | 54 | $ | (34 | ) | $ | 19 | $ | 945 | 77 | ||||||||||
Cash management | 21 | 2 | (6 | ) | - | 17 | 6 | |||||||||||||||
Total fee-based client assets | $ | 927 | $ | 56 | $ | (40 | ) | $ | 19 | $ | 962 | 75 | ||||||||||
At March 31, 2016 | Inflows | Outflows | Market Impact | At June 30, 2016 | Average for the Three Months Ended June 30, 2016 | |||||||||||||||||
| $ in billions, Fee Rate in bps | Fee Rate 1 | |||||||||||||||||||||
Separately managed accounts 2 | $ | 278 | $ | 9 | $ | (7 | ) | $ | (1 | ) | $ | 279 | 37 | |||||||||
Unified managed accounts | 112 | 11 | (5 | ) | 2 | 120 | 106 | |||||||||||||||
Mutual fund advisory | 24 | - | (1 | ) | - | 23 | 119 | |||||||||||||||
Representative as advisor | 114 | 8 | (8 | ) | 3 | 117 | 85 | |||||||||||||||
Representative as portfolio manager | 255 | 17 | (12 | ) | 5 | 265 | 99 | |||||||||||||||
Subtotal | $ | 783 | $ | 45 | $ | (33 | ) | $ | 9 | $ | 804 | 78 | ||||||||||
Cash management | 15 | 4 | (3 | ) | - | 16 | 6 | |||||||||||||||
Total fee-based client assets | $ | 798 | $ | 49 | $ | (36 | ) | $ | 9 | $ | 820 | 76 | ||||||||||
At December 31, 2016 | Inflows | Outflows | Market Impact | At 2017 | Average for the Six Months Ended June 30, 2017 | |||||||||||||||||
| $ in billions, fee rate in bps | Fee Rate 1 | |||||||||||||||||||||
Separately managed accounts 2, 3 | $ | 222 | $ | 16 | $ | (11 | ) | $ | 10 | $ | 237 | 16 | ||||||||||
Unified managed accounts 3 | 204 | 25 | (15 | ) | 14 | 228 | 98 | |||||||||||||||
Mutual fund advisory | 21 | 1 | (3 | ) | 2 | 21 | 118 | |||||||||||||||
Representative as advisor | 125 | 19 | (14 | ) | 8 | 138 | 85 | |||||||||||||||
Representative as portfolio manager | 285 | 42 | (21 | ) | 15 | 321 | 97 | |||||||||||||||
Subtotal | $ | 857 | $ | 103 | $ | (64 | ) | $ | 49 | $ | 945 | 76 | ||||||||||
Cash management | 20 | 5 | (8 | ) | - | 17 | 6 | |||||||||||||||
Total fee-based client assets | $ | 877 | $ | 108 | $ | (72 | ) | $ | 49 | $ | 962 | 75 | ||||||||||
At December 31, 2015 | Inflows | Outflows | Market Impact | At June 30, 2016 | Average for the Six Months Ended June 30, 2016 | |||||||||||||||||
| $ in billions, Fee Rate in bps | Fee Rate 1 | |||||||||||||||||||||
Separately managed accounts 2 | $ | 283 | $ | 17 | $ | (17 | ) | $ | (4 | ) | $ | 279 | 37 | |||||||||
Unified managed accounts | 105 | 21 | (9 | ) | 3 | 120 | 107 | |||||||||||||||
Mutual fund advisory | 25 | 1 | (3 | ) | - | 23 | 119 | |||||||||||||||
Representative as advisor | 115 | 13 | (14 | ) | 3 | 117 | 86 | |||||||||||||||
Representative as portfolio manager | 252 | 31 | (22 | ) | 4 | 265 | 100 | |||||||||||||||
Subtotal | $ | 780 | $ | 83 | $ | (65 | ) | $ | 6 | $ | 804 | 77 | ||||||||||
Cash management | 15 | 7 | (6 | ) | - | 16 | 6 | |||||||||||||||
Total fee-based client assets | $ | 795 | $ | 90 | $ | (71 | ) | $ | 6 | $ | 820 | 76 | ||||||||||
bps-Basis points
| 1. | Certain data enhancements made in the first quarter of 2017 resulted in a modification to the "Fee Rate" calculations. Prior periods have been restated to reflect the revised calculations. |
| 2. | Includes non-custody account values reflecting prior quarter-end balances due to a lag in the reporting of asset values by third-party custodians. |
| 3. | A shift in client assets of approximately $66 billion in the fourth quarter of 2016 from separately managed accounts to unified managed accounts resulted in a lower average fee rate for those platforms but did not impact the average fee rate for total fee-based client assets. |
| 15 | June 2017 Form 10-Q |
| Management's Discussion and Analysis | |
Investment Management
Income Statement Information
| Three Months Ended June 30, | ||||||||||||
| $ in millions | 2017 | 2016 | % Change | |||||||||
Revenues | ||||||||||||
Trading | $ | (3 | ) | $ | 5 | (160 | )% | |||||
Investments | 125 | 50 | 150 | % | ||||||||
Asset management, distribution and administration fees | 539 | 517 | 4 | % | ||||||||
Other | 4 | 9 | (56 | )% | ||||||||
Total non-interest revenues | 665 | 581 | 14 | % | ||||||||
Interest income | 1 | 3 | (67 | )% | ||||||||
Interest expense | 1 | 1 | - | % | ||||||||
Net interest | - | 2 | (100 | )% | ||||||||
Net revenues | 665 | 583 | 14 | % | ||||||||
Compensation and benefits | 288 | 238 | 21 | % | ||||||||
Non-compensation expenses | 235 | 227 | 4 | % | ||||||||
Total non-interest expenses | 523 | 465 | 12 | % | ||||||||
Income from continuing operations before income taxes | 142 | 118 | 20 | % | ||||||||
Provision for income taxes | 41 | 37 | 11 | % | ||||||||
Net income | 101 | 81 | 25 | % | ||||||||
Net income applicable to noncontrolling interests | 1 | 3 | (67 | )% | ||||||||
Net income applicable to Morgan Stanley | $ | 100 | $ | 78 | 28 | % | ||||||
| Six Months Ended June 30, | ||||||||||||
| $ in millions | 2017 | 2016 | % Change | |||||||||
Revenues | ||||||||||||
Investment banking | $ | - | $ | 1 | (100 | )% | ||||||
Trading | (14 | ) | (5 | ) | (180 | )% | ||||||
Investments | 223 | (14 | ) | N/M | ||||||||
Commissions and fees | - | 3 | (100 | )% | ||||||||
Asset management, distribution and administration fees | 1,056 | 1,043 | 1 | % | ||||||||
Other | 8 | 31 | (74 | )% | ||||||||
Total non-interest revenues | 1,273 | 1,059 | 20 | % | ||||||||
Interest income | 2 | 4 | (50 | )% | ||||||||
Interest expense | 1 | 3 | (67 | )% | ||||||||
Net interest | 1 | 1 | - | % | ||||||||
Net revenues | 1,274 | 1,060 | 20 | % | ||||||||
Compensation and benefits | 567 | 451 | 26 | % | ||||||||
Non-compensation expenses | 462 | 447 | 3 | % | ||||||||
Total non-interest expenses | 1,029 | 898 | 15 | % | ||||||||
Income from continuing operations before income taxes | 245 | 162 | 51 | % | ||||||||
Provision for income taxes | 71 | 47 | 51 | % | ||||||||
Net income | 174 | 115 | 51 | % | ||||||||
Net income (loss) applicable to noncontrolling interests | 7 | (13 | ) | (154 | )% | |||||||
Net income applicable to Morgan Stanley | $ | 167 | $ | 128 | 30 | % | ||||||
N/M – Not Meaningful
Net Revenues
Investments
| • | Investments gains of $125 million in the current quarter compared with Investment gains of $50 million in the prior quarter reflected higher realized gains and higher carried interest in Infrastructure and Private Equity investments. |
| • | Investments gains of $223 million in the current year period reflected gains and positive carried interest in all Alternative/Other products. Investments losses in the prior year period reflected losses and the reversal of previously accrued carried interest in certain Private Equity and Real Estate investments. |
Asset Management, Distribution and Administration Fees
| • | Asset management, distribution and administration fees of $539 million increased 4% in the current quarter compared to the prior year quarter primarily as a result of higher average assets under management or supervision ("AUM") in Equity and Fixed income products, with higher performance fees, partially offset by lower fee rates in Liquidity products and Alternative/Other products. |
| • | Asset management, distribution and administration fees of $1,056 million were relatively unchanged in the current year period, reflecting higher average AUM in Equity and Fixed income products, essentially offset by lower fee rates in Alternative/Other products. |
See "AUM and Average Fee Rate by Asset Class" herein.
Non-interest Expenses
Non-interest expenses of $523 million in the current quarter and $1,029 million in the current year period increased 12% and 15% from the comparable periods primarily due to higher Compensation and benefit expenses.
| • | Compensation and benefits expenses increased in the current quarter and current year period principally due to an increase in deferred compensation associated with carried interest. |
| • | Non-compensation expenses increased in the current quarter and current year period primarily due to higher brokerage, clearing and exchange fees, partially offset by lower professional service fees. |
| June 2017 Form 10-Q | 16 |
| Management's Discussion and Analysis | |
Assets Under Management or Supervision
AUM and Average Fee Rate by Asset Class
For a description of the rollforward items in the following tables, see "Management's Discussion and Analysis of Financial Condition and Results of Operations-Business Segments-Investment Management-Assets Under Management or Supervision" in Part II, Item 7 of the 2016 Form 10-K.
At March 31, 2017 | Inflows | Outflows | Market Impact | Other 1 | At June 30, | Average for the Three Months Ended June 30, 2017 | ||||||||||||||||||||||||||
| $ in billions, Fee Rate in bps | Total AUM | Fee Rate | ||||||||||||||||||||||||||||||
Equity | $ | 87 | $ | 6 | $ | (5 | ) | $ | 5 | $ | 1 | $ | 94 | $ | 91 | 73 | ||||||||||||||||
Fixed income | 62 | 8 | (6 | ) | 1 | 1 | 66 | 64 | 33 | |||||||||||||||||||||||
Liquidity | 153 | 308 | (308 | ) | - | 1 | 154 | 153 | 17 | |||||||||||||||||||||||
Alternative / Other products | 119 | 6 | (6 | ) | 3 | (1 | ) | 121 | 120 | 70 | ||||||||||||||||||||||
Total assets under management or supervision | $ | 421 | $ | 328 | $ | (325 | ) | $ | 9 | $ | 2 | $ | 435 | $ | 428 | 46 | ||||||||||||||||
Shares of minority stake assets | 7 | 8 | 8 | |||||||||||||||||||||||||||||
At March 31, 2016 | Inflows | Outflows | Market Impact | Other 1 | At June 30, 2016 | Average for the Three Months Ended June 30, 2016 | ||||||||||||||||||||||||||
| $ in billions, Fee Rate in bps | Total AUM | Fee Rate | ||||||||||||||||||||||||||||||
Equity | $ | 81 | $ | 5 | $ | (6 | ) | $ | 1 | $ | - | $ | 81 | $ | 81 | 74 | ||||||||||||||||
Fixed income | 62 | 7 | (8 | ) | - | - | 61 | 61 | 32 | |||||||||||||||||||||||
Liquidity | 146 | 291 | (289 | ) | 1 | - | 149 | 146 | 19 | |||||||||||||||||||||||
Alternative / Other products | 116 | 9 | (10 | ) | 1 | (1 | ) | 115 | 116 | 74 | ||||||||||||||||||||||
Total assets under management or supervision | $ | 405 | $ | 312 | $ | (313 | ) | $ | 3 | $ | (1 | ) | $ | 406 | $ | 404 | 48 | |||||||||||||||
Shares of minority stake assets | 8 | 8 | 8 | |||||||||||||||||||||||||||||
At December 31, 2016 | Inflows | Outflows | Market Impact | Other 1 | At June 30, | Average for the Six Months Ended June 30, 2017 | ||||||||||||||||||||||||||
$ in billions, Fee Rate in bps | Total AUM | Fee Rate | ||||||||||||||||||||||||||||||
Equity | $ | 79 | $ | 11 | $ | (10 | ) | $ | 13 | $ | 1 | $ | 94 | $ | 87 | 74 | ||||||||||||||||
Fixed income | 60 | 13 | (11 | ) | 2 | 2 | 66 | 63 | 33 | |||||||||||||||||||||||
Liquidity | 163 | 636 | (646 | ) | - | 1 | 154 | 155 | 18 | |||||||||||||||||||||||
Alternative / Other products | 115 | 13 | (10 | ) | 4 | (1 | ) | 121 | 119 | 70 | ||||||||||||||||||||||
Total assets under management or supervision | $ | 417 | $ | 673 | $ | (677 | ) | $ | 19 | $ | 3 | $ | 435 | $ | 424 | 46 | ||||||||||||||||
Shares of minority stake assets | 8 | 8 | 8 | |||||||||||||||||||||||||||||
At December 31, 2015 | Inflows | Outflows | Market Impact | Other 1 | At June 30, 2016 | Average for the Six Months Ended June 30, 2016 | ||||||||||||||||||||||||||
$ in billions, Fee Rate in bps | Total AUM | Fee Rate | ||||||||||||||||||||||||||||||
Equity | $ | 83 | $ | 10 | $ | (12 | ) | $ | - | - | $ | 81 | $ | 80 | 73 | |||||||||||||||||
Fixed income | 60 | 12 | (14 | ) | 2 | 1 | 61 | 60 | 32 | |||||||||||||||||||||||
Liquidity | 149 | 627 | (627 | ) | - | - | 149 | 148 | 18 | |||||||||||||||||||||||
Alternative / Other products | 114 | 14 | (14 | ) | 1 | - | 115 | 115 | 77 | |||||||||||||||||||||||
Total assets under management or supervision | $ | 406 | $ | 663 | $ | (667 | ) | $ | 3 | 1 | $ | 406 | $ | 403 | 48 | |||||||||||||||||
Shares of minority stake assets | 8 | 8 | 8 | |||||||||||||||||||||||||||||
bps-Basis points
| 1. | Includes distributions and foreign currency impact. |
| 17 | June 2017 Form 10-Q |
| Management's Discussion and Analysis | |
Supplemental Financial Information and Disclosures
U.S. Bank Subsidiaries
We provide loans to a variety of customers, from large corporate and institutional clients to high net worth individuals, primarily through our U.S. bank subsidiaries, Morgan Stanley Bank, N.A. ("MSBNA") and Morgan Stanley Private Bank, National Association ("MSPBNA") (collectively, "U.S. Bank Subsidiaries"). The lending activities in the Institutional Securities business segment primarily include loans or lending commitments to corporate clients. The lending activities in the Wealth Management business segment primarily include securities-based lending that allows clients to borrow money against the value of qualifying securities and also include residential real estate loans. We expect our lending activities to continue to grow through further market penetration of the Wealth Management business segment's client base. For a further discussion of our credit risks, see "Quantitative and Qualitative Disclosures about Market Risk-Risk Management-Credit Risk." For further discussion about loans and lending commitments, see Notes 7 and 11 to the consolidated financial statements.
U.S. Bank Subsidiaries' Supplemental Financial Information Excluding Transactions with the Parent Company
| $ in billions | At 2017 | At December 31, 2016 | ||||||
U.S. Bank Subsidiaries assets | $ | 175.4 | $ | 180.7 | ||||
U.S. Bank Subsidiaries investment securities portfolio: | ||||||||
Investment securities-AFS | 38.3 | 50.3 | ||||||
Investment securities-HTM | 15.3 | 13.6 | ||||||
Total | $ | 53.6 | $ | 63.9 | ||||
Wealth Management U.S. Bank Subsidiaries data |
| |||||||
Securities-based lending and other loans 1 | $ | 39.4 | $ | 36.0 | ||||
Residential real estate loans | 25.7 | 24.4 | ||||||
Total | $ | 65.1 | $ | 60.4 | ||||
Institutional Securities U.S. Bank Subsidiaries data |
| |||||||
Corporate loans | $ | 20.0 | $ | 20.3 | ||||
Wholesale real estate loans | 10.7 | 9.9 | ||||||
Total | $ | 30.7 | $ | 30.2 | ||||
AFS-Available for sale
HTM-Held to maturity
| 1. | Other loans primarily include tailored lending. |
AFS Investment securities in our U.S. Bank Subsidiaries decreased as of June 30, 2017 as compared with December 31, 2016 primarily as a result of sales of securities to fund changes in our liquidity profile including deposit outflows, growth in loans and growth in HTM securities.
Income Tax Matters
Effective Tax Rate
| Three Months Ended June 30, | Six Months Ended June 30, | |||||||||||||||
| 2017 | 2016 | 2017 | 2016 | |||||||||||||
From continuing operations | 32.0 | % | 33.5 | % | 30.5 | % | 33.4 | % | ||||||||
The effective tax rate for the current year period includes net discrete tax benefits of $110 million, primarily resulting from a $128 million recurring-type benefit in the current year period associated with the adoption of new accounting guidance related to employee share-based payments. See Note 2 to the consolidated financial statements for information on the adoption of the accounting update Improvements to Employee Share-Based Payment Accounting .
Accounting Development Updates
The Financial Accounting Standards Board issued accounting updates that apply to us but are not yet effective for the Firm.
Accounting updates not listed below were assessed and determined to be either not applicable or are not expected to have a significant impact on our consolidated financial statements.
The following accounting updates are currently being evaluated to determine the potential impact of adoption:
| • | Revenue from Contracts with Customers. This accounting update aims to clarify the principles of revenue recognition, to develop a common revenue recognition standard across all industries for U.S. GAAP and to provide enhanced disclosures for users of the financial statements. The core principle of this guidance is that an entity should recognize revenues to depict the transfer of promised goods or services to customers in an amount that reflects the consideration to which the entity expects to be entitled in exchange for those goods or services. We will adopt the guidance on January 1, 2018 and expect to apply the modified retrospective method of adoption. |
We expect this accounting update to potentially change the timing and presentation of certain revenues, as well as the timing and presentation of certain related costs for Investment banking fees and Asset management, distribution and administration fees. Subject to the resolution of certain industry interpretations, these changes are not expected to be significant.
The recognition of performance fees from fund management activities in the form of carried interest that are subject to reversal is expected to remain essentially unchanged. We expect to apply the equity method of accounting to such carried interest, thus excluding them from the scope of this standard.
| June 2017 Form 10-Q | 18 |
| Management's Discussion and Analysis | |
We will continue to assess the impact of the new standard as we progress through the implementation process and as industry interpretations are resolved; therefore, additional impacts may be identified prior to adoption.
| • | Leases. This accounting update requires lessees to recognize on the balance sheet all leases with terms exceeding one year, which results in the recognition of a right of use asset and corresponding lease liability, including for those leases that we currently classify as operating leases. The right of use asset and lease liability will initially be measured using the present value of the remaining rental payments. The accounting for leases where we are the lessor is largely unchanged. This update is effective as of January 1, 2019. |
| • | Financial Instruments–Credit Losses. This accounting update impacts the impairment model for certain financial assets measured at amortized cost such as loans held for investment and HTM securities. The amendments in this update will accelerate the recognition of credit losses by replacing the incurred loss impairment methodology with a current expected credit loss ("CECL") methodology that requires an estimate of expected credit losses over the entire life of the financial asset. Additionally, although the CECL methodology will not apply to AFS debt securities, the update will require establishment of an allowance to reflect impairment of these securities, thereby eliminating the concept of a permanent write-down. This update is effective as of January 1, 2020. |
Critical Accounting Policies
Our consolidated financial statements are prepared in accordance with U.S. GAAP, which requires us to make estimates and assumptions (see Note 1 to the consolidated financial statements). We believe that of our significant accounting policies (see Note 2 to the consolidated financial statements in Item 8 of the 2016 Form 10-K and Note 2 to the consolidated financial statements), the fair value, goodwill and intangible assets, legal and regulatory contingencies and income taxes policies involve a higher degree of judgment and complexity. For a further discussion about our critical accounting policies, see "Management's Discussion and Analysis of Financial Condition and Results of Operations-Critical Accounting Policies" in Part II, Item 7 of the 2016 Form 10-K.
Liquidity and Capital Resources
Senior management establishes liquidity and capital policies. Through various risk and control committees, senior management reviews business performance relative to these policies, monitors the availability of alternative sources of financing, and oversees the liquidity, interest rate and currency sensitivity of our asset and liability position. The Treasury Department, Firm Risk Committee, Asset and Liability Management Committee, and other committees and control groups assist in evaluating, monitoring and controlling the impact that our business activities have on our consolidated balance sheets, liquidity and capital structure. Liquidity and capital matters are reported regularly to the Board of Directors (the "Board") and the Board's Risk Committee.
The Balance Sheet
We monitor and evaluate the composition and size of our balance sheet on a regular basis. Our balance sheet management process includes quarterly planning, business-specific thresholds, monitoring of business-specific usage versus key performance metrics and new business impact assessments.
We establish balance sheet thresholds at the consolidated and business segment levels. We monitor balance sheet utilization and review variances resulting from business activity or market fluctuations. On a regular basis, we review current performance versus established thresholds and assess the need to re-allocate our balance sheet based on business unit needs. We also monitor key metrics, including asset and liability size and capital usage.
Total Assets by Business Segment
| At June 30, 2017 | ||||||||||||||||
$ in millions | Institutional Securities | Wealth Management | Investment Management | Total | ||||||||||||
Assets | ||||||||||||||||
Cash and cash equivalents 1 | $ | 30,203 | $ | 14,391 | $ | 65 | $ | 44,659 | ||||||||
Trading assets at fair value | 288,255 | 77 | 2,470 | 290,802 | ||||||||||||
Investment securities | 18,077 | 53,499 | - | 71,576 | ||||||||||||
Securities purchased under agreements to resell | 90,490 | 6,918 | - | 97,408 | ||||||||||||
Securities borrowed | 126,428 | 294 | - | 126,722 | ||||||||||||
Customer and other receivables | 35,954 | 18,380 | 583 | 54,917 | ||||||||||||
Loans, net of allowance | 32,528 | 65,106 | 5 | 97,639 | ||||||||||||
Other assets 2 | 43,668 | 12,070 | 1,555 | 57,293 | ||||||||||||
Total assets | $ | 665,603 | $ | 170,735 | $ | 4,678 | $ | 841,016 | ||||||||
| 19 | June 2017 Form 10-Q |
| Management's Discussion and Analysis | |
| At December 31, 2016 | ||||||||||||||||
| $ in millions | Institutional Securities | Wealth Management | Investment Management | Total | ||||||||||||
Assets | ||||||||||||||||
Cash and cash equivalents 1 | $ | 25,291 | $ | 18,022 | $ | 68 | $ | 43,381 | ||||||||
Trading assets at fair value | 259,680 | 64 | 2,410 | 262,154 | ||||||||||||
Investment securities | 16,222 | 63,870 | - | 80,092 | ||||||||||||
Securities purchased under agreements to resell | 96,735 | 5,220 | - | 101,955 | ||||||||||||
Securities borrowed | 124,840 | 396 | - | 125,236 | ||||||||||||
Customer and other receivables | 26,624 | 19,268 | 568 | 46,460 | ||||||||||||
Loans, net of allowance | 33,816 | 60,427 | 5 | 94,248 | ||||||||||||
Other assets 2 | 45,941 | 13,868 | 1,614 | 61,423 | ||||||||||||
Total assets | $ | 629,149 | $ | 181,135 | $ | 4,665 | $ | 814,949 | ||||||||
| 1. | Cash and cash equivalents include cash and due from banks and interest bearing deposits with banks. |
| 2. | Other assets primarily includes Cash deposited with clearing organizations or segregated under federal and other regulations or requirements; Other investments; Premises, equipment and software costs; Goodwill; Intangible assets and deferred tax assets. |
A substantial portion of total assets consists of liquid marketable securities and short-term receivables arising principally from sales and trading activities in the Institutional Securities business segment. Total assets increased to $841.0 billion at June 30, 2017 from $814.9 billion at December 31, 2016, primarily driven by an increase in trading inventory within Institutional Securities. The increase reflects higher market values for corporate equities compared with December 31, 2016, along with increased trading activity across fixed income products including U.S. government and agency securities and Other sovereign government obligations.
Securities Repurchase Agreements and Securities Lending
Securities borrowed or securities purchased under agreements to resell and securities loaned or securities sold under agreements to repurchase are treated as collateralized financings (see Note 2 to the consolidated financial statements in the 2016 Form 10-K and Note 6 to the consolidated financial statements).
Collateralized Financing Transactions
| $ in millions | At June 30, 2017 | At December 31, 2016 | ||||||
Securities purchased under agreements to resell and Securities borrowed 1 | $ | 224,130 | $ | 227,191 | ||||
Securities sold under agreements to repurchase and Securities loaned 1 | $ | 67,559 | $ | 70,472 | ||||
Securities received as collateral 2 | $ | 14,408 | $ | 13,737 | ||||
Daily Average Balance Three Months Ended | ||||||||
$ in millions | June 30, 2017 | December 31, 2016 | ||||||
Securities purchased under agreements to resell and Securities borrowed 1 | $ | 220,045 | $ | 224,355 | ||||
Securities sold under agreements to repurchase and Securities loaned 1 | $ | 72,040 | $ | 68,908 | ||||
| 1. | Differences between period end balances and average balances were not significant. |
| 2. | Included in Trading assets in the consolidated balance sheets. |
Customer Securities Financing
The customer receivable portion of the securities financing transactions primarily includes customer margin loans, collateralized by customer-owned securities, which are segregated in accordance with regulatory requirements. The customer payable portion of the securities financing transactions primarily includes payables to our prime brokerage customers. Our risk exposure on these transactions is mitigated by collateral maintenance policies that limit our credit exposure to customers and liquidity reserves held against this risk exposure.
Liquidity Risk Management Framework
The primary goal of our Liquidity Risk Management Framework is to ensure that we have access to adequate funding across a wide range of market conditions and time horizons. The framework is designed to enable us to fulfill our financial obligations and support the execution of our business strategies.
The core components of our Liquidity Risk Management Framework are the Required Liquidity Framework, Liquidity Stress Tests and the Global Liquidity Reserve ("GLR"), which support our target liquidity profile. For further discussion about the Firm's Required Liquidity Framework and Liquidity Stress Tests, see "Management's Discussion and Analysis of Financial Condition and Results of Operations- Liquidity and Capital Resources-Liquidity Risk Management Framework" in Part II, Item 7 of the 2016 Form 10-K.
At June 30, 2017 and December 31, 2016, we maintained sufficient liquidity to meet current and contingent funding obligations as modeled in our Liquidity Stress Tests.
Global Liquidity Reserve
We maintain sufficient global liquidity reserves pursuant to our Required Liquidity Framework. For further discussion of our GLR, see "Management's Discussion and Analysis of Financial Condition and Results of Operations-Liquidity and Capital Resources-Liquidity Risk Management Framework-Global Liquidity Reserve" in Part II, Item 7 of the 2016 Form 10-K.
| June 2017 Form 10-Q | 20 |
| Management's Discussion and Analysis | |
GLR by Type of Investment
$ in millions | At June 30, 2017 | At December 31, 2016 | ||||||
Cash deposits with banks | $ | 10,057 | $ | 8,679 | ||||
Cash deposits with central banks | 29,427 | 30,568 | ||||||
Unencumbered highly liquid securities: | ||||||||
U.S. government obligations | 71,336 | 78,615 | ||||||
U.S. agency and agency mortgage-backed securities | 52,967 | 46,360 | ||||||
Non-U.S. sovereign obligations 1 | 21,290 | 30,884 | ||||||
Other investment grade securities | 3,219 | 7,191 | ||||||
Total | $ | 188,296 | $ | 202,297 | ||||
| 1. | Non-U.S. sovereign obligations are primarily composed of unencumbered German, French, Dutch, U.K. and Japanese government obligations. |
GLR Managed by Bank and Non-Bank Legal Entities
At June 30, | At December 31, 2016 | Daily Average Balance Three Months Ended | ||||||||||
| $ in millions | June 30, 2017 | |||||||||||
Bank legal entities | ||||||||||||
Domestic | $ | 62,897 | $ | 74,411 | $ | 65,976 | ||||||
Foreign | 4,145 | 4,238 | 3,949 | |||||||||
Total Bank legal entities | 67,042 | 78,649 | 69,925 | |||||||||
Non-Bank legal entities | ||||||||||||
Domestic: | ||||||||||||
Parent Company | 48,987 | 66,514 | 56,070 | |||||||||
Non-Parent Company | 32,953 | 18,801 | 31,557 | |||||||||
Total Domestic | 81,940 | 85,315 | 87,627 | |||||||||
Foreign | 39,314 | 38,333 | 42,620 | |||||||||
Total Non-Bank legal entities | 121,254 | 123,648 | 130,247 | |||||||||
Total | $ | 188,296 | $ | 202,297 | $ | 200,172 | ||||||
The reduction in total GLR as of June 30, 2017 compared with December 31, 2016, reflecting the decrease in our AFS Investment securities, was primarily related to the reduction in our deposits balance and growth in loans.
Regulatory Liquidity Framework
Liquidity Coverage Ratio
The Basel Committee on Banking Supervision's ("Basel Committee") Liquidity Coverage Ratio ("LCR") standard is designed to ensure that banking organizations have sufficient high-quality liquid assets ("HQLA") to cover net cash outflows arising from significant stress over 30 calendar days. The standard's objective is to promote the short-term resilience of the liquidity risk profile of banking organizations. We and our U.S. Bank Subsidiaries are subject to the LCR requirements issued by U.S. banking regulators ("U.S. LCR"), which are based on the Basel Committee's LCR, including a requirement to calculate each entity's U.S. LCR on each business day.
HQLA by Type of Asset
| $ in millions | At June 30, 2017 | At December 31, 2016 | ||||||
Cash 1 | $ | 29,608 | $ | 30,569 | ||||
Securities 2 | 138,666 | 129,524 | ||||||
Total 3 | $ | 168,274 | $ | 160,093 | ||||
| 1. | Cash on deposit with central banks. |
| 2. | Primarily includes U.S. Treasuries; U.S. agency mortgage-backed securities; sovereign bonds; investment-grade corporate bonds; and publicly traded common equities. |
| 3. | Excludes excess HQLA held at U.S. Bank Subsidiaries. |
The regulatory definition of HQLA is substantially the same as our GLR. Differences include cash placed at institutions other than central banks, which is included in our GLR but considered an inflow for LCR purposes, and certain unencumbered investment grade corporate bonds and publicly traded common equities, which are includable in HQLA but do not meet the definition of GLR.
We and our U.S. Bank Subsidiaries are required to maintain a minimum of 100% of the fully phased-in U.S. LCR. We and our U.S. Bank Subsidiaries are compliant with the minimum required U.S. LCR based on current interpretations.
Net Stable Funding Ratio
The objective of the Net Stable Funding Ratio ("NSFR") is to reduce funding risk over a one-year horizon by requiring banking organizations to fund their activities with sufficiently stable sources of funding in order to mitigate the risk of future funding stress.
The Basel Committee finalized the NSFR framework in 2014. In May 2016, the U.S. banking regulators issued a proposal to implement the NSFR in the U.S. If adopted as proposed, the requirements would apply to us and our U.S. Bank Subsidiaries beginning January 1, 2018. We continue to evaluate the potential impact of the proposal, which is subject to further rulemaking procedures following the closing of the public comment period in August 2016. Our preliminary estimates, based on the current proposal, indicate that actions will be necessary to meet the requirement, which we expect to accomplish by the effective date of the final rule. For an additional discussion of NSFR, see "Management's Discussion and Analysis of Financial Condition and Results of Operations-Liquidity and Capital Resources-Regulatory Liquidity Framework-Net Stable Funding Ratio" in Part II, Item 7 of the 2016 Form 10-K.
| 21 | June 2017 Form 10-Q |
| Management's Discussion and Analysis | |
Funding Management
We manage our funding in a manner that reduces the risk of disruption to our operations. We pursue a strategy of diversification of secured and unsecured funding sources (by product, investor and region) and attempt to ensure that the tenor of our liabilities equals or exceeds the expected holding period of the assets being financed.
We fund our balance sheet on a global basis through diverse sources. These sources may include our equity capital, long-term borrowings, securities sold under agreements to repurchase ("repurchase agreements"), securities lending, deposits, letters of credit and lines of credit. We have active financing programs for both standard and structured products targeting global investors and currencies.
Secured Financing
For a discussion of our secured financing activities, see "Management's Discussion and Analysis of Financial Condition and Results of Operations-Liquidity and Capital Resources-Funding Management-Secured Financing" in Part II, Item 7 of the 2016 Form 10-K.
At June 30, 2017 and December 31, 2016, the weighted average maturity of our secured financing of less liquid assets was greater than 120 days.
Unsecured Financing
For a discussion of our unsecured financing activities, see "Management's Discussion and Analysis of Financing Condition and Results of Operations-Liquidity and Capital Resources-Funding Management-Unsecured Financing" in Part II, Item 7 of the 2016 Form 10-K and see Note 4 to the consolidated financial statements.
Deposits
| $ in millions | At June 30, 2017 | At December 31, 2016 | ||||||
Deposits | $ | 144,913 | $ | 155,863 | ||||
The majority of deposits in our U.S. Bank Subsidiaries are sourced from our retail brokerage accounts and are considered to have stable, low-cost funding characteristics. Available funding sources to our U.S. Bank Subsidiaries include demand deposit accounts, money market deposit accounts, time deposits, repurchase agreements, federal funds purchased and Federal Home Loan Bank advances. The reduction in Deposits as of June 30, 2017 compared with December 31, 2016 was primarily due to client deployment of cash into the markets and typical seasonal client tax payments.
Short-Term Borrowings
| $ in millions | At June 30, 2017 | At December 31, 2016 | ||||||
Short-term borrowings | $ | 916 | $ | 941 | ||||
Our unsecured short-term borrowings primarily consist of structured notes, bank loans and bank notes with original maturities of 12 months or less.
Long-Term Borrowings
We believe that accessing debt investors through multiple distribution channels helps provide consistent access to the unsecured markets. In addition, the issuance of long-term borrowings allows us to reduce reliance on short-term credit sensitive instruments. Long-term borrowings are generally managed to achieve staggered maturities, thereby mitigating refinancing risk, and to maximize investor diversification through sales to global institutional and retail clients across regions, currencies and product types. Availability and cost of financing to us can vary depending on market conditions, the volume of certain trading and lending activities, our credit ratings and the overall availability of credit.
We may engage in various transactions in the credit markets (including, for example, debt retirements) that we believe are in our investors' best interests.
Long-term Borrowings by Maturity at June 30, 2017
| $ in millions | Parent Company | Subsidiaries | Total | |||||||||
2017 | $ | 8,742 | $ | 4,079 | $ | 12,821 | ||||||
2018 | 18,532 | 2,044 | 20,576 | |||||||||
2019 | 21,738 | 1,567 | 23,305 | |||||||||
2020 | 19,238 | 1,860 | 21,098 | |||||||||
2021 | 15,826 | 1,350 | 17,176 | |||||||||
Thereafter | 80,485 | 8,651 | 89,136 | |||||||||
Total | $ | 164,561 | $ | 19,551 | $ | 184,112 | ||||||
Maturities over next 12 months |
| $ | 28,823 | |||||||||
Approximate net increase in long-term borrowings June 30, 2017 through July 28, 2017 |
| $ | 7,518 | |||||||||
Includes: |
| |||||||||||
Senior debt issuance on July 24, 2017 |
| 7,000 | ||||||||||
For further information on long-term borrowings, see Note 10 to the consolidated financial statements.
| June 2017 Form 10-Q | 22 |
| Management's Discussion and Analysis | |
Credit Ratings
We rely on external sources to finance a significant portion of our daily operations. The cost and availability of financing generally are impacted by our credit ratings, among other things. In addition, our credit ratings can have an impact on certain trading revenues, particularly in those businesses where longer-term counterparty performance is a key consideration, such as OTC derivative transactions, including credit derivatives and interest rate swaps. Rating agencies consider company-specific factors; other industry factors such as regulatory or legislative changes and the macroeconomic environment, among other things.
Our credit ratings do not include any uplift from perceived government support from any rating agency given the significant progress of the U.S. financial reform legislation and regulations. Some rating agencies have stated that they currently incorporate various degrees of credit rating uplift from non-governmental third-party sources of potential support.
Parent Company and MSBNA's Senior Unsecured Ratings at July 28, 2017
| Parent Company | ||||||
| Short-term Debt | Long-term Debt | Rating Outlook | ||||
DBRS, Inc. | R-1 (middle) | A (high) | Stable | |||
Fitch Ratings, Inc. | F1 | A | Stable | |||
Moody's Investors Service, Inc. | P-2 | A3 | Stable | |||
Rating and Investment Information, Inc. | a-1 | A- | Stable | |||
Standard & Poor's Global Ratings | A-2 | BBB+ | Stable | |||
| Morgan Stanley Bank, N.A. | ||||||
| Short-term Debt | Long-term Debt | Rating Outlook | ||||
Fitch Ratings, Inc. | F1 | A+ | Stable | |||
Moody's Investors Service, Inc. | P-1 | A1 | Stable | |||
Standard & Poor's Global Ratings | A-1 | A+ | Stable | |||
In connection with certain OTC trading agreements and certain other agreements where we are a liquidity provider to certain financing vehicles associated with the Institutional Securities business segment, we may be required to provide additional collateral, immediately settle any outstanding liability balances with certain counterparties or pledge additional collateral to certain exchanges and clearing organizations in the event of a future credit rating downgrade irrespective of whether we are in a net asset or net liability position.
The additional collateral or termination payments that may be called in the event of a future credit rating downgrade vary by contract and can be based on ratings by either or both of Moody's Investors Service, Inc. ("Moody's") and Standard & Poor's Global Ratings ("S&P"). The following table shows
the future potential collateral amounts and termination payments that could be called or required by counterparties or exchanges and clearing organizations in the event of one-notch or two-notch downgrade scenarios, from the lowest of Moody's or S&P ratings, based on the relevant contractual downgrade triggers.
Incremental Collateral or Terminating Payments upon Potential Future Rating Downgrade
| $ in millions | At June 30, 2017 | At December 31, 2016 | ||||||
One-notch downgrade | $ | 950 | $ | 1,292 | ||||
Two-notch downgrade | 720 | 875 | ||||||
While certain aspects of a credit rating downgrade are quantifiable pursuant to contractual provisions, the impact it would have on our business and results of operations in future periods is inherently uncertain and would depend on a number of interrelated factors, including, among others, the magnitude of the downgrade, the rating relative to peers, the rating assigned by the relevant agency pre-downgrade, individual client behavior and future mitigating actions we might take. The liquidity impact of additional collateral requirements is included in our Liquidity Stress Tests.
Capital Management
We view capital as an important source of financial strength and actively manage our consolidated capital position based upon, among other things, business opportunities, risks, capital availability and rates of return together with internal capital policies, regulatory requirements and rating agency guidelines and, therefore, in the future may expand or contract our capital base to address the changing needs of our businesses. We attempt to maintain total capital, on a consolidated basis, at least equal to the sum of our operating subsidiaries' required equity.
Common Stock
We repurchased approximately $500 million of our outstanding common stock as part of our share repurchase program during the current quarter and $1,250 million during the current year period. We repurchased approximately $625 million during the prior year quarter and $1,250 million in the prior year period (see Note 14 to the consolidated financial statements).
For a description of our share repurchase program, see "Unregistered Sales of Equity Securities and Use of Proceeds."
For a description of our 2017 capital plan, see "Liquidity and Capital Resources-Regulatory Requirements-Capital Plans and Stress Tests."
| 23 | June 2017 Form 10-Q |
| Management's Discussion and Analysis | |
Preferred Stock
On June 15, 2017, we announced that the Board declared quarterly dividends for preferred stock shareholders of record on June 30, 2017 that were paid on July 17, 2017.
For additional information on preferred stock, see Note 14 to the consolidated financial statements.
Tangible Equity
At | At December 31, 2016 | Monthly Average Balance Three Months Ended | ||||||||||
| $ in millions | June 30, 2017 | |||||||||||
Common equity | $ | 70,306 | $ | 68,530 | $ | 69,916 | ||||||
Preferred equity | 8,520 | 7,520 | 8,520 | |||||||||
Morgan Stanley shareholders' equity | 78,826 | 76,050 | 78,436 | |||||||||
Less: Goodwill and net intangible assets | (9,156 | ) | (9,296 | ) | (9,194 | ) | ||||||
Morgan Stanley tangible shareholders' equity 1 | $ | 69,670 | $ | 66,754 | $ | 69,242 | ||||||
Common equity | $ | 70,306 | $ | 68,530 | $ | 69,916 | ||||||
Less: Goodwill and net intangible assets | (9,156 | ) | (9,296 | ) | (9,194 | ) | ||||||
Tangible common equity 1 | $ | 61,150 | $ | 59,234 | $ | 60,722 | ||||||
| 1. | Morgan Stanley tangible shareholders' equity and tangible common equity are non-GAAP financial measures. |
Regulatory Requirements
Regulatory Capital Framework
We are a financial holding company under the Bank Holding Company Act of 1956, as amended (the "BHC Act"), and are subject to the regulation and oversight of the Board of Governors of the Federal Reserve System (the "Federal Reserve"). The Federal Reserve establishes capital requirements for us, including well-capitalized standards, and evaluates our compliance with such capital requirements. The Office of the Comptroller of the Currency ("OCC") establishes similar capital requirements and standards for our U.S. Bank Subsidiaries. The regulatory capital requirements are largely based on the Basel III capital standards established by the Basel Committee and also implement certain provisions of the Dodd-Frank Wall Street Reform and Consumer Protection Act (the "Dodd-Frank Act").
The Basel Committee has recently published revisions to certain standards in its capital framework, and is actively considering potential revisions to other capital standards, that, if adopted by the U.S. banking agencies, could substantially change the U.S. regulatory capital framework. For additional discussion of regulatory capital framework, see "Management's Discussion and Analysis of Financial Condition and Results of Operations-Liquidity and Capital Resources-Regulatory Requirements-Regulatory Capital Framework" in Part II, Item 7 of the 2016 Form 10-K.
Regulatory Capital Requirements
We are required to maintain minimum risk-based and leverage capital ratios under the regulatory capital requirements. A summary of the calculations of regulatory capital, risk-weighted assets ("RWAs") and transition provisions follows.
Regulatory Capital. Minimum risk-based capital ratio requirements apply to Common Equity Tier 1 capital, Tier 1 capital and Total capital (which includes Tier 2 capital). Certain adjustments to and deductions from capital are required for purposes of determining these ratios, such as goodwill, intangible assets, certain deferred tax assets, other amounts in Accumulated other comprehensive income (loss) ("AOCI") and investments in the capital instruments of unconsolidated financial institutions. Certain of these adjustments and deductions are also subject to transitional provisions.
In addition to the minimum risk-based capital ratio requirements, on a fully phased-in basis by 2019, we will be subject to:
| • | A greater than 2.5% Common Equity Tier 1 capital conservation buffer; |
| • | The Common Equity Tier 1 global systemically important bank ("G-SIB") capital surcharge, currently at 3%; and |
| • | Up to a 2.5% Common Equity Tier 1 countercyclical capital buffer ("CCyB"), currently set by U.S. banking regulators at zero (collectively, the "buffers"). |
In 2017, the phase-in amount for each of the buffers is 50% of the fully phased-in buffer requirement. Failure to maintain the buffers would result in restrictions on our ability to make capital distributions, including the payment of dividends and the repurchase of stock, and to pay discretionary bonuses to executive officers. For a further discussion of the G-SIB capital surcharge, see "Management's Discussion and Analysis of Financial Condition and Results of Operations-Liquidity and Capital Resources-Regulatory Requirements-G-SIB Capital Surcharge" in Part II, Item 7 of the 2016 Form 10-K.
See "Total Loss-Absorbing Capacity, Long-Term Debt and Clean Holding Company Requirements" herein for additional capital requirements effective January 1, 2019.
Risk-Weighted Assets. RWAs reflect both our on- and off-balance sheet risk as well as capital charges attributable to the risk of loss arising from the following:
| • | Credit risk: The failure of a borrower, counterparty or issuer to meet its financial obligations to us; |
| June 2017 Form 10-Q | 24 |
| Management's Discussion and Analysis | |
| • | Market risk: Adverse changes in the level of one or more market prices, rates, indices, implied volatilities, correlations or other market factors, such as market liquidity; and |
| • | Operational risk: Inadequate or failed processes or systems, human factors or from external events ( e.g. , fraud, theft, legal and compliance risks, cyber attacks or damage to physical assets). |
For a further discussion of our market, credit and operational risks, see "Quantitative and Qualitative Disclosures about Market Risk."
Our binding risk-based capital ratios for regulatory purposes are the lower of the capital ratios computed under (i) the standardized approaches for calculating credit risk and market risk RWAs (the "Standardized Approach") and (ii) the applicable advanced approaches for calculating credit risk, market risk and operational risk RWAs (the "Advanced Approach"). The credit risk RWA calculations between the two approaches differ in that the Standardized Approach requires calculation of RWAs using prescribed risk weights, whereas the Advanced Approach utilizes models to calculate exposure amounts and risk weights. At June 30, 2017, our binding ratios are based on the Advanced Approach transitional rules.
The methods for calculating each of our risk-based capital ratios will change through January 1, 2022 as aspects of the capital rules are phased in. These changes may result in differences in our reported capital ratios from one reporting period to the next that are independent of changes to our capital base, asset composition, off-balance sheet exposures or risk profile.
Minimum Risk-Based Capital Ratios: Transitional Provisions
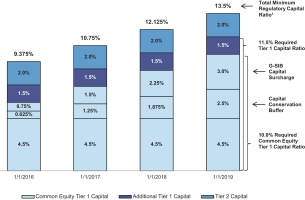
| 1. | These ratios assume the requirements for the G-SIB capital surcharge (3.0%) and CCyB (zero) remain at current levels. See "Total Loss-Absorbing Capacity, Long-Term Debt and Clean Holding Company Requirements" herein for additional capital requirements effective January 1, 2019. |
Transitional and Fully Phased-In Regulatory Capital Ratios
|
| |||||||||||||||
| At June 30, 2017 | ||||||||||||||||
| Transitional | Pro Forma Fully Phased-In | |||||||||||||||
| $ in millions | Standardized | Advanced | Standardized | Advanced | ||||||||||||
Risk-based capital | ||||||||||||||||
Common Equity Tier 1 capital | $ | 61,604 | $ | 61,604 | $ | 60,862 | $ | 60,862 | ||||||||
Tier 1 capital | 70,380 | 70,380 | 69,603 | 69,603 | ||||||||||||
Total capital | 81,302 | 81,025 | 80,537 | 80,261 | ||||||||||||
Total RWAs | 368,963 | 370,679 | 379,191 | 381,520 | ||||||||||||
Common Equity Tier 1 capital ratio | 16.7 | % | 16.6 | % | 16.1 | % | 16.0 | % | ||||||||
Tier 1 capital ratio | 19.1 | % | 19.0 | % | 18.4 | % | 18.2 | % | ||||||||
Total capital ratio | 22.0 | % | 21.9 | % | 21.2 | % | 21.0 | % | ||||||||
Leverage-based capital | ||||||||||||||||
Adjusted average assets 1 | $ | 828,365 | N/A | $ | 827,842 | N/A | ||||||||||
Tier 1 leverage ratio 2 | 8.5 | % | N/A | 8.4 | % | N/A | ||||||||||
| At December 31, 2016 | ||||||||||||||||
| Transitional | Pro Forma Fully Phased-In | |||||||||||||||
| $ in millions | Standardized | Advanced | Standardized | Advanced | ||||||||||||
Risk-based capital | ||||||||||||||||
Common Equity Tier 1 capital | $ | 60,398 | $ | 60,398 | $ | 58,616 | $ | 58,616 | ||||||||
Tier 1 capital | 68,097 | 68,097 | 66,315 | 66,315 | ||||||||||||
Total capital | 78,917 | 78,642 | 77,155 | 76,881 | ||||||||||||
Total RWAs | 340,191 | 358,141 | 351,101 | 369,709 | ||||||||||||
Common Equity Tier 1 capital ratio | 17.8 | % | 16.9 | % | 16.7 | % | 15.9 | % | ||||||||
Tier 1 capital ratio | 20.0 | % | 19.0 | % | 18.9 | % | 17.9 | % | ||||||||
Total capital ratio | 23.2 | % | 22.0 | % | 22.0 | % | 20.8 | % | ||||||||
Leverage-based capital | ||||||||||||||||
Adjusted average assets 1 | $ | 811,402 | N/A | $ | 810,288 | N/A | ||||||||||
Tier 1 leverage ratio 2 | 8.4 | % | N/A | 8.2 | % | N/A | ||||||||||
N/A-Not Applicable
| 1. | Adjusted average assets represent the denominator of the Tier 1 leverage ratio and are composed of the average daily balance of consolidated on-balance sheet assets under U.S. GAAP during the calendar quarter ended June 30, 2017 and December 31, 2016 adjusted for disallowed goodwill, transitional intangible assets, certain deferred tax assets, certain investments in the capital instruments of unconsolidated financial institutions and other adjustments. |
| 2. | The minimum Tier 1 leverage ratio requirement is 4.0%. |
The fully phased-in pro forma estimates in the previous tables are based on our current understanding of the capital rules and other factors, which may be subject to change as we receive additional clarification and implementation guidance from the Federal Reserve and as the interpretation of the regulations evolves over time. These fully phased-in pro forma estimates are non-GAAP financial measures because they were not yet effective at June 30, 2017. These preliminary estimates are subject to risks and uncertainties that may cause actual results to differ materially and should not be taken as a projection of what our capital, capital ratios, RWAs, earnings or other results will actually be at future dates. For a discussion of risks and uncertainties that may affect our future results, see "Risk Factors" in Part I, Item 1A of the 2016 Form 10-K.
| 25 | June 2017 Form 10-Q |
| Management's Discussion and Analysis | |
Well-Capitalized Minimum Regulatory Capital Ratios for U.S. Bank Subsidiaries
| At June 30, 2017 | ||||
Common Equity Tier 1 risk-based capital ratio | 6.5% | |||
Tier 1 risk-based capital ratio | 8.0% | |||
Total risk-based capital ratio | 10.0% | |||
Tier 1 leverage ratio | 5.0% | |||
For us to remain a financial holding company, our U.S. Bank Subsidiaries must qualify as well-capitalized by maintaining the minimum ratio requirements set forth in the previous table. The Federal Reserve has not yet revised the well-capitalized standard for financial holding companies to reflect the higher capital standards required for us under the capital rules. Assuming that the Federal Reserve would apply the same or very similar well-capitalized standards to financial holding companies, each of our risk-based capital ratios and Tier 1 leverage ratio at June 30, 2017 would have exceeded the revised well-capitalized standard. The Federal Reserve may require us to maintain risk- and leverage-based capital ratios substantially in excess of mandated minimum levels, depending upon general economic conditions and a financial holding company's particular condition, risk profile and growth plans.
Regulatory Capital Calculated under Transitional Rules
| $ in millions | At June 30, 2017 | At December 31, 2016 | ||||||
Common Equity Tier 1 capital | ||||||||
Common stock and surplus | $ | 16,469 | $ | 17,494 | ||||
Retained earnings | 56,325 | 53,679 | ||||||
AOCI | (2,488 | ) | (2,643 | ) | ||||
Regulatory adjustments and deductions: | ||||||||
Net goodwill | (6,532 | ) | (6,526 | ) | ||||
Net intangible assets (other than goodwill and mortgage servicing assets) | (2,051 | ) | (1,631 | ) | ||||
Other adjustments and deductions 1 | (119 | ) | 25 | |||||
Total Common Equity Tier 1 capital | $ | 61,604 | $ | 60,398 | ||||
Additional Tier 1 capital | ||||||||
Preferred stock | $ | 8,520 | $ | 7,520 | ||||
Noncontrolling interests | 489 | 613 | ||||||
Other adjustments and deductions 2 | (66 | ) | (246 | ) | ||||
Additional Tier 1 capital | $ | 8,943 | $ | 7,887 | ||||
Deduction for investments in covered funds | (167 | ) | (188 | ) | ||||
Total Tier 1 capital | $ | 70,380 | $ | 68,097 | ||||
Standardized Tier 2 capital | ||||||||
Subordinated debt | $ | 10,351 | $ | 10,303 | ||||
Noncontrolling interests | 80 | 62 | ||||||
Eligible allowance for credit losses | 493 | 464 | ||||||
Other adjustments and deductions | (2 | ) | (9 | ) | ||||
Total Standardized Tier 2 capital | $ | 10,922 | $ | 10,820 | ||||
Total Standardized capital | $ | 81,302 | $ | 78,917 | ||||
Advanced Tier 2 capital | ||||||||
Subordinated debt | $ | 10,351 | $ | 10,303 | ||||
Noncontrolling interests | 80 | 62 | ||||||
Eligible credit reserves | 216 | 189 | ||||||
Other adjustments and deductions | (2 | ) | (9 | ) | ||||
Total Advanced Tier 2 capital | $ | 10,645 | $ | 10,545 | ||||
Total Advanced capital | $ | 81,025 | $ | 78,642 | ||||
| June 2017 Form 10-Q | 26 |
| Management's Discussion and Analysis | |
Regulatory Capital Rollforward Calculated under Transitional Rules
| $ in millions | Six Months Ended June 30, 2017 | |||
Common Equity Tier 1 capital | ||||
Common Equity Tier 1 capital at December 31, 2016 | $ | 60,398 | ||
Change related to the following items: | ||||
Value of shareholders' common equity | 1,776 | |||
Net goodwill | (6 | ) | ||
Net intangible assets (other than goodwill and mortgage servicing assets) | (420 | ) | ||
Other adjustments and deductions 1 | (144 | ) | ||
Common Equity Tier 1 capital at June 30, 2017 | $ | 61,604 | ||
Additional Tier 1 capital | ||||
Additional Tier 1 capital at December 31, 2016 | $ | 7,887 | ||
New issuance of qualifying preferred stock | 1,000 | |||
Change related to the following items: | ||||
Noncontrolling interests | (124 | ) | ||
Other adjustments and deductions 2 | 180 | |||
Additional Tier 1 capital at June 30, 2017 | 8,943 | |||
Deduction for investments in covered funds at December 31, 2016 | (188 | ) | ||
Change in deduction for investments in covered funds | 21 | |||
Deduction for investments in covered funds at June 30, 2017 | (167 | ) | ||
Tier 1 capital at June 30, 2017 | $ | 70,380 | ||
Standardized Tier 2 capital | ||||
Tier 2 capital at December 31, 2016 | $ | 10,820 | ||
Change related to the following items: | ||||
Eligible allowance for credit losses | 29 | |||
Other changes, adjustments and deductions 3 | 73 | |||
Standardized Tier 2 capital at June 30, 2017 | $ | 10,922 | ||
Total Standardized capital at June 30, 2017 | $ | 81,302 | ||
Advanced Tier 2 capital | ||||
Tier 2 capital at December 31, 2016 | $ | 10,545 | ||
Change related to the following items: | ||||
Eligible credit reserves | 27 | |||
Other changes, adjustments and deductions 3 | 73 | |||
Advanced Tier 2 capital at June 30, 2017 | $ | 10,645 | ||
Total Advanced capital at June 30, 2017 | $ | 81,025 | ||
| 1. | Other adjustments and deductions used in the calculation of Common Equity Tier 1 capital include credit spread premium over risk-free rate for derivative liabilities, net deferred tax assets, net after-tax DVA and adjustments related to AOCI. |
| 2. | Other adjustments and deductions used in the calculation of Additional Tier 1 capital include credit spread premium over risk-free rate for derivatives liabilities, net deferred tax assets and net after-tax DVA. |
| 3. | Other changes, adjustments and deductions used in the calculations of Standardized and Advanced Tier 2 capital include changes in subordinated debt and noncontrolling interests. |
RWAs Rollforward Calculated under Transitional Rules
Six Months Ended June 30, 2017 1 | ||||||||
| $ in millions | Standardized | Advanced | ||||||
Credit risk RWAs | ||||||||
Balance at December 31, 2016 | $ | 278,874 | $ | 169,231 | ||||
Change related to the following items: | ||||||||
Derivatives | 3,799 | 1,896 | ||||||
Securities financing transactions | 4,406 | 1,719 | ||||||
Securitizations | 1,362 | 992 | ||||||
Investment securities | (3,025 | ) | (1,593 | ) | ||||
Commitments, guarantees and loans | 40 | 228 | ||||||
Cash | (452 | ) | (520 | ) | ||||
Equity investments | (933 | ) | (991 | ) | ||||
Other credit risk 2 | 1,141 | 622 | ||||||
Total change in credit risk RWAs | $ | 6,338 | $ | 2,353 | ||||
Balance at June 30, 2017 | $ | 285,212 | $ | 171,584 | ||||
Market risk RWAs | ||||||||
Balance at December 31, 2016 | $ | 61,317 | $ | 60,872 | ||||
Change related to the following items: | ||||||||
Regulatory VaR | 2,366 | 2,366 | ||||||
Regulatory stressed VaR | 14,279 | 14,279 | ||||||
Incremental risk charge | 2,448 | 2,448 | ||||||
Comprehensive risk measure | (1,935 | ) | (1,670 | ) | ||||
Specific risk: | ||||||||
Non-securitizations | 2,138 | 2,138 | ||||||
Securitizations | 3,138 | 3,175 | ||||||
Total change in market risk RWAs | $ | 22,434 | $ | 22,736 | ||||
Balance at June 30, 2017 | $ | 83,751 | $ | 83,608 | ||||
Operational risk RWAs | ||||||||
Balance at December 31, 2016 | $ | N/A | $ | 128,038 | ||||
Change in operational risk RWAs 3 | N/A | (12,551 | ) | |||||
Balance at June 30, 2017 | $ | N/A | $ | 115,487 | ||||
Total RWAs | $ | 368,963 | $ | 370,679 | ||||
VaR-Value-at-Risk
N/A-Not Applicable
| 1. | The RWAs for each category in the table reflect both on- and off-balance sheet exposures, where appropriate. |
| 2. | Amount reflects assets not in a defined category, non-material portfolios of exposures and unsettled transactions, as applicable. |
| 3. | Amount reflects a reduction in the internal loss data related to litigation utilized in the operational risk capital model. |
Regulatory stressed VaR increased $14,279 million in the current year period under both the Standardized and the Advanced approaches. These increases were primarily driven by increases in trading inventory across the equities, global macro, and credit businesses within Institutional Securities, in response to client demand.
| 27 | June 2017 Form 10-Q |
| Management's Discussion and Analysis | |
Supplementary Leverage Ratio
We and our U.S. Bank Subsidiaries are required to publicly disclose our supplementary leverage ratios, which will become effective as a capital standard on January 1, 2018. By January 1, 2018, we must also maintain a Tier 1 supplementary leverage capital buffer of at least 2% in addition to the 3% minimum supplementary leverage ratio (for a total of at least 5%), in order to avoid limitations on capital distributions, including dividends and stock repurchases, and discretionary bonus payments to executive officers. In addition, beginning in 2018, our U.S. Bank Subsidiaries must maintain a supplementary leverage ratio of 6% to be considered well-capitalized.
Pro Forma Supplementary Leverage Exposure and Ratio
| At June 30, 2017 | At December 31, 2016 | |||||||||||||||
$ in millions | Transitional basis | Fully phased-in 1 | Transitional basis | Fully phased-in 1 | ||||||||||||
Average total assets 2 | $ | 837,875 | $ | 837,875 | $ | 820,536 | $ | 820,536 | ||||||||
Adjustments 3, 4 | 241,726 | 241,203 | 242,113 | 240,999 | ||||||||||||
Pro forma supplementary leverage exposure | $ | 1,079,601 | $ | 1,079,078 | $ | 1,062,649 | $ | 1,061,535 | ||||||||
Pro forma supplementary leverage ratio | 6.5% | 6.5% | 6.4% | 6.2% | ||||||||||||
| 1. | Estimated amounts utilize fully phased-in Tier 1 capital and take into consideration the Tier 1 capital deduction that would be applicable in 2018 after the phase-in period has ended. |
| 2. | Computed as the average daily balance of consolidated total assets under U.S. GAAP during the calendar quarter ended June 30, 2017 and December 31, 2016. |
| 3. | Computed as the arithmetic mean of the month-end balances over the calendar quarter ended June 30, 2017 and December 31, 2016. |
| 4. | Adjustments are to: (i) incorporate derivative exposures, including adding the related potential future exposure (including for derivatives cleared for clients), grossing up cash collateral netting where qualifying criteria are not met and adding the effective notional principal amount of sold credit protection offset by qualifying purchased credit protection; (ii) reflect the counterparty credit risk for repo-style transactions; (iii) add the credit equivalent amount for off-balance sheet exposures; and (iv) apply other adjustments to Tier 1 capital, including disallowed goodwill, transitional intangible assets, certain deferred tax assets and certain investments in the capital instruments of unconsolidated financial institutions. |
Pro forma fully phased-in supplementary leverage exposure and ratio are based on our current understanding of rules and other factors.
U.S. Subsidiary Banks' Pro Forma Supplementary Leverage Ratios on a Transitional Basis
| At June 30, 2017 | At December 31, 2016 | |||||||
MSBNA | 8.8 | % | 7.7% | |||||
MSPBNA | 9.9 | % | 10.2% | |||||
The pro forma supplementary leverage exposures and pro forma supplementary leverage ratios, both on transitional and fully phased-in bases, are non-GAAP financial measures because they have not yet become effective. Our estimates are subject to risks and uncertainties that may cause actual results to differ materially from estimates based on these regulations. Further, these expectations should not be taken as projections of what our supplementary leverage ratios, earnings, assets or exposures will actually be at future dates. For a
discussion of risks and uncertainties that may affect our future results, see "Risk Factors" in Part I, Item 1A of the 2016 Form 10-K.
Total Loss-Absorbing Capacity, Long-Term Debt and Clean Holding Company Requirements
On December 15, 2016, the Federal Reserve adopted a final rule for top-tier bank holding companies of U.S. G-SIBs ("covered BHCs"), including the Parent Company, that establishes external total loss-absorbing capacity ("TLAC"), long-term debt ("LTD") and clean holding company requirements. The final rule contains various definitions and restrictions, such as requiring eligible LTD to be issued by the covered BHC and be unsecured, have a maturity of one year or more from the date of issuance and not have certain derivative-linked features typically associated with certain types of structured notes. We expect to be in compliance with all requirements of the rule by January 1, 2019, the date that compliance is required.
For a further discussion of TLAC and LTD requirements, see "Management's Discussion and Analysis of Financial Condition and Results of Operations-Liquidity and Capital Resources-Regulatory Requirements-Total Loss-Absorbing Capacity, Long-Term Debt and Clean Holding Company Requirements" in Part II, Item 7 of the 2016 Form 10-K. For discussions about the interaction between the single point of entry resolution strategy and the TLAC and LTD requirements, see "Business-Supervision and Regulation-Financial Holding Company-Resolution and Recovery Planning" in Part I, Item 1 and "Risk Factors-Legal, Regulatory and Compliance Risk" in Part I, Item 1A of the 2016 Form 10-K.
Capital Plans and Stress Tests
Pursuant to the Dodd-Frank Act, the Federal Reserve has adopted capital planning and stress test requirements for large bank holding companies, including us, which form part of the Federal Reserve's annual Comprehensive Capital Analysis and Review ("CCAR") framework.
We submitted our 2017 capital plan and company-run stress test results to the Federal Reserve on April 5, 2017. On June 22, 2017, the Federal Reserve published summary results of the Dodd-Frank Act supervisory stress tests of each large bank holding company, including us. On June 28, 2017, the Federal Reserve published summary results of CCAR and announced that they did not object to our 2017 Capital Plan ("Capital Plan"). The Capital Plan includes the repurchase of up to $5.0 billion of outstanding common stock for the period beginning July 1, 2017 through June 30, 2018, an increase from $3.5 billion in the 2016 Capital Plan. Additionally, the Capital Plan includes an increase in our quarterly common
| June 2017 Form 10-Q | 28 |
| Management's Discussion and Analysis | |
stock dividend to $0.25 per share from $0.20 per share, beginning with the common stock dividend declared on July 19, 2017. We disclosed a summary of the results of our company-run stress tests on June 23, 2017 on our Investor Relations website. In addition, we must submit the results of our mid-cycle company-run stress test to the Federal Reserve by October 5, 2017 and disclose a summary of the results between October 5, 2017 and November 4, 2017.
The Dodd-Frank Act also requires each of our U.S. Bank Subsidiaries to conduct an annual stress test. MSBNA and MSPBNA submitted their 2017 annual company-run stress tests to the OCC on April 5, 2017 and published a summary of their stress test results on June 23, 2017 on our Investor Relations website.
For a further discussion of our capital plans and stress tests, see "Management's Discussion and Analysis of Financial Condition and Results of Operations-Liquidity and Capital Resources-Regulatory Requirements-Capital Plans and Stress Tests" in Part II, Item 7 of the 2016 Form 10-K.
Attribution of Average Common Equity According to the Required Capital Framework
Our required capital ("Required Capital") estimation is based on the Required Capital framework, an internal capital adequacy measure. Common equity attribution to the business segments is based on capital usage calculated by the Required Capital framework, as well as each business segment's relative contribution to our total Required Capital. Required Capital is assessed for each business segment and further attributed to product lines. This process is intended to align capital with the risks in each business segment in order to allow senior management to evaluate returns on a risk-adjusted basis.
The Required Capital framework is a risk-based and leverage use-of-capital measure, which is compared with our regulatory capital to ensure that we maintain an amount of going concern capital after absorbing potential losses from stress events, where applicable, at a point in time. We define the difference between our total average common equity and the sum of the average common equity amounts allocated to our business segments as Parent Company equity. We generally hold Parent Company equity for prospective regulatory requirements, organic growth, acquisitions and other capital needs.
Common equity estimation and attribution to the business segments are based on our pro forma fully phased-in regulatory capital estimates, including supplementary leverage, and incorporates our internal stress tests. The amount of capital allocated to the business segments is set at the beginning of each year and remains fixed throughout the year until the next
annual reset. Differences between available and Required Capital are attributed to Parent Company equity during the year.
The Required Capital framework is expected to evolve over time in response to changes in the business and regulatory environment. We will continue to evaluate the framework with respect to the impact of future regulatory requirements, as appropriate.
Average Common Equity Attribution
| Three Months Ended June 30, | Six Months Ended June 30, | |||||||||||||||
| $ in billions | 2017 | 2016 | 2017 | 2016 | ||||||||||||
Institutional Securities | $ | 40.2 | $ | 43.2 | $ | 40.2 | $ | 43.2 | ||||||||
Wealth Management | 17.2 | 15.3 | 17.2 | 15.3 | ||||||||||||
Investment Management | 2.4 | 2.8 | 2.4 | 2.8 | ||||||||||||
Parent Company | 10.1 | 7.7 | 9.7 | 7.3 | ||||||||||||
Total 1 | $ | 69.9 | $ | 69.0 | $ | 69.5 | $ | 68.6 | ||||||||
| 1. | Average common equity is a non-GAAP financial measure. |
Regulatory Developments
Resolution and Recovery Planning
Pursuant to the Dodd-Frank Act, we are required to submit to the Federal Reserve and the Federal Deposit Insurance Corporation ("FDIC") an annual resolution plan that describes our strategy for a rapid and orderly resolution under the U.S. Bankruptcy Code in the event of our material financial distress or failure.
Our preferred resolution strategy, which is set out in our 2017 resolution plan, is a single point of entry strategy. We submitted our full 2017 resolution plan on June 30, 2017. We previously submitted a status report in respect of certain shortcomings identified in our 2015 resolution plan on September 30, 2016. As indicated in our 2017 resolution plan and anticipated in our 2016 status report, the Parent Company has amended and restated its support agreement with its material subsidiaries. Under the amended and restated support agreement, upon the occurrence of a resolution scenario, the Parent Company would be obligated to contribute or loan on a subordinated basis all of its material assets, other than shares in subsidiaries of the Parent Company and certain intercompany receivables, to provide capital and liquidity, as applicable, to our material subsidiaries. The obligations of the Parent Company under the amended and restated support agreement are secured on a senior basis by the assets of the Parent Company (other than shares in subsidiaries of the Parent Company). As a result, claims of our material subsidiaries against the assets of the Parent Company (other than shares in subsidiaries of the
| 29 | June 2017 Form 10-Q |
| Management's Discussion and Analysis | |
Parent Company) are effectively senior to unsecured obligations of the Parent Company.
In September 2016, the OCC issued final guidelines that establish enforceable standards for recovery planning by national banks and certain other institutions with total consolidated assets of $50 billion or more, calculated on a rolling four-quarter average basis, including MSBNA and MSPBNA. The guidelines were effective on January 1, 2017; MSBNA must be in compliance by January 1, 2018 and MSPBNA must be in compliance by October 1, 2018.
For more information about resolution and recovery planning requirements and our activities in these areas, including the implications of such activities in a resolution scenario, see "Business-Supervision and Regulation-Financial Holding Company-Resolution and Recovery Planning" in Part I, Item 1, "Risk Factors-Legal, Regulatory and Compliance Risk" in Part I, Item 1A and "Management's Discussion and Analysis of Financial Condition and Results of Operations-Liquidity and Capital Resources-Regulatory Developments-Resolution and Recovery Planning" in Part II, Item 7 of the 2016 Form 10-K.
Legacy Covered Funds under the Volcker Rule
The Volcker Rule prohibits "banking entities," including us and our affiliates, from engaging in certain "proprietary trading" activities, as defined in the Volcker Rule, subject to exemptions for underwriting, market-making-related activities, risk-mitigating hedging and certain other activities. The Volcker Rule also prohibits certain investments and relationships by banking entities with "covered funds," with a number of exemptions and exclusions. In June 2017, we received approval from the Federal Reserve of our application for a five-year extension of the transition period to conform investments in certain legacy Volcker covered funds that are also illiquid funds. The approval covers essentially all of our non-conforming investments in, and relationships with, legacy covered funds subject to the Volcker Rule.
For more information about Volcker Rule requirements and our activities in these areas, including the conformance periods applicable to certain covered funds and our application for a statutory extension, see "Business-Supervision and Regulation-Financial Holding Company-Activities Restrictions under the Volcker Rule" in Part I, Item 1 and "Management's Discussion and Analysis of Financial Condition and Results of Operations-Liquidity and Capital Resources-Regulatory Developments-Legacy Covered Funds under the Volcker Rule" in Part II, Item 7 of the 2016 Form 10-K.
U.S. Department of Labor Conflict of Interest Rule
The U.S. Department of Labor's final Conflict of Interest Rule went into effect on June 9, 2017, with certain aspects subject to phased-in compliance, and full compliance required by January 1, 2018. The U.S. Department of Labor is undertaking an examination of the rule which may result in changes to the rule or related exemptions or a change in the January 1, 2018 full compliance date. For a discussion of the U.S. Department of Labor Conflict of Interest Rule, see "Business-Supervision and Regulation-Institutional Securities and Wealth Management" in Part I, Item 1 of the 2016 Form 10-K.
U.K. Referendum
Following the U.K. electorate vote to leave the European Union, the U.K. invoked Article 50 of the Lisbon Treaty on March 29, 2017. For further discussion of U.K. referendum's potential impact on our operations, see "Risk Factors-International Risk" in Part I, Item 1A of the 2016 Form 10-K. For further information regarding our exposure to the U.K., see also "Quantitative and Qualitative Disclosures about Market Risk-Risk Management-Credit Risk-Country Risk Exposure."
Off-Balance Sheet Arrangements
We enter into various off-balance sheet arrangements, including through unconsolidated special purpose entities ("SPEs") and lending-related financial instruments (e.g., guarantees and commitments), primarily in connection with the Institutional Securities and Investment Management business segments.
We utilize SPEs primarily in connection with securitization activities. For information on our securitization activities, see Note 12 to the consolidated financial statements.
For information on our commitments, obligations under certain guarantee arrangements and indemnities, see Note 11 to the consolidated financial statements. For further information on our lending commitments, see "Quantitative and Qualitative Disclosures about Market Risk-Risk Management-Credit Risk-Lending Activities."
Effects of Inflation and Changes in Interest and Foreign Exchange Rates
For a discussion of the effects of inflation and changes in interest and foreign exchange rates on our business and financial results and strategies to mitigate potential exposures, see "Management's Discussion and Analysis of Financial Condition and Results of Operations-Liquidity and Capital Resources-Effects of Inflation and Changes in Interest and Foreign Exchange Rates" in Part II, Item 7 of the 2016 Form 10-K.
| June 2017 Form 10-Q | 30 |
| Quantitative and Qualitative Disclosures about Market Risk | |
Risk Management
Management believes effective risk management is vital to the success of our business activities. For a discussion of our risk management functions, see "Quantitative and Qualitative Disclosures about Market Risk-Risk Management" in Part II, Item 7A of the 2016 Form 10-K.
Market Risk
Market risk refers to the risk that a change in the level of one or more market prices, rates, indices, implied volatilities (the price volatility of the underlying instrument imputed from option prices), correlations or other market factors, such as market liquidity, will result in losses for a position or portfolio. Generally, we incur market risk as a result of trading, investing and client facilitation activities, principally within the Institutional Securities business segment where the substantial majority of our Value-at-Risk ("VaR") for market risk exposures is generated. In addition, we incur market risk within the Wealth Management and Investment Management business segments. The Wealth Management business segment primarily incurs non-trading market risk from lending and deposit-taking activities. The Investment Management business segment primarily incurs non-trading market risk from capital investments in real estate funds and investments in private equity vehicles. For a further discussion of market risk, see "Quantitative and Qualitative Disclosures about Market Risk-Risk Management-Market Risk" in Part II, Item 7A of the 2016 Form 10-K.
VaR
We use the statistical technique known as VaR as one of the tools used to measure, monitor and review the market risk exposures of our trading portfolios. The Market Risk Department calculates and distributes daily VaR-based risk measures to various levels of management.
VaR Methodology, Assumptions and Limitations. For information regarding our VaR methodology, assumptions and limitations, see "Quantitative and Qualitative Disclosures about Market Risk-Risk Management-Market Risk-Sales and Trading and Related Activities-VaR Methodology, Assumptions and Limitations" in Part II, Item 7A of the 2016 Form 10-K.
We utilize the same VaR model for risk management purposes as well as for regulatory capital calculations. Our VaR model has been approved by our regulators for use in regulatory calculations.
The portfolio of positions used for our VaR for risk management purposes ("Management VaR") differs from that used for regulatory capital requirements ("Regulatory VaR").
Management VaR contains certain positions that are excluded from Regulatory VaR. Examples include counterparty credit valuation adjustment ("CVA") and related hedges, as well as loans that are carried at fair value and associated hedges.
The following table presents the Management VaR for the Trading portfolio, on a period-end, quarterly average and quarterly high and low basis. To further enhance the transparency of the traded market risk, the Credit Portfolio VaR has been disclosed as a separate category from the Primary Risk Categories. The Credit Portfolio includes counterparty CVA and related hedges, as well as loans that are carried at fair value and associated hedges.
Trading Risks
95%/One-Day Management VaR
| 95%/One-Day VaR for the | ||||||||||||||||
| Three Months Ended | ||||||||||||||||
| June 30, 2017 | ||||||||||||||||
$ in millions | Period End | Average | High | Low | ||||||||||||
Interest rate and credit spread | $ | 35 | $ | 35 | $ | 44 | $ | 27 | ||||||||
Equity price | 15 | 18 | 26 | 15 | ||||||||||||
Foreign exchange rate | 10 | 11 | 15 | 8 | ||||||||||||
Commodity price | 9 | 9 | 10 | 8 | ||||||||||||
Less: Diversification benefit 1, 2 | (27 | ) | (27 | ) | N/A | N/A | ||||||||||
Primary Risk Categories | $ | 42 | $ | 46 | $ | 60 | $ | 36 | ||||||||
Credit Portfolio | 11 | 12 | 14 | 11 | ||||||||||||
Less: Diversification benefit 1, 2 | (7 | ) | (7 | ) | N/A | N/A | ||||||||||
Total Management VaR | $ | 46 | $ | 51 | $ | 64 | $ | 41 | ||||||||
95%/One-Day VaR for the | ||||||||||||||||
| Three Months Ended | ||||||||||||||||
| March 31, 2017 | ||||||||||||||||
$ in millions | Period End | Average | High | Low | ||||||||||||
Interest rate and credit spread | $ | 40 | $ | 30 | $ | 40 | $ | 23 | ||||||||
Equity price | 19 | 15 | 26 | 12 | ||||||||||||
Foreign exchange rate | 11 | 11 | 18 | 7 | ||||||||||||
Commodity price | 8 | 8 | 11 | 7 | ||||||||||||
Less: Diversification benefit 1, 2 | (26 | ) | (25 | ) | N/A | N/A | ||||||||||
Primary Risk Categories | $ | 52 | $ | 39 | $ | 52 | $ | 28 | ||||||||
Credit Portfolio | 14 | 15 | 17 | 14 | ||||||||||||
Less: Diversification benefit 1, 2 | (9 | ) | (10 | ) | N/A | N/A | ||||||||||
Total Management VaR | $ | 57 | $ | 44 | $ | 57 | $ | 33 | ||||||||
N/A-Not Applicable
| 1. | Diversification benefit equals the difference between the total Management VaR and the sum of the component VaRs. This benefit arises because the simulated one-day losses for each of the components occur on different days; similar diversification benefits also are taken into account within each component. |
| 2. | The high and low VaR values for the total Management VaR and each of the component VaRs might have occurred on different days during the quarter, and therefore, the diversification benefit is not an applicable measure. |
| 31 | June 2017 Form 10-Q |
| Risk Disclosures | |
The average total Management VaR for the three months ended June 30, 2017 ("current quarter") was $51 million compared with $44 million for the three months ended March 31, 2017 ("last quarter"). The average Management VaR for the Primary Risk Categories for the current quarter was $46 million compared with $39 million for the last quarter. These increases were primarily driven by increases in trading inventory across the equities, global macro, and credit businesses within Institutional Securities, in response to client demand.
Distribution of VaR Statistics and Net Revenues for the Current Quarter. One method of evaluating the reasonableness of our VaR model as a measure of our potential volatility of net revenues is to compare VaR with actual trading revenues. Assuming no intraday trading, for a 95%/one-day VaR, the expected number of times that trading losses should exceed VaR during the year is 13, and, in general, if trading losses were to exceed VaR more than 21 times in a year, the adequacy of the VaR model would be questioned. We evaluate the reasonableness of our VaR model by comparing the potential declines in portfolio values generated by the model with actual trading results for the Firm, as well as individual business units. For days where losses exceed the VaR statistic, we examine the drivers of trading losses to evaluate the VaR model's accuracy relative to realized trading results.
The distribution of VaR Statistics and Net Revenues is presented in the following histograms for the Total Trading populations.
Total Trading. As shown in the 95%/One-Day Management VaR table on the preceding page, the average 95%/one-day total Management VaR for the current quarter was $51 million. The following histogram presents the distribution of the daily 95%/one-day total Management VaR for the current quarter, which was in a range between $40 million and $60 million for approximately 95% of trading days during the current quarter.
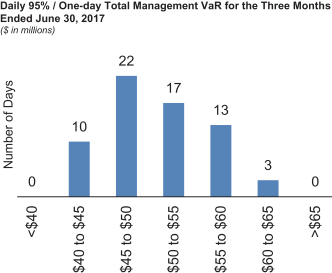
The following histogram shows the distribution for the current quarter of daily net trading revenues, including profits and losses from Interest rate and credit spread, Equity price, Foreign exchange rate, Commodity price, and Credit Portfolio positions and intraday trading activities, for our Trading businesses. Daily net trading revenues also include intraday trading activities but exclude certain items not captured in the VaR model, such as fees, commissions and net interest income. Daily net trading revenues differ from the definition of revenues required for Regulatory VaR backtesting, which further excludes intraday trading. During the current quarter, we experienced net trading losses on one day, which was not in excess of the 95%/one-day Total Management VaR.
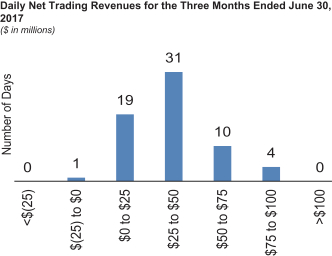
Non-Trading Risks
We believe that sensitivity analysis is an appropriate representation of our non-trading risks. Reflected below is this analysis covering substantially all of the non-trading risk in our portfolio.
Counterparty Exposure Related to Our Own Credit Spread. The credit spread risk sensitivity of the counterparty exposure related to our own credit spread corresponded to an increase in value of approximately $6 million for each 1 basis point widening in our credit spread level at both June 30, 2017 and March 31, 2017.
Funding Liabilities. The credit spread risk sensitivity of our mark-to-market funding liabilities corresponded to an increase in value of approximately $26 million and $19 million for each 1 basis point widening in our credit spread level at June 30, 2017 and March 31, 2017, respectively.
Interest Rate Risk Sensitivity. The following table presents an analysis of selected instantaneous upward and downward parallel interest rate shocks on net interest income over the next 12 months for our U.S. Bank Subsidiaries. These shocks
| June 2017 Form 10-Q | 32 |
| Risk Disclosures | |
are applied to our 12-month forecast for our U.S. Bank Subsidiaries, which incorporates market expectations of interest rates and our forecasted business activity, including our deposit deployment strategy and asset-liability management hedges.
U.S. Bank Subsidiaries' Net Interest Income Sensitivity Analysis
| $ in millions | At June 30, 2017 | At March 31, 2017 | ||||||
Basis point change | ||||||||
+200 | $ | 716 | $ | 537 | ||||
+100 | 413 | 332 | ||||||
-100 | (577 | ) | (569) | |||||
We do not manage to any single rate scenario but rather manage net interest income in our U.S. Bank Subsidiaries to optimize across a range of possible outcomes. The sensitivity analysis assumes that we take no action in response to these scenarios, assumes there are no changes in other macroeconomic variables normally correlated with changes in interest rates, and includes subjective assumptions regarding customer and market re-pricing behavior and other factors. The increase in positive sensitivity to interest rates arising in the +200 and +100 basis points scenarios between March 31, 2017 and June 30, 2017 is related to overall changes in our asset-liability positioning, primarily lower holdings of fixed-rate AFS Investment securities.
Investments. We have exposure to public and private companies through direct investments, as well as through funds that invest in these assets. These investments are predominantly equity positions with long investment horizons, a portion of which are for business facilitation purposes. The market risk related to these investments is measured by estimating the potential reduction in net income associated with a 10% decline in investment values and related impact on performance fees.
Investments Sensitivity, Including Related Performance Fees
| 10% Sensitivity | ||||||||
| $ in millions | At June 30, 2017 | At March 31, 2017 | ||||||
Investments related to Investment Management activities | $ | 326 | $ | 337 | ||||
Other investments: | ||||||||
Mitsubishi UFJ Morgan Stanley Securities Co., Ltd. | 171 | 171 | ||||||
Other Firm investments | 151 | 151 | ||||||
Equity Market Sensitivity. In the Wealth Management and Investment Management business segments, certain fee-based revenue streams are driven by the value of clients' equity holdings. The overall level of revenues for these streams also depends on multiple additional factors that include, but are not limited to, the level and duration of the equity market increase or decline, price volatility, the geographic and
industry mix of client assets, the rate and magnitude of client investments and redemptions, and the impact of such market increase or decline and price volatility on client behavior. Therefore, overall revenues do not correlate completely with changes in the equity markets.
Credit Risk
Credit risk refers to the risk of loss arising when a borrower, counterparty or issuer does not meet its financial obligations to us. We primarily incur credit risk exposure to institutions and individuals through our Institutional Securities and Wealth Management business segments. For a further discussion of our credit risks, see "Quantitative and Qualitative Disclosures about Market Risk–Risk Management–Credit Risk" in Part II, Item 7A of the 2016 Form 10-K. Also, see Notes 7 and 11 to the consolidated financial statements for additional information about our loans and lending commitments, respectively.
Lending Activities
We provide loans and lending commitments to a variety of customers, from large corporate and institutional clients to high net worth individuals. In addition, we purchase loans in the secondary market. In the consolidated balance sheets, these loans and lending commitments are carried at either fair value with changes in fair value recorded in earnings; held for investment, which are recorded at amortized cost; or held for sale, which are recorded at the lower of cost or fair value. Loans held for investment and loans held for sale are classified in Loans, and loans held at fair value are classified in Trading assets in the consolidated balance sheets. See Notes 3, 7 and 11 to the consolidated financial statements for further information.
Loan and Lending Commitment Portfolio by Business Segment
| At June 30, 2017 | ||||||||||||||||
$ in millions | Institutional Securities | Wealth Management | Investment Management 1 | Total | ||||||||||||
Corporate loans | $ | 13,730 | $ | 13,096 | $ | 5 | $ | 26,831 | ||||||||
Consumer loans | - | 26,354 | - | 26,354 | ||||||||||||
Residential real estate loans | - | 25,646 | - | 25,646 | ||||||||||||
Wholesale real estate loans | 8,482 | - | - | 8,482 | ||||||||||||
Loans held for investment, gross of allowance | 22,212 | 65,096 | 5 | 87,313 | ||||||||||||
Allowance for loan losses | (266 | ) | (40 | ) | - | (306) | ||||||||||
Loans held for investment, net of allowance | 21,946 | 65,056 | 5 | 87,007 | ||||||||||||
Corporate loans | 9,394 | - | - | 9,394 | ||||||||||||
Residential real estate loans | 10 | 50 | - | 60 | ||||||||||||
Wholesale real estate loans | 1,178 | - | - | 1,178 | ||||||||||||
Loans held for sale | 10,582 | 50 | - | 10,632 | ||||||||||||
Corporate loans | 6,755 | - | 20 | 6,775 | ||||||||||||
Residential real estate loans | 662 | - | - | 662 | ||||||||||||
Wholesale real estate loans | 1,788 | - | - | 1,788 | ||||||||||||
Loans held at fair value | 9,205 | - | 20 | 9,225 | ||||||||||||
Total loans 2 | 41,733 | 65,106 | 25 | 106,864 | ||||||||||||
Lending commitments 3,4 | 88,739 | 9,110 | - | 97,849 | ||||||||||||
Total loans and lending commitments 2,3,4 | $ | 130,472 | $ | 74,216 | $ | 25 | $ | 204,713 | ||||||||
| 33 | June 2017 Form 10-Q |
| Risk Disclosures | |
| At December 31, 2016 | ||||||||||||||||
$ in millions | Institutional Securities | Wealth Management | Investment Management 1 | Total | ||||||||||||
Corporate loans | $ | 13,858 | $ | 11,162 | $ | 5 | $ | 25,025 | ||||||||
Consumer loans | - | 24,866 | - | 24,866 | ||||||||||||
Residential real estate loans | - | 24,385 | - | 24,385 | ||||||||||||
Wholesale real estate loans | 7,702 | - | - | 7,702 | ||||||||||||
Loans held for investment, gross of allowance | 21,560 | 60,413 | 5 | 81,978 | ||||||||||||
Allowance for loan losses | (238 | ) | (36 | ) | - | (274) | ||||||||||
Loans held for investment, net of allowance | 21,322 | 60,377 | 5 | 81,704 | ||||||||||||
Corporate loans | 10,710 | - | - | 10,710 | ||||||||||||
Residential real estate loans | 11 | 50 | - | 61 | ||||||||||||
Wholesale real estate loans | 1,773 | - | - | 1,773 | ||||||||||||
Loans held for sale | 12,494 | 50 | - | 12,544 | ||||||||||||
Corporate loans | 7,199 | - | 18 | 7,217 | ||||||||||||
Residential real estate loans | 966 | - | - | 966 | ||||||||||||
Wholesale real estate loans | 519 | - | - | 519 | ||||||||||||
Loans held at fair value | 8,684 | - | 18 | 8,702 | ||||||||||||
Total loans 2 | 42,500 | 60,427 | 23 | 102,950 | ||||||||||||
Lending commitments 3,4 | 90,143 | 8,299 | - | 98,442 | ||||||||||||
Total loans and lending commitments 2,3,4 | $ | 132,643 | $ | 68,726 | $ | 23 | $ | 201,392 | ||||||||
| 1. | Loans in Investment Management are entered into in conjunction with certain investment advisory activities. |
| 2. | Amounts exclude $27.7 billion and $24.4 billion related to margin loans and $4.2 billion and $4.7 billion related to employee loans at June 30, 2017 and December 31, 2016, respectively. See Notes 6 and 7 to the consolidated financial statements for further information. |
| 3. | Lending commitments represent the notional amount of legally binding obligations to provide funding to clients for all lending transactions. Since commitments associated with these business activities may expire unused or may not be utilized to full capacity, they do not necessarily reflect the actual future cash funding requirements. |
| 4. | For syndications led by us, the lending commitments accepted by the borrower but not yet closed are net of the amounts agreed to by counterparties that will participate in the syndication. For syndications that we participate in and do not lead, lending commitments accepted by the borrower but not yet closed include only the amount that we expect will be allocated from the lead syndicate bank. Due to the nature of our obligations under the commitments, these amounts include certain commitments participated to third parties. |
Our credit exposure from our loans and lending commitments is measured in accordance with our internal risk management standards. Risk factors considered in determining the aggregate allowance for loan and commitment losses include the borrower's financial strength, seniority of the loan, collateral type, volatility of collateral value, debt cushion, loan-to-value ratio, debt service ratio, covenants and counterparty type. Qualitative and environmental factors such as economic and business conditions, nature and volume of the portfolio and lending terms, and volume and severity of past due loans may also be considered.
At June 30, 2017 and December 31, 2016, the allowance for loan losses related to loans that were accounted for as held for
investment was $306 million and $274 million, respectively, and the allowance for commitment losses related to lending commitments that were accounted for as held for investment was $186 million and $190 million, respectively. The aggregate allowance for loan and commitment losses increased during the current year period primarily due to updates to model parameters used in determining the inherent allowance. See Note 7 to the consolidated financial statements for further information.
Institutional Securities Lending Activities . In connection with certain Institutional Securities business segment activities, we provide loans and lending commitments to a diverse group of corporate and other institutional clients. These activities include originating and purchasing corporate loans, commercial and residential mortgage lending, asset-backed lending, financing extended to equities and commodities customers, and loans to municipalities. These loans and lending commitments may have varying terms; may be senior or subordinated; may be secured or unsecured; are generally contingent upon representations, warranties and contractual conditions applicable to the borrower; and may be syndicated, traded or hedged by us.
We also participate in securitization activities whereby we extend short-term or long-term funding to clients through loans and lending commitments that are secured by the assets of the borrower and generally provide for over-collateralization, including commercial real estate loans, loans secured by loan pools, commercial company loans, and secured lines of revolving credit. Credit risk with respect to these loans and lending commitments arises from the failure of a borrower to perform according to the terms of the loan agreement or a decline in the underlying collateral value. See Note 12 to the consolidated financial statements for information about our securitization activities. In addition, a collateral management group monitors collateral levels against requirements and oversees the administration of the collateral function. See Note 6 to the consolidated financial statements for additional information about our collateralized transactions.
Institutional Securities loans and lending commitments are mainly related to relationship-based and event-driven lending to select corporate clients. Relationship-based loans and lending commitments are used for general corporate purposes, working capital and liquidity purposes by our investment banking clients and typically consist of revolving lines of credit, letter of credit facilities and term loans. In connection with the relationship-based lending activities, we had hedges (which included single-name, sector and index hedges) with a notional amount of $15.2 billion and $20.2 billion at June 30, 2017 and December 31, 2016,
| June 2017 Form 10-Q | 34 |
| Risk Disclosures | |
respectively. Event-driven loans and lending commitments are associated with a particular event or transaction, such as to support client merger, acquisition, recapitalization and project finance activities. Event-driven loans and lending commitments typically consist of revolving lines of credit, term loans and bridge loans.
Institutional Securities Loans and Lending Commitments by Credit Rating 1
| At June 30, 2017 | ||||||||||||||||||||
| Years to Maturity | ||||||||||||||||||||
| $ in millions | Less than 1 | 1-3 | 3-5 | Over 5 | Total | |||||||||||||||
Loans | ||||||||||||||||||||
AAA | $ | - | $ | - | $ | - | $ | - | $ | - | ||||||||||
AA | - | - | 34 | 187 | 221 | |||||||||||||||
A | 800 | 2,018 | 860 | 781 | 4,459 | |||||||||||||||
BBB | 2,213 | 4,505 | 2,737 | 590 | 10,045 | |||||||||||||||
NIG | 5,314 | 13,016 | 4,275 | 2,246 | 24,851 | |||||||||||||||
Unrated 2 | 320 | 129 | 430 | 1,278 | 2,157 | |||||||||||||||
Total Loans 3 | 8,647 | 19,668 | 8,336 | 5,082 | 41,733 | |||||||||||||||
Lending Commitments | ||||||||||||||||||||
AAA | - | 165 | - | - | 165 | |||||||||||||||
AA | 3,885 | 614 | 3,620 | 4 | 8,123 | |||||||||||||||
A | 2,976 | 4,704 | 11,749 | 759 | 20,188 | |||||||||||||||
BBB | 2,680 | 10,216 | 17,070 | 208 | 30,174 | |||||||||||||||
NIG | 3,677 | 11,065 | 12,378 | 2,855 | 29,975 | |||||||||||||||
Unrated 2 | 41 | 46 | 4 | 23 | 114 | |||||||||||||||
Total Lending Commitments | 13,259 | 26,810 | 44,821 | 3,849 | 88,739 | |||||||||||||||
Total Exposure | $ | 21,906 | $ | 46,478 | $ | 53,157 | $ | 8,931 | $ | 130,472 | ||||||||||
| At December 31, 2016 | ||||||||||||||||||||
| Years to Maturity | ||||||||||||||||||||
| $ in millions | Less than 1 | 1-3 | 3-5 | Over 5 | Total | |||||||||||||||
Loans | ||||||||||||||||||||
AAA | $ | - | $ | - | $ | - | $ | - | $ | - | ||||||||||
AA | - | - | 38 | - | 38 | |||||||||||||||
A | 235 | 775 | 1,391 | 552 | 2,953 | |||||||||||||||
BBB | 1,709 | 6,473 | 2,768 | 1,362 | 12,312 | |||||||||||||||
NIG | 4,667 | 12,114 | 5,629 | 2,304 | 24,714 | |||||||||||||||
Unrated 2 | 699 | 126 | 175 | 1,483 | 2,483 | |||||||||||||||
Total Loans 3 | 7,310 | 19,488 | 10,001 | 5,701 | 42,500 | |||||||||||||||
Lending Commitments | ||||||||||||||||||||
AAA | 50 | 105 | 50 | - | 205 | |||||||||||||||
AA | 3,724 | 451 | 3,989 | - | 8,164 | |||||||||||||||
A | 1,994 | 4,610 | 11,135 | 392 | 18,131 | |||||||||||||||
BBB | 6,261 | 9,006 | 18,148 | 653 | 34,068 | |||||||||||||||
NIG | 2,839 | 8,934 | 14,267 | 3,418 | 29,458 | |||||||||||||||
Unrated 2 | 107 | 6 | - | 4 | 117 | |||||||||||||||
Total Lending Commitments | 14,975 | 23,112 | 47,589 | 4,467 | 90,143 | |||||||||||||||
Total Exposure | $ | 22,285 | $ | 42,600 | $ | 57,590 | $ | 10,168 | $ | 132,643 | ||||||||||
| 1. | Obligor credit ratings are determined by the Credit Risk Management Department. |
| 2. | Unrated loans and lending commitments are primarily trading positions that are measured at fair value and risk managed as a component of Market Risk. For a further discussion of our Market Risk, see "Quantitative and Qualitative Disclosures about Market Risk-Risk Management-Market Risk" herein. |
| 3. | At June 30, 2017 and December 31, 2016, approximately 99% of loans held for investment were current, while approximately 1% were on nonaccrual status because the loans were past due for a period of 90 days or more or payment of principal or interest was in doubt. |
Event-Driven Loans and Lending Commitments
| $ in millions | At June 30, 2017 | At December 31, 2016 | ||||||
Loans | $ | 4,777 | $ | 5,097 | ||||
Lending commitments | 9,685 | 16,252 | ||||||
Total | $ | 14,462 | $ | 21,349 | ||||
Loans and lending commitments to non-investment grade borrowers | $ | 11,550 | $ | 15,339 | ||||
Maturity Profile of Event-Driven Loans and Lending Commitments
|
| |||||||
| At June 30, 2017 | At December 31, 2016 | |||||||
Less than 1 year | 22% | 34% | ||||||
1-3 years | 34% | 14% | ||||||
3-5 years | 21% | 28% | ||||||
Over 5 years | 23% | 24% | ||||||
Institutional Securities Credit Exposure from Loans and Lending Commitments by Industry
| $ in millions | At June 30, 2017 | At December 31, 2016 | ||||||
Industry 1 | ||||||||
Real estate | $ | 23,794 | $ | 19,807 | ||||
Consumer discretionary | 13,171 | 12,059 | ||||||
Funds, exchanges and other financial services 2 | 12,382 | 11,481 | ||||||
Energy | 11,572 | 11,757 | ||||||
Industrials | 11,049 | 11,465 | ||||||
Utilities | 9,515 | 9,216 | ||||||
Healthcare | 9,185 | 11,534 | ||||||
Information technology | 8,138 | 8,602 | ||||||
Consumer staples | 7,707 | 7,329 | ||||||
Mortgage finance | 5,553 | 6,296 | ||||||
Materials | 5,283 | 7,630 | ||||||
Telecommunications services | 4,437 | 6,156 | ||||||
Insurance | 3,510 | 4,190 | ||||||
Consumer finance | 2,572 | 2,847 | ||||||
Other | 2,604 | 2,274 | ||||||
Total | $ | 130,472 | $ | 132,643 | ||||
| 1. | Industry categories are based on the Global Industry Classification Standard ® . |
| 2. | Includes mutual funds, pension funds, private equity and real estate funds, exchanges and clearinghouses, and diversified financial services. |
| 35 | June 2017 Form 10-Q |
| Risk Disclosures | |
Institutional Securities Lending Exposures Related to the Energy Industry. At June 30, 2017, Institutional Securities' loans and lending commitments related to the energy industry were $11.6 billion, of which approximately 67% are accounted for as held for investment and 33% are accounted for as either held for sale or at fair value. Additionally, approximately 56% of the total energy industry loans and lending commitments were to investment grade counterparties.
At June 30, 2017, the energy industry portfolio included $1.1 billion in loans and $2.1 billion in lending commitments to Oil and Gas Exploration and Production ("E&P") companies. The E&P loans were to non-investment grade counterparties, which are generally subject to periodic borrowing base reassessments based on the value of the underlying oil and gas reserves pledged as collateral. In limited situations, we may extend the period related to borrowing base reassessments typically in conjunction with taking certain risk mitigating actions with the borrower. Approximately 52% of the E&P lending commitments were to investment grade counterparties. To the extent oil and natural gas prices remain at quarter-end levels, or deteriorate further, we may incur additional lending losses.
Institutional Securities Margin Lending. In addition to the activities noted above, Institutional Securities provides margin lending, which allows the client to borrow against the value of qualifying securities. At June 30, 2017 and December 31, 2016, the amounts related to margin lending were $15.4 billion and $11.9 billion, respectively, which were classified within Customer and other receivables in the consolidated balance sheets.
Wealth Management Lending Activities. The principal Wealth Management lending activities include securities-based lending and residential real estate loans.
Securities-based lending provided to our retail clients is primarily conducted through our Portfolio Loan Account ("PLA") and Liquidity Access Line ("LAL") platforms, which had an outstanding loan balance of $31.6 billion and $29.7 billion at June 30, 2017 and December 31, 2016, respectively. For more information about our securities-based lending and residential real estate loans, see "Quantitative and Qualitative Disclosures about Market Risk–Risk Management–Credit Risk–Lending Activities" in Part II, Item 7A of the 2016 Form 10-K.
For the current quarter, loans and lending commitments associated with the Wealth Management business segment lending activities increased by approximately 6%, mainly due to growth in securities-based lending and other loans.
Wealth Management Lending Activities by Remaining Contractual Maturity
| At June 30, 2017 | ||||||||||||||||||||
| Years to Maturity | ||||||||||||||||||||
| $ in millions | Less than 1 | 1-3 | 3-5 | Over 5 | Total | |||||||||||||||
Securities-based lending and other loans | $ | 34,048 | $ | 3,208 | $ | 1,196 | $ | 979 | $ | 39,431 | ||||||||||
Residential real estate loans | - | 9 | 35 | 25,631 | 25,675 | |||||||||||||||
Total 1 | $ | 34,048 | $ | 3,217 | $ | 1,231 | $ | 26,610 | $ | 65,106 | ||||||||||
Lending commitments | 6,484 | 1,903 | 458 | 265 | 9,110 | |||||||||||||||
Total loans and lending commitments | $ | 40,532 | $ | 5,120 | $ | 1,689 | $ | 26,875 | $ | 74,216 | ||||||||||
| At December 31, 2016 | ||||||||||||||||||||
| Years to Maturity | ||||||||||||||||||||
| $ in millions | Less than 1 | 1-3 | 3-5 | Over 5 | Total | |||||||||||||||
Securities-based lending and other loans | $ | 30,547 | $ | 2,983 | $ | 1,304 | $ | 1,179 | $ | 36,013 | ||||||||||
Residential real estate loans | - | - | 45 | 24,369 | 24,414 | |||||||||||||||
Total 1 | $ | 30,547 | $ | 2,983 | $ | 1,349 | $ | 25,548 | $ | 60,427 | ||||||||||
Lending commitments | 6,372 | 1,413 | 268 | 246 | 8,299 | |||||||||||||||
Total loans and lending commitments | $ | 36,919 | $ | 4,396 | $ | 1,617 | $ | 25,794 | $ | 68,726 | ||||||||||
| 1. | At June 30, 2017 and December 31, 2016, greater than 99% of the Wealth Management business segment loans held for investment were current, while less than 1% were on nonaccrual status because the loans were past due for a period of 90 days or more or payment of principal or interest was in doubt. |
Wealth Management Loans included in Customer and Other Receivables
| $ in millions | At June 30, 2017 | At December 31, 2016 | ||||||
Net customer receivables representing margin loans | $ | 12,328 | $ | 12,483 | ||||
Employee loans 1 : | ||||||||
Balance | $ | 4,323 | $ | 4,804 | ||||
Allowance for loan losses | (83 | ) | (89 | ) | ||||
Balance, net | $ | 4,240 | $ | 4,715 | ||||
| 1. | Granted in conjunction with programs established by us to retain and recruit certain employees. These loans are full recourse and generally require periodic payments. At June 30, 2017, these loans have repayment terms ranging from 1 to 20 years. We establish an allowance for loan amounts to terminated employees that we do not consider recoverable, which is recorded in Compensation and benefits expense. |
Credit Exposure-Derivatives
We incur credit risk as a dealer in OTC derivatives. Credit risk with respect to derivative instruments arises from the possibility that a counterparty may fail to perform according to the terms of the contract. In connection with our OTC derivative activities, we generally enter into master netting agreements and collateral arrangements with counterparties. These agreements provide us with the ability to demand
| June 2017 Form 10-Q | 36 |
| Risk Disclosures | |
collateral, as well as to liquidate collateral and offset receivables and payables covered under the same master netting agreement in the event of counterparty default.
We manage our trading positions by employing a variety of risk mitigation strategies. These strategies include diversification of risk exposures and hedging. Hedging activities consist of the purchase or sale of positions in related securities and financial instruments, including a variety of derivative products (e.g., futures, forwards, swaps and options). For credit exposure information on our OTC derivative products, see Note 4 to the consolidated financial statements. For a discussion of our credit exposure and related credit derivative contracts, see "Quantitative and Qualitative Disclosures about Market Risk-Risk Management-Credit Risk-Credit Exposure-Derivatives" in Part II, Item 7A of the 2016 Form 10-K.
Credit Derivative Portfolio by Counterparty Type
| At June 30, 2017 | ||||||||||||||||||||
| Fair Values 1 | Notionals | |||||||||||||||||||
| $ in millions | Receivable | Payable | Net | Protection Purchased | Protection Sold | |||||||||||||||
Banks and securities firms | $ | 5,870 | $ | 6,293 | $ | (423 | ) | $ | 222,828 | $ | 195,023 | |||||||||
Insurance and other financial institutions | 3,563 | 4,022 | (459 | ) | 156,758 | 154,604 | ||||||||||||||
Non-financial entities | 39 | 90 | (51 | ) | 3,586 | 1,189 | ||||||||||||||
Total | $ | 9,472 | $ | 10,405 | $ | (933 | ) | $ | 383,172 | $ | 350,816 | |||||||||
| At December 31, 2016 | ||||||||||||||||||||
| Fair Values 1 | Notionals | |||||||||||||||||||
| $ in millions | Receivable | Payable | Net | Protection Purchased | Protection Sold | |||||||||||||||
Banks and securities firms | $ | 8,516 | $ | 9,397 | $ | (881 | ) | $ | 319,830 | $ | 273,462 | |||||||||
Insurance and other financial institutions | 3,619 | 3,901 | (282 | ) | 144,527 | 151,999 | ||||||||||||||
Non-financial entities | 94 | 127 | (33 | ) | 5,832 | 4,269 | ||||||||||||||
Total | $ | 12,229 | $ | 13,425 | $ | (1,196 | ) | $ | 470,189 | $ | 429,730 | |||||||||
| 1. | Our Credit Default Swaps ("CDS") are classified in either Level 2 or Level 3 of the fair value hierarchy. Approximately 4% of receivable fair values, and 6% and 7%, respectively, of payable fair values represented Level 3 amounts at June 30, 2017 and December 31, 2016 (see Note 3 to the consolidated financial statements). |
The fair values shown in the previous table are before the application of contractual netting or collateral. For additional credit exposure information on our credit derivative portfolio, see Note 4 to the consolidated financial statements.
OTC Derivative Products at Fair Value, Net of Collateral, by Industry
| $ in millions | At June 30, 2017 | At December 31, 2016 1 | ||||||
Industry 2 | ||||||||
Utilities | $ | 4,052 | $ | 4,184 | ||||
Funds, exchanges and other financial services 3 | 3,145 | 2,756 | ||||||
Industrials | 1,269 | 1,644 | ||||||
Regional governments | 1,144 | 1,352 | ||||||
Sovereign governments | 1,104 | 709 | ||||||
Banks and securities firms | 949 | 1,485 | ||||||
Healthcare | 930 | 1,103 | ||||||
Not-for-profit organizations | 730 | 830 | ||||||
Hedge funds | 542 | 233 | ||||||
Consumer discretionary | 392 | 590 | ||||||
Information technology | 366 | 267 | ||||||
Materials | 348 | 235 | ||||||
Insurance | 279 | 570 | ||||||
Energy | 267 | 533 | ||||||
Consumer staples | 243 | 567 | ||||||
Special purpose vehicles | 229 | 821 | ||||||
Other | 166 | 256 | ||||||
Total 4 | $ | 16,155 | $ | 18,135 | ||||
| 1. | The amounts included in the December 31, 2016 industry categories have been revised due to previous misclassifications. The total remains unchanged. |
| 2. | Industry categories are based on the Global Industry Classification Standard ® . |
| 3. | Amounts include mutual funds, pension funds, private equity and real estate funds, exchanges and clearinghouses, consumer finance, mortgage finance and other diversified financial services. |
| 4. | For further information on derivative instruments and hedging activities, see Note 4 to the consolidated financial statements. |
| 37 | June 2017 Form 10-Q |
| Risk Disclosures | |
Country Risk Exposure
Country risk exposure is the risk that events in, or that affect, a foreign country (any country other than the U.S.) might adversely affect us. We actively manage country risk exposure through a comprehensive risk management framework that combines credit and market fundamentals and allows us to effectively identify, monitor and limit country risk. Country risk exposure before and after hedging is monitored and managed. For a further discussion of our country risk exposure see, "Quantitative and Qualitative Disclosures about Market Risk-Risk Management-Country Risk Exposure" in Part II, Item 7A of the 2016 Form 10-K.
Our sovereign exposures consist of financial instruments entered into with sovereign and local governments. Our non-sovereign exposures consist of exposures to primarily corporations and financial institutions. The following table shows our 10 largest non-U.S. country risk net exposures at June 30, 2017. Index credit derivatives are included in the country risk exposure table. Each reference entity within an index is allocated to that reference entity's country of risk. Index exposures are allocated to the underlying reference entities in proportion to the notional weighting of each reference entity in the index, adjusted for any fair value receivable/payable for that reference entity. Where credit risk crosses multiple jurisdictions, for example, a CDS purchased from an issuer in a specific country that references bonds issued by an entity in a different country, the fair value of the CDS is reflected in the Net Counterparty Exposure column based on the country of the CDS issuer. Further, the notional amount of the CDS adjusted for the fair value of the receivable/payable is reflected in the Net Inventory column based on the country of the underlying reference entity.
| June 2017 Form 10-Q | 38 |
| Risk Disclosures | |
Top Ten Country Exposures at June 30, 2017 1
| $ in millions | Net Inventory 2 | Net Counterparty Exposure 3,4 | Loans | Lending Commitments | Exposure Before Hedges | Hedges 5 | Net Exposure | |||||||||||||||||||||
Country | ||||||||||||||||||||||||||||
United Kingdom: | ||||||||||||||||||||||||||||
Sovereigns | $ | 1,444 | $ | 92 | $ | - | $ - | $ | 1,536 | $ | (254) | $ | 1,282 | |||||||||||||||
Non-sovereigns | 595 | 9,995 | 2,050 | 5,630 | 18,270 | (1,824 | ) | 16,446 | ||||||||||||||||||||
Total | $ | 2,039 | $ | 10,087 | $ | 2,050 | $ | 5,630 | $ | 19,806 | $ | (2,078 | ) | $ | 17,728 | |||||||||||||
Japan: | ||||||||||||||||||||||||||||
Sovereigns | $ | 2,205 | $ | 76 | $ | - | $ | - | $ | 2,281 | $ | (82 | ) | $ | 2,199 | |||||||||||||
Non-sovereigns | 512 | 3,161 | 95 | - | 3,768 | (144 | ) | 3,624 | ||||||||||||||||||||
Total | $ | 2,717 | $ | 3,237 | $ | 95 | $ | - | $ | 6,049 | $ | (226 | ) | $ | 5,823 | |||||||||||||
Brazil: | ||||||||||||||||||||||||||||
Sovereigns | $ | 4,088 | $ | - | $ | - | $ | - | $ | 4,088 | $ | (12 | ) | $ | 4,076 | |||||||||||||
Non-sovereigns | 52 | 568 | 955 | 68 | 1,643 | (511 | ) | 1,132 | ||||||||||||||||||||
Total | $ | 4,140 | $ | 568 | $ | 955 | $ | 68 | $ | 5,731 | $ | (523 | ) | $ | 5,208 | |||||||||||||
Germany: | ||||||||||||||||||||||||||||
Sovereigns | $ | 1,237 | $ | 772 | $ | - | $ | - | $ | 2,009 | $ | (908 | ) | $ | 1,101 | |||||||||||||
Non-sovereigns | 144 | 1,359 | 526 | 3,256 | 5,285 | (1,370 | ) | 3,915 | ||||||||||||||||||||
Total | $ | 1,381 | $ | 2,131 | $ | 526 | $ | 3,256 | $ | 7,294 | $ | (2,278 | ) | $ | 5,016 | |||||||||||||
Canada: | ||||||||||||||||||||||||||||
Sovereigns | $ | 182 | $ | 100 | $ | - | $ | - | $ | 282 | $ | - | $ | 282 | ||||||||||||||
Non-sovereigns | 276 | 1,619 | 155 | 1,465 | 3,515 | (356 | ) | 3,159 | ||||||||||||||||||||
Total | $ | 458 | $ | 1,719 | $ | 155 | $ | 1,465 | $ | 3,797 | $ | (356 | ) | $ | 3,441 | |||||||||||||
United Arab Emirates: | ||||||||||||||||||||||||||||
Sovereigns | $ | (25 | ) | $ | 831 | $ | - | $ | - | $ | 806 | $ | (24 | ) | $ | 782 | ||||||||||||
Non-sovereigns | 5 | 191 | 28 | 1,983 | 2,207 | (15 | ) | 2,192 | ||||||||||||||||||||
Total | $ | (20 | ) | $ | 1,022 | $ | 28 | $ | 1,983 | $ | 3,013 | $ | (39 | ) | $ | 2,974 | ||||||||||||
China: | ||||||||||||||||||||||||||||
Sovereigns | $ | (45 | ) | $ | 213 | $ | - | $ | - | $ | 168 | $ | (249 | ) | $ | (81 | ) | |||||||||||
Non-sovereigns | 1,032 | 157 | 759 | 515 | 2,463 | (10 | ) | 2,453 | ||||||||||||||||||||
Total | $ | 987 | $ | 370 | $ | 759 | $ | 515 | $ | 2,631 | $ | (259 | ) | $ | 2,372 | |||||||||||||
India: | ||||||||||||||||||||||||||||
Sovereigns | $ | 1,157 | $ | - | $ | - | $ | - | $ | 1,157 | $ | - | $ | 1,157 | ||||||||||||||
Non-sovereigns | 562 | 507 | - | - | 1,069 | - | 1,069 | |||||||||||||||||||||
Total | $ | 1,719 | $ | 507 | $ | - | $ | - | $ | 2,226 | $ | - | $ | 2,226 | ||||||||||||||
Ireland: | ||||||||||||||||||||||||||||
Sovereigns | $ | 13 | $ | 5 | $ | - | $ | - | $ | 18 | $ | (82 | ) | $ | (64 | ) | ||||||||||||
Non-sovereigns | 122 | 399 | 1,671 | 74 | 2,266 | - | 2,266 | |||||||||||||||||||||
Total | $ | 135 | $ | 404 | $ | 1,671 | $ | 74 | $ | 2,284 | $ | (82 | ) | $ | 2,202 | |||||||||||||
Singapore: | ||||||||||||||||||||||||||||
Sovereigns | $ | 1,482 | $ | 149 | $ | - | $ | - | $ | 1,631 | $ | - | $ | 1,631 | ||||||||||||||
Non-sovereigns | 50 | 228 | 29 | 117 | 424 | - | 424 | |||||||||||||||||||||
Total | $ | 1,532 | $ | 377 | $ | 29 | $ | 117 | $ | 2,055 | $ | - | $ | 2,055 | ||||||||||||||
| 1. | At June 30, 2017, we had exposure to these countries for overnight deposits with banks of approximately $14.6 billion. |
| 2. | Net inventory represents exposure to both long and short single-name and index positions ( i.e. , bonds and equities at fair value and CDS based on a notional amount assuming zero recovery adjusted for any fair value receivable or payable). As a market maker, we may transact in these CDS positions to facilitate client trading. At June 30, 2017, gross purchased protection, gross written protection, and net exposures related to single-name and index credit derivatives for those countries shown in the previous table were $(55.7) billion, $53.5 billion and $(2.2) billion, respectively. |
| 3. | Net counterparty exposure ( i.e ., repurchase transactions, securities lending and OTC derivatives) takes into consideration legally enforceable master netting agreements and collateral. |
| 4. | At June 30, 2017, the benefit of collateral received against counterparty credit exposure was $7.9 billion in the U.K. with 96% of collateral consisting of cash and government obligations of the U.K., the U.S. and France, and $9.3 billion in Germany, with 95% of collateral consisting of cash and government obligations of France, Belgium and Germany. The benefit of collateral received against counterparty credit exposure in the other countries totaled approximately $7.2 billion, with collateral primarily consisting of cash and government obligations of Japan. These amounts do not include collateral received on secured financing transactions. |
| 5. | Amounts represent CDS hedges (purchased and sold) on net counterparty exposure and lending executed by trading desks responsible for hedging counterparty and lending credit risk exposures for us. Amounts are based on the CDS notional amount assuming zero recovery adjusted for any fair value receivable or payable. For a further description of the contractual terms for purchased credit protection and whether they may limit the effectiveness of our hedges, see "Credit Exposure-Derivatives" herein. |
| 39 | June 2017 Form 10-Q |
| Risk Disclosures | |
Country Risk Exposures Related to the United Kingdom. At June 30, 2017, our country risk exposures in the U.K. included net exposures of $17,728 million as shown in the previous table, and overnight deposits of $6,657 million. The $16,446 million of exposures to non-sovereigns were diversified across both names and sectors. Of this exposure $14,162 million was to investment grade counterparties, with the largest single component ($5,334 million) to exchanges and clearing houses.
Country Risk Exposures Related to Brazil . At June 30, 2017, our country risk exposures in Brazil included net exposures of $5,208 million as shown in the previous table. Our sovereign net exposures in Brazil were principally in the form of local currency government bonds held onshore to support client activity. The $1,132 million of exposures to non-sovereigns were diversified across both names and sectors.
Operational Risk
Operational risk refers to the risk of loss, or of damage to our reputation, resulting from inadequate or failed processes or systems, human factors or from external events ( e.g. , fraud, theft, legal and compliance risks, cyber attacks or damage to physical assets). We may incur operational risk across the full scope of our business activities, including revenue-generating activities ( e.g ., sales and trading) and support and control groups ( e.g. , information technology and trade processing). For a further discussion about our operational risk, see "Quantitative and Qualitative Disclosures about Market Risk-Risk Management-Operational Risk" in Part II, Item 7A of the 2016 Form 10-K.
Model Risk
Model risk refers to the potential for adverse consequences from decisions based on incorrect or misused model outputs. Model risk can lead to financial loss, poor business and strategic decision making, or damage to the Firm's reputation. The risk inherent in a model is a function of the materiality,
complexity and uncertainty around inputs and assumptions. Model risk is generated from the use of models impacting financial statements, regulatory filings, capital adequacy assessments and the formulation of business strategies. For a further discussion about our model risk, see "Quantitative and Qualitative Disclosures about Market Risk–Risk Management–Model Risk" in Part II, Item 7A of the 2016 Form 10-K.
Liquidity Risk
Liquidity risk refers to the risk that we will be unable to finance our operations due to a loss of access to the capital markets or difficulty in liquidating our assets. Liquidity risk also encompasses our ability (or perceived ability) to meet our financial obligations without experiencing significant business disruption or reputational damage that may threaten our viability as a going concern. For a further discussion about our liquidity risk, see "Quantitative and Qualitative Disclosures about Market Risk-Risk Management-Liquidity Risk" in Part II, Item 7A of the 2016 Form 10-K and "Management's Discussion and Analysis of Financial Condition and Results of Operations-Liquidity and Capital Resources" in Part I, Item 2.
Legal and Compliance Risk
Legal and compliance risk includes the risk of legal or regulatory sanctions, material financial loss, including fines, penalties, judgments, damages and/or settlements, or loss to reputation that we may suffer as a result of failure to comply with laws, regulations, rules, related self-regulatory organization standards and codes of conduct applicable to our business activities. This risk also includes contractual and commercial risk, such as the risk that a counterparty's performance obligations will be unenforceable. It also includes compliance with anti-money laundering and terrorist financing rules and regulations. For a further discussion about our legal and compliance risk, see "Quantitative and Qualitative Disclosures about Market Risk-Risk Management-Legal and Compliance Risk" in Part II, Item 7A of the 2016 Form 10-K.
| June 2017 Form 10-Q | 40 |
| |
Controls and Procedures
Under the supervision and with the participation of the Firm's management, including our Chief Executive Officer and Chief Financial Officer, we conducted an evaluation of the effectiveness of the Firm's disclosure controls and procedures (as defined in Rule 13a-15(e) of the Securities Exchange Act of 1934, as amended (the "Exchange Act")). Based on this evaluation, our Chief Executive Officer and Chief Financial Officer concluded that our disclosure controls and procedures were effective as of the end of the period covered by this report.
No change in the Firm's internal control over financial reporting (as defined in Rule 13a-15(f) of the Exchange Act) occurred during the period covered by this report that materially affected, or is reasonably likely to materially affect, the Firm's internal control over financial reporting.
| 41 | June 2017 Form 10-Q |
Report of Independent Registered Public Accounting Firm
To the Board of Directors and Shareholders of Morgan Stanley:
We have reviewed the accompanying condensed consolidated balance sheet of Morgan Stanley and subsidiaries (the "Firm") as of June 30, 2017, and the related condensed consolidated income statements and comprehensive income statements for the three-month and six-month periods ended June 30, 2017 and 2016, and the cash flow statements and statements of changes in total equity for the six-month periods ended June 30, 2017 and 2016. These interim condensed consolidated financial statements are the responsibility of the management of the Firm.
We conducted our reviews in accordance with the standards of the Public Company Accounting Oversight Board (United States). A review of interim financial information consists principally of applying analytical procedures and making inquiries of persons responsible for financial and accounting matters. It is substantially less in scope than an audit conducted in accordance with the standards of the Public Company Accounting Oversight Board (United States), the objective of which is the expression of an opinion regarding
the financial statements taken as a whole. Accordingly, we do not express such an opinion.
Based on our reviews, we are not aware of any material modifications that should be made to such condensed interim consolidated financial statements for them to be in conformity with accounting principles generally accepted in the United States of America.
We have previously audited, in accordance with the standards of the Public Company Accounting Oversight Board (United States), the consolidated balance sheet of the Firm as of December 31, 2016, and the consolidated income statement, comprehensive income statement, cash flow statement and statement of changes in total equity for the year then ended (not presented herein) included in the Firm's Annual Report on Form 10-K; and in our report dated February 27, 2017, we expressed an unqualified opinion on those consolidated financial statements. In our opinion, the information set forth in the accompanying condensed consolidated balance sheet as of December 31, 2016 is fairly stated, in all material respects, in relation to the consolidated balance sheet from which it has been derived.
/s/ Deloitte & Touche LLP
New York, New York
August 3, 2017
| June 2017 Form 10-Q | 42 |
Financial Statements
Consolidated Financial Statements and Notes | |
Consolidated Income Statements
(Unaudited)
| Three Months Ended June 30, | Six Months Ended June 30, | |||||||||||||||
| in millions, except per share data | 2017 | 2016 | 2017 | 2016 | ||||||||||||
Revenues | ||||||||||||||||
Investment banking | $ | 1,530 | $ | 1,224 | $ | 3,075 | $ | 2,331 | ||||||||
Trading | 2,931 | 2,746 | 6,166 | 4,811 | ||||||||||||
Investments | 163 | 126 | 328 | 92 | ||||||||||||
Commissions and fees | 1,027 | 1,020 | 2,060 | 2,075 | ||||||||||||
Asset management, distribution and administration fees | 2,902 | 2,637 | 5,669 | 5,257 | ||||||||||||
Other | 199 | 243 | 428 | 323 | ||||||||||||
Total non-interest revenues | 8,752 | 7,996 | 17,726 | 14,889 | ||||||||||||
Interest income | 2,106 | 1,667 | 4,071 | 3,414 | ||||||||||||
Interest expense | 1,355 | 754 | 2,549 | 1,602 | ||||||||||||
Net interest | 751 | 913 | 1,522 | 1,812 | ||||||||||||
Net revenues | 9,503 | 8,909 | 19,248 | 16,701 | ||||||||||||
Non-interest expenses | ||||||||||||||||
Compensation and benefits | 4,252 | 4,015 | 8,718 | 7,698 | ||||||||||||
Occupancy and equipment | 333 | 329 | 660 | 658 | ||||||||||||
Brokerage, clearing and exchange fees | 525 | 484 | 1,034 | 949 | ||||||||||||
Information processing and communications | 433 | 429 | 861 | 871 | ||||||||||||
Marketing and business development | 155 | 154 | 291 | 288 | ||||||||||||
Professional services | 561 | 547 | 1,088 | 1,061 | ||||||||||||
Other | 602 | 468 | 1,146 | 955 | ||||||||||||
Total non-interest expenses | 6,861 | 6,426 | 13,798 | 12,480 | ||||||||||||
Income from continuing operations before income taxes | 2,642 | 2,483 | 5,450 | 4,221 | ||||||||||||
Provision for income taxes | 846 | 833 | 1,661 | 1,411 | ||||||||||||
Income from continuing operations | 1,796 | 1,650 | 3,789 | 2,810 | ||||||||||||
Income (loss) from discontinued operations, net of income taxes | (5 | ) | (4 | ) | (27 | ) | (7 | ) | ||||||||
Net income | $ | 1,791 | $ | 1,646 | $ | 3,762 | $ | 2,803 | ||||||||
Net income applicable to noncontrolling interests | 34 | 64 | 75 | 87 | ||||||||||||
Net income applicable to Morgan Stanley | $ | 1,757 | $ | 1,582 | $ | 3,687 | $ | 2,716 | ||||||||
Preferred stock dividends and other | 170 | 157 | 260 | 235 | ||||||||||||
Earnings applicable to Morgan Stanley common shareholders | $ | 1,587 | $ | 1,425 | $ | 3,427 | $ | 2,481 | ||||||||
Earnings per basic common share | ||||||||||||||||
Income from continuing operations | $ | 0.89 | $ | 0.77 | $ | 1.92 | $ | 1.33 | ||||||||
Income (loss) from discontinued operations | - | (0.01 | ) | (0.01 | ) | (0.01 | ) | |||||||||
Earnings per basic common share | $ | 0.89 | $ | 0.76 | $ | 1.91 | $ | 1.32 | ||||||||
Earnings per diluted common share | ||||||||||||||||
Income from continuing operations | $ | 0.87 | $ | 0.75 | $ | 1.88 | $ | 1.30 | ||||||||
Income (loss) from discontinued operations | - | - | (0.01 | ) | - | |||||||||||
Earnings per diluted common share | $ | 0.87 | $ | 0.75 | $ | 1.87 | $ | 1.30 | ||||||||
Dividends declared per common share | $ | 0.20 | $ | 0.15 | $ | 0.40 | $ | 0.30 | ||||||||
Average common shares outstanding | ||||||||||||||||
Basic | 1,791 | 1,866 | 1,796 | 1,875 | ||||||||||||
Diluted | 1,830 | 1,899 | 1,836 | 1,907 | ||||||||||||
| See Notes to Consolidated Financial Statements | 43 | June 2017 Form 10-Q |
| Consolidated Comprehensive Income Statements (Unaudited) | |
Three Months Ended June 30, | Six Months Ended June 30, | |||||||||||||||
| $ in millions | 2017 | 2016 | 2017 | 2016 | ||||||||||||
Net income | $ | 1,791 | $ | 1,646 | $ | 3,762 | $ | 2,803 | ||||||||
Other comprehensive income (loss), net of tax: | ||||||||||||||||
Foreign currency translation adjustments | $ | 12 | $ | 131 | 162 | 317 | ||||||||||
Change in net unrealized gains on available-for-sale securities | 108 | 143 | 192 | 538 | ||||||||||||
Pension, postretirement and other | 4 | (5 | ) | 4 | (4 | ) | ||||||||||
Change in net debt valuation adjustment | (183 | ) | 145 | (174 | ) | 348 | ||||||||||
Total other comprehensive income (loss) | $ | (59 | ) | $ | 414 | $ | 184 | $ | 1,199 | |||||||
Comprehensive income | $ | 1,732 | $ | 2,060 | $ | 3,946 | $ | 4,002 | ||||||||
Net income applicable to noncontrolling interests | 34 | 64 | 75 | 87 | ||||||||||||
Other comprehensive income (loss) applicable to noncontrolling interests | (21 | ) | 81 | 29 | 136 | |||||||||||
Comprehensive income applicable to Morgan Stanley | $ | 1,719 | $ | 1,915 | $ | 3,842 | $ | 3,779 | ||||||||
| June 2017 Form 10-Q | 44 | See Notes to Consolidated Financial Statements |
| Consolidated Balance Sheets | |
| (Unaudited) | ||||||||
| $ in millions, except share data | At June 30, | At December 31, 2016 | ||||||
Assets | ||||||||
Cash and due from banks | $ | 25,008 | $ | 22,017 | ||||
Interest bearing deposits with banks | 19,651 | 21,364 | ||||||
Trading assets at fair value ( $163,689 and $152,548 were pledged to various parties) | 290,802 | 262,154 | ||||||
Investment securities (includes $50,488 and $63,170 at fair value) | 71,576 | 80,092 | ||||||
Securities purchased under agreements to resell (includes $102 and $302 at fair value) | 97,408 | 101,955 | ||||||
Securities borrowed | 126,722 | 125,236 | ||||||
Customer and other receivables | 54,917 | 46,460 | ||||||
Loans:
| ||||||||
Held for investment (net of allowance of $306 and $274) | 87,007 | 81,704 | ||||||
Held for sale | 10,632 | 12,544 | ||||||
Goodwill | 6,591 | 6,577 | ||||||
Intangible assets (net of accumulated amortization of $2,575 and $2,421) | 2,567 | 2,721 | ||||||
Other assets | 48,135 | 52,125 | ||||||
Total assets | $ | 841,016 | $ | 814,949 | ||||
Liabilities | ||||||||
Deposits (includes $130 and $63 at fair value) | $ | 144,913 | $ | 155,863 | ||||
Short-term borrowings (includes $582 and $406 at fair value) | 916 | 941 | ||||||
Trading liabilities at fair value | 134,810 | 128,194 | ||||||
Securities sold under agreements to repurchase (includes $738 and $729 at fair value) | 50,697 | 54,628 | ||||||
Securities loaned | 16,862 | 15,844 | ||||||
Other secured financings (includes $5,731 and $5,041 at fair value) | 16,642 | 11,118 | ||||||
Customer and other payables | 197,055 | 190,513 | ||||||
Other liabilities and accrued expenses | 15,042 | 15,896 | ||||||
Long-term borrowings (includes $43,226 and $38,736 at fair value) | 184,112 | 164,775 | ||||||
Total liabilities | 761,049 | 737,772 | ||||||
Commitments and contingent liabilities (see Note 11) | ||||||||
Equity | ||||||||
Morgan Stanley shareholders' equity: | ||||||||
Preferred stock | 8,520 | 7,520 | ||||||
Common stock, $0.01 par value: | ||||||||
Shares authorized: 3,500,000,000 ; Shares issued: 2,038,893,979 ; Shares outstanding: 1,839,578,174 and 1,852,481,601 | 20 | 20 | ||||||
Additional paid-in capital | 23,140 | 23,271 | ||||||
Retained earnings | 56,325 | 53,679 | ||||||
Employee stock trusts | 2,945 | 2,851 | ||||||
Accumulated other comprehensive income (loss) | (2,488 | ) | (2,643 | ) | ||||
Common stock held in treasury at cost, $0.01 par value ( 199,315,805 and 186,412,378 shares) | (6,691 | ) | (5,797 | ) | ||||
Common stock issued to employee stock trusts | (2,945 | ) | (2,851 | ) | ||||
Total Morgan Stanley shareholders' equity | 78,826 | 76,050 | ||||||
Noncontrolling interests | 1,141 | 1,127 | ||||||
Total equity | 79,967 | 77,177 | ||||||
Total liabilities and equity | $ | 841,016 | $ | 814,949 | ||||
| See Notes to Consolidated Financial Statements | 45 | June 2017 Form 10-Q |
| Consolidated Statements of Changes in Total Equity (Unaudited) | |
$ in millions | Preferred Stock | Common Stock | Additional Paid-in Capital | Retained Earnings | Employee Stock Trusts | Accumulated Other Comprehensive Income (Loss) | Common Stock Held in Treasury at Cost | Common Stock Issued to Employee Stock Trusts | Non- controlling Interests | Total Equity | ||||||||||||||||||||||||||||||
Balance at December 31, 2016 | $ | 7,520 | $ | 20 | $ | 23,271 | $ | 53,679 | $ | 2,851 | $ | (2,643 | ) | $ | (5,797 | ) | $ | (2,851 | ) | $ | 1,127 | $ | 77,177 | |||||||||||||||||
Cumulative adjustment for accounting changes 1 | - | - | 45 | (35 | ) | - | - | - | - | - | 10 | |||||||||||||||||||||||||||||
Net income applicable to Morgan Stanley | - | - | - | 3,687 | - | - | - | - | - | 3,687 | ||||||||||||||||||||||||||||||
Net income applicable to noncontrolling interests | - | - | - | - | - | - | - | - | 75 | 75 | ||||||||||||||||||||||||||||||
Dividends | - | - | - | (1,006 | ) | - | - | - | - | - | (1,006 | ) | ||||||||||||||||||||||||||||
Shares issued under employee plans | - | - | (170 | ) | - | 94 | - | 815 | (94 | ) | - | 645 | ||||||||||||||||||||||||||||
Repurchases of common stock and employee tax withholdings | - | - | - | - | - | - | (1,709 | ) | - | - | (1,709 | ) | ||||||||||||||||||||||||||||
Net change in Accumulated other comprehensive income (loss) | - | - | - | - | - | 155 | - | - | 29 | 184 | ||||||||||||||||||||||||||||||
Issuance of preferred stock | 1,000 | - | (6 | ) | - | - | - | - | - | - | 994 | |||||||||||||||||||||||||||||
Other net decreases | - | - | - | - | - | - | - | - | (90 | ) | (90 | ) | ||||||||||||||||||||||||||||
Balance at June 30, 2017 | $ | 8,520 | $ | 20 | $ | 23,140 | $ | 56,325 | $ | 2,945 | $ | (2,488 | ) | $ | (6,691 | ) | $ | (2,945 | ) | $ | 1,141 | $ | 79,967 | |||||||||||||||||
Balance at December 31, 2015 | $ | 7,520 | $ | 20 | $ | 24,153 | $ | 49,204 | $ | 2,409 | $ | (1,656 | ) | $ | (4,059 | ) | $ | (2,409 | ) | $ | 1,002 | $ | 76,184 | |||||||||||||||||
Cumulative adjustment for accounting change related to DVA 2 | - | - | - | 312 | - | (312 | ) | - | - | - | - | |||||||||||||||||||||||||||||
Net adjustment for accounting change related to consolidation 3 | - | - | - | - | - | - | - | - | 106 | 106 | ||||||||||||||||||||||||||||||
Net income applicable to Morgan Stanley | - | - | - | 2,716 | - | - | - | - | - | 2,716 | ||||||||||||||||||||||||||||||
Net income applicable to noncontrolling interests | - | - | - | - | - | - | - | - | 87 | 87 | ||||||||||||||||||||||||||||||
Dividends | - | - | - | (822 | ) | - | - | - | - | - | (822 | ) | ||||||||||||||||||||||||||||
Shares issued under employee plans and related tax effects | - | - | (1,456 | ) | - | 464 | - | 2,062 | (464 | ) | - | 606 | ||||||||||||||||||||||||||||
Repurchases of common stock and employee tax withholdings | - | - | - | - | - | - | (1,629 | ) | - | - | (1,629 | ) | ||||||||||||||||||||||||||||
Net change in Accumulated other comprehensive income (loss) | - | - | - | - | - | 1,063 | - | - | 136 | 1,199 | ||||||||||||||||||||||||||||||
Other net decreases | - | - | - | - | - | - | - | - | (72 | ) | (72 | ) | ||||||||||||||||||||||||||||
Balance at June 30, 2016 | $ | 7,520 | $ | 20 | $ | 22,697 | $ | 51,410 | $ | 2,873 | $ | (905) | $ | (3,626) | $ | (2,873) | $ | 1,259 | $ | 78,375 | ||||||||||||||||||||
| 1. | The cumulative adjustment relates to the adoption of the following accounting updates on January 1, 2017: Improvements to Employee Share-Based Payment Accounting, for which the Firm recorded a cumulative catch-up adjustment to reflect its election to account for forfeitures as they occur (see Note 2 for further information); and Intra-Entity Transfers of Assets Other Than Inventory , for which the Firm recorded a cumulative catch-up adjustment to reflect the tax impact from an intercompany sale of assets. |
| 2. | Debt valuation adjustment ("DVA") represents the change in the fair value resulting from fluctuations in the Firm's credit spreads and other credit factors related to liabilities carried at fair value under the fair value option, primarily related to certain Long-term and Short-term borrowings. In accordance with the early adoption of a provision of the accounting update Recognition and Measurement of Financial Assets and Financial Liabilities , a cumulative catch-up adjustment was recorded as of January 1, 2016 to move the cumulative unrealized DVA amount, net of noncontrolling interests and tax, related to outstanding liabilities under the fair value option election from Retained earnings into Accumulated other comprehensive income (loss) ("AOCI"). See Note 2 to the consolidated financial statements in the Firm's Annual Report on Form 10-K for the year ended December 31, 2016 (the "2016 Form 10-K") and Note 14 for further information. |
| 3. | In accordance with the accounting update Amendments to the Consolidation Analysis , a net adjustment was recorded as of January 1, 2016 to both consolidate and deconsolidate certain entities under the new guidance. See Note 2 to the consolidated financial statements in the 2016 Form 10-K for further information. |
| June 2017 Form 10-Q | 46 | See Notes to Consolidated Financial Statements |
Consolidated Cash Flow Statements (Unaudited) | |
Six Months Ended June 30, | ||||||||
| $ in millions | 2017 | 2016 | ||||||
Cash flows from operating activities | ||||||||
Net income | $ | 3,762 | $ | 2,803 | ||||
Adjustments to reconcile net income to net cash provided by (used for) operating activities: | ||||||||
(Income) loss from equity method investments | - | (1 | ) | |||||
Compensation payable in common stock and options | 518 | 492 | ||||||
Depreciation and amortization | 889 | 879 | ||||||
Net gain on sale of available-for-sale securities | (16 | ) | (82 | ) | ||||
Impairment charges | 6 | 67 | ||||||
Provision for credit losses on lending activities | 25 | 131 | ||||||
Other operating adjustments | (148 | ) | 218 | |||||
Changes in assets and liabilities: | ||||||||
Trading assets, net of Trading liabilities | (18,050 | ) | (333 | ) | ||||
Securities borrowed | (1,486 | ) | 11,135 | |||||
Securities loaned | 1,018 | (2,117 | ) | |||||
Customer and other receivables and other assets | (2,336 | ) | (10,537 | ) | ||||
Customer and other payables and other liabilities | 5,732 | 9,949 | ||||||
Securities purchased under agreements to resell | 4,547 | (9,932 | ) | |||||
Securities sold under agreements to repurchase | (3,931 | ) | 13,636 | |||||
Net cash provided by (used for) operating activities | (9,470 | ) | 16,308 | |||||
Cash flows from investing activities | ||||||||
Proceeds from (payments for): | ||||||||
Other assets-Premises, equipment and software, net | (723 | ) | (645 | ) | ||||
Changes in loans, net | (5,326 | ) | (4,724 | ) | ||||
Investment securities: | ||||||||
Purchases | (8,418 | ) | (30,700 | ) | ||||
Proceeds from sales | 13,533 | 20,274 | ||||||
Proceeds from paydowns and maturities | 3,668 | 3,507 | ||||||
Other investing activities | (39 | ) | (126 | ) | ||||
Net cash provided by (used for) investing activities | 2,695 | (12,414 | ) | |||||
Cash flows from financing activities | ||||||||
Net proceeds from (payments for): | ||||||||
Short-term borrowings | (25 | ) | (1,293 | ) | ||||
Noncontrolling interests | (35 | ) | (43 | ) | ||||
Other secured financings | 4,272 | (69 | ) | |||||
Deposits | (10,950 | ) | (3,341 | ) | ||||
Proceeds from: | ||||||||
Derivatives financing activities | 73 | - | ||||||
Issuance of preferred stock, net of issuance costs | 994 | - | ||||||
Issuance of long-term borrowings | 33,522 | 20,628 | ||||||
Payments for: | ||||||||
Long-term borrowings | (17,796 | ) | (15,900 | ) | ||||
Derivatives financing activities | (48 | ) | (120 | ) | ||||
Repurchases of common stock and employee tax withholdings | (1,709 | ) | (1,629 | ) | ||||
Cash dividends | (954 | ) | (791 | ) | ||||
Other financing activities | 21 | - | ||||||
Net cash provided by (used for) financing activities | 7,365 | (2,558 | ) | |||||
Effect of exchange rate changes on cash and cash equivalents | 688 | 714 | ||||||
Net increase in cash and cash equivalents | 1,278 | 2,050 | ||||||
Cash and cash equivalents, at beginning of period | 43,381 | 54,083 | ||||||
Cash and cash equivalents, at end of period | $ | 44,659 | $ | 56,133 | ||||
Cash and cash equivalents include: | ||||||||
Cash and due from banks | $ | 25,008 | $ | 27,597 | ||||
Interest bearing deposits with banks | 19,651 | 28,536 | ||||||
Cash and cash equivalents, at end of period | $ | 44,659 | $ | 56,133 | ||||
Supplemental Disclosure of Cash Flow Information
Cash payments for interest were $ 1,922 million and $1,082 million.
Cash payments for income taxes, net of refunds, were $ 732 million and $340 million
| See Notes to Consolidated Financial Statements | 47 | June 2017 Form 10-Q |
Notes to Consolidated Financial Statements (Unaudited) | |
1. Introduction and Basis of Presentation
The Firm
Morgan Stanley, a financial holding company, is a global financial services firm that maintains significant market positions in each of its business segments-Institutional Securities, Wealth Management and Investment Management. Morgan Stanley, through its subsidiaries and affiliates, provides a wide variety of products and services to a large and diversified group of clients and customers, including corporations, governments, financial institutions and individuals. Unless the context otherwise requires, the terms "Morgan Stanley" or the "Firm" mean Morgan Stanley (the "Parent Company") together with its consolidated subsidiaries.
A description of the clients and principal products and services of each of the Firm's business segments is as follows:
Institutional Securities provides investment banking, sales and trading, lending and other services to corporations, governments, financial institutions, and high to ultra-high net worth clients. Investment banking services consist of capital raising and financial advisory services, including services relating to the underwriting of debt, equity and other securities, as well as advice on mergers and acquisitions, restructurings, real estate and project finance. Sales and trading services include sales, financing and market-making activities in equity and fixed income products, including prime brokerage services, global macro, credit and commodities products. Lending services include originating and/or purchasing corporate loans, commercial and residential mortgage lending, asset-backed lending, financing extended to equities and commodities customers, and loans to municipalities. Other services include investment and research activities.
Wealth Management provides a comprehensive array of financial services and solutions to individual investors and small to medium-sized businesses/institutions covering brokerage and investment advisory services, financial and wealth planning services, annuity and insurance products, credit and other lending products, banking and retirement plan services.
Investment Management provides a broad range of investment strategies and products that span geographies, asset classes, and public and private markets to a diverse group of clients across institutional and intermediary channels. Strategies and products include equity, fixed income, liquidity and alternative/other products. Institutional clients include defined benefit/defined contribution plans, founda-
tions, endowments, government entities, sovereign wealth funds, insurance companies, third-party fund sponsors and corporations. Individual clients are serviced through intermediaries, including affiliated and non-affiliated distributors.
Basis of Financial Information
The unaudited consolidated financial statements ("consolidated financial statements") are prepared in accordance with accounting principles generally accepted in the United States of America ("U.S. GAAP"), which require the Firm to make estimates and assumptions regarding the valuations of certain financial instruments, the valuation of goodwill and intangible assets, compensation, deferred tax assets, the outcome of legal and tax matters, allowance for credit losses and other matters that affect its consolidated financial statements and related disclosures. The Firm believes that the estimates utilized in the preparation of its consolidated financial statements are prudent and reasonable. Actual results could differ materially from these estimates. Intercompany balances and transactions have been eliminated. Certain reclassifications have been made to prior periods to conform to the current presentation.
The accompanying consolidated financial statements should be read in conjunction with the Firm's consolidated financial statements and notes thereto included in the 2016 Form 10-K. Certain footnote disclosures included in the 2016 Form 10-K have been condensed or omitted from these consolidated financial statements as they are not required for interim reporting under U.S. GAAP. The consolidated financial statements reflect all adjustments of a normal, recurring nature that are, in the opinion of management, necessary for the fair presentation of the results for the interim period. The results of operations for interim periods are not necessarily indicative of results for the entire year.
Consolidation
The consolidated financial statements include the accounts of the Firm, its wholly owned subsidiaries and other entities in which the Firm has a controlling financial interest, including certain variable interest entities ("VIE") (see Note 12). For consolidated subsidiaries that are less than wholly owned, the third-party holdings of equity interests are referred to as noncontrolling interests. The net income attributable to noncontrolling interests for such subsidiaries is presented as Net income applicable to noncontrolling interests in the consolidated income statements. The portion of shareholders' equity that is attributable to noncontrolling interests for such subsidiaries is presented as noncontrolling interests, a component of total equity, in the consolidated balance sheets.
| June 2017 Form 10-Q | 48 |
Notes to Consolidated Financial Statements (Unaudited) | |
For a discussion of the Firm's involvement with VIEs and its significant regulated U.S. and international subsidiaries, see Notes 1 and 2 to the consolidated financial statements in the 2016 Form 10-K.
2. Significant Accounting Policies
For a detailed discussion about the Firm's significant accounting policies, see Note 2 to the consolidated financial statements in the 2016 Form 10-K.
During the six months ended June 30, 2017 ("current year period"), other than the following, there were no significant updates made to the Firm's significant accounting policies.
Accounting Standards Adopted
The Firm adopted the following accounting update on January 1, 2017.
| • | Improvements to Employee Share-Based Payment Accounting . This accounting update simplifies the accounting for employee share-based payments, including the recognition of forfeitures, the classification of income tax consequences, and the classification within the consolidated cash flow statements. |
Beginning in 2017, the income tax consequences related to share-based payments are required to be recognized in Provision for income taxes in the consolidated income
statements upon the conversion of employee share-based awards instead of additional paid-in capital. The impact of the income tax consequences upon conversion of the awards may be either a benefit or a provision. Conversion of employee share-based awards to Firm shares will primarily occur in the first quarter of each year. The impact of recognizing excess tax benefits upon conversion of awards in the quarter in which the accounting update was adopted (three months ended March 31, 2017) was a $112 million benefit to Provision for income taxes. The classification of cash flows from excess tax benefits was moved from the financing section to the operating section of the consolidated cash flow statements, and was applied on a retrospective basis.
In addition, this accounting update permits an entity to elect whether to continue to estimate the total forfeitures, or to account for forfeitures on an actual basis as they occur. The Firm has elected to account for forfeitures on an actual basis as they occur. This change is required to be applied using a modified retrospective approach, and upon adoption, the Firm recorded a cumulative catch-up adjustment, decreasing Retained earnings by approximately $30 million net of tax, increasing Additional paid-in capital by approximately $45 million and increasing deferred tax assets by approximately $15 million.
| 49 | June 2017 Form 10-Q |
Notes to Consolidated Financial Statements (Unaudited) | |
3. Fair Values
Fair Value Measurement
Assets and Liabilities Measured at Fair Value on a Recurring
Basis
| At June 30, 2017 | ||||||||||||||||||||
| $ in millions | Level 1 | Level 2 | Level 3 | Netting 4 | Total | |||||||||||||||
Assets at Fair Value | ||||||||||||||||||||
Trading assets: | ||||||||||||||||||||
U.S. government and agency securities: | ||||||||||||||||||||
U.S. Treasury securities | $ | 27,473 | $ | - | $ | - | $ | - | $ | 27,473 | ||||||||||
U.S. agency securities | 2,148 | 25,832 | - | - | 27,980 | |||||||||||||||
Total U.S. government and agency securities | 29,621 | 25,832 | - | - | 55,453 | |||||||||||||||
Other sovereign government obligations 1 | 19,553 | 5,382 | 100 | - | 25,035 | |||||||||||||||
Corporate and other debt: | ||||||||||||||||||||
State and municipal securities | - | 2,572 | 9 | - | 2,581 | |||||||||||||||
Residential mortgage-, commercial mortgage- and asset-backed securities | - | 2,564 | 264 | - | 2,828 | |||||||||||||||
Corporate bonds | - | 15,338 | 449 | - | 15,787 | |||||||||||||||
Collateralized debt and loan obligations | - | 305 | 58 | - | 363 | |||||||||||||||
Loans and lending commitments 2 | - | 4,361 | 4,864 | - | 9,225 | |||||||||||||||
Other debt | - | 2,269 | 186 | - | 2,455 | |||||||||||||||
Total corporate and other debt | - | 27,409 | 5,830 | - | 33,239 | |||||||||||||||
Corporate equities 3 | 127,252 | 394 | 500 | - | 128,146 | |||||||||||||||
Securities received as collateral | 14,402 | 6 | - | - | 14,408 | |||||||||||||||
Derivative and other contracts: | ||||||||||||||||||||
Interest rate | 623 | 254,677 | 1,850 | - | 257,150 | |||||||||||||||
Credit | - | 9,049 | 423 | - | 9,472 | |||||||||||||||
Foreign exchange | 100 | 54,895 | 62 | - | 55,057 | |||||||||||||||
Equity | 803 | 41,506 | 3,073 | - | 45,382 | |||||||||||||||
Commodity and other | 1,647 | 6,705 | 4,071 | - | 12,423 | |||||||||||||||
Netting 4 | (2,976 | ) | (297,356 | ) | (2,360 | ) | (46,652 | ) | (349,344 | ) | ||||||||||
Total derivative and other contracts | 197 | 69,476 | 7,119 | (46,652 | ) | 30,140 | ||||||||||||||
Investments 5 | 305 | 243 | 946 | - | 1,494 | |||||||||||||||
Physical commodities | - | 134 | - | - | 134 | |||||||||||||||
Total trading assets 5 | 191,330 | 128,876 | 14,495 | (46,652 | ) | 288,049 | ||||||||||||||
Investment securities-AFS | 22,018 | 28,470 | - | - | 50,488 | |||||||||||||||
Securities purchased under agreements to resell | - | 102 | - | - | 102 | |||||||||||||||
Intangible assets | - | 3 | - | - | 3 | |||||||||||||||
Total assets at fair value 6 | $ | 213,348 | $ | 157,451 | $ | 14,495 | $ | (46,652 | ) | $ | 338,642 | |||||||||
| At June 30, 2017 | ||||||||||||||||||||
| $ in millions | Level 1 | Level 2 | Level 3 | Netting 4 | Total | |||||||||||||||
Liabilities at Fair Value | ||||||||||||||||||||
Deposits | $ | - | $ | 51 | $ | 79 | $ | - | $ | 130 | ||||||||||
Short-term borrowings | - | 582 | - | - | 582 | |||||||||||||||
Trading liabilities: | ||||||||||||||||||||
U.S. government and agency securities: | ||||||||||||||||||||
U.S. Treasury securities | 16,142 | - | - | - | 16,142 | |||||||||||||||
U.S. agency securities | 439 | 84 | - | - | 523 | |||||||||||||||
Total U.S. government and agency securities | 16,581 | 84 | - | - | 16,665 | |||||||||||||||
Other sovereign government obligations 1 | 25,411 | 1,118 | - | - | 26,529 | |||||||||||||||
Corporate and other debt: | ||||||||||||||||||||
Corporate bonds | - | 6,653 | 13 | - | 6,666 | |||||||||||||||
Other debt | - | 316 | 2 | - | 318 | |||||||||||||||
Total corporate and other debt | - | 6,969 | 15 | - | 6,984 | |||||||||||||||
Corporate equities 3 | 36,338 | 81 | 27 | - | 36,446 | |||||||||||||||
Obligation to return securities received as collateral | 21,471 | 9 | 1 | - | 21,481 | |||||||||||||||
Derivative and other contracts: | ||||||||||||||||||||
Interest rate | 551 | 233,943 | 880 | - | 235,374 | |||||||||||||||
Credit | - | 9,677 | 728 | - | 10,405 | |||||||||||||||
Foreign exchange | 35 | 58,070 | 60 | - | 58,165 | |||||||||||||||
Equity | 699 | 44,996 | 1,980 | - | 47,675 | |||||||||||||||
Commodity and other | 1,847 | 6,757 | 2,562 | - | 11,166 | |||||||||||||||
Netting 4 | (2,976 | ) | (297,356 | ) | (2,360 | ) | (33,388 | ) | (336,080 | ) | ||||||||||
Total derivative and other contracts | 156 | 56,087 | 3,850 | (33,388 | ) | 26,705 | ||||||||||||||
Total trading liabilities | 99,957 | 64,348 | 3,893 | (33,388 | ) | 134,810 | ||||||||||||||
Securities sold under agreements to repurchase | - | 590 | 148 | - | 738 | |||||||||||||||
Other secured financings | - | 5,487 | 244 | - | 5,731 | |||||||||||||||
Long-term borrowings | 67 | 40,513 | 2,646 | - | 43,226 | |||||||||||||||
Total liabilities at fair value 6 | $ | 100,024 | $ | 111,571 | $ | 7,010 | $ | (33,388 | ) | $ | 185,217 | |||||||||
| June 2017 Form 10-Q | 50 |
Notes to Consolidated Financial Statements (Unaudited) | |
| At December 31, 2016 | ||||||||||||||||||||
| $ in millions | Level 1 | Level 2 | Level 3 | Netting 4 | Total | |||||||||||||||
Assets at Fair Value | ||||||||||||||||||||
Trading assets: | ||||||||||||||||||||
U.S. government and agency securities: | ||||||||||||||||||||
U.S. Treasury securities | $ | 25,457 | $ | - | $ | - | $ | - | $ | 25,457 | ||||||||||
U.S. agency securities | 2,122 | 20,392 | 74 | - | 22,588 | |||||||||||||||
Total U.S. government and agency securities | 27,579 | 20,392 | 74 | - | 48,045 | |||||||||||||||
Other sovereign government obligations | 14,005 | 5,497 | 6 | - | 19,508 | |||||||||||||||
Corporate and other debt: | ||||||||||||||||||||
State and municipal securities | - | 2,355 | 250 | - | 2,605 | |||||||||||||||
Residential mortgage-, commercial mortgage- and asset-backed securities | - | 1,691 | 217 | - | 1,908 | |||||||||||||||
Corporate bonds | - | 11,051 | 232 | - | 11,283 | |||||||||||||||
Collateralized debt and loan obligations | - | 602 | 63 | - | 665 | |||||||||||||||
Loans and lending commitments 2 | - | 3,580 | 5,122 | - | 8,702 | |||||||||||||||
Other debt | - | 1,360 | 180 | - | 1,540 | |||||||||||||||
Total corporate and other debt | - | 20,639 | 6,064 | - | 26,703 | |||||||||||||||
Corporate equities 3 | 117,857 | 333 | 445 | - | 118,635 | |||||||||||||||
Securities received as collateral | 13,717 | 19 | 1 | - | 13,737 | |||||||||||||||
Derivative and other contracts: | ||||||||||||||||||||
Interest rate | 1,131 | 300,406 | 1,373 | - | 302,910 | |||||||||||||||
Credit | - | 11,727 | 502 | - | 12,229 | |||||||||||||||
Foreign exchange | 231 | 74,921 | 13 | - | 75,165 | |||||||||||||||
Equity | 1,185 | 35,736 | 1,708 | - | 38,629 | |||||||||||||||
Commodity and other | 2,808 | 6,734 | 3,977 | - | 13,519 | |||||||||||||||
Netting 4 | (4,378 | ) | (353,543 | ) | (1,944 | ) | (51,381 | ) | (411,246 | ) | ||||||||||
Total derivative and other contracts | 977 | 75,981 | 5,629 | (51,381 | ) | 31,206 | ||||||||||||||
Investments 5 | 237 | 197 | 958 | - | 1,392 | |||||||||||||||
Physical commodities | - | 112 | - | - | 112 | |||||||||||||||
Total trading assets 5 | 174,372 | 123,170 | 13,177 | (51,381 | ) | 259,338 | ||||||||||||||
Investment securities-AFS | 29,120 | 34,050 | - | - | 63,170 | |||||||||||||||
Securities purchased under agreements to resell | - | 302 | - | - | 302 | |||||||||||||||
Intangible assets | - | 3 | - | - | 3 | |||||||||||||||
Total assets at fair value 6 | $ | 203,492 | $ | 157,525 | $ | 13,177 | $ | (51,381 | ) | $ | 322,813 | |||||||||
| At December 31, 2016 | ||||||||||||||||||||
| $ in millions | Level 1 | Level 2 | Level 3 | Netting 4 | Total | |||||||||||||||
Liabilities at Fair Value | ||||||||||||||||||||
Deposits | $ | - | $ | 21 | $ | 42 | $ | - | $ | 63 | ||||||||||
Short-term borrowings | - | 404 | 2 | - | 406 | |||||||||||||||
Trading liabilities: | ||||||||||||||||||||
U.S. government and agency securities: | ||||||||||||||||||||
U.S. Treasury securities | 10,745 | - | - | - | 10,745 | |||||||||||||||
U.S. agency securities | 891 | 61 | - | - | 952 | |||||||||||||||
Total U.S. government and agency securities | 11,636 | 61 | - | - | 11,697 | |||||||||||||||
Other sovereign government obligations | 20,658 | 2,430 | - | - | 23,088 | |||||||||||||||
Corporate and other debt: | ||||||||||||||||||||
Corporate bonds | - | 5,572 | 34 | - | 5,606 | |||||||||||||||
Other debt | - | 549 | 2 | - | 551 | |||||||||||||||
Total corporate and other debt | - | 6,121 | 36 | - | 6,157 | |||||||||||||||
Corporate equities 3 | 37,611 | 29 | 34 | - | 37,674 | |||||||||||||||
Obligation to return securities received as collateral | 20,236 | 25 | 1 | - | 20,262 | |||||||||||||||
Derivative and other contracts: | ||||||||||||||||||||
Interest rate | 1,244 | 285,379 | 953 | - | 287,576 | |||||||||||||||
Credit | - | 12,550 | 875 | - | 13,425 | |||||||||||||||
Foreign exchange | 17 | 75,510 | 56 | - | 75,583 | |||||||||||||||
Equity | 1,162 | 37,828 | 1,524 | - | 40,514 | |||||||||||||||
Commodity and other | 2,663 | 6,845 | 2,377 | - | 11,885 | |||||||||||||||
Netting 4 | (4,378 | ) | (353,543 | ) | (1,944 | ) | (39,803 | ) | (399,668 | ) | ||||||||||
Total derivative and other contracts | 708 | 64,569 | 3,841 | (39,803 | ) | 29,315 | ||||||||||||||
Physical commodities | - | 1 | - | - | 1 | |||||||||||||||
Total trading liabilities | 90,849 | 73,236 | 3,912 | (39,803 | ) | 128,194 | ||||||||||||||
Securities sold under agreements to repurchase | - | 580 | 149 | - | 729 | |||||||||||||||
Other secured financings | - | 4,607 | 434 | - | 5,041 | |||||||||||||||
Long-term borrowings | 47 | 36,677 | 2,012 | - | 38,736 | |||||||||||||||
Total liabilities at fair value 6 | $ | 90,896 | $ | 115,525 | $ | 6,551 | $ | (39,803 | ) | $ | 173,169 | |||||||||
AFS-Available for sale
| 1. | At June 30, 2017, the Firm transferred from Level 2 to Level 1 $1.3 billion and $1.8 billion of Trading assets-Other sovereign government obligations and Trading liabilities-Other sovereign government obligations, respectively, due to increased market activity in these instruments. |
| 2. | At June 30, 2017, loans held at fair value consisted of $6,775 million of corporate loans, $662 million of residential real estate loans and $1,788 million of wholesale real estate loans. At December 31, 2016, loans held at fair value consisted of $7,217 million of corporate loans, $966 million of residential real estate loans and $519 million of wholesale real estate loans. |
| 3. | For trading purposes, the Firm holds or sells short equity securities issued by entities in diverse industries and of varying sizes. |
| 4. | For positions with the same counterparty that cross over the levels of the fair value hierarchy, both counterparty netting and cash collateral netting are included in the column titled "Netting." For contracts with the same counterparty, counterparty netting among positions classified within the same level is included within that shared level. For further information on derivative instruments and hedging activities, see Note 4. |
| 5. | Amounts exclude certain investments that are measured at fair value using the net asset value ("NAV") per share, which are not classified in the fair value hierarchy. For additional disclosure about such investments, see "Fair Value of Investments Measured at NAV" herein. |
| 6. | Amounts exclude the unsettled fair value on long futures contracts of $852 million at June 30, 2017 and $784 million at December 31, 2016 included in Customer and other receivables in the consolidated balance sheets and unsettled fair value of short futures contracts of $425 million at June 30, 2017 and $174 million at December 31, 2016 in Customer and other payables in the consolidated balance sheets. These contracts are primarily: classified as Level 1 in the fair value hierarchy, actively traded, and valued based on quoted prices from the exchange. |
| 51 | June 2017 Form 10-Q |
Notes to Consolidated Financial Statements (Unaudited) | |
For a description of the valuation techniques applied to the Firm's major categories of assets and liabilities measured at fair value on a recurring basis, see Note 3 to the consolidated financial statements in the 2016 Form 10-K. During the current quarter there were no significant updates made to the Firm's valuation techniques.
Changes in Level 3 Assets and Liabilities Measured at Fair Value on a Recurring Basis
The following tables present additional information about Level 3 assets and liabilities measured at fair value on a recurring basis for the three months ended June 30, 2017 ("current quarter"), the three months ended June 30, 2016 ("prior year quarter"), the current year period and the six months ended June 30, 2016 ("prior year period"). Level 3 instruments may be hedged with instruments classified in Level 1 and Level 2. As a result, the realized and unrealized gains (losses) for assets and liabilities within the Level 3 category presented in the following tables do not reflect the related realized and unrealized gains (losses) on hedging instruments that have been classified by the Firm within the Level 1 and/or Level 2 categories.
Additionally, both observable and unobservable inputs may be used to determine the fair value of positions that the Firm has classified within the Level 3 category. As a result, the unrealized gains (losses) during the period for assets and liabilities within the Level 3 category presented in the following tables herein may include changes in fair value during the period that were attributable to both observable and unobservable inputs. Total realized and unrealized gains (losses) are primarily included in Trading revenues in the consolidated income statements.
Roll-forward of Level 3 Assets and Liabilities Measured at Fair Value on a Recurring Basis
| $ in millions | Beginning Balance at March 31, 2017 | Realized and Unrealized Gains (Losses) | Purchases 1 | Sales and Issuances 2 | Settlements 1 | Net Transfers | Ending Balance at June 30, 2017 | Unrealized Gains (Losses) at June 30, 2017 | ||||||||||||||||||||||||
Assets at Fair Value | ||||||||||||||||||||||||||||||||
Trading assets: | ||||||||||||||||||||||||||||||||
U.S. agency securities | $ | 42 | $ | - | $ | - | $ | - | $ | - | $ | (42 | ) | $ | - | $ | - | |||||||||||||||
Other sovereign government obligations | 65 | - | 87 | (52 | ) | - | - | 100 | - | |||||||||||||||||||||||
Corporate and other debt: | ||||||||||||||||||||||||||||||||
State and municipal securities | 55 | 3 | 3 | (52 | ) | - | - | 9 | - | |||||||||||||||||||||||
Residential mortgage-, commercial mortgage- and asset backed securities | 216 | 36 | 32 | (44 | ) | (5 | ) | 29 | 264 | 8 | ||||||||||||||||||||||
Corporate bonds | 445 | 2 | 144 | (161 | ) | - | 19 | 449 | (2 | ) | ||||||||||||||||||||||
Collateralized debt and loan obligations | 78 | (2 | ) | 5 | (23 | ) | (1 | ) | 1 | 58 | (2 | ) | ||||||||||||||||||||
Loans and lending commitments | 4,479 | 27 | 1,242 | (417 | ) | (581 | ) | 114 | 4,864 | 11 | ||||||||||||||||||||||
Other debt | 194 | 33 | 57 | (108 | ) | - | 10 | 186 | 30 | |||||||||||||||||||||||
Total corporate and other debt | 5,467 | 99 | 1,483 | (805 | ) | (587 | ) | 173 | 5,830 | 45 | ||||||||||||||||||||||
Corporate equities | 309 | 8 | 101 | (59 | ) | - | 141 | 500 | 9 | |||||||||||||||||||||||
Securities received as collateral | 1 | - | - | (1 | ) | - | - | - | - | |||||||||||||||||||||||
Net derivative and other contracts 3 : | ||||||||||||||||||||||||||||||||
Interest rate | 298 | 35 | 28 | (27 | ) | 637 | (1 | ) | 970 | 58 | ||||||||||||||||||||||
Credit | (351 | ) | 28 | - | - | 16 | 2 | (305 | ) | 24 | ||||||||||||||||||||||
Foreign exchange | (71 | ) | 53 | 1 | (1 | ) | 22 | (2 | ) | 2 | 64 | |||||||||||||||||||||
Equity | 217 | 185 | 677 | (171 | ) | 80 | 105 | 1,093 | 189 | |||||||||||||||||||||||
Commodity and other | 1,503 | 154 | 3 | - | (108 | ) | (43 | ) | 1,509 | 79 | ||||||||||||||||||||||
Total net derivative and other contracts | 1,596 | 455 | 709 | (199 | ) | 647 | 61 | 3,269 | 414 | |||||||||||||||||||||||
Investments | 961 | 11 | 20 | (25 | ) | 4 | (25 | ) | 946 | 7 | ||||||||||||||||||||||
Liabilities at Fair Value | ||||||||||||||||||||||||||||||||
Deposits | $ | 56 | $ | - | $ | - | $ | 23 | $ | - | $ | - | $ | 79 | $ | - | ||||||||||||||||
Trading liabilities: | ||||||||||||||||||||||||||||||||
Corporate and other debt: | ||||||||||||||||||||||||||||||||
Corporate bonds | 34 | - | (135 | ) | 124 | - | (10 | ) | 13 | (1 | ) | |||||||||||||||||||||
Other debt | 2 | - | - | - | - | - | 2 | - | ||||||||||||||||||||||||
Total corporate and other debt | 36 | - | (135 | ) | 124 | - | (10 | ) | 15 | (1 | ) | |||||||||||||||||||||
Corporate equities | - | (12 | ) | (34 | ) | 44 | - | 5 | 27 | (11 | ) | |||||||||||||||||||||
Obligation to return securities received as collateral | 2 | - | (2 | ) | 1 | - | - | 1 | - | |||||||||||||||||||||||
Securities sold under agreements to repurchase | 148 | - | - | - | - | - | 148 | - | ||||||||||||||||||||||||
Other secured financings | 203 | (4 | ) | - | 38 | (1 | ) | - | 244 | (4 | ) | |||||||||||||||||||||
Long-term borrowings | 2,092 | (45 | ) | - | 694 | (145 | ) | (40 | ) | 2,646 | (49 | ) | ||||||||||||||||||||
| June 2017 Form 10-Q | 52 |
Notes to Consolidated Financial Statements (Unaudited) | |
| $ in millions | Beginning Balance at March 31, 2016 | Realized and Unrealized Gains (Losses) | Purchases 1 | Sales and Issuances 2 | Settlements 1 | Net Transfers | Ending Balance at June 30, 2016 | Unrealized Gains (Losses) at June 30, 2016 | ||||||||||||||||||||||||
Assets at Fair Value | ||||||||||||||||||||||||||||||||
Trading assets: | ||||||||||||||||||||||||||||||||
U.S. agency securities | $ | 8 | $ | - | $ | - | $ | (18 | ) | $ | - | $ | 30 | $ | 20 | $ | - | |||||||||||||||
Other sovereign government obligations | 8 | - | - | (3 | ) | - | (3 | ) | 2 | - | ||||||||||||||||||||||
Corporate and other debt: | ||||||||||||||||||||||||||||||||
State and municipal securities | 5 | 1 | 4 | - | - | - | 10 | 2 | ||||||||||||||||||||||||
Residential mortgage-, commercial mortgage- and asset backed securities | 355 | (4 | ) | 7 | (87 | ) | - | 84 | 355 | (14 | ) | |||||||||||||||||||||
Corporate bonds | 224 | 17 | 116 | (35 | ) | - | (46 | ) | 276 | 17 | ||||||||||||||||||||||
Collateralized debt and loan obligations | 348 | 18 | 3 | (178 | ) | - | (82 | ) | 109 | 18 | ||||||||||||||||||||||
Loans and lending commitments | 6,185 | (46 | ) | 360 | (484 | ) | (596 | ) | (1 | ) | 5,418 | (55 | ) | |||||||||||||||||||
Other debt | 527 | 4 | 13 | (19 | ) | - | 3 | 528 | 2 | |||||||||||||||||||||||
Total corporate and other debt | 7,644 | (10 | ) | 503 | (803 | ) | (596 | ) | (42 | ) | 6,696 | (30 | ) | |||||||||||||||||||
Corporate equities | 430 | (63 | ) | 273 | (82 | ) | - | 14 | 572 | (63 | ) | |||||||||||||||||||||
Net derivative and other contracts 3 : | ||||||||||||||||||||||||||||||||
Interest rate | 169 | (159 | ) | 2 | (7 | ) | 42 | (282 | ) | (235 | ) | (157 | ) | |||||||||||||||||||
Credit | (723 | ) | 65 | 1 | - | 93 | (550 | ) | (1,114 | ) | 53 | |||||||||||||||||||||
Foreign exchange | 126 | (58 | ) | - | - | (94 | ) | 25 | (1 | ) | (47 | ) | ||||||||||||||||||||
Equity | (1,832 | ) | 168 | 50 | (140 | ) | 263 | 18 | (1,473 | ) | (106 | ) | ||||||||||||||||||||
Commodity and other | 1,200 | 211 | 5 | (4 | ) | (88 | ) | (37 | ) | 1,287 | 130 | |||||||||||||||||||||
Total net derivative and other contracts | (1,060 | ) | 227 | 58 | (151 | ) | 216 | (826 | ) | (1,536 | ) | (127 | ) | |||||||||||||||||||
Investments | 922 | 5 | 58 | (11 | ) | - | - | 974 | 7 | |||||||||||||||||||||||
Intangible assets | 4 | - | - | - | - | (4 | ) | - | - | |||||||||||||||||||||||
Liabilities at Fair Value | ||||||||||||||||||||||||||||||||
Deposits | $ | 23 | $ | (1 | ) | $ | - | $ | 8 | $ | - | $ | (2 | ) | $ | 30 | $ | (1 | ) | |||||||||||||
Trading liabilities: | ||||||||||||||||||||||||||||||||
Corporate and other debt: | ||||||||||||||||||||||||||||||||
Corporate bonds | 6 | (1 | ) | (5 | ) | 29 | - | (25 | ) | 6 | (1 | ) | ||||||||||||||||||||
Other debt | 5 | 1 | (1 | ) | - | - | - | 3 | - | |||||||||||||||||||||||
Total corporate and other debt | 11 | - | (6 | ) | 29 | - | (25 | ) | 9 | (1 | ) | |||||||||||||||||||||
Corporate equities | 31 | (28 | ) | (33 | ) | 5 | - | (5 | ) | 26 | - | |||||||||||||||||||||
Obligation to return securities received as collateral | 1 | - | (1 | ) | - | - | - | - | - | |||||||||||||||||||||||
Securities sold under agreements to repurchase | 151 | 1 | - | - | - | - | 150 | 1 | ||||||||||||||||||||||||
Other secured financings | 454 | (14 | ) | - | 23 | (22 | ) | (28 | ) | 441 | (14 | ) | ||||||||||||||||||||
Long-term borrowings | 1,798 | 21 | - | 164 | (131 | ) | 119 | 1,929 | 26 | |||||||||||||||||||||||
| 53 | June 2017 Form 10-Q |
Notes to Consolidated Financial Statements (Unaudited) | |
| $ in millions | Beginning Balance at December 31, 2016 | Realized and Unrealized Gains (Losses) | Purchases 1 | Sales and Issuances 2 | Settlements 1 | Net Transfers | Ending Balance at June 30, 2017 | Unrealized Gains (Losses) at June 30, 2017 | ||||||||||||||||||||||||
Assets at Fair Value | ||||||||||||||||||||||||||||||||
Trading assets: | ||||||||||||||||||||||||||||||||
U.S. agency securities | $ | 74 | $ | (1 | ) | $ | - | $ | (240 | ) | $ | - | $ | 167 | $ | - | $ | - | ||||||||||||||
Other sovereign government obligations | 6 | - | 98 | (4 | ) | - | - | 100 | - | |||||||||||||||||||||||
Corporate and other debt: | ||||||||||||||||||||||||||||||||
State and municipal securities | 250 | 3 | 3 | (77 | ) | - | (170 | ) | 9 | - | ||||||||||||||||||||||
Residential mortgage-, commercial mortgage- and asset backed securities | 217 | 44 | 78 | (83 | ) | (16 | ) | 24 | 264 | 27 | ||||||||||||||||||||||
Corporate bonds | 232 | (2 | ) | 241 | (98 | ) | - | 76 | 449 | (1 | ) | |||||||||||||||||||||
Collateralized debt and loan obligations | 63 | (3 | ) | 11 | (12 | ) | (2 | ) | 1 | 58 | (3 | ) | ||||||||||||||||||||
Loans and lending commitments | 5,122 | 89 | 1,596 | (1,002 | ) | (1,146 | ) | 205 | 4,864 | 41 | ||||||||||||||||||||||
Other debt | 180 | 36 | 38 | (115 | ) | - | 47 | 186 | 34 | |||||||||||||||||||||||
Total corporate and other debt | 6,064 | 167 | 1,967 | (1,387 | ) | (1,164 | ) | 183 | 5,830 | 98 | ||||||||||||||||||||||
Corporate equities | 445 | 10 | 97 | (158 | ) | - | 106 | 500 | 15 | |||||||||||||||||||||||
Securities received as collateral | 1 | - | - | (1 | ) | - | - | - | - | |||||||||||||||||||||||
Net derivative and other contracts 3 : | ||||||||||||||||||||||||||||||||
Interest rate | 420 | (66 | ) | 47 | (27 | ) | 652 | (56 | ) | 970 | (55 | ) | ||||||||||||||||||||
Credit | (373 | ) | 1 | - | - | 62 | 5 | (305 | ) | (13 | ) | |||||||||||||||||||||
Foreign exchange | (43 | ) | 23 | 1 | (1 | ) | 8 | 14 | 2 | 43 | ||||||||||||||||||||||
Equity | 184 | 118 | 758 | (158 | ) | 121 | 70 | 1,093 | 200 | |||||||||||||||||||||||
Commodity and other | 1,600 | 104 | 9 | (19 | ) | (188 | ) | 3 | 1,509 | (76 | ) | |||||||||||||||||||||
Total net derivative and other contracts | 1,788 | 180 | 815 | (205 | ) | 655 | 36 | 3,269 | 99 | |||||||||||||||||||||||
Investments | 958 | 19 | 82 | (28 | ) | (63 | ) | (22 | ) | 946 | 11 | |||||||||||||||||||||
Liabilities at Fair Value | ||||||||||||||||||||||||||||||||
Deposits | $ | 42 | $ | (1 | ) | $ | - | $ | 36 | $ | - | $ | - | $ | 79 | $ | (1 | ) | ||||||||||||||
Short-term borrowings | 2 | - | - | - | (2 | ) | - | - | - | |||||||||||||||||||||||
Trading liabilities: | ||||||||||||||||||||||||||||||||
Corporate and other debt: | ||||||||||||||||||||||||||||||||
Corporate bonds | 34 | - | (164 | ) | 129 | - | 14 | 13 | - | |||||||||||||||||||||||
Other debt | 2 | - | - | - | - | - | 2 | - | ||||||||||||||||||||||||
Total corporate and other debt | 36 | - | (164 | ) | 129 | - | 14 | 15 | - | |||||||||||||||||||||||
Corporate equities | 34 | - | (63 | ) | 5 | - | 51 | 27 | - | |||||||||||||||||||||||
Obligation to return securities received as collateral | 1 | - | - | - | - | - | 1 | - | ||||||||||||||||||||||||
Securities sold under agreements to repurchase | 149 | 1 | - | - | - | - | 148 | 1 | ||||||||||||||||||||||||
Other secured financings | 434 | (23 | ) | - | 52 | (221 | ) | (44 | ) | 244 | (16 | ) | ||||||||||||||||||||
Long-term borrowings | 2,012 | (104 | ) | - | 981 | (286 | ) | (165 | ) | 2,646 | (95 | ) | ||||||||||||||||||||
| June 2017 Form 10-Q | 54 |
Notes to Consolidated Financial Statements (Unaudited) | |
| $ in millions | Beginning Balance at December 31, 2015 | Realized and Unrealized Gains (Losses) | Purchases 1 | Sales and Issuances 2 | Settlements 1 | Net Transfers | Ending Balance at June 30, 2016 | Unrealized Gains (Losses) at June 30, 2016 | ||||||||||||||||||||||||
Assets at Fair Value | ||||||||||||||||||||||||||||||||
Trading assets: | ||||||||||||||||||||||||||||||||
U.S. agency securities | $ | - | $ | 1 | $ | - | $ | (19 | ) | $ | - | $ | 38 | $ | 20 | $ | 1 | |||||||||||||||
Other sovereign government obligations | 4 | - | - | (5 | ) | - | 3 | 2 | 1 | |||||||||||||||||||||||
Corporate and other debt: | ||||||||||||||||||||||||||||||||
State and municipal securities | 19 | 1 | 4 | (15 | ) | - | 1 | 10 | 1 | |||||||||||||||||||||||
Residential mortgage-, commercial mortgage- and asset backed securities | 438 | (36 | ) | 26 | (170 | ) | - | 97 | 355 | (33 | ) | |||||||||||||||||||||
Corporate bonds | 267 | 62 | 113 | (128 | ) | - | (38 | ) | 276 | 61 | ||||||||||||||||||||||
Collateralized debt and loan obligations | 430 | 5 | 22 | (224 | ) | - | (124 | ) | 109 | 17 | ||||||||||||||||||||||
Loans and lending commitments | 5,936 | (111 | ) | 970 | (720 | ) | (672 | ) | 15 | 5,418 | (121 | ) | ||||||||||||||||||||
Other debt | 448 | (2 | ) | 133 | (63 | ) | - | 12 | 528 | (2 | ) | |||||||||||||||||||||
Total corporate and other debt | 7,538 | (81 | ) | 1,268 | (1,320 | ) | (672 | ) | (37 | ) | 6,696 | (77 | ) | |||||||||||||||||||
Corporate equities | 433 | (45 | ) | 296 | (119 | ) | - | 7 | 572 | (64 | ) | |||||||||||||||||||||
Securities received as collateral | 1 | - | - | (1 | ) | - | - | - | - | |||||||||||||||||||||||
Net derivative and other contracts 3 : | ||||||||||||||||||||||||||||||||
Interest rate | 260 | 305 | 3 | (21 | ) | (60 | ) | (722 | ) | (235 | ) | 205 | ||||||||||||||||||||
Credit | (844 | ) | (343 | ) | 1 | - | 153 | (81 | ) | (1,114 | ) | (360 | ) | |||||||||||||||||||
Foreign exchange | 141 | (109 | ) | - | - | (201 | ) | 168 | (1 | ) | (82 | ) | ||||||||||||||||||||
Equity | (2,031 | ) | (321 | ) | 71 | (184 | ) | 1,121 | (129 | ) | (1,473 | ) | (434 | ) | ||||||||||||||||||
Commodity and other | 1,050 | 297 | 7 | (4 | ) | (176 | ) | 113 | 1,287 | 210 | ||||||||||||||||||||||
Total net derivative and other contracts | (1,424 | ) | (171 | ) | 82 | (209 | ) | 837 | (651 | ) | (1,536 | ) | (461 | ) | ||||||||||||||||||
Investments | 707 | (56 | ) | 404 | (40 | ) | (41 | ) | - | 974 | (53 | ) | ||||||||||||||||||||
Intangible assets | 5 | - | - | - | - | (5 | ) | - | - | |||||||||||||||||||||||
Liabilities at Fair Value | ||||||||||||||||||||||||||||||||
Deposits | $ | 19 | $ | (2 | ) | $ | - | $ | 13 | $ | - | $ | (4 | ) | $ | 30 | $ | (2 | ) | |||||||||||||
Short-term borrowings | 1 | - | - | - | (1 | ) | - | - | - | |||||||||||||||||||||||
Trading liabilities: | ||||||||||||||||||||||||||||||||
Corporate and other debt: | ||||||||||||||||||||||||||||||||
Corporate bonds | - | (5 | ) | (7 | ) | 10 | - | (2 | ) | 6 | (5 | ) | ||||||||||||||||||||
Other debt | 4 | 2 | (3 | ) | 4 | - | - | 3 | 2 | |||||||||||||||||||||||
Total corporate and other debt | 4 | (3 | ) | (10 | ) | 14 | - | (2 | ) | 9 | (3 | ) | ||||||||||||||||||||
Corporate equities | 17 | (3 | ) | (22 | ) | 18 | - | 10 | 26 | (3 | ) | |||||||||||||||||||||
Obligation to return securities received as collateral | 1 | - | (1 | ) | - | - | - | - | - | |||||||||||||||||||||||
Securities sold under agreements to repurchase | 151 | 1 | - | - | - | - | 150 | 1 | ||||||||||||||||||||||||
Other secured financings | 461 | (32 | ) | - | 69 | (43 | ) | (78 | ) | 441 | (32 | ) | ||||||||||||||||||||
Long-term borrowings | 1,987 | (12 | ) | - | 276 | (167 | ) | (179 | ) | 1,929 | (6 | ) | ||||||||||||||||||||
| 1. | Loan originations and consolidations of VIEs are included in purchases and deconsolidations of VIEs are included in settlements. |
| 2. | Amounts related to entering into Net derivatives and other contracts, Deposits, Short-term borrowings, Other secured financings and Long-term borrowings primarily represent issuances. Amounts for other line items primarily represent sales. |
| 3. | Net derivative and other contracts represent Trading assets-Derivative and other contracts, net of Trading liabilities-Derivative and other contracts. |
| 55 | June 2017 Form 10-Q |
Notes to Consolidated Financial Statements (Unaudited) | |
Significant Unobservable Inputs Used in Recurring and Nonrecurring Level 3 Fair Value Measurements
The following disclosures provide information on the valuation techniques, significant unobservable inputs, and their ranges and averages for each major category of assets and liabilities measured at fair value on a recurring and nonrecurring basis with a significant Level 3 balance. The level of aggregation and breadth of products cause the range of inputs to be wide and not evenly distributed across the inventory. Further, the range of unobservable inputs may differ across firms in the financial services industry because of diversity in the types of products included in each firm's inventory. For qualitative information on the sensitivity of the fair value measurements to changes in the significant unobservable inputs, see Note 3 to the consolidated financial statements in the 2016 Form 10-K. There are no predictable relationships between multiple significant unobservable inputs attributable to a given valuation technique. A single amount is disclosed when there is no significant difference between the minimum, maximum and average (weighted average or simple average / median).
Valuation Techniques and Sensitivity of Unobservable Inputs Used in Recurring and Nonrecurring Level 3 Fair Value Measurements
| Predominant Valuation Techniques/Significant Unobservable Inputs | Range (Weighted Averages or Simple Averages/Median) 1 | |||||
| $ in millions | At June 30, 2017 | At December 31, 2016 | ||||
Recurring Fair Value Measurement | ||||||
Assets at Fair Value | ||||||
U.S. agency securities ( $ - and $74) | ||||||
Comparable pricing: | Comparable bond price | N/A | 96 to 105 points (102 points) | |||
Other sovereign government obligations ( $100 and $6) | ||||||
Comparable pricing: | Comparable bond price | 92 to 99 points (96 points) | N/M | |||
State and municipal securities ( $9 and $250) | ||||||
Comparable pricing: | Comparable bond price | N/M | 53 to 100 points (91 points) | |||
Residential mortgage-, commercial mortgage- and asset-backed securities ( $264 and $217) | ||||||
Comparable pricing: | Comparable bond price | 0 to 95 points (24 points) | 0 to 86 points (27 points) | |||
Corporate bonds ( $449 and $232) | ||||||
Comparable pricing: | Comparable bond price | 2 to 133 points (87 points) | 3 to 130 points (70 points) | |||
Option model: | At the money volatility | 15% to 34% (24%) | 23% to 33% (30%) | |||
Collateralized debt and loan obligations ( $58 and $63) | ||||||
Comparable pricing: | Comparable bond price | 0 to 65 points (35 points) | 0 to 103 points (50 points) | |||
Correlation model: | Credit correlation | 42% to 49% (44%) | N/M | |||
Loans and lending commitments ($4,864 and $5,122) | ||||||
Corporate loan model: | Credit spread | N/M | 402 to 672 bps (557 bps) | |||
Expected recovery: | Asset coverage | 36% to 100% (85%) | 43% to 100% (83%) | |||
Option model: | Volatility skew | -1% | N/M | |||
Margin loan model: | Discount rate | 1% to 5% (2%) | 2% to 8% (3%) | |||
| Volatility skew | 10% to 32% (18%) | 21% to 63% (33%) | ||||
Comparable pricing: | Comparable loan price | 55 to 104 points (95 points) | 45 to 100 points (84 points) | |||
Discounted cash flow: | Implied weighted average cost of capital | N/M | 5% | |||
| Capitalization rate | N/M | 4% to 10% (4%) | ||||
Other debt ( $186 and $180) | ||||||
Option model: | At the money volatility | 17% to 52% (44%) | 16% to 52% (52%) | |||
Discounted cash flow: | Discount rate | 9% to 12% (11%) | 7% to 12% (11%) | |||
Comparable pricing: | Comparable loan price | N/M | 1 to 74 points (23 points) | |||
Corporate equities ( $500 and $445) | ||||||
Comparable pricing: | Comparable equity price | 100% | 100% | |||
Net derivative and other contracts 2 : | ||||||
Interest rate ( $970 and $420) | ||||||
Option model: | Interest rate - Foreign exchange correlation | N/M | 28% to 58% (44% / 43%) | |||
| Interest rate volatility skew | 26% to 94% (42% / 41%) | 19% to 117% (55% / 56%) | ||||
| Interest rate quanto correlation | N/M | -17% to 31% (1% / -5%) | ||||
| Interest rate curve correlation | N/M | 28% to 96% (68% / 72%) | ||||
| Inflation volatility | 24% to 63% (44% / 41%) | 23% to 55% (40% / 39%) | ||||
| Interest rate - inflation correlation | -48% to -27% (-36% / -34%) | N/M | ||||
| Interest rate curve | 1% | N/M | ||||
| June 2017 Form 10-Q | 56 |
Notes to Consolidated Financial Statements (Unaudited) | |
| Predominant Valuation Techniques/Significant Unobservable Inputs | Range (Weighted Averages or Simple Averages/Median) 1 | |||||
| $ in millions | At June 30, 2017 | At December 31, 2016 | ||||
Credit ( $(305) and $(373)) | ||||||
Comparable pricing: | Cash synthetic basis | 4 to 6 points (5 points) | 5 to 12 points (11 points) | |||
| Comparable bond price | N/M | 0 to 70 points (23 points) | ||||
Correlation model: | Credit correlation | 37% to 78% (48%) | 32% to 70% (45%) | |||
Foreign exchange 3 ( $2 and $(43)) | ||||||
Option model: | Interest rate - Foreign exchange correlation | 27% to 54% (44% / 44%) | 28% to 58% (44% / 43%) | |||
| Interest rate volatility skew | 29% to 102% (47% / 46%) | 34% to 117% (55% / 56%) | ||||
| Interest rate quanto correlation | N/M | -17% to 31% (1% / -5%) | ||||
Equity 3 ( $1,093 and $184) | ||||||
Option model: | At the money volatility | 6% to 57% (33%) | 7% to 66% (33%) | |||
| Volatility skew | -3% to 1% (-1%) | -4% to 0% (-1%) | ||||
| Equity - Equity correlation | 5% to 99% (78%) | 25% to 99% (73%) | ||||
| Equity - Foreign exchange correlation | -70% to 9% (-30%) | -63% to 30% (-43%) | ||||
| Equity - Interest rate correlation | -7% to 52% (23% / 24%) | -8% to 52% (12% / 4%) | ||||
Commodity and other( $1,509 and $1,600) | ||||||
Option model: | Forward power price | $6 to $87 ($30) per MWh | $7 to $90 ($32) per MWh | |||
| Commodity volatility | 6% to 62% (17%) | 6% to 130% (18%) | ||||
| Cross-commodity correlation | 5% to 99% (92%) | 5% to 99% (92%) | ||||
Investments ( $946 and $958) | ||||||
Discounted cash flow: | Implied weighted average cost of capital | N/M | 10% | |||
| Exit multiple | 10 times | 10 to 24 times (11 times) | ||||
Market approach: | EBITDA multiple | 8 to 24 times (13 times) | 6 to 24 times (12 times) | |||
Comparable pricing: | Comparable equity price | 75% to 100% (90%) | 75% to 100% (93%) | |||
Liabilities at Fair Value | ||||||
Deposits ( $79 and $42) | ||||||
Option model: | At the money volatility | 15% to 50% (24%) | N/M | |||
| Volatility skew | -1% to 0% (-1%) | N/M | ||||
Securities sold under agreements to repurchase ( $148 and $149) | ||||||
Discounted cash flow: | Funding spread | 131 to 145 bps (136 bps) | 118 to 127 bps (121 bps) | |||
Other secured financings ( $244 and $434) | ||||||
Discounted cash flow: | Funding spread | 48 to 80 bps (64 bps) | 63 to 92 bps (78 bps) | |||
Option model: | Volatility skew | -1% | -1% | |||
| At the money volatility | 10% to 40% (26%) | N/M | ||||
Discounted cash flow: | Discount rate | N/M | 4% | |||
Long-term borrowings ( $2,646 and $2,012) | ||||||
Option model: | At the money volatility | 6% to 42% (26%) | 7% to 42% (30%) | |||
| Volatility skew | -3% to 1% (-1%) | -2% to 0% (-1%) | ||||
| Equity - Equity correlation | 36% to 98% (71%) | 35% to 99% (84%) | ||||
| Equity - Foreign exchange correlation | -72% to 13% (-29%) | -63% to 13% (-40%) | ||||
Option model: | Interest rate volatility skew | 26% to 94% (42% / 41%) | 25% | |||
| Equity volatility discount | 9% to 12% (10% / 11%) | 7% to 11% (10% / 10%) | ||||
Comparable pricing: | Comparable equity price | 100% | N/M | |||
| Nonrecurring Fair Value Measurement | ||||||
| Assets at Fair Value | ||||||
| Loans ( $1,277 and $2,443) | ||||||
Corporate loan model: | Credit spread | 90 to 563 bps (273 bps) | 90 to 487 bps (208 bps) | |||
Expected recovery: | Asset coverage | 73% to 95% (84%) | 73% to 99% (97%) | |||
bps-Basis points. One basis point equals 1/100 th of 1%.
Points-Percentage of par
MWh-Megawatt hours
EBITDA-Earnings before interest, taxes, depreciation and amortization
N/A-Not Applicable
N/M-Not Meaningful
| 1. | Amounts represent weighted averages except where simple averages and the median of the inputs are provided when more relevant. |
| 2. | Credit valuation adjustment ("CVA") and funding valuation adjustments ("FVA") are included in the balance but excluded from the Valuation Technique(s) and Significant Unobservable Inputs in the previous table. CVA is a Level 3 input when the underlying counterparty credit curve is unobservable. FVA is a Level 3 input in its entirety given the lack of observability of funding spreads in the principal market. |
| 3. | Includes derivative contracts with multiple risks ( i.e. , hybrid products). |
| 57 | June 2017 Form 10-Q |
Notes to Consolidated Financial Statements (Unaudited) | |
For a description of the Firm's significant unobservable inputs for all major categories of assets and liabilities, see Note 3 to the consolidated financial statements in the 2016 Form 10-K. During the current quarter there were no significant updates made to the Firm's significant unobservable inputs.
Fair Value of Investments Measured at NAV
For a description of the Firm's investments in private equity funds, real estate funds and hedge funds measured at fair value based on NAV, see Note 3 to the consolidated financial statements in the 2016 Form 10-K.
Investments in Certain Funds Measured at NAV per Share
| At June 30, 2017 | At December 31, 2016 | |||||||||||||||
| $ in millions | Fair Value | Commitment | Fair Value | Commitment | ||||||||||||
Private equity funds | $ | 1,588 | $ | 388 | $ | 1,566 | $ | 335 | ||||||||
Real estate funds | 1,050 | 157 | 1,103 | 136 | ||||||||||||
Hedge funds | 115 | 18 | 147 | 4 | ||||||||||||
Total | $ | 2,753 | $ | 563 | $ | 2,816 | $ | 475 | ||||||||
Nonredeemable Funds by Contractual Maturity
| Fair Value at June 30, 2017 | ||||||||
| $ in millions | Private Equity | Real Estate | ||||||
Less than 5 years | $ | 297 | $ | 80 | ||||
5-10 years | 745 | 644 | ||||||
Over 10 years | 546 | 326 | ||||||
Total | $ | 1,588 | $ | 1,050 | ||||
Restrictions
Investments in hedge funds may be subject to initial period lock-up or gate provisions. A lock-up provision is a provision that provides that during a certain initial period an investor may not make a withdrawal from the fund. A gate provision restricts the amount of redemption that an investor can demand on any redemption date.
Hedge Funds Redemption Frequency
| Fair Value At June 30, 2017 | ||
Quarterly | 57% | |
Every six months | -% | |
Greater than six months | 21% | |
Subject to lock-up provisions 1 | 22% | |
Percentage of hedge fund investments that cannot be redeemed due to a gate provision 2 | 23% |
| 1. | Remaining restriction period for these investments was primarily over three years. |
| 2. | Gate provision has been imposed by the hedge fund manager primarily for indefinite periods. |
The redemption notice periods for hedge funds were primarily greater than six months.
Fair Value Option
The Firm elected the fair value option for certain eligible instruments that are risk managed on a fair value basis to mitigate income statement volatility caused by measurement basis differences between the elected instruments and their associated risk management transactions or to eliminate complexities of applying certain accounting models.
Earnings Impact of Instruments under the Fair Value Option
| $ in millions | Trading Revenues | Interest Income (Expense) | Net Revenues | |||||||
Three Months Ended June 30, 2017 | ||||||||||
Securities purchased under agreements to resell | $ | (1 | ) | $ 1 | $ | - | ||||
Deposits 1 | - | - | - | |||||||
Short-term borrowings 1 | 6 | (1) | 5 | |||||||
Securities sold under agreements to repurchase 1 | (3 | ) | (4) | (7) | ||||||
Long-term borrowings 1 | (901 | ) | (111) | (1,012) | ||||||
Three Months Ended June 30, 2016 | ||||||||||
Securities purchased under agreements to resell | $ | (1 | ) | $ 2 | $ | 1 | ||||
Deposits 1 | (1 | ) | (1) | (2) | ||||||
Short-term borrowings 1 | (9 | ) | - | (9) | ||||||
Securities sold under agreements to repurchase 1 | (3 | ) | (3) | (6) | ||||||
Long-term borrowings 1 | (1,289 | ) | (130) | (1,419) | ||||||
Six Months Ended June 30, 2017 | ||||||||||
Securities purchased under agreements to resell | $ | (1 | ) | $ 2 | $ | 1 | ||||
Deposits 1 | (1 | ) | - | (1) | ||||||
Short-term borrowings 1 | (9 | ) | (1) | (10) | ||||||
Securities sold under agreements to repurchase 1 | (1 | ) | (8) | (9) | ||||||
Long-term borrowings 1 | (2,511 | ) | (230) | (2,741) | ||||||
Six Months Ended June 30, 2016 | ||||||||||
Securities purchased under agreements to resell | $ | (1 | ) | $ 4 | $ | 3 | ||||
Deposits 1 | (3 | ) | (1) | (4) | ||||||
Short-term borrowings 1 | 36 | - | 36 | |||||||
Securities sold under agreements to repurchase 1 | (12 | ) | (5) | (17) | ||||||
Long-term borrowings 1 | (2,254 | ) | (269) | (2,523) | ||||||
| 1. | Gains (losses) in all periods are mainly attributable to changes in foreign currency rates or interest rates or movements in the reference price or index for short-term and long-term borrowings before the impact of related hedges. |
The amounts in the previous table are included within Net revenues and do not reflect any gains or losses on related hedging instruments. In addition to the amounts in the
| June 2017 Form 10-Q | 58 |
Notes to Consolidated Financial Statements (Unaudited) | |
previous table, as discussed in Note 2 to the consolidated financial statements in the 2016 Form 10-K, instruments within Trading assets or Trading liabilities are measured at fair value.
Gains (Losses) Due to Changes in Instrument-Specific Credit Risk
| Three Months Ended June 30, | ||||||||||||||||
| 2017 | 2016 | |||||||||||||||
| $ in millions | Trading Revenues | OCI | Trading Revenues | OCI | ||||||||||||
Short-term and long-term borrowings 1 | $ | (4 | ) | $ (281) | $ | - | $ | 226 | ||||||||
Securities sold under agreements to repurchase 1 | - | - | - | (1 | ) | |||||||||||
Loans and other debt 2 | 48 | - | (14 | ) | - | |||||||||||
Lending commitments 3 | - | - | 2 | - | ||||||||||||
| Six Months Ended June 30, | ||||||||||||||||
| 2017 | 2016 | |||||||||||||||
| $ in millions | Trading Revenues | OCI | Trading Revenues | OCI | ||||||||||||
Short-term and long-term borrowings 1 | $ | (8 | ) | $ | (267 | ) | $ | 41 | $ | 545 | ||||||
Securities sold under agreements to repurchase 1 | - | (3 | ) | - | 3 | |||||||||||
Loans and other debt 2 | 45 | - | (114 | ) | - | |||||||||||
Lending commitments 3 | - | - | 3 | - | ||||||||||||
| $ in millions | June 30, 2017 | December 31, 2016 | ||||||
Cumulative pre-tax DVA
gain (loss) recognized in AOCI | $ (1,191) | $ | (921 | ) | ||||
OCI-Other comprehensive income (loss)
| 1. | Unrealized DVA gains (losses) are recorded in OCI and when such gains (losses) are realized they are recorded in Trading revenues. See Note 2 to the consolidated financial statements in the 2016 Form 10-K and Note 14 for further information. |
| 2. | Loans and other debt instrument-specific credit gains (losses) were determined by excluding the non-credit components of gains and losses, such as those due to changes in interest rates. |
| 3. | Gains (losses) on lending commitments were generally determined based on the difference between estimated expected client yields and contractual yields at each respective period-end. |
Short-Term and Long-Term Borrowings Measured at Fair Value on a Recurring Basis
$ in millions | At June 30, 2017 | At December 31, 2016 | ||||||
| Business Unit Responsible for Risk Management | ||||||||
Equity | $ | 23,605 | $ | 21,066 | ||||
Interest rates | 18,502 | 16,051 | ||||||
Foreign exchange | 760 | 1,114 | ||||||
Credit | 709 | 647 | ||||||
Commodities | 232 | 264 | ||||||
Total | $ | 43,808 | $ | 39,142 | ||||
Net Difference of Contractual Principal Amount Over Fair Value
| $ in millions | At June 30, 2017 | At December 31, 2016 | ||||||
Loans and other debt 1 | $ | 12,986 | $ | 13,495 | ||||
Loans 90 or more days past due and/or on nonaccrual status 1 | 11,337 | 11,502 | ||||||
Short-term and long-term borrowings 2 | 621 | 720 | ||||||
| 1. | The majority of the difference between principal and fair value amounts for loans and other debt relates to distressed debt positions purchased at amounts well below par. |
| 2. | Short-term and long-term borrowings do not include structured notes where the repayment of the initial principal amount fluctuates based on changes in a reference price or index. |
Fair Value Loans on Nonaccrual Status
| $ in millions | At June 30, 2017 | At December 31, 2016 | ||||||
Nonaccrual loans | $ | 1,326 | $ | 1,536 | ||||
Nonaccrual loans 90 or more days past due | $ | 796 | $ | 787 | ||||
The previous tables exclude non-recourse debt from consolidated VIEs, liabilities related to failed sales of financial assets, pledged commodities and other liabilities that have specified assets attributable to them.
Assets and Liabilities Measured at Fair Value on a Nonrecurring Basis
Current Quarter Gains (Losses)
| Three Months Ended June 30, | ||||||||
| $ in millions | 2017 1 | 2016 1 | ||||||
Assets | ||||||||
Loans 2 | $ | 20 | $ | (34 | ) | |||
Other Assets-Other investments 3 | - | (38 | ) | |||||
Other assets-Premises, equipment and software costs 4 | (1 | ) | (22 | ) | ||||
Total | $ | 19 | $ | (94 | ) | |||
Liabilities | ||||||||
Other liabilities and accrued expenses 2 | ||||||||
Lending commitments | $ | 21 | $ | 13 | ||||
Total | $ | 21 | $ | 13 | ||||
| 59 | June 2017 Form 10-Q |
Notes to Consolidated Financial Statements (Unaudited) | |
Current Year Period Gains (Losses)
| Six Months Ended June 30, | ||||||||
| $ in millions | 2017 1 | 2016 1 | ||||||
Assets | ||||||||
Loans 2 | $ | 44 | $ | (131 | ) | |||
Other Assets-Other investments 3 | - | (40 | ) | |||||
Other assets-Premises, equipment and software costs 4 | (6 | ) | (27 | ) | ||||
Total | $ | 38 | $ | (198 | ) | |||
Liabilities | ||||||||
Other liabilities and accrued expenses 2 | ||||||||
Lending commitments | $ | 48 | $ | 24 | ||||
Total | $ | 48 | $ | 24 | ||||
| 1. | Gains and losses for Loans and Other assets-Other investments are classified in Other revenues. For other items, gains and losses are recorded in Other revenues if the item is held for sale, otherwise Other expenses. |
| 2. | Non-recurring changes in the fair value of loans and lending commitments were calculated as follows: for the held for investment category, based on the value of the underlying collateral; and for the held for sale category, based on recently executed transactions, market price quotations, valuation models that incorporate market observable inputs where possible, such as comparable loan or debt prices and credit default swap spread levels adjusted for any basis difference between cash and derivative instruments, or default recovery analysis where such transactions and quotations are unobservable. |
| 3. | Losses related to Other assets-Other investments were determined using techniques that included discounted cash flow models, methodologies that incorporate multiples of certain comparable companies and recently executed transactions. |
| 4. | Losses related to Other assets-Premises, equipment and software costs were determined using techniques that included a default recovery analysis and recently executed transactions. |
Carrying and Fair Values
| At June 30, 2017 | ||||||||||||
| Fair Value by Level | ||||||||||||
| $ in millions | Total | Level 2 | Level 3 1 | |||||||||
Assets | ||||||||||||
Loans | $ | 2,632 | $ | 1,355 | $ | 1,277 | ||||||
Total assets | $ | 2,632 | $ | 1,355 | $ | 1,277 | ||||||
Liabilities | ||||||||||||
Other liabilities and accrued expenses-Lending commitments | $ | 212 | $ | 164 | $ | 48 | ||||||
Total liabilities | $ | 212 | $ | 164 | $ | 48 | ||||||
| At December 31, 2016 | ||||||||||||
| Fair Value by Level | ||||||||||||
| $ in millions | Total | Level 2 | Level 3 1 | |||||||||
Assets | ||||||||||||
Loans | $ | 4,913 | $ | 2,470 | $ | 2,443 | ||||||
Other assets-Other investments | 123 | - | 123 | |||||||||
Other assets-Premises, equipment and software costs | 25 | 22 | 3 | |||||||||
Total assets | $ | 5,061 | $ | 2,492 | $ | 2,569 | ||||||
Liabilities | ||||||||||||
Other liabilities and accrued expenses-Lending commitments | $ | 226 | $ | 166 | $ | 60 | ||||||
Total liabilities | $ | 226 | $ | 166 | $ | 60 | ||||||
| 1. | Refer to "Significant Unobservable Inputs Used in Recurring and Nonrecurring Level 3 Fair Value Measurements" section herein for details of the significant unobservable inputs used for nonrecurring fair value measurement. |
Financial Instruments Not Measured at Fair Value
| At June 30, 2017 | ||||||||||||||||||||
| Carrying | Fair Value | |||||||||||||||||||
| $ in millions | Value | Level 1 | Level 2 | Level 3 | Total | |||||||||||||||
Financial Assets |
| |||||||||||||||||||
Cash and due from banks | $ | 25,008 | $ | 25,008 | $ | - | $ | - | $ | 25,008 | ||||||||||
Interest bearing deposits with banks | 19,651 | 19,651 | - | - | 19,651 | |||||||||||||||
Investment securities-HTM | 21,088 | 8,255 | 12,319 | 123 | 20,697 | |||||||||||||||
Securities purchased under agreements to resell | 97,306 | - | 92,537 | 4,718 | 97,255 | |||||||||||||||
Securities borrowed | 126,722 | - | 126,722 | 1 | 126,723 | |||||||||||||||
Customer and other receivables 1 | 49,292 | - | 45,052 | 4,110 | 49,162 | |||||||||||||||
Loans 2 | 97,639 | - | 20,319 | 78,579 | 98,898 | |||||||||||||||
Other assets 3 | 30,171 | 30,171 | - | - | 30,171 | |||||||||||||||
Financial Liabilities |
| |||||||||||||||||||
Deposits | $ | 144,783 | $ | - | $ | 144,783 | $ | - | $ | 144,783 | ||||||||||
Short-term borrowings | 334 | - | 334 | - | 334 | |||||||||||||||
Securities sold under agreements to repurchase | 49,959 | - | 46,452 | 3,488 | 49,940 | |||||||||||||||
Securities loaned | 16,862 | - | 16,477 | 401 | 16,878 | |||||||||||||||
Other secured financings | 10,911 | - | 9,961 | 956 | 10,917 | |||||||||||||||
Customer and other payables 1 | 192,973 | - | 192,973 | - | 192,973 | |||||||||||||||
Long-term borrowings | 140,886 | - | 145,544 | 51 | 145,595 | |||||||||||||||
| June 2017 Form 10-Q | 60 |
Notes to Consolidated Financial Statements (Unaudited) | |
| At December 31, 2016 | ||||||||||||||||||||
| Carrying | Fair Value | |||||||||||||||||||
| $ in millions | Value | Level 1 | Level 2 | Level 3 | Total | |||||||||||||||
Financial Assets | ||||||||||||||||||||
Cash and due from banks | $ | 22,017 | $ | 22,017 | $ | - | $ | - | $ | 22,017 | ||||||||||
Interest bearing deposits with banks | 21,364 | 21,364 | - | - | 21,364 | |||||||||||||||
Investment securities-HTM | 16,922 | 5,557 | 10,896 | - | 16,453 | |||||||||||||||
Securities purchased under agreements to resell | 101,653 | - | 97,825 | 3,830 | 101,655 | |||||||||||||||
Securities borrowed | 125,236 | - | 125,093 | 147 | 125,240 | |||||||||||||||
Customer and other receivables 1 | 41,679 | - | 36,962 | 4,575 | 41,537 | |||||||||||||||
Loans 2 | 94,248 | - | 20,906 | 74,121 | 95,027 | |||||||||||||||
Other assets 3 | 33,979 | 33,979 | - | - | 33,979 | |||||||||||||||
Financial Liabilities | ||||||||||||||||||||
Deposits | $ | 155,800 | $ | - | $ | 155,800 | $ | - | $ | 155,800 | ||||||||||
Short-term borrowings | 535 | - | 535 | - | 535 | |||||||||||||||
Securities sold under agreements to repurchase | 53,899 | - | 50,941 | 2,972 | 53,913 | |||||||||||||||
Securities loaned | 15,844 | - | 15,853 | - | 15,853 | |||||||||||||||
Other secured financings | 6,077 | - | 4,792 | 1,290 | 6,082 | |||||||||||||||
Customer and other payables 1 | 187,497 | - | 187,497 | - | 187,497 | |||||||||||||||
Long-term borrowings | 126,039 | - | 129,826 | 51 | 129,877 | |||||||||||||||
| HTM-Held | to maturity |
| 1. | Accrued interest, fees, and dividend receivables and payables where carrying value approximates fair value have been excluded. |
| 2. | Amounts include loans measured at fair value on a non-recurring basis. |
| 3. | Cash deposited with clearing organizations or segregated under federal and other regulations or requirements. |
Lending commitments-Held for investment and Held for sale
| Commitment | Fair Value | |||||||||||||||
| $ in millions | amount 1 | Total | Level 2 | Level 3 | ||||||||||||
June 30, 2017 | $ | 95,090 | $ | 917 | $ | 706 | $ | 211 | ||||||||
December 31, 2016 | 97,409 | 1,241 | 973 | 268 | ||||||||||||
| 1. | For further discussion on lending commitments, see Note 11. |
The previous tables exclude certain financial instruments such as equity method investments and all non-financial assets and liabilities such as the value of the long-term relationships with the Firm's deposit customers. For further discussion of the contents and valuation techniques of financial instruments not measured at fair value, see Note 3 to the consolidated financial statements in the 2016 Form 10-K. During the current quarter there were no significant updates made to the Firm's valuation techniques for financial instruments not measured at fair value.
| 61 | June 2017 Form 10-Q |
Notes to Consolidated Financial Statements (Unaudited) | |
4. Derivative Instruments and Hedging Activities
Derivative Fair Values
| At June 30, 2017 | ||||||||||||||||
| Assets | ||||||||||||||||
$ in millions | Bilateral OTC | Cleared OTC 1 | Exchange- Traded | Total | ||||||||||||
Designated as accounting hedges |
| |||||||||||||||
Interest rate contracts | $ | 1,547 | $ | 937 | $ | - | $ | 2,484 | ||||||||
Foreign exchange contracts | 48 | 8 | - | 56 | ||||||||||||
Total | 1,595 | 945 | - | 2,540 | ||||||||||||
Not designated as accounting hedges 2 |
| |||||||||||||||
Interest rate contracts | 182,333 | 72,140 | 193 | 254,666 | ||||||||||||
Credit contracts | 7,282 | 2,190 | - | 9,472 | ||||||||||||
Foreign exchange contracts | 54,357 | 544 | 100 | 55,001 | ||||||||||||
Equity contracts | 24,832 | - | 20,550 | 45,382 | ||||||||||||
Commodity and other contracts | 10,197 | - | 2,226 | 12,423 | ||||||||||||
Total | 279,001 | 74,874 | 23,069 | 376,944 | ||||||||||||
Total gross derivatives | $ | 280,596 | $ | 75,819 | $ | 23,069 | $ | 379,484 | ||||||||
Amounts offset | ||||||||||||||||
Counterparty netting | (215,065 | ) | (71,178 | ) | (20,307 | ) | (306,550 | ) | ||||||||
Cash collateral netting | (38,973 | ) | (3,821 | ) | - | (42,794 | ) | |||||||||
Total in Trading assets | $ | 26,558 | $ | 820 | $ | 2,762 | $ | 30,140 | ||||||||
Amounts not offset 3 | ||||||||||||||||
Financial instruments collateral | (11,213 | ) | - | - | (11,213 | ) | ||||||||||
Other cash collateral | (10 | ) | - | - | (10 | ) | ||||||||||
Net amounts 4 | $ | 15,335 | $ | 820 | $ | 2,762 | $ | 18,917 | ||||||||
| Liabilities | ||||||||||||||||
$ in millions | Bilateral OTC | Cleared OTC 1 | Exchange- Traded | Total | ||||||||||||
Designated as accounting hedges |
| |||||||||||||||
Interest rate contracts | $ | 60 | $ | 757 | $ | - | $ | 817 | ||||||||
Foreign exchange contracts | 138 | 40 | - | 178 | ||||||||||||
Total | 198 | 797 | - | 995 | ||||||||||||
Not designated as accounting hedges 2 |
| |||||||||||||||
Interest rate contracts | 166,210 | 68,206 | 141 | 234,557 | ||||||||||||
Credit contracts | 8,132 | 2,273 | - | 10,405 | ||||||||||||
Foreign exchange contracts | 57,314 | 625 | 48 | 57,987 | ||||||||||||
Equity contracts | 27,653 | - | 20,022 | 47,675 | ||||||||||||
Commodity and other contracts | 8,881 | - | 2,285 | 11,166 | ||||||||||||
Total | 268,190 | 71,104 | 22,496 | 361,790 | ||||||||||||
Total gross derivatives | $ | 268,388 | $ | 71,901 | $ | 22,496 | $ | 362,785 | ||||||||
Amounts offset | ||||||||||||||||
Counterparty netting | (215,065 | ) | (71,178 | ) | (20,307 | ) | (306,550 | ) | ||||||||
Cash collateral netting | (29,136 | ) | (394 | ) | - | (29,530 | ) | |||||||||
Total in Trading liabilities | $ | 24,187 | $ | 329 | $ | 2,189 | $ | 26,705 | ||||||||
Amounts not offset 3 | ||||||||||||||||
Financial instruments collateral | (6,276 | ) | - | (168 | ) | (6,444 | ) | |||||||||
Other cash collateral | (26 | ) | (58 | ) | - | (84 | ) | |||||||||
Net amounts 4 | $ | 17,885 | $ | 271 | $ | 2,021 | $ | 20,177 | ||||||||
| At December 31, 2016 | ||||||||||||||||
| Assets | ||||||||||||||||
$ in millions | Bilateral OTC | Cleared OTC | Exchange- Traded | Total | ||||||||||||
Designated as accounting hedges |
| |||||||||||||||
Interest rate contracts | $ | 1,924 | $ | 1,049 | $ | - | $ | 2,973 | ||||||||
Foreign exchange contracts | 249 | 18 | - | 267 | ||||||||||||
Total | 2,173 | 1,067 | - | 3,240 | ||||||||||||
Not designated as accounting hedges 5 |
| |||||||||||||||
Interest rate contracts | 200,336 | 99,217 | 384 | 299,937 | ||||||||||||
Credit contracts | 9,837 | 2,392 | - | 12,229 | ||||||||||||
Foreign exchange contracts | 73,645 | 1,022 | 231 | 74,898 | ||||||||||||
Equity contracts | 20,710 | - | 17,919 | 38,629 | ||||||||||||
Commodity and other contracts | 9,792 | - | 3,727 | 13,519 | ||||||||||||
Total | 314,320 | 102,631 | 22,261 | 439,212 | ||||||||||||
Total gross derivatives | $ | 316,493 | $ | 103,698 | $ | 22,261 | $ | 442,452 | ||||||||
Amounts offset | ||||||||||||||||
Counterparty netting | (243,488 | ) | (100,477 | ) | (19,607 | ) | (363,572 | ) | ||||||||
Cash collateral netting | (45,875 | ) | (1,799 | ) | - | (47,674 | ) | |||||||||
Total in Trading assets | $ | 27,130 | $ | 1,422 | $ | 2,654 | $ | 31,206 | ||||||||
Amounts not offset 3 | ||||||||||||||||
Financial instruments collateral | (10,293 | ) | - | - | (10,293 | ) | ||||||||||
Other cash collateral | (124 | ) | - | - | (124 | ) | ||||||||||
Net amounts 4 | $ | 16,713 | $ | 1,422 | $ | 2,654 | $ | 20,789 | ||||||||
| Liabilities | ||||||||||||||||
$ in millions | Bilateral OTC | Cleared OTC | Exchange- Traded | Total | ||||||||||||
Designated as accounting hedges |
| |||||||||||||||
Interest rate contracts | $ | 77 | $ | 647 | $ | - | $ | 724 | ||||||||
Foreign exchange contracts | 15 | 25 | - | 40 | ||||||||||||
Total | 92 | 672 | - | 764 | ||||||||||||
Not designated as accounting hedges 5 |
| |||||||||||||||
Interest rate contracts | 183,063 | 103,392 | 397 | 286,852 | ||||||||||||
Credit contracts | 11,024 | 2,401 | - | 13,425 | ||||||||||||
Foreign exchange contracts | 74,575 | 952 | 16 | 75,543 | ||||||||||||
Equity contracts | 22,531 | - | 17,983 | 40,514 | ||||||||||||
Commodity and other contracts | 8,303 | - | 3,582 | 11,885 | ||||||||||||
Total | 299,496 | 106,745 | 21,978 | 428,219 | ||||||||||||
Total gross derivatives | $ | 299,588 | $ | 107,417 | $ | 21,978 | $ | 428,983 | ||||||||
Amounts offset | ||||||||||||||||
Counterparty netting | (243,488 | ) | (100,477 | ) | (19,607 | ) | (363,572 | ) | ||||||||
Cash collateral netting | (30,405 | ) | (5,691 | ) | - | (36,096 | ) | |||||||||
Total in Trading liabilities | $ | 25,695 | $ | 1,249 | $ | 2,371 | $ | 29,315 | ||||||||
Amounts not offset 3 | ||||||||||||||||
Financial instruments collateral | (7,638 | ) | - | (585 | ) | (8,223 | ) | |||||||||
Other cash collateral | (10 | ) | (1 | ) | - | (11 | ) | |||||||||
Net amounts 4 | $ | 18,047 | $ | 1,248 | $ | 1,786 | $ | 21,081 | ||||||||
| June 2017 Form 10-Q | 62 |
Notes to Consolidated Financial Statements (Unaudited) | |
Derivative Notionals
At June 30, 2017
| Assets | ||||||||||||||||
$ in billions | Bilateral OTC | Cleared OTC | Exchange- Traded | Total | ||||||||||||
Designated as accounting hedges |
| |||||||||||||||
Interest rate contracts | $ | 25 | $ | 36 | $ | - | $ | 61 | ||||||||
Foreign exchange contracts | 4 | - | - | 4 | ||||||||||||
Total | 29 | 36 | - | 65 | ||||||||||||
Not designated as accounting hedges 2 |
| |||||||||||||||
Interest rate contracts | 3,928 | 7,275 | 3,184 | 14,387 | ||||||||||||
Credit contracts | 255 | 105 | - | 360 | ||||||||||||
Foreign exchange contracts | 1,779 | 60 | 10 | 1,849 | ||||||||||||
Equity contracts | 388 | - | 291 | 679 | ||||||||||||
Commodity and other contracts | 69 | - | 84 | 153 | ||||||||||||
Total | 6,419 | 7,440 | 3,569 | 17,428 | ||||||||||||
Total gross derivatives | $ | 6,448 | $ | 7,476 | $ | 3,569 | $ | 17,493 | ||||||||
| Liabilities | ||||||||||||||||
$ in billions | Bilateral OTC | Cleared OTC | Exchange- Traded | Total | ||||||||||||
Designated as accounting hedges |
| |||||||||||||||
Interest rate contracts | $ | 2 | $ | 95 | $ | - | $ | 97 | ||||||||
Foreign exchange contracts | 5 | 1 | - | 6 | ||||||||||||
Total | 7 | 96 | - | 103 | ||||||||||||
Not designated as accounting hedges 2 |
| |||||||||||||||
Interest rate contracts | 3,671 | 5,901 | 1,236 | 10,808 | ||||||||||||
Credit contracts | 287 | 87 | - | 374 | ||||||||||||
Foreign exchange contracts | 1,869 | 62 | 23 | 1,954 | ||||||||||||
Equity contracts | 378 | - | 347 | 725 | ||||||||||||
Commodity and other contracts | 76 | - | 69 | 145 | ||||||||||||
Total | 6,281 | 6,050 | 1,675 | 14,006 | ||||||||||||
Total gross derivatives | $ | 6,288 | $ | 6,146 | $ | 1,675 | $ | 14,109 | ||||||||
At December 31, 2016
| Assets | ||||||||||||||||
$ in billions | Bilateral OTC | Cleared OTC | Exchange- Traded | Total | ||||||||||||
Designated as accounting hedges |
| |||||||||||||||
Interest rate contracts | $ | 30 | $ | 38 | $ | - | $ | 68 | ||||||||
Foreign exchange contracts | 6 | - | - | 6 | ||||||||||||
Total | 36 | 38 | - | 74 | ||||||||||||
Not designated as accounting hedges 5 |
| |||||||||||||||
Interest rate contracts | 3,586 | 6,224 | 2,586 | 12,396 | ||||||||||||
Credit contracts | 333 | 112 | - | 445 | ||||||||||||
Foreign exchange contracts | 1,580 | 52 | 13 | 1,645 | ||||||||||||
Equity contracts | 338 | - | 242 | 580 | ||||||||||||
Commodity and other contracts | 67 | - | 79 | 146 | ||||||||||||
Total | 5,904 | 6,388 | 2,920 | 15,212 | ||||||||||||
Total gross derivatives | $ | 5,940 | $ | 6,426 | $ | 2,920 | $ | 15,286 | ||||||||
| Liabilities | ||||||||||||||||
$ in billions | Bilateral OTC | Cleared OTC | Exchange- Traded | Total | ||||||||||||
Designated as accounting hedges |
| |||||||||||||||
Interest rate contracts | $ | 2 | $ | 52 | $ | - | $ | 54 | ||||||||
Foreign exchange contracts | 1 | 1 | - | 2 | ||||||||||||
Total | 3 | 53 | - | 56 | ||||||||||||
Not designated as accounting hedges 5 |
| |||||||||||||||
Interest rate contracts | 3,462 | 6,087 | 897 | 10,446 | ||||||||||||
Credit contracts | 359 | 96 | - | 455 | ||||||||||||
Foreign exchange contracts | 1,557 | 48 | 14 | 1,619 | ||||||||||||
Equity contracts | 321 | - | 273 | 594 | ||||||||||||
Commodity and other contracts | 78 | - | 59 | 137 | ||||||||||||
Total | 5,777 | 6,231 | 1,243 | 13,251 | ||||||||||||
Total gross derivatives | $ | 5,780 | $ | 6,284 | $ | 1,243 | $ | 13,307 | ||||||||
OTC-Over–the-counter
| 1. | Effective in the first quarter of 2017, the Chicago Mercantile Exchange ("CME") amended its rulebook for cleared OTC derivatives, resulting in the characterization of variation margin transfers as settlement payments as opposed to cash posted as collateral. In the quarter of adoption, the cleared OTC gross derivative assets and liabilities, and related counterparty and cash collateral netting amounts in total decreased by approximately $13 billion and $20 billion, respectively. |
| 2. | Notional amounts include gross notionals related to open long and short futures contracts of $2,765 billion and $732 billion, respectively. The unsettled fair value on these futures contracts (excluded from this table) of $852 million and $425 million is included in Customer and other receivables and Customer and other payables, respectively, in the consolidated balance sheets. |
| 3. | Amounts relate to master netting agreements and collateral agreements that have been determined by the Firm to be legally enforceable in the event of default but where certain other criteria are not met in accordance with applicable offsetting accounting guidance. |
| 63 | June 2017 Form 10-Q |
Notes to Consolidated Financial Statements (Unaudited) | |
| 4. | Amounts include transactions that are either not subject to master netting agreements or collateral agreements or are subject to such agreements but the Firm has not determined the agreements to be legally enforceable as follows: $3.3 billion of derivative assets and $3.5 billion of derivative liabilities at June 30, 2017 and $3.7 billion of derivative assets and $3.5 billion of derivative liabilities at December 31, 2016. |
| 5. | Notional amounts include gross notionals related to open long and short futures contracts of $2,088 billion and $332 billion, respectively. The unsettled fair value on these futures contracts (excluded from this table) of $784 million and $174 million is included in Customer and other receivables and Customer and other payables, respectively, in the consolidated balance sheets. |
For information related to offsetting of certain collateralized transactions, see Note 6. For a discussion of the Firm's derivative instruments and hedging activities, see Note 4 to the consolidated financial statements in the 2016 Form 10-K.
Gains (Losses) on Fair Value Hedges
| Recognized in Interest Expense | ||||||||||||||||
| Three Months Ended June 30, | Six Months Ended June 30, | |||||||||||||||
| $ in millions | 2017 | 2016 | 2017 | 2016 | ||||||||||||
Derivatives | $ 138 | $ 969 | $ (660) | $ | 3,119 | |||||||||||
Borrowings | (213 | ) | (993 | ) | 495 | (3,282) | ||||||||||
Total | $ | (75 | ) | $ | (24 | ) | $ (165) | $ | (163) | |||||||
Gains (Losses) on Net Investment Hedges
| Three Months Ended June 30, | Six Months Ended June 30, | |||||||||||||||
| $ in millions | 2017 | 2016 | 2017 | 2016 | ||||||||||||
Foreign exchange contracts |
| |||||||||||||||
Effective portion-OCI | $ (47) | $ | (112 | ) | $ (251) | $ (336) | ||||||||||
Forward points excluded from hedge effectiveness testing-Interest income | $ (9) | $ | (19 | ) | $ (19) | $ (39) | ||||||||||
Trading Revenues by Product Type
| Three Months Ended June 30, | Six Months Ended June 30, | |||||||||||||||
| $ in millions | 2017 | 2016 | 2017 | 2016 | ||||||||||||
Interest rate contracts | $ | 451 | $ | 320 | $ | 1,045 | $ | 626 | ||||||||
Foreign exchange contracts | 197 | 362 | 432 | 599 | ||||||||||||
Equity security and index contracts 1 | 1,818 | 1,615 | 3,459 | 2,945 | ||||||||||||
Commodity and other contracts | 110 | 20 | 299 | (124) | ||||||||||||
Credit contracts | 355 | 429 | 931 | 765 | ||||||||||||
Total | $ | 2,931 | $ | 2,746 | $ | 6,166 | $ | 4,811 | ||||||||
| 1. | Dividend income is included within equity security and index contracts. |
The previous table summarizes gains and losses included in Trading revenues in the consolidated income statements from trading activities. These activities include revenues related to derivative and non-derivative financial instruments. The Firm generally utilizes financial instruments across a variety of product types in connection with its market-making and related risk management strategies. Accordingly, the trading revenues presented in the previous table are not representative of the manner in which the Firm manages its business activities and are prepared in a manner similar to the presentation of trading revenues for regulatory reporting purposes.
OTC Derivative Products-Trading Assets
Counterparty Credit Rating and Remaining Maturity of OTC Derivative Assets
| Fair Value at June 30, 2017 1 | ||||||||||||||||||||
| Contractual Years to Maturity | Total Derivative Assets | |||||||||||||||||||
| $ in millions | Less than 1 | 1-3 | 3-5 | Over 5 | ||||||||||||||||
Credit Rating 2 |
| |||||||||||||||||||
AAA | $ | 232 | $ | 308 | $ | 406 | $ | 3,168 | $ | 4,114 | ||||||||||
AA | 1,357 | 1,913 | 2,336 | 10,841 | 16,447 | |||||||||||||||
A | 6,487 | 5,123 | 4,342 | 18,625 | 34,577 | |||||||||||||||
BBB | 3,417 | 2,685 | 2,001 | 12,737 | 20,840 | |||||||||||||||
Non-investment grade | 2,753 | 2,104 | 3,070 | 2,247 | 10,174 | |||||||||||||||
Total | $ | 14,246 | $ | 12,133 | $ | 12,155 | $ | 47,618 | $ | 86,152 | ||||||||||
| Fair Value at June 30, 2017 1 | ||||||||||||||||
| $ in millions | Total Derivative Assets | Cross-Maturity and Cash Collateral Netting 3 | Net Amounts Post-cash Collateral | Net Amounts Post- collateral 4 | ||||||||||||
Credit Rating 2 |
| |||||||||||||||
AAA | $ | 4,114 | $ | (3,091 | ) | $ | 1,023 | $ | 952 | |||||||
AA | 16,447 | (10,935 | ) | 5,512 | 2,756 | |||||||||||
A | 34,577 | (25,571 | ) | 9,006 | 5,118 | |||||||||||
BBB | 20,840 | (14,301 | ) | 6,539 | 4,908 | |||||||||||
Non-investment grade | 10,174 | (4,886 | ) | 5,288 | 2,421 | |||||||||||
Total | $ | 86,152 | $ | (58,784 | ) | $ | 27,368 | $ | 16,155 | |||||||
| Fair Value at December 31, 2016 1 | ||||||||||||||||||||
| Contractual Years to Maturity | Total Derivative Assets | |||||||||||||||||||
| $ in millions | Less than 1 | 1-3 | 3-5 | Over 5 | ||||||||||||||||
Credit Rating 2 |
| |||||||||||||||||||
AAA | $ | 150 | $ | 428 | $ | 918 | $ | 2,931 | $ | 4,427 | ||||||||||
AA | 3,177 | 2,383 | 2,942 | 10,194 | 18,696 | |||||||||||||||
A | 9,244 | 6,676 | 5,495 | 21,322 | 42,737 | |||||||||||||||
BBB | 4,423 | 3,085 | 2,434 | 13,023 | 22,965 | |||||||||||||||
Non-investment grade | 2,283 | 1,702 | 1,722 | 1,794 | 7,501 | |||||||||||||||
Total | $ | 19,277 | $ | 14,274 | $ | 13,511 | $ | 49,264 | $ | 96,326 | ||||||||||
| June 2017 Form 10-Q | 64 |
Notes to Consolidated Financial Statements (Unaudited) | |
| Fair Value at December 31, 2016 1 | ||||||||||||||||
| $ in millions | Total Derivative Assets | Cross-Maturity and Cash Collateral Netting 3 | Net Amounts Post-cash Collateral | Net Amounts Post- collateral 4 | ||||||||||||
Credit Rating 2 |
| |||||||||||||||
AAA | $ | 4,427 | $ | (3,900 | ) | $ | 527 | $ | 485 | |||||||
AA | 18,696 | (11,813 | ) | 6,883 | 4,114 | |||||||||||
A | 42,737 | (31,425 | ) | 11,312 | 6,769 | |||||||||||
BBB | 22,965 | (16,629 | ) | 6,336 | 4,852 | |||||||||||
Non-investment grade | 7,501 | (4,131 | ) | 3,370 | 1,915 | |||||||||||
Total | $ | 96,326 | $ | (67,898 | ) | $ | 28,428 | $ | 18,135 | |||||||
| 1. | Fair values shown represent the Firm's net exposure to counterparties related to its OTC derivative products. |
| 2. | Obligor credit ratings are determined internally by the Credit Risk Management Department. |
| 3. | Amounts represent the netting of receivable balances with payable balances for the same counterparty across maturity categories. Receivable and payable balances with the same counterparty in the same maturity category are netted within such maturity category, where appropriate. Cash collateral received is netted on a counterparty basis, provided legal right of offset exists. |
| 4. | Fair value is shown net of collateral received (primarily cash and U.S. government and agency securities). |
Credit Risk-Related Contingencies
In connection with certain OTC trading agreements, the Firm may be required to provide additional collateral or immediately settle any outstanding liability balances with certain counterparties in the event of a credit rating downgrade of the Firm.
The following table presents the aggregate fair value of certain derivative contracts that contain credit risk-related contingent features that are in a net liability position for which the Firm has posted collateral in the normal course of business.
Net Derivative Liabilities and Collateral Posted
$ in millions | At June 30, 2017 | At December 31, 2016 | ||||||
Net derivative liabilities with credit risk-related contingent features | $ | 19,335 | $ | 22,939 | ||||
Collateral posted | 14,672 | 17,040 | ||||||
The additional collateral or termination payments that may be called in the event of a future credit rating downgrade vary by contract and can be based on ratings by either or both of Moody's Investors Service, Inc. ("Moody's") and Standard & Poor's Global Ratings ("S&P"). The following table shows the future potential collateral amounts and termination payments that could be called or required by counterparties or exchange and clearing organizations in the event of one-notch or two-notch downgrade scenarios based on the relevant contractual downgrade triggers.
Incremental Collateral or Termination Payments upon Potential Future Ratings Downgrade
| $ in millions | At June 30, 2017 1 | |
One-notch downgrade | $ 1,042 | |
Two-notch downgrade | 401 |
| 1. | Amounts include $1,187 million related to bilateral arrangements between the Firm and other parties where upon the downgrade of one party, the downgraded party must deliver collateral to the other party. These bilateral downgrade arrangements are used by the Firm to manage the risk of counterparty downgrades. |
Credit Derivatives and Other Credit Contracts
The Firm enters into credit derivatives, principally through credit default swaps, under which it receives or provides protection against the risk of default on a set of debt obligations issued by a specified reference entity or entities. A majority of the Firm's counterparties for these derivatives are banks, broker-dealers, and insurance and other financial institutions.
For further information on credit derivatives and other credit contracts, see Note 4 to the consolidated financial statements in the 2016 Form 10-K.
Protection Sold and Purchased with Credit Default Swaps
| At June 30, 2017 | ||||||||||||||||
| Protection Sold | Protection Purchased | |||||||||||||||
$ in millions | Notional | Fair Value (Asset)/ Liability | Notional | Fair Value (Asset)/ Liability | ||||||||||||
Credit default swaps |
| |||||||||||||||
Single name | $ | 195,821 | $ | (1,274 | ) | $ | 207,973 | $ | 1,613 | |||||||
Index and basket | 131,476 | (48 | ) | 126,594 | (113 | ) | ||||||||||
Tranched index and basket | 23,519 | (408 | ) | 48,605 | 1,163 | |||||||||||
Total | $ | 350,816 | $ | (1,730 | ) | $ | 383,172 | $ | 2,663 | |||||||
Single name and non-tranched index and basket with identical underlying reference obligations | $ | 323,765 | - | $ | 330,349 | - | ||||||||||
| At December 31, 2016 | ||||||||||||||||
| Protection Sold | Protection Purchased | |||||||||||||||
$ in millions | Notional | Fair Value (Asset)/ Liability | Notional | Fair Value (Asset)/ Liability | ||||||||||||
Credit default swaps |
| |||||||||||||||
Single name | $ | 266,918 | $ | (753 | ) | $ | 269,623 | $ | 826 | |||||||
Index and basket | 130,383 | 374 | 122,061 | (481 | ) | |||||||||||
Tranched index and basket | 32,429 | (670 | ) | 78,505 | 1,900 | |||||||||||
Total | $ | 429,730 | $ | (1,049 | ) | $ | 470,189 | $ | 2,245 | |||||||
Single name and non-tranched index and basket with identical underlying reference obligations | $ | 395,536 | - | $ | 389,221 | - | ||||||||||
| 65 | June 2017 Form 10-Q |
Notes to Consolidated Financial Statements (Unaudited) | |
Credit Ratings of Reference Obligation and Maturities of Credit Protection Sold
| At June 30, 2017 | ||||||||||||||||||||||||
| Maximum Potential Payout/Notional | Fair Value (Asset)/ Liability 1 | |||||||||||||||||||||||
| Years to Maturity | ||||||||||||||||||||||||
| $ in millions | Less than 1 | 1-3 | 3-5 | Over 5 | Total | |||||||||||||||||||
Single name credit default swaps 2 | ||||||||||||||||||||||||
Investment grade | $ | 57,174 | $ | 52,949 | $ | 26,353 | $ | 9,523 | $ | 145,999 | $ | (1,397 | ) | |||||||||||
Non-investment grade | 22,379 | 18,958 | 7,465 | 1,020 | 49,822 | 123 | ||||||||||||||||||
Total single name credit default swaps | 79,553 | 71,907 | 33,818 | 10,543 | 195,821 | (1,274 | ) | |||||||||||||||||
Index and basket credit default swaps 2 | ||||||||||||||||||||||||
Investment grade | 26,972 | 14,044 | 48,806 | 7,914 | 97,736 | (999 | ) | |||||||||||||||||
Non-investment grade | 27,129 | 7,037 | 13,807 | 9,286 | 57,259 | 543 | ||||||||||||||||||
Total index and basket credit default swaps | 54,101 | 21,081 | 62,613 | 17,200 | 154,995 | (456 | ) | |||||||||||||||||
Total credit default swaps sold | $ | 133,654 | $ | 92,988 | $ | 96,431 | $ | 27,743 | $ | 350,816 | $ | (1,730 | ) | |||||||||||
Other credit contracts | 27 | - | 13 | 129 | 169 | 4 | ||||||||||||||||||
Total credit derivatives and other credit contracts | $ | 133,681 | $ | 92,988 | $ | 96,444 | $ | 27,872 | $ | 350,985 | $ | (1,726 | ) | |||||||||||
| At December 31, 2016 | ||||||||||||||||||||||||
| Maximum Potential Payout/Notional | Fair Value (Asset)/ Liability 1 | |||||||||||||||||||||||
| Years to Maturity | ||||||||||||||||||||||||
| $ in millions | Less than 1 | 1-3 | 3-5 | Over 5 | Total | |||||||||||||||||||
Single name credit default swaps 2 | ||||||||||||||||||||||||
Investment grade | $ | 79,449 | $ | 70,796 | $ | 34,529 | $ | 10,293 | $ | 195,067 | $ | (1,060 | ) | |||||||||||
Non-investment grade | 34,571 | 25,820 | 10,436 | 1,024 | 71,851 | 307 | ||||||||||||||||||
Total single name credit default swaps | $ | 114,020 | $ | 96,616 | $ | 44,965 | $ | 11,317 | $ | 266,918 | $ | (753 | ) | |||||||||||
Index and basket credit default swaps 2 | ||||||||||||||||||||||||
Investment grade | $ | 26,530 | $ | 21,388 | $ | 35,060 | $ | 9,096 | $ | 92,074 | $ | (846 | ) | |||||||||||
Non-investment grade | 26,135 | 22,983 | 11,759 | 9,861 | 70,738 | 550 | ||||||||||||||||||
Total index and basket credit default swaps | $ | 52,665 | $ | 44,371 | $ | 46,819 | $ | 18,957 | $ | 162,812 | $ | (296 | ) | |||||||||||
Total credit default swaps sold | $ | 166,685 | $ | 140,987 | $ | 91,784 | $ | 30,274 | $ | 429,730 | $ | (1,049 | ) | |||||||||||
Other credit contracts | 49 | 6 | - | 215 | 270 | - | ||||||||||||||||||
Total credit derivatives and other credit contracts | $ | 166,734 | $ | 140,993 | $ | 91,784 | $ | 30,489 | $ | 430,000 | $ | (1,049 | ) | |||||||||||
| 1. | Fair value amounts are shown on a gross basis prior to cash collateral or counterparty netting. |
| 2. | In order to provide an indication of the current payment status or performance risk of the CDS, a breakdown of CDS based on the Firm's internal credit ratings by investment grade and non-investment grade is provided. Internal credit ratings serve as the Credit Risk Management Department's assessment of credit risk and the basis for a comprehensive credit limits framework used to control credit risk. The Firm uses quantitative models and judgment to estimate the various risk parameters related to each obligor. |
| June 2017 Form 10-Q | 66 |
Notes to Consolidated Financial Statements (Unaudited) | |
5. Investment Securities
The following tables present information about the Firm's AFS securities, which are carried at fair value, and HTM securities, which are carried at amortized cost. The net unrealized gains or losses on AFS securities are reported on an after-tax basis as a component of AOCI.
AFS and HTM Securities
At June 30, 2017 | ||||||||||||||||
| $ in millions | Amortized Cost | Gross Unrealized Gains | Gross Unrealized Losses | Fair Value | ||||||||||||
AFS debt securities | ||||||||||||||||
U.S. government and agency securities: | ||||||||||||||||
U.S. Treasury securities | $ | 21,580 | $ | - | $ | 417 | $ | 21,163 | ||||||||
U.S. agency securities 1 | 21,714 | 36 | 200 | 21,550 | ||||||||||||
Total U.S. government and agency securities | 43,294 | 36 | 617 | 42,713 | ||||||||||||
Corporate and other debt: | ||||||||||||||||
Commercial mortgage-backed securities: | ||||||||||||||||
Agency | 1,536 | 2 | 42 | 1,496 | ||||||||||||
Non-agency | 1,578 | 11 | 9 | 1,580 | ||||||||||||
Corporate bonds | 1,586 | 13 | 8 | 1,591 | ||||||||||||
Collateralized loan obligations | 560 | 1 | - | 561 | ||||||||||||
FFELP student loan asset-backed securities 2 | 2,549 | 7 | 15 | 2,541 | ||||||||||||
| Total corporate and other debt | 7,809 | 34 | 74 | 7,769 | ||||||||||||
Total AFS debt securities | 51,103 | 70 | 691 | 50,482 | ||||||||||||
AFS equity securities | 15 | - | 9 | 6 | ||||||||||||
Total AFS securities | 51,118 | 70 | 700 | 50,488 | ||||||||||||
HTM securities | ||||||||||||||||
U.S. government securities: | ||||||||||||||||
U.S. Treasury securities | 8,463 | 9 | 216 | 8,256 | ||||||||||||
U.S. agency securities 1 | 12,501 | 10 | 193 | 12,318 | ||||||||||||
Total U.S. government and agency securities | 20,964 | 19 | 409 | 20,574 | ||||||||||||
Corporate and other debt: | ||||||||||||||||
Commercial mortgage-backed securities: | ||||||||||||||||
Non-agency | 124 | - | 1 | 123 | ||||||||||||
Total corporate and other debt | 124 | - | 1 | 123 | ||||||||||||
Total HTM securities | 21,088 | 19 | 410 | 20,697 | ||||||||||||
Total Investment securities | $ | 72,206 | $ | 89 | $ | 1,110 | $ | 71,185 | ||||||||
| At December 31, 2016 | ||||||||||||||||
| $ in millions | Amortized Cost | Gross Unrealized Gains | Gross Unrealized Losses | Fair Value | ||||||||||||
AFS debt securities | ||||||||||||||||
U.S. government and agency securities: | ||||||||||||||||
U.S. Treasury securities | $ | 28,371 | $ | 1 | $ | 545 | $ | 27,827 | ||||||||
U.S. agency securities 1 | 22,348 | 14 | 278 | 22,084 | ||||||||||||
Total U.S. government and agency securities | 50,719 | 15 | 823 | 49,911 | ||||||||||||
Corporate and other debt: | ||||||||||||||||
Commercial mortgage-backed securities: | ||||||||||||||||
Agency | 1,850 | 2 | 44 | 1,808 | ||||||||||||
Non-agency | 2,250 | 11 | 16 | 2,245 | ||||||||||||
Auto loan asset-backed securities | 1,509 | 1 | 1 | 1,509 | ||||||||||||
Corporate bonds | 3,836 | 7 | 22 | 3,821 | ||||||||||||
Collateralized loan obligations | 540 | - | 1 | 539 | ||||||||||||
FFELP student loan asset-backed securities 2 | 3,387 | 5 | 61 | 3,331 | ||||||||||||
Total corporate and other debt | 13,372 | 26 | 145 | 13,253 | ||||||||||||
Total AFS debt securities | 64,091 | 41 | 968 | 63,164 | ||||||||||||
AFS equity securities | 15 | - | 9 | 6 | ||||||||||||
Total AFS securities | 64,106 | 41 | 977 | 63,170 | ||||||||||||
HTM securities | ||||||||||||||||
U.S. government securities: | ||||||||||||||||
U.S. Treasury securities | 5,839 | 1 | 283 | 5,557 | ||||||||||||
U.S. agency securities 1 | 11,083 | 1 | 188 | 10,896 | ||||||||||||
Total HTM securities | 16,922 | 2 | 471 | 16,453 | ||||||||||||
Total Investment securities | $ | 81,028 | $ | 43 | $ | 1,448 | $ | 79,623 | ||||||||
| 1. | U.S. agency securities consist mainly of agency-issued debt, agency mortgage pass-through pool securities and collateralized mortgage obligations. |
| 2. | FFELP-Federal Family Education Loan Program. Amounts are backed by a guarantee from the U.S. Department of Education of at least 95% of the principal balance and interest on such loans. |
| 67 | June 2017 Form 10-Q |
Notes to Consolidated Financial Statements (Unaudited) | |
Investment Securities in an Unrealized Loss Position
| At June 30, 2017 | ||||||||||||||||||||||||
| Less than 12 Months | 12 Months or Longer | Total | ||||||||||||||||||||||
| $ in millions | Fair Value | Gross Unrealized Losses | Fair Value | Gross Unrealized Losses | Fair Value | Gross Unrealized Losses | ||||||||||||||||||
AFS debt securities | ||||||||||||||||||||||||
U.S. government and agency securities: | ||||||||||||||||||||||||
U.S. Treasury securities | $ | 21,163 | $ | 417 | $ | - | $ | - | $ | 21,163 | $ | 417 | ||||||||||||
U.S. agency securities | 11,890 | 199 | 99 | 1 | 11,989 | 200 | ||||||||||||||||||
Total U.S. government and agency securities | 33,053 | 616 | 99 | 1 | 33,152 | 617 | ||||||||||||||||||
Corporate and other debt: | ||||||||||||||||||||||||
Commercial mortgage-backed securities: | ||||||||||||||||||||||||
Agency | 1,063 | 42 | - | - | 1,063 | 42 | ||||||||||||||||||
Non-agency | 370 | 6 | 406 | 3 | 776 | 9 | ||||||||||||||||||
Corporate bonds | 592 | 8 | - | - | 592 | 8 | ||||||||||||||||||
FFELP student loan asset-backed securities | 1,580 | 15 | - | - | 1,580 | 15 | ||||||||||||||||||
Total corporate and other debt | 3,605 | 71 | 406 | 3 | 4,011 | 74 | ||||||||||||||||||
Total AFS debt securities | 36,658 | 687 | 505 | 4 | 37,163 | 691 | ||||||||||||||||||
AFS equity securities | - | - | 6 | 9 | 6 | 9 | ||||||||||||||||||
Total AFS securities | 36,658 | 687 | 511 | 13 | 37,169 | 700 | ||||||||||||||||||
HTM securities | ||||||||||||||||||||||||
U.S. government and agency securities: | ||||||||||||||||||||||||
U.S. Treasury securities | 7,043 | 216 | - | - | 7,043 | 216 | ||||||||||||||||||
U.S. agency securities | 10,573 | 193 | - | - | 10,573 | 193 | ||||||||||||||||||
Total U.S. government and agency securities | 17,616 | 409 | - | - | 17,616 | 409 | ||||||||||||||||||
Corporate and other debt: | ||||||||||||||||||||||||
Non-agency | 91 | 1 | - | - | 91 | 1 | ||||||||||||||||||
Total corporate and other debt | 91 | 1 | - | - | 91 | 1 | ||||||||||||||||||
Total HTM securities | 17,707 | 410 | - | - | 17,707 | 410 | ||||||||||||||||||
Total Investment securities | $ | 54,365 | $ | 1,097 | $ | 511 | $ | 13 | $ | 54,876 | $ | 1,110 | ||||||||||||
| June 2017 Form 10-Q | 68 |
Notes to Consolidated Financial Statements (Unaudited) | |
| At December 31, 2016 | ||||||||||||||||||||||||
| Less than 12 Months | 12 Months or Longer | Total | ||||||||||||||||||||||
| $ in millions | Fair Value | Gross Unrealized Losses | Fair Value | Gross Unrealized Losses | Fair Value | Gross Unrealized Losses | ||||||||||||||||||
AFS debt securities | ||||||||||||||||||||||||
U.S. government and agency securities: | ||||||||||||||||||||||||
U.S. Treasury securities | $ | 25,323 | $ | 545 | $ | - | $ | - | $ | 25,323 | $ | 545 | ||||||||||||
U.S. agency securities | 16,760 | 278 | 125 | - | 16,885 | 278 | ||||||||||||||||||
Total U.S. government and agency securities | 42,083 | 823 | 125 | - | 42,208 | 823 | ||||||||||||||||||
Corporate and other debt: | ||||||||||||||||||||||||
Commercial mortgage-backed securities: | ||||||||||||||||||||||||
Agency | 1,245 | 44 | - | - | 1,245 | 44 | ||||||||||||||||||
Non-agency | 763 | 11 | 594 | 5 | 1,357 | 16 | ||||||||||||||||||
Auto loan asset-backed securities | 659 | 1 | 123 | - | 782 | 1 | ||||||||||||||||||
Corporate bonds | 2,050 | 21 | 142 | 1 | 2,192 | 22 | ||||||||||||||||||
Collateralized loan obligations | 178 | - | 239 | 1 | 417 | 1 | ||||||||||||||||||
FFELP student loan asset-backed securities | 2,612 | 61 | - | - | 2,612 | 61 | ||||||||||||||||||
Total corporate and other debt | 7,507 | 138 | 1,098 | 7 | 8,605 | 145 | ||||||||||||||||||
Total AFS debt securities | 49,590 | 961 | 1,223 | 7 | 50,813 | 968 | ||||||||||||||||||
AFS equity securities | 6 | 9 | - | - | 6 | 9 | ||||||||||||||||||
Total AFS securities | 49,596 | 970 | 1,223 | 7 | 50,819 | 977 | ||||||||||||||||||
HTM securities | ||||||||||||||||||||||||
U.S. government and agency securities: | ||||||||||||||||||||||||
U.S. Treasury securities | 5,057 | 283 | - | - | 5,057 | 283 | ||||||||||||||||||
U.S. agency securities | 10,612 | 188 | - | - | 10,612 | 188 | ||||||||||||||||||
Total HTM securities | 15,669 | 471 | - | - | 15,669 | 471 | ||||||||||||||||||
Total Investment securities | $ | 65,265 | $ | 1,441 | $ | 1,223 | $ | 7 | $ | 66,488 | $ | 1,448 | ||||||||||||
| 69 | June 2017 Form 10-Q |
Notes to Consolidated Financial Statements (Unaudited) | |
As discussed in Note 2 to the consolidated financial statements in the 2016 Form 10-K, AFS and HTM securities with a current fair value less than their amortized cost are analyzed as part of the Firm's ongoing assessment of temporarily versus other-than-temporarily impaired at the individual security level.
The Firm believes there are no securities in an unrealized loss position that are other-than-temporarily-impaired at June 30, 2017 and December 31, 2016 for the reasons discussed herein.
For AFS debt securities, the Firm does not intend to sell the securities and is not likely to be required to sell the securities prior to recovery of amortized cost basis. For AFS and HTM debt securities, the securities have not experienced credit losses as the net unrealized losses reported in the previous table are primarily due to higher interest rates since those securities were purchased.
Additionally, the Firm does not expect to experience a credit loss based on consideration of the relevant information (as discussed in Note 2 to the consolidated financial statements in the 2016 Form 10-K), including for U.S. government and agency securities, the existence of an explicit and implicit guarantee provided by the U.S. government. The risk of credit loss on securities in an unrealized loss position is considered minimal because the Firm's U.S. government and agency securities, as well as asset-backed securities ("ABS"), commercial mortgage-backed securities ("CMBS") and collateralized loan obligations ("CLOs"), are highly rated and because corporate bonds are all investment grade.
For AFS equity securities, the Firm has the intent and ability to hold these securities for a period of time sufficient to allow for any anticipated recovery in market value.
See Note 12 for additional information on securities issued by VIEs, including U.S. agency mortgage-backed securities, non-agency CMBS, auto loan ABS, CLO and FFELP student loan ABS.
Investment Securities by Contractual Maturity
| At June 30, 2017 | ||||||||||||
$ in millions | Amortized Cost | Fair Value | Annualized Average Yield | |||||||||
AFS debt securities | ||||||||||||
U.S. government and agency securities: |
| |||||||||||
U.S. Treasury securities: | ||||||||||||
Due within 1 year | $ | 3,798 | $ | 3,786 | 0.9% | |||||||
After 1 year through 5 years | 13,090 | 12,923 | 1.2% | |||||||||
After 5 years through 10 years | 4,692 | 4,454 | 1.4% | |||||||||
Total | 21,580 | 21,163 | ||||||||||
| At June 30, 2017 | ||||||||||||
$ in millions | Amortized Cost | Fair Value | Annualized Average Yield | |||||||||
U.S. agency securities: | ||||||||||||
Due within 1 year | $ | 539 | $ | 539 | 0.3% | |||||||
After 1 year through 5 years | 3,696 | 3,693 | 0.7% | |||||||||
After 5 years through 10 years | 760 | 762 | 2.0% | |||||||||
After 10 years | 16,719 | 16,556 | 1.8% | |||||||||
Total | 21,714 | 21,550 | ||||||||||
Total U.S. government and agency securities | 43,294 | 42,713 | 1.4% | |||||||||
Corporate and other debt: | ||||||||||||
Commercial mortgage-backed securities: |
| |||||||||||
Agency: | ||||||||||||
Due within 1 year | 49 | 49 | 1.1% | |||||||||
After 1 year through 5 years | 241 | 240 | 1.5% | |||||||||
After 5 years through 10 years | 383 | 385 | 1.2% | |||||||||
After 10 years | 863 | 822 | 1.6% | |||||||||
Total | 1,536 | 1,496 | ||||||||||
Non-agency: | ||||||||||||
After 5 years through 10 years | 36 | 35 | 2.5% | |||||||||
After 10 years | 1,542 | 1,545 | 2.1% | |||||||||
Total | 1,578 | 1,580 | ||||||||||
Corporate bonds: | ||||||||||||
Due within 1 year | 36 | 36 | 1.2% | |||||||||
After 1 year through 5 years | 1,219 | 1,225 | 2.4% | |||||||||
After 5 years through 10 years | 331 | 330 | 2.4% | |||||||||
Total | 1,586 | 1,591 | ||||||||||
Collateralized loan obligations: | ||||||||||||
After 5 years through 10 years | 362 | 362 | 1.5% | |||||||||
After 10 years | 198 | 199 | 2.4% | |||||||||
Total | 560 | 561 | ||||||||||
FFELP student loan asset-backed securities: | ||||||||||||
After 1 year through 5 years | 57 | 56 | 0.8% | |||||||||
After 5 years through 10 years | 536 | 532 | 0.8% | |||||||||
After 10 years | 1,956 | 1,953 | 1.1% | |||||||||
Total | 2,549 | 2,541 | ||||||||||
Total corporate and other debt | 7,809 | 7,769 | 1.6% | |||||||||
Total AFS debt securities | 51,103 | 50,482 | 1.4% | |||||||||
AFS equity securities | 15 | 6 | - % | |||||||||
Total AFS securities | 51,118 | 50,488 | 1.4% | |||||||||
HTM securities | ||||||||||||
U.S. government securities: | ||||||||||||
U.S. Treasury securities: | ||||||||||||
Due within 1 year | 300 | 300 | 0.7% | |||||||||
After 1 year through 5 years | 4,837 | 4,831 | 1.5% | |||||||||
After 5 years through 10 years | 2,599 | 2,472 | 1.6% | |||||||||
After 10 years | 727 | 653 | 2.3% | |||||||||
Total | 8,463 | 8,256 | ||||||||||
U.S. agency securities: | ||||||||||||
After 10 years | 12,501 | 12,318 | 2.4% | |||||||||
Total | 12,501 | 12,318 | ||||||||||
Corporate and other debt: | ||||||||||||
Commercial mortgage-backed securities: |
| |||||||||||
Non-agency: | ||||||||||||
After 1 year through 5 years | 41 | 41 | 3.7% | |||||||||
After 5 years through 10 years | 83 | 82 | 3.8% | |||||||||
Total | 124 | 123 | ||||||||||
Total HTM securities | 21,088 | 20,697 | 2.1% | |||||||||
Total Investment securities | $ | 72,206 | $ | 71,185 | 1.6% | |||||||
| June 2017 Form 10-Q | 70 |
Notes to Consolidated Financial Statements (Unaudited) | |
Gross Realized Gains and Losses on Sales of AFS Securities
| Three Months Ended June 30, | Six Months Ended June 30, | |||||||||||||||
| $ in millions | 2017 | 2016 | 2017 | 2016 | ||||||||||||
Gross realized gains | $ | 23 | $ | 71 | $ | 27 | $ | 85 | ||||||||
Gross realized (losses) | (9 | ) | (1 | ) | (11 | ) | (3 | ) | ||||||||
Total | $ | 14 | $ | 70 | $ | 16 | $ | 82 | ||||||||
Gross realized gains and losses are recognized in Other revenues in the consolidated income statements.
6. Collateralized Transactions
The Firm enters into securities purchased under agreements to resell, securities sold under agreements to repurchase, securities borrowed and securities loaned transactions to, among other things, acquire securities to cover short positions and settle other securities obligations, to accommodate customers' needs and to finance its inventory positions. For further discussion of the Firm's collateralized transactions, see Note 6 to the consolidated financial statements in the 2016 Form 10-K.
Offsetting of Certain Collateralized Transactions
| At June 30, 2017 | ||||||||||||||||||||
$ in millions | Gross Amounts | Amounts Offset | Net Amounts Presented | Amounts Not Offset 1 | Net Amounts | |||||||||||||||
Assets | ||||||||||||||||||||
Securities purchased under agreements to resell | $ | 161,364 | $ | (63,956 | ) | $ | 97,408 | $ | (89,731 | ) | $ | 7,677 | ||||||||
Securities borrowed | 140,136 | (13,414 | ) | 126,722 | (121,668 | ) | 5,054 | |||||||||||||
Liabilities | ||||||||||||||||||||
Securities sold under agreements to repurchase | $ | 114,653 | $ | (63,956 | ) | $ | 50,697 | $ | (44,980 | ) | $ | 5,717 | ||||||||
Securities loaned | 30,276 | (13,414 | ) | 16,862 | (16,632 | ) | 230 | |||||||||||||
Not subject to legally enforceable master netting agreements 2 |
| |||||||||||||||||||
Securities purchased under agreements to resell |
| $ | 7,010 | |||||||||||||||||
Securities borrowed | 1,224 | |||||||||||||||||||
Securities sold under agreements to repurchase |
| 5,222 | ||||||||||||||||||
Securities loaned | 183 | |||||||||||||||||||
| At December 31, 2016 | ||||||||||||||||||||
$ in millions | Gross Amounts | Amounts Offset | Net Amounts Presented | Amounts Not Offset 1 | Net Amounts | |||||||||||||||
Assets | ||||||||||||||||||||
Securities purchased under agreements to resell | $ | 182,888 | $ | (80,933 | ) | $ | 101,955 | $ | (93,365 | ) | $ | 8,590 | ||||||||
Securities borrowed | 129,934 | (4,698 | ) | 125,236 | (118,974 | ) | 6,262 | |||||||||||||
Liabilities | ||||||||||||||||||||
Securities sold under agreements to repurchase | $ | 135,561 | $ | (80,933 | ) | $ | 54,628 | $ | (47,933 | ) | $ | 6,695 | ||||||||
Securities loaned | 20,542 | (4,698 | ) | 15,844 | (15,670 | ) | 174 | |||||||||||||
Not subject to legally enforceable master netting agreements 2 |
| |||||||||||||||||||
Securities purchased under agreements to resell |
| $ | 7,765 | |||||||||||||||||
Securities borrowed | 2,591 | |||||||||||||||||||
Securities sold under agreements to repurchase |
| 6,500 | ||||||||||||||||||
Securities loaned | 154 | |||||||||||||||||||
| 1. | Amounts relate to master netting agreements that have been determined by the Firm to be legally enforceable in the event of default but where certain other criteria are not met in accordance with applicable offsetting accounting guidance. |
| 2. | Represents amounts within Net Amounts related to transactions that are either not subject to master netting agreements or are subject to such agreements but the Firm has not determined the agreements to be legally enforceable. |
For information related to offsetting of derivatives, see Note 4.
Maturities and Collateral Pledged
Gross Secured Financing Balances by Remaining Contractual Maturity
| At June 30, 2017 | ||||||||||||||||||||
$ in millions | Overnight and Open | Less than 30 Days | 30-90 Days | Over 90 Days | Total | |||||||||||||||
Securities sold under agreements to repurchase 1 | $ | 29,403 | $ | 26,884 | $ | 18,896 | $ | 39,470 | $ | 114,653 | ||||||||||
Securities loaned 1 | 16,447 | 1,656 | 1,833 | 10,340 | 30,276 | |||||||||||||||
Gross amount of secured financing included in the offsetting disclosure | $ | 45,850 | $ | 28,540 | $ | 20,729 | $ | 49,810 | $ | 144,929 | ||||||||||
Trading liabilities- Obligation to return securities received as collateral | 21,481 | - | - | - | 21,481 | |||||||||||||||
Total | $ | 67,331 | $ | 28,540 | $ | 20,729 | $ | 49,810 | $ | 166,410 | ||||||||||
| 71 | June 2017 Form 10-Q |
Notes to Consolidated Financial Statements (Unaudited) | |
| At December 31, 2016 | ||||||||||||||||||||
$ in millions | Overnight and Open | Less than 30 Days | 30-90 Days | Over 90 Days | Total | |||||||||||||||
Securities sold under agreements to repurchase 1 | $ | 41,549 | $ | 36,703 | $ | 24,648 | $ | 32,661 | $ | 135,561 | ||||||||||
Securities loaned 1 | 9,487 | 851 | 2,863 | 7,341 | 20,542 | |||||||||||||||
Gross amount of secured financing included in the offsetting disclosure | $ | 51,036 | $ | 37,554 | $ | 27,511 | $ | 40,002 | $ | 156,103 | ||||||||||
Trading liabilities- Obligation to return securities received as collateral | 20,262 | - | - | - | 20,262 | |||||||||||||||
Total | $ | 71,298 | $ | 37,554 | $ | 27,511 | $ | 40,002 | $ | 176,365 | ||||||||||
| 1. | Amounts are presented on a gross basis, prior to netting in the consolidated balance sheets. |
Gross Secured Financing Balances by Class of Collateral Pledged
| $ in millions | At June 30, 2017 | At December 31, 2016 | ||||||
Securities sold under agreements to repurchase 1 |
| |||||||
U.S. government and agency securities | $ | 28,512 | $ | 56,372 | ||||
State and municipal securities | 157 | 1,363 | ||||||
Other sovereign government obligations | 51,498 | 42,790 | ||||||
Asset-backed securities | 1,549 | 1,918 | ||||||
Corporate and other debt | 5,083 | 9,086 | ||||||
Corporate equities | 26,599 | 23,152 | ||||||
Other | 1,255 | 880 | ||||||
Total securities sold under agreements to repurchase | $ | 114,653 | $ | 135,561 | ||||
Securities loaned 1 | ||||||||
Other sovereign government obligations | 13,599 | 4,762 | ||||||
Corporate and other debt | 124 | 73 | ||||||
Corporate equities | 16,375 | 15,693 | ||||||
Other | 178 | 14 | ||||||
Total securities loaned | $ | 30,276 | $ | 20,542 | ||||
Gross amount of secured financing included in the offsetting disclosure | $ | 144,929 | $ | 156,103 | ||||
Trading liabilities-Obligation to return securities received as collateral |
| |||||||
Corporate equities | 21,472 | 20,247 | ||||||
Other | 9 | 15 | ||||||
Total Trading liabilities-Obligation to return securities received as collateral | $ | 21,481 | $ | 20,262 | ||||
Total | $ | 166,410 | $ | 176,365 | ||||
| 1. | Amounts are presented on a gross basis, prior to netting in the consolidated balance sheets. |
Assets Pledged
| $ in millions | At June 30, 2017 | At December 31, 2016 | ||||||
Carrying value of trading assets loaned or pledged 1 | $ | 42,053 | $ | 41,358 | ||||
Carrying value of loans pledged (gross of allowance for loan losses) 1 | 3,876 | - | ||||||
Total | $ | 45,929 | $ | 41,358 | ||||
| 1. | Counterparties do not have the right to sell or repledge the collateral. |
The Firm pledges its trading assets and loans to collateralize securities sold under agreements to repurchase, securities loaned, other secured financings and derivatives. Counterparties may or may not have the right to sell or repledge the collateral.
Pledged financial instruments that can be sold or repledged by the secured party are identified as Trading assets (pledged to various parties) in the consolidated balance sheets. Pledged financial instruments that cannot be sold or repledged by the secured party are shown in the previous table.
Collateral Received
The Firm receives collateral in the form of securities in connection with securities purchased under agreements to resell, securities borrowed, derivative transactions, customer margin loans and securities-based lending. In many cases, the Firm is permitted to sell or repledge these securities held as collateral and use the securities to secure securities sold under agreements to repurchase, to enter into securities lending and derivative transactions or for delivery to counterparties to cover short positions.
The Firm also receives securities as collateral in connection with certain securities-for-securities transactions. In instances where the Firm is the lender and permitted to sell or repledge these securities, it reports the fair value of the collateral received and the related obligation to return the collateral included in Trading assets and Trading liabilities, respectively, in its consolidated balance sheets.
Fair Value of Collateral Received with Right to Sell or Repledge
| $ in millions | At June 30, 2017 | At December 31, 2016 | ||||||
Collateral received with right to sell or repledge | $ | 556,203 | $ | 561,239 | ||||
Collateral that was sold or repledged | 429,029 | 430,911 | ||||||
| June 2017 Form 10-Q | 72 |
Notes to Consolidated Financial Statements (Unaudited) | |
Customer Margin Lending and Other
| $ in millions | At June 30, 2017 | At December 31, 2016 | ||||||
Net customer receivables representing margin loans | $ | 27,744 | $ | 24,359 | ||||
The Firm engages in margin lending to clients that allows the client to borrow against the value of qualifying securities. Margin loans are included within Customer and other receivables in the consolidated balance sheets. Under these agreements and transactions, the Firm receives collateral, including U.S. government and agency securities, other sovereign government obligations, corporate and other debt, and corporate equities. Customer receivables generated from margin lending activities are collateralized by customer-owned securities held by the Firm. The Firm monitors required margin levels and established credit terms daily and, pursuant to such guidelines, requires customers to deposit additional collateral, or reduce positions, when necessary.
For a further discussion of the Firm's margin lending activities, see Note 6 to the consolidated financial statements in the 2016 Form 10-K.
The Firm has additional secured liabilities. For a further discussion of other secured financings, see Note 10.
Cash and Securities Deposited with Clearing Organizations or Segregated
| $ in millions | At June 30, 2017 | At December 31, 2016 | ||||||
Segregated securities 1 | $ | 20,351 | $ | 23,756 | ||||
Other assets-Cash deposited with clearing organizations or segregated under federal and other regulations or requirements | 30,171 | 33,979 | ||||||
Total | $ | 50,522 | $ | 57,735 | ||||
| 1. | Securities segregated under federal regulations for the Firm's U.S. broker-dealers are sourced from Securities purchased under agreements to resell and Trading assets in the consolidated balance sheets. |
7. Loans and Allowance for Credit Losses
Loans
The Firm's loans held for investment are recorded at amortized cost, and its loans held for sale are recorded at the lower of cost or fair value in the consolidated balance sheets. For a further description of these loans, refer to Note 7 to the consolidated financial statements in the 2016 Form 10-K. See Note 3 for further information regarding Loans and lending commitments held at fair value.
Loans Held for Investment and Held for Sale by Loan Type
| At June 30, 2017 | ||||||||||||
| $ in millions | Loans Held for Investment | Loans Held for Sale | Total Loans | |||||||||
Corporate loans | $ | 26,831 | $ | 9,394 | $ | 36,225 | ||||||
Consumer loans | 26,354 | - | 26,354 | |||||||||
Residential real estate loans | 25,646 | 60 | 25,706 | |||||||||
Wholesale real estate loans | 8,482 | 1,178 | 9,660 | |||||||||
Total loans, gross | 87,313 | 10,632 | 97,945 | |||||||||
Allowance for loan losses | (306 | ) | - | (306 | ) | |||||||
Total loans, net | $ | 87,007 | $ | 10,632 | $ | 97,639 | ||||||
| At December 31, 2016 | ||||||||||||
| $ in millions | Loans Held for Investment | Loans Held for Sale | Total Loans | |||||||||
Corporate loans | $ | 25,025 | $ | 10,710 | $ | 35,735 | ||||||
Consumer loans | 24,866 | - | 24,866 | |||||||||
Residential real estate loans | 24,385 | 61 | 24,446 | |||||||||
Wholesale real estate loans | 7,702 | 1,773 | 9,475 | |||||||||
Total loans, gross | 81,978 | 12,544 | 94,522 | |||||||||
Allowance for loan losses | (274 | ) | - | (274 | ) | |||||||
Total loans, net | $ | 81,704 | $ | 12,544 | $ | 94,248 | ||||||
Loans to Non-U.S. Borrowers
| $ in millions | At 2017 | At December 31, 2016 | ||||||
Loans, net of allowance | $ | 8,725 | $ | 9,388 | ||||
Loans by Interest Rate Type
| $ in millions | At 2017 | At December 31, 2016 | ||||||
Fixed | $ | 12,696 | $ | 11,895 | ||||
Floating or adjustable | $ | 84,943 | $ | 82,353 | ||||
Credit Quality
For a further discussion about the Firm's evaluation of credit transactions and monitoring and credit quality indicators, see Note 7 to the consolidated financial statements in the 2016 Form 10-K.
| 73 | June 2017 Form 10-Q |
Notes to Consolidated Financial Statements (Unaudited) | |
Loans Held for Investment before Allowance by Credit Quality
| At June 30, 2017 | ||||||||||||||||||||
$ in millions | Corporate | Consumer | Residential Real Estate | Wholesale Real Estate | Total | |||||||||||||||
Pass | $ | 25,321 | $ | 26,351 | $ | 25,598 | $ | 7,975 | $ | 85,245 | ||||||||||
Special mention | 416 | 3 | - | 192 | 611 | |||||||||||||||
Substandard | 1,025 | - | 48 | 315 | 1,388 | |||||||||||||||
Doubtful | 69 | - | - | - | 69 | |||||||||||||||
Loss | - | - | - | - | - | |||||||||||||||
Total | $ | 26,831 | $ | 26,354 | $ | 25,646 | $ | 8,482 | $ | 87,313 | ||||||||||
| At December 31, 2016 | ||||||||||||||||||||
| $ in millions | Corporate | Consumer | Residential Real Estate | Wholesale Real Estate | Total | |||||||||||||||
Pass | $ | 23,409 | $ | 24,853 | $ | 24,345 | $ | 7,294 | $ | 79,901 | ||||||||||
Special mention | 288 | 13 | - | 218 | 519 | |||||||||||||||
Substandard | 1,259 | - | 40 | 190 | 1,489 | |||||||||||||||
Doubtful | 69 | - | - | - | 69 | |||||||||||||||
Loss | - | - | - | - | - | |||||||||||||||
Total | $ | 25,025 | $ | 24,866 | $ | 24,385 | $ | 7,702 | $ | 81,978 | ||||||||||
Allowance for Credit Losses and Impaired Loans
For factors considered by the Firm in determining the allowance for loan losses and impairments, see Notes 2 and 7 to the consolidated financial statements in the 2016 Form 10-K.
Impaired Loans Before Allowance by Product Type
| At June 30, 2017 | ||||||||||||
| $ in millions | Corporate | Residential Real Estate | Total | |||||||||
With allowance | $ | 141 | $ | - | $ | 141 | ||||||
Without allowance 1 | 122 | 35 | 157 | |||||||||
Unpaid principal balance 2 | 273 | 36 | 309 | |||||||||
| At December 31, 2016 | ||||||||||||
| $ in millions | Corporate | Residential Real Estate | Total | |||||||||
With allowance | $ | 104 | $ | - | $ | 104 | ||||||
Without allowance 1 | 206 | 35 | 241 | |||||||||
Unpaid principal balance 2 | 316 | 38 | 354 | |||||||||
| 1. | At June 30, 2017 and December 31, 2016, no allowance was recorded for these loans as the present value of the expected future cash flows (or, alternatively, the observable market price of the loan or the fair value of the collateral held) equaled or exceeded the carrying value. |
| 2. | The impaired loans unpaid principal balance differs from the aggregate amount of impaired loan balances with and without allowance due to various factors, including charge-offs and net deferred loan fees or costs. |
Select Loan Information by Region
| At June 30, 2017 | ||||||||||||||||
| $ in millions | Americas | EMEA | Asia- Pacific | Total | ||||||||||||
Impaired loans | $ | 279 | $ | 9 | $ | 10 | $ | 298 | ||||||||
Allowance for loan losses | 274 | 30 | 2 | 306 | ||||||||||||
| At December 31, 2016 | ||||||||||||||||
| $ in millions | Americas | EMEA | Asia- Pacific | Total | ||||||||||||
Impaired loans | $ | 320 | $ | 9 | $ | 16 | $ | 345 | ||||||||
Allowance for loan losses | 245 | 28 | 1 | 274 | ||||||||||||
EMEA-Europe, Middle East and Africa
Allowance for Credit Losses on Lending Activities
Loans-Current Year Period
Allowance for Loan Losses Rollforward
| $ in millions | Corporate | Consumer | Residential Real Estate | Wholesale Real Estate | Total | |||||||||||||||
December 31, 2016 | $ | 195 | $ | 4 | $ | 20 | $ | 55 | $ | 274 | ||||||||||
Recoveries | 1 | - | - | - | 1 | |||||||||||||||
Provision for (release of) loan losses 1 | 14 | - | 1 | 14 | 29 | |||||||||||||||
Other | 1 | - | - | 1 | 2 | |||||||||||||||
June 30, 2017 | $ | 211 | $ | 4 | $ | 21 | $ | 70 | $ | 306 | ||||||||||
Loan Loss Allowance by Impairment Methodology
| At June 30, 2017 | ||||||||||||||||||||
| $ in millions | Corporate | Consumer | Residential Real Estate | Wholesale Real Estate | Total | |||||||||||||||
Inherent | $ | 142 | $ | 4 | $ | 21 | $ | 70 | $ | 237 | ||||||||||
Specific | 69 | - | - | - | 69 | |||||||||||||||
Total | $ | 211 | $ | 4 | $ | 21 | $ | 70 | $ | 306 | ||||||||||
Loans by Impairment Methodology 2
| At June 30, 2017 | ||||||||||||||||||||
| $ in millions | Corporate | Consumer | Residential Real Estate | Wholesale Real Estate | Total | |||||||||||||||
Inherent | $ | 26,568 | $ | 26,354 | $ | 25,611 | $ | 8,482 | $ | 87,015 | ||||||||||
Specific | 263 | - | 35 | - | 298 | |||||||||||||||
Total | $ | 26,831 | $ | 26,354 | $ | 25,646 | $ | 8,482 | $ | 87,313 | ||||||||||
| 1. | The Firm recorded provisions of $7 million for loan losses for the current quarter. |
| 2. | Loan balances are gross of the allowance for loan losses. |
| June 2017 Form 10-Q | 74 |
Notes to Consolidated Financial Statements (Unaudited) | |
Loans-Prior Year Period
Allowance for Loan Losses Rollforward
| $ in millions | Corporate | Consumer | Residential Real Estate | Wholesale Real Estate | Total | |||||||||||||||
December 31, 2015 | $ | 166 | $ | 5 | $ | 17 | $ | 37 | $ | 225 | ||||||||||
Provision for (release of) loan losses 1 | 116 | (1 | ) | 1 | 12 | 128 | ||||||||||||||
Other 2 | (30 | ) | - | - | - | (30 | ) | |||||||||||||
June 30, 2016 | $ | 252 | $ | 4 | $ | 18 | $ | 49 | $ | 323 | ||||||||||
Loan Loss Allowance by Impairment Methodology
| At June 30, 2016 | ||||||||||||||||||||
| $ in millions | Corporate | Consumer | Residential Real Estate | Wholesale Real Estate | Total | |||||||||||||||
Inherent | $ | 147 | $ | 4 | $ | 18 | $ | 49 | $ | 218 | ||||||||||
Specific | 105 | - | - | - | 105 | |||||||||||||||
Total | $ | 252 | $ | 4 | $ | 18 | $ | 49 | $ | 323 | ||||||||||
Loans by Impairment Methodology 3
| At June 30, 2016 | ||||||||||||||||||||
| $ in millions | Corporate | Consumer | Residential Real Estate | Wholesale Real Estate | Total | |||||||||||||||
Inherent | $ | 23,604 | $ | 23,337 | $ | 22,638 | $ | 7,415 | $ | 76,994 | ||||||||||
Specific | 582 | - | 30 | - | 612 | |||||||||||||||
June 30, 2016 | $ | 24,186 | $ | 23,337 | $ | 22,668 | $ | 7,415 | $ | 77,606 | ||||||||||
| 1. | The Firm recorded provisions of $16 million for loan losses for the prior year quarter. |
| 2. | Amount includes the impact related to the transfer to loans held for sale and foreign currency translation adjustments. |
| 3. | Loan balances are gross of the allowance for loan losses. |
Commitments-Current Year Period
Allowance for Lending Commitments Rollforward
| $ in millions | Corporate | Consumer | Residential Real Estate | Wholesale Real Estate | Total | |||||||||||||||
December 31, 2016 | $ | 185 | $ | 1 | $ | - | $ | 4 | $ | 190 | ||||||||||
Provision for (release of) lending commitments 1 | (3 | ) | - | - | (1 | ) | (4 | ) | ||||||||||||
June 30, 2017 | $ | 182 | $ | 1 | $ | - | $ | 3 | $ | 186 | ||||||||||
Lending Commitments Allowance by Impairment Methodology
| At June 30, 2017 | ||||||||||||||||||||
| $ in millions | Corporate | Consumer | Residential Real Estate | Wholesale Real Estate | Total | |||||||||||||||
Inherent | $ | 179 | $ | 1 | $ | - | $ | 3 | $ | 183 | ||||||||||
Specific | 3 | - | - | - | 3 | |||||||||||||||
Total | $ | 182 | $ | 1 | $ | - | $ | 3 | $ | 186 | ||||||||||
Lending Commitments by Impairment Methodology 2
| At June 30, 2017 | ||||||||||||||||||||
| $ in millions | Corporate | Consumer | Residential Real Estate | Wholesale Real Estate | Total | |||||||||||||||
Inherent | $ | 62,339 | $ | 6,005 | $ | 346 | $ | 409 | $ | 69,099 | ||||||||||
Specific | 229 | - | - | - | 229 | |||||||||||||||
Total | $ | 62,568 | $ | 6,005 | $ | 346 | $ | 409 | $ | 69,328 | ||||||||||
| 1. | The Firm recorded a release of $7 million for commitments for the current quarter. |
| 2. | Lending commitments are gross of the allowance for lending commitments. |
Commitments-Prior Year Period
Allowance for Lending Commitments Rollforward
| $ in millions | Corporate | Consumer | Residential Real Estate | Wholesale Real Estate | Total | |||||||||||||||
December 31, 2015 | $ | 180 | $ | 1 | $ | - | $ | 4 | $ | 185 | ||||||||||
Provision for lending commitments 1 | 1 | - | - | 2 | 3 | |||||||||||||||
Other | - | (1 | ) | - | - | (1 | ) | |||||||||||||
June 30, 2016 | $ | 181 | $ | - | $ | - | $ | 6 | $ | 187 | ||||||||||
Lending Commitments Allowance by Impairment Methodology
| At June 30, 2016 | ||||||||||||||||||||
| $ in millions | Corporate | Consumer | Residential Real Estate | Wholesale Real Estate | Total | |||||||||||||||
Inherent | $ | 173 | $ | - | $ | - | $ | 6 | $ | 179 | ||||||||||
Specific | 8 | - | - | - | 8 | |||||||||||||||
Total | $ | 181 | $ | - | $ | - | $ | 6 | $ | 187 | ||||||||||
| 75 | June 2017 Form 10-Q |
Notes to Consolidated Financial Statements (Unaudited) | |
Lending Commitments by Impairment Methodology 2
| At June 30, 2016 | ||||||||||||||||||||
| $ in millions | Corporate | Consumer | Residential Real Estate | Wholesale Real Estate | Total | |||||||||||||||
Inherent | $ | 63,120 | $ | 5,264 | $ | 327 | $ | 496 | $ | 69,207 | ||||||||||
Specific | 64 | - | - | - | 64 | |||||||||||||||
Total | $ | 63,184 | $ | 5,264 | $ | 327 | $ | 496 | $ | 69,271 | ||||||||||
| 1. | The Firm recorded a release of $13 million for commitments for the prior year quarter. |
| 2. | Lending commitments are gross of the allowance for lending commitments. |
Troubled Debt Restructurings
Impaired loans and lending commitments classified as held for investment within corporate loans include troubled debt restructurings as shown in the following table.
Troubled Debt Restructurings
| $ in millions | At June 30, 2017 | At December 31, 2016 | ||||||
Loans | $ | 58 | $ | 67 | ||||
Lending commitments | 21 | 14 | ||||||
Allowance for loan losses | 8 | - | ||||||
These restructurings typically include modifications of interest rates, collateral requirements, other loan covenants and payment extensions.
Employee Loans
Employee loans are granted in conjunction with a program established in the Wealth Management business segment to retain and recruit certain employees. These loans are recorded in Customer and other receivables in the consolidated balance sheets. These loans are full recourse, generally require periodic payments and have repayment terms ranging from 1 to 20 years. The Firm establishes an allowance for loan amounts it does not consider recoverable, and the related provision is recorded in Compensation and benefits expense.
Employee Loans
| $ in millions | At June 30, 2017 | At December 31, 2016 | ||||||
Balance | $ | 4,323 | $ | 4,804 | ||||
Allowance for loan losses | (83 | ) | (89 | ) | ||||
Balance, net | $ | 4,240 | $ | 4,715 | ||||
8. Equity Method Investments
Overview
The Firm's investments accounted for under the equity method of accounting (see Note 1 to the consolidated financial statements in the 2016 Form 10-K) are included in Other assets-Other investments in the consolidated balance sheets. Income (loss) from equity method investments is included in Other revenues in the consolidated income statements.
Equity Method Investment Balances
| $ in millions | At June 30, 2017 | At December 31, 2016 | ||||||
Investments | $ | 2,760 | $ | 2,837 | ||||
| Three Months Ended June 30, | Six Months Ended June 30, | |||||||||||||||
| $ in millions | 2017 | 2016 | 2017 | 2016 | ||||||||||||
Income (loss) | $ | (9 | ) | $ | (14 | ) | $ | - | $ | 1 | ||||||
Japanese Securities Joint Venture
Included in the equity method investments is the Firm's 40% voting interest ("40% interest") in Mitsubishi UFJ Morgan Stanley Securities Co., Ltd. ("MUMSS"). Mitsubishi UFJ Financial Group, Inc. ("MUFG") holds a 60% voting interest. The Firm accounts for its equity method investment in MUMSS within the Institutional Securities business segment. The Firm records income from its 40% interest in MUMSS within Other revenues in the consolidated income statements.
| Three Months Ended June 30, | Six Months Ended June 30, | |||||||||||||||
| $ in millions | 2017 | 2016 | 2017 | 2016 | ||||||||||||
Income from investment in MUMSS | $ | 23 | $ | 23 | $ | 71 | $ | 57 | ||||||||
In addition to MUMSS, the Firm held other equity method investments that were not individually significant.
9. Deposits
Deposits
| $ in millions | At June 30, 2017 | At December 31, 2016 | ||||||
Savings and demand deposits | $ | 141,087 | $ | 154,559 | ||||
Time deposits 1 | 3,826 | 1,304 | ||||||
Total 2 | $ | 144,913 | $ | 155,863 | ||||
Deposits subject to FDIC insurance | $ | 120,991 | $ | 127,992 | ||||
Time deposits that equal or exceed the FDIC insurance limit | $ | 2 | $ | 46 | ||||
| June 2017 Form 10-Q | 76 |
Notes to Consolidated Financial Statements (Unaudited) | |
Interest Bearing Deposit Maturities at June 30, 2017
| $ in millions | Savings and Demand Deposits | Time Deposits 1 | ||||||
Demand | $ | 141,047 | $ | - | ||||
2017 | - | 2,925 | ||||||
2018 | - | 672 | ||||||
2019 | - | 105 | ||||||
2021 | - | 8 | ||||||
Thereafter | - | 116 | ||||||
| FDIC-Federal | Deposit Insurance Corporation |
| 1. | Certain time deposit accounts are carried at fair value under the fair value option (see Note 3). |
| 2. | Deposits were primarily held in the U.S. |
The vast majority of deposits in Morgan Stanley Bank, N.A. ("MSBNA") and Morgan Stanley Private Bank, National Association ("MSPBNA") (collectively, "U.S. Bank Subsidiaries") are sourced from Wealth Management customer accounts.
10. Long-Term Borrowings and Other Secured Financings
Long-Term Borrowings
| $ in millions | At June 30, 2017 | At December 31, 2016 | ||||||
Senior | $ | 173,761 | $ | 154,472 | ||||
Subordinated | 10,351 | 10,303 | ||||||
Total | $ | 184,112 | $ | 164,775 | ||||
Weighted average stated maturity, in years | 6.5 | 5.9 | ||||||
During the current year period and prior year period, the Firm issued notes with a principal amount of approximately $33.5 billion and $20.6 billion, respectively, and approximately $17.8 billion and $15.9 billion, respectively, in aggregate long-term borrowings matured or were retired.
Other Secured Financings
Other secured financings include the liabilities related to transfers of financial assets that are accounted for as financings rather than sales, consolidated VIEs where the Firm is deemed to be the primary beneficiary, pledged commodities, certain equity-linked notes and other secured borrowings. These liabilities are generally payable from the cash flows of the related assets accounted for as Trading assets. See Note 12 for further information on Other secured financings related to VIEs and securitization activities.
Other Secured Financings by Original Maturity and Type
| $ in millions | At June 30, 2017 | At December 31, 2016 | ||||||
Secured Financings | ||||||||
Original maturities: | ||||||||
Greater than one year | $ | 11,005 | $ | 9,404 | ||||
One year or less | 4,996 | 1,429 | ||||||
Failed sales 1 | 641 | 285 | ||||||
Total | $ | 16,642 | $ | 11,118 | ||||
| 1. | For more information on failed sales, see Note 12. |
11. Commitments, Guarantees and Contingencies
Commitments
The Firm's commitments are summarized in the following table by years to maturity. Since commitments associated with these instruments may expire unused, the amounts shown do not necessarily reflect the actual future cash funding requirements.
| Years to Maturity at June 30, 2017 | ||||||||||||||||||||
| $ in millions | Less than 1 | 1-3 | 3-5 | Over 5 | Total | |||||||||||||||
Lending: | ||||||||||||||||||||
Corporate 1 | $ | 13,478 | $ | 28,417 | $ | 45,187 | $ | 3,806 | $ | 90,888 | ||||||||||
Consumer | 5,998 | 4 | - | 4 | 6,006 | |||||||||||||||
Residential real estate | 35 | 25 | 84 | 238 | 382 | |||||||||||||||
Wholesale real estate | 232 | 266 | 8 | 67 | 573 | |||||||||||||||
Forward-starting secured financing receivables 2 | 70,023 | - | - | - | 70,023 | |||||||||||||||
Underwriting | 1,024 | - | - | - | 1,024 | |||||||||||||||
Investment activities | 569 | 197 | 22 | 259 | 1,047 | |||||||||||||||
Letters of credit and other financial guarantees | 156 | 1 | 1 | 41 | 199 | |||||||||||||||
Total | $ | 91,515 | $ | 28,910 | $ | 45,302 | $ | 4,415 | $ | 170,142 | ||||||||||
| 1. | Due to the nature of the Firm's obligations under the commitments, these amounts include certain commitments participated to third parties of $6.2 billion. |
| 2. | Represents forward-starting securities purchased under agreements to resell and securities borrowed agreements, of which $59.8 billion settled within three business days. |
For a further description of these commitments, refer to Note 12 to the consolidated financial statements in the 2016 Form 10-K.
| 77 | June 2017 Form 10-Q |
Notes to Consolidated Financial Statements (Unaudited) | |
Guarantees
Obligations under Guarantee Arrangements at June 30, 2017
| Maximum Potential Payout/Notional | ||||||||||||||||||||
| Years to Maturity | ||||||||||||||||||||
| $ in millions | Less than 1 | 1-3 | 3-5 | Over 5 | Total | |||||||||||||||
Credit derivatives | $ | 133,654 | $ | 92,988 | $ | 96,431 | $ | 27,743 | $ | 350,816 | ||||||||||
Other credit contracts | 27 | - | 13 | 129 | 169 | |||||||||||||||
Non-credit derivatives | 1,560,514 | 918,800 | 331,073 | 572,502 | 3,382,889 | |||||||||||||||
Standby letters of credit and other financial guarantees issued 1 | 779 | 856 | 1,147 | 5,153 | 7,935 | |||||||||||||||
Market value guarantees | 39 | 65 | 70 | - | 174 | |||||||||||||||
Liquidity facilities | 3,229 | - | - | - | 3,229 | |||||||||||||||
Whole loan sales guarantees | - | - | 2 | 23,278 | 23,280 | |||||||||||||||
Securitization representations and warranties | - | - | - | 57,547 | 57,547 | |||||||||||||||
General partner guarantees | 34 | 44 | 313 | 13 | 404 | |||||||||||||||
| $ in millions | Carrying Amount (Asset)/ Liability | Collateral/ Recourse | ||||||
Credit derivatives 2 | $ | (1,730 | ) | $ | - | |||
Other credit contracts | 4 | - | ||||||
Non-credit derivatives 2 | 45,076 | - | ||||||
Standby letters of credit and other financial guarantees issued 1 | (186 | ) | 6,560 | |||||
Market value guarantees | 1 | 4 | ||||||
Liquidity facilities | (5 | ) | 5,503 | |||||
Whole loan sales guarantees | 8 | - | ||||||
Securitization representations and warranties | 90 | - | ||||||
General partner guarantees | 44 | - | ||||||
| 1. | These amounts include certain issued standby letters of credit participated to third parties, totaling $0.7 billion of notional and collateral/recourse, due to the nature of the Firm's obligations under these arrangements. |
| 2. | Carrying amounts of derivative contracts are shown on a gross basis prior to cash collateral or counterparty netting. For further information on derivative contracts, see Note 4. |
The Firm also has obligations under certain guarantee arrangements, including contracts and indemnification agreements, that contingently require the Firm to make payments to the guaranteed party based on changes in an underlying measure (such as an interest or foreign exchange rate, security or commodity price, an index, or the occurrence or non-occurrence of a specified event) related to an asset, liability or equity security of a guaranteed party. Also included as guarantees are contracts that contingently require the Firm to make payments to the guaranteed party based on another entity's failure to perform under an agreement, as well as indirect guarantees of the indebtedness of others.
For more information on the nature of the obligation and related business activity for market value guarantees, liquidity facilities, whole loan sales guarantees and general partner guarantees related to certain investment management funds, as well as the other products in the previous table, see Note 12 to the consolidated financial statements in the 2016 Form 10-K.
Other Guarantees and Indemnities
In the normal course of business, the Firm provides guarantees and indemnifications in a variety of transactions. These provisions generally are standard contractual terms. Certain of these guarantees and indemnifications related to indemnities, exchange/clearinghouse member guarantees and merger and acquisition guarantees are described in Note 12 to the consolidated financial statements in the 2016 Form 10-K.
In addition, in the ordinary course of business, the Firm guarantees the debt and/or certain trading obligations (including obligations associated with derivatives, foreign exchange contracts and the settlement of physical commodities) of certain subsidiaries. These guarantees generally are entity or product specific and are required by investors or trading counterparties. The activities of the Firm's subsidiaries covered by these guarantees (including any related debt or trading obligations) are included in the consolidated financial statements.
Finance Subsidiary
The Parent Company fully and unconditionally guarantees the securities issued by Morgan Stanley Finance LLC, a 100%-owned finance subsidiary.
Contingencies
Legal . In the normal course of business, the Firm has been named, from time to time, as a defendant in various legal actions, including arbitrations, class actions and other litiga-
| June 2017 Form 10-Q | 78 |
Notes to Consolidated Financial Statements (Unaudited) | |
tion, arising in connection with its activities as a global diversified financial services institution. Certain of the actual or threatened legal actions include claims for substantial compensatory and/or punitive damages or claims for indeterminate amounts of damages. In some cases, the entities that would otherwise be the primary defendants in such cases are bankrupt or are in financial distress. These actions have included, but are not limited to, residential mortgage and credit-crisis related matters.
Over the last several years, the level of litigation and investigatory activity (both formal and informal) by governmental and self-regulatory agencies has increased materially in the financial services industry. As a result, the Firm expects that it will continue to be the subject of elevated claims for damages and other relief and, while the Firm has identified below any individual proceedings where the Firm believes a material loss to be reasonably possible and reasonably estimable, there can be no assurance that material losses will not be incurred from claims that have not yet been asserted or are not yet determined to be probable or possible and reasonably estimable losses.
The Firm contests liability and/or the amount of damages as appropriate in each pending matter. Where available information indicates that it is probable a liability had been incurred at the date of the consolidated financial statements and the Firm can reasonably estimate the amount of that loss, the Firm accrues the estimated loss by a charge to income.
In many proceedings and investigations, however, it is inherently difficult to determine whether any loss is probable or even possible or to estimate the amount of any loss. In addition, even where a loss is possible or an exposure to loss exists in excess of the liability already accrued with respect to a previously recognized loss contingency, it is not always possible to reasonably estimate the size of the possible loss or range of loss.
For certain legal proceedings and investigations, the Firm cannot reasonably estimate such losses, particularly for proceedings and investigations where the factual record is being developed or contested or where plaintiffs or governmental entities seek substantial or indeterminate damages, restitution, disgorgement or penalties. Numerous issues may need to be resolved, including through potentially lengthy discovery and determination of important factual matters, determination of issues related to class certification and the calculation of damages or other relief, and by addressing novel or unsettled legal questions relevant to the proceedings or investigations in question, before a loss or additional loss or range of loss or additional range of loss can be reasonably estimated for a proceeding or investigation.
For certain other legal proceedings and investigations, the Firm can estimate reasonably possible losses, additional losses, ranges of loss or ranges of additional loss in excess of amounts accrued, but does not believe, based on current knowledge and after consultation with counsel, that such losses will have a material adverse effect on the Firm's consolidated financial statements as a whole, other than the matters referred to in the following paragraphs.
On July 15, 2010, China Development Industrial Bank ("CDIB") filed a complaint against the Firm, styled China Development Industrial Bank v. Morgan Stanley & Co. Incorporated et al ., which is pending in the Supreme Court of the State of New York, New York County ("Supreme Court of NY"). The complaint relates to a $275 million credit default swap referencing the super senior portion of the STACK 2006-1 CDO. The complaint asserts claims for common law fraud, fraudulent inducement and fraudulent concealment and alleges that the Firm misrepresented the risks of the STACK 2006-1 CDO to CDIB, and that the Firm knew that the assets backing the CDO were of poor quality when it entered into the credit default swap with CDIB. The complaint seeks compensatory damages related to the approximately $228 million that CDIB alleges it has already lost under the credit default swap, rescission of CDIB's obligation to pay an additional $12 million, punitive damages, equitable relief, fees and costs. On February 28, 2011, the court denied the Firm's motion to dismiss the complaint. Based on currently available information, the Firm believes it could incur a loss in this action of up to approximately $240 million plus pre- and post-judgment interest, fees and costs.
On August 8, 2012, U.S. Bank, in its capacity as trustee, filed a complaint on behalf of Morgan Stanley Mortgage Loan Trust 2006-14SL, Mortgage Pass-Through Certificates, Series 2006-14SL, Morgan Stanley Mortgage Loan Trust 2007-4SL and Mortgage Pass-Through Certificates, Series 2007-4SL against the Firm styled Morgan Stanley Mortgage Loan Trust 2006-14SL, et al. v. Morgan Stanley Mortgage Capital Holdings LLC, as successor in interest to Morgan Stanley Mortgage Capital Inc ., pending in the Supreme Court of NY. The complaint asserts claims for breach of contract and alleges, among other things, that the loans in the trusts, which had original principal balances of approximately $354 million and $305 million respectively, breached various representations and warranties. The complaint seeks, among other relief, rescission of the mortgage loan purchase agreements underlying the transactions, specific performance and unspecified damages and interest. On August 16, 2013, the court granted in part and denied in part the Firm's motion to dismiss the complaint. On August 16, 2016, the Firm moved for summary judgment and the plaintiffs moved for partial summary judgment. Based on currently available informa-
| 79 | June 2017 Form 10-Q |
Notes to Consolidated Financial Statements (Unaudited) | |
tion, the Firm believes that it could incur a loss in this action of up to approximately $527 million, the total original unpaid balance of the mortgage loans for which the Firm received repurchase demands that it did not repurchase, plus pre- and post-judgment interest, fees and costs, but plaintiff is seeking to expand the number of loans at issue and the possible range of loss could increase.
On May 3, 2013, plaintiffs in Deutsche Zentral-Genossenschaftsbank AG et al. v. Morgan Stanley et al. filed a complaint against the Firm, certain affiliates, and other defendants in the Supreme Court of NY. The complaint alleges that defendants made material misrepresentations and omissions in the sale to plaintiffs of certain mortgage pass-through certificates backed by securitization trusts containing residential mortgage loans. The total amount of certificates allegedly sponsored, underwritten and/or sold by the Firm to plaintiff was approximately $644 million. The complaint alleges causes of action against the Firm for common law fraud, fraudulent concealment, aiding and abetting fraud, negligent misrepresentation, and rescission and seeks, among other things, compensatory and punitive damages. On June 10, 2014, the court granted in part and denied in part the Firm's motion to dismiss the complaint. On June 20, 2017 the Appellate Division, First Department, affirmed the lower court's June 10, 2014 order. On July 28, 2017, the Firm filed a motion for leave to appeal that decision to the New York Court of Appeals. At March 25, 2017, the current unpaid balance of the mortgage pass-through certificates at issue in this action was approximately $237 million, and the certificates had incurred actual losses of approximately $87 million. Based on currently available information, the Firm believes it could incur a loss in this action up to the difference between the $237 million unpaid balance of these certificates (plus any losses incurred) and their fair market value at the time of a judgment against the Firm, or upon sale, plus pre- and post-judgment interest, fees and costs. The Firm may be entitled to be indemnified for some of these losses.
On July 8, 2013, U.S. Bank National Association, in its capacity as trustee, filed a complaint against the Firm styled U.S. Bank National Association, solely in its capacity as Trustee of the Morgan Stanley Mortgage Loan Trust 2007-2AX (MSM 2007-2AX) v. Morgan Stanley Mortgage Capital Holdings LLC, as Successor-by-Merger to Morgan Stanley Mortgage Capital Inc. and GreenPoint Mortgage Fundin g, Inc. , pending in the Supreme Court of NY. The complaint asserts claims for breach of contract and alleges, among other things, that the loans in the trust, which had an original principal balance of approximately $650 million, breached various representations and warranties. The complaint seeks, among other relief, specific performance of the loan breach remedy procedures in the transaction documents, unspecified damages and interest. On August 22,
2013, the Firm filed a motion to dismiss the complaint, which was granted in part and denied in part on November 24, 2014. Based on currently available information, the Firm believes that it could incur a loss in this action of up to approximately $240 million, the total original unpaid balance of the mortgage loans for which the Firm received repurchase demands that it did not repurchase, plus pre- and post-judgment interest, fees and costs, but plaintiff is seeking to expand the number of loans at issue and the possible range of loss could increase.
On December 30, 2013, Wilmington Trust Company, in its capacity as trustee for Morgan Stanley Mortgage Loan Trust 2007-12, filed a complaint against the Firm styled Wilmington Trust Company v. Morgan Stanley Mortgage Capital Holdings LLC et al. , pending in the Supreme Court of NY. The complaint asserts claims for breach of contract and alleges, among other things, that the loans in the trust, which had an original principal balance of approximately $516 million, breached various representations and warranties. The complaint seeks, among other relief, unspecified damages, attorneys' fees, interest and costs. On February 28, 2014, the defendants filed a motion to dismiss the complaint, which was granted in part and denied in part on June 14, 2016. The plaintiff filed a notice of appeal of that order on August 17, 2016, and the appeal was fully briefed on May 5, 2017. On July 11, 2017, the Appellate Division, First Department affirmed in part and reversed in part the trial court's order that granted in part the Firm's motion to dismiss. Based on currently available information, the Firm believes that it could incur a loss in this action of up to approximately $152 million, the total original unpaid balance of the mortgage loans for which the Firm received repurchase demands that it did not repurchase, plus attorney's fees, costs and interest, but plaintiff is seeking to expand the number of loans at issue and the possible range of loss could increase.
On April 28, 2014, Deutsche Bank National Trust Company, in its capacity as trustee for Morgan Stanley Structured Trust I 2007-1, filed a complaint against the Firm styled Deutsche Bank National Trust Company v. Morgan Stanley Mortgage Capital Holdings LLC , pending in the United States District Court for the Southern District of New York. The complaint asserts claims for breach of contract and alleges, among other things, that the loans in the trust, which had an original principal balance of approximately $735 million, breached various representations and warranties. The complaint seeks, among other relief, specific performance of the loan breach remedy procedures in the transaction documents, unspecified compensatory and/or rescissory damages, interest and costs. On April 3, 2015, the court granted in part and denied in part the Firm's motion to dismiss the complaint. On May 8, 2017, the Firm moved for summary judgment. Based on currently available
| June 2017 Form 10-Q | 80 |
Notes to Consolidated Financial Statements (Unaudited) | |
information, the Firm believes that it could incur a loss in this action of up to approximately $292 million, the total original unpaid balance of the mortgage loans for which the Firm received repurchase demands that it did not repurchase, plus pre- and post-judgment interest, fees and costs, but plaintiff is seeking to expand the number of loans at issue and the possible range of loss could increase.
On September 19, 2014, Financial Guaranty Insurance Company ("FGIC") filed a complaint against the Firm in the Supreme Court of NY, styled Financial Guaranty Insurance Company v. Morgan Stanley ABS Capital I Inc. et al. relating to a securitization issued by Basket of Aggregated Residential NIMS 2007-1 Ltd. The complaint asserts claims for breach of contract and alleges, among other things, that the net interest margin securities ("NIMS") in the trust breached various representations and warranties. FGIC issued a financial guaranty policy with respect to certain notes that had an original balance of approximately $475 million. The complaint seeks, among other relief, specific performance of the NIMS breach remedy procedures in the transaction documents, unspecified damages, reimbursement of certain payments made pursuant to the transaction documents, attorneys' fees and interest. On November 24, 2014, the Firm filed a motion to dismiss the complaint, which the court denied on January 19, 2017. On February 24, 2017, the Firm filed a notice of appeal of the court's order. Based on currently available information, the Firm believes that it could incur a loss in this action of up to approximately $126 million, the unpaid balance of these notes, plus pre- and post-judgment interest, fees and costs, as well as claim payments that FGIC has made and will make in the future.
On September 23, 2014, FGIC filed a complaint against the Firm in the Supreme Court of NY styled Financial Guaranty Insurance Company v. Morgan Stanley ABS Capital I Inc. et al . relating to the Morgan Stanley ABS Capital I Inc. Trust 2007-NC4. The complaint asserts claims for breach of contract and fraudulent inducement and alleges, among other things, that the loans in the trust breached various representations and warranties and defendants made untrue statements and material omissions to induce FGIC to issue a financial guaranty policy on certain classes of certificates that had an original balance of approximately $876 million. The complaint seeks, among other relief, specific performance of the loan breach remedy procedures in the transaction documents, compensatory, consequential and punitive damages, attorneys' fees and interest. On January 23, 2017, the court denied the Firm's motion to dismiss the complaint. On February 24, 2017, the Firm filed a notice of appeal of the court's order. Based on currently available information, the Firm believes that it could incur a loss in this action of up to approximately $277 million, the total original unpaid balance of the mortgage loans for which the Firm received repurchase
demands from a certificate holder and FGIC that the Firm did not repurchase, plus pre- and post-judgment interest, fees and costs, as well as claim payments that FGIC has made and will make in the future. In addition, plaintiff is seeking to expand the number of loans at issue and the possible range of loss could increase.
On January 23, 2015, Deutsche Bank National Trust Company, in its capacity as trustee, filed a complaint against the Firm styled Deutsche Bank National Trust Company solely in its capacity as Trustee of the Morgan Stanley ABS Capital I Inc. Trust 2007-NC4 v. Morgan Stanley Mortgage Capital Holdings LLC as Successor-by-Merger to Morgan Stanley Mortgage Capital Inc., and Morgan Stanley ABS Capital I Inc. , pending in the Supreme Court of NY. The complaint asserts claims for breach of contract and alleges, among other things, that the loans in the trust, which had an original principal balance of approximately $1.05 billion, breached various representations and warranties. The complaint seeks, among other relief, specific performance of the loan breach remedy procedures in the transaction documents, compensatory, consequential, rescissory, equitable and punitive damages, attorneys' fees, costs and other related expenses, and interest. On December 11, 2015, the court granted in part and denied in part the Firm's motion to dismiss the complaint. On February 11, 2016, plaintiff filed a notice of appeal of that order, and the appeal was fully briefed on August 19, 2016. Based on currently available information, the Firm believes that it could incur a loss in this action of up to approximately $277 million, the total original unpaid balance of the mortgage loans for which the Firm received repurchase demands from a certificate holder and a monoline insurer that the Firm did not repurchase, plus pre- and post-judgment interest, fees and costs, but plaintiff is seeking to expand the number of loans at issue and the possible range of loss could increase.
In matters styled Case number 15/3637 and Case number 15/4353 , the Dutch Tax Authority ("Dutch Authority") is challenging in the Dutch Tax Tribunal in Amsterdam the prior set-off by the Firm of approximately €124 million (plus accrued interest) of withholding tax credits against the Firm's corporation tax liabilities for the tax years 2007 to 2013. The Dutch Authority alleges that the Firm was not entitled to receive the withholding tax credits on the basis, inter alia, that a Firm subsidiary did not hold legal title to certain securities subject to withholding tax on the relevant dates. The Dutch Authority has also alleged that the Firm failed to provide certain information to the Dutch Authority and keep adequate books and records. The Firm does not agree with these allegations. A hearing regarding this matter has been scheduled on September 19, 2017. Based on currently available information, the Firm believes that it could incur a loss in this action of up to approximately €124 million (plus accrued interest).
| 81 | June 2017 Form 10-Q |
Notes to Consolidated Financial Statements (Unaudited) | |
12. Variable Interest Entities and Securitization Activities
Overview
For a discussion of the Firm's VIEs, the determination and structure of VIEs and securitization activities, see Note 13 to the consolidated financial statements in the 2016 Form 10-K.
Consolidated VIEs
Assets and Liabilities by Type of Activity
| At June 30, 2017 | At December 31, 2016 | |||||||||||||||
$ in millions | VIE Assets | VIE Liabilities | VIE Assets | VIE Liabilities | ||||||||||||
Credit-linked notes | $ | 200 | $ | - | $ | 501 | $ | - | ||||||||
Other structured financings | 426 | 5 | 602 | 10 | ||||||||||||
Asset-backed securitizations 1 | 34 | 22 | 397 | 283 | ||||||||||||
Other 2 | 1,164 | 258 | 910 | 25 | ||||||||||||
Total | $ | 1,824 | $ | 285 | $ | 2,410 | $ | 318 | ||||||||
| 1. | Asset-backed securitizations include transactions backed by residential mortgage loans, commercial mortgage loans and other types of assets, including consumer or commercial assets. The value of assets is determined based on the fair value of the liabilities and the interests owned by the Firm in such VIEs because the fair values for the liabilities and interests owned are more observable. |
| 2. | Other primarily includes certain operating entities, investment funds and structured transactions. |
Assets and Liabilities by Balance Sheet Caption
| $ in millions | At June 30, 2017 | At December 31, 2016 | ||||||
Assets | ||||||||
Cash and due from banks | $ | 87 | $ | 74 | ||||
Trading assets at fair value | 785 | 1,295 | ||||||
Customer and other receivables | 12 | 13 | ||||||
Goodwill | 18 | 18 | ||||||
Intangible assets | 166 | 177 | ||||||
Other assets | 756 | 833 | ||||||
Total | $ | 1,824 | $ | 2,410 | ||||
Liabilities | ||||||||
Other secured financings at fair value | $ | 249 | $ | 289 | ||||
Other liabilities and accrued expenses | 36 | 29 | ||||||
Total | $ | 285 | $ | 318 | ||||
Consolidated VIE assets and liabilities are presented in the previous tables after intercompany eliminations. The assets owned by many consolidated VIEs cannot be removed unilaterally by the Firm and are not generally available to the Firm. The related liabilities issued by many consolidated VIEs are
non-recourse to the Firm. In certain other consolidated VIEs, the Firm either has the unilateral right to remove assets or provides additional recourse through derivatives such as total return swaps, guarantees or other forms of involvement.
In general, the Firm's exposure to loss in consolidated VIEs is limited to losses that would be absorbed on the VIE's net assets recognized in its financial statements, net of amounts absorbed by third-party variable interest holders.
Noncontrolling Interests and Additional Maximum Exposure to Losses Related to Consolidated VIEs
| $ in millions | At June 30, 2017 | At December 31, 2016 | ||||||
Noncontrolling interests | $ | 206 | $ | 228 | ||||
Maximum exposure to losses 1 | - | 78 | ||||||
| 1. | Primarily related to certain derivatives, commitments, guarantees and other forms of involvement not recognized in the consolidated financial statements. |
Non-consolidated VIEs
The following tables include all VIEs in which the Firm has determined that its maximum exposure to loss is greater than specific thresholds or meets certain other criteria and exclude exposure to loss from liabilities due to immateriality. Most of the VIEs included in the following tables are sponsored by unrelated parties; the Firm's involvement generally is the result of its secondary market-making activities, securities held in its Investment securities portfolio (see Note 5) and certain investments in funds.
Non-consolidated VIE Assets, Maximum and Carrying Value of Exposure to Loss
| At June 30, 2017 | ||||||||||||||||||||
| $ in millions | MABS | CDO | MTOB | OSF | Other | |||||||||||||||
VIE assets (unpaid principal balance) | $ | 78,818 | $ | 8,598 | $ | 5,337 | $ | 3,526 | $ | 34,823 | ||||||||||
Maximum exposure to loss |
| |||||||||||||||||||
Debt and equity interests | $ | 8,482 | $ | 1,703 | $ | 52 | $ | 1,503 | $ | 5,528 | ||||||||||
Derivative and other contracts | - | - | 3,229 | - | 25 | |||||||||||||||
Commitments, guarantees and other | 805 | 1,468 | - | 174 | 337 | |||||||||||||||
Total | $ | 9,287 | $ | 3,171 | $ | 3,281 | $ | 1,677 | $ | 5,890 | ||||||||||
Carrying value of exposure to loss-Assets |
| |||||||||||||||||||
Debt and equity interests | $ | 8,482 | $ | 1,703 | $ | 52 | $ | 1,098 | $ | 5,528 | ||||||||||
Derivative and other contracts | - | - | 5 | - | 52 | |||||||||||||||
Total | $ | 8,482 | $ | 1,703 | $ | 57 | $ | 1,098 | $ | 5,580 | ||||||||||
| June 2017 Form 10-Q | 82 |
Notes to Consolidated Financial Statements (Unaudited) | |
| At December 31, 2016 | ||||||||||||||||||||
| $ in millions | MABS | CDO | MTOB | OSF | Other | |||||||||||||||
VIE assets (unpaid principal balance) | $ | 101,916 | $ | 11,341 | $ | 4,857 | $ | 4,293 | $ | 39,077 | ||||||||||
Maximum exposure to loss |
| |||||||||||||||||||
Debt and equity interests | $ | 11,243 | $ | 1,245 | $ | 50 | $ | 1,570 | $ | 4,877 | ||||||||||
Derivative and other contracts | - | - | 2,812 | - | 45 | |||||||||||||||
Commitments, guarantees and other | 684 | 99 | - | 187 | 228 | |||||||||||||||
Total | $ | 11,927 | $ | 1,344 | $ | 2,862 | $ | 1,757 | $ | 5,150 | ||||||||||
Carrying value of exposure to loss-Assets |
| |||||||||||||||||||
Debt and equity interests | $ | 11,243 | $ | 1,245 | $ | 49 | $ | 1,183 | $ | 4,877 | ||||||||||
Derivative and other contracts | - | - | 5 | - | 18 | |||||||||||||||
Total | $ | 11,243 | $ | 1,245 | $ | 54 | $ | 1,183 | $ | 4,895 | ||||||||||
MABS-Mortgage- and asset-backed securitizations
CDO-Collateralized debt obligations, including collateralized loan obligations
MTOB-Municipal tender option bonds
OSF-Other structured financings
Non-consolidated VIE Mortgage- and Asset-Backed Securitization Assets
| At June 30, 2017 | At December 31, 2016 | |||||||||||||||
| $ in millions | Unpaid Principal Balance | Debt and Equity Interests | Unpaid Principal Balance | Debt and Equity Interests | ||||||||||||
Residential mortgages | $ | 9,106 | $ | 524 | $ | 4,775 | $ | 458 | ||||||||
Commercial mortgages | 49,504 | 2,614 | 54,021 | 2,656 | ||||||||||||
U.S. agency collateralized mortgage obligations | 13,243 | 2,745 | 14,796 | 2,758 | ||||||||||||
Other consumer or commercial loans | 6,965 | 2,599 | 28,324 | 5,371 | ||||||||||||
Total | $ | 78,818 | $ | 8,482 | $ | 101,916 | $ | 11,243 | ||||||||
The Firm's maximum exposure to loss presented above often differs from the carrying value of the variable interests held by the Firm. The maximum exposure to loss presented above is dependent on the nature of the Firm's variable interest in the VIEs and is limited to the notional amounts of certain liquidity facilities, other credit support, total return swaps, written put options, and the fair value of certain other derivatives and investments the Firm has made in the VIEs. Liabilities issued by VIEs generally are non-recourse to the Firm. Where notional amounts are utilized in quantifying the maximum exposure related to derivatives, such amounts do not reflect fair value write-downs already recorded by the Firm.
The Firm's maximum exposure to loss presented above does not include the offsetting benefit of any financial instruments that the Firm may utilize to hedge these risks associated with its variable interests. In addition, the Firm's maximum exposure to loss presented above is not reduced by the amount of collateral held as part of a transaction with the VIE or any party to the VIE directly against a specific exposure to loss.
Securitization transactions generally involve VIEs. Primarily as a result of its secondary market-making activities, the Firm owned additional VIE assets mainly issued by securitization SPEs for which the maximum exposure to loss is less than specific thresholds. These additional assets totaled $11.9 billion and $11.7 billion at June 30, 2017 and December 31, 2016, respectively.
These assets were either retained in connection with transfers of assets by the Firm, acquired in connection with secondary market-making activities, held as AFS securities in its Investment securities portfolio (see Note 5), or held as investments in funds. At June 30, 2017 and December 31, 2016, these assets consisted of securities backed by residential mortgage loans, commercial mortgage loans or other consumer loans, such as credit card receivables, automobile loans and student loans, CDOs or CLOs, and investment funds.
The Firm's primary risk exposure is to the securities issued by the SPE owned by the Firm, with the highest risk on the most subordinate class of beneficial interests. These assets generally are included in Trading assets-Corporate and other debt, Trading assets-Investments or AFS securities within its Investment securities portfolio and are measured at fair value (see Note 3). The Firm does not provide additional support in these transactions through contractual facilities, such as liquidity facilities, guarantees or similar derivatives. The Firm's maximum exposure to loss generally equals the fair value of the assets owned.
| 83 | June 2017 Form 10-Q |
Notes to Consolidated Financial Statements (Unaudited) | |
Transactions with SPEs in which the Firm, acting as principal, transferred financial assets with continuing involvement and received sales treatment are shown in the following tables.
Transfers of Assets with Continuing Involvement
| At June 30, 2017 | ||||||||||||||||
| $ in millions | Residential Mortgage Loans | Commercial Mortgage Loans | U.S. Agency Collateralized Mortgage Obligations | Credit- Linked Notes and Other 1 | ||||||||||||
SPE assets (unpaid principal balance) 2 | $ | 17,692 | $ | 53,764 | $ | 12,337 | $ | 11,831 | ||||||||
Retained interests |
| |||||||||||||||
Investment grade 3 | $ | - | $ | 140 | $ | 710 | $ | 5 | ||||||||
Non-investment grade (fair value) | 3 | 86 | - | 643 | ||||||||||||
Total | $ | 3 | $ | 226 | $ | 710 | $ | 648 | ||||||||
Interests purchased in the secondary market (fair value) |
| |||||||||||||||
Investment grade | $ | 4 | $ | 92 | $ | 66 | $ | - | ||||||||
Non-investment grade | 17 | 71 | - | - | ||||||||||||
Total | $ | 21 | $ | 163 | $ | 66 | $ | - | ||||||||
Derivative assets (fair value) | $ | 1 | $ | - | $ | - | $ | 32 | ||||||||
Derivative liabilities (fair value) | - | - | - | 307 | ||||||||||||
| At December 31, 2016 | ||||||||||||||||
| $ in millions | Residential Mortgage Loans | Commercial Mortgage Loans | U.S. Agency Collateralized Mortgage Obligations | Credit- Linked Notes and Other 1 | ||||||||||||
SPE assets (unpaid principal balance) 2 | $ | 19,381 | $ | 43,104 | $ | 11,092 | $ | 11,613 | ||||||||
Retained interests (fair value) |
| |||||||||||||||
Investment grade | $ | - | $ | 22 | $ | 375 | $ | - | ||||||||
Non-investment grade | 4 | 79 | - | 826 | ||||||||||||
Total | $ | 4 | $ | 101 | $ | 375 | $ | 826 | ||||||||
Interests purchased in the secondary market (fair value) |
| |||||||||||||||
Investment grade | $ | - | $ | 30 | $ | 26 | $ | - | ||||||||
Non-investment grade | 23 | 75 | - | - | ||||||||||||
Total | $ | 23 | $ | 105 | $ | 26 | $ | - | ||||||||
Derivative assets (fair value) | $ | - | $ | 261 | $ | - | $ | 89 | ||||||||
Derivative liabilities (fair value) | - | - | - | 459 | ||||||||||||
| 1. | Amounts include CLO transactions managed by unrelated third parties. |
| 2. | Amounts include assets transferred by unrelated transferors. |
| 3. | Amounts include $734 million of investment grade retained interests at fair value. |
| At June 30, 2017 | ||||||||||||
| $ in millions | Level 2 | Level 3 | Total | |||||||||
Retained interests (fair value) | ||||||||||||
Investment grade | $ | 729 | $ | 5 | $ | 734 | ||||||
Non-investment grade | 4 | 728 | 732 | |||||||||
Total | $ | 733 | $ | 733 | $ | 1,466 | ||||||
Interests purchased in the secondary market (fair value) |
| |||||||||||
Investment grade | $ | 155 | $ | 7 | $ | 162 | ||||||
Non-investment grade | 75 | 13 | 88 | |||||||||
Total | $ | 230 | $ | 20 | $ | 250 | ||||||
Derivative assets (fair value) | $ | 33 | $ | - | $ | 33 | ||||||
Derivative liabilities (fair value) | 131 | 176 | 307 | |||||||||
| At December 31, 2016 | ||||||||||||
| $ in millions | Level 2 | Level 3 | Total | |||||||||
Retained interests (fair value) | ||||||||||||
Investment grade | $ | 385 | $ | 12 | $ | 397 | ||||||
Non-investment grade | 14 | 895 | 909 | |||||||||
Total | $ | 399 | $ | 907 | $ | 1,306 | ||||||
Interests purchased in the secondary market (fair value) |
| |||||||||||
Investment grade | $ | 56 | $ | - | $ | 56 | ||||||
Non-investment grade | 84 | 14 | 98 | |||||||||
Total | $ | 140 | $ | 14 | $ | 154 | ||||||
Derivative assets (fair value) | $ | 348 | $ | 2 | $ | 350 | ||||||
Derivative liabilities (fair value) | 98 | 361 | 459 | |||||||||
Transferred assets are carried at fair value prior to securitization, and any changes in fair value are recognized in the consolidated income statements. The Firm may act as underwriter of the beneficial interests issued by these securitization vehicles. Investment banking underwriting net revenues are recognized in connection with these transactions. The Firm may retain interests in the securitized financial assets as one or more tranches of the securitization. These retained interests are generally carried at fair value in the consolidated balance sheets with changes in fair value recognized in the consolidated income statements.
Proceeds from New Securitization Transactions and Sales of Loans
| Three Months Ended June 30, | Six Months Ended June 30, | |||||||||||||||
| $ in millions | 2017 | 2016 | 2017 | 2016 | ||||||||||||
New transactions 1 | $ | 4,750 | $ | 4,163 | $ | 10,747 | $ | 6,876 | ||||||||
Retained interests | 529 | 502 | 959 | 1,133 | ||||||||||||
Sales of corporate loans to CLO SPEs 1,2 | 239 | - | 418 | 31 | ||||||||||||
| 1. | Net gains on new transactions and sales of corporate loans to CLO entities at the time of the sale were not material for all periods presented. |
| 2. | Sponsored by non-affiliates. |
The Firm has provided, or otherwise agreed to be responsible for, representations and warranties regarding certain assets transferred in securitization transactions sponsored by the Firm (see Note 11).
| June 2017 Form 10-Q | 84 |
Notes to Consolidated Financial Statements (Unaudited) | |
The Firm also enters into transactions in which it sells equity securities and contemporaneously enters into bilateral OTC equity derivatives with the purchasers of the securities, through which it retains the exposure to the securities as shown in the following table.
Carrying and Fair Value of Assets Sold and Retained Interest Exposure
| $ in millions | At June 30, 2017 | At December 31, 2016 | ||||||
Carrying value of assets derecognized at the time of sale and gross cash proceeds | $ | 14,817 | $ | 11,209 | ||||
Fair value | ||||||||
Assets sold | 14,710 | 11,301 | ||||||
Derivative assets recognized in the consolidated balance sheets | 33 | 128 | ||||||
Derivative liabilities recognized in the consolidated balance sheets | 140 | 36 | ||||||
Failed Sales
For transfers that fail to meet the accounting criteria for a sale, the Firm continues to recognize the assets in Trading assets at fair value, and the Firm recognizes the associated liabilities in Other secured financings at fair value in the consolidated balance sheets (see Note 10).
The assets transferred to certain unconsolidated VIEs in transactions accounted for as failed sales cannot be removed unilaterally by the Firm and are not generally available to the Firm. The related liabilities are also non-recourse to the Firm. In certain other failed sale transactions, the Firm has the right to remove assets or provides additional recourse through derivatives such as total return swaps, guarantees or other forms of involvement.
Carrying Value of Assets and Liabilities Related to Failed Sales
At June 30, 2017 | At December 31, 2016 | |||||||||||||||
| $ in millions | Assets | Liabilities | Assets | Liabilities | ||||||||||||
Failed sales | $ | 641 | $ | 641 | $ | 285 | $ | 285 | ||||||||
13. Regulatory Requirements
Regulatory Capital Framework
For a discussion of the Firm's regulatory capital framework, see Note 14 to the consolidated financial statements in the 2016 Form 10-K.
Regulatory Capital Requirements
The Firm is required to maintain minimum risk-based and leverage capital ratios under the regulatory capital requirements. A summary of the calculations of regulatory capital,
risk-weighted assets ("RWAs") and transition provisions follows.
Regulatory Capital
The Firm's binding risk-based capital ratios for regulatory purposes are the lower of the capital ratios computed under the (i) standardized approaches for calculating credit risk RWAs and market risk RWAs (the "Standardized Approach") and (ii) applicable advanced approaches for calculating credit risk, market risk and operational risk RWAs (the "Advanced Approach").
Minimum risk-based capital ratio requirements apply to Common Equity Tier 1 capital, Tier 1 capital and Total capital. Certain adjustments to and deductions from capital are required for purposes of determining these ratios, such as goodwill, intangible assets, certain deferred tax assets, other amounts in AOCI and investments in the capital instruments of unconsolidated financial institutions. Certain of these adjustments and deductions are also subject to transitional provisions.
In addition to the minimum risk-based capital ratio requirements, on a fully phased-in basis by 2019, the Firm will be subject to:
| • | A greater than 2.5% Common Equity Tier 1 capital conservation buffer; |
| • | The Common Equity Tier 1 global systemically important bank capital surcharge, currently at 3%; and |
| • | Up to a 2.5% Common Equity Tier 1 countercyclical capital buffer, currently set by U.S. banking regulators at zero (collectively, the "buffers"). |
In 2017, the phase-in amount for each of the buffers is 50% of the fully phased-in buffer requirement. Failure to maintain the buffers will result in restrictions on the Firm's ability to make capital distributions, including the payment of dividends and the repurchase of stock, and to pay discretionary bonuses to executive officers.
The methods for calculating each of the Firm's risk-based capital ratios will change through January 1, 2022 as aspects of the capital rules are phased in. These changes may result in differences in the Firm's reported capital ratios from one reporting period to the next that are independent of changes to its capital base, asset composition, off-balance sheet exposures or risk profile.
For a further discussion of the Firm's calculation of risk-based capital ratios, see Note 14 to the consolidated financial statements in the 2016 Form 10-K.
| 85 | June 2017 Form 10-Q |
Notes to Consolidated Financial Statements (Unaudited) | |
The Firm's Regulatory Capital and Capital Ratios
At June 30, 2017 and December 31, 2016, the Firm's binding ratios are based on the Advanced Approach transitional rules.
Regulatory Capital
| At June 30, 2017 | ||||||||||||
$ in millions | Amount | Ratio | Minimum Capital Ratio 1 | |||||||||
Common Equity Tier 1 capital | $ | 61,604 | 16.6 | % | 7.3% | |||||||
Tier 1 capital | 70,380 | 19.0 | % | 8.8% | ||||||||
Total capital | 81,025 | 21.9 | % | 10.8% | ||||||||
Tier 1 leverage 2 | - | 8.5 | % | 4.0% | ||||||||
Total RWAs | $ | 370,679 | N/A | N/A | ||||||||
Adjusted average assets 3 | 828,365 | N/A | N/A | |||||||||
| At December 31, 2016 | ||||||||||||
$ in millions | Amount | Ratio | Minimum Capital Ratio 1 | |||||||||
Common Equity Tier 1 capital | $ | 60,398 | 16.9 | % | 5.9% | |||||||
Tier 1 capital | 68,097 | 19.0 | % | 7.4% | ||||||||
Total capital | 78,642 | 22.0 | % | 9.4% | ||||||||
Tier 1 leverage 2 | - | 8.4 | % | 4.0% | ||||||||
Total RWAs | $ | 358,141 | N/A | N/A | ||||||||
Adjusted average assets 3 | 811,402 | N/A | N/A | |||||||||
N/A-Not Applicable
| 1. | Percentages represent minimum regulatory capital ratios under the transitional rules. |
| 2. | Tier 1 leverage ratios are calculated under the Standardized Approach transitional rules. |
| 3. | Adjusted average assets represent the denominator of the Tier 1 leverage ratio and are composed of the average daily balance of consolidated on-balance sheet assets under U.S. GAAP during the calendar quarter ended June 30, 2017 and December 31, 2016, respectively, adjusted for disallowed goodwill, transitional intangible assets, certain deferred tax assets, certain investments in the capital instruments of unconsolidated financial institutions and other adjustments. |
U.S. Bank Subsidiaries' Regulatory Capital and Capital Ratios
The Firm's U.S. Bank Subsidiaries are subject to similar regulatory capital requirements as the Firm. Failure to meet minimum capital requirements can initiate certain mandatory and discretionary actions by regulators that, if undertaken, could have a direct material effect on the U.S. Bank Subsidiaries' financial statements. Under capital adequacy guidelines and the regulatory framework for prompt corrective action, each of the U.S. Bank Subsidiaries must meet specific capital guidelines that involve quantitative measures of its assets, liabilities and certain off-balance sheet items as calculated under regulatory accounting practices.
Each U.S. depository institution subsidiary of the Firm must be well-capitalized in order for the Firm to continue to qualify as a financial holding company and to continue to engage in the broadest range of financial activities permitted
for financial holding companies. Under regulatory capital requirements adopted by the U.S. federal banking agencies, U.S. depository institutions must maintain certain minimum capital ratios in order to be considered well-capitalized. At June 30, 2017 and December 31, 2016, the Firm's U.S. Bank Subsidiaries maintained capital at levels sufficiently in excess of the universally mandated well-capitalized requirements to address any additional capital needs and requirements identified by the U.S. federal banking regulators.
At June 30, 2017 and December 31, 2016, the U.S. Bank Subsidiaries' binding ratios are based on the Standardized Approach transitional rules.
MSBNA's Regulatory Capital
| At June 30, 2017 | ||||||||||||
$ in millions | Amount | Ratio | Minimum Capital Ratio 1 | |||||||||
Common Equity Tier 1 capital | $ | 14,526 | 18.5 | % | 6.5% | |||||||
Tier 1 capital | 14,526 | 18.5 | % | 8.0% | ||||||||
Total capital | 14,807 | 18.9 | % | 10.0% | ||||||||
Tier 1 leverage | 14,526 | 12.0 | % | 5.0% | ||||||||
| At December 31, 2016 | ||||||||||||
$ in millions | Amount | Ratio | Minimum Capital Ratio 1 | |||||||||
Common Equity Tier 1 capital | $ | 13,398 | 16.9 | % | 6.5% | |||||||
Tier 1 capital | 13,398 | 16.9 | % | 8.0% | ||||||||
Total capital | 14,858 | 18.7 | % | 10.0% | ||||||||
Tier 1 leverage | 13,398 | 10.5 | % | 5.0% | ||||||||
| 1. | Capital ratios that are required in order to be considered well-capitalized for U.S. regulatory purposes. |
MSPBNA's Regulatory Capital
| At June 30, 2017 | ||||||||||||
$ in millions | Amount | Ratio | Minimum Capital Ratio 1 | |||||||||
Common Equity Tier 1 capital | $ | 5,898 | 24.8 | % | 6.5% | |||||||
Tier 1 capital | 5,898 | 24.8 | % | 8.0% | ||||||||
Total capital | 5,938 | 25.0 | % | 10.0% | ||||||||
Tier 1 leverage | 5,898 | 10.3 | % | 5.0% | ||||||||
| At December 31, 2016 | ||||||||||||
$ in millions | Amount | Ratio | Minimum Capital Ratio 1 | |||||||||
Common Equity Tier 1 capital | $ | 5,589 | 26.1 | % | 6.5% | |||||||
Tier 1 capital | 5,589 | 26.1 | % | 8.0% | ||||||||
Total capital | 5,626 | 26.3 | % | 10.0% | ||||||||
Tier 1 leverage | 5,589 | 10.6 | % | 5.0% | ||||||||
| 1. | Capital ratios that are required in order to be considered well-capitalized for U.S. regulatory purposes. |
| June 2017 Form 10-Q | 86 |
Notes to Consolidated Financial Statements (Unaudited) | |
U.S. Broker-Dealer Regulatory Capital Requirements
MS&Co. Regulatory Capital
| $ in millions | At June 30, 2017 | At December 31, 2016 | ||||||
Net capital | $ | 10,388 | $ | 10,311 | ||||
Excess net capital | 8,312 | 8,034 | ||||||
Morgan Stanley & Co. LLC ("MS&Co.") is a registered U.S. broker-dealer and registered futures commission merchant and, accordingly, is subject to the minimum net capital requirements of the U.S. Securities and Exchange Commission ("SEC") and the U.S. Commodity Futures Trading Commission ("CFTC"). As an Alternative Net Capital broker-dealer under SEC rules, MS&Co. is subject to minimum net capital requirements, which it exceeded as presented in the previous table. In addition to these requirements, MS&Co. is required to meet capital requirements imposed by Appendix E of Rule 15c3-1, which are presented in the following table. MS&Co. has consistently operated with capital in excess of its regulatory capital requirements.
| $ in millions | At June 30, 2017 | At December 31, 2016 | ||||||
Required tentative net capital 1 | $ | 1,000 | $ | 1,000 | ||||
Required net capital | 500 | 500 | ||||||
| 1. | MS&Co. is required to notify the SEC in the event that its tentative net capital is less than $5 billion. |
At June 30, 2017 and December 31, 2016, MS&Co. had tentative net capital in excess of the minimum and the notification requirements.
MSSB LLC Regulatory Capital
| $ in millions | At June 30, 2017 | At December 31, 2016 | ||||||
Net capital | $ | 2,288 | $ | 3,946 | ||||
Excess net capital | 2,131 | 3,797 | ||||||
Morgan Stanley Smith Barney LLC ("MSSB LLC") is a registered U.S. broker-dealer and introducing broker for the futures business and, accordingly, is subject to the minimum net capital requirements of the SEC. MSSB LLC has consistently operated with capital in excess of its regulatory capital requirements.
Other Regulated Subsidiaries
Morgan Stanley & Co. International plc ("MSIP"), a London-based broker-dealer subsidiary, is subject to the capital requirements of the Prudential Regulation Authority, and Morgan Stanley MUFG Securities Co., Ltd. ("MSMS"), a Tokyo-based broker-dealer subsidiary, is subject to the capital requirements of the Financial Services Agency. MSIP and MSMS have consistently operated with capital in excess of their respective regulatory capital requirements.
Certain other U.S. and non-U.S. subsidiaries of the Firm are subject to various securities, commodities and banking regulations, and capital adequacy requirements promulgated by the regulatory and exchange authorities of the countries in which they operate. These subsidiaries have consistently operated with capital in excess of their local capital adequacy requirements.
14. Total Equity
Dividends and Share Repurchases
The Firm repurchased approximately $500 million of its outstanding common stock as part of the share repurchase program during the current quarter and $1,250 million during the current year period. The Firm repurchased approximately $625 million during the prior year quarter and $1,250 million in the prior year period.
On June 28, 2017, the Board of Governors of the Federal Reserve System (the "Federal Reserve") announced that they did not object to the Firm's 2017 capital plan ("Capital Plan"). The Capital Plan includes the share repurchase of up to $5.0 billion of outstanding common stock for the period beginning July 1, 2017 through June 30, 2018, an increase from $3.5 billion in the 2016 Capital Plan. Additionally, the Capital Plan includes an increase in the quarterly common stock dividend to $0.25 per share from $0.20 per share, beginning with the common stock dividend declared on July 19, 2017.
Preferred Stock
For a description of Series A through Series K preferred stock issuances, see Note 15 to the consolidated financial statements in the 2016 Form 10-K. Dividends declared on the Firm's outstanding preferred stock were $170 million during the current quarter and $156 million during the prior year quarter, and $260 million during the current year period and $234 million during the prior year period. On June 15, 2017, the Firm announced that the Board of Directors (the "Board") declared a quarterly dividend for preferred stock shareholders of record on June 30, 2017 that was paid on July 17, 2017. The Firm is authorized to issue 30 million shares of preferred stock. The preferred stock has a preference over the common stock upon liquidation. The Firm's preferred stock qualifies as Tier 1 capital in accordance with regulatory capital requirements (see Note 13).
Series K Preferred Stock. The Series K Preferred Stock offering (net of related issuance costs) in January 2017 resulted in proceeds of approximately $994 million.
| 87 | June 2017 Form 10-Q |
Notes to Consolidated Financial Statements (Unaudited) | |
Preferred Stock Outstanding
$ in millions, except | Shares Outstanding | Liquidation Preference per Share | Carrying Value | |||||||||||||
| At June 30, 2017 | At June 30, 2017 | At December 31, 2016 | ||||||||||||||
Series | ||||||||||||||||
A | 44,000 | $ | 25,000 | $ | 1,100 | $ | 1,100 | |||||||||
C 1 | 519,882 | 1,000 | 408 | 408 | ||||||||||||
E | 34,500 | 25,000 | 862 | 862 | ||||||||||||
F | 34,000 | 25,000 | 850 | 850 | ||||||||||||
G | 20,000 | 25,000 | 500 | 500 | ||||||||||||
H | 52,000 | 25,000 | 1,300 | 1,300 | ||||||||||||
I | 40,000 | 25,000 | 1,000 | 1,000 | ||||||||||||
J | 60,000 | 25,000 | 1,500 | 1,500 | ||||||||||||
K | 40,000 | 25,000 | 1,000 | - | ||||||||||||
Total |
| $ | 8,520 | $ | 7,520 | |||||||||||
| 1. | Series C is composed of the issuance of 1,160,791 shares of Series C Preferred Stock to MUFG for an aggregate purchase price of $911 million, less the redemption of 640,909 shares of Series C Preferred Stock of $503 million, which were converted to common shares of approximately $705 million. |
Comprehensive Income (Loss)
Accumulated Other Comprehensive Income (Loss)
| $ in millions | Foreign Currency Translation Adjustments | AFS Securities | Pensions, Postretirement and Other | DVA | Total | |||||||||||||||
March 31, 2017 | $ | (879 | ) | $ | (504 | ) | $ | (474 | ) | $ | (593 | ) | $ | (2,450 | ) | |||||
OCI during the period 1 | 23 | 108 | 4 | (173 | ) | (38 | ) | |||||||||||||
June 30, 2017 | $ | (856 | ) | $ | (396 | ) | $ | (470 | ) | $ | (766 | ) | $ | (2,488 | ) | |||||
March 31, 2016 | $ | (831 | ) | $ | 76 | $ | (373 | ) | $ | (110 | ) | $ | (1,238 | ) | ||||||
OCI during the period 1 | 52 | 143 | (5 | ) | 143 | 333 | ||||||||||||||
June 30, 2016 | $ | (779 | ) | $ | 219 | $ | (378 | ) | $ | 33 | $ | (905 | ) | |||||||
December 31, 2016 | $ | (986 | ) | $ | (588 | ) | $ | (474 | ) | $ | (595 | ) | $ | (2,643 | ) | |||||
OCI during the period 1 | 130 | 192 | 4 | (171 | ) | 155 | ||||||||||||||
June 30, 2017 | $ | (856 | ) | $ | (396 | ) | $ | (470 | ) | $ | (766 | ) | $ | (2,488 | ) | |||||
December 31, 2015 | $ | (963 | ) | $ | (319 | ) | $ | (374 | ) | $ | - | $ | (1,656 | ) | ||||||
Cumulative adjustment for accounting change related to DVA 2 | - | - | - | (312 | ) | (312 | ) | |||||||||||||
OCI during the period 1 | 184 | 538 | (4 | ) | 345 | 1,063 | ||||||||||||||
June 30, 2016 | $ | (779 | ) | $ | 219 | $ | (378 | ) | $ | 33 | $ | (905) | ||||||||
| 1. | Amounts net of tax and noncontrolling interests. |
| 2. | In accordance with the early adoption of a provision of the accounting update Recognition and Measurement of Financial Assets and Financial Liabilities , a cumulative catch-up adjustment was recorded as of January 1, 2016 to move the cumulative unrealized DVA amount, net of noncontrolling interests and tax, related to outstanding liabilities under the fair value option election from Retained earnings into AOCI. See Note 2 to the consolidated financial statements in the 2016 Form 10-K for further information. |
Period Changes in OCI Components
Three Months Ended June 30, 2017 | ||||||||||||||||||||
| $ in millions | Pre-tax gain (loss) | Income tax benefit (provision) | After-tax gain (loss) | Non- controlling interests | Net | |||||||||||||||
Foreign currency translation adjustments |
| |||||||||||||||||||
OCI activity | $ | 1 | $ | 11 | $ | 12 | $ | (11 | ) | $ | 23 | |||||||||
Reclassified to earnings | - | - | - | - | - | |||||||||||||||
Net OCI | $ | 1 | $ | 11 | $ | 12 | $ | (11 | ) | $ | 23 | |||||||||
Change in net unrealized gains (losses) on AFS securities |
| |||||||||||||||||||
OCI activity | $ | 185 | $ | (68 | ) | $ | 117 | $ | - | $ | 117 | |||||||||
Reclassified to earnings 1 | (14 | ) | 5 | (9 | ) | - | (9 | ) | ||||||||||||
Net OCI | $ | 171 | $ | (63 | ) | $ | 108 | $ | - | $ | 108 | |||||||||
Pension, postretirement and other |
| |||||||||||||||||||
OCI activity | $ | 3 | $ | - | $ | 3 | $ | - | $ | 3 | ||||||||||
Reclassified to earnings 1 | 1 | - | 1 | - | 1 | |||||||||||||||
Net OCI | 4 | - | 4 | - | 4 | |||||||||||||||
Change in net DVA |
| |||||||||||||||||||
OCI activity | $ | (285 | ) | $ | 99 | $ | (186 | ) | $ | (10 | ) | $ | (176 | ) | ||||||
Reclassified to earnings 1 | 4 | (1 | ) | 3 | - | 3 | ||||||||||||||
Net OCI | $ | (281 | ) | $ | 98 | $ | (183 | ) | $ | (10 | ) | $ | (173 | ) | ||||||
Three Months Ended June 30, 2016 | ||||||||||||||||||||
| $ in millions | Pre-tax gain (loss) | Income tax benefit (provision) | After-tax gain (loss) | Non- controlling interests | Net | |||||||||||||||
Foreign currency translation adjustments |
| |||||||||||||||||||
OCI activity | $ | 72 | $ | 59 | $ | 131 | $ | 79 | $ | 52 | ||||||||||
Reclassified to earnings | - | - | - | - | - | |||||||||||||||
Net OCI | $ | 72 | $ | 59 | $ | 131 | $ | 79 | $ | 52 | ||||||||||
Change in net unrealized gains (losses) on AFS securities |
| |||||||||||||||||||
OCI activity | $ | 298 | $ | (110 | ) | $ | 188 | $ | - | $ | 188 | |||||||||
Reclassified to earnings 1 | (70 | ) | 25 | (45 | ) | - | (45 | ) | ||||||||||||
Net OCI | $ | 228 | $ | (85 | ) | $ | 143 | $ | - | $ | 143 | |||||||||
Pension, postretirement and other |
| |||||||||||||||||||
OCI activity | $ | (5 | ) | $ | - | $ | (5 | ) | $ | - | $ | (5 | ) | |||||||
Reclassified to earnings 1 | (1 | ) | 1 | - | - | - | ||||||||||||||
Net OCI | $ | (6 | ) | $ | 1 | $ | (5 | ) | $ | - | $ | (5 | ) | |||||||
Change in net DVA |
| |||||||||||||||||||
OCI activity | $ | 225 | $ | (80 | ) | $ | 145 | $ | 2 | $ | 143 | |||||||||
Reclassified to earnings 1 | - | - | - | - | - | |||||||||||||||
Net OCI | $ | 225 | $ | (80 | ) | $ | 145 | $ | 2 | $ | 143 | |||||||||
| June 2017 Form 10-Q | 88 |
Notes to Consolidated Financial Statements (Unaudited) | |
Six Months Ended June 30, 2017 | ||||||||||||||||||||
| $ in millions | Pre-tax gain (loss) | Income tax benefit (provision) | After-tax gain (loss) | Non- controlling interests | Net | |||||||||||||||
Foreign currency translation adjustments |
| |||||||||||||||||||
OCI activity | $ | 44 | $ | 118 | $ | 162 | $ | 32 | $ | 130 | ||||||||||
Reclassified to earnings | - | - | - | - | - | |||||||||||||||
Net OCI | $ | 44 | $ | 118 | $ | 162 | $ | 32 | $ | 130 | ||||||||||
Change in net unrealized gains (losses) on AFS securities |
| |||||||||||||||||||
OCI activity | $ | 322 | $ | (120 | ) | $ | 202 | $ | - | $ | 202 | |||||||||
Reclassified to earnings 1 | (16 | ) | 6 | (10 | ) | - | (10 | ) | ||||||||||||
Net OCI | $ | 306 | $ | (114 | ) | $ | 192 | $ | - | $ | 192 | |||||||||
Pension, postretirement and other |
| |||||||||||||||||||
OCI activity | $ | 3 | $ | - | $ | 3 | $ | - | $ | 3 | ||||||||||
Reclassified to earnings 1 | 1 | - | 1 | - | 1 | |||||||||||||||
Net OCI | 4 | - | 4 | - | 4 | |||||||||||||||
Change in net DVA |
| |||||||||||||||||||
OCI activity | $ | (278 | ) | $ | 98 | $ | (180 | ) | $ | (3 | ) | $ | (177 | ) | ||||||
Reclassified to earnings 1 | 8 | (2 | ) | 6 | - | 6 | ||||||||||||||
Net OCI | $ | (270 | ) | $ | 96 | $ | (174 | ) | $ | (3 | ) | $ | (171 | ) | ||||||
Six Months Ended June 30, 2016 2 | ||||||||||||||||||||
| $ in millions | Pre-tax gain (loss) | Income tax benefit (provision) | After-tax gain (loss) | Non- controlling interests | Net | |||||||||||||||
Foreign currency translation adjustments |
| |||||||||||||||||||
OCI activity | $ | 143 | $ | 174 | $ | 317 | $ | 133 | $ | 184 | ||||||||||
Reclassified to earnings | - | - | - | - | - | |||||||||||||||
Net OCI | $ | 143 | $ | 174 | $ | 317 | $ | 133 | $ | 184 | ||||||||||
Change in net unrealized gains (losses) on AFS securities |
| |||||||||||||||||||
OCI activity | $ | 934 | $ | (344 | ) | $ | 590 | $ | - | $ | 590 | |||||||||
Reclassified to earnings 1 | (82 | ) | 30 | (52 | ) | - | (52 | ) | ||||||||||||
Net OCI | $ | 852 | $ | (314 | ) | $ | 538 | $ | - | $ | 538 | |||||||||
Pension, postretirement and other |
| |||||||||||||||||||
OCI activity | $ | (6 | ) | $ | 3 | $ | (3 | ) | $ | - | $ | (3 | ) | |||||||
Reclassified to earnings 1 | (2 | ) | 1 | (1 | ) | - | (1 | ) | ||||||||||||
Net OCI | $ | (8 | ) | $ | 4 | $ | (4 | ) | $ | - | $ | (4 | ) | |||||||
Change in net DVA |
| |||||||||||||||||||
OCI activity | $ | 589 | $ | (215 | ) | $ | 374 | $ | 3 | $ | 371 | |||||||||
Reclassified to earnings 1 | (41 | ) | 15 | (26 | ) | - | (26 | ) | ||||||||||||
Net OCI | $ | 548 | $ | (200 | ) | $ | 348 | $ | 3 | $ | 345 | |||||||||
| 1. | Amounts reclassified to earnings related to: realized gains and losses from sales of AFS securities are classified within Other revenues in the consolidated income statements; Pension, postretirement and other are classified within Compensation and benefits expenses in the consolidated income statements; and realization of DVA are classified within Trading revenues in the consolidated income statements. |
| 2. | Exclusive of 2016 cumulative adjustment for accounting change related to DVA. |
| Noncontrolling Interests | ||||||||
| $ in millions | At June 30, 2017 | At December 31 2016 | ||||||
Noncontrolling interests | $ | 1,141 | $ | 1,127 | ||||
The increase in noncontrolling interests was primarily due to the increase in net income attributable to noncontrolling interests, partially offset by deconsolidation of certain investment management funds sponsored by the Firm.
15. Earnings per Common Share
Calculation of Basic and Diluted Earnings per Common Share ("EPS")
| Three Months Ended June 30, | Six Months Ended June 30, | |||||||||||||||
| in millions, except for per share data | 2017 | 2016 | 2017 | 2016 | ||||||||||||
Basic EPS | ||||||||||||||||
Income from continuing operations | $ | 1,796 | $ | 1,650 | $ | 3,789 | $ | 2,810 | ||||||||
Income (loss) from discontinued operations | (5 | ) | (4 | ) | (27 | ) | (7 | ) | ||||||||
Net income | 1,791 | 1,646 | 3,762 | 2,803 | ||||||||||||
Net income applicable to noncontrolling interests | 34 | 64 | 75 | 87 | ||||||||||||
Net income applicable to Morgan Stanley | 1,757 | 1,582 | 3,687 | 2,716 | ||||||||||||
Less: Preferred stock dividends and other | (170 | ) | (157 | ) | (260 | ) | (235 | ) | ||||||||
Earnings applicable to Morgan Stanley common shareholders | $ | 1,587 | $ | 1,425 | $ | 3,427 | $ | 2,481 | ||||||||
Weighted average common shares outstanding | 1,791 | 1,866 | 1,796 | 1,875 | ||||||||||||
Earnings per basic common share |
| |||||||||||||||
Income from continuing operations | $ | 0.89 | $ | 0.77 | $ | 1.92 | $ | 1.33 | ||||||||
Income (loss) from discontinued operations | - | (0.01 | ) | (0.01 | ) | (0.01 | ) | |||||||||
Earnings per basic common share | $ | 0.89 | $ | 0.76 | $ | 1.91 | $ | 1.32 | ||||||||
Diluted EPS | ||||||||||||||||
Earnings applicable to Morgan Stanley common shareholders | $ | 1,587 | $ | 1,425 | $ | 3,427 | $ | 2,481 | ||||||||
Weighted average common shares outstanding | 1,791 | 1,866 | 1,796 | 1,875 | ||||||||||||
Effect of dilutive securities: | ||||||||||||||||
Stock options and RSUs 1 | 39 | 33 | 40 | 32 | ||||||||||||
Weighted average common shares outstanding and common stock equivalents | 1,830 | 1,899 | 1,836 | 1,907 | ||||||||||||
Earnings per diluted common share |
| |||||||||||||||
Income from continuing operations | $ | 0.87 | $ | 0.75 | $ | 1.88 | $ | 1.30 | ||||||||
Income (loss) from discontinued operations | - | - | (0.01 | ) | - | |||||||||||
Earnings per diluted common share | $ | 0.87 | $ | 0.75 | $ | 1.87 | $ | 1.30 | ||||||||
Weighted average antidilutive RSUs and stock options (excluded from the computation of diluted EPS) 1 | - | 14 | - | 15 | ||||||||||||
| 89 | June 2017 Form 10-Q |
Notes to Consolidated Financial Statements (Unaudited) | |
| 1. | Restricted stock units ("RSUs") that are considered participating securities are treated as a separate class of securities in the computation of basic EPS, and, therefore, such RSUs are not included as incremental shares in the diluted EPS computations. |
16. Interest Income and Interest Expense
| Three Months Ended June 30, | Six Months Ended June 30, | |||||||||||||||
| $ in millions | 2017 | 2016 | 2017 | 2016 | ||||||||||||
Interest income 1 | ||||||||||||||||
Investment securities | $ | 304 | $ | 237 | $ | 630 | $ | 473 | ||||||||
Loans | 798 | 680 | 1,546 | 1,327 | ||||||||||||
Interest bearing deposits with banks | 67 | 52 | 122 | 105 | ||||||||||||
Securities purchased under agreements to resell and Securities borrowed 2 | 29 | (120 | ) | 10 | (198 | ) | ||||||||||
Trading assets, net of Trading liabilities 3 | 491 | 526 | 955 | 1,109 | ||||||||||||
Customer receivables and Other 4 | 417 | 292 | 808 | 598 | ||||||||||||
Total interest income | $ | 2,106 | $ | 1,667 | $ | 4,071 | $ | 3,414 | ||||||||
Interest expense 1 | ||||||||||||||||
Deposits | $ | 14 | $ | 15 | $ | 25 | $ | 37 | ||||||||
Short-term and Long-term borrowings | 1,067 | 851 | 2,088 | 1,818 | ||||||||||||
Securities sold under agreements to repurchase and Securities loaned 5 | 339 | 259 | 587 | 513 | ||||||||||||
Customer payables and Other 6 | (65 | ) | (371 | ) | (151 | ) | (766 | ) | ||||||||
Total interest expense | $ | 1,355 | $ | 754 | $ | 2,549 | $ | 1,602 | ||||||||
Net interest | $ | 751 | $ | 913 | $ | 1,522 | $ | 1,812 | ||||||||
| 1. | Interest income and Interest expense are recorded within the consolidated income statements depending on the nature of the instrument and related market conventions. When interest is included as a component of the instrument's fair value, interest is included within Trading revenues or Investments revenues. Otherwise, it is included within Interest income or Interest expense. |
| 2. | Includes fees paid on Securities borrowed. |
| 3. | Interest expense on Trading liabilities is reported as a reduction to Interest income on Trading assets. |
| 4. | Includes interest from customer receivables and cash deposited with clearing organizations or segregated under federal and other regulations or requirements. |
| 5. | Includes fees received on Securities loaned. |
| 6. | Includes fees received from prime brokerage customers for stock loan transactions incurred to cover customers' short positions. |
17. Employee Benefit Plans
The Firm sponsors various retirement plans for the majority of its U.S. and non-U.S. employees. The Firm provides certain other postretirement benefits, primarily health care and life insurance, to eligible U.S. employees.
Components of the Net Periodic Benefit Expense (Income) for Pension and Other Postretirement Plans
| Three Months Ended June 30, | Six Months Ended June 30, | |||||||||||||||
| $ in millions | 2017 | 2016 | 2017 | 2016 | ||||||||||||
Service cost, benefits earned during the period | $ | 4 | $ | 4 | $ | 8 | $ | 8 | ||||||||
Interest cost on projected benefit obligation | 38 | 39 | 75 | 77 | ||||||||||||
Expected return on plan assets | (29 | ) | (30 | ) | (58 | ) | (60 | ) | ||||||||
Net amortization of prior service credit | (4 | ) | (5 | ) | (8 | ) | (9 | ) | ||||||||
Net amortization of actuarial loss | 4 | 3 | 8 | 6 | ||||||||||||
Net periodic benefit expense (income) | $ | 13 | $ | 11 | $ | 25 | $ | 22 | ||||||||
18. Income Taxes
The Firm is under continuous examination by the Internal Revenue Service (the "IRS") and other tax authorities in certain countries, such as Japan and the United Kingdom ("U.K."), and in states in which it has significant business operations, such as New York. The Firm is currently at various levels of field examination with respect to audits by the IRS, as well as New York State and New York City, for tax years 2009-2012 and 2007-2014, respectively. The Firm believes that the resolution of these tax matters will not have a material effect on the annual consolidated financial statements, although a resolution could have a material impact on the consolidated income statements and effective tax rate for any period in which such resolution occurs.
In April 2016, the Firm received a notification from the IRS that the Congressional Joint Committee on Taxation approved the final report of an Appeals Office review of matters from tax years 1999-2005, and the Revenue Agent's Report reflecting agreed closure of the 2006-2008 tax years. In March 2017, the Firm filed claims with the IRS to contest certain items, associated with tax years 1999-2005, the resolution of which is not expected to have a material impact on the annual consolidated financial statements or effective tax rate.
During 2017, the Firm expects to reach a conclusion with the U.K. tax authorities on substantially all issues through tax year 2010, the resolution of which is not expected to have a material impact on the annual consolidated financial statements or effective tax rate.
The Firm has established a liability for unrecognized tax benefits that it believes is adequate in relation to the potential for additional assessments. Once established, the Firm adjusts liabilities for unrecognized tax benefits only when new information is available or when an event occurs necessitating a change.
| June 2017 Form 10-Q | 90 |
Notes to Consolidated Financial Statements (Unaudited) | |
The Firm expects to receive new information related to a multi-year IRS field audit examination that may prompt a decrease in the Firm's recorded unrecognized tax benefits over the next 12 months. The potential change in unrecognized tax benefits is not expected to have a material impact on the Firm's annual consolidated financial statements or effective tax rate, although it could have a material impact on
the Firm's consolidated income statements and effective tax rate for the period in which such development occurs.
See Note 11 regarding the Dutch Tax Authority's challenge, in the Dutch Tax Tribunal in Amsterdam (matters styled Case number 15/3637 and Case number 15/ 4353 ), of the Firm's entitlement to certain withholding tax credits which may impact the balance of unrecognized tax benefits.
19. Segment and Geographic Information
Segment Information
For a discussion about the Firm's business segments, see Note 21 to the consolidated financial statements in the 2016 Form 10-K.
Selected Financial Information by Business Segment
| Three Months Ended June 30, 2017 | ||||||||||||||||||||
| $ in millions | IS 1 | WM | IM 2 | I/E | Total | |||||||||||||||
Total non-interest revenues 3 | $ | 5,020 | $ | 3,142 | $ | 665 | $ | (75 | ) | $ | 8,752 | |||||||||
Interest income | 1,243 | 1,114 | 1 | (252 | ) | 2,106 | ||||||||||||||
Interest expense | 1,501 | 105 | 1 | (252 | ) | 1,355 | ||||||||||||||
Net interest | (258 | ) | 1,009 | - | - | 751 | ||||||||||||||
Net revenues | $ | 4,762 | $ | 4,151 | $ | 665 | $ | (75 | ) | $ | 9,503 | |||||||||
Income from continuing operations before income taxes | $ | 1,443 | $ | 1,057 | $ | 142 | $ | - | $ | 2,642 | ||||||||||
Provision for income taxes | 413 | 392 | 41 | - | 846 | |||||||||||||||
Income from continuing operations | 1,030 | 665 | 101 | - | 1,796 | |||||||||||||||
Income (loss) from discontinued operations, net of income taxes | (5 | ) | - | - | - | (5 | ) | |||||||||||||
Net income | 1,025 | 665 | 101 | - | 1,791 | |||||||||||||||
Net income applicable to noncontrolling interests | 33 | - | 1 | - | 34 | |||||||||||||||
Net income applicable to Morgan Stanley | $ | 992 | $ | 665 | $ | 100 | $ | - | $ | 1,757 | ||||||||||
| Three Months Ended June 30, 2016 | ||||||||||||||||||||
| $ in millions | IS 4 | WM 4 | IM 2 | I/E | Total | |||||||||||||||
Total non-interest revenues 3 | $ | 4,496 | $ | 2,982 | $ | 581 | $ | (63 | ) | $ | 7,996 | |||||||||
Interest income | 966 | 920 | 3 | (222 | ) | 1,667 | ||||||||||||||
Interest expense | 884 | 91 | 1 | (222 | ) | 754 | ||||||||||||||
Net interest | 82 | 829 | 2 | - | 913 | |||||||||||||||
Net revenues | $ | 4,578 | $ | 3,811 | $ | 583 | $ | (63 | ) | $ | 8,909 | |||||||||
Income from continuing operations before income taxes | $ | 1,506 | $ | 859 | $ | 118 | $ | - | $ | 2,483 | ||||||||||
Provision for income taxes | 453 | 343 | 37 | - | 833 | |||||||||||||||
Income from continuing operations | 1,053 | 516 | 81 | - | 1,650 | |||||||||||||||
Income (loss) from discontinued operations, net of income taxes | (4 | ) | - | - | - | (4 | ) | |||||||||||||
Net income | 1,049 | 516 | 81 | - | 1,646 | |||||||||||||||
Net income applicable to noncontrolling interests | 61 | - | 3 | - | 64 | |||||||||||||||
Net income applicable to Morgan Stanley | $ | 988 | $ | 516 | $ | 78 | $ | - | $ | 1,582 | ||||||||||
| Six Months Ended June 30, 2017 | ||||||||||||||||||||
| $ in millions | IS 1 | WM | IM 2 | I/E | Total | |||||||||||||||
Total non-interest revenues 3 | $ | 10,399 | $ | 6,206 | $ | 1,273 | $ | (152 | ) | $ | 17,726 | |||||||||
Interest income | 2,367 | 2,193 | 2 | (491 | ) | 4,071 | ||||||||||||||
Interest expense | 2,852 | 190 | 1 | (494 | ) | 2,549 | ||||||||||||||
Net interest | (485 | ) | 2,003 | 1 | 3 | 1,522 | ||||||||||||||
Net revenues | $ | 9,914 | $ | 8,209 | $ | 1,274 | $ | (149 | ) | $ | 19,248 | |||||||||
Income from continuing operations before income taxes | $ | 3,173 | $ | 2,030 | $ | 245 | $ | 2 | $ | 5,450 | ||||||||||
Provision for income taxes | 872 | 718 | 71 | - | 1,661 | |||||||||||||||
Income from continuing operations | 2,301 | 1,312 | 174 | 2 | 3,789 | |||||||||||||||
Income (loss) from discontinued operations, net of income taxes | (27 | ) | - | - | - | (27 | ) | |||||||||||||
Net income | 2,274 | 1,312 | 174 | 2 | 3,762 | |||||||||||||||
Net income applicable to noncontrolling interests | 68 | - | 7 | - | 75 | |||||||||||||||
Net income applicable to Morgan Stanley | $ | 2,206 | $ | 1,312 | $ | 167 | $ | 2 | $ | 3,687 | ||||||||||
| Six Months Ended June 30, 2016 | ||||||||||||||||||||
| $ in millions | IS 4 | WM 4 | IM 2 | I/E | Total | |||||||||||||||
Total non-interest revenues 3 | $ | 8,141 | $ | 5,819 | $ | 1,059 | $ | (130 | ) | $ | 14,889 | |||||||||
Interest income | 2,019 | 1,834 | 4 | (443 | ) | 3,414 | ||||||||||||||
Interest expense | 1,868 | 174 | 3 | (443 | ) | 1,602 | ||||||||||||||
Net interest | 151 | 1,660 | 1 | - | 1,812 | |||||||||||||||
Net revenues | $ | 8,292 | $ | 7,479 | $ | 1,060 | $ | (130 | ) | $ | 16,701 | |||||||||
Income from continuing operations before income taxes | $ | 2,414 | $ | 1,645 | $ | 162 | $ | - | $ | 4,221 | ||||||||||
Provision for income taxes | 728 | 636 | 47 | - | 1,411 | |||||||||||||||
Income from continuing operations | 1,686 | 1,009 | 115 | - | 2,810 | |||||||||||||||
Income (loss) from discontinued operations, net of income taxes | (7 | ) | - | - | - | (7 | ) | |||||||||||||
Net income | 1,679 | 1,009 | 115 | - | 2,803 | |||||||||||||||
Net income (loss) applicable to noncontrolling interests | 100 | - | (13 | ) | - | 87 | ||||||||||||||
Net income applicable to Morgan Stanley | $ | 1,579 | $ | 1,009 | $ | 128 | $ | - | $ | 2,716 | ||||||||||
IS-Institutional Securities
WM-Wealth Management
IM-Investment Management
I/E-Intersegment eliminations
| 91 | June 2017 Form 10-Q |
Notes to Consolidated Financial Statements (Unaudited) | |
| 1. | In the current quarter, the Firm recorded a provision of $86 million for potential additional value-added tax, interest and penalties in relation to certain intercompany service activities provided to our U.K. Group. |
| 2. | The Firm waives a portion of its fees from certain registered money market funds that comply with the requirements of Rule 2a-7 of the Investment Company Act of 1940. These fee waivers resulted in a reduction of fees of approximately $23 million and $12 million for the current quarter and prior year quarter, respectively, and $45 million and $35 million for the current year period and prior year period, respectively. |
| 3. | In certain management fee arrangements, the Firm is entitled to receive performance-based fees (also referred to as incentive fees and includes carried interest) when the return on assets under management exceeds certain benchmark returns or other performance targets. In such arrangements, performance fee revenues are accrued (or reversed) quarterly based on measuring account/fund performance to date versus the performance benchmark stated in the investment management agreement. The Firm's portion of net unrealized cumulative performance-based fees (for which the Firm is not obligated to pay compensation) at risk of reversing if fund performance falls below stated investment management agreement benchmarks was approximately $469 million and $397 million at June 30, 2017 and December 31, 2016, respectively. See Note 11 for information regarding general partner guarantees, which include potential obligations to return performance fee distributions previously received. |
| 4. | Effective July 1, 2016, the Institutional Securities and Wealth Management business segments entered into an agreement, whereby Institutional Securities assumed management of Wealth Management's fixed income client-driven trading activities and employees. Institutional Securities now pays fees to Wealth Management based on distribution activity (collectively, the "Fixed Income Integration"). Prior periods have not been recast for this new intersegment agreement due to immateriality. |
Total Assets by Business Segment
| $ in millions | At June 30, 2017 | At December 31, 2016 | ||||||
Institutional Securities | $ | 665,603 | $ | 629,149 | ||||
Wealth Management | 170,735 | 181,135 | ||||||
Investment Management | 4,678 | 4,665 | ||||||
Total 1 | $ | 841,016 | $ | 814,949 | ||||
| 1. | Corporate assets have been fully allocated to the business segments. |
Geographic Information
For a discussion about the Firm's geographic net revenues, see Note 21 to the consolidated financial statements in the 2016 Form 10-K.
Net Revenues by Region
| Three Months Ended June 30, | Six Months Ended June 30, | |||||||||||||||
| $ in millions | 2017 | 2016 | 2017 | 2016 | ||||||||||||
Americas | $ | 6,746 | $ | 6,538 | $ | 13,834 | $ | 12,290 | ||||||||
EMEA | 1,606 | 1,312 | 3,095 | 2,441 | ||||||||||||
Asia-Pacific | 1,151 | 1,059 | 2,319 | 1,970 | ||||||||||||
Net revenues | $ | 9,503 | $ | 8,909 | $ | 19,248 | $ | 16,701 | ||||||||
20. Subsequent Events
The Firm has evaluated subsequent events for adjustment to or disclosure in the consolidated financial statements through the date of this report and has not identified any recordable or disclosable events not otherwise reported in these consolidated financial statements or the notes thereto.
| June 2017 Form 10-Q | 92 |
Financial Data Supplement (Unaudited) Average Balances and Interest Rates and Net Interest Income | |
| Three Months Ended June 30, | ||||||||||||||||||||||||
| 2017 | 2016 | |||||||||||||||||||||||
| $ in millions | Average Daily Balance | Interest | Annualized Average Rate | Average Daily Balance | Interest | Annualized Average Rate | ||||||||||||||||||
Interest earning assets 1 | ||||||||||||||||||||||||
Investment securities 2 | $ | 74,855 | $ | 304 | 1.6 | % | $ | 78,233 | $ | 237 | 1.2 | % | ||||||||||||
Loans 2 | 96,230 | 798 | 3.3 | 89,344 | 680 | 3.1 | ||||||||||||||||||
Interest bearing deposits with banks 2 | 19,555 | 67 | 1.4 | 29,250 | 52 | 0.7 | ||||||||||||||||||
Securities purchased under agreements to resell and Securities borrowed 3: | ||||||||||||||||||||||||
U.S. | 129,845 | 140 | 0.4 | 157,223 | (64 | ) | (0.2 | ) | ||||||||||||||||
Non-U.S. | 90,200 | (111 | ) | (0.5 | ) | 82,863 | (56 | ) | (0.3 | ) | ||||||||||||||
Trading assets, net of Trading liabilities 4: | ||||||||||||||||||||||||
U.S. | 60,963 | 476 | 3.1 | 49,914 | 459 | 3.7 | ||||||||||||||||||
Non-U.S. | 3,409 | 15 | 1.8 | 12,447 | 67 | 2.2 | ||||||||||||||||||
Customer receivables and Other 5: | ||||||||||||||||||||||||
U.S. | 48,330 | 292 | 2.4 | 46,144 | 233 | 2.0 | ||||||||||||||||||
Non-U.S. | 25,863 | 125 | 1.9 | 21,655 | 59 | 1.1 | ||||||||||||||||||
Total | $ | 549,250 | $ | 2,106 | 1.5 | % | $ | 567,073 | $ | 1,667 | 1.2 | % | ||||||||||||
Interest bearing liabilities 1 | ||||||||||||||||||||||||
Deposits 2 | $ | 146,982 | $ | 14 | - | % | $ | 154,835 | $ | 15 | - | % | ||||||||||||
Short-term and Long-term borrowings 2, 6 | 180,918 | 1,067 | 2.4 | 164,061 | 851 | 2.1 | ||||||||||||||||||
Securities sold under agreements to repurchase and Securities loaned 7: | ||||||||||||||||||||||||
U.S. | 35,066 | 245 | 2.8 | 31,412 | 141 | 1.8 | ||||||||||||||||||
Non-U.S. | 36,974 | 94 | 1.0 | 31,729 | 118 | 1.5 | ||||||||||||||||||
Customer payables and Other 8: | ||||||||||||||||||||||||
U.S. | 130,814 | (98 | ) | (0.3 | ) | 126,988 | (335 | ) | (1.1 | ) | ||||||||||||||
Non-U.S. | 64,135 | 33 | 0.2 | 65,603 | (36 | ) | (0.2 | ) | ||||||||||||||||
Total | $ | 594,889 | $ | 1,355 | 0.9 | $ | 574,628 | $ | 754 | 0.5 | ||||||||||||||
Net interest income and net interest rate spread | $ | 751 | 0.6 | % | $ | 913 | 0.7 | % | ||||||||||||||||
| 93 | June 2017 Form 10-Q |
Financial Data Supplement (Unaudited) Average Balances and Interest Rates and Net Interest Income | |
| Six Months Ended June 30, | ||||||||||||||||||||||||
| 2017 | 2016 | |||||||||||||||||||||||
| $ in millions | Average Daily Balance | Interest | Annualized Average Rate | Average Daily Balance | Interest | Annualized Average Rate | ||||||||||||||||||
Interest earning assets 1 | ||||||||||||||||||||||||
Investment securities 2 | $ | 77,758 | $ | 630 | 1.6 | % | $ | 76,999 | $ | 473 | 1.2 | % | ||||||||||||
Loans 2 | 95,799 | 1,546 | 3.3 | 87,979 | 1,327 | 3.0 | ||||||||||||||||||
Interest bearing deposits with banks 2 | 19,928 | 122 | 1.2 | 30,514 | 105 | 0.7 | ||||||||||||||||||
Securities purchased under agreements to resell and Securities borrowed 3: | ||||||||||||||||||||||||
U.S. | 128,775 | 216 | 0.3 | 154,488 | (126 | ) | (0.2 | ) | ||||||||||||||||
Non-U.S. | 92,354 | (206 | ) | (0.4 | ) | 84,499 | (72 | ) | (0.2 | ) | ||||||||||||||
Trading assets, net of Trading liabilities 4: | ||||||||||||||||||||||||
U.S. | 58,390 | 922 | 3.2 | 48,827 | 957 | 4.0 | ||||||||||||||||||
Non-U.S. | 2,630 | 33 | 2.5 | 13,386 | 152 | 2.3 | ||||||||||||||||||
Customer receivables and Other 5: | ||||||||||||||||||||||||
U.S. | 48,173 | 586 | 2.5 | 47,400 | 468 | 2.0 | ||||||||||||||||||
Non-U.S. | 25,664 | 222 | 1.7 | 22,092 | 130 | 1.2 | ||||||||||||||||||
Total | $ | 549,471 | $ | 4,071 | 1.5 | % | $ | 566,184 | $ | 3,414 | 1.2 | % | ||||||||||||
Interest bearing liabilities 1 | ||||||||||||||||||||||||
Deposits 2 | $ | 150,309 | $ | 25 | - | % | $ | 156,893 | $ | 37 | - | % | ||||||||||||
Short-term and Long-term borrowings 2, 6 | 175,937 | 2,088 | 2.4 | 162,059 | 1,818 | 2.3 | ||||||||||||||||||
Securities sold under agreements to repurchase and Securities loaned 7: | ||||||||||||||||||||||||
U.S. | 35,199 | 417 | 2.4 | 31,635 | 271 | 1.7 | ||||||||||||||||||
Non-U.S. | 37,654 | 170 | 0.9 | 28,144 | 242 | 1.7 | ||||||||||||||||||
Customer payables and Other 8: | ||||||||||||||||||||||||
U.S. | 130,836 | (183 | ) | (0.3 | ) | 125,943 | (704 | ) | (1.1 | ) | ||||||||||||||
Non-U.S. | 60,160 | 32 | 0.1 | 65,055 | (62 | ) | (0.2 | ) | ||||||||||||||||
Total | $ | 590,095 | $ | 2,549 | 0.9 | $ | 569,729 | $ | 1,602 | 0.6 | ||||||||||||||
Net interest income and net interest rate spread | $ | 1,522 | 0.6 | % | $ | 1,812 | 0.6 | % | ||||||||||||||||
| 1. | Certain revisions have been made to prior periods to conform to the current presentation. |
| 2. | Amounts include primarily U.S. balances. |
| 3. | Includes fees paid on Securities borrowed. |
| 4. | Trading assets, net of Trading liabilities exclude non-interest earning assets and non-interest bearing liabilities, such as equity securities. |
| 5. | Includes interest from customer receivables and cash deposited with clearing organizations or segregated under federal and other regulations or requirements. |
| 6. | The Firm also issues structured notes that have coupon or repayment terms linked to the performance of debt or equity securities, indices, currencies or commodities, which are recorded within Trading revenues (see Note 3 to the consolidated financial statements). |
| 7. | Includes fees received on Securities loaned. |
| 8. | Includes fees received from prime brokerage customers for stock loan transactions incurred to cover customers' short positions. |
| June 2017 Form 10-Q | 94 |
Financial Data Supplement (Unaudited) Rate/Volume Analysis | |
Effect of Volume and Rate Changes on Net Interest Income
| Three Months Ended June 30, 2017 versus Three Months Ended June 30, 2016 | Six Months Ended June 30, 2017 versus Six Months Ended June 30, 2016 | |||||||||||||||||||||||
Increase (decrease) due to change in: | Increase (decrease) due to change in: | |||||||||||||||||||||||
| $ in millions | Volume | Rate | Net Change | Volume | Rate | Net Change | ||||||||||||||||||
Interest earning assets | ||||||||||||||||||||||||
Investment securities | $ | (10 | ) | $ | 77 | $ | 67 | $ | 5 | $ | 152 | $ | 157 | |||||||||||
Loans | 52 | 66 | 118 | 118 | 101 | 219 | ||||||||||||||||||
Interest bearing deposits with banks | (17 | ) | 32 | 15 | (37 | ) | 54 | 17 | ||||||||||||||||
Securities purchased under agreements to resell and Securities borrowed: | ||||||||||||||||||||||||
U.S. | 11 | 193 | 204 | 20 | 322 | 342 | ||||||||||||||||||
Non-U.S. | (5 | ) | (50 | ) | (55 | ) | (7 | ) | (127 | ) | (134 | ) | ||||||||||||
Trading assets, net of Trading liabilities: | ||||||||||||||||||||||||
U.S. | 101 | (84 | ) | 17 | 186 | (221 | ) | (35 | ) | |||||||||||||||
Non-U.S. | (49 | ) | (3 | ) | (52 | ) | (122 | ) | 3 | (119 | ) | |||||||||||||
Customer receivables and Other: | ||||||||||||||||||||||||
U.S. | 11 | 48 | 59 | 8 | 110 | 118 | ||||||||||||||||||
Non-U.S. | 11 | 55 | 66 | 21 | 71 | 92 | ||||||||||||||||||
Change in interest income | $ | 105 | $ | 334 | $ | 439 | $ | 192 | $ | 465 | $ | 657 | ||||||||||||
Interest bearing liabilities | ||||||||||||||||||||||||
Deposits | $ | (1 | ) | $ | - | $ | (1 | ) | $ | (2 | ) | $ | (10 | ) | $ | (12 | ) | |||||||
Short-term and Long-term borrowings | 88 | 128 | 216 | 156 | 114 | 270 | ||||||||||||||||||
Securities sold under agreements to repurchase and Securities loaned: | ||||||||||||||||||||||||
U.S. | 16 | 88 | 104 | 31 | 115 | 146 | ||||||||||||||||||
Non-U.S. | 19 | (43 | ) | (24 | ) | 82 | (154 | ) | (72 | ) | ||||||||||||||
Customer payables and Other: | ||||||||||||||||||||||||
U.S. | (10 | ) | 247 | 237 | (26 | ) | 547 | 521 | ||||||||||||||||
Non-U.S. | 1 | 68 | 69 | 5 | 89 | 94 | ||||||||||||||||||
Change in interest expense | $ | 113 | $ | 488 | $ | 601 | $ | 246 | $ | 701 | $ | 947 | ||||||||||||
Change in net interest income | $ | (8 | ) | $ | (154 | ) | $ | (162 | ) | $ | (54 | ) | $ | (236 | ) | $ | (290 | ) | ||||||
| 95 | June 2017 Form 10-Q |
| |
Other Information
Legal Proceedings
The following new matters and developments have occurred since previously reporting certain matters in the Firm's Annual Report on Form 10-K for the year ended December 31, 2016 (the "Form 10-K") and the Firm's Quarterly Report on Form 10-Q for the quarterly period ended March 31, 2017 (the "First Quarter Form 10-Q"). See also the disclosures set forth under "Legal Proceedings" in Part I, Item 3 of the Form 10-K and Part II, Item 1 of the First Quarter Form 10-Q.
Residential Mortgage and Credit Crisis Related Matters
On April 13, 2017, the Appellate Division, First Department, denied plaintiff's motion for leave to appeal to the New York Court of Appeals in Federal Housing Finance Agency, as Conservator for the Federal Home Loan Mortgage Corporation, on behalf of the Trustee of the Morgan Stanley ABS Capital I Inc. Trust, Series 2007-NC1 (MSAC 2007-NC1) v. Morgan Stanley ABS Capital I Inc.
On April 13, 2017, the Appellate Division, First Department, denied plaintiff's motion for leave to appeal to the New York Court of Appeals in Federal Housing Finance Agency, as Conservator for the Federal Home Loan Mortgage Corporation, on behalf of the Trustee of the Morgan Stanley ABS Capital I Inc. Trust, Series 2007-NC3 (MSAC 2007-NC3) v. Morgan Stanley ABS Capital I Inc.
On April 21, 2017 the parties to Morgan Stanley Mortgage Loan Trust 2006-13ARX v. Morgan Stanley Mortgage Capital Holdings LLC, as successor in interest to Morgan Stanley Mortgage Capital Inc. reached an agreement in principle to settle the litigation.
On May 8, 2017, the Firm moved for summary judgment in Deutsche Bank National Trust Company v. Morgan Stanley Mortgage Capital Holdings LLC .
On May 12, 2017, plaintiff filed a notice of appeal of the decision and order by the Supreme Court of the State of New York, which granted the Firm's motion to dismiss the amended complaint in Royal Park Investments SA/NV v. Morgan Stanley et al .
On May 30, 2017, the parties in Morgan Stanley Mortgage Loan Trust 2006-4SL, et al. v. Morgan Stanley Mortgage Capital Inc. and Morgan Stanley Mortgage Loan Trust 2006-10SL, et al. v. Morgan Stanley Mortgage Capital Holdings LLC, as successor in interest to Morgan Stanley Mortgage Capital Inc. reached an agreement in principle to settle the litigation.
On June 20, 2017, the Appellate Division, First Department, affirmed the order granting in part and denying in part the Firm's motion to dismiss in Deutsche Zentral-Genossenschaftsbank AG et al. v. Morgan Stanley et al . On July 28, 2017, the Firm filed a motion for leave to appeal that decision to the New York Court of Appeals.
Following the reversal on appeal of the Court's order granting defendants' motion to dismiss on November 17, 2016, on June 15, 2017, plaintiffs in Phoenix Light SF Limited, et al. v. Morgan Stanley, et al. filed a second amended complaint. On July 7, 2017, the court so-ordered a stipulation of partial discontinuance dismissing claims relating to certificates having an original face value of approximately $76 million.
On July 11, 2017, the Appellate Division, First Department, affirmed in part and reversed in part, an order granting in part and denying in part the Firm's motion to dismiss in Wilmington Trust Company v. Morgan Stanley Mortgage Capital Holdings LLC et al.
European Matters
On July 17, 2017, the court in Parma, Italy presiding over the criminal trial against certain present and former employees of the Firm related to the bankruptcy of Parmalat in 2003 issued a decision acquitting the present and former employees of all of the charges pending against them.
On May 31, 2017, Land Salzburg received parliamentary approval for the resolution of all claims in the actions styled Land Salzburg v. Morgan Stanley & Co. International plc and Morgan Stanley Capital Services LLC and Morgan Stanley & Co. International plc v. Land Salzburg .
On July 3, 2017, the Firm was informed that the public prosecutor for the Court of Accounts for the Republic of Italy filed a claim against the Firm styled Case No. 2012/00406/MNV, which is pending in the Regional Prosecutor's Office at the Judicial Section of the Court of Auditors for Lazio, Italy. The claim relates to certain derivative transactions between the Republic of Italy and the Firm. The transactions were originally entered into between 1999 and 2005, and were terminated in December 2011 and January 2012. The claim alleges, inter alia, that the Firm was acting as an agent of the Republic of Italy, that the derivative transactions were improper and that the termination of the transactions was also improper and asserts claims for damages through an administrative process against the Firm for €2.76 billion. The Firm does not agree with these allegations. A hearing regarding this matter has been scheduled for April 19, 2018.
In matters styled Case number 15/3637 and Case number 15/4353 , the Dutch Tax Authority ("Dutch Authority") is
| June 2017 Form 10-Q | 96 |
| |
challenging in the Dutch Tax Tribunal in Amsterdam the prior set-off by the Firm of approximately €124 million (plus accrued interest) of withholding tax credits against the Firm's corporation tax liabilities for the tax years 2007 to 2013. The Dutch Authority alleges that the Firm was not entitled to receive the withholding tax credits on the basis, inter alia, that a Firm subsidiary did not hold legal title to certain securities subject to withholding tax on the relevant dates. The Dutch Authority has also alleged that the Firm failed to provide certain information to the Dutch Authority and keep adequate books and records. The Firm does not agree with these allegations. A hearing regarding this matter has been scheduled on September 19, 2017.
Other
Beginning in February of 2016, the Firm was named as a defendant in multiple purported antitrust class actions now consolidated into a single proceeding in the United States District Court for the Southern District of New York styled In Re: Interest Rate Swaps Antitrust Litigation . Plaintiffs allege, inter alia, that the Firm, together with a number of other financial institution defendants violated United States and
New York state antitrust laws from 2008 through December of 2016 in connection with their alleged efforts to prevent the development of electronic exchange-based platforms for interest rates swaps trading. Complaints were filed both on behalf of a purported class of investors who purchased interest rates swaps from defendants, as well as on behalf of two swap execution facilities that allegedly were thwarted by the defendants in their efforts to develop such platforms. The consolidated complaints seek, among other relief, certification of the investor class of plaintiffs and treble damages. On July 28, 2017, the court granted in part and denied in part the defendants' motion to dismiss the complaints.
On June 2, 2015, the Firm submitted to the Environmental Protection Agency ("EPA") a self-disclosure that certain reformulated blendstock the Firm blended and sold during 2013 and 2014 potentially did not meet the applicable volatile organic compound reduction standards of the EPA's Phase II Reformulated Gasoline standard. On July 7, 2017, the EPA made a settlement demand of approximately $1 million. Further discussions between the parties are ongoing.
| 97 | June 2017 Form 10-Q |
| |
Unregistered Sales of Equity Securities and Use of Proceeds
The following table sets forth the information with respect to purchases made by or on behalf of the Firm of its common stock during the quarterly period ended June 30, 2017.
Issuer Purchases of Equity Securities
| $ in millions, except per share data | Total Number of Shares Purchased | Average Price Paid Per Share | Total Number of Shares Purchased as Part of Publicly Announced Plans or Programs 1 | Approximate Dollar Value of Shares that May Yet be Purchased Under the Plans or Programs | ||||||||||||
Month #1 (April 1, 2017-April 30, 2017) | ||||||||||||||||
Share Repurchase Program 2 | 1,050,000 | $ | 43.04 | 1,050,000 | $ | 455 | ||||||||||
Employee transactions 3 | 1,049,776 | $ | 40.86 | - | - | |||||||||||
Month #2 (May 1, 2017-May 31, 2017) | ||||||||||||||||
Share Repurchase Program 2 | 5,728,000 | $ | 42.89 | 5,728,000 | $ | 209 | ||||||||||
Employee transactions 3 | 82,728 | $ | 43.36 | - | - | |||||||||||
Month #3 (June 1, 2017-June 30, 2017) | ||||||||||||||||
Share Repurchase Program 2 | 4,765,281 | $ | 43.89 | 4,765,281 | $ | 5,000 | ||||||||||
Employee transactions 3 | 29,687 | $ | 42.57 | - | - | |||||||||||
Quarter ended at June 30, 2017 | ||||||||||||||||
Share Repurchase Program 2 | 11,543,281 | $ | 43.32 | 11,543,281 | $ | 5,000 | ||||||||||
Employee transactions 3 | 1,162,191 | $ | 41.09 | - | - | |||||||||||
| 1. | Share purchases under publicly announced programs are made pursuant to open-market purchases, Rule 10b5-1 plans or privately negotiated transactions (including with employee benefit plans) as market conditions warrant and at prices the Firm deems appropriate and may be suspended at any time. |
| 2. | The Firm's Board of Directors has authorized the repurchase of the Firm's outstanding stock under a share repurchase program (the "Share Repurchase Program"). The Share Repurchase Program is a program for capital management purposes that considers, among other things, business segment capital needs, as well as equity-based compensation and benefit plan requirements. The Share Repurchase Program has no set expiration or termination date. Share repurchases by the Firm are subject to regulatory approval. On June 28, 2017, the Board of Governors of the Federal Reserve System (the "Federal Reserve") announced that they did not object to our 2017 capital plan, which included a share repurchase of up to $5.0 billion of the Firm's outstanding common stock during the period beginning July 1, 2017 through June 30, 2018. During the three months ended June 30, 2017, the Firm repurchased approximately $500 million of the Firm's outstanding common stock as part of its Share Repurchase Program. For further information, see "Management's Discussion and Analysis of Financial Condition and Results of Operations-Liquidity and Capital Resources-Capital Management". |
| 3. | Includes shares acquired by the Firm in satisfaction of the tax withholding obligations on stock-based awards and the exercise of stock options granted under the Firm's stock-based compensation plans. |
Exhibits
An exhibit index has been filed as part of this Report on page E-1.
| June 2017 Form 10-Q | 98 |
| |
SIGNATURES
Pursuant to the requirements of the Securities Exchange Act of 1934, the Registrant has duly caused this report to be signed on its behalf by the undersigned thereunto duly authorized.
MORGAN STANLEY (Registrant) | ||
By: | / S / J ONATHAN P RUZAN | |
Jonathan Pruzan Executive Vice President and Chief Financial Officer | ||
By: | / S / P AUL C. W IRTH | |
Paul C. Wirth Deputy Chief Financial Officer | ||
Date: August 3, 2017
| 99 | June 2017 Form 10-Q |
Exhibit Index
Morgan Stanley
Quarter Ended June 30, 2017
| Exhibit No. | Description | |
| 12 | Statement Re: Computation of Ratio of Earnings to Fixed Charges and Computation of Earnings to Fixed Charges and Preferred Stock Dividends. | |
| 15 | Letter of awareness from Deloitte & Touche LLP, dated August 3, 2017, concerning unaudited interim financial information. | |
| 31.1 | Rule 13a-14(a) Certification of Chief Executive Officer. | |
| 31.2 | Rule 13a-14(a) Certification of Chief Financial Officer. | |
| 32.1 | Section 1350 Certification of Chief Executive Officer. | |
| 32.2 | Section 1350 Certification of Chief Financial Officer. | |
| 101 | Interactive data files pursuant to Rule 405 of Regulation S-T: (i) the Consolidated Income Statements-Three Months and Six Months Ended June 30, 2017 and 2016, (ii) the Consolidated Comprehensive Income Statements-Three Months and Six Months Ended June 30, 2017 and 2016, (iii) the Consolidated Balance Sheets-June 30, 2017 and December 31, 2016, (iv) the Consolidated Statements of Changes in Total Equity-Six Months Ended June 30, 2017 and 2016, (v) the Consolidated Cash Flow Statements-Six Months Ended June 30, 2017 and 2016, and (vi) Notes to Consolidated Financial Statements (unaudited). | |
E-1