UNITED STATES
SECURITIES AND EXCHANGE COMMISSION
WASHINGTON, D.C. 20549
FORM 10-K
ANNUAL REPORT PURSUANT TO SECTION 13 OR 15(d) OF THE
SECURITIES EXCHANGE ACT OF 1934
For the fiscal year ended September 30, 2013
Commission File Number 1-13783

Integrated Electrical Services, Inc.
(Exact name of registrant as specified in its charter)
| Delaware | 76-0542208 | |
(State or other jurisdiction of incorporation or organization) | (I.R.S. Employer Identification No.) |
5433 Westheimer Road, Suite 500, Houston, Texas, 77056
(Address of principal executive offices and ZIP code)
Registrant's telephone number, including area code: (713) 860-1500
Securities registered pursuant to Section 12(b) of the Act:
Title of each class | Name of each exchange on which registered | |
| Common Stock, par value $0.01 per share | NASDAQ |
Securities registered pursuant to Section 12(g) of the Act: None
Indicate by check mark if the Registrant is a well-known seasoned issuer, as defined in Rule 405 of the Securities Act. Yes ¨ No x
Indicate by check mark if the Registrant is not required to file reports pursuant to Section 13 or 15(d) of the Securities Exchange Act of 1934. Yes ¨ No x
Indicate by check mark whether the Registrant (1) has filed all reports required to be filed by Section 13 or 15(d) of the Securities Exchange Act of 1934 during the preceding 12 months (or for such shorter period that the Registrant was required to file such reports), and (2) has been subject to such filing requirements for the past 90 days. Yes x No ¨
Indicate by check mark whether the registrant has submitted electronically and posted on its corporate Web site, if any, every Interactive Data File required to be submitted and posted pursuant to Rule 405 of Regulation S-T (§232.405 of this chapter) during the preceding 12 months (or for such shorter period that the registrant was required to submit and post such files). Yes x No ¨
Indicate by check mark if disclosure of delinquent filers pursuant to Item 405 of Regulation S-K is not contained herein, and will not be contained, to the best of the Registrant's knowledge, in definitive proxy or information statements incorporated by reference in Part III of this Form 10-K or any amendment to this Form 10-K. ¨
Indicate by check mark whether the Registrant is a large accelerated filer, an accelerated filer, a non-accelerated filer, or a smaller reporting company. See the definitions of "large accelerated filer", "accelerated filer" and "smaller reporting company" in Rule 12b-2 of the Exchange Act. (Check one):
| Large accelerated filer | ¨ | Accelerated filer | ¨ | |||
| Non-accelerated filer | x (Do not check if a smaller reporting company) | Smaller reporting company | ¨ | |||
Indicate by check mark whether the Registrant is a shell company (as defined in Rule 12b-2 of the Exchange Act). Yes ¨ No x
The aggregate market value of the voting stock of the Registrant on March 29, 2013 held by non-affiliates was approximately $31.9 million. On December 16, 2013, there were 17,841,640 shares of common stock outstanding.
DOCUMENTS INCORPORATED BY REFERENCE
Certain information contained in the Proxy Statement for the 2014 Annual Meeting of Stockholders of the Registrant to be held on February 4, 2014 is incorporated by reference into Part III of this Form 10-K.
FORM 10-K
INTEGRATED ELECTRICAL SERVICES, INC.
Table of Contents
| Page | ||||||
| PART I | ||||||
DEFINITIONS | 1 | |||||
DISCLOSURE REGARDING FORWARD LOOKING STATEMENTS | 1 | |||||
Item 1 | BUSINESS | 3 | ||||
Item 1A | RISK FACTORS | 11 | ||||
Item 1B | UNRESOLVED STAFF COMMENTS | 15 | ||||
Item 2 | PROPERTIES | 15 | ||||
Item 3 | LEGAL PROCEEDINGS | 15 | ||||
Item 4 | MINE SAFETY DISCLOSURES | 16 | ||||
| PART II | ||||||
Item 5 | MARKET FOR REGISTRANT'S COMMON EQUITY; RELATED STOCKHOLDER MATTERS AND ISSUER PURCHASES OF EQUITY SECURITIES | 16 | ||||
Item 6 | SELECTED FINANCIAL DATA | 18 | ||||
Item 7 | MANAGEMENT'S DISCUSSION AND ANALYSIS OF FINANCIAL CONDITION AND RESULTS OF OPERATIONS | 19 | ||||
Item 7A | QUANTITATIVE AND QUALITATIVE DISCLOSURES ABOUT MARKET RISK | 34 | ||||
Item 8 | FINANCIAL STATEMENTS AND SUPPLEMENTARY DATA | 35 | ||||
Item 9 | CHANGES IN AND DISAGREEMENTS WITH ACCOUNTANTS ON ACCOUNTING AND FINANCIAL DISCLOSURE | 75 | ||||
Item 9A | CONTROLS AND PROCEDURES | 75 | ||||
Item 9B | OTHER INFORMATION | 75 | ||||
PART III | ||||||
Item 10 | DIRECTORS, EXECUTIVE OFFICERS AND CORPORATE GOVERNANCE | 76 | ||||
Item 11 | EXECUTIVE COMPENSATION | 76 | ||||
Item 12 | SECURITY OWNERSHIP OF CERTAIN BENEFICIAL OWNERS AND MANAGEMENT AND RELATED STOCKHOLDER MATTERS | 76 | ||||
Item 13 | CERTAIN RELATIONSHIPS AND RELATED TRANSACTIONS AND DIRECTOR INDEPENDENCE | 77 | ||||
Item 14 | PRINCIPAL ACCOUNTANT FEES AND SERVICES | 77 | ||||
PART IV | ||||||
Item 15 | EXHIBITS AND FINANCIAL STATEMENT SCHEDULES | 77 | ||||
SIGNATURES | 81 | |||||
EX-21.1 | ||||||
EX-23.1 | ||||||
EX-31.1 | ||||||
EX-31.2 | ||||||
EX-32.1 | ||||||
EX-32.2 | ||||||
PART I
DEFINITIONS
In this Annual Report on Form 10-K, the words "IES", the "Company", the "Registrant", "we", "our", "ours" and "us" refer to Integrated Electrical Services, Inc. and, except as otherwise specified herein, to our subsidiaries.
DISCLOSURE REGARDING FORWARD-LOOKING STATEMENTS
This Annual Report on Form 10-K includes certain statements that may be deemed "forward-looking statements" within the meaning of Section 27A of the Securities Act of 1933 and Section 21E of the Securities Exchange Act of 1934, all of which are based upon various estimates and assumptions that the Company believes to be reasonable as of the date hereof. In some cases, you can identify forward-looking statements by terminology such as "may," "will," "could," "should," "expect," "plan," "project," "intend," "anticipate," "believe," "seek," "estimate," "predict," "potential," "pursue," "target," "continue," the negative of such terms or other comparable terminology. These statements involve risks and uncertainties that could cause the Company's actual future outcomes to differ materially from those set forth in such statements. Such risks and uncertainties include, but are not limited to:
| • | the ability of our controlling shareholder to take action not aligned with other shareholders; |
| • | the sale or disposition of the shares of our common stock held by our majority shareholder, which, under certain circumstances, would trigger change of control provisions in our severance plan or financing and surety arrangements; |
| • | the possibility that certain tax benefits of our net operating losses may be restricted or reduced in a change in ownership; |
| • | limitations on the availability of sufficient credit or cash flow to fund our working capital needs and capital expenditures and debt service; |
| • | difficulty in fulfilling the covenant terms of our credit facilities; |
| • | competition in our respective industries, both from third parties and former employees, which could result in the loss of one or more customers or lead to lower margins on new projects; |
| • | the inability to achieve, or difficulties and delays in achieving, potential benefits of the acquisition of MISCOR Group, Ltd; |
| • | challenges integrating other new businesses into the Company or new types of work, products or processes into our segments; |
| • | fluctuations in operating activity due to downturns in levels of construction, seasonality and differing regional economic conditions; |
| • | a general reduction in the demand for our services; |
| • | a change in the mix of our customers, contracts and business; |
| • | our ability to successfully manage projects; |
| • | possibility of errors when estimating revenue and progress to date on percentage-of-completion contracts; |
| • | additional closures or sales of facilities could result in significant future charges and a significant disruption of our operations; |
| • | inaccurate estimates used when entering into fixed-priced contracts; |
| • | the cost and availability of qualified labor; |
| • | increased cost of surety bonds affecting margins on work and the potential for our surety providers to refuse bonding or require additional collateral at their discretion; |
| • | increases in bad debt expense and days sales outstanding due to liquidity problems faced by our customers; |
1
| • | the recognition of potential goodwill, long-lived assets and other investment impairments; |
| • | credit and capital market conditions, including changes in interest rates that affect the cost of construction financing and mortgages, and the inability for some of our customers to retain sufficient financing which could lead to project delays or cancellations; |
| • | accidents resulting from the physical hazards associated with our work and the potential for accidents; |
| • | our ability to pass along increases in the cost of commodities used in our business, in particular, copper, aluminum, steel, fuel and certain plastics; |
| • | potential supply chain disruptions due to credit or liquidity problems faced by our suppliers; |
| • | loss of key personnel and effective transition of new management; |
| • | success in transferring, renewing and obtaining electrical and construction licenses; |
| • | uncertainties inherent in estimating future operating results, including revenues, operating income or cash flow; |
| • | disagreements with taxing authorities with regard to tax positions we have adopted; |
| • | the recognition of tax benefits related to uncertain tax positions; |
| • | complications associated with the incorporation of new accounting, control and operating procedures; |
| • | the financial impact of new or proposed accounting regulations; |
| • | the effect of litigation, claims and contingencies, including warranty losses, damages or other latent defect claims in excess of our existing reserves and accruals; |
| • | warranty losses or other unexpected liabilities stemming from former segments which we have sold or closed; |
| • | growth in latent defect litigation in states where we provide residential electrical work for home builders not otherwise covered by insurance; |
| • | changes in the assumptions made regarding future events used to value our stock options and performance-based stock awards; |
| • | the ability of IES to enter into, and the terms of, future contracts; |
| • | the inability to carry out plans and strategies as expected; |
| • | future capital expenditures and refurbishment, repair and upgrade costs; and delays in and costs of refurbishment, repair and upgrade projects; and |
| • | liabilities under laws and regulations protecting the environment. |
You should understand that the foregoing, as well as other risk factors discussed in this document, including those listed in Part I, Item 1A of this report under the heading " Risk Factors ", could cause future outcomes to differ materially from those experienced previously or those expressed in such forward-looking statements. We undertake no obligation to publicly update or revise any information, including information concerning our controlling shareholder, net operating losses, borrowing availability, cash position, or any forward-looking statements to reflect events or circumstances that may arise after the date of this report. Forward-looking statements are provided in this Form 10-K pursuant to the safe harbor established under the Private Securities Litigation Reform Act of 1995 and should be evaluated in the context of the estimates, assumptions, uncertainties and risks described herein.
2
| Item 1. | Business |
OVERVIEW OF OUR SERVICES
Integrated Electrical Services, Inc. is a holding company that owns and manages subsidiaries' operating across a variety of end markets. Our operations are currently organized into four principal business segments, based upon the nature of our current products and services:
| • | Communications – Nationwide provider of products and services for mission critical infrastructure, such as data centers, of large corporations. |
| • | Residential – Regional provider of electrical installation services for single-family housing and multi-family apartment complexes. |
| • | Commercial & Industrial – Provider of electrical design, construction, and maintenance services to the commercial and industrial markets in various regional markets and nationwide in certain areas of expertise, such as the power infrastructure market. |
| • | Infrastructure Solutions – Provider of industrial and rail services, and electrical and mechanical solutions to domestic and international customers. This segment was created in connection with the acquisition of MISCOR Group, Ltd. in September 2013, as described further below under Corporate Strategy. |
Our businesses are managed in a decentralized manner. While sharing common goals and values, each of the Company's segments manages its own day-to-day operations. Our corporate office is focused on significant capital allocation decisions, investment activities and selection of segment leadership, as well as strategic and operational improvement initiatives and the establishment and monitoring of risk management practices within our segment.
CORPORATE STRATEGY
We seek to create shareholder value through positive returns on capital and generation of free cash flow. In addition, we seek to acquire or invest in similar stand-alone platform companies based in North America or acquire businesses that strategically fit within our existing business segments. In evaluating potential acquisition candidates, we seek to invest in businesses with, among other characteristics:
| • | Significant market share in niche industries and low technological and/or product obsolescence risk; |
| • | Proven management with a willingness to continue post acquisition; |
| • | Established market position and sustainable advantage; |
| • | High returns on invested capital; and |
| • | Strong cash flow characteristics. |
We believe that acquisitions provide an opportunity to expand into new end markets and diversify our revenue and profit streams. Further, by acquiring businesses with strong cash flow characteristics we expect to maximize the value of our significant net operating loss carry forwards ("NOLs"). While we may use acquisitions to build our presence in the electrical infrastructure industry, we will also consider potential acquisitions in other industries, which could result in changes in our operations from those historically conducted by us.
Integrated Electrical Services, Inc. is a Delaware corporation established in 1997 and headquartered in Houston, Texas, with its executive office in Greenwich, Connecticut.
A majority of our outstanding common stock is owned by Tontine Capital Partners, L.P. and its affiliates (collectively, "Tontine"). On September 13, 2013, Tontine filed an amended Schedule 13D indicating its ownership level of 58%. As a result, Tontine can control most of our affairs, including any action requiring the approval of shareholders, such as the approval of any potential merger or sale of all or substantially all assets, segments, or the Company itself. While Tontine is subject to restrictions under federal securities laws on sales of its shares as an affiliate, Tontine is party to a Registration Rights Agreement with the Company under which it has the ability, subject to certain restrictions, to demand registration of its shares in order to permit unrestricted sales of those shares. On February 20, 2013, pursuant to the Registration Rights Agreement, Tontine delivered a request to the Company for registration of all of its shares of IES common stock, and on February 21, 2013, the Company filed a shelf registration statement (as amended, the "Shelf Registration Statement") to register Tontine's shares. The Shelf Registration Statement was declared effective by the U.S. Securities and Exchange Commission ("SEC") on June 18, 2013. As long as the Shelf Registration Statement remains effective, Tontine has the ability to resell any or all of its shares from time to time in one or more offerings, as described in the Shelf Registration Statement and in any prospectus supplement filed in connection with an offering pursuant to the Shelf Registration Statement. Additionally, a
3
change in control would trigger the change of control provisions in a number of our material agreements, including our credit facility, bonding agreements with our sureties and our executive severance plan. For more information see Note 3, "Controlling Shareholder" in the notes to our Consolidated Financial Statements.
Net Operating Loss Carry Forward
The Company and certain of its subsidiaries have a federal NOL of approximately $466 million at September 30, 2013, including approximately $141 million resulting from the additional amortization of personal goodwill. A change in ownership, as defined by Internal Revenue Code Section 382, could reduce the availability of net operating losses for federal and state income tax purposes. Should Tontine sell or otherwise dispose of all or a portion of its position in IES, a change in ownership could occur. In addition a change in ownership could result from the purchase of common stock by an existing or a new 5% shareholder as defined by Internal Revenue Code Section 382. Should a change in ownership occur, all net operating losses incurred prior to the change in ownership would be subject to limitation imposed by Internal Revenue Code Section 382, which would substantially reduce the amount of NOL currently available to offset taxable income. For more information see Item 8, " Financial Statements and Supplementary Data " of this Form 10-K.
On January 28, 2013, the Company implemented a tax benefit protection plan (the "NOL Rights Plan") that was designed to deter an acquisition of the Company's stock in excess of a threshold amount that could trigger a change of control within the meaning of Internal Revenue Code Section 382. The NOL Rights Plan was filed as an Exhibit to our Current Report on Form 8-K filed with the SEC on January 28, 2013 and any description thereof is qualified in its entirety by the terms of the NOL Rights Plan.
MISCOR Acquisition
On September 13, 2013, the Company completed its acquisition of MISCOR Group, Ltd. ("the Merger"). MISCOR Group, Ltd. ("MISCOR") is a provider of electrical and mechanical solutions to domestic and international customers. The acquisition of MISCOR is part of IES' strategic plan to invest in companies that meet our strategic and financial criteria and allow us to accelerate the utilization of our NOLs.
In connection with to the Merger, IES issued approximately 2.8 million shares of common stock and paid approximately $4.1 million in cash to MISCOR shareholders. The shares of IES common stock issued to MISCOR shareholders in connection with the Merger represent approximately 15.6% of the shares of IES common stock issued and outstanding immediately after the Merger.
Tontine owned approximately 49.9% of MISCOR prior to the Merger and elected to receive stock consideration in exchange for 100% of its shares of MISCOR common stock tendered in connection with the Merger, such that, according to its amended Schedule 13D filed on September 13, 2013, its ownership of IES increased from approximately 56.7% immediately prior to the Merger to approximately 58.0% immediately following the Merger.
In connection with the Merger, the Company entered into an amendment to the existing term loan with Wells Fargo Bank, National Association, in the amount of $13.1 million, the proceeds of which were used to pay the cash component of the merger consideration, to repay outstanding MISCOR debt and to pay certain transaction expenses associated with the Merger. For more information on the Merger and the acquisition term loan, see Note 20, "Business Combination" , in the notes to our Consolidated Financial Statements. The Agreement and Plan of Merger, First Amendment to Agreement and Plan of Merger, and Second Amendment to Credit and Security Agreement, dated September 13, 2013, by and among the Company, each of the other Borrowers and Guarantors named therein and Wells Fargo Bank, National Association, are filed as Exhibits to this Form 10-K.
The MISCOR business will be reported as a new operating segment, Infrastructure Solutions, as shown below.
OPERATING SEGMENTS
The Company's reportable segments consist of the consolidated operating units identified above, which offer different products and services and are managed separately. The table below describes the percentage of our total revenues attributable to each of our four segments over each of the last three years:
| Years Ended September 30, | ||||||||||||||||||||||||
| 2013 | 2012 | 2011 | ||||||||||||||||||||||
| $ | % | $ | % | $ | % | |||||||||||||||||||
| (Dollars in thousands, Percentage of revenues) | ||||||||||||||||||||||||
Communications | $ | 126,348 | 25.5 | % | $ | 121,492 | 26.6 | % | $ | 83,615 | 20.6 | % | ||||||||||||
Residential | 162,611 | 32.9 | % | 129,974 | 28.5 | % | 114,732 | 28.2 | % | |||||||||||||||
Commercial & Industrial | 203,481 | 41.1 | % | 204,649 | 44.9 | % | 207,794 | 51.2 | % | |||||||||||||||
Infrastructure Solutions (1) | 2,153 | 0.5 | % | - | - | - | - | |||||||||||||||||
|
|
|
|
|
|
|
|
|
|
|
| |||||||||||||
Total Consolidated | $ | 494,593 | 100.0 | % | $ | 456,115 | 100.0 | % | $ | 406,141 | 100.0 | % | ||||||||||||
|
|
|
|
|
|
|
|
|
|
|
| |||||||||||||
| (1) | Includes revenues from MISCOR subsequent to acquisition on September 13, 2013. |
4
For additional financial information by segment, see Note 11, "Operating Segments" in the notes to our Consolidated Financial Statements. The residential, industrial, mission critical infrastructure and commercial industries in which we operate are exposed to many regional and national trends such as the demand for single and multi-family housing, the need for mission critical facilities as a result of technology-driven advancements, and changes in commercial, industrial, institutional, public infrastructure and electric utility spending. For a further discussion of the industries in which we operate, please see the discussion below of each of our segments.
Communications
Business Description
Originally established in 1984, our Communications segment is a leading provider of network infrastructure products and services for data centers and other mission critical environments. Services offered include the design, installation and maintenance of network infrastructure for the financial, medical, hospitality, government, high-tech manufacturing, educational and information technology industries. We also provide the design and installation of audio/visual, telephone, fire, wireless and intrusion alarm systems as well as design/build, service and maintenance of data network systems. A significant portion of our Communications revenue is generated from long-term, repeat customers, some of whom use IES as a preferred provider for major projects. We perform services across the United States from our ten offices, which includes our Communications headquarters located in Tempe, Arizona, allowing dedicated onsite maintenance teams at our customers' sites.
Industry Overview
Our Communications segment is driven by demand increases for computing and storage resources as a result of technology advancements and changes in data consumption patterns. We believe this trend towards increased data storage and retrieval on the "cloud" will continue to grow the data center segment of this industry. Additionally, devices continue to require greater bandwidth and interconnectivity. Nevertheless, due to economic, technological and other factors, there can be no assurance that construction and demand will continue to increase.
Sales and Marketing
We primarily specialize in installations of communication systems, and site and national account support for the mission critical infrastructure of Fortune 500 corporations. Our sales strategy relies on a concentrated business development effort, with centralized corporate marketing programs and direct end-customer communications and relationships. Due to the mission critical nature of the facilities we service, our end-customers significantly rely upon our past performance record, technical expertise and specialized knowledge. Our long-term strategy is to improve our position as a preferred mission critical solutions and services provider to large national corporations and strategic local companies. Key elements of our long-term strategy include continued investment in our employees' technical expertise and expansion of our onsite maintenance and recurring revenue model.
Competition
Our competition consists of both small, privately owned contractors who have limited access to capital and large public companies. We compete on quality of service and/or price, and seek to emphasize our long history of delivering high quality solutions to our customers.
Seasonality and Quarterly Fluctuations
The effects of seasonality on our Communications business are insignificant, as work generally is performed inside structures protected from the weather. Our service and maintenance business is also generally not affected by seasonality. In addition, the construction industry has historically been highly cyclical. Our volume of business may be adversely affected by declines in construction projects resulting from adverse regional or national economic conditions. Quarterly results may also be materially affected by the timing of new construction projects. Accordingly, operating results for any fiscal period are not necessarily indicative of results that may be achieved for any subsequent fiscal period.
Residential
Business Description
Residential provides electrical installation services for single-family housing and multi-family apartment complexes and CATV cabling installations for residential and light commercial applications. In addition to our core electrical construction work, the
5
Residential segment also provides services for the installation of residential solar power, smart meters, and electric car charging stations, both for new construction and existing residences. The Residential segment is made up of 24 total locations, which includes the headquarters in Houston. These locations geographically cover Texas, the Sun-Belt, and the Western and Mid-Atlantic regions of the United States, including Hawaii.
Industry Overview
Our Residential business is closely correlated to the single and multi-family housing market in the United States and our installation capabilities have the ability to effectively scale according to the housing cycle. Demand for both single-family and multi-family housing has increased with the economic recovery. Nevertheless, due to economic, technological or other factors there can be no assurance that construction and demand will continue to increase in the future.
Sales and Marketing
Demand for our Residential services is highly dependent on the number of single-family and multi-family home starts in the markets we serve. Although we operate in multiple states throughout the Sun-Belt, Mid-Atlantic and western regions of the United States, the majority of our segment revenues are derived from services provided in the state of Texas. Our sales efforts include a variety of strategies, including a concentrated focus on national homebuilders and multi-family developers and a local sales strategy for single and multi-family housing projects. Our cable, solar and electric car charging station revenues are typically generated through industry-specific third parties to which we act as a preferred provider of installation services.
Our long-term strategy is to continue to be the leading national provider of electrical services to the residential market. Although the key elements of our long-term strategy include a continued focus on maintaining a low and variable cost structure and cash generation, during the housing downturn we modified our strategy by expanding into markets less exposed to national building cycles, such as solar panel and electric car charging installations.
Competition
Our competition primarily consists of small, privately owned contractors who have limited access to capital. We believe that we have a competitive advantage over these smaller competitors due to our key employees' long-standing customer relationships, our financial capabilities, and our local market knowledge and competitive pricing. There are few barriers to entry for our electrical contracting services in the residential markets.
Seasonality and Quarterly Fluctuations
Results of operations from our Residential segment can be seasonal, depending on weather trends, with typically higher revenues generated during spring and summer and lower revenues during fall and winter. Our service and maintenance business is generally not affected by seasonality. In addition, the construction industry has historically been highly cyclical. Our volume of business may be adversely affected by declines in construction projects resulting from adverse regional or national economic conditions. Quarterly results may also be materially affected by the timing of new construction projects. Accordingly, operating results for any fiscal period are not necessarily indicative of results that may be achieved for any subsequent fiscal period.
Commercial & Industrial
Business Description
This segment offers a broad range of electrical design, construction, renovation, engineering and maintenance services to the commercial and industrial markets. The Commercial & Industrial segment consists of 18 total locations, which includes the segment headquarters in Houston, Texas. These locations geographically cover Texas, Nebraska, Colorado, Oregon and the Mid-Atlantic region.
Services include the design of electrical systems within a building or complex and procurement and installation of wiring and connection to power sources, end-use equipment and fixtures, as well as contract maintenance. We focus on projects that require special expertise, such as design-and-build projects that utilize the capabilities of our in-house experts, or projects which require specific market expertise, such as transmission and distribution projects. We also focus on service, maintenance and certain renovation and upgrade work, which tends to be either recurring or have lower sensitivity to economic cycles, or both. We provide services for a variety of projects, including: office buildings, manufacturing facilities, data centers, chemical plants, refineries, wind farms, solar facilities and municipal infrastructure and health care facilities. Our utility services consist of overhead and underground installation and maintenance of electrical and other utilities transmission and distribution networks, installation and splicing of high-voltage transmission and distribution lines, substation construction and substation and right-of-way maintenance. Our maintenance services generally provide recurring revenues that are typically less affected by levels of construction activity. Service and maintenance revenues are derived from service calls and routine maintenance contracts, which tend to be recurring and less sensitive to short-term economic fluctuations.
Industry Overview
Given the diverse end markets of our Commercial & Industrial customers, which include both commercial buildings, such as offices, healthcare facilities and schools, and industrial projects, such as power, chemical, refinery and heavy manufacturing facilities, we are subject to many trends within the construction industry. In general, demand for our Commercial & Industrial services is driven by construction and renovation activity levels, economic growth, and availability of bank lending. Due to economic, technological or other factors there can be no assurance that construction and demand will increase.
6
Sales and Marketing
Demand for our Commercial & Industrial services is driven by construction and renovation activity levels, economic growth, and availability of bank lending. Certain of our industrial projects have longer cycle times than our typical Commercial & Industrial services and may follow the economic trends with a lag. Our sales focus varies by location, but is primarily based upon regional and local relationships and a demonstrated expertise in certain industries, such as transmission and distribution.
Our long-term strategy has been modified over the past two years due to the downturn in the construction industry. Our long-term strategy is to be the preferred provider of electrical services in the markets where we have demonstrated expertise or are a local market leader. Key elements of our long-term strategy include leveraging our expertise in certain niche markets, expansion of our service and maintenance business and maintaining our focus on our returns on risk adjusted capital.
Competition
The electrical infrastructure services industry is generally highly competitive and includes a number of regional or small privately-held local firms. There are few barriers to entry for our electrical contracting services in the commercial and industrial markets, which limits our advantages when competing for projects. Industry expertise, project size, location and past performance will determine our bidding strategy, the level of involvement from competitors and our level of success in winning awards. Our primary advantages vary by location and market, but mostly are based upon local individual relationships with key employees or a demonstrated industry expertise. Additionally, due to the size of many of our projects, our financial resources help us compete effectively against local competitors.
Seasonality and Quarterly Fluctuations
The effects of seasonality on our Commercial & Industrial business are insignificant, as work generally is performed inside structures protected from the weather. Our service and maintenance business is also generally not affected by seasonality. In addition, the construction industry has historically been highly cyclical. Our volume of business may be adversely affected by declines in construction projects resulting from adverse regional or national economic conditions. Quarterly results may also be materially affected by the timing of new construction projects. Accordingly, operating results for any fiscal period are not necessarily indicative of results that may be achieved for any subsequent fiscal period.
Infrastructure Solutions
Business Description
Our Infrastructure Solutions segment provides maintenance and repair services to several industries, including electric motor repair and rebuilding for the steel, railroad, marine, petrochemical, pulp and paper, wind energy, mining, automotive and power generation industries. Infrastructure Solutions repairs and manufactures industrial lifting magnets for the steel and scrap industries, provides locomotive maintenance, remanufacturing, and repair services to the rail industry, and manufactures and rebuilds power assemblies, engine parts, and other components for large diesel engines. For more information see Note 20, " Business Combination " in the notes to our Consolidated Financial Statements.
Industry Overview
Given the diverse end-markets of Infrastructure Solutions' customers, we are subject to many economic trends. In general, demand for our products and services has been driven by in-house maintenance departments continuing to outsource maintenance and repair work, output levels and equipment utilization at heavy industrial facilities, railroad companies' capital investment in locomotives, and an overall improvement in the economy. Further, given our strategic locations in Ohio, Indiana, and West Virginia, we believe that we are well-positioned to capture spending on unconventional oil and gas exploration and production.
Sales and Marketing
Demand for Infrastructure Solutions' products and services is largely driven by the degree to which industrial and mechanical services are outsourced by our customers, production rates at steel, power generation and other heavy industrial facilities, the need for electrical infrastructure improvements, and spending on unconventional oil and gas exploration and production. Our sales effort is largely driven by personnel based at our nine locations and independent sales representatives. Given that the majority of our customers lie within a 200 mile radius of our facilities, we believe that this structure allows us to rapidly address and respond to the needs of our customers. Our long term strategy is to be the preferred provider of outsourced electro-mechanical and power assembly services, repairs, and manufacturing to our select markets.
Competition
Our competition is comprised mainly of small, specialized manufacturing and repair shops, a limited number of other multi-location providers of electric motor repair, engineering and maintenance services, and various original equipment manufacturers. Participants in this industry compete primarily on the basis of capabilities, service, quality, timeliness and, to a lesser extent, price. We believe that we have a competitive advantage over most small service providers due to our breadth of capabilities, focus on quality, technical support and customer service.
7
Raw Materials
The principal raw materials used in Infrastructure Solutions are copper, raw steel, and various flexible materials. Certain raw materials are obtained from a number of commercial sources at prevailing prices, and we do not depend on any single supplier for any substantial portion of raw materials. We obtain copper and raw steel from across the country through multiple sources. The cost to deliver copper and raw steel can limit the geographic areas from which we can obtain this material. Infrastructure Solutions attempts to minimize this risk by stocking adequate levels of key components. However, we may encounter problems from time to time in obtaining the raw materials necessary to conduct our Infrastructure Solutions business.
Seasonality and Quarterly Fluctuations
Infrastructure Solutions' revenues from industrial services may be affected by the timing of scheduled outages at its industrial customers' facilities and by weather conditions with respect to projects conducted outdoors, but the effects of seasonality on revenues in its industrial services business are insignificant. The effects of seasonality on revenues for rail services are also insignificant. Accordingly, Infrastructure Solutions' quarterly results may fluctuate and the results of one fiscal quarter may not be representative of the results of any other quarter or of the full fiscal year.
DISCONTINUED OPERATIONS
During the economic downturn we focused on return on capital and cash flow to maximize long-term shareholder value. As a result, beginning in 2011, we increased our focus on a number of initiatives to return the Company to profitability (the "2011 Restructuring Plan"). Included in these initiatives was the closure or sale of a number of facilities within our Commercial & Industrial segment and one location in our Communications segment. During 2011, we initiated the sale or closure of all or portions of our Commercial facilities in Arizona, Florida, Iowa, Maryland, Massachusetts, Nevada and Texas, our Industrial facility in Louisiana, and our Communications facility in Maryland. We have substantially concluded the closure of these facilities as of September 30, 2013. Results from operations of these facilities for the years ended September 30, 2013, 2012, and 2011 are presented in our Consolidated Statements of Comprehensive Income as discontinued operations. For further discussion of discontinued operations, please refer to Note 21, "Discontinued Operations" in the notes to our Consolidated Financial Statements. The 2011 Restructuring Plan is more fully described in Item 7. "Management's Discussion and Analysis of Financial Condition and Results of Operations – The 2011 Restructuring Plan" of this Form 10-K.
RISK MANAGEMENT
The primary risks in our existing operations include project bidding and management, bodily injury, property and environmental damage, and construction defects. We monitor project bidding and management practices at various levels within our company. We maintain automobile, general liability and construction defect insurance for third party health, bodily injury and property damage, pollution coverage and workers' compensation coverage, which we consider appropriate to insure against these risks. Our third-party insurance is subject to deductibles for which we establish reserves. In light of these risks, we are also committed to a strong safety and environmental compliance culture. We employ full-time and part-time regional safety managers, under the supervision of our full-time Vice President of Safety, and seek to maintain standardized safety and environmental policies, programs, procedures and personal protection equipment relative to each segment, including programs to train new employees, which apply to employees new to the industry and those new to the Company. To further emphasize our commitment to safety, we have also tied management incentives to specific safety performance results.
In the electrical contracting industry, our ability to post surety bonds provides us with an advantage over competitors that are smaller or have fewer financial resources. We believe that the strength of our balance sheet, as well as a good relationship with our bonding providers, enhances our ability to obtain adequate financing and surety bonds. For a further discussion of our risks, please refer to Item 1A. "Risk Factors" of this Form 10-K.
CUSTOMERS
We have a diverse customer base. During the twelve-month periods ended September 30, 2013, 2012 and 2011, no single customer accounted for more than 10% of our revenues. We will continue to emphasize developing and maintaining relationships with our customers by providing superior, high-quality service. Management at each of our segments is responsible for determining sales strategy and sales activities.
BACKLOG
Backlog is a measure of revenue that we expect to recognize from work that has yet to be performed on uncompleted contracts, and from work that has been contracted but has not started. Backlog is not a guarantee of future revenues, as contractual commitments may change. As of September 30, 2013, our backlog was approximately $204 million compared to $234 million as of September 30, 2012. There were multiple large projects included in the 2012 backlog that were not replicated in 2013, consistent with our operating principle of focusing on higher quality projects and margins rather than high project volume.
8
REGULATIONS
Our operations are subject to various federal, state and local laws and regulations, including:
| • | licensing requirements applicable to electricians; |
| • | building and electrical codes; |
| • | regulations relating to worker safety and protection of the environment; |
| • | regulations relating to consumer protection, including those governing residential service agreements; and |
| • | qualifications of our business legal structure in the jurisdictions where we do business. |
Many state and local regulations governing electricians require permits and licenses to be held by individuals. In some cases, a required permit or license held by a single individual may be sufficient to authorize specified activities for all our electricians who work in the state or county that issued the permit or license. It is our policy to ensure that, where possible, any permits or licenses that may be material to our operations in a particular geographic area are held by multiple employees within that area.
We believe we have all licenses required to conduct our operations and are in compliance with applicable regulatory requirements. Failure to comply with applicable regulations could result in substantial fines or revocation of our operating licenses or an inability to perform government work.
CAPITAL FACILITIES
During fiscal year 2013, the Company maintained a credit facility, as described in Item 7. "Management's Discussion and Analysis of Financial Condition and Results of Operations-Credit Facilities" of this Form 10-K. For a discussion of the Company's capital resources, see Item 7. "Management's Discussion and Analysis of Financial Condition and Results of Operations-Capital Resources" of this Form 10-K.
FINANCIAL INFORMATION
For information on the Company's financial information by segment, see Note 11, "Operating Segments" in the notes to our Consolidated Financial Statements.
EMPLOYEES
At September 30, 2013, we had 2,740 employees. We are party to two collective bargaining agreements within our Infrastructure Solutions segment. We believe that our relationship with our employees is strong.
LOCATIONS
We have 61 domestic locations serving the United States. In addition to our executive and corporate offices, we have ten locations within our Communications business, 24 locations within our Residential business, 18 locations within our Commercial & Industrial business and nine locations within our Infrastructure Solutions business. This diversity helps to reduce our exposure to unfavorable economic developments in any given region.
9
EXECUTIVE OFFICERS OF THE REGISTRANT
Certain information with respect to each executive officer is as follows:
James M. Lindstrom, 41, has served as President and Chief Executive Officer of the Company since October 3, 2011. He previously served as Interim President and Chief Executive Officer of the Company since June 30, 2011. Mr. Lindstrom was an employee at Tontine Associates, LLC, a private investment fund and an affiliate of our controlling shareholder Tontine from 2006 to October 3, 2011. From 2003 to 2006, Mr. Lindstrom was Chief Financial Officer of Centrue Financial Corporation, a regional financial services company, and had prior experience in private equity and investment banking. Mr. Lindstrom served as a director of Broadwind Energy, Inc. from October 2007 to May 2010 and has served as a board observer on multiple public and private boards.
Robert W. Lewey , 51, has served as Senior Vice President and Chief Financial Officer since January 20, 2012. From 2001 to 2006 and since 2007, Mr. Lewey served as Director of Tax, Vice President, Tax and Treasurer for IES. From 2006 to 2007, he served as Vice President, Tax for Sulzer US Holdings, Inc. From 1995 to 2001, Mr. Lewey served as Vice President, Tax for Metamor Worldwide, Inc., a leading provider of information technology solutions. Mr. Lewey began his career with Deloitte.
Gail D. Makode , 38, has served as Senior Vice President, General Counsel and Corporate Secretary since October 15, 2012. Ms. Makode was previously General Counsel and Member of the Board at MBIA Insurance Corporation and Chief Compliance Officer of MBIA Inc. Prior to MBIA, Ms. Makode served as vice president and counsel for Deutsche Bank AG, and before that, was an associate at Cleary, Gottlieb, Steen & Hamilton, where she specialized in public and private securities offerings and mergers and acquisitions.
We have adopted a Code of Ethics for Financial Executives that applies to our Chief Executive Officer, Chief Financial Officer and Chief Accounting Officer. The Code of Ethics may be found on our website at www.ies-corporate.com . If we make any substantive amendments to the Code of Ethics or grant any waiver, including any implicit waiver, from a provision of the code to our Chief Executive Officer, Chief Financial Officer or Chief Accounting Officer, we will disclose the nature of such amendment or waiver on that website or in a report on Form 8-K. Paper copies of these documents are also available free of charge upon written request to us.
AVAILABLE INFORMATION
General information about us can be found on our website at www.ies-corporate.com under "Investors." We file our interim and annual financial reports, as well as other reports required by the Securities Exchange Act of 1934, as amended (the "Exchange Act"), with the United States Securities and Exchange Commission (the "SEC").
Our annual report on Form 10-K, quarterly reports on Form 10-Q and current reports on Form 8-K, as well as any amendments and exhibits to those reports are available free of charge through our website as soon as it is reasonably practicable after we file them with, or furnish them to, the SEC. You may also contact our Investor Relations department and they will provide you with a copy of these reports. The materials that we file with the SEC are also available free of charge through the SEC website at www.sec.gov . You may also read and copy these materials at the SEC's Public Reference Room at 100 F Street, NE., Washington, D.C. 20549. Information on the operation of the Public Reference Room is available by calling the SEC at 1–800–SEC–0330.
In addition to the Code of Ethics for Financial Executives, we have adopted a Code of Business Conduct and Ethics for directors, officers and employees (the Legal Compliance and Corporate Policy Manual), and established Corporate Governance Guidelines and adopted charters outlining the duties of our Audit, Human Resources and Compensation and Nominating/Governance Committees, copies of which may be found on our website. Paper copies of these documents are also available free of charge upon written request to us. We have designated an "audit committee financial expert" as that term is defined by the SEC. Further information about this designee may be found in the Proxy Statement for the 2014 Annual Meeting of Stockholders of the Company.
10
Item 1A. Risk Factors
You should consider carefully the risks described below, as well as the other information included in this document before making an investment decision. Our business, results of operations or financial condition could be materially and adversely affected by any of these risks, and the value of your investment may decrease due to any of these risks.
Existence of a controlling shareholder.
A majority of our outstanding common stock is owned by Tontine Capital Partners, L.P. and its affiliates (collectively, "Tontine"). On September 13, 2013, Tontine filed an amended Schedule 13D indicating its ownership level of 58%. As a result, Tontine can control most of our affairs, including the election of our directors, who in turn appoint executive management, and can control any action requiring the approval of shareholders, including the adoption of amendments to our corporate charter and approval of any potential merger or sale of all or substantially all assets, segments, or the Company itself. This control also gives Tontine the ability to bring matters to a shareholder vote that may not be in the best interest of our other shareholders lenders, surety and customers. Additionally, Tontine is in the business of investing in companies and may, from time to time, acquire and hold interests in businesses that compete directly or indirectly with us or act as suppliers or customers of the Company.
Availability of net operating losses may be reduced by a change in ownership.
A change in ownership, as defined by Internal Revenue Code Section 382, could reduce the availability of net operating losses, ("NOLs"), for federal and state income tax purposes. Should Tontine sell or otherwise dispose of all or a portion of its position in IES, a change in ownership could occur. A change in ownership could also result from the purchase of common stock by an existing or a new 5% shareholder as defined by Internal Revenue Code Section 382. Currently, we have approximately $315 million of federal NOLs that are available to use to offset taxable income, exclusive of NOLs from the amortization of additional tax goodwill. Should a change in ownership occur, all NOLs incurred prior to the change in ownership would be subject to limitation imposed by Internal Revenue Code Section 382, which would substantially reduce the amount of NOL currently available to offset taxable income.
On January 28, 2013, we implemented the NOL Rights Plan, which was designed to deter an acquisition of the Company's stock in excess of a threshold amount that could trigger a change of control within the meaning of Internal Revenue Code Section 382. We can make no assurances the NOL Rights Plan will be effective in deterring a change in control or protecting or realizing NOLs.
To service our indebtedness and to fund working capital, we will require a significant amount of cash. Our ability to generate cash depends on many factors that are beyond our control.
Our ability to make payments on and to refinance our indebtedness and to fund working capital requirements will depend on our ability to generate cash in the future. This is subject to our operational performance, as well as general economic, financial, competitive, legislative, regulatory and other factors that are beyond our control.
We cannot provide assurance that our business will generate sufficient cash flow from operations or asset sales or that future borrowings will be available to us under our credit facility in an amount sufficient to enable us to pay our indebtedness or to fund our other liquidity needs. We may need to refinance all or a portion of our indebtedness, on or before maturity. We cannot provide assurance that we will be able to refinance any of our indebtedness on commercially reasonable terms, or at all. Our inability to refinance our debt on commercially reasonable terms could have a material adverse effect on our business.
We have restrictions and covenants under our credit facility.
We may not be able to remain in compliance with the covenants in our credit facility. A failure to fulfill the terms and requirements of our credit facility may result in a default under one or more of our material agreements, which could have a material adverse effect on our ability to conduct our operations and our financial condition.
The highly competitive nature of our industries could affect our profitability by reducing our profit margins.
With respect to electrical contracting services, the industries in which we compete are highly fragmented and are served by many small, owner-operated private companies. There are also several large private regional companies and a small number of large public companies from which we face competition in these industries. In the future, we could also face competition from new competitors entering these markets because certain segments, such as our electrical contracting services, have a relatively low barrier for entry while other segments, such as our services for mission critical infrastructure, have attractive dynamics. Some of our competitors offer a greater range of services, including mechanical construction, facilities management, plumbing and heating, ventilation and air conditioning services. Competition in our markets depends on a number of factors, including price. Some of our competitors may have lower overhead cost structures and may, therefore, be able to provide services comparable to ours at lower rates than we do. If we are unable to offer our services at competitive prices or if we have to reduce our prices to remain competitive, our profitability would be impaired.
11
The markets in which Infrastructure Solutions does business are highly competitive, and we do not expect the level of competition that we face to decrease in the future. An increase in competitive pressures in these markets or our failure to compete effectively may result in pricing reductions, reduced gross margins, and loss of market share. Many of the competitors of the acquired MISCOR business have longer operating histories, greater name recognition, more customers, and significantly greater financial, marketing, technical, and other competitive resources than we have. While the combined corporation presents the opportunity to leverage MISCOR's resources to improve financial results, our competitors may still be able to adapt more quickly to new technologies and changes in customer needs or devote greater resources to the development, promotion, and sale of their products and services. While we believe Infrastructure Solutions' overall product and service offerings distinguish it from its competitors, these competitors could develop new products or services that could directly compete with Infrastructure Solutions' products and services.
We may experience difficulties in integrating MISCOR's business and could fail to realize potential benefits of the merger.
Achieving the anticipated benefits of the merger will depend in part upon whether we are able to integrate MISCOR's business in an efficient and effective manner. We may not be able to complete this integration process smoothly or successfully. The difficulties of integrating MISCOR's business potentially will include, among other things:
| • | geographically separated organizations and possible differences in corporate cultures and management philosophies; |
| • | significant demands on management resources, which may distract management's attention from day-to-day business; |
| • | differences in the disclosure systems, compliance requirements, accounting systems, and accounting controls and procedures of the two companies, which may interfere with our ability to make timely and accurate public disclosure; and |
| • | the demands of managing new locations, new personnel and new lines of business acquired in the Merger. |
Any inability to realize the potential benefits of the Merger, as well as any delays in integration, could have an adverse effect upon our revenues, level of expenses and operating results, which may adversely affect the value of our common stock.
We may be unsuccessful at integrating other companies that we may acquire, or new types of work, products or processes into our segments.
We may engage in acquisitions and dispositions of operations, assets and investments, or develop new types of work, processes or products from time to time in the future. If we are unable to successfully integrate newly acquired assets or operations or if we make untimely or unfavorable dispositions of operations or investments, it could negatively impact the market value of our common stock. Additionally, any future acquisition or disposition may result in significant changes in the composition of our assets and liabilities, and as a result, our financial condition, results of operations and the market value of our common stock following any such acquisition or disposition may be affected by factors different from those currently affecting our financial condition, results of operations and market value of our common stock.
The current changing economic environment poses significant challenges for us.
Although general economic conditions have improved, the current economic environment continues to present challenges for our customers and us. While we have limited direct exposure to problems in Europe and the financial markets, we are nevertheless affected by general economic trends. Many of our customers depend on the availability of credit to purchase our services or electrical and mechanical products. Continued uncertainties or the return of constrained credit market conditions could have adverse effects on our customers, which would adversely affect our financial condition and results of operations. This continued uncertainty in economic conditions coupled with the on-going weak national economic recovery could have an adverse effect on our revenue and profits.
Changes in operating factors that are beyond our control could hurt our operating results.
Our operating results may fluctuate significantly in the future as a result of a variety of factors, many of which are beyond management's control. These factors include the costs of new technology; the relative speed and success with which Infrastructure Solutions can acquire customers for its products and services; capital expenditures for equipment; sales, marketing, and promotional activities expenses; changes in its pricing policies, suppliers, and competitors; changes in operating expenses; increased competition in the markets we serve; and other general economic and seasonal factors. Adverse changes in one or more of these factors could hurt our operating results.
Backlog may not be realized or may not result in profits.
Customers often have no obligation under our contracts to assign or release work to us, and many contracts may be terminated on short notice. Reductions in backlog due to cancellation of one or more contracts by a customer or for other reasons could significantly reduce the revenue and profit we actually receive from contracts included in backlog. In the event of a project cancellation, we may be reimbursed for certain costs but typically have no contractual right to the total revenues reflected in our backlog.
12
Our use of percentage-of-completion accounting could result in a reduction or elimination of previously reported profits.
As discussed in Item 7, " Management's Discussion and Analysis of Financial Condition and Results of Operations - Critical Accounting Policies" and in the notes to our Consolidated Financial Statements included in Item 8, " Financial Statements and Supplementary Data" of this Form 10-K, a significant portion of our revenues are recognized using the percentage-of-completion method of accounting, utilizing the cost-to-cost method. This method is used because management considers costs incurred to be the best available measure of progress on these contracts. We recognize costs for materials upon installation. The percentage-of-completion accounting practice we use results in our recognizing contract revenues and earnings ratably over the contract term in proportion to our incurrence of contract costs. The earnings or losses recognized on individual contracts are based on estimates of contract revenues, costs and profitability. Contract losses are recognized in full when determined to be probable and reasonably estimable and contract profit estimates are adjusted based on ongoing reviews of contract profitability. Further, a portion of our contracts contain various cost and performance incentives. Penalties are recorded when known or finalized, which generally occurs during the latter stages of the contract. In addition, we record cost recovery claims when we believe recovery is probable and the amounts can be reasonably estimated. Actual collection of claims could differ from estimated amounts and could result in a reduction or elimination of previously recognized earnings. In certain circumstances, it is possible that such adjustments could be significant.
We may incur significant charges or be adversely impacted by the closure or sale of additional facilities.
While, historically, we have incurred significant costs associated with the closure or disposition of facilities, we will continue to evaluate the need for facility closures or dispositions from time to time in the future. If we were to elect to dispose of a substantial portion of any of our segments, the realized values of such actions could be substantially less than current book values, which would likely result in a material adverse impact on our financial results.
The availability and cost of surety bonds affect our ability to enter into new contracts and our margins on those engagements.
Many of our customers require us to post performance and payment bonds issued by a surety. Those bonds guarantee the customer that we will perform under the terms of a contract and that we will pay subcontractors and vendors. We obtain surety bonds from two primary surety providers; however, there is no commitment from these providers to guarantee our ability to issue bonds for projects as they are required. Our ability to access this bonding capacity is at the sole discretion of our surety providers.
Due to seasonality and differing regional economic conditions, our results may fluctuate from period to period.
Our business is subject to seasonal variations in operations and demand that affect the construction business, particularly in the Residential and Commercial & Industrial segments, as well as seasonal variations in the industrial and rail industries in which Infrastructure Solutions participates. Untimely weather delay from rain, heat, ice, cold or snow can not only delay our work but can negatively impact our schedules and profitability by delaying the work of other trades on a construction site. Our quarterly results may also be affected by regional economic conditions that affect the construction market. Infrastructure Solutions' revenues from industrial services may be affected by the timing of scheduled outages at its industrial customers' facilities and by weather conditions with respect to projects conducted outdoors. Accordingly, our performance in any particular quarter may not be indicative of the results that can be expected for any other quarter or for the entire year.
The estimates we use in placing bids could be materially incorrect. The use of incorrect estimates could result in losses on a fixed price contract. These losses could be material to our business.
We currently generate, and expect to continue to generate, a significant portion of our revenues under fixed price contracts. The cost of fuel, labor and materials, including copper wire, may vary significantly from the costs we originally estimate. Variations from estimated contract costs along with other risks inherent in performing fixed price contracts may result in actual revenue and gross profits for a project differing from those we originally estimated, and could result in losses on projects. Depending upon the size of a particular project, variations from estimated contract costs can have a significant impact on our operating results.
Commodity and labor costs may fluctuate materially, and we may not be able to pass on all cost increases during the term of a contract, which could have an adverse effect on our ability to maintain our profitability.
We enter into many contracts at fixed prices, and if the costs associated with labor; and commodities such as copper, aluminum, steel, fuel and certain plastics increase, losses may be incurred. Some of these materials have been and may continue to be subject to sudden and significant price increases. Depending on competitive pressures and customer resistance, we may not be able to pass on these cost increases to our customers, which would reduce our gross profit margins and, in turn, make it more difficult for us to maintain our profitability.
We may experience difficulties in managing our billings and collections.
Our billings under fixed price contracts in our electrical contracting business are generally based upon achieving certain milestones and will be accepted by the customer once we demonstrate those milestones have been met. If we are unable to demonstrate compliance with billing requests, or if we fail to issue a project billing, our likelihood of collection could be delayed or impaired, which, if experienced across several large projects, could have a materially adverse effect on our results of operations.
13
Our reported operating results could be adversely affected as a result of goodwill impairment write-offs.
When we acquire a business, we record an asset called "goodwill" if the amount we pay for the business, including liabilities assumed, is in excess of the fair value of the assets of the business we acquire. Accounting principles generally accepted in the United States of America ("GAAP") requires that goodwill attributable to each of our reporting units be tested at least annually. The testing includes comparing the fair value of each reporting unit with its carrying value. Fair value is determined using discounted cash flows, market multiples and market capitalization. Significant estimates used in the methodologies include estimates of future cash flows, future short-term and long-term growth rates, weighted average cost of capital and estimates of market multiples for each of the reporting units. On an ongoing basis, we expect to perform impairment tests at least annually as of September 30. Impairment adjustments, if any, are required to be recognized as operating expenses. We cannot assure that we will not have future impairment adjustments to our recorded goodwill.
The vendors who make up our supply chain may be adversely affected by the current operating environment and credit market conditions.
We are dependent upon the vendors within our supply chain to maintain a steady supply of inventory, parts and materials. Many of our segments are dependent upon a limited number of suppliers, and significant supply disruptions could adversely affect our operations. Under recent market conditions, including both the construction slowdown and the tightening credit market, it is possible that one or more of our suppliers will be unable to meet the terms of our operating agreements due to financial hardships, liquidity issues or other reasons related to the prolonged market recovery.
Our operations are subject to numerous physical hazards. If an accident occurs, it could result in an adverse effect on our business.
Hazards related to our industry include, but are not limited to, electrocutions, fires, machinery-caused injuries, mechanical failures and transportation accidents. These hazards can cause personal injury and loss of life, severe damage to or destruction of property and equipment, and may result in suspension of operations. Our insurance does not cover all types or amounts of liabilities. Our third-party insurance is subject to deductibles for which we establish reserves. No assurance can be given that our insurance or our provisions for incurred claims and incurred but not reported claims will be adequate to cover all losses or liabilities we may incur in our operations; nor can we provide assurance that we will be able to maintain adequate insurance at reasonable rates.
Our internal controls over financial reporting and our disclosure controls and procedures may not prevent all possible errors that could occur. Internal controls over financial reporting and disclosure controls and procedures, no matter how well designed and operated, can provide only reasonable, not absolute, assurance that the control system's objective will be met.
On a quarterly basis we evaluate our internal controls over financial reporting and our disclosure controls and procedures, which include a review of the objectives, design, implementation and effectiveness of the controls and the information generated for use in our periodic reports. In the course of our controls evaluation, we sought (and seek) to identify data errors, control problems and to confirm that appropriate corrective actions, including process improvements, are being undertaken. This type of evaluation is conducted on a quarterly basis so that the conclusions concerning the effectiveness of our controls can be reported in our periodic reports.
A control system, no matter how well designed and operated, can provide only reasonable, not absolute, assurance that the control system's objectives will be satisfied. Internal controls over financial reporting and disclosure controls and procedures are designed to give reasonable assurance that they are effective and achieve their objectives. We cannot provide absolute assurance that all possible future control issues have been detected. These inherent limitations include the possibility that our judgments can be faulty, and that isolated breakdowns can occur because of human error or mistake. The design of our system of controls is based in part upon certain assumptions about the likelihood of future events, and there can be no assurance that any design will succeed absolutely in achieving our stated goals under all potential future or unforeseeable conditions. Because of the inherent limitations in a cost-effect control system, misstatements due to error could occur without being detected.
We have adopted tax positions that a taxing authority may view differently. If a taxing authority differs with our tax positions, our results may be adversely affected.
Our effective tax rate and cash paid for taxes are impacted by the tax positions that we have adopted. Taxing authorities may not always agree with the positions we have taken. We have established reserves for tax positions that we have determined to be less likely than not to be sustained by taxing authorities. However, there can be no assurance that our results of operations will not be adversely affected in the event that disagreement over our tax positions does arise.
14
Litigation and claims can cause unexpected losses.
In the construction business there are frequently claims and litigation. There are also inherent claims and litigation risks associated with the number of people that work on construction sites and the fleet of vehicles on the road every day. In all of our businesses, we are subject to potential claims and litigation. Claims are sometimes made and lawsuits filed for amounts in excess of their value or in excess of the amounts for which they are eventually resolved. Claims and litigation normally follow a predictable course of time to resolution. However, there may be periods of time in which a disproportionate amount of our claims and litigation are concluded in the same quarter or year. If multiple matters are resolved during a given period, then the cumulative effect of these matters may be higher than the ordinary level in any one reporting period.
Latent defect claims could expand.
Latent defect litigation is normal for residential home builders in some parts of the country; however, such litigation is increasing in certain states where we perform work. Also, in recent years, latent defect litigation has expanded to aspects of the commercial market. Should we experience similar increases in our latent defect claims and litigation, additional pressure may be placed on the profitability of the Residential and Commercial & Industrial segments of our business.
We may be required to conduct environmental remediation activities, which could be expensive and inhibit the growth of our business and our ability to maintain profitability, particularly in our Infrastructure Solutions business.
We are subject to a number of environmental laws and regulations, including those concerning the handling, treatment, storage, and disposal of hazardous materials. These laws predominately affect our Infrastructure Solutions business but may impact our other businesses. These environmental laws generally impose liability on present and former owners and operators, transporters and generators of hazardous materials for remediation of contaminated properties. We believe that our business is operating in compliance in all material respects with applicable environmental laws, many of which provide for substantial penalties for violations. There can be no assurance that future changes in such laws, interpretations of existing regulations or the discovery of currently unknown problems or conditions will not require substantial additional expenditures. In addition, if we do not comply with these laws and regulations, we could be subject to material administrative, civil or criminal penalties, or other liabilities. We may also be required to incur substantial costs to comply with current or future environmental and safety laws and regulations. Any such additional expenditures or costs that we may incur could hurt our operating results.
The loss of a group or several key personnel, either at the corporate or operating level, could adversely affect our business.
The loss of key personnel or the inability to hire and retain qualified employees could have an adverse effect on our business, financial condition and results of operations. Our operations depend on the continued efforts of our executive officers, senior management and management personnel at our segments. We cannot guarantee that any member of management at the corporate or subsidiary level will continue in their capacity for any particular period of time. We have a severance plan in place that covers certain of our senior leaders; however, this plan can neither guarantee that we will not lose key employees, nor prevent them from competing against us, which is often dependent on state and local employment laws. If we lose a group of key personnel or even one key person at a segment, we may not be able to recruit suitable replacements at comparable salaries or at all, which could adversely affect our operations. Additionally, we do not maintain key man life insurance for members of our management.
Item 1B. Unresolved Staff Comments
None.
Item 2. Properties
Facilities
At September 30, 2013, we maintained branch offices, warehouses, sales facilities and administrative offices at 61 locations. Substantially all of our facilities are leased. We lease our executive office located in Greenwich, Connecticut and our corporate office located in Houston, Texas. We believe that our properties are adequate for our present needs, and that suitable additional or replacement space will be available as required.
Item 3. Legal Proceedings
For further information regarding legal proceedings, see Note 17, "Commitments and Contingencies - Legal Matters " in the notes to our Consolidated Financial Statements.
15
Item 4. Mine Safety Disclosures
None.
Item 5. Market for Registrant's Common Equity; Related Stockholder Matters and Issuer Purchases of Equity Securities
Our common stock trades on the NASDAQ Global Select Market under the ticker symbol "IESC." The following table sets forth the daily high and low close price for our common stock as reported on NASDAQ for each of the four quarters of the years ended September 30, 2013 and 2012.
| High | Low | |||||||
Year Ended September 30, 2013 | ||||||||
First Quarter | $ | 5.80 | $ | 3.90 | ||||
Second Quarter | $ | 6.50 | $ | 4.37 | ||||
Third Quarter | $ | 6.39 | $ | 4.22 | ||||
Fourth Quarter | $ | 5.89 | $ | 3.91 | ||||
Year Ended September 30, 2012 | ||||||||
First Quarter | $ | 2.80 | $ | 1.85 | ||||
Second Quarter | $ | 4.74 | $ | 1.85 | ||||
Third Quarter | $ | 4.60 | $ | 2.74 | ||||
Fourth Quarter | $ | 5.00 | $ | 2.81 | ||||
As of December 16, 2013, the closing market price of our common stock was $5.13 per share and there were approximately 395 holders of record.
We have never paid cash dividends on our common stock, and we do not anticipate paying cash dividends in the foreseeable future. We expect that we will utilize all available earnings generated by our operations and borrowings under the 2012 Credit Facility for the development and operation of our business, to retire existing debt, to repurchase our common stock, or to acquire or invest in other businesses. Any future determination as to the payment of dividends will be made at the discretion of our Board of Directors and will depend upon our operating results, financial condition, capital requirements, general business conditions and other factors that the Board of Directors deems relevant. Our debt instruments restrict us from paying cash dividends and also place limitations on our ability to repurchase our common stock. See Item 7. " Management's Discussion and Analysis of Financial Condition and Results of Operations-Working Capital" and Item 7. " Management's Discussion and Analysis of Financial Condition and Results of Operations-Liquidity and Capital Resources " of this Form 10-K.
Five-Year Stock Performance Graph
The graph below compares the cumulative 5-Year total return provided shareholders on Integrated Electrical Services, Inc.'s common stock relative to the cumulative total returns of the Russell 2000 index and two customized peer groups of twelve companies and seven companies respectively, whose individual companies are listed in footnotes 1 and 2 below. An investment of $100 (with reinvestment of all dividends) is assumed to have been made in our common stock, in each index and in each of the peer groups on September 30, 2008 and its relative performance is tracked through September 30, 2013.
(1.) There are twelve companies included in the company's first customized peer group, which was utilized by the company in fiscal 2012. They are: Comfort Systems USA Inc., Dycom Industries Inc., Englobal Corp., Furmanite Corporation, Mastec Inc., Matrix Service Company, MYR Group Inc., Pike Corp., Powell Industries Inc., Primoris Services Corp., Team Inc. and Willbros Group Inc.
(2.) In fiscal year 2013, the Company updated its peer group. The seven companies included in the company's second customized peer group are: Black Box Corp., Comfort Systems USA Inc., Furmanite Corporation, MYR Group Inc., Pike Corp., Sterling Construction Company Inc. and Team Inc.
16
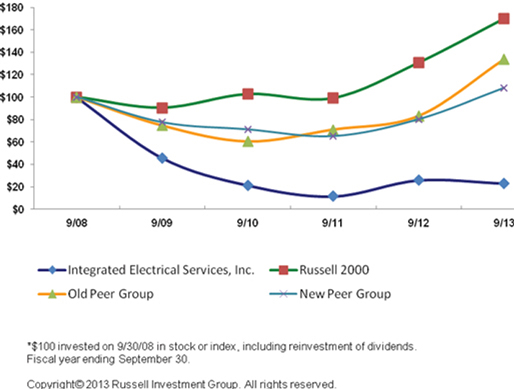
| Years ended September 30, | ||||||||||||||||||||||||
| 2008 | 2009 | 2010 | 2011 | 2012 | 2013 | |||||||||||||||||||
Integrated Electrical Services, Inc. | $ | 100.00 | 45.84 | 21.41 | 11.53 | 25.91 | 23.12 | |||||||||||||||||
Russell 2000 | $ | 100.00 | 90.45 | 102.53 | 98.91 | 130.47 | 169.68 | |||||||||||||||||
Old Peer Group | $ | 100.00 | 74.49 | 60.26 | 70.81 | 83.01 | 133.47 | |||||||||||||||||
New Peer Group | $ | 100.00 | 77.61 | 71.30 | 65.35 | 80.33 | 108.11 | |||||||||||||||||
17
Item 6. Selected Financial Data
The following selected consolidated historical financial information for IES should be read in conjunction with the audited historical Consolidated Financial Statements of Integrated Electrical Services, Inc. and subsidiaries, and the notes thereto, set forth in Item 8, " Financial Statements and Supplementary Data" of this Form 10-K.
| Years Ended September 30, | ||||||||||||||||||||
| 2013 | 2012 | 2011 | 2010 | 2009 | ||||||||||||||||
| (In Thousands, Except Share Information) | ||||||||||||||||||||
Continuing Operations: | ||||||||||||||||||||
Revenues | $ | 494,593 | $ | 456,115 | $ | 406,141 | $ | 382,431 | $ | 516,124 | ||||||||||
Cost of services | 427,633 | 398,063 | 361,757 | 326,939 | 422,507 | |||||||||||||||
|
|
|
|
|
|
|
|
|
| |||||||||||
Gross profit | 66,960 | 58,052 | 44,384 | 55,492 | 93,617 | |||||||||||||||
Selling, general and administrative expenses | 66,598 | 58,609 | 63,321 | 74,251 | 95,750 | |||||||||||||||
Gain on sale of Assets | (64 | ) | (168 | ) | (6,555 | ) | (128 | ) | (339 | ) | ||||||||||
Asset impairment | - | - | 4,804 | - | - | |||||||||||||||
Restructuring charges | - | - | - | 763 | 7,407 | |||||||||||||||
|
|
|
|
|
|
|
|
|
| |||||||||||
Income (loss) from Operations | 426 | (389 | ) | (17,186 | ) | (19,394 | ) | (9,201 | ) | |||||||||||
|
|
|
|
|
|
|
|
|
| |||||||||||
Other (income) expense: | ||||||||||||||||||||
Interest expense, net | 1,619 | 2,290 | 2,210 | 3,271 | 4,094 | |||||||||||||||
Other expense (income), net | 659 | (62 | ) | (7 | ) | (18 | ) | 1,829 | ||||||||||||
|
|
|
|
|
|
|
|
|
| |||||||||||
Interest and other expense, net | 2,278 | 2,228 | 2,203 | 3,253 | 5,923 | |||||||||||||||
|
|
|
|
|
|
|
|
|
| |||||||||||
Loss from operations before income taxes | (1,852 | ) | (2,617 | ) | (19,389 | ) | (22,647 | ) | (15,124 | ) | ||||||||||
Provision (benefit) for income taxes | 326 | 38 | 172 | (36 | ) | 495 | ||||||||||||||
|
|
|
|
|
|
|
|
|
| |||||||||||
Net loss from continuing operations | $ | (2,178 | ) | $ | (2,655 | ) | $ | (19,561 | ) | $ | (22,611 | ) | $ | (15,619 | ) | |||||
|
|
|
|
|
|
|
|
|
| |||||||||||
Discontinued Operations: | ||||||||||||||||||||
Loss from discontinued operations | (1,395 | ) | (9,158 | ) | (18,288 | ) | (8,539 | ) | (3,246 | ) | ||||||||||
Provision (benefit) for income taxes | - | (11 | ) | (26 | ) | 5 | 68 | |||||||||||||
|
|
|
|
|
|
|
|
|
| |||||||||||
Net loss discontinued operations | (1,395 | ) | (9,147 | ) | (18,262 | ) | (8,544 | ) | (3,314 | ) | ||||||||||
|
|
|
|
|
|
|
|
|
| |||||||||||
Net loss | $ | (3,573 | ) | $ | (11,802 | ) | $ | (37,823 | ) | $ | (31,155 | ) | $ | (18,933 | ) | |||||
|
|
|
|
|
|
|
|
|
| |||||||||||
Basic loss earnings per share: | ||||||||||||||||||||
Continuing operations | $ | (0.15 | ) | $ | (0.18 | ) | $ | (1.35 | ) | $ | (1.57 | ) | $ | (1.09 | ) | |||||
Discontinued operations | $ | (0.09 | ) | $ | (0.63 | ) | $ | (1.26 | ) | $ | (0.59 | ) | $ | (0.23 | ) | |||||
|
|
|
|
|
|
|
|
|
| |||||||||||
Total | $ | (0.24 | ) | $ | (0.81 | ) | $ | (2.61 | ) | $ | (2.16 | ) | $ | (1.32 | ) | |||||
|
|
|
|
|
|
|
|
|
| |||||||||||
Diluted loss earnings per share: | ||||||||||||||||||||
Continuing operations | $ | (0.15 | ) | $ | (0.18 | ) | $ | (1.35 | ) | $ | (1.57 | ) | $ | (1.09 | ) | |||||
Discontinued operations | $ | (0.09 | ) | $ | (0.63 | ) | $ | (1.26 | ) | $ | (0.59 | ) | $ | (0.23 | ) | |||||
|
|
|
|
|
|
|
|
|
| |||||||||||
Total | $ | (0.24 | ) | $ | (0.81 | ) | $ | (2.61 | ) | $ | (2.16 | ) | $ | (1.32 | ) | |||||
|
|
|
|
|
|
|
|
|
| |||||||||||
Shares used to calculate loss per share | ||||||||||||||||||||
Basic | 14,952,054 | 14,625,776 | 14,493,747 | 14,409,368 | 14,331,614 | |||||||||||||||
Diluted | 14,952,054 | 14,625,776 | 14,493,747 | 14,409,368 | 14,331,614 | |||||||||||||||
| Years Ended September 30, | ||||||||||||||||||||
| 2013 | 2012 | 2011 | 2010 | 2009 | ||||||||||||||||
| (In Thousands, Except Share Information) | ||||||||||||||||||||
Balance Sheet Data: | ||||||||||||||||||||
Cash and cash equivalents | $ | 20,757 | $ | 18,729 | $ | 35,577 | $ | 32,924 | $ | 64,174 | ||||||||||
Restricted Cash | - | 7,155 | - | - | - | |||||||||||||||
Working capital | 45,467 | 43,001 | 61,721 | 82,202 | 119,099 | |||||||||||||||
Total assets | 179,252 | 164,713 | 180,244 | 207,860 | 270,653 | |||||||||||||||
Total debt | 13,773 | 10,480 | 10,498 | 11,256 | 28,687 | |||||||||||||||
Total stockholders' equity | 62,486 | 53,157 | 64,301 | 101,201 | 131,175 | |||||||||||||||
18
Item 7. Management's Discussion and Analysis of Financial Condition and Results of Operations
The following discussion and analysis should be read in conjunction with our Consolidated Financial Statements and the notes thereto, set forth in Item 8, "Financial Statements and Supplementary Data" of this Form 10-K. For additional information, see "Disclosure Regarding Forward Looking Statements" in Part I of this Form 10-K.
OVERVIEW
Executive Overview
Please refer to Item 1. "Business" of this Form 10-K for a discussion of the Company's services and corporate strategy. Integrated Electrical Services, Inc., a Delaware corporation, is a holding company that owns and manages diverse operating subsidiaries, comprised of providers of industrial products and infrastructure services to a variety of end markets. Our operations are currently organized into four principal business segments: Communications, Residential, Commercial & Industrial, and Infrastructure Solutions.
Industry Trends
Our performance is affected by a number of trends that drive the demand for our services. In particular, the markets in which we operate are exposed to many regional and national trends such as the demand for single and multi-family housing, the need for mission critical facilities as a result of technology-driven advancements, the degree to which in-house maintenance departments outsource maintenance and repair work, output levels and equipment utilization at heavy industrial facilities, capital investment in locomotives by railroad companies, and changes in commercial, institutional, public infrastructure and electric utility spending. Over the long term, we believe that there are numerous factors that could positively drive demand and affect growth within the industries in which we operate, including (i) population growth, which will increase the need for commercial and residential facilities, (ii) aging public infrastructure, which must be replaced or repaired, (iii) increased emphasis on environmental and energy efficiency, which may lead to both increased public and private spending, and (iv) the low price of natural gas combined with an increase in domestic oil and gas output and increase in spending on unconventional oil and gas exploration and production, which is expected to spur the construction of and modifications to heavy industrial facilities. However, there can be no assurance that we will not experience a decrease in demand for our services due to economic, technological or other factors. For a further discussion of the industries in which we operate, please see Item 1. " Business -Operating Segments" of this Form 10-K.
Business Outlook
While differences exist among the Company's segments, on an overall basis, demand for the Company's services increased in fiscal 2013 as compared to fiscal 2012 resulting in aggregate year-over-year revenue growth. In addition, the Company's previous investment in growth initiatives and other business-specific factors discussed below contributed to year-over-year revenue growth. Among our segment, year-over-year revenue growth rates during fiscal 2013 were led primarily by growth in our Residential segment. The combination of increasing revenue, increasing project bid margins, effective project execution, and efficient scaling of operations as the economy improves have resulted in a significant reduction in operating losses. Provided that no significant deterioration in general economic conditions occurs, the Company expects total revenues from existing businesses to increase on a year-over-year basis during fiscal 2014 due to an increase in overall demand for the services we provide. Despite this expectation of growth within certain segments, we remain focused on controlled growth within certain markets which continue to experience competitive margins and volatile commodity and lab costs.
To service our indebtedness and to fund working capital, we require a significant amount of cash. Our ability to generate cash depends on many factors that are beyond our control, including demand for our products and services, the availability of projects at margins acceptable to us, the ultimate collectability of our receivables and our ability to borrow on our 2012 Credit Facility, among many other factors. We anticipate that the combination of cash on hand, cash flows and available capacity under our 2012 Credit Facility will provide sufficient cash to enable us to meet our working capital needs, debt service requirements and capital expenditures for property and equipment through the next twelve months. We expect that our fixed asset requirements will range from $2.0 to $2.5 million for the fiscal year ending on September 30, 2014, and we may acquire these assets either through capital expenditures or through lease agreements.
19
RESULTS OF OPERATIONS
We report our operating results across our four operating segments: Communications, Residential, Commercial & Industrial and Infrastructure Solutions. Expenses associated with our Corporate office are classified as a fifth segment. The following table presents selected historical results of operations of IES. The Infrastructure Solutions segment was added in connection with the acquisition of MISCOR on September 13, 2013. Our consolidated results of operations include Infrastructure Solutions' operations subsequent to closing. As these results are not significant, no separate discussion of Infrastructure Solutions' results is provided below.
| Years Ended September 30, | ||||||||||||||||||||||||
| 2013 | 2012 | 2011 | ||||||||||||||||||||||
| $ | % | $ | % | $ | % | |||||||||||||||||||
| (Dollars in thousands, Percentage of revenues) | ||||||||||||||||||||||||
Revenues | $ | 494,593 | 100.0 | % | $ | 456,115 | 100.0 | % | $ | 406,141 | 100.0 | % | ||||||||||||
Cost of services | 427,633 | 86.5 | % | 398,063 | 87.3 | % | 361,757 | 89.1 | % | |||||||||||||||
|
|
|
|
|
|
|
|
|
|
|
| |||||||||||||
Gross profit | 66,960 | 13.5 | % | 58,052 | 12.7 | % | 44,384 | 10.9 | % | |||||||||||||||
Selling, general and administrative expenses (1) | 66,598 | 13.5 | % | 58,609 | 12.8 | % | 63,321 | 15.6 | % | |||||||||||||||
Gain on sale of assets | (64) | 0.0 | % | (168) | 0.0 | % | (6,555) | (1.6) | % | |||||||||||||||
Asset impairment | - | 0.0 | % | - | 0.0 | % | 4,804 | 1.2 | % | |||||||||||||||
|
|
|
|
|
|
|
|
|
|
|
| |||||||||||||
Income (loss) from operations | 426 | 0.0 | % | (389) | (0.1) | % | (17,186) | (4.3) | % | |||||||||||||||
|
|
|
|
|
|
|
|
|
|
|
| |||||||||||||
Interest and other expense, net | 2,278 | 0.5 | % | 2,228 | 0.5 | % | 2,203 | 0.5 | % | |||||||||||||||
|
|
|
|
|
|
|
|
|
|
|
| |||||||||||||
Loss from operations before income taxes | (1,852) | (0.5) | % | (2,617) | (0.6) | % | (19,389) | (4.8) | % | |||||||||||||||
Provision (benefit) for income taxes | 326 | 0.1 | % | 38 | 0.0 | % | 172 | 0.0 | % | |||||||||||||||
|
|
|
|
|
|
|
|
|
|
|
| |||||||||||||
Net loss from continuing operations | (2,178) | (0.6) | % | (2,655) | (0.6) | % | (19,561) | (4.8) | % | |||||||||||||||
|
|
|
|
|
|
|
|
|
|
|
| |||||||||||||
Net loss from discontinued operations | (1,395) | (0.3) | % | (9,158) | (2.0) | % | (18,288) | (4.5) | % | |||||||||||||||
(Benefit) provision for income taxes | - | 0.0 | % | (11) | 0.0 | % | (26) | 0.0 | % | |||||||||||||||
|
|
|
|
|
|
|
|
|
|
|
| |||||||||||||
Net loss from discontinued operations | (1,395) | (0.3) | % | (9,147) | (2.0) | % | (18,262) | (4.5) | % | |||||||||||||||
|
|
|
|
|
|
|
|
|
|
|
| |||||||||||||
Net loss | $ | (3,573) | (0.9) | % | $ | (11,802) | (2.6) | % | $ | (37,823) | (9.3) | % | ||||||||||||
|
|
|
|
|
|
|
|
|
|
|
| |||||||||||||
| (1) | 2013 expense includes transaction costs $3.0 million incurred in connection with our acquisitions. |
Consolidated revenues for the year ended September 30, 2013 were $38.5 million greater than for the year ended September 30, 2012, an increase of 8.4%. Revenues increased primarily due to growth within our Residential segment. Revenues at our Communications segment increased to a lesser degree, offset by a reduction at our Commercial & Industrial segment. Infrastructure Solutions contributed $2.2 million in revenues for the year ended September 30, 2013.
Our overall gross profit percentage increased to 13.5% during the year ended September 30, 2013 as compared to 12.7% during the year ended September 30, 2012. The increase in overall gross profit percentage combined with the increase in activity resulted in an $8.9 million increase in our consolidated gross profit for the year ended September 30, 2013, as compared to the year ended September 30, 2012. The increase in gross profit was attributable to the Residential and Communications segments, offset by a decrease in our Commercial & Industrial segment. Infrastructure Solutions contributed $0.4 million to our consolidated gross profit, which included a net impact of purchase accounting adjustments of $0.2 million.
Selling, general and administrative expenses include costs not directly associated with performing work for our customers. These costs consist primarily of compensation and benefits related to corporate, segment and branch management (including incentive-based compensation), occupancy and utilities, training, professional services, information technology costs, consulting fees, travel and certain types of depreciation and amortization. We allocate certain corporate selling, general and administrative costs across our segments as we believe this more accurately reflects the costs associated with operating each segment.
During the year ended September 30, 2013, our selling, general and administrative expenses were $66.6 million, an increase of $8.0 million, or 13.6%, as compared to the year ended September 30, 2012. Our 2013 selling general and administrative expenses included $3.0 million of acquisition related costs. The remaining increase primarily resulted from higher personnel and incentive costs directly attributable to increased activity and profitability. Additionally, Infrastructure Solutions incurred $0.3 million in selling, general and administrative expenses.
20
Communications
2013 Compared to 2012
| Years Ended September 30, | ||||||||||||||||
| 2013 | 2012 | |||||||||||||||
| $ | % | $ | % | |||||||||||||
| (Dollars in thousands, Percentage of revenues) | ||||||||||||||||
Revenue | $ | 126,348 | 100.0 | % | $ | 121,492 | 100.0 | % | ||||||||
Gross Profit | 23,784 | 18.8 | % | 18,204 | 15.0 | % | ||||||||||
Selling, general and administrative expenses | 13,610 | 10.8 | % | 13,431 | 11.1 | % | ||||||||||
Revenue. Our Communications segment revenues increased by $4.9 million during the year ended September 30, 2013, a 4.0% increase compared to the year ended September 30, 2012 . Revenues attributable to service and time and material projects increased $1.2 million. Revenues from high tech manufacturing projects were $30.3 million during the year ended September 30, 2013, compared to $27.0 million during the year ended September 30, 2012. Revenues attributable to data centers were $38.7 million for the year ended September 30, 2013 compared to $38.0 million for the year ended September 30, 2012.
Gross Profit. Our Communications segment's gross profit during the year ended September 30, 2013 increased $5.6 million, or 30.6%, as compared to the year ended September 30, 2012. Gross profit as a percentage of revenue increased 3.8% to 18.8% for the year ended September 30, 2013, due primarily to the increased productivity through the completion of data center and high-tech manufacturing projects and, to a lesser extent, improved performance of our San Diego branch during the year ended September 30, 2013.
Selling, General and Administrative Expenses. Our Communications segment's selling, general and administrative expenses increased $0.2 million, or 1.3%, during the year ended September 30, 2013 compared to the year ended September 30, 2012. Selling, general and administrative expenses as a percentage of revenues in the Communication segment decreased 0.3% to 10.8% of segment revenue during the year ended September 30, 2013 compared to the year ended September 30, 2012. During the year ended September 30, 2012, we experienced higher selling, general and administrative costs in our San Diego operations, due primarily to a legal settlement and associated fees of $1.7 million. These legal costs were not duplicated in the year ended September 30, 2013. Offsetting the decrease in legal costs was an increase in training and personnel costs, which include the addition of five sales people, and higher personnel and incentive costs directly attributable to increased activity and profitability for the year ended September 30, 2013.
2012 Compared to 2011
| Years Ended September 30, | ||||||||||||||||
| 2012 | 2011 | |||||||||||||||
| $ | % | $ | % | |||||||||||||
| (Dollars in thousands, Percentage of revenues) | ||||||||||||||||
Revenue | $ | 121,492 | 100.0 | % | $ | 83,615 | 100.0 | % | ||||||||
Gross Profit | 18,204 | 15.0 | % | 12,473 | 14.9 | % | ||||||||||
Selling, general and administrative expenses | 13,431 | 11.1 | % | 9,578 | 11.5 | % | ||||||||||
Revenue. Our Communications segment revenues increased $37.9 million during the year ended September 30, 2012, a 45.3% increase compared to the year ended September 30, 2011 . This increase is primarily due to an increase in data center projects and high tech manufacturing projects during 2012, along with our establishment of an operation in San Diego, California. We believe the expansion of technology, cloud computing and increased demands for consumer focused data storage and collection, has led to an increase in demand for additional data center capacity. Revenues attributable to data centers were $38.0 million for the year ended September 30, 2012 compared to $29.9 million for the year ended September 30, 2011. The increase in high tech manufacturing projects is related to a major expansion by a high tech manufacturer in the greater Phoenix, Arizona area. Revenues from high tech manufacturing projects were $27.0 million during the year ended September 30, 2012, and $9.4 million during the year ended
21
September 30, 2011. Revenue from the establishment of our San Diego operations increased overall revenue by $10.5 million for the year ended September 30, 2012.
Gross Profit. Our Communications segment's gross profit during the year ended September 30, 2012 increased $5.7 million, or 46.0%, as compared to the year ended September 30, 2011. The increase in gross profit is attributable to a higher volume of contract revenues as noted in the revenue analysis above. Overall gross profit as a percentage of revenue remained unchanged during 2012. Exclusive of our San Diego operations, which were established in the fourth quarter of 2011, gross profit increased 0.9%.
Selling, General and Administrative Expenses. Our Communications segment's selling, general and administrative expenses increased $3.9 million, or 40.2%, during the year ended September 30, 2012 compared to the year ended September 30, 2011. Selling, general and administrative expenses as a percentage of revenues in the Communication segment decreased to 11.1% of segment revenue during the year ended September 30, 2012. The increase in selling, general and administrative expenses is primarily due to a $1.2 million legal settlement reserve, detailed in Note 16, " Commitment and Contingencies - TekWorks, Inc" in the notes to our Consolidated Financial Statements. Additionally, we incurred higher expenses associated with our expansion of facilities in Southern California, including litigation expenses, increased staff in response to revenue growth, and to a lesser extent, incentive awards for achieving specific performance goals.
Residential
2013 Compared to 2012
| Years Ended September 30, | ||||||||||||||||
| 2013 | 2012 | |||||||||||||||
| $ | % | $ | % | |||||||||||||
| (Dollars in thousands, Percentage of revenues) | ||||||||||||||||
Revenue | $ | 162,611 | 100.0 | % | $ | 129,974 | 100.0 | % | ||||||||
Gross Profit | 27,227 | 16.7 | % | 20,700 | 15.9 | % | ||||||||||
Selling, general and administrative expenses | 25,447 | 15.6 | % | 19,703 | 15.2 | % | ||||||||||
Revenue. Our Residential segment revenues increased $32.6 million during the year ended September 30, 2013, an increase of 25.1% as compared to the year ended September 30, 2012. Revenues for our multi-family construction increased by $21.0 million during the year ended September 30, 2013, as overall market conditions have continued to improve. Multi-family construction projects were primarily driven by increased demand for rental housing, student housing, and senior living facilities throughout the regions in which we operate. Single-family construction revenues increased by $16.7 million, primarily in Texas, where the economy has experienced continued growth and population expansion. Revenue was impacted to a lesser degree by decreases in solar installations and increases in cable and service activity.
Gross Profit. During the year ended September 30, 2013, our Residential segment experienced a $6.5 million, or 31.5%, increase in gross profit as compared to the year ended September 30, 2012. Gross profit increased due to higher volume of both single-family and multi-family projects, offset by lower volume and reduced gross margin percentage in solar projects. Gross margin percentage increased by 0.9%, within single-family, and 1.6% within multi-family, offset to a lesser degree by a reduction in gross margin within our solar division.
Selling, General and Administrative Expenses. Our Residential segment experienced a $5.7 million, or 29.2%, increase in selling, general and administrative expenses during the year ended September 30, 2013 compared to the year ended September 30, 2012. Selling, general and administrative expenses as a percentage of revenues in the Residential segment increased 0.4% to 15.6% of segment revenue during the year ended September 30, 2013. This increase is attributable primarily to the scaling of operations, including increased incentives in both single-family and multi-family divisions during the year ended September 30, 2013, and impacted to a lesser degree by increased legal fees related to construction defects claims.
22
2012 Compared to 2011
| Years Ended September 30, | ||||||||||||||||
| 2012 | 2011 | |||||||||||||||
| $ | % | $ | % | |||||||||||||
| (Dollars in thousands, Percentage of revenues) | ||||||||||||||||
Revenue | $ | 129,974 | 100.0 | % | $ | 114,732 | 100.0 | % | ||||||||
Gross Profit | 20,700 | 15.9 | % | 18,690 | 16.3 | % | ||||||||||
Selling, general and administrative expenses | 19,703 | 15.2 | % | 18,441 | 16.1 | % | ||||||||||
Revenue. Our Residential segment revenues increased $15.3 million during the year ended September 30, 2012, an increase of 13.3% as compared to the year ended September 30, 2011. Revenues for our multi-family construction increased by $4.2 million. In 2012, multi-family industry starts were attributed to improved demand for rental housing. Rental housing demand was partially driven by the deferral of purchases of single family homes due to continued restrictive lending practices for single family purchases, an uncertain job market and lower apartment vacancy rates. Single family construction revenues increased by $11.6 million, primarily in the Texas markets. We entered into the solar installation market during fiscal 2012, resulting in revenues of $9.5 million. Included in our fiscal 2011 balance are revenues attributable to a non-core electrical distribution facility, totaling $13.1 million. We sold this business in February 2011, and as such, no revenues from this facility are included in our fiscal 2012 balance.
Gross Profit. During the year ended September 30, 2012, our Residential segment experienced a $2.0 million, or 10.8%, increase in gross profit as compared to the year ended September 30, 2011. Gross margin percentage in the Residential segment decreased to 15.9% during the year ended September 30, 2012. We attribute much of the increase in Residential's gross margin primarily to the higher volume of single family projects.
Selling, General and Administrative Expenses. Our Residential segment experienced a $1.3 million, or 6.8%, increase in selling, general and administrative expenses during the year ended September 30, 2012 compared to the year ended September 30, 2011. Selling, general and administrative expenses as a percentage of revenues in the Residential segment decreased to 15.2% of segment revenue during the year ended September 30, 2012. We attribute much of the increase in Residential selling, general and administrative expenses primarily to increased incentives and our expansion into the solar installation market.
Commercial & Industrial
2013 Compared to 2012
| Years Ended September 30, | ||||||||||||||||
| 2013 | 2012 | |||||||||||||||
| $ | % | $ | % | |||||||||||||
| (Dollars in thousands, Percentage of revenues) | ||||||||||||||||
Revenue | $ | 203,481 | 100.0 | % | $ | 204,649 | 100.0 | % | ||||||||
Gross Profit | 15,524 | 7.6 | % | 19,148 | 9.4 | % | ||||||||||
Selling, general and administrative expenses | 14,362 | 7.1 | % | 17,166 | 8.4 | % | ||||||||||
Revenue. Revenues in our Commercial & Industrial segment decreased $1.2 million during the year ended September 30, 2013, a decrease of 0.6% compared to the year ended September 30, 2012. Our Commercial & Industrial segment is impacted not only by industry construction trends, but also specific industry and local economic trends. Impacts from these trends on our revenues may be delayed due to the long lead time of our projects. During the year ended September 30, 2013, our revenue decrease was the result of the completion of large commercial projects early in the fiscal year, offset by a lesser degree by increased utility and industrial projects.
Gross Profit . Our Commercial & Industrial segment's gross profit during the year ended September 30, 2013 decreased by $3.6 million, or 18.9%, as compared to the year ended September 30, 2012. Commercial & Industrial's gross margin percentage decreased 1.8% to 7.6% during the year ended September 30, 2013. The decrease in margin was primarily due to a total of $2.1 million of job underperformance on four projects in one of our commercial branches, and $3.0 million due to the recognition of higher projected costs on a significant commercial project that commenced in 2009 and is scheduled to be completed in 2015. The higher costs related
23
to this significant commercial project are due to various delays and other impacts resulting in lower productivity rates than originally estimated and which are anticipated to continue for the remainder of the project. These projected costs resulted in a lower anticipated gross profit percentage on the project and a reduction in gross profit recognized to date. While we expect the project to be completed profitably, the project is outside of the maximum size and duration criteria within our risk management parameters that were implemented in mid-2011. This decrease in margin was offset by improvements in gross profits in multiple projects. While we have experienced some reprieve in project bid margins, particularly in our industrial branches, the competitive market that has existed during the prolonged recession has continued to constrain significant increases in project bid margins in most commercial markets.
Selling, General and Administrative Expenses. Our Commercial & Industrial segment's selling, general and administrative expenses during the year ended September 30, 2013 decreased by $2.8 million, or 16.3%, compared to the year ended September 30, 2012. Selling, general and administrative expenses as a percentage of revenues in the Commercial & Industrial segment decreased by 1.3% during the year ended September 30, 2013, reflective of lower personnel costs and, to a lesser extent, a reduction in other costs as the segment continues to scale to a level necessary to return to profitability.
2012 Compared to 2011
| Years Ended September 30, | ||||||||||||||||
| 2012 | 2011 | |||||||||||||||
| $ | % | $ | % | |||||||||||||
| (Dollars in thousands, Percentage of revenues) | ||||||||||||||||
Revenue | $ | 204,649 | 100.0 | % | $ | 207,794 | 100.0 | % | ||||||||
Gross Profit | 19,148 | 9.4 | % | 13,221 | 6.4 | % | ||||||||||
Selling, general and administrative expenses | 17,166 | 8.4 | % | 21,788 | 10.5 | % | ||||||||||
Revenue. Revenues in our Commercial & Industrial segment decreased $3.2 million during the year ended September 30, 2012, a decrease of 1.5% compared to the year ended September 30, 2011. Our Commercial & Industrial segment is impacted not only by industry construction trends, but also specific industry and local economic trends. Impacts from these trends on our revenues may be delayed due to the long lead time of our projects. Our revenues were also impacted by a refocusing of our business development strategy on projects within our demonstrated areas of expertise and with increased margin expectations. Projects in all sectors remain subject to delays or cancellation with little advance notice. In many of our Commercial markets, we continue to experience increased competition from new entrants, including residential contractors or contractors from other geographic markets.
Gross Profit . Our Commercial & Industrial segment's gross profit during the year ended September 30, 2012 increased $5.9 million, or 44.8%, as compared to the year ended September 30, 2011. Commercial & Industrial's gross margin percentage increased to 9.4% during the year ended September 30, 2012, primarily due to improved execution of projects in all locations. Although the competitive market that has existed during the prolonged recession has continued to depress project bid margins, we have begun to experience some reprieve. In 2011, we experienced margin erosion and project difficulties due to a combination of project management turnover, projects outside our historical area of expertise, and delays in receipt of material and labor productivity, all of which significantly increased our cost on those projects. In 2012, we focused our efforts on winning projects within our areas of expertise, and significantly reduced the project inefficiencies due to delay and labor turnover.
Selling, General and Administrative Expenses. Our Commercial & Industrial segment's selling, general and administrative expenses during the year ended September 30, 2012 decreased $4.6 million, or 21.2%, compared to the year ended September 30, 2011. Selling, general and administrative expenses as a percentage of revenues in the Commercial & Industrial segment decreased to 8.4% of segment revenue during the year ended September 30, 2012. This decrease is primarily attributed to the consolidation of back offices in several locations late in fiscal 2011.
Restructuring Charges
In the second quarter of our 2011 fiscal year, we began the 2011 Restructuring Plan that was designed to consolidate operations within our Commercial & Industrial business. Pursuant to the 2011 Restructuring Plan, we planned to either sell or close certain underperforming facilities within our Commercial & Industrial operations. The 2011 Restructuring Plan was a key element of our
24
commitment to return the Company to profitability. The results of operations related to the 2011 Restructuring Plan are included in the net loss from discontinued operations within our Consolidated Statements of Comprehensive Income for the years ended September 30, 2012 and 2011.
The facilities directly affected by the 2011 Restructuring Plan were in several locations throughout the country, including Arizona, Florida, Iowa, Louisiana, Massachusetts, Nevada and Texas. These facilities were selected due to their business prospects at that time and the extended time frame needed to return the facilities to a profitable position.
The following table presents the elements of costs incurred for the 2011 Restructuring Plan:
| Years Ended September 30, | ||||||||||||
| 2013 | 2012 | 2011 | ||||||||||
| (In thousands) | ||||||||||||
Severance compensation | $ | (4 | ) | $ | (62 | ) | $ | 1,455 | ||||
Consulting and other charges | 63 | 1,099 | 1,531 | |||||||||
Lease termination costs | - | 133 | 799 | |||||||||
|
|
|
|
|
| |||||||
Total restructuring charges | $ | 59 | $ | 1,170 | $ | 3,785 | ||||||
|
|
|
|
|
| |||||||
Interest and Other Expense, net
| Years Ended September 30, | ||||||||||||
| 2013 | 2012 | 2011 | ||||||||||
| (In thousands) | ||||||||||||
Interest expense | $ | 1,249 | $ | 1,755 | $ | 1,940 | ||||||
Deferred financing charges | 522 | 569 | 338 | |||||||||
|
|
|
|
|
| |||||||
Total interest expense | 1,771 | 2,324 | 2,278 | |||||||||
|
|
|
|
|
| |||||||
Interest income | (152 | ) | (34 | ) | (68 | ) | ||||||
Other (income) expense, net | 659 | (62 | ) | (7 | ) | |||||||
|
|
|
|
|
| |||||||
Total interest and other expense, net | $ | 2,278 | $ | 2,228 | $ | 2,203 | ||||||
|
|
|
|
|
| |||||||
Interest Expense
During the year ended September 30, 2013, we incurred interest expense of $1.8 million primarily comprised of interest expense from the Tontine Term Loan, the Wells Fargo Term Loan, the Insurance Financing Agreements, an average letter of credit balance of $7.4 million under the 2012 Credit Facility and an average unused line of credit balance of $22.6 million. This compares to interest expense of $2.3 million for the year ended September 30, 2012, on a debt balance primarily comprised of the Tontine Term Loan, the Insurance Financing Agreements, an average letter of credit balance of $8.8 million under the 2006 Credit Facility and an average unused line of credit balance of $29.7 million.
During the year ended September 30, 2012, we incurred interest expense of $2.3 million primarily comprised of interest expense from the Tontine Term Loan, the Wells Fargo Term Loan, the Insurance Financing Agreements, an average letter of credit balance of $8.8 million under the 2012 Credit Facility and an average unused line of credit balance of $29.7 million. This compares to interest expense of $2.3 million for the year ended September 30, 2011, on a debt balance primarily comprised of the Tontine Term Loan, the Insurance Financing Agreements, an average letter of credit balance of $12.7 million under the 2006 Credit Facility and an average unused line of credit balance of $38.9 million.
Interest Income
For the years ended September 30, 2013, 2012 and 2011 we earned interest income of $152 thousand, $34 thousand and $68 thousand, respectively, on the average Cash and Cash Equivalents balances of $15.1 million, $26.1 million and $29.9 million, respectively. We received $109 thousand in conjunction with a legal settlement within our Commercial & Industrial segment during the year ended September 30, 2013.
Other (Income) Expense
During the year ended September 30, 2013, we fully reserved for an outstanding receivable for a settlement agreement with a former surety. The surety has failed to make payments in accordance with the settlement agreement, and has proposed a modified payment structure to satisfy the debt. The Company concluded that collectability was not probable as of December 31, 2012, and has recorded
25
a reserve for the entire balance of $1.7 million. The reserve was recorded as other expense within our Consolidated Statements of Comprehensive Income. Through September 2013, we recovered $0.5 million of this settlement. The recovery was recorded as other income within our Consolidated Statements of Comprehensive Income. Please refer to Note 17, "Commitments and Contingencies" in the Notes to the Consolidated Financial Statements set forth in Part I, Item 8 of this Quarterly Report on Form 10-K for additional information.
During the year ended September 30, 2013, we recorded a liability of $0.7 million for contingent purchase consideration in conjunction with the Asset Purchase Agreement with the Acro Group. As of September 30, 2013, we have determined the settlement of this liability will be less than the amount recorded at the time of the transaction. Accordingly, we have reduced the liability to $0.1 million and recorded $0.6 million as other income within our Consolidated Statements of Comprehensive Income.
Sale of Non-Core Electrical Distribution Facility
On February 28, 2011, Key Electrical Supply, Inc, a wholly owned subsidiary of the Company, sold substantially all the assets and certain liabilities of a non-core electrical distribution facility engaged in distributing wiring, lighting, electrical distribution, power control and generators for residential and commercial applications to Elliot Electric Supply, Inc. The purchase price of $6.7 million was adjusted to reflect working capital variances. The loss on this transaction was immaterial.
PROVISION FOR INCOME TAXES
Our provision for income taxes increased from $38 thousand for the year ended September 30, 2012 to $0.3 million for the year ended September 30, 2013. The increase is mainly attributable to a decrease in the reversal of unrecognized tax benefits, resulting in a $0.2 million increase in the income tax expense and a $0.1 million increase in state income tax provision. We provided a valuation allowance for the federal tax benefit resulting from the loss of operations for the years ended September 30, 2013 and 2012, respectively. As a result, we did not recognize any net benefit for federal taxes for the years ended September 30, 2013 and 2012.
Our provision for income taxes decreased from of $0.2 million for the year ended September 30, 2011 to $38 thousand for the year ended September 30, 2012. The decrease is mainly attributable to an increase in the reversal of unrecognized tax benefits, resulting in a $0.2 million decrease in the income tax expense. We provided a valuation allowance for the federal tax benefit resulting from the loss of operations for the years ended September 30, 2012 and 2011, respectively. As a result, we did not recognize any net benefit for federal taxes for the years ended September 30, 2012 and 2011.
WORKING CAPITAL
During the year ended September 30, 2013, working capital increased by $2.5 million from September 30, 2012, reflecting a $3.4 million decrease in current assets and a $5.8 million decrease in current liabilities during the period.
During the year ended September 30, 2013, our current assets decreased by $3.4 million, or 2.3%, to $144.0 million, as compared to $147.4 million as of September 30, 2012. Cash and cash equivalents decreased by $5.1 million during the year ended September 30, 2013 as compared to September 30, 2012, primarily due to a $5.0 million cash payment to satisfy the Tontine Term Loan, $1.4 million paid to satisfy the Wells Fargo Term Loan, and $2.4 million paid for acquisition expenditures. The current trade accounts receivables, net, decreased by $2.7 million at September 30, 2013, as compared to September 30, 2012. Days sales outstanding ("DSOs") decreased to 59 as of September 30, 2013 from 67 as of September 30, 2012. The improvement was driven predominantly by increased collection efforts. While the rate of collections may vary, our secured position, resulting from our ability to secure liens against our customers' overdue receivables, reasonably assures that collection will occur eventually to the extent that our security retains value. Inventory increased $5.0 million during the year ended September 30, 2013 compared to September 30, 2012, due primarily to the acquisition of MISCOR, offset by the completion of large projects within our Communications segment. We also experienced a $0.5 million decrease in retainage during the year ended September 30, 2013 compared to September 30, 2012. At September 30, 2013, we sold the building which was classified as held for sale as of September 30, 2012.
During the year ended September 30, 2013, our total current liabilities decreased by $5.8 million to $98.6 million, compared to $104.4 million as of September 30, 2012. During the year ended September 30, 2013, accounts payable and accrued expenses increased $5.6 million. Billings in excess of costs decreased by $4.6 million during the year ended September 30, 2013 compared to September 30, 2012. Finally, current maturities of long-term debt decreased by $6.9 million during the year ended September 30, 2013 compared to September 30, 2012 primarily due to the repayment of the Tontine Term Loan, partly offset by the current portion of our Wells Fargo Term Loan.
26
Surety
Many customers, particularly in connection with new construction, require us to post performance and payment bonds issued by a surety. These bonds provide a guarantee to the customer that we will perform under the terms of our contract and that we will pay our subcontractors and vendors. If we fail to perform under the terms of our contract or to pay subcontractors and vendors, the customer may demand that the surety make payments or provide services under the bond. We must reimburse the sureties for any expenses or outlays they incur on our behalf. To date, we have not been required to make any reimbursements to our sureties for bond-related costs.
As is common in the surety industry, sureties issue bonds on a project-by-project basis and can decline to issue bonds at any time. We believe that our relationships with our sureties will allow us to provide surety bonds as they are required. However, current market conditions, as well as changes in our sureties' assessment of our operating and financial risk, could cause our sureties to decline to issue bonds for our work. If our sureties decline to issue bonds for our work, our alternatives would include posting other forms of collateral for project performance, such as letters of credit or cash, seeking bonding capacity from other sureties, or engaging in more projects that do not require surety bonds. In addition, if we are awarded a project for which a surety bond is required but we are unable to obtain a surety bond, the result could be a claim for damages by the customer for the costs of replacing us with another contractor.
As of September 30, 2013, the estimated cost to complete our bonded projects was approximately $49.2 million. We believe the bonding capacity presently provided by our sureties is adequate for our current operations and will be adequate for our operations for the foreseeable future. As of September 30, 2013, we utilized $1.0 million of cash (as is included in "Other Non-Current Assets" in our Consolidated Balance Sheet) as collateral for certain of our previous bonding programs.
The 2012 Revolving Credit Facility
On August 9, 2012, we entered into a Credit and Security Agreement (the "Credit Agreement"), for a $30.0 million revolving credit facility (the "2012 Credit Facility") with Wells Fargo Bank, National Association ("Wells Fargo") with a maturity date of August 9, 2015, unless earlier terminated. We have subsequently entered into two amendments to the 2012 Credit Facility. On February 12, 2013, we entered into an amendment of our 2012 Credit Facility with Wells Fargo (the "Amendment"), extending the terms to August 9, 2016, adding IES Renewable Energy, LLC as a borrower, and providing for a term loan (the "Wells Fargo Term Loan"). On September 13, 2013, we entered into an amendment of our 2012 Credit Facility with Wells Fargo (the "Second Amendment") in connection with the acquisition of MISCOR, which amended the Wells Fargo Term Loan, removed the requirement to cash collateralize our outstanding letters of credit, and added IES Subsidiary Holdings Inc., Magnetech Industrial Services, Inc., and HK Engine Components LLC, as borrowers.
The 2012 Credit Facility is guaranteed by our subsidiaries and secured by first priority liens on substantially all of our subsidiaries' existing and future acquired assets, exclusive of collateral provided to our surety providers. The 2012 Credit Facility also restricts us from paying cash dividends and places limitations on our ability to repurchase our common stock.
The 2012 Credit Facility contains customary affirmative, negative and financial covenants. The 2012 Credit Facility requires that we maintain a fixed charge coverage ratio of not less than 1.0:1.0 at any time that our Liquidity (the aggregate amount of unrestricted cash and cash equivalents on hand plus Excess Availability) or Excess Availability fall below the level stipulated within the 2012 Credit Facility, the First Amendment, and Second Amendment. The Second Amendment provided for tiered thresholds. Through December 31, 2013, our Liquidity must not fall below $15.0 million. Thereafter, our Liquidity must not fall below $20.0 million. Our Excess Availability must not fall below $4.0 million through September 30, 2013. This minimum threshold increases by $0.3 million monthly through December 31, 2013, at which time and thereafter, our Excess Availability must not fall below $5.0 million. As of September 30, 2013, our Liquidity was in excess of $15.0 million and Excess Availability was in excess of $4.0 million; had we not met these thresholds at September 30, 2013, we would not have met the required 1.0:1.0 fixed charge coverage ratio test.
Borrowings under the 2012 Credit Facility may not exceed a "borrowing base" that is determined monthly by our lenders based on available collateral, primarily certain accounts receivables, inventories and personal property and equipment. Under the terms of the 2012 Credit Facility, amounts outstanding bear interest at a per annum rate equal to a Daily Three Month LIBOR (as defined in the Credit Agreement), plus an interest rate margin, which is determined quarterly.
In addition, we are charged monthly in arrears for (1) an unused commitment fee of 0.50% per annum, (2) a collateral monitoring fee ranging from $1 thousand to $2 thousand, based on the then-applicable interest rate margin, (3) a letter of credit fee based on the then-applicable interest rate margin and (4) certain other fees and charges as specified in the Credit Agreement.
At September 30, 2013, we had $8.4 million available to us under the 2012 Credit Facility, $6.5 million in outstanding letters of credit with Wells Fargo and no outstanding borrowings. The terms surrounding the 2012 Credit Facility agreement required that we cash collateralize our letters of credit balance. As such, we had $7.2 million classified as restricted cash within the Balance Sheet as of September 30, 2012. The Second Amendment removed the requirement to cash collateralize our letter of credit balance. As such, we have no restricted cash as of September 30, 2013.
27
The Wells Fargo Term Loan for $5.0 million was provided for within the Amendment to the 2012 Credit Facility. We were scheduled to pay monthly installments of $0.2 million through February 2015 at an annual interest rate of 6% plus 3 Month LIBOR. The Second Amendment to the 2012 Credit Facility increased our total Wells Fargo Term Loan by $10.2 million to $13.7 million at September 30, 2013. The Wells Fargo Term Loan is payable in equal monthly installments of $0.3 million through August 9, 2016, with the residual unpaid principal balance due on that date. The Second Amendment also extended the terms, and reduced the annual interest rate to 5% plus 3 Month LIBOR, through September 13, 2014. Following that time, the Wells Fargo Term Loan amounts outstanding bear interest at a per annum rate equal to a Daily Three Month LIBOR plus an interest rate margin, which is determined quarterly.
The 2006 Revolving Credit Facility
On May 12, 2006, we entered into a Loan and Security Agreement (the "Loan and Security Agreement"), for a revolving credit facility (as amended, the "2006 Credit Facility") with Bank of America, N.A. and certain other lenders. Under the terms of the amended 2006 Credit Facility, the size of the facility was $40.0 million and the maturity date was November 12, 2012. On August 9, 2012, the amended 2006 Credit Facility was replaced by the 2012 Credit Facility.
The Tontine Term Loan
On December 12, 2007, we entered into the Tontine Term Loan, a $25 million senior subordinated loan agreement, with Tontine, which the Company terminated and prepaid in full subsequent to the first quarter of fiscal 2013, as further described below.
The Tontine Term Loan bore interest at 11.0% per annum and was due on May 15, 2013. Interest was payable quarterly in cash or in-kind at our option. Any interest paid in-kind would bear interest at 11.0% in addition to the loan principal. The Tontine Term Loan was subordinated to the 2012 Credit Facility. The Tontine Term Loan was an unsecured obligation of the Company and its subsidiary borrowers and contained no financial covenants or restrictions on dividends or distributions to stockholders. The Tontine Term Loan was amended on August 9, 2012 in connection with the Company entering into the 2012 Credit Facility. The amendment did not materially impact the Company's obligations under the Tontine Term Loan.
On April 30, 2010, we prepaid $15 million of principal on the Tontine Term Loan. On May 1, 2010, Tontine assigned the Tontine Term Loan to Tontine Capital Overseas Master Fund II, L.P, also a related party. Pursuant to its terms, we were permitted to repay the Tontine Term Loan at any time prior to the maturity date at par, plus accrued interest without penalty within the restrictions of the 2012 Credit Facility. On February 13, 2013, we repaid the remaining $10 million of principal on the Tontine Term Loan, plus accrued interest, with existing cash on hand and proceeds from the Wells Fargo Term Loan.
Capital Lease
The Company leases certain equipment under agreements, which are classified as capital leases and included in property, plant and equipment. Accumulated amortization of this equipment for the years ended September 30, 2013, 2012 and 2011 was $182 thousand, $182 thousand and $172 thousand, respectively, which amounts are included in depreciation expense in the accompanying statements of comprehensive income.
Insurance Financing Agreements
From time to time, we elect to finance our commercial insurance policy premiums over a term equal to or less than the term of the policy (each, an "Insurance Financing Agreement"). The terms of the Insurance Financing Agreements for fiscal year 2013 were for twelve months with an interest rate range of 1.99% to 2.75%. The Insurance Financing Agreements were collateralized by the gross unearned premiums on the respective insurance policies plus any payments for losses claimed under the policies and are subject to intercreditor agreements with Wells Fargo. The remaining balance due on the Insurance Financing Agreements at September 30, 2013 was zero, as compared to $0.2 million at September 30, 2012.
LIQUIDITY AND CAPITAL RESOURCES
As of September 30, 2013, we had cash and cash equivalents of $20.8 million, working capital of $45.5 million, $6.5 million of letters of credit outstanding under our 2012 Credit Facility. We anticipate that the combination of cash on hand, cash flows and available capacity under our 2012 Credit Facility will provide sufficient cash to enable us to meet our working capital needs, debt service requirements and capital expenditures for property and equipment through the next twelve months. Our ability to generate cash flow is dependent on many factors, including demand for our services, the availability of projects at margins acceptable to us, the ultimate collectability of our receivables, and our ability to borrow on our 2012 Credit Facility, if needed. We were not required to test our covenants under our 2012 Credit Facility during the period. Had we been required to test our covenants, we would have failed at September 30, 2013.
28
We continue to closely monitor the financial markets and general national and global economic conditions. To date, we have experienced no loss or lack of access to our invested cash or cash equivalents; however, we can provide no assurances that access to our invested cash and cash equivalents will not be impacted in the future by adverse conditions in the financial markets.
Operating Activities
Our cash flow from operations is not only influenced by cyclicality, demand for our services, operating margins and the type of services we provide, but can also be influenced by working capital needs such as the timing of our receivable collections. Working capital needs are generally lower during our fiscal first and second quarters due to the seasonality that we experience in many regions of the country.
Operating activities provided net cash of $2.0 million during the year ended September 30, 2013, as compared to $7.4 million of net cash used in the year ended September 30, 2012. We used substantially less cash to reduce our accounts payable and accrued expenses in 2013. We utilized inventory on hand during 2013 in the completion of large projects within our Communications segment. Our billings in excess of cost in fiscal 2013 decreased by $4.7 million as compared to the prior year.
Operating activities used net cash of $7.4 million during the year ended September 30, 2012, as compared to $11.9 million of net cash used in the year ended September 30, 2011. The increase in operating cash flows in the year ended September 30, 2012 was due primarily to the collection of Accounts Receivable, offset by an increase in inventory.
Investing Activities
In the year ended September 30, 2013, net cash from investing activities used $4.8 million as compared to $1.9 million of net cash used by investing activities in the year ended September 30, 2012. Investing activities in the year ended September 30, 2013 was comprised of $5.2 million used in conjunction with the acquisition of MISCOR and the acquisition of certain assets from the Acro Group, and $0.4 million used for capital expenditures, offset by $0.8 million in proceeds from the sale of a building. Investing activities in the year ended September 30, 2012 included $1.9 million used for capital expenditures.
Net cash used from investing activities was $1.9 million in the year ended September 30, 2012 as compared to $15.3 million of net cash used in investing activities in the year ended September 30, 2011. In the year ended September 30, 2011, investing activities included $16.8 million from the sale of facilities, and $1.2 million of proceeds from the sale of equipment, partially offset by $1.3 million used for capital expenditures. Investing activities in the year ended September 30, 2012 included $1.9 million used for capital expenditures.
Financing Activities
Financing activities provided net cash of $4.8 million in the year ended September 30, 2013 compared to $7.6 million used in the year ended September 30, 2012. We entered into the Wells Fargo Term Loan in fiscal 2013, repaid the Tontine Term Loan, and repaid $5.6 million in debt acquired immediately subsequent to the MISCOR acquisition. Financing activities in the year ended September 30, 2012 included an increase of $7.1 million in restricted cash to satisfy the requirements of our 2012 Credit Facility. This requirement was removed in 2013, reducing the restricted cash balance to zero.
Financing activities used net cash of $7.6 million in the year ended September 30, 2012 compared to $0.8 million used in the year ended September 30, 2011. Financing activities in the year ended September 30, 2012 included $0.3 million used for repayments of debt. Financing activities in the year ended September 30, 2011 included $0.8 million used for repayments of debt.
Bonding Capacity
At September 30, 2013, we had adequate surety bonding capacity under our surety agreements. Our ability to access this bonding capacity is at the sole discretion of our surety providers. As of September 30, 2013, the expected cumulative cost to complete for projects covered by our surety providers was $49.2 million. We believe we have adequate remaining available bonding capacity to meet our current needs, subject to the sole discretion of our surety providers. For additional information, please refer to Note 17, " Commitments and Contingencies – Surety " in the notes to our Consolidated Financial Statements.
CONTROLLING SHAREHOLDER
On September 13, 2013, Tontine filed an amended Schedule 13D indicating its ownership level of 58% of the Company's outstanding common stock. While Tontine is subject to restrictions under federal securities laws on sales of its shares as an affiliate, on February 20, 2013, pursuant to a Registration Rights Agreement, Tontine delivered a request to the Company for registration of all of its shares of IES common stock, and on February 21, 2013, the Company filed a shelf registration statement (as amended, the "Shelf
29
Registration Statement") to register Tontine's shares. The Shelf Registration Statement was declared effective by the SEC on June 18, 2013. As long as the Shelf Registration Statement remains effective, Tontine will have the ability to resell any or all of its shares from time to time in one or more offerings, as described in the Shelf Registration Statement and in any prospectus supplement filed in connection with an offering pursuant to the Shelf Registration Statement.
Should Tontine sell, exchange, or otherwise dispose of all or a portion of its position in IES, a change in ownership could occur. A change in ownership, as defined by Internal Revenue Code Section 382, could reduce the availability of net operating losses for federal and state income tax purposes. As of September 30, 2013 we have approximately $466 million of federal NOLs that are available to use to offset taxable income, inclusive of NOLs from the amortization of additional tax goodwill. As of September 30, 2013 we had approximately $315 million of federal NOLs that are available to use to offset taxable income, exclusive of NOLs from the amortization of additional tax goodwill. On January 28, 2013, the Company implemented a tax benefit protection plan (the "NOL Rights Plan") that was designed to deter an acquisition of the Company's stock in excess of a threshold amount that could trigger a change of control within the meaning of Internal Revenue Code Section 382. The NOL Rights Plan was filed as an Exhibit to our Current Report on Form 8-K filed with the SEC on January 28, 2013 and any description thereof is qualified in its entirety by the terms of the NOL Rights Plan. There can be no assurance that the NOL Rights Plan will be effective in deterring a change of control or protecting or realizing the NOLs. Furthermore, a change in control would trigger the change of control provisions in a number of our material agreements, including our 2012 Credit Facility, bonding agreements with our sureties and our executive severance plan.
On April 30, 2010, we prepaid $15.0 million of the original $25.0 million principal outstanding on the Tontine Term Loan; accordingly at September 30, 2012, $10.0 million remained outstanding under the Tontine Term Loan, which was scheduled to mature on May 15, 2013. On February 13, 2013, we repaid the remaining $10.0 million of principal on the Tontine Term Loan, plus accrued interest, with existing cash on hand and proceeds from the Wells Fargo Term Loan. Pursuant to its terms, we were permitted to repay the Tontine Term Loan at any time prior to the maturity date at par, plus accrued interest without penalty within the restrictions of the 2012 Credit Facility.
On March 13, 2013, the Company announced the entry into the Agreement and Plan of Merger with MISCOR, which was amended by the First Amendment to Agreement and Plan of Merger, dated as of July 10, 2013(as amended, the "Merger Agreement"). As of July 24, 2013, Tontine beneficially owned 49.9% of the issued and outstanding shares of MISCOR common stock. Given Tontine's significant holdings in both the Company and MISCOR, only the disinterested members of the IES Board of Directors voted on, and unanimously approved, the Merger Agreement. In addition, MISCOR established a special committee of independent directors that voted on and approved the Merger Agreement and recommended approval of the Merger Agreement by the MISCOR full board of directors. After receiving approval from the special committee, the disinterested members of the MISCOR board of directors unanimously approved the Merger Agreement. The merger was finalized on September 13, 2013. In connection with the merger, Tontine elected to receive stock consideration in exchange for 100% of its shares of MISCOR common stock tendered pursuant to the merger, such that, according to its amended Schedule 13D filed on September 13, 2013, its ownership of IES common stock increased from approximately 56.7% immediately prior to the merger to approximately 58.0% immediately following the merger.
On March 29, 2012, we entered into a sublease agreement with Tontine Associates, LLC, an affiliate of our controlling shareholder, for corporate office space in Greenwich, Connecticut. The lease extends from April 1, 2012 through March 31, 2014, with monthly payments due in the amount of $6 thousand. The lease has terms at market rates and payments by the Company are at a rate consistent with that paid by Tontine Associates, LLC to its landlord.
James M. Lindstrom has served as Chief Executive Officer and President of the Company since October 3, 2011. Mr. Lindstrom previously served in such capacities on an interim basis since June 2011 and has served as Chairman of the Company's Board of Directors since February 2011. Mr. Lindstrom was an employee of Tontine from 2006 until October 2011.
David B. Gendell has served as a member of the Company's Board of Directors since February 2012. Mr. Gendell, who is the brother of Jeffrey Gendell, the founder and managing member of Tontine, is also an employee of Tontine.
OFF-BALANCE SHEET ARRANGEMENTS AND CONTRACTUAL OBLIGATIONS
As is common in our industry, we have entered into certain off-balance sheet arrangements that expose us to increased risk. Our significant off-balance sheet transactions include commitments associated with non-cancelable operating leases, letter of credit obligations, firm commitments for materials and surety guarantees.
We enter into non-cancelable operating leases for many of our vehicle and equipment needs. These leases allow us to retain our cash when we do not own the vehicles or equipment, and we pay a monthly lease rental fee. At the end of the lease, we have no further obligation to the lessor. We may cancel or terminate a lease before the end of its term. Typically, we would be liable to the lessor for various lease cancellation or termination costs and the difference between the fair market value of the leased asset and the implied book value of the leased asset as calculated in accordance with the lease agreement.
30
Some of our customers and vendors require us to post letters of credit as a means of guaranteeing performance under our contracts and ensuring payment by us to subcontractors and vendors. If our customer has reasonable cause to effect payment under a letter of credit, we would be required to reimburse our creditor for the letter of credit. At September 30, 2013, $0.2 million of our outstanding letters of credit were to collateralize our customers and vendors.
Some of the underwriters of our casualty insurance program require us to post letters of credit as collateral, as is common in the insurance industry. To date, we have not had a situation where an underwriter has had reasonable cause to effect payment under a letter of credit. At September 30, 2013, $6.3 million of our outstanding letters of credit were to collateralize our insurance programs.
From time to time, we may enter into firm purchase commitments for materials such as copper wire and aluminum wire, among others, which we expect to use in the ordinary course of business. These commitments are typically for terms less than one year and require us to buy minimum quantities of materials at specified intervals at a fixed price over the term. As of September 30, 2013, we did not have any open purchase commitments.
Many of our customers require us to post performance and payment bonds issued by a surety. Those bonds guarantee the customer that we will perform under the terms of a contract and that we will pay subcontractors and vendors. In the event that we fail to perform under a contract or pay subcontractors and vendors, the customer may demand the surety to pay or perform under our bond. Our relationship with our sureties is such that we will indemnify the sureties for any expenses they incur in connection with any of the bonds they issue on our behalf. To date, we have not incurred any costs to indemnify our sureties for expenses they incurred on our behalf.
As of September 30, 2013, our future contractual obligations due by September 30 of each of the following fiscal years include (in thousands) (1):
| Less than 1 Year | 1 to 3 Years | 3 to 5 Years | More than 5 Years | Total | ||||||||||||||||
Long-term debt obligations | $ | 3,500 | $ | 10,208 | $ | - | $ | - | $ | 13,708 | ||||||||||
Operating lease obligations | $ | 4,829 | $ | 6,176 | $ | 2,118 | $ | 278 | $ | 13,401 | ||||||||||
Capital lease obligations | $ | 62 | $ | 2 | $ | - | $ | - | $ | 64 | ||||||||||
|
|
|
|
|
|
|
|
|
| |||||||||||
Total | $ | 8,391 | $ | 16,386 | $ | 2,118 | $ | 278 | $ | 27,173 | ||||||||||
|
|
|
|
|
|
|
|
|
| |||||||||||
| (1) | The tabular amounts exclude the interest obligations that will be created if the debt and capital lease obligations are outstanding for the periods presented. |
Our other commitments expire by September 30 of each of the following fiscal years (in thousands):
| 2014 | 2015 | 2016 | Thereafter | Total | ||||||||||||||||
Standby letters of credit | $ | 6,460 | $ | - | $ | - | $ | - | $ | 6,460 | ||||||||||
Other commitments | $ | - | $ | - | $ | - | $ | - | $ | - | ||||||||||
|
|
|
|
|
|
|
|
|
| |||||||||||
Total | $ | 6,460 | $ | - | $ | - | $ | - | $ | 6,460 | ||||||||||
|
|
|
|
|
|
|
|
|
| |||||||||||
CRITICAL ACCOUNTING POLICIES
The discussion and analysis of our financial condition and results of operations are based on our Consolidated Financial Statements, which have been prepared in accordance with GAAP. The preparation of our Consolidated Financial Statements requires us to make estimates and assumptions that affect the reported amounts of assets and liabilities, disclosures of contingent assets and liabilities known to exist as of the date the Consolidated Financial Statements are published and the reported amounts of revenues and expenses recognized during the periods presented. We review all significant estimates affecting our Consolidated Financial Statements on a recurring basis and record the effect of any necessary adjustments prior to their publication. Judgments and estimates are based on our beliefs and assumptions derived from information available at the time such judgments and estimates are made. Uncertainties with respect to such estimates and assumptions are inherent in the preparation of financial statements. There can be no assurance that actual results will not differ from those estimates.
Accordingly, we have identified the accounting principles which we believe are most critical to our reported financial status by considering accounting policies that involve the most complex or subjective decisions or assessments. We identified our most critical accounting policies to be those related to revenue recognition, the assessment of goodwill and asset impairment, our allowance for doubtful accounts receivable, the recording of our insurance liabilities and estimation of the valuation allowance for deferred tax assets, and unrecognized tax benefits. These accounting policies, as well as others, are described in Note 2, "Summary of Significant Accounting Policies" in the notes to our Consolidated Financial Statements, and at relevant sections in this discussion and analysis.
31
Revenue Recognition. We enter into contracts principally on the basis of competitive bids. We frequently negotiate the final terms and prices of those contracts with the customer. Although the terms of our contracts vary considerably, most are made on either a fixed price or unit price basis in which we agree to do the work for a fixed amount for the entire project (fixed price) or for units of work performed (unit price). We also perform services on a cost-plus or time and materials basis. Our most significant cost drivers are the cost of labor, the cost of materials and the cost of casualty and health insurance. These costs may vary from the costs we originally estimated. Variations from estimated contract costs along with other risks inherent in performing fixed price and unit price contracts may result in actual revenue and gross profits or interim projected revenue and gross profits for a project differing from those we originally estimated and could result in losses on projects. Depending on the size of a particular project, variations from estimated project costs could have a significant impact on our operating results for any fiscal quarter or year.
We complete most of our projects within one year. We frequently provide service and maintenance work under open-ended, unit price master service agreements which are renewable annually. We recognize revenue on service, time and material work when services are performed. Work performed under a construction contract generally provides that the customers accept completion of progress to date and compensate us for services rendered, measured in terms of units installed, hours expended or some other measure of progress. Revenues from construction contracts are recognized on the percentage-of-completion method. The percentage-of-completion method for construction contracts is measured principally by the percentage of costs incurred and accrued to date for each contract to the estimated total costs for each contract at completion. We generally consider contracts substantially complete upon departure from the work site and acceptance by the customer. Contract costs include all direct material and labor costs and those indirect costs related to contract performance, such as indirect labor, supplies, tools, repairs and depreciation costs. Changes in job performance, job conditions, estimated contract costs, profitability and final contract settlements may result in revisions to costs and income, and the effects of such revisions are recognized in the period in which the revisions are determined. Provisions for total estimated losses on uncompleted contracts are made in the period in which such losses are determined.
The current asset "Costs and estimated earnings in excess of billings on uncompleted contracts" represents revenues recognized in excess of amounts billed that management believes will be billed and collected within the next twelve months. The current liability "Billings in excess of costs and estimated earnings on uncompleted contracts" represents billings in excess of revenues recognized. Costs and estimated earnings in excess of billings on uncompleted contracts are amounts considered recoverable from customers based on different measures of performance, including achievement of specific milestones, completion of specified units or completion of the contract. Also included in this asset, from time to time, are claims and unapproved change orders, which include amounts that we are in the process of collecting from our customers or agencies for changes in contract specifications or design, contract change orders in dispute or unapproved as to scope and price, or other related causes of unanticipated additional contract costs. Claims and unapproved change orders are recorded at estimated realizable value when collection is probable and can be reasonably estimated. We do not recognize profits on construction costs incurred in connection with claims. Claims made by us involve negotiation and, in certain cases, litigation. Such litigation costs are expensed as incurred.
Valuation of Intangibles and Long-Lived Assets. We evaluate goodwill for potential impairment at least annually at year end, however, if impairment indicators exist, we will evaluate as needed. Included in this evaluation are certain assumptions and estimates to determine the fair values of reporting units such as estimates of future cash flows and discount rates, as well as assumptions and estimates related to the valuation of other identified intangible assets. Changes in these assumptions and estimates or significant changes to the market value of our common stock could materially impact our results of operations or financial position. We recorded goodwill impairment during the year ended September 30, 2011 of $0.1 million. We did not record goodwill impairment during the years ended September 30, 2013 and 2012.
We assess impairment indicators related to long-lived assets and intangible assets at least annually at year end. If we determine impairment indicators exist, we conduct an evaluation to determine whether any impairment has occurred. This evaluation includes certain assumptions and estimates to determine fair value of asset groups, including estimates about future cash flows and discount rates, among others. Changes in these assumptions and estimates could materially impact our results of operations or financial projections. We recorded long-lived or intangible asset impairment during the years ended September 30, 2013, 2012 and 2011 of $0.2, $0.7 and $0.1 million, respectively; primarily attributable to real estate we sold at September 30, 2013. The write down was made to reduce the carrying value of the property to its current expected fair value.
Current and Non-Current Accounts and Notes Receivable and Provision for Doubtful Accounts. We provide an allowance for doubtful accounts for unknown collection issues, in addition to reserves for specific accounts receivable where collection is considered doubtful. Inherent in the assessment of the allowance for doubtful accounts are certain judgments and estimates including, among others, our customers' access to capital, our customers' willingness to pay, general economic conditions, and the ongoing relationships with our customers. In addition to these factors, the method of accounting for construction contracts requires the review and analysis of not only the net receivables, but also the amount of billings in excess of costs and costs in excess of billings. The analysis management utilizes to assess collectability of our receivables includes detailed review of older balances, analysis of days sales outstanding where we include in the calculation, in addition to accounts receivable balances net of any allowance for doubtful accounts, the level of costs in excess of billings netted against billings in excess of costs, and the ratio of accounts receivable, net of
32
any allowance for doubtful accounts plus the level of costs in excess of billings, to revenues. These analyses provide an indication of those amounts billed ahead or behind the recognition of revenue on our construction contracts and are important to consider in understanding the operational cash flows related to our revenue cycle.
Risk-Management. We are insured for workers' compensation, automobile liability, general liability, construction defects, employment practices and employee-related health care claims, subject to deductibles. Our general liability program provides coverage for bodily injury and property damage. Losses up to the deductible amounts are accrued based upon our estimates of the liability for claims incurred and an estimate of claims incurred but not reported. The accruals are derived from actuarial studies, known facts, historical trends and industry averages utilizing the assistance of an actuary to determine the best estimate of the ultimate expected loss. We believe such accruals to be adequate; however, insurance liabilities are difficult to assess and estimate due to unknown factors, including the severity of an injury, the determination of our liability in proportion to other parties, the number of incidents incurred but not reported and the effectiveness of our safety program. Therefore, if actual experience differs from the assumptions used in the actuarial valuation, adjustments to the reserve may be required and would be recorded in the period that the experience becomes known.
Valuation Allowance for Deferred Tax Assets. We regularly evaluate valuation allowances established for deferred tax assets for which future realization is uncertain. We perform this evaluation at least annually at the end of each fiscal year. The estimation of required valuation allowances includes estimates of future taxable income. In assessing the realizability of deferred tax assets at September 30, 2013, we considered that it was more likely than not that some or all of the deferred tax assets would not be realized. The ultimate realization of deferred tax assets is dependent upon the generation of future taxable income during the periods in which those temporary differences become deductible. We consider the scheduled reversal of deferred tax liabilities, projected future taxable income and tax planning strategies in making this assessment.
Income Taxes. GAAP specifies the methodology by which a company must identify, recognize, measure and disclose in its financial statements the effects of any uncertain tax return reporting positions that it has taken or expects to take. GAAP requires financial statement reporting of the expected future tax consequences of uncertain tax return reporting positions on the presumption that all relevant tax authorities possess full knowledge of those tax reporting positions, as well as all of the pertinent facts and circumstances, but it prohibits discounting of any of the related tax effects for the time value of money.
The evaluation of a tax position is a two-step process. The first step is the recognition process to determine if it is more likely than not that a tax position will be sustained upon examination by the appropriate taxing authority, based on the technical merits of the position. The second step is a measurement process whereby a tax position that meets the more likely than not recognition threshold is calculated to determine the amount of benefit/expense to recognize in the financial statements. The tax position is measured at the largest amount of benefit/expense that is more likely than not of being realized upon ultimate settlement.
The Financial Accounting Standards Board, ("FASB") has issued standards on business combinations and accounting and reporting of non-controlling interests in consolidated financial statements. Beginning October 1, 2009, with the adoption of the updates, reductions in the valuation allowance and contingent tax liabilities attributable to all periods, if any should occur, are recorded as an adjustment to income tax expense.
We are currently not under federal audit by the Internal Revenue Service. The tax years ended September 30, 2010 and forward are subject to audit as are prior tax years, to the extent of unutilized net operating losses generated in those years.
We anticipate that approximately $3 thousand in liabilities for unrecognized tax benefits, including accrued interest, may be reversed in the next twelve months. This reversal is predominantly due to the expiration of the statutes of limitation for unrecognized tax benefits.
New Accounting Pronouncements. Newly adopted accounting policies are described in Note 2, "Summary of Significant Accounting Policies - New Accounting Pronouncements " in the notes to our Consolidated Financial Statements, and at relevant sections in this discussion and analysis.
33
Item 7A. Quantitative and Qualitative Disclosures About Market Risk
Management is actively involved in monitoring exposure to market risk and continues to develop and utilize appropriate risk management techniques. Our exposure to significant market risks includes fluctuations in labor costs, commodity prices for copper, aluminum, steel and fuel. Commodity price risks may have an impact on our results of operations due to the fixed price nature of many of our contracts. We are also exposed to interest rate risk with respect to our outstanding debt obligations on the 2012 Credit Facility. For additional information see "Risk Factors" in Item 1A of this Form 10-K.
Commodity Risk
Our exposure to significant market risks includes fluctuations in commodity prices for copper, aluminum, steel and fuel. Commodity price risks may have an impact on our results of operations due to fixed nature of many of our contracts. Over the long-term, we expect to be able to pass along a portion of these costs to our customers, as market conditions in the construction industry will allow.
Interest Rate Risk
We are subject to interest rate risk on our floating interest rate borrowings. Floating rate debt, where the interest rate fluctuates periodically, exposes us to short-term changes in market interest rates.
While all of the long-term debt outstanding under our Credit Facility is structured on floating interest rate terms, approximately 76% of our long-term debt outstanding as of September 30, 2013 was effectively subject to fully floating interest rate terms after giving effect to our interest rate hedging arrangement. A one percentage point increase in the interest rates on our long-term debt outstanding under our Credit Facility as of September 30, 2013 would cause a $0.1 million pre-tax annual increase in interest expense.
34
Item 8. Financial Statements and Supplementary Data
INDEX TO CONSOLIDATED FINANCIAL STATEMENTS
| Page | ||||
Report of Independent Registered Public Accounting Firm | 36 | |||
Consolidated Balance Sheets | 37 | |||
Consolidated Statements of Comprehensive Income | 38 | |||
Consolidated Statements of Stockholders' Equity | 39 | |||
Consolidated Statements of Cash Flows | 40 | |||
Notes to Consolidated Financial Statements | 41 | |||
35
REPORT OF INDEPENDENT REGISTERED PUBLIC ACCOUNTING FIRM
The Board of Directors and Stockholders of
Integrated Electrical Services, Inc.
We have audited the accompanying consolidated balance sheets of Integrated Electrical Services, Inc. and subsidiaries ("the Company") as of September 30, 2013 and 2012, and the related consolidated statements of comprehensive income, stockholders' equity, and cash flows for each of the three years in the period ended September 30, 2013. These financial statements are the responsibility of the Company's management. Our responsibility is to express an opinion on these financial statements based on our audits.
We conducted our audits in accordance with the standards of the Public Company Accounting Oversight Board (United States). Those standards require that we plan and perform the audit to obtain reasonable assurance about whether the financial statements are free of material misstatement. We were not engaged to perform an audit of the Company's internal control over financial reporting. Our audits included consideration of internal control over financial reporting as a basis for designing audit procedures that are appropriate in the circumstances, but not for the purpose of expressing an opinion on the effectiveness of the Company's internal control over financial reporting. Accordingly, we express no such opinion. An audit also includes examining, on a test basis, evidence supporting the amounts and disclosures in the financial statements, assessing the accounting principles used and significant estimates made by management, and evaluating the overall financial statement presentation. We believe that our audits provide a reasonable basis for our opinion.
In our opinion, the financial statements referred to above present fairly, in all material respects, the consolidated financial position of Integrated Electrical Services, Inc. and subsidiaries at September 30, 2013 and 2012, and the consolidated results of their operations and their cash flows for each of the three years in the period ended September 30, 2013, in conformity with U.S. generally accepted accounting principles.
/s/ ERNST & YOUNG LLP
Houston, Texas
December 17, 2013
36
INTEGRATED ELECTRICAL SERVICES, INC. AND SUBSIDIARIES
Consolidated Balance Sheets
(In Thousands, Except Share Information)
| September 30, 2013 | September 30, 2012 | |||||||
| ASSETS | ||||||||
CURRENT ASSETS: | ||||||||
Cash and cash equivalents | $ | 20,757 | $ | 18,729 | ||||
Restricted cash | - | 7,155 | ||||||
Accounts receivable: | ||||||||
Trade, net of allowance of $980 and $1,788, respectively | 73,540 | 76,259 | ||||||
Retainage | 17,473 | 17,004 | ||||||
Inventories | 20,147 | 15,141 | ||||||
Costs and estimated earnings in excess of billings on uncompleted contracts | 8,336 | 8,180 | ||||||
Assets held for sale | - | 1,110 | ||||||
Prepaid expenses and other current assets | 3,772 | 3,807 | ||||||
|
|
|
| |||||
Total current assets | 144,025 | 147,385 | ||||||
|
|
|
| |||||
LONG-TERM RECEIVABLES, net of allowance | 35 | 259 | ||||||
PROPERTY AND EQUIPMENT | 10,414 | 6,480 | ||||||
GOODWILL | 13,924 | 4,446 | ||||||
INTANGIBLE ASSETS | 4,138 | - | ||||||
OTHER NON-CURRENT ASSETS | 6,716 | 6,143 | ||||||
|
|
|
| |||||
Total assets | $ | 179,252 | $ | 164,713 | ||||
|
|
|
| |||||
| LIABILITIES AND STOCKHOLDERS' EQUITY | ||||||||
CURRENT LIABILITIES: | ||||||||
Current maturities of long-term debt | $ | 3,562 | $ | 456 | ||||
Current maturities of long-term debt, related party | - | 10,000 | ||||||
|
|
|
| |||||
Current maturities of long-term debt, total | 3,562 | 10,456 | ||||||
Accounts payable and accrued expenses | 74,320 | 68,673 | ||||||
Billings in excess of costs and estimated earnings on uncompleted contracts | 20,676 | 25,255 | ||||||
|
|
|
| |||||
Total current liabilities | 98,558 | 104,384 | ||||||
|
|
|
| |||||
LONG-TERM DEBT, net of current maturities | 10,210 | 24 | ||||||
LONG-TERM DEFERRED TAX LIABILITY | 905 | 285 | ||||||
OTHER NON-CURRENT LIABILITIES | 7,093 | 6,863 | ||||||
|
|
|
| |||||
Total liabilities | 116,766 | 111,556 | ||||||
|
|
|
| |||||
STOCKHOLDERS' EQUITY: | ||||||||
Preferred stock, $0.01 par value, 10,000,000 shares authorized, none issued and outstanding | - | - | ||||||
Common stock, $0.01 par value, 100,000,000 shares authorized; 18,203,379 and 15,407,802 shares issued and 17,944,322 and 14,977,400 outstanding, respectively | 182 | 154 | ||||||
Treasury stock, at cost, 259,057 and 430,402 shares, respectively | (2,332 | ) | (4,546 | ) | ||||
Additional paid-in capital | 174,514 | 163,871 | ||||||
Accumulated other comprehensive income | 17 | - | ||||||
Retained deficit | (109,895 | ) | (106,322 | ) | ||||
|
|
|
| |||||
Total stockholders' equity | 62,486 | 53,157 | ||||||
|
|
|
| |||||
Total liabilities and stockholders' equity | $ | 179,252 | $ | 164,713 | ||||
|
|
|
| |||||
The accompanying notes are an integral part of these Consolidated Financial Statements.
37
INTEGRATED ELECTRICAL SERVICES, INC. AND SUBSIDIARIES
Consolidated Statements of Comprehensive Income
(In Thousands, Except Share Information)
| Years Ended September 30, | ||||||||||||
| 2013 | 2012 | 2011 | ||||||||||
Revenues | $ | 494,593 | $ | 456,115 | $ | 406,141 | ||||||
Cost of services | 427,633 | 398,063 | 361,757 | |||||||||
|
|
|
|
|
| |||||||
Gross profit | 66,960 | 58,052 | 44,384 | |||||||||
Selling, general and administrative expenses | 66,598 | 58,609 | 63,321 | |||||||||
Gain on sale of assets | (64 | ) | (168 | ) | (6,555 | ) | ||||||
Asset impairment | - | - | 4,804 | |||||||||
|
|
|
|
|
| |||||||
Income (loss) from operations | 426 | (389 | ) | (17,186 | ) | |||||||
|
|
|
|
|
| |||||||
Interest and other (income) expense: | ||||||||||||
Interest expense | 1,771 | 2,324 | 2,278 | |||||||||
Interest income | (152 | ) | (34 | ) | (68 | ) | ||||||
Other (income) expense, net | 659 | (62 | ) | (7 | ) | |||||||
|
|
|
|
|
| |||||||
Interest and other expense, net | 2,278 | 2,228 | 2,203 | |||||||||
|
|
|
|
|
| |||||||
Loss from continuing operations before income taxes | (1,852 | ) | (2,617 | ) | (19,389 | ) | ||||||
Provision for income taxes | 326 | 38 | 172 | |||||||||
|
|
|
|
|
| |||||||
Net loss from continuing operations | $ | (2,178 | ) | $ | (2,655 | ) | $ | (19,561 | ) | |||
|
|
|
|
|
| |||||||
Discontinued operations (Note 20) | ||||||||||||
Loss from discontinued operations | (1,395 | ) | (9,158 | ) | (18,288 | ) | ||||||
Benefit for income taxes | - | (11 | ) | (26 | ) | |||||||
|
|
|
|
|
| |||||||
Net loss from discontinued operations | (1,395 | ) | (9,147 | ) | (18,262 | ) | ||||||
|
|
|
|
|
| |||||||
Net loss | $ | (3,573 | ) | $ | (11,802 | ) | $ | (37,823 | ) | |||
|
|
|
|
|
| |||||||
Unrealized gain on interest hedge, net of tax | 17 | - | - | |||||||||
Comprehensive loss | $ | (3,556 | ) | $ | (11,802 | ) | $ | (37,823 | ) | |||
|
|
|
|
|
| |||||||
Loss per share: | ||||||||||||
Continuing operations | $ | (0.15 | ) | $ | (0.18 | ) | $ | (1.35 | ) | |||
Discontinued operations | $ | (0.09 | ) | $ | (0.63 | ) | $ | (1.26 | ) | |||
|
|
|
|
|
| |||||||
Basic | $ | (0.24 | ) | $ | (0.81 | ) | $ | (2.61 | ) | |||
Diluted loss per share: | ||||||||||||
Continuing operations | $ | (0.15 | ) | $ | (0.18 | ) | $ | (1.35 | ) | |||
Discontinued operations | $ | (0.09 | ) | $ | (0.63 | ) | $ | (1.26 | ) | |||
|
|
|
|
|
| |||||||
Diluted | $ | (0.24 | ) | $ | (0.81 | ) | $ | (2.61 | ) | |||
Shares used in the computation of loss per share | ||||||||||||
Basic | 14,952,054 | 14,625,776 | 14,493,747 | |||||||||
Diluted | 14,952,054 | 14,625,776 | 14,493,747 | |||||||||
The accompanying notes are an integral part of these Consolidated Financial Statements.
38
INTEGRATED ELECTRICAL SERVICES, INC. AND SUBSIDIARIES
Consolidated Statements of Stockholders' Equity
(In Thousands, Except Share Information)
| Common Stock | Treasury Stock | APIC | Accumulated
Other Comprehensive Income (Loss) | Retained Deficit | Total Stockholders' Equity | |||||||||||||||||||||||||||
| Shares | Amount | Shares | Amount | |||||||||||||||||||||||||||||
BALANCE, September 30, 2010 | 15,407,802 | $ | 154 | (633,898 | ) | $ | (13,677 | ) | $ | 171,510 | $ | (88 | ) | $ | (56,697 | ) | $ | 101,202 | ||||||||||||||
Restricted stock grant | - | - | 333,616 | 4,595 | (4,595 | ) | - | - | - | |||||||||||||||||||||||
Forfeiture of restricted stock | - | - | (130,258 | ) | (450 | ) | 450 | - | - | - | ||||||||||||||||||||||
Acquisition of treasury stock | - | - | (20,789 | ) | 3,937 | (4,009 | ) | - | - | (72 | ) | |||||||||||||||||||||
Non-cash compensation | - | - | - | - | 907 | - | - | 907 | ||||||||||||||||||||||||
Unrealized loss on marketable securities, net of tax | - | - | - | - | - | 88 | - | 88 | ||||||||||||||||||||||||
Net loss | - | - | - | - | - | - | (37,823 | ) | (37,823 | ) | ||||||||||||||||||||||
|
|
|
|
|
|
|
|
|
|
|
|
|
|
|
| |||||||||||||||||
BALANCE, September 30, 2011 | 15,407,802 | $ | 154 | (451,329 | ) | $ | (5,595 | ) | $ | 164,263 | $ | - | $ | (94,520 | ) | $ | 64,302 | |||||||||||||||
|
|
|
|
|
|
|
|
|
|
|
|
|
|
|
| |||||||||||||||||
Restricted stock grant | - | - | 107,500 | 1,322 | (1,322 | ) | - | - | - | |||||||||||||||||||||||
Forfeiture of restricted stock | - | - | (32,277 | ) | (92 | ) | 92 | - | - | - | ||||||||||||||||||||||
Acquisition of treasury stock | - | - | (54,296 | ) | (181 | ) | - | - | - | (181 | ) | |||||||||||||||||||||
Non-cash compensation | - | - | - | - | 838 | - | - | 838 | ||||||||||||||||||||||||
Net loss | - | - | - | - | - | - | (11,802 | ) | (11,802 | ) | ||||||||||||||||||||||
|
|
|
|
|
|
|
|
|
|
|
|
|
|
|
| |||||||||||||||||
BALANCE, September 30, 2012 | 15,407,802 | $ | 154 | (430,402 | ) | $ | (4,546 | ) | $ | 163,871 | $ | - | $ | (106,322 | ) | $ | 53,157 | |||||||||||||||
|
|
|
|
|
|
|
|
|
|
|
|
|
|
|
| |||||||||||||||||
Restricted stock grant | - | - | 266,814 | 2,649 | (2,649 | ) | - | - | - | |||||||||||||||||||||||
Forfeiture of restricted stock | - | - | - | - | - | - | - | - | ||||||||||||||||||||||||
Acquisition of treasury stock | - | - | (95,469 | ) | (435 | ) | - | - | - | (435 | ) | |||||||||||||||||||||
Non-cash compensation | - | - | - | - | 1,430 | - | - | 1,430 | ||||||||||||||||||||||||
Interest rate swap | - | - | - | - | - | 17 | - | 17 | ||||||||||||||||||||||||
Issuance of stock related to acquisition | 2,795,577 | 28 | - | - | 11,862 | - | - | 11,890 | ||||||||||||||||||||||||
Net loss | - | - | - | - | - | - | (3,573 | ) | (3,573 | ) | ||||||||||||||||||||||
|
|
|
|
|
|
|
|
|
|
|
|
|
|
|
| |||||||||||||||||
BALANCE ,September 30, 2013 | 18,203,379 | $ | 182 | (259,057 | ) | $ | (2,332 | ) | $ | 174,514 | $ | 17 | $ | (109,895 | ) | $ | 62,486 | |||||||||||||||
|
|
|
|
|
|
|
|
|
|
|
|
|
|
|
| |||||||||||||||||
The accompanying notes are an integral part of these Consolidated Financial Statements.
39
INTEGRATED ELECTRICAL SERVICES, INC. AND SUBSIDIARIES
Consolidated Statements of Cash Flows
(In Thousands)
| Years Ended September 30, | ||||||||||||
| 2013 | 2012 | 2011 | ||||||||||
CASH FLOWS FROM OPERATING ACTIVITIES: | ||||||||||||
Net loss | $ | (3,573 | ) | $ | (11,802 | ) | $ | (37,823 | ) | |||
Adjustments to reconcile net loss to net cash provided by operating activities: | ||||||||||||
Bad debt expense | 4 | (858 | ) | (715 | ) | |||||||
Deferred financing cost amortization | 286 | 209 | 338 | |||||||||
Depreciation and amortization | 2,552 | 2,146 | 6,356 | |||||||||
Gain on sale of business units | - | - | (6,657 | ) | ||||||||
Loss (gain) on sale of assets | 119 | 44 | 88 | |||||||||
Non-cash compensation expense | 1,430 | 838 | 907 | |||||||||
Impairment | 1,475 | 688 | 4,854 | |||||||||
Deferred income tax | - | (39 | ) | (107 | ) | |||||||
Changes in operating assets and liabilities | ||||||||||||
Accounts receivable | 3,987 | 11,130 | (2,761 | ) | ||||||||
Inventories | 2,523 | (6,698 | ) | (537 | ) | |||||||
Costs and estimated earnings in excess of billings | (155 | ) | 1,782 | 2,222 | ||||||||
Prepaid expenses and other current assets | 670 | (273 | ) | 1,206 | ||||||||
Other non-current assets | (625 | ) | 211 | 3,092 | ||||||||
Accounts payable and accrued expenses | (1,201 | ) | (10,114 | ) | 14,861 | |||||||
Billings in excess of costs and estimated earnings | (4,579 | ) | 5,670 | 2,476 | ||||||||
Other non-current liabilities | (959 | ) | (305 | ) | 348 | |||||||
|
|
|
|
|
| |||||||
Net cash (used in) provided by operating activities | 1,954 | (7,371 | ) | (11,852 | ) | |||||||
|
|
|
|
|
| |||||||
CASH FLOWS FROM INVESTING ACTIVITIES: | ||||||||||||
Purchases of property and equipment | (444 | ) | (1,877 | ) | (2,688 | ) | ||||||
Proceeds from sales of property and equipment | 829 | - | 1,268 | |||||||||
Proceeds from sales of facilities | - | - | 16,763 | |||||||||
Cash paid in conjunction with business combination | (5,155 | ) | - | - | ||||||||
|
|
|
|
|
| |||||||
Net cash provided by (used in) investing activities | (4,770 | ) | (1,877 | ) | 15,343 | |||||||
|
|
|
|
|
| |||||||
CASH FLOWS FROM FINANCING ACTIVITIES: | ||||||||||||
Borrowings of debt | 15,167 | - | - | |||||||||
Repayments of debt | (17,042 | ) | (264 | ) | (766 | ) | ||||||
Purchase of treasury stock | (436 | ) | (181 | ) | (72 | ) | ||||||
Change in restricted cash | 7,155 | (7,155 | ) | - | ||||||||
|
|
|
|
|
| |||||||
Net cash provided by (used in) financing activities | 4,844 | (7,600 | ) | (838 | ) | |||||||
|
|
|
|
|
| |||||||
NET INCREASE (DECREASE) IN CASH EQUIVALENTS | 2,028 | (16,848 | ) | 2,653 | ||||||||
CASH AND CASH EQUIVALENTS, beginning of period | 18,729 | 35,577 | 32,924 | |||||||||
|
|
|
|
|
| |||||||
CASH AND CASH EQUIVALENTS, end of period | $ | 20,757 | $ | 18,729 | $ | 35,577 | ||||||
|
|
|
|
|
| |||||||
| SUPPLEMENTAL DISCLOSURE OF CASH FLOW INFORMATION: | 2013 | 2012 | 2011 | |||||||||
Cash paid for interest | $ | 1,115 | $ | 1,646 | $ | 2,293 | ||||||
Cash paid for income taxes | $ | 496 | $ | 436 | $ | 340 | ||||||
Assets acquired under capital lease | $ | - | $ | - | $ | 68 | ||||||
The accompanying notes are an integral part of these Consolidated Financial Statements.
40
INTEGRATED ELECTRICAL SERVICES, INC.
Notes to Consolidated Financial Statements
(All Amounts in Thousands Except Share Amounts)
1. BUSINESS
Description of the Business
Integrated Electrical Services, Inc. is a holding company that owns and manages operating subsidiaries in business activities across a variety of end markets. Our operations are currently organized into four principal business segments, based upon the nature of our current products and services:
| • | Communications – Nationwide provider of products and services for mission critical infrastructure, such as data centers, of large corporations. |
| • | Residential – Regional provider of electrical installation services for single-family housing and multi-family apartment complexes. |
| • | Commercial & Industrial – Provider of electrical design, construction, and maintenance services to the commercial and industrial markets in various regional markets and nationwide in certain areas of expertise, such as the power infrastructure market. |
| • | Infrastructure Solutions – Provider of industrial and rail services, and electrical and mechanical solutions to domestic and international customers. This segment was created in connection with the acquisition of MISCOR. |
The words "IES", the "Company", "we", "our", and "us" refer to Integrated Electrical Services, Inc. and, except as otherwise specified herein, to our wholly-owned subsidiaries.
Our Communications segment is a leading provider of network infrastructure products and services for data centers and other mission critical environments. Services offered include the design, installation and maintenance of network infrastructure for the financial, medical, hospitality, government, hi-tech manufacturing, educational and information technology industries. We also provide the design and installation of audio/visual, telephone, fire, wireless and intrusion alarm systems as well as design/build, service and maintenance of data network systems. We perform services across the United States from our ten offices, which includes our Communications headquarters located in Tempe, Arizona, allowing for dedicated onsite maintenance teams at our customer's sites.
Our Residential segment provides electrical installation services for single-family housing and multi-family apartment complexes and CATV cabling installations for residential and light commercial applications. In addition to our core electrical construction work, the Residential segment has expanded its offerings by providing services for the installation of residential solar power, smart meters, electric car charging stations and stand-by generators, both for new construction and existing residences. The Residential segment is made up of 24 total locations, which includes our Residential headquarters in Houston. These segment locations geographically cover Texas, the Sun-Belt, and the Western and Mid-Atlantic regions of the United States, including Hawaii.
Our Commercial & Industrial segment is one of the largest providers of electrical contracting services in the United States. The segment offers a broad range of electrical design, construction, renovation, engineering and maintenance services to the commercial and industrial markets. The Commercial & Industrial segment consists of 18 total locations, which includes our Commercial & Industrial headquarters in Houston, Texas. These locations geographically cover Texas, Nebraska, Colorado, Oregon and the Mid-Atlantic region. Services include the design of electrical systems within a building or complex, procurement and installation of wiring and connection to power sources, end-use equipment and fixtures, as well as contract maintenance. We focus on projects that require special expertise, such as design-and-build projects that utilize the capabilities of our in-house experts, or projects which require specific market expertise, such as transmission and distribution and power generation facilities. We also focus on service, maintenance and certain renovation and upgrade work, which tends to be either recurring or have lower sensitivity to economic cycles, or both. We provide services for a variety of projects, including: high-rise residential and office buildings, power plants, manufacturing facilities, data centers, chemical plants, refineries, wind farms, solar facilities, municipal infrastructure and health care facilities, and residential developments. Our utility services consist of overhead and underground installation and maintenance of electrical and other utilities transmission and distribution networks, installation and splicing of high-voltage transmission and distribution lines, substation construction and substation and right-of-way maintenance. Our maintenance services generally provide recurring revenues that are typically less affected by levels of construction activity. Service and maintenance revenues are derived from service calls and routine maintenance contracts, which tend to be recurring and less sensitive to short term economic fluctuations.
41
INTEGRATED ELECTRICAL SERVICES, INC.
Notes to Consolidated Financial Statements
(All Amounts in Thousands Except Share Amounts)
Our Infrastructure Solutions segment provides maintenance and repair services to several industries, including electric motor repair and rebuilding for the steel, railroad, marine, petrochemical, pulp and paper, wind energy, mining, automotive and power generation industries. Infrastructure Solutions repairs and manufactures industrial lifting magnets for the steel and scrap industries, provides locomotive maintenance, remanufacturing, and repair services to the rail industry, and manufactures and rebuilds power assemblies, engine parts, and other components for large diesel engines. Infrastructure Solutions is made up of nine total locations, which includes our Infrastructure Solutions headquarters in Ohio. These segment locations geographically cover Alabama, Indiana, Ohio, West Virginia, Maryland and California.
Controlling Shareholder
At September 30, 2013, Tontine Capital Partners, L.P. and its affiliates (collectively, "Tontine"), was the controlling shareholder of the Company's common stock. Accordingly, Tontine has the ability to exercise significant control over our affairs, including the election of directors and any action requiring the approval of shareholders, including the approval of any potential merger or sale of all or substantially all assets or segments of the Company, or the Company itself. For a more complete discussion on our relationship with Tontine, please refer to Note 3, "Controlling Shareholder" in the notes to our Consolidated Financial Statements.
Sale of Non-Core Electrical Distribution Facility
On February 28, 2011, Key Electrical Supply, Inc, a wholly owned subsidiary of the Company, sold substantially all the assets and certain liabilities of a non-core electrical distribution facility engaged in distributing wiring, lighting, electrical distribution, power control and generators for residential and commercial applications to Elliot Electric Supply, Inc. for a purchase price of $6,676. The loss on this transaction was immaterial.
2. SUMMARY OF SIGNIFICANT ACCOUNTING POLICIES
Principles of Consolidation
The accompanying consolidated financial statements include the accounts of IES and its wholly-owned subsidiaries. All significant intercompany accounts and transactions have been eliminated in consolidation. In the opinion of management, all adjustments considered necessary for a fair presentation have been included and are of a normal recurring nature.
Asset Impairment
During the fiscal years ended September 30, 2013 and 2012, the Company recorded pretax non-cash asset impairment charges of $200 and $688, respectively, related to real estate held by our Commercial & Industrial segment. The real estate was held within a location selected for closure during 2011. This impairment was to adjust the carrying value of real estate held for sale to the estimated current market value less expected selling expenses. The real estate is classified as assets held for sale within our Consolidated Balance Sheets as of September 30, 2012, and was subsequently sold on September 30, 2013. The impairment charges are included in our net loss from discontinued operations within our Consolidated Statements of Comprehensive Income.
During the fiscal year ended September 30, 2011, the Company recorded a pretax non-cash asset impairment charge of $3,551 related to certain internally-developed capitalized software within our Corporate segment, $968 for our investment in EnerTech Capital Partners II L.P. ("EnerTech") within our Corporate segment, $142 for goodwill within our Commercial & Industrial segment and $143 within our Commercial & Industrial segment, related to real estate held by the Company which was impaired further in 2012 and 2013, as noted above. The Company ceased use of the internally-developed software in 2011. As a result, the software has a fair value of zero. The non-cash impairments related to the investment in EnerTech and the real estate were to adjust the carrying value to their estimated current market values.
Use of Estimates
The preparation of financial statements in conformity with accounting principles generally accepted in the United States of America ("GAAP") requires the use of estimates and assumptions by management in determining the reported amounts of assets and liabilities, disclosures of contingent liabilities at the date of the financial statements and the reported amounts of revenues and expenses during
42
INTEGRATED ELECTRICAL SERVICES, INC.
Notes to Consolidated Financial Statements
(All Amounts in Thousands Except Share Amounts)
the reporting period. Actual results could differ from those estimates. Estimates are primarily used in our revenue recognition of construction in progress, fair value assumptions in analyzing goodwill, investments, intangible assets and long-lived asset impairments and adjustments, allowance for doubtful accounts receivable, stock-based compensation, reserves for legal matters, assumptions regarding estimated costs to exit certain segments, realizability of deferred tax assets, unrecognized tax benefits and self-insured claims liabilities and related reserves.
Cash and Cash Equivalents
We consider all highly liquid investments purchased with an original maturity of three months or less to be cash equivalents.
Inventories
Inventories generally consist of raw materials, work in process, finished goods, and parts and supplies held for use in the ordinary course of business. Inventory is valued at the lower of cost or market generally using the historical average cost or first-in, first-out (FIFO) method. When circumstances dictate, we write down inventory to its estimated realizable value based on assumptions about future demand, market conditions, plans for disposal, and physical condition of the product. Where shipping and handling costs are borne by us, these charges are included in inventory and charged to cost of services upon use in our projects or the providing of services.
Securities and Equity Investments
Our investments are accounted for using either the cost or equity method of accounting, as appropriate. Each period, we evaluate whether an event or change in circumstances has occurred that may indicate an investment has been impaired. If, upon further investigation of such events, we determine the investment has suffered a decline in value that is other than temporary, we write down the investment to its estimated fair value.
Long-Term Receivables
From time to time, we enter into payment plans with certain customers over periods in excess of one year. We classify these receivables as long-term receivables. Additionally, we provide an allowance for doubtful accounts for specific long-term receivables where collection is considered doubtful.
In March 2009, in connection with a construction project entering bankruptcy, we transferred $3,992 of trade accounts receivable to long-term receivable and initiated breach of contract and mechanics' lien foreclosure actions against the project's general contractor and owner, respectively. At the same time, we reserved the costs in excess of billings of $278 associated with this receivable. In March 2010, given the significant uncertainty associated with its ultimate collectability we reserved the remaining balance of $3,714, but continued to pursue collection through the bankruptcy court proceeding. In February 2011, we entered into a $2,850 settlement in connection with the breach of contract and mechanics' lien foreclosure actions related to the receivable. The $2,850 recovery was recorded in the accompanying consolidated statements of comprehensive income as a component of selling, general, and administrative expenses.
Property and Equipment
Additions of property and equipment are recorded at cost, and depreciation is computed using the straight-line method over the estimated useful life of the related asset. Leasehold improvements are capitalized and depreciated over the lesser of the life of the lease or the estimated useful life of the asset.
Expenditures for repairs and maintenance are charged to expense when incurred. Expenditures for major renewals and betterments, which extend the useful lives of existing property and equipment, are capitalized and depreciated. Upon retirement or disposition of property and equipment, the capitalized cost and related accumulated depreciation are removed from the accounts and any resulting gain or loss is recognized in the statements of comprehensive income in the caption (gain) loss on sale of assets.
43
INTEGRATED ELECTRICAL SERVICES, INC.
Notes to Consolidated Financial Statements
(All Amounts in Thousands Except Share Amounts)
Goodwill
Goodwill attributable to each reporting unit is tested for impairment by comparing the fair value of each reporting unit with its carrying value. Fair value is determined using discounted cash flows. These impairment tests are required to be performed at least annually. Significant estimates used in the methodologies include estimates of future cash flows, future short-term and long-term growth rates, and weighted average cost of capital for each of the reportable units. On an ongoing basis (absent any impairment indicators), we perform an impairment test annually using a measurement date of September 30.
Intangible Assets
Intangible assets with definite lives are amortized over their estimated useful lives based on expected economic benefit with no residual value. Customer relationships are amortized assuming gradual attrition. Intangible assets with indefinite lives are not subject to amortization. We perform a test for impairment annually, or more frequently when indicators of impairment are present.
Debt Issuance Costs
Debt issuance costs are included in other noncurrent assets and are amortized to interest expense over the scheduled maturity of the debt. Amortization expense of debt issuance costs was $522, $568 and $338, respectively, for the years ended 2013, 2012 and 2011. Remaining unamortized capitalized debt issuance costs were $1,449 and $1,139 at September 30, 2013, and September 30, 2012, respectively.
Revenue Recognition
Revenue is generally recognized once the following four criteria are met; (i) persuasive evidence of an arrangement exists, (ii) delivery of the product has occurred or services have been rendered, (iii) the price of the product or service is fixed and determinable, and (iv) collectability is reasonably assured. Costs associated with these products and services are recognized within the period they are incurred.
We recognize revenue on project contracts using the percentage of completion method. Project contracts generally provide that customers accept completion of progress to date and compensate us for services rendered measured in terms of units installed, hours expended or some other measure of progress. We recognize revenue on both signed contracts and change orders. A discussion of our treatment of claims and unapproved change orders is described later in this section. Percentage of completion for construction contracts is measured principally by the percentage of costs incurred and accrued to date for each contract to the estimated total cost for each contract at completion. We generally consider contracts to be substantially complete upon departure from the work site and acceptance by the customer. Contract costs include all direct material, labor and insurance costs and those indirect costs related to contract performance, such as indirect labor, supplies, tools, repairs and depreciation costs. Changes in job performance, job conditions, estimated contract costs and profitability and final contract settlements may result in revisions to costs and income and the effects of these revisions are recognized in the period in which the revisions are determined. Provisions for total estimated losses on uncompleted contracts are made in the period in which such losses are determined. The balances billed but not paid by customers pursuant to retainage provisions in project contracts will be due upon completion of the contracts and acceptance by the customer. Based on our experience, the retention balance at each balance sheet date will be collected within the subsequent fiscal year.
Certain divisions in the Residential segment use the completed contract method of accounting because the duration of their contracts is short in nature. We recognize revenue on completed contracts when the project is complete and billable to the customer. Provisions for estimated losses on these contracts are recorded in the period such losses are determined.
The current asset "Costs and estimated earnings in excess of billings on uncompleted contracts" represents revenues recognized in excess of amounts billed which management generally believes will generally be billed and collected within the next twelve months. Also included in this asset, from time to time, are claims and unapproved change orders which are amounts we are in the process of collecting from our customers or agencies for changes in contract specifications or design, contract change orders in dispute or unapproved as to scope and price, or other related causes of unanticipated additional contract costs. Claims are limited to costs incurred and are recorded at estimated realizable value when collection is probable and can be reasonably estimated. We do not recognize profits on project costs incurred in connection with claims. Claims made by us involve negotiation and, in certain cases, litigation. Such litigation costs are expensed as incurred. As of September 30, 2013, 2012 and 2011, there were no material revenues recorded associated with any claims. The current liability "Billings in excess of costs and estimated earnings on uncompleted
44
INTEGRATED ELECTRICAL SERVICES, INC.
Notes to Consolidated Financial Statements
(All Amounts in Thousands Except Share Amounts)
contracts" represents billings in excess of revenues recognized. Costs and estimated earnings in excess of billings on uncompleted contracts are amounts considered recoverable from customers based on different measures of performance, including achievement of specific milestones, completion of specified units or at the completion of the contract.
Accounts Receivable and Allowance for Doubtful Accounts
We record accounts receivable for all amounts billed and not collected. Generally, we do not charge interest on outstanding accounts receivable; however, from time to time we may believe it necessary to charge interest on a case by case basis. Additionally, we provide an allowance for doubtful accounts for specific accounts receivable where collection is considered doubtful as well as for general unknown collection issues based on historical trends. Accounts receivable not determined to be collectible are written off as deemed necessary in the period such determination is made. As is common in our industry, some of these receivables are in litigation or require us to exercise our contractual lien rights in order to collect. These receivables are primarily associated with a few divisions within our Commercial & Industrial segment. Certain other receivables are slow-pay in nature and require us to exercise our contractual or lien rights. We believe that our allowance for doubtful accounts is sufficient to cover uncollectible receivables as of September 30, 2013 and September 30, 2012.
Comprehensive Income
Comprehensive income includes all changes in equity during a period except those resulting from investments by and distributions to stockholders.
Income Taxes
We follow the asset and liability method of accounting for income taxes. Under this method, deferred income tax assets and liabilities are recorded for the future income tax consequences of temporary differences between the financial reporting and income tax bases of assets and liabilities, and are measured using enacted tax rates and laws.
We regularly evaluate valuation allowances established for deferred tax assets for which future realization is uncertain. We perform this evaluation at least annually at the end of each fiscal year. The estimation of required valuation allowances includes estimates of future taxable income. In assessing the realizability of deferred tax assets at September 30, 2013, we considered whether it was more likely than not that some portion or all of the deferred tax assets would not be realized. The ultimate realization of deferred tax assets is dependent upon the generation of future taxable income during the periods in which those temporary differences become deductible. We consider the scheduled reversal of deferred tax liabilities, projected future taxable income and tax planning strategies in making this assessment. If actual future taxable income is different from the estimates, our results could be affected. We have determined to fully reserve against such an occurrence.
On May 12, 2006, we had a change in ownership as defined in Internal Revenue Code Section 382. Internal Revenue Code Section 382 limits the utilization of net operating losses that existed as of the change in ownership in tax periods subsequent to the change in ownership. As such, our utilization after the change date of net operating losses in existence as of the change in ownership is subject to Internal Revenue Code Section 382 limitations for federal income taxes and some state income taxes. We have provided valuation allowances on all net operating losses where it is determined it is more likely than not that they will expire without being utilized.
45
INTEGRATED ELECTRICAL SERVICES, INC.
Notes to Consolidated Financial Statements
(All Amounts in Thousands Except Share Amounts)
Risk-Management
We retain the risk for workers' compensation, employer's liability, automobile liability, general liability and employee group health claims, as well as pollution coverage, resulting from uninsured deductibles per accident or occurrence which are subject to annual aggregate limits. Our general liability program provides coverage for bodily injury and property damage. Losses up to the deductible amounts are accrued based upon our known claims incurred and an estimate of claims incurred but not reported. For the year ended September 30, 2013, we compiled our historical data pertaining to the insurance experiences and actuarially developed the ultimate loss associated with our insurance programs other than pollution coverage, which was obtained in connection with the MISCOR acquisition. We believe that the actuarial valuation provides the best estimate of the ultimate losses to be expected under these programs.
The undiscounted ultimate losses of all insurance reserves at September 30, 2013 and 2012, was $5,306 and $6,864, respectively. Based on historical payment patterns, we expect payments of undiscounted ultimate losses to be made as follows:
| Year Ended September 30: | ||||
2014 | $ | 1,668 | ||
2015 | 991 | |||
2016 | 595 | |||
2017 | 379 | |||
2018 | 243 | |||
Thereafter | 1,430 | |||
|
| |||
Total | $ | 5,306 | ||
|
| |||
We elect to discount the ultimate losses above to present value using an approximate risk-free rate over the average life of our insurance claims. For the years ended September 30, 2013 and 2012, the discount rate used was 1.4 percent and 0.6 percent, respectively. The present value of all insurance reserves for the employee group health claims, workers' compensation, auto and general liability recorded at September 30, 2013 and 2012 was $4,963 and $5,228, respectively. Our employee group health claims are anticipated to be resolved within the year ended September 30, 2014.
We had letters of credit totaling $6,147 outstanding at September 30, 2013 to collateralize our high deductible insurance obligations.
Realization of Long-Lived Assets
We evaluate the recoverability of property and equipment and other long-lived assets as facts and circumstances indicate that any of those assets might be impaired. If an evaluation is required for our assets we plan to hold and use, the estimated future undiscounted cash flows associated with the asset are compared to the asset's carrying amount to determine if an impairment of such property has occurred. The effect of any impairment would be to expense the difference between the fair value of such property and its carrying value. Estimated fair values are determined based on expected future cash flows discounted at a rate we believe incorporates the time value of money, the expectations about future cash flows and an appropriate risk premium.
During the years ended September 30, 2013, 2012 and 2011, we evaluated certain of our long-lived assets. These evaluations resulted in impairment charges as described above under " Asset Impairment ".
Risk Concentration
Financial instruments, which potentially subject us to concentrations of credit risk, consist principally of cash deposits and accounts receivable. We grant credit, usually without collateral, to our customers, who are generally large public companies, contractors and homebuilders throughout the United States. Consequently, we are subject to potential credit risk related to changes in business and economic factors throughout the United States, specifically, within the construction, homebuilding and mission critical facility markets. However, we are entitled to payment for work performed and have certain lien rights in that work. Further, management believes that its contract acceptance, billing and collection policies are adequate to manage potential credit risk. We routinely maintain cash balances in financial institutions in excess of federally insured limits. We periodically assess the financial condition of these institutions where these funds are held and believe the credit risk is minimal. As a result of recent credit market turmoil we maintain the majority of our cash and cash equivalents in money market mutual funds.
No single customer accounted for more than 10% of our revenues for the years ended September 30, 2013, 2012 and 2011.
46
INTEGRATED ELECTRICAL SERVICES, INC.
Notes to Consolidated Financial Statements
(All Amounts in Thousands Except Share Amounts)
Fair Value of Financial Instruments
Our financial instruments consist of cash and cash equivalents, accounts receivable, notes receivable, investments, accounts payable, a loan agreement, and an interest rate swap agreement. We believe that the carrying value of financial instruments, with the exception of our cost method investment in EnerTech, in the accompanying Consolidated Balance Sheets, approximates their fair value due to their short-term nature.
We estimate the fair value of our investment in EnerTech (Level 3) using quoted market prices for underlying publicly traded securities, and estimated enterprise values determined using cash flow projections and market multiples of the underlying non-public companies. For additional information, please refer to Note 7, "Detail of Certain Balance Sheet Accounts – Securities and Equity Investments – Investment in EnerTech."
Stock-Based Compensation
We measure and record compensation expense for all share-based payment awards based on the fair value of the awards granted, net of estimated forfeitures, at the date of grant. We calculate the fair value of stock options using a binomial option pricing model. The fair value of restricted stock awards and phantom stock unit awards is determined based on the number of shares granted and the closing price of IES's common stock on the date of grant. Forfeitures are estimated at the time of grant and revised as deemed necessary. The resulting compensation expense from discretionary awards is recognized on a straight-line basis over the requisite service period, which is generally the vesting period. The cash flows resulting from the tax deductions in excess of the compensation expense recognized for options and restricted stock (excess tax benefit) are classified as financing cash flows.
Deferred Compensation Plans
The Company maintains a rabbi trust to fund certain deferred compensation plans. The securities held by the trust are classified as trading securities. The investments are recorded at fair value and are classified as other non-current assets in the accompanying Consolidated Balance Sheets as of September 30, 2013 and 2012. The changes in fair values are recorded as unrealized gains (losses) as a component of other income (expense) in the Consolidated Statements of Comprehensive Income.
The corresponding deferred compensation liability is included in other non-current liabilities on the Consolidated Balance Sheets and changes in this obligation are recognized as adjustments to compensation expense in the period in which they are determined.
New Accounting Pronouncements
In February 2013, the FASB issued accounting guidance related to the reporting of amounts reclassified out of accumulated other comprehensive income. This guidance sets forth new disclosure requirements for items reclassified from accumulated other comprehensive income by requiring disclosures for both the changes in accumulated other comprehensive income by component and where the significant items reclassified from accumulated other comprehensive income are classified in the Statements of Consolidated Comprehensive Income. This guidance became effective for us on October 1, 2013 and will require additional disclosure for changes in accumulated other comprehensive income.
In June 2011, the FASB issued amended authoritative guidance associated with comprehensive income, which requires companies to present the total of comprehensive income, the components of net income, and the components of other comprehensive income either in a single continuous statement of comprehensive income or in two separate but consecutive statements. This amendment to the authoritative guidance associated with comprehensive income was effective for the Company on October 1, 2012 and has been applied retrospectively. We have adopted a single continuous statement of comprehensive income.
3. CONTROLLING SHAREHOLDER
At September 30, 2013 Tontine Capital Partners, L.P. and its affiliates (collectively "Tontine") was the controlling shareholder of the Company's common stock. Accordingly, Tontine has the ability to exercise significant control over our affairs, including the election of directors and any action requiring the approval of shareholders.
47
INTEGRATED ELECTRICAL SERVICES, INC.
Notes to Consolidated Financial Statements
(All Amounts in Thousands Except Share Amounts)
While Tontine is subject to restrictions under federal securities laws on sales of its shares as an affiliate pursuant to a Registration Rights Agreement, Tontine delivered a request to the Company for registration of all of its shares of IES common stock, and on February 21, 2013, the Company filed the Shelf Registration Statement to register Tontine's shares. The Shelf Registration Statement was declared effective by the SEC on June 18, 2013. As long as the Shelf Registration remains effective, Tontine has the ability to resell any or all of its shares from time to time in one or more offerings, as described in the Shelf Registration Statement and in any prospectus supplement filed in connection with an offering pursuant to the Shelf Registration Statement.
Should Tontine sell or otherwise dispose of all or a portion of its position in IES, a change in ownership could occur. A change in ownership, as defined by Internal Revenue Code Section 382, could reduce the availability of net operating losses ("NOLs") for federal and state income tax purposes. On January 28, 2013, the Company implemented a tax benefit protection plan (the "NOL Rights Plan") that is designed to deter an acquisition of the Company's stock in excess of a threshold amount that could trigger a change of control within the meaning of Internal Revenue Code Section 382. For additional information on the NOL Rights Plan please see our Current Report on Form 8-K, filed with the SEC on January 28, 2013. There can be no assurance that the NOL Rights Plan will be effective in deterring a change of control or protecting the NOLs. Furthermore, a change in control would trigger the change of control provisions in a number of our material agreements, including our 2012 Credit Facility, bonding agreements with our sureties and certain employment contracts with certain officers and employees of the Company.
4. STRATEGIC ACTIONS
The 2011 Restructuring Plan
In the second quarter of our 2011 fiscal year, we began a restructuring program (the "2011 Restructuring Plan") that was designed to consolidate operations within our Commercial & Industrial business. Pursuant to the 2011 Restructuring Plan, we began the closure of certain underperforming facilities within our Commercial & Industrial operations. The 2011 Restructuring Plan was a key element of our commitment to return the Company to profitability.
The facilities directly affected by the 2011 Restructuring Plan were in several locations throughout the country, including Arizona, Florida, Iowa, Massachusetts, Louisiana, Nevada and Texas. These facilities were selected due to business prospects at that time and the extended time frame needed to return the facilities to a profitable position. Closure costs associated with the 2011 Restructuring Plan included equipment and facility lease termination expenses, incremental management consulting expenses and severance costs for employees. The Company has completed the wind down of these facilities with minimal completion remaining. As part of our restructuring charges reported within discontinued operations for our Commercial & Industrial segment we recognized $(4), $(62), and $1,455 in severance charges; $63, $1,099, and $1,530 in consulting services; and zero, $133, and $799 in costs related to lease terminations for the years ended September 30, 2013, 2012, and 2011, respectively. Charges related to the 2011 Restructuring Plan in year ended 2014 are expected to be immaterial.
The 2011 Restructuring Plan pertains only to our Commercial & Industrial segment. The following table summarizes the activities related to our restructuring activities by component:
| Severance Charges | Consulting Charges | Lease Termination & Other Charges | Total | |||||||||||||
Restructuring liability at September 30, 2012 | $ | 201 | $ | 10 | $ | 329 | $ | 540 | ||||||||
Restructuring charges (reversals) incurred | (4 | ) | 63 | - | 59 | |||||||||||
Cash payments made | (82 | ) | (73 | ) | (169 | ) | (324 | ) | ||||||||
|
|
|
|
|
|
|
| |||||||||
Restructuring liability at September 30, 2013 | $ | 115 | $ | - | $ | 160 | $ | 275 | ||||||||
|
|
|
|
|
|
|
| |||||||||
48
INTEGRATED ELECTRICAL SERVICES, INC.
Notes to Consolidated Financial Statements
(All Amounts in Thousands Except Share Amounts)
5. PROPERTY AND EQUIPMENT
Property and equipment consists of the following:
| Estimated Useful Lives in Years | ||||||||||||
| Years Ended September 30, | ||||||||||||
| 2013 | 2012 | |||||||||||
Land | N/A | $ | 689 | $ | 1,795 | |||||||
Buildings | 5-20 | 3,762 | 550 | |||||||||
Transportation equipment | 3-5 | 1,688 | 1,696 | |||||||||
Machinery and equipment | 3-10 | 7,251 | 4,732 | |||||||||
Leasehold improvements | 5-10 | 2,313 | 2,015 | |||||||||
Information systems | 2-8 | 15,408 | 15,289 | |||||||||
Furniture and fixtures | 5-7 | 776 | 887 | |||||||||
|
|
|
| |||||||||
| $ | 31,887 | $ | 26,964 | |||||||||
Less - Accumulated depreciation and amortization | (21,570 | ) | (20,484 | ) | ||||||||
Construction in Progress | 97 | - | ||||||||||
|
|
|
| |||||||||
Property and equipment, net | $ | 10,414 | $ | 6,480 | ||||||||
|
|
|
| |||||||||
Depreciation and amortization expense from continuing operations was $2,552, $2,075 and $6,216, respectively, for the years ended September 30, 2013, 2012 and 2011.
6. PER SHARE INFORMATION
Basic earnings per share is calculated as income (loss) available to common stockholders, divided by the weighted average number of common shares outstanding during the period. If the effect is dilutive, participating securities are included in the computation of basic earnings per share. Our participating securities do not have a contractual obligation to share in the losses in any given period. As a result, these participating securities will not be allocated any losses in the periods of net losses, but will be allocated income in the periods of net income using the two-class method.
The following table reconciles the components of the basic and diluted loss per share for the years ended September 30, 2013, 2012 and 2011:
| Years Ended September 30, | ||||||||||||
| 2013 | 2012 | 2011 | ||||||||||
Numerator: | ||||||||||||
Net loss from continuing operations attributable to common shareholders | $ | (2,178 | ) | $ | (2,655 | ) | $ | (19,561 | ) | |||
|
|
|
|
|
| |||||||
Net loss from discontinued operations attributable to common shareholders | $ | (1,395 | ) | $ | (9,147 | ) | $ | (18,262 | ) | |||
|
|
|
|
|
| |||||||
Net loss | $ | (3,573 | ) | $ | (11,802 | ) | $ | (37,823 | ) | |||
|
|
|
|
|
| |||||||
Denominator: | ||||||||||||
Weighted average common shares outstanding - basic | 14,952,054 | 14,625,776 | 14,493,747 | |||||||||
|
|
|
|
|
| |||||||
Basic loss per share | $ | (0.24 | ) | $ | (0.81 | ) | $ | (2.61 | ) | |||
Diluted loss per share | $ | (0.24 | ) | $ | (0.81 | ) | $ | (2.61 | ) | |||
49
INTEGRATED ELECTRICAL SERVICES, INC.
Notes to Consolidated Financial Statements
(All Amounts in Thousands Except Share Amounts)
7. DETAIL OF CERTAIN BALANCE SHEET ACCOUNTS
Activity in our allowance for doubtful accounts on accounts and long-term receivables consists of the following:
| Years Ended September 30, | ||||||||
| 2013 | 2012 | |||||||
Balance at beginning of period | $ | 1,788 | $ | 2,704 | ||||
Additions to costs and expenses | 133 | 771 | ||||||
Deductions for uncollectible receivables written off, net of recoveries | (941 | ) | (1,687 | ) | ||||
|
|
|
| |||||
Balance at end of period | $ | 980 | $ | 1,788 | ||||
|
|
|
| |||||
Accounts payable and accrued expenses consist of the following:
| Years Ended September 30, | ||||||||
| 2013 | 2012 | |||||||
Accounts payable, trade | $ | 40,659 | $ | 39,879 | ||||
Accrued compensation and benefits | 18,057 | 13,312 | ||||||
Accrued insurance liabilities | 4,963 | 5,229 | ||||||
Other accrued expenses | 10,641 | 10,253 | ||||||
|
|
|
| |||||
| $ | 74,320 | $ | 68,673 | |||||
|
|
|
| |||||
Contracts in progress are as follows:
| Years Ended September 30, | ||||||||
| 2013 | 2012 | |||||||
Costs incurred on contracts in progress | $ | 362,822 | $ | 402,738 | ||||
Estimated earnings | 42,464 | 33,931 | ||||||
|
|
|
| |||||
| 405,286 | 436,669 | |||||||
Less - Billings to date | (417,626 | ) | (453,744 | ) | ||||
|
|
|
| |||||
Net contracts in progress | $ | (12,340 | ) | $ | (17,075 | ) | ||
|
|
|
| |||||
Costs and estimated earnings in excess of billings on uncompleted contracts | 8,336 | 8,180 | ||||||
Less - Billings in excess of costs and estimated earnings on uncompleted contracts | (20,676 | ) | (25,255 | ) | ||||
|
|
|
| |||||
Net contracts in progress | $ | (12,340 | ) | $ | (17,075 | ) | ||
|
|
|
| |||||
Other non-current assets are comprised of the following:
| Years Ended September 30, | ||||||||
| 2013 | 2012 | |||||||
Deposits | $ | 999 | $ | 2,137 | ||||
Deferred tax assets | 1,631 | 1,065 | ||||||
Executive Savings Plan assets | 591 | 533 | ||||||
Securities and equity investments | 919 | 919 | ||||||
Other | 2,576 | 1,489 | ||||||
|
|
|
| |||||
Total | $ | 6,716 | $ | 6,143 | ||||
|
|
|
| |||||
Securities and Equity Investments
Investment in EnerTech
In April 2000, we committed to invest up to $5,000 in EnerTech. We fulfilled our commitment in fiscal year 2008. As our investment was 2.21% of the overall ownership in EnerTech at September 30, 2013 and 2012, we account for this investment using the cost method of accounting. EnerTech's investment portfolio from time to time results in unrealized losses reflecting a possible, other-than-temporary, impairment of our investment. The carrying value of our investment in EnerTech at September 30, 2013 and 2012 was $919. Our results of operations for the year ended September 30, 2011, includes a write down of $967 attributable to our investment in EnerTech.
50
INTEGRATED ELECTRICAL SERVICES, INC.
Notes to Consolidated Financial Statements
(All Amounts in Thousands Except Share Amounts)
The following table presents the reconciliation of the carrying value and unrealized gains (losses) to the fair value of the investment in EnerTech as of September 30, 2013 and 2012:
| Years Ended September 30, | ||||||||
| 2013 | 2012 | |||||||
Carrying value | $ | 919 | $ | 919 | ||||
Unrealized gains | 138 | 69 | ||||||
|
|
|
| |||||
Fair value | $ | 1,057 | $ | 988 | ||||
|
|
|
| |||||
At each reporting date, the Company performs an evaluation of impairment for securities to determine if any unrealized losses are other-than-temporary. For equity securities, this evaluation considers a number of factors including, but not limited to, the length of time and extent to which the fair value has been less than cost, the financial condition and near term prospects of the issuer and management's ability and intent to hold the securities until fair value recovers. The assessment of the ability and intent to hold these securities to recovery focuses on liquidity needs, asset and liability management objectives and securities portfolio objectives. Based on the results of this evaluation, we believe the unrealized gain at September 30, 2013 indicated our investment was not impaired.
In June 2012, we received a distribution from EnerTech of $84, which was applied as a reduction in the carrying value of the investment.
On December 31, 2012, EnerTech's general partner, with the consent of the fund's investors, extended the fund through December 31, 2013. The fund will terminate on this date unless extended by the fund's valuation committee. The fund may be extended for another one-year period through December 31, 2014 with the consent of the fund's valuation committee.
8. DEBT
Debt consists of the following:
| September 30, | September 30, | |||||||
| 2013 | 2012 | |||||||
Wells Fargo Term Loan, paid in installments thru Aug 9, 2016 | $ | 13,708 | $ | - | ||||
Tontine Term Loan | - | 10,000 | ||||||
Insurance Financing Agreements | - | 196 | ||||||
Capital leases and other | 64 | 284 | ||||||
|
|
|
| |||||
Total debt | 13,772 | 10,480 | ||||||
Less - Short-term debt and current maturities of long-term debt | (3,562 | ) | (10,456 | ) | ||||
|
|
|
| |||||
Total long-term debt | $ | 10,210 | $ | 24 | ||||
|
|
|
| |||||
Future payments on debt in future fiscal years at September 30, 2013 are as follows:
| Capital Leases and Other | Term Debt | Total | ||||||||||
2014 | $ | 62 | $ | 3,500 | $ | 3,562 | ||||||
2015 | 4 | 3,500 | 3,504 | |||||||||
2016 | - | 6,708 | 6,708 | |||||||||
2017 | - | - | - | |||||||||
2018 | - | - | - | |||||||||
Thereafter | - | - | - | |||||||||
Less: Imputed Interest | (2 | ) | - | (2 | ) | |||||||
|
|
|
|
|
| |||||||
Total | $ | 64 | $ | 13,708 | $ | 13,772 | ||||||
|
|
|
|
|
| |||||||
51
INTEGRATED ELECTRICAL SERVICES, INC.
Notes to Consolidated Financial Statements
(All Amounts in Thousands Except Share Amounts)
For the years ended September 30, 2013, 2012 and 2011, we incurred interest expense of $1,771, $2,324 and $2,278, respectively.
The 2012 Revolving Credit Facility
On August 9, 2012, we entered into a Credit and Security Agreement (the "Credit Agreement"), for a $30,000 revolving credit facility (the "2012 Credit Facility") with Wells Fargo Bank, National Association with a maturity date of August 9, 2015, unless earlier terminated. We have entered into two amendments to the 2012 Credit Facility. On February 12, 2013, we entered into an amendment of our 2012 Credit Facility with Wells Fargo (the "Amendment"), to extend the term to August 9, 2016, add IES Renewable Energy, LLC as a borrower, and provide for a term loan (the "Wells Fargo Term Loan"). On September 13, 2013, we entered into an amendment of our 2012 Credit Facility with Wells Fargo (the "Second Amendment"), which amended the Wells Fargo Term Loan, removed the requirement to cash collateralize our outstanding letters of credit, and added IES Subsidiary Holdings Inc., Magnetech Industrial Services, Inc., and HK Engine Components, LLC, as borrowers.
The 2012 Credit Facility is guaranteed by our subsidiaries and secured by first priority liens on substantially all of our subsidiaries' existing and future acquired assets, exclusive of collateral provided to our surety providers. The 2012 Credit Facility also restricts us from paying cash dividends and places limitations on our ability to repurchase our common stock.
The 2012 Credit Facility contains customary affirmative, negative and financial covenants. The 2012 Credit Facility requires that we maintain a fixed charge coverage ratio of not less than 1.0:1.0 at any time that our Liquidity (defined as the aggregate amount of unrestricted cash and cash equivalents on hand plus Excess Availability (as defined in the Credit Facility)) or Excess Availability fall below stipulated levels. The Second Amendment provided for tiered thresholds. Through December 31, 2013, our Liquidity must not fall below $15,000. Thereafter, our Liquidity must not fall below $20,000. Our Excess Availability must not fall below $4,000 through September 30, 2013. This minimum threshold increases by $250 monthly through December 31, 2013, at which time and thereafter, our Excess Availability must not fall below $5,000. As of September 30, 2013, our Liquidity was in excess of $15,000 and Excess Availability was in excess of $4,000; had we not met these thresholds at September 30, 2013, we would not have met the required 1.0:1.0 fixed charge coverage ratio test.
Borrowings under the 2012 Credit Facility may not exceed a "borrowing base" that is determined monthly by our lenders based on available collateral, primarily certain accounts receivables, inventories and personal property and equipment. Under the terms of the 2012 Credit Facility, amounts outstanding bear interest at a per annum rate equal to a Daily Three Month LIBOR (as defined in the Credit Agreement), plus an interest rate margin, which is determined quarterly, based on the following thresholds:
Level | Thresholds | Interest Rate Margin | ||
| I | Liquidity £ $20,000 at any time during the period; or Excess Availability £ $7,500 at any time during the period; or Fixed charge coverage ratio < 1.0:1.0 | 4.00 percentage points | ||
| II | Liquidity > $20,000 at all times during the period; and Liquidity £ $30,000 at any time during the period; and Excess Availability $7,500; and Fixed charge coverage ratio ³ 1.0:1.0 | 3.50 percentage points | ||
| III | Liquidity > $30,000 at all times during the period; and Excess Availability > $7,500; and Fixed charge coverage ratio ³ 1.0:1.0 | 3.00 percentage points | ||
52
INTEGRATED ELECTRICAL SERVICES, INC.
Notes to Consolidated Financial Statements
(All Amounts in Thousands Except Share Amounts)
In addition, we are charged monthly in arrears for (1) an unused commitment fee of 0.50% per annum, (2) a collateral monitoring fee ranging from $1 to $2, based on the then-applicable interest rate margin, (3) a letter of credit fee based on the then-applicable interest rate margin and (4) certain other fees and charges as specified in the Credit Agreement.
At September 30, 2013, we had $8,445 available to us under the 2012 Credit Facility, $6,460 in outstanding letters of credit with Wells Fargo and no outstanding borrowings. Prior to the Second Amendment, we were required to cash collateralize our letters of credit balance. As such, we had $7,155 classified as restricted cash within the Balance Sheet as of September 30, 2012. The Second Amendment removed the requirement to cash collateralize our letter of credit balance. As such, we have no restricted cash as of September 30, 2013.
The $5,000 Wells Fargo Term Loan was provided for within the First Amendment to the 2012 Credit Facility. We were scheduled to pay monthly installments of $208 through February 2015 at an annual interest rate of 6% plus 3 Month LIBOR. The Second Amendment to the 2012 Credit Facility increased our total Term Loan by $10,147 to $13,708 at September 30, 2013. The Wells Fargo Term Loan is payable in equal monthly installments of $292 through August 9, 2016, with the residual unpaid principal balance due on that date. The Second Amendment also extended the term and reduced the annual interest rate to 5% plus 3 Month LIBOR, through September 13, 2014. Following that time, the Wells Fargo Term Loan amounts outstanding bear interest at a per annum rate equal to a Daily Three Month LIBOR plus an interest rate margin, which is determined quarterly, based on the following thresholds:
Level | Thresholds | Interest Rate Margin | ||
| I | Liquidity £ $20,000 at any time during the period; or Excess Availability £ $7,500 at any time during the period; or Fixed charge coverage ratio < 1.0:1.0 | 5.00 percentage points | ||
| II | Liquidity > $20,000 at all times during the period; and Liquidity £ $30,000 at any time during the period; and Excess Availability $7,500; and Fixed charge coverage ratio ³ 1.0:1.0 | 4.50 percentage points | ||
| III | Liquidity > $30,000 at all times during the period; and Excess Availability > $7,500; and Fixed charge coverage ratio ³ 1.0:1.0 | 4.00 percentage points | ||
The 2006 Revolving Credit Facility
On May 12, 2006, we entered into a Loan and Security Agreement (the "Loan and Security Agreement"), for a revolving credit facility (the "2006 Credit Facility") with Bank of America, N.A. and certain other lenders. On August 9, 2012, the 2006 Credit Facility was replaced by the 2012 Credit Facility. The 2006 Credit Facility and its amendments are filed as Exhibits to this Form 10-K and any descriptions thereof are qualified in their entirety by the terms of the 2006 Credit Facility or its respective amendments. On May 7, 2008, we renegotiated the terms of our 2006 Credit Facility and entered into an amended agreement with the same financial institutions. On April 30, 2010, we renegotiated the terms of, and entered into an amendment to the Loan and Security Agreement pursuant to which the maturity date was extended to May 31, 2012. In connection with the amendment, we incurred an amendment fee of $200, which was amortized over 24 months.
On December 15, 2011, we renegotiated the terms of, and entered into an amendment to, the Loan and Security Agreement without incurring termination charges. Under the terms of the amended 2006 Credit Facility, the size of the facility was reduced to $40,000 and the maturity date was extended to November 12, 2012. Under the terms of the amended 2006 Credit Facility, we were required to cash collateralize all of our letters of credit issued by the banks. The cash collateral was added to the borrowing base calculation at 100% throughout the term of the agreement. The 2006 Credit Facility required that we maintain a fixed charge coverage ratio of not less than 1.0:1.0 at any time that our aggregate amount of unrestricted cash on hand plus availability was less than $25,000 and,
53
INTEGRATED ELECTRICAL SERVICES, INC.
Notes to Consolidated Financial Statements
(All Amounts in Thousands Except Share Amounts)
thereafter, until such time as our aggregate amount of unrestricted cash on hand plus availability had been at least $25,000 for a period of 60 consecutive days. The amended Agreement also called for cost of borrowings of 4.0% over LIBOR per annum. Cost for letters of credit was the same as borrowings and also included a 25 basis point "fronting fee." All other terms and conditions remained unchanged. In connection with the amendment, we incurred an amendment fee of $60 which, together with unamortized balance of the prior amendment was amortized using the straight line method through August 30, 2012. On August 9, 2012, the amended 2006 Credit Facility was replaced by the 2012 Credit Facility.
The 2006 Credit Facility was guaranteed by our subsidiaries and secured by first priority liens on substantially all of our subsidiaries' existing and future acquired assets, exclusive of collateral provided to our surety providers. The 2006 Credit Facility contained customary affirmative, negative and financial covenants. The 2006 Credit Facility also restricted us from paying cash dividends and placed limitations on our ability to repurchase our common stock.
Borrowings under the 2006 Credit Facility could not exceed a "borrowing base" that was determined monthly by our lenders based on available collateral, primarily certain accounts receivables and inventories. Under the terms of the 2006 Credit Facility in effect as of August 30, 2012, interest for loans and letter of credit fees was based on our Total Liquidity, which is calculated for any given period as the sum of average daily availability for such period plus average daily unrestricted cash on hand for such period as follows:
| Annual Interest Rate for | ||||
Total Liquidity | Annual Interest Rate for Loans | Letters of Credit | ||
Greater than or equal to $60,000 | LIBOR plus 3.00% or Base Rate plus 1.00% | 3.00% plus 0.25% fronting fee | ||
Greater than $40,000 and less than $60,000 | LIBOR plus 3.25% or Base Rate plus 1.25% | 3.25% plus 0.25% fronting fee | ||
Less than or equal to $40,000 | LIBOR plus 3.50% or Base Rate plus 1.50% | 3.50% plus 0.25% fronting fee |
For the year ended September 30, 2012, we paid no interest for loans under the 2006 Credit Facility and had a weighted average interest rate, including fronting fees, of 3.49% for letters of credit. In addition, we were charged monthly in arrears (1) an unused commitment fee of 0.50%, and (2) certain other fees and charges as specified in the Loan and Security Agreement, as amended.
As of August 9, 2012, we were subject to the financial covenant under the 2006 Credit Facility requiring that we maintain a fixed charge coverage ratio of not less than 1.0:1.0 at any time that our aggregate amount of unrestricted cash on hand plus availability is less than $25,000 and, thereafter, until such time as our aggregate amount of unrestricted cash on hand plus availability has been at least $25,000 for a period of 60 consecutive days. As of August 9, 2012, our Total Liquidity was in excess of $25,000.
The Tontine Term Loan
On December 12, 2007, we entered into the Tontine Term Loan, a $25,000 senior subordinated loan agreement, with Tontine, which the Company terminated and prepaid in full subsequent to the first quarter of fiscal 2013, as further described below.
The Tontine Term Loan bore interest at 11.0% per annum and was due on May 15, 2013. Interest was payable quarterly in cash or in-kind at our option. Any interest paid in-kind would bear interest at 11.0% in addition to the loan principal. The Tontine Term Loan was subordinated to the 2012 Credit Facility. The Tontine Term Loan was an unsecured obligation of the Company and its subsidiary borrowers and contained no financial covenants or restrictions on dividends or distributions to stockholders. The Tontine Term Loan was amended on August 9, 2012 in connection with the Company entering into the 2012 Credit Facility. The amendment did not materially impact the Company's obligations under the Tontine Term Loan.
On April 30, 2010, we prepaid $15,000 of principal on the Tontine Term Loan. On May 1, 2010, Tontine assigned the Tontine Term Loan to Tontine Capital Overseas Master Fund II, L.P, also a related party. Pursuant to its terms, we were permitted to repay the Tontine Term Loan at any time prior to the maturity date at par, plus accrued interest without penalty within the restrictions of the 2012 Credit Facility. On February 13, 2013, we repaid the remaining $10,000 of principal on the Tontine Term Loan, plus accrued interest, with existing cash on hand and proceeds from the Wells Fargo Term Loan.
54
INTEGRATED ELECTRICAL SERVICES, INC.
Notes to Consolidated Financial Statements
(All Amounts in Thousands Except Share Amounts)
Capital Lease
The Company leases certain equipment under agreements, which are classified as capital leases and included in property, plant and equipment. Amortization of this equipment for the years ended September 30, 2013, 2012 and 2011 was $182, $182 and $172, respectively, which is included in depreciation expense in the accompanying statements of comprehensive income.
9. LEASES
We enter into operating leases for many of our facilities, vehicle and equipment needs. These leases allow us to retain cash, and we pay a monthly lease rental fee. At the end of the lease, we have no further obligation to the lessor. We may cancel or terminate a lease before the end of its term. Typically, we would be liable to the lessor for various lease cancellation or termination costs and the difference between the fair market value of the leased asset and the implied book value of the leased asset as calculated in accordance with the lease agreement.
For a discussion of leases with certain related parties which are included below, see Note 13, "Related-Party Transactions."
Rent expense was $3,764, $3,461 and $4,056 for the years ended September 30, 2013, 2012 and 2011, respectively, and included within the selling, general and administrative expenses in the Consolidated Statements of Comprehensive Income.
Future minimum lease payments under these non-cancelable operating leases with terms in excess of one year are as follows:
Year Ended September 30: | ||||
2014 | $ | 4,829 | ||
2015 | 3,567 | |||
2016 | 2,609 | |||
2017 | 1,729 | |||
2018 | 389 | |||
Thereafter | 278 | |||
|
| |||
Total | $ | 13,401 | ||
|
|
55
INTEGRATED ELECTRICAL SERVICES, INC.
Notes to Consolidated Financial Statements
(All Amounts in Thousands Except Share Amounts)
10. INCOME TAXES
Federal and state income tax provisions for continuing operations are as follows:
| Years Ended September 30, | ||||||||||||
| 2013 | 2012 | 2011 | ||||||||||
Federal: | ||||||||||||
Current | $ | - | $ | - | $ | - | ||||||
Deferred | - | - | - | |||||||||
State: | ||||||||||||
Current | 363 | 253 | 250 | |||||||||
Deferred | (37 | ) | (215 | ) | (78 | ) | ||||||
|
|
|
|
|
| |||||||
| $ | 326 | $ | 38 | $ | 172 | |||||||
|
|
|
|
|
| |||||||
Actual income tax expense differs from income tax expense computed by applying the U.S. federal statutory corporate rate of 35 percent to income before provision for income taxes as follows:
| Years Ended September 30, | ||||||||||||
| 2013 | 2012 | 2011 | ||||||||||
Provision (benefit) at the statutory rate | $ | (648 | ) | $ | (918 | ) | $ | (6,786 | ) | |||
Increase resulting from: | ||||||||||||
Non-deductible expenses | 1,269 | 490 | 548 | |||||||||
State income taxes, net of federal deduction | 377 | 106 | - | |||||||||
Change in valuation allowance | - | 581 | 7,066 | |||||||||
Other | 29 | - | 16 | |||||||||
Decrease resulting from: | ||||||||||||
Change in valuation allowance | (651 | ) | - | - | ||||||||
State income taxes, net of federal deduction | - | - | (600 | ) | ||||||||
Contingent tax liabilities | (50 | ) | (206 | ) | (72 | ) | ||||||
Other | - | (15 | ) | - | ||||||||
|
|
|
|
|
| |||||||
| $ | 326 | $ | 38 | $ | 172 | |||||||
|
|
|
|
|
| |||||||
Deferred income tax provisions result from temporary differences in the recognition of income and expenses for financial reporting purposes and for income tax purposes. The income tax effects of these temporary differences, representing deferred income tax assets and liabilities, result principally from the following:
| Years Ended September 30, | ||||||||
| 2013 | 2012 | |||||||
Deferred income tax assets: | ||||||||
Allowance for doubtful accounts | $ | 370 | $ | 675 | ||||
Accrued expenses | 7,023 | 6,254 | ||||||
Net operating loss carryforward | 110,259 | 106,004 | ||||||
Various reserves | 1,022 | 1,085 | ||||||
Equity losses in affiliate | 235 | 292 | ||||||
Share-based compensation | 2,732 | 2,757 | ||||||
Capital loss carryforward | 4,100 | 3,909 | ||||||
Property | - | 397 | ||||||
Other | 2,334 | 1,651 | ||||||
|
|
|
| |||||
Subtotal | 128,075 | 123,024 | ||||||
Less valuation allowance | (126,500 | ) | (121,962 | ) | ||||
|
|
|
| |||||
Total deferred income tax assets | $ | 1,575 | $ | 1,062 | ||||
|
|
|
| |||||
Deferred income tax liabilities: | ||||||||
Property and equipment | $ | (570 | ) | $ | - | |||
Deferred contract revenue and other | (123 | ) | (196 | ) | ||||
|
|
|
| |||||
Total deferred income tax liabilities | (693 | ) | (196 | ) | ||||
|
|
|
| |||||
Net deferred income tax assets | $ | 882 | $ | 866 | ||||
|
|
|
| |||||
56
INTEGRATED ELECTRICAL SERVICES, INC.
Notes to Consolidated Financial Statements
(All Amounts in Thousands Except Share Amounts)
In 2002, we adopted a tax accounting method change that allowed us to deduct goodwill for income tax purposes that had previously been classified as non-deductible. The accounting method change resulted in additional amortizable tax basis in goodwill. We believe the realization of the additional tax basis in goodwill is less than probable and have not recorded a deferred tax asset. Although a deferred tax asset has not been recorded through September 30, 2013, we have derived a cumulative cash tax reduction of $11,448 from the change in tax accounting method and the subsequent amortization of the additional tax goodwill. In addition, the amortization of the additional tax goodwill has resulted in additional federal net operating loss carry forwards of $140,835 and state net operating loss carry forwards of $14,564. We believe the realization of the additional net operating loss carry forwards is not more likely than not and have not recorded a deferred tax asset. We have $993 of tax basis in the additional tax goodwill that remains to be amortized. As of September 30, 2013, approximately two years remain to be amortized.
As of September 30, 2013, we had available approximately $465,577 of federal net tax operating loss carry forward for federal income tax purposes, including $140,835 resulting from the additional amortization of tax goodwill. This carry forward, which may provide future tax benefits, will begin to expire in 2022. On May 12, 2006, we had a change in ownership as defined in Internal Revenue Code Section 382. As such, our utilization after the change date of our net operating loss in existence as of the change of control date was subject to Section 382 limitations for federal income taxes and some state income taxes. The annual limitation under Section 382 on the utilization of federal net operating losses was approximately $20,000 for the first five tax years subsequent to the change in ownership and $16,000 thereafter. Approximately $284,616 of federal net operating losses will not be subject to this limitation. Also, after applying the Section 382 limitation to available state net operating loss carry forwards, we had available approximately $145,527 state net tax operating loss carry forwards, including $14,564 resulting from the additional amortization of tax goodwill which begins to expire as of September 30, 2014. We have provided valuation allowances on all net operating losses where it is determined it is more likely than not that they will expire without being utilized.
In assessing the realizability of deferred tax assets at September 30, 2013, we considered whether it was more likely than not that some portion or all of the deferred tax assets will not be realized. Our realization of deferred tax assets is dependent upon the generation of future taxable income during the periods in which these temporary differences become deductible. However, GAAP guidelines place considerably more weight on historical results and less weight on future projections when there is negative evidence such as cumulative pretax losses in recent years. We incurred a cumulative pretax loss for the years ended September 30, 2013, 2012 and 2011. In the absence of specific favorable evidence of sufficient weight to offset the negative evidence of the cumulative pretax loss, we have provided valuation allowances of $121,095 for all federal deferred tax assets and $5,405 for certain state deferred tax assets. We believe that $1,075 of federal deferred tax assets will be realized by offsetting reversing deferred tax liabilities. We believe that $882 of state deferred tax assets will be realized and valuation allowances were not provided for these assets. We will evaluate the appropriateness of our remaining deferred tax assets and valuation allowances on at least annually at the end of each fiscal year.
As a result of the reorganization and related adjustment to the book basis in goodwill, we have tax basis in excess of book basis in amortizable goodwill of approximately $23,902. The tax basis in amortizable goodwill in excess of book basis is not reflected as a deferred tax asset. To the extent the amortization of the excess tax basis results in a cash tax benefit, the benefit will first go to reduce goodwill, then other long-term intangible assets, and then additional paid-in capital. As of September 30, 2013, we have received $72 in cash tax benefits related to the amortization of excess tax basis.
GAAP requires financial statement reporting of the expected future tax consequences of uncertain tax return reporting positions on the presumption that all relevant tax authorities possess full knowledge of those tax reporting positions, as well as all of the pertinent facts and circumstances, but it prohibits discounting of any of the related tax effects for the time value of money. The evaluation of a tax position is a two-step process. The first step is the recognition process to determine if it is more likely than not that a tax position will be sustained upon examination by the appropriate taxing authority, based on the technical merits of the position. The second step is a measurement process whereby a tax position that meets the more likely than not recognition threshold is calculated to determine the amount of benefit/expense to recognize in the financial statements. The tax position is measured at the largest amount of benefit/expense that is more likely than not of being realized upon ultimate settlement.
57
INTEGRATED ELECTRICAL SERVICES, INC.
Notes to Consolidated Financial Statements
(All Amounts in Thousands Except Share Amounts)
A reconciliation of the beginning and ending balances of unrecognized tax liabilities is as follows:
Balance at October 1, 2012 | $ | 5,343 | ||
Additions for position related to current year | 13 | |||
Additions for positions of prior years | 8 | |||
Reduction resulting from the lapse of the applicable statutes of limitations | (63 | ) | ||
Reduction resulting from settlement of positions of prior years | - | |||
|
| |||
Balance at September 30, 2013 | $ | 5,301 | ||
|
|
As of September 30, 2013, $5,301 of unrecognized tax benefits would result in a decrease in the provision for income tax expense. We anticipate that approximately $3 of unrecognized tax benefits, including accrued interest, may reverse in the next twelve months. The reversal is predominately due to the expiration of the statutes of limitation for unrecognized tax benefits.
We had approximately $6 and $15 accrued for the payment of interest and penalties at September 30, 2013 and 2012, respectively. We recognize interest and penalties related to unrecognized tax benefits as part of the provision for income taxes.
We are currently not under federal audit by the Internal Revenue Service. The tax years ended September 30, 2010 and forward are subject to audit as are tax years prior to September 30, 2010, to the extent of unutilized net operating losses generated in those years.
The net deferred income tax assets and liabilities are comprised of the following:
| Years Ended September 30, | ||||||||
| 2013 | 2012 | |||||||
Current deferred income taxes: | ||||||||
Assets | $ | 442 | $ | 283 | ||||
Liabilities | (286 | ) | (197 | ) | ||||
|
|
|
| |||||
Net deferred tax asset, current | $ | 156 | $ | 86 | ||||
|
|
|
| |||||
Noncurrent deferred income taxes: | ||||||||
Assets | $ | 1,631 | $ | 1,065 | ||||
Liabilities | (905 | ) | (285 | ) | ||||
|
|
|
| |||||
Net deferred tax asset, non-current | 726 | 780 | ||||||
|
|
|
| |||||
Net deferred income tax assets | $ | 882 | $ | 866 | ||||
|
|
|
| |||||
11. OPERATING SEGMENTS
We manage and measure performance of our business in four distinct operating segments: Communications, Residential, Commercial & Industrial, and Infrastructure Solutions. These segments are reflective of how the Company's Chief Operating Decision Maker ("CODM") reviews operating results for the purposes of allocating resources and assessing performance. The Company's CODM is its Chief Executive Officer. The Communications segment consists of low voltage installation, design, planning and maintenance for mission critical infrastructure such as data centers. The Residential segment consists of electrical installation, replacement and renovation services in single-family, condominium, townhouse and low-rise multifamily housing units. The Commercial & Industrial segment provides electrical design, installation, renovation, engineering and maintenance and replacement services in facilities such as office buildings, high-rise apartments and condominiums, theaters, restaurants, hotels, hospitals and critical-care facilities, school districts, light manufacturing and processing facilities, military installations, airports, outside plants, network enterprises, switch network customers, manufacturing and distribution centers, water treatment facilities, refineries, petrochemical and power plants, and alternative energy facilities. The Infrastructure Solutions segment is comprised of the operations of the recently acquired MISCOR business, and engages in the repair of electrical-mechanical industrial equipment, and provides services to traditional industrial, rail and utility clients.
The accounting policies of the segments are the same as those described in the summary of significant accounting policies. We evaluate performance based on income from operations of the respective business units prior to the allocation of Corporate office expenses. Transactions between segments are eliminated in consolidation. Our Corporate office provides general and administrative as well as support services to our four operating segments. Management allocates costs between segments for selling, general and administrative expenses and depreciation expense.
58
INTEGRATED ELECTRICAL SERVICES, INC.
Notes to Consolidated Financial Statements
(All Amounts in Thousands Except Share Amounts)
Segment information for the years ended September 30, 2013, 2012 and 2011 is as follows:
| Years Ended September 30, 2013 | ||||||||||||||||||||||||
| Communications | Residential | Commercial
& Industrial | Infrastructure Solutions | Corporate | Total | |||||||||||||||||||
Revenues | $ | 126,348 | $ | 162,611 | $ | 203,481 | $ | 2,153 | $ | - | $ | 494,593 | ||||||||||||
Cost of services | 102,564 | 135,384 | 187,957 | 1,728 | - | 427,633 | ||||||||||||||||||
|
|
|
|
|
|
|
|
|
|
|
| |||||||||||||
Gross profit | 23,784 | 27,227 | 15,524 | 425 | - | 66,960 | ||||||||||||||||||
Selling, general and administrative | 13,610 | 25,447 | 14,362 | 337 | 12,842 | 66,598 | ||||||||||||||||||
Gain on sale of assets | - | (17 | ) | (46 | ) | - | (1 | ) | (64 | ) | ||||||||||||||
|
|
|
|
|
|
|
|
|
|
|
| |||||||||||||
Income (loss) from operations | $ | 10,174 | $ | 1,797 | $ | 1,208 | $ | 88 | $ | (12,841 | ) | $ | 426 | |||||||||||
|
|
|
|
|
|
|
|
|
|
|
| |||||||||||||
Other data: | ||||||||||||||||||||||||
Depreciation and amortization expense | $ | 372 | $ | 807 | $ | 247 | $ | 38 | $ | 1,088 | $ | 2,552 | ||||||||||||
Capital expenditures | 269 | 209 | 270 | 5 | - | 753 | ||||||||||||||||||
Total assets | $ | 24,858 | $ | 36,838 | $ | 55,342 | $ | 27,889 | $ | 34,325 | $ | 179,252 | ||||||||||||
| Years Ended September 30, 2012 | ||||||||||||||||||||||||
| Communications | Residential | Commercial
& Industrial | Infrastructure Solutions | Corporate | Total | |||||||||||||||||||
Revenues | $ | 121,492 | $ | 129,974 | $ | 204,649 | $ | - | $ | - | $ | 456,115 | ||||||||||||
Cost of services | 103,288 | 109,274 | 185,501 | - | - | 398,063 | ||||||||||||||||||
|
|
|
|
|
|
|
|
|
|
|
| |||||||||||||
Gross profit | 18,204 | 20,700 | 19,148 | - | - | 58,052 | ||||||||||||||||||
Selling, general and administrative | 13,431 | 19,703 | 17,166 | - | 8,309 | 58,609 | ||||||||||||||||||
Loss (gain) on sale of assets | (60 | ) | 24 | (132 | ) | - | - | (168 | ) | |||||||||||||||
|
|
|
|
|
|
|
|
|
|
|
| |||||||||||||
Income (loss) from operations | $ | 4,833 | $ | 973 | $ | 2,114 | $ | - | $ | (8,309 | ) | $ | (389 | ) | ||||||||||
|
|
|
|
|
|
|
|
|
|
|
| |||||||||||||
Other data: | ||||||||||||||||||||||||
Depreciation and amortization expense | $ | 260 | $ | 375 | $ | 244 | $ | - | $ | 1,196 | $ | 2,075 | ||||||||||||
Capital expenditures | 569 | 666 | 341 | - | 301 | 1,877 | ||||||||||||||||||
Total assets | $ | 29,603 | $ | 33,927 | $ | 65,929 | $ | - | $ | 35,254 | $ | 164,713 | ||||||||||||
59
INTEGRATED ELECTRICAL SERVICES, INC.
Notes to Consolidated Financial Statements
(All Amounts in Thousands Except Share Amounts)
| Years Ended September 30, 2011 | ||||||||||||||||||||||||
| Communications | Residential | Commercial & Industrial | Infrastructure Solutions | Corporate | Total | |||||||||||||||||||
Revenues | $ | 83,615 | $ | 114,732 | $ | 207,794 | $ | - | $ | - | $ | 406,141 | ||||||||||||
Cost of services | 71,142 | 96,042 | 194,573 | - | - | 361,757 | ||||||||||||||||||
|
|
|
|
|
|
|
|
|
|
|
| |||||||||||||
Gross profit | 12,473 | 18,690 | 13,221 | - | - | 44,384 | ||||||||||||||||||
Selling, general and administrative | 9,578 | 18,441 | 21,788 | - | 13,514 | 63,321 | ||||||||||||||||||
Loss (gain) on sale of assets | - | 116 | (33 | ) | - | (6,638 | ) | (6,555 | ) | |||||||||||||||
Asset Impairment | 72 | - | 71 | - | 4,661 | 4,804 | ||||||||||||||||||
|
|
|
|
|
|
|
|
|
|
|
| |||||||||||||
Income (loss) from operations | $ | 2,823 | $ | 133 | $ | (8,605 | ) | $ | - | $ | (11,537 | ) | $ | (17,186 | ) | |||||||||
|
|
|
|
|
|
|
|
|
|
|
| |||||||||||||
Other data: | ||||||||||||||||||||||||
Depreciation and amortization expense | $ | 278 | $ | 514 | $ | 1,575 | $ | - | $ | 3,849 | $ | 6,216 | ||||||||||||
Capital expenditures | 928 | 181 | 431 | - | 1,148 | 2,688 | ||||||||||||||||||
Total assets | $ | 23,073 | $ | 23,584 | $ | 79,506 | $ | - | $ | 54,081 | $ | 180,244 | ||||||||||||
12. STOCKHOLDERS' EQUITY
The 2006 Equity Incentive Plan became effective on May 12, 2006 (as amended, the "2006 Equity Incentive Plan"). The 2006 Equity Incentive Plan provides for grants of stock options as well as grants of stock, including restricted stock. We have approximately 1.0 million shares of common stock authorized for issuance under the 2006 Equity Incentive Plan.
Treasury Stock
During the year ended September 30, 2013, we repurchased 95,469 common shares from our employees to satisfy minimum tax withholding requirements upon the vesting of restricted stock issued under the 2006 Equity Incentive Plan. We issued 266,814 shares out of treasury stock under our share-based compensation programs; 12,500 for restricted shares granted, and 254,314 for phantom stock units.
Restricted Stock
Restricted Stock Awards:
Fiscal | Shares Granted | Weighted Average Fair Value at Date of Grant | Shares Vested | Shares Forfeited | Shares Outstanding | Expense recognized through September 30, 2013 | ||||||||||||||||||
| 2006 | 384,850 | $ | 24.78 | 258,347 | 126,503 | - | $ | 6,402 | ||||||||||||||||
| 2006 | 25,000 | 17.36 | 25,000 | - | - | 434 | ||||||||||||||||||
| 2007 | 20,000 | 25.08 | 20,000 | - | - | 502 | ||||||||||||||||||
| 2007 | 4,000 | 26.48 | 4,000 | - | - | 106 | ||||||||||||||||||
| 2008 | 101,650 | 19.17 | 85,750 | 15,900 | - | 1,779 | ||||||||||||||||||
| 2009 | 185,100 | 8.71 | 146,400 | 38,700 | - | 1,344 | ||||||||||||||||||
| 2010 | 225,486 | 3.64 | 147,456 | 78,030 | - | 495 | ||||||||||||||||||
| 2011 | 320,000 | 3.39 | 171,715 | 73,205 | 75,080 | 669 | ||||||||||||||||||
| 2012 | 107,500 | 2.07 | 35,834 | - | 71,666 | 124 | ||||||||||||||||||
| 2013 | 12,500 | 5.00 | - | - | 12,500 | 19 | ||||||||||||||||||
60
INTEGRATED ELECTRICAL SERVICES, INC.
Notes to Consolidated Financial Statements
(All Amounts in Thousands Except Share Amounts)
During the years ended September 30, 2013, 2012 and 2011, we recognized $374, $536, and $787, respectively, in compensation expense related to these restricted stock awards. At September 30, 2013, the unamortized compensation cost related to outstanding unvested restricted stock was $216. We expect to recognize $186 and $30 of this unamortized compensation expense during the years ended September 30, 2014 and 2015, respectively. A summary of restricted stock awards for the years ended September 30, 2013, 2012 and 2011 is provided in the table below:
| Years Ended September 30, | ||||||||||||
| 2013 | 2012 | 2011 | ||||||||||
Unvested at beginning of year | 257,826 | 376,200 | 352,086 | |||||||||
Granted | 12,500 | 107,500 | 320,000 | |||||||||
Vested | (111,080 | ) | (192,973 | ) | (165,628 | ) | ||||||
Forfeited | - | (32,901 | ) | (130,258 | ) | |||||||
|
|
|
|
|
| |||||||
Unvested at end of year | 159,246 | 257,826 | 376,200 | |||||||||
|
|
|
|
|
| |||||||
The fair value of shares vesting during the years ended September 30, 2013, 2012 and 2011 was $528, $661 and $520, respectively. Fair value was calculated as the number of shares vested times the market price of shares on the date of vesting. The weighted average grant date fair value of unvested restricted stock at September 30, 2013 was $2.90.
All the restricted shares granted under the 2006 Equity Incentive Plan (vested or unvested) participate in dividends issued to common shareholders, if any.
Phantom Stock Units
Phantom stock units ("PSUs") are primarily granted to the members of the Board of Directors as part of their overall compensation. These PSUs are paid via unrestricted stock grants to each director upon their departure from the Board of Directors. We record compensation expense for the full value of the grant on the date of grant. For the years ended September 30, 2013, 2012 and 2011, we recognized $295, $159, and $100 in compensation expense related to these grants.
From time to time, PSUs are granted to employees. These PSUs are paid via unrestricted stock grants to each employee upon the satisfaction of the grant terms. We record compensation expense for the PSUs granted to employees over the grant vesting period. For the years ended September 30, 2013, 2012 and 2011, we recognized $651, $129, and $0 in compensation expense related to these grants.
61
INTEGRATED ELECTRICAL SERVICES, INC.
Notes to Consolidated Financial Statements
(All Amounts in Thousands Except Share Amounts)
Stock Options
We utilized a binomial option pricing model to measure the fair value of stock options granted. Our determination of fair value of share-based payment awards on the date of grant using an option-pricing model is affected by our stock price as well as assumptions regarding a number of highly complex and subjective variables. These variables include, but are not limited to, our expected stock price volatility over the term of the awards, the risk-free rate of return, and actual and projected employee stock option exercise behaviors. The expected life of stock options is not considered under the binomial option pricing model that we utilize. The assumptions used in the fair value method calculation for the years ended September 30, 2013, 2012 and 2011 are disclosed in the following table:
| Years Ended September 30, | ||||||||||||
| 2013 | 2012 | 2011 | ||||||||||
Weighted average value per option granted during the period | $ | 3.43 | N/A | $ | 2.05 | |||||||
Dividends (1) | $ | - | N/A | $ | - | |||||||
Stock price volatility (2) | 66.6 | % | N/A | 69.9 | % | |||||||
Risk-free rate of return | 0.9 | % | N/A | 1.9 | % | |||||||
Option term | 10.0 years | N/A | 10.0 years | |||||||||
Expected life | 6.0 years | N/A | 6.0 years | |||||||||
Forfeiture rate (3) | 10.0 | % | N/A | 0.0 | % | |||||||
| (1) | We do not currently pay dividends on our common stock. |
| (2) | Based upon the Company's historical volatility. |
| (3) | The forfeiture rate for the 2011 options was assumed on the date of grant to be zero based on the limited number of employees who have been awarded stock options. The forfeiture rate for the 2013 options was for a larger number of employees and based on historical data. |
Stock-based compensation expense recognized during the period is based on the value of the portion of the share-based payment awards that is ultimately expected to vest during the period. Stock-based compensation expense recognized in the Consolidated Statements of Comprehensive Income is based on awards ultimately expected to vest. We estimate our forfeitures at the time of grant and revise, if necessary, in subsequent periods if actual forfeitures differ from those estimates.
The following table summarizes activity under our stock option plans.
| Shares | Weighted Average Exercise Price | |||||||
Outstanding, September 30, 2010 | 158,500 | $ | 18.66 | |||||
Options granted | 20,000 | 3.24 | ||||||
Exercised | - | - | ||||||
Forfeited and Cancelled | (158,500 | ) | 18.66 | |||||
|
|
|
| |||||
Outstanding, September 30, 2011 | 20,000 | $ | 18.66 | |||||
Options granted | - | - | ||||||
Exercised | - | - | ||||||
Forfeited and Cancelled | - | - | ||||||
|
|
|
| |||||
Outstanding, September 30, 2012 | 20,000 | $ | 3.24 | |||||
|
|
|
| |||||
Options granted | 150,000 | 5.76 | ||||||
Exercised | - | - | ||||||
Forfeited and Cancelled | - | - | ||||||
|
|
|
| |||||
Outstanding, September 30, 2013 | 170,000 | $ | 5.46 | |||||
|
|
|
| |||||
62
INTEGRATED ELECTRICAL SERVICES, INC.
Notes to Consolidated Financial Statements
(All Amounts in Thousands Except Share Amounts)
The following table summarizes options outstanding and exercisable at September 30, 2013:
Exercise Prices | Outstanding as of September 30, 2013 | Remaining Contractual Life in Years | Weighted-Average Exercise Price | Exercisable as of September 30, 2013 | Weighted-Average Exercise Price | |||||||||||||||
$3.24 | 20,000 | 7.80 | $ | 3.24 | 13,333 | $ | 3.24 | |||||||||||||
$5.76 | 150,000 | 9.58 | $ | 5.76 | - | $ | - | |||||||||||||
|
|
|
|
|
|
|
| |||||||||||||
| 170,000 | $ | 5.46 | 13,333 | $ | 3.24 | |||||||||||||||
|
|
|
|
|
|
|
| |||||||||||||
Our 2011 options vest over a three year period at a rate of one-third per year upon the annual anniversary date of the grant. Our 2013 options cliff vest at the end of a two year period ending at the anniversary date of the grant. All options expire ten years from the grant date if they are not exercised. Upon exercise of stock options, it is our policy to first issue shares from treasury stock, then to issue new share. Unexercised stock options expire July 2021 and May 2023.
During the years ended September 30, 2013, 2012 and 2011, we recognized $110, $14 and $19, respectively, in compensation expense related to our stock option awards. At September 30, 2013, the unamortized compensation cost related to outstanding unvested stock options was $378. We expect to recognize $243 and $135 of this unamortized compensation expense during the year ended September 30, 2014 and 2015.
The intrinsic value of stock options outstanding and exercisable was $36 and zero at September 30, 2013 and 2012, respectively. The intrinsic value is calculated as the difference between the fair value as of the end of the period and the exercise price of the stock options.
13. RELATED-PARTY TRANSACTIONS
In connection with some of our original acquisitions, certain segments have entered into related party lease arrangements with former owners for facilities. Related party lease expense for the years ended September 30, 2013, 2012 and 2011 was $230, $198 and $265, respectively. Future commitments with respect to these leases are included in the schedule of minimum lease payments in Note 9, "Leases."
As described more fully in Note 8, "Debt – The Tontine Term Loan, " we entered into a $25,000 term loan with Tontine, a related party, in December 2007. On April 30, 2010, the Company issued a $15,000 payment towards the Tontine Term Loan, resulting in a reduction in interest expenses related to the Tontine Term Loan. On February 13, 2013, we repaid the remaining $10,000 of principal with cash on hand and proceeds from our $5,000 term loan with Wells Fargo. During the years ended September 30, 2013, 2012 and 2011 we incurred interest expense of $410, $1,103 and $1,100, respectively, related to the Tontine Term Loan.
On March 29, 2012, we entered into a sublease agreement with Tontine Associates, LLC, an affiliate of Tontine, for corporate office space in Greenwich, Connecticut. The lease extends from April 1, 2012 through March 31, 2014, with monthly payments due in the amount of $6. The lease has terms at market rates and payments by the Company are at a rate consistent with that paid by Tontine Associates, LLC to its landlord.
14. EMPLOYEE BENEFIT PLANS
401(k) Plan
In November 1998, we established the Integrated Electrical Services, Inc. 401(k) Retirement Savings Plan (the "401(k) Plan"). All full-time IES employees are eligible to participate on the first day of the month subsequent to completing sixty days of service and attaining age twenty-one. Participants become vested in our matching contributions following three years of service. After suspending Company matching under the 401(k) Plan in February 2009, we reinstated the employee match in March of 2013. We recognized $177, $0, and $0, respectively in matching expenses in 2013, 2012 and 2011.
Infrastructure Solutions has two 401(k) plans. The first provides for employees covered by collective bargaining agreements and has no provision for employer contributions. The second provides for employees outside collective bargaining agreements and has a provision for employer contributions. We recognized $4 in matching expense in 2013.
63
INTEGRATED ELECTRICAL SERVICES, INC.
Notes to Consolidated Financial Statements
(All Amounts in Thousands Except Share Amounts)
Executive Savings Plan
Under the Executive Deferred Compensation Plan adopted on July 1, 2004 (the "Executive Savings Plan"), certain employees are permitted to defer a portion (up to 75%) of their base salary and/or bonus for a Plan Year. The Compensation Committee of the Board of Directors may, in its sole discretion, credit one or more participants with an employer deferral (contribution) in such amount as the Committee may choose ("Employer Contribution"). The Employer Contribution, if any, may be a fixed dollar amount, a fixed percentage of the participant's compensation, base salary, or bonus, or a "matching" amount with respect to all or part of the participant's elective deferrals for such plan year, and/or any combination of the foregoing as the Committee may choose.
Post Retirement Benefit Plans
Certain individuals at one of the Company's locations are entitled to receive fixed annual payments that reach a maximum amount, as specified in the related agreements, for a ten year period following retirement or, in some cases, the attainment of 62 years of age. We recognize the unfunded status of the plan as a non-current liability in our Consolidated Balance Sheet. Benefits vest 50% after ten years of service, which increases by 10% per annum until benefits are fully vested after 15 years of service. We had an unfunded benefit liability of $828 and $827 recorded as of September 30, 2013 and 2012, respectively.
Multiemployer Pension Plan
Infrastructure Solutions participates in a multiemployer direct benefit pension plan for employees covered under our collective bargaining agreement. We do not administer the plan. We do not significantly participate in this plan. As of December 31, 2012, this plan was funded at 84.9%.
15. FAIR VALUE MEASUREMENTS
Fair Value Measurement Accounting
Fair value is considered the price to sell an asset, or transfer a liability, between market participants on the measurement date. Fair value measurements assume that the asset or liability is (1) exchanged in an orderly manner, (2) the exchange is in the principal market for that asset or liability, and (3) the market participants are independent, knowledgeable, able and willing to transact an exchange. Fair value accounting and reporting establishes a framework for measuring fair value by creating a hierarchy for observable independent market inputs and unobservable market assumptions and expands disclosures about fair value measurements. Considerable judgment is required to interpret the market data used to develop fair value estimates. As such, the estimates presented herein are not necessarily indicative of the amounts that could be realized in a current exchange. The use of different market assumptions and/or estimation methods could have a material effect on the estimated fair value.
We estimate the fair value of our interest rate swap agreement with Wells Fargo to be $17 at September 30, 2013, using Level 2 inputs, including an estimated market valuation from Wells Fargo Bank.
We estimate the fair value of the contingent consideration to be $95 at September 30, 2013, using Level 3 inputs, including a discounted revenue projection. The fair value of this contingent liability will vary depending on actual revenues earned.
We estimate the fair value of our unfavorable MISCOR leases to be $(490), using Level 2 inputs, including estimated market valuation including market rates from comparable properties.
64
INTEGRATED ELECTRICAL SERVICES, INC.
Notes to Consolidated Financial Statements
(All Amounts in Thousands Except Share Amounts)
Financial assets and liabilities measured at fair value on a recurring basis as of September 30, 2013, are summarized in the following table by the type of inputs applicable to the fair value measurements:
| Total Fair Value | Quoted Prices (Level 1) | Significant Other Observable Inputs (Level 2) | Significant Unobservable (Level 3) | |||||||||||||
Executive savings plan assets | $ | 591 | $ | 591 | $ | - | $ | - | ||||||||
Executive savings plan liabilities | (477 | ) | (477 | ) | - | - | ||||||||||
Interest rate swap agreement | 17 | - | 17 | - | ||||||||||||
Contingent consideration agreement | (95 | ) | - | - | (95 | ) | ||||||||||
Unfavorable acquired leases | (485 | ) | - | (485 | ) | - | ||||||||||
|
|
|
|
|
|
|
| |||||||||
Total | $ | (449 | ) | $ | 114 | $ | (468 | ) | $ | (95 | ) | |||||
|
|
|
|
|
|
|
| |||||||||
The table below presents a reconciliation of the fair value of our contingent consideration obligation, which uses significant unobservable inputs (level 3).
| Contingent Consideration Agreement | Total | |||||||
Fair Value at September 2012 | $ | - | $ | - | ||||
Issuances | 665 | 665 | ||||||
Settlements | - | - | ||||||
Adjustments to Fair Value | (570 | ) | (570 | ) | ||||
|
|
|
| |||||
Fair Value at September 30, 2013 | $ | 95 | $ | 95 | ||||
|
|
|
| |||||
Below is a description of the inputs used to value the assets summarized in the preceding table:
Level 1 - Inputs represent unadjusted quoted prices for identical assets exchanged in active markets.
Level 2 - Inputs include directly or indirectly observable inputs other than Level 1 inputs such as quoted prices for similar assets exchanged in active or inactive markets; quoted prices for identical assets exchanged in inactive markets; and other inputs that are considered in fair value determinations of the assets.
Level 3 - Inputs include unobservable inputs used in the measurement of assets. Management is required to use its own assumptions regarding unobservable inputs because there is little, if any, market activity in the assets or related observable inputs that can be corroborated at the measurement date.
16. INVENTORY
Inventories consists of the following components:
| Years Ended September 30, | ||||||||
| 2013 | 2012 | |||||||
Raw materials | $ | 2,389 | $ | - | ||||
Work in process | 3,519 | - | ||||||
Finished goods | 1,545 | - | ||||||
Parts and supplies | 12,694 | 15,141 | ||||||
|
|
|
| |||||
Total Inventories | $ | 20,147 | $ | 15,141 | ||||
|
|
|
| |||||
65
INTEGRATED ELECTRICAL SERVICES, INC.
Notes to Consolidated Financial Statements
(All Amounts in Thousands Except Share Amounts)
17. COMMITMENTS AND CONTINGENCIES
Legal Matters
From time to time we are a party to various claims, lawsuits and other legal proceedings that arise in the ordinary course of business. We maintain various insurance coverages to minimize financial risk associated with these proceedings. None of these proceedings, separately or in the aggregate, are expected to have a material adverse effect on our financial position, results of operations or cash flows. With respect to all such proceedings, we record reserves when it is probable that a liability has been incurred and the amount of loss can be reasonably estimated. We expense routine legal costs related to these proceedings as they are incurred.
The following is a discussion of our significant legal matters:
Ward Transformer Site
One of our subsidiaries has been identified as one of more than 200 potentially responsible parties ("PRPs") with respect to the clean-up of an electric transformer resale and reconditioning facility, known as the Ward Transformer Site, located in Raleigh, North Carolina, due to Polychlorinated Biphenyls ("PCBs") contamination on and off the site. The subsidiary, which we acquired in January 1999, is believed to have sent transformers to the facility during the 1990s. Based on our investigation to date, there is evidence to support our defense that our subsidiary contributed no PCB contamination to the site.
In April 2009, two PRPs, Carolina Power and Light Company and Consolidation Coal Company, filed suit against us and most of the other PRPs in the U.S. District Court for the Eastern District of North Carolina (Western Division) to contribute to the cost of the clean-up. The plaintiffs were two of four PRPs that have commenced clean-up of on-site contaminated soils under an Emergency Removal Action pursuant to a settlement agreement and Administrative Order on Consent entered into between the four PRPs and the U.S. Environmental Protection Agency ("EPA") in September 2005. We are not a party to that settlement agreement or Order on Consent.
In addition to the on-site clean-up, the EPA has selected approximately 50 PRPs to which it sent a Special Notice Letter in late 2008 to organize the clean-up of soils off site and address contamination of groundwater and other miscellaneous off-site issues. We were not a recipient of that letter. On January 8, 2013, the EPA held a meeting with those PRPs as well as others that were not recipients of the letter to discuss potential settlement of its costs associated with the site. The Company was invited to attend this meeting and asked to confirm whether it would participate in settlement discussions, which the Company confirmed. The Company intends to present to the EPA the evidence developed in litigation to support the argument that the Company did not contribute PCB contamination to the site. The Company has tendered a demand for indemnification to the former owner of the acquired corporation that may have transacted business with the facility. As of September 30, 2013, we have not recorded a reserve for this matter, as we believe the likelihood of our responsibility for damages is not probable and a potential range of exposure is not estimable.
Hamilton Wage and Hour
The Company is a defendant in three wage-and-hour suits seeking class action certification that were filed between August 29, 2012 and June 24, 2013, in the U.S. District Court for the Eastern District of Texas. Each of these cases is among several others filed by Plaintiffs' attorney against contractors working in the Port Arthur, Texas Motiva plant on various projects over the last few years. The claims are based on alleged failure to compensate for time spent bussing to and from the plant, donning safety wear and other activities. It does not appear the Company will face significant exposure for any unpaid wages. In a separate earlier case based on the same allegations, a federal district court ruled that the time spent traveling on the busses is not compensable. On January 11, 2013, the U.S. Court of Appeals for the Fifth Circuit upheld the district court's ruling finding no liability for wages for time spent bussing into the facility. On October 8, 2013, the U.S. Supreme Court declined to review plaintiffs' appeal of the Fifth Circuit dismissal of their claims for compensation for time spent bussing to the facility, effectively reducing the Company's risk of liability on this issue in its cases. Our investigation indicates that all claims for time spent on other activities either were inapplicable to the Company's employees or took place during times for which the Company's employees were compensated. We have filed responsive pleadings and, following initial discovery are positioning the cases to obtain a dismissal of all claims. As of September 30, 2013, we have not recorded a reserve for this matter, as we believe the likelihood of our responsibility for damages is not probable and a potential range of exposure is not estimable.
66
INTEGRATED ELECTRICAL SERVICES, INC.
Notes to Consolidated Financial Statements
(All Amounts in Thousands Except Share Amounts)
Risk-Management
We retain the risk for workers' compensation, employer's liability, automobile liability, general liability and employee group health claims, as well as pollution coverage, resulting from uninsured deductibles per accident or occurrence which are subject to annual aggregate limits. Our general liability program provides coverage for bodily injury and property damage. Losses up to the deductible amounts are accrued based upon our known claims incurred and an estimate of claims incurred but not reported. As a result, many of our claims are effectively self-insured. Many claims against our insurance are in the form of litigation. At September 30, 2013, we had $4,963 accrued for insurance liabilities. We are also subject to construction defect liabilities, primarily within our Residential segment. As of September 30, 2013, we had $520 reserved for these claims.
Some of the underwriters of our casualty insurance program require us to post letters of credit as collateral. This is common in the insurance industry. To date, we have not had a situation where an underwriter has had reasonable cause to effect payment under a letter of credit. At September 30, 2013, $6,147 of our outstanding letters of credit were utilized to collateralize our insurance program.
Surety
Many customers, particularly in connection with new construction, require us to post performance and payment bonds issued by a surety. Those bonds provide a guarantee to the customer that we will perform under the terms of our contract and that we will pay our subcontractors and vendors. If we fail to perform under the terms of our contract or to pay subcontractors and vendors, the customer may demand that the surety make payments or provide services under the bond. We must reimburse the sureties for any expenses or outlays they incur on our behalf. To date, we have not been required to make any reimbursements to our sureties for bond-related costs.
As is common in the surety industry, sureties issue bonds on a project-by-project basis and can decline to issue bonds at any time. We believe that our relationships with our sureties will allow us to provide surety bonds as they are required. However, current market conditions, as well as changes in our sureties' assessment of our operating and financial risk, could cause our sureties to decline to issue bonds for our work. If our sureties decline to issue bonds for our work, our alternatives would include posting other forms of collateral for project performance, such as letters of credit or cash, seeking bonding capacity from other sureties, or engaging in more projects that do not require surety bonds. In addition, if we are awarded a project for which a surety bond is required but we are unable to obtain a surety bond, the result can be a claim for damages by the customer for the costs of replacing us with another contractor.
As of September 30, 2013, the estimated cost to complete our bonded projects was approximately $49,149. We evaluate our bonding requirements on a regular basis, including the terms offered by our sureties. We believe the bonding capacity presently provided by our current sureties is adequate for our current operations and will be adequate for our operations for the foreseeable future. As of September 30, 2013, we had cash totaling $999 to collateralize our obligations to certain of our previous sureties (as is included in Other Non-Current Assets in our Consolidated Balance Sheet). Posting letters of credit in favor of our sureties reduces the borrowing availability under our 2012 Credit Facility.
On May 7, 2013, the Company and certain of its current and future subsidiaries and affiliates entered into a new agreement of indemnity (the "Surety Agreement") with certain entities affiliated with Suremerica Surety Underwriting Services, LLC ("Suremerica"). Pursuant to the Surety Agreement, we have agreed to assign to Suremerica, among other things, as collateral to secure our obligations under the Surety Agreement, our rights, title and interest in, and all accounts receivable and related proceeds arising pursuant to, any contract bonded by Suremerica on our behalf. Further, under the Surety Agreement, we have also agreed that, upon written demand, we will deposit with Suremerica, as additional collateral, an amount determined by Suremerica to be sufficient to discharge any claim made against Suremerica on a bond issued on our behalf.
67
INTEGRATED ELECTRICAL SERVICES, INC.
Notes to Consolidated Financial Statements
(All Amounts in Thousands Except Share Amounts)
Other Commitments and Contingencies
Some of our customers and vendors require us to post letters of credit as a means of guaranteeing performance under our contracts and ensuring payment by us to subcontractors and vendors. If our customer has reasonable cause to effect payment under a letter of credit, we would be required to reimburse our creditor for the letter of credit. At September 30, 2013, $200 of our outstanding letters of credit were to collateralize our vendors.
On January 9, 2012, we entered into a settlement agreement with regard to $2,000 of collateral held by a surety who previously issued construction payment and performance bonds for us. The agreement called for a total settlement of $2,200 to be paid in monthly installments through February 2013, and based on subsequent payment defaults, was amended to provide for additional collateral and a total settlement amount of $2,025 ($2,200 less the $175 already received) to be paid in monthly installments beginning September 30, 2012 through July 2014 with an interest rate of 12%. Following a subsequent amendment to postpone or modify payment dates, on January 2, 2013, the Company tendered a notice of default to the surety and its coal mining operations, which had been pledged as additional collateral. Given the surety's failure to make the payments due on December 31, 2012, and January 31, 2013, and its continued attempts to restructure the underlying settlement agreement, the Company concluded the collection of the receivable was not probable as of December 31, 2012, and recorded a reserve in the amount $1,725 for the first quarter of fiscal 2013, bringing the receivable's net carrying value to zero. The charge was recorded as other expense within our Consolidated Statements of Comprehensive Income and the reserve was recorded within our current assets within the Consolidated Balance Sheet.
On March 8, 2013, the Company issued a notice of acceleration of the promissory notes signed by the two mining companies, and subsequently filed suit to enforce the acceleration and to domesticate the agreed judgment against the surety and its owner in Virginia. Following these actions, the surety entered into an amended agreement with the Company which provided for payment of $300, which was received on June 24, 2013, and additional monthly installments with final payment due June 30, 2014. As of December 11, 2013, the Company has received installment payments totaling $450. If the defendants default on this agreement, the Company expects to move forward with the collection activities that led to the June 2013 amendment and payments. The extent of recovery of the remaining balance, if any, cannot be determined. However, the possibility of a partial or full recovery exists as installment payments continue, and the Company remains poised to aggressively pursue collection in the event of a default. We have classified the $450 received as of September 2013 as other income within our Consolidated Statements of Comprehensive Income. Any subsequent recovery will be included in other income.
From time to time, we may enter into firm purchase commitments for materials such as copper or aluminum wire which we expect to use in the ordinary course of business. These commitments are typically for terms less than one year and require us to buy minimum quantities of materials at specific intervals at a fixed price over the term. As of September 30, 2013, we had no such open purchase commitments.
18. GOODWILL AND INTANGIBLE ASSETS
The following is a progression of goodwill by segment for the years ended September 30, 2013, 2012 and 2011:
| Residential | Infrastructure Solutions | Total | ||||||||||
Balance at September 30, 2011 | $ | 4,446 | $ | - | $ | 4,446 | ||||||
Balance at September 30, 2012 | 4,446 | - | 4,446 | |||||||||
Acquisition | 4,185 | 5,293 | 9,478 | |||||||||
|
|
|
|
|
| |||||||
Balance at September 30, 2013 | $ | 8,631 | $ | 5,293 | $ | 13,924 | ||||||
|
|
|
|
|
| |||||||
Goodwill
Based upon the results of our annual impairment analysis, the fair value of our Residential segment significantly exceeded the book value, and warrants no impairment. We evaluated goodwill attributable to Infrastructure Solutions qualitatively, and have concluded no impairment is necessary. We recorded goodwill impairment of $142 during the year ended September 30, 2011, bringing the goodwill balance attributable to our Commercial & Industrial segment to zero.
68
INTEGRATED ELECTRICAL SERVICES, INC.
Notes to Consolidated Financial Statements
(All Amounts in Thousands Except Share Amounts)
Intangible assets consist of the following:
| Year Ended September 30, 2013 | ||||||||||||||||
| Estimated Useful Lives (in Years) | Gross Carrying Amount | Accumulated Amortization | Net | |||||||||||||
Trademarks/trade names | Indefinite | $ | 1,200 | $ | - | $ | 1,200 | |||||||||
Technical Library | 20 | 400 | 1 | 399 | ||||||||||||
Customer Relationships | 6.3 | 2,100 | 16 | 2,084 | ||||||||||||
Order backlog | 0.4 | 350 | 350 | - | ||||||||||||
Covenants not to compete | 3.0 | 140 | 27 | 113 | ||||||||||||
Developed Technology | 4.0 | 400 | 58 | 342 | ||||||||||||
|
|
|
|
|
| |||||||||||
Total | $ | 4,590 | $ | 452 | $ | 4,138 | ||||||||||
|
|
|
|
|
| |||||||||||
Amortization of intangible assets was $452 for the year ended September 30, 2013. Our future amortization expense for years ended September 30, is as follows:
Year Ended September 30, | ||||
2014 | $ | 499 | ||
2015 | 499 | |||
2016 | 471 | |||
2017 | 398 | |||
2018 | 358 | |||
Thereafter | 713 | |||
|
| |||
Total | $ | 2,938 | ||
|
| |||
19. DERIVATIVE INSTRUMENTS
On March 1, 2013, we entered into an interest rate swap agreement with Wells Fargo Bank, N.A. in conjunction with our Wells Fargo Term Loan to hedge interest rate risk. Borrowings under the Wells Fargo Term Loan bore interest at a per annum rate equal to Daily Three Month LIBOR plus an applicable margin. Our interest rate swap agreement bears interest of 1.00% less the per annum rate equal to Daily Three Month LIBOR, thus mitigating the interest rate risk associated with the Daily Three Month LIBOR and ensuring a fixed rate for hedged borrowings under the Wells Fargo Term Loan.
Our derivative instrument is held at fair value on our consolidated balance sheet. Related cash flows are recorded as operating activities on the consolidated statement of cash flows. Gains and losses related to this derivative instrument are recognized within other comprehensive income. As of September 13, 2013, the interest rate swap agreement was 100% effective, as interest for both the Wells Fargo Term Loan and interest rate swap agreement were calculated utilizing the Daily Three Month LIBOR rate on the same principal basis.
The following table presents the gross fair value of our interest rate swap derivative, and the line items where it appears on our consolidated balance sheet:
| September 30, | September 30, | |||||||
| 2013 | 2012 | |||||||
Assets | ||||||||
Prepaid expenses and other current assets | $ | 17 | $ | - | ||||
Stockholder's equity | $ | 17 | $ | - | ||||
Accumulated other comprehensive income | ||||||||
69
INTEGRATED ELECTRICAL SERVICES, INC.
Notes to Consolidated Financial Statements
(All Amounts in Thousands Except Share Amounts)
20. BUSINESS COMBINATION
Acquisition of Assets from the Acro Group
On February 8, 2013, IES Renewable Energy, LLC ("IES Renewable"), an indirect wholly-owned subsidiary of the Company, entered into an Asset Purchase Agreement with a group of entities operating under the name of the Acro Group: Residential Renewable Technologies, Inc., Energy Efficiency Solar, Inc. and Lonestar Renewable Technologies Acquisition Corp. (collectively, the "Acro Group"). Pursuant to the terms of the Asset Purchase Agreement, the Company agreed to acquire certain assets in connection with the Acro Group's turn-key residential solar integration business (the "Acquired Assets"). The Acquired Assets include, but are not limited to, assets relating to the Acro Group's solar installation sales and marketing platform and the backlog of contracts entered into by the Acro Group with residential solar customers, which provide for the payment of sales and marketing fees in connection with the sale, installation and third-party financing of residential solar equipment. The transaction closed on February 15, 2013 (the "Closing Date").
Following consummation of the transaction, IES Residential, Inc. ("IES Residential"), a wholly-owned subsidiary of the Company, began offering full-service residential solar integration services, including design, procurement, permitting, installation, financing services through third parties and warranty services for residential customers. IES Residential had previously provided solar installation subcontracting services to the Acro Group, and as of February 8, 2013, was owed $3,800 for subcontracting services provided up to that date (such balance, as of the day prior to the Closing Date, the "Accounts Receivable Balance").
Total consideration received by the Acro Group for the Acquired Assets consists of (i) IES Residential's release of the Accounts Receivable Balance, (ii) payment by IES Renewable to the Acro Group of a percentage of future gross revenue generated from the Acquired Assets in an amount not to exceed $2,000 over the 12-month period beginning the first full month following the Closing Date, subject to certain reductions as described in the Asset Purchase Agreement, and (iii) $828 representing amounts paid by IES Residential, to the Acro Group to fund certain of its operating expenses between January 4, 2013 and the Closing Date.
Purchase price and fair value of assets acquired and liabilities assumed
The Company accounted for the transaction under the acquisition method of accounting, which requires recording assets and liabilities at fair value (Level 3). These Level 3 fair value assessments were measured based on a third party valuation, utilizing methodologies including discounted cash flow, replacement cost, and excess earnings, which are subject to finalization. The total estimated purchase price was allocated to the tangible assets and separately identifiable intangible assets acquired and liabilities assumed based on their fair values on the Closing Date.
70
INTEGRATED ELECTRICAL SERVICES, INC.
Notes to Consolidated Financial Statements
(All Amounts in Thousands Except Share Amounts)
The valuations were derived based on assumptions made by management. While management believes that its assumptions underlying the valuations are reasonable, different estimates and assumptions could result in different values being assigned to individual assets acquired and liabilities assumed. The fair value of assets acquired and liabilities assumed on the Closing Date is as follows:
IES receivable from the Acro Group as of December 31, 2012 (a) | $ | 2,263 | ||
IES deferred cost recorded in connection with transactions with Acro Group between January 1, 2013 and February 15, 2013 | 1,042 | |||
Cash purchase consideration | 828 | |||
Fair value of contingent consideration (b) | 665 | |||
|
| |||
Total consideration transferred | $ | 4,798 | ||
|
|
| (a) | As of the Closing Date, IES had a receivable from the Acro Group from past transactions between the two companies. This receivable was forgiven by IES as a portion of the consideration paid to acquire the Acro Group assets and liabilities. |
| (b) | The contingent consideration is based on a formula of the Acro Group's revenue for the first 12 months after February 15, 2013, with a maximum and minimum amount payable by IES. |
Total estimate of consideration expected to be transferred | 4,798 | |||
Fair value of assets acquired and liabilities assumed: | ||||
Trade receivables | $ | 317 | ||
Prepaid commissions | 46 | |||
Inventory | 16 | |||
Property and equipment | 40 | |||
Order backlog | 350 | |||
Covenant not-to-compete | 140 | |||
Developed technology | 400 | |||
Vacation payable | (26 | ) | ||
Customer incentive payable | (70 | ) | ||
Deferred revenue | (600 | ) | ||
|
| |||
Goodwill: (c) | $ | 4,185 | ||
|
| |||
| (c) | The goodwill is attributable to the workforce of the acquired business and other intangibles that do not qualify for separate recognition. |
Acquisition of MISCOR
On September 13, 2013 we completed the acquisition of 100% of the voting equity interests of MISCOR Group, LTD ("MISCOR"), a provider of maintenance and repair services including engine parts and components to the industrial and rail services. MISCOR operates in locations in Indiana, Alabama, Ohio, West Virginia, and California. Following the consummation of the transaction, MISCOR was incorporated as the sole component of our Infrastructure Solutions segment.
Total consideration received by MISCOR shareholders consisted of 2,795,577 shares of IES common stock valued at $11,853, combined with cash totaling $4,364.
Purchase price and fair value of assets acquired and liabilities assumed
The Company accounted for the transaction under the acquisition method of accounting, which requires recording assets and liabilities at fair value (Level 3). These Level 3 fair value assessments were measured based on a third party valuation, utilizing methodologies including discounted cash flow, replacement cost, and excess earnings, which are subject to finalization. The total estimated purchase price was allocated to the tangible assets and separately identifiable intangible assets acquired and liabilities assumed based on their preliminary estimated fair values on September 13, 2013.
71
INTEGRATED ELECTRICAL SERVICES, INC.
Notes to Consolidated Financial Statements
(All Amounts in Thousands Except Share Amounts)
The valuations derived from estimated fair value assessments and assumptions used by management are preliminary pending finalization of certain intangible asset valuations. While management believes that its preliminary estimates and assumptions underlying the valuations are reasonable, different estimates and assumptions could result in different values being assigned to individual assets acquired and liabilities assumed. This may result in adjustments to the preliminary amounts recorded and goodwill, which could be material. The preliminary valuation of the assets acquired and liabilities assumed as of September 13, 2013 is as follows:
IES Common Shares (2,795,577) | $ | 11,853 | ||
Cash purchase consideration | 4,364 | |||
|
| |||
Total consideration transferred | $ | 16,217 | ||
|
| |||
Total estimate of consideration expected to be transferred | $ | 16,217 | ||
Fair value of assets acquired and liabilities assumed: | ||||
Trade receivables | $ | 4,925 | ||
Prepaids | 532 | |||
Inventory | 7,530 | |||
Property and equipment | 5,355 | |||
Customer relationships | 2,100 | |||
Technical library | 400 | |||
Trade names | 1,200 | |||
Other assets | 552 | |||
Trade payables | (4,143 | ) | ||
Accrued liabilities | (2,016 | ) | ||
Term loan | (5,511 | ) | ||
|
| |||
Goodwill: (c) | $ | 5,293 | ||
|
|
| (c) | The goodwill is attributable to the workforce of the acquired business and other intangibles that do not qualify for separate recognition. Although this goodwill is not deductible for tax purposes, we acquired tax basis of $8.6 million in goodwill and intangible assets recognized by MISCOR prior to our purchase agreement with them. The deferred tax asset associated with this basis is fully offset by a corresponding valuation allowance. No value was assigned in the purchase price allocation above to the original intangible assets recognized by MISCOR prior to our purchase agreement. |
Unaudited Pro Forma Information – 2013 Acquisitions
The following unaudited supplemental pro forma results of operations include the results of each of the companies acquired during year ended September 30, 2013, described above as if each had been consolidated as of October 1, 2011, and have been provided for illustrative purposes only and do not purport to be indicative of the actual results that would have been achieved by the combined companies for the periods presented or that may be achieved by the combined companies in the future. Future results may vary significantly from the results reflected in the following pro forma financial information because of future events and transactions, as well as other factors, many of which are beyond IES's control.
The unaudited pro forma financial information reflects certain adjustments related to the acquisition, such as the recording of incremental depreciation expense in connection with fair value adjustments to property and equipment, incremental amortization expense in connection with recording acquired identifiable intangible assets at fair value, and the elimination of the impact of historical transactions between IES and the Acro Group that would have been treated as intercompany transactions had the companies been consolidated. The unaudited pro forma financial information also includes the effect of certain non-recurring items as of October 1, 2011 such as $3,034 in acquisition related costs incurred during the year ended September 30, 2013. The unaudited pro forma financial statements include these acquisition related costs as if they had been incurred on October 1, 2011.
The supplemental pro forma results of operations for the years ended September 30, 2013 and 2012, as if the assets of Acro Group had been acquired and the acquisition of MISCOR had been completed on October 1, 2011, are as follows:
| Unaudited | ||||||||
| Year Ended | Year Ended | |||||||
| September 30, 2013 | September 30, 2012 | |||||||
Revenues | $ | 542,027 | $ | 520,016 | ||||
Net loss from continuing operations | $ | (3,081 | ) | $ | (6,642 | ) | ||
72
INTEGRATED ELECTRICAL SERVICES, INC.
Notes to Consolidated Financial Statements
(All Amounts in Thousands Except Share Amounts)
21. DISCONTINUED OPERATIONS
In 2011, we initiated the closure of all or portions of our Commercial & Industrial and Communications facilities in Arizona, Florida, Iowa, Louisiana, Maryland, Massachusetts, Nevada and Texas. These facilities were a key aspect of our commitment to return the Company to profitability and selected based on their current business prospects and the extended time frame needed to return the facilities to a profitable position. From the time of identification through September 30, 2013 we have sub-leased or terminated our lease contracts for leased facilities. We have satisfied substantially all of our contracts through either the subcontracting or self-performance. We have completed the wind down of these facilities as of September 30, 2013. Results from operations of these facilities for the years ended September 30, 2013, 2012, and 2011 are presented in our Consolidated Statements of Comprehensive Income as discontinued operations.
The components of the results of discontinued operations for these facilities are as follows:
| Years Ended September 30, | ||||||||||||
| 2013 | 2012 | 2011 | ||||||||||
Revenues | $ | 1,559 | $ | 16,279 | $ | 69,222 | ||||||
Cost of services | 2,032 | 20,941 | 78,220 | |||||||||
|
|
|
|
|
| |||||||
Gross profit | (473 | ) | (4,662 | ) | (8,998 | ) | ||||||
Selling, general and administrative | 601 | 2,557 | 5,536 | |||||||||
Loss (gain) on sale of assets | 258 | 769 | (28 | ) | ||||||||
Restructuring charge | 63 | 1,170 | 3,785 | |||||||||
Other (income) expense | - | - | (3 | ) | ||||||||
|
|
|
|
|
| |||||||
Loss from discontinued operations | (1,395 | ) | (9,158 | ) | (18,288 | ) | ||||||
(Benefit) provision for income taxes | - | (11 | ) | (26 | ) | |||||||
|
|
|
|
|
| |||||||
Net loss from discontinued operations | $ | (1,395 | ) | $ | (9,147 | ) | $ | (18,262 | ) | |||
|
|
|
|
|
| |||||||
Included in the Consolidated Balance Sheets at September 30, 2013 and 2012 are the following major classes of assets and liabilities associated with discontinued operations:
| Years Ended September 30, | ||||||||
| 2013 | 2012 | |||||||
Assets of discontinued operations: | ||||||||
Current | $ | 1,123 | $ | 6,127 | ||||
Liabilities of discontinued operations: | ||||||||
Current | $ | 889 | $ | 3,005 | ||||
73
INTEGRATED ELECTRICAL SERVICES, INC.
Notes to Consolidated Financial Statements
(All Amounts in Thousands Except Share Amounts)
22. QUARTERLY RESULTS OF OPERATIONS (UNAUDITED)
Quarterly financial information for the years ended September 30, 2013 and 2012, are summarized as follows:
| Fiscal Year Ended September 30, 2013 | ||||||||||||||||
| First Quarter | Second Quarter | Third Quarter | Fourth Quarter | |||||||||||||
Revenues | $ | 127,264 | $ | 121,995 | $ | 121,552 | $ | 123,782 | ||||||||
Gross profit | $ | 17,980 | $ | 15,996 | $ | 15,653 | $ | 17,331 | ||||||||
Net income (loss) from continuing operations | $ | 633 | $ | (940 | ) | $ | (725 | ) | $ | (1,146 | ) | |||||
Net loss from discontinued operations | $ | (123 | ) | $ | (161 | ) | $ | (413 | ) | $ | (698 | ) | ||||
Net loss | $ | 510 | $ | (1,101 | ) | $ | (1,138 | ) | $ | (1,844 | ) | |||||
Loss per share from continuing operations: | ||||||||||||||||
Basic | $ | 0.04 | $ | (0.06 | ) | $ | (0.05 | ) | $ | (0.07 | ) | |||||
Diluted | $ | 0.04 | $ | (0.06 | ) | $ | (0.05 | ) | $ | (0.07 | ) | |||||
Loss per share from discontinued operations: | ||||||||||||||||
Basic | $ | (0.01 | ) | $ | (0.01 | ) | $ | (0.03 | ) | $ | (0.05 | ) | ||||
Diluted | $ | (0.01 | ) | $ | (0.01 | ) | $ | (0.03 | ) | $ | (0.05 | ) | ||||
Earnings loss per share: | ||||||||||||||||
Basic | $ | 0.03 | $ | (0.07 | ) | $ | (0.08 | ) | $ | (0.12 | ) | |||||
Diluted | $ | 0.03 | $ | (0.07 | ) | $ | (0.08 | ) | $ | (0.12 | ) | |||||
The sum of the individual quarterly earnings per share amounts may not agree with year-to-date earnings per share as each period's computation is based on the weighted average number of shares outstanding during the period.
| Fiscal Year Ended September 30, 2012 | ||||||||||||||||
| First Quarter | Second Quarter | Third Quarter | Fourth Quarter | |||||||||||||
Revenues | $ | 108,998 | $ | 107,608 | $ | 116,128 | $ | 123,381 | ||||||||
Gross profit | $ | 13,193 | $ | 13,789 | $ | 14,256 | $ | 16,814 | ||||||||
Net income (loss) from continuing operations | $ | 192 | $ | (1,186 | ) | $ | (1,213 | ) | $ | (448 | ) | |||||
Net loss from discontinued operations | $ | (3,913 | ) | $ | (2,245 | ) | $ | (1,963 | ) | $ | (1,026 | ) | ||||
Net loss | $ | (3,721 | ) | $ | (3,431 | ) | $ | (3,176 | ) | $ | (1,474 | ) | ||||
Loss per share from continuing operations: | ||||||||||||||||
Basic | $ | 0.01 | $ | (0.08 | ) | $ | (0.08 | ) | $ | (0.03 | ) | |||||
Diluted | $ | 0.01 | $ | (0.08 | ) | $ | (0.08 | ) | $ | (0.03 | ) | |||||
Loss per share from discontinued operations: | ||||||||||||||||
Basic | $ | (0.27 | ) | $ | (0.15 | ) | $ | (0.13 | ) | $ | (0.07 | ) | ||||
Diluted | $ | (0.27 | ) | $ | (0.15 | ) | $ | (0.13 | ) | $ | (0.07 | ) | ||||
Earnings loss per share: | ||||||||||||||||
Basic | $ | (0.26 | ) | $ | (0.23 | ) | $ | (0.22 | ) | $ | (0.10 | ) | ||||
Diluted | $ | (0.26 | ) | $ | (0.23 | ) | $ | (0.22 | ) | $ | (0.10 | ) | ||||
The sum of the individual quarterly earnings per share amounts may not agree with year-to-date earnings per share as each period's computation is based on the weighted average number of shares outstanding during the period.
74
Item 9. Changes in and Disagreements with Accountants on Accounting and Financial Disclosure
None.
Item 9A. Controls and Procedures
Changes in Internal Control Over Financial Reporting
There have been no changes in our internal control over financial reporting the occurred during the fiscal year ended September 30, 2013 that have materially affected, or are reasonably likely to materially affect, our internal control over financial reporting.
Disclosure Controls and Procedures
In accordance with Exchange Act Rule 13a-15 and 15d-15, we carried out an evaluation, under the supervision and with the participation of management, including our Chief Executive Officer and our Chief Financial Officer, of the effectiveness of our disclosure controls and procedures as of the end of the period covered by this report. Based on that evaluation, our Chief Executive Officer and Chief Financial Officer concluded that our disclosure controls and procedures were effective as of September 30, 2013 to provide reasonable assurance that information required to be disclosed in our reports filed or submitted under the Exchange Act is recorded, processed, summarized and reported within the time periods specified in the Securities and Exchange Commission's rules and forms. Our disclosure controls and procedures include controls and procedures designed to ensure that information required to be disclosed in reports filed or submitted under the Exchange Act is accumulated and communicated to our management, including our Chief Executive Officer and Chief Financial Officer, as appropriate, to allow timely decisions regarding required disclosure.
Management's Report on Internal Control over Financial Reporting
Management, including the Company's Chief Executive Officer and Chief Financial Officer, is responsible for establishing and maintaining adequate internal control over financial reporting for the Company. The Company's internal control system was designed to provide reasonable assurance to the Company's Management and Directors regarding the preparation and fair presentation of published financial statements. Because of its inherent limitations, internal control over financial reporting may not prevent or detect misstatements. Also, projections of any evaluation of effectiveness to future periods are subject to the risk that controls may become inadequate because of changes in conditions, or that the degree of compliance with the policies or procedures may deteriorate.
Management conducted an evaluation of the effectiveness of internal control over financial reporting based on the Internal Control - Integrated Framework issued by the Committee of Sponsoring Organizations of the Treadway Commission. Based on this evaluation, management concluded that Integrated Electrical Services' internal control over financial reporting was effective as of September 30, 2013.
Item 9B. Other Information
None.
75
PART III
Item 10. Directors, Executive Officers and Corporate Governance
The information required to be included Item 10 of Part III of this Form 10-K is incorporated by reference from the sections entitled "Security Ownership of Certain Beneficial Owners and Management;" "Section 16(a) Beneficial Ownership Reporting Compliance;" "Report of the Audit Committee" and "Election of Directors" in the Company's definitive Proxy Statement for its 2014 Annual Meeting of Stockholders (the "Proxy Statement") to be filed with the SEC no later than December 31, 2013.
Item 11. Executive Compensation
The information required to be included in Item 11 of Part III of this Form 10-K is incorporated by reference from the section entitled "Executive Compensation" in the Proxy Statement.
Item 12. Security Ownership of Certain Beneficial Owners and Management and Related Stockholder Matters
Certain information required to be included in Item 12 of Part III of this Form 10-K is incorporated by reference from the section entitled "Security Ownership of Certain Beneficial Owners and Management" in the Proxy Statement.
SECURITIES AUTHORIZED FOR ISSUANCE UNDER EQUITY COMPENSATION PLANS
Equity Compensation Plan Information
The following table provides information as of September 30, 2013 with respect to shares of our common stock that may be issued upon the exercise of options, warrants and rights granted to employees or members of the Board of Directors under the Company's existing equity compensation plans. For additional information about our equity compensation plans, see Note 12, "Stockholders' Equity" in the notes to our Consolidated Financial Statements set forth in Item 8, " Financial Statements and Supplementary Data" of this Form 10-K.
Plan Category | (a) Number of Securities to be Issued Upon Exercise of Outstanding Options, Warrants and Rights | (b) Weighted-Average Exercise Price of Outstanding Options, Warrants and Rights | (c) Number of Securities Remaining Available for Future Issuance Under Equity Compensation Plans (Excluding Securities Reflected in Column (a)) | |||||||||
Equity compensation plans approved by security holders | - | - | - | |||||||||
Equity compensation plans not approved by security holders | 170,000 | (1) | $ | 3.24 | 742,671 | (2) | ||||||
| (1) | Represents shares issuable upon exercise of outstanding options granted under the Integrated Electrical Services, Inc. 2006 Equity Incentive Plan. This plan was authorized pursuant to the Company's plan of reorganization and provides for the granting or awarding of stock options, stock and restricted stock to employees (including officers), consultants and directors of the Company. All stock options granted under this plan were granted at fair market value on the date of grant. 159,246 shares of restricted stock are outstanding under this plan. |
| (2) | Represents shares remaining available for issuance under the Integrated Electrical Services, Inc. 2006 Equity Incentive Plan |
76
Item 13. Certain Relationships and Related Transactions, and Director Independence
The information required to be included in Item 13 of Part III of this Form 10-K is incorporated by reference from the section entitled "Certain Relationships and Related Person Transactions" in the Proxy Statement.
Item 14. Principal Accountant Fees and Services
The information required to be included in Item 14 of Part III of this Form 10-K is incorporated by reference from the section entitled "Audit Fees" in the Proxy Statement.
PART IV
Item 15. Exhibits and Financial Statement Schedules
(a) Financial Statements and Supplementary Data, Financial Statement Schedules and Exhibits
See Index to Financial Statements under Item 8, " Financial Statements and Supplementary Data" of this From 10-K.
(b) Exhibits
Exhibit No. | Description | |
| 2.1 - | Agreement and Plan of Merger effective as of March 13, 2013, by and among Integrated Electrical Services, Inc., IES Subsidiary Holdings, Inc. and MISCOR Group, Ltd. (Attached as part of Annex A to the joint proxy statement/prospectus that is part of this Registration Statement) (the schedules and annexes have been omitted pursuant to Item 601(b)(2) of Regulation S-K) | |
| 2.2 - | First Amendment to Agreement and Plan of Merger, dated as of July 10, 2013, by and among Integrated Electrical Services, Inc., IES Subsidiary Holdings, Inc. and MISCOR Group, Ltd. (Attached as part of Annex A to the joint proxy statement/prospectus that is part of this Registration Statement) | |
| 2.3 - | Asset Purchase Agreement, dated February 8, 2013, by and among IES Renewable Energy, LLC, Residential Renewable Energy Technologies, Inc., Energy Efficiency Solar, Inc., and Lonestar Renewable Technologies Acquisition Corp. (Incorporated by reference to Exhibit 2.1 to the Company's Quarterly Report on Form 10-Q filed on February 14, 2013) (the schedules and annexes have been omitted pursuant to Item 601(b)(2) of Regulation S-K) | |
| 3.1 - | Second Amended and Restated Certificate of Incorporation of Integrated Electrical Services, Inc. (Incorporated by reference to Exhibit 4.1 to the Company's registration statement on Form S-8 filed on May 12, 2006) | |
| 3.2 - | Certificate of Designations of Series A Junior Participating Preferred Stock (Incorporated by reference to Exhibit 3.1 to the Company's Current Report on From 8-K filed on January 28, 2013) | |
| 3.3 - | Bylaws of Integrated Electrical Services, Inc. (Incorporated by reference to Exhibit 4.2 to the Company's registration statement on Form S-8, filed on May 12, 2006) | |
| 4.1 - | Specimen common stock certificate. (Incorporated by reference to Exhibit 4.1 to the Company's Current Report on Form 8-K filed June 18, 2008) | |
| 4.2 - | Tax Benefit Protection Plan Agreement by and between Integrated Electrical Services, Inc. and American Stock Transfer & Trust Company, LLC, as Rights Agent, dated as of January 28, 2013, including the forms of Certificate of Designation and of Rights Certificate and Summary of Stockholder Rights Plan attached thereto as Exhibits A, B and C, respectively (Incorporated by reference to Exhibit 4.1 to the Company's Current Report on Form 8-K filed on January 28, 2013) | |
77
| 4.3 - | Registration Rights Agreement, dated May 12, 2006, by and among Integrated Electrical Services, Inc., Tontine Capital Partners, L.P. and certain of its affiliates and Southpoint Master Fund, L.P. (Incorporated by reference to Exhibit 10.5 to the Company's Current Report on Form 8-K filed on May 17, 2006) | |
| 4.4 - | First Amendment to Registration Rights Agreement, dated September 11, 2007, by and among Integrated Electrical Services, Inc., Tontine Capital Partners, L.P. and certain of its affiliates. (Incorporated by reference to Exhibit 10.24 to the Company's Annual Report on Form 10-K filed on December 14, 2012) | |
| 10.1 - | Restated Underwriting, Continuing Indemnity and Security Agreement, dated May 12, 2006, by Integrated Electrical Services, Inc. and certain of its subsidiaries and affiliates in favor of Federal Insurance Company. (Incorporated by reference to Exhibit 10.4 to the Company's Current Report on Form 8-K filed May 17, 2006) | |
| 10.2 - | First Amendment, dated as of October 30, 2006, to the Restated Underwriting, Continuing Indemnity, and Security Agreement, dated May 12, 2006, by Integrated Electrical Services, Inc., certain of its subsidiaries and Federal Insurance Company and certain of its affiliates. (Incorporated by reference to Exhibit 10.1 to the Company's Current Report on Form 8-K filed November 6, 2006) | |
| 10.3 - | Third Amendment, dated May 1, 2007, to the Restated Underwriting, Continuing Indemnity and Security Agreement, dated May 12, 2006, by Integrated Electrical Services, Inc., certain of its subsidiaries and Federal Insurance Company and certain of its affiliates. (Incorporated by reference to Exhibit 10.1 to the Company's Current Report on Form 8-K filed October 12, 2007) | |
| 10.4 - | Fourth Amendment to the Restated Underwriting, Continuing Indemnity and Security Agreement, dated May 12, 2006, by Integrated Electrical Services, Inc., certain of its subsidiaries and Federal Insurance Company and certain of its affiliates. (Incorporated by reference to Exhibit 10.2 to the Company's Current Report on Form 8-K filed October 12, 2007) | |
| 10.5 - | Rider to Add Principal/Indemnitor and Fifth Amendment, dated September 29, 2008, to Restated Underwriting, Continuing Indemnity, and Security Agreement, dated May 12, 2006, by Integrated Electrical Services, Inc., certain of its subsidiaries and Federal Insurance Company and certain of its affiliates. (Incorporated by reference to Exhibit 10.1 to the Company's Current Report on Form 8-K filed October 24, 2008) | |
| 10.6 - | Agreement of Indemnity, dated May 7, 2010, by Integrated Electrical Services, Inc. and certain of its present and future subsidiaries and affiliates and Chartis Property Casualty Company, Chartis Insurance Company of Canada, American Home Assurance Company, Commerce and Industry Insurance Company, Granite State Insurance Company, Lexington Insurance Company, National Union Fire Insurance Company of Pittsburgh, Pa., New Hampshire Insurance Company and The Insurance Company of the State of Pennsylvania and any and all of their affiliates, subsidiaries, successors and assigns. (Incorporated by reference to Exhibit 10.1 to the Company's Current Report on Form 8-K filed May 13, 2010) | |
| 10.7 - | Amendment No. 1 to Agreement of Indemnity, dated August 16, 2012, between Integrated Electrical Services, Inc. and certain of its present and future subsidiaries and affiliates and Chartis Property Casualty Company, Chartis Insurance Company of Canada, American Home Assurance Company, Commerce and Industry Insurance Company, Granite State Insurance Company, Lexington Insurance Company, National Union Fire Insurance Company of Pittsburgh, Pa., New Hampshire Insurance Company and The Insurance Company of the State of Pennsylvania, and any and all of their affiliates, subsidiaries, successors and assigns (Incorporated by reference to Exhibit 10.1 to the Company's Current Report on Form 8-K filed August 17, 2012) | |
| 10.8 - | Credit and Security Agreement, dated August 9, 2012, by and among Integrated Electrical Services, Inc. and its subsidiaries and Wells Fargo Bank, National Association. (Incorporated by reference to Exhibit 10.1 to the Company's Quarterly Report on Form 10-Q filed August 13, 2012) | |
78
| 10.9 - | Joinder and First Amendment to Credit and Security Agreement, dated February 12, 2013, by and among Integrated Electrical Services, Inc. and its subsidiaries and Wells Fargo Bank, National Association. (Incorporated by reference to Exhibit 10.1 to the Company's Quarterly Report on Form 10-Q filed February 14, 2013) | |
| 10.10 - | Joinder and Second Amendment to Credit and Security Agreement, dated September 13, 2013, by and among Integrated Electrical Services, Inc. and its subsidiaries and Wells Fargo Bank, National Association. (Incorporated by reference to Exhibit 10.1 to the Company's Current Report on Form 8-K filed September 13, 2013) | |
| 10.11 - | Subcontract, dated June 17, 2009, by and between IES Commercial, Inc. and Manhattan Torcon A Joint Venture. (Incorporated by reference to Exhibit 10.1 to the Company's Current Report on Form 8-K filed November 24, 2009) | |
| 10.12 - | Letter Agreement, dated November 4, 2009, by and between Integrated Electrical Services, Inc., IES Commercial, Inc. and Manhattan Torcon A Joint Venture. (Incorporated by reference to Exhibit 10.2 to the Company's Current Report on Form 8-K filed November 24, 2009) | |
| *10.13 - | Term Life Insurance Plan. (Incorporated by reference to Exhibit 10.3 to the Company's Current Report on Form 8-K filed October 17, 2007) | |
| *10.14 - | Amended and Restated 2006 Equity Incentive Plan. (Incorporated by reference to Exhibit 10.1 to the Company's Current Report on Form 8-K filed October 17, 2007) | |
| *10.15 - | Form of Phantom Share Award under the 2006 Equity Incentive Plan. (Incorporated by reference to Exhibit 10.1 to the Company's Current Report on Form 8-K filed November 19, 2007) | |
| *10.16 - | Form of Stock Option Award Agreement under the 2006 Equity Incentive Plan. (Incorporated by reference to Exhibit 10.7 to the Company's Current Report on Form 8-K filed on May 17, 2006) | |
| *10.17 - | Amended and Restated Form of Restricted Stock Award Agreement under the 2006 Equity Incentive Plan. (Incorporated by reference to Exhibit 10.1 to the Company's Current Report on Form 8-K filed September 24, 2010) | |
| *10.18 - | Annual Management Incentive Plan. (Incorporated by reference to Exhibit 10.4 to the Current Report on Form 8-K filed November 19, 2007) | |
| *10.19 - | Amended and Restated 2009 Deferred Compensation Plan. (Incorporated by reference to Exhibit 10.34 to the Company's Annual Report on Form 10-K filed December 15, 2008) | |
| *10.20 - | Integrated Electrical Services, Inc. Long Term Incentive Plan, as amended and restated. (Incorporated by reference to Exhibit 10.2 to the Company's Current Report on Form 8-K filed September 23, 2009) | |
| *10.21 - | Integrated Electrical Services, Inc. Executive Severance Benefit Plan. (Incorporated by reference to Exhibit 10.1 to the Company's Current Report on Form 8-K filed January 27, 2012) | |
| 21.1 - | Subsidiaries of the Registrant(1) | |
| 23.1 - | Consent of Ernst & Young LLP(1) | |
| 31.1 - | Rule 13a-14(a)/15d-14(a) Certification of James M. Lindstrom, Chief Executive Officer(1) | |
| 31.2 - | Rule 13a-14(a)/15d-14(a) Certification of Robert W. Lewey, Chief Financial Officer(1) | |
| 32.1 - | Section 1350 Certification of James M. Lindstrom, Chief Executive Officer(1) | |
| 32.2 - | Section 1350 Certification of Robert W. Lewey, Chief Financial Officer(1) | |
| **101.INS | XBRL Instance Document | |
79
| **101.SCH | XBRL Schema Document | |
| **101.LAB | XBRL Label Linkbase Document | |
| **101.PRE | XBRL Presentation Linkbase Document | |
| **101.DEF | XBRL Definition Linkbase Document | |
| **101.CAL | XBRL Calculation Linkbase Document | |
| * | Management contracts or compensatory plans or arrangements required to be filed herewith pursuant to Item 15(a)(3) of this Annual Report on Form 10-K. |
| ** | Filed herewith |
(1) Filed herewith.
80
SIGNATURES
Pursuant to the requirements of Section 13 or 15(d) of the Securities Exchange Act of 1934, the Registrant has duly caused this report to be signed on its behalf by the undersigned, thereunto duly authorized on December 17, 2013.
INTEGRATED ELECTRICAL SERVICES, INC.
| By: | / S / JAMES M. LINDSTROM | |
James M. Lindstrom Chief Executive Officer and President |
POWER OF ATTORNEY
KNOW ALL MEN BY THESE PRESENTS, that each of the undersigned officers and directors of INTEGRATED ELECTRICAL SERVICES, INC. hereby constitutes and appoints James M. Lindstrom and Gail D. Makode, and each of them individually, as his true and lawful attorneys-in-fact and agents, with full power of substitution, for him and on his behalf and in his name, place and stead, in any and all capacities, to sign, execute and file any or all amendments to this report, with any and all exhibits thereto, and all other documents required to be filed therewith, with the Securities and Exchange Commission or any regulatory authority, granting unto each such attorney-in-fact and agent, full power and authority to do and perform each and every act and thing requisite and necessary to be done in and about the premises in order to effectuate the same, as fully to all intents and purposes as he himself might or could do, if personally present, hereby ratifying and confirming all that said attorneys-in-fact and agents, or either of them, or their or his substitutes or substitute, may lawfully do or cause to be done by virtue hereof.
SIGNATURES
Pursuant to the requirements of Section 13 or 15(d) of the Securities Exchange Act of 1934, the Registrant has duly caused this report to be signed on its behalf by the undersigned, thereunto duly authorized on December 17, 2013.
| Signature | Title | |
/s/ James M. Lindstrom | Chief Executive Officer, President and Chairman of the Board | |
| James M. Lindstrom | ||
/s/ Robert W. Lewey | Senior Vice President and Chief Financial Officer (Principal Financial Officer) | |
| Robert W. Lewey | ||
/s/ Joseph L. Dowling III | Director | |
| Joseph L. Dowling III | ||
/s/ David B. Gendell | Director | |
| David B. Gendell | ||
/s/ Joe D. Koshkin | Director | |
| Joe D. Koshkin | ||
/s/ Donald L. Luke | Director | |
| Donald L. Luke | ||
81