UNITED STATES SECURITIES AND EXCHANGE COMMISSION
WASHINGTON, D.C. 20549
FORM 10-Q
(Mark One)
QUARTERLY REPORT PURSUANT TO SECTION 13 OR 15(d) OF THE SECURITIES EXCHANGE ACT OF 1934
For the quarterly period ended September 30, 2016
OR |
TRANSITION REPORT PURSUANT TO SECTION 13 OR 15(d) OF THE SECURITIES EXCHANGE ACT OF 1934 |
For the transition period from ____ to ____ |
Commission file number 001-00035  GENERAL ELECTRIC COMPANY (Exact name of registrant as specified in its charter) |
New York | 14-0689340 | |
(State or other jurisdiction of incorporation or organization) | (I.R.S. Employer Identification No.) | |
| ||
41 Farnsworth Street, Boston, MA | 02210 | |
(Address of principal executive offices) | (Zip Code) | |
| ||
(Registrant's telephone number, including area code) (617) 443-3000
_______________________________________________ (Former name, former address and former fiscal year, if changed since last report) | ||
Indicate by check mark whether the registrant (1) has filed all reports required to be filed by Section 13 or 15(d) of the Securities Exchange Act of 1934 during the preceding 12 months (or for such shorter period that the registrant was required to file such reports), and (2) has been subject to such filing requirements for the past 90 days. Yes No
Indicate by check mark whether the registrant has submitted electronically and posted on its corporate Web site, if any, every Interactive Data File required to be submitted and posted pursuant to Rule 405 of Regulation S-T (§232.405 of this chapter) during the preceding 12 months (or for such shorter period that the registrant was required to submit and post such files). Yes No
Indicate by check mark whether the registrant is a large accelerated filer, an accelerated filer, a non-accelerated filer, or a smaller reporting company. See the definitions of "large accelerated filer," "accelerated filer" and "smaller reporting company" in Rule 12b-2 of the Exchange Act. (Check one):
Large accelerated filer
| Accelerated filer
|
Non-accelerated filer
| Smaller reporting company
|
Indicate by check mark whether the registrant is a shell company (as defined in Rule 12b-2 of the Exchange Act). Yes No
There were 8,846,390,000 shares of common stock with a par value of $0.06 per share outstanding at September 30, 2016.
TABLE OF CONTENTS
Page | |
Forward Looking Statements | 3 |
Management's Discussion and Analysis of Financial Condition and Results of Operations (MD&A) | 4 |
Key Performance Indicators | 8 |
Consolidated Results | 11 |
Segment Operations | 15 |
Corporate Items and Eliminations | 34 |
Discontinued Operations | 37 |
Other Consolidated Information | 38 |
Statement of Financial Position | 40 |
Financial Resources and Liquidity | 41 |
Exposures | 47 |
Critical Accounting Estimates | 48 |
Other Items | 49 |
Supplemental Information | 51 |
Controls and Procedures | 58 |
Other Financial Data | 58 |
Regulations and Supervision | 59 |
Legal Proceedings | 60 |
Financial Statements and Notes | 63 |
Exhibits | 123 |
Form 10-Q Cross Reference Index | 124 |
Signatures | 125 |
FORWARD LOOKING STATEMENTS
This document contains "forward-looking statements" – that is, statements related to future, not past, events. In this context, forward-looking statements often address our expected future business and financial performance and financial condition, and often contain words such as "expect," "anticipate," "intend," "plan," "believe," "seek," "see," "will," "would," or "target."
Forward-looking statements by their nature address matters that are, to different degrees, uncertain, such as statements about our announced plan to combine our Oil & Gas business with Baker Hughes, including projected revenue and cost synergies, impact on our earnings per share, and the timing and structure of the proposed transaction; our announced plan to reduce the size of our financial services businesses, including expected cash and non-cash charges associated with this plan and earnings per share of GE Capital's retained businesses (Verticals); expected income; earnings per share; revenues; organic growth; growth and productivity associated with our Digital business; margins; cost structure; restructuring charges; transaction-related synergies; cash flows; returns on capital and investment; capital expenditures, capital allocation or capital structure; and dividends.
For us, particular uncertainties that could cause our actual results to be materially different than those expressed in our forward-looking statements include:
| our ability to complete incremental asset sales as part of our announced plan to reduce the size of our financial services businesses in a timely manner (or at all) and at the prices we have assumed; |
| our ability to reduce costs as we execute that plan; |
| changes in law, economic and financial conditions, including interest and exchange rate volatility, commodity and equity prices and the value of financial assets, including the impact of these conditions on our ability to execute that plan; |
| the impact of conditions in the financial and credit markets on the availability and cost of GE Capital Global Holdings, LLC's (GE Capital) funding, and GE Capital's exposure to counterparties; |
| the impact of conditions in the housing market and unemployment rates on the level of commercial credit defaults; |
| pending and future mortgage loan repurchase claims and other litigation claims and investigations in connection with WMC, which may affect our estimates of liability, including possible loss estimates; |
| our ability to maintain our current credit rating and the impact on our funding costs and competitive position if we do not do so; |
| the amount and timing of our cash flows and earnings and other conditions, which may affect our ability to pay our quarterly dividend at the planned level or to repurchase shares at planned levels; |
| GE Capital's ability to pay dividends to GE at the planned level, which may be affected by GE Capital's cash flows and earnings, financial services regulation and oversight, and other factors; |
| our ability to convert pre-order commitments/wins into orders/bookings; |
| the price we realize on orders/bookings since commitments/wins are stated at list prices; |
| customer actions or developments such as early aircraft retirements or reduced energy demand, changes in economic conditions, including oil prices, and other factors that may affect the level of demand and financial performance of the major industries and customers we serve; |
| the effectiveness of our risk management framework; |
| the impact of regulation and regulatory, investigative and legal proceedings and legal compliance risks, including the impact of financial services regulation and litigation; |
| our capital allocation plans, as such plans may change including with respect to the timing and size of share repurchases, acquisitions, joint ventures, dispositions and other strategic actions; |
| our success in completing, including obtaining regulatory approvals and satisfying other closing conditions for, announced transactions, such as our announced plans and transactions to combine our Oil & Gas business with Baker Hughes and reduce the size of our financial services businesses; |
| our success in integrating acquired businesses and operating joint ventures, including Alstom and Baker Hughes; |
| our ability to realize anticipated earnings and savings from announced transactions, acquired businesses and joint ventures, including Alstom and Baker Hughes; |
| the impact of potential information technology or data security breaches; and |
| the other factors that are described in "Risk Factors" in our Annual Report on Form 10-K for the year ended December 31, 2015. |
These or other uncertainties may cause our actual future results to be materially different than those expressed in our forward-looking statements. We do not undertake to update our forward-looking statements. This document includes certain forward-looking projected financial information that is based on current estimates and forecasts. Actual results could differ materially .
2016 3Q FORM 10-Q 3
MANAGEMENT'S DISCUSSION AND ANALYSIS OF FINANCIAL CONDITION AND RESULTS OF OPERATIONS (MD&A)
PRESENTATION
The consolidated financial statements of General Electric Company (the Company) combine the industrial manufacturing and services businesses of General Electric Company (GE) with the financial services businesses of GE Capital Global Holdings, LLC, and its predecessor, General Electric Capital Corporation (GE Capital or Financial Services).
We believe that investors will gain a better understanding of our company if they understand how we measure and talk about our results. Because of the diversity in our businesses, we present our financial statements in a three-column format, which allows investors to see our industrial operations separately from our Financial Services operations. We believe that this, along with further disaggregation of our results into segments and GE Capital Verticals, provides useful information to investors. When used in this report, unless otherwise indicated by the context, we use the terms to mean the following:
| General Electric or the Company – the parent company, General Electric Company. |
| GE – the adding together of all affiliates except GE Capital, whose continuing operations are presented on a one-line basis, giving effect to the elimination of transactions among such affiliates. Transactions between GE and GE Capital have not been eliminated at the GE level. We present the results of GE in the center column of our consolidated statements of earnings, financial position and cash flows. An example of a GE metric is GE cash from operating activities (GE CFOA). |
| General Electric Capital Corporation or GECC – the predecessor to GE Capital Global Holdings, LLC. |
| GE Capital Global Holdings, LLC or GECGH – the adding together of all affiliates of GECGH, giving effect to the elimination of transactions among such affiliates. |
| GE Capital or Financial Services – refers to GECGH, or its predecessor GECC, and is the adding together of all affiliates of GE Capital giving effect to the elimination of transactions among such affiliates. We present the results of GE Capital in the right-side column of our consolidated statements of earnings, financial position and cash flows. |
| GE consolidated – the adding together of GE and GE Capital, giving effect to the elimination of transactions between the two. We present the results of GE consolidated in the left-side column of our consolidated statements of earnings, financial position and cash flows. |
| Industrial – GE excluding the continuing operations of GE Capital. We believe that this provides investors with a view as to the results of our industrial businesses and corporate items. An example of an Industrial metric is Industrial CFOA (Non-GAAP), which is GE CFOA excluding the effects of dividends from GE Capital. |
| Industrial segment – the sum of our seven industrial reporting segments, without giving effect to the elimination of transactions among such segments and between these segments and our Financial Services segment. This provides investors with a view as to the results of our industrial segments, without inter-segment eliminations and corporate items. An example of an industrial segment metric is industrial segment revenue growth. |
| Total segment – the sum of our seven industrial segments and one financial services segment, without giving effect to the elimination of transactions among such segments. This provides investors with a view as to the results of all of our segments, without inter-segment eliminations and corporate items. |
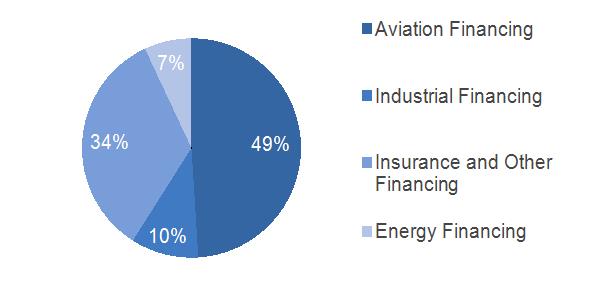
| Verticals or GE Capital Verticals – the adding together of GE Capital businesses that we expect to retain, principally its vertical financing businesses-GE Capital Aviation Services (GECAS), Energy Financial Services (EFS) and Industrial Finance (which includes Healthcare Equipment Finance, Working Capital Solutions and Industrial Financing Solutions)-that relate to the Company's core industrial domain and other operations, including our run-off insurance activities, and allocated corporate costs. |
We integrate acquisitions as quickly as possible. Revenues and earnings from the date we complete the acquisition through the end of the fourth quarter following the acquisition are considered the acquisition effect of such businesses.
2016 3Q FORM 10-Q 4
Discussion of GE Capital's total assets includes deferred income tax liabilities, which are presented within assets for purposes of our consolidated statement of financial position presentations for this filing.
Amounts reported in billions in graphs within this report are computed based on the amounts in millions. As a result, the sum of the components reported in billions may not equal the total amount reported in billions due to rounding. Certain columns and rows within the tables may not add due to the use of rounded numbers. Percentages presented are calculated from the underlying numbers in millions.
Discussions throughout this MD&A are based on continuing operations unless otherwise noted.
The MD&A should be read in conjunction with the Financial Statements and Notes to the consolidated financial statements.
OTHER TERMS USED BY GE
| Backlog – unfilled customer orders for products and product services (expected life of contract sales for product services). |
| Continuing earnings – unless otherwise indicated, we refer to captions such as "earnings from continuing operations attributable to GE common shareowners" as continuing earnings or simply as earnings. |
| Continuing earnings per share (EPS) – unless otherwise indicated, when we refer to continuing earnings per share, it is the diluted per-share amount of "earnings from continuing operations attributable to GE common shareowners". |
| Digital revenues – revenues related to software-enabled product upgrades, internally developed software (including Predix) and associated hardware, and software-enabled productivity solutions. These revenues are largely generated from our operating businesses and are included in their segment results. |
| Ending Net Investment (ENI) (Non-GAAP) – the total capital we have invested in the Financial Services business. It is the sum of short-term borrowings, long-term borrowings and equity (excluding noncontrolling interests) adjusted for unrealized gains and losses on investment securities and hedging instruments. Alternatively, it is the amount of assets of continuing operations less the amount of non-interest-bearing liabilities. |
| Equipment leased to others (ELTO) – rental equipment we own that is available to rent and is stated at cost less accumulated depreciation. |
| GE Capital Exit Plan – our plan, announced on April 10, 2015, to reduce the size of our financial services businesses through the sale of most of the assets of GE Capital, and to focus on continued investment and growth in our industrial businesses. |
| Industrial margin – GE revenues and other income excluding GE Capital earnings (loss) from continuing operations (Industrial revenues) minus GE total costs and expenses less GE interest and other financial charges divided by Industrial revenues. |
| Industrial operating profit margin (Non-GAAP) – Industrial segment profit plus corporate items and eliminations (excluding gains, restructuring, and pre-tax non-operating pension costs) divided by industrial segment revenues plus corporate items and eliminations (excluding gains and GE-GE Capital eliminations). |
| Net earnings – unless otherwise indicated, we refer to captions such as "net earnings attributable to GE common shareowners" as net earnings. |
| Net earnings per share (EPS) – unless otherwise indicated, when we refer to net earnings per share, it is the diluted per-share amount of "net earnings attributable to GE common shareowners". |
| Non-operating pension costs (Non-GAAP) – comprise the expected return on plan assets, interest cost on benefit obligations and net actuarial gain (loss) amortization for our principal pension plans. |
| Operating earnings (Non-GAAP) – GE earnings from continuing operations attributable to GE common shareowners excluding the impact of non-operating pension costs. |
| Operating earnings per share (Non-GAAP) – unless otherwise indicated, when we refer to operating earnings per share, it is the diluted per-share amount of "operating earnings". |
| Operating pension costs (Non-GAAP) – comprise the service cost of benefits earned, prior service cost amortization and curtailment gain or loss for our principal pension plans. |
| Organic revenues (Non-GAAP) – revenues excluding the effects of acquisitions, dispositions and foreign currency exchange. |
2016 3Q FORM 10-Q 5
| Product services – for purposes of the financial statement display of sales and costs of sales in our Statement of Earnings, "goods" is required by SEC regulations to include all sales of tangible products, and "services" must include all other sales, including other services activities. In our MD&A section of this report, we refer to sales under product services agreements and sales of both goods (such as spare parts and equipment upgrades) and related services (such as monitoring, maintenance and repairs) as sales of "product services," which is an important part of our operations. We refer to "product services" simply as "services" within the MD&A. |
| Product services agreements – contractual commitments, with multiple-year terms, to provide specified services for products in our Power, Renewable Energy, Oil & Gas, Aviation and Transportation installed base – for example, monitoring, maintenance, service and spare parts for a gas turbine/generator set installed in a customer's power plant. |
| Revenues – unless otherwise indicated, we refer to captions such as "revenues and other income" simply as revenues. |
| Segment profit – refers to the operating profit of the industrial segments and the net earnings of the Financial Services segment. See the Segment Operations section within the MD&A for a description of the basis for segment profits. |
NON-GAAP FINANCIAL MEASURES
In the accompanying analysis of financial information, we sometimes use information derived from consolidated financial data but not presented in our financial statements prepared in accordance with U.S. generally accepted accounting principles (GAAP). Certain of these data are considered "non-GAAP financial measures" under the SEC rules. Specifically, we have referred, in various sections of this report, to:
| Industrial segment organic revenues |
| Operating and non-operating pension costs |
| Adjusted corporate costs (operating) |
| Industrial operating and GE Capital earnings (loss) from continuing operations and EPS |
| Industrial operating + Verticals earnings and EPS |
| Industrial operating profit and operating profit margin (excluding certain items) |
| Industrial segment operating profit and operating profit margin (excluding Alstom) |
| Industrial cash flows from operating activities (Industrial CFOA) and Industrial CFOA excluding taxes related to the Appliances business sale |
| Capital ending net investment (ENI), excluding liquidity |
The reasons we use these non-GAAP financial measures and the reconciliations to their most directly comparable GAAP financial measures are included in the Supplemental Information section within this MD&A. Non-GAAP financial measures referred to in this report are either labeled as "non-GAAP" or designated as such with an asterisk (*).
2016 3Q FORM 10-Q 6
OUR OPERATING SEGMENTS
We are a global digital industrial company, transforming industry with software-defined machines and solutions that are connected, responsive and predictive, with products and services ranging from aircraft engines, locomotives, power generation and oil and gas production equipment to medical imaging, financing and industrial products. Operational and financial overviews for our operating segments are provided in the "Segment Operations" section within this MD&A.
OUR INDUSTRIAL OPERATING SEGMENTS
 | Power |  | Transportation |  | Energy Connections & Lighting (a) |
 | Renewable Energy |  | Aviation | ||
 | Oil & Gas |  | Healthcare |
OUR FINANCIAL SERVICES OPERATING SEGMENT
 | Capital |
(a) | Beginning in the third quarter of 2016, the former Energy Connections and Appliances & Lighting segments are presented as one reporting segment called Energy Connections & Lighting. This segment includes the historical results of the Appliances business prior to its sale. |
CORPORATE INFORMATION
GE's Internet address a t www.ge.com , Investor Relations website at www.ge.com/investor-relations and our corporate blog at www.gereports.com , as well as GE's Facebook page and Twitter accounts, including @GE_Reports, contain a significant amount of information about GE, including financial and other information for investors. GE encourages investors to visit these websites from time to time, as information is updated and new information is posted.
2016 3Q FORM 10-Q 7
KEY PERFORMANCE INDICATORS
(Dollars in billions; per-share amounts in dollars)
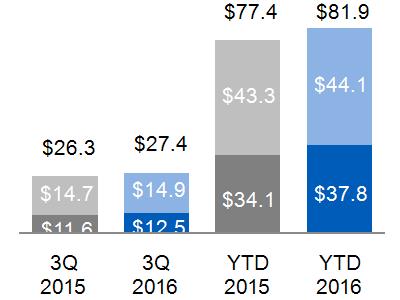
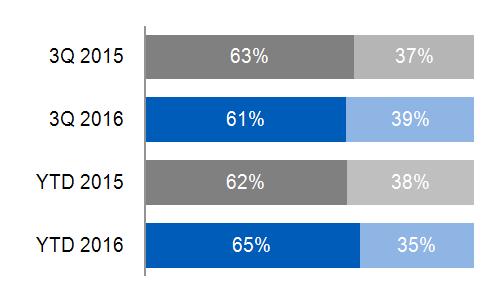
REVENUES PERFORMANCE |
INDUSTRIAL ORDERS |
INDUSTRIAL BACKLOG | |||||||
3Q 2016 | YTD 2016 | 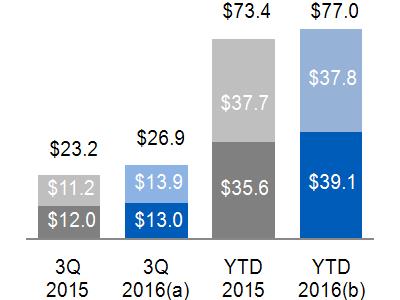
|
Equipment
Services
| 
|
Equipment
Services
| ||||
Industrial Segment | 4% | 6% | |||||||
Industrial Segment Organic* | 1% | -% | |||||||
Capital | (2)% | -% | |||||||
(a) Included $5.2 billion related to Alstom (b) Included $12.7 billion related to Alstom | (a) Included $31.9 billion related to Alstom
| ||||||||
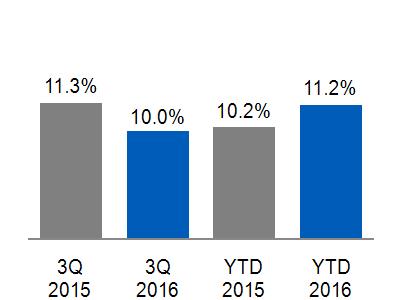
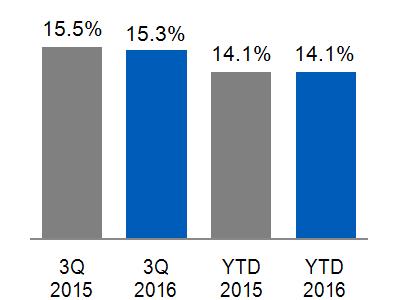
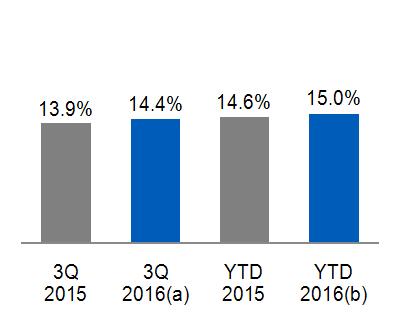
INDUSTRIAL MARGINS |
INDUSTRIAL OPERATING PROFIT MARGINS (NON-GAAP) (a) |
GE CFOA | |||||||
|
|
 |
GE Capital Dividend
Industrial CFOA(b)* | ||||||
(a) Excluded gains, non-operating pension costs, restructuring and other, noncontrolling interests, GE Capital preferred stock dividends, as well as the results of Alstom | (a) Included $(0.8) billion related to Alstom (b) 2016 included deal taxes of $(1.1) billion related to the sale of our Appliances business | ||||||||
* Non-GAAP Financial Measure
2016 3Q FORM 10-Q 8
KEY PERFORMANCE INDICATORS
(Dollars in billions; per-share amounts in dollars)
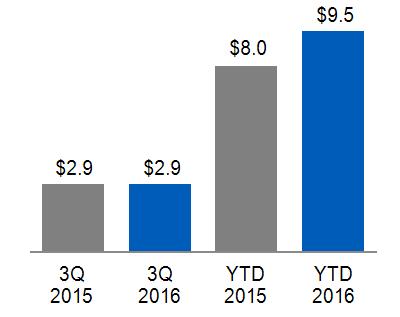
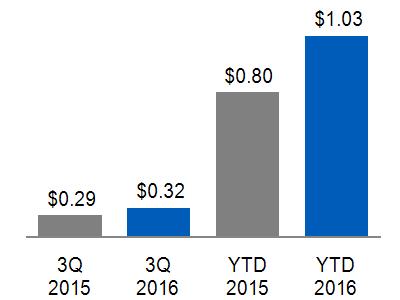
NET EARNINGS (LOSS) | NET EARNINGS (LOSS) PER SHARE | |
|
| |
OPERATING EARNINGS (NON-GAAP) | OPERATING EARNINGS PER SHARE (NON-GAAP) | |
| 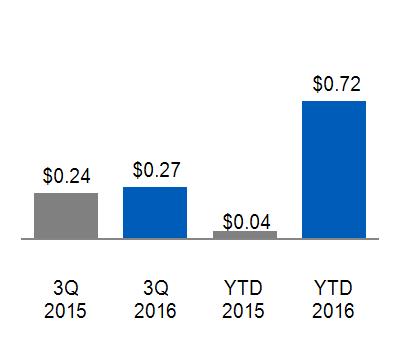 | |
INDUSTRIAL OPERATING + VERTICALS EARNINGS (NON-GAAP) | INDUSTRIAL OPERATING + VERTICALS EPS (NON-GAAP) | |
|
 |
2016 3Q FORM 10-Q 9
SIGNIFICANT DEVELOPMENTS IN 2016 | |
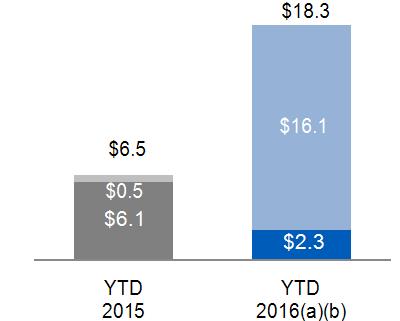
| During the first nine months of 2016, we returned $24.5 billion to shareholders including $18.1 billion through buyback of our common stock and $6.4 billion in dividends.
For the nine months ended September 30, 2016, Alstom contributed revenues of $9.2 billion and operating earnings of $0.5 billion, which included the effects of purchase accounting and acquisition related charges at Corporate of $0.7 billion. Including the effects of tax benefits of $0.6 billion, net earnings were less than $0.1 billion for the nine months ended September 30, 2016. In addition, Alstom used cash flow from operating activities of $0.8 billion for the nine months ended September 30, 2016.
|
 | On October 31, 2016, we announced an agreement with Baker Hughes Incorporated (Baker Hughes) to combine GE's Oil & Gas business and Baker Hughes to create a new company. The transaction will be executed using a partnership structure, pursuant to which GE Oil & Gas and Baker Hughes will each contribute their operating assets to a newly formed partnership. GE will have a 62.5% interest in this partnership and existing Baker Hughes shareholders will have a 37.5% interest through a newly NYSE listed corporation. Baker Hughes shareholders will also receive a special one-time cash dividend of $17.50 per share at closing. GE will contribute $7.4 billon to the new partnership to fund the cash dividend to existing Baker Hughes shareholders. The transaction is subject to the approval of Baker Hughes shareholders, regulatory approvals and other customary closing conditions.
|
| | On October 11, 2016, we announced a plan to acquire LM Wind Power, the Danish maker of rotor blades for $1.7 billion. LM Wind is one of the world's largest wind turbine blade manufacturers (a) .
|
On September 14, 2016, we acquired the remaining 74% of the software developer Meridium Inc. for cash proceeds of $0.4 billion. The acquisition is expected to enhance and accelerate our asset performance-management capabilities across our Industrial businesses.
| |
 | On September 6, 2016, we announced public tender offers to acquire two European 3-D printing companies, Arcam AB and SLM Solutions Group AG for a total of $1.4 billion. On October 26, 2016, we announced that the conditions for the acquisition of SLM Solutions were not satisfied at the expiration of the tender period and that the offer to acquire SLM Solutions had lapsed. On October 27, 2016, we announced that the tender period for Arcam would be extended to November 10, 2016. On October 27, 2016, we also announced an agreement to acquire a 75% interest in Concept Laser GmbH, another European 3-D printing company, for $0.6 billion (a) . Both Arcam and Concept Laser make machines that can print metal parts used in aircraft components, tapping into manufacturers' growing demand for digital technologies.
|
 | On June 6, 2016, we completed the sale of our Appliances business to Qingdao Haier Co., Ltd. (Haier) for proceeds of $5.6 billion (including $0.8 billion from the sale of receivables originated in our Appliances business and sold from GE Capital to Haier) and recognized an after-tax gain of $1.9 billion in the nine months ended September 30, 2016.
On March 30, 2016, we announced an agreement to sell GE Asset Management (GEAM), GE's asset management arm with assets under management of approximately $100 billion, to State Street Corporation. On July 1, 2016, we completed the sale for proceeds of $0.4 billion and recognized an after-tax gain of $0.3 billion. |
|
| As of September 30, 2016, we have signed agreements with buyers for $193 billion of GE Capital ending net investment (ENI), excluding liquidity (as originally reported at December 31, 2014), of which $173 billion have closed.
On June 28, 2016, we received approval of our request to the Financial Stability Oversight Council (FSOC) for rescission of GE Capital's designation as a nonbank Systemically Important Financial Institution (SIFI).
GE Capital paid common dividends of $5.1 billion and $16.1 billion for the three and nine months ended September 30, 2016, respectively. In October 2016, we received an additional $2.0 billion of common dividends from GE Capital bringing our year-to-date total to $18.1 billion.
(a) Subject to customary closing conditions. |
2016 3Q FORM 10-Q 10
CONSOLIDATED RESULTS
THREE AND NINE MONTHS ENDED SEPTEMBER 30
(Dollars in billions)
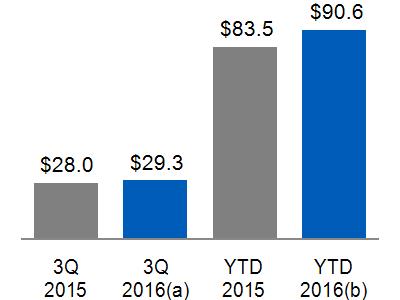
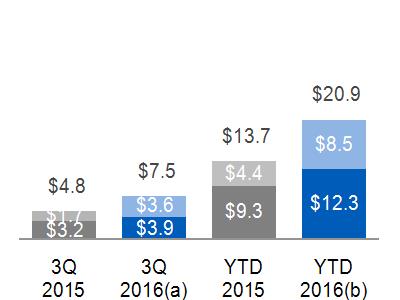
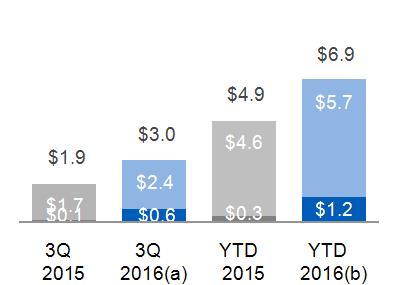
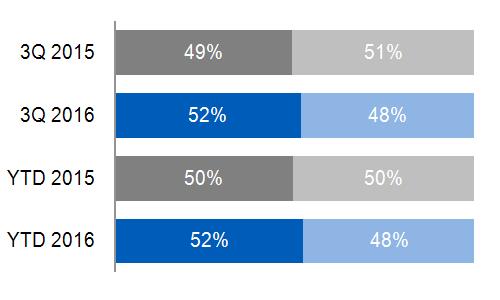
REVENUES |
INDUSTRIAL AND FINANCIAL SERVICES REVENUES | ||||||
 |  |
 | |||||
(a) Included $3.2 billion related to Alstom (b) Included $9.2 billion related to Alstom | (a) Included $3.2 billion related to Alstom (b) Included $9.2 billion related to Alstom | ||||||
COMMENTARY: 2016 - 2015 | |||||||
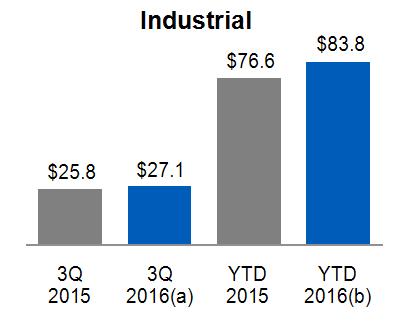
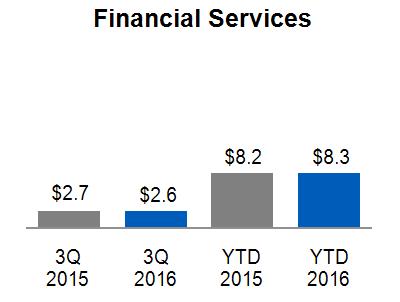
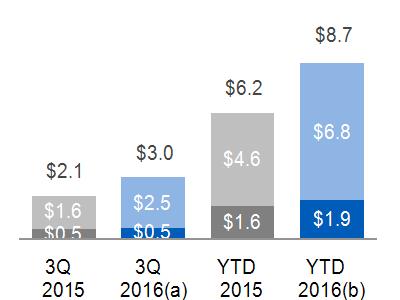
THREE MONTHS Consolidated revenues increased $1.2 billion, or 4%. Industrial revenues increased $1.3 billion, or 5%, mainly from the effects of acquisitions of $3.3 billion, primarily Alstom, and an increase in Industrial organic revenue* of $0.1 billion. These increases were partially offset by the effects of dispositions of $2.0 billion, primarily from the sale of our Appliances business to Haier in the second quarter of 2016. In 2015, the effects of acquisitions and dispositions on Industrial revenues were an insignificant amount and a decrease of $0.1 billion, respectively. Financial Services revenues decreased $0.1 billion, or 2%, as a result of the effects of dispositions and organic revenue declines, partially offset by higher gains and lower impairments.
|
NINE MONTHS Consolidated revenues increased $7.1 billion, or 9%. Industrial revenues increased $7.2 billion, or 9%, mainly from the effects of acquisitions of $9.3 billion, primarily Alstom. The increase was partially offset by the effects of dispositions of $0.9 billion, primarily from the sale of our Appliances business to Haier in the second quarter of 2016, the effects of a stronger U.S. dollar of $0.7 billion and a decrease in Industrial organic revenue* of $0.5 billion. In 2015, the effects of acquisitions and dispositions on Industrial revenues were an increase of $0.2 billion and a decrease of $0.1 billion, respectively. Financial Services revenues increased less than $0.1 billion, primarily due to lower impairments, higher gains and the effects of acquisitions, partially offset by the effects of dispositions, organic revenue declines and the effects of currency exchange.
| ||||||
* Non-GAAP Financial Measure
2016 3Q FORM 10-Q 11
THREE AND NINE MONTHS ENDED SEPTEMBER 30
(Dollars in billions)
CONTINUING EARNINGS (LOSS) |
CONTINUING EARNINGS (LOSS) PER SHARE | INDUSTRIAL SELLING, GENERAL & ADMINISTRATIVE (SG&A) AS A % OF SALES | ||||
|
|
 (a) 14.3% excluding $3.3 billion of Alstom sales and $0.5 billion of Alstom SG&A* (b) 15.0% excluding $9.3 billion of Alstom sales and $1.6 billion of Alstom SG&A* | ||||
COMMENTARY: 2016 - 2015 | ||||||
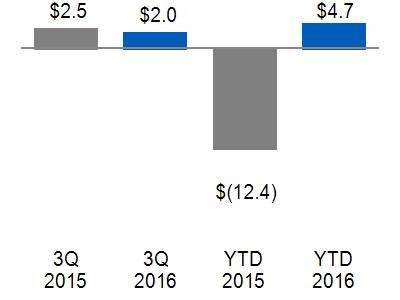
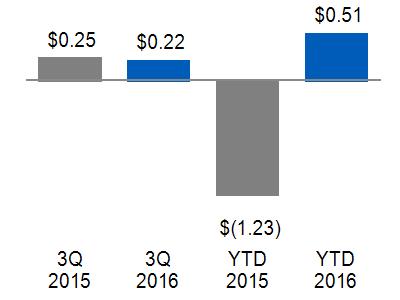
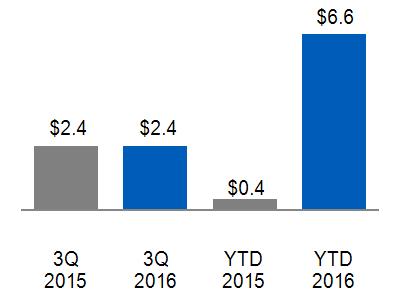
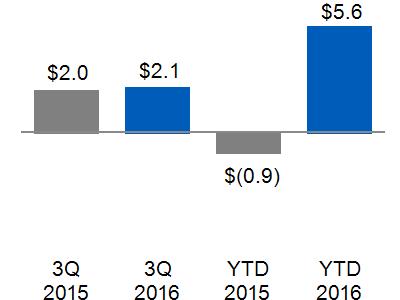
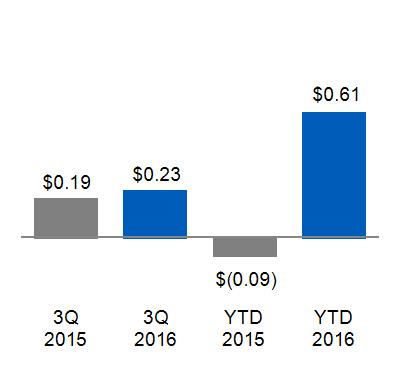
THREE MONTHS Consolidated continuing earnings increased $0.1 billion, or 7%. Financial Services net loss decreased $0.2 billion, primarily due to lower impairments and higher gains, partially offset by the effects of dispositions and core decreases. Core decreases reflect excess interest expense, higher restructuring expenses and higher insurance reserve provisions, partially offset by increased tax benefits resulting from an IRS tax settlement and tax adjustments in the three months ended September 30, 2016, to bring Capital's nine-month tax rate in line with the projected full-year tax rate. The effects of acquisitions on consolidated continuing earnings were a decrease of $0.1 billion in 2016 and an insignificant amount in 2015. The net effects of dispositions on consolidated continuing earnings were decreases of $0.1 billion in 2016 and an increase of $0.1 billion in 2015. Earnings per share amounts for the third quarter of 2016 were positively impacted by the reduction in number of outstanding common shares compared to the third quarter of 2015. The average number of shares outstanding used to calculate third quarter 2016 earnings per share amounts was 11% lower than in the third quarter of 2015 as a result of previously disclosed actions, primarily the 2015 Synchrony Financial share exchange and ongoing share buyback activities over the last 12 months funded in large part by dividends from GE Capital. Industrial SG&A costs increased $0.3 billion as the favorable impact of cost reductions at Corporate, lower SG&A relating to dispositions and non-operating pension costs were more than offset by increases in SG&A relating to Alstom and higher restructuring charges. | NINE MONTHS Consolidated continuing earnings increased $6.5 billion. Financial Services losses decreased $4.9 billion, or 77%, primarily due to the absence of the 2015 charges associated with the GE Capital Exit Plan. The net effects of dispositions on consolidated continuing earnings were increases of $1.8 billion in 2016, primarily due to an after-tax gain of $1.9 billion from the sale of our Appliances business to Haier, and $0.3 billion in 2015. The effects of acquisitions on consolidated continuing earnings were a decrease of $0.2 billion in 2016 and an increase of $0.1 billion in 2015. In addition to the effects on net earnings described above, earnings per share amounts for the first nine months of 2016 were also positively impacted by the reduction in number of outstanding common shares compared to the first nine months of 2015. The average number of shares outstanding used to calculate first nine-month 2016 earnings per share amounts was 9% lower than in the first nine-month of 2015 as a result of previously disclosed actions, primarily the 2015 Synchrony Financial share exchange and ongoing share buyback activities over the last 12 months funded in large part by dividends from GE Capital. Industrial SG&A costs increased $1.1 billion as the favorable impact of cost reductions at Corporate and lower SG&A relating to dispositions and non-operating pension costs were more than offset by increases in SG&A relating to Alstom and higher restructuring charges.
| |||||
See the "Other Consolidated Information" section within the MD&A for a discussion of income taxes.
*Non-GAAP Financial Measure
2016 3Q FORM 10-Q 12
GE CAPITAL
GE Capital results include continuing operations, which are reported in the Capital segment (see Segment discussion), and discontinued operations (see Discontinued Operations section and Note 2).
THE GE CAPITAL EXIT PLAN
On April 10, 2015, the Company announced a plan (the GE Capital Exit Plan) to create a simple, more valuable company by reducing the size of its financial services businesses through the sale of most of the assets of GE Capital over the following 24 months and aligning a smaller GE Capital with GE's industrial businesses.
Under the GE Capital Exit Plan, which was approved on April 2, 2015 and aspects of which were approved on March 31, 2015, the Company is retaining certain GE Capital businesses, principally its vertical financing businesses-GE Capital Aviation Services (GECAS), Energy Financial Services (EFS) and Industrial Finance (which includes Healthcare Equipment Finance, Working Capital Solutions and Industrial Financing Solutions)-that relate to the Company's core industrial domain and other operations, including our run-off insurance activities, and allocated corporate costs (together referred to as GE Capital Verticals or Verticals).
We expect GE Capital to release approximately $35 billion in dividends to GE (subject to regulatory approval) as a result of the sale of GE Capital assets. We received $4.3 billion in dividends from GE Capital in 2015 and $16.1 billion in the first nine months of 2016. In October 2016, we received and additional $2.0 billion of common dividends from GE Capital bringing our year-to-date total to $18.1 billion. As of September 30, 2016, we are ahead of our plan, having signed agreements with buyers for $193 billion of ending net investment (ENI), excluding liquidity (as originally reported at December 31, 2014), of which $173 billion has closed. In addition, as part of our initiative to reduce the size of our financial services businesses, we completed the split-off of our remaining interest in GE Capital's North American Retail Finance business, Synchrony Financial, to holders of GE common stock, which resulted in a $20.4 billion buyback of GE common stock (671.4 million shares) in 2015. In connection with the GE Capital Exit Plan, we completed a legal reorganization of GE Capital that included a merger of GE Capital into GE, a guarantee by GE of GE Capital debt, and an exchange of $36 billion of GE Capital debt for new notes guaranteed by GE. The result of all these actions reduced GE Capital's total assets by 59% from $501 billion at December 31, 2014 to $203 billion at September 30, 2016. As of September 30, 2016, we incurred charges of $22.9 billion. Due to anticipated tax benefits and gains, we do not expect total after-tax charges through the completion of the GE Capital Exit Plan to exceed our initial $23 billion estimate.
Given the progress of the GE Capital Exit Plan to date, we expect to largely complete that plan by the end of 2016. On March 31, 2016, GE filed its request to the Financial Stability Oversight Council (FSOC) for rescission of GE Capital's designation as a nonbank Systemically Important Financial Institution (SIFI). On June 28, 2016, we received approval of our request to the FSOC for rescission of GE Capital's designation as a nonbank SIFI.
SALES AGREEMENTS
During the nine months ended September 30, 2016, GE signed agreements to sell approximately $36 billion of ENI, excluding liquidity (as originally reported at December 31, 2014), of which approximately $16 billion, $20 billion and less than $1 billion related to our Commercial Lending and Leasing (CLL), Consumer and Real Estate businesses, respectively.
Of the signed agreements, sales representing approximately $69 billion of ENI, excluding liquidity (as originally reported at December 31, 2014) have closed during the first nine months of 2016, including approximately $60 billion, $9 billion and less than $1 billion related to our CLL, Consumer and Real Estate businesses, respectively.
2016 3Q FORM 10-Q 13
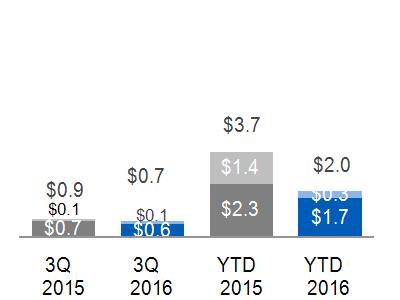
AFTER-TAX CHARGES RELATED TO THE GE CAPITAL EXIT PLAN
In the nine months ended September 30, 2016, GE recorded $0.9 billion of after-tax charges related to the GE Capital Exit Plan of which $0.1 billion was recorded in continuing operations and $0.8 billion was recorded in discontinued operations. Of these after-tax charges, $0.3 billion of net benefits were recorded in the third quarter of 2016 . A description of these after-tax charges for the nine months ended September 30, 2016 is provided below.
| $1.3 billion of net loss primarily related to the completed and planned dispositions of Consumer and most of the CLL businesses, which was recorded in discontinued operations under the caption "Earnings (loss) from discontinued operations, net of taxes" in the Statement of Earnings. |
| $0.3 billion of charges associated with the preferred equity exchange that was completed in January 2016, which was recorded in continuing operations and reported in GE Capital's corporate component under the caption "Preferred stock dividends" in the Statement of Earnings. |
| These charges were partially offset by tax benefits of $0.6 billion related to an IRS tax settlement. Of these benefits $0.3 billion was recorded in continuing operations and reported in GE Capital's corporate component under the captions "Benefit (provision) for income taxes" and "Interest and other financial charges" in the Statement of Earnings and $0.2 billion was recorded in discontinued operations under the caption "Earnings (loss) from discontinued operations, net of taxes" in the Statement of Earnings. |
For additional information about the GE Capital Exit Plan 2015 sales agreements and after-tax charges, refer to our Form 8-K filed on June 3, 2016 related to the Annual Report on Form 10-K for the year ended December 31, 2015.
In addition to the above charges, during the nine months ended September 30, 2016, we have incurred other costs related to our ongoing liability management actions, including $0.6 billion of pre-tax losses related to the repurchase of $12.5 billion of long-term unsecured debt and subordinated debentures which were recorded in continuing operations. These charges will result in lower future interest costs, more than offsetting the initial charges. We expect to continue these actions when economically beneficial.
2016 3Q FORM 10-Q 14
SEGMENT OPERATIONS
SUMMARY OF OPERATING SEGMENTS | |||||||||||||||||
Three months ended September 30 | Nine months ended September 30 | ||||||||||||||||
(In millions) | 2016 | 2015 | V% | 2016 | 2015 | V% | |||||||||||
Revenues | |||||||||||||||||
Power | $ | 6,506 | $ | 4,738 | 37 % | $ | 18,348 | $ | 14,405 | 27 % | |||||||
Renewable Energy | 2,770 | 1,666 | 66 % | 6,533 | 4,335 | 51 % | |||||||||||
Oil & Gas | 2,964 | 3,938 | (25)% | 9,497 | 12,096 | (21)% | |||||||||||
Aviation | 6,300 | 6,001 | 5 % | 19,074 | 17,927 | 6 % | |||||||||||
Healthcare | 4,482 | 4,255 | 5 % | 13,190 | 12,666 | 4 % | |||||||||||
Transportation | 1,249 | 1,593 | (22)% | 3,471 | 4,322 | (20)% | |||||||||||
Energy Connections & Lighting(a) | 3,151 | 4,065 | (22)% | 11,808 | 11,695 | 1 % | |||||||||||
Total industrial segment revenues | 27,421 | 26,256 | 4 % | 81,920 | 77,445 | 6 % | |||||||||||
Capital | 2,600 | 2,660 | (2)% | 8,256 | 8,215 | - % | |||||||||||
Total segment revenues | 30,021 | 28,916 | 4 % | 90,176 | 85,660 | 5 % | |||||||||||
Corporate items and eliminations | (755) | (888) | 429 | (2,166) | |||||||||||||
Consolidated revenues | $ | 29,266 | $ | 28,028 | 4 % | $ | 90,604 | $ | 83,494 | 9 % | |||||||
Segment profit (loss) | |||||||||||||||||
Power | $ | 1,197 | $ | 1,071 | 12 % | $ | 2,910 | $ | 2,874 | 1 % | |||||||
Renewable Energy | 202 | 174 | 16 % | 413 | 375 | 10 % | |||||||||||
Oil & Gas | 353 | 610 | (42)% | 981 | 1,712 | (43)% | |||||||||||
Aviation | 1,494 | 1,353 | 10 % | 4,366 | 3,936 | 11 % | |||||||||||
Healthcare | 717 | 652 | 10 % | 2,130 | 1,944 | 10 % | |||||||||||
Transportation | 309 | 379 | (18)% | 747 | 934 | (20)% | |||||||||||
Energy Connections & Lighting(a) | 48 | 292 | (84)% | 209 | 669 | (69)% | |||||||||||
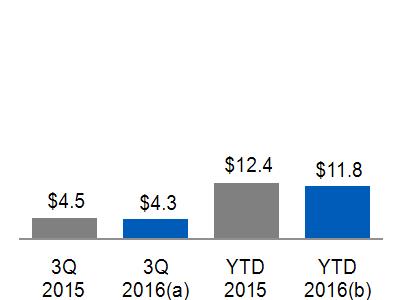
Total industrial segment profit | 4,320 | 4,530 | (5)% | 11,756 | 12,445 | (6)% | |||||||||||
Capital | 26 | (154) | F | (1,466) | (6,368) | 77 % | |||||||||||
Total segment profit (loss) | 4,345 | 4,376 | (1)% | 10,290 | 6,076 | 69 % | |||||||||||
Corporate items and eliminations | (1,524) | (1,559) | (2,120) | (4,436) | |||||||||||||
GE interest and other financial charges | (483) | (440) | (1,490) | (1,243) | |||||||||||||
GE provision for income taxes | (241) | (413) | (1,034) | (1,302) | |||||||||||||
Earnings (loss) from continuing operations | |||||||||||||||||
attributable to GE common shareowners | 2,097 | 1,965 | 7 % | 5,645 | (904) | F | |||||||||||
Earnings (loss) from discontinued operations, net of tax | (105) | 629 | U | (954) | (11,253) | 92 % | |||||||||||
Less net earnings attributable to noncontrolling | |||||||||||||||||
interests, discontinued operations | (2) | 89 | U | 2 | 270 | (99)% | |||||||||||
Earnings (loss) from discontinued operations, | |||||||||||||||||
net of tax and noncontrolling interest | (103) | 541 | U | (956) | (11,523) | 92 % | |||||||||||
Consolidated net earnings (loss) | |||||||||||||||||
attributable to the GE common shareowners | $ | 1,994 | $ | 2,506 | (20)% | $ | 4,689 | $ | (12,427) | F | |||||||
\ | \ | ||||||||||||||||
| (a) | Beginning in the third quarter of 2016, the former Energy Connections and Appliances & Lighting segments are presented as one reporting segment called Energy Connections & Lighting. This segment includes the historical results of the Appliances business prior to its sale in June 2016. |
2016 3Q FORM 10-Q 15
REVENUES AND PROFIT
Segment revenues include revenues and other income related to the segment.
Segment profit is determined based on internal performance measures used by the Chief Executive Officer (CEO) to assess the performance of each business in a given period. In connection with that assessment, the CEO may exclude matters such as charges for restructuring; rationalization and other similar expenses; acquisition costs and other related charges; technology and product development costs; certain gains and losses from acquisitions or dispositions; and litigation settlements or other charges, for which responsibility preceded the current management team. For additional information about costs excluded from segment profit, see Corporate Items and Eliminations section within this MD&A.
Segment profit excludes results reported as discontinued operations and material accounting changes. Segment profit also excludes the portion of earnings or loss attributable to noncontrolling interests of consolidated subsidiaries, and as such only includes the portion of earnings or loss attributable to our share of the consolidated earnings or loss of consolidated subsidiaries.
Segment profit excludes or includes interest and other financial charges and income taxes according to how a particular segment's management is measured:
| Interest and other financial charges, income taxes and GE preferred stock dividends are excluded in determining segment profit (which we sometimes refer to as "operating profit") for the industrial segments. |
| Interest and other financial charges, income taxes and GE Capital preferred stock dividends are included in determining segment profit (which we sometimes refer to as "net earnings") for the Capital segment. |
Certain corporate costs, such as shared services, employee benefits and information technology are allocated to our segments based on usage. A portion of the remaining corporate costs is allocated based on each segment's relative net cost of operations.
With respect to the segment revenue and profit walks, the overall effect of foreign exchange is included within multiple captions as follows:
| The translational foreign exchange impact is included within Foreign Exchange. |
| The transactional impact of foreign exchange hedging is included in operating cost within Productivity and in other income within Other. |
SEGMENT RESULTS – THREE AND NINE MONTHS ENDED SEPTEMBER 30, 2016
(Dollars in billions)
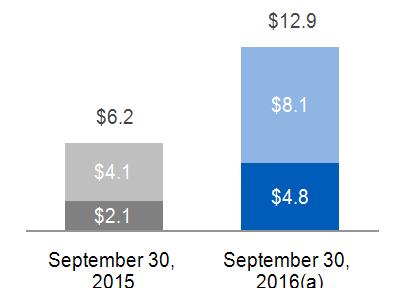
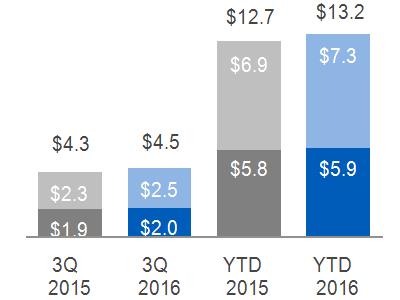
INDUSTRIAL SEGMENT EQUIPMENT & SERVICES REVENUES |
INDUSTRIAL SEGMENT PROFIT | |||
 |
Equipment(a)
Services(b)
| 
| ||
(a) $12.9 billion, excluding $2.0 billion related to Alstom*, and $38.4 billion, excluding $5.7 billion related to Alstom* for the three and nine months ended September 30, 2016, respectively (b) $11.3 billion, excluding $1.2 billion related to Alstom*, and $34.3 billion, excluding $3.5 billion related to Alstom* for the three and nine months ended September 30, 2016, respectively *Non-GAAP Financial Measure
| (a) $4.2 billion, excluding $0.1 billion related to Alstom* (b) $11.5 billion, excluding $0.3 billion related to Alstom* | |||
2016 3Q FORM 10-Q 16
2016 – 2015 COMMENTARY: THREE MONTHS ENDED SEPTEMBER 30 | ||
Industrial segment revenues increased $1.2 billion (4%), driven by increases at Power and Renewable Energy, mainly as a result of the effects of acquisitions (primarily Alstom). This increase was partially offset by lower revenues at Oil & Gas and Energy Connections & Lighting (due to the sale of the Appliances business in the second quarter of 2016). Industrial segment profit decreased $0.2 billion (5%), mainly driven by lower earnings at Oil & Gas, as well as an unfavorable impact of foreign exchange, partially offset by higher earnings at Power, Aviation and Healthcare. Industrial segment margin decreased 150 bps primarily driven by the effects of Alstom results. Excluding Alstom, industrial segment margin was 17.3%*, compared with 17.3%* in the same period of 2015.
| ||
2016 – 2015 COMMENTARY: NINE MONTHS ENDED SEPTEMBER 30 | ||
Industrial segment revenues increased $4.5 billion (6%), driven by increases at Power and Renewable Energy, mainly as a result of the effects of acquisitions (primarily Alstom). This increase was partially offset by lower revenues at Oil & Gas, as well as an unfavorable impact of foreign exchange. Industrial segment profit decreased $0.6 billion (6%), mainly driven by lower earnings at Oil & Gas, Energy Connections & Lighting and Transportation, as well as an unfavorable impact of foreign exchange, partially offset by higher earnings at Aviation and Healthcare. Industrial segment margin decreased 170 bps primarily driven by the effects of Alstom results. Excluding Alstom, industrial segment margin was 15.8%*, compared with 16.1%* in the same period of 2015 reflecting core decreases at Renewable Energy, Energy Connections & Lighting and Oil & Gas.
| ||
SIGNIFICANT SEGMENT DEVELOPMENTS
ALSTOM ACQUISITION
On November 2, 2015, we completed the acquisition of Alstom's Thermal, Renewables and Grid businesses. The completion of the transaction followed the regulatory approval of the deal in over 20 countries and regions including the EU, U.S., China, India, Japan and Brazil. The cash purchase price was €9.2 billion (approximately $10.1 billion), net of cash acquired. The acquisition and alliances with Alstom affected our Power, Energy Connections & Lighting and Renewable Energy segments, and to a lesser extent our Oil & Gas segment.
At year-end 2015, our preliminary allocation of purchase price resulted in recognition of approximately $13.5 billion of goodwill, $5.2 billion of intangible assets, and $1.1 billion of unfavorable customer contract liabilities. The preliminary fair value of the associated noncontrolling interest was approximately $3.6 billion. As of the end of the third quarter of 2016, the preliminary amount of goodwill, intangible assets and unfavorable customer contract liabilities recognized was adjusted to approximately $17.2 billion, $4.4 billion, and $2.4 billion, respectively. The adjustments reflected revisions in estimates primarily related to cash flow and other valuation assumptions for customer contracts, increases to legal reserves, and other fair value adjustments related to acquired assets and liabilities. Deferred taxes, unrecognized tax benefits and other tax uncertainties were also adjusted. We will finalize our purchase accounting analysis in the fourth quarter. See Note 7 to the consolidated financial statements for further information.
For the nine months ended September 30, 2016, Alstom contributed revenues of $9.2 billion and an operating loss of $0.5 billion, which included the effects of purchase accounting and acquisition related charges at Corporate of $0.7 billion. Including the effects of tax benefits of $0.6 billion, net earnings were less than $0.1 billion for the nine months ended September 30, 2016. In addition, Alstom used cash flow from operating activities of $0.8 billion for the nine months ended September 30, 2016. Alstom related revenues and operating profit are presented separately in the segment revenues and profit walks that follow.
SALE OF APPLIANCES
On January 15, 2016, we announced the signing of an agreement to sell our Appliances business to Qingdao Haier Co., Ltd. (Haier). On June 6, 2016, we completed the sale for proceeds of $5.6 billion (including $0.8 billion from the sale of receivables originated in our Appliances business and sold from GE Capital to Haier) and recognized an after-tax gain of $1.9 billion in the nine months ended September 30, 2016. Beginning in the third quarter of 2016, the former Energy Connections and Appliances & Lighting segments are presented as one reporting segment called Energy Connections & Lighting. This segment includes the historical results of the Appliances business prior to its sale.
*Non-GAAP Financial Measure
2016 3Q FORM 10-Q 17
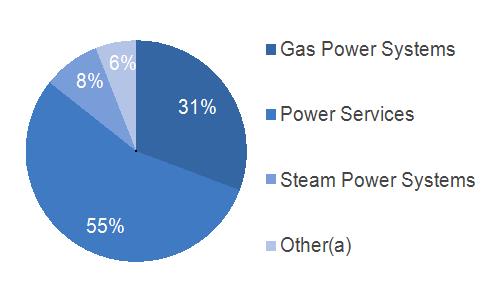
 POWER
POWER OPERATIONAL OVERVIEW - THREE AND NINE MONTHS ENDED SEPTEMBER 30
(Dollars in billions)
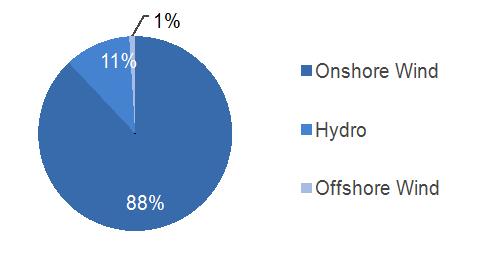
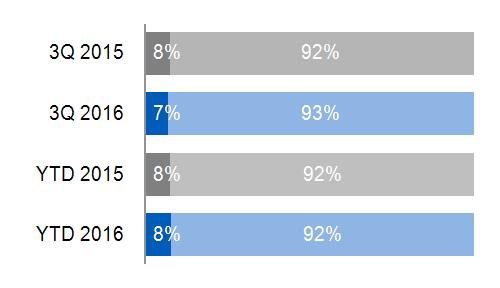
2016 YTD SUB-SEGMENT REVENUES | EQUIPMENT/SERVICES REVENUES | |||
|  | |||
(a) Includes Water & Distributed Power and GE Hitachi Nuclear | Services Equipment | |||
ORDERS |
BACKLOG | |||
|
Equipment
Services
| 
|
Equipment
Services
| |
(a) Included $2.8 billion related to Alstom (b) Included $7.1 billion related to Alstom
| (a) Included $17.7 billion related to Alstom | |||
UNIT SALES | ||||
 | ||||
2016 3Q FORM 10-Q 18
FINANCIAL OVERVIEW - THREE AND NINE MONTHS ENDED SEPTEMBER 30
(Dollars in billions)
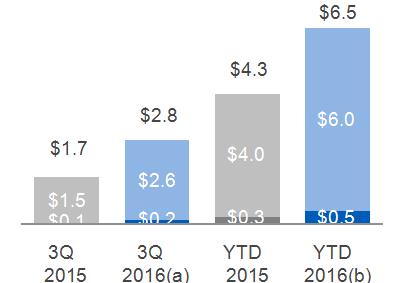
SEGMENT REVENUES 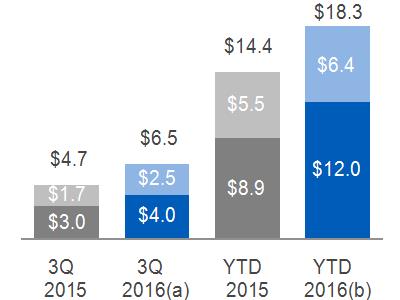
(a) $5.1 billion, excluding $1.4 billion related to Alstom* (b) $14.0 billion, excluding $4.3 billion related to Alstom*
| SEGMENT PROFIT 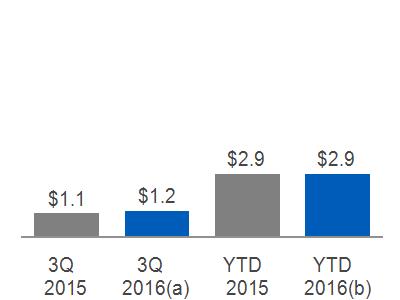
(a) $1.1 billion, excluding $0.1 billion related to Alstom* (b) $2.7 billion, excluding $0.2 billion related to Alstom* | SEGMENT PROFIT MARGIN 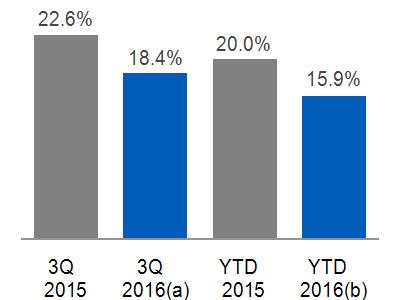
(a) 21.9%, excluding 6.3% related to Alstom* (b) 19.3%, excluding 4.8% related to Alstom* | |||||||||
Equipment
Services | |||||||||||
SEGMENT REVENUES & PROFIT WALK: | COMMENTARY: 2016 - 2015 | ||||||||||
THREE MONTHS | Segment revenues up $1.8 billion (37%); Segment profit up $0.1 billion (12%) as a result of:
The increase in revenues was primarily driven by the effects of Alstom. Revenues also increased due to higher equipment volume and prices at Gas Power Systems as a result of 14 more gas turbine shipments than in the prior year, as well as higher services volume at Power Services, partially offset by lower services volume at Water and Nuclear. The increase in revenues was partially offset by lower other income. The increase in profit was primarily driven by the effects of Alstom, higher volume, prices and cost productivity, partially offset by an unfavorable business mix, driven by 7 more H-Turbine shipments than in the prior year, and lower other income.
| ||||||||||
Revenues | Profit | ||||||||||
September 30, 2015 | $ | 4.7 | $ | 1.1 | |||||||
Volume | 0.3 | 0.1 | |||||||||
Price | 0.1 | 0.1 | |||||||||
Foreign Exchange | - | - | |||||||||
(Inflation)/Deflation | N/A | - | |||||||||
Mix | N/A | (0.1) | |||||||||
Productivity | N/A | 0.1 | |||||||||
Other | (0.1) | (0.1) | |||||||||
Alstom | 1.4 | 0.1 | |||||||||
September 30, 2016 | $ | 6.5 | $ | 1.2 | |||||||
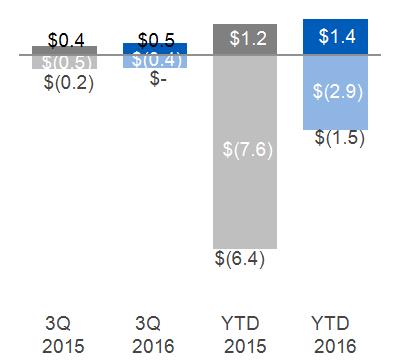
NINE MONTHS | Segment revenues up $3.9 billion (27%); Segment profit up 1% as a result of:
The increase in revenues was primarily driven by the effects of Alstom and increased services volume at Power Services, partially offset by lower equipment volume at Gas Power Systems as a result of 10 fewer gas turbine shipments than in the prior year. The increase was partially offset by lower other income, including negative foreign exchange transactional hedge impacts, as well as the effects of a stronger U.S. dollar. The increase in profit was primarily driven by the effects of Alstom, higher prices, material deflation and a favorable business mix. The increase was partially offset by lower other income, including negative foreign exchange transactional hedge impacts and lower cost productivity.
| ||||||||||
Revenues | Profit | ||||||||||
September 30, 2015 | $ | 14.4 | $ | 2.9 | |||||||
Volume | (0.1) | - | |||||||||
Price | 0.1 | 0.1 | |||||||||
Foreign Exchange | (0.1) | - | |||||||||
(Inflation)/Deflation | N/A | 0.1 | |||||||||
Mix | N/A | 0.1 | |||||||||
Productivity | N/A | (0.1) | |||||||||
Other | (0.2) | (0.3) | |||||||||
Alstom | 4.3 | 0.2 | |||||||||
September 30, 2016 | $ | 18.3 | $ | 2.9 | |||||||
*Non-GAAP Financial Measure
2016 3Q FORM 10-Q 19
 RENEWABLE ENERGY
 OPERATIONAL OVERVIEW - THREE AND NINE MONTHS ENDED SEPTEMBER 30
(Dollars in billions)
2016 YTD SUB-SEGMENT REVENUES | EQUIPMENT/SERVICES REVENUES | |||||||
 |  | |||||||
Services Equipment
| ||||||||
ORDERS |
BACKLOG | |||||||
|
Equipment
Services
|  |
Equipment
Services
| |||||
(a) Included $1.0 billion related to Alstom (b) Included $1.5 billion related to Alstom
| (a) Included $5.7 billion related to Alstom | |||||||
UNIT SALES | ||||||||
 | ||||||||
2016 3Q FORM 10-Q 20
FINANCIAL OVERVIEW - THREE AND NINE MONTHS ENDED SEPTEMBER 30
(Dollars in billions)
SEGMENT REVENUES | SEGMENT PROFIT | SEGMENT PROFIT MARGIN | ||||||||
(a) $2.4 billion, excluding $0.4 billion related to Alstom* (b) $5.6 billion, excluding $0.9 billion related to Alstom*
|
Equipment
Services | 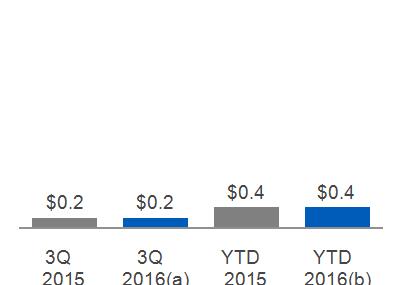
(a) $0.2 billion, excluding an insignificant amount related to Alstom* (b) $0.4 billion, excluding an insignificant amount related to Alstom*
| 
(a) 8.9%, excluding (3.1)% related to Alstom* (b) 7.6%, excluding (2.1)% related to Alstom*
| |||||||
SEGMENT REVENUES & PROFIT WALK: | COMMENTARY: 2016 - 2015 | |||||||||
THREE MONTHS | Segment revenues up $1.1 billion (66%); Segment profit up 16% as a result of:
The increase in revenues was primarily due to higher volume, mainly driven by higher equipment sales in Onshore Wind as a result of shipping 235 more onshore wind turbines than in the prior year, as well as the effects of Alstom, partially offset by lower other income, including negative foreign exchange transactional hedge impacts. The increase in profit was mainly due to higher volume and material deflation, partially offset by lower other income, including negative foreign exchange transactional hedge impacts.
| |||||||||
Revenues | Profit | |||||||||
September 30, 2015 | $ | 1.7 | $ | 0.2 | ||||||
Volume | 0.8 | 0.1 | ||||||||
Price | - | - | ||||||||
Foreign Exchange | - | - | ||||||||
(Inflation)/Deflation | N/A | 0.1 | ||||||||
Mix | N/A | - | ||||||||
Productivity | N/A | - | ||||||||
Other | (0.1) | (0.1) | ||||||||
Alstom | 0.4 | - | ||||||||
September 30, 2016 | $ | 2.8 | $ | 0.2 | ||||||
NINE MONTHS | Segment revenues up $2.2 billion (51%); Segment profit up 10% as a result of:
The increase in revenues was primarily due to higher volume, mainly driven by the increase in Onshore Wind turbine shipments, as a result of shipping 429 more units than in the prior year, and the effects of Alstom. The increase was partially offset by the effects of a stronger U.S. dollar and lower other income, including negative foreign exchange transactional hedge impacts. The increase in profit was primarily due to higher volume, material deflation and cost productivity, partially offset by an unfavorable business mix and lower other income, including negative foreign exchange transactional hedge impacts.
| |||||||||
Revenues | Profit | |||||||||
September 30, 2015 | $ | 4.3 | $ | 0.4 | ||||||
Volume | 1.6 | 0.1 | ||||||||
Price | - | - | ||||||||
Foreign Exchange | (0.1) | - | ||||||||
(Inflation)/Deflation | N/A | 0.1 | ||||||||
Mix | N/A | (0.1) | ||||||||
Productivity | N/A | 0.1 | ||||||||
Other | (0.1) | (0.1) | ||||||||
Alstom | 0.9 | - | ||||||||
September 30, 2016 | $ | 6.5 | $ | 0.4 | ||||||
*Non-GAAP Financial Measure
2016 3Q FORM 10-Q 21
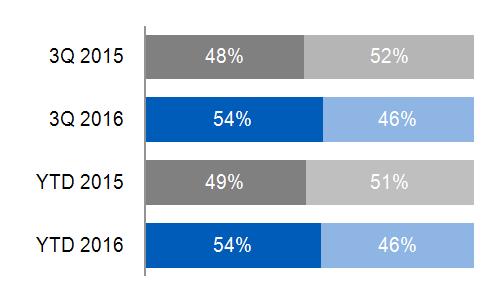
OIL & GAS OPERATIONAL OVERVIEW - THREE AND NINE MONTHS ENDED SEPTEMBER 30
(Dollars in billions)
2016 YTD SUB-SEGMENT REVENUES | EQUIPMENT/SERVICES REVENUES | |||
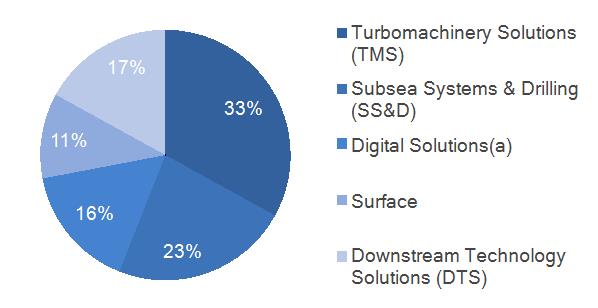 |  | |||
(a ) Previously referred to as Measurement & Controls (M&C)
|
Services Equipment
| |||
ORDERS |
BACKLOG | |||
|
Equipment
Services | 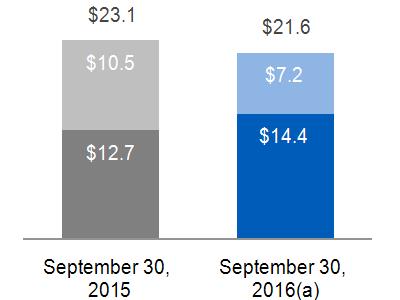
|
Equipment
Services
| |
(a) Included an insignificant amount related to Alstom (b) Included $0.1 billion related to Alstom
| (a) Included $0.2 billion related to Alstom | |||
2016 3Q FORM 10-Q 22
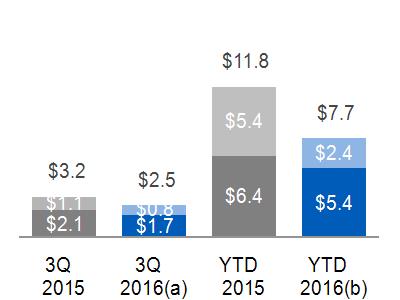
FINANCIAL OVERVIEW - THREE AND NINE MONTHS ENDED SEPTEMBER 30
(Dollars in billions)
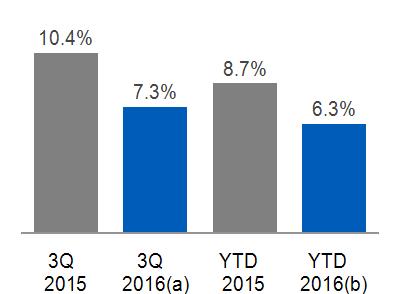
SEGMENT REVENUES | SEGMENT PROFIT | SEGMENT PROFIT MARGIN | |||||||||
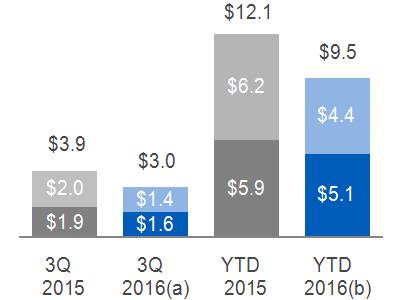
(a) $2.9 billion, excluding an insignificant amount related to Alstom* (b) $9.4 billion, excluding $0.1 billion related to Alstom* |
Equipment
Services | 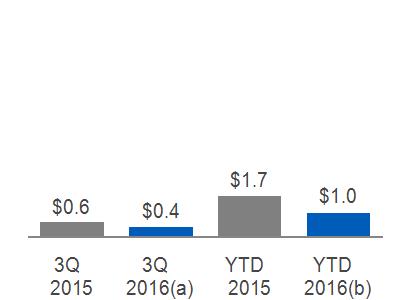
(a) $0.4 billion, excluding an insignificant amount related to Alstom* (b) $1.0 billion, excluding an insignificant amount related to Alstom*
| 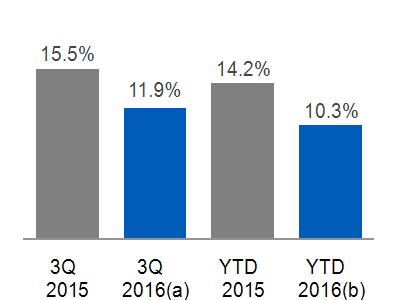
(a) 11.9%, excluding 5.9% related to Alstom* (b) 10.4%, excluding 3.8% related to Alstom* | ||||||||
SEGMENT REVENUES & PROFIT WALK: | COMMENTARY: 2016 - 2015 | ||||||||||
THREE MONTHS | Segment revenues down $1.0 billion (25%); Segment profit down $0.3 billion (42%) as a result of:
The decrease in revenues was primarily driven by market conditions resulting in a decrease in equipment and services volume across all sub-segments, with the exception of increased equipment volume at DTS. Revenues also decreased due to lower prices at TMS and DTS, as well as lower other income, including negative foreign exchange transactional hedge impacts. The decrease in profit was also driven by negative market conditions, mainly due to lower volume and prices, which, despite the effects of restructuring actions, drove lower cost productivity. Profit also decreased due to lower other income, including negative foreign exchange transactional hedge impacts. These decreases were partially offset by material deflation.
| ||||||||||
Revenues | Profit | ||||||||||
September 30, 2015 | $ | 3.9 | $ | 0.6 | |||||||
Volume | (0.8) | (0.1) | |||||||||
Price | (0.1) | (0.1) | |||||||||
Foreign Exchange | - | - | |||||||||
(Inflation)/Deflation | N/A | 0.1 | |||||||||
Mix | N/A | - | |||||||||
Productivity | N/A | (0.1) | |||||||||
Other | (0.1) | (0.1) | |||||||||
Alstom | - | - | |||||||||
September 30, 2016 | $ | 3.0 | $ | 0.4 | |||||||
NINE MONTHS | Segment revenues down $2.6 billion (21%); Segment profit down $0.7 billion (43%) as a result of:
The decrease in revenues was primarily due to lower equipment volume across all sub-segments, the effects of a stronger U.S. dollar, lower prices and lower other income, partially offset by the effects of Alstom. The decrease in profit was primarily market driven, mainly due to lower equipment volume and prices, which, despite the effects of restructuring actions, drove lower cost productivity. These decreases were partially offset by material deflation and lower other income, including negative foreign exchange transactional hedge impacts.
| ||||||||||
Revenues | Profit | ||||||||||
September 30, 2015 | $ | 12.1 | $ | 1.7 | |||||||
Volume | (2.2) | (0.3) | |||||||||
Price | (0.2) | (0.2) | |||||||||
Foreign Exchange | (0.3) | - | |||||||||
(Inflation)/Deflation | N/A | 0.2 | |||||||||
Mix | N/A | - | |||||||||
Productivity | N/A | (0.4) | |||||||||
Other | (0.1) | - | |||||||||
Alstom | 0.1 | - | |||||||||
September 30, 2016 | $ | 9.5 | $ | 1.0 | |||||||
*Non-GAAP Financial Measure
2016 3Q FORM 10-Q 23
AVIATION OPERATIONAL OVERVIEW - THREE AND NINE MONTHS ENDED SEPTEMBER 30
(Dollars in billions; except where noted)
2016 YTD SUB-SEGMENT REVENUES | EQUIPMENT/SERVICES REVENUES | |||
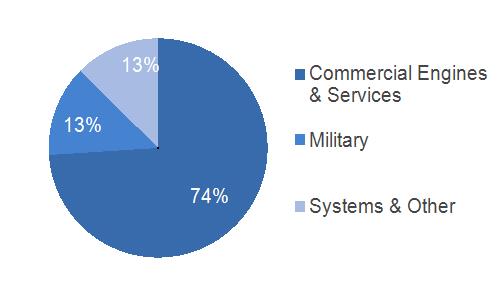 | 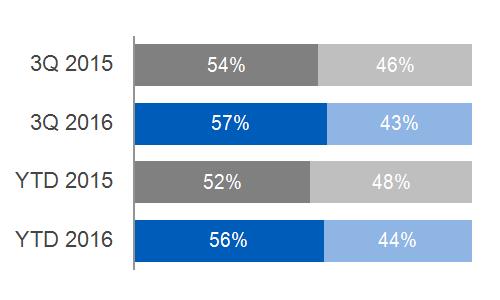 | |||
Services Equipment
| ||||
ORDERS |
BACKLOG | |||
|
Equipment
Services
|  |
Equipment
Services
| |
UNIT SALES | ||||
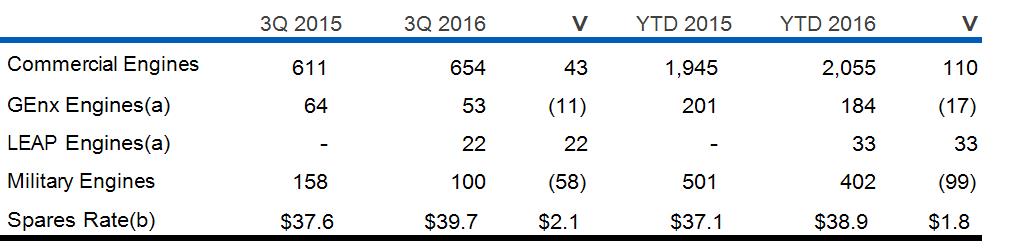 (a) GEnx and LEAP engines are a subset of commercial engines (b) Commercial spares shipment rate in millions of dollars per day | ||||
2016 3Q FORM 10-Q 24
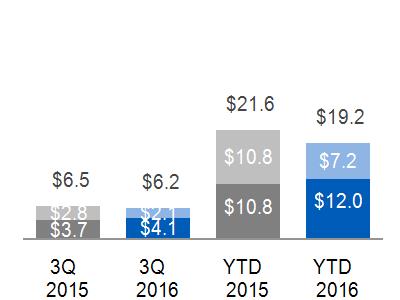
FINANCIAL OVERVIEW - THREE AND NINE MONTHS ENDED SEPTEMBER 30
(Dollars in billions)
SEGMENT REVENUES | SEGMENT PROFIT | SEGMENT PROFIT MARGIN | ||
 |
Equipment
Services
| 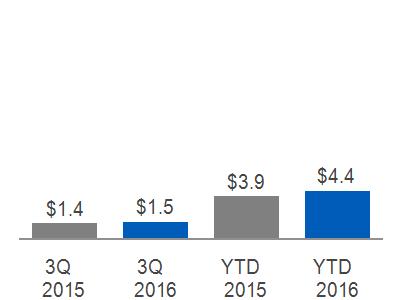 | 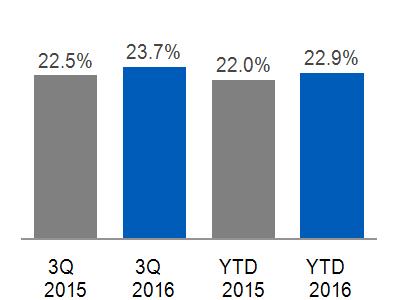 |
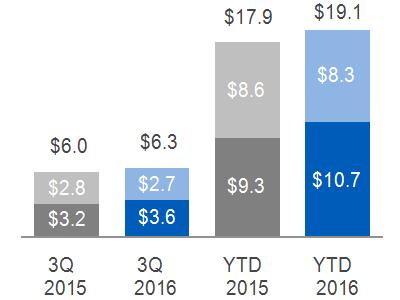
SEGMENT REVENUES & PROFIT WALK: | COMMENTARY: 2016 - 2015 | |||||
THREE MONTHS | Segment revenues up $0.3 billion (5%); Segment profit up $0.1 billion (10%) as a result of:
The increase in revenues was primarily due to higher services volume, partially offset by lower equipment volume driven by lower GEnx shipments and Military, despite an increase in Commercial Engines driven by LEAP engine shipments. The increase in profit was primarily due to higher services volume and higher cost productivity, partially offset by the effects of inflation.
| |||||
Revenues | Profit | |||||
September 30, 2015 | $ | 6.0 | $ | 1.4 | ||
Volume | 0.2 | 0.1 | ||||
Price | - | - | ||||
Foreign Exchange | - | - | ||||
(Inflation)/Deflation | N/A | (0.1) | ||||
Mix | N/A | - | ||||
Productivity | N/A | 0.1 | ||||
Other | - | - | ||||
September 30, 2016 | $ | 6.3 | $ | 1.5 | ||
NINE MONTHS | Segment revenues up $1.1 billion (6%); Segment profit up $0.4 billion (11%) as a result of:
The increase in revenues was primarily driven by higher services volume and prices, partially offset by lower equipment volume in Military. The increase in profit was primarily driven by higher cost productivity, higher services volume and prices, partially offset by the effects of inflation and lower other income.
| |||||
Revenues | Profit | |||||
September 30, 2015 | $ | 17.9 | $ | 3.9 | ||
Volume | 1.1 | 0.2 | ||||
Price | 0.1 | 0.1 | ||||
Foreign Exchange | - | - | ||||
(Inflation)/Deflation | N/A | (0.1) | ||||
Mix | N/A | - | ||||
Productivity | N/A | 0.3 | ||||
Other | - | (0.1) | ||||
September 30, 2016 | $ | 19.1 | $ | 4.4 | ||
2016 3Q FORM 10-Q 25
 HEALTHCARE
 OPERATIONAL OVERVIEW - THREE AND NINE MONTHS ENDED SEPTEMBER 30
(Dollars in billions)
2016 YTD SUB-SEGMENT REVENUES | EQUIPMENT/SERVICES REVENUES | |||
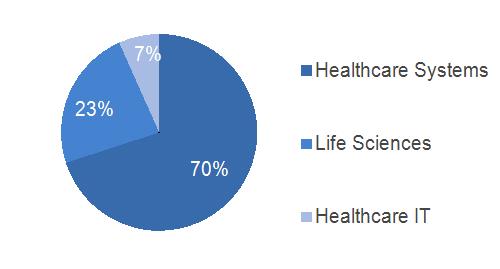 |  | |||
Services Equipment | ||||
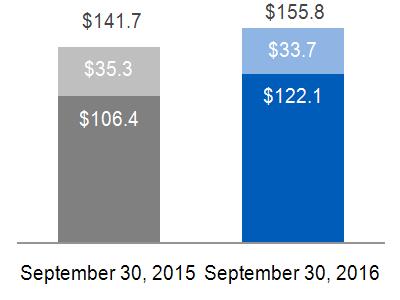
ORDERS |
BACKLOG | |||
 |
Equipment
Services
| 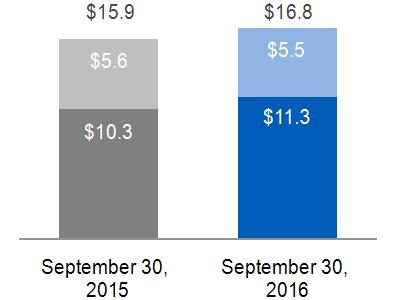 |
Equipment
Services
| |
2016 3Q FORM 10-Q 26
FINANCIAL OVERVIEW - THREE AND NINE MONTHS ENDED SEPTEMBER 30
(Dollars in billions)
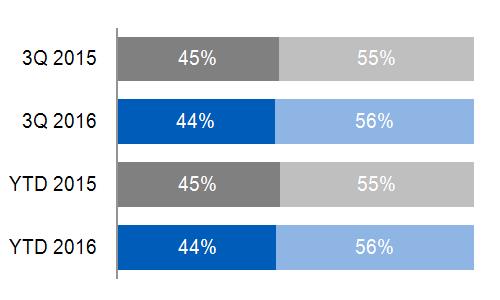
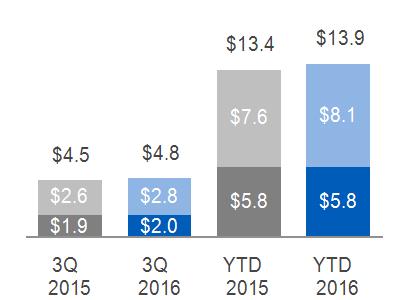
SEGMENT REVENUES | SEGMENT PROFIT | SEGMENT PROFIT MARGIN | ||
 |
Equipment
Services |  | 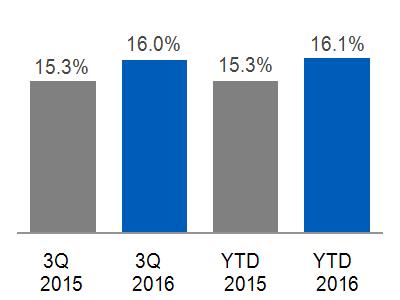 |
SEGMENT REVENUES & PROFIT WALK: | COMMENTARY: 2016 - 2015 | |||||
THREE MONTHS | Segment revenues up $0.2 billion (5%); Segment profit up $0.1 billion (10%) as a result of:
The increase in revenues was primarily due to higher volume driven by Life Sciences and Healthcare Systems, partially offset by lower prices at Healthcare Systems. The increase in profit was primarily driven by higher cost productivity, including the effects of previous restructuring actions and volume growth, partially offset by lower prices at Healthcare Systems.
| |||||
Revenues | Profit | |||||
September 30, 2015 | $ | 4.3 | $ | 0.7 | ||
Volume | 0.3 | - | ||||
Price | (0.1) | (0.1) | ||||
Foreign Exchange | - | - | ||||
(Inflation)/Deflation | N/A | - | ||||
Mix | N/A | - | ||||
Productivity | N/A | 0.1 | ||||
Other | - | - | ||||
September 30, 2016 | $ | 4.5 | $ | 0.7 | ||
NINE MONTHS | Segment revenues up $0.5 billion (4%); Segment profit up $0.2 billion (10%) as a result of:
The increase in revenues was primarily due to higher volume driven by Life Sciences and Healthcare Systems, partially offset by lower prices at Healthcare Systems and the effects of a stronger U.S. dollar. The increase in profit was primarily driven by higher cost productivity, including the effects of previous restructuring actions and strong volume growth, partially offset by lower prices at Healthcare Systems.
| |||||
Revenues | Profit | |||||
September 30, 2015 | $ | 12.7 | $ | 1.9 | ||
Volume | 0.8 | 0.1 | ||||
Price | (0.2) | (0.2) | ||||
Foreign Exchange | (0.1) | - | ||||
(Inflation)/Deflation | N/A | - | ||||
Mix | N/A | - | ||||
Productivity | N/A | 0.3 | ||||
Other | - | - | ||||
September 30, 2016 | $ | 13.2 | $ | 2.1 | ||
2016 3Q FORM 10-Q 27
 TRANSPORTATION
 OPERATIONAL OVERVIEW - THREE AND NINE MONTHS ENDED SEPTEMBER 30
(Dollars in billions)
2016 YTD SUB-SEGMENT REVENUES | EQUIPMENT/SERVICES REVENUES | |||
 |  | |||
(a) Includes Marine, Stationary, Drilling and Digital | Services Equipment | |||
ORDERS |
BACKLOG | |||
|
Equipment
Services
|  |
Equipment
Services
| |
UNIT SALES | ||||
 | ||||
2016 3Q FORM 10-Q 28
FINANCIAL OVERVIEW - THREE AND NINE MONTHS ENDED SEPTEMBER 30
(Dollars in billions)
SEGMENT REVENUES | SEGMENT PROFIT | SEGMENT PROFIT MARGIN | ||
 |
Equipment
Services | 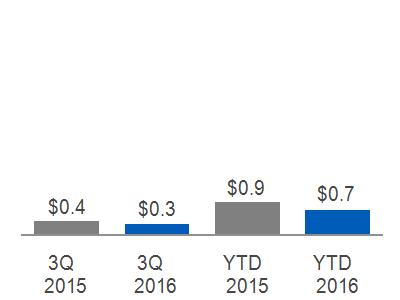 | 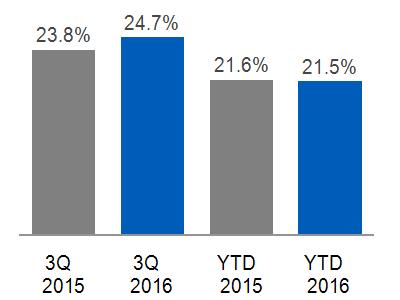 |
SEGMENT REVENUES & PROFIT WALK: | COMMENTARY: 2016 - 2015 | |||||
THREE MONTHS | Segment revenues down $0.3 billion (22%); Segment profit down $0.1 billion (18%) as a result of:
The decrease in revenues was primarily due to lower equipment volume driven by 59 fewer locomotive shipments than in the prior year. The decrease in revenues was also impacted by the Signaling business disposition in November 2015. The decrease in profit was driven by lower volume due to lower locomotive shipments and lower services volume, partially offset by the effects of previous restructuring actions.
| |||||
Revenues | Profit | |||||
September 30, 2015 | $ | 1.6 | $ | 0.4 | ||
Volume | (0.3) | (0.1) | ||||
Price | - | - | ||||
Foreign Exchange | - | - | ||||
(Inflation)/Deflation | N/A | - | ||||
Mix | N/A | - | ||||
Productivity | N/A | - | ||||
Other | - | - | ||||
September 30, 2016 | $ | 1.2 | $ | 0.3 | ||
NINE MONTHS | Segment revenues down $0.9 billion (20%); Segment profit down $0.2 billion (20%) as a result of:
The decrease in revenues was primarily driven by lower equipment volume, driven by 87 fewer locomotive shipments than in the prior year, as well as lower services volume due to higher parked locomotives. The decrease in revenues was also impacted by the Signaling business disposition in November 2015. The decrease in profit was primarily driven by lower equipment volume, partially offset by material deflation and the effects of previous restructuring actions.
| |||||
Revenues | Profit | |||||
September 30, 2015 | $ | 4.3 | $ | 0.9 | ||
Volume | (0.8) | (0.2) | ||||
Price | - | - | ||||
Foreign Exchange | - | - | ||||
(Inflation)/Deflation | N/A | 0.1 | ||||
Mix | N/A | - | ||||
Productivity | N/A | - | ||||
Other | - | - | ||||
September 30, 2016 | $ | 3.5 | $ | 0.7 | ||
2016 3Q FORM 10-Q 29
 ENERGY CONNECTIONS & LIGHTING
 OPERATIONAL OVERVIEW - THREE AND NINE MONTHS ENDED SEPTEMBER 30
(Dollars in billions)
2016 YTD SUB-SEGMENT REVENUES | EQUIPMENT/SERVICES REVENUES | |||
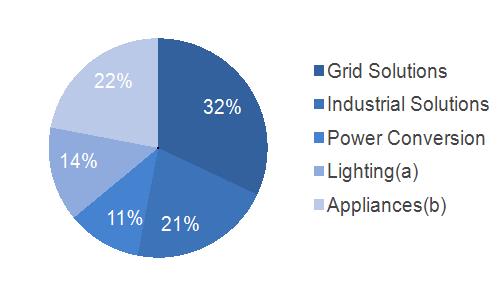 | 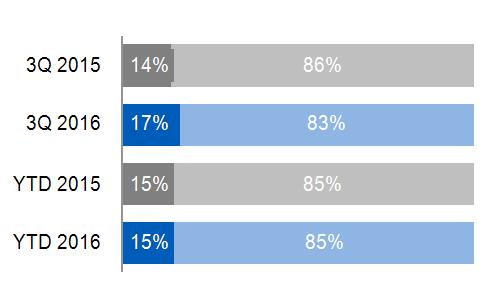 | |||
(a) Includes Current, powered by GE (b) Reflects historical results of Appliances prior to its sale in June 2016 | Services Equipment
| |||
ORDERS |
BACKLOG | |||
|
Equipment
Services
|  |
Equipment
Services
| |
(a) Included $1.4 billion related to Alstom (b) Included $4.0 billion related to Alstom | (a) Included $8.3 billion related to Alstom | |||
2016 3Q FORM 10-Q 30
FINANCIAL OVERVIEW - THREE AND NINE MONTHS ENDED SEPTEMBER 30
(Dollars in billions)
SEGMENT REVENUES | SEGMENT PROFIT (LOSS) | SEGMENT PROFIT MARGIN | ||
(a) $1.8 billion, excluding $1.4 billion related to Alstom* (b) $7.9 billion, excluding $3.9 billion related to Alstom* |
Equipment
Services | 
(a) Includes $0.1 billion related to Alstom* (b) $(0.1) billion, excluding $0.1 billion related to Alstom* | 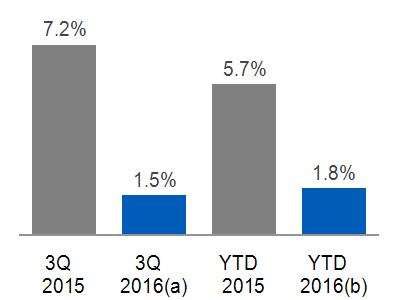
(a) (1.0)%, excluding 4.6% related to Alstom* (b) 1.8%, excluding 1.8% related to Alstom* |
SEGMENT REVENUES & PROFIT WALK: | COMMENTARY: 2016 - 2015 | |||||
THREE MONTHS | Segment revenues down $0.9 billion (22%); Segment profit down $0.2 billion (84%) as a result of:
The decrease in revenues was driven primarily by the Appliances disposition in June 2016, as well as lower Lighting revenues, as traditional lighting sales were partially offset by an increase in LED revenues and Current. The decrease in revenues was partially offset by the effects of Alstom, including higher equipment sales at Grid. The decrease in profit was due to lower core volume, lower cost productivity and the effects of the Appliances disposition, partially offset by the effects of Alstom, including higher equipment sales at Grid.
| |||||
Revenues | Profit | |||||
September 30, 2015 | $ | 4.1 | $ | 0.3 | ||
Volume | (2.2) | (0.2) | ||||
Price | - | - | ||||
Foreign Exchange | - | - | ||||
(Inflation)/Deflation | N/A | - | ||||
Mix | N/A | - | ||||
Productivity | N/A | (0.1) | ||||
Other | - | - | ||||
Alstom | 1.4 | 0.1 | ||||
September 30, 2016 | $ | 3.2 | $ | - | ||
NINE MONTHS | Segment revenues up $0.1 billion (1%); Segment profit down $0.5 billion (69%)as a result of:
The increase in revenues was driven by the effects of Alstom, including higher equipment sales at Grid, partially offset by a decrease in core volume driven by Industrial Solutions and Power Conversion, the effects of the Appliances disposition and traditional lighting sales. The increase was also partially offset by lower prices, the effects of a stronger U.S. dollar and lower other income, including negative foreign exchange hedge impacts. The decrease in profit was due to lower cost productivity, driven by lower core volume and prices, as well as the effects of the Appliances disposition and lower other income, including negative foreign exchange transactional hedge impacts, partially offset by material deflation, a favorable business mix and the effects of Alstom.
| |||||
Revenues | Profit | |||||
September 30, 2015 | $ | 11.7 | $ | 0.7 | ||
Volume | (3.5) | (0.2) | ||||
Price | (0.1) | (0.1) | ||||
Foreign Exchange | (0.1) | - | ||||
(Inflation)/Deflation | N/A | 0.1 | ||||
Mix | N/A | - | ||||
Productivity | N/A | (0.2) | ||||
Other | (0.1) | (0.1) | ||||
Alstom | 3.9 | 0.1 | ||||
September 30, 2016 | $ | 11.8 | $ | 0.2 | ||
*Non-GAAP Financial Measure
2016 3Q FORM 10-Q 31
 CAPITAL
 OPERATIONAL OVERVIEW - THREE AND NINE MONTHS ENDED SEPTEMBER 30
(Dollars in billions)
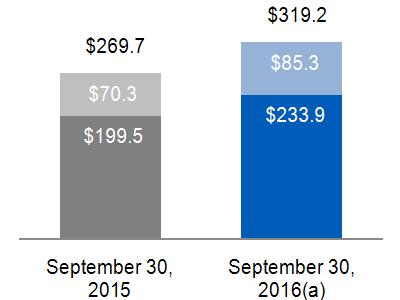
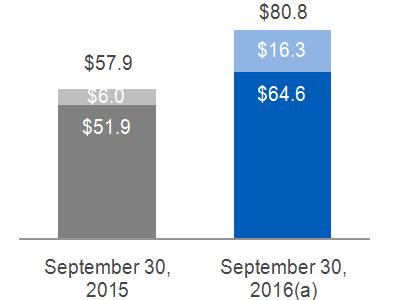
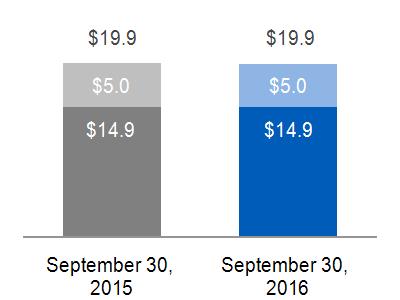
2016 YTD SUB-SEGMENT REVENUES | ENDING NET INVESTMENT, EXCLUDING LIQUIDITY* | |
 | 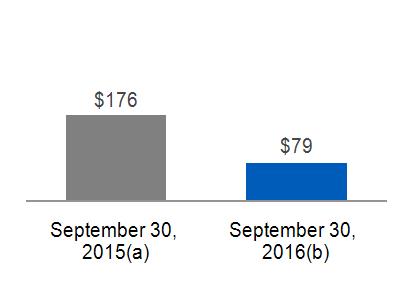
(a) As originally reported; $271 billion including discontinued operations (b) $103 billion including discontinued operations |
FINANCIAL OVERVIEW - THREE AND NINE MONTHS ENDED SEPTEMBER 30
(Dollars in billions)
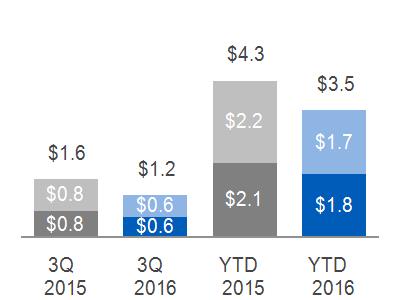
SEGMENT REVENUES | SEGMENT PROFIT (LOSS) (a) | |||
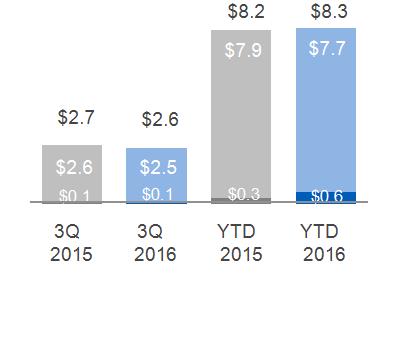 | Total Capital
Verticals
Other Continuing
|
|
Verticals
Other Continuing
Total Capital
| |
(a) Interest and other financial charges and income taxes are included in determining segment profit (loss) for the Capital segment | ||||
* Non-GAAP Financial Measure
2016 3Q FORM 10-Q 32
COMMENTARY: 2016 - 2015
THREE MONTHS
Capital revenues decreased $0.1 billion, or 2%, as a result of the effects of dispositions and organic revenue declines, partially offset by higher gains and lower impairments.
| Within Capital, Verticals revenues decreased by $0.1 billion as a result of the effects of dispositions ($0.2 billion) and organic revenue declines ($0.2 billion), partially offset by lower impairments ($0.2 billion) and higher gains ($0.1 billion). |
| Other Capital revenues increased less than $0.1 billion as a result of higher gains ($0.1 billion) and organic revenue growth ($0.1 billion), partially offset by higher impairments ($0.1 billion). |
Capital net loss decreased $0.2 billion, primarily due to lower impairments and higher gains, partially offset by the effects of dispositions and core decreases. Core decreases reflect excess interest expense, higher restructuring expenses and higher insurance reserve provisions, partially offset by increased tax benefits resulting from an IRS tax settlement and tax adjustments in the three months ended September 30, 2016, to bring Capital's nine-month tax rate in line with the projected full-year tax rate.
| Within Capital, Verticals net earnings increased by $0.1 billion due to lower impairments ($0.2 billion) and higher gains, partially offset by the effects of dispositions ($0.1 billion) and core decreases ($0.1 billion). |
| Other Capital net loss decreased by $0.1 billion primarily as a result of: |
| Increased tax benefits related to an IRS settlement of $0.3 billion. |
| Tax adjustments of $0.1 billion in the three months ended September 30, 2016, to bring Capital's nine-month tax rate in line with the projected full-year tax rate. |
| Higher treasury operation expenses of $0.3 billion reflecting excess interest expense and derivative activities that reduce or eliminate interest rate, currency or market risk between financial assets and liabilities. We expect to continue to have excess interest costs in 2016 as asset sales outpace our debt maturities. We may engage in liability management actions, such as buying back debt, based on market and economic conditions. |
| Higher restructuring expenses of $0.1 billion. |
NINE MONTHS
Capital revenues increased less than $0.1 billion primarily due to lower impairments, higher gains and the effects of acquisitions, partially offset by the effects of dispositions, organic revenue declines and the effects of currency exchange.
| Within Capital, Verticals revenues decreased by $0.2 billion as a result of organic revenue declines ($0.5 billion) and the effects of dispositions ($0.2 billion), partially offset by higher gains ($0.3 billion), lower impairments ($0.1 billion) and the effects of acquisitions. |
| Other Capital revenues increased $0.3 billion as a result of organic revenue growth ($0.4 billion) and lower impairments ($0.1 billion), partially offset by lower gains ($0.2 billion) and the effects of currency exchange ($0.1 billion). |
Capital net loss decreased by $4.9 billion, or 77%, primarily due to the absence of the 2015 charges associated with the GE Capital Exit Plan.
| Within Capital, Verticals net earnings increased by $0.2 billion as a result of higher gains ($0.2 billion) and lower impairments ($0.1 billion), partially offset by the effects of dispositions ($0.1 billion) and core decreases ($0.1 billion). |
| Other Capital net loss decreased by $4.7 billion primarily as a result of: |
| Lower tax expenses of $6.1 billion primarily related to the absence of the 2015 charges for repatriation of foreign earnings and write-off of deferred tax assets related to the GE Capital Exit Plan. |
| Tax adjustments of $0.5 billion in the nine months ended September 30, 2016, to bring Capital's nine-month tax rate in line with the projected full-year tax rate. |
| Increased tax benefits related to an IRS tax settlement of $0.3 billion. |
| Higher treasury operation expenses of $1.6 billion reflecting excess interest expense, costs associated with the February and May 2016 debt tenders and derivative activities that reduce or eliminate interest rate, currency or market risk between financial assets and liabilities. We expect to continue to have excess interest costs in 2016 as asset sales outpace our debt maturities. We may engage in liability management actions, such as buying back debt, based on market and economic conditions. |
· | Charges of $0.3 billion associated with the preferred equity exchange that was completed in January 2016. |
· | Higher restructuring expenses of $0.3 billion. |
2016 3Q FORM 10-Q 33
CORPORATE ITEMS AND ELIMINATIONS | ||||||||||||
REVENUES AND OPERATING PROFIT (COST) | ||||||||||||
Three months ended September 30 | Nine months ended September 30 | |||||||||||
(In millions) | 2016 | 2015 | 2016 | 2015 | ||||||||
Revenues | ||||||||||||
Gains (losses) on disposed and held for sale businesses | $ | 208 | $ | - | $ | 3,395 | $ | 49 | ||||
NBCU settlement | - | - | - | 450 | ||||||||
Eliminations and other | (963) | (888) | (2,966) | (2,665) | ||||||||
Total Corporate Items and Eliminations | $ | (755) | $ | (888) | $ | 429 | $ | (2,166) | ||||
Operating profit (cost) | ||||||||||||
Gains (losses) on disposed and held for sale businesses | $ | 208 | $ | - | $ | 3,395 | $ | 49 | ||||
NBCU settlement | - | - | - | 450 | ||||||||
Principal retirement plans(a) | (542) | (659) | (1,489) | $ | (2,121) | |||||||
Restructuring and other charges | (683) | (346) | (2,557) | (1,167) | ||||||||
Eliminations and other | (507) | (554) | (1,469) | (1,647) | ||||||||
Total Corporate Items and Eliminations | $ | (1,524) | $ | (1,559) | $ | (2,120) | $ | (4,436) | ||||
CORPORATE COSTS | ||||||||||||
Three months ended September 30 | Nine months ended September 30 | |||||||||||
(In millions) | 2016 | 2015 | 2016 | 2015 | ||||||||
Total Corporate Items and Eliminations | $ | (1,524) | $ | (1,559) | $ | (2,120) | $ | (4,436) | ||||
Less: non-operating pension cost | (511) | (693) | (1,534) | (2,077) | ||||||||
Total Corporate costs (operating) * | $ | (1,012) | $ | (866) | $ | (586) | $ | (2,359) | ||||
Less: restructuring and other charges, gains (losses) and settlement | (475) | (346) | 838 | (668) | ||||||||
Adjusted total corporate costs (operating)* | $ | (538) | $ | (520) | $ | (1,424) | $ | (1,691) | ||||
(a) | Included non-operating pension cost* of $0.5 billion and $0.7 billion in the three months ended September 30, 2016 and 2015, respectively, and $1.5 billion and $2.1 billion in the nine months ended September 30, 2016 and 2015, respectively, which includes expected return on plan assets, interest costs and non-cash amortization of actuarial gains and losses. |
2016 – 2015 COMMENTARY: THREE MONTHS ENDED SEPTEMBER 30
Revenues and other income increased $0.1 billion, primarily as a result of:
| $0.2 billion of higher net gains from disposed and held for sale businesses, which included $0.4 billion gain from the sale of GE Asset Management to State Street Corporation, partially offset by a $0.2 billion charge related to the anticipated sale of a non-strategic platform in our Aviation business. This was partially offset by $0.1 billion of higher inter-segment eliminations. |
Operating costs were flat, primarily as a result of:
| $0.2 billion of higher net gains from disposed and held for sale businesses, which included $0.4 billion gain from the sale of GE Asset Management to State Street Corporation, partially offset by a $0.2 billion charge related to the anticipated sale of a non-strategic platform in our Aviation business, and |
| $0.1 billion of lower costs associated with our principal retirement plans including the effects of higher discount rates. |
These decreases to operating costs were offset by $0.3 billion higher restructuring and other charges, which included $0.2 billion of higher restructuring charges associated with the Alstom acquisition.
*Non-GAAP Financial Measure
2016 3Q FORM 10-Q 34
2016 – 2015 COMMENTARY: NINE MONTHS ENDED SEPTEMBER 30
Revenues and other income increased $2.6 billion, primarily a result of:
| $3.3 billion of higher net gains from disposed and held for sale businesses, which included $3.2 billion gain from the sale of our Appliances business to Haier in the second quarter of 2016 and $0.4 billion gain from the sale of GE Asset Management to State Street Corporation, partially offset by a $0.2 billion charge related to the anticipated sale of a non-strategic platform in our Aviation business in the third quarter of 2016. |
This increase to revenues and other income was partially offset by the following:
| $0.5 billion lower other income from a settlement related to the NBCU transaction in the second quarter of 2015, and |
| $0.3 billion of higher inter-segment eliminations. |
Operating costs decreased $2.3 billion, primarily as a result of:
| $3.3 billion of higher net gains from disposed and held for sale businesses, which included $3.2 billion gain from the sale of our Appliances business to Haier in the second quarter of 2016 and $0.4 billion gain from the sale of GE Asset Management to State Street Corporation, partially offset by a $0.2 billion charge related to the anticipated sale of a non-strategic platform in our Aviation business in the third quarter of 2016. |
| $0.6 billion of lower costs associated with our principal retirement plans including the effects of higher discount rates, and |
| $0.2 billion of lower costs under our long-term incentive plan. |
These decreases to operating costs were partially offset by the following:
| $1.4 billion higher restructuring and other charges, which included $0.6 billion of higher restructuring charges associated with the Alstom acquisition, and |
| $0.5 billion lower other income from a settlement related to the NBCU transaction in the second quarter of 2015. |
COSTS NOT INCLUDED IN SEGMENT RESULTS
Certain amounts are not included in industrial operating segment results because they are excluded from measurement of their operating performance for internal and external purposes. These amounts are included in GE Corporate Items & Eliminations and may include matters such as charges for restructuring; rationalization and other similar expenses; acquisition costs and related charges; technology and product development cost; certain gains and losses from acquisitions or dispositions; and litigation settlements or other charges, for which responsibility preceded the current management team. The amount of costs not included in segment results follows.
COSTS | |||||||||||
Three months ended September 30 | Nine months ended September 30 | ||||||||||
(In billions) | 2016 | 2015 | 2016 | 2015 | |||||||
Power | $ | 0.3 | (a) | $ | 0.1 | $ | 0.8 | (a) | $ | 0.2 | |
Renewable Energy | - | - | 0.2 | 0.1 | |||||||
Oil & Gas | 0.1 | (b) | 0.2 | 0.7 | (b) | 0.5 | |||||
Aviation | - | - | 0.1 | - | |||||||
Healthcare | 0.1 | (c) | - | 0.4 | (c) | 0.1 | |||||
Transportation | - | - | 0.2 | - | |||||||
Energy Connections & Lighting | 0.1 | - | 0.3 | 0.2 | |||||||
Total | $ | 0.7 | $ | 0.3 | $ | 2.7 | $ | 1.1 | |||
(a) | For the three and nine months ended September 30, 2016, Power's results excluded $0.3 billion and $0.8 billion of costs, primarily related to restructuring charges associated with the Alstom acquisition. |
(b) | For the three and nine months ended September 30, 2016, Oil & Gas's results excluded $0.1 billion and $0.7 billion of costs, primarily related to ongoing restructuring activities. |
(c) | For the three and nine months ended September 30, 2016, Healthcare's results excluded $0.1 billion and $0.4 billion of costs, primarily related to restructuring charges. |
2016 3Q FORM 10-Q 35
GAINS (LOSSES) | |||||||||||
Three months ended September 30 | Nine months ended September 30 | ||||||||||
(In billions) | 2016 | 2015 | 2016 | 2015 | |||||||
Power | $ | - | $ | - | $ | - | $ | - | |||
Renewable Energy | - | - | - | - | |||||||
Oil & Gas | - | - | - | - | |||||||
Aviation | (0.2) | (a) | - | (0.2) | (a) | - | |||||
Healthcare | - | - | - | - | |||||||
Transportation | - | - | - | - | |||||||
Energy Connections & Lighting | - | - | 3.2 | (b) | - | ||||||
Total | $ | (0.2) | $ | - | $ | 2.9 | $ | - | |||
(a) | Related to the anticipated sale of a non-strategic platform in our Aviation business. |
(b) Related to the sale of our Appliances business in the second quarter of 2016.
2016 3Q FORM 10-Q 36
DISCONTINUED OPERATIONS
Discontinued operations primarily relate to our financial services businesses as a result of the GE Capital Exit Plan and include our Consumer business, most of our CLL business, our Real Estate business and U.S. mortgage business (WMC). All of these operations were previously reported in the Capital segment.
We have entered into Transitional Service Agreements (TSA) with and provided certain indemnifications to buyers of GE Capital's assets. Under the TSAs, GE Capital provides various services for terms generally between 12 and 24 months and receives a level of cost reimbursement from the buyers.
At September 30, 2016, specific indemnifications amounted to $1.6 billion, for which we have recognized related liabilities of $0.2 billion. In addition, we provided $0.1 billion of credit support, the majority on behalf of certain customers aligned with signed disposal transactions scheduled to close in 2016, and recognized an insignificant liability at September 30, 2016 .
As part of the GE Capital Exit Plan, we entered into hedges (on an after-tax basis) of our net investment in businesses that we plan to dispose. These derivatives are treated as standalone hedges and the mark-to-market valuation changes on the derivatives are recorded in earnings of discontinued operations.
Results of operations, financial position and cash flows for these businesses are separately reported as discontinued operations for all periods presented.
FINANCIAL INFORMATION FOR DISCONTINUED OPERATIONS | |||||||||||
Three months ended September 30 | Nine months ended September 30 | ||||||||||
(In millions) | 2016 | 2015 | 2016 | 2015 | |||||||
Earnings (loss) from discontinued operations, net of taxes | $ | (105) | $ | 629 | $ | (954) | $ | (11,253) | |||
2016 – 2015 COMMENTARY: THREE MONTHS ENDED SEPTEMBER 30
The third quarter 2016 loss from discontinued operations, net of taxes, primarily reflected the following:
| $0.5 billion after-tax loss at our Consumer business (including $0.4 billion after-tax loss on planned disposals). |
| Third quarter 2016 losses were partially offset by a $0.2 billion tax benefit related to an IRS tax settlement in our discontinued insurance operations and $0.1 billion after-tax earnings at our CLL business. |
The third quarter 2015 earnings from discontinued operations, net of taxes, primarily reflected the following:
| $1.0 billion after-tax earnings at our Consumer business. |
| $0.1 billion after-tax earnings at our Real Estate business (including $0.2 billion after-tax gain on transactions closed in the quarter). |
| Third quarter 2015 earnings were partially offset by $0.5 billion after-tax loss at our CLL business (including $1.2 billion after-tax loss on planned disposals). |
2016 – 2015 COMMENTARY: NINE MONTHS ENDED SEPTEMBER 30
The 2016 loss from discontinued operations, net of taxes, primarily reflected the following:
| $0.7 billion after-tax loss at our CLL business (including $0.8 billion after-tax loss on planned disposals). |
| $0.5 billion after-tax loss at our Consumer business (including $0.5 billion after-tax loss on planned disposals). |
| These 2016 losses were partially offset by a $0.2 billion tax benefit related to an IRS settlement in our discontinued insurance operations. |
The 2015 loss from discontinued operations, net of taxes, primarily reflected the following:
| $8.2 billion after-tax loss at our CLL business (including $8.4 billion after-tax loss on planned disposals). |
| $2.2 billion after-tax loss at our Real Estate business (including $2.2 billion after-tax loss on planned disposals). |
| $0.9 billion after-tax loss at our Consumer business. |
For additional information related to discontinued operations, see Note 2 to the consolidated financial statements.
2016 3Q FORM 10-Q 37
OTHER CONSOLIDATED INFORMATION
INCOME TAXES
GE pays the income taxes it owes in every country it does business. While GE and GE Capital file a consolidated U.S. federal income tax return, many factors impact our income tax expense and cash tax payments. The most significant factor is that we conduct business in approximately 180 countries and more than half of our revenue is earned outside the U.S., often in countries with lower tax rates than in the U.S. We reinvest most of our foreign earnings overseas to be able to fund our active non-U.S. business operations. Our tax liability is also affected by U.S. and foreign tax incentives designed to encourage certain investments, such as research and development, and is also affected by acquisitions, dispositions and tax law changes. Finally, our tax returns are routinely audited, and settlements of issues raised in these audits sometimes affect our tax rates.
GE and GE Capital file a consolidated U.S. federal income tax return. This enables GE and GE Capital to use tax deductions and credits of one member of the group to reduce the tax that otherwise would have been payable by another member of the group. The GE Capital effective tax rate reflects the benefit of these tax reductions in the consolidated return. GE makes cash payments to GE Capital for tax reductions and GE Capital pays for tax increases at the time GE's tax payments are due.
CONSOLIDATED – THREE AND NINE MONTHS ENDED SEPTEMBER 30
(Dollars in billions)
PROVISION FOR INCOME TAXES | |||
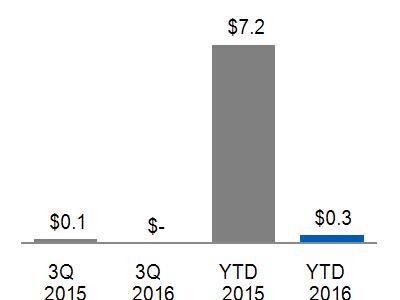 | |||
2016 – 2015 COMMENTARY: THREE MONTHS ENDED SEPTEMBER 30
| The consolidated income tax rate was 0.9% in the third quarter of 2016 compared to 6.6% in the third quarter of 2015. |
| The consolidated tax provision decreased in the third quarter of 2016 compared to the third quarter of 2015 due to a larger adjustment to reduce the tax rate to the projected full-year tax rate and due to the final resolution of the IRS disallowance of the tax loss on the 2003 disposition of ERC Life Reinsurance Company, partially offset by lower benefits from lower-taxed global operations. |
| The first nine months of 2016 tax rate was adjusted to reflect the relatively large amount of pre-tax income through the third quarter of 2016 relative to tax benefits through the third quarter of 2016. Tax benefits incurred through the third quarter were relatively low as larger international tax benefits are projected for the fourth quarter of 2016. |
| The consolidated tax provision includes $0.2 billion and $0.4 billion for GE (excluding GE Capital) for the third quarters of 2016 and 2015, respectively. |
2016 3Q FORM 10-Q 38
2016 – 2015 COMMENTARY: NINE MONTHS ENDED SEPTEMBER 30
| The consolidated tax rate was 4.9% in the first nine months of 2016 compared to 115.0% in the first nine months of 2015. The tax rate for the first nine months of 2015 was in excess of 100% due to the tax expense of $6.2 billion in the first nine months of 2015 for the expected repatriation of foreign earnings and write-off of deferred tax assets incurred in connection with the GE Capital Exit Plan. |
| The consolidated income tax provision decreased from the first nine months of 2015 to the first nine months of 2016 due to the non-repeat of the GE Capital Exit Plan charge, a larger adjustment to reduce the tax rate to the projected full-year tax rate and the final resolution of the IRS disallowance of the tax loss on the 2003 disposition of ERC Life Reinsurance Company, partially offset by lower benefits from lower-taxed global operations. |
| The first nine months of 2016 tax rate was adjusted to reflect the relatively large amount of pre-tax income through the third quarter of 2016 including the gain on the sale of the Appliances business relative to tax benefits through the third quarter of 2016. Tax benefits incurred through the third quarter were also relatively low as larger international tax benefits are projected for the fourth quarter of 2016 and because of high taxes on the gain on the sale of the Appliances business. |
| The consolidated tax provision includes $1.0 billion and $1.3 billion for GE (excluding GE Capital) for the first nine months of 2016 and 2015, respectively. |
BENEFITS FROM GLOBAL OPERATIONS
Absent the effects of the GE Capital Exit Plan, our consolidated income tax provision is lower because of the benefits of lower-taxed global operations. There is a benefit from global operations as non-U.S. income is subject to local country tax rates that are significantly below the 35% U.S. statutory rate. These non-U.S. earnings have been indefinitely reinvested outside the U.S. and are not subject to current U.S. income tax. Most of these earnings have been reinvested in active non-U.S. business operations and we do not intend to repatriate these earnings to fund U.S. operations. The rate of tax on our indefinitely reinvested non-U.S. earnings is below the 35% U.S. statutory tax rate because we have significant business operations subject to tax in countries where the tax on that income is lower than the U.S. statutory rate and because GE funds certain non-U.S. operations through foreign companies that are subject to low foreign taxes.
A substantial portion of the benefit related to business operations subject to tax in countries where the tax on that income is lower than the U.S. statutory rate is derived from our GECAS aircraft leasing operations located in Ireland, from our Power operations located in Switzerland and Hungary, and our Healthcare operations in Europe.
We expect our ability to benefit from non-U.S. income taxed at less than the U.S. rate to continue, subject to changes in U.S. or foreign law. In addition, since this benefit depends on management's intention to indefinitely reinvest amounts outside the U.S., our tax provision will increase to the extent we no longer indefinitely reinvest foreign earnings .
2016 3Q FORM 10-Q 39
STATEMENT OF FINANCIAL POSITION
Because GE and GE Capital share certain significant elements of their Statements of Financial Position, the following discussion addresses significant captions in the consolidated statement. Within the following discussions, however, we distinguish between GE and GE Capital activities in order to permit meaningful analysis of each individual consolidating statement.
MAJOR CHANGES IN OUR FINANCIAL POSITION FOR THE NINE MONTHS ENDED
SEPTEMBER 30, 2016
| Cash and equivalents decreased $18.0 billion. GE Cash and equivalents increased $0.2 billion due to cash flows from operating activities of $18.3 billion (including common dividends from GE Capital of $16.1 billion), proceeds from the sale of our Appliances business of $4.8 billion and a short-term loan from GE Capital of $5.0 billion. This is partially offset by treasury stock purchases of $18.7 billion (cash basis), including $9.1 billion paid under ASR agreements, dividends of $6.4 billion, net PP&E additions of $2.1 billion and software spend of $0.6 billion. GE Capital Cash and equivalents decreased $18.2 billion primarily driven by $50.7 billion net repayments of debt, $16.2 billion in payments of dividends to shareowners and a short-term loan to GE of $5.0 billion, partially offset by $53.3 billion in proceeds from business dispositions and $0.8 billion in proceeds from the sale of receivables originated in our Appliances business and sold to Haier. See the Statement of Cash Flows section for additional information. |
| Investment securities increased $14.4 billion , primarily driven by investing excess cash in longer term investment to achieve higher yield . See Note 3 for additional information. |
| All other assets decreased $11.0 billion , primarily due to maturities of time deposits in line with debt maturities at GE Capital. |
| Assets of discontinued operations decreased $90.0 billion , primarily due to the disposition of CLL businesses of $81.5 billion. See Note 2 for additional information. |
| Borrowings decreased $48.2 billion , primarily due to a net decrease of GE Capital borrowings of $48.7 billion, partially offset by a net increase in borrowings by GE of $1.4 billion (excluding GE Capital debt assumption and short-term loan from GE Capital to GE). |
| Liabilities of discontinued operations decreased $36.7 billion , primarily driven by the disposition of CLL businesses of $33.6 billion. See Note 2 for additional information. |
| Common stock held in treasury increased $16.3 billion, primarily due to treasury stock purchases of $18.1 billion (book basis), including $9.1 billion repurchased under ASR agreements. This was partially offset by treasury stock issuances of $1.9 billion, primarily stock option exercises of $1.1 billion. |
2016 3Q FORM 10-Q 40
FINANCIAL RESOURCES AND LIQUIDITY
LIQUIDITY AND BORROWINGS
We maintain a strong focus on liquidity. At both GE and GE Capital we manage our liquidity to help provide access to sufficient funding to meet our business needs and financial obligations throughout business cycles.
Our liquidity and borrowing plans for GE and GE Capital are established within the context of our annual financial and strategic planning processes. At GE, our liquidity and funding plans take into account the liquidity necessary to fund our operating commitments, which include primarily purchase obligations for inventory and equipment, payroll and general expenses (including pension funding). We also take into account our capital allocation and growth objectives, including paying dividends, repurchasing shares, investing in research and development and acquiring industrial businesses. At GE, we rely primarily on cash generated through our operating activities, any dividend payments from GE Capital, and also have historically maintained a commercial paper program that we regularly use to fund operations in the U.S., principally within the quarters.
GE Capital has historically relied on the unsecured term debt markets, the global commercial paper markets, deposits, secured funding, retail funding products, bank borrowings and securitizations to fund its balance sheet. Subsequent to April 10, 2015 and with the execution of the GE Capital Exit Plan, we do not plan to issue any incremental GE Capital senior unsecured term debt for four years. Furthermore, we have reduced our commercial paper from $25 billion to $5 billion consistent with the Exit Plan. In addition, we have substantially reduced our reliance on deposits and securitization due to the Exit Plan. Today, we mainly rely on excess cash positions, cash generated through dispositions , and the cash flow from our Verticals to fund our debt maturities and our operating and interest costs. GE Capital's liquidity position is targeted to meet its obligations under both normal and stressed conditions. We expect to maintain an elevated liquidity position as we generate cash from asset sales, returning to more normalized levels in 2019. During this period we expect to have excess interest costs as asset sales outpace our debt maturities. While we maintain elevated liquidity levels, we may engage in liability management actions, such as buying back debt, based on market and economic conditions in order to reduce our excess interest costs. For the nine months ended September 30, 2016, we repurchased $6.7 billion of long-term unsecured debt and $5.8 billion of subordinated debentures, resulting in a pre-tax loss of $0.6 billion.
Our 2016 GE Capital funding plan anticipates repayment of principal on outstanding short-term borrowings, including the current portion of long-term debt ($42.7 billion at December 31, 2015), principally through dispositions, asset sales and cash on hand. Long-term maturities and early redemptions were $6.0 billion in the third quarter of 2016.
We maintain a detailed liquidity policy for GE Capital that requires GE Capital to maintain a contingency funding plan. The liquidity policy defines GE Capital's liquidity risk tolerance under different stress scenarios based on its liquidity sources and also establishes procedures to escalate potential issues. We actively monitor GE Capital's access to funding markets and its liquidity profile through tracking external indicators and testing various stress scenarios. The contingency funding plan provides a framework for handling market disruptions and establishes escalation procedures in the event that such events or circumstances arise. GE Capital will continue to evaluate the need to modify the existing contingency funding plan due to the GE Capital Exit Plan.
On December 2, 2015, $87.7 billion of senior unsecured notes and $4.9 billion of commercial paper was assumed by GE upon its merger with GE Capital. The amount of the intercompany payable to GE was $59.8 billion as of September 30, 2016, which includes a reduction for a $5.0 billion short-term loan in the second quarter of 2016 from GE Capital to GE, which bears the right of offset against amounts owed under the assumed debt agreement. See Note 9 to the consolidated financial statements.
On June 3, 2016, GE commenced an offering to exchange $19.6 billion of all the outstanding, unregistered senior notes that were issued by GE Capital International Funding Company Unlimited Company in a private offering on October 26, 2015, for identical, registered 2.342% Senior Notes due 2020, 3.373% Senior Notes due 2025 and 4.418% Senior Notes due 2035. The exchange offer was completed on July 8, 2016.
2016 3Q FORM 10-Q 41
LIQUIDITY SOURCES
In addition to GE cash of $10.6 billion at September 30, 2016, GE Capital maintained liquidity sources of $57.0 billion that consisted of cash and equivalents of $41.9 billion, high-quality investments of $12.2 billion and cash and equivalents of $2.9 billion classified as discontinued operations. Additionally, at September 30, 2016, we have $20.0 billion of committed unused credit lines extended by 36 banks in a syndicated credit facility agreement.
CASH AND EQUIVALENTS | |||||||
(In billions) | September 30, 2016 | September 30, 2016 | |||||
GE(a) | $ | 10.6 | U.S. | $ | 15.9 | ||
GE Capital(b) | 41.9 | Non-U.S.(c) | 36.6 | ||||
(a) | At September 30, 2016, $3.1 billion of GE cash and equivalents was held in countries with currency controls that may restrict the transfer of funds to the U.S. or limit our ability to transfer funds to the U.S. without incurring substantial costs. These funds are available to fund operations and growth in these countries and we do not currently anticipate a need to transfer these funds to the U.S. |
(b) | At September 30, 2016, GE Capital cash and equivalents of about $0.4 billion were primarily in insurance entities and were subject to regulatory restrictions. |
(c) | Of this amount at September 30, 2016, $4.7 billion is held outside of the U.S. and is available to fund operations and other growth of non-U.S. subsidiaries; it is also available to fund our needs in the U.S. on a short-term basis through short-term loans, without being subject to U.S. tax. Under the Internal Revenue Code, these loans are permitted to be outstanding for 30 days or less and the total of all such loans is required to be outstanding for less than 60 days during the year. If we were to repatriate this cash, we would be subject to additional U.S. income taxes and foreign withholding taxes. |
We reduced our Capital ENI, excluding liquidity*, to $79 billion at September 30, 2016.
During the first nine months of 2016, there were no new senior unsecured debt issuances.
COMMERCIAL PAPER | |||||
(In billions) | GE | GE Capital | |||
Average commercial paper borrowings during the third quarter of 2016 | $ | 10.1 | $ | 5.0 | |
Maximum commercial paper borrowings outstanding during the third quarter of 2016 | 17.0 | 5.1 | |||
GE Capital commercial paper maturities have historically been funded principally through new commercial paper issuances and at GE are substantially repaid before quarter-end using indefinitely reinvested overseas cash, which as discussed above, is available for use in the U.S. on a short-term basis without being subject to U.S. tax.
We securitize financial assets as an alternative source of funding. At September 30, 2016, consolidated non-recourse securitization borrowings were $2.2 billion.
We have four deposit-taking banks outside of the U.S., which are classified as discontinued operations. On April 18, 2016, we completed the sale of the deposit-taking bank in the U.S., GE Capital Bank, an industrial bank.
*Non-GAAP Financial Measure
2016 3Q FORM 10-Q 42
GE GUARANTEE OF CERTAIN GE CAPITAL DEBT
GE provides implicit and explicit support to GE Capital through commitments, capital contributions and operating support. As part of the GE Capital Exit Plan, on April 10, 2015, GE and GE Capital entered into an amendment to their existing financial support agreement. Under this amendment (the Amendment), the Company has provided a full and unconditional guarantee (the Guarantee) of the payment of principal and interest on all tradable senior and subordinated outstanding long-term debt securities and all commercial paper issued or guaranteed by GE Capital identified in the Amendment. The Guarantee replaced the requirement that the Company make certain income maintenance payments to GE Capital in certain circumstances. GE Capital's U.S. public indentures were concurrently amended to provide the full and unconditional guarantee by the Company set forth in the Guarantee. At September 30, 2016, the balance of this debt that GE assumed was $64.8 billion, and the Guarantee applied to approximately $53.5 billion of GE Capital debt. See Note 18 to the consolidated financial statements for further information on the guarantor financial statements.
ACCELERATED SHARE REPURCHASE AGREEMENT
During the first nine months of 2016, we repurchased $18.1 billion of our common stock, including $9.1 billion repurchased under the accelerated share repurchase (ASR) agreements.
In September 2016, we entered into an ASR agreement with a financial institution which allowed us to repurchase GE common stock at a price below its volume weighted-average price during a given period. During the third quarter, we paid $2.5 billion and received and classified as treasury shares an initial delivery of 71,189,280 shares based on then-current market prices. The payment was recorded as a reduction to shareowners' equity, consisting of a $2.1 billion increase in treasury stock, which reflects the value of the shares received upon initial delivery, and a $0.4 billion decrease in other capital, which reflects the value of the stock held back pending final delivery. In the fourth quarter of 2016, we received the remaining 14,758,566 shares based on the final volume weighted-average price less the negotiated discount.
In the third quarter of 2016, we received the remaining 18,269,775 shares related to the ASR agreement entered in June 2016 based on the final volume weighted-average price less the negotiated discount.
2016 3Q FORM 10-Q 43
STATEMENT OF CASH FLOWS - NINE MONTHS ENDED SEPTEMBER 30, 2016 VERSUS 2015
CONSOLIDATED CASH FLOWS
We evaluate our cash flow performance by reviewing our industrial (non-GE Capital) businesses and GE Capital businesses separately. Cash from operating activities (CFOA) is the principal source of cash generation for our industrial businesses. The industrial businesses also have liquidity available via the public capital markets.
GE CASH FLOWS – NINE MONTHS ENDED SEPTEMBER 30
(Dollars in billions)
OPERATING CASH FLOWS | INVESTING CASH FLOWS | FINANCING CASH FLOWS | ||||||||
2015 | 2016 | 2015 | 2016 | 2015 | 2016 | |||||
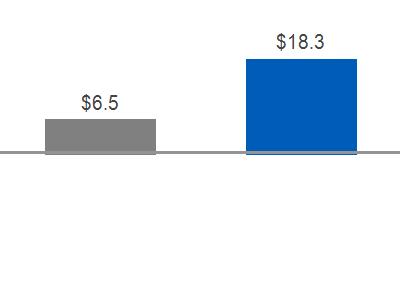 | 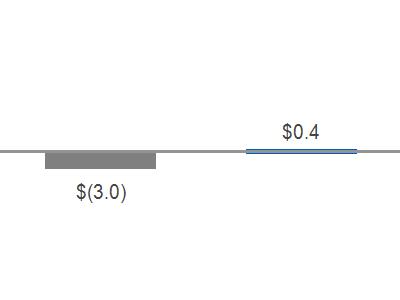
| 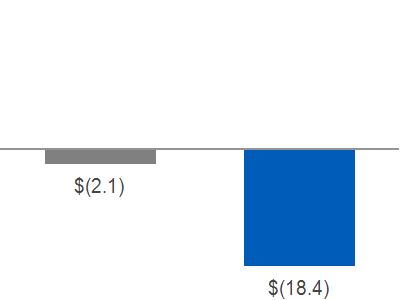
| ||||||||
With respect to GE CFOA, we believe that it is useful to supplement our GE Statement of Cash Flows and to examine in a broader context the business activities that provide and require cash.
The most significant source of cash in GE CFOA is customer-related activities, the largest of which is collecting cash resulting from product or services sales. The most significant operating use of cash is to pay our suppliers, employees, tax authorities and others for a wide range of material and services. Dividends from GE Capital represent the distribution of a portion of GE Capital retained earnings, and are distinct from cash from continuing operations within the GE Capital businesses. See the Intercompany Transactions and Eliminations section for information related to transactions between GE and GE Capital.
2016 – 2015 COMMENTARY
GE cash from operating activities increased $11.8 billion primarily due to the following:
| GE Capital paid common dividends totaling $16.1 billion and $0.5 billion to GE in the nine months ended September 30, 2016 and 2015, respectively. |
| An increase of operating cash collections of $7.7 billion to $84.3 billion in 2016, primarily driven by an increase in progress collections of $1.5 billion and higher GE segment revenues from sales of goods and services due to the impact of the Alstom acquisition in the nine months ended September 30, 2016 compared with that of 2015. |
| These increases were partially offset by an increase in operating cash payments of $11.5 billion to $82.0 billion in 2016, primarily driven by $1.1 billion due to taxes on the sale of our Appliances business to Haier, $0.8 billion increased spend on inventory due to volume growth for end of year 2016 shipments, $0.5 billion incentive compensation payments due to long-term performance awards and higher costs and expenses mainly due to the impact of the Alstom acquisition in the nine months ended September 30, 2016 compared with that of 2015. |
GE cash from investing activities increased $3.4 billion primarily due to the following:
| The sale of our Appliances business to Haier for proceeds of $4.8 billion and the sale of GE Asset Management (GEAM) to State Street Corporation for proceeds of $0.4 billion |
| This is partially offset by payments for principal businesses purchased of $0.9 billion in addition to funding of a joint venture at our Aviation business of $0.3 billion in the nine months ended September 30, 2016. |
2016 3Q FORM 10-Q 44
GE cash used for financing activities increased $16.3 billion primarily due to the following:
| An increase in payment for net repurchases of GE treasury shares of $18.6 billion, including $9.1 billion paid under ASR agreements. |
| This increase was partially offset by a net change in borrowings of $2.1 billion. The change is driven by a short-term loan from GE Capital to GE of $5.0 billion in the nine months ended September 30, 2016, partially offset by $3.4 billion of GE issued unsecured notes in the nine months ended September 30, 2015. |
GE CAPITAL CASH FLOWS – NINE MONTHS ENDED SEPTEMBER 30
(Dollars in billions)
OPERATING CASH FLOWS | INVESTING CASH FLOWS | FINANCING CASH FLOWS | ||||||||
2015 | 2016 | 2015 | 2016 | 2015 | 2016 | |||||
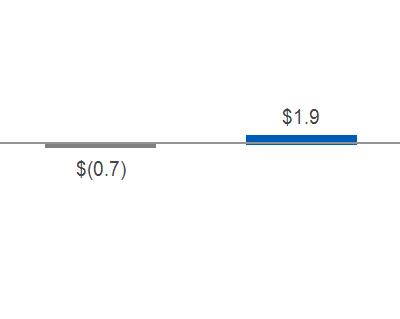 | 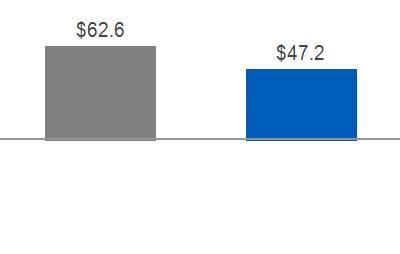 |
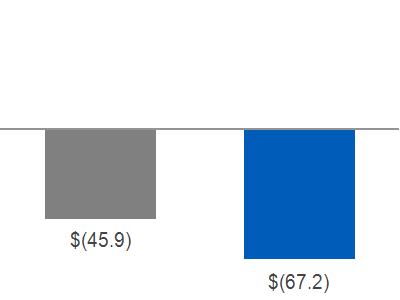
| ||||||||
2016 – 2015 COMMENTARY-CONTINUING OPERATIONS:
GE Capital cash from operating activities-continuing operations increased $2.6 billion primarily due to the following:
| An increase in net cash collateral activity with counterparties on derivative contracts of $3.4 billion in addition to an increase in cash generated from earnings and other activity. |
| These increases were partially offset by higher tax payments. |
GE Capital cash from investing activities-continuing operations decreased $15.4 billion primarily due to the following:
| A short-term loan from GE Capital to GE of $5.0 billion. |
| Higher net investments of $3.7 billion. |
| Lower net cash received from derivative settlements of $3.3 billion. |
| An increase in net financing receivables of $0.9 billion, representing a net increase of $1.7 billion partially offset by the sale of receivables purchased from our Appliances business and sold to Haier for proceeds of $0.8 billion. |
| The 2015 proceeds from principal business dispositions of $0.5 billion. |
| Other investing activities of $7.9 billion, primarily excess cash generated from 2015 collections of financing receivables and other investing assets by discontinued operations prior to disposition of the underlying business. |
| These decreases were partially offset by higher proceeds from the sale of certain of our CLL, Consumer and Real Estate businesses of $4.2 billion and the 2015 acquisition of Milestone Aviation Group resulting in net cash paid of $1.7 billion. |
GE Capital cash used for financing activities-continuing operations increased $21.3 billion primarily due to the following:
| GE Capital paid common dividends totaling $16.1 billion and $0.5 billion to GE in the nine months ended September 30, 2016 and 2015, respectively. |
| In addition, higher net repayments of borrowings of $6.8 billion were partially offset by lower net redemption of investment contracts of $0.7 billion. |
2016 3Q FORM 10-Q 45
GE CAPITAL DISCONTINUED OPERATIONS CASH FLOWS – NINE MONTHS ENDED SEPTEMBER 30
(Dollars in billions)
OPERATING CASH FLOWS | INVESTING CASH FLOWS | FINANCING CASH FLOWS | ||||||||
2015 | 2016 | 2015 | 2016 | 2015 | 2016 | |||||
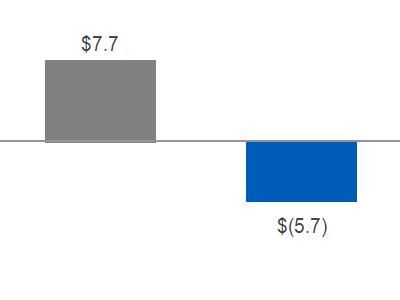 |
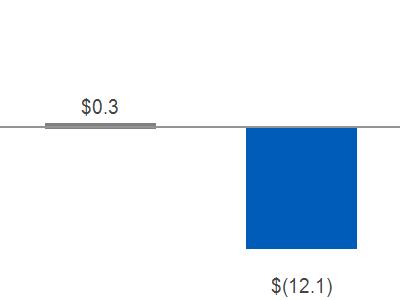 | 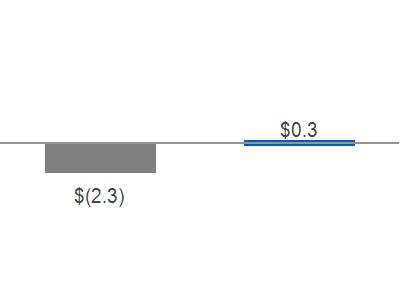 | ||||||||
2016 – 2015 COMMENTARY-DISCONTINUED OPERATIONS:
GE Capital cash from operating activities-discontinued operations decreased $13.4 billion primarily due to the following:
| Lower cash generated as a result of certain dispositions in our CLL business of $11.7 billion, and Consumer business of $4.4 billion (primarily resulting from the 2015 split-off of Synchrony Financial) partially offset by our Real Estate business of $3.1 billion. In connection with the GE Capital Exit Plan, we closed a vast majority of our CLL and Consumer businesses and substantially all of our Real Estate business dispositions in 2015 and 2016. |
| Included in the above were higher tax payments of $2.6 billion, primarily as a result of additional taxes generated by our business disposition activity. |
GE Capital cash from investing activities-discontinued operations decreased $12.4 billion primarily due to the following:
| The sale of bank deposits for $16.5 billion in net cash paid in conjunction with the sale of GE Capital Bank's U.S. online deposit platform to Goldman Sachs Bank USA during the first nine months of 2016. |
| Other investing activities of $2.9 billion, primarily cash generated from 2015 collections of financing receivables and other investing assets prior to disposition of the underlying business. |
| These decreases were partially offset by higher cash used of $7.0 billion resulting from the 2015 split-off of Synchrony Financial, primarily reflecting 2015 increases in financing receivables and investment securities. |
GE Capital cash used for financing activities-discontinued operations decreased $2.5 billion primarily due to the following:
| Lower repayment of borrowings of $7.7 billion as a result of certain dispositions in our Consumer (including $2.9 billion resulting from the 2015 split-off of Synchrony Financial), CLL and Real Estate businesses in connection with the GE Capital Exit Plan. |
| This decrease was partially offset by lower net cash proceeds from bank deposits of $5.4 billion resulting from the 2015 split-off of Synchrony Financial. |
INTERCOMPANY TRANSACTIONS AND ELIMINATIONS
Transactions between related companies are made on an arms-length basis, are eliminated and consist primarily of GE Capital dividends to GE; GE customer receivables sold to GE Capital; GE Capital services for trade receivables management and material procurement; buildings and equipment leased between GE and GE Capital, including sales-leaseback activity; information technology (IT) and other services sold to GE Capital by GE; aircraft engines manufactured by GE that are installed on aircraft purchased by GE Capital from third-party producers for lease to others; expenses related to parent-subsidiary pension plans and various investments, loans and allocations of GE corporate overhead costs.
2016 3Q FORM 10-Q 46
GE Capital is a member of certain GE pension plans. As a result of the GE Capital Exit Plan, GE Capital will have additional funding obligations for these pension plans. These obligations do not relate to the Verticals and are recognized as expense in GE Capital's other continuing operations when they become probable and estimable. GE records a contra expense as GE Capital's additional funding obligations are recognized and GE's related pension obligations are paid by GE Capital. On a consolidated basis, the additional required funding obligations do not affect earnings but rather are reflected as a reduction of the pension liability when paid. In the three and nine months ended September 30, 2016, the additional funding obligations recognized by GE Capital were $0.1 billion and $0.3 billion, respectively. No such funding obligations were recognized in the three and nine months ended September 30, 2015. As of September 30, 2016, the total outstanding funding obligation was $0.2 billion.
GE sells customer receivables to GE Capital in the ordinary course of business to fund the growth of our industrial businesses. During any given period, GE receives cash from the sale of receivables to GE Capital. It also foregoes the future collection of cash on receivables sold as GE Capital will collect the cash from the customer. The incremental amount of cash received from sales of receivables in excess of the cash GE would have otherwise collected had those receivables not been sold, represents the cash generated or used in the period relating to this activity. The effect of cash generated in GE CFOA from selling these receivables to GE Capital increased GE's CFOA by $0.8 billion and decreased GE's CFOA by $0.4 billion for the nine months ended September 30, 2016 and 2015, respectively.
See Note 17 to the consolidated financial statements for additional information about the eliminations of intercompany transactions between GE and GE Capital.
EXPOSURES
FOREIGN CURRENCY
As a result of our global operations, we generate and incur a significant portion of our revenues and expenses in currencies other than the U.S. dollar. The results of operating entities reported in currencies other than U.S. dollar are translated to the U.S. dollar at the applicable exchange rate for inclusion in the financial statements. The foreign currency effect arising from operating activities outside of the U.S., including the remeasurement of derivatives, can result in significant transactional foreign currency fluctuations at points in time, but will generally be offset as the underlying hedged item is recognized in earnings. The effects of foreign currency fluctuations, excluding the earnings impact of the underlying hedged item, decreased net earnings for the three and nine months ended September 30, 2016 by $0.1 billion and $0.4 billion, respectively.
On June 23, 2016, a referendum in the United Kingdom (U.K.) was approved to withdraw from the European Union . The referendum was advisory and the terms of any withdrawal are subject to a negotiation period that could last for two years after the U.K. government initiates the withdrawal process. The approval of the referendum had, and may continue to have, an impact on foreign currency exchange rates, among other things. We actively manage our exposure to the U.K. and do not anticipate a material economic impact from our currency exposure as a result of the recent decision by the U.K. to exit the European Union.
For further information about our risk exposures, our use of derivatives, and the effects of this activity on our financial statements see Notes 15 and 19 to the consolidated financial statements.
OIL & GAS INDUSTRY
The oil and gas market remains challenging. While oil prices increased in the third quarter of 2016, activity remained subdued with U.S. onshore rig and well counts declining from both year-end 2015 and 2014 peak levels, and capital expenditures and investment decisions continuing to be delayed. As a result, our Oil & Gas business has experienced declines in orders through the nine months ended September 30, 2016 of approximately 34%.
In this difficult market our Oil & Gas business will continue to focus on the items within its control such as cost management and competitiveness. Our restructuring investment will likely increase from $0.4 billion to approximately $0.5 billion to achieve our cost reduction target of $0.7 billion to $0.8 billion, as lower volume will offset some of the realization.
2016 3Q FORM 10-Q 47
CRITICAL ACCOUNTING ESTIMATES
We utilized significant estimates in the preparation of the third quarter financial statements.
Please refer to the Critical Accounting Estimates section within MD&A and Note 1, Basis of Presentation and Summary of Significant Accounting Policies, to the consolidated financial statements of our Form 8-K filed on June 3, 2016 related to the 2015 Annual Report on Form 10-K for a discussion of our accounting policies and the critical accounting estimates we use to: recognize revenue on long-term product services agreement; assess the recoverability of assets such as financing receivables and goodwill; determine the fair value of financial assets; and determine our provision for income taxes and recoverability of deferred tax assets.
2016 3Q FORM 10-Q 48
OTHER ITEMS
NEW ACCOUNTING STANDARDS
In February 2016, the Financial Accounting Standards Board (FASB) issued Accounting Standards Update (ASU) No. 2016- 02, Leases . The new standard establishes a right-of-use (ROU) model that requires a lessee to record a ROU asset and a lease liability on the balance sheet for all leases with terms longer than 12 months. Leases will be classified as either finance or operating, with classification affecting the pattern of expense recognition. Similarly, lessors will be required to classify leases as either sales-type, finance or operating, with classification affecting the pattern of income recognition. Classification for both lessees and lessors will be based on an assessment of whether risks and rewards as well as substantive control have been transferred through a lease contract. The new standard is effective for fiscal years beginning after December 15, 2018, including interim periods within those fiscal years, with early adoption permitted. A modified retrospective transition approach is required for leases existing at, or entered into after, the beginning of the earliest comparative period presented in the financial statements, with certain practical expedients available. While we continue to evaluate the effect of the standard on our ongoing financial reporting, we anticipate that the adoption of ASU 2016-02 may materially affect our statement of financial position.
In May 2014, the FASB issued ASU 2014-09, Revenue from Contracts with Customers , which requires an entity to recognize the amount of revenue to which it expects to be entitled for the transfer of promised goods or services to customers. The ASU will replace most existing revenue recognition guidance in GAAP and will be effective for us as of January 1, 2018. The standard permits the use of either the retrospective or modified retrospective (cumulative effect) transition method and we have not yet selected which transition method we will apply. In addition, we are evaluating recently issued guidance on practical expedients as part of our transition decision. Given the complexity of our commercial arrangements, we are continuing to assess the potential effect that the standard is expected to have on our consolidated financial statements. We believe the more significant effects on our existing accounting policies will be associated with our long-term product service agreements and commercial aircraft engine contracts as further discussed below.
For our long-term product service agreements, we expect to continue to recognize revenue over time by applying contract-specific estimated margin rates to incurred costs. The standard provides new guidance in assessing what comprises the distinct service being provided to a customer that may have implications to our existing unit of account and the recognition of contract modifications.
In addition, the revenue for our commercial aircraft engines will be recognized on a point-in-time basis, which is a change from our current long-term contract accounting process of applying contract-specific estimated margin rates to incurred costs.
2016 3Q FORM 10-Q 49
GE DIGITAL
In late 2015, we created GE Digital, whose activities are focused on assisting in the market development of our digital product offerings through software design, fulfillment and product management, while also interfacing with our customers. Digital revenues include software-enabled product upgrades, internally developed software (including Predix TM ) and associated hardware, and software-enabled productivity solutions. These revenues are reported in the financial results of our operating segments.
On September 14, 2016, we acquired the remaining 74% of the software developer Meridium Inc. for cash proceeds of $0.4 billion. The acquisition is expected to enhance and accelerate our asset performance management capabilities across our industrial businesses.
Digital revenues for the three and nine months ended September 30, 2016 were $1.3 billion and $3.6 billion, respectively, compared with $1.2 billion and $3.4 billion for the three and nine months ended September 30, 2015, respectively, and were principally reported in our Power and Healthcare segments.
IRAN THREAT REDUCTION AND SYRIA HUMAN RIGHTS ACT OF 2012
The Company is making the following disclosure pursuant to Section 13(r) of the Securities Exchange Act of 1934.
Under Section 13(r) of the Securities Exchange Act of 1934, enacted in 2012, GE is required to disclose in its periodic reports if it or any of its affiliates knowingly engaged in business activities relating to Iran, even if those activities are conducted in accordance with authorizations subsequently issued by the U.S. Government. Reportable activities include investments that significantly enhance Iran's ability to develop petroleum resources valued at $20 million or more in the aggregate during a twelve-month period. Reporting is also required for transactions related to Iran's domestic production of refined petroleum products or Iran's ability to import refined petroleum products valued at $5 million or more in the aggregate during a twelve-month period.
In January 2016, the U.S. Department of Treasury's Office of Foreign Assets Control (OFAC) issued General License H authorizing U.S.-owned or controlled foreign entities to engage in transactions with Iran if these entities meet the requirements of the general license. Pursuant to this authorization, a non-U.S. affiliate of GE's Power business received a purchase order during the third quarter of 2016 for the sale of spare parts to an Iranian entity to provide electricity and steam to an area of Iran that includes certain oil refineries. The total value of the purchase order is €16.2 million ($18.1 million). The non-U.S. affiliate is still in the process of finalizing this transaction. As of September 30, 2016, no revenue has been recognized and no expenses have been incurred in the execution of the transaction contemplated by the purchase order. The non-U.S. affiliate intends to continue this activity.
Another non-U.S. affiliate of GE's Oil & Gas business signed three contracts during the second quarter of 2016 and two contracts during the third quarter of 2016 for the sale of goods pursuant to General License H that could potentially enhance Iran's ability to develop petroleum resources. These contracts are valued at under $20 million in the aggregate, but GE is reporting them during this quarter in conjunction with the report above. The contracts cover the sale of gas turbine equipment and associated services for ultimate end use by an Iranian company in a gas production project in Iran. These contracts are valued at approximately €11.4 million ($12.8 million), €1.8 million ($2.0 million), €1.1 million ($1.3 million), €408,000 ($460,000) and €69,000 ($78,000). The non-U.S. affiliate has just started operational activities related to these transactions. As of September 30, 2016, no revenue has been recognized and no expenses have been incurred in the execution of the transactions contemplated by these contracts. The non-U.S. affiliate intends to continue this activity.
2016 3Q FORM 10-Q 50
SUPPLEMENTAL INFORMATION
FINANCIAL MEASURES THAT SUPPLEMENT U.S. GENERALLY ACCEPTED ACCOUNTING PRINCIPLES MEASURES (NON-GAAP FINANCIAL MEASURES)
We sometimes use information derived from consolidated financial information but not presented in our financial statements prepared in accordance with U.S. generally accepted accounting principles (GAAP). Certain of these data are considered "non-GAAP financial measures" under U.S. Securities and Exchange Commission rules. Specifically, we have referred to:
| Industrial segment organic revenues |
| Operating and non-operating pension costs |
| Adjusted corporate costs (operating) |
| Industrial operating and GE Capital earnings (loss) from continuing operations and EPS |
| Industrial operating + Verticals earnings and EPS |
| Industrial operating profit and operating profit margin (excluding certain items) |
| Industrial segment operating profit and operating profit margin (excluding Alstom) |
| Industrial cash flows from operating activities (Industrial CFOA) and Industrial CFOA excluding taxes related to the Appliances business sale |
| Capital ending net investment (ENI), excluding liquidity |
The reasons we use these non-GAAP financial measures and the reconciliations to their most directly comparable GAAP financial measures follow.
2016 3Q FORM 10-Q 51
INDUSTRIAL SEGMENT ORGANIC REVENUES | |||||||||||||||
Three months ended September 30 | Nine months ended September 30 | ||||||||||||||
(Dollars in millions) | 2016 | 2015 | V% | 2016 | 2015 | V% | |||||||||
Industrial segment revenues (GAAP) | $ | 27,421 | $ | 26,256 | 4% | $ | 81,920 | $ | 77,445 | 6 % | |||||
Adjustments: | |||||||||||||||
Acquisitions | 3,261 | - | 9,291 | - | |||||||||||
Business dispositions (other than dispositions of businesses | |||||||||||||||
acquired for investment) | - | 2,219 | 1,133 | 4,962 | |||||||||||
Currency exchange rates | (37) | - | (729) | - | |||||||||||
Industrial segment organic revenues (Non-GAAP) | $ | 24,198 | $ | 24,038 | 1% | $ | 72,224 | $ | 72,483 | - | |||||
Organic revenue growth measures revenue excluding the effects of acquisitions, business dispositions and currency exchange rates. We believe that this measure provides management and investors with a more complete understanding of underlying operating results and trends of established, ongoing operations by excluding the effect of acquisitions, dispositions and currency exchange, which activities are subject to volatility and can obscure underlying trends. We also believe that presenting organic revenue growth separately for our industrial businesses provides management and investors with useful information about the trends of our industrial businesses and enables a more direct comparison to other non-financial businesses and companies. Management recognizes that the term "organic revenue growth" may be interpreted differently by other companies and under different circumstances. Although this may have an effect on comparability of absolute percentage growth from company to company, we believe that these measures are useful in assessing trends of the respective businesses or companies and may therefore be a useful tool in assessing period-to-period performance trends.
OPERATING AND NON-OPERATING PENSION COSTS | |||||||||||
Three months ended September 30 | Nine months ended September 30 | ||||||||||
(In millions) | 2016 | 2015 | 2016 | 2015 | |||||||
Service cost for benefits earned | $ | 307 | $ | 348 | $ | 913 | $ | 1,076 | |||
Prior service cost amortization | 76 | 51 | 228 | 154 | |||||||
Curtailment loss (gain) | - | - | (1) | 71 | |||||||
Operating pension costs (Non-GAAP) | 383 | 399 | 1,140 | 1,301 | |||||||
Expected return on plan assets | (837) | (826) | (2,507) | (2,478) | |||||||
Interest cost on benefit obligations | 736 | 696 | 2,205 | 2,087 | |||||||
Net actuarial loss amortization | 612 | 823 | 1,836 | 2,468 | |||||||
Non-operating pension costs (Non-GAAP) | 511 | 693 | 1,534 | 2,077 | |||||||
Total principal pension plans costs (GAAP) | $ | 894 | $ | 1,092 | $ | 2,674 | $ | 3,378 | |||
We have provided the operating and non-operating components of cost for our principal pension plans. Operating pension cost comprise the service cost of benefits earned, prior service cost amortization and curtailment loss (gain) for our principal pension plans. Non-operating pension cost comprise the expected return on plan assets, interest cost on benefit obligations and net actuarial loss amortization for our principal pension plans. We believe that the operating components of pension cost better reflects the ongoing service-related cost of providing pension benefits to our employees. We believe that the operating and non-operating components of cost for our principal pension plans, considered along with the corresponding GAAP measure, provide management and investors with additional information for comparison of our pension plan cost and operating results with the pension plan cost and operating results of other companies.
2016 3Q FORM 10-Q 52
ADJUSTED CORPORATE COSTS (OPERATING) | ||||||||||||
Three months ended September 30 | Nine months ended September 30 | |||||||||||
(In millions) | 2016 | 2015 | 2016 | 2015 | ||||||||
Total Corporate Items and Eliminations (GAAP) | $ | (1,524) | $ | (1,559) | $ | (2,120) | $ | (4,436) | ||||
Less: non-operating pension costs (Non-GAAP) | (511) | (693) | (1,534) | (2,077) | ||||||||
Total Corporate costs (operating) (Non-GAAP) | $ | (1,012) | $ | (866) | $ | (586) | $ | (2,359) | ||||
Less: restructuring and other charges, gains (losses) and settlement | (475) | (346) | 838 | (668) | ||||||||
Adjusted total corporate costs (operating) (Non-GAAP) | $ | (538) | $ | (520) | $ | (1,424) | $ | (1,691) | ||||
Operating corporate costs exclude non-service-related pension costs of our principal pension plans, which comprise interest costs, expected return on plan assets and amortization of actuarial gains/losses. Service cost, prior service cost and curtailment loss components of our principal pension plans are included in operating corporate costs. We believe that these components of pension cost better reflect the ongoing service-related costs of providing pension benefits to our employees. Accordingly, we believe that our measure of operating corporate costs provides management and investors with a useful measure of the operational costs incurred outside of our businesses. We believe that this measure, considered along with the corresponding GAAP measure, provides management and investors with additional information for comparison of our operating corporate costs to the operating corporate costs of other companies.
We also believe that adjusting operating corporate costs to exclude the effects of items that are not closely associated with ongoing corporate operations, such as earnings of previously divested businesses, gains and losses on disposed and held for sale businesses, and restructuring and other charges, provides management and investors with a meaningful measure that increases the period-to-period comparability of our ongoing corporate costs.
2016 3Q FORM 10-Q 53
INDUSTRIAL OPERATING EARNINGS AND GE CAPITAL EARNINGS (LOSS) | |||||||||||||||
FROM CONTINUING OPERATIONS AND EPS | |||||||||||||||
Three months ended September 30 | Nine months ended September 30 | ||||||||||||||
(Dollars in millions; except per share amounts) | 2016 | 2015 | V% | 2016 | 2015 | V% | |||||||||
Consolidated earnings (loss) from continuing operations | |||||||||||||||
attributable to GE common shareowners (GAAP) | $ | 2,097 | $ | 1,965 | 7% | $ | 5,645 | $ | (904) | F | |||||
Non-operating pension costs (pre-tax) | 511 | 693 | 1,534 | 2,077 | |||||||||||
Tax effect on non-operating pension costs(a) | (179) | (243) | (537) | (727) | |||||||||||
Adjustment: non-operating pension costs (net of tax) | 332 | 450 | 997 | 1,350 | |||||||||||
Operating earnings (loss) (Non-GAAP) | 2,429 | 2,415 | 1% | 6,642 | 448 | F | |||||||||
Adjustment: GE Capital earnings (loss) from continuing operations | |||||||||||||||
attributable to GE common shareowners | 26 | (154) | (1,466) | (6,368) | |||||||||||
Industrial operating earnings (loss) (Non-GAAP) | $ | 2,404 | $ | 2,569 | (6)% | $ | 8,109 | $ | 6,814 | 19% | |||||
Earnings (loss) per share(EPS) – diluted(b) | |||||||||||||||
Consolidated EPS from continuing operations attributable to | |||||||||||||||
GE common shareowners (GAAP) | $ | 0.23 | $ | 0.19 | 21% | $ | 0.61 | $ | (0.09) | F | |||||
Adjustment: non-operating pension costs (net of tax) | 0.04 | 0.04 | 0.11 | 0.13 | |||||||||||
Operating EPS (Non-GAAP) | 0.27 | 0.24 | 13% | 0.72 | 0.04 | F | |||||||||
GE Capital EPS from continuing operations attributable to | |||||||||||||||
GE common shareowners (GAAP) | - | (0.02) | 100% | (0.16) | (0.63) | 75% | |||||||||
Industrial operating EPS (Non-GAAP) | $ | 0.27 | $ | 0.25 | 8% | $ | 0.88 | $ | 0.68 | 29% | |||||
(a) | The tax effect on non-operating pension costs was calculated using a 35% U.S. federal statutory tax rate, based on its applicability to such cost. |
(b) | Earnings-per-share amounts are computed independently. As a result, the sum of per-share amounts may not equal the total. |
Operating earnings (loss) excludes non-service related pension costs of our principal pension plans comprising interest cost, expected return on plan assets and amortization of actuarial gains/losses. The service cost, prior service cost and curtailment loss components of our principal pension plans are included in operating earnings. We believe that these components of pension cost better reflect the ongoing service-related costs of providing pension benefits to our employees. As such, we believe that our measure of operating earnings (loss) provides management and investors with a useful measure of the operational results of our business. Other components of GAAP pension cost are mainly driven by capital allocation decisions and market performance, and we manage these separately from the operational performance of our businesses. Non-operating pension costs are not necessarily indicative of the current or future cash flow requirements related to our pension plan. We also believe that this measure, considered along with the corresponding GAAP measure, provides management and investors with additional information for comparison of our operating results to the operating results of other companies.
2016 3Q FORM 10-Q 54
INDUSTRIAL OPERATING + VERTICALS EARNINGS AND EPS | |||||||||||||||
Three months ended September 30 | Nine months ended September 30 | ||||||||||||||
(Dollars in millions; except per share amounts) | 2016 | 2015 | V% | 2016 | 2015 | V% | |||||||||
GE Capital earnings (loss) from continuing operations | |||||||||||||||
attributable to GE common shareowners (GAAP) | $ | 26 | $ | (154) | F | $ | (1,466) | $ | (6,368) | 77% | |||||
Adjustment: GE Capital other continuing | |||||||||||||||
earnings (loss) (Other Capital) | (441) | (504) | (2,881) | (7,596) | |||||||||||
Verticals earnings(a) | $ | 466 | $ | 351 | 33% | 1,414 | 1,228 | 15% | |||||||
Industrial operating earnings (Non-GAAP) | $ | 2,404 | $ | 2,569 | (6)% | $ | 8,109 | $ | 6,814 | 19% | |||||
Verticals earnings(a) | 466 | 351 | 1,414 | 1,228 | |||||||||||
Industrial operating earnings + Verticals earnings (Non-GAAP) | $ | 2,870 | $ | 2,920 | (2)% | $ | 9,523 | $ | 8,042 | 18% | |||||
Adjustment: Non-operating pension costs and | |||||||||||||||
other Capital | (773) | (954) | (3,878) | (8,946) | |||||||||||
Earnings (loss) from continuing operations attributable to | |||||||||||||||
GE common shareowners (GAAP) | $ | 2,097 | $ | 1,965 | 7% | $ | 5,645 | $ | (904) | F | |||||
Earnings (loss) per share (EPS) - diluted(b) | |||||||||||||||
Industrial operating EPS (Non-GAAP) | $ | 0.27 | $ | 0.25 | 8% | $ | 0.88 | $ | 0.68 | 29% | |||||
Verticals EPS | 0.05 | 0.03 | 0.15 | 0.12 | |||||||||||
Industrial operating + Verticals EPS (Non-GAAP) | $ | 0.32 | $ | 0.29 | 10% | $ | 1.03 | $ | 0.80 | 29% | |||||
Adjustment: Non-operating pension costs and | |||||||||||||||
other Capital | (0.09) | (0.09) | (0.42) | (0.89) | |||||||||||
EPS from continuing operations (GAAP) | $ | 0.23 | $ | 0.19 | 21% | $ | 0.61 | $ | (0.09) | F | |||||
(a) | Verticals include businesses expected to be retained (GECAS, EFS, Industrial Finance, and run-off Insurance), including allocated corporate costs of $25 million after tax in both the three months ended September 30, 2016 and 2015, and $75 million and $108 million after tax in the nine months ended September 30, 2016 and 2015, respectively. |
(b) | Earnings-per-share amounts are computed independently. As a result, the sum of per-share amounts may not equal the total. |
To supplement the table above, we have provided the following graphic presentation of the reconciliation between GAAP EPS from continuing operations to Industrial operating + Verticals EPS (Non-GAAP).
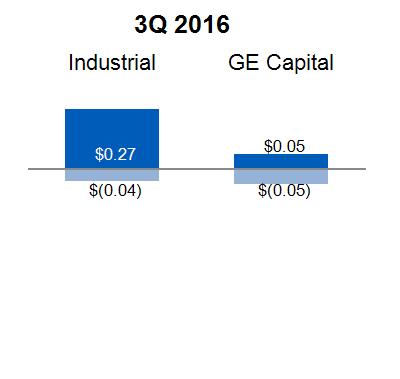 |
Industrial operating & Verticals (Non-GAAP)
Non-operating pension & other Capital (Non-GAAP) GAAP Continuing EPS |
$ 0.32
$(0.09) $0.23 | 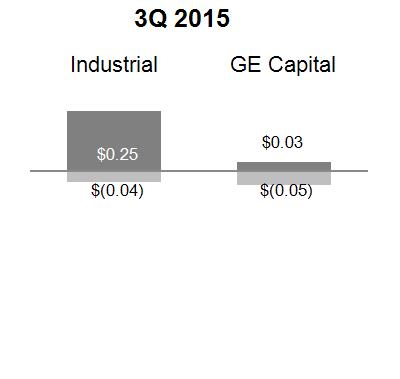 |
Industrial operating & Verticals (Non-GAAP)
Non-operating pension & other Capital (Non-GAAP) GAAP Continuing EPS |
$0.29
$(0.09) $0.19 |
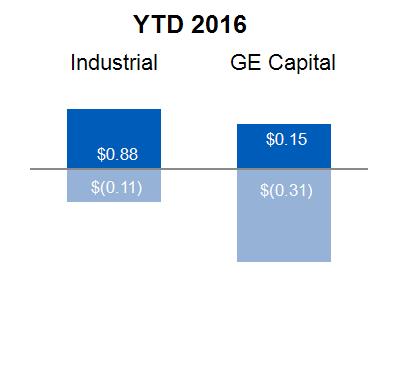 |
Industrial operating & Verticals (Non-GAAP)
Non-operating pension & other Capital (Non-GAAP) GAAP Continuing EPS |
$1.03
$(0.42) $0.61 | 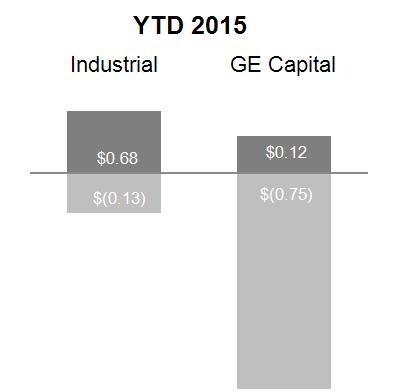 |
Industrial operating & Verticals (Non-GAAP)
Non-operating pension & other Capital (Non-GAAP) GAAP Continuing EPS |
$0.80
$(0.89) $(0.09) |
As described above, Verticals represents the GE Capital businesses that we expect to retain. We believe that presenting Industrial operating + Verticals earnings-per-share (Non-GAAP) amounts provides management and investors with a useful measure to evaluate the performance of the businesses we expect to retain after the disposition of most of our financial services business.
2016 3Q FORM 10-Q 55
INDUSTRIAL OPERATING PROFIT AND OPERATING PROFIT MARGIN (EXCLUDING CERTAIN ITEMS) | |||||||||||
Three months ended September 30 | Nine months ended September 30 | ||||||||||
(Dollars in millions) | 2016 | 2015 | 2016 | 2015 | |||||||
Revenues | |||||||||||
GE total revenues and other income | $ | 27,172 | $ | 25,659 | $ | 82,382 | $ | 70,408 | |||
Less: GE Capital earnings (loss) from continuing operations | 26 | (154) | (1,466) | (6,207) | |||||||
GE revenues and other income | |||||||||||
excluding GE Capital earnings (loss) (Industrial revenues) (GAAP) | $ | 27,146 | $ | 25,813 | $ | 83,848 | $ | 76,615 | |||
Less: gains | 208 | - | 3,395 | 499 | |||||||
Less: Alstom revenues | 3,226 | - | 9,210 | - | |||||||
Adjusted Industrial revenues (Non-GAAP) | $ | 23,712 | $ | 25,813 | $ | 71,244 | $ | 76,115 | |||
Costs | |||||||||||
GE total costs and expenses | $ | 24,909 | $ | 23,325 | $ | 75,977 | $ | 70,048 | |||
Less: GE interest and other financial charges | 483 | 440 | 1,490 | 1,243 | |||||||
Industrial costs excluding interest and other financial charges (GAAP) | $ | 24,426 | $ | 22,885 | $ | 74,487 | $ | 68,805 | |||
Less: Alstom costs and expenses | 3,082 | - | 8,949 | - | |||||||
Less: non-operating pension costs (pre-tax) | 511 | 693 | 1,534 | 2,077 | |||||||
Less: restructuring and other charges | 683 | 346 | 2,557 | 1,167 | |||||||
Less: noncontrolling interests and 2015 GE Capital preferred stock dividends | 76 | 43 | 275 | 199 | |||||||
Adjusted Industrial costs (Non-GAAP) | $ | 20,074 | $ | 21,803 | $ | 61,172 | $ | 65,362 | |||
Industrial profit (GAAP) | $ | 2,720 | $ | 2,928 | $ | 9,361 | $ | 7,810 | |||
Industrial margins (GAAP) | 10.0% | 11.3% | 11.2% | 10.2% | |||||||
Industrial operating profit (Non-GAAP) | $ | 3,638 | $ | 4,009 | $ | 10,070 | $ | 10,754 | |||
Industrial operating profit margins (Non-GAAP) | 15.3% | 15.5% | 14.1% | 14.1% | |||||||
. | . | ||||||||||
We have presented our Industrial operating profit and operating profit margin excluding gains, non-operating pension costs (pre-tax), restructuring and other, noncontrolling interests, GE Capital preferred stock dividends, as well as the results of Alstom. We believe that Industrial operating profit and operating profit margin adjusted for these items are meaningful measures because they increase the comparability of period-to-period results.
INDUSTRIAL SEGMENT OPERATING PROFIT AND OPERATING PROFIT MARGIN (EXCLUDING ALSTOM) | |||||||||||
Three months ended September 30 | Nine months ended September 30 | ||||||||||
(Dollars in millions) | 2016 | 2015 | 2016 | 2015 | |||||||
Revenues | |||||||||||
Total industrial segment revenues (GAAP) | $ | 27,421 | $ | 26,256 | $ | 81,920 | $ | 77,445 | |||
Less: Alstom revenues | 3,226 | - | 9,210 | - | |||||||
Total industrial segment operating revenues excluding Alstom (Non-GAAP) | $ | 24,195 | $ | 26,256 | $ | 72,710 | $ | 77,445 | |||
Segment profit (loss) | |||||||||||
Total industrial segment operating profit (GAAP) | $ | 4,320 | $ | 4,530 | $ | 11,756 | $ | 12,445 | |||
Total industrial segment operating profit margin (GAAP) | 15.8% | 17.3% | 14.4% | 16.1% | |||||||
Less: Alstom profit (loss) | $ | 144 | $ | - | $ | 261 | $ | - | |||
Total industrial segment operating profit excluding Alstom (Non-GAAP) | $ | 4,176 | $ | 4,530 | $ | 11,494 | $ | 12,445 | |||
Total industrial segment operating profit margin excluding Alstom (Non-GAAP) | 17.3% | 17.3% | 15.8% | 16.1% | |||||||
. | . | ||||||||||
We have presented our industrial segment operating profit and industrial segment operating profit margin excluding the results of Alstom power and grid. We believe that operating profit and operating profit margin adjusted for the Alstom impacts are meaningful measures because they increase the comparability of period-to-period results.
2016 3Q FORM 10-Q 56
INDUSTRIAL CASH FLOWS FROM OPERATING ACTIVITIES (INDUSTRIAL CFOA) | |||||||
AND INDUSTRIAL CFOA EXCLUDING TAXES RELATED TO THE APPLIANCES BUSINESS SALE | |||||||
Nine months ended September 30 | |||||||
(Dollars in millions) | 2016 | 2015 | V% | ||||
Cash from GE's operating activities (continuing operations), as reported (GAAP) | $ | 18,342 | $ | 6,526 | F | ||
Adjustments: dividends from GE Capital | 16,050 | 450 | |||||
Industrial CFOA (Non-GAAP) | $ | 2,292 | $ | 6,076 | (62)% | ||
Adjustment: taxes related to the Appliances business sale | 1,076 | - | |||||
Industrial CFOA excluding deal taxes (Non-GAAP) | $ | 3,368 | $ | 6,076 | (45)% | ||
We define "Industrial CFOA" as GE's cash from operating activities (continuing operations) less the amount of dividends received by GE from GE Capital. This includes the effects of intercompany transactions, including GE customer receivables sold to GE Capital; GE Capital services for trade receivables management and material procurement; buildings and equipment leased by GE from GE Capital; information technology (IT) and other services sold to GE Capital by GE; aircraft engines manufactured by GE that are installed on aircraft purchased by GE Capital from third-party producers for lease to others; and various investments, loans and allocations of GE corporate overhead costs. We believe that investors may find it useful to compare GE's operating cash flows without the effect of GE Capital dividends, since these dividends are not representative of the operating cash flows of our industrial businesses and can vary from period to period based upon the results of the financial services businesses. We also believe that investors may find it useful to compare Industrial CFOA excluding the effects of taxes paid related to the Appliances business sale. Management recognizes that these measures may not be comparable to cash flow results of companies which contain both industrial and financial services businesses, but believes that this comparison is aided by the provision of additional information about the amounts of dividends paid by our financial services business and the separate presentation in our financial statements of the GE Capital cash flows. We believe that our measure of Industrial CFOA and Industrial CFOA excluding Appliances sale-related taxes provides management and investors with useful measures to compare the capacity of our industrial operations to generate operating cash flow with the operating cash flow of other non-financial businesses and companies and as such provides useful measures to supplement the reported GAAP CFOA measure.
CAPITAL ENDING NET INVESTMENT (ENI), EXCLUDING LIQUIDITY | |||||
(In billions) | September 30, 2016 | September 30, 2015(b) | |||
Financial Services (GE Capital) total assets (GAAP) | $ | 202.7 | $ | 433.8 | |
Adjustment deferred income tax | 6.0 | - | |||
GE Capital total assets | $ | 208.7 | $ | 433.8 | |
Less assets of discontinued operations | 30.9 | 121.9 | |||
Less non-interest bearing liabilities | 44.6 | 50.3 | |||
Capital ENI (Non-GAAP) | $ | 133.2 | $ | 261.6 | |
Less liquidity(a) | 54.1 | 85.5 | |||
Capital ENI, excluding liquidity (Non-GAAP) | $ | 79.1 | $ | 176.1 | |
Discontinued operations, excluding liquidity | 24.0 | 94.5 | |||
Total ENI (excluding liquidity) including discontinued operations (Non-GAAP) | $ | 103.1 | $ | 270.6 | |
(a) | Liquidity includes cash and equivalents and $12.2 billion of high quality investments at September 30, 2016 |
(b) | As originally reported |
We use ENI to measure the size of our Capital segment. We believe that this measure is a useful indicator of the capital (debt or equity) required to fund a business as it adjusts for non-interest bearing current liabilities generated in the normal course of business that do not require a capital outlay. We also believe that by excluding liquidity, we provide a meaningful measure of assets requiring capital to fund our Capital segment as a substantial amount of liquidity resulted from debt issuances to pre-fund future debt maturities and will not be used to fund additional assets. Liquidity consists of cash and equivalents and certain high quality investments. As a general matter, investments included in liquidity are expected to be highly liquid, giving us the ability to readily convert them to cash. Providing this measure will help investors measure how we are performing against our previously communicated goal to reduce the size of our financial services segment.
2016 3Q FORM 10-Q 57
CONTROLS AND PROCEDURES
Under the direction of our Chief Executive Officer and Chief Financial Officer, we evaluated our disclosure controls and procedures and internal control over financial reporting and concluded that our disclosure controls and procedures were effective as of September 30, 2016.
OTHER FINANCIAL DATA
PURCHASES OF EQUITY SECURITIES BY THE ISSUER AND AFFILIATED PURCHASERS | ||||||||||
Approximate | ||||||||||
dollar value | ||||||||||
Total number | of shares that | |||||||||
of shares | may yet be | |||||||||
purchased | purchased | |||||||||
as part of | under our | |||||||||
Total number | Average | our share | share | |||||||
of shares | price paid | repurchase | repurchase | |||||||
Period | purchased(a) | per share | program(b) | program(b) | ||||||
(Shares in thousands) | ||||||||||
2016 | ||||||||||
July | 21,914 | $ | 32.10 | 21,862 | ||||||
August | 5,763 | 31.16 | 5,720 | |||||||
September(c) | 111,838 | 31.63 | 111,796 | |||||||
Total | 139,515 | $ | 31.68 | 139,378 | $ | 28.5 | billion | |||
| (a) | This category included 137 thousand shares repurchased from our various benefit plans. |
| (b) | Shares were repurchased through the 2015 GE Share Repurchase Program (the Program). As of September 30, 2016, we were authorized to repurchase up to $50.0 billion of our common stock through 2018 and we had repurchased a total of approximately $21.5 billion under the Program. The Program is flexible and shares will be acquired with a combination of borrowings and free cash flow from the public markets and other sources, including GE Stock Direct, a stock purchase plan that is available to the public. The total amount remaining under our share repurchase program excludes an unsettled amount of $0.4 billion under an accelerated share repurchase (ASR) agreement. |
| (c) | Includes 71,189 thousand shares repurchased at an average price of $29.85 per share pursuant to an ASR agreement. |
2016 3Q FORM 10-Q 58
REGULATIONS AND SUPERVISION
With the rescission of its designation as a nonbank SIFI, GE Capital's activities are no longer subject to the consolidated supervision of the Federal Reserve or subject to the enhanced prudential standards set forth in the Dodd Frank Wall Street Reform and Consumer Protection Act and its implementing regulations, including minimum regulatory capital and liquidity requirements, submission of annual resolution plans, the Volcker Rule and regulatory reporting requirements.
GE Capital's international operations are consolidated under GE Capital International Holdings Limited, a wholly owned subsidiary of GE Capital. GE Capital International Holdings Limited continues to maintain its own capital structure and is supervised by the U.K. Prudential Regulation Authority (PRA). The PRA's supervision includes capital and liquidity standards that could impact the payment of dividends to GE Capital.
2016 3Q FORM 10-Q 59
LEGAL PROCEEDINGS
The following information supplements and amends our discussion set forth under "Legal Proceedings" in our Annual Report on Form 10-K for the fiscal year ended December 31, 2015 and our Quarterly Reports on Form 10-Q for the quarters ended March 31, 2016 and June 30, 2016.
There are 10 lawsuits relating to pending mortgage loan repurchase claims in which WMC, our U.S. mortgage business that we sold in 2007, is a party. The adverse parties in these cases are securitization trustees or parties claiming to act on their behalf. While the alleged claims for relief vary from case to case, the complaints and counterclaims in these actions generally assert claims for breach of contract, indemnification, and/or declaratory judgment, and seek specific performance (repurchase) and/or monetary damages. Beginning in the fourth quarter 2013, WMC entered into settlements that reduced its exposure on claims asserted in certain securitizations, and the claim amounts reported herein reflect the effect of these settlements.
Five WMC cases are pending in the United States District Court for the District of Connecticut. Four of these cases were initiated in 2012, and one was initiated in the third quarter 2013. Deutsche Bank National Trust Company (Deutsche Bank) is the adverse party in four cases, and Law Debenture Trust Company of New York (Law Debenture) is the adverse party in one case. The Deutsche Bank complaints assert claims on approximately $4,300 million of mortgage loans and seek to recover damages in excess of approximately $1,800 million. The Law Debenture complaint asserts claims on approximately $800 million of mortgage loans, and alleges losses on these loans in excess of approximately $425 million. In September, WMC and Deutsche Bank agreed to settle all claims arising out of the four securitizations at issue in the Connecticut lawsuits, subject to judicial approvals. In October, Deutsche Bank filed petitions for instruction in California state court seeking judicial instructions that Deutsche Bank's entry into the settlement agreements was a reasonable exercise of its discretion and approving the distribution of settlement proceeds pursuant to the terms of each trust's governing documents.
At June 30, 2016, four WMC cases were pending in the United States District Court for the District of Minnesota against US Bank National Association (US Bank). Following the July 2016 order of the Minnesota state court approving the settlement of these cases and the expiration of the appeal period in September 2016, the District Court entered orders on September 29 and 30, 2016, dismissing all four cases with prejudice.
Four cases are pending against WMC in New York State Supreme Court, all of which were initiated by securitization trustees or securities administrators. These cases involve, in the aggregate, claims involving approximately $4,559 million of mortgage loans. One of these lawsuits was initiated by Deutsche Bank in the second quarter 2013 and names as defendants WMC and Barclays Bank PLC. It involves claims against WMC on approximately $1,000 million of mortgage loans and does not specify the amount of damages sought. In September 2016, WMC and Deutsche Bank agreed to settle all claims arising out of the two securitizations at issue in this lawsuit, subject to judicial approvals. In October 2016, Deutsche Bank filed petitions for instruction in California state court seeking judicial instructions that Deutsche Bank's entry into the settlement agreements was a reasonable exercise of its discretion and approving the distribution of settlement proceeds pursuant to the terms of each trust's governing documents. The second case, in which the plaintiff is The Bank of New York Mellon (BNY), was initiated in the fourth quarter 2012 and names as defendants WMC, J.P. Morgan Mortgage Acquisition Corporation and JPMorgan Chase Bank, N.A. BNY asserts claims on approximately $1,300 million of mortgage loans, and seeks to recover damages in excess of $650 million. The third case was initiated by BNY in November 2013 and names as defendants WMC, J.P. Morgan Mortgage Acquisition Corporation and JPMorgan Chase Bank, N.A. In this case, BNY asserts claims on approximately $1,300 million of mortgage loans, and seeks to recover damages in excess of $600 million. On September 18, 2015, the court granted defendants' motion to dismiss this case on statute of limitations grounds, and the plaintiff filed a notice of appeal on October 21, 2015. The fourth case was filed in October 2014 and names as defendants WMC, J.P. Morgan Mortgage Acquisition Corporation and JPMorgan Chase Bank, N.A. The plaintiff, BNY, asserts claims on approximately $959 million of mortgage loans and seeks to recover damages in excess of $475 million.
2016 3Q FORM 10-Q 60
One case is pending against WMC in the United States District Court for the Southern District of New York. The case was initiated by the Federal Housing Finance Agency (FHFA) in the fourth quarter 2012. In the second quarter 2013, Deutsche Bank, in its role as securitization trustee, intervened as a plaintiff and filed a complaint relating to approximately $1,300 million of loans and alleging losses in excess of approximately $100 million. In December 2013, the District Court issued an order denying WMC's motion to dismiss but, on its own motion, ordered re-briefing on several issues raised by WMC's motion to dismiss in February 2015. On July 10, 2015, the District Court entered an order dismissing the lawsuit as time-barred under the applicable statute of limitations. Deutsche Bank filed a notice of appeal from this order of dismissal on August 13, 2015, and the United States Court of Appeals for the Second Circuit heard oral argument on June 10, 2016. In September 2016, WMC and Deutsche Bank agreed to settle all claims arising out of the securitization at issue in this lawsuit, subject to judicial approval. In October 2016, Deutsche Bank filed a petition for instruction in California state court seeking judicial instructions that Deutsche Bank's entry into the settlement agreement was a reasonable exercise of its discretion and approving the distribution of settlement proceeds pursuant to the terms of the trust's governing documents. The court has scheduled the initial hearing on this petition, and the other petitions filed by Deutsche Bank referenced above, for April 2017.
The amounts of the claims at issue in these cases (discussed above) reflect the purchase price or unpaid principal balances of the mortgage loans at issue at the time of purchase and do not give effect to pay downs, accrued interest or fees, or potential recoveries based upon the underlying collateral. All of the mortgage loans involved in these lawsuits are included in WMC's reported claims at September 30, 2016. See Note 2 to the consolidated financial statements for additional information.
In December 2015, we learned that, as part of continuing industry-wide investigation of subprime mortgages, the Civil Division of the U.S. Department of Justice is investigating potential violations of the Financial Institutions Reform, Recovery, and Enforcement Act of 1989 (FIRREA) by WMC and its affiliates arising out of the origination, purchase or sale of residential mortgage loans between January 1, 2005 and December 31, 2007. The Justice Department subsequently issued subpoenas to WMC and GE Capital, and we are cooperating with the Justice Department's investigation.
As previously reported, in 2000, GE and the Environmental Protection Agency (EPA) entered into a consent decree relating to PCB cleanup of the Housatonic River in Massachusetts. Following the EPA's release in September 2015 of an intended final remediation decision, GE and the EPA engaged in mediation and the first step of the dispute resolution process contemplated by the consent decree. In October 2016, the EPA issued its final decision pursuant to the consent decree, commencing a 30-day period for GE and other interested parties to appeal the decision to the EPA's Environmental Appeals Board and ultimately to the United States Court of Appeals for the First Circuit. The EPA may not implement any remedy until all appeals are exhausted. As of September 30, 2016, and based on its assessment of current facts and circumstances and its defenses, GE believes that it has recorded adequate reserves to cover future obligations associated with an expected final remedy.
2016 3Q FORM 10-Q 61
[PAGE INTENTIONALLY LEFT BLANK]
2016 3Q FORM 10-Q 62
FINANCIAL STATEMENTS AND NOTES
Statement of Earnings (Loss) | 64 | |||
Consolidated Statement of Comprehensive Income (Loss) | 68 | |||
Consolidated Statement of Changes in Shareowners' Equity | 69 | |||
Statement of Financial Position | 70 | |||
Statement of Cash Flows | 72 | |||
Notes to Consolidated Financial Statements | ||||
1 | Basis of Presentation and Summary of Significant Accounting Policies | 74 | ||
2 | Businesses Held for Sale and Discontinued Operations | 76 | ||
3 | Investment Securities | 81 | ||
4 | Inventories | 84 | ||
5 | GE Capital Financing Receivables and Allowance for Losses on Financing Receivables | 84 | ||
6 | Property, Plant and Equipment | 85 | ||
7 | Acquisitions, Goodwill and Other Intangible Assets | 85 | ||
8 | Contract Assets | 90 | ||
9 | Borrowings | 91 | ||
10 | Postretirement Benefit Plans | 93 | ||
11 | Income Taxes | 94 | ||
12 | Shareowners' Equity | 95 | ||
13 | Earnings Per Share Information | 99 | ||
14 | Fair Value Measurements | 101 | ||
15 | Financial Instruments | 106 | ||
16 | Variable Interest Entities | 112 | ||
17 | Intercompany Transactions | 114 | ||
18 | Guarantor Financial Information | 115 | ||
19 | Supplemental Information | 121 | ||
2016 3Q FORM 10-Q 63
FINANCIAL STATEMENTS
STATEMENT OF EARNINGS (LOSS) | |||||
(UNAUDITED) | |||||
Three months ended September 30 | |||||
General Electric Company | |||||
and consolidated affiliates | |||||
(In millions; per-share amounts in dollars) | 2016 | 2015 | |||
Revenues and other income | |||||
Sales of goods | $ | 18,553 | $ | 17,860 | |
Sales of services | 8,261 | 7,667 | |||
Other income | 227 | 169 | |||
GE Capital earnings (loss) from continuing operations | - | - | |||
GE Capital revenues from services | 2,224 | 2,332 | |||
Total revenues and other income | 29,266 | 28,028 | |||
Costs and expenses | |||||
Cost of goods sold | 15,255 | 14,198 | |||
Cost of services sold | 5,711 | 5,657 | |||
Selling, general and administrative expenses | 4,343 | 4,258 | |||
Interest and other financial charges | 961 | 897 | |||
Investment contracts, insurance losses and | |||||
insurance annuity benefits | 684 | 673 | |||
Other costs and expenses | 238 | 295 | |||
Total costs and expenses | 27,191 | 25,978 | |||
Earnings (loss) from continuing operations before income taxes | 2,074 | 2,050 | |||
Benefit (provision) for income taxes | (18) | (135) | |||
Earnings (loss) from continuing operations | 2,056 | 1,915 | |||
Earnings (loss) from discontinued operations, net of taxes (Note 2) | (105) | 629 | |||
Net earnings (loss) | 1,951 | 2,545 | |||
Less net earnings (loss) attributable to noncontrolling interests | (76) | 39 | |||
Net earnings (loss) attributable to the Company | 2,027 | 2,506 | |||
Preferred stock dividends | (33) | - | |||
Net earnings (loss) attributable to GE common shareowners | $ | 1,994 | $ | 2,506 | |
Amounts attributable to GE common shareowners | |||||
Earnings (loss) from continuing operations | $ | 2,056 | $ | 1,915 | |
Less net earnings (loss) attributable to noncontrolling interests, | |||||
continuing operations | (74) | (50) | |||
Earnings (loss) from continuing operations attributable to the Company | 2,131 | 1,965 | |||
Preferred stock dividends | (33) | - | |||
Earnings (loss) from continuing operations attributable | |||||
to GE common shareowners | 2,097 | 1,965 | |||
Earnings (loss) from discontinued operations, net of taxes | (105) | 629 | |||
Less net earnings (loss) attributable to | |||||
noncontrolling interests, discontinued operations | (2) | 89 | |||
Net earnings (loss) attributable to GE common shareowners | $ | 1,994 | $ | 2,506 | |
Per-share amounts (Note 13) | |||||
Earnings (loss) from continuing operations | |||||
Diluted earnings (loss) per share | $ | 0.23 | $ | 0.19 | |
Basic earnings (loss) per share | $ | 0.24 | $ | 0.19 | |
Net earnings (loss) | |||||
Diluted earnings (loss) per share | $ | 0.22 | $ | 0.25 | |
Basic earnings (loss) per share | $ | 0.22 | $ | 0.25 | |
Dividends declared per common share | $ | 0.23 | $ | 0.23 | |
Amounts may not add due to rounding.
See Note 3 for other-than-temporary impairment amounts on investment securities.
See accompanying notes.
2016 3Q FORM 10-Q 64
STATEMENT OF EARNINGS (LOSS) (CONTINUED) | |||||||||||
(UNAUDITED) | |||||||||||
Three months ended September 30 | |||||||||||
GE(a) | Financial Services (GE Capital) | ||||||||||
(In millions; per-share amounts in dollars) | 2016 | 2015 | 2016 | 2015 | |||||||
Revenues and other income | |||||||||||
Sales of goods | $ | 18,621 | $ | 17,874 | $ | 34 | $ | 21 | |||
Sales of services | 8,313 | 7,738 | - | - | |||||||
Other income | 213 | 201 | - | - | |||||||
GE Capital earnings (loss) from continuing operations | 26 | (154) | - | - | |||||||
GE Capital revenues from services | - | - | 2,566 | 2,639 | |||||||
Total revenues and other income | 27,172 | 25,659 | 2,600 | 2,660 | |||||||
Costs and expenses | |||||||||||
Cost of goods sold | 15,329 | 14,215 | 27 | 18 | |||||||
Cost of services sold | 5,216 | 5,122 | 547 | 606 | |||||||
Selling, general and administrative expenses | 3,880 | 3,549 | 631 | 861 | |||||||
Interest and other financial charges | 483 | 440 | 617 | 586 | |||||||
Investment contracts, insurance losses and | |||||||||||
insurance annuity benefits | - | - | 700 | 714 | |||||||
Other costs and expenses | - | - | 241 | 313 | |||||||
Total costs and expenses | 24,909 | 23,325 | 2,763 | 3,098 | |||||||
Earnings (loss) from continuing operations before income taxes | 2,263 | 2,334 | (163) | (438) | |||||||
Benefit (provision) for income taxes | (241) | (413) | 223 | 278 | |||||||
Earnings (loss) from continuing operations | 2,022 | 1,921 | 60 | (160) | |||||||
Earnings (loss) from discontinued operations, net of taxes (Note 2) | (103) | 541 | (105) | 630 | |||||||
Net earnings (loss) | 1,918 | 2,462 | (45) | 470 | |||||||
Less net earnings (loss) attributable to noncontrolling interests | (76) | (43) | - | 83 | |||||||
Net earnings (loss) attributable to the Company | 1,994 | 2,506 | (45) | 387 | |||||||
Preferred stock dividends | - | - | (33) | - | |||||||
Net earnings (loss) attributable to GE common shareowners | $ | 1,994 | $ | 2,506 | $ | (78) | $ | 387 | |||
Amounts attributable to GE common shareowners: | |||||||||||
Earnings (loss) from continuing operations | $ | 2,022 | $ | 1,921 | $ | 60 | $ | (160) | |||
Less net earnings (loss) attributable to noncontrolling interests, | |||||||||||
continuing operations | (76) | (43) | 1 | (6) | |||||||
Earnings (loss) from continuing operations attributable to the Company | 2,097 | 1,965 | 59 | (154) | |||||||
Preferred stock dividends | - | - | (33) | - | |||||||
Earnings (loss) from continuing operations attributable | |||||||||||
to GE common shareowners | 2,097 | 1,965 | 26 | (154) | |||||||
Earnings (loss) from discontinued operations, net of taxes | (103) | 541 | (105) | 630 | |||||||
Less net earnings (loss) attributable to | |||||||||||
noncontrolling interests, discontinued operations | - | - | (2) | 89 | |||||||
Net earnings (loss) attributable to GE common shareowners | $ | 1,994 | $ | 2,506 | $ | (78) | $ | 387 | |||
(a) | Represents the adding together of all affiliated companies except GE Capital, which is presented on a one-line basis. See Note 1. |
Amounts may not add due to rounding.
In the consolidating data on this page, "GE" means the basis of consolidation as described in Note 1 to the consolidated financial statements; "GE Capital" means GE Capital Global Holdings, LLC (GECGH) and its predecessor General Electric Capital Corporation (GECC) and all of their affiliates and associated companies. Separate information is shown for "GE" and "Financial Services (GE Capital)." Transactions between GE and GE Capital have been eliminated from the "General Electric Company and consolidated affiliates" columns on the prior page.
2016 3Q FORM 10-Q 65
STATEMENT OF EARNINGS (LOSS) | |||||
(UNAUDITED) | |||||
Nine months ended September 30 | |||||
General Electric Company | |||||
and consolidated affiliates | |||||
(In millions; per-share amounts in dollars) | 2016 | 2015 | |||
Revenues and other income | |||||
Sales of goods | $ | 54,626 | $ | 53,003 | |
Sales of services | 25,530 | 22,263 | |||
Other income | 3,385 | 1,092 | |||
GE Capital earnings (loss) from continuing operations | - | - | |||
GE Capital revenues from services | 7,063 | 7,136 | |||
Total revenues and other income | 90,604 | 83,494 | |||
Costs and expenses | |||||
Cost of goods sold | 45,533 | 42,748 | |||
Cost of services sold | 18,177 | 16,362 | |||
Selling, general and administrative expenses | 13,833 | 13,058 | |||
Interest and other financial charges | 4,023 | 2,228 | |||
Investment contracts, insurance losses and | |||||
insurance annuity benefits | 2,101 | 1,942 | |||
Other costs and expenses | 801 | 873 | |||
Total costs and expenses | 84,467 | 77,211 | |||
Earnings (loss) from continuing operations before income taxes | 6,137 | 6,283 | |||
Benefit (provision) for income taxes | (302) | (7,227) | |||
Earnings (loss) from continuing operations | 5,835 | (945) | |||
Earnings (loss) from discontinued operations, net of taxes (Note 2) | (954) | (11,253) | |||
Net earnings (loss) | 4,881 | (12,198) | |||
Less net earnings (loss) attributable to noncontrolling interests | (283) | 229 | |||
Net earnings (loss) attributable to the Company | 5,164 | (12,427) | |||
Preferred stock dividends | (474) | - | |||
Net earnings (loss) attributable to GE common shareowners | $ | 4,689 | $ | (12,427) | |
Amounts attributable to GE common shareowners | |||||
Earnings (loss) from continuing operations | $ | 5,835 | $ | (945) | |
Less net earnings (loss) attributable to noncontrolling interests, | |||||
continuing operations | (285) | (41) | |||
Earnings (loss) from continuing operations attributable to the Company | 6,120 | (904) | |||
Preferred stock dividends | (474) | - | |||
Earnings (loss) from continuing operations attributable | |||||
to GE common shareowners | 5,645 | (904) | |||
Earnings (loss) from discontinued operations, net of taxes | (954) | (11,253) | |||
Less net earnings (loss) attributable to noncontrolling interests, | |||||
discontinued operations | 2 | 270 | |||
Net earnings (loss) attributable to GE common shareowners | $ | 4,689 | $ | (12,427) | |
Per-share amounts (Note 13) | |||||
Earnings (loss) from continuing operations | |||||
Diluted earnings (loss) per share | $ | 0.61 | $ | (0.09) | |
Basic earnings (loss) per share | $ | 0.62 | $ | (0.09) | |
Net earnings (loss) | |||||
Diluted earnings (loss) per share | $ | 0.51 | $ | (1.23) | |
Basic earnings (loss) per share | $ | 0.51 | $ | (1.23) | |
Dividends declared per common share | $ | 0.69 | $ | 0.69 | |
Amounts may not add due to rounding.
See Note 3 for other-than-temporary impairment amounts on investment securities.
See accompanying notes.
2016 3Q FORM 10-Q 66
STATEMENT OF EARNINGS (LOSS) (CONTINUED) | |||||||||||
(UNAUDITED) | |||||||||||
Nine months ended September 30 | |||||||||||
GE(a) | Financial Services (GE Capital) | ||||||||||
(In millions; per-share amounts in dollars) | 2016 | 2015 | 2016 | 2015 | |||||||
Revenues and other income | |||||||||||
Sales of goods | $ | 54,745 | $ | 53,071 | $ | 88 | $ | 64 | |||
Sales of services | 25,745 | 22,521 | - | - | |||||||
Other income | 3,359 | 1,023 | - | - | |||||||
GE Capital earnings (loss) from continuing operations | (1,466) | (6,207) | - | - | |||||||
GE Capital revenues from services | - | - | 8,168 | 8,152 | |||||||
Total revenues and other income | 82,382 | 70,408 | 8,256 | 8,215 | |||||||
Costs and expenses | |||||||||||
Cost of goods sold | 45,669 | 42,821 | 71 | 58 | |||||||
Cost of services sold | 16,725 | 14,948 | 1,667 | 1,672 | |||||||
Selling, general and administrative expenses | 12,094 | 11,035 | 2,238 | 2,458 | |||||||
Interest and other financial charges | 1,490 | 1,243 | 3,006 | 1,348 | |||||||
Investment contracts, insurance losses and | |||||||||||
insurance annuity benefits | - | - | 2,186 | 2,061 | |||||||
Other costs and expenses | - | - | 822 | 903 | |||||||
Total costs and expenses | 75,977 | 70,048 | 9,990 | 8,500 | |||||||
Earnings (loss) from continuing operations before income taxes | 6,405 | 360 | (1,734) | (285) | |||||||
Benefit (provision) for income taxes | (1,034) | (1,302) | 732 | (5,925) | |||||||
Earnings (loss) from continuing operations | 5,370 | (942) | (1,002) | (6,210) | |||||||
Earnings (loss) from discontinued operations, net of taxes (Note 2) | (956) | (11,523) | (954) | (11,249) | |||||||
Net earnings (loss) | 4,414 | (12,465) | (1,956) | (17,459) | |||||||
Less net earnings (loss) attributable to noncontrolling interests | (275) | (38) | (8) | 267 | |||||||
Net earnings (loss) attributable to the Company | 4,689 | (12,427) | (1,948) | (17,726) | |||||||
Preferred stock dividends | - | - | (474) | (161) | |||||||
Net earnings (loss) attributable to GE common shareowners | $ | 4,689 | $ | (12,427) | $ | (2,422) | $ | (17,887) | |||
Amounts attributable to GE common shareowners: | |||||||||||
Earnings (loss) from continuing operations | $ | 5,370 | $ | (942) | $ | (1,002) | $ | (6,210) | |||
Less net earnings (loss) attributable to noncontrolling interests, | |||||||||||
continuing operations | (275) | (38) | (10) | (3) | |||||||
Earnings (loss) from continuing operations attributable to the Company | 5,645 | (904) | (992) | (6,207) | |||||||
Preferred stock dividends | - | - | (474) | (161) | |||||||
Earnings (loss) from continuing operations attributable | |||||||||||
to GE common shareowners | 5,645 | (904) | (1,466) | (6,368) | |||||||
Earnings (loss) from discontinued operations, net of taxes | (956) | (11,523) | (954) | (11,249) | |||||||
Less net earnings (loss) attributable to noncontrolling interests, | |||||||||||
discontinued operations | - | - | 2 | 270 | |||||||
Net earnings (loss) attributable to GE common shareowners | $ | 4,689 | $ | (12,427) | $ | (2,422) | $ | (17,887) | |||
(a) | Represents the adding together of all affiliated companies except GE Capital, which is presented on a one-line basis. See Note 1. |
Amounts may not add due to rounding.
In the consolidating data on this page, "GE" means the basis of consolidation as described in Note 1 to the consolidated financial statements; "GE Capital" means GE Capital Global Holdings, LLC (GECGH) and its predecessor General Electric Capital Corporation (GECC) and all of their affiliates and associated companies. Separate information is shown for "GE" and "Financial Services (GE Capital)." Transactions between GE and GE Capital have been eliminated from the "General Electric Company and consolidated affiliates" columns on the prior page.
2016 3Q FORM 10-Q 67
GENERAL ELECTRIC COMPANY AND CONSOLIDATED AFFILIATES | |||||||||||
CONSOLIDATED STATEMENT OF COMPREHENSIVE INCOME (LOSS) | |||||||||||
(UNAUDITED) | |||||||||||
Three months ended September 30 | Nine months ended September 30 | ||||||||||
(In millions) | 2016 | 2015 | 2016 | 2015 | |||||||
Net earnings (loss) | $ | 1,951 | $ | 2,545 | $ | 4,881 | $ | (12,198) | |||
Less net earnings (loss) attributable to noncontrolling interests | (76) | 39 | (283) | 229 | |||||||
Net earnings (loss) attributable to the Company | $ | 2,027 | $ | 2,506 | $ | 5,164 | $ | (12,427) | |||
Other comprehensive income (loss) | |||||||||||
Investment securities | $ | 97 | $ | (3) | $ | 715 | $ | (452) | |||
Currency translation adjustments | (194) | 624 | (138) | (2,895) | |||||||
Cash flow hedges | 30 | (35) | 60 | 6 | |||||||
Benefit plans | 548 | 627 | 1,481 | 4,486 | |||||||
Other comprehensive income (loss) | 481 | 1,214 | 2,117 | 1,144 | |||||||
Less other comprehensive income (loss) | |||||||||||
attributable to noncontrolling interests | 5 | (8) | 10 | (45) | |||||||
Other comprehensive income (loss) attributable to the Company | $ | 477 | $ | 1,221 | $ | 2,107 | $ | 1,189 | |||
Comprehensive income (loss) | $ | 2,432 | $ | 3,759 | $ | 6,998 | $ | (11,054) | |||
Less comprehensive income (loss) attributable to noncontrolling interests | (71) | 31 | (273) | 184 | |||||||
Comprehensive income (loss) attributable to the Company | $ | 2,504 | $ | 3,727 | $ | 7,271 | $ | (11,238) | |||
Amounts may not add due to rounding.
Amounts presented net of taxes. See Note 12 for further information about other comprehensive income (loss) and noncontrolling interests.
See accompanying notes.
2016 3Q FORM 10-Q 68
GENERAL ELECTRIC COMPANY AND CONSOLIDATED AFFILIATES | |||||
CONSOLIDATED STATEMENT OF CHANGES IN SHAREOWNERS' EQUITY | |||||
(UNAUDITED) | |||||
Nine months ended September 30 | |||||
(In millions) | 2016 | 2015 | |||
Shareowners' equity balance at January 1 | $ | 98,274 | $ | 128,159 | |
Net earnings (loss) attributable to the Company | 5,164 | (12,427) | |||
Dividends and other transactions with shareowners | (6,770) | (6,972) | |||
Redemption value adjustment for redeemable noncontrolling interests | (178) | (1) | |||
Other comprehensive income (loss) attributable to the Company | 2,107 | 1,189 | |||
Net sales (purchases) of shares for treasury | (16,310) | 1,386 | |||
Changes in other capital | (404) | (129) | |||
Ending balance at September 30 | 81,882 | 111,204 | |||
Noncontrolling interests | 1,663 | 8,788 | |||
Total equity balance at September 30 | $ | 83,544 | $ | 119,993 | |
Amounts may not add due to rounding.
See Note 12 for further information about changes in shareowners' equity.
See accompanying notes.
2016 3Q FORM 10-Q 69
STATEMENT OF FINANCIAL POSITION | |||||
General Electric Company | |||||
and consolidated affiliates | |||||
(In millions, except share amounts) | September 30, 2016 | December 31, 2015 | |||
(Unaudited) | |||||
Assets | |||||
Cash and equivalents | $ | 52,530 | $ | 70,483 | |
Investment securities (Note 3) | 46,369 | 31,973 | |||
Current receivables | 25,187 | 27,022 | |||
Inventories (Note 4) | 24,116 | 22,515 | |||
Financing receivables – net (Note 5) | 11,863 | 12,052 | |||
Other GE Capital receivables | 6,301 | 6,782 | |||
Property, plant and equipment – net (Note 6) | 51,453 | 54,095 | |||
Receivable from GE Capital (debt assumption) | - | - | |||
Investment in GE Capital | - | - | |||
Goodwill (Note 7) | 69,988 | 65,526 | |||
Other intangible assets – net (Note 7) | 16,779 | 17,797 | |||
Contract assets (Note 8) | 24,354 | 21,156 | |||
All other assets | 25,749 | 36,797 | |||
Deferred income taxes (Note 11) | 1,463 | 3,105 | |||
Assets of businesses held for sale (Note 2) | 611 | 2,818 | |||
Assets of discontinued operations (Note 2) | 30,930 | 120,951 | |||
Total assets(a) | $ | 387,694 | $ | 493,071 | |
Liabilities and equity | |||||
Short-term borrowings (Note 9) | $ | 31,571 | $ | 49,860 | |
Accounts payable, principally trade accounts | 13,067 | 13,680 | |||
Progress collections and price adjustments accrued | 15,760 | 15,776 | |||
Dividends payable | 2,062 | 2,167 | |||
Other GE current liabilities | 20,230 | 23,597 | |||
Non-recourse borrowings of consolidated securitization entities (Note 9) | 2,175 | 3,083 | |||
Long-term borrowings (Note 9) | 115,686 | 144,659 | |||
Investment contracts, insurance liabilities and insurance annuity benefits | 27,126 | 25,692 | |||
Non-current compensation and benefits | 40,420 | 40,487 | |||
All other liabilities | 23,190 | 23,611 | |||
Liabilities of businesses held for sale (Note 2) | 28 | 861 | |||
Liabilities of discontinued operations (Note 2) | 9,782 | 46,487 | |||
Total liabilities(a) | 301,098 | 389,961 | |||
Redeemable noncontrolling interests (Note 12) | 3,051 | 2,972 | |||
Preferred stock (5,944,250 shares outstanding at both September 30, 2016 | |||||
and December 31, 2015) | 6 | 6 | |||
Common stock (8,846,390,000 and 9,379,288,000 shares outstanding | |||||
at September 30, 2016 and December 31, 2015, respectively) | 702 | 702 | |||
Accumulated other comprehensive income (loss) – net attributable to GE(b) | |||||
Investment securities | 1,176 | 460 | |||
Currency translation adjustments | (5,643) | (5,499) | |||
Cash flow hedges | (21) | (80) | |||
Benefit plans | (9,934) | (11,410) | |||
Other capital | 37,209 | 37,613 | |||
Retained earnings | 138,236 | 140,020 | |||
Less common stock held in treasury | (79,849) | (63,539) | |||
Total GE shareowners' equity | 81,882 | 98,274 | |||
Noncontrolling interests(c) (Note 12) | 1,663 | 1,864 | |||
Total equity (Note 12) | 83,544 | 100,138 | |||
Total liabilities, redeemable noncontrolling interests and equity | $ | 387,694 | $ | 493,071 | |
(a) | Our consolidated assets at September 30, 2016 included total assets of $7,962 million of certain variable interest entities (VIEs) that can only be used to settle the liabilities of those VIEs. These assets included current receivables and net financing receivables of $4,155 million and investment securities of $1,450 million within continuing operations and assets of discontinued operations of $398 million. Our consolidated liabilities at September 30, 2016 included liabilities of certain VIEs for which the VIE creditors do not have recourse to GE. These liabilities included non-recourse borrowings of consolidated securitization entities (CSEs) of $2,175 million within continuing operations. See Note 16. |
(b) | The sum of accumulated other comprehensive income (loss) (AOCI) attributable to the Company was $(14,422) million and $(16,529) million at September 30, 2016 and December 31, 2015, respectively. |
(c) | Included AOCI attributable to noncontrolling interests of $(254) million and $(264) million at September 30, 2016 and December 31, 2015, respectively. |
Amounts may not add due to rounding.
See accompanying notes.
2016 3Q FORM 10-Q 70
STATEMENT OF FINANCIAL POSITION (CONTINUED) | |||||||||||
GE(a) | Financial Services (GE Capital) | ||||||||||
(In millions, except share amounts) | September 30, 2016 | December 31, 2015 | September 30, 2016 | December 31, 2015 | |||||||
(Unaudited) | (Unaudited) | ||||||||||
Assets | |||||||||||
Cash and equivalents | $ | 10,591 | $ | 10,372 | $ | 41,939 | $ | 60,111 | |||
Investment securities (Note 3) | 257 | 151 | 46,116 | 31,827 | |||||||
Current receivables | 13,384 | 14,707 | - | - | |||||||
Inventories (Note 4) | 24,022 | 22,449 | 93 | 66 | |||||||
Financing receivables - net (Note 5) | - | - | 24,989 | 25,003 | |||||||
Other GE Capital receivables | - | - | 15,201 | 15,455 | |||||||
Property, plant and equipment – net (Note 6) | 19,556 | 20,145 | 32,699 | 34,781 | |||||||
Receivable from GE Capital (debt assumption)(b) | 59,798 | 84,704 | - | - | |||||||
Investment in GE Capital | 28,958 | 46,227 | - | - | |||||||
Goodwill (Note 7) | 67,618 | 63,157 | 2,369 | 2,370 | |||||||
Other intangible assets – net (Note 7) | 16,448 | 17,365 | 332 | 435 | |||||||
Contract assets (Note 8) | 24,354 | 21,156 | - | - | |||||||
All other assets | 12,210 | 12,813 | 14,058 | 25,081 | |||||||
Deferred income taxes (Note 11) | 7,434 | 7,666 | (5,970) | (4,561) | |||||||
Assets of businesses held for sale (Note 2) | 611 | 2,818 | - | - | |||||||
Assets of discontinued operations (Note 2) | 9 | 9 | 30,921 | 120,942 | |||||||
Total assets | $ | 285,249 | $ | 323,737 | $ | 202,747 | $ | 311,508 | |||
Liabilities and equity | |||||||||||
Short-term borrowings (Note 9)(b) | $ | 18,940 | $ | 19,792 | $ | 24,444 | $ | 48,617 | |||
Accounts payable, principally trade accounts | 18,494 | 19,250 | 1,844 | 1,745 | |||||||
Progress collections and price adjustments accrued | 15,861 | 15,776 | - | - | |||||||
Dividends payable | 2,062 | 2,167 | - | - | |||||||
Other GE current liabilities | 20,230 | 23,595 | - | - | |||||||
Non-recourse borrowings of consolidated securitization entities (Note 9) | - | - | 2,175 | 3,083 | |||||||
Long-term borrowings (Note9)(b) | 65,683 | 83,309 | 99,828 | 128,478 | |||||||
Investment contracts, insurance liabilities and insurance annuity benefits | - | - | 27,642 | 26,155 | |||||||
Non-current compensation and benefits | 39,370 | 39,472 | 1,040 | 1,006 | |||||||
All other liabilities | 18,246 | 16,217 | 6,743 | 9,351 | |||||||
Liabilities of businesses held for sale (Note 2) | 58 | 1,409 | - | - | |||||||
Liabilities of discontinued operations (Note 2) | 128 | 128 | 9,654 | 46,359 | |||||||
Total liabilities | 199,073 | 221,115 | 173,370 | 264,795 | |||||||
Redeemable noncontrolling interests (Note 12) | 3,051 | 2,972 | - | - | |||||||
Preferred stock (5,944,250 shares outstanding at both September 30, 2016 | |||||||||||
and December 31, 2015) | 6 | 6 | 6 | 6 | |||||||
Common stock (8,846,390,000 and 9,379,288,000 shares outstanding | |||||||||||
at September 30, 2016 and December 31, 2015, respectively) | 702 | 702 | - | - | |||||||
Accumulated other comprehensive income (loss) - net attributable to GE | |||||||||||
Investment securities | 1,176 | 460 | 1,149 | 456 | |||||||
Currency translation adjustments | (5,643) | (5,499) | (833) | (898) | |||||||
Cash flow hedges | (21) | (80) | (3) | (112) | |||||||
Benefit plans | (9,934) | (11,410) | (506) | (540) | |||||||
Other capital | 37,209 | 37,613 | 12,635 | 12,326 | |||||||
Retained earnings | 138,236 | 140,020 | 16,510 | 34,988 | |||||||
Less common stock held in treasury | (79,849) | (63,539) | - | - | |||||||
Total GE shareowners' equity | 81,882 | 98,274 | 28,958 | 46,227 | |||||||
Noncontrolling interests (Note 12) | 1,244 | 1,378 | 419 | 486 | |||||||
Total equity (Notes 12) | 83,126 | 99,651 | 29,377 | 46,713 | |||||||
Total liabilities, redeemable noncontrolling interests and equity | $ | 285,249 | $ | 323,737 | $ | 202,747 | $ | 311,508 | |||
(a) | Represents the adding together of all affiliated companies except GE Capital, which is presented on a one-line basis. See Note 1. |
(b) | On December 2, 2015, senior unsecured notes and commercial paper was assumed by GE upon its merger with GE Capital resulting in an intercompany payable to GE. The short-term borrowings were $10,074 million (which includes an offset of $5,002 million short-term loan from GE Capital to GE) and $17,642 million and the long-term borrowings were $49,723 million and $67,062 million at September 30, 2016 and December 31, 2015, respectively. See Note 9 for additional information. |
Amounts may not add due to rounding.
In the consolidating data on this page, "GE" means the basis of consolidation as described in Note 1 to the consolidated financial statements; "GE Capital" means GE Capital Global Holdings, LLC (GECGH) and its predecessor General Electric Capital Corporation (GECC) and all of their affiliates and associated companies. Separate information is shown for "GE" and "Financial Services (GE Capital)." Transactions between GE and GE Capital have been eliminated from the "General Electric Company and consolidated affiliates" columns on the prior page.
2016 3Q FORM 10-Q 71
STATEMENT OF CASH FLOWS | |||||
(UNAUDITED) | |||||
Nine months ended September 30 | |||||
General Electric Company | |||||
and consolidated affiliates | |||||
(In millions) | 2016 | 2015 | |||
Cash flows – operating activities | |||||
Net earnings (loss) | $ | 4,881 | $ | (12,198) | |
Less net earnings (loss) attributable to noncontrolling interests | (283) | 229 | |||
Net earnings (loss) attributable to the Company | 5,164 | (12,427) | |||
(Earnings) loss from discontinued operations | 954 | 11,253 | |||
Adjustments to reconcile net earnings (loss) attributable to the | |||||
Company to cash provided from operating activities | |||||
Depreciation and amortization of property, plant and equipment | 3,641 | 3,554 | |||
(Earnings) loss from continuing operations retained by GE Capital | - | - | |||
Deferred income taxes | 1,244 | 2,400 | |||
Decrease (increase) in GE current receivables | 763 | 909 | |||
Decrease (increase) in inventories | (2,594) | (1,766) | |||
Increase (decrease) in accounts payable | (49) | 376 | |||
Increase (decrease) in GE progress collections | 78 | (1,265) | |||
All other operating activities | (5,356) | 2,410 | |||
Cash from (used for) operating activities – continuing operations | 3,846 | 5,444 | |||
Cash from (used for) operating activities – discontinued operations | (5,719) | 7,702 | |||
Cash from (used for) operating activities | (1,873) | 13,146 | |||
Cash flows – investing activities | |||||
Additions to property, plant and equipment | (5,109) | (4,807) | |||
Dispositions of property, plant and equipment | 3,403 | 2,406 | |||
Net decrease (increase) in GE Capital financing receivables | 293 | 747 | |||
Proceeds from sale of discontinued operations | 53,250 | 49,006 | |||
Proceeds from principal business dispositions | 5,273 | 754 | |||
Net cash from (payments for) principal businesses purchased | (930) | (1,738) | |||
All other investing activities | (2,621) | 13,098 | |||
Cash from (used for) investing activities – continuing operations | 53,559 | 59,466 | |||
Cash from (used for) investing activities – discontinued operations | (12,056) | 305 | |||
Cash from (used for) investing activities | 41,503 | 59,771 | |||
Cash flows – financing activities | |||||
Net increase (decrease) in borrowings (maturities of 90 days or less) | (1,021) | (16,619) | |||
Newly issued debt (maturities longer than 90 days) | 1,178 | 12,994 | |||
Repayments and other debt reductions (maturities longer than 90 days) | (50,500) | (36,207) | |||
Net dispositions (purchases) of GE shares for treasury | (17,969) | 635 | |||
Dividends paid to shareowners | (6,611) | (6,961) | |||
All other financing activities | (266) | (1,399) | |||
Cash from (used for) financing activities – continuing operations | (75,188) | (47,556) | |||
Cash from (used for) financing activities – discontinued operations | 295 | (2,250) | |||
Cash from (used for) financing activities | (74,893) | (49,807) | |||
Effect of currency exchange rate changes on cash and equivalents | (169) | (3,516) | |||
Increase (decrease) in cash and equivalents | (35,432) | 19,594 | |||
Cash and equivalents at beginning of year | 90,878 | 91,016 | |||
Cash and equivalents at September 30 | 55,445 | 110,610 | |||
Less cash and equivalents of discontinued operations at September 30 | 2,915 | 26,743 | |||
Cash and equivalents of continuing operations at September 30 | $ | 52,530 | $ | 83,867 | |
Amounts may not add due to rounding.
See accompanying notes.
2016 3Q FORM 10-Q 72
STATEMENT OF CASH FLOWS (CONTINUED) | |||||||||||
(UNAUDITED) | |||||||||||
Nine months ended September 30 | |||||||||||
GE(a) | Financial Services (GE Capital) | ||||||||||
(In millions) | 2016 | 2015 | 2016 | 2015 | |||||||
Cash flows – operating activities | |||||||||||
Net earnings (loss) | $ | 4,414 | $ | (12,465) | $ | (1,956) | $ | (17,459) | |||
Less net earnings (loss) attributable to noncontrolling interests | (275) | (38) | (8) | 267 | |||||||
Net earnings (loss) attributable to the Company | 4,689 | (12,427) | (1,948) | (17,726) | |||||||
(Earnings) loss from discontinued operations | 956 | 11,523 | 954 | 11,249 | |||||||
Adjustments to reconcile net earnings (loss) attributable to the | |||||||||||
Company to cash provided from operating activities | |||||||||||
Depreciation and amortization of property, plant and equipment | 1,857 | 1,777 | 1,771 | 1,792 | |||||||
(Earnings) loss from continuing operations retained by GE Capital(b) | 17,518 | 6,927 | - | - | |||||||
Deferred income taxes | 81 | (407) | 1,164 | 2,806 | |||||||
Decrease (increase) in GE current receivables | 455 | 588 | - | - | |||||||
Decrease (increase) in inventories | (2,543) | (1,739) | (15) | (9) | |||||||
Increase (decrease) in accounts payable | (38) | 34 | 12 | 296 | |||||||
Increase (decrease) in GE progress collections | 179 | (1,278) | - | - | |||||||
All other operating activities | (4,812) | 1,529 | (35) | 923 | |||||||
Cash from (used for) operating activities – continuing operations | 18,342 | 6,526 | 1,903 | (669) | |||||||
Cash from (used for) operating activities – discontinued operations | - | (11) | (5,719) | 7,713 | |||||||
Cash from (used for) operating activities | 18,342 | 6,515 | (3,815) | 7,044 | |||||||
Cash flows – investing activities | |||||||||||
Additions to property, plant and equipment | (2,804) | (2,708) | (2,719) | (2,557) | |||||||
Dispositions of property, plant and equipment | 727 | 525 | 2,974 | 2,104 | |||||||
Net decrease (increase) in GE Capital financing receivables | - | - | 128 | 1,034 | |||||||
Proceeds from sale of discontinued operations | - | - | 53,250 | 49,006 | |||||||
Proceeds from principal business dispositions | 5,273 | 222 | - | 532 | |||||||
Net cash from (payments for) principal businesses purchased | (930) | (61) | - | (1,677) | |||||||
All other investing activities | (1,915) | (1,037) | (6,435) | 14,137 | |||||||
Cash from (used for) investing activities – continuing operations | 350 | (3,058) | 47,198 | 62,580 | |||||||
Cash from (used for) investing activities – discontinued operations | - | 10 | (12,056) | 295 | |||||||
Cash from (used for) investing activities | 351 | (3,048) | 35,142 | 62,875 | |||||||
Cash flows – financing activities | |||||||||||
Net increase (decrease) in borrowings (maturities of 90 days or less) | 1,732 | 716 | (1,945) | (17,354) | |||||||
Newly issued debt (maturities longer than 90 days) | 5,180 | 3,537 | 987 | 9,457 | |||||||
Repayments and other debt reductions (maturities longer than 90 days) | (755) | (153) | (49,745) | (36,054) | |||||||
Net dispositions (purchases) of GE shares for treasury | (17,969) | 635 | - | - | |||||||
Dividends paid to shareowners | (6,427) | (6,960) | (16,234) | (611) | |||||||
All other financing activities | (143) | 132 | (259) | (1,369) | |||||||
Cash from (used for) financing activities – continuing operations | (18,382) | (2,095) | (67,196) | (45,931) | |||||||
Cash from (used for) financing activities – discontinued operations | - | - | 295 | (2,250) | |||||||
Cash from (used for) financing activities | (18,382) | (2,095) | (66,900) | (48,181) | |||||||
Effect of currency exchange rate changes on cash and equivalents | (91) | (479) | (78) | (3,038) | |||||||
Increase (decrease) in cash and equivalents | 219 | 894 | (35,652) | 18,700 | |||||||
Cash and equivalents at beginning of year | 10,372 | 15,916 | 80,506 | 75,100 | |||||||
Cash and equivalents at September 30 | 10,591 | 16,810 | 44,854 | 93,800 | |||||||
Less cash and equivalents of discontinued operations at September 30 | - | - | 2,915 | 26,743 | |||||||
Cash and equivalents of continuing operations at September 30 | $ | 10,591 | $ | 16,810 | $ | 41,939 | $ | 67,057 | |||
| (a) | Represents the adding together of all affiliated companies except GE Capital, which is presented on a one-line basis. |
| (b) | Represents GE Capital earnings/loss from continuing operations attributable to the Company, net of GE Capital dividends paid to GE. |
Amounts may not add due to rounding.
In the consolidating data on this page, "GE" means the basis of consolidation as described in Note 1 to the consolidated financial statements; "GE Capital" means GE Capital Global Holdings, LLC (GECGH) and its predecessor General Electric Capital Corporation (GECC) and all of their affiliates and associated companies. Separate information is shown for "GE" and "Financial Services (GE Capital)." Transactions between GE and GE Capital have been eliminated from the "Consolidated" columns and are discussed in Note 17.
2016 3Q FORM 10-Q 73
NOTES TO CONSOLIDATED FINANCIAL STATEMENTS
NOTE 1. BASIS OF PRESENTATION AND SUMMARY OF SIGNIFICANT ACCOUNTING POLICIES
BASIS OF PRESENTATION
The accompanying consolidated financial statements represent the consolidation of General Electric Company (the Company) and all companies that we directly or indirectly control, either through majority ownership or otherwise. See Note 1 to the consolidated financial statements in our Form 8-K filed on June 3, 2016 related to the Annual Report on Form 10-K for the year ended December 31, 2015 that discusses our consolidation and financial statement presentation. As used in this report on Form 10-Q (Report), "GE" represents the adding together of all affiliated companies except GE Capital (GE Capital or Financial Services), whose continuing operations are presented on a one-line basis; GE Capital consists of General Capital Global Holdings, LLC (GECGH) and all of its affiliates; and "Consolidated" represents the adding together of GE and GE Capital with the effects of transactions between the two eliminated. Unless otherwise indicated, we refer to the caption revenues and other income simply as "revenues" throughout this Form 10-Q.
We have reclassified certain prior-period amounts to conform to the current-period presentation. Certain columns and rows may not add due to the use of rounded numbers. Percentages presented are calculated from the underlying numbers in millions. Unless otherwise indicated, information in these notes to the consolidated financial statements relates to continuing operations.
INTERIM PERIOD PRESENTATION
The consolidated financial statements and notes thereto are unaudited. These statements include all adjustments (consisting of normal recurring accruals) that we considered necessary to present a fair statement of our results of operations, financial position and cash flows. The results reported in these consolidated financial statements should not be regarded as necessarily indicative of results that may be expected for the entire year. It is suggested that these consolidated financial statements be read in conjunction with the financial statements and notes thereto included in our 2015 consolidated financial statements of our Form 8-K filed on June 3, 2016 related to the Annual Report on Form 10-K for the year ended December 31, 2015.
SUMMARY OF SIGNIFICANT ACCOUNTING POLICIES
Please refer to Note 1, Basis of Presentation and Summary of Significant Accounting Policies, to the consolidated financial statements of our 2015 Form 10-K Report for the discussion of our significant accounting policies.
ACCOUNTING CHANGES
On September 30, 2016, we adopted ASU 2016-09, Improvements to Employee Share-Based Payment Accounting , which was intended to simplify several aspects of the accounting for employee share-based payment transactions including the accounting for income taxes, forfeitures, and statutory tax withholding requirements, as well as classification in the statement of cash flows.
We adopted the standard on a prospective basis with the effect of adoption reflected for the interim periods after the year beginning January 1, 2016 as required by the standard. The primary effects of adoption were the recognition of excess tax benefits in our provision for income taxes rather than paid-in capital and the reclassification of cash flows related to excess tax benefits from a financing activity to an operating activity for the periods beginning January 1, 2016. We will continue to estimate the number of awards that are expected to vest in our determination of the related periodic compensation cost.
As a result of the adoption, our provision for income taxes decreased by $41 million and $97 million for the three and nine months ended September 30, 2016, respectively for the excess tax benefits related to share-based payments in its provision for income taxes. Application of the cash flow presentation requirements from January 1, 2016, resulted in an increase to cash from operating activities and a decrease to cash from financing activities of $59 million and $137 million for the three and nine months ended September 30, 2016, respectively.
2016 3Q FORM 10-Q 74
On January 1, 2016, we adopted ASU 2015-16, Simplifying the Accounting for Measurement-Period Adjustments , which eliminated the requirement for an acquirer in a business combination to account for measurement-period adjustments retrospectively. See Note 7 for further discussion of the purchase accounting effects of recent acquisitions.
On January 1, 2016, we adopted ASU 2015-03, Simplifying the Presentation of Debt Issuance Costs , which requires that debt issuance costs related to a recognized debt liability to be presented on the balance sheet as a direct deduction from the debt liability, similar to the presentation of debt premiums and discounts. ASU 2015-03 applies retrospectively and does not change the recognition and measurement requirements for debt issuance costs. The adoption of ASU 2015-03 resulted in the reclassification of $674 million of unamortized debt issuance costs related to the Company's borrowings from all other assets to short-term and long-term borrowings within our consolidated balance sheet as of December 31, 2015.
On January 1, 2016, we adopted ASU 2015-02, Amendments to the Consolidation Analysis . The ASU amended the consolidation guidance for VIEs and general partners' investment in limited partnerships and modified the evaluation of whether limited partnerships and similar legal entities are VIEs or voting interest entities.
Upon adoption, we deconsolidated three investment funds managed by GE Asset Management (GEAM) that had been accounted for under the guidance prior to the issuance of ASU 2009-17, Improvements to Financial Reporting by Enterprises Involved with Variable Interest Entities, by virtue of the deferral provided by ASU 2010-10, Amendments for Certain Investment Funds . We concluded that GEAM's management contracts were no longer variable interests in the three investment funds and therefore continued consolidation was not appropriate. We deconsolidated net assets and noncontrolling interests of $123 million, respectively.
In addition, many of the limited partnerships in which EFS invests became VIEs because the limited partners have no participating rights or substantive removal rights over the general partners. The general partners continue to control these limited partnerships, however, our disclosed exposure to unconsolidated VIEs in Note 16 increased by $6,110 million as a result.
ACCELERATED SHARE REPURCHASE AGREEMENTS
During 2016, we entered into accelerated share repurchase (ASR) agreements to repurchase shares of GE common stock. Under an ASR agreement, the Company pays a specified amount to a financial institution and receives an initial delivery of shares based on the terms of the agreement. Upon settlement of the agreement, the financial institution delivers additional shares, or the Company returns shares, with the final net number of shares calculated based on the volume-weighted average price of GE common stock over the term of the agreement, less an agreed upon discount. When certain conditions are met, the transaction is accounted for as an equity transaction and the shares are included in treasury stock when received, at which time there is an immediate reduction in the weighted- average number of common shares used in calculating earnings per share. See Note 12 for additional information.
2016 3Q FORM 10-Q 75
NOTE 2. BUSINESSES HELD FOR SALE AND DISCONTINUED OPERATIONS
ASSETS AND LIABILITIES OF BUSINESSES HELD FOR SALE
In the third quarter of 2016, we classified a business at Aviation with assets of $601 million and liabilities of $58 million, as held for sale. We have adjusted the carrying value of the business to fair value, which resulted in a $145 million after-tax loss (including a $120 million loss on the planned disposal) in the third quarter. We expect to complete a sale of the business within the next twelve months.
On March 30, 2016, we announced an agreement to sell GE Asset Management (GEAM), GE's asset management arm with assets under management of approximately $100 billion, to State Street Corporation. On July 1, 2016, we completed the sale for proceeds of $437 million and recognized an after-tax gain of $260 million. Net sale proceeds associated with U.S. pension plans will be deposited into the GE Pension Trust, increasing trust assets used to pay GE pension plan benefits. There is a potential to realize up to $48 million in additional proceeds if the management of assets for more pension plans transfers to the buyer.
On January 15, 2016, we announced the signing of an agreement to sell our Appliances business to Qingdao Haier Co., Ltd. (Haier). On June 6, 2016, we completed the sale for proceeds of $5,568 million (including $773 million from sale of receivables originated in our Appliances business and sold from GE Capital to Haier) and recognized an after-tax gain of approximately $1,850 million in the nine months ended September 30, 2016.
FINANCIAL INFORMATION FOR ASSETS AND LIABILITIES OF BUSINESSES HELD FOR SALE | |||||
(In millions) | September 30, 2016 |
| December 31, 2015 | ||
| |||||
Assets | |||||
Current receivables | $ | 10 | $ | 79 | |
Inventories | 130 | 583 | |||
Property, plant, and equipment – net | 81 | 1,208 | |||
Goodwill | 28 | 370 | |||
Other intangible assets – net | 36 | 162 | |||
Contract assets | 313 | - | |||
Other |
| 13 |
|
| 416 |
Assets of businesses held for sale | $ | 611 |
| $ | 2,818 |
|
|
|
| ||
Liabilities |
|
|
| ||
Accounts payable(a) | $ | 17 | $ | 503 | |
Other current liabilities | 3 | 325 | |||
Other | 8 | 33 | |||
Liabilities of businesses held for sale | $ | 28 | $ | 861 | |
| (a) | Certain transactions in our Industrial businesses were made on an arms-length basis with GE Capital, consisting primarily of GE Capital services for material procurement. These intercompany balances included within our held for sale businesses are reported in the GE and GE Capital columns of our financial statements, but are eliminated in deriving our consolidated financial statements. |
2016 3Q FORM 10-Q 76
DISCONTINUED OPERATIONS
Discontinued operations primarily relate to our financial services businesses as a result of the GE Capital Exit Plan and include our Consumer business, most of our CLL business, our Real Estate business and our U.S. mortgage business (WMC). All of these operations were previously reported in the Capital segment. Results of operations, financial position and cash flows for these businesses are separately reported as discontinued operations for all periods presented.
We have entered into Transitional Service Agreements (TSA) with and provided certain indemnifications to buyers of GE Capital's assets. Under the TSAs, GE Capital provides various services for terms generally between 12 and 24 months and receives a level of cost reimbursement from the buyers.
At September 30, 2016, specific indemnifications amounted to $1,556 million, for which we have recognized related liabilities of $171 million. In addition, we provided $92 million of credit support, the majority on behalf of certain customers aligned with signed disposal transactions scheduled to close in 2016, and recognized an insignificant liability at September 30, 2016.
FINANCIAL INFORMATION FOR DISCONTINUED OPERATIONS | |||||||||||
Three months ended September 30 | Nine months ended September 30 | ||||||||||
(In millions) | 2016 | 2015 | 2016 | 2015 | |||||||
Operations | |||||||||||
Total revenues and other income (loss) | $ | 633 | $ | 6,483 | $ | 2,494 | $ | 18,772 | |||
Earnings (loss) from discontinued operations before income taxes | $ | 6 | $ | 2,267 | $ | (154) | $ | (476) | |||
Benefit (provision) for income taxes | 278 | (650) | 460 | (208) | |||||||
Earnings (loss) from discontinued operations, net of taxes | $ | 284 | $ | 1,617 | $ | 306 | $ | (684) | |||
Disposal | |||||||||||
Gain (loss) on disposal before income taxes | $ | (50) | $ | (2,616) | $ | (591) | $ | (9,652) | |||
Benefit (provision) for income taxes | (339) | 1,629 | (670) | (916) | |||||||
Gain (loss) on disposal, net of taxes | $ | (389) | $ | (987) | $ | (1,261) | $ | (10,568) | |||
Earnings (loss) from discontinued operations, net of taxes(a)(b) | $ | (105) | $ | 629 | $ | (954) | $ | (11,253) | |||
| (a) | The sum of GE industrial earnings (loss) from discontinued operations, net of taxes, and GE Capital earnings (loss) from discontinued operations, net of taxes, after adjusting for earnings (loss) attributable to noncontrolling interests related to discontinued operations, is reported within GE industrial earnings (loss) from discontinued operations, net of taxes, on the Consolidated Statement of Earnings (Loss). |
| (b) | Earnings (loss) from discontinued operations attributable to the Company, before income taxes, was $(43) million and $(438) million for the three months ended September 30, 2016 and 2015, respectively, and $(746) million and $(10,398) million for the nine months ended September 30, 2016 and 2015, respectively. |
(In millions) | September 30, 2016 | December 31, 2015 | |||
Assets | |||||
Cash and equivalents | $ | 2,915 | $ | 20,395 | |
Investment securities | 5,096 | 8,478 | |||
Financing receivables – net | 1,344 | 3,205 | |||
Other receivables | 949 | 1,221 | |||
Property, plant and equipment – net | 598 | 7,537 | |||
Goodwill | 391 | 7,764 | |||
Other intangible assets - net | 35 | 80 | |||
Deferred income taxes | 1,746 | 2,447 | |||
Financing receivables held for sale | 16,666 | 69,847 | |||
Valuation allowance on disposal group classified as discontinued operations | (1,859) | (6,374) | |||
Other | 3,050 | 6,350 | |||
Assets of discontinued operations | $ | 30,930 | $ | 120,951 | |
Liabilities | |||||
Short-term borrowings | $ | 201 | $ | 739 | |
Accounts payable | 664 | 2,870 | |||
Non-recourse borrowings | 877 | 3,994 | |||
Bank deposits | 4,153 | 25,613 | |||
Long-term borrowings | 583 | 730 | |||
All other liabilities | 2,580 | 11,053 | |||
Deferred income taxes | 675 | 1,437 | |||
Other | 49 | 52 | |||
Liabilities of discontinued operations | $ | 9,782 | $ | 46,487 | |
2016 3Q FORM 10-Q 77
CONSUMER
In connection with the GE Capital Exit Plan, we announced the planned disposition of our Consumer business and classified the business as discontinued operations. We closed a vast majority of our Consumer business dispositions (including the split-off of Synchrony Financial) in 2015 and 2016.
FINANCIAL INFORMATION FOR CONSUMER | |||||||||||
Three months ended September 30 | Nine months ended September 30 | ||||||||||
(In millions) | 2016 | 2015 | 2016 | 2015 | |||||||
Operations | |||||||||||
Total revenues and other income (loss) | $ | 271 | $ | 3,652 | $ | 957 | $ | 9,237 | |||
Interest | $ | (42) | $ | (564) | $ | (139) | $ | (1,748) | |||
Selling, general, and administrative expenses | (245) | (1,045) | (580) | (3,216) | |||||||
Cost of services sold | - | - | - | - | |||||||
Provision for losses on financing receivables | 1 | (727) | 1 | (4,596) | |||||||
Investment contracts, insurance losses and insurance annuity benefits | (1) | (3) | (2) | (10) | |||||||
Other costs and expenses | (25) | (105) | (89) | (345) | |||||||
Earnings (loss) from discontinued operations, before income taxes | (39) | 1,207 | 149 | (679) | |||||||
Benefit (provision) for income taxes | (26) | (231) | (127) | (238) | |||||||
Earnings (loss) from discontinued operations, net of taxes | $ | (65) | $ | 976 | $ | 22 | $ | (917) | |||
Disposal | |||||||||||
Gain (loss) on disposal before income taxes | $ | (29) | $ | - | $ | 124 | $ | - | |||
Benefit (provision) for income taxes | (360) | - | (599) | - | |||||||
Gain (loss) on disposal, net of taxes | $ | (389) | $ | - | $ | (475) | $ | - | |||
Earnings (loss) from discontinued operations, net of taxes(a) | $ | (454) | $ | 976 | $ | (453) | $ | (917) | |||
| (a) | Earnings (loss) from discontinued operations attributable to the Company, before income taxes, was $(67) million and $1,119 million for the three months ended September 30, 2016 and 2015, respectively, and $273 million and $(943) million for the nine months ended September 30, 2016 and 2015, respectively. |
COMMERCIAL LENDING AND LEASING
In connection with the GE Capital Exit Plan, we announced the planned disposition of most of our CLL business and classified this portion of the business as discontinued operations. We closed a vast majority of our CLL business dispositions in 2015 and 2016.
FINANCIAL INFORMATION FOR COMMERCIAL LENDING AND LEASING | |||||||||||
Three months ended September 30 | Nine months ended September 30 | ||||||||||
(In millions) | 2016 | 2015 | 2016 | 2015 | |||||||
Operations | |||||||||||
Total revenues and other income (loss) | $ | 334 | $ | 2,691 | $ | 1,535 | $ | 8,664 | |||
Interest | $ | (74) | $ | (576) | $ | (476) | $ | (1,919) | |||
Selling, general and administrative expenses | (176) | (893) | (1,222) | (2,834) | |||||||
Cost of services sold | - | - | - | (1,735) | |||||||
Provision for losses on financing receivables | - | 13 | (2) | (1,744) | |||||||
Other costs and expenses | (11) | (7) | (25) | (104) | |||||||
Earnings (loss) from discontinued operations, before income taxes | 74 | 1,228 | (191) | 328 | |||||||
Benefit (provision) for income taxes | 40 | (484) | 254 | (169) | |||||||
Earnings (loss) from discontinued operations, net of taxes | $ | 114 | $ | 744 | $ | 63 | $ | 159 | |||
Disposal | |||||||||||
Gain (loss) on disposal before income taxes | $ | (22) | $ | (2,834) | $ | (652) | $ | (8,059) | |||
Benefit (provision) for income taxes | 21 | 1,629 | (133) | (298) | |||||||
Gain (loss) on disposal, net of taxes | $ | (1) | $ | (1,205) | $ | (785) | $ | (8,357) | |||
Earnings (loss) from discontinued operations, net of taxes(a) | $ | 113 | $ | (461) | $ | (722) | $ | (8,198) | |||
| (a) | Earnings (loss) from discontinued operations attributable to the Company, before income taxes, was $52 million and $(1,608) million for the three months ended September 30, 2016 and 2015, respectively, and $(846) million and $(7,736) million for the nine months ended September 30, 2016 and 2015, respectively. |
2016 3Q FORM 10-Q 78
REAL ESTATE
In connection with the GE Capital Exit Plan, we announced the planned disposition of our Real Estate business and classified the business as discontinued operations. We closed substantially all of our Real Estate business dispositions in 2015 and 2016.
FINANCIAL INFORMATION FOR REAL ESTATE | |||||||||||
Three months ended September 30 | Nine months ended September 30 | ||||||||||
(In millions) | 2016 | 2015 | 2016 | 2015 | |||||||
Operations | |||||||||||
Total revenues and other income (loss) | $ | 21 | $ | 81 | $ | 47 | $ | 893 | |||
Interest | $ | (4) | $ | (64) | $ | (40) | $ | (437) | |||
Selling, general and administrative | (20) | (149) | (98) | (373) | |||||||
Cost of services sold | - | - | - | (5) | |||||||
Provision for losses on financing receivables | - | - | - | 4 | |||||||
Other costs and expenses | (1) | (7) | (7) | (147) | |||||||
Earnings (loss) from discontinued operations, before income taxes | (5) | (139) | (98) | (65) | |||||||
Benefit (provision) for income taxes | 30 | 53 | 88 | 95 | |||||||
Earnings (loss) from discontinued operations, net of taxes | $ | 25 | $ | (86) | $ | (10) | $ | 30 | |||
Disposal | |||||||||||
Gain (loss) on disposal before income taxes | $ | 1 | $ | 218 | $ | (62) | $ | (1,593) | |||
Benefit (provision) for income taxes | - | - | 62 | (618) | |||||||
Gain (loss) on disposal, net of taxes | $ | 1 | $ | 218 | $ | - | $ | (2,211) | |||
Earnings (loss) from discontinued operations, net of taxes(a) | $ | 26 | $ | 132 | $ | (10) | $ | (2,181) | |||
| (a) | Earnings (loss) from discontinued operations attributable to the Company, before income taxes, was $(4) million and $81 million for the three months ended September 30, 2016 and 2015, respectively, and $(160) million and $(1,658) million for the nine months ended September 30, 2016 and 2015, respectively. |
WMC
During the fourth quarter of 2007, we completed the sale of WMC, our U.S. mortgage business. WMC substantially discontinued all new loan originations by the second quarter of 2007, and is not a loan servicer. In connection with the sale, WMC retained certain representation and warranty obligations related to loans sold to third parties prior to the disposal of the business and contractual obligations to repurchase previously sold loans that had an early payment default. All claims received by WMC for early payment default have either been resolved or are no longer being pursued.
The remaining active claims have been brought by securitization trustees or administrators seeking recovery from WMC for alleged breaches of representations and warranties on mortgage loans that serve as collateral for residential mortgage-backed securities (RMBS). At September 30, 2016, such claims consisted of $1,266 million of individual claims generally submitted before the filing of a lawsuit (compared to $2,887 million at December 31, 2015) and $5,628 million of additional claims asserted against WMC in litigation without making a prior claim (Litigation Claims) (compared to $8,047 million at December 31, 2015). The total amount of these claims, $6,894 million, reflects the purchase price or unpaid principal balances of the loans at the time of purchase and does not give effect to pay downs or potential recoveries based upon the underlying collateral, which in many cases are substantial, nor to accrued interest or fees. As of September 30, 2016, these amounts do not include approximately $110 million of repurchase claims relating to alleged breaches of representations that are not in litigation and that are beyond the applicable statute of limitations. WMC believes that repurchase claims brought based upon representations and warranties made more than six years before WMC was notified of the claim would be disallowed in legal proceedings under applicable law and the June 11, 2015 decision of the New York Court of Appeals in ACE Securities Corp. v. DB Structured Products, Inc., on the statute of limitations period governing such claims.
2016 3Q FORM 10-Q 79
Reserves related to repurchase claims made against WMC were $665 million at September 30, 2016, reflecting a net decrease to reserves in the three months ended September 30, 2016 of $195 million due to settlements during the quarter. The reserve estimate takes into account recent settlement activity and is based upon WMC's evaluation of the remaining exposures as a percentage of estimated lifetime mortgage loan losses within the pool of loans supporting each securitization for which timely claims have been asserted in litigation against WMC. Settlements in prior periods reduced WMC's exposure on claims asserted in certain securitizations and the claim amounts reported above give effect to these settlements .
ROLLFORWARD OF THE RESERVE | |||||||||||
Three months ended September 30 | Nine months ended September 30 | ||||||||||
(In millions) | 2016 | 2015 | 2016 | 2015 | |||||||
Balance, beginning of period | $ | 860 | $ | 825 | $ | 875 | $ | 809 | |||
Provision | - | 28 | 84 | 46 | |||||||
Claim resolutions / rescissions | (195) | (21) | (294) | (23) | |||||||
Balance, end of period | $ | 665 | $ | 832 | $ | 665 | $ | 832 | |||
Given the significant litigation activity and WMC's continuing efforts to resolve the lawsuits involving claims made against WMC, it is difficult to assess whether future losses will be consistent with WMC's past experience. Adverse changes to WMC's assumptions supporting the reserve may result in an increase to these reserves. WMC estimates a range of reasonably possible loss from $0 to approximately $500 million over its recorded reserve at September 30, 2016. This estimate involves significant judgment and may not reflect the range of uncertainties and unpredictable outcomes inherent in litigation, including the matters discussed in Legal Proceedings and potential changes in WMC's legal strategy. This estimate excludes any possible loss associated with an adverse court decision on the applicable statute of limitations or an adverse outcome in the Financial Institutions Reform, Recovery, and Enforcement Act of 1989 (FIRREA) investigation discussed in Legal Proceedings, as WMC is unable at this time to develop such a meaningful estimate.
At September 30, 2016, there were 10 lawsuits involving claims made against WMC arising from alleged breaches of representations and warranties on mortgage loans included in 11 securitizations. The adverse parties in these cases are securitization trustees or parties claiming to act on their behalf. Although the alleged claims for relief vary from case to case, the complaints and counterclaims in these actions generally assert claims for breach of contract, indemnification, and/or declaratory judgment, and seek specific performance (repurchase of defective mortgage loan) and/or money damages. Adverse court decisions, including in cases not involving WMC, could result in new claims and lawsuits on additional loans. However, WMC continues to believe that it has defenses to the claims asserted in litigation, including, for example, based on causation and materiality requirements and applicable statutes of limitations. It is not possible to predict the outcome or impact of these defenses and other factors, any of which could materially affect the amount of any loss ultimately incurred by WMC on these claims.
WMC has also received indemnification demands, nearly all of which are unspecified, from depositors/underwriters/sponsors of RMBS in connection with lawsuits brought by RMBS investors concerning alleged misrepresentations in the securitization offering documents to which WMC is not a party or, in two cases, involving mortgage loan repurchase claims made against RMBS sponsors. WMC believes that it has defenses to these demands.
To the extent WMC is required to repurchase loans, WMC's loss also would be affected by several factors, including pay downs, accrued interest and fees, and the value of the underlying collateral. The reserve and estimate of possible loss reflect judgment, based on currently available information, and a number of assumptions, including economic conditions, claim and settlement activity, pending and threatened litigation, court decisions regarding WMC's legal defenses, indemnification demands, government activity, and other variables in the mortgage industry. Actual losses arising from claims against WMC could exceed these amounts and additional claims and lawsuits could result if actual claim rates, governmental actions, litigation and indemnification activity, adverse court decisions, actual settlement rates or losses WMC incurs on repurchased loans differ from its assumptions .
FINANCIAL INFORMATION FOR WMC | |||||||||||
Three months ended September 30 | Nine months ended September 30 | ||||||||||
(In millions) | 2016 | 2015 | 2016 | 2015 | |||||||
Total revenues and other income (loss) | $ | 19 | $ | (22) | $ | (38) | $ | (26) | |||
Earnings (loss) from discontinued operations, net of taxes | $ | (8) | $ | (21) | $ | (60) | $ | (37) | |||
2016 3Q FORM 10-Q 80
NOTE 3. INVESTMENT SECURITIES
Substantially all of our investment securities are classified as available-for-sale. These comprise mainly investment-grade debt securities supporting obligations to annuitants and policyholders in our run-off insurance operations. We do not have any securities classified as held-to-maturity.
September 30, 2016 | December 31, 2015 | ||||||||||||||||||||||
Gross | Gross | Gross | Gross | ||||||||||||||||||||
Amortized | unrealized | unrealized | Estimated | Amortized | unrealized | unrealized | Estimated | ||||||||||||||||
(In millions) | cost | gains | losses | fair value | cost | gains | losses | fair value | |||||||||||||||
GE | |||||||||||||||||||||||
Debt | |||||||||||||||||||||||
U.S. corporate | $ | 2 | $ | - | $ | - | $ | 2 | $ | 2 | $ | - | $ | - | $ | 3 | |||||||
Corporate – non-U.S. | - | - | - | - | 1 | - | - | 1 | |||||||||||||||
U.S. government and federal | |||||||||||||||||||||||
agency | 49 | 1 | - | 50 | 49 | - | - | 49 | |||||||||||||||
Equity | 156 | 53 | (5) | 204 | 87 | 13 | (2) | 98 | |||||||||||||||
208 | 54 | (5) | 257 | 139 | 14 | (2) | 151 | ||||||||||||||||
GE Capital | |||||||||||||||||||||||
Debt | |||||||||||||||||||||||
U.S. corporate | 20,865 | 4,264 | (32) | 25,097 | 19,971 | 2,669 | (285) | 22,355 | |||||||||||||||
State and municipal | 3,907 | 693 | (44) | 4,556 | 3,910 | 407 | (73) | 4,245 | |||||||||||||||
Mortgage and asset-backed | 2,798 | 184 | (17) | 2,966 | 2,995 | 157 | (35) | 3,116 | |||||||||||||||
Corporate – non-U.S. | 11,769 | 114 | (10) | 11,873 | 759 | 96 | (9) | 846 | |||||||||||||||
Government – non-U.S. | 592 | 161 | (1) | 752 | 279 | 136 | - | 415 | |||||||||||||||
U.S. government and federal | |||||||||||||||||||||||
agency | 656 | 91 | - | 747 | 623 | 104 | - | 727 | |||||||||||||||
Equity | 105 | 20 | - | 125 | 112 | 16 | (4) | 123 | |||||||||||||||
40,693 | 5,526 | (103) | 46,116 | 28,648 | 3,585 | (407) | 31,827 | ||||||||||||||||
Eliminations | (4) | - | - | (4) | (4) | - | - | (4) | |||||||||||||||
Total | $ | 40,897 | $ | 5,580 | $ | (108) | $ | 46,369 | $ | 28,783 | $ | 3,599 | $ | (409) | $ | 31,973 | |||||||
Our corporate debt portfolio comprises securities issued by public and private corporations in various industries, mainly in the U.S. Substantially all of our corporate debt securities are rated investment grade by the major rating agencies.
Mortgage and asset-backed securities substantially comprises commercial and residential mortgage-backed securities. Substantially all of these securities have investment-grade credit ratings. Our commercial mortgage-backed securities (CMBS) portfolio is collateralized by both diversified pools of mortgages that were originated for securitization (conduit CMBS) and pools of large loans backed by high-quality properties (large loan CMBS). Our residential mortgage-backed securities (RMBS) portfolio is collateralized primarily by pools of individual, direct mortgage loans, of which substantially all are in a senior position in the capital structure of the deals, not other structured products such as collateralized debt obligations. Of the total RMBS held at September 30, 2016, $52 million was related to residential subprime credit securities, primarily supporting obligations to annuitants and policyholders in our run-off insurance operations. All of the subprime exposure is related to securities backed by mortgage loans originated in 2005 and prior and are investment grade.
The fair value of investment securities increased to $46,369 million at September 30, 2016, from $31,973 million at December 31, 2015, primarily due to higher net purchases of Corporate – non-U.S. debt securities and higher net unrealized gains in U.S. Corporate and State and Municipal debt securities resulting from lower interest rates.
2016 3Q FORM 10-Q 81
ESTIMATED FAIR VALUE AND GROSS UNREALIZED LOSSES OF AVAILABLE-FOR-SALE INVESTMENT SECURITIES | ||||||||||||
In loss position for | ||||||||||||
Less than 12 months | 12 months or more | |||||||||||
Gross | Gross | |||||||||||
Estimated | unrealized | Estimated | unrealized | |||||||||
(In millions) | fair value(a) | losses(a)(b) | fair value | losses(b) | ||||||||
September 30, 2016 | ||||||||||||
Debt | ||||||||||||
U.S. corporate | $ | 148 | $ | (2) | $ | 387 | $ | (30) | ||||
State and municipal | 31 | (1) | 157 | (43) | ||||||||
Mortgage and asset-backed | 167 | (2) | 112 | (14) | ||||||||
Corporate – non-U.S. | 4,088 | (7) | 31 | (3) | ||||||||
Government - non-U.S. | 256 | (1) | - | - | ||||||||
Equity | 11 | (5) | - | - | ||||||||
Total | $ | 4,701 | $ | (19) | $ | 686 | $ | (90) | (c) | |||
December 31, 2015 | ||||||||||||
Debt | ||||||||||||
U.S. corporate | $ | 2,966 | $ | (218) | $ | 433 | $ | (67) | ||||
State and municipal | 494 | (20) | 155 | (53) | ||||||||
Mortgage and asset-backed | 719 | (20) | 84 | (16) | ||||||||
Corporate – non-U.S. | 56 | (4) | 14 | (4) | ||||||||
Equity | 36 | (6) | - | - | ||||||||
Total | $ | 4,273 | $ | (269) | $ | 686 | $ | (140) | ||||
| (a) | Includes the estimated fair value of and gross unrealized losses on equity securities held by GE. At September 30, 2016, the estimated fair value of and gross unrealized losses on equity securities were $11 million and $(5) million, respectively. At December 31, 2015, the estimated fair value of and gross unrealized losses on equity securities were $6 million and $(2) million, respectively. |
| (b) | Included gross unrealized losses of $1 million related to securities that had other-than-temporary impairments previously recognized at September 30, 2016. |
| (c) | Includes debt securities held to support obligations to holders of Guaranteed Investment Contracts (GICs) of which the majority are considered to be investment-grade by the major rating agencies at September 30, 2016. |
Unrealized losses are not indicative of the amount of credit loss that would be recognized and at September 30, 2016 are primarily due to increases in market yields subsequent to our purchase of the securities. We presently do not intend to sell the vast majority of our debt securities that are in an unrealized loss position and believe that it is not more likely than not that we will be required to sell the vast majority of these securities before anticipated recovery of our amortized cost. The methodologies and significant inputs used to measure the amount of credit loss for our investment securities during 2016 have not changed.
PRE-TAX, OTHER-THAN-TEMPORARY IMPAIRMENTS ON INVESTMENT SECURITIES | |||||||||||
Three months ended September 30 | Nine months ended September 30 | ||||||||||
(In millions) | 2016 | 2015 | 2016 | 2015 | |||||||
Total pre-tax, OTTI recognized | $ | 11 | $ | 3 | $ | 28 | $ | 35 | |||
Pre-tax, OTTI recognized in AOCI | - | - | - | - | |||||||
Pre-tax, OTTI recognized in earnings(a) | $ | 11 | $ | 3 | $ | 28 | $ | 35 | |||
| (a) | Included pre-tax, other-than-temporary impairments recorded in earnings related to equity securities of an immaterial amount and $1 million in the three months ended September 30, 2016 and 2015, respectively and $9 million and $1 million in the nine months ended September 30, 2016 and 2015, respectively. |
2016 3Q FORM 10-Q 82
CONTRACTUAL MATURITIES OF INVESTMENT IN AVAILABLE-FOR-SALE DEBT SECURITIES | |||||
(EXCLUDING MORTGAGE AND ASSET-BACKED SECURITIES) | |||||
Amortized | Estimated | ||||
(In millions) | cost | fair value | |||
Due | |||||
Within one year | $ | 11,653 | $ | 11,656 | |
After one year through five years | 3,984 | 4,247 | |||
After five years through ten years | 4,605 | 5,168 | |||
After ten years | 17,600 | 22,007 | |||
We expect actual maturities to differ from contractual maturities because borrowers have the right to call or prepay certain obligations.
GROSS REALIZED GAINS AND LOSSES ON AVAILABLE-FOR-SALE INVESTMENT SECURITIES | |||||||||||
Three months ended September 30 | Nine months ended September 30 | ||||||||||
(In millions) | 2016 | 2015 | 2016 | 2015 | |||||||
GE | |||||||||||
Gains | $ | 4 | $ | 3 | $ | 10 | $ | 4 | |||
Losses, including impairments | - | - | (10) | (14) | |||||||
Net | 4 | 3 | - | (10) | |||||||
GE Capital | |||||||||||
Gains | 3 | 20 | 39 | 117 | |||||||
Losses, including impairments | (12) | (5) | (43) | (40) | |||||||
Net | (10) | 15 | (3) | 77 | |||||||
Total | $ | (5) | $ | 18 | $ | (4) | $ | 67 | |||
Although we generally do not have the intent to sell any specific securities at the end of the period, in the ordinary course of managing our investment securities portfolio, we may sell securities prior to their maturities for a variety of reasons, including diversification, credit quality, yield and liquidity requirements and the funding of claims and obligations to policyholders.
Proceeds from investment securities sales and early redemptions by issuers totaled $416 million and $2,356 million in the three months ended September 30, 2016 and 2015, respectively, principally from sales of U.S. government and federal agency and Mortgage and asset-backed securities by Trinity and our run-off insurance operations.
Proceeds from investment securities sales and early redemptions by issuers totaled $1,283 million and $4,953 million in the nine months ended September 30, 2016 and 2015, respectively, principally from sales of U.S. government and federal agency and Mortgage and asset-backed securities by Trinity and our run-off insurance operations.
2016 3Q FORM 10-Q 83
NOTE 4. INVENTORIES
(In millions) | September 30, 2016 | December 31, 2015 | |||
Raw materials and work in process | $ | 13,917 | $ | 13,415 | |
Finished goods | 9,387 | 8,265 | |||
Unbilled shipments | 500 | 628 | |||
23,804 | 22,308 | ||||
Revaluation to LIFO | 312 | 207 | |||
Total inventories | $ | 24,116 | $ | 22,515 | |
NOTE 5. GE CAPITAL FINANCING RECEIVABLES AND ALLOWANCE FOR LOSSES ON FINANCING RECEIVABLES
FINANCING RECEIVABLES, NET | |||||
(In millions) | September 30, 2016 | December 31, 2015 | |||
Loans, net of deferred income | $ | 20,090 | $ | 20,115 | |
Investment in financing leases, net of deferred income | 4,963 | 4,969 | |||
25,054 | 25,084 | ||||
Allowance for losses | (65) | (81) | |||
Financing receivables – net(a) | $ | 24,989 | $ | 25,003 | |
| (a) | Included $12,942 million and $12,892 million of receivables sold by GE to GE Capital at September 30, 2016 and December 31, 2015, respectively. |
ALLOWANCE FOR LOSSES | |||||
(In millions) | 2016 | 2015 | |||
Balance at January 1 | $ | 81 | $ | 93 | |
Provision | 12 | 40 | |||
Net write-offs | (28) | (48) | |||
Other(a) | - | - | |||
Balance at September 30 | $ | 65 | $ | 85 | |
(a) Other primarily includes the effects of currency exchange.
We manage our financing receivable portfolio using delinquency and nonaccrual data as key performance indicators. At September 30, 2016, $1,061 million (4.2%), $540 million (2.2%) and $345 million (1.4%) of financing receivables were over 30 days past due, over 90 days past due and on nonaccrual, respectively. Of the $345 million of nonaccrual financing receivables at September 30, 2016, primarily related to aviation financing, $90 million are currently paying in accordance with the contractual terms. At December 31, 2015, $622 million (2.5%), $201 million (0.8%) and $256 million (1.0%) of financing receivables were over 30 days past due, over 90 days past due and on nonaccrual, respectively.
The recorded investment in impaired loans at September 30, 2016 and December 31, 2015 was $270 million and $175 million, respectively, and was primarily related to aviation financing. The method used to measure impairment for these loans is primarily based on collateral value. At September 30, 2016, troubled debt restructurings included in impaired loans were $182 million, the vast majority related to aviation financing.
2016 3Q FORM 10-Q 84
NOTE 6. PROPERTY, PLANT AND EQUIPMENT
(In millions) | September 30, 2016 | December 31, 2015 | |||
Original cost | $ | 87,575 | $ | 90,023 | |
Less accumulated depreciation and amortization | (36,122) | (35,928) | |||
Property, plant and equipment – net | $ | 51,453 | $ | 54,095 | |
Consolidated depreciation and amortization on property, plant and equipment was $1,136 million and $1,265 million in the three months ended September 30, 2016 and 2015, respectively, and $3,641 million and $3,554 million in the nine months ended September 30, 2016 and 2015, respectively.
NOTE 7. ACQUISITIONS, GOODWILL AND OTHER INTANGIBLE ASSETS
ACQUISITIONS
On October 31, 2016, we announced an agreement with Baker Hughes Incorporated (Baker Hughes) to combine GE's Oil & Gas business and Baker Hughes to create a new company. The transaction will be executed using a partnership structure, pursuant to which GE Oil & Gas and Baker Hughes will each contribute their operating assets to a newly formed partnership. GE will have a 62.5% interest in this partnership and existing Baker Hughes shareholders will have a 37.5% interest through a newly NYSE listed corporation. Baker Hughes shareholders will also receive a special one-time cash dividend of $17.50 per share at closing. GE will contribute $7.4 billon to the new partnership to fund the cash dividend to existing Baker Hughes shareholders. The transaction is subject to the approval of Baker Hughes shareholders, regulatory approvals and other customary closing conditions .
On September 14, 2016, we acquired the remaining 74% of the software developer Meridium Inc. for cash proceeds of $370 million. Upon gaining control, we fair valued the business including our previously held 26% equity interest. The preliminary purchase price allocation resulted in goodwill of approximately $350 million and amortizable intangible assets of approximately $165 million. The allocation of the purchase price will be finalized upon completion of post-closing procedures.
On May 10, 2016, we announced the pending acquisition of the heat recovery steam generator ("HRSG") business from Doosan Engineering & Construction ("Doosan") for $250 million. On August 16, 2016, we acquired 80% of the HRSG business for proceeds of approximately $220 million. The remaining 20% of the HRSG business continues to be subject to local regulatory requirements and we expect a staggered close beginning in the fourth quarter of 2016 through the first half of 2017. The preliminary purchase price allocation resulted in goodwill of approximately $170 million and amortizable intangible assets of approximately $35 million. The allocation of the purchase price will be finalized upon completion of post-closing procedures.
On November 2, 2015, we acquired the Thermal, Renewables and Grid businesses from Alstom. The purchase price was €9,200 million ($10,124 million), net of cash acquired of approximately €1,600 million ($1,765 million). In order to obtain approval by the European Commission and the Department of Justice, GE pledged to sell certain of Alstom's gas-turbine assets and its Power Systems Manufacturing subsidiary to Ansaldo Energia SpA (Ansaldo) after the close of the transaction for approximately €120 million. The purchase price will be paid by Ansaldo over a period of five years. The transaction closed on February 25, 2016.
We formed three consolidated joint ventures with Alstom in grid technology, renewable energy, and global nuclear and French steam power. In addition, GE contributed its Digital Energy business to the grid technology joint venture.
Alstom holds redemption rights with respect to its interest in the grid technology and renewable energy joint ventures, which, if exercised, would require us to purchase all of their interest during September 2018 or September 2019. Alstom also holds similar redemption rights for the global nuclear and French steam power joint venture that are exercisable during the first full calendar quarter immediately following the fifth or sixth anniversary of the acquisition date. The redemption price would generally be equal to Alstom's initial investment plus annual accretion of 3% for the grid technology and renewable energy joint ventures and plus annual accretion of 2% for the nuclear and French steam power joint venture, with potential upside sharing based on an EBITDA multiple. Alstom also holds additional redemption rights in other limited circumstances as well as a call option to require GE to sell all of its interests in the renewable energy joint venture at the higher of fair value or Alstom's initial investment plus annual accretion of 3% during the month of May in the years 2016 through 2019 and also upon a decision to IPO the joint venture.
2016 3Q FORM 10-Q 85
GE holds a call option on Alstom's interest in the global nuclear and French steam power joint venture at the same amount as Alstom's redemption price in the event that Alstom exercises its put option in the grid technology or renewable energy joint ventures. GE also has call options on Alstom's interest in the three joint ventures in other limited circumstances. In addition, the French Government holds a preferred interest in the global nuclear and French steam power joint venture, giving it certain protective rights.
The acquisition and alliances with Alstom will have a significant effect on our Power, Energy Connections and Renewable Energy segments, and to a lesser extent our Oil & Gas segment. The financial impact of acquired businesses on individual segments will be affected by a number of variables, including operating performance, purchase accounting effects and realized synergies. In addition, due to the amount of time that elapsed between signing and closing, the commercial operations of the businesses were negatively affected primarily as a result of uncertainty among Alstom customers regarding the execution of the transaction. This affected the overall valuation of the acquired businesses at the time of close and, accordingly, is reflected among the initial and adjusted amounts assigned to the assets and liabilities recorded in purchase accounting.
ALSTOM ACQUISITION ACCOUNTING UPDATE
The total consideration for the acquired businesses, at the time of close included our purchase price of $10,124 million (net of cash acquired) and a preliminary valuation of noncontrolling interests, of approximately $3,600 million for a total of approximately $13,700 million. In the fourth quarter of 2015, the preliminary allocation of purchase price resulted in goodwill, intangible assets and unfavorable customer contract liabilities of approximately $13,500 million, $5,200 million, and $1,100 million respectively. The amount of goodwill recognized compared with identifiable intangible assets is affected by estimated GE-specific synergies, which are not permitted to be included in the measurement of identifiable intangibles. Such synergies include additional revenue from cross-selling complementary product lines. The preliminary fair value of the associated noncontrolling interests consisted of approximately $2,900 million for Alstom's redeemable noncontrolling interests in the three joint ventures (presented separately from total equity in the consolidated balance sheet) and $700 million for all other noncontrolling interests.
Through the third quarter of 2016, we adjusted the preliminary allocation of purchase price, which has now resulted in goodwill, intangible assets, and unfavorable customer contract liabilities, of approximately $17,200 million, $4,400 million, and $2,350 million respectively as of the acquisitions date. These adjustments, which are necessary to reflect acquired assets and liabilities of the acquired businesses at fair value, reflected revisions in estimates in the first, second and third quarters of 2016, primarily related to cash flow and other valuation assumptions for customer contracts, increases to legal reserves, and other fair value adjustments related to acquired assets and liabilities. The approximate amounts of significant purchase accounting adjustments recorded since the date of acquisition include a reduction in the book value of assets sold to Ansaldo of $450 million, adjustments to the fair value of derivative contracts of $350 million, decreases in inventory balances of $115 million, increases to legal reserves of $1,000 million, increases to property, plant and equipment of $50 million, a reduction in the book value of aged accounts receivable of $200 million and other project related costs such as warranty provisions and liquidating damages of $625 million. In addition, the preliminary fair value of Alstom's redeemable noncontrolling interests was increased by $100 million to approximately $3,000 million and all other noncontrolling interests decreased by $100 million to approximately $600 million. We will finalize our purchase accounting analysis in the fourth quarter.
With respect to legal reserves, the amounts we have recorded relate to legacy legal and compliance matters of the Alstom businesses that existed before the date of our acquisition, which matters we have been independently assessing since that time. As previously reported, these include Alstom legacy matters in a number of jurisdictions that involve alleged anti-competitive activities or alleged improper payments. While we believe that the amounts recorded in connection with our purchase accounting reviews of the identified matters are appropriate, such legal and compliance matters are inherently uncertain, and future payments that may be necessary to resolve them could vary from the liability amounts recorded.
In addition to purchase price allocation based on the fair value of acquired assets and liabilities, other adjustments are necessary to reflect differences between IFRS and US GAAP, as applied to differences in facts and circumstances between those businesses as part of Alstom and as part of GE post acquisition. The table below presents approximate consideration paid, amounts of assets acquired and liabilities assumed as of the acquisition date, inclusive of the purchase accounting adjustments and IFRS to US GAAP adjustments recorded as of September 30, 2016, and the fair value of the non-controlling interest .
2016 3Q FORM 10-Q 86
ASSETS ACQUIRED AND LIABILITIES ASSUMED AT THE ACQUISITION DATE | ||
Approximate | ||
balance at | ||
(in millions) | September 30, 2016 | |
Assets | ||
Cash and equivalents | $ | 1,750 |
Current receivables | 4,050 | |
Inventories | 4,700 | |
Property, plant and equipment | 2,850 | |
Goodwill | 17,200 | |
Other intangible assets | 4,400 | |
All other assets, net(a) | 3,750 | |
Total Assets | $ | 38,700 |
Liabilities | ||
Accounts payable | $ | 1,900 |
Progress collections | 2,900 | |
Accrued contract liabilities | 10,500 | |
All other liabilities(b) | 7,850 | |
Total Liabilities | 23,200 | |
Redeemable noncontrolling interests | 3,000 | |
Noncontrolling interest | 600 | |
Total purchase price | 11,900 | |
Cash acquired | 1,750 | |
Total purchase price, net of cash acquired | $ | 10,100 |
| (a) | Includes approximately $350 million of net deferred tax assets, including approximately $50 million of non-U.S. loss carry forwards net of valuation allowances and offsetting liabilities for unrecognized benefits. Also includes approximately $200 million of indemnification receivables for liabilities for unrecognized income tax benefits and other tax uncertainties. |
| (b) | Includes approximately $950 million of liabilities for unrecognized income tax benefits and other uncertain taxes and approximately $750 million of pension and other employee related costs. |
CHANGES IN GOODWILL BALANCES | |||||||||||
Dispositions, | |||||||||||
currency | |||||||||||
Balance at | exchange | Balance at | |||||||||
(In millions) | January 1, 2016 | Acquisitions (a) | and other | September 30, 2016 | |||||||
Power | $ | 16,736 | $ | 3,648 | $ | (4) | $ | 20,381 | |||
Renewable Energy | 2,580 | 314 | (8) | 2,886 | |||||||
Oil & Gas | 10,594 | 1 | (80) | 10,515 | |||||||
Aviation | 8,567 | - | 26 | 8,593 | |||||||
Healthcare | 17,353 | 162 | (47) | 17,467 | |||||||
Transportation | 851 | 25 | 10 | 885 | |||||||
Energy Connections & Lighting | 6,441 | 63 | (211) | 6,293 | |||||||
Capital | 2,370 | - | - | 2,369 | |||||||
Corporate | 34 | 346 | 218 | 598 | |||||||
Total | $ | 65,526 | $ | 4,559 | $ | (97) | $ | 69,988 | |||
Goodwill balances increased by $4,461 million in 2016, primarily as a result of the Alstom acquisition purchase accounting adjustments and other acquisitions.
We test goodwill for impairment annually in the third quarter of each year using data as of July 1 of that year. The impairment test consists of two steps: in step one, the carrying value of the reporting unit is compared with its fair value; in step two, which is applied when the carrying value is more than its fair value, the amount of goodwill impairment, if any, is derived by deducting the fair value of the reporting unit's assets and liabilities from the fair value of its equity, and comparing that amount with the carrying amount of goodwill. We determined fair values for each of the reporting units using the market approach, when available and appropriate, or the income approach, or a combination of both. We assess the valuation methodology based upon the relevance and availability of the data at the time we perform the valuation. If multiple valuation methodologies are used, the results are weighted appropriately.
2016 3Q FORM 10-Q 87
Valuations using the market approach are derived from metrics of publicly traded companies or historically completed transactions of comparable businesses. The selection of comparable businesses is based on the markets in which the reporting units operate giving consideration to risk profiles, size, geography, and diversity of products and services. A market approach is limited to reporting units for which there are publicly traded companies that have the characteristics similar to our businesses.
Under the income approach, fair value is determined based on the present value of estimated future cash flows, discounted at an appropriate risk-adjusted rate. We use our internal forecasts to estimate future cash flows and include an estimate of long-term future growth rates based on our most recent views of the long-term outlook for each business. Actual results may differ from those assumed in our forecasts. We derive our discount rates using a capital asset pricing model and analyzing published rates for industries relevant to our reporting units to estimate the cost of equity financing. We use discount rates that are commensurate with the risks and uncertainty inherent in the respective businesses and in our internally developed forecasts. Discount rates used in our reporting unit valuations ranged from 9.5% to 16.5%.
During the third quarter of 2016, we performed our annual impairment test of goodwill for all of our reporting units. Based on the results of our step one testing, the fair values of each of the GE reporting units exceeded their carrying values; therefore, the second step of the impairment test was not required to be performed for any of our reporting units and no goodwill impairment was recognized.
While all of our reporting units passed step one of our annual impairment testing in 2016, we identified four reporting units for which the fair value was not substantially in excess of its carrying value. Due to the continuation of depressed oil and natural gas prices, the fair value of our Energy Financial Services reporting unit, within our Capital operating segment, continues to be impacted and was in excess of its carrying value by approximately 2%. The goodwill associated with our Energy Financial Services reporting unit was $1,386 million at September 30, 2016, representing approximately 2% of our total goodwill. The estimated fair value of the Energy Financial Services reporting unit is based on a number of assumptions about future business performance and investment, including the performance of our renewable investment portfolio and the expected proceeds and timing of non-strategic investment divestitures. Our assumed discount rate was 10% and was derived by applying a capital asset pricing model and corroborated using equity analyst research reports and implied cost of equity based on forecasted price to earnings per share multiples for similar companies. Based on the results of the step 1 testing, we further substantiated our Energy Financial Services goodwill balance by performing the second step analysis in which the implied fair value of goodwill exceeded its carrying value by approximately $670 million. While we have seen some stabilization in the oil and gas environment, there continues to be uncertainty about a number of assumptions upon which the estimated implied fair value of goodwill is based. While all reporting units within our Oil & Gas operating segment are significantly in excess of their carrying value, the business continues to experience declines in orders, project commencement delays and pricing pressures, which affect their fair value. While the goodwill of the Energy Financial Services and Oil & Gas reporting units are not currently impaired, we will continue to monitor the oil & gas industry and the impact it may have on these businesses.
In addition, the fair value of the Power Conversion reporting unit, within our Energy Connections operating segment, was in excess of its carrying value by approximately 9%. The goodwill associated with our Power Conversion reporting unit was $1,154 million at September 30, 2016, representing approximately 2% of our total goodwill. Our Power Conversion reporting unit has experienced a decline in order growth and an increase in the order to cash cycle, which has caused the reduction in value over the prior year. While the goodwill of the reporting unit is not currently impaired, there could be an impairment in the future as a result of changes in certain assumptions. For example, the reporting unit's fair value could be adversely affected and result in an impairment of goodwill if actual cash flows are below estimated cash flows, the estimated cash flows are discounted at a higher risk-adjusted rate or market multiples decrease.
Finally, two reporting unit fair values were impacted as a result of the Alstom transaction. Subsequent to the close of the acquisition of Alstom, we formed two new reporting units, Grid Solutions and Hydro. The Alstom Grid business was combined with our Digital Energy business, within our Energy Connections operating segment, to create the new Grid Solutions reporting unit and the Alstom Hydro business is a newly created reporting unit within our Renewable Energy operating segment. Since fair value equals carrying value at the time of acquisition, this caused the fair value of these reporting units not to be significantly in excess of its carrying value. The fair value of the Hydro reporting unit approximated its carrying value and the excess of fair value over carrying value of the Grid Solutions reporting unit is approximately 3%. The goodwill associated with our Hydro and Grid Solutions reporting units was $756 million and $3,586 million, respectively, representing approximately 1% and 5% of our total goodwill at September 30, 2016. While the goodwill of these reporting units are not currently impaired, there could be an impairment in the future as a result of changes in certain assumptions. For example, the fair value of these reporting units could be adversely affected and result in an impairment of goodwill if expected synergies of the acquisition with Alstom are not realized or if the reporting units were not able to execute on customer opportunities, the estimated cash flows are discounted at a higher risk-adjusted rate or market multiples decrease.
2016 3Q FORM 10-Q 88
As of September 30, 2016, we believe that the goodwill is recoverable for all of the reporting units; however, there can be no assurances that the goodwill will not be impaired in future periods.
In 2015, we identified one reporting unit for which the fair value was not substantially in excess of its carrying value. Due to the sharp decline experienced in oil prices and the prospect of a continuation of prevailing oil prices, the fair value of our Energy Financial Services reporting unit, within our Capital operating segment, had been impacted and was in excess of its carrying value by approximately 13%. Due to the continued decline in oil prices, we performed an impairment test in the fourth quarter using data as of December 31, 2015, which resulted in the fair value of our Energy Financial Services reporting unit being in excess of its carrying value by approximately 12%. In the current year, the fair value of the Energy Financial Services reporting unit continues to be impacted by the market conditions within the oil & gas industry as discussed above.
In 2015, although not impaired, our Oil & Gas business had also experienced declines in orders, project commencement delays and pricing pressures, which affected the fair value of our Oil & Gas reporting units. Our Oil & Gas business continues to be affected by the overall market conditions as discussed above.
Estimating the fair value of reporting units requires the use of estimates and significant judgments that are based on a number of factors including actual operating results. It is reasonably possible that the judgments and estimates described above could change in future periods.
2016 3Q FORM 10-Q 89
OTHER INTANGIBLE ASSETS
OTHER INTANGIBLE ASSETS - NET | |||||
(In millions) | September 30, 2016 | December 31, 2015 | |||
Intangible assets subject to amortization | $ | 16,679 | $ | 17,688 | |
Indefinite-lived intangible assets(a) | 101 | 109 | |||
Total | $ | 16,779 | $ | 17,797 | |
| (a) | Indefinite-lived intangible assets principally comprise trademarks and in-process research and development. |
INTANGIBLE ASSETS SUBJECT TO AMORTIZATION | |||||||||||||||||
September 30, 2016 | December 31, 2015 | ||||||||||||||||
Gross | Gross | ||||||||||||||||
carrying | Accumulated | carrying | Accumulated | ||||||||||||||
(In millions) | amount | amortization | Net | amount | amortization | Net | |||||||||||
Customer-related | $ | 9,393 | $ | (2,400) | $ | 6,993 | $ | 9,758 | $ | (2,113) | $ | 7,645 | |||||
Patents and technology | 8,813 | (3,459) | 5,354 | 8,543 | (3,096) | 5,447 | |||||||||||
Capitalized software | 7,710 | (4,529) | 3,181 | 7,375 | (4,136) | 3,239 | |||||||||||
Trademarks | 1,246 | (337) | 910 | 1,337 | (282) | 1,055 | |||||||||||
Lease valuations | 132 | (55) | 77 | 167 | (22) | 145 | |||||||||||
Present value of future profits(a) | 676 | (676) | - | 651 | (651) | - | |||||||||||
All other | 312 | (147) | 165 | 267 | (108) | 159 | |||||||||||
Total | $ | 28,282 | $ | (11,602) | $ | 16,679 | $ | 28,098 | $ | (10,408) | $ | 17,688 | |||||
| (a) | Balances at September 30, 2016 and December 31, 2015 reflect adjustments of $247 million and $266 million, respectively, to the present value of future profits in our run-off insurance operation to reflect the effects that would have been recognized had the related unrealized investment securities holding gains and losses actually been realized. |
Intangible assets subject to amortization decreased by $1,009 million in the nine months ended September 30, 2016, primarily as a result of changes in the fair value of the acquired Alstom intangible assets and amortization, offset by acquisitions, capitalized software and patents across all business platforms.
GE amortization expense related to intangible assets subject to amortization was $363 million and $362 million in the three months ended September 30, 2016 and 2015, respectively, and $1,258 million and $1,055 million for the nine months ended September 30, 2016 and 2015, respectively. GE Capital amortization expense related to intangible assets subject to amortization was $33 million and $21 million in the three months ended September 30, 2016 and 2015, respectively, and $103 million and $78 million for the nine months ended September 30, 2016 and 2015, respectively.
NOTE 8. CONTRACT ASSETS
(In millions) | September 30, 2016 | December 31, 2015 | |||
GE | |||||
Contract assets | $ | 24,354 | $ | 21,156 | |
Contract assets reflect revenues earned in excess of billings on our long-term contracts to construct technically complex equipment (such as gas power systems and aircraft engines), long-term product maintenance or extended warranty arrangements and other deferred contract related costs. Long-term product maintenance amounts are presented net of related billings in excess of revenues of $2,970 million and $2,602 million at September 30, 2016 and December 31, 2015, respectively.
2016 3Q FORM 10-Q 90
NOTE 9. BORROWINGS
(In millions) | September 30, 2016 | December 31, 2015 | |||
Short-term borrowings | |||||
GE | |||||
Commercial paper | $ | 1,500 | $ | 500 | |
Current portion of long-term borrowings | 15,212 | 17,770 | |||
Other | 2,229 | 1,522 | |||
Total GE short-term borrowings(a) | 18,940 | 19,792 | |||
GE Capital | |||||
Commercial paper | |||||
U.S. | 5,002 | 650 | |||
Non-U.S. | - | 4,351 | |||
Current portion of long-term borrowings(c) | 9,356 | 24,969 | |||
Intercompany payable to GE(b) | 10,074 | 17,642 | |||
Other | 12 | 1,005 | |||
Total GE Capital short-term borrowings | 24,444 | 48,617 | |||
Eliminations(b) | (11,813) | (18,549) | |||
Total short-term borrowings | $ | 31,571 | $ | 49,860 | |
Long-term borrowings | |||||
GE | |||||
Senior notes | $ | 61,160 | $ | 72,471 | |
Subordinated notes | 2,864 | 2,940 | |||
Subordinated debentures(d) | 744 | 6,600 | |||
Other | 915 | 1,298 | |||
Total GE long-term borrowings(a) | 65,683 | 83,309 | |||
GE Capital | |||||
Senior notes | 47,993 | 59,107 | |||
Subordinated notes | 313 | 251 | |||
Intercompany payable to GE(b) | 49,723 | 67,062 | |||
Other(c) | 1,798 | 2,058 | |||
Total GE Capital long-term borrowings | 99,828 | 128,478 | |||
Eliminations(b) | (49,825) | (67,128) | |||
Total long-term borrowings | $ | 115,686 | $ | 144,659 | |
Non-recourse borrowings of consolidated securitization entities(e) | $ | 2,175 | $ | 3,083 | |
Total borrowings | $ | 149,432 | $ | 197,602 | |
(a) | Excluding assumed debt of GE Capital, GE total borrowings is $19,823 million. |
(b) | The amount of the intercompany payable to GE was $59,798 million as of September 30, 2016, which includes a reduction in the short-term intercompany payable to GE for a $(5,002) million loan in the second quarter of 2016 from GE Capital to GE, which bears the right of offset against amounts owed under the assumed debt agreement. |
(c) | Included $2,468 million and $2,679 million of funding secured by aircraft and other collateral at September 30, 2016 and December 31, 2015, respectively, of which $1,425 million and $1,534 million is non-recourse to GE Capital at September 30, 2016 and December 31, 2015, respectively. |
(d) | Included $744 million and $2,587 million of subordinated debentures at September 30, 2016 and December 31, 2015, respectively, which constitute the sole assets of trusts that have issued trust preferred securities and where GE owns 100% of the common securities of the trusts. Obligations associated with these trusts are unconditionally guaranteed by GE. |
(e) | Included $1,843 million and $918 million of current portion of long-term borrowings at September 30, 2016 and December 31, 2015, respectively. See Note 16. |
2016 3Q FORM 10-Q 91
As discussed in Note 1, the adoption of ASU 2015-03 resulted in the reclassification of $674 million of unamortized debt issuance costs related to the Company's borrowings, of which $641 million was reclassified in long-term borrowings and $33 million was reclassified in short-term borrowings, within our consolidated balance sheet as of December 31, 2015.
On April 10, 2015, GE provided a full and unconditional guarantee on the payment of the principal and interest on all tradable senior and subordinated outstanding long-term debt securities and all commercial paper issued or guaranteed by GE Capital. $92,537 million of such debt was assumed by GE on December 2, 2015 upon its merger with GE Capital resulting in an intercompany payable to GE. At September 30, 2016, the amount of the intercompany payable to GE was $59,798 million, including $64,800 million of borrowings assumed by GE and a reduction for a $5,002 million short-term loan in the second quarter of 2016 from GE Capital to GE, which bears the right of offset against amounts owed under the assumed debt agreement. The Guarantee applies to approximately $53,527 million of GE Capital debt. Prior to the merger $35,999 million (representing $31,154 million of outstanding principal and $4,846 million of premium) of GE Capital debt was exchanged into a new GE Capital international entity, including $16,372 million, which matured on April 15, 2016.
Additional information about borrowings and associated swaps can be found in Notes 15 and 19.
2016 3Q FORM 10-Q 92
NOTE 10. POSTRETIREMENT BENEFIT PLANS
We sponsor a number of pension and retiree health and life insurance benefit plans. Principal pension plans are the GE Pension Plan and the GE Supplementary Pension Plan. Principal retiree benefit plans provide health and life insurance benefits to certain eligible participants and these participants share in the cost of the healthcare benefits. Other pension plans include the U.S. and non-U.S. pension plans with pension assets or obligations greater than $50 million. Smaller pension plans and other retiree benefit plans are not material individually or in the aggregate.
EFFECT ON OPERATIONS OF PENSION PLANS | ||||||||||||
Principal pension plans | ||||||||||||
Three months ended September 30 | Nine months ended September 30 | |||||||||||
(In millions) | 2016 | 2015 | 2016 | 2015 | ||||||||
Service cost for benefits earned | $ | 307 | $ | 348 | $ | 913 | $ | 1,076 | ||||
Prior service cost amortization | 76 | 51 | 228 | 154 | ||||||||
Expected return on plan assets | (837) | (826) | (2,507) | (2,478) | ||||||||
Interest cost on benefit obligations | 736 | 696 | 2,205 | 2,087 | ||||||||
Net actuarial loss amortization | 612 | 823 | 1,836 | 2,468 | ||||||||
Curtailment loss (gain) | - | - | (1) | 71 | (a) | |||||||
Pension plans cost | $ | 894 | $ | 1,092 | $ | 2,674 | $ | 3,378 | ||||
(a) Curtailment loss resulting from GE Capital Exit Plan.
Other pension plans | ||||||||||||
Three months ended September 30 | Nine months ended September 30 | |||||||||||
(In millions) | 2016 | 2015 | 2016 | 2015 | ||||||||
Service cost for benefits earned | $ | 106 | $ | 99 | $ | 337 | $ | 299 | ||||
Prior service cost (credit) amortization | - | 1 | (1) | 1 | ||||||||
Expected return on plan assets | (264) | (211) | (786) | (625) | ||||||||
Interest cost on benefit obligations | 172 | 133 | 512 | 396 | ||||||||
Net actuarial loss amortization | 68 | 72 | 197 | 217 | ||||||||
Pension plans cost | $ | 82 | $ | 94 | $ | 259 | $ | 288 | ||||
EFFECT ON OPERATIONS OF PRINCIPAL RETIREE BENEFIT PLANS | ||||||||||||
Principal retiree benefit plans | ||||||||||||
Three months ended September 30 | Nine months ended September 30 | |||||||||||
(In millions) | 2016 | 2015 | 2016 | 2015 | ||||||||
Service cost for benefits earned | $ | 32 | $ | 27 | $ | 84 | $ | 119 | ||||
Prior service cost (credit) amortization | (41) | (38) | (123) | 29 | ||||||||
Expected return on plan assets | (11) | (12) | (33) | (36) | ||||||||
Interest cost on benefit obligations | 62 | 67 | 188 | 268 | ||||||||
Net actuarial gain amortization | (12) | (14) | (39) | (11) | ||||||||
Curtailment gain, net | - | - | - | (192) | (a) | |||||||
Retiree benefit plans cost | $ | 30 | $ | 30 | $ | 77 | $ | 177 | ||||
| (a) | Gain principally resulting from life insurance amendment. |
2016 3Q FORM 10-Q 93
NOTE 11. INCOME TAXES
UNRECOGNIZED TAX BENEFITS | |||||
(In millions) | September 30, 2016 | December 31, 2015 | |||
Unrecognized tax benefits | $ | 5,605 | $ | 6,778 | |
Portion that, if recognized, would reduce tax expense and effective tax rate(a) | 3,260 | 4,723 | |||
Accrued interest on unrecognized tax benefits | 709 | 805 | |||
Accrued penalties on unrecognized tax benefits | 144 | 98 | |||
Reasonably possible reduction to the balance of unrecognized tax benefits | |||||
in succeeding 12 months | 0-800 | 0-700 | |||
Portion that, if recognized, would reduce tax expense and effective tax rate(a) | 0-200 | 0-200 | |||
| (a) | Some portion of such reduction may be reported as discontinued operations. |
The Internal Revenue Service (IRS) is currently auditing our consolidated U.S. income tax returns for 2012-2013. In addition, certain other U.S. tax deficiency issues and refund claims for previous years are still unresolved. The IRS had disallowed the tax loss on our 2003 disposition of ERC Life Reinsurance Corporation. We contested the disallowance of this loss. In August 2016, the government approved a final settlement of the case and the balance of unrecognized tax benefits and associated interest was adjusted in the quarter to reflect the final agreed settlement. We believe that there are no other jurisdictions in which the outcome of unresolved issues or claims is likely to be material to our results of operations, financial position or cash flows. We further believe that we have made adequate provision for all income tax uncertainties.
2016 3Q FORM 10-Q 94
NOTE 12. SHAREOWNERS' EQUITY
ACCUMULATED OTHER COMPREHENSIVE INCOME (LOSS) | |||||||||||
Three months ended September 30 | Nine months ended September 30 | ||||||||||
(In millions) | 2016 | 2015 | 2016 | 2015 | |||||||
Investment securities | |||||||||||
Beginning balance | $ | 1,077 | $ | 564 | $ | 460 | $ | 1,013 | |||
Other comprehensive income (loss) (OCI) before reclassifications – | |||||||||||
net of deferred taxes of $48, $14, $352 and $(196) | 97 | 22 | 675 | (382) | |||||||
Reclassifications from OCI – net of deferred taxes | |||||||||||
of $5, $(20), $36 and $(45) | 1 | (26) | 40 | (70) | |||||||
Other comprehensive income (loss)(a) | 97 | (3) | 715 | (452) | |||||||
Less OCI attributable to noncontrolling interests | (2) | - | (1) | - | |||||||
Ending balance | $ | 1,176 | $ | 561 | $ | 1,176 | $ | 561 | |||
Currency translation adjustments (CTA) | |||||||||||
Beginning balance | $ | (5,448) | $ | (5,913) | $ | (5,499) | $ | (2,428) | |||
OCI before reclassifications – net of deferred taxes | |||||||||||
of $5, $(185), $222 and $1,158 | (280) | (108) | (138) | (3,936) | |||||||
Reclassifications from OCI – net of deferred taxes | |||||||||||
of $(6), $(628), $74 and $(779) | 85 | 733 | 1 | 1,039 | |||||||
Other comprehensive income (loss)(a) | (194) | 624 | (138) | (2,895) | |||||||
Less OCI attributable to noncontrolling interests | - | (8) | 6 | (43) | |||||||
Ending balance | $ | (5,643) | $ | (5,281) | $ | (5,643) | $ | (5,281) | |||
Cash flow hedges | |||||||||||
Beginning balance | $ | (51) | $ | (140) | $ | (80) | $ | (180) | |||
OCI before reclassifications – net of deferred taxes | |||||||||||
of $(12), $(28), $(17) and $(24) | (21) | (133) | (61) | (626) | |||||||
Reclassifications from OCI – net of deferred taxes | |||||||||||
of $6, $11, $7 and $59 | 52 | 98 | 121 | 632 | |||||||
Other comprehensive income (loss)(a) | 30 | (35) | 60 | 6 | |||||||
Less OCI attributable to noncontrolling interests | - | - | - | - | |||||||
Ending balance | $ | (21) | $ | (174) | $ | (21) | $ | (174) | |||
Benefit plans | |||||||||||
Beginning balance | $ | (10,476) | $ | (12,716) | $ | (11,410) | $ | (16,578) | |||
Prior service credit (costs) - net of deferred taxes | |||||||||||
of $0, $0, $5 and $1,194 | - | - | 23 | 2,090 | |||||||
Net actuarial gain (loss) – net of deferred taxes | |||||||||||
of $49, $0, $6 and $269 | 83 | 43 | 71 | 602 | |||||||
Net curtailment/settlement - net of deferred taxes | |||||||||||
of $0, $0, $0 and $(44) | - | - | (1) | (77) | |||||||
Prior service cost amortization – net of deferred taxes | |||||||||||
of $22, $17, $63 and $92 | 12 | - | 45 | 101 | |||||||
Net actuarial loss amortization – net of deferred taxes | |||||||||||
of $216, $297, $649 and $902 | 453 | 584 | 1,343 | 1,771 | |||||||
Other comprehensive income (loss)(a) | 548 | 627 | 1,481 | 4,486 | |||||||
Less OCI attributable to noncontrolling interests | 6 | - | 5 | (2) | |||||||
Ending balance | $ | (9,934) | $ | (12,089) | $ | (9,934) | $ | (12,089) | |||
Accumulated other comprehensive income (loss) at September 30 | $ | (14,422) | $ | (16,983) | $ | (14,422) | $ | (16,983) | |||
| (a) | Total other comprehensive income (loss) was $481 million and $1,214 million in the three months ended September 30, 2016 and 2015, respectively and $2,117 million and $1,144 million in the nine months ended September 30, 2016 and 2015, respectively. |
2016 3Q FORM 10-Q 95
RECLASSIFICATION OUT OF AOCI | |||||||||||||
Three months ended | Nine months ended | ||||||||||||
September 30 | September 30 | ||||||||||||
(In millions) | 2016 | 2015 | 2016 | 2015 | Statement of earnings caption | ||||||||
Available-for-sale securities | |||||||||||||
Realized gains (losses) on | |||||||||||||
sale/impairment of securities | $ | (6) | $ | 45 | $ | (76) | $ | 116 | Total revenues and other income(a) | ||||
Income taxes | 5 | (20) | 36 | (45) | Benefit (provision) for income taxes(b) | ||||||||
Net of tax | $ | (1) | $ | 26 | $ | (40) | $ | 70 | |||||
Currency translation adjustments | |||||||||||||
Gains (losses) on dispositions | $ | (79) | $ | (104) | $ | (74) | $ | (260) | Total revenues and other income(c) | ||||
Income taxes | (6) | (628) | 74 | (779) | Benefit (provision) for income taxes(d) | ||||||||
Net of tax | $ | (85) | $ | (733) | $ | (1) | $ | (1,039) | |||||
Cash flow hedges | |||||||||||||
Gains (losses) on interest rate | |||||||||||||
derivatives | $ | (12) | $ | (39) | $ | (67) | $ | (100) | Interest and other financial charges | ||||
Foreign exchange contracts | (43) | (72) | (47) | (600) | (e) | ||||||||
Other | (3) | 2 | (14) | 9 | (f) | ||||||||
Total before tax | (57) | (109) | (128) | (691) | |||||||||
Income taxes | 6 | 11 | 7 | 59 | Benefit (provision) for income taxes | ||||||||
Net of tax | $ | (52) | $ | (98) | $ | (121) | $ | (632) | |||||
Benefit plan items | |||||||||||||
Curtailment gain (loss) | $ | - | $ | - | $ | 1 | $ | 121 | (g) | ||||
Amortization of prior service costs | (34) | (17) | (108) | (193) | (g) | ||||||||
Amortization of actuarial gains (losses) | (669) | (881) | (1,992) | (2,673) | (g) | ||||||||
Total before tax | (703) | (898) | (2,099) | (2,745) | |||||||||
Income taxes | 238 | 314 | 712 | 950 | Benefit (provision) for income taxes | ||||||||
Net of tax | $ | (465) | $ | (584) | $ | (1,387) | $ | (1,795) | |||||
Total reclassification adjustments (net of tax) | $ | (602) | $ | (1,389) | $ | (1,548) | $ | (3,396) | |||||
(a) | Included an insignificant amount and $29 million for the three months ended September 30, 2016 and 2015, and $(72) million and $49 million for the nine months ended September 30, 2016 and 2015, respectively in earnings (loss) from discontinued operations, net of taxes. |
(b) | Included $3 million and $(15) million for the three months ended September 30, 2016 and 2015, and $34 million and $(21) million for the nine months ended September 30, 2016 and 2015, respectively in earnings (loss) from discontinued operations, net of taxes. |
(c) | Included $(79) million and $(104) million for the three months ended September 30, 2016 and 2015, and $(8) million and $(261) million for the nine months ended September 30, 2016 and 2015, respectively in earnings (loss) from discontinued operations, net of taxes. |
(d) | Included $(7) million and $(628) million for the three months ended September 30, 2016 and 2015, and $73 million and $(779) million for the nine months ended September 30, 2016 and 2015, respectively in earnings (loss) from discontinued operations, net of taxes |
(e) | Included $(30) million and $(47) million in GE Capital revenues from services and $(13) million and $(25) million in interest and other financial charges in the three months ended September 30, 2016 and 2015, respectively and $1 million and $(587) million in GE Capital revenues from services and $(48) million and $(13) million in interest and other financial charges in the nine months ended September 30, 2016 and 2015, respectively. |
(f) | Primarily recorded in costs and expenses. |
(g) | Curtailment gain (loss), amortization of prior service costs and actuarial gains and losses out of AOCI are included in the computation of net periodic pension costs. See Note 10 for further information. |
2016 3Q FORM 10-Q 96
SHARES OF GE PREFERRED STOCK
At December 31, 2014 GECC had outstanding 50,000 shares of non-cumulative A, B and C Series perpetual preferred stock at an average dividend rate of 6.44% with a face value of $5,000 million. In connection with the GE Capital Exit Plan, on December 3, 2015, these shares were converted into a corresponding Series A, B, and C of fixed-to-floating rate non-cumulative perpetual preferred stock issued by GE with face value of $2,778 million, $2,073 million, $1,094 million, respectively, for a cumulative face value of $5,944 million and an initial average fixed dividend rate of 4.07%. The incremental shares were issued in order to compensate preferred holders for the lower dividend rate. Subsequent to the issuance of the preferred stock on December 3, 2015, in response to investor feedback, GE launched an exchange offer on December 18, 2015 that allowed GE preferred stock investors to exchange their existing Series A, B and C preferred stock into a Series D GE preferred stock. These Series D instruments bear an initial fixed interest rate of 5.00% through January 21, 2021, will bear a floating rate equal to three-month LIBOR plus 3.33% thereafter and are callable on January 21, 2021. On January 20, 2016, $2,687 million of Series A, $2,008 million of Series B and $999 million of Series C were exchanged into $5,694 million Series D GE preferred stock. In addition to interim dividends and accretion of $122 million, a deemed dividend of $232 million was recorded in the nine months ended September 30, 2016, $195 million for the amount by which the fair value of the Series D GE preferred stock exceeded the fair value of the original GECC Series A, B and C preferred stock, and a cash payment of $37 million paid to the GE Series A and B preferred stockholders who exchanged into the Series D GE preferred stock. Post exchange, $91 million of Series A, $64 million of Series B and $95 million of Series C GE preferred stock remain outstanding. The carrying value of the GE preferred stock at September 30, 2016 was $5,250 million and will increase to $5,944 million through periodic accretion to the respective call dates of each series. Principal and accretion for the preferred stock is recorded in other capital in the consolidated Statement of Financial Position and dividends and accretion are presented under the caption "Preferred stock dividends" in the Statement of Earnings (Loss). Dividends on GE preferred stock are payable semi-annually, in June and December and accretion is recorded on a quarterly basis.
In conjunction with the exchange of the GE Capital preferred stock into GE preferred stock and the exchange of Series A, B and C preferred stock into Series D preferred stock, GE Capital issued preferred stock to GE for which the amount and terms mirror the GE preferred stock held by external investors ( $5,250 million carrying value at September 30, 2016).
NONCONTROLLING INTERESTS
Noncontrolling interests in equity of consolidated affiliates includes common shares in consolidated affiliates and preferred stock issued by our affiliates.
CHANGES TO NONCONTROLLING INTERESTS | |||||||||||
Three months ended September 30 | Nine months ended September 30 | ||||||||||
(In millions) | 2016 | 2015 | 2016 | 2015 | |||||||
Beginning balance | $ | 1,693 | $ | 8,776 | $ | 1,864 | $ | 8,674 | |||
Net earnings (loss) | 6 | 39 | (62) | 232 | |||||||
GECC preferred stock dividend | - | - | - | (161) | |||||||
Dividends | (25) | (18) | (47) | (36) | |||||||
Dispositions | (53) | (3) | (94) | (9) | |||||||
Other (including AOCI)(a)(b) | 42 | (6) | 1 | 88 | |||||||
Ending balance | $ | 1,663 | $ | 8,788 | $ | 1,663 | $ | 8,788 | |||
(a) Includes research & development partner funding arrangements, acquisitions and eliminations.
| (b) | Includes $(123) million for deconsolidation of investment funds managed by GE Asset Management (GEAM) upon the adoption of ASU 2015-02, Amendments to the Consolidation Analysis . See Note 1. |
The ending balance for the period ended September 30, 2015 included $4,949 million related to GECC Series A, B and C preferred stock. In connection with the reorganization of the GE Capital businesses, original GECC preferred stock was converted to preferred stock issued by GE in the fourth quarter of 2015, and accordingly GE preferred stock is reflected in shareowners' equity in the consolidated Statement of Financial Position. There was no dividend on GECC preferred stock in the three months ended September 30, 2015. The dividend on GECC preferred stock was $161 million in the nine months ended September 30, 2015. In addition, the ending balance for the period ended September 30, 2015 also included $2,790 million related to Synchrony Financial, which was eliminated as part of the split-off of Synchrony Financial from GE in the fourth quarter of 2015.
2016 3Q FORM 10-Q 97
REDEEMABLE NONCONTROLLING INTEREST
Redeemable noncontrolling interest presented in our statement of financial position includes common shares issued by our affiliates that are redeemable at the option of the holder of those interests.
As part of the Alstom acquisition, we formed three joint ventures in which the noncontrolling interests hold certain redemption rights. These joint ventures and the associated redemption rights are discussed in Note 7. Our retained earnings will be adjusted for subsequent changes in the redemption value of the noncontrolling interest in these entities to the extent that the redemption value exceeds the carrying amount of the noncontrolling interest.
Three months ended September 30 | Nine months ended September 30 | ||||||||||
(In millions) | 2016 | 2015 | 2016 | 2015 | |||||||
Beginning balance | $ | 3,070 | $ | 79 | $ | 2,972 | $ | 98 | |||
Net earnings (loss) | (82) | - | (221) | (3) | |||||||
Dividends | (8) | - | (17) | (11) | |||||||
Redemption value adjustment | 68 | - | 178 | 1 | |||||||
Other | 3 | 3 | 138 | (4) | |||||||
Ending balance | $ | 3,051 | $ | 82 | $ | 3,051 | $ | 82 | |||
OTHER
During the first nine months of 2016, we repurchased $18,144 million of our common stock, including $9,125 million repurchased under the accelerated share repurchase (ASR) agreements.
In September 2016, we entered into an ASR agreement with a financial institution which allowed us to repurchase GE common stock at a price below its volume weighted-average price during a given period. During the third quarter, we paid $2,500 million and received and classified as treasury shares an initial delivery of 71,189,280 shares based on then-current market prices. The payment was recorded as a reduction to shareowners' equity, consisting of a $2,125 million increase in treasury stock, which reflects the value of the shares received upon initial delivery, and a $375 million decrease in other capital, which reflects the value of the stock held back pending final delivery. In the fourth quarter of 2016, we received the remaining 14,758,566 shares based on the final volume weighted-average price less the negotiated discount.
We accounted for the ASR as two separate transactions: (i) 71,189,280 shares of common stock initially delivered to GE and $2,125 million was accounted for as a treasury stock transaction and (ii) the unsettled contract of $375 million was determined to be a forward contract indexed to GE's own common stock. The initial delivery of 71,189,280 shares resulted in an immediate reduction of the outstanding shares used to calculate the weighted-average common shares outstanding for basic and diluted earnings per share. GE has determined that the forward contract, indexed to its own common stock, met all the criteria for equity classification.
In the third quarter of 2016, we received the remaining 18,269,775 shares related to the ASR agreement entered in June 2016 based on the final volume weighted-average price less the negotiated discount.
Common dividends from GE Capital totaled $5,050 million and $16,050 million to GE in the three months ended September 30, 2016 and the nine months ended September 30, 2016, respectively. GE Capital did not pay any common dividends to GE in the three months ended September 30, 2015 and paid common dividends of $450 million to GE in the nine months ended September 30, 2015, respectively. Dividends on GE preferred stock totaled $33 million and $474 million, including cash dividends of $184 million to GE in the three months ended September 30, 2016 and the nine months ended September 30, 2016, respectively. There were no dividends on GE preferred stock in the three months ended and in the nine months ended September 30, 2015.
2016 3Q FORM 10-Q 98
NOTE 13. EARNINGS PER SHARE INFORMATION
Three months ended September 30 | |||||||||||
2016 | 2015 | ||||||||||
(In millions; per-share amounts in dollars) | Diluted | Basic | Diluted | Basic | |||||||
Amounts attributable to the Company: | |||||||||||
Consolidated | |||||||||||
Earnings from continuing operations for | |||||||||||
per-share calculation(a)(b) | $ | 2,127 | $ | 2,127 | $ | 1,962 | $ | 1,962 | |||
Preferred stock dividends | (33) | (33) | - | - | |||||||
Earnings from continuing operations attributable to | |||||||||||
common shareowners for per-share calculation(a)(b) | $ | 2,094 | $ | 2,094 | $ | 1,962 | $ | 1,962 | |||
Earnings (loss) from discontinued operations | |||||||||||
for per-share calculation(a)(b) | (100) | (100) | 540 | 540 | |||||||
Net earnings attributable to GE common | |||||||||||
shareowners for per-share calculation(a)(b) | $ | 1,991 | $ | 1,991 | $ | 2,502 | $ | 2,502 | |||
Average equivalent shares | |||||||||||
Shares of GE common stock outstanding | 8,904 | 8,904 | 10,103 | 10,103 | |||||||
Employee compensation-related shares (including | |||||||||||
stock options) | 112 | - | 70 | - | |||||||
Total average equivalent shares | 9,016 | 8,904 | 10,173 | 10,103 | |||||||
Per-share amounts | |||||||||||
Earnings from continuing operations | $ | 0.23 | $ | 0.24 | $ | 0.19 | $ | 0.19 | |||
Earnings (loss) from discontinued operations | (0.01) | (0.01) | 0.05 | 0.05 | |||||||
Net earnings | 0.22 | 0.22 | 0.25 | 0.25 | |||||||
Nine months ended September 30 | |||||||||||
2016 | 2015 | ||||||||||
(In millions; per-share amounts in dollars) | Diluted | Basic | Diluted | Basic | |||||||
Amounts attributable to the Company: | |||||||||||
Consolidated | |||||||||||
Earnings (loss) from continuing operations for | |||||||||||
per-share calculation(a)(b) | $ | 6,110 | $ | 6,110 | $ | (913) | $ | (913) | |||
Preferred stock dividends | (474) | (474) | - | - | |||||||
Earnings (loss) from continuing operations attributable to | |||||||||||
common shareowners for per-share calculation(a)(b) | $ | 5,636 | $ | 5,636 | $ | (913) | $ | (913) | |||
Loss from discontinued operations | |||||||||||
for per-share calculation(a)(b) | (956) | (956) | (11,532) | (11,532) | |||||||
Net earnings (loss) attributable to GE common | |||||||||||
shareowners for per-share calculation(a)(b) | $ | 4,680 | $ | 4,680 | $ | (12,436) | $ | (12,436) | |||
Average equivalent shares | |||||||||||
Shares of GE common stock outstanding | 9,096 | 9,096 | 10,085 | 10,085 | |||||||
Employee compensation-related shares (including | |||||||||||
stock options) | 105 | - | - | - | |||||||
Total average equivalent shares | 9,201 | 9,096 | 10,085 | 10,085 | |||||||
Per-share amounts | |||||||||||
Earnings (loss) from continuing operations | $ | 0.61 | $ | 0.62 | $ | (0.09) | $ | (0.09) | |||
Earnings (loss) from discontinued operations | (0.10) | (0.11) | (1.14) | (1.14) | |||||||
Net earnings (loss) | 0.51 | 0.51 | (1.23) | (1.23) | |||||||
(a) | Our unvested restricted stock unit awards that contain non-forfeitable rights to dividends or dividend equivalents are considered participating securities. For the three months ended September 30, 2016 and 2015, participating securities are included in the computation of earnings (loss) per share pursuant to the two-class method and the application of this treatment had an insignificant effect. For the nine month period ended September 30, 2016, pursuant to the two-class method, as a result of the excess of dividends in current period earnings, losses were not allocated to the participating securities. For the nine month period ended September 30, 2015, pursuant to the two-class method, as a result of the net loss from continuing operations, losses were not allocated to the participating securities. |
(b) | Included an insignificant amount of dividend equivalents in each of the periods presented. |
2016 3Q FORM 10-Q 99
For the three months ended September 30, 2016 and 2015, approximately 15 million and 89 million, respectively, of outstanding stock awards were not included in the computation of diluted earnings (loss) per share because their effect was antidilutive. For the nine months ended September 30, 2016, approximately 24 million of outstanding stock awards were not included in the computation of diluted earnings per share because their effect was antidilutive. As a result of the loss from continuing operations for the nine months ended September 30, 2015, outstanding stock awards of approximately 398 million, were not included in the computation of diluted earnings per share because their effect was antidilutive.
In September 2016, we entered into an ASR agreement to repurchase shares of GE common stock. See Note 12 for additional information. The initial delivery of 71,189,280 shares resulted in an immediate reduction of the outstanding shares used to calculate the weighted-average common shares outstanding for basic and diluted earnings per share. GE has determined that the forward contract, indexed to its own common stock, met all the criteria for equity classification. There was no dilutive impact on earnings per share related to the forward contract.
Earnings per share amounts are computed independently, as a result, the sum of per-share amounts from continuing operations and discontinued operations may not equal the total per share amounts for net earnings (loss).
2016 3Q FORM 10-Q 100
NOTE 14. FAIR VALUE MEASUREMENTS
RECURRING FAIR VALUE MEASUREMENTS
Our assets and liabilities measured at fair value on a recurring basis include investment securities primarily supporting obligations to annuitants and policyholders in our run-off insurance operations.
ASSETS AND LIABILITIES MEASURED AT FAIR VALUE ON A RECURRING BASIS | ||||||||||||||
Netting | ||||||||||||||
(In millions) | Level 1 | (a) | Level 2 | (a) | Level 3 | adjustment | (b) | Net balance | ||||||
September 30, 2016 | ||||||||||||||
Assets | ||||||||||||||
Investment securities | ||||||||||||||
Debt | ||||||||||||||
U.S. corporate | $ | - | $ | 21,600 | $ | 3,499 | $ | - | $ | 25,099 | ||||
State and municipal | - | 4,502 | 55 | - | 4,556 | |||||||||
Mortgage and asset-backed | - | 2,958 | 8 | - | 2,966 | |||||||||
Corporate – non-U.S. | - | 11,636 | 237 | - | 11,873 | |||||||||
Government – non-U.S. | - | 752 | - | - | 752 | |||||||||
U.S. government and federal agency | - | 492 | 305 | - | 797 | |||||||||
Equity | 301 | 14 | 10 | - | 325 | |||||||||
Derivatives(c) | - | 6,947 | 27 | (6,521) | 454 | |||||||||
Total | $ | 301 | $ | 48,902 | $ | 4,141 | $ | (6,521) | $ | 46,823 | ||||
Liabilities | ||||||||||||||
Derivatives | $ | - | $ | 3,987 | $ | 1 | $ | (3,289) | $ | 699 | ||||
Other(e) | - | 1,107 | - | - | 1,107 | |||||||||
Total | $ | - | $ | 5,094 | $ | 1 | $ | (3,289) | $ | 1,806 | ||||
December 31, 2015 | ||||||||||||||
Assets | ||||||||||||||
Investment securities | ||||||||||||||
Debt | ||||||||||||||
U.S. corporate | $ | - | $ | 19,351 | $ | 3,006 | $ | - | $ | 22,358 | ||||
State and municipal | - | 4,215 | 30 | - | 4,245 | |||||||||
Mortgage and asset-backed | - | 3,084 | 32 | - | 3,116 | |||||||||
Corporate – non-U.S. | 12 | 544 | 290 | - | 847 | |||||||||
Government – non-U.S. | 5 | 410 | - | - | 415 | |||||||||
U.S. government and federal agency | 49 | 404 | 323 | - | 776 | |||||||||
Equity | 194 | 9 | 13 | - | 217 | |||||||||
Derivatives(c) | - | 7,312 | 79 | (6,110) | 1,281 | |||||||||
Other(d) | - | - | 259 | - | 259 | |||||||||
Total | $ | 260 | $ | 35,331 | $ | 4,033 | $ | (6,110) | $ | 33,512 | ||||
Liabilities | ||||||||||||||
Derivatives | $ | - | $ | 5,677 | $ | 4 | $ | (4,968) | $ | 713 | ||||
Other(e) | - | 1,182 | - | - | 1,182 | |||||||||
Total | $ | - | $ | 6,860 | $ | 4 | $ | (4,968) | $ | 1,895 | ||||
| (a) | There were $12 million of Corporate – non-U.S. securities and $50 million of U.S. Treasuries and federal agency securities transferred from Level 1 to Level 2 in the nine months ended September 30, 2016 primarily attributable to changes in approach. There were no securities transferred between Level 1 and Level 2 in the year ended December 31, 2015. |
| (b) | The netting of derivative receivables and payables (including the effects of any collateral posted or received) is permitted when a legally enforceable master netting agreement exists. |
| (c) | The fair value of derivatives includes an adjustment for non-performance risk. At September 30, 2016 and December 31, 2015, the cumulative adjustment for non-performance risk was $(9) million and insignificant, respectively. See Notes 15 and 19 for additional information on the composition of our derivative portfolio. |
| (d) | Includes private equity investments. |
| (e) | Primarily represents the liabilities associated with certain of our deferred incentive compensation plans. |
2016 3Q FORM 10-Q 101
LEVEL 3 INSTRUMENTS
The majority of our Level 3 balances consist of investment securities classified as available-for-sale with changes in fair value recorded in shareowners' equity.
CHANGES IN LEVEL 3 INSTRUMENTS FOR THE THREE MONTHS ENDED | |||||||||||||||||||||||||||
Net | |||||||||||||||||||||||||||
change in | |||||||||||||||||||||||||||
Net | Net | unrealized | |||||||||||||||||||||||||
realized/ | realized/ | gains | |||||||||||||||||||||||||
unrealized | unrealized | (losses) | |||||||||||||||||||||||||
gains | gains | relating to | |||||||||||||||||||||||||
(losses) | (losses) | Transfers | Transfers | instruments | |||||||||||||||||||||||
Balance at | included in | included | into | out of | Balance at | still held at | |||||||||||||||||||||
(In millions) | July 1 | earnings(a) | in AOCI | Purchases | Sales | Settlements | Level 3(b) | Level 3(b) | September 30 | September 30(c) | |||||||||||||||||
2016 | |||||||||||||||||||||||||||
Investment securities | |||||||||||||||||||||||||||
Debt | |||||||||||||||||||||||||||
U.S. corporate | $ | 3,422 | $ | (6) | $ | 19 | $ | 139 | $ | (23) | $ | (43) | $ | - | $ | (10) | $ | 3,499 | $ | - | |||||||
State and municipal | 32 | - | 1 | 22 | - | - | - | - | 55 | - | |||||||||||||||||
Mortgage and | |||||||||||||||||||||||||||
asset-backed | 8 | - | - | - | - | - | - | - | 8 | - | |||||||||||||||||
Corporate – non-U.S. | 244 | - | - | - | - | - | 3 | (10) | 237 | - | |||||||||||||||||
U.S. government and | |||||||||||||||||||||||||||
federal agency | 307 | - | (2) | - | - | - | - | - | 305 | - | |||||||||||||||||
Equity | 8 | (1) | 3 | - | - | - | - | - | 10 | - | |||||||||||||||||
Derivatives(d)(e) | 37 | 9 | - | - | - | (19) | - | - | 27 | (1) | |||||||||||||||||
Total | $ | 4,057 | $ | 3 | $ | 21 | $ | 161 | $ | (23) | $ | (62) | $ | 3 | $ | (20) | $ | 4,141 | $ | (1) | |||||||
2015 | |||||||||||||||||||||||||||
Investment securities | |||||||||||||||||||||||||||
Debt | |||||||||||||||||||||||||||
U.S. corporate | $ | 3,024 | $ | 5 | $ | (7) | $ | 74 | $ | (28) | $ | (37) | $ | 35 | $ | (15) | $ | 3,050 | $ | - | |||||||
State and municipal | 47 | - | - | - | - | - | - | (17) | 30 | - | |||||||||||||||||
Mortgage and | |||||||||||||||||||||||||||
asset-backed | 78 | (2) | - | - | - | - | 33 | (70) | 40 | - | |||||||||||||||||
Corporate – non-U.S. | 283 | - | - | 1 | - | (1) | - | - | 283 | - | |||||||||||||||||
Government – non-U.S. | 2 | - | - | - | - | - | - | (2) | - | - | |||||||||||||||||
U.S. government and | |||||||||||||||||||||||||||
federal agency | 293 | - | 16 | - | - | - | - | - | 309 | - | |||||||||||||||||
Equity | 6 | - | (1) | - | - | - | 6 | - | 10 | - | |||||||||||||||||
Derivatives(d)(e) | 65 | 15 | - | - | - | (1) | - | - | 79 | (27) | |||||||||||||||||
Other | 222 | 10 | - | - | - | - | - | - | 233 | - | |||||||||||||||||
Total | $ | 4,020 | $ | 29 | $ | 8 | $ | 74 | $ | (28) | $ | (40) | $ | 74 | $ | (103) | $ | 4,034 | $ | (27) | |||||||
(a) | Earnings effects are primarily included in the "GE Capital revenues from services" and "Interest and other financial charges" captions in the Statement of Earnings. |
(b) | Transfers in and out of Level 3 are considered to occur at the beginning of the period. Transfers out of Level 3 were primarily a result of increased use of quotes from independent pricing vendors based on recent trading activity. |
(c) | Represents the amount of unrealized gains or losses for the period included in earnings. |
(d) | Represents derivative assets net of derivative liabilities and includes cash accruals of none and $12 million not reflected in the fair value hierarchy table for the three months ended September 30, 2016 and 2015, respectively. |
(e) | Gains (losses) included in net realized/unrealized gains (losses) included in earnings were offset by the earnings effects from the underlying items that were economically hedged. See Notes 15 and 19. |
2016 3Q FORM 10-Q 102
CHANGES IN LEVEL 3 INSTRUMENTS FOR THE NINE MONTHS ENDED | |||||||||||||||||||||||||||
Net | |||||||||||||||||||||||||||
change in | |||||||||||||||||||||||||||
Net | Net | unrealized | |||||||||||||||||||||||||
realized/ | realized/ | gains | |||||||||||||||||||||||||
unrealized | unrealized | (losses) | |||||||||||||||||||||||||
gains | gains | relating to | |||||||||||||||||||||||||
(losses) | (losses) | Transfers | Transfers | instruments | |||||||||||||||||||||||
Balance at | included in | included | into | out of | Balance at | still held at | |||||||||||||||||||||
(In millions) | January 1 | earnings(a) | in AOCI | Purchases | Sales | Settlements | Level 3(b) | Level 3(b) | September 30 | September 30(c) | |||||||||||||||||
2016 | |||||||||||||||||||||||||||
Investment securities | |||||||||||||||||||||||||||
Debt | |||||||||||||||||||||||||||
U.S. corporate | $ | 3,006 | $ | 3 | $ | 251 | $ | 372 | $ | (28) | $ | (86) | $ | 8 | $ | (28) | $ | 3,499 | $ | - | |||||||
State and municipal | 30 | - | 3 | 22 | - | (1) | - | - | 55 | - | |||||||||||||||||
Mortgage and | |||||||||||||||||||||||||||
asset-backed | 32 | (19) | - | - | - | (6) | - | - | 8 | - | |||||||||||||||||
Corporate – non-U.S. | 290 | 28 | - | 9 | (82) | - | 2 | (10) | 237 | - | |||||||||||||||||
U.S. government and | |||||||||||||||||||||||||||
federal agency | 323 | - | (16) | - | - | (1) | - | - | 305 | - | |||||||||||||||||
Equity | 13 | (7) | 4 | - | - | - | - | - | 10 | - | |||||||||||||||||
Derivatives(d)(e) | 88 | (13) | - | - | - | (58) | - | 10 | 27 | (21) | |||||||||||||||||
Other | 259 | - | - | - | - | - | - | (259) | - | - | |||||||||||||||||
Total | $ | 4,042 | $ | (8) | $ | 241 | $ | 404 | $ | (110) | $ | (152) | $ | 10 | $ | (287) | $ | 4,141 | $ | (21) | |||||||
2015 | |||||||||||||||||||||||||||
Investment securities | |||||||||||||||||||||||||||
Debt | |||||||||||||||||||||||||||
U.S. corporate | $ | 3,053 | $ | (1) | $ | (93) | $ | 255 | $ | (78) | $ | (93) | $ | 35 | $ | (28) | $ | 3,050 | $ | - | |||||||
State and municipal | 58 | - | (2) | - | - | (8) | - | (17) | 30 | - | |||||||||||||||||
Mortgage and | |||||||||||||||||||||||||||
asset-backed | 145 | (11) | (9) | - | (32) | (3) | 33 | (83) | 40 | - | |||||||||||||||||
Corporate – non-U.S. | 337 | - | (4) | 1 | (49) | (1) | - | - | 283 | - | |||||||||||||||||
Government – non-U.S. | 2 | - | - | - | - | - | - | (2) | - | - | |||||||||||||||||
U.S. government and | |||||||||||||||||||||||||||
federal agency | 266 | - | 44 | - | - | (1) | - | - | 309 | - | |||||||||||||||||
Equity | 9 | 2 | (3) | 6 | (6) | (4) | 6 | - | 10 | - | |||||||||||||||||
Derivatives(d)(e) | 29 | 19 | - | - | - | (9) | 40 | - | 79 | 13 | |||||||||||||||||
Other | 277 | (24) | - | - | (20) | - | - | - | 233 | (37) | |||||||||||||||||
Total | $ | 4,175 | $ | (15) | $ | (66) | $ | 261 | $ | (185) | $ | (120) | $ | 115 | $ | (130) | $ | 4,034 | $ | (24) | |||||||
(a) | Earnings effects are primarily included in the "GE Capital revenues from services" and "Interest and other financial charges" captions in the Statement of Earnings. |
(b) | Transfers in and out of Level 3 are considered to occur at the beginning of the period. Transfers out of Level 3 for the nine months ended September 30, 2016 were primarily a result of the adoption of ASU 2015-02, Amendments to the Consolidation Analysis . See Note 1. |
(c) | Represents the amount of unrealized gains or losses for the period included in earnings. |
(d) | Represents derivative assets net of derivative liabilities and includes cash accruals of none and $12 million not reflected in the fair value hierarchy table for the nine months ended September 30, 2016 and 2015, respectively. |
(e) | Gains (losses) included in net realized/unrealized gains (losses) included in earnings were offset by the earnings effects from the underlying items that were economically hedged. See Notes 15 and 19. |
2016 3Q FORM 10-Q 103
The following table represents non-recurring fair value amounts (as measured at the time of the adjustment) for those assets remeasured to fair value on a non-recurring basis during the fiscal year and still held at September 30, 2016 and December 31, 2015.
Remeasured during | Remeasured during | ||||||||||
the nine months ended | the year ended | ||||||||||
September 30, 2016 | December 31, 2015 | ||||||||||
(In millions) | Level 2 | Level 3 | Level 2 | Level 3 | |||||||
Financing receivables and financing receivables held for sale | $ | - | $ | 31 | $ | - | $ | 154 | |||
Cost and equity method investments | - | 230 | 1 | 436 | |||||||
Long-lived assets | 27 | 681 | 2 | 882 | |||||||
Total | $ | 27 | $ | 942 | $ | 3 | $ | 1,471 | |||
The following table represents the fair value adjustments to assets measured at fair value on a non-recurring basis and still held at September 30, 2016 and 2015.
Three months ended September 30 | Nine months ended September 30 | ||||||||||
(In millions) | 2016 | 2015 | 2016 | 2015 | |||||||
Financing receivables and financing receivables held for sale | $ | - | $ | (10) | $ | (14) | $ | (46) | |||
Cost and equity method investments | (2) | (280) | (95) | (370) | |||||||
Long-lived assets | (21) | (89) | (161) | (142) | |||||||
Total | $ | (24) | $ | (380) | $ | (270) | $ | (558) | |||
2016 3Q FORM 10-Q 104
LEVEL 3 MEASUREMENTS - SIGNIFICANT UNOBSERVABLE INPUTS | |||||||||
Range | |||||||||
(Dollars in millions) | Fair value | Valuation technique | Unobservable inputs | (weighted-average) | |||||
September 30, 2016 | |||||||||
Recurring fair value measurements | |||||||||
Investment securities – Debt | |||||||||
U.S. corporate | $ | 885 | Income approach | Discount rate(a) | 1.4%-17.4% (7.6%) | ||||
Mortgage and asset-backed | 8 | Income approach | Discount rate(a) | 2.8%-7.0% (4.9%) | |||||
Non-recurring fair value measurements | |||||||||
Financing receivables and | |||||||||
financing receivables held for sale | $ | 31 | Income approach | Discount rate(a) | 9.0%-30.0% (20.4%) | ||||
Cost and equity method investments | 132 | Income approach | Discount rate(a) | 9.0%-20.0% (13.3%) | |||||
Long-lived assets | 620 | Income approach | Discount rate(a) | 2.5%-11.6% (10.4%) | |||||
Market comparables | |||||||||
December 31, 2015 | |||||||||
Recurring fair value measurements | |||||||||
Investment securities – Debt | |||||||||
U.S. corporate | $ | 834 | Income approach | Discount rate(a) | 1.7%-14.1% (8.6%) | ||||
Mortgage and asset-backed | 31 | Income approach | Discount rate(a) | 5.0%-12.0% (10.5%) | |||||
Corporate – non-U.S. | 236 | Income approach | Discount rate(a) | 6.5%-14.0% (7.5%) | |||||
Other financial assets | 259 | Income approach, | EBITDA multiple | 6.1X-15.0X (9.9X) | |||||
Market comparables | Capitalization rate | 7.8%-7.8% (7.8%) | |||||||
Non-recurring fair value measurements | |||||||||
Financing receivables and | |||||||||
financing receivables held for sale | $ | 146 | Income approach | Discount rate(a) | 6.5%-30.0% (10.7%) | ||||
Cost and equity method investments | 293 | Income approach, | Discount rate(a) | 9.5%-35.0% (14.4%) | |||||
Long-lived assets | 830 | Income approach | Discount rate(a) | 1.8%-11.7% (10.5%) | |||||
| (a) | Discount rates are determined based on inputs that market participants would use when pricing investments, including credit and liquidity risk. An increase in the discount rate would result in a decrease in the fair value. |
At September 30, 2016 and December 31, 2015, other Level 3 recurring fair value measurements of $3,244 million and $2,637 million, respectively, and non-recurring measurements of $148 million and $122 million, respectively, are valued using non-binding broker quotes or other third-party sources. At September 30, 2016 and December 31, 2015, other recurring fair value measurements of $4 million and $32 million, respectively, and non-recurring fair value measurements of $11 million and $80 million, respectively, were individually insignificant and utilize a number of different unobservable inputs not subject to meaningful aggregation.
2016 3Q FORM 10-Q 105
NOTE 15. FINANCIAL INSTRUMENTS
The following table provides information about assets and liabilities not carried at fair value. The table excludes finance leases and non-financial assets and liabilities. Substantially all of the assets discussed below are considered to be Level 3. The vast majority of our liabilities' fair value can be determined based on significant observable inputs and thus considered Level 2. Few of the instruments are actively traded and their fair values must often be determined using financial models. Realization of the fair value of these instruments depends upon market forces beyond our control, including marketplace liquidity.
September 30, 2016 | December 31, 2015 | |||||||||||
Carrying | Carrying | |||||||||||
amount | Estimated | amount | Estimated | |||||||||
(In millions) | (net) | fair value | (net) | fair value | ||||||||
GE | ||||||||||||
Assets | ||||||||||||
Investments and notes receivable | $ | 1,388 | $ | 1,458 | $ | 1,104 | $ | 1,174 | ||||
Liabilities | ||||||||||||
Borrowings(a)(b) | 19,823 | 21,363 | 18,397 | 18,954 | ||||||||
Borrowings (debt assumed)(a)(c) | 64,800 | 73,879 | 84,704 | 92,231 | ||||||||
GE Capital | ||||||||||||
Assets | ||||||||||||
Loans | 20,047 | 19,836 | 20,061 | 19,774 | ||||||||
Time deposits(d) | - | - | 10,386 | 10,386 | ||||||||
Other commercial mortgages | 1,417 | 1,536 | 1,381 | 1,447 | ||||||||
Loans held for sale | 497 | 497 | 342 | 342 | ||||||||
Other financial instruments(e) | 102 | 125 | 94 | 110 | ||||||||
Liabilities | ||||||||||||
Borrowings(a)(f)(g)(h) | 66,649 | 69,839 | 95,474 | 99,396 | ||||||||
Investment contracts | 2,822 | 3,420 | 2,955 | 3,441 | ||||||||
(a) See Note 9.
(b) Included $166 million and $116 million of accrued interest in estimated fair value at September 30, 2016 and December 31, 2015, respectively.
| (c) | Included $682 million and $1,006 million of accrued interest in estimated fair value at September 30, 2016 and December 31, 2015, respectively. |
| (d) | Balances at December 31, 2015 comprised high quality interest bearing deposits of global banks that matured in April and July 2016. |
| (e) | Principally comprises cost method investments. |
| (f) | Fair values exclude interest rate and currency derivatives designated as hedges of borrowings. Had they been included, the fair value of borrowings at September 30, 2016 and December 31, 2015 would have been reduced by $5,060 million and $3,001 million, respectively. |
| (g) | Included $878 million and $1,103 million of accrued interest in estimated fair value at September 30, 2016 and December 31, 2015, respectively. |
| (h) | Excluded $59,798 million and $84,704 million of intercompany payable to GE at September 30, 2016 and December 31, 2015 respectively, which includes a reduction for a $5,002 million short-term loan in second quarter of 2016 from GE Capital to GE, which bears the right of offset against amounts owed under the assumed debt agreement. |
NOTIONAL AMOUNTS OF LOAN COMMITMENTS | |||||
(In millions) | September 30, 2016 | December 31, 2015 | |||
Ordinary course of business lending commitments(a) | $ | 529 | $ | 531 | |
Unused revolving credit lines | 200 | 279 | |||
| (a) | Excluded investment commitments of $800 million and $782 million at September 30, 2016 and December 31, 2015, respectively. |
2016 3Q FORM 10-Q 106
SECURITIES REPURCHASE AND REVERSE REPURCHASE ARRANGEMENTS
Our issuances of securities repurchase agreements are insignificant. No repurchase agreements were accounted for as off-book financing and we do not engage in securities lending transactions. At September 30, 2016, we were party to no repurchase agreements.
We also enter into reverse securities repurchase agreements, primarily for short-term investment with maturities of 90 days or less. At September 30, 2016, we were party to reverse repurchase agreements totaling $7.1 billion, which were reported in cash and equivalents on the financial statements. Under these reverse securities repurchase agreements, we typically lend available cash at a specified rate of interest and hold U.S. or highly-rated European government securities as collateral during the term of the agreement. Collateral value is in excess of amounts loaned under the agreements.
DERIVATIVES AND HEDGING
In this section, we explain how we use derivatives to manage our risks and how these financial instruments are reflected in our financial statements. Our use of derivatives relates solely to risk management; we do not use derivatives for speculation. As discussed elsewhere in this report, we are executing a plan to reduce the size and scope of our financial services business, with the intention of principally retaining those activities that support our industrial businesses. The affected businesses have either been sold or are held for sale and are presented as discontinued operations in our financial statements as of September 30, 2016. As a result of these actions, the significance of financial services hedging activity will diminish significantly in the future.
RISK MANAGEMENT STRATEGY
In our industrial businesses, we buy, manufacture and sell components and products across global markets. These activities expose us to changes in foreign currency exchange rates and commodity prices, which can adversely affect revenues earned and costs of operating our industrial businesses. When the currency in which we sell equipment differs from the primary currency of one of our industrial businesses (known as its functional currency) and the exchange rate fluctuates, it will affect the revenue we earn on the sale. These sales and purchase transactions also create receivables and payables denominated in foreign currencies, which expose us to foreign currency gains and losses based on changes in exchange rates. Changes in the price of a raw material that we use in manufacturing can affect the cost of manufacturing. We use derivatives to mitigate or eliminate these exposures.
With respect to our ongoing financial services activities, our key exposures relate to interest rate and currency risk. To the extent feasible, we seek to ensure that the characteristics of the debt we have issued align with the assets being funded. The form (fixed rate or floating rate) and currency denomination of the debt we issue depends on a number of considerations, the most important of which are market factors (demand, pricing, etc.) that affect the economics of the issuance. If the form and currency denomination of the debt does not match the assets being funded, we typically execute derivatives to meet this objective within defined limits.
2016 3Q FORM 10-Q 107
FORMS OF HEDGING
In this section we explain the hedging methods we use and their effects on our financial statements.
Cash flow hedges – We use cash flow hedging primarily to reduce or eliminate the effects of foreign exchange rate changes on purchase and sale contracts in our industrial businesses and to convert foreign currency debt that we have issued in our financial services business back to our functional currency. Accordingly, the vast majority of our derivative activity in this category consists of currency exchange contracts. As a result of acquisitions in our industrial businesses, we expect to significantly expand our foreign currency hedging activity related to long-term contracts. We also use commodity derivatives to reduce or eliminate price risk on raw materials purchased for use in manufacturing.
Under hedge accounting, the derivative carrying amount is measured at fair value each period and any resulting gain or loss is recorded in a separate component of shareowners' equity. Differences between the derivative and the hedged item may cause changes in their fair values to not offset completely, which is referred to as ineffectiveness. When the hedged transaction occurs, these amounts are released from shareowners' equity, in order that the transaction will be reflected in earnings at the rate locked in by the derivative. The effect of the hedge is reported in the same financial statement line item as the earnings effects of the hedged transaction. The table below summarizes how the derivative is reflected in the balance sheet and in earnings under hedge accounting. The effect of the hedged forecasted transaction is not presented in this table but offsets the earnings effect of the derivative.
As part of our ongoing effort to reduce borrowings, we may repurchase debt that was in a cash flow hedge accounting relationship. At the time of determining that the debt cash flows are probable of not occurring any related OCI will be released to earnings.
FINANCIAL STATEMENT EFFECTS - CASH FLOW HEDGES | |||||||||||
Three months ended September 30 | Nine months ended September 30 | ||||||||||
(In millions) | 2016 | 2015 | 2016 | 2015 | |||||||
Balance sheet changes | |||||||||||
Fair value of derivatives increase (decrease) | $ | 2 | $ | (123) | $ | (43) | $ | (760) | |||
Shareowners' equity (increase) decrease | (2) | 124 | 43 | 761 | |||||||
Earnings (loss) related to ineffectiveness | - | 1 | - | 1 | |||||||
Earnings (loss) effect of derivatives(a) | (57) | (109) | (128) | (691) | |||||||
(a) Offsets earnings effect of the hedged forecasted transaction | |||||||||||
The following table explains the effect of changes in market rates on the fair value of derivatives we use most commonly in cash flow hedging arrangements.
Interest rate forwards/swaps | Interest rate increases | Interest rate decreases | ||
Pay fixed rate/receive floating rate | Fair value increases | Fair value decreases | ||
Currency forwards/swaps | U.S. dollar strengthens | U.S. dollar weakens | ||
Pay U.S. dollars/receive foreign currency | Fair value decreases | Fair value increases | ||
Commodity derivatives | Price increases | Price decreases | ||
Receive commodity/ pay fixed price | Fair value increases | Fair value decreases | ||
Fair value hedges – These derivatives are used to hedge the effects of interest rate and currency exchange rate changes on debt that we have issued. We have issued mostly fixed rate debt that is used to fund both fixed and floating rate assets. In instances where fixed rate debt is funding floating rate assets, we have an exposure to changes in interest rates. We enter into interest rate swaps that receive a fixed rate and pay a floating rate of interest to align with that portion of our debt which funds floating rate assets. These swaps typically match the maturity of the associated debt being hedged.
2016 3Q FORM 10-Q 108
Under hedge accounting, the derivative is measured at fair value and the carrying amount of the hedged debt is adjusted for the change in value related to the exposure being hedged, with both adjustments offset to earnings as interest expense. For example, the earnings effect of an increase in the fair value of the derivative will be largely offset by the earnings effect of an increase in the carrying amount of the hedged debt. Differences between the terms of the derivative and the hedged debt may cause changes in their fair values to not offset completely, which is referred to as ineffectiveness. The table below summarizes how the derivative and the hedged debt are reflected in the balance sheet and in earnings under hedge accounting. The effect on interest expense of changing from the fixed rate on the debt to the floating rate on the swap is not shown in this table.
FINANCIAL STATEMENT EFFECTS - FAIR VALUE HEDGES | |||||||||||
Three months ended September 30 | Nine months ended September 30 | ||||||||||
(In millions) | 2016 | 2015 | 2016 | 2015 | |||||||
Balance sheet changes | |||||||||||
Fair value of derivative increase (decrease) | $ | (116) | $ | 1,383 | $ | 2,494 | $ | 510 | |||
Adjustment to carrying amount of hedged debt (increase) decrease | 37 | (1,379) | (2,651) | (590) | |||||||
Earnings (loss) related to hedge ineffectiveness | (79) | 4 | (156) | (80) | |||||||
The effect of changes in market interest rates on the fair value of derivatives we use most commonly in fair value hedging arrangements is presented below.
Interest rate forwards/swaps | Interest rate increases | Interest rate decreases | ||
Pay floating rate/receive fixed rate | Fair value decreases | Fair value increases | ||
Net investment hedges – We invest in foreign operations that conduct their financial services activities in currencies other than the US dollar. We hedge the currency risk associated with those investments primarily using short-term currency exchange contracts under which we receive US dollars and pay foreign currency and non-derivatives instruments such as debt denominated in a foreign currency.
Under hedge accounting, the portion of the fair value change of the derivative or debt instrument that relates to changes in spot currency exchange rates is offset in a separate component of shareowners' equity. For example, an increase in the fair value of the derivative related to changes in spot exchange rates will be offset by a corresponding increase in the currency translation component of shareowners' equity. The portion of the fair value change of the derivative related to differences between spot and forward rates, which primarily relates to the interest component, is recorded in earnings each period as interest expense. As a result of this hedging strategy, the investments in foreign operations of our financial services business are largely unaffected by changes in currency exchange rates. The amounts recorded in shareowners' equity only affect earnings if the hedged investment is sold, substantially liquidated, or control is lost.
FINANCIAL STATEMENT EFFECTS - NET INVESTMENT HEDGES | |||||||||||
Three months ended September 30 | Nine months ended September 30 | ||||||||||
(In millions) | 2016 | 2015 | 2016 | 2015 | |||||||
Balance sheet changes | |||||||||||
Fair value of derivatives increase (decrease) | $ | 107 | $ | 1,260 | $ | 154 | $ | 4,627 | |||
Fair value of non-derivatives (increase) decrease | 450 | - | 330 | - | |||||||
Shareowners' equity (increase) decrease | (552) | (1,297) | (513) | (4,720) | |||||||
Earnings (loss) related to | |||||||||||
spot-forward differences and ineffectiveness | 5 | (37) | (28) | (93) | |||||||
Earnings (loss) related to | |||||||||||
reclassification upon sale or liquidation(a) | 47 | 1,935 | (1,025) | 2,524 | |||||||
| (a) | Included $47 million and $1,935 million recorded in discontinued operations in the three months ended September 30, 2016 and 2015, and $(1,026) million and $2,527 million recorded in discontinued operations in the nine months ended September 30, 2016 and 2015, respectively. |
The effect of changes in currency exchange rates on the fair value of derivatives we use in net investment hedging arrangements is presented below .
Currency forwards/swaps | U.S. dollar strengthens | U.S. dollar weakens | ||
Receive U.S. dollars/pay foreign currency | Fair value increases | Fair value decreases |
2016 3Q FORM 10-Q 109
Economic Hedges - These derivatives are not designated as hedges from an accounting standpoint (and therefore we do not apply hedge accounting to the relationship) but otherwise serve the same economic purpose as other hedging arrangements. Economic hedges are used when changes in the carrying amount of the hedged item are already recorded in earnings in the same period as the derivative, making hedge accounting unnecessary. For example, in our industrial businesses we record the effects of spot exchange rate changes on our foreign currency payables and receivables in earnings each period along with the fair value changes on the foreign currency forward contracts used as economic hedges. In these cases, the earnings effects of the derivative and hedged item largely offset. We also use economic hedges when we have exposures to currency exchange risk for which we are unable to meet the requirements for hedge accounting. For example, we use currency forwards as an economic hedge of forecasted foreign currency cash flows under long-term contracts. In this case, the forecast period is so long that it is difficult to meet the hedge accounting requirement that the occurrence of the hedged transactions is probable. For these types of economic hedges, changes in the fair value of the derivative are recorded in earnings currently but changes in the value of the forecasted foreign currency cash flows are only recognized in earnings when they occur. As a result, even though the derivative is an effective economic hedge, there is a net effect on earnings in each period due to differences in the timing of earnings recognition between the derivative and the hedged item.
The table below provides information about the earnings effects of all derivatives that serve as economic hedges. These derivatives are marked to fair value through earnings each period. For our financial services business, these gains and losses are reported in "GE Capital revenues from services". For our industrial businesses, the effects are reported in "Other income" or "Other costs and expenses". The offsetting earnings effects associated with hedged assets and liabilities are also displayed in the table below. In general, the earnings effects of the hedged item are recorded in the same financial statement line as the derivative. The earnings effect of economic hedges, after considering offsets related to earnings effects of hedged assets and liabilities, is substantially offset by changes in the fair value of forecasted transactions that have not yet affected earnings.
FINANCIAL STATEMENT EFFECTS - ECONOMIC HEDGES | |||||||||||
Three months ended September 30 | Nine months ended September 30 | ||||||||||
(In millions) | 2016 | 2015 | 2016 | 2015 | |||||||
Balance sheet changes | |||||||||||
Change in fair value of economic hedge increase (decrease) | $ | (692) | $ | (486) | $ | (835) | $ | (2,729) | |||
Change in carrying amount of item being hedged increase (decrease) | 386 | 483 | 209 | 2,631 | |||||||
Earnings (loss) effect of economic hedges(a) | (306) | (3) | (626) | (98) | |||||||
(a) Offset by the future earnings effects of economically hedged item.
The table below explains the effects of market rate changes on the fair value of derivatives we use most commonly as economic hedges.
Interest rate forwards/swaps interest rate | Interest rate increases | Interest rate decreases | ||
Pay floating rate/receive fixed rate | Fair value decreases | Fair value increases | ||
Currency forwards/swaps | U.S. dollar strengthens | U.S. dollar weakens | ||
Pay U.S. dollars/receive foreign currency | Fair value decreases | Fair value increases | ||
Receive U.S. dollars/pay foreign currency | Fair value increases | Fair value decreases | ||
Commodity derivatives | Price increases | Price decreases | ||
Receive commodity/ pay fixed price | Fair value increases | Fair value decreases | ||
NOTIONAL AMOUNT OF DERIVATIVES
The notional amount of a derivative is the number of units of the underlying (for example, the notional principal amount of the debt in an interest rate swap). The notional amount is used to compute interest or other payment streams to be made under the contract and is a measure of our level of activity. We generally disclose derivative notional amounts on a gross basis. A substantial majority of the outstanding notional amount of $192 billion at September 30, 2016 is related to managing interest rate and currency risk between financial assets and liabilities in our financial services business. The remaining derivative notional primarily relates to hedges of anticipated sales and purchases in foreign currency, commodity purchases and contractual terms in contracts that are considered embedded derivatives.
2016 3Q FORM 10-Q 110
The table below provides additional information about how derivatives are reflected in our financial statements. Derivative assets and liabilities are recorded at fair value exclusive of interest earned or owed on interest rate derivatives, which is presented separately on our balance sheet. Cash collateral and securities held as collateral represent assets that have been provided by our derivative counterparties as security for amounts they owe us (derivatives that are in an asset position).
CARRYING AMOUNTS RELATED TO DERIVATIVES | |||||
(In millions) | September 30, 2016 | December 31, 2015 | |||
Derivative assets | $ | 6,976 | $ | 7,391 | |
Derivative liabilities | (3,988) | (5,681) | |||
Accrued interest | 740 | 1,014 | |||
Cash collateral & credit valuation adjustment | (3,232) | (1,141) | |||
Net Derivatives | 496 | 1,583 | |||
Securities held as collateral | (741) | (1,277) | |||
Net amount | $ | (245) | $ | 306 | |
EFFECTS OF DERIVATIVES ON EARNINGS
All derivatives are marked to fair value on our balance sheet, whether they are designated in a hedging relationship for accounting purposes or are used as economic hedges. As discussed in the previous sections, each type of hedge affects the financial statements differently. In fair value and economic hedges, both the hedged item and the hedging derivative largely offset in earnings each period. In cash flow and net investment hedges, the effective portion of the hedging derivative is offset in separate components of shareowners' equity and ineffectiveness is recognized in earnings. The table below summarizes these offsets and the net effect on pre-tax earnings.
Three months ended September 30 | Nine months ended September 30 | ||||||||||||||||
Effect on | Effect on | Effect on | Effect on | Effect on | Effect on | ||||||||||||
(In millions) | hedging instrument | underlying | earnings | hedging instrument | underlying | earnings | |||||||||||
2016 | |||||||||||||||||
Cash flow hedges | $ | 2 | $ | (2) | $ | - | $ | (43) | $ | 43 | $ | - | |||||
Fair value hedges | (116) | 37 | (79) | 2,494 | (2,651) | (156) | |||||||||||
Net investment hedges(a) | 557 | (552) | 5 | 484 | (513) | (28) | |||||||||||
Economic hedges(b) | (692) | 386 | (306) | (835) | 209 | (626) | |||||||||||
Total | $ | (380) | $ | (810) | |||||||||||||
2015 | |||||||||||||||||
Cash flow hedges | $ | (123) | $ | 124 | $ | 1 | $ | (760) | $ | 761 | $ | 1 | |||||
Fair value hedges | 1,383 | (1,379) | 4 | 510 | (590) | (80) | |||||||||||
Net investment hedges(a) | 1,260 | (1,297) | (37) | 4,627 | (4,720) | (93) | |||||||||||
Economic hedges(b) | (486) | 483 | (3) | (2,729) | 2,631 | (98) | |||||||||||
Total | $ | (35) | $ | (270) | |||||||||||||
The amounts in the table above generally do not include associated derivative accruals in income or expense.
(a) Both derivatives and non-derivatives hedging instruments are included.
(b) Net effect is substantially offset by the change in fair value of the hedged item that will affect earnings in future periods.
Note 12 provides additional information about changes in shareowners' equity related to hedging and amounts released to earnings. Other supplemental information about derivatives and hedging can be found in Note 19.
2016 3Q FORM 10-Q 111
NOTE 16. VARIABLE INTEREST ENTITIES
We use variable interest entities in the ordinary course of business to operate joint ventures to provide goods and services to our customers and to arrange asset backed financing, including securitizations. Investors in these entities only have recourse to the assets owned by the entity and not to our general credit. We do not have implicit support arrangements with any VIE. We did not provide non-contractual support for previously transferred financing receivables to any VIE in 2016 or 2015.
CONSOLIDATED VARIABLE INTEREST ENTITIES
Our most significant consolidated VIEs are the three joint ventures we formed with Alstom to facilitate the Alstom acquisition. These joint ventures include grid technology, renewable energy, and global nuclear and French steam power. The combined assets, liabilities and redeemable non-controlling interest in the joint ventures as of September 30, 2016 was $15,335 million, $6,898 million and $2,942 million, respectively. Further information about the formation of the Alstom joint ventures is provided in Note 7. These joint ventures are VIEs due to the nature of the exit mechanisms held by Alstom and are consolidated by GE because we control all significant activities of the joint ventures. As these joint ventures are businesses, would otherwise be consolidated under the voting model and their assets can be used for purposes other than settlement of the joint ventures' obligations, there is no continuing VIE disclosure requirement for these consolidated joint ventures.
The Consolidated VIEs for which we have continuing disclosure requirements fall into two main groups. We consolidate VIEs because we have the power to direct the activities that significantly affect the VIE's economic performance, typically because of our role as either servicer or manager for the VIE, which are further described below:
| GE Capital Consolidated Securitization Entities (CSEs) were created to facilitate securitization of financial assets and other forms of asset-backed financing that serve as an alternative funding source by providing access to variable funding notes and term markets. The securitization transactions executed with these entities are similar to those used by many financial institutions and all are non-recourse. We provide servicing for all of the assets in these entities. |
The financing receivables in these entities have similar risks and characteristics to our other financing receivables and were underwritten to the same standard. Accordingly, the performance of these assets has been similar to our other financing receivables; however, the blended performance of the pools of receivables in these entities reflects the eligibility criteria that we apply to determine which receivables are selected for transfer. Contractually the cash flows from these financing receivables must first be used to pay third-party debt holders as well as other expenses of the entity. Excess cash flows are available to GE and GE Capital. The creditors of these entities have no claim on other assets of GE or GE Capital.
| Other remaining assets and liabilities of consolidated VIEs within GE and GE Capital relate primarily to three categories of entities: (1) joint ventures that lease equipment with $812 million of assets and $716 million of liabilities; (2) other entities that are involved in power generating and leasing activities with $337 million of assets and $131 million of liabilities; and (3) insurance entities that, among other lines of business, provide property and casualty and workers' compensation coverage for GE with $1,605 million of assets and $1,053 million of liabilities. |
2016 3Q FORM 10-Q 112
ASSETS AND LIABILITIES OF CONSOLIDATED VIEs | ||||||||||||||
GE Capital | ||||||||||||||
Trade receivables | Other | |||||||||||||
(In millions) | GE | securitization(a) | securitization(a) | Other | Total | |||||||||
September 30, 2016 | ||||||||||||||
Assets | ||||||||||||||
Financing receivables, net | $ | - | $ | - | $ | - | $ | 716 | $ | 716 | ||||
Current receivables | 69 | 2,650 | (b) | 772 | - | 3,491 | ||||||||
Investment securities | - | - | - | 1,450 | 1,450 | |||||||||
Other assets | 256 | - | 754 | 1,060 | 2,070 | |||||||||
Total | $ | 325 | $ | 2,650 | $ | 1,526 | $ | 3,226 | $ | 7,727 | ||||
Liabilities | ||||||||||||||
Borrowings | $ | 8 | $ | - | $ | 1,271 | $ | 802 | $ | 2,081 | ||||
Non-recourse borrowings | - | 1,970 | 205 | - | 2,175 | |||||||||
Other liabilities | 243 | 32 | 35 | 1,273 | 1,583 | |||||||||
Total | $ | 251 | $ | 2,002 | $ | 1,511 | $ | 2,075 | $ | 5,839 | ||||
December 31, 2015 | ||||||||||||||
Assets | ||||||||||||||
Financing receivables, net | $ | - | $ | - | $ | - | $ | 882 | $ | 882 | ||||
Current receivables | 385 | 3,506 | (b) | - | - | 3,891 | ||||||||
Investment securities | - | - | - | 1,404 | 1,404 | |||||||||
Other assets | 2,482 | 24 | - | 1,068 | 3,574 | |||||||||
Total | $ | 2,867 | $ | 3,530 | $ | - | $ | 3,354 | $ | 9,751 | ||||
Liabilities | ||||||||||||||
Borrowings | $ | 221 | $ | - | $ | - | $ | 960 | $ | 1,181 | ||||
Non-recourse borrowings | - | 3,022 | - | 61 | 3,083 | |||||||||
Other liabilities | 2,289 | 34 | - | 1,234 | 3,557 | |||||||||
Total | $ | 2,510 | $ | 3,056 | $ | - | $ | 2,255 | $ | 7,821 | ||||
(a) | We provide servicing to the CSEs and are contractually permitted to commingle cash collected from customers on financing receivables sold to CSE investors with our own cash prior to payment to a CSE, provided our short-term credit rating does not fall below A-1/P-1. These CSEs also owe us amounts for purchased financial assets and scheduled interest and principal payments. At September 30, 2016 and December 31, 2015, the amounts of commingled cash owed to the CSEs were $969 million and $1,093 million, respectively, and the amounts owed to us by CSEs were an insignificant amount and $7 million, respectively. |
(b) | In June 2016, we completed the sale of our Appliances business to Haier and sold all of the Appliances receivables purchased by the securitization trust to Haier for $773 million. Further information about the sale is provided in Note 2. At December 31, 2015, included $737 million of receivables purchased from Appliances. |
Total revenues from our consolidated VIEs were $211 million and $714 million in the three months ended September 30, 2016 and 2015, respectively, and $881 million and $1,428 million in the nine months ended September 30, 2016 and 2015, respectively. Related expenses consisted primarily of cost of goods and services of $112 million and $242 million in the three months ended September 30, 2016 and 2015, respectively, and $610 million and $966 million in the nine months ended September 30, 2016 and 2015, respectively.
INVESTMENTS IN UNCONSOLIDATED VARIABLE INTEREST ENTITIES
Our involvement with unconsolidated VIEs primarily consists of assisting in the formation and financing of the entity. We are not required to consolidate these entities because the nature of our involvement with the activities of the VIEs does not give us power over decisions that significantly affect their economic performance.
Our largest exposure to unconsolidated VIEs consists of investments in long-lived, capital intensive energy projects and companies ($5,899 million). The classification of our variable interests in these entities in our financial statements is based on the nature of the entity and the characteristics of the investment we hold.
2016 3Q FORM 10-Q 113
INVESTMENTS IN UNCONSOLIDATED VIEs | |||||
(In millions) | September 30, 2016 | December 31, 2015 | |||
Other assets and investment securities | $ | 5,495 | $ | 745 | |
Financing receivables – net | 13 | 13 | |||
Total investments | 5,508 | 758 | |||
Contractual obligations to fund investments, guarantees or revolving lines of credit | 704 | 29 | |||
Total exposure(a) | $ | 6,212 | $ | 787 | |
| (a) | The increase in the unconsolidated VIE disclosure above is a result of adoption of ASU 2015-02 on January 1, 2016. These investments, prior to the adoption of ASU 2015-02, were not considered VIEs. Further information is provided in Note 1. |
In addition to the entities included in the table above, we also hold passive investments in investment securities issued by VIEs. Such investments were, by design, investment-grade at issuance and held by a diverse group of investors. Further information about such investments is provided in Note 3.
NOTE 17. INTERCOMPANY TRANSACTIONS
Transactions between related companies are made on an arms-length basis, are eliminated and consist primarily of GE Capital dividends to GE; GE customer receivables sold to GE Capital; GE Capital services for trade receivables management and material procurement; buildings and equipment leased between GE and GE Capital, including sales-leaseback activity; information technology (IT) and other services sold to GE Capital by GE; aircraft engines manufactured by GE that are installed on aircraft purchased by GE Capital from third-party producers for lease to others; expenses related to parent-subsidiary pension plans, and various investments, loans and allocations of GE corporate overhead costs.
These intercompany transactions are reported in the GE and GE Capital columns of our financial statements, but are eliminated in deriving our consolidated financial statements. Effects of these eliminations on our consolidated cash flows from operating, investing and financing activities are $(16,399) million, $6,011 million and $10,390 million in the nine months ended September 30 , 2016, and $(413) million, $(56) million and $469 million in the nine months ended September 30 , 2015, respectively. Details of these eliminations are shown below.
Nine months ended September 30 | |||||
(In millions) | 2016 | 2015 | |||
Cash from (used for) operating activities-continuing operations | |||||
Combined | $ | 20,245 | $ | 5,857 | |
GE customer receivables sold to GE Capital | 37 | 162 | |||
GE Capital dividends to GE | (16,050) | (450) | |||
Other reclassifications and eliminations | (386) | (125) | |||
Total cash from (used for) operating activities-continuing operations | $ | 3,846 | $ | 5,444 | |
Cash from (used for) investing activities-continuing operations | |||||
Combined | $ | 47,548 | $ | 59,522 | |
GE customer receivables sold to GE Capital | 767 | (243) | |||
GE Capital short-term loan to GE | 5,002 | - | |||
Other reclassifications and eliminations | 242 | 187 | |||
Total cash from (used for) investing activities-continuing operations | $ | 53,559 | $ | 59,466 | |
Cash from (used for) financing activities-continuing operations | |||||
Combined | $ | (85,578) | $ | (48,026) | |
GE customer receivables sold to GE Capital | (804) | 81 | |||
GE Capital dividends to GE | 16,050 | 450 | |||
GE Capital short-term loan to GE | (5,002) | - | |||
Other reclassifications and eliminations | 146 | (62) | |||
Total cash from (used for) financing activities-continuing operations | $ | (75,188) | $ | (47,556) | |
2016 3Q FORM 10-Q 114
NOTE 18. GUARANTOR FINANCIAL INFORMATION
GUARANTOR AND NON-GUARANTOR CONDENSED CONSOLIDATING FINANCIAL INFORMATION
On October 26, 2015, GE Capital International Funding Company Unlimited Company, formerly GE Capital International Funding Company (the Issuer), then a finance subsidiary of General Electric Capital Corporation, settled its previously announced private offers to exchange (the Exchange Offers) the Issuer's new senior unsecured notes for certain outstanding debt securities of General Electric Capital Corporation.
The new notes that were issued were composed of $15.3 billion of 0.964% Six Month Notes due April 2016 (which have subsequently been repaid upon maturity), £0.8 billion of 1.363% Six Month Notes due April 2016 (which have subsequently been repaid upon maturity), $6.1 billion of 2.342% Notes due 2020, $2.0 billion of 3.373% Notes due 2025 and $11.5 billion of 4.418% Notes due 2035. These notes were fully and unconditionally, jointly and severally guaranteed by both the Company and GE Capital International Holdings Limited (GECIHL) (each a Guarantor, and together, the Guarantors).
Under the terms of a registration rights agreement entered into in connection with the Exchange Offers, the Issuer and the Company agreed to file a registration statement with the U.S. Securities and Exchange Commission (SEC) for an offer to exchange new senior notes of the Issuer registered with the SEC and guaranteed by the Guarantors for certain of the Issuer's outstanding unregistered senior notes. This exchange was completed in July 2016.
PRESENTATION
In connection with the registration of the senior notes, the Company is required to provide certain financial information regarding the Issuer and the Guarantors of the registered securities. Included are the Condensed Consolidating Statements of Earnings and Comprehensive Income for the three months ended September 30, 2016 and 2015 and nine months ended September 30, 2016 and 2015, Condensed Consolidating Statements of Financial Position as of September 30, 2016 and December 31, 2015 and Condensed Consolidating Statements of Cash Flows for the nine months ended September 30, 2016 and 2015 for:
| General Electric Company (the Parent Company Guarantor) - prepared with investments in subsidiaries accounted for under the equity method of accounting and excluding any inter-segment eliminations. The equity basis earnings (losses) of subsidiaries are reflected in the captions "Equity in earnings (losses) of affiliates" and "Earnings (loss) from discontinued operations, net of tax"; |
| GE Capital International Funding Company Unlimited Company (the Subsidiary Issuer) – incorporated in May 2015 as a finance subsidiary for debt and reflects activity subsequent to the issuance of new notes on October 26, 2015; |
| GE Capital International Holdings Limited (GECIHL) (the Subsidiary Guarantor) - prepared with investments in non-guarantor subsidiaries accounted for under the equity method of accounting and reflects activity subsequent to the GE Capital Reorganization on December 3, 2015. The equity basis earnings (losses) of subsidiaries are reflected in the captions "Equity in earnings (losses) of affiliates" and "Earnings (loss) from discontinued operations, net of tax"; |
| Non-Guarantor Subsidiaries - prepared on an aggregated basis excluding any elimination or consolidation adjustments and includes predominantly all non-cash adjustments for cash flows; |
| Consolidating Adjustments - adjusting entries necessary to consolidate the Parent Company Guarantor with the Subsidiary Issuer, the Subsidiary Guarantor and Non-Guarantor Subsidiaries; and |
| Consolidated - prepared on a consolidated basis. |
2016 3Q FORM 10-Q 115
CONDENSED CONSOLIDATING STATEMENT OF EARNINGS (LOSS) AND COMPREHENSIVE INCOME (LOSS) | ||||||||||||
FOR THE THREE MONTHS ENDED SEPTEMBER 30, 2016 (UNAUDITED) | ||||||||||||
Parent | Non- | |||||||||||
Company | Subsidiary | Subsidiary | Guarantor | Consolidating | ||||||||
(in millions) | Guarantor | Issuer | Guarantor | Subsidiaries | Adjustments | Consolidated | ||||||
Revenues and other income | ||||||||||||
Sales of goods and services | $ | 8,194 | $ | - | $ | - | $ | 36,082 | $ | (17,462) | $ | 26,814 |
Other income | 883 | - | - | 35,578 | (36,234) | 227 | ||||||
Equity in earnings (loss) of affiliates | 1,788 | - | 428 | 29,804 | (32,019) | - | ||||||
GE Capital revenues from services | - | 166 | 243 | 2,838 | (1,023) | 2,224 | ||||||
Total revenues and other income | 10,865 | 166 | 671 | 104,302 | (86,738) | 29,266 | ||||||
Costs and expenses | ||||||||||||
Interest and other financial charges | 1,166 | 138 | 525 | 856 | (1,724) | 961 | ||||||
Investment contracts, insurance losses and | ||||||||||||
insurance annuity benefits | - | - | - | 701 | (17) | 684 | ||||||
Other costs and expenses | 8,498 | - | 16 | 35,400 | (18,367) | 25,547 | ||||||
Total costs and expenses | 9,664 | 138 | 541 | 36,957 | (20,109) | 27,191 | ||||||
Earnings (loss) from continuing | ||||||||||||
operations before income taxes | 1,201 | 28 | 130 | 67,345 | (66,630) | 2,074 | ||||||
Benefit (provision) for income taxes | 932 | (3) | (11) | (951) | 16 | (18) | ||||||
Earnings (loss) from continuing operations | 2,132 | 24 | 119 | 66,395 | (66,614) | 2,056 | ||||||
Earnings (loss) from discontinued | ||||||||||||
operations, net of taxes | (105) | - | (552) | 224 | 328 | (105) | ||||||
Net earnings (loss) | 2,027 | 24 | (433) | 66,619 | (66,286) | 1,951 | ||||||
Less net earnings (loss) attributable to | ||||||||||||
noncontrolling interests | - | - | - | (51) | (25) | (76) | ||||||
Net earnings (loss) attributable to | ||||||||||||
the Company | 2,027 | 24 | (433) | 66,670 | (66,262) | 2,027 | ||||||
Other comprehensive income (loss) | 477 | - | 51 | (711) | 661 | 477 | ||||||
Comprehensive income (loss) attributable | ||||||||||||
to the Company | $ | 2,504 | $ | 24 | $ | (382) | $ | 65,959 | $ | (65,601) | $ | 2,504 |
CONDENSED CONSOLIDATING STATEMENT OF EARNINGS (LOSS) AND COMPREHENSIVE INCOME (LOSS) | ||||||||||||
FOR THE THREE MONTHS ENDED SEPTEMBER 30, 2015 (UNAUDITED) | ||||||||||||
Parent | Non- | |||||||||||
Company | Subsidiary | Subsidiary | Guarantor | Consolidating | ||||||||
(in millions) | Guarantor | Issuer | Guarantor | Subsidiaries | Adjustments | Consolidated | ||||||
Revenues and other income | ||||||||||||
Sales of goods and services | $ | 11,175 | $ | - | $ | - | $ | 33,206 | $ | (18,854) | $ | 25,527 |
Other income | 353 | - | - | 2,367 | (2,550) | 169 | ||||||
Equity in earnings (loss) of affiliates | 2,152 | - | - | 126,207 | (128,359) | - | ||||||
GE Capital revenues from services | - | - | - | 7,376 | (5,044) | 2,332 | ||||||
Total revenues and other income | 13,680 | - | - | 169,155 | (154,806) | 28,028 | ||||||
Costs and expenses | ||||||||||||
Interest and other financial charges | 805 | - | - | 2,251 | (2,159) | 897 | ||||||
Investment contracts, insurance losses and | ||||||||||||
insurance annuity benefits | - | - | - | 717 | (44) | 673 | ||||||
Other costs and expenses | 11,155 | - | - | 37,487 | (24,233) | 24,408 | ||||||
Total costs and expenses | 11,960 | - | - | 40,455 | (26,436) | 25,978 | ||||||
Earnings (loss) from continuing | ||||||||||||
operations before income taxes | 1,720 | - | - | 128,700 | (128,370) | 2,050 | ||||||
Benefit (provision) for income taxes | 156 | - | - | 661 | (952) | (135) | ||||||
Earnings (loss) from continuing operations | 1,876 | - | - | 129,362 | (129,322) | 1,915 | ||||||
Earnings (loss) from discontinued | ||||||||||||
operations, net of taxes | 629 | - | - | 1,466 | (1,466) | 629 | ||||||
Net earnings (loss) | 2,506 | - | - | 130,828 | (130,789) | 2,545 | ||||||
Less net earnings (loss) attributable to | ||||||||||||
noncontrolling interests | - | - | - | 88 | (49) | 39 | ||||||
Net earnings (loss) attributable to | ||||||||||||
the Company | 2,506 | - | - | 130,740 | (130,740) | 2,506 | ||||||
Other comprehensive income (loss) | 1,221 | - | - | 175 | (175) | 1,221 | ||||||
Comprehensive income (loss) attributable | ||||||||||||
to the Company | $ | 3,727 | $ | - | $ | - | $ | 130,915 | $ | (130,915) | $ | 3,727 |
2016 3Q FORM 10-Q 116
CONDENSED CONSOLIDATING STATEMENT OF EARNINGS (LOSS) AND COMPREHENSIVE INCOME (LOSS) | ||||||||||||
FOR THE NINE MONTHS ENDED SEPTEMBER 30, 2016 (UNAUDITED) | ||||||||||||
Parent | Non- | |||||||||||
Company | Subsidiary | Subsidiary | Guarantor | Consolidating | ||||||||
(in millions) | Guarantor | Issuer | Guarantor | Subsidiaries | Adjustments | Consolidated | ||||||
Revenues and other income | ||||||||||||
Sales of goods and services | $ | 28,870 | $ | - | $ | - | $ | 108,043 | $ | (56,757) | $ | 80,156 |
Other income | 845 | - | - | 55,062 | (52,522) | 3,385 | ||||||
Equity in earnings (loss) of affiliates | 7,923 | - | 1,093 | 58,732 | (67,747) | - | ||||||
GE Capital revenues from services | - | 762 | 1,262 | 9,182 | (4,144) | 7,063 | ||||||
Total revenues and other income | 37,638 | 762 | 2,355 | 231,019 | (181,170) | 90,604 | ||||||
Costs and expenses | ||||||||||||
Interest and other financial charges | 2,828 | 685 | 2,133 | 4,027 | (5,651) | 4,023 | ||||||
Investment contracts, insurance losses and | ||||||||||||
insurance annuity benefits | - | - | - | 2,188 | (87) | 2,101 | ||||||
Other costs and expenses | 30,555 | - | 71 | 108,537 | (60,819) | 78,344 | ||||||
Total costs and expenses | 33,383 | 686 | 2,204 | 114,752 | (66,558) | 84,467 | ||||||
Earnings (loss) from continuing | ||||||||||||
operations before income taxes | 4,255 | 76 | 150 | 116,267 | (114,612) | 6,137 | ||||||
Benefit (provision) for income taxes | 1,862 | (10) | (58) | (1,908) | (189) | (302) | ||||||
Earnings (loss) from continuing operations | 6,118 | 67 | 93 | 114,359 | (114,801) | 5,835 | ||||||
Earnings (loss) from discontinued | ||||||||||||
operations, net of taxes | (954) | - | (1,547) | 398 | 1,149 | (954) | ||||||
Net earnings (loss) | 5,164 | 67 | (1,455) | 114,757 | (113,652) | 4,881 | ||||||
Less net earnings (loss) attributable to | ||||||||||||
noncontrolling interests | - | - | - | (143) | (140) | (283) | ||||||
Net earnings (loss) attributable to | ||||||||||||
the Company | 5,164 | 67 | (1,455) | 114,900 | (113,512) | 5,164 | ||||||
Other comprehensive income (loss) | 2,107 | (12) | 114 | 136 | (238) | 2,107 | ||||||
Comprehensive income (loss) attributable | ||||||||||||
to the Company | $ | 7,271 | $ | 55 | $ | (1,341) | $ | 115,036 | $ | (113,750) | $ | 7,271 |
CONDENSED CONSOLIDATING STATEMENT OF EARNINGS (LOSS) AND COMPREHENSIVE INCOME (LOSS) | ||||||||||||
FOR THE NINE MONTHS ENDED SEPTEMBER 30, 2015 (UNAUDITED) | ||||||||||||
Parent | Non- | |||||||||||
Company | Subsidiary | Subsidiary | Guarantor | Consolidating | ||||||||
(in millions) | Guarantor | Issuer | Guarantor | Subsidiaries | Adjustments | Consolidated | ||||||
Revenues and other income | ||||||||||||
Sales of goods and services | $ | 32,310 | $ | - | $ | - | $ | 97,982 | $ | (55,026) | $ | 75,266 |
Other income | 765 | - | - | 6,766 | (6,439) | 1,092 | ||||||
Equity in earnings (loss) of affiliates | 1,068 | - | - | 141,183 | (142,251) | - | ||||||
GE Capital revenues from services | - | - | - | 25,000 | (17,863) | 7,136 | ||||||
Total revenues and other income | 34,143 | - | - | 270,930 | (221,579) | 83,494 | ||||||
Costs and expenses | ||||||||||||
Interest and other financial charges | 2,374 | - | - | 6,898 | (7,045) | 2,228 | ||||||
Investment contracts, insurance losses and | ||||||||||||
insurance annuity benefits | - | - | - | 2,070 | (128) | 1,942 | ||||||
Other costs and expenses | 34,174 | - | - | 116,287 | (77,420) | 73,041 | ||||||
Total costs and expenses | 36,549 | - | - | 125,255 | (84,592) | 77,211 | ||||||
Earnings (loss) from continuing | ||||||||||||
operations before income taxes | (2,406) | - | - | 145,675 | (136,987) | 6,283 | ||||||
Benefit (provision) for income taxes | 1,228 | - | - | (9,266) | 811 | (7,227) | ||||||
Earnings (loss) from continuing operations | (1,178) | - | - | 136,409 | (136,176) | (945) | ||||||
Earnings (loss) from discontinued | ||||||||||||
operations, net of taxes | (11,249) | - | - | (1,226) | 1,222 | (11,253) | ||||||
Net earnings (loss) | (12,427) | - | - | 135,182 | (134,953) | (12,198) | ||||||
Less net earnings (loss) attributable to | ||||||||||||
noncontrolling interests | - | - | - | 285 | (56) | 229 | ||||||
Net earnings (loss) attributable to | ||||||||||||
the Company | (12,427) | - | - | 134,897 | (134,897) | (12,427) | ||||||
Other comprehensive income (loss) | 1,189 | - | - | (3,610) | 3,610 | 1,189 | ||||||
Comprehensive income (loss) attributable | ||||||||||||
to the Company | $ | (11,238) | $ | - | $ | - | $ | 131,288 | $ | (131,288) | $ | (11,238) |
(a) | Included within the subsidiaries of the Subsidiary Guarantor are cash and cash equivalent balances of $25.9 billion and net assets of discontinued operations of $21.6 billion. |
2016 3Q FORM 10-Q 117
CONDENSED CONSOLIDATING STATEMENT OF FINANCIAL POSITION | ||||||||||||
DECEMBER 31, 2015 | ||||||||||||
Parent | Non- | |||||||||||
Company | Subsidiary | Subsidiary | Guarantor | Consolidating | ||||||||
(In millions) | Guarantor | Issuer | Guarantor | Subsidiaries | Adjustments | Consolidated | ||||||
Assets | ||||||||||||
Cash and equivalents | $ | 4,137 | $ | - | $ | - | $ | 86,955 | $ | (20,609) | $ | 70,483 |
Investment securities | 14 | - | - | 40,886 | (8,927) | 31,973 | ||||||
Receivables - net | 88,696 | 33,232 | 69,306 | 75,909 | (221,286) | 45,856 | ||||||
Inventories | 5,447 | - | - | 19,762 | (2,694) | 22,515 | ||||||
Property, plant and equipment - net | 6,540 | - | - | 56,808 | (9,253) | 54,095 | ||||||
Investment in subsidiaries(a) | 274,471 | - | 78,505 | 405,686 | (758,662) | - | ||||||
Goodwill and intangible assets | 7,793 | - | - | 61,412 | 14,118 | 83,323 | ||||||
All other assets | 15,732 | 11 | 915 | 247,611 | (200,392) | 63,876 | ||||||
Assets of discontinued operations | - | - | - | - | 120,951 | 120,951 | ||||||
Total assets | $ | 402,828 | $ | 33,242 | $ | 148,725 | $ | 995,029 | $ | (1,086,754) | $ | 493,071 |
Liabilities and equity | ||||||||||||
Short-term borrowings | $ | 145,051 | $ | 16,204 | $ | 71,862 | $ | 60,601 | $ | (243,858) | $ | 49,860 |
Accounts payable | 6,096 | - | - | 37,636 | (30,052) | 13,680 | ||||||
Other current liabilities | 14,482 | (1) | 17 | 34,903 | (7,860) | 41,540 | ||||||
Long-term and non-recourse borrowings | 97,471 | 16,423 | 46,392 | 105,801 | (118,345) | 147,742 | ||||||
All other liabilities | 41,455 | 489 | 224 | 57,996 | (9,514) | 90,651 | ||||||
Liabilities of discontinued operations | - | - | - | - | 46,487 | 46,487 | ||||||
Total Liabilities | 304,555 | 33,115 | 118,495 | 296,937 | (363,141) | 389,961 | ||||||
Redeemable noncontrolling interests | - | - | - | 2,888 | 84 | 2,972 | ||||||
GE shareowners' equity | 98,274 | 127 | 30,230 | 693,589 | (723,946) | 98,274 | ||||||
Noncontrolling interests | - | - | - | 1,616 | 248 | 1,864 | ||||||
Total equity | 98,274 | 127 | 30,230 | 695,204 | (723,697) | 100,138 | ||||||
Total liabilities, redeemable | ||||||||||||
noncontrolling interests and equity | $ | 402,828 | $ | 33,242 | $ | 148,725 | $ | 995,029 | $ | (1,086,754) | $ | 493,071 |
| (a) | Included within the subsidiaries of the Subsidiary Guarantor are cash and cash equivalent balances of $40.1 billion and net assets of discontinued operations of $58.6 billion. |
2016 3Q FORM 10-Q 118
CONDENSED CONSOLIDATING STATEMENT OF CASH FLOWS | ||||||||||||
NINE MONTHS ENDED SEPTEMBER 30, 2016 (UNAUDITED) | ||||||||||||
Parent | Non- | |||||||||||
Company | Subsidiary | Subsidiary | Guarantor | Consolidating | ||||||||
(In millions) | Guarantor | Issuer | Guarantor | Subsidiaries | adjustments | Consolidated | ||||||
Cash flows – operating activities | ||||||||||||
Cash from (used for) operating activities - | ||||||||||||
continuing operations | $ | (14,847) | $ | 175 | $ | (121) | $ | 83,404 | $ | (64,766) | $ | 3,846 |
Cash from (used for) operating activities - | ||||||||||||
discontinued operations | (954) | - | - | (4,366) | (399) | (5,719) | ||||||
Cash from (used for) operating activities | (15,801) | 175 | (121) | 79,038 | (65,165) | (1,873) | ||||||
Cash flows – investing activities | ||||||||||||
Cash from (used for) investing activities – | ||||||||||||
continuing operations | 20,902 | 16,080 | 36,317 | 32,000 | (51,740) | 53,559 | ||||||
Cash from (used for) investing activities – | ||||||||||||
discontinued operations | - | - | - | (12,056) | - | (12,056) | ||||||
Cash from (used for) investing activities | 20,902 | 16,080 | 36,317 | 19,944 | (51,740) | 41,503 | ||||||
Cash flows – financing activities | ||||||||||||
Cash from (used for) financing activities – | ||||||||||||
continuing operations | (6,894) | (16,255) | (36,194) | (150,446) | 134,601 | (75,188) | ||||||
Cash from (used for) financing activities – | ||||||||||||
discontinued operations | - | - | - | 295 | - | 295 | ||||||
Cash from (used for) financing activities | (6,894) | (16,255) | (36,194) | (150,151) | 134,601 | (74,893) | ||||||
Effect of currency exchange rate changes | ||||||||||||
on cash and equivalents | - | - | - | (169) | - | (169) | ||||||
Increase (decrease) in cash and equivalents | (1,792) | - | 3 | (51,339) | 17,696 | (35,432) | ||||||
Cash and equivalents at beginning of year | 4,137 | - | - | 107,350 | (20,609) | 90,878 | ||||||
Cash and equivalents at September 30 | 2,344 | - | 3 | 56,011 | (2,913) | 55,445 | ||||||
Less cash and equivalents of discontinued | ||||||||||||
operations at September 30 | - | - | - | 2,915 | - | 2,915 | ||||||
Cash and equivalents of continuing operations | ||||||||||||
at September 30 | $ | 2,344 | $ | - | $ | 3 | $ | 53,095 | $ | (2,913) | $ | 52,530 |
2016 3Q FORM 10-Q 119
CONDENSED CONSOLIDATING STATEMENT OF CASH FLOWS | ||||||||||||
NINE MONTHS ENDED SEPTEMBER 30, 2015 (UNAUDITED) | ||||||||||||
Parent | Non- | |||||||||||
Company | Subsidiary | Subsidiary | Guarantor | Consolidating | ||||||||
(In millions) | Guarantor | Issuer | Guarantor | Subsidiaries | adjustments | Consolidated | ||||||
Cash flows – operating activities | ||||||||||||
Cash from (used for) operating activities - | ||||||||||||
continuing operations | $ | (5,898) | $ | - | $ | - | $ | 176,052 | $ | (164,710) | $ | 5,444 |
Cash from (used for) operating activities - | ||||||||||||
discontinued operations | (11,249) | - | - | 17,729 | 1,222 | 7,702 | ||||||
Cash from (used for) operating activities | (17,147) | - | - | 193,781 | (163,488) | 13,146 | ||||||
Cash flows – investing activities | ||||||||||||
Cash from (used for) investing activities – | ||||||||||||
continuing operations | 24,884 | - | - | (93,930) | 128,512 | 59,466 | ||||||
Cash from (used for) investing activities – | ||||||||||||
discontinued operations | - | - | - | 305 | - | 305 | ||||||
Cash from (used for) investing activities | 24,884 | - | - | (93,625) | 128,512 | 59,771 | ||||||
Cash flows – financing activities | ||||||||||||
Cash from (used for) financing activities – | ||||||||||||
continuing operations | (9,693) | - | - | (46,188) | 8,324 | (47,556) | ||||||
Cash from (used for) financing activities – | ||||||||||||
discontinued operations | - | - | - | (2,250) | - | (2,250) | ||||||
Cash from (used for) financing activities | (9,693) | - | - | (48,438) | 8,324 | (49,807) | ||||||
Effect of currency exchange rate changes | ||||||||||||
on cash and equivalents | - | - | - | (3,516) | - | (3,516) | ||||||
Increase (decrease) in cash and equivalents | (1,956) | - | - | 48,201 | (26,651) | 19,594 | ||||||
Cash and equivalents at beginning of year | 4,820 | - | - | 88,216 | (2,020) | 91,016 | ||||||
Cash and equivalents at September 30 | 2,864 | - | - | 136,417 | (28,671) | 110,610 | ||||||
Less cash and equivalents of discontinued | ||||||||||||
operations at September 30 | - | - | - | 26,743 | - | 26,743 | ||||||
Cash and equivalents of continuing operations | ||||||||||||
at September 30 | $ | 2,864 | $ | - | $ | - | $ | 109,674 | $ | (28,671) | $ | 83,867 |
2016 3Q FORM 10-Q 120
NOTE 19. SUPPLEMENTAL INFORMATION
DERIVATIVES AND HEDGING
Note 15 provides the primary information related to our derivatives and hedging activity. This section provides certain supplemental information about this topic.
Changes in the fair value of derivatives are recorded in a separate component of equity (referred to below as Accumulated Other Comprehensive Income, or AOCI) and are recorded in earnings in the period in which the hedged transaction occurs. The table below summarizes this activity by hedging instrument.
FAIR VALUE OF DERIVATIVES | |||||||||||
September 30, 2016 | December 31, 2015 | ||||||||||
(In millions) | Assets | Liabilities | Assets | Liabilities | |||||||
Derivatives accounted for as hedges | |||||||||||
Interest rate contracts | $ | 5,411 | $ | 23 | $ | 4,132 | $ | 158 | |||
Currency exchange contracts | 231 | 414 | 1,109 | 1,383 | |||||||
Other contracts | - | - | - | - | |||||||
5,642 | 437 | 5,241 | 1,541 | ||||||||
Derivatives not accounted for as hedges | |||||||||||
Interest rate contracts | 128 | 23 | 119 | 44 | |||||||
Currency exchange contracts | 1,111 | 3,506 | 1,715 | 4,048 | |||||||
Other contracts | 96 | 22 | 315 | 49 | |||||||
1,334 | 3,550 | 2,149 | 4,141 | ||||||||
Gross derivatives recognized in statement of | |||||||||||
financial position | |||||||||||
Gross derivatives | 6,976 | 3,988 | 7,391 | 5,681 | |||||||
Gross accrued interest | 764 | 24 | 1,001 | (13) | |||||||
7,740 | 4,012 | 8,392 | 5,668 | ||||||||
Amounts offset in statement of financial position | |||||||||||
Netting adjustments(a) | (2,367) | (2,358) | (4,326) | (4,326) | |||||||
Cash collateral(b) | (4,154) | (931) | (1,784) | (642) | |||||||
(6,521) | (3,289) | (6,110) | (4,968) | ||||||||
Net derivatives recognized in statement of | |||||||||||
financial position | |||||||||||
Net derivatives | 1,219 | 723 | 2,282 | 700 | |||||||
Amounts not offset in statement of | |||||||||||
financial position | |||||||||||
Securities held as collateral(c) | (741) | - | (1,277) | - | |||||||
Net amount | $ | 478 | $ | 723 | $ | 1,005 | $ | 700 | |||
Derivatives are classified in the captions "All other assets" and "All other liabilities" and the related accrued interest is classified in "Other GE Capital receivables" and "All other liabilities" in our financial statements.
(a) The netting of derivative receivables and payables is permitted when a legally enforceable master netting agreement exists. Amounts include fair value adjustments related to our own and counterparty non-performance risk. At September 30, 2016 and December 31, 2015, the cumulative adjustment for non-performance risk was $(9) million and insignificant, respectively.
(b) Excluded excess cash collateral received and posted of $188 million and none at September 30, 2016, respectively, and $48 million and $379 million at December 31, 2015, respectively.
(c) Excluded excess securities collateral received of $47 million and $107 million at September 30, 2016 and December 31, 2015, respectively.
2016 3Q FORM 10-Q 121
CASH FLOW HEDGE ACTIVITY | |||||||||||
Gain (loss) reclassified | |||||||||||
Gain (loss) recognized in AOCI | from AOCI into earnings | ||||||||||
for the three months ended September 30 | for the three months ended September 30 | ||||||||||
(In millions) | 2016 | 2015 | 2016 | 2015 | |||||||
Interest rate contracts | $ | 1 | $ | 10 | $ | (12) | $ | (39) | |||
Currency exchange contracts | - | (132) | (46) | (69) | |||||||
Commodity contracts | 1 | (2) | - | (1) | |||||||
Total(a) | $ | 2 | $ | (124) | $ | (57) | $ | (109) | |||
CASH FLOW HEDGE ACTIVITY | |||||||||||
Gain (loss) reclassified | |||||||||||
Gain (loss) recognized in AOCI | from AOCI into earnings | ||||||||||
for the nine months ended September 30 | for the nine months ended September 30 | ||||||||||
(In millions) | 2016 | 2015 | 2016 | 2015 | |||||||
Interest rate contracts | $ | 32 | $ | - | $ | (67) | $ | (100) | |||
Currency exchange contracts | (76) | (757) | (59) | (589) | |||||||
Commodity contracts | 1 | (4) | (3) | (2) | |||||||
Total(a) | $ | (43) | $ | (761) | $ | (128) | $ | (691) | |||
| (a) | Gain (loss) is recorded in GE Capital revenues from services, interest and other financial charges, and other costs and expenses when reclassified to earnings. |
The total pre-tax amount in AOCI related to cash flow hedges of forecasted transactions was a $1 million gain at September 30, 2016. We expect to transfer $86 million loss to earnings as an expense in the next 12 months contemporaneously with the earnings effects of the related forecasted transactions. In both the nine months ended 2016 and 2015, we recognized insignificant gains and losses related to hedged forecasted transactions and firm commitments that did not occur by the end of the originally specified period. At September 30, 2016 and 2015, the maximum term of derivative instruments that hedge forecasted transactions was 16 years and 17 years, respectively. See Note12 for additional information about reclassifications out of AOCI.
For cash flow hedges, the amount of ineffectiveness in the hedging relationship and amount of the changes in fair value of the derivatives that are not included in the measurement of ineffectiveness were insignificant for each reporting period.
COUNTERPARTY CREDIT RISK
Fair values of our derivatives can change significantly from period to period based on, among other factors, market movements and changes in our positions. We manage counterparty credit risk (the risk that counterparties will default and not make payments to us according to the terms of our agreements) on an individual counterparty basis. Where we have agreed to netting of derivative exposures with a counterparty, we net our exposures with that counterparty and apply the value of collateral posted to us to determine the exposure. We actively monitor these net exposures against defined limits and take appropriate actions in response, including requiring additional collateral.
As discussed above, we have provisions in certain of our master agreements that require counterparties to post collateral (typically, cash or U.S. Treasury securities) when our receivable due from the counterparty, measured at current market value, exceeds a specified limit. The fair value of such collateral was $4,895 million at September 30, 2016, of which $4,154 million was cash and $741 million was in the form of securities held by a custodian for our benefit. Under certain of these same agreements, we post collateral to our counterparties for our derivative obligations, the fair value of which was $931 million at September 30, 2016. At September 30, 2016, our exposure to counterparties (including accrued interest), net of collateral we hold, was $363 million. This excludes exposure related to embedded derivatives.
Additionally, our master agreements typically contain mutual downgrade provisions that provide the ability of each party to require termination if the long-term credit rating of the counterparty were to fall below A-/A3 or other ratings levels agreed upon with the counterparty. In certain of these master agreements, each party also has the ability to require termination if the short-term rating of the counterparty were to fall below A-1/P-1. Our master agreements also typically contain provisions that provide termination rights upon the occurrence of certain other events, such as a bankruptcy or events of default by one of the parties. If an agreement was terminated under any of these circumstances, the termination amount payable would be determined on a net basis and could also take into account any collateral posted. The net amount of our derivative liability, after consideration of collateral posted by us and outstanding interest payments was $728 million at September 30, 2016. This excludes exposure related to embedded derivatives.
2016 3Q FORM 10-Q 122
EXHIBITS
Exhibit 3(a)
| Certificate of Change of General Electric Company (Incorporated by reference to Exhibit 3(1) to General Electric's Current Report on Form 8-K, dated September 1, 2016 (Commission file number 001-00035).
| |
Exhibit 10(a)
| General Electric 2003 Non-Employee Director Compensation Plan, Amended and Restated as of September 9, 2016.
| |
Exhibit 11 Exhibit 12(a) Exhibit 12(b)
| Computation of Per Share Earnings.*
Computation of Ratio of Earnings to Fixed Charges. Computation of Ratio of Earnings to Fixed Charges and Ratio of Earnings to Combined Fixed Charges and Preferred Stock Dividends.
| |
Exhibit 31(a)
| Certification Pursuant to Rules 13a14(a) or 15d14(a) under the Securities Exchange Act of 1934, as Amended.
| |
Exhibit 31(b)
| Certification Pursuant to Rules 13a14(a) or 15d14(a) under the Securities Exchange Act of 1934, as Amended.
| |
Exhibit 32
| Certification Pursuant to 18 U.S.C. Section 1350.
| |
Exhibit 101
| The following materials from General Electric Company's Quarterly Report on Form 10-Q for the quarter ended September 30, 2016, formatted in XBRL (eXtensible Business Reporting Language); (i) Statement of Earnings (Loss) for the three months ended September 30, 2016 and 2015, (ii) Consolidated Statement of Comprehensive Income (Loss) for the three months ended September 30, 2016 and 2015, (iii) Consolidated Statement of Changes in Shareowners' Equity for the nine months ended September 30, 2016 and 2015, (iv) Statement of Financial Position at September 30, 2016 and December 31, 2015, (v) Statement of Cash Flows for the nine months ended September 30, 2016 and 2015, and (vi) Notes to Consolidated Financial Statements.
| |
* | Data required by Financial Accounting Standards Board Accounting Standards Codification 260, Earnings Per Share , is provided in Note 13 to the Consolidated Financial Statements in this Report.
| |
2016 3Q FORM 10-Q 123
FORM 10-Q CROSS REFERENCE INDEX
Item Number |
| Page(s) | ||
Part I – FINANCIAL INFORMATION | ||||
Item 1. | Financial Statements | 63-122 | ||
Item 2. | Management's Discussion and Analysis of Financial Condition and Results of Operations | 4-57,59 | ||
Item 3. | Quantitative and Qualitative Disclosures About Market Risk | Not applicable(a) | ||
Item 4. | Controls and Procedures | 58 | ||
Part II – OTHER INFORMATION | ||||
Item 1. | Legal Proceedings | 60-61 | ||
Item 1A. | Risk Factors | Not applicable(b) | ||
Item 2. | Unregistered Sales of Equity Securities and Use of Proceeds | 58 | ||
Item 3. | Defaults Upon Senior Securities | Not applicable | ||
Item 4. | Mine Safety Disclosures | Not applicable | ||
Item 5. | Other Information | Not applicable | ||
Item 6. | Exhibits | 123 | ||
Signatures | 125 | |||
(a) | There have been no significant changes to our market risk since December 31, 2015. For a discussion of our exposure to market risk, refer to our Annual Report on Form 10-K for the year ended December 31, 2015. |
(b) | There have been no significant changes to our risk factors since December 31, 2015. For a discussion of our risk factors, refer to our Annual Report on Form 10-K for the year ended December 31, 2015. |
2016 3Q FORM 10-Q 124
SIGNATURES
Pursuant to the requirements of the Securities Exchange Act of 1934, the registrant has duly caused this report to be signed on its behalf by the undersigned thereunto duly authorized.
General Electric Company
| |||
November 2, 2016 | /s/ Jan R. Hauser | ||
Date | Jan R. Hauser Vice President and Controller Duly Authorized Officer and Principal Accounting Officer
|
2016 3Q FORM 10-Q 125