|
|
UNITED STATES
SECURITIES AND EXCHANGE COMMISSION
Washington, D.C. 20549
FORM 10-K
(Mark One)
☑ | Annual Report Pursuant to Section 13 or 15 (d) of the Securities Exchange Act of 1934 |
For the fiscal year ended January 31, 2018.
¨ | Transition Report Pursuant to Section 13 or 15 (d) of the Securities Exchange Act of 1934 |
For the transition period from to
Commission file number 1-8777
VIRCO MFG. CORPORATION
(Exact name of registrant as specified in its charter)
DELAWARE |
| 95-1613718 |
(State or other jurisdiction of incorporation or organization) |
| (IRS Employer Identification No.) |
|
|
|
2027 Harpers Way, Torrance, California |
| 90501 |
(Address of principal executive offices) |
| (Zip Code) |
Registrant's telephone number, including area code (310) 533-0474
Securities registered pursuant to Section 12(b) of the Act:
Title of each class |
| Name of each exchange on which registered: |
Common Stock, $0.01 Par Value |
| The NASDAQ Stock Market LLC |
Securities registered pursuant to Section 12(g) of the Act: None
Indicate by check mark if the issuer is a well-known seasoned issuer as defined in Rule 405 of the Securities Act. Yes ¨ No ☑
Indicate by check mark if the registrant is not required to file reports pursuant to Section 13 or Section 15(d) of the Exchange Act. Yes ¨ No ☑
Indicate by check mark whether the registrant (1) has filed all reports required to be filed by Section 13 or 15(d) of the Securities Exchange Act of 1934 during the preceding 12 months (or for such shorter period that the Registrant was required to file such reports), and (2) has been subject to such filing requirements for the past 90 days. Yes ☑ No ¨
Indicate by check mark whether the registrant has submitted electronically and posted on its corporate Web site, if any, every Interactive Data File required to be submitted and posted pursuant to Rule 405 of Regulation S-T (§232.405 of this chapter) during the preceding 12 months (or for such shorter period that the registrant was required to submit and post such files). Yes ☑ No ¨
Indicate by check mark if disclosure of delinquent filers pursuant to Item 405 of Regulation S-K (§229.405 of this chapter) is not contained herein, and will not be contained, to the best of registrant's knowledge, in definitive proxy or information statements incorporated by reference in Part III of this Form 10-K or any amendment to this Form 10-K. ☑
Indicate by check mark whether the registrant is a large accelerated filer, an accelerated filer, a non-accelerated filer, or a smaller reporting company. See the definitions of "large accelerated filer," "accelerated filer" and "smaller reporting company" in Rule 12b-2 of the Exchange Act. (Check one):
Large accelerated filer ¨ |
| Accelerated filer ¨ |
| Non-accelerated filer ¨ |
| Smaller reporting company ☑ |
|
|
|
| (Do not check if a smaller reporting company) |
|
|
Emerging growth company ¨ |
|
|
|
|
|
|
If an emerging growth company, indicate by check mark if the registrant has elected not to use the extended transition period for complying with any new or revised financial accounting standards provided pursuant to Section 13(a) of the Exchange Act. ¨
Indicate by check mark whether the registrant is a shell company (as defined in Rule 12b-2 of the Exchange Act.) Yes ¨ No ☑
The aggregate market value of the voting and non-voting common stock held by non-affiliates of the registrant on July 31, 2017, was $65 million (based upon the closing price of the registrant's common stock on such day, as reported by NASDAQ).
As of April 1, 2018, there were 15,357,457 shares of the registrant's common stock ($0.01 par value) outstanding.
DOCUMENTS INCORPORATED BY REFERENCE
Portions of the Registrant's definitive proxy statement for its 2018 Annual Meeting of Stockholders to be filed with the Securities and Exchange Commission are incorporated by reference into Part III of this Annual Report on Form 10-K as set forth herein.
|
|
TABLE OF CONTENTS
| Page Numbers |
PART I |
|
Item 1. Business | 3 |
Item 1A. Risk Factors | 13 |
Item 1B. Unresolved Staff Comments | 20 |
Item 2. Properties | 20 |
Item 3. Legal Proceedings | 20 |
Item 4. Mine Safety Disclosures | 20 |
PART II |
|
Item 5. Market for Registrant's Common Equity, Related Stockholder Matters and Issuer Purchases of Equity Securities | 21 |
Item 6. Selected Financial Data | 22 |
Item 7. Management's Discussion and Analysis of Financial Condition and Results of Operations | 23 |
Item 7A. Quantitative and Qualitative Disclosures about Market Risk | 37 |
Item 8. Financial Statements and Supplementary Data | 39 |
Item 9. Changes in and Disagreements with Accountants on Accounting and Financial Disclosures | 65 |
Item 9A. Controls and Procedures | 65 |
Item 9B. Other Information | 66 |
PART III |
|
Item 10. Directors, Executive Officers of the Registrant and Corporate Governance | 67 |
Item 11. Executive Compensation | 67 |
Item 12. Security Ownership of Certain Beneficial Owners and Management and Related Stockholder Matters | 67 |
Item 13. Certain Relationships and Related Transactions, and Director Independence | 67 |
Item 14. Principal Accounting Fees and Services | 67 |
PART IV |
|
Item 15. Exhibits, Financial Statement Schedules | 68 |
SIGNATURES | 70 |
2
PART I
Cautionary Statement Regarding Forward-Looking Statements
This report on Form 10-K contains a number of "forward-looking statements" that reflect the current views of Virco Mfg. Corporation ( the "Company" or "Virco") with respect to future events and financial performance, including, but not limited to, statements concerning: availability of funding for educational institutions; plans and objectives of management for future operations, including relating to the Company's future products, pricing, marketing, seasonal fluctuations in demand, expansion, manufacturing processes, and business strategies; the Company's ability to continue to control costs and inventory levels; availability and cost of raw materials, especially steel and petroleum-based products; the availability and cost of labor; transportation costs; the potential impact of the Company's "Assemble-To-Ship" program on earnings; market demand; the Company's ability to position itself in the market; current and future investments in and utilization of infrastructure; and management's beliefs that cash flow from current operations, existing cash reserves, and available lines of credit will be sufficient to support the Company's working capital requirements to fund existing operations. Forward-looking statements also include the assumptions underlying or relating to any of the foregoing statements. Such forward-looking statements are not guarantees of future performance and are subject to known and unknown risks, uncertainties, assumptions and other factors, many of which are out of the Company's control and difficult to forecast, that may cause actual results to differ materially from those which are expressed or implied in any forward-looking statements. Such factors include, but are not limited to, changes in, or the Company's ability to predict, general economic conditions, the availability and cost of raw materials, the markets for school and office furniture generally and specifically in areas and with customers with which the Company conducts its principal business activities, the rate of approval of school bonds for the construction of new schools, the extent to which existing schools order replacement furniture, customer confidence, competition, and other factors included in the "Risk Factors" section of this report.
The forward-looking statements contained in this report on Form 10-K are made on the basis of the views and assumptions of management regarding future events and business performance as of the date this report is filed with the SEC. We do not undertake any obligation to update these statements to reflect events or circumstances occurring after the date this report is filed.
In this report, words such as "anticipates," "believes," "expects," "will continue," "future," "intends," "plans," "estimates," "projects," "potential," "budgets," "may," "could" and similar expressions identify forward-looking statements. Readers are cautioned not to place undue reliance on forward-looking statements, which speak only as of the date hereof.
Please note that this report includes trademarks of Virco, including, but not limited to, the following: ZUMA ® , ZUMAfrd™, Ph.D. ® , I.Q. ® , Virtuoso ® , Classic Series™, Martest 21 ® , Lunada ® , Plateau ® , Core-a-Gator ® , Future Access ® , Sigma ® , Metaphor ® , Telos ® , TEXT ® , Parameter ® , Sage™, Analogy™ and Civitas™. Solely for convenience, from time to time, we refer to our trademarks in this report without the ® and ™ symbols, but such references are not intended to indicate that we will not assert, to the fullest extent under applicable law, our rights to our trademarks. In addition, other names and brands included in this report may be claimed by us as well or by third parties
Item 1. Business
Introduction
Designing, producing and distributing high-value furniture for a diverse family of customers is a 68-year tradition at Virco Mfg. Corporation ("Virco" or the "Company", or in the first person, "we", "us" or "our"). Virco was incorporated in California in February 1950, and reincorporated in Delaware in April 1984. Virco started as a local manufacturer of chairs and desks for Los Angeles-area schools, and over the years has become the largest manufacturer and supplier of moveable educational furniture and equipment for the preschool through 12th grade market in the United States. The Company manufactures a wide assortment of products, including mobile tables, mobile storage equipment, desks, computer furniture, chairs, activity tables, folding chairs and folding tables. Additionally, Virco has worked with accomplished designers - such as Peter Glass, Richard Holbrook, and Bob Mills - to develop additional products for contemporary applications. These include the best-selling ZUMA Series; the recently introduced Analogy and Civitas furniture collections; Metaphor and Sage Series items for educational settings; and the wide-ranging Plateau Series.
Along with serving customers in the education market - which in addition to preschool through 12th grade public and private schools includes: junior and community colleges; four-year colleges and universities; trade, technical and vocational schools - Virco is a significant furniture and equipment supplier for convention centers and arenas; the hospitality industry with respect to banquet and meeting facilities; government facilities at the federal, state, county and municipal levels; and places of worship. We also sell to wholesalers, distributors, traditional retailers and catalog retailers that serve these same markets.
3
To meet the furniture and equipment needs of our customers, Virco leases a 560,000 sq. ft. office, manufacturing and warehousing facility located on 23.5 acres of land in Torrance, California; this facility includes our corporate headquarters, West Coast showroom, and our West Coast distribution operations. To complement our Torrance-based operations, Virco owns 100 acres of land in Conway, Arkansas, containing 1,200,000 sq. ft. of manufacturing, warehousing, and office space. With high-density storage systems, 70 dock doors dedicated to outbound freight, and substantial yard capacity to store and stage trailers, this facility supports Virco's ability to handle increased sales during our peak summer delivery season and enhances the efficiency with which orders are filled. Virco also operates two other facilities in Conway. The first is a 375,000 sq. ft. factory - acquired in 1954, and expanded and modernized in subsequent years - where a variety of operations take place, including the manufacture of fabricated steel components, chrome plating, and plastic injection-molding; components generated here are transferred to other facilities for assembly into finished goods. The second is a 175,000 sq. ft. manufacturing facility where compression-molded hard plastic components are fabricated and stored. The Company occupied this building under a series of leases for approximately 20 years, and purchased this facility in the third quarter of the 2018 fiscal year.
New Products and Markets
Because the product needs and preferences of our customers continue to evolve - and in response to competitive furniture and equipment offerings from domestic and offshore suppliers - Virco maintains an active new product development program. We've worked with accomplished designers - such as Peter Glass, Richard Holbrook, and Bob Mills - to introduce exciting furniture and equipment solutions for contemporary applications. In addition to new product programs, our domestic factories allow the Company to respond to custom requests or modifications to existing product offerings made by our customers. Often these custom requests are incorporated into our product offering for all customers. Over the past three years, Virco has launched a substantial number of new products, including the products discussed below.
In 2016, to further support STEM and STEAM (Science, Technology, Engineering, Art and Math) centered learning, Virco introduced Makerspace™ Tables. The Makerspace line offers a wide assortment of medium-duty tables designed specifically for the hands-on learning environment most commonly found in vocational classes, makerspace areas, and STEM / STEAM centered education. Available in a large selection of top sizes, the unique inset design allows the user to easily swap out to a new work surface when needed without completely disassembling or replacing the entire table. Surface options include a standard ¾-inch laminate plywood core, or an unfinished, non-laminate, raw plywood work surface. To address the ongoing integration of technology in the classroom, Instructor Media Towers and Media Stations offer solutions for media storage and presentation. Virco's Media Towers incorporate locking doors, adjustable and fixed shelves, file and box drawers, and fully integrated cable management. Optional accessories for the Instructor Media Towers include a Caster Kit, Lectern Top Assembly, and Shelf Kits.
In 2017 the Company introduced a variety of new product lines and product family extensions. We launched our "Mix & Match" dealer program, which allows customers to select from a variety of table shapes, sizes, and heights, including stand up heights, along with a variety of interchangeable legs. To continue to provide customers with collaborative and multi-purpose solutions, we introduced the new 5000 Series Activity Table line which offers standard and new shapes with a thick profile leg and expanded our 4000 Series Activity Table line with a variety of new shapes. Our Zuma line was expanded to further address the needs of today's classrooms. The adjustable stand up height student desk comes in models and includes a standard FRW hard-plastic work surface with optional accessories including book boxes and baskets and backpack hangers. The Zuma stacking cantilever chair easily nests on top of tables and desks, then stacks to create space or store. Also new for 2017 was the Sigma adjustable height cantilever desk.
In the fiscal year ended January 31, 2018, Virco further expanded our product offerings to include products that broaden our solutions for technology, collaborative learning, higher education and multi-functional areas of the campus. The new 5700 Series Tables feature built-in wire management and were designed to support technology, training and media-savvy classrooms. Targeting higher-education, business and dining environments, our new Parison ™ Series chairs offer an elegant and refined look in 4-leg, mobile and task chairs as well as stools. The Metonymy™ Series fits well in classrooms, commons, libraries and living spaces. With its highly functional and compact design, the Metonymy set offers flexible usage including a sturdy desk with padded seat and footrest as well as a step stool, podium or standing desk. Virco's 4000 and 5000 Series collaborative activity tables continue to fill the need for active, flexible spaces and we further broadened our line to include new shapes and sizes as well as a Floor Table Conversion Kit for the 4000 Series tables. The floor table provides a solution for allowing students to select flexible seating, including having a stable surface while sitting low to the ground.
Many of today's modern classrooms are focusing on creating more dynamic, active and flexible environments for their 21 st Century learners. Virco has continued to innovate around its line of Healthy Movement furniture and introduced three new lines of flexible seating that take movement and choice to a new level. The Room to Move Collection was previewed at the EDspaces show in October 2017 and is based on the idea that today's classrooms are active, dynamic places where students are often given room to move - empowering them with choices of where to sit, how to sit and even when to sit. The Floor Rocker
4
(available in Analogy, Sage and ZUMA styles) provides a safe, durable and ergonomic option for floor seating. The C2M (Choose to Move) 4-Leg Chair won the EDspaces Innovation in Seating Award and offers an empowering new twist on flexible seating with a patent-pending mode selector that allows the same chair to easily transform from fixed to active seating. Like the C2M chair, the R2M (Room to Move) Mobile Task Chair offers movement in all directions - front-to-back and side-to-side - as well as the mobility and adjustability of a task chair. All of these products enable healthy movement and flexibility in the classroom while blending with existing Virco furniture.
As of January 31, 2018, the Company employed approximately 750 full-time employees, manufacturing its products in 1.1 million square feet of fabrication facilities and 1.2 million square feet of assembly and warehousing facilities in Torrance, California and Conway, Arkansas. Additionally, the Company's PlanSCAPE® project management software allows its sales representatives to provide CAD layouts of classrooms, as well as classroom-by-classroom planning documents for the budgeting, acquisition and delivery of furniture, fixtures and equipment ("FF&E").
In the past decade, due to budgetary constraints, many schools reduced or eliminated central warehouses, janitorial services, and professional purchasing functions. As a result, fewer school districts administer their own bids, and are more likely to use regional, state, or national contracts. A shift to site-based management combined with reductions in professional purchasing personnel has increased the reliance of schools on suppliers that provide for a variety of needs from one source rather than administering different vendor relationships for each item. In response to these changes, the Company has expanded both the products and the services it provides to its educational customers. Now, in addition to buying furniture FOB Factory, customers can purchase furniture for delivery to warehouses and school sites, and can also purchase full-service furniture delivery that includes the delivery of the furniture in classrooms. Because the Company has been aggressively developing new furniture lines to enhance the range of products it manufactures - and by purchasing furniture and equipment from other companies for re-sale with Virco products - the Company is now able to provide "one-stop shopping" for all FF&E needs in our educational market.
The expansion of the Company's product line combined with the expansion of its services over the years has provided Virco with the ability to serve various markets including the education market (the Company's primary market), which is made up of public and private schools (preschool through 12th grade), junior and community colleges; four-year colleges and universities; and trade, technical and vocational schools. Virco also serves convention centers and arenas; the hospitality industry with respect to banquet and meeting facilities; government facilities at the federal, state, county and municipal levels; and places of worship. In addition, the Company also sells to wholesalers, distributors, traditional, internet and catalog retailers that serve these same markets.
Manufacturing and Distribution
Virco serves its customers through a well-trained, nationwide sales and support team. Virco's educational product line is marketed through an extensive direct sales force, as well as through a dealer network. In addition, Virco has a Corporate Sales Group to pursue international business wholesalers, mail order accounts and national chains where management believes that it is more efficient to have a single sales representative or group service such customers, as they tend to have needs that transcend the geographic boundaries established for Virco's local accounts. The Company also has an array of support services, including complete package solutions for the FF&E line item on school budgets; computer-assisted layout planning; transportation planning; and product delivery.
Another important element of Virco's business model is the Company's emphasis on developing and maintaining key manufacturing, assembly, distribution, and service capabilities. For example, Virco has developed competencies in several manufacturing processes that are important to the markets the Company serves, such as finishing systems, plastic molding, metal fabrication and woodworking. Virco's physical facilities are designed to support its ATS strategy. Warehouses have substantial staging areas combined with a large number of dock doors to support the seasonal peak in shipments during summer months.
During the last decade, many furniture manufacturers closed their domestic manufacturing facilities and began importing increasing quantities of furniture from international sources. During this same period, Virco elected to significantly reduce its work force, but retain its domestic factory locations. The Company believes that its domestic manufacturing capabilities are a significant strength. The Company has effectively used product selection, color selection, and dependable execution of delivery to customers to enhance its market position. With increasing costs from international sources and increasing freight costs, our factories are cost-competitive for bulky educational furniture and equipment items. The Company's ATS strategy allows for low-cube component parts to be sourced globally, with fabrication of bulky welded steel frames, wood tops, and larger molded-plastic components to be performed locally. Domestic production of laminated wood tops and molded plastic enables the Company to market a color palette that cannot be matched in a short delivery window by imported finished goods.
5
Domestic assembly allows the Company to use standard ATS components to assemble customer-specific product and color combinations shortly prior to delivery.
Finally, management continues to hone Virco's ability to finance, manufacture and warehouse furniture within the relatively narrow delivery window associated with the highly seasonal demand for education sales. In 2017 and 2018, approximately 55% of the Company's total sales were delivered in June, July, and August with an even higher portion of educational sales delivered in that period. Shipments of furniture during peak weeks in July and August can be six times greater than in the seasonally slow winter months. Virco's substantial warehouse space allows the Company to build adequate inventories to service this narrow delivery window for the education market.
Principal Products
Virco produces the broadest line of furniture for the K-12 market of any manufacturer in the United States. By supplementing products manufactured by Virco with products from other manufacturers, Virco provides a comprehensive product assortment that covers substantially all products and price points that are traditionally included on the FF&E line item on a new school project or school budget. Virco also provides a variety of products for preschool markets and has recently developed products that are targeted for college, university, and corporate learning center environments. The Company has an ambitious and on-going product development program featuring products developed in-house as well as products developed with accomplished designers. The Company's primary furniture lines are constructed of tubular metal legs and frames, combined with wood and plastic tops, plastic seats and backs, upholstered seats and backs, and upholstered rigid polyethylene and polypropylene shells. Virco also has flat metal forming capabilities to enable the production of desks, returns, bookcases, filing cabinets, mobile pedestals and related items.
Virco's principal manufactured products include:
SEATING - Virco offers a full line of classroom seating in a variety of price points providing high value and quality across all types of seating, from traditional to modern solutions. The ergonomically supportive ZUMA® line designed by Peter Glass and Bob Mills posted the highest initial-year new product sales total in the Company's history. In addition to fixed-height 4-leg chairs, the ZUMA line includes cantilever chairs; tablet arm chairs with a fixed or articulating work surface and a compact footprint; and steel-frame rockers. The Sage™ line, originally designed to serve students in college, university and other adult education settings - and on high school campuses - now offers a 13" and a 15" 4-leg chair and a corresponding pair of cantilever chairs for younger or smaller students; there's also a selection of Sage rockers for K-12 applications and several tablet arm units. Selected adult-height Sage models can also now be ordered with a padded, upholstered seat. The Analogy seating line includes fixed-height 4-leg chairs, cantilever chairs; tablet arm chairs with a fixed or articulating work surface and a compact footprint; and steel-frame rockers. Other Virco seating choices include the Metaphor® Series - an updated sequel to Virco's best-selling Classic Series™ furniture with improvements in comfort, ergonomics, stackability, and manufacturing efficiencies. The Sage Contract line is targeted for offices and reception areas, colleges, hospitality venues and other adult environments. Virco further expanded the Sage Contract line in 2015 with the addition of a mobile tablet-arm workstation that includes an integrated bookrack to further penetrate the higher education market. Civitas™ chairs and stools are intended for foodservice, libraries, media centers, circulation areas, and related areas where people gather. Additional Virco seating alternatives range from 120, 121 and 122 Series stools to contoured I.Q.® Series classroom chairs by Richard Holbrook; comfortable, attractive Virtuoso® chairs by Charles Perry; and Analogy™ Series chairs by Peter Glass and Bob Mills. The N2 Series was designed by Virco and introduced in 2015 as a comprehensive, ergonomic seating line that specifically caters to the budget conscious consumer. Classic Series™ stack chairs and Martest 21® hard plastic seating models are popular choices in schools across America. Along with this range of seating, Virco serves additional markets such as event venues and training spaces with a line of folding chairs and upholstered stack chairs, as well as additional plastic stack chairs and upholstered ergonomic chairs.
TABLES - Our broad collection of tables offer solutions for K-12 classrooms and multi-use areas across the entire campus as well as serving higher learning, event, training and administrative spaces. Our 4000 and 5000 Series Activity Tables provide a broad range of shapes, sizes and heights ideal for collaborative learning. Virco's TEXT® table collection for learning environments - designed by Peter Glass and Bob Mills- features heavy-gauge tubular steel and proven Virco construction for extended product life, and elliptical legs, swooping yokes and arched feet for exceptional elegance. Selected TEXT models can be equipped with a variety of technology-support and storage accessories. TEXT Tilt-Top Height Adjustable Table further expand Virco's reach into the seminar, training room, and higher education markets by enhancing the functionality and flexibility of the table while strengthening the Virco and TEXT brands. The Tetra™ Series is a versatile collection of tables and student desks suitable for various environments. From classrooms to open-office spaces, the Tetra is simple enough to serve as an everyday workstation but can be customized to suit the needs of a fast-paced computer lab or seminar training room. Lunada® tables, combining Virco's popular Lunada bi-point bases with a selection of 20 top sizes, make great choices for seminar, conference and related settings. Designed for Virco by Peter Glass, Plateau® tables bring exceptional versatility,
6
sturdy construction and great styling to working and learning environments. For durable, easy-to-use lightweight folding tables, Virco's Core-a-Gator® models are unsurpassed. When paired with attractive, durable Virco cafe tops, Lunada bases by Peter Glass provide eye-catching table solutions for hospitality settings. Civitas tops and bases provide excellent furniture solutions for casual spaces where people gather. Virco's Makerspace tables are designed specifically for hands-on learning environments most commonly found in vocational classes, makerspace areas and STEM / STEAM centered education. Virco also carries traditional folding tables, CT Series tables with a hand crank mechanism for top height adjustment, and office tables, as well as the computer tables and mobile tables described below.
COMPUTER FURNITURE - The TEXT and Tetra Series table collections described in the preceding paragraph provides an array of computer furniture choices for learning or business environments; Virco's Flip-Top Technology tables and HWT (Hinged Wire Trough) Technology tables also deliver popular computer furniture solutions. Future Access® computer tables come with an integral wire management panel and all rectangular models have a smooth post-formed front and rear edge. Like our Future Access models, 8700 Series computer tables can be equipped with Virco's functional computing accessories, such as keyboard mouse trays, CPU holders and support columns for optional elevated shelves. In an effort to address the demand for collaborative solutions in a computer lab environment, Virco added the Quarter Round 8700 Series Computer Table that allows multiple tables to be grouped together while maintaining a technology based environment. The 5700 Series features the thick profile leg of the 5000 Series with integrated technology for a modern look. The Plateau Office Solutions collection offers desks and workstations with technology-support capabilities, while the Plateau Library/Technology Solutions line has specialty tables and other products for computing applications. Virco now offers Instructor Media Stations and Towers that include several options for media storage and presentation.
DESKS/CHAIR DESKS - From the ergonomic and collaborative-learning strengths of our best-selling ZUMA® student desks to the continuing popularity of our traditional Classic Series™ chair desks and combo units, Virco's wide-ranging furniture models can be found in thousands of America's schools. To expand on the popularity of the 785 Student Desk, Virco added a Collaborative Top work surface as an option on all 785 desk models, which facilitates convenient grouping of desks for break-out sessions and classroom collaboration. The Sage Contract saw the addition of an optional bookrack, which combined with the tablet arm and caster options, creates a complete mobile workstation for a variety of environments. The Molecule is a student desk with a unique shaped collaborative work surface that can be used by a single student or grouped together with multiple Molecules to create various arrangements and group settings. Related products include an array of tablet arm units, new Agile Combo models and new Analogy™ Series combo chair desks. Selected models are available with durable, colorfast Martest 21® or Fortified Recycled Wood™ hard plastic components. For teachers, principals and district administrators - and for business environments - Virco offers an extensive range of Parameter® desks, returns and credenzas designed by Peter Glass and Bob Mills. Textameter™ mobile workstations provide additional furniture choices for educators.
ADMINISTRATIVE OFFICE FURNITURE - In addition to the Plateau® Office Solutions, Parameter®, and Textameter™ product lines, Virco manufactures a selection of desks, returns, bookcases and other items that employ the Company's flat metal forming capabilities. These products include 53 Series steel storage cabinets, an expanded range of 53 Series lateral files, and special versions of 543 and 546 Series desks with wire management capabilities. Other products range from 53 Series wardrobe tower cabinets and Parameter file credenzas to Parameter mobile pedestals and Plateau bookcases in popular 36" wide and 48" wide models that work in classroom settings and related educational environments as well as administrative offices.
LABORATORY FURNITURE - For biology and chemistry classes, and other school- and college-based lab settings, Virco offers a variety of steel-based science tables. Virco manufactures the table bases of these items and equips them with specialty Chemsurf® and epoxy resin tops. Virco's ZUMA®, Sage™, Analogy™, N2, Telos®, Metaphor®, I.Q.®, Classic Series™, and 3000 Series collections include pneumatically adjustable lab stools with high-range seat-height adjustment and a steel foot-ring. Virco also carries a selection of wood-frame science tables with Chemsurf and epoxy resin tops.
MOBILE FURNITURE - Cafeterias are perfect venues for the ever-popular Virco mobile tables - including a selection of oval mobile tables with attached benches or stools - while classrooms benefit from the spacious storage capacity of Virco mobile cabinets; additional mobile cabinet models with a magnetic marker back are available. ADA compliant Mobile Bench & Stool Tables were also introduced to the Virco line of mobile products in 2015 to expand on our wheelchair accessible solutions. An array of Virco product lines includes mobile chairs for school settings and offices.
STORAGE EQUIPMENT - For moving selected Virco chairs and folding tables, the Company carries a wide range of handling and storage equipment. For our convention center, arena, and auditorium customers, Virco also manufactures stackable storage trucks that work with Virco upholstered stack chairs, folding chairs and folding tables.
Virco's wide-ranging product selection includes hundreds of furniture models that are certified the Greenguard® Children & Schools Program for indoor air quality. In 2005 Virco's ZUMA and ZUMAfrd™ products earned the distinction of being the
7
first classroom furniture models to be certified by the Greenguard Children & Schools Program, now known as Greenguard Gold certification. All of the models in the Company's most recently introduced product lines - including Analogy™ furniture models and Textameter™ instructor workstations - are Greenguard-certified. Along with Virco's leadership relative to Greenguard-certified furniture, the Company also introduced the classroom furniture industry's first Take-Back program in 2007, enabling qualifying schools, colleges, universities, and other organizations and customers to return selected out-of-service furniture components for recycling rather than sending these items to a landfill.
In order to provide a comprehensive product offering for the education market, the Company supplements Virco-manufactured products with items purchased for re-sale, including wood and steel office furniture, early learning products for pre-school and kindergarten classrooms, science laboratory furniture, and library tables, chairs and equipment. Virco now offers customized, space-efficient workstations by Interior Concepts™ for technology and language labs, media centers, computer classrooms, reception areas and offices. Interior Concepts is one of the many vendors with which the Company partners in order to effectively position Virco as the preferred one-stop furniture and equipment source for K-12 schools. None of the products from vendor partners accounted for more than 10% of consolidated revenues in 2018.
To complement Virco's extensive selection of furniture and equipment, we offer customers a variety of valuable services in connection with the purchase of Virco products; revenues from these service levels are included in the purchase price of the furniture items. In addition to giving customers the option of purchasing Virco products and making their own delivery arrangements, Virco provides three levels of delivery service. When customers choose Standard Delivery - also known as tailgate delivery - the delivery driver is responsible for moving the customer's goods to the tailgate of the truck only; therefore, the customer must have personnel on hand to unload the truck. For additional charges Virco also offers Inside Delivery (to an inside location), or Full-Service Delivery (delivered and placed in the classroom). To assist customers involved with FF&E purchases for new school construction projects or school renovations, Virco's PlanSCAPE® service provides room-by-room computerized layout planning and full FF&E project management.
Customers
Virco's major customers include educational institutions, convention centers and arenas, hospitality providers, government facilities, and places of worship. No customer accounted for more than 10% of Virco's consolidated revenues during 2018.
Raw Materials
Virco purchases steel, aluminum, plastic, polyurethane, polyethylene, polypropylene, plywood, particleboard, medium density fiberboard (MDF), cartons and other raw materials from many different sources for the manufacture of its principal products. Management believes the Company is not more vulnerable with respect to the sources and availability of these raw materials than other manufacturers of similar products. The Company's largest raw material cost is for steel, followed by plastics and wood.
The price of these commodities, particularly steel and plastic, can be volatile. Historically the Company has experienced years where the price of steel, plastic, and wood have spiked significantly; often as a result of global demand or tariffs on international supply but also in response to domestic supply interruptions. In 2016 the cost of these commodities declined slightly. In 2017, the cost of steel increased significantly, but the increase did not occur until after the Company had sourced the majority of its steel for the summer delivery season. In 2018, the cost of commodities increased during the year. Subsequent to year-end, tariffs announced on imported steel by President Trump have created volatility in the price of steel and other imported components, and the price of steel has increased significantly during 2018.
In addition to the raw materials described above, the Company purchases components used in the fabrication and assembly of furniture from a variety of overseas locations, but primarily from China. These components are classified as raw materials in the financial statements until such time that the components are consumed in a fabrication or assembly processes. These components are sourced from a variety of factories, none of which are owned or operated by the Company. Costs for these imported components increased moderately during each of the last three years, and are expected to increase by 6-8% in 2019.
With respect to the Company's annual contracts (or those contracts that have longer terms), the Company may have limited ability to increase prices during the term of the contract. The Company has, however, negotiated increased flexibility under many of these contracts, allowing the Company to increase prices on future orders. Nevertheless, even with respect to these more flexible contracts, the Company does not have the ability to increase prices on orders received prior to any announced price increases in commodities. Due to the intensely seasonal nature of our business, the Company may receive significant orders during the first and second quarters for delivery in the second and third quarters. With respect to any of the contracts described above, if the costs of raw materials increase suddenly or unexpectedly, the Company cannot be certain that it will be able to implement corresponding increases in its sales prices in order to offset such increased costs. Significant cost increases
8
in providing products during a given contract period can adversely impact operating results and have done so during prior years. The Company typically benefits from any decreases in raw material costs under the contracts described above.
Marketing and Distribution
Virco serves its customers through a well-trained, nationwide sales and support team, as well as a dealer network. In addition, Virco has a Corporate Sales Group to pursue international sales, wholesalers, mail order accounts and national chains where management believes it would be more efficient to have a single sales representative or group approach such persons, as they tend to have needs that transcend the geographic boundaries established for Virco's local accounts.
Virco's educational product line is marketed through what management believes to be the largest direct sales force of any education furniture manufacturer. The Company's approach to servicing its customer base is very flexible, and is tailored to best meet the needs of individual customers and regions. When considered to be most efficient, the sales force will call directly upon school business officials, who may include purchasing agents or individual school principals where site-based management is practiced. Where it is considered advantageous, the Company will use large exclusive distributors and full-service dealer partners. The Company's direct sales force is considered to be an important competitive advantage over competitors who rely primarily upon dealer networks for distribution of their products.
Virco's sales force is assisted by the Company's proprietary PlanSCAPE® software and experienced PlanSCAPE managers when preparing complete package solutions for the FF&E segment of bond-funded public-school construction projects. PlanSCAPE software also enables the entire Virco sales force to prepare quotations for less complicated projects.
A significant portion of Virco's business is awarded through annual bids with school districts or other buying groups used by school districts. These bids are typically valid for one year. Many contracts contain penalty, performance, and debarment provisions that can result in debarment for a number of years, a financial penalty, or calling of performance bonds.
Sales of commercial and contract furniture are made throughout the United States by distributorships and by Company sales representatives who service the distributorship network. Virco representatives call directly upon state and local governments, convention centers, individual hospitality venues, places of worship and mass merchants. This market includes colleges and universities, preschools, private schools, and office training facilities, which typically purchase furniture through commercial channels.
The Company sells to thousands of customers, and, as such no single customer represented more than 10 percent of the Company's consolidated revenues in 2018. Significant purchases of furniture using public funds often require annual bids or some form of "authorization" to purchase goods or services from a vendor. This authorization can include state contracts, local and national buying groups, or local school districts that "piggyback" on the bid of a larger district. In virtually all cases, purchase orders and payments are processed by the individual school districts, even though the contract pricing may be determined by a state contract, national or local buying group, or consortium of school districts. Schools usually can purchase from more than one contract or purchasing vehicle if they are participants in buying groups as well as being eligible for a state or national contract.
Virco is the exclusive supplier of movable classroom furniture for one nationwide purchasing organization under which many of our customers price their furniture. See " Item 1A. Risk Factors: Approximately 50% of our sales are priced through one contract, under which we are the exclusive supplier of classroom furniture ." Sales priced under this contract represented approximately 58% of sales in 2018, 56% of sales in 2017, and 51% of sales in 2016. In 2009, the Company was awarded a three-year contract with this purchasing organization extending through 2012 and three one-year extensions extending through 2015. In 2015, the Company was awarded a three-year extension through December 31, 2017 with two one-year extensions through December 31, 2019. In 2018 the Company was awarded a five-year contract with this organization that extends through December 2022, with two two-year extensions extending through 2026. If Virco were unable to sell under this contract, we believe we would be able to sell to the vast majority of our customers under alternative contracts.
The Company's education customers typically do not have logistic capabilities and more than 75 % of sales are FOB destination, and include freight to customer. Sales of furniture that are sold FOB factory are typically made to resellers of our product who in turn provide logistics to the ultimate customer. Approximately 90% of the Company's freight is supplied by third party carriers. Utilizing third party carriers is an effective method of addressing the significant seasonal peak in summer and moderating excess capacity issues in the slow season. Reliance on third party carriers can expose the Company to freight rate volatility, fuel surcharges, and to capacity constraints in the transportation industry. Historically, the Company has been able to obtain adequate capacity from freight vendors to service the summer season.
Seasonality
9
The educational sales market is extremely seasonal. Approximately 55% of the Company's total sales in 2018 were delivered in June, July, and August with an even higher portion of educational sales delivered in that period. Shipments during peak weeks in July and August can be as great as six times the level of shipments in the winter months.
Working Capital Requirements During Our "Peak" Summer Season
As discussed above, the market for educational furniture and equipment is marked by extreme seasonality, with the majority of shipments occurring from June to August each year, which is the Company's peak season. As a result of this seasonality, Virco builds and carries significant amounts of inventory during the peak summer season to facilitate the rapid delivery requirements of customers in the educational market. This requires a large up-front investment in raw materials and components, labor, storage and related costs as inventory is built in anticipation of peak sales during the summer months. As the capital required for this build-up generally exceeds cash available from operations, Virco has historically relied on bank financing to meet cash flow requirements during the build-up period immediately preceding the high season. Currently, the Company has a line of credit with PNC Bank to assist in meeting cash flow requirements as inventory is built for, and business is transacted during, the peak summer season.
In addition, Virco typically is faced with a large balance of accounts receivable during the peak season. This occurs for three primary reasons. First, accounts receivable balances naturally increase during the peak season as product shipments increase. Second, many customers during this period are government institutions, which tend to pay accounts receivable more slowly than commercial customers. Third, many summer deliveries may be "projects" where the Company provides furniture for a new school or significant refurbishment of an existing school. Projects may require architect sign off, school board approval prior to payment, or punch list completion, all of which can delay payment. Virco has historically enjoyed high levels of collectability on these accounts receivable due to the low-credit risk associated with such customers. Nevertheless, due to the time differential between inventory build-up in anticipation of the peak season and the collection on accounts receivable throughout the peak season, the Company must rely on external sources of financing.
As a result of the seasonality of our business, our manufacturing capacity is dictated by the capacity requirement during the months of June, July, and August. Because of this seasonality, factory utilization is lower during the slow season. The Company utilizes a variety of tactics to address this seasonal business. During the summer months, which comprise our second and third fiscal quarters, our full-time personnel utilization generally is at or exceeds full capacity. The Company utilizes temporary labor and significant overtime to meet these seasonal requirements. During the slow portions of the year, temporary labor and overtime are eliminated to moderate the off-season costs. Our manufacturing facility capacity utilization generally remains less than 100% during these off-season months; because physical structure capacity cannot be adjusted as readily as personnel capacity, we have secured sufficient physical structure capacity to accommodate our current needs as well as for anticipated future growth. Our physical structure utilization is significantly lower during the first and fourth quarters of each year than it is during the second and third quarters.
The Company utilizes a comparable strategy to address warehousing and distribution requirements. During summer months, temporary labor is hired to supplement experienced warehouse and distribution personnel. More than 90% of the Company's freight is provided by third-party carriers. Utilizing third party carriers is an effective method of addressing the significant seasonal peak in summer and moderating excess capacity issues in the slow season. Reliance on third party carriers can expose the Company to freight rate volatility, fuel surcharges, and to capacity constraints in the transportation industry. The Company has secured sufficient warehouse capacity to accommodate our current needs as well as anticipated future growth.
Virco's working capital requirements during, and in anticipation of, the peak summer season require management to make estimates and judgments that affect assets, liabilities, revenues and expenses, and related contingent assets and liabilities. For example, management expends a significant amount of time in the first quarter of each year developing a stocking plan and estimating the number of temporary summer employees, the amount of raw materials, and the types of components and products that will be required during the peak season. If management underestimates any of these requirements, Virco's ability to meet customer orders in a timely manner or to provide adequate customer service may be diminished. If management overestimates any of these requirements, the Company may have to absorb higher storage, labor and related costs, each of which may negatively affect the Company's results of operations. On an on-going basis, management evaluates and adjusts its estimates, including those related to market demand, labor costs, and stocking inventory. Moreover, management continually strives to improve its ability to correctly forecast the requirements of the Company's business during the peak season each year based in part on annual contracts which are in place and management's experience with respect to the market.
As part of Virco's efforts to balance seasonality, financial performance and quality without sacrificing service or market share, management has been refining the Company's ATS operating model. ATS is Virco's version of mass-customization, which assembles standardized, stocked components into customized configurations before shipment. The ATS program reduces the total amount of inventory and working capital needed to support a given level of sales. It does this by increasing the
10
inventory's versatility, delaying assembly until the last moment, and reducing the amount of warehouse space needed to store finished goods. As part of the ATS stocking program, Virco has endeavored to create a more flexible work force. The Company has developed compensation programs to reward employees who are willing to move from fabrication to assembly to the warehouse as seasonal demands evolve.
Other Matters
Competition
Virco has numerous competitors in each of its markets. In the educational furniture market, Virco manufactures furniture and sells direct to educational customers. Competitors typically fall into two categories (1) furniture manufacturers that sell to dealers which re-sell furniture to the end user, and (2) dealers that purchase product from these manufacturers and re-sell to educational customers. The manufacturers that Virco competes with include HON (HNI), Artco-Bell, KI Inc., Bretford, Smith System, Columbia, Scholarcraft, Alumni, ECR4Kids, and VS America. Historically, our largest competitor that purchases and re-sells furniture has been School Specialty (SCHS). MeTEOR (formerly Contrax) is a significant nationwide reseller focusing on projects. In addition to School Specialty and MeTEOR, there are numerous catalogers, internet resellers, and smaller local education furniture dealers that sell into local markets. Competitors in contract furniture vary depending upon the specific product line or sales market and include Falcon Products, National Public Seating, Sandusky Lee, Bush Industries, MTS and Mity Enterprises, Inc.
The educational furniture market is characterized by price competition, as many sales occur on a bid basis. Management compensates for this market characteristic through a combination of methods that include emphasizing the value of Virco's products and product assortment, the convenience of one-stop shopping for "Equipment for Educators™", the value of Virco's project management capabilities, the value of Virco's distribution and delivery capabilities, and the value of Virco's customer support capabilities and other intangibles. In addition, management believes that the streamlining of costs assists the Company in compensating for this market characteristic by allowing Virco to offer a higher value product at a lower price. For example, as discussed above, Virco has decreased distribution costs by avoiding re-sellers, and management believes that the Company's large direct sales force and the Company's sizeable manufacturing and warehousing capabilities facilitate these efforts. Although management prefers to compete on the value of Virco products and services, when market conditions warrant, the Company will compete based on direct prices and may reduce its prices to build or maintain its market share.
Backlog
Sales order backlog at January 31, 2018, totaled $17.2 million and approximated eight weeks of sales, compared to $13.6 million at January 31, 2017, and $12.2 million at January 31, 2016. Substantially all of the backlog will ship during the year ending January 31, 2019.
Patents and Trademarks
In the last 15 years, the United States Patent and Trademark Office (the "USPTO") has issued to Virco more than 50 patents on its various new product lines. These patents cover various design and utility features in Ph.D.® chairs, I.Q.® Series furniture, the ZUMAfrd™ family of products, and the ZUMA® family of products, among others.
Virco has a number of other design and utility patents in the United States and other countries that provide protection for Virco's intellectual property as well. These patents expire over the next one to 15 years. Virco maintains an active program to protect its investment in technology and patents by monitoring and enforcing its intellectual property rights. While Virco's patents are an important element of its success, Virco's business as a whole is not believed to be materially dependent on any one patent. See "Risk Factors: An inability to protect our intellectual property could have a significant impact on our business."
In order to distinguish genuine Virco products from competitors' products, Virco has obtained the rights to certain trademarks and trade names for its products and engages in advertising and sales campaigns to promote its brands and to identify genuine Virco products. While Virco's trademarks and trade names play an important role in its success, Virco's business as a whole is not believed to be materially dependent on any one trademark or trade name, except perhaps "Virco," which the Company has protected and enhanced as an emblem of quality educational furniture for over 68 years.
Virco has no franchises or concessions that are considered to be of material importance to the conduct of its business and has not appraised or established a value for its patents or trademarks.
Employees
11
As of January 31, 2018, Virco and its subsidiaries employed approximately 750 full-time employees across our facilities. Of this number, approximately 585 are involved in manufacturing and distribution, approximately 100 in sales and marketing and approximately 65 in administration. The Company also utilizes temporary workers as necessary to meet seasonal production, warehousing or distribution requirements that cannot be filled by its full-time workforce. During 2018, the Company employed approximately 300 temporary workers during the months of June, July, and August, with smaller numbers immediately preceding and following these months.
Environmental Compliance
Virco is subject to numerous federal, state, and local environmental laws and regulations in the various jurisdictions in which it operates that (a) govern operations that may have adverse environmental effects, such as the discharge of materials into the environment, as well as handling, storage, transportation and disposal practices for solid and hazardous wastes, and (b) impose liability for response costs and certain damages resulting from past and current spills, disposals or other releases of hazardous materials. In this context, Virco works diligently to remain in compliance with all such environmental laws and regulations as these affect the Company's operations. Moreover, Virco has enacted policies for recycling and resource recovery that have earned repeated commendations, including: recognition by the California Department of Resources Recycling and Recovery (CalRecycle) in 2012 and 2011 as a Waste Reduction Awards Program (WRAP) honoree; recognition by the United States Environmental Protection Agency in 2004 as a WasteWise Hall of Fame Charter Member, in 2003 as a WasteWise Partner of the Year and in 2002 as a WasteWise Program Champion for Large Businesses; and recognition by the Sanitation Districts of Los Angeles County for compliance with industrial waste water discharge guidelines in 2008 through 2011. In addition to these awards and commendations, Virco's ZUMA® and ZUMAfrd™ product lines were the first classroom furniture collections to earn indoor air quality certification through the stringent GREENGUARD® Children & Schools Program, now known as Greenguard Gold certification. As a follow-up to the certification of ZUMA and ZUMAfrd models in 2006, hundreds of other Virco furniture items - including Analogy™ furniture models and Textameter™ instructor workstations - have earned GREENGUARD certification. Moreover, all Virco products covered by the Consumer Product Safety Improvement Act of 2008 are in compliance with this legislation. All affected Virco models are also in compliance with the California Air Resources Board rule implemented on January 1, 2009, concerning formaldehyde emissions from composite wood products. Environmental laws have changed rapidly in recent years, and Virco may be subject to more stringent environmental laws in the future. The Company has expended, and may be expected to continue to expend, significant amounts in the future for compliance with environmental rules and regulations, for the investigation of environmental conditions, for the installation of environmental control equipment, or remediation of environmental contamination. Normal recurring expenses relating to operating our factories in a manner that meets or exceeds environmental laws are matched to the cost of producing inventory. It is possible that the Company's operations may result in noncompliance with, or liability for remediation pursuant to, environmental laws. Should such eventualities occur, the Company records liabilities for remediation costs when remediation costs are probable and can be reasonably estimated. See Risk Factors: We could be required to incur substantial costs to comply with environmental requirements." Violations of, and liabilities under, environmental laws and regulations may increase our costs or require us to change our business practices.
Financial Information About Industry Segment and Geographic Areas
Virco operates in a single industry segment. For information regarding the Company's revenues, gross profit and total assets for each of the last three fiscal years, see the Company's consolidated financial statements.
During 2018, Virco derived approximately 6.3% of its revenues from customers located outside of the United States (primarily Canada).
During 2017, Virco derived approximately 6.3% of its revenues from customers located outside of the United States (primarily Canada).
During 2016, Virco derived approximately 6.7% of its revenues from customers located outside of the United States (primarily Canada and Puerto Rico).
The Company determines sales to these markets based upon the customers' principal place of business.
During 2018, 2017 and 2016, the Company did not have any long-lived assets outside of the United States.
Executive Officers of the Registrant
As of April 1, 2018, the executive officers of the Company, who are elected by and serve at the discretion of the Company's Board of Directors, were as follows:
12
Name |
| Office |
| Age at January 31, 2018 |
| Has Held Office Since |
Robert A. Virtue (1) |
| Chairman of the Board and Chief Executive Officer |
| 85 |
| 1990 |
Douglas A. Virtue (2) |
| President |
| 59 |
| 2014 |
J. Scott Bell (3) |
| Senior Vice President - Chief Operating Officer |
| 61 |
| 2004 |
Robert E. Dose (4) |
| Senior Vice President - Chief Financial Officer, Secretary and Treasurer |
| 61 |
| 1995 |
Patricia Quinones (5) |
| Senior Vice President - Chief Administrative Officer |
| 54 |
| 2004 |
James D. Johnson (6) |
| Senior Vice President - Chief Marketing Officer |
| 49 |
| 2015 |
Bassey Yau (7) |
| Vice President - Corporate Controller, Assistant Secretary and Assistant Treasurer |
| 59 |
| 2004 |
________________________
(1) | Appointed Chairman in 1990; has been employed by the Company for 61 years and served as the President from 1982 until 2014 and Chief Executive Officer since 1988. | |
(2) | Appointed President in 2014; has been employed by the Company for 32 years and has served in Production Control, as Contract Administrator, as Manager of Marketing Services, as General Manager of the Torrance Division, as Corporate Executive Vice President and currently as President. | |
(3) | Appointed in 2004; has been employed by the Company for 29 years and has served in a variety of manufacturing, safety, and environmental positions, Vice President - General Manager, Conway Division, and currently as Chief Operating Officer. | |
(4) | Appointed in 1995; has been employed by the Company for 27 years and has served as the Corporate Controller, and currently as Senior Vice President of Finance, Secretary and Treasurer. | |
(5) | Appointed in 2004; has been employed by the Company for 26 years in a variety customer and marketing service positions, Vice President of Logistics, Marketing Services and Information Technology and currently as Chief Administrative Officer. | |
(6) | Appointed in 2015 as Senior Vice President of Marketing & Business Development, currently as Chief Marketing Officer. | |
(7) | Appointed in 2004; has been employed by the Company for 21 years and has served as Corporate Controller, and currently as Vice President Accounting, Corporate Controller, Assistant Secretary and Assistant Treasurer. | |
None of the Company's executive officers have employment contracts.
Available Information
Virco files annual, quarterly and current reports, proxy statements and other information with the Securities and Exchange Commission ("SEC"). Stockholders may read and copy this information at the SEC's Public Reference Room at 100 F Street, N.E., Washington, D.C. 20549. Information on the operation of the Public Reference Room may be obtained by calling the SEC at 1-800-SEC-0330. Stockholders may also obtain copies of this information by mail from the Public Reference Room at the address set forth above, at prescribed rates.
The SEC also maintains an Internet website that contains reports, proxy statements and other information about issuers like Virco who file electronically with the SEC. The address of that site is www.sec.gov.
In addition, Virco makes available to its stockholders, free of charge through its Internet website, its annual reports on Form 10-K, quarterly reports on Form 10-Q, current reports on Form 8-K, and amendments to those reports filed, or furnished pursuant to, Section 13(a) or 15(d) of the Securities Exchange Act of 1934 (the "Exchange Act"), as soon as reasonably practicable after Virco electronically files such material with, or furnishes it to, the SEC. The address of that site is www.virco.com.
Item 1A. Risk Factors
The following risk factors and other information included in this Annual Report on Form 10-K should be carefully considered. The risks and uncertainties described below are not the only ones we face. Additional risks and uncertainties not presently known to us or that we presently deem less significant may also adversely affect our business, operating results, cash flows, and financial condition. If any of the following risks actually occur, our business, operating results, cash flows and financial condition could be materially adversely affected.
13
Our product sales are significantly affected by education funding, which is a function of tax revenues and general economic conditions. If the economy weakens, funding for education may fail to improve or decrease, which would adversely affect our business and results of operations.
Our sales are significantly impacted by the level of education funding primarily in North America, which, in turn is a function of the general economic environment. In a weak economy, like the one that started in 2009, state and local tax revenues declined, restricting funding for K-12 education spending which typically leads to a decrease in demand for school furniture. Sustained depressions in the per-student funding levels provided for in-state and local budgets in the future could have a materially adverse impact on our business, financial condition and results of operations as they have in the past.
In addition, geopolitical uncertainties, terrorist attacks, acts of war, natural disasters, increases in energy and other costs or combinations of such factors and other factors that are outside of our control could at any time have a significant effect on the economy, which in turn would affect government revenues and allocations of government spending. The occurrence of any of these or similar events in the future could cause demand for our products to decline or competitive pricing pressures to increase, either or both of which would adversely affect our business, operating results, cash flows and financial condition.
Gaps in state budgets may adversely affect our revenue and results of operations.
Virtually all states are required to balance their operating budgets either on an annual or bi-annual basis. Unlike the federal government, states cannot maintain services during an economic downturn by running a deficit. Without federal economic assistance, states that have not fully recovered from the 2008-2009 recession will need to address remaining shortfalls with a combination of spending cuts and/or tax increases. Many states are adversely impacted by underfunded retirement and health insurance obligations. Tax revenues and other state funds may be allocated to underfunded benefit obligations instead of education. If any states cut spending for education to address such budgetary shortfalls, our revenue and results of operations will be adversely affected.
Reduced levels of spending on education may significantly impact spending on furniture and increase price competition in the furniture market. If price competition increases, we may need to reduce our prices to build or maintain our market share, which in turn could lower our profit margins.
The educational furniture market is characterized by price competition, as many sales occur on a bid basis and are based on demand related to educational funding available to schools. When funding for education declines, schools typically reduce spending on all budget line items prior to reducing teacher and administrator salaries and benefits. This in turn can result in reduced demand for school furniture, which in turn can intensify price competition in our industry. This price competition could impact our ability to implement price increases or, in some cases, such as during an industry downturn, maintain prices. In addition, when market conditions warrant, we may need to reduce prices to build or maintain our market share. If we are unable to increase or maintain prices for our products, our profit margins could decline. Such decline will be compounded to the extent we are unable to maintain or reduce the cost of our products, which may be especially difficult in the current environment given the volatility of the commodities markets.
Our efforts to introduce new products that meet customer requirements may not be successful, which could limit our sales growth or cause our sales to decline.
To keep pace with industry trends, such as changes in education curriculum and increases in the use of technology, and with evolving regulatory and industry requirements, including environmental, health, safety and other standards for the education environment and for product performance, we must periodically introduce new products or modify existing ones. The introduction of new or modification of existing products requires the coordination of the design, manufacturing and marketing of such products, which may be affected by factors beyond our control. The design and engineering of certain of our new products can take a year or more, and further time may be required to achieve customer acceptance. Accordingly, the launch of any particular product may be later or less successful than we originally anticipated. Additionally, our competitors may develop new product designs that achieve a high level of customer acceptance, which could give them a competitive advantage over us in making future sales. Difficulties or delays in introducing new or modified products or lack of customer acceptance of such products could limit our sales growth or cause our sales to decline.
The majority of our sales are generated under annual contracts, which combined with the seasonal nature of our business, may limit our ability to raise prices on a timely basis during a given year in response to increases in costs.
We commit to annual contracts that determine selling prices for goods and services for periods of one year, and occasionally longer. Though the Company has negotiated increased flexibility under many of these contracts that may allow the Company to increase prices on future orders, the Company does not have the ability to raise prices on orders received prior to any announced price increase. Due to the intensely seasonal nature of our business, the Company may receive significant orders
14
during the first and second quarters for delivery in the second and third quarters. With respect to any of the contracts described above, if the costs of providing our products or services increase between the date the orders are received and the shipping date, we will likely not be able to implement corresponding increases in our sales prices for such products or services in order to offset the related increased costs. Significant cost increases in providing either the services or products during a given contract period could therefore lower our profit margins.
We depend on outside suppliers who may be unable to meet our volume and quality requirements, and we may be unable to obtain alternative sources.
We require substantial amounts of raw materials and components to manufacture our products, which we purchase from outside sources. Raw materials comprised our single largest total cost. Contracts with most of our suppliers are short-term. These suppliers may not continue to provide raw materials and components to us at attractive prices, or at all, and we may not be able to obtain the raw materials we need in the future from these or other providers on the scale and within the time frames we require. In a deteriorating economic environment, many of the Company's suppliers may experience difficulty obtaining financing and may go out of business. The Company may have difficulty replacing these suppliers, especially if the supplier fails as the Company is entering the seasonal summer shipping season. Moreover, we do not carry significant inventories of raw materials, components or finished goods that could mitigate an interruption or delay in the availability of raw materials and components. In addition, because we purchase components from international sources, primarily China, we are subject to fluctuations in currency exchange rates as well as the impact of natural disasters, war and other factors that may disrupt the transportation systems, ports, or shipping lines used by our suppliers, and other uncontrollable factors such as changes in foreign regulation or economic conditions. Any failure to obtain raw materials and components on a timely basis, or any significant delays or interruptions in the supply of raw materials, could prevent us from being able to manufacture products ordered by our customers in a timely fashion, which could have a negative impact on our reputation and could cause our sales to decline.
Increases in basic commodity, raw material and component costs could adversely affect our profitability.
Fluctuations in the price, availability and quality of the commodities, raw materials and components used in manufacturing our products could have an adverse effect on our costs of sales, profitability and our ability to meet customers' demand. The price of commodities, raw materials and components, including steel and plastics, our largest raw material categories, have been volatile in prior years, and the cost, quality and availability of such commodities have been significantly affected in recent years by, among other things, changes in global supply and demand, changes in laws and regulations (including tariffs and duties), changes in exchange rates and worldwide price levels, natural disasters, labor disputes, terrorism and political unrest or instability. These factors could lead to further price increases or supply interruptions in the future. As discussed above, in the short term, rapid changes in raw material costs can be very difficult for us to offset with price increases because, in the case of many of our contracts, we have committed to selling prices for goods and services for periods of one year, and occasionally longer. Our profit margins could be adversely affected if commodity, raw material and component costs remain high or escalate further, and, we are unable to pass along a portion of the higher costs to our customers.
The Company incurred increased steel and plastic costs in the second half of 2017, but the increase did not occur until after the Company had sourced the majority of its steel for the summer delivery season. In 2018, the cost of commodities increased during the year. Subsequent to year-end, tariffs on imported steel announced by President Trump have created volatility in the price of steel and other imported components, and the price of steel has increased significantly during 2018. The Company has increased list prices for 2019 in effort recover the increased material costs.
We are affected by the cost of petroleum-based products, and increases in petroleum prices could reduce our margins and profits.
The profitability of our operations is sensitive to the cost of fuel, which materially affects our transportation costs, the costs of petroleum-based materials (like plastics), and the costs of energy (including electricity and natural gas) used in operating our manufacturing facilities. Petroleum prices have fluctuated significantly in recent years and are expected to rise from current historical lows. Prices and availability of petroleum products are subject to political, economic and market factors that are generally outside our control. Political events in petroleum-producing regions as well as hurricanes and other weather-related events may cause petroleum prices to increase. If such prices increase, our transportation costs may be adversely affected in the form of increased operation costs for our fleet and surcharges on freight paid to third-party carriers. If our transportation costs increase, and/or the price of petroleum-based products and cost of operating our manufacturing facilities increase, these increases could have a negative impact on our gross margins and profitability.
Cost and availability of third party freight can adversely affect profitability and results of operations.
15
The majority of our sales are FOB destination, and include freight from Virco's facilities to the customer location. Virco depends upon third party carriers for more than 90% of customer deliveries. Subsequent to 2009, many carriers went out of business or reduced the size of their fleets due to economic conditions, and have not increased the fleets as the economy has improved. Recent regulation and more stringent enforcement of federal regulations governing the transportation industry (especially regarding drivers) have adversely impacted the cost and availability of transportation services. Further, there may be a lack of available trained and licensed drivers, which may reduce the availability of transportation services. Inability to obtain adequate third party freight on a timely basis during the summer delivery season can adversely affect cost to deliver products to customers and the level of customer service, which can in turn adversely impact future sales.
The Company imports component parts from international sources (primarily China). Disruptions in the cost or availability of ocean freight or disruptions in port operations, may adversely impact the Company's ability to obtain adequate component parts to support sales, particularly in the busy summer season.
Approximately 50% of our sales are priced through one contract, under which we are the exclusive supplier of classroom furniture.
A nationwide contract/price list, which allows schools and school districts to purchase furniture without bidding, accounts for the pricing of a significant portion of our sales. This contract/price list is sponsored by a nationwide purchasing organization that does not purchase products from the Company. By providing a public bid specification and authorization service to publicly-funded agencies, the organization's contract/price list enables such agencies to make authorized expenditures of taxpayer funds. For all sales under this contract/price list, Virco has a direct selling relationship with the purchaser, whether it is a school, a district, or another publicly-funded agency. In addition, Virco can ship directly to the purchaser; perform inside delivery services at the purchaser's location; and finally bill directly to, and collect from, the purchaser. Although Virco sells direct to hundreds of individual schools and school districts, and these schools and school districts can purchase our products and services under several bids and contracts available to them, approximately 58% of Virco's sales in 2018 and 56% of Virco's sales in 2017 were priced under this nationwide contract/price list. In 2009 the Company was awarded a three-year contract and three one-year extensions with this purchasing organization extending through 2015. In 2015, the Company was awarded a three-year extension through December 31, 2017 with two one-year extensions through December 31, 2019. In November 2017, the Company was awarded a five-year contract extending through December 2022 along with two two-year extensions through 2026. If Virco were to lose its exclusive supplier status under this contract/price list, and other manufacturers were allowed to sell under this contract/price list, it could cause Virco's sales, or growth in sales, to decline.
We operate in a seasonal business, and require significant amounts of working capital through our existing credit facility to fund acquisitions of inventory, fund expenses for freight and classroom delivery, and finance receivables during the summer delivery season. Restrictions imposed by the terms of our existing credit facility may limit our operating and financial flexibility. In addition, there can be no assurance that the Company will meet the requirements of its financial covenants on an ongoing basis or that should it fail to meet such covenants in the future, the agent and lender under the Credit Agreement will agree to waivers or amendments with respect thereto.
Our credit facility, among other things, largely prevents us from incurring any additional indebtedness, limits capital expenditures, limits dividends and stock repurchases, and provides for seasonal variations in the maximum borrowing amount, including a reduced maximum level of borrowing during the fourth fiscal quarter. Our credit facility also provides for periodic financial covenants, which currently include a minimum earnings before interest, tax, depreciation and amortization (EBITDA) and a minimum fixed charge coverage ratio requirement. As a result of the foregoing, our operational and financial flexibility may be limited, which may prevent us from engaging in transactions that might further our growth strategy or otherwise be considered beneficial to us.
Under our credit facility, substantially all of our accounts receivable is automatically and promptly swept to repay amounts outstanding under the credit facility upon our receipt. Due to this automatic liquidating nature, if we breach any covenant, violate any representation or warranty or suffer any deterioration in our ability to borrow pursuant to the borrowing base calculation contained in the credit facility, we may not have access to cash liquidity unless provided by the lender in its discretion. If the indebtedness under our credit facility were to be accelerated, we cannot be certain that we will have sufficient funds available to pay such indebtedness or that we will have the ability to refinance the accelerated indebtedness on terms favorable to us or at all. Any such acceleration could also result in a foreclosure on all or substantially all of our assets, which would have a negative impact on the value of our common stock and jeopardize our ability to continue as a going concern. In addition, certain of the covenants and representations and warranties set forth in our credit facility contain limited or no materiality thresholds, and many of the representations and warranties must be true and correct in all material respects upon each borrowing, which we expect to occur on an ongoing basis. There can be no assurance that we will be able to comply with all such covenants and be able to continue to make such representations and warranties on an ongoing basis. There can be no assurance that the Company will meet the requirements of its financial covenants on an ongoing basis or that, should it fail to
16
meet such covenants, the Agent and Lender under its Credit Agreement will agree to waivers or amendments with respect thereto. If we breach any of our financial covenants without receiving a corresponding waiver or amendment, the Agent and Lender may accelerate our credit facility and impose default interest and other fees, any of which could have a material adverse effect on our financial condition and results of operations.
We may not be able to renew our credit facility on favorable terms, or at all, which would adversely affect our results of operations.
We have historically relied on third-party bank financing to meet our seasonal cash flow requirements. Our current credit facility was renewed subsequent to year end, and extends through March 19, 2023. On an annual basis, we prepare a lender approved forecast of seasonal working capital requirements and use borrowings under our credit facility with PNC Bank to help meet these seasonal cash flow and working capital requirements. Disruptions in the U.S. credit markets have caused the interest rate on prospective debt financing to widen considerably and have made financing terms for borrowers less attractive, and in certain cases have resulted in the unavailability of certain types of debt financing. Uncertainty in the credit markets may negatively impact our ability to obtain approval of our annual forecast, changes in our forecast or renew our credit facility upon its maturity in 2023 on favorable terms or at all. If we are unable to access or renew our credit facility on favorable terms (including available borrowing line and the rate of interest charged thereunder), or at all, our ability to fund our operations would be impaired, which would have a material adverse effect on our results of operations.
If management does not accurately forecast the Company's requirements for the peak summer season, the Company's results of operations could be adversely affected.
The Company's business is highly seasonal and requires significant working capital in anticipation of and during the peak summer season. This requires management to make estimates and judgments with respect to the Company's working capital requirements during, and in anticipation of, the peak summer season. Management expends a significant amount of time in the fourth quarter of the prior year and the first quarter of each year developing a stocking plan and estimating the number of temporary summer employees, the amount of raw materials, and the types of components and products that will be required during the peak season. If management does not accurately forecast the Company's requirements, the Company's results of operations could be adversely affected. For example, if management underestimates any of these requirements, Virco's ability to meet customer orders in a timely manner or to provide adequate customer service may be diminished. If management overestimates any of these requirements, the Company may be required to absorb higher storage, labor and related costs, each of which may negatively affect the Company's results of operations.
We may require additional capital in the future, which may not be available or may be available only on unfavorable terms.
Our capital requirements depend on many factors, including capital improvements, tooling and new product development. To the extent that our existing capital is insufficient to meet these requirements and cover any losses, we may need to raise additional funds through financings or curtail our growth and reduce our assets. Any equity or debt financing, if available at all, may be on terms that are not favorable to us. Equity financings could result in dilution to our stockholders, and the securities may have rights, preferences and privileges that are senior to those of our common stock. If our need for capital arises because of significant losses, the occurrence of these losses may make it more difficult for us to raise the necessary capital.
An inability to protect our intellectual property could have a significant impact on our business.
We attempt to protect our intellectual property rights through a combination of patent, trademark, copyright and trade secret laws. Our ability to compete effectively with our competitors depends, to a significant extent, on our ability to maintain the proprietary nature of our intellectual property. The degree of protection offered by the claims of the various patents, trademarks and service marks may not be broad enough to provide significant proprietary protection or competitive advantages to us, and patents, trademarks or service marks may not be issued on our pending or contemplated applications. In addition, not all of our products are covered by patents. It is also possible that our patents, trademarks and service marks may be challenged, invalidated, cancelled, narrowed or circumvented. If we are unable to maintain the proprietary nature of our intellectual property with respect to our significant current or proposed products, our competitors may be able to sell copies of our products, which could adversely affect our ability to sell our original products and could also result in competitive pricing pressures.
If third parties claim that we infringe upon their intellectual property rights, we may incur liability and costs and may have to redesign or discontinue an infringing product.
17
We face the risk of claims that we have infringed third parties' intellectual property rights. Companies operating in the furniture industry routinely seek protection of the intellectual property for their product designs, and our principal competitors may have large intellectual property portfolios. Our efforts to identify and avoid infringing third parties' intellectual property rights may not be successful. Any claims of intellectual property infringement, even those without merit, could (i) be expensive and time-consuming to defend; (ii) cause us to cease making, licensing or using products that incorporate the challenged intellectual property; (iii) require us to redesign, reengineer, or rebrand our products or packaging, if feasible; or (iv) require us to enter into royalty or licensing agreements in order to obtain the right to use a third party's intellectual property. Such claims could have a negative impact on our sales and results of operations.
We could be required to incur substantial costs to comply with environmental and other legal requirements. Violations of, and liabilities under, these laws and regulations may increase our costs or require us to change our business practices.
Our past and present ownership and operation of manufacturing plants are subject to extensive and changing federal, state, and local environmental laws and regulations, including those relating to discharges to air, water and land, the handling and disposal of solid and hazardous waste and the cleanup of properties affected by hazardous substances. As a result, we are involved from time to time in administrative and judicial proceedings and inquiries relating to environmental matters and could become subject to fines or penalties related thereto. We cannot predict what environmental legislation or regulations will be enacted in the future, how existing or future laws or regulations will be administered or interpreted or what environmental conditions may be found to exist. Compliance with more stringent laws or regulations, or stricter interpretation of existing laws, may require additional expenditures by us, some of which may be material. If new environmental laws and regulations are introduced and enforced domestically, but not implemented or enforced internationally, we will operate at a competitive disadvantage compared to competitors who source product primarily from international sources. In addition, in the past we have been identified as a potentially responsible party pursuant to the Comprehensive Environmental Response Compensation and Liability Act ("CERCLA") for remediation costs associated with waste disposal sites previously used by us. In general, CERCLA can impose liability for costs to investigate and remediate contamination without regard to fault or the legality of disposal and, under certain circumstances, liability may be joint and several, resulting in one party being held responsible for the entire obligation. Liability may also include damages for harm to natural resources. We may also be subject to claims for personal injury or contribution relating to CERCLA sites. We reserve amounts for such matters when expenditures are probable and reasonably estimable.
In addition to environmental laws and regulations affecting our manufacturing activities, the Company is subject to laws and regulations related to consumer product regulation. The Company sells products that are subject to the Consumer Product Safety Improvement Act of 2008 and the California Air Resources Board rule implemented on January 1, 2009, concerning formaldehyde emissions from composite wood products.
The Patient Protection and Affordable Care Act may increase the cost of providing medical benefits to employees, which could have a significant adverse impact on our results of operations.
We currently provide medical, dental, vision, and life insurance benefits to substantially all full-time employees. The Patient Protection and Affordable Care Act, or modifications to this Act, and state legislation in the states in which we operate, may cause the cost of providing medical insurance to our employees to increase. We may not be able to pass the cost of increased medical costs to our customers, which could cause our costs of sales to increase and our gross profit to decline or cause our losses to increase.
We may not be able to manage our business effectively if we are unable to retain our experienced management team or recruit other key personnel.
The success of our operations is highly dependent upon our ability to attract and retain qualified employees and upon the ability of our senior management and other key employees to implement our business strategy. We believe there are only a limited number of qualified executives in the industry in which we compete. The loss of the services of key members of our management team could seriously harm our efforts to successfully implement our business strategy.
We are subject to potential labor disruptions, which could have a significant impact on our business.
None of our work force is represented by unions, and while we believe that we have good relations with our work force, we may experience work stoppages or other labor problems in the future. Any prolonged work stoppage could have an adverse effect on our reputation, our vendor relations and our customers.
Our insurance coverage may not adequately cover for any product liability claims.
18
We maintain product liability and other insurance coverage that we believe to be generally in accordance with industry practices. Our insurance coverage may not be adequate to protect us fully against substantial claims and costs that may arise from product defects, particularly if we have a large number of defective products that we must repair, retrofit, replace or recall.
Volatility in the equity markets or interest rates could substantially increase our pension costs and have a negative impact on our operating results.
We sponsor one qualified defined benefit pension plan, the Virco Employee Retirement Plan (the "Employee Plan"), and two nonqualified pension plans. The difference between plan obligations and assets, or the funded status of the Employee Plan, significantly affects net periodic benefit costs of our Employee Plan and our ongoing funding requirements with respect to the Employee Plan. The Employee Plan is funded with trust assets invested in a diversified portfolio of debt and equity securities and other investments. Among other factors, changes in interest rates, investment returns and the market value of plan assets can (i) affect the level of plan funding; (ii) cause volatility in the net periodic pension cost; and (iii) increase our future contribution requirements. Because the current economic environment is characterized by declining investment returns and historically low interest rates, we may be required to make additional cash contributions to the Employee Plan and recognize further increases in our net pension cost to satisfy our funding requirements. A significant decrease in investment returns or the market value of plan assets or a significant decrease in interest rates could increase our net periodic pension costs and adversely affect our results of operations.
Holders of approximately 35% of the shares of our stock have entered into an agreement restricting the sale of the stock.
Certain shares of the Company's common stock received by the holders thereof as gifts from Julian A. Virtue, including shares received in subsequent stock dividends, are subject to an agreement that restricts the sale or transfer of those shares. As a result of the share ownership and representation on the board and in management, the parties to the agreement have significant influence on affairs and actions of the Company, including matters requiring stockholder approval such as the election of directors and approval of significant corporate transactions. In addition, these transfer restrictions and concentration of ownership could have the effect of impeding an acquisition of the Company.
Our corporate documents and Delaware law contain provisions that could discourage, delay or prevent a change in control of our company.
Provisions in our certificate of incorporation and our amended and restated bylaws may discourage, delay or prevent a merger or acquisition involving us that our stockholders may consider favorable. For example, our certificate of incorporation currently provides for a staggered board of directors, whereby directors serve for three-year terms, with approximately one-third of the directors coming up for reelection each year. Having a staggered board will make it more difficult for a third party to obtain control of our board of directors through a proxy contest, which may be a necessary step in an acquisition of us that is not favored by our board of directors.
We are also subject to the anti-takeover provisions of Section 203 of the Delaware General Corporation Law. Under these provisions, if anyone becomes an "interested stockholder," we may not enter into a "business combination" with that person for three years without special approval, which could discourage a third party from making a takeover offer and could delay or prevent a change of control. For purposes of Section 203, "interested stockholder" means, generally, someone owning 15% or more of our outstanding voting stock or an affiliate of ours that owned 15% or more of our outstanding voting stock during the past three years, subject to certain exceptions as described in Section 203.
Our stock price has historically been volatile, and investors in our common stock could suffer a decline in value.
There has been significant volatility in the market price and trading volume of equity securities, which may be unrelated to the financial performance of the companies issuing the securities. The limited "float" of shares available for purchase or sale of Virco stock can magnify this volatility. These broad market fluctuations may negatively affect the market price of our common stock. Some specific factors that may have a significant effect on our common stock market price include:
• | actual or anticipated fluctuations in our operating results or future prospects; |
• | our announcements or our competitors' announcements of new products; |
• | the public's reaction to our press releases, our other public announcements and our filings with the SEC; |
• | strategic actions by us or our competitors, such as acquisitions or restructurings; |
19
• | new laws or regulations or new interpretations of existing laws or regulations applicable to our business; |
• | changes in accounting standards, policies, guidance, interpretations or principles; |
• | changes in our growth rates or our competitors' growth rates; |
• | our inability to raise additional capital; |
• | conditions of the school furniture industry as a result of changes in funding or general economic conditions, including those resulting from war, incidents of terrorism and responses to such events; and |
• | changes in stock market analyst recommendations or earnings estimates regarding our common stock, other comparable companies or the education furniture industry generally. |
Item 1B. Unresolved Staff Comments
None.
Item 2. Properties
Torrance, California
Virco leases a 560,000 sq. ft. office, manufacturing and warehousing facility located on 23.5 acres of land in Torrance, California. This facility is occupied under a lease expiring on April 30, 2025. This facility also includes the corporate headquarters, the West Coast showroom, and all West Coast distribution operations.
Conway, Arkansas
The Company owns 100 acres of land in Conway, Arkansas, containing 1,200,000 sq. ft. of manufacturing, warehousing, and office space. This facility - which is equipped with high-density storage systems, features 70 dock doors dedicated to outbound freight, and has substantial yard capacity to store and stage trailers - has enabled the Company to consolidate the warehousing function and implement the Assemble-to-Ship inventory stocking program. Management believes that this facility supports Virco's ability to handle increased sales during the peak delivery season and enhances the efficiency with which orders are filled. This facility and the underlying real estate, along with the rest of the Company's assets, secure the Company's obligations under its credit facility.
In addition to the complex described above, the Company operates two other facilities in Conway, Arkansas. The first is a 375,000 sq. ft. fabrication facility that was acquired in 1954, and expanded and modernized over subsequent years. The Company manufactures fabricated steel components, chrome plates, and fabricates injection-molded plastic components at this facility. These components are transferred to other facilities for assembly into finished goods. The second is a 175,000 sq. ft. manufacturing facility that is used to fabricate and store compression-molded components. This building was occupied under a series of leases for approximately 20 years. In August 2017, the Company purchased this building.
Item 3. Legal Proceedings
Virco is involved in legal proceedings from time to time in the ordinary course of business. In the opinion of the Company, such legal proceedings are not material in amount or management expects that the Company will be successful on the merits in pending cases against the Company or any liabilities resulting from such cases will be substantially covered by insurance. While it is impossible to estimate with certainty the ultimate legal and financial liability with respect to these suits and claims, management believes that the aggregate amount of such liabilities will not be material to the results of operations, financial position, or cash flows of the Company.
Item 4. Mine Safety Disclosures
Not applicable.
20
PART II
Item 5. Market for Registrant's Common Equity, Related Stockholder Matters and Issuer Purchases of Equity Securities
The NASDAQ [Global Market] is the principal market on which Virco Mfg. Corporation (VIRC) stock is traded. As of April 2, 2018 , there were approximately 185 registered stockholders according to the Company's transfer agent records. As of such date, there were approximately 1,306 beneficial stockholders.
Dividend Policy
Historically it has been the board of directors' policy to periodically review the payment of cash and stock dividends in light of the Company's earnings and liquidity. Pursuant to the terms of the Company's current line of credit with PNC Bank, which was entered into on December 22, 2011, the Company was prohibited from paying dividends. On April 4, 2016, the Company entered into Amendment #12 to the PNC line of credit. This amendment, among other modifications, allows the Company to pay dividends or conduct stock repurchases in an amount up to $1.3 million per year. In March 2018, the Company entered into Amendment #17 to the PNC line of credit. This amendment, among other modifications, allows the Company to pay dividends or conduct stock repurchases in an amount up to $2.0 million per year. In December 2017, the Company declared a quarterly cash dividend of $0.015 per share, payable January 10, 2018 to shareholders of record as of December 28, 2017. In March 2018, the Company declared a quarterly cash dividend of $0.015 per share, payable April 10, 2018 to shareholders of record as of March 23, 2018.
Quarterly Stock Market Information for fiscal year ended,
| Common Stock Range | ||||||
| 1/31/2018 |
| 1/31/2017 | ||||
| High |
| Low |
| High |
| Low |
1st Quarter | $4.70 |
| $3.55 |
| $3.50 |
| $2.99 |
2nd Quarter | 5.95 |
| 3.92 |
| 4.94 |
| 3.15 |
3rd Quarter | 6.05 |
| 4.85 |
| 4.79 |
| 4.01 |
4th Quarter | 5.88 |
| 4.50 |
| 4.70 |
| 3.85 |
Stock Repurchases
The Company did not repurchase any shares of its stock during 2018.
Stock Performance Graph
The graph set forth below compares the five-year cumulative total stockholder return of the Company's common stock with the cumulative total stockholder return of (i) an industry peer group index, and (ii) the NASDAQ Market Index. The graph assumes $100 was invested on February 1, 2013, in the Company's common stock, the NASDAQ Market Index and the companies in the peer group and assumes the reinvestment of dividends, if any.
21
COMPARISON OF 5-YEAR CUMULATIVE TOTAL RETURN
AMONG VIRCO MFG. CORPORATION, NASDAQ MARKET INDEX
AND MORNINGSTAR INDEX
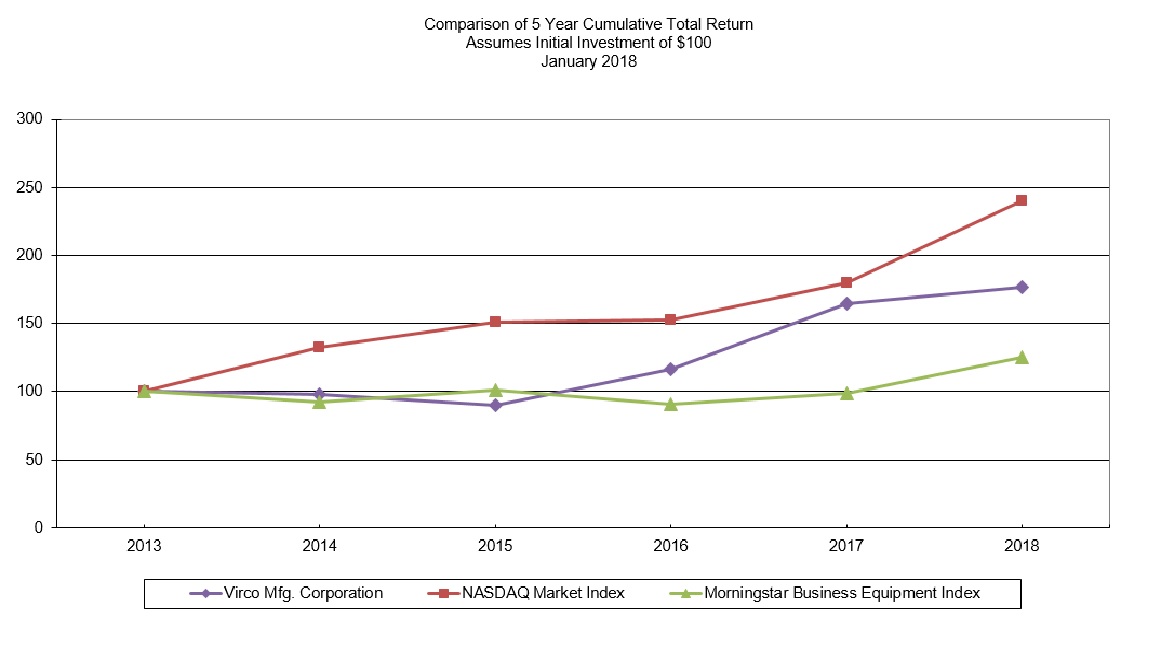
| Period Ending | ||||||||||||||||||||||
Company/Market/Peer Group | 1/31/2013 |
| 1/31/2014 |
| 1/31/2015 |
| 1/31/2016 |
| 1/31/2017 |
| 1/31/2018 | ||||||||||||
Virco Mfg. Corporation | $ | 100.00 | |
| $ | 98.13 | |
| $ | 90.26 | |
| $ | 116.10 | |
| $ | 164.79 | |
| $ | 176.79 | |
NASDAQ Market Index | $ | 100.00 | |
| $ | 132.33 | |
| $ | 151.25 | |
| $ | 152.32 | |
| $ | 179.88 | |
| $ | 240.02 | |
Morningstar Business Equipment | $ | 100.00 | |
| $ | 92.14 | |
| $ | 101.55 | |
| $ | 90.43 | |
| $ | 99.11 | |
| $ | 125.47 | |
The current composition of Morningstar Business Equipment Index is as follows: Canon Inc., Avery Dennison Corp., Ricoh Co Ltd., Brother Industries Ltd., Konica Minolta Inc., Pitney Bowes Inc., Herman Miller Inc., VeriFone Systems Inc., HNI Corp., Steelcase Inc., ACCO Brands Corp., Knoll Inc., Neopost SA., Kimball International Inc., Ennis Inc., Veritiv Corp., Essendant Inc., Takano Co Ltd., Kewaunee Scientific Corp., Virco Manufacturing Corp., On Track Innovations Ltd., Zinzino Holding AB., CPI Card Group Inc., Inscape Corp., Odawara Auto-Machine Mfg Co Ltd., Stargroup Ltd., Gunther International Ltd., Reconditioned Systems Inc., Teleconnect Inc., BoxScore Brands Inc., 3D MakerJet Inc., Koala Corp., Marmion Industries Corp., Coupon Express Inc., Global Payment Technologies Inc., American Locker Group Inc., Onyx Service & Solutions Inc., Pure Broadcast Corp., Astro Communications Inc., Addmaster Corp., Roboserver Systems Corp., Banneker Inc.
Item 6. Selected Financial Data
The following tables set forth selected historical consolidated financial data for the periods indicated. The following data should be read in conjunction with Item 8, Financial Statements and Supplementary Data, and with Item 7, Management's Discussion and Analysis of Financial Condition and Results of Operations of this Annual Report on Form 10K.
22
Five Year Summary of Selected Financial Data
In thousands, except per share data | 2018 |
| 2017 |
| 2016 |
| 2015 |
| 2014 | ||||||||||
Summary of income (operations) |
|
|
|
|
|
|
|
|
| ||||||||||
Net sales | $ | 189,287 | |
| $ | 173,417 | |
| $ | 168,595 | |
| $ | 164,052 | |
| $ | 155,042 | |
Net income (loss) | $ | (3,209 | ) |
| $ | 22,760 | |
| $ | 4,549 | |
| $ | 849 | |
| $ | (1,730 | ) |
Net income (loss) per share data * |
|
|
|
|
|
|
|
|
| ||||||||||
Basic | $ | (0.21 | ) |
| $ | 1.51 | |
| $ | 0.31 | |
| $ | 0.06 | |
| $ | (0.12 | ) |
Assuming dilution | (0.21 | ) |
| 1.49 | |
| 0.30 | |
| 0.06 | |
| (0.12 | ) | |||||
__________________________
* | Net loss per share for fiscal years 2018, 2014 was calculated based on basic shares outstanding due to the anti-dilutive effect on the inclusion of common stock equivalent shares. |
Other Financial Data
In thousands, except per share data | 2018 |
| 2017 |
| 2016 |
| 2015 |
| 2014 | ||||||||||
Total assets | $ | 116,623 | |
| $ | 108,187 | |
| $ | 89,435 | |
| $ | 81,811 | |
| $ | 83,344 | |
Working capital | $ | 27,990 | |
| $ | 26,908 | |
| $ | 23,994 | |
| $ | 17,566 | |
| $ | 16,983 | |
Current ratio | 2.0/1 | |
| 2.2/1 | |
| 2.1/1 | |
| 1.8/1 | |
| 1.7/1 | | |||||
Total long-term obligations | $ | 30,188 | |
| $ | 27,248 | |
| $ | 33,344 | |
| $ | 37,833 | |
| $ | 33,083 | |
Stockholders' equity | $ | 58,712 | |
| $ | 59,354 | |
| $ | 33,313 | |
| $ | 22,573 | |
| $ | 27,605 | |
Shares outstanding at year-end | 15,357 | |
| 15,180 | |
| 14,998 | |
| 14,853 | |
| 14,718 | | |||||
Stockholders' equity per share | $ | 3.82 | |
| $ | 3.91 | |
| $ | 2.22 | |
| $ | 1.52 | |
| $ | 1.88 | |
_______________________
Item 7. Management's Discussion and Analysis of Financial Condition and Results of Operations
Executive Overview
Management's strategy is to position Virco as the overall value supplier of educational furniture and equipment. The markets that Virco serves include the education market (the Company's primary market), which is made up of public and private schools (preschool through 12th grade), junior and community colleges, four-year colleges and universities; and trade, technical and vocational schools. Virco also serves convention centers and arenas; the hospitality industry, with respect to their banquet and meeting facilities; government facilities at the federal, state, county and municipal levels; and places of worship. In addition, the Company sells to wholesalers, distributors, retailers, catalog retailers, and internet retailers that serve these same markets. These institutions are frequently characterized by extreme seasonality and/or a bid-based purchasing function. The Company's business model, which is designed to support this strategy, includes the development of several competencies to enable superior service to the markets in which Virco competes. An important element of Virco's business model is the Company's emphasis on developing and maintaining key manufacturing, warehousing, distribution, delivery, project management, and service capabilities. The Company has developed a comprehensive product offering for the furniture, fixtures and equipment needs of the K-12 education market, enabling a school to procure all of its furniture, fixtures and equipment ("FF&E") requirements from one source.
Virco's product offering consists primarily of items manufactured by Virco, complemented with products sourced from other furniture manufacturers. Our product offerings are continually enhanced with an ongoing new product development program that incorporates internally developed products as well as product lines developed with accomplished designers. Finally, management continues to hone Virco's ability to forecast, finance, manufacture, warehouse, deliver, and install furniture within the relatively narrow delivery window associated with the highly seasonal demand for education sales. In 2018 and 2017, approximately 55% and 54% respectively of the Company's total sales were delivered in June, July, and August with an even higher portion of educational sales delivered in that period. Average weekly shipments during July and August can be as great
23
as six times the level of average weekly shipments in the winter months. Virco's substantial warehouse space allows the Company to build and ship adequate inventories to service this narrow delivery window for the education market.
The market and operating environment for school furniture, fixtures, and equipment has been challenging during the last fifteen years. The Company has seen moderate improvement in its primary market in the last three years, but spending on furniture, fixtures and equipment is well below the level experienced prior to the recession. Schools suffered significant budgetary pressures from 2002 to 2006 following the "dot com" bust and post "9/11" era, followed by a recovery from 2006 - 2007. Following the recession in 2008, the industry suffered from reduced funding and severe budget shortages impacting years from 2010 through 2014.
The budgetary pressures directly impact the demand for the Company's products, as the demand for educational furniture largely depends upon: (1) available funding in a school's general operating fund and (2) the completion of bond-funded projects, which is directly impacted by the amount of bond financing issued to fund new school construction, to renovate older schools, and to fully equip new and renovated schools.
Approximately 80-85% of a school's operating budget is for the salaries and benefits for school teachers and administrators. Increasing costs for medical insurance, combined with pressures from unfunded post-retirement medical and pension obligations reduces funds available for other purposes. In response to these budgetary pressures, schools typically elect to retain teachers and spend less on repairs, maintenance, and replacement furniture, which in turn reduces the demand for, and sales of, the Company's products. In recent years there has been an improvement in state and local tax collections, and the majority of state and local governments have seen their tax receipts return to or exceed the pre-2008 levels.
In response to the 2008 recession, passage of new bond issuances declined, and the related bond funded project completions decreased materially for several years. In recent years the completions of bond funded projects have recovered from the low point subsequent to 2008, but projects remain well below the pre-2008 levels. In the recent election we observed an increase in bond passages. Due to the time requirement to plan and construct a new school or major remodel, there is a time lag frequently ranging from one to three years between bond passage and when the bond funding translates into furniture sales. Sales of product for completions of new schools, additions and renovations improved in the year ended January 31, 2018, and is anticipated to be strong for the year ending January 31, 2019.
While the current operating environment continues to show moderate year-over-year improvement, under-funding of our education system continues to be an on-going concern. A 2016 report from the National Council on School Facilities estimates that on every school day, approximately 50 million students and six million adults use publicly funded K-12 facilities. For state and local governments, spending on these facilities is the largest capital expenditure outside of highways. It is estimated that public schools spend approximately $99 billion per year on maintenance, operations, and capital spending. The study estimates that a desirable level of spending would be $145 billion, leaving an annual shortfall of $46 billion.
The significant budgetary challenges faced by the education industry have had an impact on the Company's business model over this time frame, and have created opportunities as well. In the 1990's, the Company's primary customers were the school business officials at a school district, and deliveries of furniture typically were to a district warehouse. In response to their budgetary challenges, many school districts closed warehouses and reduced janitorial and support staff in order to retain accredited teachers. Selling efforts must now reach school principals and administrative staff in addition to the district business offices. Sales priced under national contracts or buying groups are displacing competitive bids administered by professional purchasing departments. Distribution has become a more meaningful component of our business as most deliveries are to school sites, and often include inside delivery to the classroom. This evolution adds to the seasonal challenges of our business, but also creates opportunities to suppliers that can execute during the short summer delivery window.
The furniture industry in general, including the market for school furniture, has been significantly impacted by low cost competition from manufacturers based in China. Competition from China increased dramatically after admission of China to the World Trade Organization in 2001. Subsequent to this date, many of our domestic manufacturing competitors closed their factories and sourced product from China. To our knowledge, no new factories or significant manufacturing enhancements were constructed to support the school furniture market during this period. Virco pursued a different strategy which exacerbated operating challenges following these events, but now leave us with what we believe to be a significant competitive advantage. During a period of robust education spending during the 1990's, the Company expanded and modernized its manufacturing and distribution facilities at the Torrance, CA and Conway, AR locations. During the last fifteen years, the Company has worked continuously to significantly reduce its cost structure while concurrently expanding its product offering, expanding manufacturing process capabilities and more fully automating its facilities. For example, headcount of permanent employees as of January 31, 2018, was approximately 750 compared to a peak of nearly 2,950 in August 2000. Factory overhead in 2018 declined by more than 50% compared to 2001. The Company accomplished this without closing a factory and while continuing to add new production processes, including flat metal forming, and other capabilities to support its
24
ambitious product development program. Our domestic fabrication allowed the Company to develop significant product variety, color choices, and custom products that are very difficult to replicate with a supply chain extending to China. Finally, many education furniture products are bulky, with a large cube relative to the selling price. The cost of ocean freight from overseas for these bulky items offsets the cost advantages for overseas production.
The Company's operating results can be impacted significantly by cost and volatility of commodities, especially steel, plastic, wood, and energy. Because a majority of the Company's sales are generated under annual contracts in which the Company has limited ability to raise the price of its products during the term of the contract, if the costs of the Company's raw materials increase suddenly or unexpectedly, the Company cannot be certain that it will be able to implement corresponding increases in its sales prices in order to offset such increased costs. The Company moderates this exposure by building significant quantities of finished goods and component parts during the first and second quarters. Commodity prices for raw materials declined modestly in the year ended January 31, 2016. In the year ended January 31, 2017 commodity costs, particularly steel, increased significantly but the Company had already sourced and produced the majority of the product delivered during the summer. During the year-ended January 31, 2018 commodity costs increased throughout the year, but without volatile spikes. The majority of Virco's sales include freight to the customer facility, and the cost or availability of transportation equipment can adversely impact both profitability and customer service. Significant cost increases in manufacturing or distributing products during a given contract period can adversely impact operating results and have done so during prior years. The Company typically benefits from any decreases in raw material or distribution costs under the contracts described above.
During the year ending January 31, 2019, the Company anticipates continued uncertainty and volatility in commodity costs, particularly with respect to certain raw materials, transportation, and energy. In 2017, the cost of steel increased significantly, but the increase did not occur until after the Company had sourced the majority of its steel for the summer delivery season. In 2018, the cost of commodities increased during the year. Subsequent to year-end, tariffs on imported steel announced by President Trump have created volatility in the price of steel and other imported components, and the price of steel has increased significantly during 2018.
While the Company anticipates challenging economic conditions to continue to impact its core customer base in the near term, there are certain underlying demographics, customer responses, and changes in the competitive landscape that provide opportunities. First, the underlying demographics of the student population are stable compared to the volatility of school budgets, and the related level of furniture and equipment purchases. This volatility is attributable to the financial health of the school systems. Virco management believes that there is a pent-up demand for quality school furniture (though it is unclear when and to what extent that pent-up demand will be converted into a meaningful increase in purchases). Second, management believes that parents and voters will make quality education an ongoing priority for future government spending. Third, many schools have responded to the budget strains by reducing their support infrastructure. This change provides opportunities to provide services to schools, such as project management for new or renovated schools, delivery to individual school sites rather than truckload deliveries to central warehouses, and delivery of furniture into classrooms. Moreover, this change offers opportunities for Virco to promote its complete product assortment which allows one-stop shopping as opposed to sourcing furniture needs from a variety of suppliers. Fourth, many suppliers previously shut down or dramatically curtailed their domestic manufacturing capabilities, making it difficult for competitors to adapt to dynamic fluctuations in demand or provide custom colors or finishes during a narrow seasonal summer delivery window when they are reliant upon a supply chain extending to Asia or elsewhere. Meanwhile, Virco has continued to and invest in automation at its domestic manufacturing facilities, adding flat metal forming processes to its manufacturing capabilities and bringing production into its factories of items formerly sourced from other suppliers. Domestic production facilitates our product development process, enabling the Company to more rapidly develop new products, release extensions of product families, and offer customized variants of our product offering. Virco views its domestic factories as a strategic resource for providing its customers with timely delivery of a broad selection of colors, finishes, laminates, and product styles.
Critical Accounting Policies and Estimates
This discussion and analysis of Virco's financial condition and results of operations is based upon the Company's financial statements which have been prepared in accordance with U.S. generally accepted accounting principles. The preparation of these financial statements requires Virco management to make estimates and judgments that affect the Company's reported assets, liabilities, revenues and expenses, and related disclosure of contingent assets and liabilities. On an on-going basis, management evaluates such estimates, including those related to revenue recognition, allowance for doubtful accounts, valuation of inventory and related obsolescence reserves, self-insured retention for products and general liability insurance, self-insured retention for workers' compensation insurance, provision for warranty, liabilities under defined benefit and other compensation programs, and estimates related to deferred tax assets and liabilities. Management bases its estimates on historical experience and on various other assumptions that are believed to be reasonable under the circumstances. This forms the basis of judgments about the carrying value of assets and liabilities that are not readily apparent from other sources. Actual
25
results may differ from these estimates under different assumptions or conditions. Factors that could cause or contribute to these differences include the factors discussed above under Item 1, Business, and elsewhere in this Annual Report on Form 10-K. Virco's critical accounting policies are as follows:
Revenue Recognition : The Company recognizes revenue in accordance with Financial Accounting Standards Board ("FASB") Accounting Standards Codification ("ASC") Topic 605, "Revenue Recognition." Revenue is recognized when title passes under its various shipping terms, when classroom delivery services are complete, and when collectability is reasonably assured. The Company reports sales net of sales returns and allowances, sales taxes imposed by various government authorities, cash discounts and rebates to customers. In most instances, the Company sells furniture on bids and contracts, which may include multiple elements. For sales that include freight to the customer, many sales are delivered on the same day shipped, with an average delivery being in route for 1 to 3 days. Classroom delivery, which involves carrying the furniture to the classroom and setting the desks and chairs in place, typically occurs the day the furniture is delivered.
In accordance with ASC 605-25 ("ASC 605-25"), "Revenue Recognition - Multiple-Element Arrangements," revenue arrangements with multiple deliverables are generally accounted for by the Company on a combined unit of accounting as our customers control our ability to deliver the furniture, and as a result the furniture delivery and classroom setup is generally provided at the same time. We recognize the consideration for the combined unit of accounting once the final item has been delivered and installed.
Allowances for Doubtful Accounts : Considerable judgment is required when assessing the ultimate realization of receivables, including assessing the probability of collection, current economic trends, historical bad debts and the current creditworthiness of each customer. The Company maintains allowances for doubtful accounts that may result from the inability of our customers to make required payments. Over the past five years, the Company's allowance for doubtful accounts has ranged from approximately 0.7% to 3.0% of accounts receivable at year-end. The allowance is evaluated using historic experience combined with a detailed review of past-due accounts. The Company does not typically obtain collateral to secure credit risk. The primary reason that Virco's allowance for doubtful accounts represents such a small percentage of accounts receivable is that a large portion of the accounts receivable is attributable to low-credit-risk governmental entities, which often purchase the furniture with funds provided from bond issuances, giving Virco's receivables a historically high degree of collectability. Although many states are experiencing budgetary difficulties, it is not anticipated that Virco's credit risk will be significantly impacted by these events. Over the next year, no significant change is expected in the Company's sales to government entities as a percentage of total revenues.
Inventory Valuation : Inventory is valued at the lower of cost or market (determined on a first-in, first-out basis) and includes material, labor, and factory overhead. The Company maintains allowances for estimated slow-moving and obsolete inventory to reflect the difference between the cost of inventory and the estimated market value. Allowances for slow-moving and obsolete inventory are determined through a physical inspection of the product in connection with a physical inventory, a review of slow-moving product, and consideration of active marketing programs. The market for education furniture is traditionally driven by value, not style, and the Company has not typically incurred significant obsolescence expenses. If market conditions are less favorable than those anticipated by management, additional allowances may be required. Due to reductions in sales volume in the past years, the Company's manufacturing facilities are operating at reduced levels of capacity. The Company records the cost of excess capacity as a period expense, not as a component of capitalized inventory valuation.
Self-Insured Retention : For 2018, 2017, and 2016 the Company was self-insured for product liability losses ranging up to $250,000 per occurrence, for workers' compensation losses up to $250,000 per occurrence, and for auto liability up to $50,000 per occurrence. The Company obtains annual actuarial valuations for the self-insured retentions. Product liability, workers' compensation, and auto reserves for known and unknown incurred but not reported ("IBNR") losses are recorded at the net present value of the estimated losses using a risk-free discount rate of 2% for 2018 and 2017. Given the relatively short term over which the IBNR losses are discounted, the sensitivity to the discount rate is not significant. Estimated workers' compensation losses were funded during the insurance year and subject to retroactive loss adjustments. The Company's exposure to self-insured retentions varies depending upon the market conditions in the insurance industry and the availability of cost-effective insurance coverage. Self-insured retentions for 2019 will be comparable to the retention levels for 2018.
Warranty Reserv e: The Company provides a warranty against all substantial defects in material and workmanship. The Company's warranty is not a guarantee of service life, which depends upon events outside the Company's control and may be different from the warranty period. The standard warranty offered on products sold through January 31, 2014, is ten years. Effective February 1, 2014 through December 31, 2016, the Company modified its warranty to a limited lifetime warranty. The warranty effective February 1, 2014 is not anticipated to have a significant effect on warranty expense. Effective January 1, 2017, the Company modified the warranty offered to provide specific warranty periods by product component, with no warranty period longer than ten years. The Company's warranties generally provide that customers can return a defective product during the specified warranty period following purchase in exchange for a replacement product or that the Company
26
can repair the product at no charge to the customer. The Company determines whether replacement or repair is appropriate in each circumstance. The Company uses historic data to estimate appropriate levels of warranty reserves. Because product mix, production methods, and raw material sources change over time, historic data may not always provide precise estimates for future warranty expense.
Defined Benefit Obligations : The Company has three defined benefit plans, the Virco Employees Retirement Plan (the "Employee Plan") and the Virco Important Performers Plan (the "VIP Plan") and the Outside Directors Plan, which provide retirement benefits to employees and outside directors. Virco discounted the pension obligations for the various plans using the following rates:
| 2018 |
| 2017 |
| 2016 |
Employee Plan | 3.75% |
| 4.25% |
| 4.00% |
VIP Plan | 4.00% |
| 4.50% |
| 4.25% |
Directors Plan | 3.75% |
| 4.25% |
| 3.25% |
Because the Company froze new benefit accruals for all three plans effective December 31, 2003, the assumed rate of increase in compensation has no effect on the accounting for the plans. The Company estimated a 6.5% return on plan assets for the Employee Plan for all three years. The VIP Plan and Directors Plan are unfunded and have no plan assets. These rate assumptions can vary due to changes in interest rates and expected returns in the stock market. In prior years, the discount rate has decreased by several percentage points, causing pension expense and pension obligations to increase.
Because the plans have been frozen for many years, there is no service cost related to the plans. In 2016, due to a large number of lump sum benefits paid to retired and terminated employees, the Company has incurred settlement costs for the Employee Plan. In effort to "de-risk" the Employee Plan, the Company intends to continue to reach out to and offer lump sum benefits to terminated and retired employees, which may result in settlement costs in the future. The Company did not incur settlement costs in 2018 or 2017.
Due to the size of the Company's pension obligations, a one percent change in discount rates can cause a material change in the pension obligations. A one percent reduction in discount rates would cause obligations under the Employee Plan to increase by approximately $2.4 million. A one percent reduction in discount rates would cause obligations under the non-qualified plans to increase by approximately $1.5 million. The retirement obligations would decrease by similar amounts if discount rate were to increase by a comparable percentage. The Company obtains annual actuarial valuations for all plans.
Deferred Tax Assets and Liabilities : The Company recognizes deferred income taxes under the asset and liability method of accounting for income taxes in accordance with the provisions of FASB ASC Topic 740 "Income Taxes." Deferred income taxes are recognized for differences between the financial statement and tax basis of assets and liabilities at enacted statutory tax rates in effect for the years in which the differences are expected to reverse. The effect on deferred taxes of a change in tax rates is recognized in income in the period that includes the enactment date. In assessing the realizability of deferred tax assets, the Company considers whether it is more likely than not that some portion or all of the deferred tax assets will not be realized. The ultimate realization of deferred tax assets is dependent upon the generation of future taxable income or reversal of deferred tax liabilities during the periods in which those temporary differences become deductible. The Company considers the scheduled reversal of deferred tax liabilities, projected future taxable income, and tax planning strategies in making this assessment. The Company has a partial valuation allowance of $925,000 against certain state deferred tax assets that the Company does not believe it is more-likely-than-not to realize. At January 31, 2018, the Company has net operating loss carryforwards of approximately $13,458,000 for federal and $30,979,000 for state income tax purposes, expiring at various dates through January 31, 2035. In 2017, Congress passed the Tax Cuts and Jobs Act (TCJA) on December 22, 2017 . The Act reduces the US federal corporate tax rate to 21%.
Results of Operations (2018 vs. 2017)
Financial Results and Cash Flow
The Company earned a pre-tax profit of $2,414,000 on net sales of $189,287,000 for the fiscal year ended January 31, 2018, compared to pre-tax profit of $4,727,000 on net sales of $173,417,000 in the fiscal year ended January 31, 2017. Net after-tax income decreased to a loss of ($3,209,000) for the fiscal year ended January 31, 2018 from $22,760,000 in the fiscal year ended January 31, 2017. The January 31, 2018 tax provision includes a $4.4 million unfavorable rate adjustment from the Tax Cuts and Jobs Act (TCJA) passed on December 22, 2017. The January 31, 2017 tax provision included a benefit to income taxes of $17,962,000 recognized in October 2016 upon the release of the Company's valuation against deferred tax assets. Net income per basic share decreased to a loss of $0.21 for the fiscal year ended January 31, 2018, compared to $1.51 in the prior year, due
27
primarily to the income tax effects described above. Cash flow provided by operations was $1,682,000 for the fiscal year ended January 31, 2018, compared to $5,862,000 in the prior year.
Sales
Virco's sales increased by 9.2% in 2018 to $189,287,000 compared to $173,417,000 in 2017. The increase in sales was attributable to growth in project business and an increase in business sold with Virco full service.
In effort to grow sales and market share, list selling prices were not changed during the fiscal year ended January 31, 2018. Growth in sales was substantially due to increases in project business. Project business has many characteristics that differ from orders funded from school operating budgets. Project business is usually bond funded, typically includes product that Virco procures from vendor partners to complete an entire school, and always includes Virco full service. Project orders are typically large orders, and are usually subject to a greater level of competition from other suppliers. Sales of product that included Virco full service represented the balance of the sales growth. Virco full service includes delivering the furniture into the classroom, as opposed to simply delivering to the school site or warehouse. Sales of furniture sold FOB factory to resellers or sold with lower service levels declined by nearly 6%.
For 2019 the Company anticipates that the budgetary challenges for state and local governments will continue to affect growth in sales. Recent elections have resulted in an increased level of bond passages, but there is typically a delay between when a bond is passed and when it translates into furniture orders. Increased bond funding favorably impacted business for 2018 and is anticipated to be beneficial for 2019. As we have throughout this economic cycle, the Company continues to focus on strategies to develop and strengthen its brand with an aggressive product development campaign. We will continue to use our domestic factories to provide greater flexibility for custom specifications such as laminates, colors, and on-time delivery. The Company will continue to emphasize the value, design and variety of its products, the value of its distribution, delivery, classroom delivery, and project management capabilities, and the importance of timely deliveries during the peak seasonal delivery period. The Company plans to increase selling prices to recover increased costs of commodities. In order to increase or maintain market share during 2019, when market conditions warrant, the Company may compete based on direct prices and may reduce its prices to build or maintain its market share.
Cost of Sales
Cost of sales was 65.4% of sales in 2018 and 63.9% of sales in 2017. The increase in cost of sales as a percentage of sales was primarily attributable to two components. First is the increase in project business, which includes resale of products sourced from other manufacturers. Gross margin on product purchased for resale is lower than on product manufactured by the Company. Second, the Company incurred increased costs for commodities. Because the Company did not increase list selling prices for the 2018 fiscal year, increased material costs adversely affected cost of sales. The hourly cost of operating our factories increased by less than 1% during the year.
During fiscal 2019, the Company anticipates continued uncertainty and volatility in commodity costs, particularly with respect to certain raw materials, transportation, and energy. Subsequent to year end, tariffs on imported steel announced by President Trump have created volatility in the price of steel and other imported components, and the price of steel has increased significantly during 2018. Due in part to volatile transportation and energy costs, we may incur higher commodity costs in fiscal 2019. For more information, please see the section below entitled "Inflation and Future Change in Prices."
Selling, General and Administrative and Other Expenses
Selling, general and administrative and other expenses for the fiscal year ended January 31, 2018, increased by approximately 8.7% to $61,512,000 compared to $56,599,000 in the prior year, but decreased as a percentage of sales to 32.5% of sales from 32.6% in the prior year. Service costs, including warehousing, freight and classroom delivery costs increased in dollars and increased by 1% as a percentage of sales. The increase in costs was driven by the increased project business and increase in full service sales with classroom delivery. Selling costs increased in dollars compared to the prior year but decreased by 0.3% as a percentage of sales. Increased selling costs were attributable to variable selling expenses. G&A spending was flat in terms of dollars, and decreased as a percentage of sales by 0.8% of sales. The 2018 year included a bonus provision of $287,000, compared to $570,000 in the prior year.
Interest expense was $328,000 higher in 2018 compared to 2017 as a result of increased average borrowing and increased interest rates.
Provision for Income Taxes
In 2017, Congress passed the Tax Cuts and Jobs Act (TCJA) on December 22, 2017 which, among other changes, reduced the federal income tax rate effective January 1, 2018 to 21%. Because Virco's fiscal year ends January 31, 2018, 11 of the 12
28
months were subject to the 34% graduated rate and one month at the 21% rate, for an effective federal rate of 32.9%. As a result of the reduction in the federal tax rate, the value of the Company's deferred tax assets decreased by $4,438,000.
The Company has a partial valuation allowance of $925,000 against certain state deferred tax assets that the Company does not believe it is more-likely-than-not to realize. At January 31, 2018, the Company has net operating loss carryforwards of approximately $13,458,000 for federal and $30,979,000 for state income tax purposes, expiring at various dates through January 31, 2035.
Because the Company has reversed the valuation allowance for the majority of deferred tax assets, and because the entire year will be subject to a 21% federal rate, it is expected the effective tax rate for 2019 will be approximately 27%.
Results of Operations (2017 vs. 2016)
Financial Results and Cash Flow
The Company earned a pre-tax profit of $4,727,000 on net sales of $173,417,000 for the fiscal year ended January 31, 2017, compared to pre-tax profit of $4,667,000 on net sales of $168,595,000 in the fiscal year ended January 31, 2016. Net after-tax income increased to $22,760,000 for the fiscal year ended January 31, 2017 from $4,549,000 in the prior fiscal year, due to a benefit to income taxes of $17,962,000 recognized in October 2016 upon the release of the Company's valuation against deferred tax assets. Net income per basic share increased to $1.51 for the fiscal year ended January 31, 2017, compared to $0.31 in the prior year, due primarily to the income tax benefit. Cash flow provided by operations was $5,862,000 for the fiscal year ended January 31, 2017, compared to $7,507,000 in the prior year.
Sales
Virco's sales increased by 2.9% in 2017 to $173,417,000 compared to $168,595,000 in 2016. The increase in sales was caused by improving economic conditions that had a favorable impact on operating budgets for school spending.
Selling prices were substantially unchanged in 2017 with the entire growth in sales attributable to increases in volume. Sales of Virco's new products, including N-2, Zuma™, Sage™, and Analogy™ contributed the majority of the increase in sales supplemented with modest increases in other product lines. Orders rates continued to be volatile and seasonal in 2017. Sales volume for the Company started slowly this year, with the first portion of the year showing a decline in sales, followed by modest growth in the seasonal summer period. Although the fourth quarter is typically a slow period for the Company, typically representing 15% or less of annual business, the fourth quarter revenue increased by nearly 20% to $23,441,000, compared to $19,494,000 in the prior year. The fourth quarter benefited from a significant disaster relief project as well as increased sales of smaller projects to other school districts. We are cautiously optimistic that this strength experienced in the fourth quarter will continue into the next year, but fourth quarter numbers are a relatively small portion of our annual business and timing of one or two projects or stocking orders can influence the fourth quarter result significantly but be a much smaller percentage of the annual sales volume.
Cost of Sales
Cost of sales was 63.9% of sales in 2017 and 64.6% of sales in 2016. Although the Company incurred increased material costs (particularly steel) during the latter part of the year, the majority of sales were fulfilled with product sourced prior to the cost increase.
The Company began the fiscal year ended January 31, 2017 with $7.9 million more inventory to support our enhanced quick ship program than we had in inventory at the beginning of the prior year. Because of the timing of the acquisition of inventory, production hours decreased by approximately 1.7% despite increased sales volume. The Company was able to offset these headwinds with increased manufacturing efficiency resulting in a net modest reduction in cost as a percentage of sales.
Selling, General and Administrative and Other Expenses
Selling, general and administrative and other expenses for the fiscal year ended January 31, 2017, increased by approximately 5.47% to $56,599,000 compared to $53,662,000 in the prior year, and increased as a percentage of sales to 32.6% of sales from 31.8% in the prior year.
Warehousing, freight and classroom delivery costs increased in dollars but decreased by 0.1% as a percentage of sales. Selling costs increased in dollars compared to the prior year and increased by 0.8% as a percentage of sales. Increased selling costs were partially attributable to variable selling expenses. The Company gave raises to employees at the beginning of the year for the first time in nearly seven years. This raise affected total selling and G&A expenses. G&A spending increased in dollars, and increased as a percentage of sales. The Company is investing in new information technology and staffing, which drove a
29
portion of the increase in G&A spending. The 2017 year included a bonus provision of $570,000, compared to $1,045,000 in the prior year.
Interest expense was $64,000 less in 2017 compared to 2016 as a result of reduced average borrowing.
Provision for Income Taxes
The Company incurred a substantial operating loss for the years ended January 31, 2013, 2012, and 2011. During the fourth quarter of the year ended January 31, 2011, based on this consideration, the Company determined the realization of a majority of the net deferred tax assets no longer met the more likely than not criteria and a valuation allowance was recorded against the majority of the net deferred tax assets. A valuation allowance was recorded against the majority of the net deferred tax assets totaling $21,906,000 at January 31, 2016. The Company recognized operating profits for the fiscal years ended January 31, 2015, January 31, 2016, and January 31, 2017. At October 31, 2016, the Company determined that it was more-likely-than-not to realize the majority of its deferred tax assets, and therefore released its valuation against those assets resulting in a benefit to income taxes of $17,962,000. The Company has left a partial valuation allowance of $515,000 against certain state deferred tax assets that the Company does not believe it is more-likely-than-not to realize. At January 31, 2017, the Company has net operating loss carryforwards of approximately $16,879,000 for federal and $34,145,000 for state income tax purposes, expiring at various dates through January 31, 2035.
Inflation and Future Change in Prices
We commit to annual contracts that determine selling prices for goods and services for periods of one year, and occasionally longer. Though the Company has negotiated flexibility under many of these contracts that may allow the Company to increase prices on future orders, the Company does not have the ability to raise prices on orders received prior to any announced price increase. Due to the intensely seasonal nature of our business, the Company may receive significant orders during the first and second quarters for delivery in the second and third quarters. With respect to any of the contracts described above, if the costs of providing our products or services increase between the date the orders are received and the shipping date, we may not be able to implement corresponding increases in our sales prices for such products or services in order to offset the related increased costs. In 2016 the cost of these commodities declined slightly. In 2017, the cost of steel increased significantly, but the increase did not occur until after the Company had sourced the majority of its steel for the summer delivery season. In 2018 the cost of commodities increased over the course of the year, but did not spike as suddenly as in some prior periods.
Subsequent to year-end, tariffs on imported steel announced by President Trump have created volatility in the price of steel and other imported components, and the price of steel has increased significantly during 2018.
These years contrast with 2012, when the Company incurred an increase of approximately 30% in the cost of steel during the second quarter, and nearly a 30% increase in the cost of certain plastics over the second and third quarters. These cost increases adversely impacted gross margins in 2012 for products shipped during the summer season.
For 2019, the Company anticipates continued volatility in costs, particularly with respect to certain raw materials, transportation, and energy. Anticipated adverse volatility for 2019 could be severe in light of tariffs imposed or threatened on imported commodities. There is continued uncertainty with respect to steel and other raw material costs, including plastics, that are affected by the price of oil. Transportation costs may be adversely affected by increased oil prices, in the form of increased operation costs for our fleet, and surcharges on freight paid to third-party carriers. Virco depends upon third party carriers for more than 90% of customer deliveries. Subsequent to 2010, many carriers went out of business or were required to reduce the size of their fleets due to economic conditions, and have not increased the fleets as the economy has improved. Recent regulation and more stringent enforcement of federal regulations governing the transportation industry (especially regarding drivers) have adversely impacted the cost and availability of freight services. Virco expects to incur continued pressure on employee benefit costs. The Company has renewed health insurance contracts for its employees through December 2018, but costs subsequent to that date may be adversely impacted by current legislation, claim costs, and industry consolidation. Virco has aggressively addressed these costs by reducing headcount, freezing pension benefits and passing on a portion of increased medical costs to employees.
To recover the cumulative impact of increased costs, the Company raised the list prices for Virco's products in 2017 and 2016 and has increased published list prices for 2019. Due to current economic conditions, the Company anticipates continued significant price competition in 2019, and may not be able to raise prices without risk of losing market share. As a significant portion of Virco's business is obtained through competitive bids, the Company is carefully considering material and
30
transportation costs as part of the bidding process. Total material costs for 2019, as a percentage of sales, could be higher than in 2018. The Company is working to control and reduce costs by improving production and distribution methodologies, investigating new packaging and shipping materials, and searching for new sources of purchased components and raw materials.
Liquidity and Capital Resources
Working Capital Requirements
Virco addresses liquidity and working capital requirements in the context of short-term seasonal requirements and long-term capital requirements of the business. The Company's core business of selling furniture to publicly funded educational institutions is extremely seasonal. The seasonal nature of this business permeates most of Virco's operational, capital, and financing decisions.
The Company's working capital requirements during and in anticipation of the peak summer season oblige management to make estimates and judgments that affect Virco's assets, liabilities, revenues and expenses. Management expends a significant amount of time during the year, and especially in the fourth quarter of the prior year and first quarter, developing a stocking plan and estimating the number of employees, the amount of raw materials, and the types of components and products that will be required during the peak season. If management underestimates any of these requirements, Virco's ability to fill customer orders on a timely basis or to provide adequate customer service may be diminished. If management overestimates any of these requirements, the Company may be required to absorb higher storage, labor and related costs, each of which may affect profitability. On an ongoing basis, management evaluates such estimates, including those related to market demand, labor costs, and inventory levels, and continually strives to improve Virco's ability to correctly forecast business requirements during the peak season each year.
As part of Virco's efforts to address seasonality, financial performance and quality without sacrificing service or market share, management has been refining the Company's ATS operating model. ATS is Virco's version of mass-customization, which assembles standard, stocked components into customized configurations before shipment. The Company's ATS program reduces the total amount of inventory and working capital needed to support a given level of sales. It does this by increasing the inventory's versatility, delaying assembly until the last moment, and reducing the amount of warehouse space needed to store finished goods. In order to provide "one stop shopping" for all FF&E needs, Virco purchases and re-sells certain finished goods from other furniture manufacturers. When practical, these furniture items are drop shipped from the Company's supplier. Where cost effective, the Company will bring the item into the Virco warehouse and the third-party products will be shipped along with product manufactured by Virco. The Company did not carry material amounts of vendor inventory during the fiscal years ended January 31, 2018 or 2017.
In addition, Virco finances its largest balance of accounts receivable during the peak season. This occurs for three primary reasons. First, accounts receivable balances naturally increase during the peak season as shipments of products increase. Second, many customers during this period are government institutions, which tend to pay accounts receivable more slowly than commercial customers. Third, many summer deliveries may be "projects" where the Company provides furniture for a new school or significant refurbishment of an existing school. Projects may require architect sign off, school board approval prior to payment, or punch list completion, all of which can delay payment.
As a result of the seasonality of our business, our manufacturing and distribution capacity is dictated by the capacity requirement during the months of June, July, and August. Because of this seasonality, factory utilization is lower during the slow season. The Company utilizes a variety of tactics to address the seasonality of its business. During the summer months, which comprise our second and third fiscal quarters, our personnel utilization generally is at or close to full capacity. The Company utilizes temporary labor and significant overtime to meet the seasonal requirements. During the slow portions of the year, temporary labor and overtime are eliminated to moderate the off-season costs. Our manufacturing facility capacity utilization generally remains less than 100% during these off-season months; because physical structure capacity cannot be adjusted as readily as personnel capacity, we have secured sufficient physical structure capacity to accommodate our current needs as well as for anticipated future growth. Our physical structure utilization is significantly lower during the first and fourth quarters of each year than it is during the second and third quarters.
The Company utilizes a comparable strategy to address warehousing and distribution requirements. During summer months, temporary labor is hired to supplement experienced warehouse and distribution personnel. More than 90% of the Company's freight is provided by third-party carriers. The Company has secured sufficient warehouse capacity to accommodate our current needs as well as anticipated future growth.
Line of Credit
31
As the capital required for the summer season generally exceeds cash available from operations, Virco has historically relied on third-party bank financing to meet seasonal cash flow requirements. On December 22, 2011 (the "Closing Date"), the Company and Virco Inc., a wholly owned subsidiary of the Company ("Virco" and, together with the Company, the "Borrowers") entered into a Revolving Credit and Security Agreement (the "Credit Agreement") with PNC Bank, National Association, as administrative agent and lender ("PNC"). The credit agreement has entered into a number of amendments subsequent to that date, which, among other things, extended the maturity date of the Credit Agreement for three years until March 19, 2023, increased the maximum availability under the Credit Agreement to $60,000,000, modified, eliminated, or waived covenants, amended seasonal advances and established a $2,500,000 line for equipment financing.
The Credit Agreement provides the Borrowers with a secured revolving line of credit (the "Revolving Credit Facility") of up to $60,000,000, with seasonal adjustments to the credit limit and subject to borrowing base limitations, and includes a sub-limit of up to $3,000,000 for issuances of letters of credit. In addition, the Credit Agreement provides an Equipment Line for purchases of equipment up to $2,500,000. The Revolving Credit Facility is an asset-based line of credit that is subject to a borrowing base limitation and generally provides for advances of up to 85% of eligible accounts receivable, plus a percentage equal to the lesser of 60% of the value of eligible inventory or 85% of the liquidation value of eligible inventory, plus an amount ranging from $8,000,000 to $14,000,000 from December 1 through July 31 of each year, minus undrawn amounts of letters of credit and reserves. The Revolving Credit Facility is secured by substantially all of the Borrowers' personal property and certain of the Borrowers' real property. The principal amount outstanding under the Credit Agreement and any accrued and unpaid interest is due no later than March 19, 2023, and the Revolving Credit Facility is subject to certain prepayment penalties upon earlier termination of the Revolving Credit Facility. Prior to the maturity date, principal amounts outstanding under the Credit Agreement may be repaid and reborrowed at the option of the Borrowers without premium or penalty, subject to borrowing base limitations, seasonal adjustments and certain other conditions.
The Revolving Credit Facility bears interest, at the Borrowers' option, at either the Alternate Base Rate (as defined in the Credit Agreement) or the Eurodollar Currency Rate (as defined in the Credit Agreement), in each case plus an applicable margin. The applicable margin for Alternate Base Rate loans is a percentage within a range of 0.50% to 1.50%, and the applicable margin for Eurodollar Currency Rate loans is a percentage within a range of 1.50% to 2.50%, in each case based on the EBITDA of the Borrowers at the end of each fiscal quarter, and may be increased at PNC's option by 2.0% during the continuance of an event of default. Accrued interest with respect to principal amounts outstanding under the Credit Agreement is payable in arrears on a monthly basis for Alternative Base Rate loans, and at the end of the applicable interest period but at most every three months for Eurodollar Currency Rate loans. The interest rate at January 31, 2018 was 5.0%.
For the year ended January 31, 2016, the Credit Agreement contained a covenant that forbade the Company from issuing dividends or making payments with respect to the Company's capital stock. As discussed above, on April 4, 2016 the Company entered into Amendment No. 12 which allows the Company to pay dividends or conduct stock repurchases in an amount up to $1.3 million per year. In March 2018 the Company entered into Amendment #17 which increased the limit on dividends and stock repurchases to $2.0 million. In addition, it contains numerous other covenants that limit under certain circumstances the ability of the Borrowers and their subsidiaries to, among other things, merge with or acquire other entities, incur new liens, incur additional indebtedness, sell assets outside of the ordinary course of business, enter into transactions with affiliates, or substantially change the general nature of the business of the Borrowers, taken as a whole.
The Credit Agreement requires the Company to maintain compliance with the following financial covenants: (i) a minimum fixed charge coverage ratio, and (ii) a minimum EBITDA amount, in each case as of the end of the relevant monthly, quarterly or annual measurement period. As of January 31, 2018, the Credit Agreement required the Company to maintain: (i) a minimum fixed charge coverage ratio of at least 1.10 to 1.00 for the four consecutive fiscal quarters ending January 31, 2018, and (ii) a minimum EBITDA amount of $7,400,000 for the twelve consecutive fiscal months ending January 31, 2018. The actual results of the Company with respect to the foregoing financial covenants for the period ending January 31, 2018 were as follows: (i) the Company maintained a fixed charge coverage ratio of greater than 1.41 to 1.00 for the four consecutive fiscal quarters ended January 31, 2018, and (ii) the Company achieved EBITDA of $10,254,000 for the fiscal year ended January 31, 2018.
In addition, the Credit Agreement contains a clean down provision that requires the Company to reduce borrowings under the line to less than $8,000,000 for a period of 30 consecutive days each fiscal year. The Company believes that normal operating cash flow will allow it to meet the clean down requirement with no adverse impact on the Company's liquidity.
Events of default (subject to certain cure periods and other limitations) under the Credit Agreement include, but are not limited to, (i) non-payment of principal, interest or other amounts due under the Credit Agreement, (ii) the violation of terms, covenants, representations or warranties in the Credit Agreement or related loan documents, (iii) any event of default under agreements governing certain indebtedness of the Borrowers and certain defaults by the Borrowers under other agreements that would materially adversely affect the Borrowers, (iv) certain events of bankruptcy, insolvency or liquidation involving the
32
Borrowers, (v) judgments or judicial actions against the Borrowers in excess of $250,000,subject to certain conditions, (vi) the failure of the Company to comply with Pension Benefit Plans (as defined in the Credit Agreement), (vii) the invalidity of loan documents pertaining to the Credit Agreement, (viii) a change of control of the Borrowers and (ix) the interruption of operations of any of the Borrowers' manufacturing facilities for five consecutive days during the peak season or fifteen consecutive days during any other time, subject to certain conditions.
Pursuant to the Credit Agreement, substantially all of the Borrowers' accounts receivable are automatically and promptly swept to repay amounts outstanding under the Revolving Credit Facility upon receipt by the Borrowers. Due to this automatic liquidating nature of the Revolving Credit Facility, if the Borrowers breach any covenant, violate any representation or warranty or suffer a deterioration in their ability to borrow pursuant to the borrowing base calculation, the Borrowers may not have access to cash liquidity unless provided by PNC at its discretion. In addition, certain of the covenants and representations and warranties set forth in the Credit Agreement contain limited or no materiality thresholds, and many of the representations and warranties must be true and correct in all material respects upon each borrowing, which the Borrowers expect to occur on an ongoing basis. There can be no assurance that the Borrowers will be able to comply with all such covenants and be able to continue to make such representations and warranties on an ongoing basis.
The Company's line of credit with PNC is structured to provide seasonal credit availability during the Company's peak summer season. The Company believes that the Revolving Credit Facility will provide sufficient liquidity to meet its capital requirements in the next 12 months. Approximately $15,961,000 was available for borrowing as of January 31, 2018.
Long-Term Capital Requirements
In addition to short-term liquidity considerations, the Company continually evaluates long-term capital requirements. From 1998 through 2001, the Company completed two large capital projects, which have had significant subsequent effects on cash flow. The first project was the implementation of the SAP enterprise resources planning system. The second project was the expansion and re-configuration of the Conway, Arkansas, manufacturing and distribution facility.
Upon completion of these projects, the Company dramatically reduced capital spending and capital expenditures have remained below depreciation from 2002 through 2017. Capital expenditures increased materially in 2018, primarily due to the $7.2 million acquisition of a component manufacturing facility. This facility had previously been occupied under operating leases. Upon purchase of the building, annual depreciation expense for the building is anticipated to be approximately $300,000 per year less than current rent expense. Annual debt service payments are anticipated to be approximately $300,000 per year less than current rent expense. Capital expenditures will continue to focus on automation, both in the factory and software applications, and new product development along with the tooling and new processes required to produce new products. The Company has identified several opportunities for capital expenditures during the next five years. The Company has established a goal of limiting capital spending to approximately $7,000,000 for 2019. Our Revolving Credit Facility with PNC Bank has been amended to provide a line for equipment and covenants have been modified to allow for anticipate capital expenditures.
Asset Impairment
The Company made substantial investments in its infrastructure in 1999, 2000, and 2001. The investments included a new factory, new warehouse, and new production and distribution equipment. Much of the tooling, machinery, and equipment acquired at this time is now fully or substantially depreciated. The factory, warehouse, and equipment acquired are used to produce, store, and ship a variety of product lines, and the use of any one piece of equipment is not dependent on the success or volume of any individual product. New products are designed to use as many common or existing components as practical. As a result, both our ATS inventory components and the machines used to produce them become more versatile. The Company evaluates the potential for impaired assets on a quarterly basis. As of January 31, 2018, there has been no impairment to the long-lived assets of the Company.
The Company has no intangible assets on its Consolidated Balance Sheet at January 31, 2018.
Contractual Obligations
The Company leases manufacturing, transportation, and office equipment, as well as real estate under a variety of operating leases. The Company leases substantially all vehicles, including trucks and passenger cars under operating leases where the lessor provides fleet management services for the Company. The fleet management services provide Virco with operating efficiencies relating to the acquisition, administration, and operation of leased vehicles. Real estate leases have been used where the Company did not want to make a long-term commitment to a location, or when economic conditions favored leasing. The Torrance manufacturing and distribution facility is leased under an operating lease that expires in April 2025. The Company does not have any lease obligations or purchase commitments in excess of normal recurring obligations. Leasehold
33
improvements and tenant improvement allowances are depreciated over the lesser of the expected life of the asset or the lease term.
Contractual Obligations
Payments Due by Period
In thousands | Total |
| Less than 1 year |
| 1-3 years |
| 3-5 years |
| More than 5 | ||||||||||
Long-term debt obligations | $ | 16,681 | |
| $ | 4,681 | |
| $ | 12,000 | |
| $ | - | |
| $ | - | |
Operating lease obligations | 34,421 | |
| 4,386 | |
| 8,189 | |
| 9,967 | |
| 11,879 | | |||||
Purchase obligations | 12,646 | |
| 12,646 | |
| - | |
| - | |
| - | | |||||
| $ | 63,748 | |
| $ | 21,713 | |
| $ | 20,189 | |
| $ | 9,967 | |
| $ | 11,879 | |
Virco's largest market is publicly funded school districts. A significant portion of this business is awarded on a bid basis. Many school districts require that a bid bond be posted as part of the bid package. In addition to bid bonds, many districts require a performance bond when the bid is awarded. At January 31, 2018, the Company had bonds outstanding valued at approximately $2,280,000. To the best of management's knowledge, in over 68 years of selling to schools, Virco has never had a bid or performance bond called.
The Company provides a warranty against all substantial defects in material and workmanship. The Company's warranty is not a guarantee of service life, which depends upon events outside the Company's control and may be different from the warranty period. The standard warranty offered on products sold through January 31, 2014, is ten years. Effective February 1, 2014 the Company modified its warranty to a limited lifetime warranty. The new warranty effective February 1, 2014 is not anticipated to have a significant effect on warranty expense. The Company's warranties generally provide that customers can return a defective product during the specified warranty period following purchase in exchange for a replacement product or that the Company can repair the product at no charge to the customer. The Company determines whether replacement or repair is appropriate in each circumstance. The Company uses historic data to estimate appropriate levels of warranty reserves. Because product mix, production methods, and raw material sources change over time, historic data may not always provide precise estimates for future warranty expense. The following is a summary of the Company's warranty-claim activity during 2018 and 2017.
|
| January 31, | ||||||
In thousands |
| 2018 |
| 2017 | ||||
Beginning balance |
| $ | 1,000 | |
| $ | 1,000 | |
Provision for current year |
| 760 | |
| 700 | | ||
Provision for prior year |
| (380 | ) |
| (285 | ) | ||
Costs incurred |
| (455 | ) |
| (415 | ) | ||
Ending balance |
| $ | 925 | |
| $ | 1,000 | |
Retirement Obligations
The Company provides retirement benefits to employees under three defined benefit retirement plans; the Employee Plan, the VIP Plan and the Directors Plan. The Employee Plan is a qualified retirement plan that is funded through a trust held at PNC Bank (Trustee). The other plans are non-qualified retirement plans. Benefits payable under the VIP Plan are secured by life insurance policies and securities held in a rabbi trust. The Company obtains annual actuarial valuations for retirement plans.
Because the plans have been frozen for many years, there is no service cost related to the plans. In recent years, due to a large number of lump sum benefits paid to retired and terminated employees, the Company has incurred settlement costs for the Employee Plan. In effort to "de-risk" the Employee Plan, the Company intends to continue to reach out to and offer lump sum benefits to terminated and retired employees, which may result in settlement costs in the future. The Company incurred settlement costs in 2016. The Company did not incur settlement costs in 2018 or 2017.
34
It is the Company's policy to contribute adequate funds to the trust accounts to cover benefit payments under the VIP Plan and Directors Plan and to maintain the funded status of the Employee Plan at a level which is adequate to avoid significant restrictions to the Employee Plan under the Pension Protection Act of 2006. The Company contributed $1.4 million, $1.4 million, and $1.6 million, to the trust in 2018, 2017, and 2016, respectively. Contributions during 2018 will depend upon actual investment results and benefit payments, but are anticipated to be approximately $0.9 million. During 2018, 2017, and 2016, the Company paid approximately $345,000, $536,000, and $591,000, respectively, in benefits per year under the non-qualified plans. It is anticipated that contributions to the non-qualified plans will be approximately $345,000 for 2019. At January 31, 2018, accumulated other comprehensive loss of approximately $9.3million, net of tax, is attributable to the pension plans.
The Company does not anticipate making any significant changes to the pension assumptions in the near future. If the Company were to have used different assumptions in the fiscal year ended January 31, 2018, a 1% reduction in investment return would have increased expense by approximately $210,000, a 1% change in the rate of compensation increase would have no impact, and a 1% reduction in the discount rate would have increased expense by $107,000.
Stockholders' Equity
Stockholder's equity decreased to $58,712,000 at January 31, 2018 from $59,354,000 at January 31, 2017 primarily due to net loss incurred in 2018 offset by adjustment to accumulated other comprehensive income (AOCI) and stock compensation expense. The Company's deferred income tax asset decreased to $10,093,000 at January 31, 2018.
The Company entered into a credit facility with PNC Bank in December 2011 that prohibited the Company from paying dividends and repurchasing any shares of its stock except in cases where a repurchase is financed by a substantially concurrent issuance of new shares of the Company's common stock. In April 2016, the Company entered into Amendment #12 with the Bank allowing the Company to pay dividends or conduct stock repurchases in an amount up to $1.3 million per year. In March 2018, the Company entered into Amendment #17 which allows the Company to pay dividends or conduct stock repurchases in an amount up to $2.0 million.
Virco issued a 10% stock dividend or 3/2 stock split every year beginning in 1983 through 2003. Although the stock dividend had no cash consequences to the Company, the accounting methodology required for 10% dividends has affected the equity section of the balance sheet. When the Company records a 10% stock dividend, 10% of the market capitalization of the Company on the date of the declaration is reclassified from retained earnings to additional paid-in capital. During the period from 1983 through 2003, the cumulative effect of the stock dividends has been to reclassify over $122 million from retained earnings to additional paid-in capital. The equity section of the balance sheet on January 31, 2018 reflects additional paid-in capital of approximately $117 million and accumulated deficit of approximately $49.6 million. Other than the losses incurred during 2004-2006 and 2011-2014, the accumulated deficit is a result of the accounting reclassification, and is not the result of accumulated losses.
Environmental and Contingent Liabilities
Environmental Compliance
Virco is subject to numerous federal, state, and local environmental laws and regulations in the various jurisdictions in which it operates that (a) govern operations that may have adverse environmental effects, such as the discharge of materials into the environment, as well as handling, storage, transportation and disposal practices for solid and hazardous wastes, and (b) impose liability for response costs and certain damages resulting from past and current spills, disposals or other releases of hazardous materials. In this context, Virco works diligently to remain in compliance with all such environmental laws and regulations as these affect the Company's operations. Moreover, Virco has enacted policies for recycling and resource recovery that have earned repeated commendations, including: recognition by the California Department of Resources Recycling and Recovery (CalRecycle) in 2012 and 2011 as a Waste Reduction Awards Program (WRAP) honoree; recognition by the United States Environmental Protection Agency in 2004 as a WasteWise Hall of Fame Charter Member, in 2003 as a WasteWise Partner of the Year and in 2002 as a WasteWise Program Champion for Large Businesses; and recognition by the Sanitation Districts of Los Angeles County for compliance with industrial waste water discharge guidelines in 2008 through 2011. This is only a partial list of Virco's environmental awards and commendations; for a more complete list, go to www.virco.com.
In addition to these awards and commendations, Virco's ZUMA and ZUMAfrd product lines were the first classroom furniture collections to earn indoor air quality certification through the stringent GREENGUARD® Children & Schools Program, now known as Greenguard Gold certification. As a follow-up to the certification of ZUMA and ZUMAfrd models in 2006, hundreds of other Virco furniture items - including Analogy furniture models and Textameter instructor workstations - have earned GREENGUARD certification. Moreover, all Virco products covered by the Consumer Product Safety Improvement Act of 2008 are in compliance with this legislation. All affected Virco models are also in compliance with the California Air
35
Resources Board rule implemented on January 1, 2009, concerning formaldehyde emissions from composite wood products. Environmental laws have changed rapidly in recent years, and Virco may be subject to more stringent environmental laws in the future. The Company has expended, and may be expected to continue to expend, significant amounts in the future for compliance with environmental rules and regulations, for the investigation of environmental conditions, for the installation of environmental control equipment, or remediation of environmental contamination. Normal recurring expenses relating to operating our factories in a manner that meets or exceeds environmental laws are matched to the cost of producing inventory. It is possible that the Company's operations may result in noncompliance with, or liability for remediation pursuant to, environmental laws. Should such eventualities occur, the Company records liabilities for remediation costs when remediation costs are probable and can be reasonably estimated. See "Risk Factors: We could be required to incur substantial costs to comply with environmental requirements." Violations of, and liabilities under, environmental laws and regulations may increase our costs or require us to change our business practices.
In 2018 and 2017, the Company was self-insured for product liability losses of up to $250,000 per occurrence, for general liability losses of up to $50,000 per occurrence, for workers' compensation losses up to $250,000 per occurrence, and for auto liability up to $50,000 per occurrence. In prior years the Company has been self-insured for workers' compensation, automobile, product, and general liability losses. The Company has purchased insurance to cover losses in excess of the self-insured retention or deductible up to a limit of $30,000,000. For the insurance year beginning April 1, 2018, the Company will be self-insured for product liability losses up to $250,000 per occurrence, for general liability losses up to $50,000 per occurrence, for workers' compensation losses up to $250,000 per occurrence, and for auto liability up to $50,000 per occurrence. In future years, the Company's exposure to self-insured retentions will vary depending upon the market conditions in the insurance industry and the availability of cost-effective insurance coverage.
The Company has aggressively pursued a program to improve product quality, reduce product liability claims and losses, and to aggressively defend product liability cases. This program has continued through 2018 and has resulted in reductions in product liability claims and litigated product liability cases. In addition, the Company has active safety programs to improve plant safety and control workers' compensation losses. Management does not anticipate that any related settlement, after consideration of the existing reserves for claims and potential insurance recovery, would have a material adverse effect on the Company's financial position, results of operations, or cash flows.
Off-Balance Sheet Arrangements
The Company did not enter into any material off-balance sheet arrangements during its 2018 fiscal year, nor did the Company
have any material off-balance sheet arrangements outstanding at January 31, 2018.
New Accounting Pronouncements
In February 2018, the FASB issued authoritative guidance to address certain stranded income tax effects in accumulated other comprehensive income (loss) resulting from the 2017 Tax Cuts and Jobs Act (the "Tax Reform") enacted in December 2017. This guidance provides the Company with an option to reclassify stranded tax effected within accumulated other comprehensive income (loss) to retained earnings in each period in which the effect of the change in the U.S. federal corporate income tax rate due to the Tax Reform is recorded. The Company will adopt this standard in the first quarter of fiscal 2019. The Company is currently evaluating the effect the standard will have on consolidated financial statements and related disclosures.
In February 2016, the FASB issued ASU No. 2016-02, Leases . The new standard requires lessees to recognize most leases, including operating leases, on-balance sheet via a right of use asset and lease liability. Changes to the lessee accounting model may change key balance sheet measures and ratios, potentially effecting analyst expectations and compliance with financial covenants. The new standard becomes effective for the Company effective for fiscal years beginning after December 15, 2018, but may be adopted at any time, and requires a modified retrospective transition. The Company is currently evaluating the effect the standard will have on consolidated financial statements and related disclosures.
In August 2016, the FASB issued ASU No. 2016-15, Statement of Cash Flows - Classification of Certain Cash Receipts and Cash Payments. The new standard provides classification guidance on eight cash flow issues including debt prepayment, settlement of zero-coupon bonds, contingent consideration payments made after a business combination, proceeds from the settlements of insurance claims, proceeds from the settlement of corporate-owned life insurance policies and distributions received from equity method investees. The new standard becomes effective for the Company for fiscal years beginning after December 15, 2017. The Company anticipates the standard will have an immaterial effect on consolidated statements of cash flows.
In March 2017, the FASB issued authoritative guidance related to the presentation of net periodic pension cost in the income statement. This guidance requires that the service cost component of net periodic pension cost is presented in the same line as
36
other compensation costs arising from services rendered by the respective employees during the period. The other components of net periodic pension cost are required to be presented in the income statement separately from the service cost component and outside of earnings from operations. This guidance also allows for the service cost component to be eligible for capitalization when applicable. This guidance is effective for fiscal years beginning after December 15, 2017, which will be the Company's first quarter of fiscal 2019, and requires retrospective adoption for the presentation of the service cost component and other components of net periodic pension cost in the income statement and prospective adoption for capitalization of the service cost component. Early adoption is permitted at the beginning of a fiscal year. The Company adopted this standard in the first quarter of fiscal 2018 and it had no effect on the condensed consolidated financial statements and related disclosures.
In March 2016, the FASB issued ASU No. 2016-09, Improvements to Employee Share-Based Payment Accounting. The new standard is intended to simplify accounting for share based employment awards to employees. Changes include: all excess tax benefits/deficiencies should be recognized as income tax expense/benefit; entities can make elections on how to account for forfeitures; and cash paid by an employer when directly withholding shares for tax withholding purposes should be classified as a financing activity on the cash flow statement. The Company implemented the new standard in the first quarter of fiscal 2018. The primary impact of implementation was the recognition of excess tax benefits in our provision for income taxes rather than paid-in capital beginning with the first quarter of fiscal 2018. Upon adoption, the balance of the unrecognized excess tax benefits of approximately $172,000 was reversed with the impact recorded to retained earnings. Prior to the adoption of this standard, that amount would have been recognized as an adjustment to "Additional paid-in capital" in the Consolidated Balance Sheets. Excess tax benefits will be recorded in the operating section of the Consolidated Statements of Cash Flows on a prospective basis. Prior to fiscal 2018, the tax benefits or shortfalls were recorded in financing cash flows. The presentation requirements for cash flows related to employee taxes paid for withheld shares in the financing section had no impact to any of the periods presented in our Consolidated Statements of Cash Flows since such cash flows have historically been presented as a financing activity.
In July 2015, the FASB issued authoritative guidance to simplify the subsequent measurement of inventories by replacing the lower of cost or market test with a lower of cost and net realizable value test. This guidance is effective for fiscal years beginning after December 15, 2016 and requires prospective adoption with early adoption permitted. The Company adopted this standard in the first quarter of fiscal 2018 and it had no effect on the consolidated financial statements and related disclosures.
In May 2014, the Financial Accounting Standards Board ("FASB") issued Accounting Standards Update ("ASU") No. 2014-09, Revenue from Contracts with Customers (Topic 606) (ASU 2014-09), and has modified the standard thereafter. The core principal of the standard requires an entity to recognize the amount of revenue to which it expects to be entitled for the transfer of promised goods or services to customers. ASU 2014-09 defines a five-step process to achieve this core principle and, in doing so, more judgment and estimates may be required within the revenue recognition process than are required under existing U.S. GAAP. The new revenue standard will be effective for the Company on February 1, 2018. The standard permits the use of either a full retrospective method, where the standard is applied to each prior reporting period presented or a cumulative effect transition method, or modified retrospective method, where the cumulative effect of initially applying the standard is recognized at the date of initial application. The Company will adopt the standard in the first quarter of 2019 using the modified retrospective approach to adoption. Our sales generally involve single performance obligations to ship goods pursuant to customer purchase orders without further underlying contracts. Prices for our products are based on published price lists, customer agreements and individual customer orders which, for certain arrangements, involve variable consideration such as sales volume rebates to customers which is currently recorded as sales are recorded. We currently record sales when products are shipped and title and other risks and rewards of ownership have passed to the customer. Under ASU 2014-09, we will record sales when our customers obtain control of our products. Accordingly, we expect adoption of this standard will have minimal effect on our revenues and disclosure.
Item 7A. Quantitative and Qualitative Disclosures about Market Risk
The Company is subject to interest rate risk related to its seasonal borrowings used to finance additional inventory and receivables. Rising interest rates may adversely affect the Company's results of operations and cash flows related to its variable-rate bank borrowings under its credit line with PNC. Accordingly, a 100-basis point upward fluctuation in PNC's base rate would have caused the Company to incur additional interest charges of approximately $214,000 for the twelve months ended January 31, 2018 . The Company would have benefited from a similar interest savings if the base rate were to have fluctuated downward by a like amount.
37
Table of Contents
The Company's business is subject to changes in the price of raw materials used to manufacture its products, such as steel, plastic, wood, aluminum, polyethylene, polypropylene, plywood, particleboard, and cartons, as well as the price of petroleum, which not only affects the cost of plastic, but also the Company's transportation costs and costs of operating its manufacturing facilities. With respect to the Company's annual contracts (or those contracts that have longer terms), the Company may have limited ability to increase prices during the term of the contract. The Company has, however, negotiated increased flexibility under many of these contracts allowing the Company to increase prices on future orders. Nevertheless, even with respect to these more flexible contracts, the Company does not have the ability to increase prices on orders received prior to any announced price increases. Due to the intensely seasonal nature of its business, the Company may receive significant orders during the first and second quarters for delivery in the second and third quarters. With respect to any of the contracts described above, if the costs of raw materials increase suddenly or unexpectedly, the Company cannot be certain that it will be able to implement corresponding increases in its sales prices in order to offset such increased costs. Significant cost increases in providing products during a given contract period can adversely impact operating results and have done so during prior years, especially 2009, and 2012. The Company typically benefits from any decreases in raw material costs under the contracts described above.
38
Item 8. Financial Statements and Supplementary Data
INDEX TO CONSOLIDATED FINANCIAL STATEMENTS
| Page Numbers |
Report of Independent Registered Public Accounting Firm | 40 |
Consolidated Balance Sheets as of January 31, 2018 and 2017 | 41 |
Consolidated Statements of Operation for the Years Ended January 31, 2018, 2017 and 2016 | 43 |
Consolidated Statements of Comprehensive Income (Loss) for the Years Ended January 31, 2018, 2017 and 2016 | 44 |
Consolidated Statements of Stockholders' Equity for the Years Ended January 31, 2018, 2017 and 2016 | 45 |
Consolidated Statements of Cash Flows for the Years Ended January 31, 2018, 2017 and 2016 | 46 |
Notes to Consolidated Financial Statements | 47 |
Schedule II - Valuation and Qualifying Accounts and Reserves for the Years Ended January 31, 2018, 2017 and 2016 | 69 |
39
REPORT OF INDEPENDENT REGISTERED PUBLIC ACCOUNTING FIRM
To the Shareholders and the Board of Directors of Virco Mfg. Corporation
Opinion on the Financial Statements
We have audited the accompanying consolidated balance sheets of Virco Mfg. Corporation (the "Company") as of January 31, 2018 and 2017, the related consolidated statements of income, comprehensive income, shareholders' equity and cash flows for each of the three years in the period ended January 31, 2018, and the related notes and financial statement schedule listed in the Index at Item 15 (a) (collectively referred to as the "Consolidated financial statements"). In our opinion, the consolidated financial statements present fairly, in all material respects, the financial position of the Company at January 31, 2018 and 2017, and the results of its operations and its cash flows for each of the three years in the period ended January 31, 2018, in conformity with U.S. generally accepted accounting principles.
Basis for Opinion
These financial statements are the responsibility of the Company's management. Our responsibility is to express an opinion on the Company's financial statements based on our audits. We are a public accounting firm registered with the Public Company Accounting Oversight Board (United States) (PCAOB) and are required to be independent with respect to the Company in accordance with the U.S. federal securities laws and the applicable rules and regulations of the Securities and Exchange Commission and the PCAOB.
We conducted our audits in accordance with the standards of the PCAOB. Those standards require that we plan and perform the audit to obtain reasonable assurance about whether the financial statements are free of material misstatement, whether due to error or fraud. The Company is not required to have, nor were we engaged to perform, an audit of its internal control over financial reporting. As part of our audits we are required to obtain an understanding of internal control over financial reporting but not for the purpose of expressing an opinion on the effectiveness of the Company's internal control over financial reporting. Accordingly, we express no such opinion.
Our audits included performing procedures to assess the risks of material misstatement of the financial statements, whether due to error or fraud, and performing procedures that respond to those risks. Such procedures included examining, on a test basis, evidence regarding the amounts and disclosures in the financial statements. Our audits also included evaluating the accounting principles used and significant estimates made by management, as well as evaluating the overall presentation of the financial statements. We believe that our audits provide a reasonable basis for our opinion.
/s/ Ernst & Young LLP
We have served as the Company's auditor since 1993.
Los Angeles, California
April 27, 2018
40
Virco Mfg. Corporation
Consolidated Balance Sheets
| January 31, | ||||||
2018 |
| 2017 | |||||
(In thousands) | |||||||
Assets |
|
|
| ||||
Current assets |
|
|
| ||||
Cash | $ | 534 | |
| $ | 788 | |
Trade accounts receivables (net of allowance for doubtful accounts of $200 at January 31, 2018 and 2017) | 11,385 | |
| 9,915 | | ||
Other receivables | 29 | |
| 216 | | ||
Income tax receivable | 171 | |
| 275 | | ||
Inventories, net | 42,057 | |
| 35,689 | | ||
Prepaid expenses and other current assets | 1,537 | |
| 1,610 | | ||
Total current assets | 55,713 | |
| 48,493 | | ||
Property, plant and equipment |
|
|
| ||||
Land | 3,731 | |
| 1,671 | | ||
Land improvements | 688 | |
| 675 | | ||
Buildings and building improvements | 51,176 | |
| 46,021 | | ||
Machinery and equipment | 103,015 | |
| 99,896 | | ||
Leasehold improvements | 809 | |
| 842 | | ||
Total property, plant and equipment | 159,419 | |
| 149,105 | | ||
Less accumulated depreciation and amortization | 116,977 | |
| 114,780 | | ||
Net property, plant and equipment | 42,442 | |
| 34,325 | | ||
Deferred income tax assets, net | 10,093 | |
| 17,008 | | ||
Other assets | 8,375 | |
| 8,361 | | ||
Total assets | $ | 116,623 | |
| $ | 108,187 | |
See accompanying notes.
41
Virco Mfg. Corporation
Consolidated Balance Sheets
| January 31, | ||||||
| 2018 |
| 2017 | ||||
| (In thousands, except share data) | ||||||
Liabilities |
|
|
| ||||
Current liabilities |
|
|
| ||||
Accounts payable | $ | 14,106 | |
| $ | 12,388 | |
Accrued compensation and employee benefits | 4,779 | |
| 5,138 | | ||
Current portion of long-term debt | 4,681 | |
| 68 | | ||
Other accrued liabilities | 4,157 | |
| 3,991 | | ||
Total current liabilities | 27,723 | |
| 21,585 | | ||
Non-current liabilities |
|
|
| ||||
Accrued self-insurance | 1,425 | |
| 1,350 | | ||
Accrued retirement benefits | 14,664 | |
| 18,699 | | ||
Income tax payable | 44 | |
| 36 | | ||
Long-term debt, less current portion | 12,000 | |
| 4,943 | | ||
Other accrued liabilities | 2,055 | |
| 2,220 | | ||
Total non-current liabilities | 30,188 | |
| 27,248 | | ||
Commitments and contingencies | |
| | ||||
Stockholders' equity |
|
|
| ||||
Preferred stock: |
|
|
| ||||
Authorized 3,000,000 shares, $.01 par value; none issued or outstanding | - | |
| - | | ||
Common stock: |
|
|
| ||||
Authorized 25,000,000 shares, $.01 par value; issued and outstanding 15,357,457 shares in 2018 and 15,179,664 shares in 2017 | 154 | |
| 152 | | ||
Additional paid-in capital | 117,465 | |
| 116,976 | | ||
Accumulated deficit | (49,648 | ) |
| (46,380 | ) | ||
Accumulated other comprehensive loss | (9,259 | ) |
| (11,394 | ) | ||
Total stockholders' equity | 58,712 | |
| 59,354 | | ||
Total liabilities and stockholders' equity | $ | 116,623 | |
| $ | 108,187 | |
See accompanying notes.
42
Virco Mfg. Corporation
Consolidated Statements of Operation
| Year ended January 31, | ||||||||||
| 2018 |
| 2017 |
| 2016 | ||||||
| (In thousands, except per share data) | ||||||||||
Net sales | $ | 189,287 | |
| $ | 173,417 | |
| $ | 168,595 | |
Costs of goods sold | 123,816 | |
| 110,874 | |
| 108,985 | | |||
Gross profit | 65,471 | |
| 62,543 | |
| 59,610 | | |||
Selling, general and administrative expenses | 61,528 | |
| 56,601 | |
| 53,653 | | |||
(Gain) loss on sale of property, plant & equipment | (16 | ) |
| (2 | ) |
| 9 | | |||
Operating income | 3,959 | |
| 5,944 | |
| 5,948 | | |||
Interest expense, net | 1,545 | |
| 1,217 | |
| 1,281 | | |||
Income before income taxes | 2,414 | |
| 4,727 | |
| 4,667 | | |||
Income tax expense (benefit) | 5,623 | |
| (18,033 | ) |
| 118 | | |||
Net (loss) income | $ | (3,209 | ) |
| $ | 22,760 | |
| $ | 4,549 | |
|
|
|
|
|
| ||||||
Net (loss) income per common share (a): |
|
|
|
|
| ||||||
Basic | $ | (0.21 | ) |
| $ | 1.51 | |
| $ | 0.31 | |
Diluted | $ | (0.21 | ) |
| $ | 1.49 | |
| $ | 0.30 | |
Weighted average shares outstanding: |
|
|
|
|
| ||||||
Basic | 15,244 | |
| 15,067 | |
| 14,914 | | |||
Diluted | 15,244 | |
| 15,266 | |
| 15,118 | | |||
(a) For fiscal year 2018, approximately 147,000 shares of common stock equivalents were excluded in the computation of diluted net income per share, as the effect would be anti-dilutive.
See accompanying notes.
43
Virco Mfg. Corporation
Consolidated Statements of Comprehensive (Loss) Income
| Years ended January 31, | ||||||||||
| 2018 |
| 2017 |
| 2016 | ||||||
| (In thousands) | ||||||||||
Net (loss) income | $ | (3,209 | ) |
| $ | 22,760 | |
| $ | 4,549 | |
Other comprehensive (loss) income |
|
|
|
|
| ||||||
Pension adjustments (net of tax $1,267, $1,816, $0 in 2018, 2017 and 2016) | 2,135 | |
| 2,936 | |
| 5,904 | | |||
Comprehensive (loss) income | $ | (1,074 | ) |
| $ | 25,696 | |
| $ | 10,453 | |
See accompanying notes.
44
Virco Mfg. Corporation
Consolidated Statements of Stockholders' Equity
| Common Stock |
|
|
|
|
|
|
|
| |||||||||||||
In thousands, except share data | Shares |
| Amount |
| Additional Paid-in Capital |
| Accumulated Deficit |
| Accumulated Other Comprehensive Loss |
| Total Stockholder's Equity | |||||||||||
Balance at January 31, 2015 | 14,852,640 | |
| $ | 149 | |
| $ | 116,348 | |
| $ | (73,690 | ) |
| $ | (20,234 | ) |
| $ | 22,573 | |
Net income | - | |
| - | |
| - | |
| 4,549 | |
| - | |
| 4,549 | | |||||
Pension adjustments, net of tax effect $0 | - | |
| - | |
| - | |
| - | |
| 5,904 | |
| 5,904 | | |||||
Shares vested and others | 145,547 | |
| 1 | |
| (207 | ) |
| 1 | |
| - | |
| (205 | ) | |||||
Stock compensation expense | - | |
| - | |
| 492 | |
| - | |
| - | |
| 492 | | |||||
Balance at January 31, 2016 | 14,998,187 | |
| $ | 150 | |
| $ | 116,633 | |
| $ | (69,140 | ) |
| $ | (14,330 | ) |
| $ | 33,313 | |
Net income | - | |
| - | |
| - | |
| 22,760 | |
| - | |
| 22,760 | | |||||
Pension adjustments, net of tax effect of $1,816 | - | |
| - | |
| - | |
| - | |
| 2,936 | |
| 2,936 | | |||||
Shares vested and others | 181,477 | |
| 2 | |
| (266 | ) |
| - | |
| - | |
| (264 | ) | |||||
Stock compensation expense | - | |
| - | |
| 609 | |
| - | |
| - | |
| 609 | | |||||
Balance at January 31, 2017 | 15,179,664 | |
| $ | 152 | |
| $ | 116,976 | |
| $ | (46,380 | ) |
| $ | (11,394 | ) |
| $ | 59,354 | |
Beginning balance adjustment to retained earnings as a result of the adoption of ASU 2016-09 | - | |
| - | |
| - | |
| 171 | |
| - | |
| 171 | | |||||
Net loss | - | |
| - | |
| - | |
| (3,209 | ) |
| - | |
| (3,209 | ) | |||||
Pension adjustments, net of tax effect of $1,267 | - | |
| - | |
| - | |
| - | |
| 2,135 | |
| 2,135 | | |||||
Cash dividends | - | |
| - | |
| - | |
| (230 | ) |
| - | |
| (230 | ) | |||||
Shares vested and others | 177,793 | |
| 2 | |
| (341 | ) |
| - | |
| - | |
| (339 | ) | |||||
Stock compensation expense | - | |
| - | |
| 830 | |
| - | |
| - | |
| 830 | | |||||
Balance at January 31, 2018 | 15,357,457 | |
| $ | 154 | |
| $ | 117,465 | |
| $ | (49,648 | ) |
| $ | (9,259 | ) |
| $ | 58,712 | |
See accompanying notes.
45
Virco Mfg. Corporation
Consolidated Statements of Cash Flows
| Year Ended January 31, | ||||||||||
2018 |
| 2017 |
| 2016 | |||||||
| (In thousands) | ||||||||||
Operating activities |
|
|
|
|
| ||||||
Net (loss) income | $ | (3,209 | ) |
| $ | 22,760 | |
| $ | 4,549 | |
Adjustments to reconcile net income to net cash provided by operating activities: |
|
|
|
|
| ||||||
Depreciation and amortization | 5,466 | |
| 5,026 | |
| 4,757 | | |||
Increase in provision for doubtful accounts | 55 | |
| 160 | |
| 141 | | |||
Increase in inventory reserve | 493 | |
| 626 | |
| 350 | | |||
(Gain) loss on sale of property, plant and equipment | (16 | ) |
| (2 | ) |
| 9 | | |||
Deferred income taxes | 5,821 | |
| (18,122 | ) |
| 77 | | |||
Stock-based compensation | 830 | |
| 609 | |
| 493 | | |||
Defined benefit plan, recognized net loss due to settlements | - | |
| - | |
| 587 | | |||
Amortization of net actuarial loss for pension plans | 955 | |
| 1,328 | |
| 2,013 | | |||
Changes in operating assets and liabilities: |
|
|
|
|
| ||||||
Trade accounts receivable | (1,470 | ) |
| 14 | |
| 544 | | |||
Other receivables | 181 | |
| (182 | ) |
| 10 | | |||
Inventories | (6,861 | ) |
| (1,712 | ) |
| (8,275 | ) | |||
Income taxes | 112 | |
| 41 | |
| (54 | ) | |||
Prepaid expenses and other current assets | 73 | |
| (536 | ) |
| (532 | ) | |||
Accounts payable and accrued liabilities | (748 | ) |
| (4,148 | ) |
| 2,838 | | |||
Net cash provided by operating activities | 1,682 | |
| 5,862 | |
| 7,507 | | |||
Investing activities |
|
|
|
|
| ||||||
Capital expenditures | (6,208 | ) |
| (4,408 | ) |
| (4,261 | ) | |||
Purchase of manufacturing facility | (7,200 | ) |
| - | |
| - | | |||
Proceeds from sale of property, plant and equipment | 22 | |
| 2 | |
| 8 | | |||
Net proceeds (investments in) from life insurance | 119 | |
| (65 | ) |
| 56 | | |||
Net cash used in investing activities | (13,267 | ) |
| (4,471 | ) |
| (4,197 | ) | |||
Financing activities |
|
|
|
|
| ||||||
Proceeds from long-term debt | 36,742 | |
| 37,447 | |
| 31,960 | | |||
Repayment of long-term debt | (25,072 | ) |
| (38,601 | ) |
| (34,719 | ) | |||
Common stock repurchased | (339 | ) |
| (264 | ) |
| (206 | ) | |||
Net cash provided by (used in) financing activities | 11,331 | |
| (1,418 | ) |
| (2,965 | ) | |||
|
|
|
|
|
| ||||||
Net (decrease) increase in cash | (254 | ) |
| (27 | ) |
| 345 | | |||
Cash at beginning of year | 788 | |
| 815 | |
| 470 | | |||
Cash at end of year | $ | 534 | |
| $ | 788 | |
| $ | 815 | |
Supplemental disclosures of cash flow information |
|
|
|
|
| ||||||
Cash paid during the year for: |
|
|
|
|
| ||||||
Interest | $ | 1,545 | |
| $ | 1,217 | |
| $ | 1,281 | |
Income tax, net of refunds | 46 | |
| 49 | |
| 72 | | |||
See accompanying notes.
46
VIRCO MFG. CORPORATION
Notes to Consolidated Financial Statements
January 31, 2018
1. Summary of Business and Significant Accounting Policies
Business
Virco Mfg. Corporation (the "Company"), which operates in one business segment, is engaged in the design, production and distribution of quality furniture for the commercial and education markets. Over 68 years of manufacturing operations have resulted in a wide product assortment. Major products include mobile tables, mobile storage equipment, desks, computer furniture, chairs, activity tables, folding chairs and folding tables. The Company manufactures its products in Torrance, California, and Conway, Arkansas, for sale primarily in the United States.
The Company operates in a seasonal business, and requires significant amounts of working capital under its credit facility to fund acquisitions of inventory and finance receivables during the summer delivery season. Restrictions imposed by the terms of the Company's credit facility may limit the Company's operating and financial flexibility. However, management believes that its existing cash and available borrowings under its credit facility, and any cash generated from operations will be sufficient to fund its working capital requirements, capital expenditures and other obligations through the next 12 months.
Principles of Consolidation
The consolidated financial statements include the accounts of Virco Mfg. Corporation and its wholly-owned subsidiaries. All intercompany balances and transactions have been eliminated in consolidation.
Management Use of Estimates
Preparation of financial statements in conformity with U.S. generally accepted accounting principles requires management to make estimates and assumptions. These estimates and assumptions affect the reported amounts of assets and liabilities - and disclosure of contingent assets and liabilities - at the date of the financial statements, as well as the reported amounts of revenues and expenses during the reporting period. Significant estimates made by management include, but are not limited to, valuation of inventory; deferred tax assets and liabilities; useful lives of property, plant, and equipment; liabilities under pension, warranty, self-insurance, and environmental claims; and the accounts receivable allowance for doubtful accounts. Actual results could differ from these estimates.
Fiscal Year End
Fiscal years 2018 , 2017 , and 2016 refer to the fiscal years ended January 31, 2018 , 2017 and 2016 respectively.
Concentration of Credit Risk
Financial instruments which potentially subject the Company to concentrations of credit risk consist principally of accounts receivable. The Company performs ongoing credit evaluations of its customers and maintains allowances for potential credit losses. Sales to the Company's recurring customers are generally made on open account with terms consistent with the industry. Credit is extended based on an evaluation of the customer's financial condition and payment history. Past due accounts are determined based on how recently payments have been made in relation to the terms granted. Amounts are written off against the allowance in the period that the Company determines that the receivable is not collectable. The Company purchases insurance on receivables from certain commercial customers to minimize the Company's credit risk. The Company does not typically obtain collateral to secure credit risk. Customers with inadequate credit are required to provide cash in advance or letters of credit. The Company does not assess interest on receivable balances. A substantial percentage of the Company's receivables come from low-risk government entities. No customer exceeded 10% of the Company's sales for fiscal years ended January 31, 2018 , 2017 and 2016. Foreign sales were approximately 6.3% , 6.3% and 6.7% of the Company's sales for fiscal years 2018 , 2017 and 2016 , respectively.
No single customer accounted for more than 10% of the Company's accounts receivable at January 31, 2018 or 2017 . Because of the short time between shipment and collection, the net carrying value of receivables approximates the fair value for these assets.
47
Fair Values of Financial Instruments
The fair values of the Company's cash, accounts receivable, and accounts payable approximate their carrying amounts due to their short-term nature.
Financial assets and liabilities measured at fair value on a recurring basis are classified in one of the three following categories, which are described below:
Level 1 - Valuations based on unadjusted quoted prices for identical assets in an active market.
Level 2 - Valuations based on quoted prices in markets where trading occurs infrequently or whose values are based on quoted prices of instruments with similar attributes in active markets.
Level 3 - Valuations based on inputs that are unobservable and involve management judgment and our own assumptions about market participants and pricing.
Financial assets measured at fair value on a recurring basis include assets associated with the Virco Employees Retirement Plan.
Inventories
Inventory is valued at the lower of cost or net realizable value (determined on a first-in, first-out basis) and includes material, labor, and factory overhead. The Company maintains allowances for estimated slow moving and obsolete inventory to reflect the difference between the lower of cost of inventory and the estimated market value. Allowances for slow moving and obsolete inventory are determined through a physical inspection of the product in connection with a physical inventory, a review of slow-moving product, and consideration of active marketing programs. The market for education furniture is traditionally driven by value, not style, and the Company has not typically incurred significant obsolescence expenses. If market conditions are less favorable than those anticipated by management, additional allowances may be required. Due to reductions in sales volume in the past years, the Company's manufacturing facilities are operating at reduced levels of capacity. The Company records the cost of excess capacity as a period expense, not as a component of capitalized inventory valuation.
The following table presents an updated breakdown of the Company's net inventory (in thousands) as of January 31, 2018 and 2017 :
|
| January 31, | ||||
|
| 2018 |
| 2017 | ||
Finished goods |
| 13,054 | |
| 11,174 | |
WIP |
| 16,627 | |
| 13,486 | |
Raw materials |
| 12,376 | |
| 11,029 | |
Inventories, net |
| 42,057 | |
| 35,689 | |
Property, Plant and Equipment
Property, plant and equipment are stated at cost, less accumulated depreciation. Depreciation and amortization are computed on the straight-line method for financial reporting purposes based upon the following estimated useful lives:
Land improvements | 5 to 25 years |
Buildings and building improvements | 5 to 40 years |
Machinery and equipment | 3 to 10 years |
Leasehold improvements | shorter of lease or useful life |
The Company capitalizes the cost of betterments that extend the life of an asset. Repairs and maintenance that do not extend the life of an asset are expensed as incurred. Repair and maintenance expense was $1,518,000 , $1,460,000 and $1,759,000 for fiscal years ended January 31, 2018 , 2017 and 2016 , respectively.
The Company subleased space at one of its facilities on a month-to-month basis during 2018 , 2017 , and 2016 . Rental income was $40,000 , $40,000 , $51,000 for fiscal years ended January 31, 2018 , 2017 , and 2016 respectively.
48
The Company has established asset retirement obligations related to leased manufacturing facilities in accordance with Financial Accounting Standards Board (FASB) Accounting Standard Codification (ASC) Topic 410, "Asset Retirement and Environmental Obligations." Accrued asset retirement obligations are recorded at net present value and discounted over the life of the lease. Asset retirement obligations, included in other non-current liabilities were $170,000 and $590,000 at January 31, 2018 and 2017 , respectively.
| January 31, | ||||||
| 2018 |
| 2017 | ||||
Balance at beginning of period | $ | 590,000 | |
| $ | 581,000 | |
Decrease in obligation | (425,000 | ) |
| - | | ||
Accretion expense | 5,000 | |
| 9,000 | | ||
Balance at end of period | $ | 170,000 | |
| $ | 590,000 | |
Impairment of Long-Lived Assets
An impairment loss is recognized in the event facts and circumstances indicate the carrying amount of a long-lived asset may not be recoverable, and an estimate of future undiscounted cash flows is less than the carrying amount of the asset. Impairment is recorded based on the excess of the carrying amount of the impaired asset over the fair value. Generally, fair value represents the Company's expected future cash flows from the use of an asset or group of assets, discounted at a rate commensurate with the risks involved. There were no impairments in fiscal years 2018 , 2017 and 2016 .
Net (Loss) Income per Share
Basic net income per share is calculated by dividing net income by the weighted-average number of common shares outstanding. Diluted net income per share is calculated by dividing net income by the weighted-average number of common shares outstanding plus the dilution effect of stock grants. The following table sets forth the computation of basic and diluted income per share:
In thousands, except per share data |
| 2018 |
| 2017 |
| 2016 | ||||||
Numerator |
|
|
|
|
|
| ||||||
Net (loss) income |
| $ | (3,209 | ) |
| $ | 22,760 | |
| $ | 4,549 | |
Denominator |
|
|
|
|
|
| ||||||
Weighted-average shares - basic |
| 15,244 | |
| 15,067 | |
| 14,914 | | |||
Dilutive effect of equity incentive plans |
| - | |
| 199 | |
| 204 | | |||
Weighted-average shares - diluted (a) |
| 15,244 | |
| 15,266 | |
| 15,118 | | |||
Net (loss) income per common share |
|
|
|
|
|
| ||||||
Basic |
| $ | (0.21 | ) |
| $ | 1.51 | |
| $ | 0.31 | |
Diluted |
| (0.21 | ) |
| 1.49 | |
| 0.30 | | |||
(a) For fiscal year 2018, approximately 147,000 shares of common stock equivalents were excluded in the computation of diluted net income per share, as the effect would be anti-dilutive.
Environmental Costs
The Company is subject to numerous environmental laws and regulations in the various jurisdictions in which it operates that (a) govern operations that may have adverse environmental effects, such as the discharge of materials into the environment, as well as handling, storage, transportation and disposal practices for solid and hazardous wastes, and (b) impose liability for response costs and certain damages resulting from past and current spills, disposals or other releases of hazardous materials. Normal, recurring expenses related to operating the Company's factories in a manner that meets or exceeds environmental laws and regulations are matched to the cost of producing inventory.
Despite our efforts to comply with existing laws and regulations, compliance with more stringent laws or regulations, or stricter interpretation of existing laws, may require additional expenditures by us, some of which may be material. We reserve amounts for such matters when expenditures are probable and reasonably estimable.
49
Costs incurred to investigate and remediate environmental waste are expensed, unless the remediation extends the useful life of the assets employed at the site. At January 31, 2018 and 2017 , the Company had not capitalized any remediation costs and had not recorded any amortization expense in fiscal years 2018 , 2017 , and 2016 .
Advertising Costs
Advertising costs are expensed in the period during which the advertising space is run. Selling, general and administrative expenses include advertising costs of $974,000 in 2018 , $945,000 in 2017 , and $1,057,000 in 2016 . Prepaid advertising costs reported as a prepaid asset on the balance sheet at January 31, 2018 and 2017 , were $355,000 and $326,000 , respectively.
Product Warranty Expense
The Company provides a product warranty on most products. The standard warranty offered on products sold through January 31, 2013 is ten years. Effective February 1, 2014 through December 31, 2016, the Company modified its warranty to a limited lifetime warranty. Effective January 1, 2017, the Company modified the warranty offered to provide specific warranty periods by product component, with no warranty period longer than ten years. The Company generally provides that customers can return a defective product during the specified warranty period following purchase in exchange for a replacement product or that the Company can repair the product at no charge to the customer. The Company determines whether replacement or repair is appropriate in each circumstance. The Company uses historic data to estimate appropriate levels of warranty reserves. Because product mix, production methods, and raw material sources change over time, historic data may not always provide precise estimates for future warranty expense. The Company recorded warranty reserves of $925,000 and $1,000,000 as of January 31, 2018 and 2017 , respectively. The current portion of the warranty reserve was $400,000 and $500,000 for 2018 and 2017 , respectively.
Self-Insurance
In 2018 and 2017 , the Company was self-insured for product and general liability losses up to $250,000 per occurrence, for workers' compensation losses up to $250,000 per occurrence, and for auto liability up to $50,000 per occurrence. Actuaries assist the Company in determining its liability for the self-insured component of claims, which have been discounted to their net present value utilizing a discount rate of 2.00% in 2018 and 2.00% in 2017 .
Stock-Based Compensation Plans
The Company recognizes stock-based compensation cost for shares that are expected to vest, on a straight-line basis, over the requisite service period of the award.
Virco issued a 10% stock dividend or 3/2 stock split every year beginning in 1983 through 2003. Although the stock dividend had no cash consequences to the Company, the accounting methodology required for 10% dividends has affected the equity section of the balance sheet. When the Company records a 10% stock dividend, 10% of the market capitalization of the Company on the date of the declaration is reclassified from retained earnings to additional paid-in capital. During the period from 1983 through 2003, the cumulative effect of the stock dividends has been to reclassify over $122 million from retained earnings to additional paid-in capital. The equity section of the balance sheet on January 31, 2018 reflects additional paid-in capital of approximately $117 million and accumulated deficit of approximately $49.6 million . Other than the losses incurred during 2004-2006 and 2011-2014, the accumulated deficit is a result of the accounting reclassification, and is not the result of accumulated losses.
Accumulated Other Comprehensive Income (Loss), Net of Tax
The following table summarizes the changes in accumulated balances of other comprehensive income (loss) for the year ended January 31, 2018 and 2017 :
50
|
| January 31, | ||||||
(in thousands) |
| 2018 |
| 2017 | ||||
Balance as of beginning of year |
| $ | (11,394 | ) |
| $ | (14,330 | ) |
|
|
|
|
| ||||
Other comprehensive income before reclassifications |
| 1,180 | |
| 1,608 | | ||
Amounts reclassified from AOCI |
| 955 | |
| 1,328 | | ||
Net current period other comprehensive income |
| 2,135 | |
| 2,936 | | ||
|
|
|
|
| ||||
Balance as of end of year |
| $ | (9,259 | ) |
| $ | (11,394 | ) |
|
|
|
|
| ||||
The reclassifications out of accumulated other comprehensive income (loss) of $955,000 and $1,328,000 for the years ended January 31, 2018 and 2017 , respectively, related to amortization of actuarial losses.
Revenue Recognition
The Company recognizes revenue in accordance with FASB ASC Topic 605, "Revenue Recognition." Revenue is recognized when title passes under its various shipping terms, when classroom delivery services are complete, and when collectability is reasonably assured. The Company reports sales net of sales returns and allowances, sales taxes imposed by various government authorities, cash discounts and rebate to customers. In most instances, the Company sells furniture on bids and contracts, which may include multiple elements. For sales that include freight to the customer, many sales are delivered on the same day shipped, with an average delivery being in route for 1 to 3 days. Classroom delivery, which involves carrying the furniture to the classroom and setting the desks and chairs in place, typically occurs the day the furniture is delivered.
In accordance with ASC 605, 25, "Revenue Recognition - Multiple-Element Arrangements," revenue arrangements with multiple deliverables are generally accounted for by the Company on a combined unit of accounting as the furniture delivery and classroom delivery are generally provided at the same time. We recognize the consideration for the combined unit of accounting once the final item has been delivered and installed.
Revenue includes freight charged to customers; related costs are recorded in selling and administrative expense. Rebates, discounts, and other marketing program expenses directly related to the sale are recorded as a reduction to net sales.
Delivery Costs
For the fiscal years ended January 31, 2018 , 2017 and 2016 , shipping and classroom delivery costs of approximately $19,299,000 , $16,116,000 and $15,799,000 , respectively, were included in selling, general and administrative expenses.
Accounting for Income Taxes
The Company recognizes deferred income taxes under the asset and liability method of accounting for income taxes in accordance with the provisions of FASB ASC Topic 740, "Accounting for Income Taxes." Deferred income taxes are recognized for differences between the financial statement and tax basis of assets and liabilities at enacted statutory tax rates in effect for the years in which the differences are expected to reverse. The effect on deferred taxes of a change in tax rates is recognized in income in the period that includes the enactment date. A valuation allowance against deferred tax assets is recorded when it is determined to be more likely than not that the asset will not be realized.
2. New Accounting Pronouncements
In February 2018, the FASB issued authoritative guidance to address certain stranded income tax effects in accumulated other comprehensive income (loss) resulting from the 2017 Tax Cuts and Jobs Act (the "Tax Reform") enacted in December 2017. This guidance provides the Company with an option to reclassify stranded tax effected within accumulated other comprehensive income (loss) to retained earnings in each period in which the effect of the change in the U.S. federal corporate income tax rate due to the Tax Reform is recorded. The Company will adopt this standard in the first quarter of fiscal 2019. The Company is currently evaluating the effect the standard will have on consolidated financial statements and related disclosures.
In February 2016, the FASB issued ASU No. 2016-02, Leases . The new standard requires lessees to recognize most leases, including operating leases, on-balance sheet via a right of use asset and lease liability. Changes to the lessee accounting model
51
Table of Contents
may change key balance sheet measures and ratios, potentially effecting analyst expectations and compliance with financial covenants. The new standard becomes effective for the Company effective for fiscal years beginning after December 15, 2018, but may be adopted at any time, and requires a modified retrospective transition. The Company is currently evaluating the effect the standard will have on consolidated financial statements and related disclosures which could be significant.
In August 2016, the FASB issued ASU No. 2016-15, Statement of Cash Flows - Classification of Certain Cash Receipts and Cash Payments. The new standard provides classification guidance on eight cash flow issues including debt prepayment, settlement of zero-coupon bonds, contingent consideration payments made after a business combination, proceeds from the settlements of insurance claims, proceeds from the settlement of corporate-owned life insurance policies and distributions received from equity method investees. The new standard becomes effective for the Company for fiscal years beginning after December 15, 2017. The Company anticipates the standard will have an immaterial effect on consolidated statements of cash flows.
In March 2017, the FASB issued authoritative guidance related to the presentation of net periodic pension cost in the income statement. This guidance requires that the service cost component of net periodic pension cost is presented in the same line as other compensation costs arising from services rendered by the respective employees during the period. The other components of net periodic pension cost are required to be presented in the income statement separately from the service cost component and outside of earnings from operations. This guidance also allows for the service cost component to be eligible for capitalization when applicable. This guidance is effective for fiscal years beginning after December 15, 2017, which will be the Company's first quarter of fiscal 2019, and requires retrospective adoption for the presentation of the service cost component and other components of net periodic pension cost in the income statement and prospective adoption for capitalization of the service cost component. Early adoption is permitted at the beginning of a fiscal year. The Company adopted this standard in the first quarter of fiscal 2018 and it had no effect on the condensed consolidated financial statements and related disclosures.
In March 2016, the FASB issued ASU No. 2016-09, Improvements to Employee Share-Based Payment Accounting. The new standard is intended to simplify accounting for share based employment awards to employees. Changes include: all excess tax benefits/deficiencies should be recognized as income tax expense/benefit; entities can make elections on how to account for forfeitures; and cash paid by an employer when directly withholding shares for tax withholding purposes should be classified as a financing activity on the cash flow statement. The Company implemented the new standard in the first quarter of fiscal 2018. The primary impact of implementation was the recognition of excess tax benefits in our provision for income taxes rather than paid-in capital beginning with the first quarter of fiscal 2018. Upon adoption, the balance of the unrecognized excess tax benefits of approximately $172,000 was reversed with the impact recorded to retained earnings. Prior to the adoption of this standard, that amount would have been recognized as an adjustment to "Additional paid-in capital" in the Consolidated Balance Sheets. Excess tax benefits will be recorded in the operating section of the Consolidated Statements of Cash Flows on a prospective basis. Prior to fiscal 2018, the tax benefits or shortfalls were recorded in financing cash flows. The presentation requirements for cash flows related to employee taxes paid for withheld shares in the financing section had no impact to any of the periods presented in our Consolidated Statements of Cash Flows since such cash flows have historically been presented as a financing activity.
In July 2015, the FASB issued authoritative guidance to simplify the subsequent measurement of inventories by replacing the lower of cost or market test with a lower of cost and net realizable value test. This guidance is effective for fiscal years beginning after December 15, 2016 and requires prospective adoption with early adoption permitted. The Company adopted this standard in the first quarter of fiscal 2018 and it had no effect on the consolidated financial statements and related disclosures.
In May 2014, the Financial Accounting Standards Board ("FASB") issued Accounting Standards Update ("ASU") No. 2014-09, Revenue from Contracts with Customers (Topic 606) (ASU 2014-09), and has modified the standard thereafter. The core principal of the standard requires an entity to recognize the amount of revenue to which it expects to be entitled for the transfer of promised goods or services to customers. ASU 2014-09 defines a five-step process to achieve this core principle and, in doing so, more judgment and estimates may be required within the revenue recognition process than are required under existing U.S. GAAP. The new revenue standard will be effective for the Company on February 1, 2018. The standard permits the use of either a full retrospective method, where the standard is applied to each prior reporting period presented or a cumulative effect transition method, or modified retrospective method, where the cumulative effect of initially applying the standard is recognized at the date of initial application. The Company will adopt the standard in the first quarter of 2019 using the modified retrospective approach to adoption. Our sales generally involve single performance obligations to ship goods pursuant to customer purchase orders without further underlying contracts. Prices for our products are based on published price lists, customer agreements and individual customer orders which, for certain arrangements, involve variable consideration such as sales volume rebates to customers which is currently recorded as sales are recorded. We currently record sales when products are shipped and title and other risks and rewards of ownership have passed to the customer. Under ASU 2014-09, we will record sales when our customers obtain control of our products. Accordingly, we expect adoption of this standard will have minimal effect on our revenues and disclosure.
52
Table of Contents
3. Debt
Outstanding balances (in thousands) for the Company's long-term debt were as follows:
|
| January 31, | ||||||
In thousands, except per share data |
| 2018 |
| 2017 | ||||
Revolving credit line |
| $ | 10,059 | |
| $ | 4,914 | |
Other |
| 6,622 | |
| 97 | | ||
Total debt |
| 16,681 | |
| 5,011 | | ||
Less current portion |
| 4,681 | |
| 68 | | ||
Non-current portion |
| $ | 12,000 | |
| $ | 4,943 | |
On December 22, 2011, the Company entered into a Revolving Credit and Security Agreement (the "Credit Agreement") with PNC Bank, National Association, as administrative agent and lender ("PNC"). The credit agreement has been amended seventeen times subsequent to that date, which, among other things, extended the maturity date of the Credit Agreement for three years until March 19, 2023, increased the maximum availability under the Credit Agreement to $60,000,000 with seasonal adjustments to the credit limit and subject to borrowing base limitations, and includes a sub-limit of up to $3,000,000 for issuances of letters of credit, modified, eliminated or waived covenants, amended seasonal advances and established a 2,500,000 line for equipment financing.
The Credit Agreement provides the Borrowers with a secured revolving line of credit (the "Revolving Credit Facility") of up to $60,000,000, with seasonal adjustments to the credit limit and subject to borrowing base limitations, and includes a sub-limit of up to $3,000,000 for issuances of letters of credit. In addition, the Credit Agreement provides an Equipment Line for purchases of equipment up to $2,500,000. The Revolving Credit Facility is an asset-based line of credit that is subject to a borrowing base limitation and generally provides for advances of up to 85% of eligible accounts receivable, plus a percentage equal to the lesser of 60% of the value of eligible inventory or 85% of the liquidation value of eligible inventory, plus an amount ranging from $8,000,000 to $14,000,000 from December 1 through July 31 of each year, minus undrawn amounts of letters of credit and reserves. The Revolving Credit Facility is secured by substantially all of the Borrowers' personal property and certain of the Borrowers' real property. The principal amount outstanding under the Credit Agreement and any accrued and unpaid interest is due no later than March 19, 2023, and the Revolving Credit Facility is subject to certain prepayment penalties upon earlier termination of the Revolving Credit Facility. Prior to the maturity date, principal amounts outstanding under the Credit Agreement may be repaid and reborrowed at the option of the Borrowers without premium or penalty, subject to borrowing base limitations, seasonal adjustments and certain other conditions.
The Revolving Credit Facility bears interest, at the Borrowers' option, at either the Alternate Base Rate (as defined in the Credit Agreement) or the Eurodollar Currency Rate (as defined in the Credit Agreement), in each case plus an applicable margin. The applicable margin for Alternate Base Rate loans is a percentage within a range of 0.50% to 1.50% , and the applicable margin for Eurodollar Currency Rate loans is a percentage within a range of 1.50% to 2.50% , in each case based on the EBITDA of the Borrowers at the end of each fiscal quarter, and may be increased at PNC's option by 2.0% during the continuance of an event of default. Accrued interest with respect to principal amounts outstanding under the Credit Agreement is payable in arrears on a monthly basis for Alternative Base Rate loans, and at the end of the applicable interest period but at most every three months for Eurodollar Currency Rate loans. The interest rate at January 31, 2018 was 5.0% .
On April 4, 2016, the Company entered into Amendment No. 12, which retroactively modified the capital expenditure covenant at January 31, 2016 and extended the maturity to December 2019. On October 27, 2016 the Company entered into Amendment No. 13, which modified the line to allow for a credit card program through PNC Bank. On March 13, 2017 the Company entered into Amendment No. 14 which established an equipment line to facilitate the capital expenditure plan for 2018 and to establish covenants for 2018. On June 8, 2017, the Company entered into Amendment No. 15 to the Credit Agreement which, among other things, will allow the restatement of the amount of revolving advances to $14,000,000 for June 2017 and $11,000,000 for July 2017 and extend the time to borrow under the $2,500,000 Equipment Line until March 12, 2018. In August 2017, the Company purchased a manufacturing building in Conway Arkansas for $7,200,000 with Virco making a 20% down payment and the seller providing financing for the remaining balance of $5,760,000 for 20 years at a fixed rate of 4% per year. In connection to this purchase, the Company entered into Amendment No. 16 to the Credit Agreement with PNC Bank which, among other things, will (a) consent to the acquisition of the building, (b) permit the Company to incur the additional indebtedness and (c) amend the Credit Agreement in certain respects, which Lenders and Agent are willing to do on the terms
53
and subject to the conditions contained in this Amendment. On March 19, 2018, the Company entered into Amendment No. 17, which amended the Credit Agreement by (i) extending the maturity date of the Credit Agreement for three years until March 19, 2023, (ii) allowing dividends and stock buyback up to $2,000,000 in aggregate for any fiscal year, (iii) setting forth the minimum EBITDA financial covenant for fiscal quarter ending April 30, 2018 at ( $3,767,000 ) and two consecutive fiscal quarters ending July 31, 2018 at $6,402,000 , (iv) increasing the Maximum Revolving Advance Amount from $50,000,000 to $60,000,000 , and (v) setting forth the minimum fixed charge coverage ratio of not less than 1.10 to 1.00 commencing with the consecutive four fiscal quarter period ending October 31, 2018 and measured as of the end of each fiscal quarter until the maturity date of the Credit Agreement. In connection with the Seventeenth Amendment, the Borrowers also agreed to pay to PNC Bank a non-refundable extension fee of $250,000 .
The Credit Agreement also requires the Company to maintain the following financial maintenance covenants: (i) a minimum fixed charge coverage ratio, and (ii) a minimum EBITDA amount, in each case as of the end of the relevant monthly, quarterly or annual measurement period. As of January 31, 2018 , the Credit Agreement required the Company to maintain: (i) a minimum fixed charge coverage ratio of at least 1.10 to 1.00 for the four consecutive fiscal quarters ending January 31, 2018 , and (ii) a minimum EBITDA amount of $7,400,000 for the twelve consecutive fiscal months ending January 31, 2018 . The actual results of the Company with respect to the foregoing financial covenants for the period ending January 31, 2018 were as follows: (i) the Company maintained a fixed charge coverage ratio of greater than 1.41 to 1.00 for the four consecutive fiscal quarters ended January 31, 2018 , and (ii) the Company achieved EBITDA of $10,254,000 for the fiscal year ended January 31, 2018 .
In addition, the Credit Agreement contains a clean down provision that requires the Company to reduce borrowings under the line to less than $8,000,000 for a period of 30 consecutive days each fiscal year. The Company believes that normal operating cash flow will allow it to meet the clean down requirement with no adverse impact on the Company's liquidity.
Events of default (subject to certain cure periods and other limitations) under the Credit Agreement include, but are not limited to, (i) non-payment of principal, interest or other amounts due under the Credit Agreement, (ii) the violation of terms, covenants, representations or warranties in the Credit Agreement or related loan documents, (iii) any event of default under agreements governing certain indebtedness of the Borrowers and certain defaults by the Borrowers under other agreements that would materially adversely affect the Borrowers, (iv) certain events of bankruptcy, insolvency or liquidation involving the Borrowers, (v) judgments or judicial actions against the Borrowers in excess of $250,000 ,subject to certain conditions, (vi) the failure of the Company to comply with Pension Benefit Plans (as defined in the Credit Agreement), (vii) the invalidity of loan documents pertaining to the Credit Agreement, (viii) a change of control of the Borrowers and (ix) the interruption of operations of any of the Borrowers' manufacturing facilities for five consecutive days during the peak season or fifteen consecutive days during any other time, subject to certain conditions.
Pursuant to the Credit Agreement, substantially all of the Borrowers' accounts receivable are automatically and promptly swept to repay amounts outstanding under the Revolving Credit Facility upon receipt by the Borrowers. Due to this automatic liquidating nature of the Revolving Credit Facility, if the Borrowers breach any covenant, violate any representation or warranty or suffer a deterioration in their ability to borrow pursuant to the borrowing base calculation, the Borrowers may not have access to cash liquidity unless provided by PNC at its discretion. In addition, certain of the covenants and representations and warranties set forth in the Credit Agreement contain limited or no materiality thresholds, and many of the representations and warranties must be true and correct in all material respects upon each borrowing, which the Borrowers expect to occur on an ongoing basis. There can be no assurance that the Borrowers will be able to comply with all such covenants and be able to continue to make such representations and warranties on an ongoing basis.
The Company's line of credit with PNC is structured to provide seasonal credit availability during the Company's peak summer season. The Company believes that the Revolving Credit Facility will provide sufficient liquidity to meet its capital requirements in the next 12 months. Approximately $15,961,000 was available for borrowing as of January 31, 2018 .
As of January 31, 2018 , long-term debt repayments are approximately as follows (in thousands):
Year ending January 31, |
| ||
2019 | $ | 4,681 | |
2020 | 6,767 | | |
2021 | 767 | | |
2022 | 461 | | |
2023 | 419 | | |
Thereafter | 3,586 | | |
54
Management believes that the carrying value of debt approximated fair value at January 31, 2018 and 2017 , as all of the long-term debt bears interest at variable rates based on prevailing market conditions.
4. Retirement Plans
Pension Plans
The Company maintains three defined benefit pension plans, the Virco Employees Retirement Plan ("Employee Plan"), the Virco Important Performers Retirement Plan ("VIP Plan") and the Directors Plan. The annual measurement date for all plans for the fiscal years ended January 31, 2018 , 2017 and 2016 is January 31. The Company and its subsidiaries cover all employees hired prior to December 31, 2003 under the Employee Plan, which is a qualified noncontributory defined benefit retirement plan. Benefits under the Employee Plan are based on years of service and career average earnings. Benefit accruals under the Employee Plan were frozen effective December 31, 2003. All benefits were fully vested on January 31, 2018 and 2017.
The Company also provides a supplementary retirement plan for certain key employees, the VIP Plan. The VIP Plan provides a benefit up to 50% of average compensation for the last five years in the VIP Plan offset by benefits earned under the Employee Plan. Benefit accruals under the VIP Plan were frozen effective December 31, 2003. The VIP Plan benefits are secured by a life insurance program. Substantially all assets securing the VIP Plan are held in a rabbi trust. These cash surrender values are included in other assets in the consolidated balance sheets. The cash surrender values of the policies securing the VIP Plan were $3,411,000 and $3,367,000 at January 31, 2018 and 2017 , respectively. Death benefits payable under life insurance policies held by the Plan were approximately $9,095,000 and $9,189,000 at January 31, 2018 and 2017 , respectively. The Company maintains a rabbi trust to hold assets related to the VIP Retirement Plan and a Split Dollar Life Insurance Plan.
In April 2001, the Board of Directors established the Directors Plan, a non-qualified plan for non-employee directors of the Company. Benefit accruals under the Directors Plan were frozen effective December 31, 2003. At January 31, 2018 , the Directors Plan did not hold any assets.
Accounting policy regarding pensions requires management to make complex and subjective estimates and assumptions relating to amounts which are inherently uncertain. Three primary economic assumptions influence the reported values of plan liabilities and pension costs. The Company takes the following factors into consideration: discount rate, assumed rate of return and rate of increase in compensation.
The discount rate represents an estimate of the rate of return on a portfolio of high-quality fixed-income securities that would provide cash flows that match the expected benefit payment stream from the plans. When setting the discount rate, the Company utilizes a spot-rate yield curve developed from high-quality bonds currently available which reflects changes in rates that have occurred over the past year. This assumption is sensitive to movements in market rates that have occurred since the preceding valuation date, and therefore, may change from year to year.
Because the Company froze future benefit accruals for all benefit plans, the compensation increase assumption had no impact on pension expense, accumulated benefit obligation or projected benefit obligation for the period ended January 31, 2018 or 2017 .
The assumed rate of return on plan assets represents an estimate of long-term returns available to investors who hold a mixture of stocks, bonds, and cash equivalent securities. When setting its expected return on plan asset assumptions, the Company considers long-term rates of return on various asset classes (both historical and forecasted, using data collected from various sources generally regarded as authoritative) in the context of expected long-term average asset allocations for its defined benefit pension plan. The VIP Plan and Directors Plan are executive benefit plans that are not funded and is subject to the Company's creditors. Because this plan is not funded, the assumed rate of return has no impact on pension expense or the funded status of the plan.
The Company maintains a trust for and funds the pension obligations for the Employee Plan. The Board of Directors appoints a Retirement Plan Committee that establishes a policy for investment and funding strategies. Approximately 70% of the trust assets are managed by investment advisors and held in common trust funds with the balance managed by the Retirement Plan Committee. The Retirement Plan Committee has established target asset allocations for its investment advisors, who invest the trust assets in a variety of institutional collective trust funds.
The Company's investment advisors have developed a funding strategy that moves fund asset allocation from equity and other investments to fixed income instruments designed to mirror the changes in discount rates as the Plan becomes more fully funded. At January 31, 2018 less than 10% of the trust assets were held in these investments. The Retirement Plan Committee
55
receives quarterly reports addressing investment returns, funded status of the plan, and progress on the glidepath to fully funded status from the investment advisors and meets periodically with them to discuss investment performance.
At January 31, 2018 and 2017 , the amount of the plan assets invested in bond or short-term investment funds was 4% and 9% , respectively, and the balance of the trust was held in equity funds or investments. The trust does not hold any Company stock.
It is the Company's policy to contribute adequate funds to the trust accounts to cover benefit payments under the VIP Plan and the Directors Plan to maintain the funded status of the Employee Plan at a level which is adequate to avoid significant restrictions to the Employee Plan under the Pension Protection Act of 2006. The Company contributed $1.4 million , $1.4 million , and $1.6 million , to the trust in 2018 , 2017 , and 2016 , respectively. Contributions during fiscal year 2019 will depend upon actual investment results and benefit payments, but are anticipated to be approximately $0.9 million . During 2018 , 2017 , and 2016 , the Company paid approximately $345,000 , $536,000 and $591,000 respectively, in benefits per year under the non-qualified plans. It is anticipated that contributions to non-qualified plans will be approximately $345,000 for 2019 . At January 31, 2018 , accumulated other comprehensive loss of approximately $9.3 million , net of tax, is attributable to the pension plans.
The following tables set forth (in thousands) the funded status of the Company's pension plans at January 31, 2018 , and 2017 :
| Employee Plan |
| VIP Plan |
| Directors Plan | ||||||||||||||||||
1/31/2018 |
| 1/31/2017 |
| 1/31/2018 |
| 1/31/2017 |
| 1/31/2018 |
| 1/31/2017 | |||||||||||||
Change in Benefit Obligation |
|
|
|
| |||||||||||||||||||
Benefit obligation at beg. of year | $ | 31,212 | |
| $ | 32,659 | |
| $ | 8,292 | |
| $ | 8,701 | |
| $ | 257 | |
| $ | 280 | |
Service cost | - | |
| - | |
| - | |
| - | |
| - | |
| - | | ||||||
Interest cost | 1,217 | |
| 1,184 | |
| 367 | |
| 357 | |
| 9 | |
| 10 | | ||||||
Participant contributions | - | |
| - | |
| - | |
| - | |
| - | |
| - | | ||||||
Amendments | - | |
| - | |
| - | |
| - | |
| - | |
| - | | ||||||
Actuarial losses (gains) | 256 | |
| (1,125 | ) |
| 656 | |
| (266 | ) |
| 18 | |
| 3 | | ||||||
Plan settlement | - | |
| - | |
| - | |
| - | |
| - | |
| - | | ||||||
Benefits paid | (1,758 | ) |
| (1,506 | ) |
| (309 | ) |
| (500 | ) |
| (36 | ) |
| (36 | ) | ||||||
Benefit obligation at end of year | $ | 30,927 | |
| $ | 31,212 | |
| $ | 9,006 | |
| $ | 8,292 | |
| $ | 248 | |
| $ | 257 | |
Change in Plan Assets |
|
|
|
|
|
|
|
|
|
|
| ||||||||||||
Fair value at beg. of year | $ | 22,911 | |
| $ | 19,848 | |
| $ | - | |
| $ | - | |
| $ | - | |
| $ | - | |
Actual return on plan assets | 4,726 | |
| 3,169 | |
| - | |
| - | |
| - | |
| - | | ||||||
Company contributions | 1,380 | |
| 1,400 | |
| 309 | |
| 500 | |
| 36 | |
| 36 | | ||||||
Settlements | - | |
| - | |
| - | |
| - | |
| - | |
| - | | ||||||
Benefits paid | (1,758 | ) |
| (1,506 | ) |
| (309 | ) |
| (500 | ) |
| (36 | ) |
| (36 | ) | ||||||
Fair value at end of year | $ | 27,259 | |
| $ | 22,911 | |
| $ | - | |
| $ | - | |
| $ | - | |
| $ | - | |
Funded Status |
|
|
|
|
|
|
|
|
|
|
| ||||||||||||
Unfunded status of the plan | $ | (3,668 | ) |
| $ | (8,301 | ) |
| $ | (9,006 | ) |
| $ | (8,292 | ) |
| $ | (248 | ) |
| $ | (257 | ) |
Amounts Recognized in Statement of Financial Position |
|
|
|
|
|
|
|
|
|
|
| ||||||||||||
Current liabilities | - | |
| - | |
| (312 | ) |
| (278 | ) |
| (34 | ) |
| (34 | ) | ||||||
Non-current liabilities | (3,668 | ) |
| (8,301 | ) |
| (8,694 | ) |
| (8,014 | ) |
| (214 | ) |
| (223 | ) | ||||||
Accrued benefit cost | $ | (3,668 | ) |
| $ | (8,301 | ) |
| $ | (9,006 | ) |
| $ | (8,292 | ) |
| $ | (248 | ) |
| $ | (257 | ) |
Amounts Recognized in Statement of Financial Position and Operations |
|
|
|
|
|
|
|
|
|
|
| ||||||||||||
Accrued benefit liability | $ | (3,668 | ) |
| $ | (8,301 | ) |
| $ | (9,006 | ) |
| $ | (8,292 | ) |
| $ | (248 | ) |
| $ | (257 | ) |
Accumulated other comp. loss (gain) | 5,749 | |
| 9,567 | |
| 2,863 | |
| 2,447 | |
| - | |
| - | | ||||||
Net amount recognized | $ | 2,081 | |
| $ | 1,266 | |
| $ | (6,143 | ) |
| $ | (5,845 | ) |
| $ | (248 | ) |
| $ | (257 | ) |
Items not yet Recognized as a Component of Net Periodic Pension Expense, Included in AOCI |
|
|
|
|
|
|
|
|
|
|
| ||||||||||||
Unrecognized net actuarial loss (gain) | $ | 5,749 | |
| $ | 9,567 | |
| $ | 2,863 | |
| $ | 2,447 | |
| $ | - | |
| $ | - | |
Unamortized prior service costs | - | |
| - | |
| - | |
| - | |
| - | |
| - | | ||||||
Net initial asset recognition | - | |
| - | |
| - | |
| - | |
| - | |
| - | | ||||||
| $ | 5,749 | |
| $ | 9,567 | |
| $ | 2,863 | |
| $ | 2,447 | |
| $ | - | |
| $ | - | |
56
| Employee Plan |
| VIP Plan |
| Directors Plan | ||||||||||||||||||
1/31/2018 |
| 1/31/2017 |
| 1/31/2018 |
| 1/31/2017 |
| 1/31/2018 |
| 1/31/2017 | |||||||||||||
Other Changes in Plan Assets and Benefit Obligations Recognized in Other Comprehensive Income |
|
|
|
| |||||||||||||||||||
Net loss (gain) | $ | (3,103 | ) |
| $ | (3,159 | ) |
| $ | 656 | |
| $ | (266 | ) |
| $ | - | |
| $ | 3 | |
Prior service cost | - | |
| - | |
| - | |
| | |
| - | |
| - | | ||||||
Amortization of (loss) gain | (715 | ) |
| (1,162 | ) |
| (240 | ) |
| (310 | ) |
| | |
| 144 | | ||||||
Amortization of prior service cost (credit) | - | |
| - | |
| - | |
| - | |
| - | |
| - | | ||||||
Amortization of initial asset | - | |
| - | |
| - | |
| - | |
| - | |
| - | | ||||||
Total recognized in other comprehensive (loss) income | $ | (3,818 | ) |
| $ | (4,321 | ) |
| $ | 416 | |
| $ | (576 | ) |
| $ | - | |
| $ | 147 | |
Items to be Recognized as a Component of Periodic Pension Cost for next fiscal year |
|
|
|
|
|
|
|
|
|
|
| ||||||||||||
Prior service cost | $ | - | |
| $ | - | |
| $ | - | |
| $ | - | |
| $ | - | |
| $ | - | |
Net actuarial loss (gain) | 362 | |
| 715 | |
| 330 | |
| 240 | |
| - | |
| - | | ||||||
| $ | 362 | |
| $ | 715 | |
| $ | 330 | |
| $ | 240 | |
| $ | - | |
| $ | - | |
Supplemental Data |
|
|
|
|
|
|
|
|
|
|
| ||||||||||||
Projected benefit obligation | $ | 30,927 | |
| $ | 31,212 | |
| $ | 9,006 | |
| $ | 8,292 | |
| $ | 248 | |
| $ | 257 | |
Accumulated benefit obligation | 30,927 | |
| 31,212 | |
| 9,006 | |
| 8,292 | |
| 248 | |
| 257 | | ||||||
Fair value of plan assets | 27,259 | |
| 22,911 | |
| - | |
| - | |
| - | |
| - | | ||||||
Components of Net Cost |
|
|
|
|
|
|
|
|
|
|
| ||||||||||||
Service cost | $ | - | |
| $ | - | |
| $ | - | |
| $ | - | |
| $ | - | |
| $ | - | |
Interest cost | 1,217 | |
| 1,184 | |
| 367 | |
| 357 | |
| 9 | |
| 10 | | ||||||
Expected return on plan assets | (1,367 | ) |
| (1,134 | ) |
| - | |
| - | |
| - | |
| - | | ||||||
Amortization of transition amount | - | |
| - | |
| - | |
| - | |
| - | |
| - | | ||||||
Recognized (gain) loss due to settlement | - | |
| - | |
| - | |
| - | |
| - | |
| - | | ||||||
Amortization of prior service cost | - | |
| - | |
| - | |
| - | |
| - | |
| - | | ||||||
Recognized net actuarial loss | 715 | |
| 1,162 | |
| 240 | |
| 310 | |
| - | |
| (144 | ) | ||||||
Benefit cost | $ | 565 | |
| $ | 1,212 | |
| $ | 607 | |
| $ | 667 | |
| $ | 9 | |
| $ | (134 | ) |
Estimated Future Benefit Payments |
|
|
|
|
|
|
|
|
|
|
| ||||||||||||
FYE 01-31-2019 | $ | 5,215 | |
|
|
| $ | 312 | |
|
|
| $ | 34 | |
|
| ||||||
FYE 01-31-2020 | 2,415 | |
|
|
| 324 | |
|
|
| 32 | |
|
| |||||||||
FYE 01-31-2021 | 2,077 | |
|
|
| 316 | |
|
|
| 31 | |
|
| |||||||||
FYE 01-31-2022 | 1,897 | |
|
|
| 352 | |
|
|
| 29 | |
|
| |||||||||
FYE 01-31-2023 | 1,895 | |
|
|
| 366 | |
|
|
| 27 | |
|
| |||||||||
FYE 01-31-2024 to 2028 | 9,325 | |
|
|
| 2,191 | |
|
|
| 70 | |
|
| |||||||||
Total | $ | 22,824 | |
|
|
| $ | 3,861 | |
|
|
| $ | 223 | |
|
| ||||||
Weighted Average Assumptions to Determine Benefit Obligations at Year-End |
|
|
|
|
|
|
|
|
|
|
| ||||||||||||
Discount rate | 3.75 | % |
| 4.25 | % |
| 4.00 | % |
| 4.50 | % |
| 3.75 | % |
| 4.25 | % | ||||||
Rate of compensation increase | N/A | |
| N/A | |
| N/A | |
| N/A | |
| N/A | |
| N/A | | ||||||
Weighted Average Assumptions to Determine Net Periodic Pension Cost |
|
|
|
|
|
|
|
|
|
|
| ||||||||||||
Discount rate | 4.25 | % |
| 4.00 | % |
| 4.25 | % |
| 4.25 | % |
| 4.25 | % |
| 4.00 | % | ||||||
Expected return on plan assets | 6.50 | % |
| 6.50 | % |
| N/A | |
| N/A | |
| N/A | |
| N/A | | ||||||
Rate of compensation increase | N/A | |
| N/A | |
| N/A | |
| N/A | |
| N/A | |
| N/A | | ||||||
57
Fair Value Measurements of Plan Assets
Employee Plan
| 1/31/2018 |
| 1/31/2017 | ||||
Level 1 Measurement |
|
|
| ||||
Cash & Cash Equivalents | $ | - | |
| $ | - | |
Common Stock | 9,701 | |
| 7,379 | | ||
Total Level 1 | $ | 9,701 | |
| $ | 7,379 | |
Level 2 Measurement |
|
|
| ||||
PNC Govt Money Fund | $ | 1,030 | |
| $ | 856 | |
Vanguard Total Bond | - | |
| 1,144 | | ||
Ishares Credit Bond ETF | 340 | |
| 172 | | ||
Vanguard INTM Term Investment | 702 | |
| 346 | | ||
Vanguard LT Investment | 1,973 | |
| - | | ||
Ishares Russell 2000 | 2,047 | |
| 1,771 | | ||
Ishares Russell MID-CAP | 2,129 | |
| 1,817 | | ||
Ishares Emerging Markets | 1,338 | |
| 1,110 | | ||
Ishares MCSI RAFE | 1,838 | |
| 1,553 | | ||
Ishares S&P Index | 4,825 | |
| - | | ||
Vanguard REIT | - | |
| 913 | | ||
Blackrock S&P Index | - | |
| 4,643 | | ||
Managed Investment Fund | 1,336 | |
| 1,207 | | ||
Total Level 2 | $ | 17,558 | |
| $ | 15,532 | |
Level 3 Measurement |
|
|
| ||||
None | N/A | |
| N/A | | ||
401(k) Retirement Plan
The Company's retirement plan, which covers all U.S. employees, allows participants to defer from 1% to 75% of their eligible compensation through a 401(k) retirement program. Through December 31, 2001, the plan included an employee stock ownership component. The plan continues to include Virco stock as one of the investment options. At January 31, 2018 and 2017 , the plan held 564,375 shares and 587,084 shares of Virco stock, respectively. For the fiscal year ended January 31, 2018 , the Company made a small contribution to employees enrolled in the Plan in connection with an auto enrollment program and initiated a Company match effective January 1, 2018. For the fiscal years ended January 31, 2018 , the compensation costs incurred for employer match was $44,000 . There was no employer match for fiscal year 2017 and 2016 .
Life Insurance
The Company provided post-retirement life insurance to certain retired employees under the Dual Option Life Insurance Plan. Effective January 2004, the Company terminated this plan for active employees. The Company has purchased split-dollar life insurance on the lives of the covered participants. Death benefits due to participants are approximately $2,450,000 . Cash surrender values of these policies, which are included in other assets in the consolidated balance sheets, were $2,092,000 and $2,231,000 at January 31, 2018 and 2017 , respectively. Death benefits payable under the policies were approximately $4,486,000 and $4,748,000 at January 31, 2018 and 2017 , respectively. Death benefits received under the Plan in excess of the benefit obligation will be retained in the trust and used to secure and fund benefits payable under the VIP Pension Plan. The Company maintains a rabbi trust to hold assets related to the Dual Option Life Insurance Plan. All assets securing this plan are held in the rabbi trust.
The following sets forth the Company's change in death benefits payable during the years ended January 31, 2018 and 2017 :
58
| 1/31/2018 |
| 1/31/2017 | ||||
Liability beginning of year | $ | 2,184,000 | |
| $ | 2,166,000 | |
Accretion expense | 54,000 | |
| 68,000 | | ||
Death benefits paid | (150,000 | ) |
| (50,000 | ) | ||
Liability end of year | $ | 2,088,000 | |
| $ | 2,184,000 | |
5. Stock-Based Compensation
Stock Incentive Plans
The Company's two stock plans are the 2011 Employee Stock Incentive Plan (the "2011 Plan") and the 2007 Employee Incentive Stock Plan (the "2007 Plan"). Under the 2011 Plan, the Company may grant an aggregate of 1,000,000 shares to its employees and non-employee directors in the form of stock options or awards. Restricted stock or stock units awarded under the 2011 Plan are expensed ratably over the vesting period of the awards. The Company determines the fair value of its restricted stock unit awards and related compensation expense as the difference between the market value of the awards on the date of grant less the exercise price of the awards granted. There were 504,404 awards granted and 259,284 awards were vested during fiscal 2018 . As of January 31, 2018 , there were approximately 303,832 shares available for future issuance under the 2011 Plan.
Under the 2007 Plan, the Company may grant an aggregate of 1,000,000 shares to its employees and non-employee directors in the form of stock options or awards. Restricted stock or stock units awarded under the 2007 Plan are expensed ratably over the vesting period of the awards. The Company determines the fair value of its restricted stock unit awards and related compensation expense as the difference between the market value of the awards on the date of grant less the exercise price of the awards granted. The Company granted no awards and the plan expired during fiscal 2018 .
Accounting for the Plans
Restricted Stock Unit Awards
The following table presents a summary of restricted stock and stock unit awards:
|
|
|
| Expense for 12 months ended |
| Unrecognized Compensation Cost at | |||||||||||||
Date of Grants | Units Granted | Terms of Vesting |
| 1/31/2018 |
| 1/31/2017 |
| 1/31/2016 |
| 1/31/2018 | |||||||||
2011 Stock Incentive Plan | | |
| |
| |
| |
| | |||||||||
06/20/2017 | 40,404 | | 1 year |
| $ | 133,000 | |
| $ | - | |
| $ | - | |
| $ | 67,000 | |
06/20/2017 | 464,000 | | 5 years |
| 292,000 | |
| - | |
| - | |
| 1,901,000 | | ||||
06/21/2016 | 51,284 | | 1 year |
| 67,000 | |
| 133,000 | |
| - | |
| - | | ||||
06/21/2016 | 36,000 | | 3 years |
| 16,000 | |
| 32,000 | |
| - | |
| - | | ||||
06/22/2015 | 48,000 | | 4 years |
| 33,000 | |
| 32,000 | |
| 22,000 | |
| 44,000 | | ||||
06/22/2015 | 27,174 | | 1 year |
| - | |
| 25,000 | |
| 50,000 | |
| - | | ||||
06/24/2014 | 490,000 | | 5 years |
| 240,000 | |
| 240,000 | |
| 246,000 | |
| 320,000 | | ||||
06/24/2014 | 28,626 | | 5 years |
| - | |
| - | |
| 25,000 | |
| - | | ||||
06/19/2012 | 520,000 | | 5 years |
| 49,000 | |
| 147,000 | |
| 150,000 | |
| - | | ||||
Totals for the period | | |
| $ | 830,000 | |
| $ | 609,000 | |
| $ | 493,000 | |
| $ | 2,332,000 | | |
59
A summary of the Company's restricted stock unit awards activity, and related information for the following years ended January 31, is as follows:
| 2018 |
| 2017 |
| 2016 | |||||||||||||||
| Restricted stock units |
| Weighted- average fair value of restricted stock units |
| Restricted stock units |
| Weighted- average fair value of restricted stock units |
| Restricted stock units |
| Weighted- average fair value of restricted stock units | |||||||||
Outstanding at beginning of year | 491,284 | |
| $ | 2.46 | |
| 657,174 | |
| $ | 2.34 | |
| 812,626 | |
| $ | 2.24 | |
Granted | 504,404 | |
| 4.95 | |
| 87,284 | |
| 3.89 | |
| 75,174 | |
| 2.76 | | |||
Vested | (259,284 | ) |
| 4.86 | |
| (223,174 | ) |
| 4.04 | |
| (212,626 | ) |
| 2.79 | | |||
Forfeited | (44,000 | ) |
| 4.42 | |
| (30,000 | ) |
| 2.61 | |
| (18,000 | ) |
| 2.74 | | |||
Outstanding at end of year | 692,404 | |
| 4.25 | |
| 491,284 | |
| 2.46 | |
| 657,174 | |
| 2.34 | | |||
Weighted-average fair value of restricted stock units granted during the year |
|
| 4.95 | |
|
|
| 3.89 | |
|
|
| 2.76 | | ||||||
The aggregate fair value of restricted stock unit awards vested during fiscal years 2018 , 2017 , and 2016 was $1,260,120 , $901,623 and $593,227 , respectively.
6. Income Taxes
The income tax expense (benefit) for the last three years is reconciled to the statutory federal income tax rate as follows (in thousands):
| Year ended January 31, | ||||||||||
| 2018 |
| 2017 |
| 2016 | ||||||
Statutory | $ | 794 | |
| $ | 1,607 | |
| $ | 1,587 | |
State taxes (net of federal tax) | 341 | |
| 363 | |
| 303 | | |||
Change in valuation allowance | 410 | |
| (19,831 | ) |
| (2,214 | ) | |||
State rate adjustment | (260 | ) |
| (548 | ) |
| 168 | | |||
Change in unrecognized tax benefits | 6 | |
| (1 | ) |
| (3 | ) | |||
Stock Compensation | (200 | ) |
| - | |
| - | | |||
Tax cuts and jobs act | 4,438 | |
| - | |
| - | | |||
Expirations of attributes | 143 | |
| 408 | |
| 229 | | |||
Other | (49 | ) |
| (31 | ) |
| 48 | | |||
Income tax expense (benefit) | $ | 5,623 | |
| $ | (18,033 | ) |
| $ | 118 | |
Significant components of the expense (benefit) for income taxes (in thousands) attributed to continuing operations are as follows:
60
| Year ended January 31, | ||||||||||
| 2018 |
| 2017 |
| 2016 | ||||||
Current |
|
|
|
|
| ||||||
Federal | $ | (296 | ) |
| $ | 24 | |
| $ | 1 | |
State | 98 | |
| 65 | |
| 40 | | |||
| (198 | ) |
| 89 | |
| 41 | | |||
Deferred |
|
|
|
|
| ||||||
Federal | 5,270 | |
| 1,519 | |
| 1,567 | | |||
State | 141 | |
| 190 | |
| 724 | | |||
| 5,411 | |
| 1,709 | |
| 2,291 | | |||
Change in Valuation Allowance | 410 | |
| (19,831 | ) |
| (2,214 | ) | |||
| 5,821 | |
| (18,122 | ) |
| 77 | | |||
Income tax expense (benefit) | $ | 5,623 | |
| $ | (18,033 | ) |
| $ | 118 | |
Deferred tax assets and liabilities (in thousands) are comprised of the following:
| Year ended January 31, | ||||||
| 2018 |
| 2017 | ||||
Deferred tax assets |
|
|
| ||||
Accrued vacation and sick leave | $ | 1,015 | |
| $ | 1,211 | |
Retirement plans | 3,756 | |
| 6,900 | | ||
Insurance reserves | 451 | |
| 633 | | ||
Warranty | 242 | |
| 383 | | ||
Net operating loss carryforwards | 4,722 | |
| 7,627 | | ||
Intangibles | - | |
| - | | ||
Inventory | 1,085 | |
| 1,418 | | ||
Other | 624 | |
| 1,005 | | ||
| $ | 11,895 | |
| $ | 19,177 | |
Deferred tax liabilities |
|
|
| ||||
Tax in excess of book depreciation | $ | (811 | ) |
| $ | (1,556 | ) |
Other | (66 | ) |
| (98 | ) | ||
| $ | (877 | ) |
| $ | (1,654 | ) |
Valuation allowance | (925 | ) |
| (515 | ) | ||
Net long term deferred tax asset | $ | 10,093 | |
| $ | 17,008 | |
|
|
|
| ||||
In assessing the realizability of deferred tax assets, the Company considers whether it is more likely than not that some portion or all of the deferred tax assets will not be realized. The ultimate realization of deferred tax assets is dependent upon the generation of future taxable income or reversal of deferred tax liabilities during the periods in which those temporary differences become deductible. The Company considers the scheduled reversal of deferred tax liabilities, projected future taxable income, and tax planning strategies in making this assessment. At October 31, 2016, the Company determined that it was more-likely-than-not to realize the majority of its deferred tax assets, and therefore released its valuation against those assets resulting in a benefit to income taxes. The Company has left a partial valuation allowance of $925,000 against certain state deferred tax assets that the Company does not believe it is more-likely-than-not to realize. At January 31, 2018 , the Company has net operating loss carryforwards of approximately $13,458,000 for federal and $30,979,000 for state income tax purposes, expiring at various dates through January 31, 2035.
The following table summarizes the activity related to our gross unrecognized tax benefits from February 1, 2016 to January 31, 2018 (in thousands):
61
| January 31, | ||||||
| 2018 |
| 2017 | ||||
Balances as of February 1, | $ | 29 | |
| $ | 31 | |
Increases related to prior year tax positions | 2 | |
| 1 | | ||
Decreases related to prior year tax positions | - | |
| - | | ||
Increases related to current year tax positions | 16 | |
| 5 | | ||
Decreases relating to settlements with taxing authorities | - | |
| - | | ||
Decreases related to lapsing of statute of limitations | (9 | ) |
| (8 | ) | ||
Balance as of January 31, | $ | 38 | |
| $ | 29 | |
At January 31, 2018 , the Company's unrecognized tax benefits associated with uncertain tax positions were $38,000 , of which $30,000 if recognized, would favorably affect the effective tax rate.
The Company recognizes interest and penalties related to unrecognized tax benefits as a component of income tax expense which is consistent with the recognition of the items in prior reporting. The Company had recorded a liability for interest and penalties related to unrecognized tax benefits of $5,000 at January 31, 2018 , and $4,000 at January 31, 2017 . In 2016, the Company closed its IRS examination for its tax return for the year ended January 31, 2013 with no changes. The years ended January 31, 2015 and subsequent years remain open for examination by the IRS and state tax authorities. The Company is currently under IRS examination for fiscal year ended January 31, 2016. The Company is not currently under state examinations.
The specific timing of when the resolution of each tax position will be reached is uncertain. As of January 31, 2018 , it is reasonably possible that unrecognized tax benefits will decrease by $4,000 within the next 12 months due to the expiration of the statute of limitations.
In March 2016, the Financial Accounting Standards Board (the "FASB") issued Accounting Standards Update No. 2016-09, Compensation - Stock Compensation (Topic 718): Improvements to Employee Shared-Based Payment Accounting (''ASU 2016-09''). ASU 2016-09 simplifies how several aspects of share-based payments are accounted for and presented in the financial statements. ASU 2016-09 is effective for public companies for annual reporting periods beginning after December 15, 2016. The Company adopted this ASU in the first quarter of fiscal 2018. The Company has excess tax benefits for which a benefit could not be previously recognized of approximately $172,000 . The balance of the unrecognized excess tax benefits was reversed with the impact recorded to retained earnings.
The Tax Cuts and Jobs Act was enacted on December 22, 2017. The Act reduces the US federal corporate tax rate to 21%.
On December 22, 2017, Staff Accounting Bulletin No. 118 was issued to address the application of US GAAP in situations when a registrant does not have the necessary information available, prepared, or analyzed (including computations) in reasonable detail to complete the accounting for certain income tax effects of the Act. In accordance with SAB 118, we have determined that $4,438,000 of the deferred tax expense recorded in connection with the remeasurement of certain deferred tax assets and liabilities was provisional amount and reasonable estimate at January 31, 2018. Additional work is necessary to do a more detailed analysis. Any subsequent adjustment to these amounts will be recorded to current tax expense in the quarter of fiscal year 2019 when the analysis is complete.
7. Commitments
The Company has operating leases on real property and equipment that expire at various dates. The Company has been operating a component fabrication operation in this building since 1998 under a series of 10-year leases. The current lease would have expired in March 2018. In August 2017, the Company purchased this facility for $7,200,000 with Virco making a 20% down payment and the seller providing financing for the remaining balance of $5,760,000 for 20 years at a fixed rate of 4% per year. The Torrance, CA office, manufacturing and distribution facility is leased under a series of 5 -year operating lease that would have expired on February 28, 2020. On November 14, 2017, the Company entered into a fourth amendment which extends the term of the lease for an additional 62 months through April 30, 2025, and provides for monthly base lease payments that increase after each 12-month period. The monthly base lease payments range from approximately $396,890.00 per month (which applies for the period from May 1, 2020 to February 28, 2021) to $446,703.19 per month (which applies for the period from March 1, 2024 to April 30, 2025). The Company leases machinery and equipment under a 5 -year operating lease arrangement. The Company has the option of buying out the assets at the end of the lease period. The Company leases trucks, automobiles, and forklifts under operating leases that include certain fleet management and maintenance services. Certain of
62
Table of Contents
the leases contain renewal or purchase options and require payment for property taxes and insurance. The Company records rent expense on a straight-line basis based on contractual lease payments. Allowances from lessors for tenant improvements have been included in the straight-line rent expense for applicable locations. Tenant improvements are capitalized and depreciated over the remaining life of the applicable lease.
Minimum future lease payments (in thousands) for operating leases in effect as of January 31, 2018 , are as follows:
Year ending January 31, |
| ||
2019 | $ | 4,386 | |
2020 | 4,219 | | |
2021 | 3,970 | | |
2022 | 4,927 | | |
2023 | 5,040 | | |
Thereafter | 11,879 | | |
Total minimum lease payments | $ | 34,421 | |
Rent expense relating to operating leases was as follows (in thousands):
Year ended January 31, |
| ||
2018 | $ | 5,644 | |
2017 | 5,735 | | |
2016 | 5,681 | | |
The Company has issued purchase commitments for raw materials at January 31, 2018 , of approximately $12,646,000 . There were no commitments in excess of normal operating requirements.
8. Contingencies
The Company and other furniture manufacturers are subject to federal, state and local laws and regulations relating to the discharge of materials into the environment and the generation, handling, storage, transportation and disposal of waste and hazardous materials. The Company has expended, and expects to continue to spend, significant amounts in the future to comply with environmental laws. Normal recurring expenses relating to operating the Company factories in a manner that meets or exceeds environmental laws are matched to the cost of producing inventory. Despite the Company's significant dedication to operating in compliance with applicable laws, there is a risk that the Company could fail to comply with a regulation or that applicable laws and regulations change. On these occasions, the Company records liabilities for remediation costs when remediation costs are probable and can be reasonably estimated.
The Company is subject to contingencies pursuant to environmental laws and regulations that in the future may require the Company to take action to correct the effects on the environment of prior disposal practices or releases of chemical or petroleum substances by the Company or other parties.
The Company has a self-insured retention for product and general liability losses up to $250,000 per occurrence, workers' compensation liability losses up to $250,000 per occurrence, and for automobile liability losses up to $50,000 per occurrence. The Company has purchased insurance to cover losses in excess of the retention up to a limit of $30,000,000 . The Company has obtained an actuarial estimate of its total expected future losses for liability claims and recorded a liability equal to the net present value of $1,375,000 and $1,650,000 at January 31, 2018 and 2017 , respectively, based upon the Company's estimated payout period of five years using a 2.0% and 2.0% discount rate, respectively.
Workers' compensation, automobile, general and product liability claims may be asserted in the future for events not currently known by management. Management does not anticipate that any related settlement, after consideration of the existing reserve for claims incurred and potential insurance recovery, would have a material adverse effect on the Company's financial position, results of operations or cash flows. Estimated payments under the self-insurance programs are as follows (in thousands):
63
Year ending January 31, |
| ||
2019 | $ | 300 | |
2020 | 300 | | |
2021 | 300 | | |
2022 | 300 | | |
2023 | 215 | | |
Thereafter | - | | |
Total | $ | 1,415 | |
Discount to net present value | (40 | ) | |
| $ | 1,375 | |
The Company and its subsidiaries are defendants in various legal proceedings resulting from operations in the normal course of business. It is the opinion of management, in consultation with legal counsel, that the ultimate outcome of all such matters will not materially affect the Company's financial position, results of operations or cash flows.
9. Warranty
The Company provides a warranty against all substantial defects in material and workmanship. The standard warranty offered on products sold through January 31, 2013 is 10 years. Effective February 1, 2014 the Company modified its warranty to a limited lifetime warranty. The warranty effective February 1, 2014 is not anticipated to have a significant effect on warranty expense. Effective January 1, 2017, the Company modified the warranty offered to provide specific warranty periods by product component, with no warranty period longer than ten years. The Company's warranty is not a guarantee of service life, which depends upon events outside the Company's control and may be different from the warranty period. The Company accrues an estimate of its exposure to warranty claims based upon both product sales data and an analysis of actual warranty claims incurred. The following is a summary of the Company's warranty-claim activity during 2018 and 2017 .
|
| January 31, | ||||||
(In thousands) |
| 2018 |
| 2017 | ||||
Beginning balance |
| $ | 1,000 | |
| $ | 1,000 | |
Provision for current year |
| 760 | |
| 700 | | ||
Provision for (benefits from) prior year |
| (380 | ) |
| (285 | ) | ||
Costs incurred |
| (455 | ) |
| (415 | ) | ||
Ending balance |
| $ | 925 | |
| $ | 1,000 | |
10. Subsequent Events
The Company has evaluated events subsequent to January 31, 2018 , to assess the need for potential recognition or disclosure in this report. Such events were evaluated through the date these financial statements were issued. Based upon this evaluation, it was determined that no subsequent events occurred that require recognition or additional disclosure in the financial statements except for Amendment No. 17, dated March 19, 2018 to the Revolving Credit and Security Agreement, dated as of December 22, 2011, which is disclosed in the notes to the consolidated financial statements.
11. Quarterly Results (Unaudited)
The Company's quarterly results for the years ended January 31, 2018 and 2017 , as adjusted, are summarized as follows (in thousands, except per share data):
64
| Q1 |
| Q2 |
| Q3 |
| Q4 | ||||||||
Year ended January 31, 2018 |
|
|
|
|
|
|
| ||||||||
Net sales | $ | 23,235 | |
| $ | 72,636 | |
| $ | 68,794 | |
| $ | 24,622 | |
Gross profit | 8,427 | |
| 26,683 | |
| 24,467 | |
| 5,894 | | ||||
Net (loss) income*** | (2,211 | ) |
| 5,028 | |
| 2,524 | |
| (8,550 | ) | ||||
Per common share |
|
|
|
|
|
|
| ||||||||
Net (loss) income* |
|
|
|
|
|
|
| ||||||||
Basic | $ | (0.15 | ) |
| $ | 0.33 | |
| $ | 0.16 | |
| $ | (0.56 | ) |
Assuming dilution | (0.15 | ) |
| 0.33 | |
| 0.16 | |
| (0.56 | ) | ||||
Year ended January 31, 2017 |
|
|
|
|
|
|
| ||||||||
Net sales | $ | 20,827 | |
| $ | 61,354 | |
| $ | 67,795 | |
| $ | 23,441 | |
Gross profit | 8,063 | |
| 23,738 | |
| 24,311 | |
| 6,431 | | ||||
Net (loss) income** | (3,138 | ) |
| 6,885 | |
| 23,998 | |
| (4,985 | ) | ||||
Per common share |
|
|
|
|
|
|
| ||||||||
Net (loss) income* |
|
|
|
|
|
|
| ||||||||
Basic | $ | (0.21 | ) |
| $ | 0.46 | |
| $ | 1.59 | |
| $ | (0.33 | ) |
Assuming dilution | (0.21 | ) |
| 0.45 | |
| 1.57 | |
| (0.33 | ) | ||||
______________________________
* Net loss per share was calculated based on basic shares outstanding due to the anti-dilutive effect on the inclusion of common stock equivalent shares.
** For fiscal quarter ended October 31, 2016, the Company released its valuation allowance against the deferred tax assets resulting in a benefit to income taxes of $17,962,000 .
*** For fiscal quarter ended January 31, 2018, the Company's tax expense increased by $4,438,000 from the revaluation of deferred tax assets as a result of the reduction in the federal tax rate due to the Tax Cuts and Jobs Act (TCJA) enacted on December 22, 2017.
Item 9. Changes in and Disagreements with Accountants on Accounting and Financial Disclosures
Not applicable.
Item 9A. Controls and Procedures
Disclosure Controls and Procedures
The Company maintains disclosure controls and procedures that are designed to ensure that information required to be disclosed in reports filed with the Commission pursuant to the Exchange Act is recorded, processed, summarized and reported within the time periods specified in the Commission's rules and forms, and that such information is accumulated and communicated to the Company's management, including its President and Chief Executive Officer and Chief Financial Officer, as appropriate, to allow timely decisions regarding required disclosure. Assessing the costs and benefits of such controls and procedures necessarily involves the exercise of judgment by management, and such controls and procedures, by their nature, can provide only reasonable assurance that management's objectives in establishing them will be achieved.
Virco carried out an evaluation, under the supervision and with the participation of the Company's management, including its President and Chief Executive Officer along with its Chief Financial Officer, of the effectiveness of the design and operation of disclosure controls and procedures as of the end of the period covered by this Annual Report pursuant to Exchange Act Rule 13a-15. Based upon the foregoing, the Company's President and Chief Executive Officer along with the Company's Chief Financial Officer concluded that Virco's disclosure controls and procedures are effective in ensuring that (i) information required to be disclosed by the Company in the reports that it files or submits under the Exchange Act is recorded, processed, summarized and reported, within the time periods specified in the SEC's rules and forms and (ii) information required to be disclosed by the Company in the reports that it files or submits under the Exchange Act is accumulated and communicated to the Company's management, including its principal executive and principal financial officers, or persons performing similar functions, as appropriate to allow timely decisions regarding required disclosure.
65
Management's Report on Internal Control over Financial Reporting
Management of Virco Mfg. Corporation (the "Company") is responsible for establishing and maintaining adequate internal control over financial reporting and for the assessment of the effectiveness of internal control over financial reporting. As defined by the Securities and Exchange Commission, internal control over financial reporting is a process designed by, or supervised by, the Company's principal executive and principal financial officers, to provide reasonable assurance regarding the reliability of financial reporting and the preparation of financial statements in accordance with generally accepted accounting principles.
The Company's internal control over financial reporting is supported by written policies and procedures, that (i) pertain to the maintenance of records that, in reasonable detail, accurately and fairly reflect the transactions and dispositions of the Company's assets; (ii) provide reasonable assurance that transactions are recorded as necessary to permit preparation of financial statements in accordance with generally accepted accounting principles, and that receipts and expenditures of the Company are being made only in accordance with authorizations of the Company's management and directors; and (iii) provide reasonable assurance regarding prevention or timely detection of unauthorized acquisition, use or disposition of the Company's assets that could have a material effect on the financial statements.
Because of its inherent limitations, internal control over financial reporting may not prevent or detect misstatements. Projections of any evaluation of effectiveness to future periods are subject to the risk that controls may become inadequate because of changes in conditions, or that the degree of compliance with the policies or procedures may deteriorate.
In connection with the preparation of the Company's annual financial statements, management of the Company has undertaken an assessment of the effectiveness of the Company's internal control over financial reporting as of January 31, 2018, based on criteria established in Internal Control - Integrated Framework issued by the Committee of Sponsoring Organizations of the Treadway Commission (2013 framework) (the COSO criteria). Management's assessment included an evaluation of the design of the Company's internal control over financial reporting and testing of the operational effectiveness of the Company's internal control over financial reporting.
Based on this assessment, management did not identify any material weakness in the Company's internal control over financial reporting, and management has concluded that the Company's internal control over financial reporting was effective as of January 31, 2018 .
Changes in Internal Control Over Financial Reporting
There was no change in the Company's internal control over financial reporting during the fourth fiscal quarter ending January 31, 2018 that has materially affected, or is reasonably likely to materially affect, the Company's internal control over financial reporting. See "Management's Report on Internal Control over Financial Reporting."
Item 9B. Other Information
None.
66
PART III
Item 10. Directors, Executive Officers of the Registrant and Corporate Governance
Except for the information disclosed in Part 1 under the heading "Executive Officers" of the Registrant, the information required by this Item regarding directors shall be incorporated by reference to information set forth in the Company's definitive Proxy Statement to be filed within 120 days after the end of the Company's fiscal year end of January 31, 2018 .
Item 11. Executive Compensation
The information required by this Item is incorporated by reference to information set forth in the Company's definitive Proxy Statement to be filed within 120 days after the end of the Company's fiscal year end of January 31, 2018 .
Item 12. Security Ownership of Certain Beneficial Owners and Management and Related Stockholder Matters
The information required by this Item is incorporated by reference to information set forth in the Company's definitive Proxy Statement to be filed within 120 days after the end of the Company's fiscal year end of January 31, 2018 .
Item 13. Certain Relationships and Related Transactions, and Director Independence
The information required by this Item is incorporated by reference to information set forth in the Company's definitive Proxy Statement to be filed within 120 days after the end of the Company's fiscal year end of January 31, 2018 .
Item 14. Principal Accounting Fees and Services
The information required by this Item is incorporated by reference to information set forth in the Company's definitive Proxy Statement to be filed within 120 days after the end of the Company's fiscal year end of January 31, 2018 .
67
PART IV
Item 15. Exhibits, Financial Statement Schedules
1. The following consolidated financial statements of Virco Mfg. Corporation are set forth in Item 8 of this report.
| Page numbers |
Report of Independent Registered Public Accounting Firm | 40 |
Consolidated Balance Sheets - January 31, 2018 and 2017 | 41 |
Consolidated Statements of Operation - Years Ended January 31, 2018, 2017 and 2016 | 43 |
Consolidated Statements of Comprehensive Income (Loss) - Years Ended January 31, 2018, 2017 and 2016 | 44 |
Consolidated Statements of Stockholders' Equity - Years Ended January 31, 2018, 2017 and 2016 | 45 |
Consolidated Statements of Cash Flows - Years Ended January 31, 2018, 2017 and 2016 | 46 |
Notes to Consolidated Financial Statements - January 31, 2018 | 47 |
68
2. The following consolidated financial statement schedule of Virco Mfg. Corporation is included in Item 15:
VIRCO MFG. CORPORATION AND SUBSIDIARIES
SCHEDULE II - VALUATION AND QUALIFYING ACCOUNTS AND RESERVES
FOR THE YEARS ENDED JANUARY 31, 2018, 2017 AND 2016
(In Thousands)
Col. A | Col. B |
| Col. C |
| Col. E |
| Col. F | ||||||||
Allowance for doubtful accounts for the period ended: |
|
|
|
|
|
|
| ||||||||
January 31, 2018 | $ | 200 | |
| $ | 55 | |
| $ | 55 | |
| $ | 200 | |
January 31, 2017 | $ | 200 | |
| $ | 110 | |
| $ | 110 | |
| $ | 200 | |
January 31, 2016 | $ | 200 | |
| $ | 141 | |
| $ | 141 | |
| $ | 200 | |
Warranty reserve for the period ended: |
|
|
|
|
|
|
| ||||||||
January 31, 2018 | $ | 1,000 | |
| $ | 380 | |
| $ | 455 | |
| $ | 925 | |
January 31, 2017 | $ | 1,000 | |
| $ | 415 | |
| $ | 415 | |
| $ | 1,000 | |
January 31, 2016 | $ | 950 | |
| $ | 375 | |
| $ | 325 | |
| $ | 1,000 | |
Product, general, workers' compensation and automobile liability reserves for the period ended: |
|
|
|
|
|
|
| ||||||||
January 31, 2018 | $ | 1,650 | |
| $ | 1,101 | |
| $ | 1,404 | |
| $ | 1,347 | |
January 31, 2017 | $ | 2,050 | |
| $ | 777 | |
| $ | 1,177 | |
| $ | 1,650 | |
January 31, 2016 | $ | 2,130 | |
| $ | 975 | |
| $ | 1,055 | |
| $ | 2,050 | |
Deferred tax valuation allowance for the period ended: |
|
|
|
|
|
|
| ||||||||
January 31, 2018 | $ | 515 | |
| $ | 410 | |
| $ | - | |
| $ | 925 | |
January 31, 2017 | $ | 21,906 | |
| $ | - | |
| $ | 21,391 | |
| $ | 515 | |
January 31, 2016 | $ | 26,399 | |
| $ | - | |
| $ | 4,493 | |
| $ | 21,906 | |
All other schedules for which provision is made in the applicable accounting regulation of the Securities and Exchange Commission are not required under the related instructions, are inapplicable, or are included in the Financial Statements or Notes thereto, and therefore are not required to be presented under this Item.
3. Exhibits
See Index to Exhibits. The exhibits listed in the accompanying Index to Exhibits are filed as part of this report.
69
SIGNATURES
Pursuant to the requirements of Section 13 or 15 (d) of the Securities Exchange Act of 1934, the registrant has duly caused this report to be signed on its behalf by the undersigned, thereunto duly authorized.
| VIRCO MFG. CORPORATION | ||
|
|
| |
Date: April 27, 2018 | By: |
| /s/ Robert A. Virtue |
|
|
| Robert A. Virtue |
|
|
| Chairman of the Board and Chief Executive Officer |
| By: |
| /s/ Robert E. Dose |
|
|
| Robert E. Dose |
|
|
| Sr. Vice President, Finance, Secretary and Treasurer (Principal Financial Officer) |
| By: |
| /s/ Bassey Yau |
|
|
| Bassey Yau |
|
|
| Vice President, Accounting, Corporate Controller, Assistant Secretary and Assistant Treasurer (Principal Accounting Officer) |
70
POWER OF ATTORNEY
KNOW ALL PERSONS BY THESE PRESENTS, that each person whose signature appears below constitutes and appoints Robert A. Virtue and Robert E. Dose his/her true and lawful attorney-in-fact and agent, with full power of substitution and, for him/her and in his/her name, place and stead, in any and all capacities to sign any and all amendments to this report on Form 10-K, and to file the same, with all exhibits thereto and other documents in connection therewith, with the Securities and Exchange Commission, granting unto said attorney-in-fact and agent full power and authority to do and perform each and every act and thing requisite and necessary to be done in connection therewith, as fully to all intents and purposes as he/she might or could do in person, hereby ratifying and confirming all that said attorney-in-fact and agent, or his/her substitute or substitutes, may lawfully do or cause to be done by virtue hereof.
Pursuant to the requirements of the Securities Exchange Act of 1934, this report has been signed below by the following persons on behalf of the registrant in the capacities and on the dates indicated.
SIGNATURE |
| TITLE |
| DATE |
|
|
| ||
/s/ Robert A. Virtue |
| Chairman of the Board, Chief Executive Officer, Director (Principal Executive Officer) |
| April 27, 2018 |
Robert A. Virtue |
|
| ||
|
|
| ||
/s/ Douglas A. Virtue |
| President, Director |
| April 27, 2018 |
Douglas A. Virtue |
|
| ||
|
|
| ||
/s/ Robert E. Dose |
| Sr. Vice President, Finance, Secretary and Treasurer (Principal Financial Officer) |
| April 27, 2018 |
Robert E. Dose |
|
| ||
|
|
| ||
/s/ Bassey Yau |
| Vice President, Accounting, Corporate Controller, Assistant Secretary and Assistant Treasurer (Principal Accounting Officer) |
| April 27, 2018 |
Bassey Yau |
|
| ||
|
|
| ||
/s/ Alexander L. Cappello |
| Director |
| April 27, 2018 |
Alexander L. Cappello |
|
|
| |
|
|
| ||
/s/ Craig Levra |
| Director |
| April 27, 2018 |
Craig Levra |
|
|
| |
|
|
|
|
|
/s/ Don Rudkin |
| Director |
| April 27, 2018 |
Don Rudkin |
|
|
| |
|
|
| ||
/s/ Robert Lind |
| Director |
| April 27, 2018 |
Robert Lind |
|
|
| |
|
|
| ||
/s/ Kathy Virtue Young |
| Director |
| April 27, 2018 |
Kathy Virtue Young |
|
|
| |
|
|
|
|
|
/s/ Agnieszka Winkler |
| Director |
| April 27, 2018 |
Agnieszka Winkler |
|
|
| |
|
|
|
|
|
71
VIRCO MFG. CORPORATION
EXHIBITS TO FORM 10-K ANNUAL REPORT
for the Year Ended January 31, 2018
Exhibit Number |
| Description |
3.1 |
| Certificate of Incorporation of the Company dated April 23, 1984, as amended (incorporated by reference to Exhibit 1 to the Company's Form 8-A12B (Commission File No. 001-08777), filed with the Commission on June 18, 2007). |
|
| |
3.2 |
| Second Amended and Restated Bylaws of the Company dated September 10, 2001 (incorporated by reference to Exhibit 3.2 to the Company's Quarterly Report on Form 10-Q (Commission File No. 001-08777), filed with the Commission on September 12, 2014). |
|
| |
10.1 |
| Lease dated February 1, 2006, between FHL Group, a California Corporation, as landlord and Virco Mfg. Corporation, a Delaware Corporation, as tenant (incorporated by reference to Exhibit 99.1 to the Company's Current Report on Form 8-K filed with the Commission on February 3, 2006). |
|
| |
10.2 |
| Design Agreement dated January 21, 2008, between the Company and Peter Glass Design, LLC, and Hedgehog Design, LLC. (incorporated by reference to Exhibit 10.1 and 10.2 to the Company's Current Report on Form 8-K filed with the Commission on January 25, 2008). |
|
|
|
10.3 |
| Lease amendment dated August 14, 2008, between AMB Property, L.P., a Delaware Limited Partnership, as landlord and Virco Mfg. Corporation, a Delaware Corporation, as tenant (incorporated by reference to Exhibit 10.1 to the Company's Quarterly Report on Form 10Q filed with the Commission on September 9, 2008). |
|
|
|
10.4 |
| Third Amendment to Lease Agreement, entered into as of December 20, 2013, by and between Starboard Distribution Center, LLC, a Delaware limited liability company, successor in interest to AMB Property, L.P., a Delaware limited Partnership and Virco Mfg. Corporation (incorporated by reference to Exhibit 10.1 to the Company's Current Report on Form 8-K filed with the Commission on December 23, 2013. |
|
|
|
10.41 |
| Fourth Amendment to Lease Agreement, entered into as of November 4, 2017, by and between Starboard Distribution Center, LLC, a Delaware limited liability company, successor in interest to AMB Property, L.P., a Delaware limited Partnership and Virco Mfg. Corporation (incorporated by reference to Exhibit 10.1 to the Company's Current Report on Form 8-K filed with the Commission on November 15, 2017). |
|
|
|
10.5 |
| Virco Mfg. Corporation 2011 Stock Incentive Plan (incorporated by reference to Exhibit 10.1 to the Company's Current Report on Form 8K filed with the Commission on June 27, 2011). |
|
|
|
10.6 |
| Revolving Credit and Security Agreement dated as of December 22, 2011 by and among Virco Mfg. Corporation and Virco Inc., as borrowers, and PNC Bank, National Association, as the lender and administrative agent (incorporated by reference to Exhibit 10.1 to the Company's Current Report on Form 8K filed with the Commission on December 22, 2011). |
|
|
|
10.7 |
| First Amendment to Revolving Credit and Securities Agreement, dated as of June 15, 2012, by and among Virco Mfg. Corporation and Virco, Inc., as borrowers, and PNC Bank, National Association, as the lender and administrative agent (incorporated by reference to Exhibit 10.1 to the Company's Quarterly Report on Form 10-Q filed with the Commission on September 14, 2012). |
10.8 |
| Second Amendment to Revolving Credit and Security Agreement, dated as of July 27, 2012, by and among Virco Mfg. Corporation and Virco, Inc., as borrowers, and PNC Bank, National Association, as the lender and administrative agent (incorporated by reference to Exhibit 10.1 to the Company's Current Report on Form 8-K filed with the Commission on July 31, 2012). |
|
| |
10.9 |
| Third Amendment to Revolving Credit and Security Agreement, dated as of September 12, 2012, by and among Virco Mfg. Corporation and Virco, Inc., as borrowers, and PNC Bank, National Association, as the lender and administrative agent (incorporated by reference to Exhibit 10.1 to the Company's Quarterly Report on Form 10-Q filed with the Commission on September 14, 2012). |
|
|
|
10.10 |
| Fourth Amendment to Revolving Credit and Security Agreement, dated as of December 6, 2012, by and among Virco Mfg. Corporation and Virco, Inc., as borrowers, and PNC Bank, National Association, as the lender and administrative agent (incorporated by reference to Exhibit 10.4 to the Company's Quarterly Report on Form 10-Q filed with the Commission on December 7, 2012). |
|
|
|
10.11 |
| Fifth Amendment to Revolving Credit and Security Agreement, dated as of March 1, 2013, by and among Virco Mfg. Corporation and Virco, Inc., as borrowers, and PNC Bank, National Association, as the lender and administrative agent (incorporated by reference to Exhibit 10.1 to the Company's Current Report on Form 8-K filed with the Commission on March 1, 2013). |
|
| |
10.12 |
| Sixth Amendment to Revolving Credit and Security Agreement, dated as of January 9, 2014, by and among Virco Mfg. Corporation and Virco, Inc., as borrowers, and PNC Bank, National Association, as the lender and administrative agent. |
|
|
|
72
10.13 |
| Seventh Amendment to Revolving Credit and Security Agreement, dated as of April 15, 2014, by and among Virco Mfg. Corporation and Virco, Inc., as borrowers, and PNC Bank, National Association, as the lender and administrative agent. (incorporated by reference to Exhibit 10.1 to the Company's Current Report on Form 8-K filed with the Commission on April 16, 2014). |
|
|
|
10.14 |
| Eighth Amendment to Revolving Credit and Security Agreement, dated as of August 18, 2014, by and among Virco Mfg. Corporation and Virco, Inc., as borrowers, and PNC Bank, National Association, as the lender and administrative agent. |
|
|
|
10.15 |
| First Amendment to the Virco Mfg. Corporation 2011 Stock Incentive Plan (incorporated by reference to the Company's Proxy Statement on Form DEF 14A filed with the Commission on May 23, 2014). |
|
|
|
10.16 |
| Ninth Amendment to Revolving Credit and Security Agreement, dated as of March 31, 2015, by and among Virco Mfg. Corporation and Virco, Inc., as borrowers, and PNC Bank, National Association, as the lender and administrative agent (incorporated by reference to Exhibit 10.20 to the Company's Annual Report on Form 10-K filed with the Commission on April 24, 2015). |
|
|
|
10.17 |
| Tenth Amendment to Revolving Credit and Security Agreement, dated as of June 18, 2015, by and among Virco Mfg. Corporation and Virco, Inc., as borrowers, and PNC Bank, National Association, as the lender and administrative agent (incorporated by reference to Exhibit 10.1 to the Company's Annual Report on Form 10-K filed with the Commission on September 11, 2015). |
|
|
|
10.18 |
| Eleventh Amendment to Revolving Credit and Security Agreement, dated as of December 2, 2015, by and among Virco Mfg. Corporation and Virco, Inc., as borrowers, and PNC Bank, National Association, as the lender and administrative agent (incorporated by reference to Exhibit 10.1 to the Company's Annual Report on Form 10-K filed with the Commission on December 15, 2015). |
|
|
|
10.19 |
| Twelfth Amendment to Revolving Credit and Security Agreement, dated as of April 4, 2016, by and among Virco Mfg. Corporation and Virco, Inc., as borrowers, and PNC Bank, National Association, as the lender and administrative agent (incorporated by reference to Exhibit 10.23 to the Company's Annual Report on Form 10-K filed with the Commission on April 26, 2016). |
|
|
|
10.20 |
| Thirteenth Amendment to Revolving Credit and Security Agreement, dated as of October 27, 2016, by and among Virco Mfg. Corporation and Virco, Inc., as borrowers, and PNC Bank, National Association, as the lender and administrative agent (incorporated by reference to Exhibit 10.23 to the Company's Annual Report on Form 10-K filed with the Commission on April 26, 2016). |
|
|
|
10.21 |
| Fourteenth Amendment to Revolving Credit and Security Agreement, dated as of March 13, 2017, by and among Virco Mfg. Corporation and Virco, Inc., as borrowers, and PNC Bank, National Association, as the lender and administrative agent (incorporated by reference to Exhibit 10.21 to the Company's Quarterly Report on Form 10-Q filed with the Commission on June 12, 2017). |
|
|
|
10.22 |
| Fifteenth Amendment to Revolving Credit and Security Agreement, dated as of June 8, 2017, by and among Virco Mfg. Corporation and Virco, Inc., as borrowers, and PNC Bank, National Association, as the lender and administrative agent (incorporated by reference to Exhibit 10.22 to the Company's Quarterly Report on Form 10-Q filed with the Commission on June 12, 2017). |
|
|
|
10.23 |
| Sixteenth Amendment to Revolving Credit and Security Agreement, dated as of August 7, 2017, by and among Virco Mfg. Corporation and Virco, Inc., as borrowers, and PNC Bank, National Association, as the lender and administrative agent (incorporated by reference to Exhibit 10.21 to the Company's Current Report on Form 8-K filed with the Commission on September 14, 2017). |
|
|
|
10.24 |
| Seventeenth Amendment to Revolving Credit and Security Agreement, dated as of March 19, 2018, by and among Virco Mfg. Corporation and Virco, Inc., as borrowers, and PNC Bank, National Association, as the lender and administrative agent (incorporated by reference to Exhibit 10.1 to the Company's Quarterly Report on Form 10-Q filed with the Commission on March 22, 2018). . |
|
|
|
21.1* |
| List of All Subsidiaries of Virco Mfg. Corporation. |
|
|
|
23.1* |
| Consent of Independent Registered Public Accounting Firm. |
|
|
|
31.1* |
| Certification of the Chief Executive Officer Pursuant to Rule 13a-14(a) under the Securities and Exchange Act of 1934, as adopted Pursuant to Section 302 of the Sarbanes-Oxley Act of 2002. |
|
|
|
31.2* |
| Certification of the Chief Financial Officer Pursuant to Rule 13a-14(a) under the Securities and Exchange Act of 1934, as adopted Pursuant to Section 302 of the Sarbanes-Oxley Act of 2002. |
|
|
|
32.1* |
| Certification of the Chief Executive Officer and Chief Financial Officer pursuant to 18 U.S.C. Section 1350. |
|
|
|
73
101.INS* |
| XBRL Instance Document. |
|
|
|
101.SCH* |
| XBRL Taxonomy Extension Schema Document. |
|
|
|
101.CAL* |
| XBRL Taxonomy Extension Calculation Linkbase Document. |
|
|
|
101.DEF* |
| XBRL Taxonomy Extension Definition Linkbase Document. |
|
|
|
101.LAB* |
| XBRL Taxonomy Extension Label Linkbase Document. |
|
|
|
101.PRE* |
| XBRL Taxonomy Extension Presentation Linkbase Document. |
|
|
|
______________________
* | Filed herewith. |
74