Table of Contents
UNITED STATES
SECURITIES AND EXCHANGE COMMISSION
Washington, D.C. 20549
FORM 10-K
| (Mark One) | ||
ý | | ANNUAL REPORT PURSUANT TO SECTION 13 OR 15(d) OF THE SECURITIES EXCHANGE ACT OF 1934 |
For the fiscal year ended January 30, 2010 | ||
OR | ||
o | | TRANSITION REPORT PURSUANT TO SECTION 13 OR 15(d) OF THE SECURITIES EXCHANGE ACT OF 1934 |
For the transition period from to | ||
Commission file number 1-6049

TARGET CORPORATION
(Exact name of registrant as specified in its charter)
| Minnesota (State or other jurisdiction of incorporation or organization) | 41-0215170 (I.R.S. Employer Identification No.) | |
1000 Nicollet Mall, Minneapolis, Minnesota (Address of principal executive offices) | | 55403 (Zip Code) |
Registrant's telephone number, including area code: 612/304-6073
Securities Registered Pursuant To Section 12(B) Of The Act:
| Title of Each Class | Name of Each Exchange on Which Registered | |
|---|---|---|
| Common Stock, par value $0.0833 per share | New York Stock Exchange |
Securities registered pursuant to Section 12(g) of the Act: None
Indicate by check mark if the registrant is a well-known seasoned issuer, as defined in Rule 405 of the Securities Act. Yes ý No o
Indicate by check mark if the registrant is not required to file reports pursuant to Section 13 or Section 15(d) of the Act. Yes o No ý
Note – Checking the box above will not relieve any registrant required to file reports pursuant to Section 13 or 15(d) of the Exchange Act from their obligations under those Sections.
Indicate by check mark whether the registrant (1) has filed all reports required to be filed by Section 13 or 15(d) of the Securities Exchange Act of 1934 during the preceding 12 months (or for such shorter period that the registrant was required to file such reports), and (2) has been subject to such filing requirements for the past 90 days. Yes ý No o
Indicate by checkmark whether the registrant has submitted electronically and posted on its corporate Web site, if any, every Interactive Data File required to be submitted and posted pursuant to Rule 405 of Regulation S-T (§232.405 of this chapter) during the preceding 12 months (or for such shorter period that the registrant was required to submit and post such files. Yes ý No o
Indicate by check mark if disclosure of delinquent filers pursuant to Item 405 of Regulation S-K (§229.405 of this chapter) is not contained herein, and will not be contained, to the best of registrant's knowledge, in definitive proxy or information statements incorporated by reference in Part III of this Form 10-K or any amendment to this Form 10-K. ý
Indicate by check mark whether the registrant is a large accelerated filer, an accelerated filer, a non-accelerated filer or a smaller reporting company (as defined in Rule 12b-2 of the Act).
| Large accelerated filer ý | Accelerated filer o | Non-accelerated filer o (Do not check if a smaller reporting company) | Smaller reporting company o |
Indicate by check mark whether the registrant is a shell company (as defined in Rule 12b-2 of the Act). Yes o No ý
Aggregate market value of the voting stock held by non-affiliates of the registrant on August 1, 2009 was $32,739,208,053, based on the closing price of $43.62 per share of Common Stock as reported on the New York Stock Exchange- Composite Index.
Indicate the number of shares outstanding of each of registrant's classes of Common Stock, as of the latest practicable date. Total shares of Common Stock, par value $0.0833, outstanding at March 10, 2010 were 793,316,518.
DOCUMENTS INCORPORATED BY REFERENCE
1. Portions of Target's Proxy Statement to be filed on or about April 29, 2010 are incorporated into Part III.
Table of Contents
TABLE OF CONTENTS
| PART I | |||||||
| Item 1 | Business | 2 | |||||
| Item 1A | Risk Factors | 4 | |||||
| Item 1B | Unresolved Staff Comments | 7 | |||||
| Item 2 | Properties | 8 | |||||
| Item 3 | Legal Proceedings | 9 | |||||
| Item 4 | Reserved | 9 | |||||
| Item 4A | Executive Officers | 9 | |||||
PART II | | | |||||
| Item 5 | Market for Registrant's Common Equity, Related Stockholder Matters and Issuer Purchases of Equity Securities | 11 | |||||
| Item 6 | Selected Financial Data | 12 | |||||
| Item 7 | Management's Discussion and Analysis of Financial Condition and Results of Operations | 13 | |||||
| Item 7A | Quantitative and Qualitative Disclosures About Market Risk | 24 | |||||
| Item 8 | Financial Statements and Supplementary Data | 25 | |||||
| Item 9 | Changes in and Disagreements with Accountants on Accounting and Financial Disclosure | 55 | |||||
| Item 9A | Controls and Procedures | 55 | |||||
| Item 9B | Other Information | 55 | |||||
PART III | | | |||||
| Item 10 | Directors, Executive Officers and Corporate Governance | 56 | |||||
| Item 11 | Executive Compensation | 56 | |||||
| Item 12 | Security Ownership of Certain Beneficial Owners and Management and Related Stockholder Matters | 56 | |||||
| Item 13 | Certain Relationships and Related Transactions, and Director Independence | 56 | |||||
| Item 14 | Principal Accountant Fees and Services | 56 | |||||
PART IV | | | |||||
| Item 15 | Exhibits and Financial Statement Schedules | 57 | |||||
| Signatures | | 59 | |||||
| Schedule II – Valuation and Qualifying Accounts | 60 | ||||||
| Exhibit Index | 61 | ||||||
| Exhibit 12 – Computations of Ratios of Earnings to Fixed Charges for each of the Five Years in the Period Ended January 30, 2010 | 63 | ||||||
1
Table of Contents
PART I
Item 1. Business
General
Target Corporation (the Corporation or Target) was incorporated in Minnesota in 1902. We operate as two reportable segments: Retail and Credit Card.
Our Retail Segment includes all of our merchandising operations, including our large-format general merchandise and food discount stores in the United States and our fully integrated online business. We offer both everyday essentials and fashionable, differentiated merchandise at discounted prices. Our ability to deliver a shopping experience that is preferred by our customers, referred to as "guests," is supported by our strong supply chain and technology infrastructure, a devotion to innovation that is ingrained in our organization and culture, and our disciplined approach to managing our current business and investing in future growth. As a component of the Retail Segment, our online business strategy is designed to enable guests to purchase products seamlessly either online or by locating them in one of our stores with the aid of online research and location tools. Our online shopping site offers similar merchandise categories to those found in our stores, excluding food items and household essentials.
Our Credit Card Segment offers credit to qualified guests through our branded proprietary credit cards, the Target Visa and the Target Card (collectively, REDcards). Our Credit Card Segment strengthens the bond with our guests, drives incremental sales and contributes to our results of operations.
Financial Highlights
Our fiscal year ends on the Saturday nearest January 31. Unless otherwise stated, references to years in this report relate to fiscal years, rather than to calendar years. Fiscal year 2009 (2009) ended January 30, 2010, and consisted of 52 weeks. Fiscal year 2008 (2008) ended January 31, 2009 and consisted of 52 weeks. Fiscal year 2007 (2007) ended February 2, 2008 and consisted of 52 weeks.
For information on key financial highlights, see the items referenced in Item 6, Selected Financial Data, and Item 7, Management's Discussion and Analysis of Financial Condition and Results of Operations, of this Annual Report on Form 10-K.
Seasonality
Due to the seasonal nature of our business, a larger share of annual revenues and earnings traditionally occurs in the fourth quarter because it includes the peak sales period from Thanksgiving to the end of December.
Merchandise
We operate Target general merchandise stores, the majority of which offer a wide assortment of general merchandise and a limited assortment of food items. During 2009 we increased the offering within some of our general merchandise stores to include a deeper food assortment, including perishables and an expanded offering of dry, dairy and frozen items. In addition, we operate SuperTarget stores with a full line of food and general merchandise items. Target.com offers a wide assortment of general merchandise including many items found in our stores and a complementary assortment, such as extended sizes and colors, sold only online. A significant portion of our sales is from national brand merchandise. In addition, we sell merchandise under private-label brands including, but not limited to, Archer Farms®, Archer Farms® Simply Balanced™, Boots & Barkley®, Choxie®, Circo®, Durabuilt®, Embark®, Gilligan & O'Malley®, itso™, Kaori®, Market Pantry®, Merona®, Play Wonder®, Room Essentials®, Smith & Hawken®, Sutton and Dodge®, Target Home, Vroom®, up & up™, Wine Cube®, and Xhilaration®. We also sell merchandise through unique programs such as ClearRx SM , GO International®, Great Save SM and Home Design Event. In addition, we sell merchandise under exclusive licensed and designer brands including, but not limited to, C9 by Champion®, Chefmate®, Cherokee®, Converse® One Star®, Eddie Bauer®, Fieldcrest®, Genuine Kids by Osh Kosh®, Kitchen Essentials® by Calphalon®, Liz Lange® for Target®, Michael Graves Design™, Mossimo®, Nick & Nora®, Sean Conway™, Simply Shabby Chic®, Sonia Kashuk®, Thomas O'Brien®. We also generate revenue from in-store
2
Table of Contents
amenities such as Target Café SM , Target Clinic®, Target Pharmacy®, and Target Photo SM , and from leased or licensed departments such as Optical, Pizza Hut, Portrait Studio and Starbucks.
Effective inventory management is key to our future success. We utilize various techniques including demand forecasting and planning and various forms of replenishment management. We achieve effective inventory management by being in-stock in core product offerings, maintaining positive vendor relationships, and carefully planning inventory levels for seasonal and apparel items to minimize markdowns.
| Sales by Product Category | Percentage of Sales | |||||||||
|---|---|---|---|---|---|---|---|---|---|---|
| | 2009 | 2008 | 2007 | |||||||
Household essentials | 23 | % | 22 | % | 21 | % | ||||
Hardlines | 22 | 22 | 22 | |||||||
Apparel and accessories | 20 | 20 | 22 | |||||||
Home furnishings and décor | 19 | 21 | 22 | |||||||
Food and pet supplies | 16 | 15 | 13 | |||||||
Total | 100 | % | 100 | % | 100 | % | ||||
Household essentials includes pharmacy, beauty, personal care, baby care, cleaning and paper products. Hardlines includes electronics (including video game hardware and software), music, movies, books, computer software, sporting goods and toys. Apparel and accessories includes apparel for women, men, boys, girls, toddlers, infants, and newborns. It also includes intimate apparel, jewelry, accessories and shoes. Home furnishings and décor includes furniture, lighting, kitchenware, small appliances, home décor, bed and bath, home improvement, automotive and seasonal merchandise such as patio furniture and holiday décor. Food and pet supplies includes dry grocery, dairy, frozen food, beverages, candy, snacks, deli, bakery, meat, produce and pet supplies.
Distribution
The vast majority of our merchandise is distributed through our network of distribution centers. We operated 38 distribution centers, including 4 food distribution centers, at January 30, 2010. General merchandise is shipped to and from our distribution centers by common carriers. In addition, certain food items are distributed by third parties. Merchandise sold through Target.com is distributed through our own distribution network, through third parties, or shipped directly from vendors.
Employees
At January 30, 2010, we employed approximately 351,000 full-time, part-time and seasonal employees, referred to as "team members." During our peak sales period from Thanksgiving to the end of December, our employment levels peaked at approximately 390,000 team members. We consider our team member relations to be good. We offer a broad range of company-paid benefits to our team members. Eligibility for, and the level of, these benefits varies, depending on team members' full-time or part-time status, compensation level, date of hire and/or length of service. These company-paid benefits include a pension plan, 401(k) plan, medical and dental plans, a retiree medical plan, short-term and long-term disability insurance, paid vacation, tuition reimbursement, various team member assistance programs, life insurance and merchandise discounts.
Working Capital
Because of the seasonal nature of our business, our working capital needs are greater in the months leading up to our peak sales period from Thanksgiving to the end of December. The increase in working capital during this time is typically financed with cash flow provided by operations and short-term borrowings.
Additional details are provided in the Liquidity and Capital Resources section in Item 7, Management's Discussion and Analysis of Financial Condition and Results of Operations.
Competition
In our Retail Segment, we compete with traditional and off-price general merchandise retailers, apparel retailers, Internet retailers, wholesale clubs, category specific retailers, drug stores, supermarkets and other
3
Table of Contents
forms of retail commerce. Our ability to positively differentiate ourselves from other retailers largely determines our competitive position within the retail industry.
In our Credit Card Segment, our primary mission is to deliver financial products and services that drive sales and deepen guest relationships at Target. Our financial products compete with those of other issuers for market share of sales volume. Our ability to differentiate the value of our financial products primarily through our rewards programs, terms, credit line management, and guest service determines our competitive position among credit card issuers.
Intellectual Property
Our brand image is a critical element of our business strategy. Our principal trademarks, including Target, SuperTarget and our "Bullseye Design," have been registered with the U.S. Patent and Trademark Office. We also seek to obtain intellectual property protection for our private-label brands.
Geographic Information
Substantially all of our revenues are generated in, and long-lived assets are located in, the United States.
Available Information
Our Annual Report on Form 10-K, quarterly reports on Form 10-Q, current reports on Form 8-K and amendments to those reports filed or furnished pursuant to Section 13(a) or 15(d) of the Exchange Act are available free of charge at www.Target.com (click on "Investors" and "SEC Filings") as soon as reasonably practicable after we file such material with, or furnish it to, the Securities and Exchange Commission (SEC). Our Corporate Governance Guidelines, Business Conduct Guide, Corporate Responsibility Report and the position descriptions for our Board of Directors and Board committees are also available free of charge in print upon request or at www.Target.com (click on "Investors" and "Corporate Governance").
Item 1A. Risk Factors
Our business is subject to a variety of risks. The most important of these is our ability to remain relevant to our guests with a brand they trust. Meeting our guests' expectations requires us to manage various strategic, operational, compliance, and financial risks. Set forth below are the most significant risks that we face.
If we are unable to positively differentiate ourselves from other retailers, our results of operations could be adversely affected.
The retail business is highly competitive. In the past we have been able to compete successfully by differentiating our shopping experience by creating an attractive value proposition through a careful combination of price, merchandise assortment, convenience, guest service and marketing efforts. Guest perceptions regarding the cleanliness and safety of our stores, our in-stock levels and other factors also affect our ability to compete. No single competitive factor is dominant, and actions by our competitors on any of these factors could have an adverse effect on our sales, gross margin and expenses.
If we fail to anticipate and respond quickly to changing consumer preferences, our sales, gross margin and profitability could suffer.
A substantial part of our business is dependent on our ability to make trend-right decisions in apparel, home décor, seasonal offerings, food and other merchandise. Failure to accurately predict constantly changing consumer tastes, preferences, spending patterns and other lifestyle decisions may result in lost sales, spoilage and increased inventory markdowns, which would lead to a deterioration in our results of operations.
Our continued success is substantially dependent on positive perceptions of the Target brand.
We believe that one of the reasons our guests prefer to shop at Target and our team members choose Target as a place of employment is the reputation we have built over many years of serving our four primary
4
Table of Contents
constituencies: guests, team members, the communities in which we operate, and shareholders. To be successful in the future, we must continue to preserve, grow and leverage the value of our brand. Brand value is based in large part on perceptions of subjective qualities, and even isolated incidents that erode trust and confidence, particularly if they result in adverse publicity, governmental investigations or litigation, can have an adverse impact on these perceptions and lead to tangible adverse affects on our business, including consumer boycotts, loss of new store development opportunities, or team member recruiting difficulties.
We are highly susceptible to the state of macroeconomic conditions and consumer confidence in the United States.
All of our stores are located within the United States, making our results highly dependent on U.S. consumer confidence and the health of the U.S. economy. In addition, a significant portion of our total sales is derived from stores located in five states: California, Texas, Florida, Minnesota and Illinois, resulting in further dependence on local economic conditions in these states. Deterioration in macroeconomic conditions and consumer confidence could negatively affect our business in many ways, including slowing sales growth or reduction in overall sales, and reducing gross margins.
In addition to the impact of macroeconomic conditions on our retail sales, these same considerations impact the success of our Credit Card Segment, as any deterioration can adversely affect cardholders' ability to pay their balances and we may not be able to anticipate and respond to changes in the risk profile of our cardholders when extending credit, resulting in higher bad debt expense. The recent Credit Card Accountability, Responsibility and Disclosure Act of 2009 has significantly restricted our ability to make changes to cardholder terms that are commensurate with changes in the risk profile of our credit card receivables portfolio. Demand for consumer credit is also impacted by macroeconomic conditions and other factors, and our performance can also be adversely affected by consumer decisions to use debit cards or other forms of payment.
If we do not effectively manage our large and growing workforce, our results of operations could be adversely affected.
With over 350,000 team members, our workforce costs represent our largest operating expense, and our business is dependent on our ability to attract, train and retain a growing number of qualified team members. Many of those team members are in entry-level or part-time positions with historically high turnover rates. Our ability to meet our labor needs while controlling our costs is subject to external factors such as unemployment levels, prevailing wage rates, health care and other benefit costs and changing demographics. If we are unable to attract and retain adequate numbers of qualified team members, our operations, guest service levels and support functions could suffer. Those factors, together with increasing wage and benefit costs, could adversely affect our results of operations.
Lack of availability of suitable locations in which to build new stores could slow our growth, and difficulty in executing plans for new stores, expansions and remodels could increase our costs and capital requirements.
Our future growth is dependent, in part, on our ability to build new stores and expand and remodel existing stores in a manner that achieves appropriate returns on our capital investment. We compete with other retailers and businesses for suitable locations for our stores. In addition, for many sites we are dependent on a third party developer's ability to acquire land, obtain financing and secure the necessary zoning changes and permits for a larger project, of which our store may be one component. Turmoil in the financial markets has made it difficult for third party developers to obtain financing for new projects. Local land use and other regulations applicable to the types of stores we desire to construct may affect our ability to find suitable locations and also influence the cost of constructing, expanding and remodeling our stores. A significant portion of our expected new store development activity is planned to occur within fully developed markets, which is generally a more time-consuming and expensive undertaking than developments in undeveloped suburban and ex-urban markets.
5
Table of Contents
Interruptions with our vendors and within our supply chain could adversely affect our results.
We are dependent on our vendors to supply merchandise in a timely and efficient manner. If a vendor fails to deliver on its commitments, whether due to financial difficulties or other reasons, we could experience merchandise out-of-stocks that could lead to lost sales. In addition, a large portion of our merchandise is sourced, directly or indirectly, from outside the United States, with China as our single largest source. Political or financial instability, trade restrictions, increased tariffs, currency exchange rates, the outbreak of pandemics, labor unrest, transport capacity and costs, port security or other events that could slow port activities and affect foreign trade are beyond our control and could disrupt our supply of merchandise and/or adversely affect our results of operations.
Failure to address product safety concerns could adversely affect our sales and results of operations.
If our merchandise offerings, including food, drug and children's products, do not meet applicable safety standards or our guests' expectations regarding safety, we could experience lost sales, experience increased costs and be exposed to legal and reputational risk. All of our vendors must comply with applicable product safety laws, and we are dependent on them to ensure that the products we buy comply with all safety standards. Events that give rise to actual, potential or perceived product safety concerns, including food or drug contamination, could expose us to government enforcement action or private litigation and result in costly product recalls and other liabilities. In addition, negative guest perceptions regarding the safety of the products we sell could cause our guests to seek alternative sources for their needs, resulting in lost sales. In those circumstances, it may be difficult and costly for us to regain the confidence of our guests.
If we fail to protect the security of personal information about our guests, we could be subject to costly government enforcement actions or private litigation and our reputation could suffer.
The nature of our business involves the receipt and storage of personal information about our guests. If we experience a data security breach, we could be exposed to government enforcement actions and private litigation. In addition, our guests could lose confidence in our ability to protect their personal information, which could cause them to discontinue usage of our credit card products, decline to use our pharmacy services, or stop shopping at our stores altogether. Such events could lead to lost future sales and adversely affect our results of operations.
Our failure to comply with federal, state or local laws, or changes in these laws could increase our expenses.
Our business is subject to a wide array of laws and regulations. Significant legislative changes that affect our relationship with our workforce (which is not represented by unions as of the end of 2009) could increase our expenses and adversely affect our operations. Examples of possible legislative changes affecting our relationship with our workforce include changes to an employer's obligation to recognize collective bargaining units, the process by which collective bargaining agreements are negotiated or imposed, minimum wage requirements, and health care mandates. In addition, changes in the regulatory environment regarding topics such as banking and consumer credit, Medicare reimbursements, privacy and information security, product safety or environmental protection, among others, could cause our expenses to increase without an ability to pass through any increased expenses through higher prices. In addition, if we fail to comply with applicable laws and regulations, particularly wage and hour laws, we could be subject to legal risk, including government enforcement action and class action civil litigation, which could adversely affect our results of operations.
Given the geographic concentration of our stores, natural disasters could adversely affect our results of operations.
Our three largest states, by total sales, are California, Texas and Florida, areas where hurricanes and earthquakes are prevalent. Such events could result in significant physical damage to or closure of one or more of our stores or distribution centers, and cause delays in the distribution of merchandise from our vendors to our distribution centers and stores, which could adversely affect our results of operations.
6
Table of Contents
Changes in our effective income tax rate could affect our results of operations.
Our effective income tax rate is influenced by a number of factors. Changes in the tax laws, the interpretation of existing laws, or our failure to sustain our reporting positions on examination could adversely affect our effective tax rate. In addition, our effective income tax rate generally bears an inverse relationship to capital market returns due to the tax-free nature of investment vehicles used to economically hedge our deferred compensation liabilities.
If we are unable to access the capital markets or obtain bank credit, our growth plans, liquidity and results of operations could suffer.
We are dependent on a stable, liquid and well-functioning financial system to fund our operations and growth plans. In particular, we have historically relied on the public debt markets to raise capital for new store development and other capital expenditures, the commercial paper market and bank credit facilities to fund seasonal needs for working capital, and the asset-backed securities markets to partially fund our accounts receivable portfolio. In addition, we use a variety of derivative products to manage our exposure to market risk, principally interest rate and equity price fluctuations. Disruptions or turmoil in the financial markets could adversely affect our ability to meet our capital requirements, fund our working capital needs or lead to losses on derivative positions resulting from counterparty failures.
A significant disruption in our computer systems could adversely affect our results of operations.
We rely extensively on our computer systems to manage inventory, process transactions and summarize results. Our systems are subject to damage or interruption from power outages, telecommunications failures, computer viruses, security breaches and catastrophic events. If our systems are damaged or fail to function properly, we may incur substantial costs to repair or replace them, and may experience loss of critical data and interruptions or delays in our ability to manage inventories or process transactions, which could adversely affect our results of operations.
Item 1B. Unresolved Staff Comments
Not applicable
7
Table of Contents
Item 2. Properties
At January 30, 2010, we had 1,740 stores in 49 states and the District of Columbia:
| | Number of Stores | Retail Sq. Ft. (in thousands) | | Number of Stores | Retail Sq. Ft. (in thousands) | ||||||||||
|---|---|---|---|---|---|---|---|---|---|---|---|---|---|---|---|
Alabama | 20 | 2,867 | Montana | 7 | 780 | ||||||||||
Alaska | 3 | 504 | Nebraska | 14 | 2,006 | ||||||||||
Arizona | 48 | 6,363 | Nevada | 19 | 2,461 | ||||||||||
Arkansas | 8 | 1,028 | New Hampshire | 9 | 1,148 | ||||||||||
California | 244 | 32,184 | New Jersey | 43 | 5,671 | ||||||||||
Colorado | 42 | 6,275 | New Mexico | 9 | 1,024 | ||||||||||
Connecticut | 20 | 2,672 | New York | 64 | 8,663 | ||||||||||
Delaware | 2 | 268 | North Carolina | 47 | 6,167 | ||||||||||
District of Columbia | 1 | 179 | North Dakota | 4 | 554 | ||||||||||
Florida | 126 | 17,644 | Ohio | 63 | 7,868 | ||||||||||
Georgia | 55 | 7,517 | Oklahoma | 14 | 2,022 | ||||||||||
Hawaii | 3 | 542 | Oregon | 19 | 2,317 | ||||||||||
Idaho | 6 | 664 | Pennsylvania | 59 | 7,713 | ||||||||||
Illinois | 86 | 11,697 | Rhode Island | 4 | 517 | ||||||||||
Indiana | 33 | 4,377 | South Carolina | 18 | 2,224 | ||||||||||
Iowa | 22 | 3,015 | South Dakota | 5 | 580 | ||||||||||
Kansas | 19 | 2,577 | Tennessee | 32 | 4,087 | ||||||||||
Kentucky | 13 | 1,525 | Texas | 148 | 20,838 | ||||||||||
Louisiana | 15 | 2,108 | Utah | 11 | 1,679 | ||||||||||
Maine | 5 | 630 | Vermont | - | - | ||||||||||
Maryland | 36 | 4,663 | Virginia | 56 | 7,448 | ||||||||||
Massachusetts | 33 | 4,279 | Washington | 35 | 4,097 | ||||||||||
Michigan | 60 | 7,141 | West Virginia | 6 | 755 | ||||||||||
Minnesota | 73 | 10,456 | Wisconsin | 37 | 4,482 | ||||||||||
Mississippi | 6 | 743 | Wyoming | 2 | 187 | ||||||||||
Missouri | 36 | 4,735 | |||||||||||||
| Total | 1,740 | 231,941 | ||||||||||||
The following table summarizes the number of owned or leased stores and distribution centers at January 30, 2010:
| | Stores | Distribution Centers (b) | ||||||
|---|---|---|---|---|---|---|---|---|
Owned | 1,492 | 29 | ||||||
Leased | 81 | 8 | ||||||
Combined (a) | 167 | 1 | ||||||
Total | 1,740 | 38 | ||||||
We own our corporate headquarters buildings located in Minneapolis, Minnesota, and we lease and own additional office space in the United States. Our international sourcing operations have 27 office locations in 18 countries, all of which are leased. We also lease office space in Bangalore, India, where we operate various support functions. Our properties are in good condition, well maintained and suitable to carry on our business.
For additional information on our properties, see also Capital Expenditures section in Item 7, Management's Discussion and Analysis of Financial Condition and Results of Operations and Notes 13 and 21 of the Notes to Consolidated Financial Statements included in Item 8, Financial Statements and Supplementary Data.
8
Table of Contents
Item 3. Legal Proceedings
SEC Rule S-K Item 103 requires that companies disclose environmental legal proceedings involving a governmental authority when such proceedings involve potential monetary sanctions of $100,000 or more.
We are one of many defendants in a lawsuit filed on February 13, 2008, by the State of California involving environmental matters that may involve potential monetary sanctions in excess of $100,000. The allegation, initially made by the California Air Resources Board in April 2006, involves a nonfood product (hairspray) that allegedly contained levels of a volatile organic compound in excess of permissible levels. We anticipate that the settlement, to be fully indemnified by the vendor, is likely to exceed $100,000 but will not be material to our financial position, results of operations or cash flows. In addition, we are a defendant in a civil lawsuit filed by the California Attorney General in June 2009 alleging that we did not handle and dispose of certain unsold products as a hazardous waste. The case is in its early stages. We anticipate that this lawsuit may involve potential monetary sanctions in excess of $100,000, but will not be material to our financial position, results of operations or cash flows.
We are the subject of an ongoing Environmental Protection Agency (EPA) investigation for alleged violations of the Clean Air Act (CAA). In March 2009, the EPA issued a Finding of Violation (FOV) related to alleged violations of the CAA, specifically the National Emission Standards for Hazardous Air Pollutants (NESHAP) promulgated by the EPA for asbestos. The FOV pertains to the remodeling of 36 Target stores that occurred between January 1, 2003 and October 28, 2007. The EPA FOV process is ongoing and no specific relief has been sought to date by the EPA. We anticipate that any resolution of this matter will be in the form of monetary penalties that are likely to exceed $100,000 but will not be material to our financial position, results of operations or cash flows.
The American Jobs Creation Act of 2004 requires SEC registrants to disclose if they have been required to pay certain penalties for failing to disclose to the Internal Revenue Service their participation in listed transactions. We have not been required to pay any of the penalties set forth in Section 6707A(e)(2) of the Internal Revenue Code.
For a description of other legal proceedings, see Note 18 of the Notes to Consolidated Financial Statements included in Item 8, Financial Statements and Supplementary Data.
Item 4. Reserved
Item 4A. Executive Officers
The executive officers of Target as of March 10, 2010 and their positions and ages are as follows:
| Name | Title | Age | ||||
|---|---|---|---|---|---|---|
| Timothy R. Baer | Executive Vice President, General Counsel and Corporate Secretary | 49 | ||||
| Michael R. Francis | Executive Vice President and Chief Marketing Officer | 47 | ||||
| John D. Griffith | Executive Vice President, Property Development | 48 | ||||
| Beth M. Jacob | Executive Vice President, Technology Services and Chief Information Officer | 48 | ||||
| Jodeen A. Kozlak | Executive Vice President, Human Resources | 46 | ||||
| Troy H. Risch | Executive Vice President, Stores | 42 | ||||
| Douglas A. Scovanner | Executive Vice President and Chief Financial Officer | 54 | ||||
| Terrence J. Scully | President, Target Financial Services | 57 | ||||
| Gregg W. Steinhafel | Chairman of the Board, President and Chief Executive Officer | 55 | ||||
| Kathryn A. Tesija | Executive Vice President, Merchandising | 47 | ||||
Each officer is elected by and serves at the pleasure of the Board of Directors. There is neither a family relationship between any of the officers named and any other executive officer or member of the Board of Directors nor any arrangement or understanding pursuant to which any person was selected as an officer. The
9
Table of Contents
service period of each officer in the positions listed and other business experience for the past five years is listed below.
| Timothy R. Baer | Executive Vice President, General Counsel and Corporate Secretary since March 2007. Senior Vice President, General Counsel and Corporate Secretary from June 2004 to March 2007. | |
Michael R. Francis | | Executive Vice President and Chief Marketing Officer since August 2008. Executive Vice President, Marketing from January 2003 to August 2008. |
John D. Griffith | | Executive Vice President, Property Development since January 2005. |
Beth M. Jacob | | Executive Vice President and Chief Information Officer since January 2010. Senior Vice President and Chief Information Officer from July 2008 to January 2010. Vice President, Guest Operations, Target Financial Services from August 2006 to July 2008. Vice President, Guest Contact Centers, Target Financial Services from September 2003 to August 2006. |
Jodeen A. Kozlak | | Executive Vice President, Human Resources since March 2007. Senior Vice President, Human Resources from February 2006 to March 2007. Vice President, Human Resources and Employee Relations General Counsel from November 2005 to February 2006. From June 2001 to November 2005 Ms. Kozlak held several positions in Employee Relations at Target. |
Troy H. Risch | | Executive Vice President, Stores since September 2006. Group Vice President from September 2005 to September 2006. Group Director from February 2002 to September 2005. |
Douglas A. Scovanner | | Executive Vice President and Chief Financial Officer since February 2000. |
Terrence J. Scully | | President, Target Financial Services since March 2003. |
Gregg W. Steinhafel | | Chief Executive Officer since May 2008. President since August 1999. Director since January 2007. Chairman of the Board since February 2009. |
Kathryn A. Tesija | | Executive Vice President, Merchandising since May 2008. Senior Vice President, Merchandising, from July 2001 to May 2008. |
10
Table of Contents
PART II
Item 5. Market for the Registrant's Common Equity, Related Stockholder Matters and Issuer Purchases of Equity Securities
Our common stock is listed on the New York Stock Exchange under the symbol "TGT." We are authorized to issue up to 6,000,000,000 shares of common stock, par value $0.0833, and up to 5,000,000 shares of preferred stock, par value $0.01. At March 10, 2010, there were 17,562 shareholders of record. Dividends declared per share and the high and low closing common stock price for each fiscal quarter during 2009 and 2008 are disclosed in Note 29 of the Notes to Consolidated Financial Statements, included in Item 8, Financial Statements and Supplementary Data.
In November 2007, our Board of Directors authorized the repurchase of $10 billion of our common stock. In November 2008 we announced a temporary suspension of our open-market share repurchase program. In January 2010, we resumed open-market purchases of shares under this program. Since the inception of this share repurchase program, we have repurchased 103.6 million common shares for a total cash investment of $5,320 million ($51.36 per share).
The table below presents information with respect to Target common stock purchases made during the three months ended January 30, 2010, by Target or any "affiliated purchaser" of Target, as defined in Rule 10b-18(a)(3) under the Exchange Act.
| | | | | Approximate | |||||||||
|---|---|---|---|---|---|---|---|---|---|---|---|---|---|
| | | | Total Number of | Dollar Value of | |||||||||
| | | | Shares Purchased | Shares that May | |||||||||
| | Total Number | Average | as Part of | Yet Be Purchased | |||||||||
| | of Shares | Price Paid | Publicly Announced | Under the | |||||||||
| Period | Purchased | per Share | Program | Program | |||||||||
November 1, 2009 through November 28, 2009 | - | $ | - | 95,235,594 | $ | 5,103,322,945 | |||||||
November 29, 2009 through January 2, 2010 | - | - | 95,235,594 | 5,103,322,945 | |||||||||
January 3, 2010 through January 30, 2010 | 8,335,800 | 50.74 | 103,571,394 | 4,680,327,198 | |||||||||
| 8,335,800 | $ | 50.74 | 103,571,394 | $ | 4,680,327,198 | |||||||
The table above includes shares of common stock reacquired from team members who wish to tender owned shares to satisfy the tax withholding on equity awards as part of our long-term incentive plans or to satisfy the exercise price on stock option exercises. For the three months ended January 30, 2010, 11,960 shares were acquired at an average per share price of $50.17 pursuant to our long-term incentive plans.
The table above includes shares reacquired upon settlement of prepaid forward contracts. For the three months ended January 30, 2010, no shares were reacquired through these contracts. At January 30, 2010, we held asset positions in prepaid forward contracts for 1.5 million shares of our common stock, for a total cash investment of $66 million, or an average per share price of $42.77. Refer to Notes 24 and 26 of the Notes to Consolidated Financial Statements for further details of these contracts.
11
Table of Contents
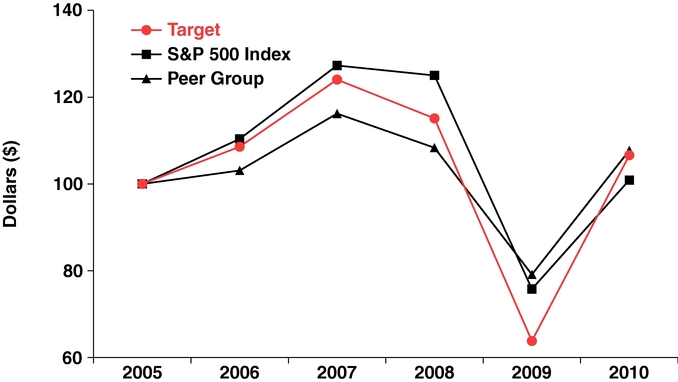
Comparison of Cumulative Five Year Total Return
| | Fiscal Years Ended | ||||||||||||||||||
|---|---|---|---|---|---|---|---|---|---|---|---|---|---|---|---|---|---|---|---|
| | January 29, 2005 | January 28, 2006 | February 3, 2007 | February 2, 2008 | January 31, 2009 | January 30, 2010 | |||||||||||||
Target | $ | 100.00 | $ | 108.57 | $ | 124.04 | $ | 115.10 | $ | 63.82 | $ | 106.62 | |||||||
S&P 500 Index | 100.00 | 110.38 | 127.29 | 125.00 | 75.79 | 100.90 | |||||||||||||
Peer Group | 100.00 | 103.10 | 116.21 | 108.34 | 79.13 | 107.73 | |||||||||||||
The graph above compares the cumulative total shareholder return on our common stock for the last five fiscal years with the cumulative total return on the S&P 500 Index and a peer group consisting of the companies comprising the S&P 500 Retailing Index and the S&P 500 Food and Staples Retailing Index (Peer Group) over the same period. The Peer Group index consists of 39 general merchandise, food and drug retailers and is weighted by the market capitalization of each component company. The graph assumes the investment of $100 in Target common stock, the S&P 500 Index and the Peer Group on January 29, 2005 and reinvestment of all dividends.
Item 6. Selected Financial Data
| | As of or for the Year Ended | ||||||||||||||||||
|---|---|---|---|---|---|---|---|---|---|---|---|---|---|---|---|---|---|---|---|
| | 2009 | 2008 | 2007 | 2006 (a) | 2005 | 2004 | |||||||||||||
Financial Results: (millions) | |||||||||||||||||||
Total revenues | $ | 65,357 | $ | 64,948 | $ | 63,367 | $ | 59,490 | $ | 52,620 | $ | 46,839 | |||||||
Earnings from continuing operations | 2,488 | 2,214 | 2,849 | 2,787 | 2,408 | 1,885 | |||||||||||||
Net Earnings | 2,488 | 2,214 | 2,849 | 2,787 | 2,408 | 3,198 | |||||||||||||
Per Share: | |||||||||||||||||||
Basic earnings per share | 3.31 | 2.87 | 3.37 | 3.23 | 2.73 | 2.09 | |||||||||||||
Diluted earnings per share | 3.30 | 2.86 | 3.33 | 3.21 | 2.71 | 2.07 | |||||||||||||
Cash dividends declared per share | 0.67 | 0.62 | 0.54 | 0.46 | 0.38 | 0.31 | |||||||||||||
Financial Position: (millions) | |||||||||||||||||||
Total assets | 44,533 | 44,106 | 44,560 | 37,349 | 34,995 | 32,293 | |||||||||||||
Long-term debt, including current portion | 16,814 | 18,752 | 16,590 | 10,037 | 9,872 | 9,538 | |||||||||||||
12
Table of Contents
Item 7. Management's Discussion and Analysis of Financial Condition and Results of Operations
Executive Summary
Our 2009 financial results in both of our business segments were affected by the challenging economy in which we operated. In light of that environment, performance in our Retail Segment was remarkable, as the segment generated the highest EBIT in the Corporation's history, in a year when comparable-store sales declined 2.5 percent. In the Credit Card Segment, disciplined management led to a 29.4 percent increase in segment profit in a year when Target's average investment in the portfolio declined about 32 percent, representing a near-doubling of segment pretax return on invested capital.
Cash flow provided by operations was $5,881 million, $4,430 million, and $4,125 million for 2009, 2008, and 2007, respectively. In 2009, we opened 76 new stores representing 58 stores net of 13 relocations and 5 closings. In 2008, we opened 114 new stores representing 91 stores net of 21 relocations and two closings.
Management's Discussion and Analysis is based on our Consolidated Financial Statements in Item 8, Financial Statements and Supplementary Data.
Analysis of Results of Operations
Retail Segment
| | | | | Percent Change | ||||||||||||
|---|---|---|---|---|---|---|---|---|---|---|---|---|---|---|---|---|
| Retail Segment Results (millions) | | | | |||||||||||||
| 2009 | 2008 | 2007 | 2009/2008 | 2008/2007 | ||||||||||||
Sales | $ | 63,435 | $ | 62,884 | $ | 61,471 | 0.9 | % | 2.3 | % | ||||||
Cost of sales | 44,062 | 44,157 | 42,929 | (0.2 | ) | 2.9 | ||||||||||
Gross margin | 19,373 | 18,727 | 18,542 | 3.5 | 1.0 | |||||||||||
SG&A expenses (a) | 12,989 | 12,838 | 12,557 | 1.2 | 2.2 | |||||||||||
EBITDA | 6,384 | 5,889 | 5,985 | 8.4 | (1.6 | ) | ||||||||||
Depreciation and amortization | 2,008 | 1,808 | 1,643 | 11.0 | 10.1 | |||||||||||
EBIT | $ | 4,376 | $ | 4,081 | $ | 4,342 | 7.3 | % | (6.0 | )% | ||||||
EBITDA is earnings before interest expense, income taxes, depreciation and amortization.
EBIT is earnings before interest expense and income taxes.
(a) New account and loyalty rewards redeemed by our guests reduce reported sales. Our Retail Segment charges these discounts to our Credit Card Segment, and the reimbursements of $89 million in 2009, $117 million in 2008, and $114 million in 2007, are recorded as a reduction to SG&A expenses within the Retail Segment .
| Retail Segment Rate Analysis | 2009 | 2008 | 2007 | |||||||
|---|---|---|---|---|---|---|---|---|---|---|
Gross margin rate | 30.5 | % | 29.8 | % | 30.2 | % | ||||
SG&A expense rate | 20.5 | 20.4 | 20.4 | |||||||
EBITDA margin rate | 10.1 | 9.4 | 9.7 | |||||||
Depreciation and amortization expense rate | 3.2 | 2.9 | 2.7 | |||||||
EBIT margin rate | 6.9 | 6.5 | 7.1 | |||||||
Retail Segment rate analysis metrics are computed by dividing the applicable amount by sales.
Sales
Sales include merchandise sales, net of expected returns, from our stores and our online business, as well as gift card breakage. Refer to Note 2 of the Notes to Consolidated Financial Statements for a definition of gift card breakage. Total sales for the Retail Segment for 2009 were $63,435 million, compared with $62,884 million in 2008 and $61,471 million in 2007. All periods were 52-week years. Growth in total sales between 2009 and 2008 as well as between 2008 and 2007 resulted from sales from additional stores opened, offset by lower comparable-store sales. In 2009, deflation affected sales growth by approximately
13
Table of Contents
4 percentage points, compared with an inflationary impact of approximately 2 percentage points in 2008 and a deflationary impact of 2 percentage points in 2007.
| | Percentage of Sales | |||||||||
|---|---|---|---|---|---|---|---|---|---|---|
| Sales by Product Category | ||||||||||
| 2009 | 2008 | 2007 | ||||||||
Household essentials | 23 | % | 22 | % | 21 | % | ||||
Hardlines | 22 | 22 | 22 | |||||||
Apparel and accessories | 20 | 20 | 22 | |||||||
Home furnishings and décor | 19 | 21 | 22 | |||||||
Food and pet supplies | 16 | 15 | 13 | |||||||
Total | 100 | % | 100 | % | 100 | % | ||||
Refer to the Merchandise section in Item 1, Business, for a description of our product categories.
Comparable-store sales is a measure that indicates the performance of our existing stores by measuring the growth in sales for such stores for a period over the comparable, prior-year period of equivalent length. The method of calculating comparable-store sales varies across the retail industry. As a result, our comparable-store sales calculation is not necessarily comparable to similarly titled measures reported by other companies.
Comparable-store sales are sales from our online business and sales from general merchandise and SuperTarget stores open longer than one year, including:
• sales from stores that have been remodeled or expanded while remaining open • sales from stores that have been relocated to new buildings of the same format within the same trade area, in which the new store opens at about the same time as the old store closesComparable-store sales do not include:
• sales from general merchandise stores that have been converted, or relocated within the same trade area, to a SuperTarget store format • sales from stores that were intentionally closed to be remodeled, expanded or reconstructed
| Comparable-Store Sales | 2009 | 2008 | 2007 | |||||||||
|---|---|---|---|---|---|---|---|---|---|---|---|---|
Comparable-store sales | (2.5) | % | (2.9 | )% | 3.0 | % | ||||||
Drivers of changes in comparable-store sales: | ||||||||||||
Number of transactions | (0.2) | % | (3.1 | )% | 0.3 | % | ||||||
Average transaction amount | (2.3) | % | 0.2 | % | 2.6 | % | ||||||
Units per transaction | (1.5) | % | (2.1 | )% | 1.1 | % | ||||||
Selling price per unit | (0.8) | % | 2.3 | % | 1.5 | % | ||||||
The comparable-store sales increases or decreases above are calculated by comparing sales in fiscal year periods with comparable prior fiscal year periods of equivalent length.
In fiscal 2009, the change in comparable-store sales was driven by a decline in the average transaction amount, primarily due to a decrease in the number of units per transaction. In 2008, the change in comparable-store sales was driven by a decline in the number of transactions, slightly offset by an increase in average transaction amount, which reflects the effect of a higher selling price per unit sold partially offset by a decrease in number of units per transaction. Transaction-level metrics are influenced by a broad array of macroeconomic, competitive and consumer behavioral factors, as well as sales mix, and comparable-store sales rates are negatively impacted by transfer of sales to new stores.
Gross Margin Rate
Gross margin rate represents gross margin (sales less cost of sales) as a percentage of sales. See Note 3 of the Notes to Consolidated Financial Statements for a description of expenses included in cost of sales. Markup is the difference between an item's cost and its retail price (expressed as a percentage of its retail price). Factors that affect markup include vendor offerings and negotiations, vendor income, sourcing strategies, market forces like raw material and freight costs, and competitive influences. Markdowns are the reduction in the original or previous price of retail merchandise. Factors that affect markdowns include inventory management, competitive influences and economic conditions.
In 2009, our gross margin rate was 30.5 percent compared with 29.8 percent in 2008. Our 2009 gross margin rate benefitted from rate improvements within categories, partially offset by the mix impact of faster
14
Table of Contents
sales growth in lower margin rate categories (generally product categories of household essentials and food). The impact of rate performance within merchandise categories on gross margin rate was an approximate 1.1 percentage point increase for 2009. This increase is the result of improved markups and reduced markdowns. The impact of sales mix on gross margin rate was an approximate 0.4 percentage point reduction.
In 2008 our gross margin rate was 29.8 percent compared with 30.2 percent in 2007. Our 2008 gross margin rate was adversely affected by sales mix, which resulted in a 0.6 percentage point reduction in the gross margin rate. Sales in merchandise categories that yield lower gross margin rates outpaced sales in our higher margin apparel and home merchandise categories. This mix impact was partially offset by favorable supply chain expense rates, as well as higher gross margin rates within merchandise categories across our assortment, which had a combined impact on gross margin rate of an approximate 0.2 percentage point increase.
Selling, General and Administrative Expense Rate
Our selling, general and administrative (SG&A) expense rate represents SG&A expenses as a percentage of sales. See Note 3 of the Notes to Consolidated Financial Statements for a description of expenses included in SG&A expenses. SG&A expenses exclude depreciation and amortization, as well as expenses associated with our credit card operations, which are reflected separately in our Consolidated Statements of Operations.
SG&A expense rate was 20.5 percent in 2009 compared with 20.4 percent in both 2008 and 2007. The change in the rate was primarily driven by an approximate 0.4 percentage point impact from an increase in incentive compensation due to better than expected 2009 performance compared with 2008 results. The rate increase was partially offset by an approximate 0.2 percentage point impact from sustained productivity gains in our stores. Within SG&A expenses in 2008 and 2007, there were no expense categories that experienced a significant fluctuation as a percentage of sales, when compared with prior periods.
Depreciation and Amortization Expense Rate
Our depreciation and amortization expense rate represents depreciation and amortization expense as a percentage of sales. In 2009, our depreciation and amortization expense rate was 3.2 percent compared with 2.9 percent in 2008 and 2.7 percent in 2007. The increase in the rate was primarily due to accelerated depreciation on assets that will be replaced as part of our 340-store 2010 remodel program. The comparative increase in 2008 was due to increased capital expenditures, specifically related to investments in new stores.
Store Data
| Number of Stores | Target general merchandise stores | SuperTarget stores | Total | |||||||
|---|---|---|---|---|---|---|---|---|---|---|
January 31, 2009 | 1,443 | 239 | 1,682 | |||||||
Opened | 63 | 13 | 76 | |||||||
Closed (a) | (17 | ) | (1 | ) | (18 | ) | ||||
January 30, 2010 | 1,489 | 251 | 1,740 | |||||||
Retail Square Feet (b) | ||||||||||
January 31, 2009 | 180,321 | 42,267 | 222,588 | |||||||
Opened | 9,039 | 2,404 | 11,443 | |||||||
Closed (a) | (1,911 | ) | (179 | ) | (2,090 | ) | ||||
January 30, 2010 | 187,449 | 44,492 | 231,941 | |||||||
15
Table of Contents
Credit Card Segment
Credit card revenues are comprised of finance charges, late fees and other revenue, and third party merchant fees, or the amounts received from merchants who accept the Target Visa credit card.
| | 2009 | 2008 | 2007 | ||||||||||||||||
|---|---|---|---|---|---|---|---|---|---|---|---|---|---|---|---|---|---|---|---|
| Credit Card Segment Results | |||||||||||||||||||
| Amount (in millions) | Rate (d) | Amount (in millions) | Rate (d) | Amount (in millions) | Rate (d) | ||||||||||||||
Finance charge revenue | $ | 1,450 | 17.4 | % | $ | 1,451 | 16.7 | % | $ | 1,308 | 18.0 | % | |||||||
Late fees and other revenue | 349 | 4.2 | 461 | 5.3 | 422 | 5.8 | |||||||||||||
Third party merchant fees | 123 | 1.5 | 152 | 1.7 | 166 | 2.3 | |||||||||||||
Total revenues | 1,922 | 23.0 | 2,064 | 23.7 | 1,896 | 26.1 | |||||||||||||
Bad debt expense | 1,185 | 14.2 | 1,251 | 14.4 | 481 | 6.6 | |||||||||||||
Operations and marketing expenses (a) | 425 | 5.1 | 474 | 5.4 | 469 | 6.4 | |||||||||||||
Depreciation and amortization | 14 | 0.2 | 17 | 0.2 | 16 | 0.2 | |||||||||||||
Total expenses | 1,624 | 19.4 | 1,742 | 20.0 | 966 | 13.3 | |||||||||||||
EBIT | 298 | 3.5 | 322 | 3.7 | 930 | 12.8 | |||||||||||||
Interest expense on nonrecourse debt collateralized by credit card receivables | 97 | 167 | 133 | ||||||||||||||||
Segment profit | $ | 201 | $ | 155 | $ | 797 | |||||||||||||
Average receivables funded by Target (b) | $ | 2,866 | $ | 4,192 | $ | 4,888 | |||||||||||||
Segment pretax ROIC (c) | 7.0 | % | 3.7 | % | 16.3 | % | |||||||||||||
| | 2009 | 2008 | 2007 | ||||||||||||||||
|---|---|---|---|---|---|---|---|---|---|---|---|---|---|---|---|---|---|---|---|
| Spread Analysis – Total Portfolio | |||||||||||||||||||
| Amount (in millions) | Rate | Amount (in millions) | Rate | Amount (in millions) | Rate | ||||||||||||||
EBIT | $ | 298 | 3.5 | % (b) | $ | 322 | 3.7 | % (b) | $ | 930 | 12.8 | % (b) | |||||||
LIBOR (a) | 0.3 | % | 2.3 | % | 5.1 | % | |||||||||||||
Spread to LIBOR (c) | $ | 270 | 3.2 | % (b) | $ | 118 | 1.4 | % (b) | $ | 558 | 7.7 | % (b) | |||||||
Our primary measure of segment profit in our Credit Card Segment is the EBIT generated by our total credit card receivables portfolio less the interest expense on nonrecourse debt collateralized by credit card receivables. We analyze this measure of profit in light of the amount of capital we have invested in our credit card receivables. In addition, we measure the performance of our overall credit card receivables portfolio by calculating the dollar Spread to LIBOR at the portfolio level. This metric approximates overall financial performance of the entire credit card portfolio we manage by measuring the difference between EBIT earned on the portfolio and a hypothetical benchmark rate financing cost applied to the entire portfolio. The interest rate on all nonrecourse debt securitized by credit card receivables is tied to LIBOR. For the first quarter of 2009, the vast majority of our portfolio accrued finance charge revenue at rates tied to the Prime Rate. Effective April 2009, we implemented a terms change to our portfolio that established a minimum annual percentage rate (APR) applied to cardholder account balances. Under these terms, finance charges accrue at a fixed APR if the benchmark Prime Rate is less than 6%; if the Prime Rate is greater than 6%, finance charges accrue at the benchmark Prime Rate, plus a spread. Because the Prime Rate was less than 6% during 2009, the majority of our portfolio accrued finance charges at a fixed APR subsequent to this terms change. As a result of regulatory actions that impact our portfolio, effective January 2010, we implemented a second terms change that converted the minimum APR for the majority of our accounts to a variable rate, and we eliminated penalty
16
Table of Contents
pricing for all current, or nondelinquent accounts. Penalty pricing is the charging of a higher interest rate for a period of time, generally 12 months, and is triggered when a cardholder repeatedly fails to make timely payments.
In 2009, Credit Card Segment profit increased to $201 million from $155 million as a result of improved portfolio performance (Spread to LIBOR) and significantly lower funding costs. The reduction in our investment in the portfolio combined with these results produced a strong improvement in segment ROIC. Segment revenues were $1,922 million, a decrease of $143 million, or 6.9 percent, from the prior year. The decrease in revenue was driven by a lower Prime Rate, lower average receivables, higher finance charge and late-fee write-offs and lower late fees due to fewer delinquent accounts offset by the positive impacts of the terms changes implemented in late 2008 and April 2009. Segment expenses were $1,624 million, a decrease of $118 million, or 6.8 percent, from prior year driven by lower bad debt and operations and marketing expenses, on both a dollar and rate basis. Segment interest expense benefited from a significantly lower LIBOR rate compared to the prior year.
Segment profit and dollar Spread to LIBOR measures in 2008 were significantly impacted on both a rate and dollar basis by bad debt expense. Segment revenues were $2,064 million, an increase of $168 million, or 8.9 percent, from the prior year, driven by a 19.5 percent increase in average receivables. On a rate basis, revenue yield decreased 2.4 percentage points primarily due to a reduction in the Prime Rate index used to determine finance charge rates in the portfolio and lower external sales volume contributing to the decline in third party merchant fees. This negative pressure on revenue yield was offset modestly by the positive impact of terms changes implemented in 2008 that increased our effective yield. Segment expenses were $1,742 million, an increase of $776 million, or 80.3 percent, from the prior year driven by an increase in bad debt expense of $770 million. The increase in bad debt expense resulted from the increase in our incurred net write-off rate from 5.9 percent in 2007 to 9.3 percent in 2008 and the increase in the allowance for doubtful accounts of $440 million for anticipated future write-offs of current receivables. Segment profit decreased from 16.3 percent in 2007 to 3.7 percent in 2008 primarily due to the effect of bad debt expense, the reduction in receivables owned and funded by Target, and the impact of a lower Prime Rate during 2008.
| Receivables Rollforward Analysis | Fiscal Year | Percent Change | ||||||||||||||
|---|---|---|---|---|---|---|---|---|---|---|---|---|---|---|---|---|
| (millions) | 2009 | 2008 | 2007 | 2009/2008 | 2008/2007 | |||||||||||
Beginning gross credit card receivables | $ | 9,094 | $ | 8,624 | $ | 6,711 | 5.4 | % | 28.5 | % | ||||||
Charges at Target | 3,553 | 4,207 | 4,491 | (15.5 | ) | (6.3 | ) | |||||||||
Charges at third parties | 6,763 | 8,542 | 9,398 | (20.8 | ) | (9.1 | ) | |||||||||
Payments | (12,065 | ) | (13,482 | ) | (13,388 | ) | (10.5 | ) | 0.7 | |||||||
Other | 637 | 1,203 | 1,412 | (47.1 | ) | (14.8 | ) | |||||||||
Period-end gross credit card receivables | $ | 7,982 | $ | 9,094 | $ | 8,624 | (12.2 | )% | 5.4 | % | ||||||
Average gross credit card receivables | $ | 8,351 | $ | 8,695 | $ | 7,275 | (4.0 | )% | 19.5 | % | ||||||
Accounts with three or more payments (60+ days) past due as a percentage of period-end credit card receivables | 6.3 | % | 6.1 | % | 4.0 | % | ||||||||||
Accounts with four or more payments (90+ days) past due as a percentage of period-end gross credit card receivables | 4.7 | % | 4.3 | % | 2.7 | % | ||||||||||
Credit card penetration (a) | 5.6 | % | 6.7 | % | 7.3 | % | ||||||||||
| Allowance for Doubtful Accounts | Fiscal Year | Percent Change | ||||||||||||||
|---|---|---|---|---|---|---|---|---|---|---|---|---|---|---|---|---|
| (millions) | 2009 | 2008 | 2007 | 2009/2008 | 2008/2007 | |||||||||||
Allowance at beginning of period | $ | 1,010 | $ | 570 | $ | 517 | 77.1 | % | 10.4 | % | ||||||
Bad debt expense | 1,185 | 1,251 | 481 | (5.3 | ) | 160.1 | ||||||||||
Net write-offs (a) | (1,179 | ) | (811 | ) | (428 | ) | 45.2 | 89.8 | ||||||||
Allowance at end of period | $ | 1,016 | $ | 1,010 | $ | 570 | 0.6 | % | 77.1 | % | ||||||
As a percentage of period-end gross credit card receivables | 12.7 | % | 11.1 | % | 6.6 | % | ||||||||||
Net write-offs as a percentage of average gross credit card receivables (annualized) | 14.1 | % | 9.3 | % | 5.9 | % | ||||||||||
17
Table of Contents
Our 2009 period-end gross credit card receivables were $7,982 million compared with $9,094 million in 2008, a decrease of 12.2 percent. Average gross credit card receivables in 2009 decreased 4.0 percent compared with 2008 levels. This change was driven by tighter risk management and underwriting initiatives that have significantly reduced available credit lines for higher-risk cardholders, fewer new accounts being opened, and a decrease in charge activity resulting from reductions in card usage by our guests, partially offset by the impact of a decline in payment rates.
Our 2008 period-end gross credit card receivables were $9,094 million compared with $8,624 million in 2007, an increase of 5.4 percent. Average gross credit card receivables in 2008 increased 19.5 percent compared with 2007 levels. This growth was driven by the annualization of the prior year's product change from proprietary Target Cards to higher-limit Target Visa cards and the impact of industry-wide declines in payment rates, offset in part by a reduction in charge activity resulting from reductions in card usage by our guests, and from risk management and underwriting initiatives that significantly reduced credit lines for higher risk cardholders.
Other Performance Factors
Net Interest Expense
Net interest expense was $801 million at the end of 2009, decreasing 7.5 percent, or $65 million from 2008. This decline was due to a decrease in the annualized average portfolio interest rate from 5.3 percent to 4.8 percent partially offset by a $16 million charge related to the early retirement of long-term debt. In 2008, net interest expense was $866 million compared with $647 million in 2007, an increase of 33.8 percent. This increase was due primarily to higher average debt balances supporting capital investment, share repurchase and the receivables portfolio, partially offset by a lower average portfolio net interest rate.
Provision for Income Taxes
Our effective income tax rate was 35.7 percent in 2009 and 37.4 percent in 2008. The decrease in the effective rate between periods is primarily due to nontaxable capital market returns on investments used to economically hedge the market risk in deferred compensation plans in 2009 compared with nondeductible losses in 2008. The 2009 effective income tax rate is also lower due to federal and state discrete items.
Our effective income tax rate for 2008 was 37.4 percent compared with 38.4 percent in 2007. The decrease in 2008 was primarily due to tax reserve reductions resulting from audit settlements and the effective resolution of other issues. The 2008 effective income tax rate was also lower due to a comparatively greater proportion of earnings subject to rate differences between taxing jurisdictions. These rate declines were partially offset by lower capital market returns on investments used to economically hedge the market risk in deferred compensation plans. Gains and losses from these investments are not taxable.
Analysis of Financial Condition
Liquidity and Capital Resources
Our 2009 operations were entirely funded by internally generated funds. Cash flow provided by operations was $5,881 in 2009 compared with $4,430 million in 2008. This strong cash flow allowed us to fund capital expenditures of $1,729 million and pay off $1.3 billion of maturing debt with internally generated funds. In addition we accelerated the payoff of a $550 million 2010 debt maturity, restarted our share repurchase program earlier than expected and experienced a $1.3 billion increase in marketable securities at January 30, 2010.
Our 2009 period-end gross credit card receivables were $7,982 million compared with $9,094 million in 2008, a decrease of 12.2 percent. Average gross credit card receivables in 2009 decreased 4.0 percent compared with 2008 levels. This change was driven by the factors indicated in the Credit Card Segment above. This trend and the factors influencing it are likely to continue into 2010. Due to the decrease in gross credit card receivables, Target Receivables Corporation (TRC), using cash flows from the receivables, repaid an affiliate of JPMorgan Chase (JPMC) $163 million during 2009 under the terms of our agreement with them as described in Note 10 of the Notes to Consolidated Financial Statements. To the extent the receivables balance continues to decline, TRC expects to continue to pay JPMC a prorata portion of principal collections such that the portion owned by JPMC would not exceed 47 percent.
18
Table of Contents
Year-end inventory levels increased $474 million, or 7.1 percent from 2008, primarily due to unusually low inventory levels at the end of 2008 in response to the challenging economic environment. Inventory levels were also higher to support traffic-driving strategic initiatives, such as food and pharmacy, in addition to comparatively higher retail square footage. Accounts payable increased by $174 million, or 2.7 percent over the same period.
During 2009, we repurchased 9.9 million shares of our common stock for a total cash investment of $479 million ($48.54 per share) under a $10 billion share repurchase plan authorized by our Board of Directors in November 2007. In 2008, we repurchased 67.2 million shares of our common stock for a total cash investment of $3,395 million ($50.49 per share).
We paid dividends totaling $496 million in 2009 and $465 million in 2008, an increase of 6.7 percent. We declared dividends totaling $503 million ($0.67 per share) in 2009, an increase of 6.8 percent over 2008. In 2008, we declared dividends totaling $471 million ($0.62 per share), an increase of 3.8 percent over 2007. We have paid dividends every quarter since our first dividend was declared following our 1967 initial public offering, and it is our intent to continue to do so in the future.
Our financing strategy is to ensure liquidity and access to capital markets, to manage our net exposure to floating interest rate volatility, and to maintain a balanced spectrum of debt maturities. Within these parameters, we seek to minimize our borrowing costs.
Maintaining strong investment-grade debt ratings is a key part of our financing strategy. Our current debt ratings are as follows:
| Debt Ratings | | Standard and Poor's | | |||||||
|---|---|---|---|---|---|---|---|---|---|---|
| | Moody's | Fitch | ||||||||
Long-term debt | A2 | A+ | A | |||||||
Commercial paper | P-1 | A-1 | F1 | |||||||
Securitized receivables (a) | Aa2 | A+ | n/a | |||||||
At January 30, 2010 and January 31, 2009, there were no amounts outstanding under our commercial paper program. In past years, we funded our peak sales season working capital needs through our commercial paper program and then used the cash generated from that sales season to repay the commercial paper issued. In 2009 we funded our working capital needs through internally generated funds. Additionally and as described in Note 10 of the Notes to Consolidated Financial Statements, during 2008 we sold to JPMC an interest in our credit card receivables for approximately $3.8 billion. We received proceeds of approximately $3.6 billion, reflecting a 7 percent discount.
An additional source of liquidity is available to us through a committed $2 billion unsecured revolving credit facility obtained through a group of banks in April 2007, which will expire in April 2012. No balances were outstanding at any time during 2009 or 2008 under this facility.
Most of our long-term debt obligations contain covenants related to secured debt levels. In addition to a secured debt level covenant, our credit facility also contains a debt leverage covenant. We are, and expect to remain, in compliance with these covenants. Additionally, at January 30, 2010, no notes or debentures contained provisions requiring acceleration of payment upon a debt rating downgrade, except that certain outstanding notes allow the note holders to put the notes to us if within a matter of months of each other we experience both (i) a change in control; and (ii) our long-term debt ratings are either reduced and the resulting rating is non-investment grade, or our long-term debt ratings are placed on watch for possible reduction and those ratings are subsequently reduced and the resulting rating is non-investment grade.
Our interest coverage ratio represents the ratio of pretax earnings before fixed charges to fixed charges. Fixed charges include interest expense and the interest portion of rent expense. Our interest coverage ratio as calculated by the SEC's applicable rules was 5.1x in 2009, 4.3x in 2008, and 6.4x in 2007.
Capital Expenditures
Capital expenditures were $1,729 million in 2009 compared with $3,547 million in 2008 and $4,369 million in 2007. This decrease was driven by lower capital expenditures for new stores, remodels and technology-related assets. Our 2009 capital expenditures include $232 million related to stores that will open in 2010 and
19
Table of Contents
later years. Net property and equipment decreased $475 million in 2009 following an increase of $1,661 million in 2008.
| Capital Expenditures | Percentage of Capital Expenditures | |||||||||
|---|---|---|---|---|---|---|---|---|---|---|
| | 2009 | 2008 | 2007 | |||||||
New stores | 52 | % | 66 | % | 71 | % | ||||
Remodels and expansions | 17 | 8 | 7 | |||||||
Information technology, distribution and other | 31 | 26 | 22 | |||||||
Total | 100 | % | 100 | % | 100 | % | ||||
Commitments and Contingencies
At January 30, 2010, our contractual obligations were as follows:
| Contractual Obligations | Payments Due by Period | ||||||||||||||||
|---|---|---|---|---|---|---|---|---|---|---|---|---|---|---|---|---|---|
| (millions) | Total | Less than 1 Year | 1-3 Years | 3-5 Years | After 5 Years | ||||||||||||
Long-term debt (a) | |||||||||||||||||
Unsecured | $ | 11,071 | $ | 786 | $ | 1,607 | $ | 502 | $ | 8,176 | |||||||
Nonrecourse | 5,553 | 900 | 750 | 3,903 | - | ||||||||||||
Interest payments – long-term debt | |||||||||||||||||
Unsecured | 10,405 | 693 | 1,240 | 1,061 | 7,411 | ||||||||||||
Nonrecourse (b) | 159 | 39 | 74 | 46 | - | ||||||||||||
Capital lease obligations (c) | 472 | 19 | 44 | 45 | 364 | ||||||||||||
Operating leases (c) | 4,000 | 264 | 324 | 265 | 3,147 | ||||||||||||
Deferred compensation | 394 | 41 | 87 | 96 | 170 | ||||||||||||
Real estate obligations | 222 | 222 | - | - | - | ||||||||||||
Purchase obligations | 2,016 | 597 | 685 | 627 | 107 | ||||||||||||
Tax contingencies (d) | - | - | - | - | - | ||||||||||||
Contractual obligations | $ | 34,292 | $ | 3,561 | $ | 4,811 | $ | 6,545 | $ | 19,375 | |||||||
Real estate obligations include commitments for the purchase, construction or remodeling of real estate and facilities. Purchase obligations include all legally binding contracts such as firm minimum commitments for inventory purchases, merchandise royalties, equipment purchases, marketing-related contracts, software acquisition/license commitments and service contracts.
We issue inventory purchase orders in the normal course of business, which represent authorizations to purchase that are cancelable by their terms. We do not consider purchase orders to be firm inventory commitments; therefore, they are excluded from the table above. We also issue trade letters of credit in the ordinary course of business, which are excluded from this table as these obligations are conditional on the purchase order not being cancelled. If we choose to cancel a purchase order, we may be obligated to reimburse the vendor for unrecoverable outlays incurred prior to cancellation.
We have not included obligations under our pension and postretirement health care benefit plans in the contractual obligations table above. Our historical practice regarding these plans has been to contribute amounts necessary to satisfy minimum pension funding requirements, plus periodic discretionary amounts determined to be appropriate. Further information on these plans, including our expected contributions for 2010, is included in Note 27 of the Notes to Consolidated Financial Statements.
We do not have any arrangements or relationships with entities that are not consolidated into the financial statements that are reasonably likely to materially affect our liquidity or the availability of capital resources.
20
Table of Contents
Critical Accounting Estimates
Our analysis of operations and financial condition is based on our consolidated financial statements, prepared in accordance with U.S. generally accepted accounting principles (GAAP). Preparation of these consolidated financial statements requires us to make estimates and assumptions affecting the reported amounts of assets and liabilities at the date of the consolidated financial statements, reported amounts of revenues and expenses during the reporting period and related disclosures of contingent assets and liabilities. In the Notes to Consolidated Financial Statements, we describe the significant accounting policies used in preparing the consolidated financial statements. Our estimates are evaluated on an ongoing basis and are drawn from historical experience and other assumptions that we believe to be reasonable under the circumstances. Actual results could differ under different assumptions or conditions. However we do not believe there is a reasonable likelihood that there will be a material change in future estimates or assumptions. Our senior management has discussed the development and selection of our critical accounting estimates with the Audit Committee of our Board of Directors. The following items in our consolidated financial statements require significant estimation or judgment:
Inventory and cost of sales We use the retail inventory method to account for substantially our entire inventory and the related cost of sales. Under this method, inventory is stated at cost using the last-in, first-out (LIFO) method as determined by applying a cost-to-retail ratio to each merchandise grouping's ending retail value. Cost includes the purchase price as adjusted for vendor income. Since inventory value is adjusted regularly to reflect market conditions, our inventory methodology reflects the lower of cost or market. We reduce inventory for estimated losses related to shrink and markdowns. Our shrink estimate is based on historical losses verified by ongoing physical inventory counts. Historically our actual physical inventory count results have shown our estimates to be reliable. Markdowns designated for clearance activity are recorded when the salability of the merchandise has diminished. Inventory is at risk of obsolescence if economic conditions change. Relevant economic conditions include changing consumer demand, customer preferences, changing consumer credit markets or increasing competition. We believe these risks are largely mitigated because our inventory typically turns in less than three months. Inventory is further described in Note 11 of the Notes to Consolidated Financial Statements.
Vendor income receivable Cost of sales and SG&A expenses are partially offset by various forms of consideration received from our vendors. This "vendor income" is earned for a variety of vendor-sponsored programs, such as volume rebates, markdown allowances, promotions and advertising allowances, as well as for our compliance programs. We establish a receivable for the vendor income that is earned but not yet received. Based on the agreements in place, this receivable is computed by estimating when we have completed our performance and when the amount is earned. The majority of all year-end vendor income receivables are collected within the following fiscal quarter. Vendor income is described further in Note 4 of the Notes to Consolidated Financial Statements.
Allowance for doubtful accounts When receivables are recorded, we recognize an allowance for doubtful accounts in an amount equal to anticipated future write-offs. This allowance includes provisions for uncollectible finance charges and other credit-related fees. We estimate future write-offs based on historical experience of delinquencies, risk scores, aging trends and industry risk trends. Substantially all accounts continue to accrue finance charges until they are written off. Accounts are automatically written off when they become 180 days past due. Management believes the allowance for doubtful accounts is adequate to cover anticipated losses in our credit card accounts receivable under current conditions; however, unexpected, significant deterioration in any of the factors mentioned above or in general economic conditions could materially change these expectations. Credit card receivables are described in Note 10 of the Notes to Consolidated Financial Statements.
Analysis of long-lived and intangible assets for impairment We review assets at the lowest level for which there are identifiable cash flows, usually at the store level, on an annual basis or whenever an event or change in circumstances indicates the carrying value of the asset may not be recoverable. An impairment loss on a long-lived and identifiable intangible asset would be recognized when estimated undiscounted future cash flows from the operation and disposition of the asset are less than the asset carrying amount. Goodwill is tested for impairment by comparing its carrying value to a fair value estimated by discounting future cash flows. This test is performed at least annually or whenever an event or change in circumstances indicates the
21
Table of Contents
carrying value of the asset may not be recoverable. Impairment on long-lived assets of $49 million in 2009, $2 million in 2008 and $7 million in 2007 were recorded as a result of the tests performed.
Our estimates of future cash flows require us to make assumptions and to apply judgment, including forecasting future sales and expenses and estimating useful lives of the assets. These estimates can be affected by factors such as future store results, real estate values, and economic conditions that can be difficult to predict.
Insurance/self-insurance We retain a substantial portion of the risk related to certain general liability, workers' compensation, property loss and team member medical and dental claims. However, we maintain stop-loss coverage to limit the exposure related to certain risks. Liabilities associated with these losses include estimates of both claims filed and losses incurred but not yet reported. We estimate our ultimate cost based on an analysis of historical data and actuarial estimates. General liability and workers' compensation liabilities are recorded at our estimate of their net present value; other liabilities referred to above are not discounted. We believe that the amounts accrued are adequate, although actual losses may differ from the amounts provided. Refer to Item 7A for further disclosure of the market risks associated with these exposures.
Income taxes We pay income taxes based on the tax statutes, regulations and case law of the various jurisdictions in which we operate. Significant judgment is required in determining income tax provisions and in evaluating the ultimate resolution of tax matters in dispute with tax authorities. Historically, our assessments of the ultimate resolution of tax issues have been materially accurate. The current open tax issues are not dissimilar in size or substance from historical items. We believe the resolution of these matters will not have a material impact on our consolidated financial statements. Income taxes are described further in Note 22 of the Notes to Consolidated Financial Statements.
Pension and postretirement health care accounting We fund and maintain a qualified defined benefit pension plan. We also maintain several smaller nonqualified plans and a postretirement health care plan for certain current and retired team members. The costs for these plans are determined based on actuarial calculations using the assumptions described in the following paragraphs. Eligibility for, and the level of, these benefits varies depending on team members' full-time or part-time status, date of hire and/or length of service.
Our expected long-term rate of return on plan assets is determined by the portfolio composition, historical long-term investment performance and current market conditions. Benefits expense recorded during the year is partially dependent upon the long-term rate of return used, and a 0.1 percent decrease in the expected long-term rate of return used to determine net pension and postretirement health care benefits expense would increase annual expense by approximately $2 million.
The discount rate used to determine benefit obligations is adjusted annually based on the interest rate for long-term high-quality corporate bonds as of the measurement date using yields for maturities that are in line with the duration of our pension liabilities. Historically, this same discount rate has also been used to determine net pension and postretirement health care benefits expense for the following plan year. The discount rates used to determine benefit obligations and benefits expense are included in Note 27 of the Notes to Consolidated Financial Statements. Benefits expense recorded during the year is partially dependent upon the discount rates used, and a 0.1 percent decrease to the weighted average discount rate used to determine net pension and postretirement health care benefits expense would increase annual expense by approximately $4 million.
Based on our experience, we use a graduated compensation growth schedule that assumes higher compensation growth for younger, shorter-service pension-eligible team members than it does for older, longer-service pension-eligible team members.
Pension and postretirement health care benefits are further described in Note 27 of the Notes to Consolidated Financial Statements.
New Accounting Pronouncements
Future Adoptions
In June 2009, the FASB issued SFAS No. 166, "Accounting for Transfers of Financial Assets an amendment of FASB Statement No. 140" (SFAS 166), codified in the Transfers and Servicing accounting principles, which amends the derecognition guidance in former FASB Statement No. 140 and eliminates the exemption from consolidation for qualifying special-purpose entities. This guidance will be effective for the
22
Table of Contents
Corporation beginning in fiscal 2010 and adoption is not anticipated to affect our consolidated net earnings, cash flows or financial position.
In June 2009, the FASB issued SFAS No. 167, "Amendments to FASB Interpretation No. 46(R)" (SFAS 167), codified in the Consolidation accounting principles, which amends the consolidation guidance applicable to variable interest entities. The amendments will significantly affect the overall consolidation analysis under former FASB Interpretation No. 46(R). This guidance will be effective for the Corporation beginning in fiscal 2010 and adoption is not anticipated to affect our consolidated net earnings, cash flows or financial position.
Outlook
In the Retail Segment, we expect to generate increases in comparable-store sales, likely in the range of 2 to 4 percent for the year, including an expected 1 percentage point lift from our remodel program. While our comparable-store sales comparisons are easier in the spring than the fall, the expected incremental sales resulting from remodels will grow as the year progresses. Additionally, we expect total sales to increase by a mid-single digit percentage.
In 2010 we expect to generally preserve our 2009 EBIT margin rate in our Retail Segment, which if achieved would result in our Retail Segment EBIT increasing in line with total sales growth.
In our Credit Card Segment, we expect the lower consumer usage of credit and our risk management strategies to continue throughout 2010, resulting in a low double-digit percentage decline in gross credit card receivables by the end of the year. We also expect to maintain segment profit on a dollar basis at generally the level earned in 2009, generating a higher pretax segment ROIC in 2010 than in 2009.
We expect our 2010 book effective tax rate to approximate our long-term structural rate, likely in the range of 37.0 to 37.5 percent.
We also expect to continue to execute against our share repurchase authorization.
We expect our 2010 capital expenditures to be in the range of $2 to $2.5 billion, reflective of projects we will complete in 2010 as well as initial spending for our 2011 and 2012 new store programs. Our expectation is that our 2010 new store program will result in approximately 13 new stores and that our 2011 new store program will be in the range of 20 to 30 stores.
Due to the early repayment of an August 2010 debt maturity, the only significant remaining 2010 maturity, prior to our seasonal working capital peak (which typically occurs in October or November), is the $900 million public series borrowing collateralized by our credit card receivables due in October.
Forward-Looking Statements
This report contains forward-looking statements, which are based on our current assumptions and expectations. These statements are typically accompanied by the words "expect," "may," "could," "believe," "would," "might," "anticipates," or words of similar import. The principal forward looking statements in this report include: For our Retail Segment, our outlook for sales, expected merchandise returns, comparable-store sales trends and EBIT margin rates; for our Credit Card Segment, our outlook for year-end gross credit card receivables, portfolio size, future write-offs of current receivables, profit, ROIC, and the allowance for doubtful accounts; on a consolidated basis, the expected effective income tax rate, the continued execution of our share repurchase program, our expected capital expenditures and the number of stores to be opened in 2010 and 2011, the expected compliance with debt covenants, our intentions regarding future dividends, the anticipated impact of new accounting pronouncements, our expected future share-based compensation expense, our expected contributions and benefit payments related to our pension and postretirement health care plans, and the adequacy of our reserves for general liability, workers' compensation, property loss, and team member medical and dental, the expected outcome of claims and litigation, and the resolution of tax uncertainties.
All such forward-looking statements are intended to enjoy the protection of the safe harbor for forward-looking statements contained in the Private Securities Litigation Reform Act of 1995, as amended. Although we believe there is a reasonable basis for the forward-looking statements, our actual results could be materially different. The most important factors which could cause our actual results to differ from our forward-looking statements are set forth on our description of risk factors in Item 1A to this Form 10-K, which should be read in conjunction with the forward-looking statements in this report. Forward-looking statements speak only as of the date they are made, and we do not undertake any obligation to update any forward-looking statement.
23
Table of Contents
Item 7A. Quantitative and Qualitative Disclosures About Market Risk
Our exposure to market risk results primarily from interest rate changes on our debt obligations, some of which are at a LIBOR-plus floating rate, and on our credit card receivables, the majority of which are assessed finance charges at a Prime-based floating rate. To manage our net interest margin, we generally maintain levels of floating-rate debt to generate similar changes in net interest expense as finance charge revenues fluctuate. The degree of floating asset and liability matching may vary over time and in different interest rate environments. At January 30, 2010, the amount of floating-rate credit card assets exceeded the amount of net floating-rate debt obligations by approximately $1 billion. As a result, based on our balance sheet position at January 30, 2010, the annualized effect of a 0.1 percentage point decrease in floating interest rates on our floating rate debt obligations, net of our floating rate credit card assets and marketable securities, would be to decrease earnings before income taxes by approximately $1 million. See further description in Note 20 of the Notes to Consolidated Financial Statements.
We record our general liability and workers' compensation liabilities at net present value; therefore, these liabilities fluctuate with changes in interest rates. Periodically, in certain interest rate environments, we economically hedge a portion of our exposure to these interest rate changes by entering into interest rate forward contracts that partially mitigate the effects of interest rate changes. Based on our balance sheet position at January 30, 2010, the annualized effect of a 0.5 percentage point decrease in interest rates would be to decrease earnings before income taxes by approximately $9 million.
In addition, we are exposed to market return fluctuations on our qualified defined benefit pension plans. The annualized effect of a one percentage point decrease in the return on pension plan assets would decrease plan assets by $22 million at January 30, 2010. The value of our pension liabilities is inversely related to changes in interest rates. To protect against declines in interest rates we hold high-quality, long-duration bonds and interest rate swaps in our pension plan trust. At year end, we had hedged approximately 50 percent of the interest rate exposure of our funded status.
As more fully described in Note 14 and Note 26 of the Notes to Consolidated Financial Statements, we are exposed to market returns on accumulated team member balances in our nonqualified, unfunded deferred compensation plans. We control the risk of offering the nonqualified plans by making investments in life insurance contracts and prepaid forward contracts on our own common stock that offset a substantial portion of our economic exposure to the returns on these plans. The annualized effect of a one percentage point change in market returns on our nonqualified defined contribution plans (inclusive of the effect of the investment vehicles used to manage our economic exposure) would not be significant.
We do not have significant direct exposure to foreign currency rates as all of our stores are located in the United States, and the vast majority of imported merchandise is purchased in U.S. dollars.
Overall, there have been no material changes in our primary risk exposures or management of market risks since the prior year.
24
Table of Contents
Item 8. Financial Statements and Supplementary Data
Report of Management on the Consolidated Financial Statements
Management is responsible for the consistency, integrity and presentation of the information in the Annual Report. The consolidated financial statements and other information presented in this Annual Report have been prepared in accordance with accounting principles generally accepted in the United States and include necessary judgments and estimates by management.
To fulfill our responsibility, we maintain comprehensive systems of internal control designed to provide reasonable assurance that assets are safeguarded and transactions are executed in accordance with established procedures. The concept of reasonable assurance is based upon recognition that the cost of the controls should not exceed the benefit derived. We believe our systems of internal control provide this reasonable assurance.
The Board of Directors exercised its oversight role with respect to the Corporation's systems of internal control primarily through its Audit Committee, which is comprised of independent directors. The Committee oversees the Corporation's systems of internal control, accounting practices, financial reporting and audits to assess whether their quality, integrity and objectivity are sufficient to protect shareholders' investments.
In addition, our consolidated financial statements have been audited by Ernst & Young LLP, independent registered public accounting firm, whose report also appears on this page.
| | | |
Gregg W. Steinhafel Chief Executive Officer and President March 12, 2010 | | Douglas A. Scovanner Executive Vice President and Chief Financial Officer |
Report of Independent Registered Public Accounting Firm on Consolidated Financial Statements
The Board of Directors and Shareholders
Target Corporation
We have audited the accompanying consolidated statements of financial position of Target Corporation and subsidiaries (the Corporation) as of January 30, 2010 and January 31, 2009, and the related consolidated statements of operations, cash flows, and shareholders' investment for each of the three years in the period ended January 30, 2010. Our audits also included the financial statement schedule listed in Item 15(a). These financial statements and schedule are the responsibility of the Corporation's management. Our responsibility is to express an opinion on these financial statements and schedule based on our audits.
We conducted our audits in accordance with the standards of the Public Company Accounting Oversight Board (United States). Those standards require that we plan and perform the audit to obtain reasonable assurance about whether the financial statements are free of material misstatement. An audit includes examining, on a test basis, evidence supporting the amounts and disclosures in the financial statements. An audit also includes assessing the accounting principles used and significant estimates made by management, as well as evaluating the overall financial statement presentation. We believe that our audits provide a reasonable basis for our opinion.
In our opinion, the financial statements referred to above present fairly, in all material respects, the consolidated financial position of Target Corporation and subsidiaries at January 30, 2010 and January 31, 2009, and the consolidated results of their operations and their cash flows for each of the three years in the period ended January 30, 2010, in conformity with U.S. generally accepted accounting principles. Also, in our opinion, the related financial statement schedule, when considered in relation to the basic financial statements taken as a whole, presents fairly in all material respects the information set forth therein.
We also have audited, in accordance with the standards of the Public Company Accounting Oversight Board (United States), the Corporation's internal control over financial reporting as of January 30, 2010, based on criteria established in Internal Control-Integrated Framework , issued by the Committee of Sponsoring Organizations of the Treadway Commission and our report dated March 12, 2010, expressed an unqualified opinion thereon.
![]()
Minneapolis,
Minnesota
March 12, 2010
25
Table of Contents
Report of Management on Internal Control
Our management is responsible for establishing and maintaining adequate internal control over financial reporting, as such term is defined in Exchange Act Rules 13a-15(f). Under the supervision and with the participation of our management, including our chief executive officer and chief financial officer, we assessed the effectiveness of our internal control over financial reporting as of January 30, 2010, based on the framework in Internal Control-Integrated Framework , issued by the Committee of Sponsoring Organizations of the Treadway Commission. Based on our assessment, we conclude that the Corporation's internal control over financial reporting is effective based on those criteria.
Our internal control over financial reporting as of January 30, 2010, has been audited by Ernst & Young LLP, the independent registered accounting firm who has also audited our consolidated financial statements, as stated in their report which appears on this page.
| | | |
Gregg W. Steinhafel Chief Executive Officer and President March 12, 2010 | | Douglas A. Scovanner Executive Vice President and Chief Financial Officer |
Report of Independent Registered Public Accounting Firm on Internal Control over Financial Reporting
The Board of Directors and Shareholders
Target Corporation
We have audited Target Corporation and subsidiaries' (the Corporation) internal control over financial reporting as of January 30, 2010, based on criteria established in Internal Control-Integrated Framework , issued by the Committee of Sponsoring Organizations of the Treadway Commission (the COSO criteria). The Corporation's management is responsible for maintaining effective internal control over financial reporting, and for its assessment of the effectiveness of internal control over financial reporting included in the accompanying Report of Management on Internal Control over Financial Reporting. Our responsibility is to express an opinion on the Corporation's internal control over financial reporting based on our audit.
We conducted our audit in accordance with the standards of the Public Company Accounting Oversight Board (United States). Those standards require that we plan and perform the audit to obtain reasonable assurance about whether effective internal control over financial reporting was maintained in all material respects. Our audit included obtaining an understanding of internal control over financial reporting, assessing the risk that a material weakness exists, testing and evaluating the design and operating effectiveness of internal control based on the assessed risk, and performing such other procedures as we considered necessary in the circumstances. We believe that our audit provides a reasonable basis for our opinion.
A company's internal control over financial reporting is a process designed to provide reasonable assurance regarding the reliability of financial reporting and the preparation of financial statements for external purposes in accordance with generally accepted accounting principles. A company's internal control over financial reporting includes those policies and procedures that (1) pertain to the maintenance of records that, in reasonable detail, accurately and fairly reflect the transactions and dispositions of the assets of the company, (2) provide reasonable assurance that transactions are recorded as necessary to permit preparation of financial statements in accordance with generally accepted accounting principles and that receipts and expenditures of the company are being made only in accordance with authorizations of management and directors of the company, and (3) provide reasonable assurance regarding prevention or timely detection of unauthorized acquisition, use or disposition of the company's assets that could have a material effect on the financial statements.
Because of its inherent limitations, internal control over financial reporting may not prevent or detect misstatements. Also, projections of any evaluation of effectiveness to future periods are subject to the risk that controls may become inadequate because of changes in conditions or that the degree of compliance with the policies or procedures may deteriorate.
In our opinion, the Corporation maintained, in all material respects, effective internal control over financial reporting as of January 30, 2010, based on the COSO criteria.
We also have audited, in accordance with the standards of the Public Company Accounting Oversight Board (United States), the consolidated statements of financial position of Target Corporation and subsidiaries as of January 30, 2010 and January 31, 2009, and the related consolidated statements of operations, cash flows and shareholders' investment for each of the three years in the period ended January 30, 2010, and our report dated March 12, 2010, expressed an unqualified opinion thereon.
![]()
Minneapolis,
Minnesota
March 12, 2010
26
Table of Contents
Consolidated Statements of Operations
| (millions, except per share data) | 2009 | 2008 | 2007 | ||||||||
|---|---|---|---|---|---|---|---|---|---|---|---|
Sales | $ | 63,435 | $ | 62,884 | $ | 61,471 | |||||
Credit card revenues | 1,922 | 2,064 | 1,896 | ||||||||
Total revenues | 65,357 | 64,948 | 63,367 | ||||||||
Cost of sales | 44,062 | 44,157 | 42,929 | ||||||||
Selling, general and administrative expenses | 13,078 | 12,954 | 12,670 | ||||||||
Credit card expenses | 1,521 | 1,609 | 837 | ||||||||
Depreciation and amortization | 2,023 | 1,826 | 1,659 | ||||||||
Earnings before interest expense and income taxes | 4,673 | 4,402 | 5,272 | ||||||||
Net interest expense | |||||||||||
Nonrecourse debt collateralized by credit card receivables | 97 | 167 | 133 | ||||||||
Other interest expense | 707 | 727 | 535 | ||||||||
Interest income | (3 | ) | (28 | ) | (21 | ) | |||||
Net interest expense | 801 | 866 | 647 | ||||||||
Earnings before income taxes | 3,872 | 3,536 | 4,625 | ||||||||
Provision for income taxes | 1,384 | 1,322 | 1,776 | ||||||||
Net earnings | $ | 2,488 | $ | 2,214 | $ | 2,849 | |||||
Basic earnings per share | $ | 3.31 | $ | 2.87 | $ | 3.37 | |||||
Diluted earnings per share | $ | 3.30 | $ | 2.86 | $ | 3.33 | |||||
Weighted average common shares outstanding | |||||||||||
Basic | 752.0 | 770.4 | 845.4 | ||||||||
Diluted | 754.8 | 773.6 | 850.8 | ||||||||
See accompanying Notes to Consolidated Financial Statements.
27
Table of Contents
Consolidated Statements of Financial Position
| (millions, except footnotes) | January 30, 2010 | January 31, 2009 | ||||||
|---|---|---|---|---|---|---|---|---|
Assets | ||||||||
Cash and cash equivalents, including marketable securities of $1,617 and $302 | $ | 2,200 | $ | 864 | ||||
Credit card receivables, net of allowance of $1,016 and $1,010 | 6,966 | 8,084 | ||||||
Inventory | 7,179 | 6,705 | ||||||
Other current assets | 2,079 | 1,835 | ||||||
Total current assets | 18,424 | 17,488 | ||||||
Property and equipment | ||||||||
Land | 5,793 | 5,767 | ||||||
Buildings and improvements | 22,152 | 20,430 | ||||||
Fixtures and equipment | 4,743 | 4,270 | ||||||
Computer hardware and software | 2,575 | 2,586 | ||||||
Construction-in-progress | 502 | 1,763 | ||||||
Accumulated depreciation | (10,485 | ) | (9,060 | ) | ||||
Property and equipment, net | 25,280 | 25,756 | ||||||
Other noncurrent assets | 829 | 862 | ||||||
Total assets | $ | 44,533 | $ | 44,106 | ||||
Liabilities and shareholders' investment | ||||||||
Accounts payable | $ | 6,511 | $ | 6,337 | ||||
Accrued and other current liabilities | 3,120 | 2,913 | ||||||
Unsecured debt and other borrowings | 796 | 1,262 | ||||||
Nonrecourse debt collateralized by credit card receivables | 900 | - | ||||||
Total current liabilities | 11,327 | 10,512 | ||||||
Unsecured debt and other borrowings | 10,643 | 12,000 | ||||||
Nonrecourse debt collateralized by credit card receivables | 4,475 | 5,490 | ||||||
Deferred income taxes | 835 | 455 | ||||||
Other noncurrent liabilities | 1,906 | 1,937 | ||||||
Total noncurrent liabilities | 17,859 | 19,882 | ||||||
Shareholders' investment | ||||||||
Common stock | 62 | 63 | ||||||
Additional paid-in-capital | 2,919 | 2,762 | ||||||
Retained earnings | 12,947 | 11,443 | ||||||
Accumulated other comprehensive loss | (581 | ) | (556 | ) | ||||
Total shareholders' investment | 15,347 | 13,712 | ||||||
Total liabilities and shareholders' investment | $ | 44,533 | $ | 44,106 | ||||
Common Stock Authorized 6,000,000,000 shares, $0.0833 par value; 744,644,454 shares issued and outstanding at January 30, 2010; 752,712,464 shares issued and outstanding at January 31, 2009.
Preferred Stock Authorized 5,000,000 shares, $0.01 par value; no shares were issued or outstanding at January 30, 2010 or January 31, 2009.
See accompanying Notes to Consolidated Financial Statements.
28
Table of Contents
Consolidated Statements of Cash Flows
| (millions) | 2009 | 2008 | 2007 | |||||||||
|---|---|---|---|---|---|---|---|---|---|---|---|---|
Operating activities | ||||||||||||
Net earnings | $ | 2,488 | $ | 2,214 | $ | 2,849 | ||||||
Reconciliation to cash flow | ||||||||||||
Depreciation and amortization | 2,023 | 1,826 | 1,659 | |||||||||
Share-based compensation expense | 103 | 72 | 73 | |||||||||
Deferred income taxes | 364 | 91 | (70 | ) | ||||||||
Bad debt expense | 1,185 | 1,251 | 481 | |||||||||
Loss / impairment of property and equipment, net | 97 | 33 | 28 | |||||||||
Other non-cash items affecting earnings | 103 | 222 | 52 | |||||||||
Changes in operating accounts providing / (requiring) cash: | ||||||||||||
Accounts receivable originated at Target | (57 | ) | (458 | ) | (602 | ) | ||||||
Inventory | (474 | ) | 77 | (525 | ) | |||||||
Other current assets | (280 | ) | (224 | ) | (139 | ) | ||||||
Other noncurrent assets | (127 | ) | (76 | ) | 101 | |||||||
Accounts payable | 174 | (389 | ) | 111 | ||||||||
Accrued and other current liabilities | 257 | (230 | ) | 62 | ||||||||
Other noncurrent liabilities | 25 | (139 | ) | 124 | ||||||||
Other | - | 160 | (79 | ) | ||||||||
Cash flow provided by operations | 5,881 | 4,430 | 4,125 | |||||||||
Investing activities | ||||||||||||
Expenditures for property and equipment | (1,729 | ) | (3,547 | ) | (4,369 | ) | ||||||
Proceeds from disposal of property and equipment | 33 | 39 | 95 | |||||||||
Change in accounts receivable originated at third parties | (10 | ) | (823 | ) | (1,739 | ) | ||||||
Other investments | 3 | (42 | ) | (182 | ) | |||||||
Cash flow required for investing activities | (1,703 | ) | (4,373 | ) | (6,195 | ) | ||||||
Financing activities | ||||||||||||
Additions to short-term notes payable | - | - | 1,000 | |||||||||
Reductions of short-term notes payable | - | (500 | ) | (500 | ) | |||||||
Additions to long-term debt | - | 3,557 | 7,617 | |||||||||
Reductions of long-term debt | (1,970 | ) | (1,455 | ) | (1,326 | ) | ||||||
Dividends paid | (496 | ) | (465 | ) | (442 | ) | ||||||
Repurchase of stock | (423 | ) | (2,815 | ) | (2,477 | ) | ||||||
Premiums on call options | - | - | (331 | ) | ||||||||
Stock option exercises and related tax benefit | 47 | 43 | 210 | |||||||||
Other | - | (8 | ) | (44 | ) | |||||||
Cash flow provided by / (required for) financing activities | (2,842 | ) | (1,643 | ) | 3,707 | |||||||
Net increase / (decrease) in cash and cash equivalents | 1,336 | (1,586 | ) | 1,637 | ||||||||
Cash and cash equivalents at beginning of year | 864 | 2,450 | 813 | |||||||||
Cash and cash equivalents at end of year | $ | 2,200 | $ | 864 | $ | 2,450 | ||||||
Cash paid for income taxes was $1,040, $1,399, and $1,734 during 2009, 2008, and 2007, respectively. Cash paid for interest (net of interest capitalized) was $805, $873, and $633 during 2009, 2008, and 2007, respectively.
See accompanying Notes to Consolidated Financial Statements.
29
Table of Contents
Consolidated Statements of Shareholders' Investment
| | | | | | Accumulated Other Comprehensive Income/(Loss) | | ||||||||||||||||
|---|---|---|---|---|---|---|---|---|---|---|---|---|---|---|---|---|---|---|---|---|---|---|
| (millions, except footnotes) | Common Stock Shares | Stock Par Value | Additional Paid-in Capital | Retained Earnings | Pension and Other Benefit Liability Adjustments | Derivative Instruments, Foreign Currency and Other | Total | |||||||||||||||
February 3, 2007 | 859.8 | $ | 72 | $ | 2,387 | $ | 13,417 | $ | (247 | ) | $ | 4 | $ | 15,633 | ||||||||
Net earnings | - | - | - | 2,849 | - | - | 2,849 | |||||||||||||||
Other comprehensive income | ||||||||||||||||||||||
Pension and other benefit liability adjustments, net of taxes of $38 | - | - | - | - | 59 | - | 59 | |||||||||||||||
Unrealized losses on cash flow hedges, net of taxes of $31 | - | - | - | - | - | (48 | ) | (48 | ) | |||||||||||||
Total comprehensive income | 2,860 | |||||||||||||||||||||
Cumulative effect of adopting new accounting pronouncements | - | - | - | (31 | ) | 54 | - | 23 | ||||||||||||||
Dividends declared | - | - | - | (454 | ) | - | - | (454 | ) | |||||||||||||
Repurchase of stock | (46.2 | ) | (4 | ) | - | (2,689 | ) | - | - | (2,693 | ) | |||||||||||
Premiums on call options | - | - | - | (331 | ) | - | - | (331 | ) | |||||||||||||
Stock options and awards | 5.1 | - | 269 | - | - | - | 269 | |||||||||||||||
February 2, 2008 | 818.7 | $ | 68 | $ | 2,656 | $ | 12,761 | $ | (134 | ) | $ | (44 | ) | $ | 15,307 | |||||||
Net earnings | - | - | - | 2,214 | - | - | 2,214 | |||||||||||||||
Other comprehensive income | ||||||||||||||||||||||
Pension and other benefit liability adjustments, net of taxes of $242 | - | - | - | - | (376 | ) | - | (376 | ) | |||||||||||||
Unrealized losses on cash flow hedges, net of taxes of $2 | - | - | - | - | - | (2 | ) | (2 | ) | |||||||||||||
Total comprehensive income | 1,836 | |||||||||||||||||||||
Dividends declared | - | - | - | (471 | ) | - | - | (471 | ) | |||||||||||||
Repurchase of stock | (67.2 | ) | (5 | ) | - | (3,061 | ) | - | - | (3,066 | ) | |||||||||||
Stock options and awards | 1.2 | - | 106 | - | - | - | 106 | |||||||||||||||
January 31, 2009 | 752.7 | $ | 63 | $ | 2,762 | $ | 11,443 | $ | (510 | ) | $ | (46 | ) | $ | 13,712 | |||||||
Net earnings | - | - | - | 2,488 | - | - | 2,488 | |||||||||||||||
Other comprehensive income | ||||||||||||||||||||||
Pension and other benefit liability adjustments, net of taxes of $17 | - | - | - | - | (27 | ) | - | (27 | ) | |||||||||||||
Unrealized gains on cash flow hedges, net of taxes of $2 | - | - | - | - | - | 4 | 4 | |||||||||||||||
Currency translation adjustment, net of taxes of $0 | - | - | - | - | - | (2 | ) | (2 | ) | |||||||||||||
Total comprehensive income | 2,463 | |||||||||||||||||||||
Dividends declared | - | - | - | (503 | ) | - | - | (503 | ) | |||||||||||||
Repurchase of stock | (9.9 | ) | (1 | ) | - | (481 | ) | - | - | (482 | ) | |||||||||||
Stock options and awards | 1.8 | - | 157 | - | - | - | 157 | |||||||||||||||
January 30, 2010 | 744.6 | $ | 62 | $ | 2,919 | $ | 12,947 | $ | (537 | ) | $ | (44 | ) | $ | 15,347 | |||||||
Dividends declared per share were $0.67, $0.62, and $0.54 in 2009, 2008, and 2007, respectively.
See accompanying Notes to Consolidated Financial Statements.
30
Table of Contents
Notes to Consolidated Financial Statements
1. Summary of Accounting Policies
Organization Target Corporation (Target or the Corporation) operates two reportable segments: Retail and Credit Card. Our Retail Segment includes all of our merchandising operations, including our large-format general merchandise and food discount stores in the United States and our fully integrated online business. Our Credit Card Segment offers credit to qualified guests through our branded proprietary credit cards, the Target Visa and the Target Card (collectively, REDcards). Our Credit Card Segment strengthens the bond with our guests, drives incremental sales and contributes to our results of operations.
Consolidation The consolidated financial statements include the balances of the Corporation and its subsidiaries after elimination of intercompany balances and transactions. All material subsidiaries are wholly owned. We consolidate variable interest entities where it has been determined that the Corporation is the primary beneficiary of those entities' operations. The variable interest entity consolidated is a bankruptcy-remote subsidiary through which we sell certain accounts receivable as a method of providing funding for our accounts receivable.
Use of estimates The preparation of our consolidated financial statements in conformity with U.S. generally accepted accounting principles (GAAP) requires management to make estimates and assumptions affecting reported amounts in the consolidated financial statements and accompanying notes. Actual results may differ significantly from those estimates.
Fiscal year Our fiscal year ends on the Saturday nearest January 31. Unless otherwise stated, references to years in this report relate to fiscal years, rather than to calendar years. Fiscal year 2009 (2009) ended January 30, 2010 and consisted of 52 weeks. Fiscal year 2008 (2008) ended January 31, 2009 and consisted of 52 weeks. Fiscal year 2007 (2007) ended February 2, 2008 and consisted of 52 weeks.
Reclassifications Certain prior year amounts have been reclassified to conform to the current year presentation.
Accounting policies applicable to the items discussed in the Notes to the Consolidated Financial Statement are described in the respective notes.
2. Revenues
Our retail stores generally record revenue at the point of sale. Sales from our online business include shipping revenue and are recorded upon delivery to the guest. Total revenues do not include sales tax as we consider ourselves a pass through conduit for collecting and remitting sales taxes. Generally, guests may return merchandise within 90 days of purchase. Revenues are recognized net of expected returns, which we estimate using historical return patterns as a percentage of sales. Commissions earned on sales generated by leased departments are included within sales and were $18 million in 2009, $19 million in 2008, and $17 million in 2007.
Revenue from gift card sales is recognized upon gift card redemption. Our gift cards do not have expiration dates. Based on historical redemption rates, a small and relatively stable percentage of gift cards will never be redeemed, referred to as "breakage." Estimated breakage revenue is recognized over time in proportion to actual gift card redemptions and was immaterial in 2009, 2008, and 2007.
Credit card revenues are recognized according to the contractual provisions of each credit card agreement. When accounts are written off, uncollected finance charges and late fees are recorded as a reduction of credit card revenues. Target retail sales charged to our credit cards totaled $3,277 million, $3,883 million, and $4,139 million in 2009, 2008, and 2007, respectively. We offer new account discounts and rewards programs on our REDcard products. These discounts are redeemable only on purchases made at Target. The discounts associated with our REDcard products are included as reductions in sales in our Consolidated Statements of Operations and were $94 million in 2009, $114 million in 2008, and $110 million in 2007.
31
Table of Contents
3. Cost of Sales and Selling, General and Administrative Expenses
The following table illustrates the primary costs classified in each major expense category:
Cost of Sales | Selling, General and Administrative Expenses | |||||
Total cost of products sold including | Compensation and benefit costs including | |||||
• | Freight expenses associated with moving | • | Stores | |||
| merchandise from our vendors to our | • | Headquarters | |||
| distribution centers and our retail stores, and | Occupancy and operating costs of retail and | ||||
| among our distribution and retail facilities | headquarters facilities | ||||
• | Vendor income that is not reimbursement of | Advertising, offset by vendor income that is a | ||||
| specific, incremental and identifiable costs | reimbursement of specific, incremental and | ||||
Inventory shrink | identifiable costs | |||||
Markdowns | Preopening costs of stores and other facilities | |||||
Outbound shipping and handling expenses | Other administrative costs | |||||
| associated with sales to our guests | |||||
Terms cash discount | ||||||
Distribution center costs, including compensation | ||||||
| and benefits costs | |||||
The classification of these expenses varies across the retail industry.
4. Consideration Received from Vendors
We receive consideration for a variety of vendor-sponsored programs, such as volume rebates, markdown allowances, promotions and advertising allowances and for our compliance programs, referred to as "vendor income." Vendor income reduces either our inventory costs or SG&A expenses based on the provisions of the arrangement. Promotional and advertising allowances are intended to offset our costs of promoting and selling merchandise in our stores. Under our compliance programs, vendors are charged for merchandise shipments that do not meet our requirements (violations), such as late or incomplete shipments. These allowances are recorded when violations occur. Substantially all consideration received is recorded as a reduction of cost of sales.
We establish a receivable for vendor income that is earned but not yet received. Based on provisions of the agreements in place, this receivable is computed by estimating the amount earned when we have completed our performance. We perform detailed analyses to determine the appropriate level of the receivable in the aggregate. The majority of year-end receivables associated with these activities are collected within the following fiscal quarter.
5. Advertising Costs
Advertising costs are expensed at first showing or distribution of the advertisement and were $1,167 million in 2009, $1,233 million in 2008, and $1,195 million in 2007. Advertising vendor income that offset advertising expenses was approximately $130 million, $143 million, and $123 million 2009, 2008, and 2007, respectively. Newspaper circulars and media broadcast made up the majority of our advertising costs in all three years.
32
Table of Contents
6. Earnings per Share
Basic earnings per share (EPS) is net earnings divided by the weighted average number of common shares outstanding during the period. Diluted EPS includes the incremental shares assumed to be issued upon the exercise of stock options and the incremental shares assumed to be issued under performance share and restricted stock unit arrangements.
| Earnings Per Share | Basic EPS | Diluted EPS | |||||||||||||||||
|---|---|---|---|---|---|---|---|---|---|---|---|---|---|---|---|---|---|---|---|
| (millions, except per share data) | 2009 | 2008 | 2007 | 2009 | 2008 | 2007 | |||||||||||||
Net earnings | $ | 2,488 | $ | 2,214 | $ | 2,849 | $ | 2,488 | $ | 2,214 | $ | 2,849 | |||||||
Adjustment for prepaid forward contracts | - | - | - | - | - | (11 | ) | ||||||||||||
Net earnings for EPS calculation | $ | 2,488 | $ | 2,214 | $ | 2,849 | $ | 2,488 | $ | 2,214 | $ | 2,838 | |||||||
Basic weighted average common shares outstanding | 752.0 | 770.4 | 845.4 | 752.0 | 770.4 | 845.4 | |||||||||||||
Incremental stock options, performance share units and restricted stock units | - | - | - | 2.8 | 3.2 | 6.0 | |||||||||||||
Adjustment for prepaid forward contracts | - | - | - | - | - | (0.6 | ) | ||||||||||||
Weighted average common shares outstanding | 752.0 | 770.4 | 845.4 | 754.8 | 773.6 | 850.8 | |||||||||||||
Earnings per share | $ | 3.31 | $ | 2.87 | $ | 3.37 | $ | 3.30 | $ | 2.86 | $ | 3.33 | |||||||
For the 2009, 2008, and 2007 EPS computations, 16.8 million, 10.5 million, and 6.3 million stock options, respectively, were excluded from the calculation of weighted average shares for diluted EPS because their effects were antidilutive. Refer to Note 26 for a description of the prepaid forward contracts referred to in the table above.
7. Other Comprehensive Income/(Loss)
Other comprehensive income/(loss) includes revenues, expenses, gains and losses that are excluded from net earnings under GAAP and are recorded directly to shareholders' investment. In 2009, 2008, and 2007, other comprehensive income/(loss) included gains and losses on certain hedge transactions, foreign currency translation adjustments and amortization of pension and postretirement plan amounts, net of related taxes. Significant items affecting other comprehensive income/(loss) are shown in the Consolidated Statements of Shareholders' Investment.
8. Fair Value Measurements
Fair value is the price at which an asset could be exchanged in a current transaction between knowledgeable, willing parties. A liability's fair value is defined as the amount that would be paid to transfer the liability to a new obligor, not the amount that would be paid to settle the liability with the creditor. Fair value measurements are categorized into one of three levels based on the lowest level of significant input used: Level 1 (unadjusted quoted prices in active markets); Level 2 (observable market inputs available at the measurement date, other than quoted prices included in Level 1); and Level 3 (unobservable inputs that cannot be corroborated by observable market data).
33
Table of Contents
The following table presents financial assets and liabilities measured at fair value on a recurring basis:
| Fair Value Measurements – Recurring Basis | Fair Value at January 30, 2010 | Fair Value at January 31, 2009 | ||||||||||||||||||
|---|---|---|---|---|---|---|---|---|---|---|---|---|---|---|---|---|---|---|---|---|
| (millions) | Level 1 | Level 2 | Level 3 | Level 1 | Level 2 | Level 3 | ||||||||||||||
Assets | ||||||||||||||||||||
Cash and cash equivalents | ||||||||||||||||||||
Marketable securities | $ | 1,617 | $ | - | $ | - | $ | 302 | $ | - | $ | - | ||||||||
Other current assets | ||||||||||||||||||||
Prepaid forward contracts | 79 | - | - | 68 | - | - | ||||||||||||||
Equity swaps | - | - | - | 1 | - | - | ||||||||||||||
Other noncurrent assets | ||||||||||||||||||||
Interest rate swaps (a) | - | 131 | - | - | 163 | - | ||||||||||||||
Company-owned life insurance investments (b) | - | 305 | - | - | 296 | - | ||||||||||||||
Total | $ | 1,696 | $ | 436 | $ | - | $ | 371 | $ | 459 | $ | - | ||||||||
Liabilities | ||||||||||||||||||||
Other noncurrent liabilities | ||||||||||||||||||||
Interest rate swaps | $ | - | $ | 23 | $ | - | $ | - | $ | 30 | $ | - | ||||||||
Total | $ | - | $ | 23 | $ | - | $ | - | $ | 30 | $ | - | ||||||||
Position | Valuation Technique | |
Marketable securities | Initially valued at transaction price. Carrying value of cash equivalents (including money market funds) approximates fair value because maturities are less than three months. | |
Prepaid forward contracts | Initially valued at transaction price. Subsequently valued by reference to the market price of Target common stock. | |
Interest rate swaps/forward and equity swaps | Valuation models are calibrated to initial trade price. Subsequent valuations are based on observable inputs to the valuation model ( e.g. , interest rates and credit spreads). Model inputs are changed only when corroborated by market data. A credit risk adjustment is made on each swap using observable market credit spreads. | |
Company-owned life insurance investments | Includes investments in separate accounts that are valued based on market rates credited by the insurer. | |
Certain assets are measured at fair value on a nonrecurring basis; that is, the instruments are not measured at fair value on an ongoing basis but are subject to fair value adjustments only in certain circumstances (for example, when there is evidence of impairment). The fair value measurements related to long-lived assets held for sale and held and used in the following table were determined using available market prices at the measurement date based on recent investments or pending transactions of similar assets, third-party independent appraisals, valuation multiples or public comparables. We classify these measurements as Level 2. The fair value measurement of an intangible asset was determined using unobservable inputs that reflect our own assumptions regarding how market participants price the intangible assets at the measurement date. We classify these measurements as Level 3.
| | Other current assets | Property and equipment | Other noncurrent assets | ||||||||
|---|---|---|---|---|---|---|---|---|---|---|---|
| Fair Value Measurements – Nonrecurring Basis (millions) | Long-lived assets held for sale (a) | Long-lived assets held and used (b) | Intangible asset | ||||||||
For the year ended January 30, 2010: | |||||||||||
Carrying amount | 74 | 98 | 6 | ||||||||
Fair value measurement | 57 | 66 | - | ||||||||
Gain/(loss) | (17 | ) | (32 | ) | (6 | ) | |||||
34
Table of Contents
The following table presents the carrying amounts and estimated fair values of financial instruments not measured at fair value in the Consolidated Statements of Financial Position. The fair value of marketable securities is determined using available market prices at the reporting date. The fair value of debt is generally measured using a discounted cash flow analysis based on our current market interest rates for similar types of financial instruments.
| Financial Instruments Not Measured at Fair Value | January 30, 2010 | |||||||
|---|---|---|---|---|---|---|---|---|
| (millions) | Carrying Amount | Fair Value | ||||||
Financial assets | ||||||||
Other current assets | ||||||||
Marketable securities (a) | $ | 27 | $ | 27 | ||||
Other noncurrent assets | ||||||||
Marketable securities (a) | 5 | 5 | ||||||
Total | $ | 32 | $ | 32 | ||||
Financial liabilities | ||||||||
Total debt (b) | $ | 16,447 | $ | 17,487 | ||||
Total | $ | 16,447 | $ | 17,487 | ||||
The carrying amounts of credit card receivables, net of allowance, accounts payable, and certain accrued and other current liabilities approximate fair value at January 30, 2010.
9. Cash Equivalents
Cash equivalents include highly liquid investments with an original maturity of three months or less from the time of purchase. Cash equivalents also include amounts due from credit card transactions with settlement terms of less than five days. Receivables resulting from third-party credit card sales within our Retail Segment are included within cash equivalents and were $313 million and $323 million at January 30, 2010 and January 31, 2009, respectively. Payables resulting from the use of the Target Visa at third-party merchants are included within cash equivalents and were $40 million and $53 million at January 30, 2010 and January 31, 2009, respectively.
10. Credit Card Receivables
Credit card receivables are recorded net of an allowance for doubtful accounts. The allowance, recognized in an amount equal to the anticipated future write-offs of existing receivables, was $1,016 million at January 30, 2010 and $1,010 million at January 31, 2009. This allowance includes provisions for uncollectible finance charges and other credit-related fees. We estimate future write-offs based on historical experience of delinquencies, risk scores, aging trends, and industry risk trends. Substantially all accounts continue to accrue finance charges until they are written off. Total receivables past due ninety days or more and still accruing finance charges were $371 million at January 30, 2010 and $393 million at January 31, 2009. Accounts are written off when they become 180 days past due.
Under certain circumstances, we offer cardholder payment plans that modify finance charges and minimum payments, which meet the accounting definition of a troubled debt restructuring (TDRs). These concessions are made on an individual cardholder basis for economic or legal reasons specific to each individual cardholder's circumstances. As a percentage of period-end gross receivables, receivables classified as TDRs were 6.7 percent at January 30, 2010 and 4.9 percent at January 31, 2009. Receivables classified as TDRs are treated consistently with other aged receivables in determining our allowance for doubtful accounts.
As a method of providing funding for our credit card receivables, we sell on an ongoing basis all of our consumer credit card receivables to Target Receivables Corporation (TRC), a wholly owned, bankruptcy remote subsidiary. TRC then transfers the receivables to the Target Credit Card Master Trust (the Trust), which from time to time will sell debt securities to third parties either directly or through a related trust. These debt
35
Table of Contents
securities represent undivided interests in the Trust assets. TRC uses the proceeds from the sale of debt securities and its share of collections on the receivables to pay the purchase price of the receivables to the Corporation.
We consolidate the receivables within the Trust and any debt securities issued by the Trust, or a related trust, in our Consolidated Statements of Financial Position based upon the applicable accounting guidance. The receivables transferred to the Trust are not available to general creditors of the Corporation. The payments to the holders of the debt securities issued by the Trust or the related trust are made solely from the assets transferred to the Trust or the related trust and are nonrecourse to the general assets of the Corporation. Upon termination of the securitization program and repayment of all debt securities, any remaining assets could be distributed to the Corporation in a liquidation of TRC.
In the second quarter of 2008, we sold an interest in our credit card receivables to JPMC. The interest sold represented 47 percent of the receivables portfolio at the time of the transaction. This transaction was accounted for as a secured borrowing, and accordingly, the credit card receivables within the Trust and the note payable issued are reflected in our Consolidated Statements of Financial Position. Notwithstanding this accounting treatment, the accounts receivable assets that collateralize the note payable supply the cash flow to pay principal and interest to the note holder; the receivables are not available to general creditors of the Corporation; and the payments to JPMC are made solely from the Trust and are nonrecourse to the general assets of the Corporation. Interest and principal payments due on the note are satisfied provided the cash flows from the Trust assets are sufficient. If the cash flows are less than the periodic interest, the available amount, if any, is paid with respect to interest. Interest shortfalls will be paid to the extent subsequent cash flows from the assets in the Trust are sufficient. Future principal payments will be made from JPMC's prorata share of cash flows from the Trust assets.
In the event of a decrease in the receivables principal amount such that JPMC's interest in the entire portfolio would exceed 47 percent for three consecutive months, TRC (using the cash flows from the assets in the Trust) would be required to pay JPMC a prorata amount of principal collections such that the portion owned by JPMC would not exceed 47 percent, unless JPMC provides a waiver. Conversely, at the option of the Corporation, JPMC may be required to fund an increase in the portfolio to maintain their 47 percent interest up to a maximum JPMC principal balance of $4.2 billion. If a three-month average of monthly finance charge excess (JPMC's prorata share of finance charge collections less write-offs and specified expenses) is less than 2 percent of the outstanding principal balance of JPMC's interest, the Corporation must implement mutually agreed upon underwriting strategies. If the three-month average finance charge excess falls below 1 percent of the outstanding principal balance of JPMC's interest, JPMC may compel the Corporation to implement underwriting and collections activities, provided those activities are compatible with the Corporation's systems, as well as consistent with similar credit card receivable portfolios managed by JPMC. If the Corporation fails to implement the activities, JPMC would cause the accelerated repayment of the note payable issued in the transaction. As noted in the preceding paragraph, payments would be made solely from the Trust assets.
11. Inventory
Substantially all of our inventory and the related cost of sales are accounted for under the retail inventory accounting method (RIM) using the last-in, first-out (LIFO) method. Inventory is stated at the lower of LIFO cost or market. Cost includes purchase price as reduced by vendor income. Inventory is also reduced for estimated losses related to shrink and markdowns. The LIFO provision is calculated based on inventory levels, markup rates and internally measured retail price indices.
Under RIM, inventory cost and the resulting gross margins are calculated by applying a cost-to-retail ratio to the retail value inventory. RIM is an averaging method that has been widely used in the retail industry due to its practicality. The use of RIM will result in inventory being valued at the lower of cost or market because permanent markdowns are currently taken as a reduction of the retail value of inventory.
We routinely enter into arrangements with vendors whereby we do not purchase or pay for merchandise until the merchandise is ultimately sold to a guest. Revenues under this program are included in sales in the Consolidated Statements of Operations, but the merchandise received under the program is not included in inventory in our Consolidated Statements of Financial Position because of the virtually simultaneous purchase and sale of this inventory. Sales made under these arrangements totaled $1,820 million in 2009, $1,524 million in 2008, and $1,643 million in 2007.
36
Table of Contents
12. Other Current Assets
| Other Current Assets (millions) | January 30, 2010 | January 31, 2009 | |||||
|---|---|---|---|---|---|---|---|
Deferred taxes | $ | 724 | $ | 693 | |||
Other receivables (a) | 526 | 433 | |||||
Vendor income receivable | 390 | 236 | |||||
Other | 439 | 473 | |||||
Total | $ | 2,079 | $ | 1,835 | |||
13. Property and Equipment
Property and equipment are recorded at cost, less accumulated depreciation. Depreciation is computed using the straight-line method over estimated useful lives or lease term if shorter. We amortize leasehold improvements purchased after the beginning of the initial lease term over the shorter of the assets' useful lives or a term that includes the original lease term, plus any renewals that are reasonably assured at the date the leasehold improvements are acquired. Depreciation expense for 2009, 2008, and 2007 was $1,999 million, $1,804 million, and $1,644 million, respectively. For income tax purposes, accelerated depreciation methods are generally used. Repair and maintenance costs are expensed as incurred and were $632 million in 2009, $609 million in 2008, and $592 million in 2007. Facility preopening costs, including supplies and payroll, are expensed as incurred.
| Estimated Useful Lives | Life (in years) | |||
|---|---|---|---|---|
Buildings and improvements | 8-39 | |||
Fixtures and equipment | 3-15 | |||
Computer hardware and software | 4-7 | |||
Long-lived assets are reviewed for impairment annually and also when events or changes in circumstances indicate that the asset's carrying value may not be recoverable. Impairments of $49 million in 2009, $2 million in 2008 and $7 million in 2007 were recorded as a result of the tests performed. Additionally, we wrote off $37 million in 2009, $26 million in 2008 and $4 million in 2007 of capitalized construction in progress costs due to project scope changes.
14. Other Noncurrent Assets
| Other Noncurrent Assets (millions) | January 30, 2010 | January 31, 2009 | |||||
|---|---|---|---|---|---|---|---|
Cash surrender value of life insurance (a) | $ | 319 | $ | 305 | |||
Goodwill and intangible assets | 239 | 231 | |||||
Interest rate swaps (b) | 131 | 163 | |||||
Other | 140 | 163 | |||||
Total | $ | 829 | $ | 862 | |||
15. Goodwill and Intangible Assets
Goodwill and intangible assets are recorded within other noncurrent assets at cost less accumulated amortization. Goodwill totaled $59 million at January 30, 2010 and $60 million at January 31, 2009. Goodwill is not amortized; instead, it is tested at least annually or whenever an event or change in circumstances indicates the carrying value of the asset may not be recoverable. Discounted cash flow models are used in determining fair value for the purposes of the required annual impairment analysis. An impairment loss on a long-lived and identifiable intangible asset would be recognized when estimated undiscounted future cash flows from the operation and disposition of the asset are less than the asset carrying amount.
37
Table of Contents
No material impairments related to goodwill and intangible assets were recorded in 2009, 2008, or 2007 as a result of the tests performed. Intangible assets by major classes were as follows:
| Intangible Assets | Leasehold | | | | | ||||||||||||||
|---|---|---|---|---|---|---|---|---|---|---|---|---|---|---|---|---|---|---|---|
| | Acquisition Costs | Other (a) | Total | ||||||||||||||||
| (millions) | Jan. 30, 2010 | Jan. 31, 2009 | Jan. 30, 2010 | Jan. 31, 2009 | Jan. 30, 2010 | Jan. 31, 2009 | |||||||||||||
Gross asset | $ | 197 | $ | 196 | $ | 150 | $ | 129 | $ | 347 | $ | 325 | |||||||
Accumulated amortization | (62 | ) | (54 | ) | (105 | ) | (100 | ) | (167 | ) | (154 | ) | |||||||
Net intangible assets | $ | 135 | $ | 142 | $ | 45 | $ | 29 | $ | 180 | $ | 171 | |||||||
Amortization is computed on intangible assets with definite useful lives using the straight-line method over estimated useful lives that typically range from 9 to 39 years for leasehold acquisition costs and from 3 to 15 years for other intangible assets. Amortization expense for 2009, 2008, and 2007 was $24 million, $21 million, and $15 million, respectively.
| Estimated Amortization Expense (millions) | 2010 | 2011 | 2012 | 2013 | 2014 | |||||||||||
|---|---|---|---|---|---|---|---|---|---|---|---|---|---|---|---|---|
Amortization expense | $23 | $18 | $13 | $11 | $10 | |||||||||||
16. Accounts Payable
We reclassify book overdrafts to accounts payable at period end. Overdrafts reclassified to accounts payable were $539 million at January 30, 2010 and $606 million at January 31, 2009.
17. Accrued and Other Current Liabilities
| Accrued and Other Current Liabilities (millions) | January 30, 2010 | January 31, 2009 | |||||
|---|---|---|---|---|---|---|---|
Wages and benefits | $ | 959 | $ | 727 | |||
Taxes payable (a) | 490 | 430 | |||||
Gift card liability (b) | 387 | 381 | |||||
Straight-line rent accrual | 185 | 167 | |||||
Workers' compensation and general liability | 163 | 176 | |||||
Dividends payable | 127 | 120 | |||||
Interest payable | 105 | 130 | |||||
Construction in progress | 72 | 182 | |||||
Other | 632 | 600 | |||||
Total | $ | 3,120 | $ | 2,913 | |||
18. Commitments and Contingencies
Purchase obligations, which include all legally binding contracts, such as firm commitments for inventory purchases, merchandise royalties, equipment purchases, marketing-related contracts, software acquisition/license commitments and service contracts, were approximately $2,016 million and $570 million at January 30, 2010 and January 31, 2009, respectively. We issue inventory purchase orders, which represent authorizations to purchase that are cancelable by their terms. We do not consider purchase orders to be firm inventory commitments. We also issue trade letters of credit in the ordinary course of business, which are not firm commitments as they are conditional on the purchase order not being cancelled. If we choose to cancel a purchase order, we may be obligated to reimburse the vendor for unrecoverable outlays incurred prior to cancellation under certain circumstances.
Trade letters of credit totaled $1,484 million and $1,359 million at January 30, 2010 and January 31, 2009, respectively, a portion of which are reflected in accounts payable. Standby letters of credit, relating primarily to
38
Table of Contents
retained risk on our insurance claims, totaled $72 million and $64 million at January 30, 2010 and January 31, 2009, respectively.
We are exposed to claims and litigation arising in the ordinary course of business and use various methods to resolve these matters in a manner that we believe serves the best interest of our shareholders and other constituents. We believe the recorded reserves in our consolidated financial statements are adequate in light of the probable and estimable liabilities. We do not believe that any of the currently identified claims or litigation matters will have a material adverse impact on our results of operations, cash flows or financial condition.
19. Notes Payable and Long-Term Debt
We obtain short-term financing throughout the year under our commercial paper program, a form of notes payable.
| Commercial Paper (millions) | 2009 | 2008 | |||||
|---|---|---|---|---|---|---|---|
Maximum amount outstanding during the year | $ | 112 | $ | 1,385 | |||
Average amount outstanding during the year | 1 | 274 | |||||
Amount outstanding at year-end | - | - | |||||
Weighted average interest rate | 0.2 | % | 2.1 | % | |||
An additional source of liquidity is available to us through a committed $2 billion unsecured revolving credit facility obtained through a group of banks in April 2007, which will expire in April 2012. No balances were outstanding at any time during 2009 or 2008 under this credit facility.
As further explained in Note 10, we maintain an accounts receivable financing program through which we sell credit card receivables to a bankruptcy remote, wholly owned subsidiary, which in turn transfers the receivables to a Trust. The Trust, either directly or through related trusts, sells debt securities to third parties. The following summarizes this activity for fiscal 2008 and 2009.
| Nonrecourse Debt Collateralized by Credit Card Receivables (millions) | Amount | ||||
|---|---|---|---|---|---|
At February 2, 2008 | $ | 2,400 | |||
Issued, net of $268 discount | 3,557 | ||||
Accretion (a) | 33 | ||||
Repaid | (500 | ) | |||
At January 31, 2009 | 5,490 | ||||
Issued | - | ||||
Accretion (a) | 48 | ||||
Repaid | (163 | ) | |||
At January 30, 2010 | $ | 5,375 | |||
Other than debt backed by our credit card receivables and other immaterial borrowings, all of our outstanding borrowings are senior, unsecured obligations.
39
Table of Contents
At January 30, 2010, the carrying value and maturities of our debt portfolio, including swap valuation adjustments for our fair value hedges, was as follows:
| | January 30, 2010 | |||||||
|---|---|---|---|---|---|---|---|---|
| Debt Maturities (millions) | ||||||||
| Rate (a) | Balance | |||||||
Due fiscal 2010-2014 | 3.2 | % | $ | 8,271 | ||||
Due fiscal 2015-2019 | 5.7 | 3,232 | ||||||
Due fiscal 2020-2024 | 9.2 | 213 | ||||||
Due fiscal 2025-2029 | 6.7 | 326 | ||||||
Due fiscal 2030-2034 | 6.6 | 905 | ||||||
Due fiscal 2035-2037 | 6.8 | 3,500 | ||||||
Total notes and debentures | 4.8 | 16,447 | ||||||
Unamortized swap valuation adjustments from terminated/de-designated swaps | 197 | |||||||
Capital lease obligations | 170 | |||||||
Less: | ||||||||
Amounts due within one year | (1,696 | ) | ||||||
Long-term debt | $ | 15,118 | ||||||
Required principal payments on notes and debentures over the next five years, excluding capital lease obligations, are as follows:
| Required Principal Payments (a) (millions) | 2010 | 2011 | 2012 | 2013 | 2014 | |||||||||||
|---|---|---|---|---|---|---|---|---|---|---|---|---|---|---|---|---|
Unsecured | $ | 786 | $ | 106 | $ | 1,501 | $ | 501 | $ | 1 | ||||||
Nonrecourse | 900 | - | 750 | 3,903 | - | |||||||||||
Total required principal payments | $ | 1,686 | $ | 106 | $ | 2,251 | $ | 4,404 | $ | 1 | ||||||
Most of our long-term debt obligations contain covenants related to secured debt levels. In addition to a secured debt level covenant, our credit facility also contains a debt leverage covenant. We are, and expect to remain, in compliance with these covenants.
20. Derivative Financial Instruments
Derivative financial instruments are reported at fair value on the Consolidated Statements of Financial Position. Our derivative instruments have been primarily interest rate swaps. We use these derivatives to mitigate our interest rate risk. We have counterparty credit risk resulting from our derivate instruments. This risk lies primarily with two global financial institutions. We monitor this concentration of counterparty credit risk on an ongoing basis.
Prior to 2009, the majority of our derivative instruments qualified for fair value hedge accounting treatment. The changes in market value of an interest rate swap, as well as the offsetting change in market value of the hedged debt, were recognized within earnings in the current period. We assessed at the inception of the hedge whether the hedging derivatives were highly effective in offsetting changes in fair value or cash flows of hedged items. Ineffectiveness resulted when changes in the market value of the hedged debt were not completely offset by changes in the market value of the interest rate swap. For those derivatives whose terms met the conditions of the "short-cut method", 100 percent hedge effectiveness was assumed. There was no ineffectiveness recognized in 2009, 2008, or 2007 related to our derivative instruments. As detailed below, at January 30, 2010, there were no derivative instruments designated as accounting hedges.
During the first quarter of 2008, we terminated certain "pay floating" interest rate swaps with a combined notional amount of $3,125 million for cash proceeds of $160 million, which are classified within other operating cash flows in the Consolidated Statements of Cash Flows. These swaps were designated as hedges; therefore, concurrent with their terminations, we were required to stop making market value adjustments to the associated hedged debt. Gains realized upon termination will be amortized into earnings over the remaining life of the associated hedge debt.
40
Table of Contents
Additionally, during 2008, we de-designated certain "pay floating" interest rate swaps, and upon de-designation, these swaps no longer qualified for hedge accounting treatment. As a result of the de-designation, the unrealized gains on these swaps determined at the date of de-designation will be amortized into earnings over the remaining lives of the previously hedged items.
In 2009, 2008, and 2007, total net gains amortized into net interest expense for terminated and de-designated swaps were $60 million, $55 million, and $6 million, respectively. The amount remaining on unamortized hedged debt valuation gains from terminated and de-designated interest rate swaps that will be amortized into earnings over the remaining lives totaled $197 million, $263 million, and $14 million, at the end of 2009, 2008, and 2007, respectively.
Simultaneous to the de-designations during 2008, we entered into "pay fixed" swaps to economically hedge the risks associated with the de-designated "pay floating" swaps. These swaps are not designated as hedging instruments and along with the de-designated "pay floating" swaps are measured at fair value on a quarterly basis. Changes in fair value measurements are a component of net interest expense on the Consolidated Statements of Operations.
At January 30, 2010, a characteristic summary of interest rate swaps outstanding was:
| Outstanding Interest Rate Swap Characteristic Summary | Pay Floating | Pay Fixed | |||
|---|---|---|---|---|---|
Weighted average rate: | |||||
Pay | one-month LIBOR | 2.6% fixed | |||
Receive | 5.0% fixed | one-month LIBOR | |||
Weighted average maturity | 4.4 years | 4.4 years | |||
Notional | $1,250 | $1,250 | |||
| Derivative Contracts – Types, Balance Sheet Classifications and Fair Values (millions) | ||||||||||||||||||
|---|---|---|---|---|---|---|---|---|---|---|---|---|---|---|---|---|---|---|
| | Asset | Liability | ||||||||||||||||
| | | Fair Value At | | Fair Value At | ||||||||||||||
| Type | Classification | Jan. 30, 2010 | Jan. 31, 2009 | Classification | Jan. 30, 2010 | Jan. 31, 2009 | ||||||||||||
Not designated as hedging instruments: | ||||||||||||||||||
Interest rate swaps | Other noncurrent assets | $ | 131 | $ | 163 | Other noncurrent | $ | 23 | $ | 30 | ||||||||
Total | $ | 131 | $ | 163 | $ | 23 | $ | 30 | ||||||||||
During 2007, we entered into a series of interest rate lock agreements that effectively fixed the interest payments on our anticipated issuance of debt that would be affected by interest-rate fluctuations on the U.S. Treasury benchmark between the beginning date of the interest rate locks and the date of the issuance of the debt. Upon our issuance of fixed-rate debt in fiscal 2007, we terminated these rate lock agreements with a combined notional amount of $2.5 billion for cash payment of $79 million, which is classified within other operating cash flows on the Consolidated Statements of Cash Flows. The loss of $48 million, net of taxes of $31 million, has been recorded in accumulated other comprehensive loss and is being recognized as an adjustment to net interest expense over the same period in which the related interest costs on the debt are recognized in earnings. During 2007, the amount reclassified into earnings was not material. During 2008 and 2009, the amount reclassified into earnings as an increase to interest expense from accumulated other comprehensive income was $3 million ($5 million pre tax) and $3 million ($5 million pre tax). The amount expected to be reclassified into earnings from accumulated other comprehensive income for 2010 is $3 million ($5 million pre tax).
41
Table of Contents
Periodic payments, valuation adjustments and amortization of gains or losses from the termination or de-designation of derivative contracts are summarized below:
| Derivative Contracts – Effect on Results of Operations (millions) | ||||||||||||
|---|---|---|---|---|---|---|---|---|---|---|---|---|
| | | Income/(Expense) | ||||||||||
| | Classification of Income/(Expense) | |||||||||||
| Type | 2009 | 2008 | 2007 | |||||||||
Interest rate swaps | Other interest expense | $ | 65 | $ | 71 | $ | (15 | ) | ||||
Interest rate forward (a) | Selling, general and administrative | - | - | 18 | ||||||||
Total | $ | 65 | $ | 71 | $ | 3 | ||||||
21. Leases
We lease certain retail locations, warehouses, distribution centers, office space, equipment and land. Assets held under capital lease are included in property and equipment. Operating lease rentals are expensed on a straight-line basis over the life of the lease beginning on the date we take possession of the property. At lease inception, we determine the lease term by assuming the exercise of those renewal options that are reasonably assured because of the significant economic penalty that exists for not exercising those options. The exercise of lease renewal options is at our sole discretion. The expected lease term is used to determine whether a lease is capital or operating and is used to calculate straight-line rent expense. Additionally, the depreciable life of buildings and leasehold improvements is limited by the expected lease term.
Rent expense on buildings is included in SG&A. Some of our lease agreements include rental payments based on a percentage of retail sales over contractual levels. Total rent expense was $174 million in 2009, $169 million in 2008, and $165 million in 2007, including immaterial amounts of percentage rent expense in 2009, 2008 and 2007. Certain leases require us to pay real estate taxes, insurance, maintenance and other operating expenses associated with the leased premises. These expenses are classified in SG&A consistent with similar costs for owned locations. Most long-term leases include one or more options to renew, with renewal terms that can extend the lease term from one to more than fifty years. Certain leases also include options to purchase the leased property.
| Future Minimum Lease Payments (millions) | Operating Leases (a) | Capital Leases | |||||
|---|---|---|---|---|---|---|---|
2010 | $ | 264 | $ | 16 | |||
2011 | 181 | 17 | |||||
2012 | 143 | 18 | |||||
2013 | 138 | 18 | |||||
2014 | 127 | 17 | |||||
After 2014 | 3,147 | 190 | |||||
Total future minimum lease payments | $ | 4,000 | 276 | ||||
Less: Interest (b) | (106 | ) | |||||
Present value of future minimum capital lease payments (c) | $ | 170 | |||||
42
Table of Contents
22. Income Taxes
Deferred tax assets and liabilities are recognized for the future tax consequences attributable to temporary differences between financial statement carrying amounts of existing assets and liabilities and their respective tax bases. Deferred tax assets and liabilities are measured using enacted income tax rates in effect for the year the temporary differences are expected to be recovered or settled. Tax rate changes affecting deferred tax assets and liabilities are recognized in income at the enactment date. We have not recorded deferred taxes when earnings from foreign operations are considered to be indefinitely invested outside the U.S. Such amounts are not significant.
| Tax Rate Reconciliation | 2009 | 2008 | 2007 | |||||||
|---|---|---|---|---|---|---|---|---|---|---|
Federal statutory rate | 35.0 | % | 35.0 | % | 35.0 | % | ||||
State income taxes, net of federal tax benefit | 3.8 | 4.0 | 4.0 | |||||||
Other | (3.1 | ) | (1.6 | ) | (0.6 | ) | ||||
Effective tax rate | 35.7 | % | 37.4 | % | 38.4 | % | ||||
The decrease in the effective rates between 2009 and 2008 is primarily due to nontaxable capital market returns on investments used to economically hedge the market risk in deferred compensation obligations in 2009 compared with nondeductible losses in 2008. The 2009 effective income tax rate is also lower due to federal and state discrete items. The decrease in 2008 was primarily due to tax reserve reductions resulting from audit settlements and the effective resolution of other issues. The 2008 effective income tax rate was also lower due to a comparatively greater proportion of earnings subject to rate differences between taxing jurisdictions. These rate declines were partially offset by lower capital market returns on investments used to economically hedge the market risk in deferred compensation plans. Gains and losses from these investments are not taxable.
| Provision for Income Taxes: Expense/(Benefit) (millions) | 2009 | 2008 | 2007 | ||||||||
|---|---|---|---|---|---|---|---|---|---|---|---|
Current: | |||||||||||
Federal | $ | 877 | $ | 1,034 | $ | 1,568 | |||||
State/other | 143 | 197 | 278 | ||||||||
Total current | 1,020 | 1,231 | 1,846 | ||||||||
Deferred: | |||||||||||
Federal | 339 | 88 | (67 | ) | |||||||
State/other | 25 | 3 | (3 | ) | |||||||
Total deferred | 364 | 91 | (70 | ) | |||||||
Total provision | $ | 1,384 | $ | 1,322 | $ | 1,776 | |||||
| Net Deferred Tax Asset/(Liability) (millions) | January 30, 2010 | January 31, 2009 | ||||||
|---|---|---|---|---|---|---|---|---|
Gross deferred tax assets: | ||||||||
Accrued and deferred compensation | $ | 538 | $ | 420 | ||||
Allowance for doubtful accounts | 393 | 390 | ||||||
Accruals and reserves not currently deductible | 380 | 349 | ||||||
Self-insured benefits | 260 | 289 | ||||||
Other | 92 | 223 | ||||||
Total gross deferred tax assets | 1,663 | 1,671 | ||||||
Gross deferred tax liabilities: | ||||||||
Property and equipment | (1,543 | ) | (1,234 | ) | ||||
Deferred credit card income | (166 | ) | (144 | ) | ||||
Other | (64 | ) | (55 | ) | ||||
Total gross deferred tax liabilities | (1,773 | ) | (1,433 | ) | ||||
Total net deferred tax asset/(liability) | $ | (110 | ) | $ | 238 | |||
We file a U.S. federal income tax return and income tax returns in various states and foreign jurisdictions. We are no longer subject to U.S. federal income tax examinations for years before 2006 and, with few
43
Table of Contents
exceptions, are no longer subject to state and local or non-U.S. income tax examinations by tax authorities for years before 2003.
| Reconciliation of Unrecognized Tax Benefit Liabilities (millions) | 2009 | 2008 | |||||
|---|---|---|---|---|---|---|---|
Balance at beginning of period | $ | 434 | $ | 442 | |||
Additions based on tax positions related to the current year | 119 | 27 | |||||
Additions for tax positions of prior years | 47 | 100 | |||||
Reductions for tax positions of prior years | (61 | ) | (101 | ) | |||
Settlements | (87 | ) | (34 | ) | |||
Balance at end of period | $ | 452 | $ | 434 | |||
If the Corporation were to prevail on all unrecognized tax benefit liabilities recorded, approximately $210 million of the $452 million reserve would benefit the effective tax rate. In addition, the reversal of accrued penalties and interest would also benefit the effective tax rate. Interest and penalties associated with unrecognized tax benefit liabilities are recorded within income tax expense. During the year ended January 30, 2010, we reversed accrued penalties and interest of approximately $10 million. During the years ended January 31, 2009 and February 2, 2008, we recognized approximately $33 million, and $37 million, respectively, in interest and penalties. We had accrued for the payment of interest and penalties of approximately $127 million at January 30, 2010 and $153 million at January 31, 2009.
Included in the balance at January 30, 2010 and January 31, 2009 are $133 million and $116 million, respectively, of liabilities for tax positions for which the ultimate deductibility is highly certain, but for which there is uncertainty about the timing of such deductibility. Because of the impact of deferred tax accounting, other than interest and penalties, the disallowance of the shorter deductibility period would not affect the annual effective tax rate, but would accelerate the cash payment to the taxing authority to an earlier period. During 2010, we will file a tax accounting method change allowed under applicable tax regulations that will determine the timing of deductions for one of our tax positions. Accordingly, this change will result in a decrease in the unrecognized tax benefit liability of approximately $130 million in the next twelve months. Additionally, it is reasonably possible that the amount of the unrecognized tax benefit liabilities with respect to other of our unrecognized tax positions will increase or decrease during the next twelve months; however, we do not currently expect any change to have a significant effect on our results of operations or our financial position.
During 2009, we filed income tax returns that included tax accounting method changes allowed under applicable tax regulations. These changes resulted in a substantial increase in tax deductions related to property and equipment, resulting in an increase in noncurrent deferred income tax liabilities of approximately $300 million and a corresponding increase in current income taxes receivable, which is classified as other current assets in the Consolidated Statements of Financial Position. These changes did not affect income tax expense for 2009.
23. Other Noncurrent Liabilities
| Other Noncurrent Liabilities (millions) | January 30, 2010 | January 31, 2009 | |||||
|---|---|---|---|---|---|---|---|
Income tax liability | $ | 579 | $ | 506 | |||
Workers' compensation and general liability | 490 | 506 | |||||
Deferred compensation | 369 | 309 | |||||
Pension and postretirement health care benefits | 178 | 318 | |||||
Other | 290 | 298 | |||||
Total | $ | 1,906 | $ | 1,937 | |||
We retain a substantial portion of the risk related to certain general liability and workers' compensation claims. Liabilities associated with these losses include estimates of both claims filed and losses incurred but not yet reported. We estimate our ultimate cost based on analysis of historical data and actuarial estimates. General liability and workers' compensation liabilities are recorded at our estimate of their net present value.
44
Table of Contents
24. Share Repurchase
In November 2007, our Board of Directors approved a share repurchase program totaling $10 billion that replaced a prior program. In November 2008, we announced that, in light of our business outlook, we were temporarily suspending our open-market share repurchase program. In January 2010, we resumed open-market purchases of shares under this program.
Share repurchases for the last three years, repurchased primarily through open market transactions, were as follows:
| Share Repurchases (millions, except per share data) | Total Number of Shares Purchased | Average Price Paid per Share | Total Investment | |||||||
|---|---|---|---|---|---|---|---|---|---|---|
2007 – Under a prior program | 19.7 | $ | 60.72 | $ | 1,197 | |||||
2007 – Under the 2007 program | 26.5 | 54.64 | 1,445 | |||||||
2008 | 67.2 | 50.49 | 3,395 | |||||||
2009 | 9.9 | 48.54 | 479 | |||||||
Total | 123.3 | $ | 52.85 | $ | 6,516 | |||||
Of the shares reacquired and included above, a portion was delivered upon settlement of prepaid forward contracts. The prepaid forward contracts settled in 2009 had a total cash investment of $56 million and an aggregate market value of $60 million at their respective settlement dates. The prepaid forward contracts settled in 2008 had a total cash investment of $249 million and an aggregate market value of $251 million at their respective settlement dates. The prepaid forward contracts settled in 2007 had a total cash investment of $165 million and an aggregate market value of $215 million at their respective settlement dates. These contracts are among the investment vehicles used to reduce our economic exposure related to our nonqualified deferred compensation plans. The details of our positions in prepaid forward contracts have been provided in Note 26.
Our share repurchases during 2008 included 30 million shares that were acquired through the exercise of call options.
| Call Option Repurchase Details | |||||||||||||||||||
|---|---|---|---|---|---|---|---|---|---|---|---|---|---|---|---|---|---|---|---|
| | | | (amounts per share) | | |||||||||||||||
| | Number of Options Exercised | | Total Cost (millions) | ||||||||||||||||
| Series | Exercise Date | Premium (a) | Strike Price | Total | |||||||||||||||
Series I | 10,000,000 | April 2008 | $ | 11.04 | $ | 40.32 | $ | 51.36 | $ | 514 | |||||||||
Series II | 10,000,000 | May 2008 | 10.87 | 39.31 | 50.18 | 502 | |||||||||||||
Series III | 10,000,000 | June 2008 | 11.20 | 39.40 | 50.60 | 506 | |||||||||||||
Total | 30,000,000 | $ | 11.04 | $ | 39.68 | $ | 50.71 | $ | 1,522 | ||||||||||
25. Share-Based Compensation
We maintain a long-term incentive plan for key team members and nonemployee members of our Board of Directors. Our long-term incentive plan allows us to grant equity-based compensation awards, including stock options, stock appreciation rights, performance share unit awards, restricted stock unit awards, restricted stock awards or a combination of awards.
A majority of granted awards are nonqualified stock options that vest annually in equal amounts over a four-year period and expire no later than 10 years after the grant date. Options granted to the nonemployee members of our Board of Directors become exercisable after one year and have a 10-year term.
We have issued performance share unit awards annually since January 2003. These awards represent shares potentially issuable in the future; historically, awards have been issued based upon the attainment of compound annual growth rates in revenue and EPS over a three year performance period. Beginning with the March 2009 grant, issuance is based upon the attainment of compound annual EPS growth rate and domestic market share change relative to a retail peer group over a three-year performance period.
We regularly issue restricted stock units with three-year cliff vesting to select team members. We also regularly issue restricted stock units to our Board of Directors. The number of unissued common shares
45
Table of Contents
reserved for future grants under the share-based compensation plans was 21,450,009 at January 30, 2010 and 25,755,800 at January 31, 2009.
| Share-Based Compensation Award Activity | | | | ||||||||||||||||||||||
|---|---|---|---|---|---|---|---|---|---|---|---|---|---|---|---|---|---|---|---|---|---|---|---|---|---|
| | Stock Options (a) | | | ||||||||||||||||||||||
| | Total Outstanding | Exercisable | | | |||||||||||||||||||||
| (number of options and units in thousands) | No. of Options | Exercise Price (b) | Intrinsic Value (c) | No. of Options | Exercise Price (b) | Intrinsic Value (c) | Performance Share Units (d) | Restricted Stock Units | |||||||||||||||||
February 3, 2007 | 27,910 | $ | 41.95 | $ | 558 | 17,659 | $ | 35.32 | $ | 470 | 1,895 | 221 | |||||||||||||
Granted | 5,725 | 49.54 | 650 | 21 | |||||||||||||||||||||
Expired/forfeited | (434 | ) | 52.67 | - | - | ||||||||||||||||||||
Exercised/issued | (5,061 | ) | 28.00 | (370 | ) | (4 | ) | ||||||||||||||||||
February 2, 2008 | 28,140 | $ | 45.84 | $ | 298 | 16,226 | $ | 41.07 | $ | 245 | 2,175 | 238 | |||||||||||||
Granted | 9,914 | 34.64 | 764 | 315 | |||||||||||||||||||||
Expired/forfeited | (756 | ) | 51.28 | (176 | ) | (2 | ) | ||||||||||||||||||
Exercised/issued | (937 | ) | 33.36 | (740 | ) | (2 | ) | ||||||||||||||||||
January 31, 2009 | 36,361 | $ | 43.00 | $ | 4 | 19,292 | $ | 43.80 | $ | 4 | 2,023 | 549 | |||||||||||||
Granted | 5,127 | 49.08 | 826 | 224 | |||||||||||||||||||||
Expired/forfeited | (1,507 | ) | 46.14 | (662 | ) | - | |||||||||||||||||||
Exercised/issued | (1,767 | ) | 35.34 | (14 | ) | (203 | ) | ||||||||||||||||||
January 30, 2010 | 38,214 | $ | 44.05 | $ | 331 | 22,446 | $ | 44.59 | $ | 189 | 2,173 | (e) | 570 | ||||||||||||
We used a Black-Scholes valuation model to estimate the fair value of the options at grant date based on the assumptions noted in the following table. Volatility represents an average of market estimates for implied volatility of 5.5-year options on Target common stock. The expected life is estimated based on an analysis of options already exercised and any foreseeable trends or changes in recipients' behavior. The risk-free interest rate is an interpolation of the relevant U.S. Treasury security maturities as of each applicable grant date. The assumptions disclosed below represent a weighted average of the assumptions used for all of our stock option grants throughout the years.
| Valuation of Share-Based Compensation | 2009 | 2008 | 2007 | ||||||||
|---|---|---|---|---|---|---|---|---|---|---|---|
Stock options weighted average valuation assumptions: | |||||||||||
Dividend yield | 1.4 | % | 1.9 | % | 1.1 | % | |||||
Volatility | 31 | % | 47 | % | 39 | % | |||||
Risk-free interest rate | 2.7 | % | 1.5 | % | 3.2 | % | |||||
Expected life in years | 5.5 | 5.5 | 5.5 | ||||||||
Stock options grant date weighted average fair value | $ | 14.18 | $ | 12.87 | $ | 18.08 | |||||
Performance share units grant date weighted average fair value | $ | 27.18 | $ | 51.68 | $ | 59.45 | |||||
Restricted stock units grant date weighted average fair value | $ | 48.94 | $ | 34.78 | $ | 57.70 | |||||
Total share-based compensation expense recognized in the Consolidated Statements of Operations was $103 million, $72 million, and $73 million in 2009, 2008, and 2007, respectively. The related income tax benefit was $40 million, $28 million, and $28 million in 2009, 2008, and 2007, respectively.
| Stock Options Exercises (millions) | 2009 | 2008 | 2007 | |||||||
|---|---|---|---|---|---|---|---|---|---|---|
Compensation expense realized | $ | 21 | $ | 14 | $ | 187 | ||||
Related income tax benefit | 8 | 5 | 73 | |||||||
Net cash proceeds | 62 | 31 | 142 | |||||||
At January 30, 2010, there was $147 million of total unrecognized compensation expense related to nonvested stock options, which is expected to be recognized over a weighted average period of 1.4 years.
46
Table of Contents
The weighted average remaining life of currently exercisable options is 4.9 years, and the weighted average remaining life of all outstanding options is 8.8 years. The total fair value of options vested was $85 million, $69 million, and $55 million, in 2009, 2008, and 2007, respectively.
Compensation expense associated with outstanding performance share units is recorded over the life of the awards. The expense recorded each period is dependent upon our estimate of the number of shares that will ultimately be issued. Future compensation expense for currently outstanding awards could reach a maximum of $51 million assuming payout of all outstanding awards. There were no share based liabilities paid during 2009. The total share based liabilities paid were $15 million in 2008 and $18 million in 2007.
Total unrecognized compensation expense related to restricted stock unit awards was $16 million as of January 30, 2010.
26. Defined Contribution Plans
Team members who meet certain eligibility requirements can participate in a defined contribution 401(k) plan by investing up to 80 percent of their compensation, as limited by statute or regulation. Generally, we match 100 percent of each team member's contribution up to 5 percent of total compensation. Company match contributions are made to the fund designated by the participant.
In addition, we maintain nonqualified, unfunded deferred compensation plans for approximately 3,500 current and retired team members. These team members choose from a menu of crediting rate alternatives that are the same as the investment choices in our 401(k) plan, including Target common stock. We credit an additional 2 percent per year to the accounts of all active participants, excluding executive officer participants, in part to recognize the risks inherent to their participation in a plan of this nature. We also maintain a nonqualified, unfunded deferred compensation plan that was frozen during 1996, covering 11 active and 50 retired participants. In this plan deferred compensation earns returns tied to market levels of interest rates, plus an additional 6 percent return, with a minimum of 12 percent and a maximum of 20 percent, as determined by the plan's terms.
The American Jobs Creation Act of 2004 added Section 409A to the Internal Revenue Code, changing the federal income tax treatment of nonqualified deferred compensation arrangements. Failure to comply with the new requirements would result in early taxation of nonqualified deferred compensation arrangements, as well as a 20 percent penalty tax and additional interest payable to the IRS. In response to these new requirements, we allowed participants to elect to accelerate the distribution dates for their account balances. Participant elections resulted in payments of $29 million in 2009 and $86 million in 2008.
We control some of our risk of offering the nonqualified plans through investing in vehicles, including company-owned life insurance and prepaid forward contracts in our own common stock that offset a substantial portion of our economic exposure to the returns of these plans. These investment vehicles are general corporate assets and are marked to market with the related gains and losses recognized in the Consolidated Statements of Operations in the period they occur. The total change in fair value for contracts indexed to our own common stock recorded in earnings was pretax income/(loss) of $36 million in 2009, $(19) million in 2008, and $6 million in 2007. During 2009 and 2008, we invested approximately $34 million and $215 million, respectively, in such investment instruments, and these investments are included in the Consolidated Statements of Cash Flows within other investing activities. Adjusting our position in these investment vehicles may involve repurchasing shares of Target common stock when settling the forward contracts. In 2009, 2008, and 2007, these repurchases totaled 1.5 million, 4.7 million, and 3.4 million shares, respectively, and are included in the total share repurchases described in Note 24.
| Prepaid Forward Contracts on Target Common Stock | Contractual Price Paid per Share | | | ||||||||||
|---|---|---|---|---|---|---|---|---|---|---|---|---|---|
| (millions, except per share data) | Number of Shares | Fair Value | Total Cash Investment | ||||||||||
January 31, 2009 | 2.2 | $ | 39.98 | $ | 68 | $ | 88 | ||||||
January 30, 2010 | 1.5 | $ | 42.77 | $ | 79 | $ | 66 | ||||||
47
Table of Contents