UNITED STATES
SECURITIES AND EXCHANGE COMMISSION
Washington, D.C. 20549
____________
FORM 10-K
____________
(check one)
x | ANNUAL REPORT PURSUANT TO SECTION 13 OR 15(d) OF THE SECURITIES EXCHANGE ACT OF 1934 For the fiscal year ended June 30, 2011 |
OR
¨ | TRANSITION REPORT PURSUANT TO SECTION 13 OR 15(d) OF THE SECURITIES EXCHANGE ACT OF 1934 For the transition period from __________ to __________ |
Commission File No. 1-367
____________
THE L.S. STARRETT COMPANY
(Exact name of registrant as specified in its charter)
____________
MASSACHUSETTS | 04-1866480 | |
(State or other jurisdiction of incorporation or organization) | (I.R.S. Employer Identification No.) |
121 CRESCENT STREET, ATHOL, MASSACHUSETTS | 01331 | |
(Address of principal executive offices) | (Zip Code) |
Registrant's telephone number, including area code 978-249-3551
____________
Securities registered pursuant to Section 12(b) of the Act:
Title of each class | Name of each exchange on which registered | |
Class A Common - $1.00 Per Share Par Value | New York Stock Exchange | |
Class B Common - $1.00 Per Share Par Value | Not applicable |
____________
Indicate by check mark if the Registrant is a well-known seasoned issuer, as defined in Rule 405 of the Securities Act. Yes ¨ No x
Indicate by check mark if the Registrant is not required to file reports pursuant to Section 13 or Section 15(d) of the Act. Yes ¨ No x
Indicate by check mark whether the Registrant (1) has filed all reports required to be filed by Section 13 or 15(d) of the Securities Exchange Act of 1934 during the preceding 12 months (or for such shorter period that the Registrant was required to file such reports) and (2) has been subject to such filing requirements for the past 90 days. Yes x No ¨
Indicate by check mark whether the registrant has submitted electronically and posted on its corporate Web site, if any, every Interactive Data File required to be submitted and posted pursuant to Rule 405 of Regulation S-T (§ 232.405 of this chapter) during the preceding 12 months (or for such shorter period that the registrant was required to submit and post such files). Yes x No ¨
Indicate by check mark if disclosure of delinquent filers pursuant to Item 405 of Regulation S-K is not contained herein and will not be contained, to the best of Registrant's knowledge, in definitive proxy or information statements incorporated by reference in Part III of this Form 10-K or amendment to this Form 10-K. x
Indicate by check mark whether the Registrant is a large accelerated filer, an accelerated filer, a non-accelerated filer or a smaller reporting company. See the definitions of "large accelerated filer," "accelerated filer" and "smaller reporting company" in Rule 12b-2 of the Exchange Act. (Check one)
Large Accelerated Filer ¨ Accelerated Filer x
Non-Accelerated Filer ¨ Smaller Reporting Company ¨
(Do not check if a smaller reporting company)
Indicate by check mark whether the Registrant is a shell company (as defined in Rule 12b-2 of the Act). Yes ¨ No x
The Registrant had 5,890,309 and 803,913 shares, respectively, of its $1.00 par value Class A and B common stock outstanding on December 25, 2010. On December 25, 2010, the last business day of the Registrant's second fiscal quarter, the aggregate market value of the common stock held by nonaffiliates was approximately $67,904,014.
There were 5,942,689 and 797,764 shares, respectively, of the Registrant's $1.00 par value Class A and Class B common stock outstanding as of August 31, 2011.
The exhibit index is located on pages 57-58.
DOCUMENTS INCORPORATED BY REFERENCE
The Registrant intends to file a definitive Proxy Statement for the Company's 2011 Annual Meeting of Stockholders within 120 days of the end of the fiscal year ended June 30, 2011. Portions of such Proxy Statement are incorporated by reference in Part III.
2
THE L.S. STARRETT COMPANY
FORM 10-K
FOR THE PERIOD ENDED JUNE 30, 2011
TABLE OF CONTENTS
Page Number | ||
PART I | ||
ITEM 1. | Business | 4-6 |
ITEM 1A. | Risk Factors | 6-8 |
ITEM 1B. | Unresolved Staff Comments | 8 |
ITEM 2. | Properties | 8-9 |
ITEM 3. | Legal Proceedings | 9 |
ITEM 4. | Removed and Reserved | 9 |
PART II | ||
ITEM 5. | Market for the Company's Common Equity, Related Stockholder Matters and Issuer Purchases of Equity Securities | 9-10 |
ITEM 6. | Selected Financial Data | 11 |
ITEM 7. | Management's Discussion and Analysis of Financial Condition and Results of Operations | 11-18 |
ITEM 7A. | Quantitative and Qualitative Disclosures about Market Risk | 11-18 |
ITEM 8. | Financial Statements and Supplementary Data | 18-49 |
ITEM 9. | Changes in and Disagreements with Accountants on Accounting and Financial Disclosure | 49 |
ITEM 9A. | Controls and Procedures | 49 |
ITEM 9B. | Other Information | 53 |
PART III | ||
ITEM 10. | Directors, Executive Officers and Corporate Governance | 53 |
ITEM 11. | Executive Compensation | 54 |
ITEM 12. | Security Ownership of Certain Beneficial Owners and Management and Related Stockholder Matters | 54 |
ITEM 13. | Certain Relationships and Related Transactions, and Director Independence | 55 |
ITEM 14. | Principal Accounting Fees and Services | 55 |
PART IV | ||
ITEM 15. | Exhibits and Financial Statement Schedules | 55-56 |
EXHIBIT INDEX | 56-57 | |
SIGNATURES | 58 | |
All references in this Annual Report to "Starrett", the "Company", "we", "our" and "us" means The L.S. Starrett Company and its subsidiaries.
3
PART I
Item 1 - Business
General
Founded in 1880 by Laroy S. Starrett and incorporated in 1929, the Company is engaged in the business of manufacturing over 5,000 different products for industrial, professional and consumer markets. As a global manufacturer with major subsidiaries in Brazil (1956), Scotland (1958) and China (1997), the Company offers its broad array of products to the market through multiple channels of distribution throughout the world. The Company's products include precision tools, electronic gages, gage blocks, optical and vision measuring equipment, custom engineered granite solutions, tape measures, levels, chalk products, squares, band saw blades, hole saws, hacksaw blades, jig saw blades, reciprocating saw blades, M1 ® lubricant and precision ground flat stock. The Company's financial reporting is based upon one business segment.
Starrett® is brand recognized around the world for precision, quality and innovation.
Products
The Company's tools and instruments are sold throughout North America and in over 100 foreign countries. By far the largest consumer of these products is the metalworking industry including aerospace, medical, and automotive but other important consumers are marine and farm equipment shops, do-it-yourselfers and tradesmen such as builders, carpenters, plumbers and electricians.
For 131 years the Company has been a recognized leader in providing measurement solutions consisting of hand measuring tools and precision instruments such as micrometers, vernier calipers, height gages, depth gages, electronic gages, dial indicators, steel rules, combination squares, custom and non contact gaging and many other items. Skilled personnel, superior products, manufacturing expertise, innovation and unmatched service has earned the Company its reputation as the "Best in Class" provider of measuring application solutions for industry. During fiscal 2008, the Company enhanced its wireless data collection solutions, making them more customer-friendly and more software-compatible.
The Company's saw product lines enjoy strong global brand recognition and market share. These products encompass a breadth of uses. During 2009, the Company introduced several new products including its ADVANZ carbide tipped products and its VERSATIX products with a patent pending tooth geometry designed for the cutting of structurals and small solids. This launch was further enhanced through the global introduction of new support programs and marketing collateral. These actions are aimed at positioning Starrett for global growth in wide band products for production applications as well as product range expansions for shop applications. A full line of complementary saw products, including hack, jig, reciprocating saw blades and hole saws provide cutting solutions for the building trades and are offered primarily through construction, electrical, plumbing and retail distributors.
Personnel
At June 30, 2011, the Company had 1,951 employees, approximately 51% of whom were domestic. This represents a net increase from June 26, 2010 of 207 employees. The headcount increase was 96 domestically and 111 internationally.
None of the Company's operations are subject to collective bargaining agreements. In general, the Company considers relations with its employees to be excellent. Domestic employees hold a large share of Company stock resulting from various stock purchase plans. The Company believes that this dual role of owner-employee has strengthened employee morale over the years.
4
Competition
The Company is competing on the basis of its reputation as the best in class for quality, precision and innovation combined with its commitment to customer service and strong customer relationships. To that end, Starrett is increasingly focusing on providing customer centric solutions. Although the Company is generally operating in highly competitive markets, the Company's competitive position cannot be determined accurately in the aggregate or by specific market since none of its competitors offer all of the same product lines offered by the Company or serve all of the markets served by the Company.
The Company is one of the largest producers of mechanics' hand measuring tools and precision instruments. In the United States, there are three other major companies and numerous small competitors in the field, including direct foreign competitors. As a result, the industry is highly competitive. During fiscal 2011, there were no material changes in the Company's competitive position. The Company's products for the building trades, such as tape measures and levels, are under constant margin pressure due to a channel shift to large national home and hardware retailers. The Company is responding to such challenges by expanding its manufacturing operations in China. Certain large customers offer private labels ("own brand") that compete with Starrett branded products. These products are often sourced directly from low cost countries.
Saw products encounter competition from several domestic and international sources. The Company's competitive position varies by market segment and country. Continued research and development, new patented products and processes, and strong customer support have enabled the Company to compete successfully in both general and performance oriented applications.
Foreign Operations
The operations of the Company's foreign subsidiaries are consolidated in its financial statements. The subsidiaries located in Brazil, Scotland and China are actively engaged in the manufacturing and distribution of precision measuring tools, saw blades, optical and vision measuring equipment and hand tools. Subsidiaries in Canada, Argentina, Australia, New Zealand, Mexico and Germany are engaged in distribution of the Company's products. The Company expects its foreign subsidiaries to continue to play a significant role in its overall operations. A summary of the Company's foreign operations is contained in Note 15 to the Company's fiscal 2011 financial statements under the caption "OPERATING DATA" found in Item 8 of this Form 10-K.
Orders and Backlog
The Company generally fills orders from finished goods inventories on hand. Sales order backlog of the Company at any point in time is not significant. Total inventories amounted to $58.8 million at June 30, 2011 and $46.2 million at June 26, 2010.
Intellectual Property
When appropriate, the Company applies for patent protection on new inventions and currently owns a number of patents. Its patents are considered important in the operation of the business, but no single patent is of material importance when viewed from the standpoint of its overall business. The Company relies on its continuing product research and development efforts, with less dependence on its current patent position. It has for many years maintained engineers and supporting personnel engaged in research, product development and related activities. The expenditures for these activities during fiscal years 2011, 2010 and 2009 were approximately $1.5 million, $0.9 million and $1.6 million respectively, all of which were expensed in the Company's financial statements.
The Company uses trademarks with respect to its products and considers its trademark portfolio as one of its most valuable assets. All of the Company's important trademarks are registered and rigorously enforced.
Environmental
Compliance with federal, state, local, and foreign provisions that have been enacted or adopted regulating the discharge of materials into the environment or otherwise relating to protection of the environment is not expected to have a material effect on the capital expenditures, earnings and competitive position of the Company. Specifically, the Company has taken steps to reduce, control and treat water discharges and air emissions. The Company takes seriously its responsibility to the environment, has embraced renewable energy alternatives and is ready to bring a new hydro – generation facility on line at its Athol, MA plant to reduce its carbon foot print and energy costs, an investment in excess of $1.0 million.
5
Strategic Activities
Globalization has had a profound impact on product offerings and buying behaviors of industry and consumers in North America and around the world, forcing the Company to adapt to this new, highly competitive business environment. The Company continuously evaluates most aspects of its business, aiming for new world-class ideas to set itself apart from its competition.
Our strategic concentration is on global brand building and providing unique customer value propositions through technically supported application solutions for our customers. Our job is to recommend and produce the best suited standard product or to design and build custom solutions. The combination of the right tool for the job with value added service gives us a competitive advantage. The Company continues its focus on lean manufacturing, plant consolidations, global sourcing and improved logistics to optimize its value chain.
The execution of these strategic initiatives has expanded the Company's manufacturing and distribution in developing economies, increasing its international sales revenues to 56% of its consolidated sales for fiscal 2011.
SEC Filings and Certifications
The Company makes its public filings with the Securities and Exchange Commission ("SEC"), including its Annual Report on Form 10-K, Quarterly Reports on Form 10-Q, Current Reports on Form 8-K and all exhibits and amendments to these reports, available free of charge at its website, www.starrett.com, as soon as reasonably practicable after the Company files such material with the SEC. Information contained on the Company's website is not part of this Annual Report on Form 10-K.
Item 1A – Risk Factors
SAFE HARBOR STATEMENT UNDER THE PRIVATE SECURITIES LITIGATION REFORM ACT OF 1995
This Annual Report on Form 10-K and the Company's 2011 Annual Report to Stockholders, including the President's letter, contains forward-looking statements about the Company's business, competition, sales, gross margins, expenditures, foreign operations, plans for reorganization, interest rate sensitivity, debt service, liquidity and capital resources, and other operating and capital requirements. In addition, forward-looking statements may be included in future Company documents and in oral statements by Company representatives to security analysts and investors. The Company is subject to risks that could cause actual events to vary materially from such forward-looking statements, including the following risk factors:
Risks Related to Financial Reporting: If the Company or its independent registered public accounting firm are unable to affirm the effectiveness of internal control over financial reporting in future years, the market value of the Company's common stock could be adversely affected. The Company's independent registered public accounting firm did audit and report on internal controls over financial reporting as of June 30, 2011 and June 26, 2010. For the year ended June 26, 2010, material weaknesses in internal controls over financial reporting were identified. Management has implemented the remediation steps outlined in the Annual Report on Form 10-K for fiscal 2010, but these steps have yet to fully resolve all the financial reporting issues, as the controls around tax reporting have not met the criteria required to be considered fully functioning. The Company is in the process of implementing new remediation steps to address this control failure.
Risks Related to the Economy: The Company's results of operations are materially affected by the conditions in the global economy. As a result of the global economic recession, U.S. and foreign economies have experienced significant declines in employment, household wealth, consumer spending, and lending. Businesses, including the Company and its customers, have faced weakened demand for their products and services, difficulty obtaining access to financing, increased funding costs, and barriers to expanding operations. The Company's results of operations in fiscal 2010 were negatively impacted by the global economic recession; however, business activity improved for the Company in fiscal 2011. The Company can provide no assurance that its improvement in fiscal 2011 will continue or that its future results of operations will improve.
Risks Related to Reorganization: The Company continues to evaluate consolidation and reorganization of some of its manufacturing and distribution operations. There can be no assurance that the Company will be successful in these efforts or that any consolidation or reorganization will result in revenue increases or cost savings to the Company. The implementation of these reorganization measures may disrupt the Company's manufacturing and distribution activities, could adversely affect operations, and could result in asset impairment charges and other costs that will be recognized if and when reorganization or restructuring plans are implemented or obligations are incurred.
6
Risks Related to Technology: Although the Company's strategy includes investment in research and development of new and innovative products to meet technology advances, there can be no assurance that the Company will be successful in competing against new technologies developed by competitors.
Risks Related to Foreign Operations: Approximately 56% of the Company's sales and 62% of net assets related to foreign operations for fiscal 2011. Foreign operations are subject to special risks that can materially affect the sales, profits, cash flows and financial position of the Company, including taxes and other restrictions on distributions and payments, currency exchange rate fluctuations, political and economic instability, inflation, minimum capital requirements and exchange controls. The Company's Brazilian operations can be very volatile, changing from year to year due to the political situation, currency risk and the economy. As a result, the future performance of the Brazilian operations may be difficult to forecast.
Risks Related to Industrial Manufacturing Sector: The market for most of the Company's products is subject to economic conditions affecting the industrial manufacturing sector, including the level of capital spending by industrial companies and the general movement of manufacturing to low cost foreign countries where the Company does not have a substantial market presence. Accordingly, economic weakness in the industrial manufacturing sector may, and in some cases has, resulted in decreased demand for certain of the Company's products, which adversely affects sales and performance. Economic weakness in the consumer market will also adversely impact the Company's performance. In the event that demand for any of the Company's products declines significantly, the Company could be required to recognize certain costs as well as asset impairment charges on long-lived assets related to those products.
Risks Related to Competition: The Company's business is subject to direct and indirect competition from both domestic and foreign firms. In particular, low cost foreign sources have created severe competitive pricing pressures. Under certain circumstances, including significant changes in U.S. and foreign currency relationships, such pricing pressures tend to reduce unit sales and/or adversely affect the Company's margins.
Risks Related to Insurance Coverage: The Company carries liability, property damage, workers' compensation, medical and other insurance policies that management considers adequate for the protection of its assets and operations. There can be no assurance, however, that the coverage limits of such policies will be adequate to cover all claims and losses. Such uncovered claims and losses could have a material adverse effect on the Company. Depending on the risk, deductibles can be as high as 5% of the loss or $500,000.
Risks Related to Raw Material and Energy Costs: Steel is the principal raw material used in the manufacture of the Company's products. The price of steel has historically fluctuated on a cyclical basis and has often depended on a variety of factors over which the Company has no control. The cost of producing the Company's products is also sensitive to the price of energy. The selling prices of the Company's products have not always increased in response to raw material, energy or other cost increases, and the Company is unable to determine to what extent, if any, it will be able to pass future cost increases through to its customers. The Company's inability to pass increased costs through to its customers could materially and adversely affect its financial condition or results of operations.
Risks Related to Stock Market Performance: Currently, the Company's U.S. defined benefit pension plan is underfunded. The Company is not required to provide additional funds to the domestic pension fund; however, the estimated future return on pension assets is insufficient to cover future obligations, creating an actuarially underfunded status. The Company could be required to fund the domestic plan in the future. The Company's UK plan, which was underfunded, required Company contributions during fiscal 2009, 2010 and 2011.
Risks Related to Acquisitions: Acquisitions involve special risks, including the potential assumption of unanticipated liabilities and contingencies, difficulty in assimilating the operations and personnel of the acquired businesses, disruption of the Company's existing business, dissipation of the Company's limited management resources, and impairment of relationships with employees and customers of the acquired business as a result of changes in ownership and management. While the Company believes that strategic acquisitions can improve its competitiveness and profitability, the failure to successfully integrate and realize the expected benefits of such acquisitions could have an adverse effect on the Company's business, financial condition and operating results.
7
Risks Related to Investor Expectations: The Company's share price suffered a significant decline in fiscal 2009 then remained relatively stable in fiscal 2010. The price rose steadily through the first three quarters of fiscal 2011 before declining in the fourth quarter. The Company's earnings may not continue to grow at rates similar to the growth rates achieved in recent years and may fall short of either a prior quarter or investors' expectations. If the Company fails to meet the expectations of securities analysts or investors, the Company's share price may decline.
Risks Related to the Company's Credit Facility: Under the Company's credit facility with TD Bank, N.A., the Company is required to comply with certain financial covenants. While the Company believes that it will be able to comply with the financial covenants in future periods, its failure to do so would result in defaults under the credit facility unless the covenants are amended or waived. An event of default under the credit facility, if not waived, could prevent additional borrowing and could result in the acceleration of the Company's indebtedness. The Credit Facility matures on April 30, 2012. The Company plans to extend the Credit Facility before maturity, however, there are no assurances the extension will be available to the Company. This could have an impact on the Company's ability to operate its business.
Risks Related to Information Systems: The efficient operation of the Company's business is dependent on its information systems, including its ability to operate them effectively and to successfully implement new technologies, systems, controls and adequate disaster recovery systems. In addition, the Company must protect the confidentiality of data of its business, employees, customers and other third parties. The failure of the Company's information systems to perform as designed or its failure to implement and operate them effectively could disrupt the Company's business or subject it to liability and thereby harm its profitability. For those reasons, the Company implemented a new Enterprise Resource Planning (ERP) system in fiscal 2010 at its principal North American locations.
Risks Related to Litigation and Changes in Laws, Regulations and Accounting Rules: Various aspects of the Company's operations are subject to federal, state, local or foreign laws, rules and regulations, any of which may change from time to time. Generally accepted accounting principles may change from time to time, as well. In addition, the Company is regularly involved in various litigation matters that arise in the ordinary course of business. Litigation, regulatory developments and changes in accounting rules and principles could adversely affect the Company's business operations and financial performance.
Item 1B – Unresolved Staff Comments
None.
Item 2 - Properties
The Company's principal plant and its corporate headquarters are located in Athol, MA on approximately 15 acres of Company-owned land. The plant consists of 25 buildings, mostly of brick construction of varying dates, with approximately 535,000 square feet.
The Company's Webber Gage Division in Cleveland, OH, owns and occupies two buildings totaling approximately 50,000 square feet.
The Company-owned facility in Mt. Airy, NC consists of one building totaling approximately 320,000 square feet. It is occupied by the Company's Saw Division, Ground Flat Stock Division and a distribution center. A separate 36,000 square foot building which formerly housed the distribution center was vacated in November 2008 and is currently listed for sale.
A manufacturing and warehousing facility in North Charleston encompassing 173,000 square feet was closed in fiscal 2005 and the building was sold in fiscal 2011.
The Company's subsidiary in Itu, Brazil owns and occupies several buildings totaling 209,000 square feet. The Company's subsidiary in Jedburgh, Scotland owns and occupies a 175,000 square foot building. A wholly owned manufacturing subsidiary in The People's Republic of China leases a 133,000 square foot building in Suzhou. In fiscal 2011, we closed a 5,000 square foot Shanghai distribution center and sales office, consolidated the distribution into the Suzhou facility and leased a new sales office in Shanghai.
8
In addition, the Company operates warehouses and/or sales-support offices in the U.S., Canada, Australia, New Zealand, Mexico, Germany, Japan and Argentina. In fiscal 2011, the company opened a new sales and distribution center in Singapore.
The Tru-Stone Division owns and occupies a 90,000 square foot facility in Waite Park, MN.
The Kinemetric Engineering Division occupies a 14,000 square foot leased facility in Laguna Hills, CA.
In the Company's opinion, all of its property, plants and equipment are in good operating condition, well maintained and adequate for its needs.
Item 3 - Legal Proceedings
The Company is, in the ordinary course of business, from time to time involved in litigation that is not considered material to its financial condition or operations.
Item 4 – Removed and Reserved
PART II
Item 5 - Market for the Company's Common Equity, Related Stockholder Matters and Issuer Purchases of Equity Securities
The Company's Class A common stock is traded on the New York Stock Exchange. Quarterly dividend and high/low closing market price information is presented in the table below. The Company's Class B common stock is generally nontransferable, except to lineal descendants, and thus has no established trading market, but it can be converted into Class A common stock at any time. The Class B common stock was issued on October 5, 1988, and the Company has paid the same dividends thereon as have been paid on the Class A common stock since that date. On June 30, 2011, there were approximately 1,488 registered holders of Class A common stock and approximately 1,227 registered holders of Class B common stock.
Quarter Ended | Dividends | High | Low | |||||||||
September 2009 | $ | 0.12 | $ | 11.18 | $ | 6.55 | ||||||
December 2009 | 0.06 | 11.75 | 8.53 | |||||||||
March 2010 | 0.06 | 11.67 | 8.74 | |||||||||
June 2010 | 0.06 | 12.56 | 7.93 | |||||||||
September 2010 | 0.06 | 12.48 | 10.00 | |||||||||
December 2010 | 0.08 | 12.88 | 10.36 | |||||||||
March 2011 | 0.08 | 14.94 | 11.38 | |||||||||
June 2011 | 0.10 | 14.32 | 10.25 | |||||||||
The Company's dividend policy is subject to periodic review by the Board of Directors. Based upon economic conditions, the Board of Directors decided to increase the quarterly dividend from $0.06 to $0.08 per share in the second quarter and from $0.08 to $0.10 per share in the fourth quarter of fiscal 2011.
9
ISSUER PURCHASES OF EQUITY SECURITIES
Summary of Stock Repurchases:
A summary of the Company's repurchases of shares of its common stock for the fourth quarter fiscal 2011 is as follows:
Period | Shares Purchased | Average Price | Shares Purchased Under Announced Programs | Shares yet to be Purchased Under Announced Programs | ||||||||||
April 2011 | None | $ | – | – | – | |||||||||
May 2011 | None | $ | – | – | – | |||||||||
June 2011 | None | $ | – | – | – | |||||||||
PERFORMANCE GRAPH
The following graph sets forth information comparing the cumulative total return to holders of the Company's Class A common stock over the last five fiscal years with (1) the cumulative total return of the Russell 2000 Index ("Russell 2000") and (2) a peer group index (the "Peer Group") reflecting the cumulative total returns of certain small cap manufacturing companies as described below. The peer group is comprised of the following companies: Acme United, Q.E.P. Co. Inc., Badger Meter, Federal Screw Works, National Presto Industries, Regal-Beloit Corp., Tecumseh Products Co., Tennant Company, The Eastern Company and WD-40.
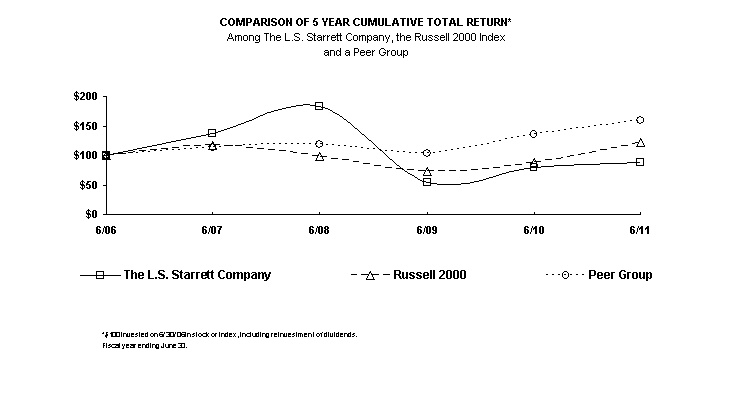
BASE | FY2007 | FY2008 | FY2009 | FY2010 | FY2011 | |||||||||||||||||||
STARRETT | 100.00 | 137.58 | 182.85 | 54.81 | 79.06 | 87.48 | ||||||||||||||||||
RUSSELL 2000 | 100.00 | 116.43 | 97.58 | 73.17 | 88.89 | 122.15 | ||||||||||||||||||
PEER GROUP | 100.00 | 113.12 | 118.51 | 102.82 | 136.13 | 158.58 | ||||||||||||||||||
10
Item 6 - Selected Financial Data
The following selected condensed financial data has been derived from and should be read in conjunction with "Management Discussion and Analysis of Financial Condition and Results of Operations" and our Consolidated Financial Statements and notes thereto, included elsewhere in this report on Form 10K and incorporated herein by reference. The table below reflects the change in pension accounting, described in Note 2, for all five fiscal years.
Years ended in June ($000 except per share data) | ||||||||||||||||||||
2011 | 2010 | 2009 | 2008 | 2007 | ||||||||||||||||
Net sales | $ | 244,841 | $ | 203,662 | $ | 203,659 | $ | 242,371 | $ | 222,356 | ||||||||||
Net earnings (loss) | 6,845 | (8,021 | ) | (23,429 | ) | 11,033 | 6,905 | |||||||||||||
Basic earnings (loss) per share | 1.02 | (1.20 | ) | (3.54 | ) | 1.68 | 1.04 | |||||||||||||
Diluted earnings (loss) per share | 1.02 | (1.20 | ) | (3.54 | ) | 1.68 | 1.04 | |||||||||||||
Long-term debt | 721 | 706 | 1,264 | 5,834 | 8,520 | |||||||||||||||
Total assets | 227,179 | 200,134 | 194,241 | 250,285 | 234,011 | |||||||||||||||
Dividends per share | 0.32 | 0.30 | 0.48 | 0.52 | 0.40 | |||||||||||||||
Items 7 and 7A- Management's Discussion and Analysis of Financial Condition and Results of Operations and Quantitative and Qualitative Disclosure about Market Risk
RESULTS OF OPERATIONS
Fiscal 2011 Compared to Fiscal 2010
As further explained in Note 2 to the consolidated financial statements in fiscal 2011, the Company changed its fiscal year end from the last Saturday in June to June 30. This change facilitated an improved closing process and conformed North American to International subsidiaries' year end. In fiscal 2010, the Company changed the fiscal year end of its International subsidiaries to that of the Company. Those subsidiaries previously reported on a one-month lag. Management has concluded that the effects of the change from a fiscal to a calendar year end and the inclusion of the additional month for its International subsidiaries in fiscal 2010 are immaterial to the consolidated financial statements.
Overview
The Company changed its method of accounting for pensions in fiscal 2011. The impact of this change is described in Note 2.
The Company began to experience an economic upturn in the second quarter of fiscal 2010. To service higher demand the Company began to increase manufacturing output, inventory raw material purchases, and selling, general, and administrative expenses globally in the third quarter of fiscal 2010. Sales increased $21.5 million or 24% in the second half of fiscal 2011 compared to the first half of fiscal 2010. Sales in the first half of 2011 were $23.7 million or 26% higher than in the first half of 2010. The Company experienced higher backorder levels in the first half of fiscal 2011 as a result of the inability to quickly adjust inventory and manufacturing staffing levels to match demand, however, this backorder position decreased in the second half of fiscal 2011.
Net sales for fiscal 2011 increased $41.1 million or 20% compared to fiscal 2010 due to global economic recovery and increased market penetration. Gross margins improved $25.4 million from $56.4 million or 28% of sales in fiscal 2010 to $81.8 million or 33% of sales in fiscal 2011. Selling, general and administrative expenses increased $6.7 million or 10% from $64.1 million in fiscal 2010 to $70.8 million in fiscal 2011. Operating income increased $21.8 million from a loss of $9.4 million in fiscal 2010 to a profit of $12.4 million in fiscal 2011.
Net Sales
Net sales in North America increased $22.6 million or 23% from $97.1 million in fiscal 2010 to $119.7 million in fiscal 2011. All divisions posted gains except Evans Rule, which lost the Sears contract in the fourth quarter of fiscal 2010. Tru-Stone and Kinemetric benefited from renewed capital equipment markets registering sales increases in fiscal 2011 of 64% and 71%, respectively, as our customers reinvested in their businesses. International sales, excluding U.S. exports, increased $18.5 million or 17% from $106.6 million in fiscal 2010 to $125.1 million in fiscal 2011. Foreign currency exchange rate fluctuations represented $8.1 million of the sales gain principally due to a weaker U.S. dollar. All International subsidiaries achieved double digit sales increases and account for over 50% of the Company's global revenues. The Company is cautiously optimistic about fiscal 2012 based upon orders through August of fiscal 2012; however, recent unfavorable economic news could have a negative impact on the year.
11
Gross Margin
Gross margin in North America increased $10.8 million or 44% from $24.5 million in fiscal 2010 to $35.3 million in fiscal 2011 and improved as a percentage of sales from 25.3% in fiscal 2010 to 29.5% in fiscal 2011. Higher sales, improved manufacturing efficiencies, and a reduction in pension cost were the key drivers in the improved margin performance. In addition, the gross margin improvement overcame an unfavorable LIFO swing of $9.5 million based upon a reduction in cost of sales of $8.5 million in fiscal 2010 to an increase in cost of sales of $1.0 million in fiscal 2011. The change in LIFO was the result of lower inventories during the recession in fiscal 2010 compared to an increase in inventories in conjunction with the economic recovery in fiscal 2011. International gross margins increased $14.6 million or 46% from $31.9 million in fiscal 2010 to $46.5 million in fiscal 2011 and improved as a percentage of sales from 30% in fiscal 2010 to 37% in fiscal 2011. Higher sales, improved manufacturing efficiencies, lower pension expense and favorable foreign exchange rates all contributed to the improved international gross margins.
Selling, General and Administrative Expenses
North American selling, general and administrative expenses increased $3.6 million or 11% but declined as a percentage of sales from 33% in fiscal 2010 to 30% in fiscal 2011. Salaries and benefits in North America increased $2.2 million in fiscal 2011 compared to fiscal 2010, principally due to the restoration of previous salary reductions, a 3% salary increase and higher medical costs. Higher sales also resulted in a $0.9 million increase in travel and commission expenses. International selling, general and administrative expenses increased $3.1 million or 10% and declined from 30% to 28% of sales. Salaries and benefits increased $2.5 million due to restoration of previous salary reductions, while increased sales resulted in a $1.3 million increase in travel and commission expenses. These expense increases were partially offset by a $2.2 million reduction in pension expense.
Operating Profit
Operating income in fiscal 2011 of $12.4 million represented a $21.8 million improvement from an operating loss of $9.4 million in fiscal 2010. Higher sales and improved margins accounted for $11.4 and $14.0 million, respectively of the $25.4 million gross margin improvement and offset the selling, general and administrative increase of $6.7 million, resulting in an $18.7 gain in operating income from operations. The net impact of combined losses related to restructuring costs and goodwill impairment of $1.7 million in fiscal 2010 compared to a $1.3 million gain on the sale of a building in fiscal 2011 represents the incremental operating profit improvement of $3.0 million.
Other Operating Income
Higher interest income was the primary factor for the $0.8 million improvement in other operating income.
Significant Fourth Quarter Activity
As shown in Note 15, the Company recorded a $4.5 million profit before taxes in the fourth quarter of fiscal 2011 compared to a comparable $1.5 million loss in fiscal 2010.
Consolidated sales increased $7.4 million or 12 % from $63.9 million in fiscal 2010 to $71.3 million in fiscal 2011 with North America representing $7.3 million of the increase. International sales increase was modest due to three months of sales in fiscal 2011 compared to four months in fiscal 2010. The four months in fiscal 2010 for International was a result of dropping the one month lag. Higher sales and improved margins generated a $5.3 million increase in gross margins which more than offset a $0.6 million increase in selling, general and administrative expenses resulting in a $4.7 million net contribution to profits. The remaining $1.5 comparative profit improvement was principally due to losses of $1.7 million related to restructuring and impairment charges in fiscal 2010 compared to no similar costs in fiscal 2011.
12
Income Taxes
The effective tax rate was 48% for fiscal 2011. The rate reflects federal, state and foreign adjustments for permanent book tax differences. The principal reason for the 8% increase over a normalized combined federal and state statutory tax rate of approximately 40% is book losses not tax benefited principally in China and the Dominican Republic as well as provisions for valuation allowances.
The effective tax rate for fiscal 2010 was 14%. The Brazilian audit settlement and losses not benefited principally in China and the Dominican Republic were the principal factors reducing the normalized benefit of 40% to 14%.
There was a $0.9 million increase in valuation allowances relating primarily to carryforwards for foreign NOL's. The Company continues to believe that it is more likely than not that it will be able to realize its domestic tax operating loss carryforward assets of approximately $8.5 million reflected on the Balance Sheet.
Fiscal 2010 Compared to Fiscal 2009
Overview
The Company began to experience the economic downturn in the second quarter of fiscal 2009 and significantly reduced its manufacturing and selling, general administrative expenses in the third quarter of fiscal 2009. These cost reductions remained in place for one year until the third quarter of fiscal 2010, when an uptick in orders resulted in restoring reduced hours to normal hours for both the factory and office personnel. The economy's cycle created significant problems in managing costs and inventory levels in fiscal 2010 compared to fiscal 2009 as first half fiscal 2010 sales declined $31.0 million, or 25%, compared to $31.1 million, or 38%, increase in the second half.
Net sales for fiscal 2010 remained level with fiscal 2009 at $203.6 million. Gross margins improved $22.5 million from $33.9 million or 16.7% of sales in fiscal 2009 to $56.4 million or 27.7% of sales in fiscal 2010. Selling, general and administrative expenses decreased $2.7 million of 4.0% from $66.8 million in fiscal 2009 to $64.1 million in fiscal 2010. The operating loss declined $28.8 million principally due to a change in accounting for pension expense which reduced cost of sales and selling, general and administrative expenses $25.3 million from $32.5 million in fiscal 2009 to $7.2 million in fiscal 2010.
Net Sales
Net sales in North America declined $5.8 million, or 5.7%, from $102.9 million in fiscal 2009 to $97.1 million in fiscal 2010. With the exception of Tru-Stone, all divisions posted declines as reduced volume from Sears impacting the Evans Rule division and the significant decline in customer capital expenditures adversely affecting the demand for Kinemetric's products. International sales increased $5.9 million, or 5.9%, from $100.7 million in fiscal 2009 to $106.6 million in fiscal 2010. Foreign currency exchange rate fluctuations represented a $4.1 million of the sales gain with a stronger Brazilian Real accounting for $5.2 million and a weaker Pound Sterling posing a $1.1 million decline.
Gross Margin
Gross margin in North America increased $29.0 million, from a negative $4.5 million in fiscal 2009 to $24.5 million in fiscal 2010. A reduction in pension expense represented $21.0 or 72% of the change. In addition, cost reductions and reduced manufacturing hours implemented in February of 2009 coupled with increased volume, particularly in the second half of fiscal 2010, represented $1.0 million while inventory reductions resulted in an additional net $4.3 million LIFO liquidation. International gross margins declined $6.5 million, from $38.4 million in fiscal 2009 to $31.9 million in fiscal 2010. A $2.2 million increase in pension expense coupled with higher fixed manufacturing costs and under absorbed overhead as a result of lower production were the prime factors influencing the gross margin decline.
13
Selling, General & Administrative Expenses
Selling, general and administrative expenses decreased $2.7 million, or 4.0%, from $66.8 million in fiscal 2009 to $64.1 million in fiscal 2010. North American expenses decreased $5.5 million, due to a $4.3 million reduction in pension expense as well as savings related to reduced salaries, travel and advertising costs of $0.9 million. International expenses increased $2.8 million, due to a $2.2 million increase in pension expense as well as higher salaries and benefits.
Operating Loss
The operating loss decreased $28.8 million from a loss of $38.2 million in fiscal 2009 to a loss of $9.4 million in fiscal 2010 principally due to a $25.3 million reduction in pension expense.
FINANCIAL INSTRUMENT MARKET RISK
Market risk is the potential change in a financial instrument's value caused by fluctuations in interest and currency exchange rates, and equity and commodity prices. The Company's operating activities expose it to risks that are continually monitored, evaluated and managed. Proper management of these risks helps reduce the likelihood of earnings volatility.
As of June 30, 2011, the Company's Scottish subsidiary held a $6.4 million six month fixed rate deposit.
The Company does not engage in tracking, market-making or other speculative activities in derivatives markets. The Company does not enter into long-term supply contracts with either fixed prices or quantities. The Company engages in an immaterial amount of hedging activity to minimize the impact of foreign currency fluctuations. Net foreign monetary assets are approximately $24.6 million as of June 30, 2011.
A 10% change in interest rates would not have a significant impact on the aggregate net fair value of the Company's interest rate sensitive financial instruments or the cash flows or future earnings associated with those financial instruments. A 10% change in interest rates would impact the fair value of the Company's fixed rate investments of $6.4 million by an immaterial amount. A 10% increase in interest rates would not have a material impact on our short-term borrowing costs. See Note 12 to the Consolidated Financial Statements for details concerning the Company's long-term debt outstanding of $0.7 million.
LIQUIDITY AND CAPITAL RESOURCES
Years ended in June ($000) | ||||||||||||
2011 | 2010 | 2009 | ||||||||||
Cash provided by operations | $ | 5,189 | $ | 29,708 | $ | 659 | ||||||
Cash provided by (used in) investing activities | (10,141 | ) | (9,011 | ) | 5,469 | |||||||
Cash provided by (used in) financing activities | 3,860 | (9,994 | ) | (1,298 | ) | |||||||
The Company has a working capital ratio of 3.9 in fiscal 2011 and 4.3 in fiscal 2010. Cash, investments, accounts receivable and inventory represent 92% of current assets in both fiscal 2011 and fiscal 2010. The Company had accounts receivable turnover of 6.3 in fiscal 2011 compared to 6.7 in fiscal 2010 and an inventory turnover ratio of 3.2 in fiscal 2011 compared to 2.7 in fiscal 2010.
Net cash provided by operations of $5.2 million in fiscal 2011 declined $24.5 million compared to fiscal 2010 due to a $24.9 million net change in inventory reflecting the economic recession in fiscal 2010 and the recovery in fiscal 2011.
The Company has invested $10.1 million in fiscal 2011. Plant and equipment and short-term investments represented a combined $12.2 million, which was partially offset by proceeds of $3.3 million from the sale of a building.
14
The Company increased short-term debt $5.5 million in fiscal 2011 compared to fiscal 2010 principally to finance higher working capital requirements.
Effects of translation rate changes on cash primarily result from the movement of the U.S. dollar against the British Pound, the Euro and the Brazilian Real. The Company uses a limited number of forward contracts to hedge some of this activity and a natural hedge strategy of paying for foreign purchases in local currency when economically advantageous.
Liquidity and Credit Arrangements
The Company believes it maintains sufficient liquidity and has the resources to fund its operations in the near term. In addition to its cash and investments, the Company has maintained a $23.0 million line of credit, of which, $0.4 million is reserved for letters of credit and $8.0 million was outstanding as of June 30, 2011.
On June 30, 2009, The L.S. Starrett Company (the "Company") and certain subsidiaries of the Company subsidiaries (the "Subsidiaries") entered into a Loan and Security Agreement (the "Credit Facility") with TD Bank, N.A., as lender.
The Credit Facility replaced the Company's previous Bank of America facility with a $23.0 million line of credit. On June 30, 2009, the Company utilized this line of credit to pay off the remaining balances on the Bank of America Reducing Revolver and Line of Credit. The interest rate under the Credit Facility is based on a grid which uses the ratio of Funded Debt/EBITDA to determine the floating margin that will be added to one-month LIBOR. The initial rate was one-month LIBOR plus 1.75%, and is currently one-month LIBOR plus 1.50%. The Credit Facility matures on April 30, 2012. The Company plans to extend this credit facility before maturity, however, there are no assurances the extension will be available to the Company.
The obligations under the Credit Facility are unsecured. However, in the event of certain triggering events, the obligations under the Credit Facility will become secured by the assets of the Company and the subsidiaries party to the Credit Facility. Triggering events are two consecutive quarters of failure to achieve the financial covenants outlined in Note 12.
Availability under the Credit Facility is subject to a borrowing base comprised of accounts receivable and inventory. The Company believes that the borrowing base will consistently produce availability under the Credit Facility in excess of $23.0 million. In addition, the Company anticipates that it will not need to fully utilize the amounts available to the Company and its subsidiaries under the Credit Facility. As of August 31, 2011, the Company had borrowings of $9.6 million under the Credit Facility.
The Credit Facility contains financial covenants with respect to leverage, tangible net worth, and interest coverage, and also contains customary affirmative and negative covenants, including limitations on indebtedness, liens, acquisitions, asset dispositions, and fundamental corporate changes, and certain customary events of default. Upon the occurrence and continuation of an event of default, the lender may terminate the revolving credit commitment and require immediate payment of the entire unpaid principal amount of the Credit Facility, accrued interest and all other obligations. As of June 30, 2011, the Company was in compliance with the financial covenants required for testing at that time under the Credit Facility.
OFF-BALANCE SHEET ARRANGEMENTS
The Company does not have any material off-balance sheet arrangements as defined under the Securities and Exchange Commission rules.
CRITICAL ACCOUNTING POLICIES and ESTIMATES
The preparation of financial statements and related disclosures in conformity with accounting principles generally accepted in the United States of America requires management to make judgments, assumptions and estimates that affect the amounts reported in the consolidated financial statements and accompanying notes. The second footnote to the Company's Consolidated Financial Statements describes the significant accounting policies and methods used in the preparation of the consolidated financial statements.
15
Judgments, assumptions, and estimates are used for, but not limited to, the allowance for doubtful accounts receivable and returned goods; inventory allowances; income tax reserves; employee turnover, discount, and return rates used to calculate pension obligations.
Future events and their effects cannot be determined with absolute certainty. Therefore, the determination of estimates requires the exercise of judgment. Actual results inevitably will differ from those estimates, and such differences may be material to the Company's Consolidated Financial Statements. The following sections describe the Company's critical accounting policies.
Revenue Recognition and Accounts Receivable : Sales of merchandise and freight billed to customers are recognized when products are delivered, title and risk of loss has passed to the customer, no significant post delivery obligations remain and collection of the resulting receivable is reasonably assured. Sales are net of provisions for cash discounts, returns, customer discounts (such as volume or trade discounts), cooperative advertising and other sales related discounts. Cooperative advertising payments made to customers are included as advertising expense in selling, general and administrative in the Consolidated Statements of Operations. While the Company does allow its customers the right to return in certain circumstances, revenue is not deferred, but rather a reserve for sales returns is provided based on experience, which historically has not been significant.
The allowance for doubtful accounts of $0.4 million and $0.6 million at the end of fiscal 2011 and 2010, respectively, is based on our assessment of the collectability of specific customer accounts and the aging of our accounts receivable. While the Company believes that the allowance for doubtful accounts is adequate, if there is a deterioration of a major customer's credit worthiness, actual defaults are higher than our previous experience, or actual future returns do not reflect historical trends, the estimates of the recoverability of the amounts due the Company and sales could be adversely affected.
Inventory Valuation : Inventory purchases and commitments are based upon future demand forecasts. If there is a sudden and significant decrease in demand for our products or there is a higher risk of inventory obsolescence because of rapidly changing technology and requirements, the Company may be required to increase the inventory reserve and, as a result, gross profit margin could be adversely affected.
Long-lived Assets and Goodwill : The Company values property, plant and equipment (PP&E) at historical cost less accumulated depreciation. Impairment losses are recorded when indicators of impairment, such as plant closures, are present and the undiscounted cash flows estimated to be generated by those assets are less than the carrying amount. The Company continually reviews for such impairment and believes that PP&E is being carried at its appropriate value.
The Company assesses the fair value of its goodwill generally based upon a discounted cash flow methodology. The discounted cash flows are estimated utilizing various assumptions regarding future revenue and expenses, working capital, terminal value, and market discount rates. If the carrying amount of the goodwill is greater than the fair value, an impairment charge is recognized to the extent the recorded goodwill exceeds the implied fair value of goodwill.
Our long-lived assets consist primarily of property, plant and equipment. The Company groups long-lived assets for impairment analysis by division and/or product line. Long-lived assets are reviewed for impairment whenever events or changes in circumstances indicate the carrying amount of such an asset may not be recoverable. Such events or circumstances include, but are not limited to, a significant decrease in the fair value of the underlying business or change in utilization of property and equipment.
Recoverability of the undepreciated cost of property, plant and equipment is measured by comparison of the carrying amount to estimated future undiscounted net cash flows the assets are expected to generate. Those cash flows include an estimated terminal value based on a hypothetical sale at the end of the assets' depreciation period. Estimating these cash flows and terminal values requires management to make judgments about the growth in demand for our products, sustainability of gross margins, and our ability to achieve economies of scale. If assets are considered to be impaired, the impairment to be recognized is measured as the amount by which the carrying amount of the long-lived asset exceeds its fair value.
16
Depreciation is included in cost of goods sold and selling, general and administrative expenses in the Consolidated Statement of Operations based upon where the assets are contributing to the measurement of cost or expense by functional area. Depreciation of equipment used in the manufacturing process is a component of inventory and included in costs of goods sold. Depreciation of equipment used for office and administrative functions is an expense in selling, general and administrative expenses.
Income Taxes : Accounting for income taxes requires estimates of future benefits and tax liabilities. Due to temporary differences in the timing of recognition of items included in income for accounting and tax purposes, deferred tax assets or liabilities are recorded to reflect the impact arising from these differences on future tax payments. With respect to recorded tax assets, the Company assesses the likelihood that the asset will be realized. If realization is in doubt because of uncertainty regarding future profitability or enacted tax rates, the Company provides a valuation allowance related to the asset. Should any significant changes in the tax law or the estimate of the necessary valuation allowance occur, the Company would record the impact of the change, which could have a material effect on our financial position or results of operations.
Defined Benefit Pension Plans: The Company has two defined benefit pension plans, one for U.S. employees and another for U.K. employees.
In 2011, we elected to retrospectively change our method of recognizing certain actuarial gains and losses. Previously, the market related value of plan assets for the U.S. plan was equal to fair value, and the market-related value of plan assets for the U.K. plan, was based on a calculated five-year moving average of market value. Actuarial gains and losses were recognized in other comprehensive income as of the measurement date. Net actuarial gains or losses in excess of ten percent (10%) of the greater of the market-related value of plan assets or of the plans' projected benefit obligation ( the corridor ) were amortized in net periodic benefit cost over the average remaining service period (fourteen-years). The primary factors contributing to actuarial gains and losses are changes in the discount rate used to value pension obligations as of the measurement date each year and the differences between expected and actual returns on plan assets.
Under our new accounting method, both plans will use fair value as the market-related value of plan assets and continue to recognize actuarial gains or losses within the corridor in other comprehensive income but instead of amortizing net actuarial gains or losses in excess of the corridor in future periods, excess gains and losses will be recognized in net periodic (benefit) cost as of the plan measurement date, which is the same as the fiscal year end of the Company ( MTM adjustment ). This change in accounting method is a permitted option which results in immediate recognition of excess net actuarial gains and losses in net periodic benefit cost instead of in other comprehensive income. Immediate recognition in net periodic benefit cost could potentially increase the volatility of net periodic benefit cost. The MTM adjustments to net periodic benefit cost for 2011, 2010 and 2009 were $0.0, $9.4, and $32.5 million, respectively. The accounting for the remaining components of net periodic pension cost, primarily service, interest costs and expected return on plan assets will be unchanged ( On-going Pension Expense ). See Note 2 to the financial statements for further details of the change and the impact of our retrospective application of the new policy.
Calculation of pension and postretirement medical costs and obligations are dependent on actuarial assumptions. These assumptions include discount rates, healthcare cost trends, inflation, salary growth, long-term return on plan assets, employee turnover rates, retirement rates, mortality and other factors. These assumptions are made based on a combination of external market factors, actual historical experience, long-term trend analysis, and an analysis of the assumptions being used by other companies with similar plans. Significant differences in actual experience or significant changes in assumptions would affect pension and other postretirement benefit costs and obligations. See also Employee Benefit Plans (Note 11 to the Consolidated Financial Statements).
Cost of Goods Sold : The Company includes material, direct and indirect labor and manufacturing overhead in cost of goods sold. Included in these costs are inbound freight, personnel (manufacturing plants only), receiving costs, internal transferring, employee benefits (including pension expense) and inspections costs.
17
Selling, General and Administrative Expenses : The Company includes distribution expenses in selling, general and administrative expenses. Distribution expenses include shipping labor and warehousing costs associated with the storage of finished goods at each manufacturing facility. The Company also includes costs for our dedicated distribution centers as selling expenses. Employee benefits, including pension expense, are also included in selling, general and administrative expenses.
CONTRACTUAL OBLIGATIONS
The following table summarizes future estimated payment obligations by period. The majority of the obligations represent commitments for production needs in the normal course of business.
Payments due by period (in millions) | ||||||||||||||||||||
Total | <1yr. | 1-3yrs. | 3-5yrs. | >5yrs. | ||||||||||||||||
Post-retirement benefit obligations | $ | 7.5 | $ | 0.7 | $ | 1.3 | $ | 1.4 | $ | 4.1 | ||||||||||
Long-term debt obligations | 1.0 | 0.3 | 0.5 | 0.2 | - | |||||||||||||||
Capital lease obligations | 1.0 | 0.3 | 0.5 | 0.2 | - | |||||||||||||||
Operating lease obligations | 4.4 | 2.0 | 2.3 | 0.1 | - | |||||||||||||||
Purchase obligations | 19.7 | 19.7 | - | - | - | |||||||||||||||
Short-term and current maturities | 8.0 | 8.0 | - | - | - | |||||||||||||||
Total | $ | 41.6 | $ | 31.0 | $ | 4.6 | $ | 1.9 | $ | 4.1 | ||||||||||
ANNUAL NYSE CEO CERTIFICATION AND SARBANES-OXLEY SECTION 302 CERTIFICATIONS
In fiscal 2011, the Company submitted an unqualified "Annual CEO Certification" to the New York Stock Exchange as required by Section 303A.12(a) of the New York Stock Exchange Listed Company Manual. Further, the Company is filing with the Securities and Exchange Commission the certifications required by Section 302 of the Sarbanes-Oxley Act of 2002 as exhibits to the Company's Annual Report on Form 10-K.
Item 8 - Financial Statements and Supplementary Data
Contents: |
|
Page |
Report of Independent Registered Public Accounting Firm |
| 19 |
Consolidated Balance Sheets |
| 20 |
Consolidated Statements of Operations |
| 21 |
Consolidated Statements of Cash Flows |
| 22 |
Consolidated Statements of Stockholders' Equity |
| 23 |
Notes to Consolidated Financial Statements |
| 24-50 |
18
REPORT OF INDEPENDENT REGISTERED PUBLIC ACCONTING FIRM
Board of Directors and Stockholders
The L.S. Starrett Company
We have audited the accompanying consolidated balance sheets of The L.S. Starrett Company and subsidiaries ("the Company") as of June 30, 2011 and June 26, 2010, and the related consolidated statements of operations, stockholders' equity, and cash flows for each of the three years in the period ended June 30, 2011. Our audits of the basic consolidated financial statements included the financial statement schedule listed in the index appearing under Item 15(a)(2). These financial statements and financial statement schedule are the responsibility of the Company's management. Our responsibility is to express an opinion on these financial statements and financial statement schedule based on our audits.
We conducted our audits in accordance with the standards of the Public Company Accounting Oversight Board (United States). Those standards require that we plan and perform the audit to obtain reasonable assurance about whether the financial statements are free of material misstatement. An audit includes examining, on a test basis, evidence supporting the amounts and disclosures in the financial statements. An audit also includes assessing the accounting principles used and significant estimates made by management, as well as evaluating the overall financial statement presentation. We believe that our audits provide a reasonable basis for our opinion.
In our opinion, the consolidated financial statements referred to above present fairly, in all material respects, the financial position of The L.S. Starrett Company and subsidiaries as of June 30, 2011 and June 26, 2010, and the results of their operations and their cash flows for each of the three years in the period ended June 30, 2011 in conformity with accounting principles generally accepted in the United States of America. Also in our opinion, the related financial statement schedule, when considered in relation to the basic consolidated financial statements taken as a whole, presents fairly, in all material respects, the information set forth therein.
As discussed in Note 2 to the consolidated financial statements, in fiscal year 2011 the Company changed its method of accounting for defined benefit pension costs. All periods presented have been retroactively adjusted for this accounting change.
We also have audited, in accordance with the standards of the Public Company Accounting Oversight Board (United States), The L.S. Starrett Company's internal control over financial reporting as of June 30, 2011, based on criteria established in Internal Control-Integrated Framework issued by the Committee of Sponsoring Organizations of the Treadway Commission (COSO) and our accompanying report dated September 13, 2011 expressed an adverse opinion on the effectiveness of the Company's internal control over financial reporting.
/s/ Grant Thornton LLP
Boston, Massachusetts
September 13, 2011
19
THE L.S. STARRETT COMPANY
Consolidated Balance Sheets
(in thousands except share data)
June 30, 2011 | June 26, 2010 | |||||||
(As Adjusted) | ||||||||
ASSETS | ||||||||
Current assets: | ||||||||
Cash | $ | 21,572 | $ | 20,478 | ||||
Investments | 6,421 | 1,250 | ||||||
Accounts receivable (less allowance for doubtful accounts of $416 and $607, respectively) | 45,567 | 33,707 | ||||||
Inventories | 58,789 | 46,156 | ||||||
Current deferred income tax asset | 6,100 | 3,300 | ||||||
Prepaid expenses and other current assets | 5,494 | 5,510 | ||||||
Total current assets | 143,943 | 110,401 | ||||||
Property, plant and equipment, net | 56,265 | 56,529 | ||||||
Property held for sale | 788 | 2,699 | ||||||
Intangible assets, net | 231 | 1,303 | ||||||
Other assets | 951 | 280 | ||||||
Long-term taxes receivable | 3,594 | 2,807 | ||||||
Long-term deferred income tax asset, net | 21,407 | 26,115 | ||||||
Total assets | $ | 227,179 | $ | 200,134 | ||||
LIABILITIES AND STOCKHOLDERS' EQUITY | ||||||||
Current liabilities: | ||||||||
Notes payable and current maturities | $ | 8,238 | $ | 2,696 | ||||
Accounts payable and accrued expenses | 22,030 | 17,740 | ||||||
Accrued salaries and wages | 7,129 | 5,037 | ||||||
Total current liabilities | 37,397 | 25,473 | ||||||
Long-term taxes payable | 10,450 | 9,132 | ||||||
Deferred income taxes | 2,806 | 2,436 | ||||||
Long-term debt | 721 | 706 | ||||||
Postretirement benefit and pension liability | 22,467 | 30,005 | ||||||
Total liabilities | 73,841 | 67,752 | ||||||
Contingencies | ||||||||
Stockholders' equity: | ||||||||
Class A common stock $1 par (20,000,000 shares authorized; 5,933,059 outstanding at June 30, 2011, 5,858,700 outstanding at June 26, 2010) | 5,933 | 5,859 | ||||||
Class B common stock $1 par (10,000,000 shares authorized; 800,868 outstanding at June 30, 2011, 821,204 outstanding at June 26, 2010) | 801 | 821 | ||||||
Additional paid-in capital | 50,863 | 50,373 | ||||||
Retained earnings | 97,702 | 93,006 | ||||||
Accumulated other comprehensive loss | (1,961 | ) | (17,677 | ) | ||||
Total stockholders' equity | 153,338 | 132,382 | ||||||
Total liabilities and stockholders' equity | $ | 227,179 | $ | 200,134 | ||||
See notes to consolidated audited financial statements
20
THE L.S. STARRETT COMPANY
Consolidated Statements of Operations
For the three years ended June 30, 2011
(in thousands except per share data)
6/30/11 | 6/26/10 | 6/27/09 | ||||||||||
(As Adjusted) | (As Adjusted) | |||||||||||
Net sales | $ | 244,841 | $ | 203,662 | $ | 203,659 | ||||||
Cost of goods sold | 163,041 | 147,290 | 169,768 | |||||||||
Gross margin | 81,800 | 56,372 | 33,891 | |||||||||
% of net sales | 33.4% | 27.7% | 16.6% | |||||||||
Selling, general and administrative expenses | 70,750 | 64,111 | 66,803 | |||||||||
Gain on sale of building | (1,350 | ) | ||||||||||
Goodwill impairment (Note 5) | - | 1,091 | 5,260 | |||||||||
Reorganization costs | - | 616 | - | |||||||||
Operating income (loss) | 12,400 | (9,446 | ) | (38,172) | ||||||||
Other income | 839 | 105 | 67 | |||||||||
Earnings (loss) earnings before income taxes | 13,239 | (9,341 | ) | (38,105) | ||||||||
Income tax expense/(benefit) | 6,394 | (1,320 | ) | (14,676) | ||||||||
Net earnings (loss) | $ | 6,845 | $ | (8,021 | ) | $ | (23,429) | |||||
Basic and diluted earnings (loss) per share | $ | 1.02 | $ | (1.20 | ) | $ | (3.54) | |||||
Average outstanding shares used in per share calculations (in thousands): | ||||||||||||
Basic | 6,698 | 6,667 | 6,622 | |||||||||
Diluted | 6,717 | 6,667 | 6,622 | |||||||||
Dividends per share | $ | 0.32 | $ | 0.30 | $ | 0.48 | ||||||
See notes to consolidated audited financial statements
21
THE L. S. STARRETT COMPANY
For the three years ended June 30, 2011
Consolidated Statements of Cash Flows
(in thousands)
6/30/11 | 6/26/10 | 6/27/09 | ||||||||||
(As Adjusted) | (As Adjusted) | |||||||||||
Cash flows from operating activities: | ||||||||||||
Net income (loss) | $ | 6,845 | $ | (8,021 | ) | $ | (23,429) | |||||
Non cash operating activities: | ||||||||||||
Gain on sale of building | (1,350 | ) | - | - | ||||||||
Depreciation | 9,351 | 10,035 | 8,649 | |||||||||
Amortization | 1,072 | 1,214 | 1,247 | |||||||||
Impairment of fixed assets | - | 747 | 52 | |||||||||
Goodwill impairment | - | 1,091 | 5,260 | |||||||||
Net long-term tax payable | 458 | (215 | ) | 604 | ||||||||
Deferred taxes | (600 | ) | (5,973 | ) | (18,488 | ) | ||||||
Unrealized transaction (gains) losses | (165 | ) | (247 | ) | 1,077 | |||||||
Retirement benefits | 732 | 9,885 | 30,464 | |||||||||
Equity loss on investment | 572 | |||||||||||
Working capital changes: | ||||||||||||
Receivables | (7,852 | ) | (6,883 | ) | 7,170 | |||||||
Inventories | (9,019 | ) | 15,903 | (4,233 | ) | |||||||
Other current assets | 153 | 2,979 | (2,759 | ) | ||||||||
Other current liabilities | 5,032 | 7,951 | (7,313 | ) | ||||||||
Prepaid pension cost and other | (40 | ) | 1,242 | 2,358 | ||||||||
Net cash provided by operating activities | 5,189 | 29,708 | 659 | |||||||||
Cash flows from investing activities: | ||||||||||||
Additions to plant and equipment | (6,772 | ) | (9,266 | ) | (9,443 | ) | ||||||
Purchase of investments | (6,631 | ) | - | (3,019 | ) | |||||||
Proceeds from sale of investments | 1,250 | 615 | 18,139 | |||||||||
Earn out paid for Kinemetric Engineering | - | (110 | ) | (208 | ) | |||||||
Investment in private software development company | (1,250 | ) | (250 | ) | - | |||||||
Proceeds from sale of building | 3,262 | - | - | |||||||||
Net cash provided by (used in) investing activities | (10,141 | ) | (9,011 | ) | 5,469 | |||||||
Cash flows from financing activities: | ||||||||||||
Proceeds from short-term borrowings | 6,878 | 14,040 | 29,518 | |||||||||
Short-term debt repayments | (1,326 | ) | (21,506 | ) | (28,603 | ) | ||||||
Proceeds from long-term borrowings | 340 | 129 | 1,188 | |||||||||
Long-term debt repayments | (372 | ) | (1,019 | ) | (552 | ) | ||||||
Common stock issued | 490 | 362 | 596 | |||||||||
Treasury shares purchased | (1 | ) | - | (263 | ) | |||||||
Dividends | (2,149 | ) | (2,000 | ) | (3,182 | ) | ||||||
Net cash provided by (used in) financing activities | 3,860 | (9,994 | ) | (1,298 | ) | |||||||
Effect of translation rate changes on cash | 2,186 | (473 | ) | (1,097 | ) | |||||||
Net increase in cash | 1,094 | 10,230 | 3,733 | |||||||||
Cash beginning of year | 20,478 | 10,248 | 6,515 | |||||||||
Cash end of year | $ | 21,572 | $ | 20,478 | $ | 10,248 | ||||||
Supplemental cash flow information: | ||||||||||||
Interest paid | $ | 255 | 1,449 | 1,127 | ||||||||
Taxes paid, net | 4,422 | 1,402 | 3,663 | |||||||||
See notes to consolidated audited financial statements
22
THE L.S. STARRETT COMPANY
For the three years ended June 30, 2011
Consolidated Statements of Stockholders' Equity
Common Stock Outstanding ($1 Par) | ||||||||||||||||||||||||
Class A | Class B | Addi tional Paid-in Capital | Retained Earnings | Accumulated Other Comprehensive Loss | Total | |||||||||||||||||||
Balance, June 28, 2008 (As Adjusted) | $ | 5,708 | $ | 906 | $ | 49,613 | $ | 129,638 | $ | 908 | $ | 186,773 | ||||||||||||
Comprehensive income: | ||||||||||||||||||||||||
Net loss | (23,429 | ) | (23,429 | ) | ||||||||||||||||||||
Unrealized net gain on investments and swap agreement | 339 | 339 | ||||||||||||||||||||||
Minimum pension liability, net | (3,869 | ) | (3,869 | ) | ||||||||||||||||||||
Translation loss, net | (14,150 | ) | (14,150 | ) | ||||||||||||||||||||
Total comprehensive loss | (41,109 | ) | ||||||||||||||||||||||
Dividends ($0.48 per share) | (3,182 | ) | (3,182 | ) | ||||||||||||||||||||
Treasury shares: | ||||||||||||||||||||||||
Purchased | (26 | ) | – | (237 | ) | (263 | ) | |||||||||||||||||
Issued | 44 | – | 480 | 524 | ||||||||||||||||||||
Issuance of stock under ESPP | – | 7 | 128 | 135 | ||||||||||||||||||||
Conversion | 44 | (44 | ) | – | ||||||||||||||||||||
Balance, June 27, 2009 (As Adjusted) | $ | 5,770 | $ | 869 | $ | 49,984 | $ | 103,027 | $ | (16,772 | ) | $ | 142,878 | |||||||||||
Comprehensive loss: | ||||||||||||||||||||||||
Net loss | (8,021 | ) | (8,021 | ) | ||||||||||||||||||||
Unrealized net gain on investments | 2 | 2 | ||||||||||||||||||||||
Minimum pension liability, net | (3,444 | ) | (3,444 | ) | ||||||||||||||||||||
Translation gain, net | 2,537 | 2,537 | ||||||||||||||||||||||
Total comprehensive loss | (8,926 | ) | ||||||||||||||||||||||
Dividends ($0.30 per share) | (2,000 | ) | (2,000 | ) | ||||||||||||||||||||
Treasury shares: | ||||||||||||||||||||||||
Issued | 38 | – | 302 | 340 | ||||||||||||||||||||
Issuance of stock under ESPP | – | 3 | 87 | 90 | ||||||||||||||||||||
Conversion | 51 | (51 | ) | – | ||||||||||||||||||||
Balance, June 26, 2010 (As Adjusted) | $ | 5,859 | $ | 821 | $ | 50,373 | $ | 93,006 | $ | (17,677 | ) | $ | 132,382 | |||||||||||
Comprehensive loss: | ||||||||||||||||||||||||
Net earnings | 6,845 | 6,845 | ||||||||||||||||||||||
Minimum pension liability, net | 5,938 | 5,938 | ||||||||||||||||||||||
Translation gain, net | 9,778 | 9,778 | ||||||||||||||||||||||
Total comprehensive income (loss) | 22,561 | |||||||||||||||||||||||
Dividends ($0.32 per share) | (2,149 | ) | (2,149 | ) | ||||||||||||||||||||
Treasury shares: | ||||||||||||||||||||||||
Purchased | – | – | (1 | ) | (1 | ) | ||||||||||||||||||
Issued | 21 | – | 209 | 230 | ||||||||||||||||||||
Issuance of stock under ESPP | – | 33 | 282 | 315 | ||||||||||||||||||||
Conversion | 53 | (53 | ) | – | - | |||||||||||||||||||
Balance, June 30, 2011 | $ | 5,933 | $ | 801 | $ | 50,863 | $ | 97,702 | $ | (1,961 | ) | $ | 153,338 | |||||||||||
Cumulative balance: | ||||||||||||||||||||||||
Translation loss | $ | (1,230 | ) | |||||||||||||||||||||
Amount not recognized as a component of net periodic benefit cost | (731 | ) | ||||||||||||||||||||||
| $ | (1,961 | ) | ||||||||||||||||||||||
See notes to consolidated audited financial statements
23
THE L.S. STARRETT COMPANY
Notes to Consolidated Financial Statements
1. DESCRIPTION OF BUSINESS
The L. S. Starrett Company (the "Company") is in the business of manufacturing industrial, professional and consumer measuring and cutting tools and related products. The largest consumer of these products is the metalworking industry, but others include automotive, aviation, marine, farm, do-it-yourselfers and tradesmen such as builders, carpenters, plumbers and electricians.
2. SIGNIFICANT ACCOUNTING POLICIES
Principles of consolidation : The consolidated financial statements include the accounts of The L. S. Starrett Company and its subsidiaries, all of which are wholly-owned. All significant intercompany items have been eliminated. The Company's fiscal year ends on June 30 but previously ended on the last Saturday in June. Fiscal years 2011, 2010 and 2009 represent 52 week years. The fiscal years of the Company's major foreign subsidiaries previously ended in May for fiscal 2009 and prior. Based upon technology improvements related to the Company's new ERP system as well as management's desire for a common financial reporting schedule, the Company eliminated the one month lag in fiscal 2010. The change in reporting for the international subsidiaries was not considered material to the Company's results of operations, therefore prior periods have not been restated.
Financial instruments and derivatives : The Company's financial instruments consist primarily of cash, investments and receivables, current liabilities and long term debt. Current assets and liabilities, except investments, are stated at cost, which approximates fair market value. Long-term debts, which are at current market interest rates, also approximate fair market value. On June 30, 2009, the Company entered into a new Loan and Security Agreement with TD Bank, N.A. and paid off its Reducing Revolver with Bank of America. The Company's U.K. subsidiary entered into various forward exchange contracts during fiscal 2011. The amount of contracts outstanding as of June 30, 2011 and June 30, 2010 (foreign subsidiary year-end) amounted to $10.7 million and $11.8 million (dollar equivalent), respectively. The values of these contracts do not differ materially from the corresponding payables.
Accounts receivable : Accounts receivable consist of trade receivables from customers. The expense for bad debts amounted to $0.3, $0.1, and $0.5 million in fiscal 2011, 2010 and 2009, respectively. In establishing the allowance for doubtful accounts, management considers historical losses, the aging of receivables and existing economic conditions.
Inventories : Inventories are stated at the lower of cost or market. Substantially, all United States inventories are valued using the LIFO method of accounting. All non-U.S. subsidiaries use the FIFO method or the average cost method, as LIFO is not an accepted method of inventory valuation outside the U.S.
Long-lived assets : Buildings and equipment are depreciated using straight-line and accelerated methods over estimated useful lives as follows: buildings and building improvements 10 to 50 years, machinery and equipment 3 to 12 years. Leases are capitalized under the criteria set forth in ASC 840, "Leases" which establishes the four criteria of a capital lease. At least one of the four following criteria must be met for a lease to be considered a capital lease: a transfer of ownership of the property to the lessee by the end of the lease term; a bargain purchase option; a lease term that is greater than or equal to 75 percent of the economic life of the leased property; present value of the future minimum lease payments equals or exceeds 90 percent of the fair market value of the leased property. If none of the aforementioned criteria are met, the lease will be an operating lease. Long-lived assets to be disposed of are reported at the lower of carrying amount or fair value less cost to sell. A gain or loss is recorded on individual fixed assets when retired or disposed of. Included in buildings and building improvements and machinery and equipment at June 30, 2011 and June 26, 2010 were $5.0 million and $4.3 million, respectively, of construction in progress. Also included in machinery and equipment at June 30, 2011 and June 26, 2010 were $0.5 million and $0.5, respectively, of capitalized interest cost. Repairs and maintenance of equipment are expensed as incurred.
24
Intangible assets and goodwil l: Intangibles are recorded at cost and are amortized on a straight-line basis over a 5 year period. Patents are amortized over a 15 year basis. Goodwill represents costs in excess of fair values assigned to the underlying net assets of acquired businesses. Goodwill is not subject to amortization but is tested for impairment annually and at any time when events suggest impairment may have occurred. The Company assesses the fair value of its goodwill using impairment tests, generally based upon a discounted cash flow methodology. The discounted cash flows are estimated utilizing various assumptions regarding future revenue and expenses, working capital, terminal value and market discount rates. In the event that the carrying value of goodwill exceeds the fair value of the goodwill, an impairment loss would be recorded for the amount of that excess. There was no goodwill recorded as of June 30, 2011 and June 26, 2010.
Revenue recognition : Sales of merchandise and freight billed to customers are recognized when title and risk of loss has passed to the customer, no significant post delivery obligations remain and collection of the resulting receivable is reasonably assured. Sales are presented net of provisions for cash discounts, returns, customer discounts (such as volume or trade discounts), cooperative advertising and other sales related discounts. Cooperative advertising payments made to customers are included as advertising expense in selling, general and administrative in the Consolidated Statements of Operations. While the Company does allow its customers the right to return in certain circumstances, revenue is not deferred, but rather a reserve for sales returns is provided based on experience, which historically has not been significant.
Advertising costs : The Company's policy is to generally expense advertising costs as incurred, except catalogs costs, which are deferred until mailed. Advertising costs were expensed as follows: $5.1 million in fiscal 2011, $5.0 million in fiscal 2010 and $4.6 million in fiscal 2009.
Freight costs : The cost of outbound freight absorbed by the Company for customers or the cost for inbound freight included in material purchase cost are both included in cost of sales.
Warranty expense : The Company's warranty obligation is generally one year from shipment to the end user and is affected by product failure rates, material usage, and service delivery costs incurred in correcting a product failure. Any such failures tend to occur soon after shipment. Historically, the Company has not incurred significant warranty expense and consequently its warranty reserves are not material. In the event a material warranty liability is deemed probable, a reserve will be established for the event.
Pension and Other Postretirement Benefits:
The Company has two defined benefit pension plans, one for U.S. employees and another for U.K. employees. The Company also has defined contribution plans. In addition, certain U.S. employees participate in an Employee Stock Ownership Plan (ESOP).
The Company sponsors both funded and unfunded U.S. and non-U.S. defined benefit pension plans covering the majority of our U.S. employees and U.K. retirees. The Company also sponsors postretirement benefit plans that provide health care benefits and life insurance coverage to eligible U.S. retirees. In 2011, the Company elected to change our method of recognizing certain actuarial gains and losses. Previously, the market related value of plan assets for the U.S. plan was equal to fair value, and the market-related value of plan assets for the U.K. plan, was based on a calculated five-year moving average of market value. Actuarial gains and losses were recognized in other comprehensive income as of the measurement date. Net actuarial gains or losses in excess of ten percent (10%) of the greater of the market-related value of plan assets or of the plans' projected benefit obligation ( the corridor ) were amortized in net periodic benefit cost over the average remaining service period (currently fourteen-years). The primary factors contributing to actuarial gains and losses are changes in the discount rate used to value pension obligations as of the measurement date each year and the differences between expected and actual returns on plan assets.
Under the Company's new accounting method, both plans will use fair value as the market-related value of plan assets and continue to recognize actuarial gains or losses within the corridor in other comprehensive income but instead of amortizing net actuarial gains or losses in excess of the corridor in future periods, excess gains and losses will be recognized in net periodic (benefit) cost as of the plan measurement date, which is the same as the fiscal year end of the Company ( MTM adjustment ). This change in accounting method is a permitted option which results in immediate recognition of excess net actuarial gains and losses in net periodic benefit cost instead of in other comprehensive income. Immediate recognition in net periodic benefit cost could potentially increase the volatility of net periodic benefit cost. The MTM adjustments to net periodic benefit cost for 2011, 2010 and 2009 were $0.0, $9.4, and $32.5 million, respectively. The accounting for the remaining components of net periodic pension cost, primarily service, interest costs and expected return on plan assets will be unchanged ( On-going Pension Expense).
25
This change has been reported through retrospective application of the new policy to all periods presented. The impacts of all adjustments made to the consolidated financial statements are summarized below (in thousands, except per share):
Year Ended June 26, 2010 | Year Ended June 27, 2009 | |||||||||||||||||||||||
Previously Reported | Effect of Change | As Adjusted | Previously Reported | Effect of Change | As Adjusted | |||||||||||||||||||
Consolidated Statement of Operations | ||||||||||||||||||||||||
Cost of goods sold | $ | 142,660 | $ | 4,630 | $ | 147,290 | $ | 144,115 | $ | 25,653 | $ | 169,768 | ||||||||||||
Selling, general and administrative expenses | 61,525 | 2,586 | 64,111 | 59,904 | 6,899 | 66,803 | ||||||||||||||||||
(Loss) before income taxes | (2,125 | ) | (7,216 | ) | (9,341 | ) | (5,553 | ) | (32,552 | ) | (38,105 | ) | ||||||||||||
Tax expense (benefit) | 858 | (2,178 | ) | (1,320 | ) | (2,333 | ) | (12,343 | ) | (14,676 | ) | |||||||||||||
Net income/(loss) | (2,983 | ) | (5,038 | ) | (8,021 | ) | (3,220 | ) | (20,209 | ) | (23,429 | ) | ||||||||||||
Basic and diluted (loss) per share | (0.45 | ) | (0.75 | ) | (1.20 | ) | (0.49 | ) | (3.05 | ) | (3.54 | ) | ||||||||||||
Consolidated Balance Sheet | ||||||||||||||||||||||||
Retained earnings | 122,724 | (29,718 | ) | 93,006 | 127,707 | (24,680 | ) | 103,027 | ||||||||||||||||
Accumulated other comprehensive income/(loss) | (47,395 | ) | 29,718 | (17,677 | ) | (41,452 | ) | 24,680 | (16,772 | ) | ||||||||||||||
Total stockholders' equity | 132,382 | - | 132,382 | 142,878 | - | 142,878 | ||||||||||||||||||
Total liabilities and stockholders' equity | 200,134 | - | 200,134 | 194,241 | - | 194,241 | ||||||||||||||||||
Consolidated Statement of Cash Flows | ||||||||||||||||||||||||
Cash flows from operating activities: | ||||||||||||||||||||||||
Net (loss) | (2,983 | ) | (5,038 | ) | (8,021 | ) | (3,220 | ) | (20,209 | ) | (23,429 | ) | ||||||||||||
Deferred taxes | (3,795 | ) | (2,178 | ) | (5,973 | ) | (6,145 | ) | (12,343 | ) | (18,488 | ) | ||||||||||||
Retirement benefits | 2,669 | 7,216 | 9,885 | (2,088 | ) | 32,552 | 30,464 | |||||||||||||||||
Consolidated Statement of Stockholders' Equity | ||||||||||||||||||||||||
Retained earnings | ||||||||||||||||||||||||
Beginning balance | 127,707 | (24,680 | ) | 103,027 | 134,109 | (4,471 | ) | 129,638 | ||||||||||||||||
Net (loss) | (2,983 | ) | (5,038 | ) | (8,021 | ) | (3,220 | ) | (20,209 | ) | (23,429 | ) | ||||||||||||
Ending balance | 122,724 | (29,718 | ) | 93,006 | 127,707 | (24,680 | ) | 103,027 | ||||||||||||||||
Accumulated other comprehensive income/(loss) | ||||||||||||||||||||||||
Beginning balance | (41,452 | ) | 24,680 | (16,772 | ) | (3,563 | ) | 4,471 | 908 | |||||||||||||||
Minimum pension liability, net | (8,192 | ) | 4,748 | (3,444 | ) | (23,804 | ) | 19,935 | (3,869 | ) | ||||||||||||||
Net translation gain (loss) | 2,247 | 290 | 2,537 | (14,424 | ) | 274 | (14,150 | ) | ||||||||||||||||
Ending balance | (47,395 | ) | 29,718 | (17,677 | ) | (41,452 | ) | 24,680 | (16,772 | ) | ||||||||||||||
Total stockholders' equity | 132,382 | - | 132,382 | 142,878 | - | 142,878 | ||||||||||||||||||
26
Income taxes : Deferred tax expense results from differences in the timing of certain transactions for financial reporting and tax purposes. Deferred taxes have not been recorded on approximately $67.1 million of undistributed earnings of foreign subsidiaries as of June 30, 2011 or the related unrealized translation adjustments because such amounts are considered permanently invested. In addition, it is possible that remittance taxes, if any, would be reduced by U.S. foreign tax credits. Valuation allowances are recognized if, based on the available evidence, it is more likely than not that some portion of the deferred tax assets will not be realized.
Sales and use tax : Sales and use tax is recorded as incurred and represents a cost of certain purchased materials.
Research and development : Research and development costs were expensed as follows: $1.5 million in fiscal 2011, $0.9 million in fiscal 2010 and $1.6 million in fiscal 2009.
Earnings per share (EPS) : Basic EPS excludes dilution and is computed by dividing earnings available to common shareholders by the weighted average number of common shares outstanding for the period. Diluted EPS reflects the potential dilution by securities that could share in the earnings. The Company had 19,236, 12,687, and 5,501 of potentially dilutive common shares in fiscal 2011, 2010 and 2009, respectively, resulting from shares issuable under its stock option plan. For fiscal year 2011, these shares had no impact on the calculated per share amounts due to their magnitude. These additional shares are not used for the diluted EPS calculation in loss years.
Translation of foreign currencies : Assets and liabilities are translated at exchange rates in effect on reporting dates, and income and expense items are translated at average rates or rates in effect on transaction dates as appropriate. The resulting differences of translating assets and liabilities due to changing exchange rates are charged or credited directly to the "Accumulated Other Comprehensive Loss" account included as part of stockholders' equity.
Use of accounting estimates : The preparation of the financial statements in conformity with accounting principles generally accepted in the U.S. requires management to make estimates and assumptions that affect the reported amounts of assets and liabilities at the date of the financial statements and the reported amounts of sales and expenses during the reporting period. Judgments, assumptions and estimates are used for, but not limited to, the allowance for doubtful accounts receivable and returned goods; inventory allowances; income tax reserves; employee turnover, discount, and return rates used to calculate pension obligations; normal expense accruals such as workers compensation and employee medical expenses. Amounts ultimately realized could differ from those estimates.
Treasury stock: Treasury stock is accounted for using the par value method. The number of treasury shares held by the Company at June 30, 2011 and June 26, 2010 was 1,668,945 and 1,689,870 respectively.
Other : Accounts payable and accrued expenses at June 30, 2011 and June 26, 2010 consist primarily of accounts payable ($13.1 million and $13.0 million), accrued benefits ($0.9 million and $1.2 million) and accrued taxes other than income ($3.1 million and $1.2 million) and accrued expenses and other ($4.9 million and $2.3 million).
Reclassifications: Certain reclassifications have been made to the prior periods as a result of the current year presentation with no effect on net earnings.
3. CASH AND INVESTMENTS
As of June 30, 2011, the company's U.K. subsidiary held a $6.4 million six month fixed rate deposit.
The investments at June 26, 2010 are AAA rated Puerto Rico debt obligations that had maturities less than one year. On July 1, 2010, these bonds were redeemed at face value. Cash and investments held in foreign locations amounted to $18.9 million and $16.2 million at June 30, 2011 and June 26, 2010, respectively. Of this amount, $4.1 million in U.S. dollar equivalents were held in British Pound Sterling and $10.5 million in U.S. dollar equivalents were held in Brazilian Real.
27
On October 1, 2008, the Company adopted ASC 820 "Fair Value Measurements", which defines and establishes a framework for measuring fair value and expands disclosures about fair value instruments. In accordance with ASC 820, the Company has categorized its financial assets, based on the priority of the inputs to the valuation technique, into a three-level fair value hierarchy as set forth below. The Company does not have any financial liabilities that are required to be measured at fair value on a recurring basis. If the inputs used to measure the financial instruments fall within different levels of the hierarchy, the categorization is based on the lowest level input that is significant to the fair value measurement of the instrument.
Financial assets recorded on the balance sheets are categorized based on the inputs to the valuation techniques as follows:
o | Level 1 – Financial assets whose values are based on unadjusted quoted prices for identical assets or liabilities in an active market which the company has the ability to access at the measurement date (examples include active exchange-traded equity securities and most U.S. Government and agency securities). |
o | Level 2 – Financial assets whose value are based on quoted market prices in markets where trading occurs infrequently or whose values are based on quoted prices of instruments with similar attributes in active markets. |
o | Level 3 – Financial assets whose values are based on prices or valuation techniques that require inputs that are both unobservable and significant to the overall fair value measurement. These inputs reflect management's own view about the assumptions a market participant would use in pricing the asset. |
As of June 30, 2011 and June 26, 2010, the Company's Level 1 financial assets were as follows (in thousands):
Level 1 | ||||||||
6/30/2011 | 6/26/2010 | |||||||
Six Month Fixed Rate | $ | 6,421 | $ | - | ||||
International Bonds (Puerto Rican debt obligations) | - | 1,250 | ||||||
Total | $ | 6,421 | $ | 1,250 | ||||
28
4. INVENTORY
Inventory consists of the following (in thousands):
June 30, 2011 | June 26, 2010 | |||||||
Raw Material and Supplies | $ | 31,928 | $ | 27,251 | ||||
Goods in Process and Finished Parts | 23,938 | 19,136 | ||||||
Finished Goods | 29,096 | 24,960 | ||||||
| 84,962 | 71,347 | |||||||
LIFO Reserve | (26,173 | ) | (25,191 | ) | ||||
Net Inventory | $ | 58,789 | 46,156 | |||||
LIFO inventories were $15.4 million and $12.3 million at June 30, 2011 and June 26, 2010, respectively, such amounts being approximately $26.2 million and $25.2 million respectively, less than if determined on a FIFO basis. The use of LIFO, as compared to FIFO, on an annual basis resulted in a $1.0 million increase in cost of sales in fiscal 2011 compared to a $8.5 million reduction in cost of sales in fiscal 2010.
5. GOODWILL AND INTANGIBLES
The Company performed its annual goodwill impairment test for Kinemetric as of June 26, 2010. During the second quarter 2010, the Company investigated whether there was a triggering event that would cause the Company to reevaluate impairment of goodwill and intangible assets as outlined in the accounting standard for goodwill and intangible assets. The Company determined that there was a triggering event during the second quarter 2010 relating to the $1.1 million of goodwill on the acquisition of Kinemetric, which is the only reporting unit with goodwill. The triggering event was the result of a decline in quarterly sales and the outlook for the markets served. The Company performed the step one evaluation of the carrying value and tangible book value at Kinemetric using a discounted cash flow methodology, which resulted in an implied fair value of $2.4 million, which was greater than the carrying value of $1.5 million; therefore no impairment write-down was required. The Company also concluded that there was no impairment related to Kinemetric's long lived tangible assets, based upon undiscounted cash flow projections.
Due to continued declines in Kinemetric's results during the fourth quarter of fiscal year 2010, an impairment review was again performed on its long-lived assets and its goodwill. Based on the undiscounted cash flow projections, the carrying value of the long lived assets was deemed to be recoverable; accordingly, no impairment write-down was necessary. Projections of cash flow were generated for this asset group utilizing estimates from sales, operations, and finance to arrive at the projected cash flows.
To estimate the fair value of its Kinemetric reporting unit, the Company utilized an income approach. The income approach, specifically a discounted cash flow methodology, included assumptions for, among other factors, forecasted revenues, gross profit margins, operating profit margins, working capital cash flow, perpetual growth rates and long term discount rates, all of which require significant judgments by management. These assumptions take into account the current recessionary environment and its impact on the Company's business. In addition, the Company utilized a discount rate appropriate to compensate for the additional risk in the equity markets regarding the Company's future cash flows in order to arrive at a control premium considered supportable based upon historical comparable transactions.
As the carrying value of Kinemetric exceeded its estimated fair value as of June 26, 2010, the Company performed the second step of the impairment analysis. Step two of the impairment test requires the Company estimate the fair value of the reporting unit's assets and liabilities, including identifiable intangible assets, and compare the implied fair value of goodwill to its carrying value. The results of step two indicated that goodwill in the Kinemetric reporting unit was fully impaired, resulting in a $1.1 million impairment recorded in the fourth quarter. The impairment charge was primarily the result of continued sales declines and the decline in the forecasted cash flows expected by the Company.
29
The Company performed its annual goodwill impairment test for Tru-Stone as of June 28, 2008, which resulted in an implied fair value greater than its carrying value. As noted in the Company's second quarter fiscal year 2009 Form 10-Q, a triggering event occurred during the second quarter relating to the $5.3 million of goodwill resulting from the acquisition of Tru-Stone. Based upon the Company's analysis, it was determined that the implied fair value of the goodwill associated with Tru-Stone continued to be greater than its carrying value of $5.3 million.
Due to continued declines in Tru-Stone's results during the third quarter of fiscal year 2009, an impairment review was performed on its long-lived assets and its goodwill. Based on the undiscounted cash flows projection, the carrying value of the long lived assets was deemed to be recoverable; accordingly, no impairment write-down was necessary. Projections of cash flow were generated for this asset group utilizing estimates from sales, operations, and finance to arrive at the projected cash flows. A significant drop in sales growth rates could result in a future impairment charge.
To estimate the fair value of its Tru-Stone reporting unit, the Company utilized a combination of income and market approaches. The income approach, specifically a discounted cash flow methodology, included assumptions for, among other factors, forecasted revenues, gross profit margins, operating profit margins, working capital cash flow, perpetual growth rates and long term discount rates, all of which require significant judgments by management. These assumptions take into account the current recessionary environment and its impact on the Company's business. In addition, the Company utilized a discount rate appropriate to compensate for the additional risk in the equity markets regarding the Company's future cash flows in order to arrive at a control premium considered supportable based upon historical comparable transactions.
As the carrying value of Tru-Stone exceeded its estimated fair value as of March 28, 2009, the Company performed the second step of the impairment analysis for Tru-Stone. Step two of the impairment test requires the Company to estimate the fair value of the reporting unit's assets and liabilities, including identifiable intangible assets, and compare the implied fair value of goodwill to its carrying value. The results of step two indicated that the goodwill in Tru-Stone's reporting unit was fully impaired, resulting in a $5.3 million impairment recorded in the third quarter. Both step one and step two were performed by an independent third party appraiser under the supervision of management. This impairment charge was due primarily to the combination of a decline in the market capitalization of the Company at March 28, 2009 and the decline in the estimated forecasted discounted cash flows expected by the Company.
As a result of the impairment described here, no goodwill balance remained as of June 30, 2011 and June 26, 2010.
The following tables present information about the Company's intangible assets on the dates or for the periods indicated (in thousands):
As of June 30, 2011 | As of June 26, 2010 | |||||||||||||||||||||||
Cost | Accumulated Amortization | Net | Cost | Accumulated Amortization | Net | |||||||||||||||||||
Other Intangible Assets | $ | 6,276 | $ | (6,045 | ) | $ | 231 | $ | 6,276 | $ | (4,973 | ) | $ | 1,303 | ||||||||||
The estimated amortization of intangible assets is $188 thousand for fiscal 2012 and $44 thousand for fiscal 2013.
6. ACQUISITIONS AND INVESTMENTS
The Company entered into an investment agreement with a private software development company in the fourth quarter of fiscal 2010. Under the agreement, the Company would invest $1.5 million over the subsequent twelve to eighteen months in exchange for 36% equity in the software development company. The Company has invested $1.5 million through the end of fiscal 2011 and has recorded a $0.5 million loss under the equity method of accounting, which is included in fiscal 2011 in other income (expense) in the Consolidated Statement of Operations. The $1.0 million net carrying value of the investment as of June 30, 2011 is included in other long term assets in the Consolidated Balance Sheet. In August 2011, the Company guaranteed a loan of $500,000 between the private software development company and a lender.
30
7. PROPERTY, PLANT AND EQUIPMENT (in thousands):
As of June 30, 2011 | ||||||||||||
Cost | Accumulated Depreciation | Net | ||||||||||
Land | $ | 1,444 | $ | - | $ | 1,444 | ||||||
Buildings and building improvements | 43,289 | (22,765 | ) | 20,524 | ||||||||
Machinery and equipment | 144,799 | (110,502 | ) | 34,297 | ||||||||
Total | $ | 189,532 | $ | (133,267 | ) | $ | 56,265 | |||||
As of June 26, 2010 | ||||||||||||
Cost | Accumulated Depreciation | Net | ||||||||||
Land | $ | 1,410 | $ | - | $ | 1,410 | ||||||
Buildings and building improvements | 40,978 | (20,777 | ) | 20,201 | ||||||||
Machinery and equipment | 135,084 | (100,166 | ) | 34,918 | ||||||||
Total | $ | 177,472 | $ | (120,943 | ) | $ | 56,529 | |||||
Property held for sale for fiscal 2011 represents a building in Mt. Airy, NC. Included in machinery and equipment are capital leases of $0.9 million as of June 30, 2011 and $0.9 million as of June 26, 2010 relating to domestic and Brazilian operations (Note 12). The accumulated amortization relating to these leases was $1.0 million and $0.7 million for fiscal 2011 and 2010, respectively. This equipment primarily represents factory machinery in its main plants. Operating lease expense was $1.5 million, $1.9 million and $1.6 million in fiscal 2011, 2010 and 2009, respectively. Operating lease payments for the next 5 years are as follows:
Year | In millions | |
2012 | 2.0 | |
2013 | 1.4 | |
2014 | 0.8 | |
2015 | 0.1 | |
2016 | - | |
Thereafter | - |
8. REORGANIZATIONS COSTS
In May of 2010, Sears informed the Company it would no longer be purchasing "Craftsman" brand measuring tapes from the Company's Evans Rule subsidiary. Evans Rule was the leading supplier of measuring tapes to Sears for over 30 years. As a result of Sears' decision, the Company incurred an inventory write-off of approximately $2.0 million, which was included in the Cost of Goods Sold on the Consolidated Statement of Operations for 2010. Also in 2010, the Company determined $0.6 million of long-lived equipment was impaired by comparing undiscounted cash flows to carrying value. This adjustment was reported as Reorganization costs on the Consolidated Statement of Operations. Sears represented net sales of $0, $4.5 million, and $8.2 million in fiscal years 2011, 2010 and 2009, respectively. Management also performed an impairment analysis of remaining Evans Rule assets and determined no further impairment provision was necessary.
31
9. OTHER INCOME AND EXPENSE
Other income and expense consists of the following (in thousands):
2011 | 2010 | 2009 | ||||||||||
Interest income | $ | 1,495 | $ | 334 | $ | 716 | ||||||
Interest expense and commitment fees | (257 | ) | (484 | ) | (844 | ) | ||||||
Foreign currency gain (loss), net | (748 | ) | (67 | ) | 383 | |||||||
Other income (expense) | 349 | 322 | (188 | ) | ||||||||
$ | 839 | $ | 105 | $ | 67 | |||||||
10. INCOME TAXES
Components of income (loss) before income taxes (in thousands):
2011 | 2010 | 2009 | ||||||||||
Domestic operations | $ | (413 | ) | $ | (7,295 | ) | $ | (47,968 | ) | |||
Foreign operations | 13,652 | (2,046 | ) | 9,863 | ||||||||
$ | 13,239 | $ | (9,341 | ) | $ | (38,105 | ) | |||||
The amount of domestic taxable income (loss) (in thousands) for fiscal 2011, 2010 and 2009 amounted to $6,841, $(7,193) and $(14,709), respectively.
The provision (benefit) for income taxes consists of the following (in thousands):
2011 | 2010 | 2009 | ||||||||||
Current: | ||||||||||||
Federal | $ | 12 | $ | - | $ | 442 | ||||||
Foreign | 6,818 | 3,699 | 3,293 | |||||||||
State | 164 | 30 | 77 | |||||||||
Deferred | ||||||||||||
Federal | (177 | ) | (815 | ) | (16,148 | ) | ||||||
Foreign | (331 | ) | (4,112 | ) | (397 | ) | ||||||
State | (92 | ) | (122 | ) | (1,943 | ) | ||||||
$ | 6,394 | $ | (1,320 | ) | $ | (14,676 | ) | |||||
A reconciliation of expected tax expense at the U.S. statutory rate to actual tax expense is as follows (in thousands):
2011 | 2010 | 2009 | ||||||||||
Expected tax expense (benefit) | $ | 4,501 | $ | (3,176 | ) | $ | (12,956 | ) | ||||
Increase (decrease) from: | ||||||||||||
State taxes, net of federal benefit | (32 | ) | (255 | ) | (1,757 | ) | ||||||
Foreign taxes, net of federal credits | (227 | ) | (76 | ) | (319 | ) | ||||||
Change in valuation allowance | 908 | 181 | (308 | ) | ||||||||
Return to provision and tax reserve adjustments (including Brazil tax settlement in fiscal 2010) | 246 | 759 | 298 | |||||||||
Foreign losses not benefited | 771 | 1,042 | 295 | |||||||||
Other permanent items | 227 | 205 | 71 | |||||||||
Actual tax expense (benefit) | $ | 6,394 | $ | (1,320 | ) | $ | (14,676 | ) | ||||
32
No valuation allowance has been recorded for the domestic federal NOL. The Company believes the domestic liability for uncertain tax positions along with certain tax planning opportunities eliminate the need for any valuation allowance. Specifically, the Company has tax planning strategies available that would generate $26.2 million of taxable income related to dis-electing the LIFO method of inventory valuation.
Conversely, a valuation allowance was provided in fiscal 2006 on state NOL's as a result of much shorter carryforward periods and the uncertainty of generating adequate taxable income at the state level. This valuation allowance has remained through fiscal 2011. Similarly, a valuation allowance has been provided on certain foreign NOL's due to the uncertainty of generating future taxable income. Lastly, a valuation allowance has been provided for foreign tax credit carryforwards due to the uncertainty of generating sufficient foreign source income in the future. The need for any valuation allowance on the domestic federal NOL and the continued need for allowance on state and foreign NOL's and tax credits will be reevaluated periodically in the future as certain facts and assumptions change over time.
Deferred income taxes at June 30, 2011 and June 26, 2010 are attributable to the following (in thousands):
2011 | 2010 | |||||||
Deferred assets (current): | ||||||||
Inventories | $ | 4,598 | $ | 1,816 | ||||
Employee benefits (other than pension) | 548 | 276 | ||||||
Book reserves | 954 | 1,208 | ||||||
$ | 6,100 | $ | 3,300 | |||||
Deferred assets (long-term): | ||||||||
Federal NOL, carried forward | $ | 7,438 | $ | 9,820 | ||||
State NOL, various carryforward periods | 1,039 | 962 | ||||||
Foreign NOL, various carried forward periods | 1,583 | 914 | ||||||
Foreign tax credit carryforward, expiring 2012 - 2016 | 1,117 | 1,194 | ||||||
Pension benefit | 3,980 | 5,589 | ||||||
Retiree medical benefits | 4,615 | 4,562 | ||||||
Intangibles | 3,813 | 3,553 | ||||||
Other | 651 | 1,389 | ||||||
$ | 24,236 | $ | 27,983 | |||||
Valuation reserve for state NOL, foreign NOL and foreign tax credits | $ | (2,829 | ) | $ | (1,868 | ) | ||
Long-term deferred assets | $ | 21,407 | $ | 26,115 | ||||
Deferred liabilities (long-term): | ||||||||
Depreciation | (2,806 | ) | (2,436 | ) | ||||
$ | (2,806 | ) | $ | (2,436 | ) | |||
Net deferred tax assets | $ | 24,701 | $ | 26,979 | ||||
As of June 30, 2011 and June 26, 2010, the net long-term deferred tax asset and deferred tax liability respectively, on the balance sheet are as follows:
2011 | 2010 | |||||||
Long-term liabilities | $ | (2,806 | ) | $ | (2,436 | ) | ||
Long-term assets | 21,407 | 26,115 | ||||||
$ | 18,601 | $ | 23,679 | |||||
Foreign operations deferred assets (current) relate primarily to book reserves.
Foreign operations net deferred assets (long-term) relate primarily to pension benefits.
33
Amounts related to foreign operations included in the long-term portion of deferred liabilities relate primarily to depreciation.
A reconciliation of the beginning and ending amount of unrecognized tax benefits are as follows:
Balance at June 28, 2008 | $ | (8,522 | ) | |
Increases for tax positions taken during a prior period | - | |||
Increases for tax positions taken during the current period | (618 | ) | ||
Decreases relating to settlements | - | |||
Decreases resulting from the expiration of the statute of limitations | - | |||
Balance at June 27, 2009 | $ | (9,140 | ) | |
Increases for tax positions taken during a prior period | - | |||
Increases for tax positions taken during the current period | (234 | ) | ||
Decreases relating to settlements | 242 | |||
Decreases resulting from the expiration of the statute of limitations | - | |||
Balance at June 26, 2010 | $ | (9,132 | ) | |
Decreases for tax positions taken during a prior period | 156 | |||
Increases for tax positions taken during the current period | (1,189 | ) | ||
Effect of exchange rate changes | (285 | ) | ||
Decreases resulting from the expiration of the statute of limitations | - | |||
Balance at June 30, 2011 | $ | (10,450 | ) |
The long term-taxes payable on the balance sheet as of June 30, 2011 and June 26, 2010 relate primarily to reserves for transfer pricing issues.
During the next 12 months, the Company expects that there is the possibility that there will be a decrease in the total amount of unrecognized tax benefits as a result of the passing of the related statute of limitations. The Company recognizes interest expense related to income tax matters in income tax expense.
The Company is subject to U.S. federal income tax and various state, local and international income taxes in numerous jurisdictions. The Company's domestic and international tax liabilities are subject to the allocation of revenues and expenses in different jurisdictions and the timing of recognizing revenues and expenses. Additionally, the amount of income taxes paid is subject to the Company's interpretation of applicable tax laws in the jurisdictions in which it files.
The Company is no longer subject to U.S. federal examination by the Internal Revenue Service for years prior to 2006. As of June 30, 2011, the Company did have a state income tax audit in process. There were no other local or federal income tax audits as of June 30, 2011. In international jurisdictions including Argentina, Australia, Brazil, Canada, China, U.K., Germany, New Zealand, Dominican Republic and Mexico, which comprise a significant portion of the Company's operations, the years that may be examined vary by country. Brazil is subject to audit for the years 2007 – 2011.
The tax effected federal NOL carryforward of $7.4 million expires in the years 2026, 2029, and 2030. The tax benefit of state tax loss carryforwards of $1 million expire at various times over the next 5 years. The foreign tax credit carryforward of $1.1 million expires in the years 2012 through 2016.
No deferred taxes have been provided on the undistributed non-U.S. subsidiary earnings that are considered to be permanently invested. At June 30, 2011, the estimated amount of total unremitted earnings is $67.1 million. The Company has not disclosed the total amount of the unrecognized deferred taxes related to these earnings. Compiling the data necessary for such disclosure is not practical as it would involve an extensive study requiring the Company to go back many years to calculate the earnings and profits for a number of foreign subsidiaries.
34
11. EMPLOYEE BENEFIT AND RETIREMENT PLANS
The Company has two defined benefit pension plans, one for U.S. employees and another for U.K. employees. The UK plan was closed to new entrants in fiscal 2009. The Company also has defined contribution plans. In addition, certain U.S. employees participate in an Employee Stock Ownership Plan (ESOP). The Company makes periodic contributions to the ESOP in the form of Company stock or in cash to be invested in Company stock. Employees are not required or permitted to make contributions to the ESOP. Ninety percent of the actuarially determined annuity value of their ESOP shares is used to offset benefits otherwise due under the domestic defined benefit pension plan. The total cost of all such plans for fiscal 2011, 2010 and 2009, considering the combined projected benefits and funds of the ESOP as well as the other plans, was $1.8 million, $11.3 million and $31.7 million, respectively. Included in these amounts are the Company's contributions to the defined contribution plan amounting to $0.6 million, $0.5 million and $0.5 million in fiscal 2011, 2010 and 2009, respectively.
Under both U.S and U.K. defined benefit plans, benefits are based on years of service and final average earnings. Plan assets, including those of the ESOP, consist primarily of investment grade debt obligations, marketable equity securities and shares of the Company's common stock. The asset allocation of the Company's domestic pension plan is diversified, consisting primarily of investments in equity and debt securities. The Company seeks a long-term investment return that is reasonable given prevailing capital market expectations. Target allocations are 40% to 70% in equities (including 10% to 20% in Company stock), and 30% to 60% in cash and debt securities.
The Company uses an expected long-term rate of return assumption of 8.0% for the U.S. domestic pension plan, and 6.0% for the U.K. plan. In determining these assumptions, the Company considers the historical returns and expectations for future returns for each asset class as well as the target asset allocation of the pension portfolio as a whole. The Company uses a discount rate assumption of 5.44% for the U.S. plan and 5.7% for the U.K. plan. In determining these assumptions, the Company considers published third party data appropriate for the plans.
Other than the discount rate, pension valuation assumptions are generally long-term and not subject to short-term market fluctuations, although they may be adjusted as warranted by structural shifts in economic or demographic outlooks. Long-term assumptions are reviewed annually to ensure they do not produce results inconsistent with current market conditions. The discount rate is adjusted annually based on corporate investment grade (rated AA or better) bond yields as of the measurement date.
Based on the actuarial valuations performed on the Company's defined benefit pension plans as of June 30, 2011; the U.S. plan remains appropriately funded and does not require minimum contributions to be made in the upcoming year. The U.K. plan, however, will require payments of $1.7 million (£1.06 million) in minimum contributions prior to the end of fiscal 2012.
The Company's overall investment strategy has been to achieve a long-term rate of return of 8.0%, with a wide diversification of asset types. The table below sets forth the actual asset allocation for the assets within the Company's plans.
Based upon the Company's revised accounting policy, management will adjust its portfolio and return to realize a 60% fixed – 40% equity asset allocation and a 6% long-term rate return. This policy change will minimize the market volatility in the future.
2011 | 2010 | |||||||
Asset category: | ||||||||
Cash | 3% | 2% | ||||||
Equities | 60% | 48% | ||||||
Debt | 34% | 47% | ||||||
Other | 3% | 3% | ||||||
100% | 100% | |||||||
The Company determines its investments strategies based upon the composition of the beneficiaries in its defined benefit plans and the relative time horizons that those beneficiaries receive payouts from the plans. The Company engages independent investment firms to manage the pension portfolio.
35
Financial assets recorded on the balance sheets are categorized based on the inputs to the valuation techniques as follows:
o | Level 1 – Financial assets whose values are based on unadjusted quoted prices for identical assets or liabilities in an active market which the company has the ability to access at the measurement date (examples include active exchange-traded equity securities and most U.S. Government and agency securities). |
o | Level 2 – Financial assets whose values are based on quoted market prices in markets where trading occurs infrequently or whose values are based on quoted prices of instruments with similar attributes in active markets. |
o | Level 3 – Financial assets whose values are based on prices or valuation techniques that require inputs that are both unobservable and significant to the overall fair value measurement. These inputs reflect management's own view about the assumptions a market participant would use in pricing the asset. The Company does not currently have any Level 3 financial assets. |
Cash equivalents are held in money market funds.
The Company's fixed income portfolio includes mutual funds that hold a combination of short-term, investment-grade fixed income securities and a diversified selection of investment-grade, fixed income securities, including corporate securities and U. S. government securities.
The Company invests in equity securities, which are diversified across a spectrum of value and growth in large, medium and small capitalization as appropriate to achieve the objective of a balanced portfolio and optimize the expected returns and volatility in the various asset classes.
The tables below show the portfolio by valuation category as of June 30, 2011 and June 26, 2010 (in thousands)..
June 30, 2011 | ||||||||||||||||||||
Asset Category | Level 1 | Level 2 | Level 3 | Total | % | |||||||||||||||
Cash Equivalent | $ | 3,941 | $ | - | $ | - | $ | 3,941 | 3% | |||||||||||
Fixed Income | - | 36,609 | - | 36,609 | 34% | |||||||||||||||
Equities | 36,989 | 28,134 | - | 65,123 | 60% | |||||||||||||||
Other | - | 2,874 | - | 2,874 | 3% | |||||||||||||||
Total | $ | 40,930 | $ | 67,617 | $ | - | $ | 108,547 | 100% | |||||||||||
June 26, 2010 | ||||||||||||||||||||
Asset Category | Level 1 | Level 2 | Level 3 | Total | % | |||||||||||||||
Cash Equivalent | $ | 2,462 | $ | - | $ | - | $ | 2,462 | 2% | |||||||||||
Fixed Income | 1,605 | 45,739 | - | 47,344 | 48% | |||||||||||||||
Equities | 25,722 | 20,840 | - | 46,562 | 47% | |||||||||||||||
Other | - | 2,499 | - | 2,499 | 3% | |||||||||||||||
Total | $ | 29,789 | $ | 69,078 | $ | - | $ | 98,867 | 100% | |||||||||||
36
U.S. and U.K. Plans Combined:
The status of these defined benefit plans, including the ESOP, is as follows (in thousands): |
2011 | 2010 | 2009 | ||||||||||
Change in benefit obligation | ||||||||||||
Benefit obligation at beginning of year | $ | 117,974 | $ | 96,167 | $ | 109,837 | ||||||
Service cost | 2,278 | 1,707 | 2,090 | |||||||||
Interest cost | 6,541 | 6,532 | 6,754 | |||||||||
Participant contributions | 202 | 231 | 244 | |||||||||
Exchange rate changes | 2,683 | (2,740 | ) | (7,306 | ) | |||||||
Benefits paid | (5,307 | ) | (5,349 | ) | (6,017 | ) | ||||||
Actuarial (gain) loss |
| (4,480 | ) | 21,426 | (9,435 | ) | ||||||
Benefit obligation at end of year | $ | 119,891 | $ | 117,974 | $ | 96,167 | ||||||
Change in plan assets | ||||||||||||
Fair value of plan assets at beginning of year | $ | 98,867 | $ | 90,864 | $ | 140,829 | ||||||
Actual return on plan assets | 12,271 | 14,628 | (38,015 | ) | ||||||||
Employer contributions | 625 | 483 | 511 | |||||||||
Participant contributions | 202 | 231 | 244 | |||||||||
Benefits paid | (5,307 | ) | (5,349 | ) | (6,017 | ) | ||||||
Exchange rate changes | 1,889 | (1,990 | ) | (6,688 | ) | |||||||
Fair value of plan assets at end of year | $ | 108,547 | $ | 98,867 | $ | 90,864 | ||||||
2011 | 2010 | 2009 | ||||||||||
Funded status at end of year | ||||||||||||
Funded status | $ | (11,344 | ) | $ | (19,107 | ) | $ | (5,303 | ) | |||
Net amount recognized | $ | (11,344 | ) | $ | (19,107 | ) | $ | (5,303 | ) | |||
37
Amounts recognized in statement of financial position | ||||||||||||
Current liability | $ | (23 | ) | (24 | ) | (23 | ) | |||||
Noncurrent liability | (11,321 | ) | (19,083 | ) | (5,280 | ) | ||||||
Net amount recognized in statement of financial position | $ | (11,344 | ) | $ | (19,107 | ) | $ | (5,303 | ) | |||
Amounts not yet reflected in net periodic benefit costs and included in accumulated other comprehensive income | ||||||||||||
Transition asset (obligation) | $ | - | $ | - | $ | - | ||||||
Prior service credit (cost) | (585 | ) | (834 | ) | (1,217 | ) | ||||||
Accumulated gain (loss) | (2,450 | ) | (11,668 | ) | (7,808 | ) | ||||||
Amounts not yet recognized as a component of net periodic benefit cost | (3,035 | ) | (12,502 | ) | (9,025 | ) | ||||||
Accumulated contributions in excess of net periodic benefit cost | $ | (8,309 | ) | $ | (6,605 | ) | $ | 3,722 | ||||
Net amount recognized | $ | (11,344 | ) | $ | (19,107 | ) | $ | (5,303 | ) | |||
Components of net periodic (benefit) cost (Domestic and U. K.) | ||||||||||||
Service cost | $ | 2,278 | $ | 1,707 | $ | 2,090 | ||||||
Interest cost | 6,541 | 6,532 | 6,754 | |||||||||
Expected return on plan assets | (7,305 | ) | (6,672 | ) | (10,157 | ) | ||||||
Amortization of prior service cost | 249 | 381 | 414 | |||||||||
Recognized actuarial (gain) or loss | (2 | ) | 9,370 | 32,491 | ||||||||
Net periodic (benefit) cost | 1,761 | $ | 11,318 | $ | 31,592 | |||||||
Estimated amounts that will be amortized from accumulated other comprehensive income over the next year | ||||||||||||
Initial net obligation(asset) | $ | - | $ | - | $ | - | ||||||
Prior service cost | (234 | ) | - | - | ||||||||
Net gain (loss) | (132 | ) | - | - | ||||||||
Information for pension plans with accumulated benefits in excess of plan assets | ||||||||||||
Projected benefit obligation | $ | 36,971 | 117,974 | 28,225 | ||||||||
Accumulated benefit obligation | 36,971 | 113,511 | 28,225 | |||||||||
Fair value of assets | 29,970 | 98,867 | 23,738 | |||||||||
38
U.S. Plan:
The status of these defined benefit plans, including the ESOP, is as follows (in thousands):
2011 | 2010 | 2009 | ||||||||
Change in benefit obligation | ||||||||||
Benefit obligation at beginning of year | $ | 81,678 | $ | 68,414 | $ | 69,310 | ||||
Service cost | 1,787 | 1,429 | 1,607 | |||||||
Interest cost | 4,498 | 4,518 | 4,669 | |||||||
Participant contributions | - | - | - | |||||||
Exchange rate changes | - | - | - | |||||||
Benefits paid | (3,821 | ) | (3,674 | ) | (3,549 | ) | ||||
Actuarial (gain) loss | (651 | ) | 10,991 | (3,623 | ) | |||||
Benefit obligation at end of year | $ | 83,491 | $ | 81,678 | $ | 68,414 | ||||
Weighted average assumptions benefit obligation | ||||||||||
Discount rate | 5.44% | 5.37% | 6.50% | |||||||
Rate of compensation increase | 2.64% | 2.64% | 2.64% | |||||||
Change in plan assets | ||||||||||
Fair value of plan assets at beginning of year | $ | 73,832 | $ | 67,126 | $ | 103,440 | ||||
Actual return on plan assets | 8,543 | 10,357 | (32,788 | ) | ||||||
Employer contributions | 23 | 23 | 23 | |||||||
Participant contributions | - | - | - | |||||||
Benefits paid | (3,821 | ) | (3,674 | ) | (3,549 | ) | ||||
Exchange rate changes | - | - | - | |||||||
Fair value of plan assets at end of year | $ | 78,577 | $ | 73,832 | $ | 67,126 | ||||
2011 | 2010 | 2009 | ||||||||
Funded status at end of year | ||||||||||
Funded status | $ | (4,914 | ) | $ | (7,846 | ) | $ | (1,288 | ) | |
Net amount recognized | $ | (4,914 | ) | $ | (7,846 | ) | $ | (1,288 | ) | |
39
Amounts recognized in statement of financial position | ||||||||||||
Noncurrent assets | $ | - | - | - | ||||||||
Current liability | (23 | ) | (24 | ) | (23 | ) | ||||||
Noncurrent liability | (4,891 | ) | (7,822 | ) | (1,265 | ) | ||||||
Net amount recognized in statement of financial position | $ | (4,914 | ) | $ | (7,846 | ) | $ | (1,288 | ) | |||
Weighted average assumptions – net periodic benefit cost | ||||||||||||
Discount rate | 5.37 | % | 6.50 | % | 6.75 | % | ||||||
Rate of compensation increase | 2.64 | % | 2.64 | % | 3.25 | % | ||||||
Return on Plan Assets | 8.00 | % | 8.00 | % | 8.00 | % | ||||||
Amounts not yet reflected in net periodic benefit costs and included in accumulated other comprehensive income | ||||||||||||
Transition asset (obligation) | $ | - | $ | - | $ | - | ||||||
Prior service credit (cost) | (585 | ) | (834 | ) | (1,107 | ) | ||||||
Accumulated gain (loss) | (4,572 | ) | (8,038 | ) | (6,615 | ) | ||||||
Amounts not yet recognized as a component of net periodic benefit cost | (5,157 | ) | (8,872 | ) | (7,722 | ) | ||||||
Accumulated contributions in excess of net periodic benefit cost | $ | 243 | $ | 1,026 | $ | 6,434 | ||||||
Net amount recognized | $ | (4,914 | ) | $ | (7,846 | ) | $ | (1,288 | ) | |||
Components of net periodic (benefit) cost | ||||||||||||
Service cost | $ | 1,787 | $ | 1,429 | $ | 1,607 | ||||||
Interest cost | 4,498 | 4,518 | 4,669 | |||||||||
Expected return on plan assets | (5,724 | ) | (5,195 | ) | (8,117 | ) | ||||||
Amortization of prior service cost | 249 | 273 | 271 | |||||||||
Amortization of transitional (asset) or obligation | - | - | - | |||||||||
Recognized actuarial (gain) or loss | (2 | ) | 4,405 | 32,491 | ||||||||
Net periodic (benefit) cost | 808 | $ | 5,430 | $ | 30,921 | |||||||
Estimated amounts that will be amortized from accumulated other comprehensive income over the next year | ||||||||||||
Initial net obligation(asset) | $ | - | $ | - | $ | - | ||||||
Prior service cost | (234 | ) | - | - | ||||||||
Net gain (loss) | 4 | - | - | |||||||||
Information for pension plans with accumulated benefits in excess of plan assets | ||||||||||||
| Projected benefit obligation | $ | 571 | 81,678 | 472 | ||||||||
Accumulated benefit obligation | 571 | 77,215 | 472 | |||||||||
Fair value of assets | - | 73,832 | - | |||||||||
40
U.K. Plan:
The status of these defined benefit plans, including the ESOP, is as follows (in thousands): | ||||||||||||
2011 | 2010 | 2009 | ||||||||||
Change in benefit obligation | ||||||||||||
Benefit obligation at beginning of year | $ | 36,296 | $ | 27,753 | $ | 40,527 | ||||||
Service cost | 491 | 278 | 483 | |||||||||
Interest cost | 2,043 | 2,014 | 2,085 | |||||||||
Participant contributions | 202 | 231 | 244 | |||||||||
Exchange rate changes | 2,683 | (2,740 | ) | (7,306 | ) | |||||||
Benefits paid | (1,486 | ) | (1,675 | ) | (2,468 | ) | ||||||
Actuarial (gain) loss | (3,829 | ) | 10,435 | (5,812 | ) | |||||||
Benefit obligation at end of year | $ | 36,400 | $ | 36,296 | $ | 27,753 | ||||||
Weighted average assumptions benefit obligation | ||||||||||||
Discount rate | 5.70% | 5.40% | 7.10% | |||||||||
Rate of compensation increase | 3.30% | 3.10% | 3.00% | |||||||||
Change in plan assets | ||||||||||||
Fair value of plan assets at beginning of year | $ | 25,035 | $ | 23,738 | $ | 37,389 | ||||||
Actual return on plan assets | 3,728 | 4,271 | (5,227 | ) | ||||||||
Employer contributions | 602 | 460 | 488 | |||||||||
Participant contributions | 202 | 231 | 244 | |||||||||
Benefits paid | (1,486 | ) | (1,675 | ) | (2,468 | ) | ||||||
Exchange rate changes | 1,889 | (1,990 | ) | (6,688 | ) | |||||||
Fair value of plan assets at end of year | $ | 29,970 | $ | 25,035 | $ | 23,738 | ||||||
2011 | 2010 | 2009 | ||||||||||
Funded status at end of year | ||||||||||||
Funded status | $ | (6,430 | ) | $ | (11,261 | ) | $ | (4,015 | ) | |||
Net amount recognized | $ | (6,430 | ) | $ | (11,261 | ) | $ | (4,015 | ) | |||
41
Amounts recognized in statement of financial position | ||||||||||||
Noncurrent assets | $ | - | - | - | ||||||||
Current liability | $ | - | - | - | ||||||||
Noncurrent liability | (6,430 | ) | (11,261 | ) | (4,015 | ) | ||||||
Net amount recognized in statement of financial position | $ | (6,430 | ) | $ | (11,261 | ) | $ | (4,015 | ) | |||
Weighted average assumptions – net periodic benefit cost | ||||||||||||
Discount rate | 5.40% | 7.10% | 6.30% | |||||||||
Rate of compensation increase | 3.10% | 3.00% | 3.70% | |||||||||
Return on Plan Assets | 6.00% | 6.50% | 6.70% | |||||||||
Amounts not yet reflected in net periodic benefit costs and included in accumulated other comprehensive income | ||||||||||||
Transition asset (obligation) | $ | - | $ | - | $ | - | ||||||
Prior service credit (cost) | - | - | (110 | ) | ||||||||
Accumulated gain (loss) | 2,122 | (3,630 | ) | (1,193 | ) | |||||||
Amounts not yet recognized as a component of net periodic benefit cost | 2,122 | (3,630 | ) | (1,303 | ) | |||||||
Accumulated contributions in excess of net periodic benefit cost | $ | (8,552 | ) | $ | (7,631 | ) | $ | (2,712 | ) | |||
Net amount recognized | $ | (6,430 | ) | $ | (11,261 | ) | $ | (4,015 | ) | |||
Components of net periodic (benefit) cost | ||||||||||||
Service cost | $ | 491 | $ | 278 | $ | 483 | ||||||
Interest cost | 2,043 | 2,014 | 2,085 | |||||||||
Expected return on plan assets | (1,581 | ) | (1,477 | ) | (2,040 | ) | ||||||
Amortization of prior service cost | - | 108 | 143 | |||||||||
Amortization of transitional (asset) or obligation | - | - | - | |||||||||
Recognized actuarial (gain) or loss | - | 4,965 | - | |||||||||
Net periodic (benefit) cost | 953 | $ | 5,888 | $ | 671 | |||||||
Estimated amounts that will be amortized from accumulated other comprehensive income over the next year | ||||||||||||
Initial net obligation(asset) | $ | - | $ | - | $ | - | ||||||
Prior service cost | - | - | - | |||||||||
Net gain (loss) | (132 | ) | - | - | ||||||||
Information for pension plans with accumulated benefits in excess of plan assets | ||||||||||||
Projected benefit obligation | $ | 36,400 | $ | 36,296 | $ | 27,753 | ||||||
Accumulated benefit obligation | 36,400 | 36,296 | 27,753 | |||||||||
Fair value of assets | 29,970 | 25,035 | 23,738 | |||||||||
42
Medical and Life Insurance Benefits-Retired Employees: | 2011 | 2010 | 2009 | |||||||||
Change in benefit obligation: | ||||||||||||
Benefit obligation at beginning of year | $ | 11,603 | $ | 10,817 | $ | 10,843 | ||||||
Service cost | 353 | 287 | 326 | |||||||||
Interest cost | 591 | 646 | 701 | |||||||||
Benefits paid | (662 | ) | (977 | ) | (706 | ) | ||||||
Actuarial (gain) loss | (81 | ) | 830 | (347 | ) | |||||||
Benefit obligation at end of year | $ | 11,804 | $ | 11,603 | $ | 10,817 | ||||||
Weighted average assumptions – benefit obligations | ||||||||||||
Discount rate | 5.44% | 5.37% | 6.50% | |||||||||
Rate of compensation increase | 2.64% | 2.64% | 2.64% | |||||||||
Change in plan assets | ||||||||||||
Fair value of plan assets at beginning of year | $ | - | $ | - | $ | - | ||||||
Employer contributions | 662 | 977 | 706 | |||||||||
Benefits paid | (662 | ) | (977 | ) | (706 | ) | ||||||
Fair value of plan assets at end of year | $ | - | $ | - | $ | - | ||||||
Amounts recognized in statement of financial position | ||||||||||||
Current post-retirement benefit liability | $ | (657 | ) | $ | (681 | ) | $ | (752 | ) | |||
Post-retirement benefit liability | (11,147 | ) | (10,922 | ) | (10,065 | ) | ||||||
Net amount recognized in consolidated balance sheet | $ | (11,804 | ) | $ | (11,603 | ) | $ | (10,817 | ) | |||
Weighted average assumptions – net periodic benefit cost | ||||||||||||
Discount rate | 5.37% | 6.50% | 6.75% | |||||||||
Rate of compensation increase | 2.64% | 2.64% | 3.25% | |||||||||
Amounts not yet reflected in net periodic benefit cost and included in accumulated other comprehensive income | ||||||||||||
Prior service credit (cost) | 2,793 | 3,699 | 4,604 | |||||||||
Accumulated gain (loss) | (1,422 | ) | (1,511 | ) | (682 | ) | ||||||
Amounts not yet recognized as a component of net periodic benefit cost | 1,371 | 2,188 | 3,922 | |||||||||
Net periodic benefit cost in excess of accumulated contributions | $ | (13,175 | ) | $ | (13,791 | ) | $ | (14,739 | ) | |||
Net amount recognized | $ | (11,804 | ) | $ | (11,603 | ) | $ | (10,817 | ) |
43
Estimated amounts that will be amortized from accumulated other comprehensive income over the next fiscal year | |||||||||
Prior service credit (cost) | $ | 905 | $ | 905 | $ | 905 | |||
Net gain (loss) | (19 | ) | (28 | ) | - | ||||
$ | 886 | $ | 877 | $ | 905 | ||||
Healthcare cost trend rate assumed for next year | 9.70% | 7.66% | 9.00% | ||||||
Rate to which the cost trend rate gradually declines | 4.50% | 4.50% | 5.00% | ||||||
Year that the rate reached the rate at which it is assumed to remain | 2027 | 2027 | 2016 | ||||||
Assumed health care cost trend rates have a significant effect on the amounts reported for the health care plans. A one percentage point change in assumed health care cost trend rates would have the following effects (in thousands):
1% Increase | ||||||||||||
2011 | 2010 | 2009 | ||||||||||
Effect on total of service and interest cost | $ | 104 | $ | 105 | $ | 106 | ||||||
Effect on postretirement benefit obligation | 1,067 | 1,079 | 950 | |||||||||
1% Decrease | ||||||||||||
2011 | 2010 | 2009 | ||||||||||
Effect on total of service and interest cost | $ | (87 | ) | $ | (89 | ) | $ | (90 | ) | |||
Effect on postretirement benefit obligation | (915 | ) | (923 | ) | (816 | ) | ||||||
For fiscal 2012, the Company expects no contributions (required or discretionary) to the qualified domestic pension plan, $23 thousand to the nonqualified domestic pension plan, $1,701 thousand to the U.K. pension plan, and $657 thousand to the retiree medical and life insurance plan.
2011 | 2010 | 2009 | ||||||||||
Components of net periodic benefit cost (benefit) | ||||||||||||
Service cost | $ | 353 | $ | 287 | $ | 326 | ||||||
Interest cost | 591 | 646 | 701 | |||||||||
Amortization of prior service cost | (905 | ) | (905 | ) | (905 | ) | ||||||
Recognized actuarial gain | 10 | - | - | |||||||||
Net periodic benefit cost | $ | 49 | $ | 28 | $ | 122 | ||||||
Future pension and other benefit payments are as follows:
Fiscal Year | Pension | Other Benefits | ||||||
2012 | $ | 5,820 | $ | 657 | ||||
2013 | 5,970 | 659 | ||||||
2014 | 6,168 | 664 | ||||||
2015 | 6,373 | 686 | ||||||
2016 | 6,564 | 706 | ||||||
2017-2021 | 36,550 | 4,139 | ||||||
44
12. DEBT
Debt, including capitalized lease obligations, is comprised of the following (in thousands):
June 30, 2011 | June 26, 2010 | |||||||
Short-term and current maturities | ||||||||
Loan and Security Agreement | $ | 8,000 | $ | 1,700 | ||||
Short-term foreign credit facility | 27 | 738 | ||||||
Capitalized leases | 211 | 258 | ||||||
$ | 8,238 | $ | 2,696 | |||||
Long-term debt | ||||||||
Capitalized leases | $ | 721 | $ | 706 | ||||
Total | $ | 8,959 | $ | 3,402 | ||||
On June 30, 2009, the Company and certain of the Company's subsidiaries entered into a $23.0 million Loan and Security Agreement (the "Credit Facility") with TD Bank, N.A.
The Credit Facility replaced a previous Bank of America facility with a $23.0 million line of credit. The interest rate under the Credit Facility is based upon a grid which uses the ratio of Funded Debt/EBITDA to determine the floating margin that will be added to one-month LIBOR. The current rate is one-month LIBOR plus 1.5%. As of June 30, 2011, this rate was 1.69%. The effective interest rate on the loan and security agreement through June 30, 2011 was 1.8%. The New Credit Facility matures on April 30, 2012.
The obligations under the New Credit Facility are unsecured. However, in the event of certain triggering events, the obligations under the Credit Facility will become secured by the assets of the Company and the Subsidiaries. Triggering events are two consecutive quarters of failure to achieve the financial covenants described below.
Availability under the Credit Facility is subject to a borrowing base comprised of accounts receivable and inventory. The Company believes that the borrowing base will consistently produce availability under the Credit Facility in excess of $23.0 million. In addition, the Company anticipates that it will not need to fully utilize the amounts available to the Company and the Subsidiaries under the Credit Facility. As of June 30, 2011, the Company had borrowings of $8.0 million under this facility. A 0.25% commitment fee is charged on the unused portion of the line of credit.
The Company has three standby letters of credit totaling $0.4 million which reduce the $23 million available line of credit to $22.6 million. As of June 30, 2011, the Company has approximately $14.7 million available in the line of credit.
The Credit Facility contains financial covenants with respect to leverage, tangible net worth, and interest coverage, and also contains customary affirmative and negative covenants, including limitations on indebtedness, liens, acquisitions, asset dispositions, and fundamental corporate changes, and certain customary events of default. Upon the occurrence and continuation of an event of default, the lender may terminate the revolving credit commitment and require immediate payment of the entire unpaid principal amount of the New Credit Facility, accrued interest and all other obligations. The material financial covenants of the Loan and Security Agreement are 1) achieve a minimum EBITDA of $3.5 million on a trailing twelve month basis (EBITDA covenant expired March 2011), 2) achieve a minimum Tangible Net Worth of $130 million excluding any pension liability, 3) incur no more than $10.0 million for capital expenditures on a fiscal year basis, and 4) maintain a Debt Service Coverage Ratio of a minimum of 1:25 to 1. As of June 30, 2011, the Company was in compliance with each of these financial covenants.
45
13. COMMON STOCK
Class B common stock is identical to Class A except that it has 10 votes per share, is generally nontransferable except to lineal descendants, cannot receive more dividends than Class A, and can be converted to Class A at any time. Class A common stock is entitled to elect 25% of the directors to be elected at each meeting with the remaining 75% being elected by Class A and Class B voting together. As of June 30, 2011 and June 26, 2010, the Company held 1,668,945 and 1,689,870, respectively, of treasury shares.
Under the Company's employee stock purchase plans (ESPP), the purchase price of the optioned stock is 85% of the lower of the market price on the date the option is granted or the date it is exercised. Options become exercisable exactly two years from the date of grant and expire if not exercised. No options were exercisable at fiscal year ends. A summary of option activity is as follows:
Shares On Option | Weighted Average Exercise Price | Shares Available For Grant | ||||||||||
Balance, June 28, 2008 | 34,239 | $ | 15.74 | 695,339 | ||||||||
Options granted ($14.17 and $7.51) | 76,519 | 9.86 | (76,519 | ) | ||||||||
Options exercised ($13.26 and $6.55) | (7,010 | ) | 11.08 | |||||||||
Options canceled | (42,401 | ) | 42,401 | |||||||||
Balance, June 27, 2009 | 61,347 | 661,221 | ||||||||||
Options granted ($8.73) | 24,330 | 8.73 | (24,330 | ) | ||||||||
Options exercised ($7.81 and $7.95) | (2,937 | ) | 7.88 | |||||||||
Options canceled | (21,656 | ) | 21,656 | |||||||||
Balance, June 26, 2010 | 61,084 | 658,547 | ||||||||||
Options granted ($7.70, $11.05 and $8.83) | 69,078 | 8.99 | (69,078 | ) | ||||||||
Options exercised ($9.29 and $7.51) | (33,098 | ) | 7.65 | |||||||||
Options canceled | (23,055 | ) | 23,055 | |||||||||
Balance, June 30, 2011 | 74,009 | 612,524 | ||||||||||
The following information relates to outstanding options as of June 30, 2011:
Weighted average remaining life | 1.3 years | |||
Weighted average fair value on grant date of options granted in: | ||||
2009 | 4.74 | |||
2010 | 4.59 | |||
2011 | 3.01 | |||
The fair value of each option grant was estimated on the date of grant using the Black-Scholes option pricing model with the following weighted average assumptions: expected volatility – 40.5 – 56.6%, interest – 0.6 – 0.8%, and expected lives - 2 years. Compensation expense of $62,100, $66,800 and $64,300 has been recorded for fiscal 2011, 2010 and 2009, respectively. It is not anticipated that future compensation expense related to ASC 718 will vary materially from this amount under the current employee stock purchase plan.
14. CONTINGENCIES
The Company is involved in some matters which arise in the normal course of business, which are not expected to have a material impact on the Company's financial statements.
46
15. OPERATING DATA
The Company believes it has no significant concentration of credit risk as of June 30, 2011. Trade receivables are dispersed among a large number of retailers, distributors and industrial accounts in many countries, with none exceeding 10% of consolidated sales.
The Company is engaged in the single business segment of producing and marketing industrial, professional and consumer products. It manufactures over 5,000 items, including precision measuring tools, tape measures, gages and saw blades. Operating segments are identified as components of an enterprise about which separate discrete financial information is used by the chief operating decision maker in determining how to allocate assets and assess performance of the Company.
The Company has (and is managed through) nine manufacturing plants or reporting units, which are in Scotland, Brazil, Athol, MA, Cleveland, OH, Mt. Airy, NC, China, Waite Park, MN, Laguna Hills, CA, and the Dominican Republic. Internal operating statements used by the chief operating decision maker (the CEO) are prepared on the basis of the operating results of each of these units, and the Company believes these reporting units meet the aggregation criteria as stated in ASC 280.
The Company has concluded that its principal units in North America, Scotland and Brazil have similar economic characteristics and therefore similar long-term financial prospects because they operate in worldwide markets, produce and market the same or similar finished products in the same way, generate comparable gross margins, have comparable return on equity, and sell primarily through distribution as opposed to directly to the end user of the product. Because the units operate in different countries, the economic climate in each country may affect the short-term results of each unit differently; however, over the long run, the units in general are expected to operate similarly and generate similar returns.
Other reporting unit similarities include:
a. | All the Company's units produce tools and related products used primarily by the metal-working and construction trades. These include rules and tape measures, levels, dial indicators, band saw and hole saw blades, gage blocks, ground flat stock, granite surface plates, micrometers and calipers, etc. All the Company's products are included in a single catalog regardless of where manufactured. |
b. | The production processes for all products (regardless of where manufactured) are the same or similar in that they use metal or granite as a raw material. |
c. | The Company's products are sold from its manufacturing units through a customer base of resellers, primarily industrial distributors. |
d. | The Company and its individual units are not materially affected by the regulatory environment. |
For these reasons, the Company believes it is appropriate to report on the basis of one reporting segment.
47
The Company's operations are primarily in North America, Brazil and the United Kingdom. Geographic information about the Company's sales and long-lived assets are as follows (in thousands):
2011 | 2010 | 2009 | ||||||||||
Sales | ||||||||||||
United States | $ | 136,257 | $ | 101,305 | $ | 104,410 | ||||||
North America (other than U.S.) | 12,406 | 10,134 | 10,034 | |||||||||
United Kingdom | 27,480 | 23,616 | 28,135 | |||||||||
Brazil | 94,859 | 77,955 | 71,666 | |||||||||
Eliminations and other | (26,161 | ) | (9,348 | ) | (10,586 | ) | ||||||
Total | $ | 244,841 | $ | 203,662 | $ | 203,659 | ||||||
Long-lived Assets | ||||||||||||
United States | $ | 60,210 | $ | 69,264 | $ | 59,148 | ||||||
North America (other than U.S.) | 501 | 651 | 648 | |||||||||
United Kingdom | 3,802 | 3,580 | 4,316 | |||||||||
Brazil | 15,910 | 14,213 | 15,191 | |||||||||
Other and eliminations | 2,813 | 2,025 | 2,215 | |||||||||
Total | $ | 83,236 | $ | 89,733 | $ | 81,518 | ||||||
48
QUARTERLY FINANCIAL DATA (unaudited)
(in thousands except per share data)
Quarter Ended (1) | Net Sales | Gross Margin | Earnings (loss) Before Income Taxes | Net Earnings | Basic (loss) Earnings Per Share | |||||||||||||||
Sep. 2009 | $ | 40,573 | $ | 8,875 | $ | (6,513 | ) | $ | (4,391 | ) | $ | (0.66 | ) | |||||||
Dec. 2009 | 50,535 | 14,744 | (516 | ) | (1,572 | ) | (0.24 | ) | ||||||||||||
Mar. 2010 | 48,643 | 14,376 | (763 | ) | (1,081 | ) | (0.16 | ) | ||||||||||||
Jun. 2010 | 63,911 | 18,377 | (1,549 | ) | (977 | ) | (0.15 | ) | ||||||||||||
$ | 203,662 | $ | 56,372 | $ | (9,341 | ) | $ | (8,021 | ) | $ | (1.20 | ) | ||||||||
Sep. 2010 | $ | 57,539 | $ | 19,283 | $ | 2,260 | $ | 1,267 | $ | 0.19 | ||||||||||
Dec. 2010 | 57,290 | 19,289 | 3,459 | 1,694 | 0.25 | |||||||||||||||
Mar. 2011 | 58,763 | 19,553 | 2,991 | 2,319 | 0.35 | |||||||||||||||
June 2011 | 71,249 | 23,675 | 4,529 | 1,565 | 0.23 | |||||||||||||||
$ | 244,841 | $ | 81,800 | $ | 13,239 | $ | 6,845 | $ | 1.02 | |||||||||||
(1) Fiscal 2010 has been adjusted to reflect the change in pension accounting.
The Company's Class A common stock is traded on the New York Stock Exchange.
16. SUBSEQUENT EVENTS
The Company evaluated June 30, 2011 financial statements for subsequent events through September 13, 2011, the date of the financial statements were available to be issued and noted no material events.
Item 9 - Changes in and Disagreements with Accountants on Accounting and Financial Disclosure
None.
Item 9A - Controls and Procedures
Pursuant to Rule 13a-15(b) under the Securities Exchange Act of 1934, we carried out an evaluation, with the participation of our management, including our Chief Executive Officer and Chief Financial Officer, of the effectiveness of our disclosure controls and procedures (as defined under Rule 13a-15(e) under the Securities Exchange Act of 1934) as of the end of the period covered by this annual report. Based upon that evaluation, our Chief Executive Officer and Chief Financial Officer concluded that our disclosure controls and procedures were effective as of such date in ensuring that information required to be filed in this annual report was recorded, processed, summarized and reported within the time period required by the rules and regulations of the Securities and Exchange Commission, and that such information is accumulated and communicated to our management, including our Chief Executive Officer and Chief Financial Officer, as appropriate, to allow timely decisions regarding required disclosure.
There were no changes in our internal control over financial reporting (as defined in Rules 13a-15(f) and 15d-15(f) under the Securities Exchange Act of 1934) during the fourth quarter of fiscal 2011 identified in connection with our Chief Executive Officer's and Chief Financial Officer's evaluation that have materially affected, or are reasonably likely to materially affect, our internal control over financial reporting.
49
Management's Report on Internal Control Over Financial Reporting
Management of the Company is responsible for establishing and maintaining adequate internal control over financial reporting as defined in Rules 13a-15(f) and 15d-15(f) under the Securities Exchange Act of 1934. The Company's internal control over financial reporting is a process designed to provide reasonable assurance regarding the reliability of financial reporting and the preparation of financial statements for external purposes in accordance with accounting principles generally accepted in the United States of America. Internal control over financial reporting includes those written policies and procedures that:
• | Pertain to the maintenance of records that, in reasonable detail, accurately and fairly reflect the transactions and acquisitions and dispositions of the assets of the Company; |
• | Provide reasonable assurance that transactions are recorded as necessary to permit preparation of financial statements in accordance with accounting principles generally accepted in the United States of America; |
• | Provide reasonable assurance that receipts and expenditures of the Company are being made only in accordance with authorization of management and directors of the Company; and |
• | Provide reasonable assurance regarding prevention or timely detection of unauthorized acquisition, use or disposition of assets that could have a material effect on the consolidated financial statements. |
Internal control over financial reporting includes the controls themselves, monitoring and internal auditing practices and actions taken to correct deficiencies as identified.
A deficiency in internal control exists when the design or operation of a control does not allow management or employees, in the normal course of performing their assigned functions, to prevent or detect misstatements on a timely basis.
A material weakness is a deficiency, or a combination of deficiencies, in internal control over financial reporting, such that there is a reasonable possibility that a material misstatement of the Company's annual or interim financial statements will not be prevented or detected on a timely basis. A significant deficiency is a deficiency, or a combination of deficiencies, in internal control over financial reporting that is less severe than a material weakness, yet important enough to merit attention by those responsible for oversight of the company's financial reporting (also referred to as those charged with governance).
Because of its inherent limitations, internal control over financial reporting may not prevent or detect all misstatements. Also, projections of any evaluation of effectiveness to future periods are subject to the risk that controls may become inadequate because of changes in conditions, or that the degree of compliance with the policies or procedures may deteriorate.
Management assessed the effectiveness of the Company's internal control over financial reporting as of June 30, 2011. Management based this assessment on criteria for effective internal control over financial reporting described in "Internal Control – Integrated Framework" issued by the Committee of Sponsoring Organizations of the Treadway Commission. Management's assessment included an evaluation of the design of the Company's internal control over financial reporting and testing of the operational effectiveness of its internal control over financial reporting. Management reviewed the results of its assessment with the Audit Committee of the Board of Directors.
Based on our internal assessment, the Company considers the prior year's identified control deficiencies related to financial reporting resources and system controls, with the exception of tax accounting and reporting, to no longer constitute a material weakness within the Company's control over its financial reporting process. However, the Company feels that the process surrounding the tax accounting and reporting process, while improved, failed to reach the threshold as of our fiscal year end on June 30, 2011 where it would no longer be considered a material weakness.
In the fourth quarter of fiscal year 2011, the Company took the following actions to address its tax accounting and reporting process: 1) increased the support and participation of the Company's external tax consultant, 2) developed a more detailed and comprehensive income tax calculation model; and, 3) performed a detailed review of the significant tax accounts worldwide. Plans for FY 2012 include: developing a standardized format for the quarterly reporting of subsidiary tax balances and assigning an internal resource to work with the Company's external consultant and review tax accounting and reporting under U.S. GAAP. It is management's belief that these additional steps, in conjunction with those already implemented in FY 2011, will be effective in the remediation of this material weakness in the upcoming fiscal year.
50
REPORT OF INDEPENDENT REGISTERED PUBLIC ACCOUNTING FIRM
To the Board of Directors and Shareholders
The L.S. Starrett Company
We have audited The L.S. Starrett Company's internal control over financial reporting as of June 30, 2011, based on criteria established in Internal Control-Integrated Framework issued by the Committee of Sponsoring Organizations of the Treadway Commission (COSO). The L.S. Starrett Company's management is responsible for maintaining effective internal control over financial reporting and for its assessment of the effectiveness of internal control over financial reporting, included in the accompanying "Management's Report on Internal Control Over Financial Reporting." Our responsibility is to express an opinion on The L.S. Starrett Company's internal control over financial reporting based on our audit.
We conducted our audit in accordance with the standards of the Public Company Accounting Oversight Board (United States). Those standards require that we plan and perform the audit to obtain reasonable assurance about whether effective internal control over financial reporting was maintained in all material respects. Our audit included obtaining an understanding of internal control over financial reporting, assessing the risk that a material weakness exists, testing and evaluating the design and operating effectiveness of internal control based on the assessed risk, and performing such other procedures as we considered necessary in the circumstances. We believe that our audit provides a reasonable basis for our opinion.
A company's internal control over financial reporting is a process designed to provide reasonable assurance regarding the reliability of financial reporting and the preparation of financial statements for external purposes in accordance with generally accepted accounting principles. A company's internal control over financial reporting includes those policies and procedures that (1) pertain to the maintenance of records that, in reasonable detail, accurately and fairly reflect the transactions and dispositions of the assets of the company; (2) provide reasonable assurance that transactions are recorded as necessary to permit preparation of financial statements in accordance with generally accepted accounting principles, and that receipts and expenditures of the company are being made only in accordance with authorizations of management and directors of the company; and (3) provide reasonable assurance regarding prevention or timely detection of unauthorized acquisition, use, or disposition of the company's assets that could have a material effect on the financial statements.
Because of its inherent limitations, internal control over financial reporting may not prevent or detect misstatements. Also, projections of any evaluation of effectiveness to future periods are subject to the risk that controls may become inadequate because of changes in conditions, or that the degree of compliance with the policies or procedures may deteriorate.
A material weakness is a deficiency, or combination of control deficiencies, in internal control over financial reporting, such that there is a reasonable possibility that a material misstatement of the company's annual or interim financial statements will not be prevented or detected on a timely basis. The following material weakness has been identified and included in management's assessment: a weakness in the income tax accounting and reporting process.
In our opinion, because of the effect of the material weakness described above on the achievement of the objectives of the control criteria, The L.S. Starrett Company has not maintained effective internal control over financial reporting as of June 30, 2011, based on criteria established in Internal Control-Integrated Framework issued by COSO.
We also have audited, in accordance with the standards of the Public Company Accounting Oversight Board (United States), the consolidated balance sheets of The Company as of June 30, 2011 and June 26, 2010, and the related consolidated statements of operations, shareholders' equity, and cash flows for each of the three years in the period ended June 30, 2011. The material weakness identified above was considered in determining the nature, timing, and extent of audit tests applied in our audit of the fiscal 2011 financial statements, and this report does not affect our report dated September 13, 2011, which expressed an unqualified opinion on those financial statements.
51
We do not express an opinion or any other form of assurance on management's remediation plan with respect to the material weakness included in Management's Report on Internal Control Over Financial Reporting.
/s/ GRANT THORNTON LLP
Boston, Massachusetts
September 13, 2011
52
Item 9B - Other Information
None.
PART III
Item 10 – Directors, Executive Officers and Corporate Governance
The information concerning the Directors of the Registrant will be contained immediately under the heading "Election of Directors" and prior to Section A of Part I in the Company's definitive Proxy Statement for the Annual Meeting of Stockholders to be held on October 12, 2011 (the "2011 Proxy Statement"), which will be mailed to stockholders on or about September 12, 2011. The information in that portion of the 2011 Proxy Statement is hereby incorporated by reference.
Executive Officers of the Registrant
Name |
| Age |
| Held Present Office Since |
| Position |
Douglas A. Starrett |
| 59 |
| 2001 |
| President and CEO and Director |
Francis J. O'Brien |
| 64 |
| 2009 |
| Chief Financial Officer and Treasurer |
Anthony M. Aspin |
| 58 |
| 2000 |
| Vice President Sales |
Stephen F. Walsh |
| 65 |
| 2001 |
| Senior Vice President Operations and Director |
Douglas A. Starrett has been President of the Company since 1995 and became CEO in 2001.
Francis J. O'Brien was previously Chief Financial Officer at Delta Education, LLC, an elementary school education company, from 2005 to 2009. Prior to Delta Education, he was Chief Financial Officer at StockerYale Corporation, a publicly traded technology company, from 2001 to 2004 and Director of Finance and Business Development at Analogic Corporation, a publicly traded manufacturer of medical and security systems, from 1998 to 2000. Mr. O'Brien served as Corporate Vice President of Finance & Administration for Addison Wesley, a global education company, from 1982 to 1997 and as Senior Manager at Coopers & Lybrand, an international public accounting firm, from 1976 to 1982. Mr. O'Brien holds a BA from the University of Massachusetts and an MBA from Suffolk University and is a Certified Public Accountant.
Anthony M. Aspin was previously a divisional sales manager with the Company.
Stephen F. Walsh was previously President of the Silicon Carbide Division of Saint-Gobain Industrial Ceramics before joining the Company in 2001 as Vice President Operations.
The positions listed above represent their principal occupations and employment during the last five years.
The President and Treasurer hold office until the first meeting of the directors following the next annual meeting of stockholders and until their respective successors are chosen and qualified, and each other officer holds office until the first meeting of directors following the next annual meeting of stockholders, unless a shorter period shall have been specified by the terms of his election or appointment or, in each case, until he sooner dies, resigns, is removed or becomes disqualified.
There have been no events under any bankruptcy act, no criminal proceedings and no judgments or injunctions material to the evaluation of the ability and integrity of any executive officer during the past five years.
Code of Ethics
The Company has adopted a Policy on Business Conduct and Ethics (the "Ethics Policy") applicable to all directors, officers and employees of the Company. The Code is intended to promote honest and ethical conduct, full and accurate reporting, and compliance with laws as well as other matters. The Ethics Policy is available on the Company's website at www.starrett.com. Stockholders may also obtain free of charge a printed copy of the Ethics Policy by writing to the Clerk of the Company at The L.S. Starrett, 121 Crescent Street, Athol, MA 01331. We intend to disclose any future amendments to, or waivers from, the Ethics Policy within four business days of the waiver or amendment through a website posting or by filing a Current Report on Form 8-K with the Securities and Exchange Commission.
53
Item 11 - Executive Compensation
The information concerning management remuneration will be contained under the heading "General Information Relating to the Board of Directors and Its Committees," and in Sections C-H of Part I of the Company's 2011 Proxy Statement, and is hereby incorporated by reference.
On July 15, 2010, the Company entered into a Change of Control Agreement with Francis J. O'Brien. The terms of Mr. O'Brien's Agreement are identical to those contained in the Change of Control Agreement between the Company and Stephen F. Walsh dated as of January 16, 2009, a form of which is incorporated by reference as Exhibit 10n to this Form 10-K. Such terms are described in the Company's Form 10-Q filed for the quarter ended December 27, 2008 and are incorporated herein by reference.
Item 12 - Security Ownership of Certain Beneficial Owners and Management and Related Stockholder Matters
(a) The following table gives information about the Company's common stock that may be issued upon the exercise of options, warrants and rights under the Company's 2007 Employees' Stock Purchase Plan ("2007 Plan") as of June 30, 2011. The 2007 Plan was approved by stockholders at the Company's 2007 annual meeting and shares of Class A or Class B common stock may be issued under the 2007 Plan. Options are not issued under the Company's Employees' Stock Purchase Plan that was adopted in 1952.
Plan Category | Number of Securities to be issued Upon Exercise of Outstanding Options, Warrants and Rights (a) | Weighted Average Exercise Price of Outstanding Options, Warrants and Rights (b) | Number of Securities Remaining Available For Future Issuance Under Equity Compen- sation Plans (Ex- cluding Securities Reflected in Column (a) (c) | |||||||||
Equity compensation plans approved by security holders | 74,009 | 7.65 | 612,524 | |||||||||
Equity compensation plans not approved by security holders | - | - | - | |||||||||
Total | 74,009 | 7.65 | 612,524 | |||||||||
(b) Security ownership of certain beneficial owners:
The information concerning a more than 5% holder of any class of the Company's voting shares will be contained under the heading "Security Ownership of Certain Beneficial Owners" in Section I of Part I of the Company's 2011 Proxy Statement, and is hereby incorporated by reference.
(c) Security ownership of management:
The information concerning the beneficial ownership of each class of equity securities by all directors, and all directors and officers of the Company as a group, will be contained under the heading "Security Ownership of Management" in Section I of Part I in the Company's 2011 Proxy Statement. These portions of the 2011 Proxy Statement are hereby incorporated by reference.
(d) The Company knows of no arrangements that may, at a subsequent date, result in a change in control of the Company.
54
Item 13 - Certain Relationships and Related Transactions, and Director Independence
The information required by this Item 13 will be contained in the Company's 2011 Proxy Statement, and is hereby incorporated by reference.
Item 14 - Principal Accountant Fees and Services
The information required by this Item 14 will be contained in the Audit Fee table in Section B of Part I in the Company's 2011 Proxy Statement. These portions of the Proxy Statement are hereby incorporated by reference.
PART IV
Item 15 – Exhibits and Financial Statement Schedules
(a) 1. Financial statements filed in Item 8 of this annual report:
Consolidated Balance Sheets at June 30, 2011 and June 26, 2010
Consolidated Statements of Operations for each of the three years in the period ended June 30, 2011.
Consolidated Statements of Cash Flows for each of the three years in the period ended June 30, 2011.
Consolidated Statements of Stockholders' Equity for each of the three years in the period ended June 30, 2011.
Notes to Consolidated Financial Statements
2. The following consolidated financial statement schedule of the Company included in this annual report on Form 10-K is filed herewith pursuant to Item 15(c) and appears immediately before the Exhibit Index:
SCHEDULE II – VALUATION AND QUALIFYING ACCOUNTS
All other financial statements and schedules are omitted because they are inapplicable, not required under the instructions, or the information is reflected in the financial statements or notes thereto.
3. See Exhibit Index below. Compensatory plans or arrangements are identified by an "*."
(b) See Exhibit Index below.
(c) Not applicable.
55
Schedule II |
The L.S. Starrett Company |
Valuation and Qualifying Accounts |
Allowance for Doubtful Accounts |
(in 000) | Balance at Beginning of Period | Provisions | Charges to Other Accounts | Write-offs (1) | Balance at End of Period | |||||||||||||||
Allowance for Doubtful Accounts: | ||||||||||||||||||||
Year Ended June 30, 2011 | $ | 607 | $ | 405 | $ | (106 | ) | $ | (490 | ) | $ | 416 | ||||||||
Year Ended June 26, 2010 | 678 | 88 | 21 | (180 | ) | 607 | ||||||||||||||
Year Ended June 27, 2009 | 701 | 451 | (21 | ) | (453 | ) | 678 | |||||||||||||
(1) Represents accounts written off during the year.
THE L.S. STARRETT COMPANY AND SUBSIDIARIES - EXHIBIT INDEX
Exhibit |
2.1* | Asset Purchase Agreement dated as of April 28, 2006 by and among Starrett Acquisition Corporation, a Delaware Corporation, Tru-Stone Technologies, Inc., a Minnesota corporation (the "Company"), St. Cloud and each individual shareholder of St. Cloud that signed the Asset Purchase Agreement filed with Form 8-K dated May 8, 2006 is hereby incorporated by reference. |
3a | Restated Articles of Organization dated December 20, 1989, filed with Form 10-Q for the quarter ended December 23, 1989, are hereby incorporated by reference. |
3b | Bylaws as amended through June 1, 2011, filed herewith. |
4 | Rights Agreement dated as of November 2, 2010 between the Company and Mellon Investor Services LLC, as Rights Agent (together with exhibits, including the Form of Rights Certificate, and the Summary of Rights to Purchase Shares of Class A Common Stock), filed with Form 10-Q for the quarter ended September 25, 2010, is hereby incorporated by reference. |
10a* | Form of indemnification agreement with directors and executive officers, filed with Form 10-K for the year ended June 29, 2002, is hereby incorporated by reference. |
10b* | The L.S. Starrett Company Supplemental Executive Retirement Plan, filed with Form 10-K for the year ended June 29, 2002 is hereby incorporated by reference. |
10c* | The L.S. Starrett Company 401(k) Stock Savings Plan (2001 Restatement), filed with Form 10-K for the year ended June 29, 2002 is hereby incorporated by reference. |
10d* | 2002 Employees' Stock Purchase Plan filed with Form 10-Q for the quarter ended September 28, 2002 is hereby incorporated by reference. |
10e* | Amendment dated April 1, 2003 to the Company's 401(k) Stock Savings Plan, filed with Form 10-K for the year ended June 28, 2003, is hereby incorporated by reference. |
10f* | Amendment dated October 20, 2003 to the Company's 401(k) Stock Savings Plan, filed with Form 10-Q for the quarter ended September 27, 2003, is hereby incorporated by reference. |
56
10g | Amended and Restated Credit Agreement, dated as of April 28, 2006 by and among the Company, the lenders from time to time party thereto, and Bank of America, N.A., as agent, filed with Form 8-K dated May 8, 2006 is hereby incorporated by reference. |
10h | Amendment dated as of June 24, 2006 to the Company's Amended and Restated Credit Agreement, filed with Form 10-K for the year ended June 24, 2006, is hereby incorporated by reference. |
10i* | Loan and Security Agreement dated as of June 30, 2009 by and among the Company, certain subsidiaries of the Company, and TD Bank, N.A., as lender, filed with Form 8-K dated July 2, 2009 is hereby incorporated by reference. |
10j* | 2007 Employees' Stock Purchase Plan filed with the Definitive Proxy Statement for the 2008 Annual Meeting of Stockholders is hereby incorporated by reference. |
10k* | Cash Bonus Plan for Executive Officers of the Company, filed with Form 10-K for the year ended June 28, 2008, is hereby incorporated by reference. |
10l* | Cash Bonus Plan for Anthony M. Aspin, filed with Form 10-K for the year ended June 28, 2008, is hereby incorporated by reference. |
10m* | Change in Control Agreement, dated January 16, 2009, between the Company and Douglas A. Starrett, filed with Form 10-Q for the quarter ended December 27, 2008, is hereby incorporated by reference. |
10n* | Form of Change in Control Agreement, executed separately by the Company and each of Stephen F. Walsh and Francis J. O'Brien on January 16, 2009 and July 15, 2010, respectively, filed with Form 10-Q for the quarter ended December 27, 2008, is hereby incorporated by reference. |
10o | Form of Non-Compete Agreement, dated as of January 16, 2009, executed separately by the Company and each of Francis J. O'Brien, Douglas A Starrett and Stephen F. Walsh on July 15, 2010, January 16, 2009 and January 16, 2009, filed with Form 10-Q for the quarter ended December 27, 2008, is hereby incorporated by reference. |
11 | Earnings per share (not considered necessary – no difference in basic and diluted per share amounts). |
18 | Preferability Letter, filed herewith. |
21 | Subsidiaries of the Registrant, filed herewith. |
23 | Consent of Independent Registered Public Accounting Firm, filed herewith. |
31a | Certification of Chief Executive Officer Pursuant to Rule 13a-14(a), filed herewith. |
31b | Certification of Chief Financial Officer Pursuant to Rule 13a-14(a), filed herewith. |
32 | Certification of Chief Executive Officer and Chief Financial Officer Pursuant to Rule 13a-14(b) and Section 906 of the Sarbanes-Oxley Act of 2003 (subsections (a) and (b) of Section 1350, Chapter 63 of Title 18, United States Code), filed herewith. |
99.1 | The audited financial statements of Tru-Stone for the years ended December 31, 2005 and December 31, 2004, and the unaudited financial statements for the quarters ended March 31, 2006 and March 31, 2005 filed with Form 8-K/A (Amendment I) dated July 13, 2006, is hereby incorporated by reference. |
99.2 | The unaudited pro forma combined balance sheet of the Company and Tru- Stone as of March 25, 2006 and the unaudited pro forma combined statement of operations of the Company and Tru-Stone for the year ended June 25, 2005 and the nine months ended March 25, 2006 filed with Form 8-K/A (Amendment I) dated July 13, 2006, is hereby incorporated by reference. |
57
SIGNATURES
Pursuant to the requirements of Section 13 or 15(d) of the Securities Exchange Act of 1934, the Registrant has duly caused this report to be signed on its behalf by the undersigned, thereunto duly authorized.
THE L.S. STARRETT COMPANY (Registrant) | ||||
By: /S/ Francis J. O'Brien | ||||
Francis J. O'Brien Treasurer and Chief Financial Officer | ||||
Date: Sept. 13, 2011 | ||||
Pursuant to the requirements of the Securities Exchange Act of 1934, this report has been signed below by the following persons on behalf of the Registrant and in the capacities and on the date indicated:
/S/DOUGLAS A. STARRETT | /S/SALVADOR DE CAMARGO, JR. | |
Douglas A. Starrett, Sept. 13, 2011 President and CEO and Director | Salvador de Camargo, Jr., Sept. 13, 2011 President, Starrett Industria e Comercio Ltda, Brazil Director |
/S/RALPH G. LAWRENCE | /S/TERRY A. PIPER | |
Ralph G. Lawrence, Sept. 13, 2011 | Terry A. Piper, Sept. 13, 2011 | |
Director | Director | |
/S/RICHARD B. KENNEDY | /S/ROBERT L. MONTGOMERY, JR. | |
Richard B. Kennedy, Sept. 13, 2011 | Robert L. Montgomery, Jr., Sept. 13, 2011 | |
Director | Director | |
/S/DAVID R. NORTH | /S/STEPHEN F. WALSH | |
David R. North, Sept. 13, 2011 | Stephen F Walsh, Sept. 13, 2011 | |
Corporate Controller | Senior Vice President Operations and Director | |
/S/DAVID A. LEMOINE | ||
David A. Lemoine, Sept. 13, 2011 | ||
Director |
58