|
|
|
UNITED STATES | ||
SECURITIES AND EXCHANGE COMMISSION | ||
Washington, D.C. 20549 | ||
FORM 10-K | ||
☑ ANNUAL REPORT PURSUANT TO SECTION 13 OR 15(d) OF THE SECURITIES EXCHANGE ACT OF 1934 | ||
For the fiscal year ended January 31, 2015 | ||
o TRANSITION REPORT PURSUANT TO SECTION 13 OR 15(d) OF THE SECURITIES EXCHANGE ACT OF 1934 | ||
For the transition period from to | ||
Commission File Number: 001-07982 | ||
RAVEN INDUSTRIES, INC. | ||
(Exact name of registrant as specified in its charter) | ||
| South Dakota |
| 46-0246171 |
|
| (State or other jurisdiction of incorporation or organization) |
| (IRS Employer Identification No.) |
|
| 205 E. 6th Street, P.O. Box 5107, Sioux Falls, SD |
| 57117- 5107 |
|
| (Address of principal executive offices) |
| (zip code) |
|
| Registrant's telephone number including area code (605) 336-2750 |
| ||
Securities registered pursuant to Section 12(b) of the Act: | ||||
| Title of Each Class: |
| Name of Each Exchange on which Registered |
|
| Common Stock, $1 par value |
| The NASDAQ Stock Market |
|
Securities registered pursuant to Section 12(g) of the Act: None | ||||
|
|
|
|
|
Indicate by checkmark if the registrant is a well-known seasoned issuer, as defined in Rule 405 of the Securities Act. | ☑ | Yes | o | No |
Indicate by checkmark if the registrant is not required to file reports pursuant to Section 13 or Section 15(d) of the Act. | o | Yes | ☑ | No |
Indicate by checkmark whether the registrant (1) has filed all reports required to be filed by Section 13 or 15(d) of the Securities Exchange Act of 1934 during the preceding 12 months (or for such shorter period that the registrant was required to file such reports), and (2) has been subject to such filing requirements for the past 90 days. | ☑ | Yes | o | No |
Indicate by checkmark whether the registrant has submitted electronically and posted on its corporate Website, if any, every Interactive Data File required to be submitted and posted pursuant to Rule 405 of Regulation S-T (§232.405 of this chapter)during the preceding 12 months (or for such shorter period that the registrant was required to submit and post such files). | ☑ | Yes | o | No |
Indicate by checkmark if disclosure of delinquent filers pursuant to Item 405 of Regulation S-K (§229.405 of this chapter)is not contained herein, and will not be contained, to the best of registrant's knowledge, in definitive proxy or information statements incorporated by reference in Part III of this Form 10-K or any amendment to this Form 10-K. | ☑ |
|
|
|
Indicate by checkmark whether the registrant is a large accelerated filer, an accelerated filer, a non-accelerated filer, or a smaller reporting company. See definition of "accelerated filer," "large accelerated filer" and "smaller reporting company" in Rule 12b-2 of the Exchange Act. | |||||
Large accelerated filer | ☑ |
|
| Accelerated filer | o |
Non-accelerated filer | o |
|
| Smaller reporting company | o |
(Do not check if a smaller reporting company) |
|
|
| ||
Indicate by checkmark whether the registrant is a shell company (as defined in Rule 12b-2 of the Act). | o | Yes | ☑ | No |
The aggregate market value of the registrant's common stock held by non-affiliates at July 31, 2014 was approximately $1,004,061,955. The aggregate market value was computed by reference to the closing price as reported on the NASDAQ Global Select Market, $27.87, on July 31, 2014, which was as of the last business day of the registrant's most recently completed second fiscal quarter. The number of shares outstanding on March 20, 2015 was 38,049,802. | ||||
DOCUMENTS INCORPORATED BY REFERENCE | ||||
The definitive proxy statement relating to the registrant's Annual Meeting of Shareholders, to be held May 21, 2015, is incorporated by reference into Part III to the extent described therein. | ||||
|
|
|
|
|
PART I |
|
| |
Item 1. | BUSINESS |
| 3 |
Item 1A. | RISK FACTORS |
| 6 |
Item 1B. | UNRESOLVED STAFF COMMENTS |
| 10 |
Item 2. | PROPERTIES |
| 10 |
Item 3. | LEGAL PROCEEDINGS |
| 10 |
Item 4. | MINE SAFETY DISCLOSURES |
| 10 |
|
|
|
|
PART II |
|
| |
Item 5. | MARKET FOR REGISTRANT'S COMMON EQUITY, RELATED SHAREHOLDER MATTERS, AND ISSUER PURCHASES OF EQUITY SECURITIES |
| 11 |
| Quarterly Information |
| 11 |
| Stock Performance |
| 12 |
Item 6. | SELECTED FINANCIAL DATA |
| 14 |
| Eleven-year Financial Summary |
| 14 |
| Business Segments |
| 16 |
Item 7. | MANAGEMENT'S DISCUSSION AND ANALYSIS OF FINANCIAL CONDITION AND RESULTS OF OPERATIONS |
| 17 |
| Executive Summary |
| 17 |
| Results of Operations - Segment Analysis |
| 20 |
| Outlook |
| 25 |
| Liquidity and Capital Resources |
| 26 |
| Off-Balance Sheet Arrangements and Contractual Obligations |
| 27 |
| Critical Accounting Estimates |
| 28 |
| Accounting Pronouncements |
| 30 |
| Forward-Looking Statements |
| 30 |
Item 7A. | QUANTITATIVE AND QUALITATIVE DISCLOSURES ABOUT MARKET RISK |
| 32 |
Item 8. | FINANCIAL STATEMENTS AND SUPPLEMENTARY DATA |
| 33 |
| Management's Report on Internal Control Over Financial Reporting |
| 34 |
| Report of Independent Registered Public Accounting Firm |
| 35 |
| Consolidated Balance Sheets |
| 36 |
| Consolidated Statements of Income and Comprehensive Income |
| 37 |
| Consolidated Statements of Shareholders' Equity |
| 38 |
| Consolidated Statements of Cash Flows |
| 39 |
| Notes to Consolidated Financial Statements |
| 40 |
Item 9. | CHANGES IN AND DISAGREEMENTS WITH ACCOUNTANTS ON ACCOUNTING AND FINANCIAL DISCLOSURE |
| 60 |
Item 9A. | CONTROLS AND PROCEDURES |
| 60 |
Item 9B. | OTHER INFORMATION |
| 60 |
|
|
|
|
PART III |
|
| |
Item 10. | DIRECTORS, EXECUTIVE OFFICERS AND CORPORATE GOVERNANCE |
| 61 |
Item 11. | EXECUTIVE COMPENSATION |
| 61 |
Item 12. | SECURITY OWNERSHIP OF CERTAIN BENEFICIAL OWNERS AND MANAGEMENT AND RELATED SHAREHOLDER MATTERS |
| 61 |
Item 13. | CERTAIN RELATIONSHIPS AND RELATED TRANSACTIONS AND DIRECTOR INDEPENDENCE |
| 61 |
Item 14. | PRINCIPAL ACCOUNTANT FEES AND SERVICES |
| 61 |
|
|
|
|
PART IV |
|
| |
Item 15. | EXHIBITS, FINANCIAL STATEMENT SCHEDULE |
| 62 |
INDEX TO EXHIBITS |
| 63 | |
SIGNATURES |
| 65 | |
SCHEDULE II |
| 66 | |
PART I |
|
|
|
ITEM 1. | BUSINESS |
Raven Industries, Inc. (the Company or Raven) was incorporated in February 1956 under the laws of the State of South Dakota and began operations later that same year. The Company is a diversified technology company providing a variety of products to customers within the industrial, agricultural, energy, construction, and military/aerospace markets. The Company markets its products around the world and has its principal operations in the United States of America. Raven began operations as a manufacturer of high-altitude research balloons before diversifying into product lines that extended from technologies and production methods of this original balloon business. The Company employs approximately 1,200 people and is headquartered at 205 E. Sixth Street, Sioux Falls, SD 57104 - telephone (605) 336-2750. The Company's Internet address is http://www.ravenind.com and its common stock trades on the NASDAQ Global Select Market under the symbol RAVN. The Company has adopted a Code of Conduct applicable to all officers, directors and employees, which is available on the website. Information on the Company's website is not part of this filing.
All reports (including Annual Reports on Form 10-K, Quarterly Reports on Form 10-Q and current reports on Form 8-K) and proxy and information statements filed with the Securities and Exchange Commission (SEC) are available through a link from the Company's website to the SEC website. All such information is available as soon as reasonably practicable after it has been electronically filed. Filings can also be obtained free of charge by contacting the Company or through the SEC's website at http://www.sec.gov or by contacting the SEC's Office of FOIA/PA Operations at 100 F Street N.E., Washington, DC 20549-2736, or calling the SEC at 1-800-SEC-0330.
BUSINESS SEGMENTS
The Company has three unique operating units, or divisions, that are also its reportable segments: Applied Technology Division (Applied Technology), Engineered Films Division (Engineered Films), and Aerostar Division (Aerostar). Many of the past and present product lines are an extension of technology and production methods developed in the original balloon business. Product lines have been grouped in these segments based on common technologies, production methods and inventories; however, more than one business segment may serve each of the product markets identified above. The Company measures the performance of its segments based on their operating income excluding administrative and general expenses. Other expense and income taxes are not allocated to individual operating segments, and assets not identifiable to an individual segment are included as corporate assets. Segment information is reported consistent with the Company's management reporting structure.
Business segment financial information is found on the following pages of this Annual Report on Form 10-K (Form 10-K): | |
16 | Business Segments |
20 | Results of Operations – Segment Analysis |
58 | Note 13 Business Segments and Major Customer Information |
Applied Technology
Applied Technology designs, manufactures, sells, and services innovative precision agriculture products and information management tools that help growers reduce costs and improve farm yields around the world. The Applied Technology product families include field computers, application controls, GPS-guidance and assisted-steering systems, automatic boom controls, planter controls, and harvest controls. As described more fully in Note 5 Acquisition of and Investments in Businesses and Technologies of the Notes to the Consolidated Financial Statements of this Form10-K, in May 2014, the Company completed the purchase of SBG Innovatie BV and its affiliate, Navtronics BVBA (collectively, SBG). The acquisition broadened Applied Technology Division's guided steering system product line by adding high-accuracy implement steering applications. Applied Technology's services include high-speed in-field Internet connectivity and cloud-based data management. The Company's investments in Site-Specific Technology Development Group, Inc. (SST), a software company, and the continued build-out of the Slingshot API platform have positioned Applied Technology to provide an information platform of choice that improves grower decision-making and business efficiencies for our agriculture retail partners.
Applied Technology sells its precision agriculture control products to both original equipment manufacturers (OEMs) and through aftermarket distribution in the United States and in most major agricultural areas around the world. Applied Technology has personnel and third-party distribution representatives located in the U.S. and key geographic areas throughout the world. The
3
Company's competitive advantage in this segment is designing and selling easy to use, reliable, and value-added products that are supported by an industry-leading service and support team.
Engineered Films
Engineered Films produces high-performance plastic films and sheeting for energy, agricultural, construction, geomembrane, and industrial applications.
Engineered Films sells plastic sheeting to independent third-party distributors in each of the various markets it serves. The Company extrudes a significant portion of the film converted for its commercial products and believes it is one of the largest sheeting converters in the United States in the markets it serves. The acquisition of Integra Plastics, Inc. described more fully in Note 5 Acquisition of and Investments in Businesses and Technologies of this Form 10-K expanded the Company's film production capacity, broadened its product offerings and enhanced conversion capabilities. Engineered Films believes its ability to both extrude and convert films allows it to provide a more customized solution to customer needs. A number of suppliers of sheeting compete with the Company on both price and product availability. Engineered Films is the Company's most capital-intensive business segment, requiring regular investments in new extrusion capacity along with printers and conversion equipment. This segment's capital expenditures were $8.2 million in fiscal 2015 , $ 6.7 million in fiscal 2014 , and $ 11.5 million in fiscal 2013 .
Aerostar
Aerostar serves aerospace and situational awareness markets and produces products as a contract manufacturing services provider. These manufactured products have included military parachutes, uniforms, and protective wear. Aerostar's proprietary products include high-altitude balloons, tethered aerostats and radar processing systems. These products can be integrated with additional third-party sensors to provide research, communications, and situational awareness to government and commercial customers. Aerostar's growth strategy emphasizes the design and manufacture of proprietary products in these markets and is winding down its contract manufacturing operations as planned. Net sales from proprietary products increased from $39.3 million in fiscal 2014 to $49.1 million in fiscal 2015. Net sales from contract manufacturing decreased from $51.3 million in fiscal 2014 to $31.7 million in fiscal 2015.
Aerostar sells to government agencies or commercial users as a prime or sub-contractor. The projects Aerostar bids on can be large-scale, with opportunities in the $10-$100 million range. These opportunities can result in volatility in Aerostar's results.
Through Vista Research, Inc. (Vista) and a separate business venture that is majority-owned by the Company, Aerostar pursues potential product and support services contracts for agencies and instrumentalities of the U.S. government. The acquisition of Vista in January 2012 positioned the Company to meet growing global demand for lower-cost detection and tracking systems used by government and law enforcement agencies. As a leading provider of surveillance systems that enhance the effectiveness of radar using sophisticated algorithms, Vista allows Aerostar to enhance its tethered aerostat security solutions.
MAJOR CUSTOMER INFORMATION
One customer, Brawler Industrial Fabrics (Brawler) accounted for 10% or more of consolidated sales in fiscal 2015. Sales to Brawler, a customer in the Engineered Films Division, accounted for 14% , 13% , and 11% of consolidated sales in fiscal years 2015 , 2014 , and 2013 .
SEASONAL WORKING CAPITAL REQUIREMENTS
Some seasonal demand exists in Applied Technology's agricultural market. Applied Technology builds product in the fall for winter and spring delivery. Certain sales to agricultural customers offer spring payment terms for fall and early winter shipments. The resulting fluctuations in inventory and accounts receivable have required, and may require, seasonal short-term financing.
FINANCIAL INSTRUMENTS
The principal financial instruments that the Company maintains are cash, cash equivalents, short-term investments, accounts receivable, accounts payable, and acquisition-related contingent payments. The Company manages the interest rate, credit and market risks associated with these accounts through periodic reviews of the carrying value of assets and liabilities and establishment of appropriate allowances in accordance with Company policies. The Company does not use off-balance sheet financing, except to enter into operating leases.
The Company uses derivative financial instruments to manage foreign currency risk. The use of these financial instruments has had no material effect on consolidated results of operations, financial condition, or cash flows.
4
RAW MATERIALS
The Company obtains a wide variety of materials from several vendors. Principal materials include numerous electronic components for Aerostar and Applied Technology, various plastic resins for Engineered Films, and fabrics for Aerostar. Engineered Films has experienced volatile resin prices over the past three years. Price increases could not always be passed on to customers due to weak demand and a competitive pricing environment. Aerostar experiences variability in lead times for components as business cycles impact demand. However, predicting future material volatility and the related potential impact on the Company is not possible.
PATENTS
The Company owns a number of patents. The Company does not believe that its business, as a whole, is materially dependent on any one patent or related group of patents. As the Company continues to develop more technology-based offerings, protection of the Company's intellectual property has become an increasingly important strategic objective. Along with a more aggressive posture toward patenting new technology and protecting trade secrets, the Company is tightening restrictions on the disclosure of our technology to industry and business partners to ensure that our technological edge is maintained and our markets for new products are protected.
RESEARCH AND DEVELOPMENT
The business segments conduct ongoing research and development efforts. Most of the Company's research and development expenditures are directed toward new products in the Applied Technology and Aerostar Divisions. Total Company research and development costs are presented in the Consolidated Statements of Income and Comprehensive Income.
ENVIRONMENTAL MATTERS
Except as described below, the Company believes that, in all material respects, it is in compliance with applicable federal, state and local environmental laws and regulations. Expenditures incurred in the past relating to compliance for operating facilities have not significantly affected the Company's capital expenditures, earnings, or competitive position.
In connection with the sale of substantially all of the assets of the Company's Glasstite, Inc. subsidiary in fiscal 2000, the Company agreed to assume responsibility for the investigation and remediation of any pre-October 29, 1999, environmental contamination at the Company's former Glasstite pickup-truck topper facility in Dunnell, Minnesota, as required by the Minnesota Pollution Control Agency (MPCA) or the United States Environmental Protection Agency.
The Company and the purchasers of the Company's Glasstite subsidiary conducted environmental assessments of the properties. Although these assessments continue to be evaluated by the MPCA on the basis of the data available, the Company believes that any activities that might be required as a result of the findings of the assessments will not have a material effect on the Company's results of operations, financial position or cash flows. The Company had $37 thousand accrued at January 31, 2015 , representing its best estimate of probable costs to be incurred related to these matters.
BACKLOG
As of February 1, 2015 , the Company's order backlog totaled approximately $26.7 million . Backlog amounts as of February 1, 2014 and 2013 were $51.8 million and $51.1 million , respectively. Because the length of time between order and shipment varies considerably by business segment and customers can change delivery schedules or potentially cancel orders, the Company does not believe that backlog, as of any particular date, is necessarily indicative of actual net sales for any future period.
EMPLOYEES
As of January 31, 2015 , the Company had approximately 1,200 employees. Following is a summary of active employees by segment: Applied Technology - 458 ; Engineered Films - 374 ; Aerostar - 263 ; and Corporate Services - 88 . Management believes its employee relations are satisfactory.
5
EXECUTIVE OFFICERS |
|
|
|
|
|
Name, Age and Position |
| Biographical Data |
Daniel A. Rykhus, 50 |
| Mr. Rykhus became the Company's President and Chief Executive Officer in 2010. He joined the Company in 1990 as Director of World Class Manufacturing, was General Manager of the Applied Technology Division from1998 through 2009, and served as Executive Vice President from 2004 through 2010. |
President and Chief Executive Officer |
| |
|
| |
|
|
|
Steven E. Brazones, 41 |
| On December 1, 2014, Steven Brazones joined the Company as its Vice President, Chief Financial Officer, and Treasurer. From 2002 to 2014, Mr. Brazones held a variety of positions with H.B. Fuller Company. Most recently, he served as H.B. Fuller's Americas regional Finance Director. Previously, he served as the Assistant Treasurer and the Director of Investor Relations. Prior to his tenure with H.B. Fuller, Mr. Brazones held various roles at Northwestern Growth. |
Vice President and Chief Financial Officer |
| |
|
| |
|
| |
|
|
|
Stephanie Herseth Sandlin, 44 |
| Ms. Herseth Sandlin joined the Company in August 2012 as General Counsel and Vice President of Corporate Development and also became the Company's Secretary in March 2013. Prior to joining the Company, Ms. Herseth Sandlin was a partner at OFW Law in Washington, D.C. from 2011 to 2012 and served as South Dakota's lone member of the United States House of Representatives from 2004 through 2011. |
General Counsel and Vice President of Corporate Development |
| |
|
| |
|
|
|
Janet L. Matthiesen, 57 |
| Ms. Matthiesen joined the Company in 2010 as Director of Administration and has been the Company's Vice President of Human Resources since 2012. Prior to joining Raven, Ms. Matthiesen was a Human Resource Manager at Science Applications International Corporation from 2002 to 2010. |
Vice President of Human Resources |
| |
|
| |
|
|
|
Matthew T. Burkhart, 39 |
| Mr. Burkhart was named Division Vice President and General Manager of the Applied Technology Division in 2010. He joined the Company in 2008 as Director of Sales and became General Manager - Applied Technology Division in 2009. Prior to joining the Company, he was a Branch Manager for Johnson Controls. |
Division Vice President and General Manager - |
| |
Applied Technology Division |
| |
|
|
|
Anthony D. Schmidt, 43 |
| Mr. Schmidt was named Division Vice President and General Manager of the Engineered Films Division in 2012. He joined the Company in 1995 in the Applied Technology Division performing various leadership roles within manufacturing and engineering. He transitioned to Engineered Films Division in 2011 as Manufacturing Manager. |
Division Vice President and General Manager - |
| |
Engineered Films Division |
| |
|
|
|
Lon E. Stroschein, 40 |
| Mr. Stroschein was named Vice President and General Manager of the Aerostar Division in 2010. He joined the Company in 2008 as International Sales Manager for Applied Technology. Prior to joining the Company, he was a bank vice president and was a member of the executive staff for a U.S. Senator. |
Division Vice President and General Manager - |
| |
Aerostar Division |
| |
ITEM 1A. | RISK FACTORS |
RISKS RELATING TO THE COMPANY
The Company's business is subject to many risks. Set forth below are the most important risks that we face. In evaluating our business and your investment in us, you should also consider the other information presented in or incorporated by reference into this Annual Report on Form 10-K.
Weather conditions could affect certain of the Company's markets such as agriculture and construction.
The Company's Applied Technology Division is largely dependent on the ability of farmers and agricultural subcontractors known as custom operators to purchase agricultural equipment that includes its products. If such farmers experience adverse weather conditions resulting in poor growing conditions, or experience unfavorable crop prices or expenses, potential buyers may be less likely to purchase agricultural equipment. Accordingly, weather conditions may adversely affect sales in the Applied Technology Division.
6
Weather conditions can also adversely affect sales in the Company's Engineered Films Division. To the extent weather conditions curtail construction or agricultural activity, sales of the segment's plastic sheeting will likely decrease.
Price fluctuations in and shortages of raw materials could have a significant impact on the Company's ability to sustain and grow earnings.
The Company's Engineered Films Division consumes significant amounts of plastic resin, the costs of which reflect market prices for natural gas and oil and other market forces. These prices are subject to worldwide supply and demand as well as other factors beyond the control of the Company. Although the Engineered Films Division is sometimes able to pass such price increases to its customers, significant variations in the cost of plastic resins can affect the Company's operating results from period to period. Unusual supply disruptions, such as caused by a natural disaster, could cause suppliers to invoke "force majeure" clauses in their supply agreements, causing shortages of material. Success in offsetting higher raw material costs with price increases is largely influenced by competitive and economic conditions and could vary significantly depending on the market served. If the Company is not able to fully offset the effects of material availability and costs, financial results could be adversely affected.
Electronic components, used by both the Applied Technology Division and Aerostar Division, are sometimes in short supply, impacting our ability to meet customer demand.
If a supplier of raw materials or components were unable to deliver due to shortage or financial difficulty, any of the Company's segments could be adversely affected.
Fluctuations in commodity prices can increase our costs and decrease our sales.
Agricultural income levels are affected by agricultural commodity prices and input costs. As a result, changes in commodity prices that reduce agricultural income levels could have a negative effect on the ability of growers and their contractors to purchase the Company's precision agriculture products manufactured by its Applied Technology Division.
Exploration for oil and natural gas fluctuates with their price. Plastic sheeting manufactured and sold by our Engineered Films Division is sold as pit and pond liners to contain water used in the drilling process. Lower prices for oil and natural gas could reduce exploration activities and demand for our products. Plastic sheeting manufacturing uses plastic resins, which can be subject to changes in price as the cost of natural gas or oil changes. Accordingly, volatility in oil and natural gas prices may negatively affect our cost of goods sold or cause us to change prices, which could adversely affect our sales and profitability.
Failure to develop and market new technologies and products could impact the Company's competitive position and have an adverse effect on the Company's financial results.
The Company's operating results in Applied Technology, Engineered Films, and Aerostar depend upon the ability to renew the pipeline of new products and to bring those products to market. This ability could be adversely affected by difficulties or delays in product development such as the inability to identify viable new products, successfully complete research and development, obtain relevant regulatory approvals, obtain intellectual property protection or gain market acceptance of new products and services. Because of the lengthy development process, technological challenges and intense competition, there can be no assurance that any of the products the Company is currently developing, or could begin to develop in the future, will achieve substantial commercial success. Technical advancements in products may also increase the risk of product failure, increasing product returns or warranty claims and settlements. In addition, sales of the Company's new products could replace sales of some of its current products, offsetting the benefit of even a successful product introduction.
The Company's sales of proprietary products are subject to uncertainties, start-up costs and inefficiencies and both competitive and compliance risks.
The Company's sales of proprietary products, which are specialized and highly technical in nature, are subject to uncertainties, start-up costs and inefficiencies as well as market, competitive, and compliance risks.
The Company's growth strategy emphasizes the design and manufacture of proprietary products while transitioning its contract manufacturing services capabilities principally to support proprietary market opportunities. For Aerostar in particular, this transition from contract manufacturing services could take too long or be unsuccessful. Further, highly technical, specialized product inventories may be more susceptible to fluctuations in market demand. If demand is unexpectedly low, write-downs or impairments of such inventory may become necessary. Either of these outcomes could adversely affect our results of operations.
The Company's contract electronic manufacturing services business and sewing businesses in the Aerostar Division have been dependent on the continued growth, viability and financial stability of a small group of customers. Aerostar is moving to transform itself into a proprietary manufacturer and service provider. To compete effectively, Aerostar must continue to provide technologically advanced products and services, maintain strict quality standards, respond flexibly and rapidly to customer needs and deliver products globally on a reliable basis at competitive prices. Start-up costs and inefficiencies can adversely affect operating results and such costs may not be recoverable in a proprietary product environment, because the Company may not
7
receive reimbursement from its customers for such costs. Reductions in the Company's existing contract revenues, unless offset by other programs and opportunities, will adversely affect its ability to sustain and grow its future sales and earnings.
Future sales will be dependent on the success of Aerostar's growth drivers, including advanced radar systems, high-altitude balloons, and aerostats to international markets. Sales of certain of these products into international markets increase the compliance risk associated with regulations such as The International Traffic in Arms Regulations (ITAR), as well as others, exposing the Company to fines and its employees to fines, imprisonment or civil penalties. Potential consequences of a material violation of such regulations include damage to our reputation, litigation, and increased costs. These consequences could adversely affect our results of operations.
The Company's Aerostar segment depends on the U.S. government for a significant portion of its sales, creating uncertainty in the timing of and funding for projected contracts.
A significant portion of Aerostar's sales are to the U.S. government or U.S. government agencies as a prime or sub-contractor. Government spending has historically been cyclical. A decrease in U.S. government defense or near-space research spending or changes in spending allocation could result in one or more of the Company's programs being reduced, delayed, or terminated. Reductions in the Company's existing programs, unless offset by other programs and opportunities, could adversely affect its ability to sustain and grow its future sales and earnings. The Company's U.S. government sales are funded by the federal budget, which operates on an October-to-September fiscal year. Changes in congressional schedules, negotiations for program funding levels, reduced program funding due to U.S government debt limitations, automatic budget cuts ("sequestration") or unforeseen world events can interrupt the funding for a program or contract. Funds for multi-year contracts can be changed in subsequent years in the appropriations process.
In addition, the U.S. government has increasingly relied on indefinite delivery, indefinite quantity (IDIQ) contracts and other procurement vehicles that are subject to a competitive bidding and funding process even after the award of the basic contract, adding an additional element of uncertainty to future funding levels. Delays in the funding process or changes in funding can impact the timing of available funds or can lead to changes in program content or termination at the government's convenience. The loss of anticipated funding or the termination of multiple or large programs could have an adverse effect on the Company's future sales and earnings.
The Company derives a portion of its revenues from foreign markets, which subjects the Company to business risks, including risk of changes in government policies and laws or worldwide economic conditions.
The Company's sales outside the U.S. were $36.8 million in fiscal 2015, representing 10% of consolidated net sales. The Company's financial results could be affected by changes in trade, monetary and fiscal policies, laws and regulations, or other activities of U.S. and non-U.S. governments, agencies and similar organizations, along with changes in worldwide economic conditions. These conditions include, but are not limited to, changes in a country's or region's economic or political condition; trade regulations affecting production, pricing and marketing of products; local labor conditions and regulations; reduced protection of intellectual property rights in some countries; changes in the regulatory or legal environment; restrictions on currency exchange activities; the impact of fluctuations in foreign currency exchange rates, which may affect product demand and may adversely affect the profitability of our products in U.S. dollars in foreign markets where payments are made in the local currency; burdensome taxes and tariffs; and other trade barriers. International risks and uncertainties also include changing social and economic conditions, terrorism, political hostilities and war, difficulty in enforcing agreements or collecting receivables, and increased transportation or other shipping costs. Any of these such risks could lead to reduced sales and reduced profitability associated with such sales.
Adverse economic conditions in the major industries the Company serves may materially affect segment performance and consolidated results of operations.
The Company's results of operations are impacted by the market fundamentals of the primary industries served. Significant declines of economic activity in the agricultural, oil and gas exploration, construction, industrial, aerospace/aviation, communication, defense and other major markets served may adversely affect segment performance and consolidated results of operations.
The Company may not be able to achieve the benefits of its restructuring efforts.
Supplementing the actions taken in the fourth quarter of fiscal 2015, on March 10, 2015 we announced an additional plan to restructure our business to lower the cost structure of each of our business segments to address current end-market weakness. There is no guarantee that these restructuring efforts will increase our operating margins or profitability and these efforts could cause unforeseen complexities and additional cash outflows.
The Company may pursue or complete acquisitions which represent additional risk and could impact future financial results.
The Company's business strategy includes the potential for future acquisitions. Acquisitions involve a number of risks including integration of the acquired company with the Company's operations and unanticipated liabilities or contingencies related to the acquired company. Further, business strategies supported by the acquisition may be in perceived, or actual, opposition to strategies
8
of certain of our customers and our business could be materially adversely affected if those relationships are terminated and the expected strategic benefits are delayed or are not achieved. The Company cannot ensure that the expected benefits of any acquisition will be realized. Costs could be incurred on pursuits or proposed acquisitions that have not yet or may not close which could significantly impact the operating results, financial condition or cash flows. Additionally, after the acquisition, unforeseen issues could arise which adversely affect the anticipated returns or which are otherwise not recoverable as an adjustment to the purchase price. Other acquisition risks include delays in realizing benefits from the acquired companies or products; difficulties due to lack of or limited prior experience in any new product or geographic markets we enter; unforeseen adjustments, charges or write-offs; unforeseen losses of customers of, or suppliers to, acquired businesses; difficulties in retaining key employees of the acquired businesses; or challenges arising from increased geographic diversity and complexity of our operations and our information technology systems.
Total goodwill and intangible assets account for approximately $70.6 million, or 19%, of the Company's total assets as of January 31, 2015. The Company evaluates goodwill and intangible assets for impairment annually, or when evidence of potential impairment exists. The annual impairment test is based on several factors requiring judgment. Principally, a significant decrease in expected cash flows or changes in market conditions may indicate potential impairment of recorded goodwill or intangible assets. Our expected future cash flows could be adversely impacted if our anticipated sales growth is not realized. An impairment would adversely impact the Company's results of operations and financial condition.
The Company may fail to continue to attract, develop and retain key management and other key employees, which could negatively impact our operating results.
We depend on the performance of our senior management team and other key employees, including experienced and skilled technical personnel. The loss of certain members of our senior management, including our Chief Executive Officer, could negatively impact our operating results and ability to execute our business strategy. Our future success will also depend in part upon our ability to attract, train, motivate, and retain qualified personnel.
The Company may fail to protect its intellectual property effectively, or may infringe upon the intellectual property of others .
The Company has developed significant proprietary technology and other rights that are used in its businesses. The Company relies on trade secret, copyright, trademark, and patent laws and contractual provisions to protect the Company's intellectual property. While the Company takes enforcement of these rights seriously, other companies such as competitors, or analogous persons in markets the Company does not participate, may attempt to copy or use the Company's intellectual property for their own benefit.
In addition, intellectual property of others also has an impact on the Company's ability to offer some of its products and services for specific uses or at competitive prices. Competitors' patents or other intellectual property may limit the Company's ability to offer products and services to its customers. Any infringement or claimed infringement of the intellectual property rights of others could result in litigation and adversely affect the Company's ability to continue to provide, or could increase the cost of providing, products and services.
Intellectual property litigation is very costly and could result in substantial expense and diversions of the Company's resources, both of which could adversely affect its businesses and financial condition and results. In addition, there may be no effective legal recourse against infringement of the Company's intellectual property by third parties, whether due to limitations on enforcement of rights in foreign jurisdictions or as a result of other factors.
Technology failures or cyber-attacks on the Company's systems could disrupt the Company's operations or the functionality of its products and negatively impact the Company's business.
The Company increasingly relies on information technology systems to process, transmit, and store electronic information. In addition, a significant portion of internal communications, as well as communication with customers and suppliers depends on information technology. Further, the products in our Applied Technology segment depend upon GPS and other systems through which our products interact with government computer systems and other centralized information sources. We are exposed to the risk of cyber incidents in the normal course of business. Cyber incidents may be deliberate attacks for the theft of intellectual property or other sensitive information or may be the result of unintentional events. Like most companies, the Company's information technology systems may be vulnerable to interruption due to a variety of events beyond the Company's control, including, but not limited to, natural disasters, terrorist attacks, telecommunications failures, computer viruses, hackers, and other security issues. Further, attacks on centralized information sources could affect the operation of our products or cause them to malfunction. The Company has technology security initiatives and disaster recovery plans in place to mitigate the Company's risk to these vulnerabilities, but these measures may not be adequate or implemented properly to ensure that the Company's operations are not disrupted. Potential consequences of a material cyber incident include damage to our reputation, litigation, and increased cyber security protection and remediation costs. Such consequences could adversely affect our results of operations.
9
ITEM 1B. | UNRESOLVED STAFF COMMENTS |
None.
ITEM 2. | PROPERTIES |
Raven's corporate office is at an owned premises located in Sioux Falls, South Dakota. The Company also owns separate manufacturing facilities for each of our business segments as well as various warehouses, training, and product development facilities.
In addition to these facilities, Applied Technology owns a product development facility in Austin, Texas and a manufacturing facility in St. Louis, Missouri as well as leasing smaller research and office facilities in South Dakota. As a result of an acquisition completed in fiscal 2015 more fully described in Note 5 Acquisitions of and Investments in Businesses and Technologies of this Form 10-K, Applied Technology also leases manufacturing, research, and office facilities in Middenmeer, Netherlands and Geel, Belgium.
As a result of a business acquisition completed in fiscal 2015 more fully described in Note 5 Acquisitions of and Investments in Businesses and Technologies of this Form 10-K, Engineered Films acquired additional production and conversion facilities in Madison and Brandon, South Dakota and Midland, Texas.
Aerostar has additional owned manufacturing, sewing, and research facilities located in Huron and Madison, South Dakota, and Sulphur Springs, Texas. Aerostar's subsidiary Vista also leases facilities in Arlington, Virginia; Duncansville, Pennsylvania and Monterey, Chatsworth and Sunnyvale, California.
Most of the Company's manufacturing plants also serve as distribution centers and contain offices for sales, engineering, and manufacturing support staff. The Company believes that its properties are suitable and adequate to meet existing production needs. Additionally, the productive capacity in the Company's facilities is substantially being utilized. The Company also owns approximately 29.6 acres of undeveloped land adjacent to the other owned property, which is available for expansion.
The following is the approximate square footage of the Company's owned or leased facilities by segment: Applied Technology - 182,000; Engineered Films - 584,000; Aerostar - 383,000; and Corporate - 150,000.
ITEM 3. | LEGAL PROCEEDINGS |
The Company is responsible for investigation and remediation of environmental contamination at one of its sold facilities (see Item 1, Business - Environmental Matters of this Form 10-K). In addition, the Company is involved as a defendant in lawsuits, claims, regulatory inquiries, or disputes arising in the normal course of its business. The potential costs and liability of such claims cannot be determined at this time. Management believes that any liability resulting from these claims will be substantially mitigated by insurance coverage. Accordingly, management does not believe the ultimate outcome of these matters will be significant to its results of operations, financial position or cash flows.
ITEM 4. | MINE SAFETY DISCLOSURES |
Not applicable.
10
PART II |
|
|
|
ITEM 5. | MARKET FOR REGISTRANT'S COMMON EQUITY, RELATED SHAREHOLDER MATTERS AND ISSUER PURCHASES OF EQUITY SECURITIES |
The Company's common stock is traded on the NASDAQ Global Select Market under the symbol RAVN. The following table shows quarterly unaudited financial results, quarterly high and low sales prices per share of the Company's common stock, as reported by NASDAQ, and dividends declared for the periods indicated:
QUARTERLY INFORMATION (UNAUDITED) | |||||||||||||||||||||||||||||||
(Dollars in thousands, except per-share amounts) | |||||||||||||||||||||||||||||||
| Net Sales | Gross Profit | Operating Income | Pre-tax Income | Net Income Attributable to Raven | Net Income Per Share (a) (b) | Common Stock Market Price (b) | Cash Dividends Per Share (b) | |||||||||||||||||||||||
| |||||||||||||||||||||||||||||||
| Basic | Diluted | High | Low | |||||||||||||||||||||||||||
FISCAL 2015 |
|
|
|
|
|
|
|
|
|
| |||||||||||||||||||||
First Quarter | $ | 102,510 | | $ | 31,766 | | $ | 16,532 | | $ | 16,453 | | $ | 11,038 | | $ | 0.30 | | $ | 0.30 | | $ | 40.06 | | $ | 30.29 | | $ | 0.12 | | |
Second Quarter | 94,485 | | 25,658 | | 10,696 | | 10,637 | | 7,719 | | 0.21 | | 0.21 | | 34.56 | | 27.75 | | 0.12 | | |||||||||||
Third Quarter | 91,292 | | 24,339 | | 10,159 | | 10,087 | | 6,783 | | 0.19 | | 0.18 | | 30.74 | | 22.13 | | 0.13 | | |||||||||||
Fourth Quarter | 89,866 | | 21,483 | | 6,414 | | 6,324 | | 6,193 | | 0.16 | | 0.16 | | 26.56 | | 20.75 | | 0.13 | | |||||||||||
Total Year | $ | 378,153 | | $ | 103,246 | | $ | 43,801 | | $ | 43,501 | | $ | 31,733 | | $ | 0.86 | | $ | 0.86 | | $ | 40.06 | | $ | 20.75 | | $ | 0.50 | | |
|
|
|
|
|
|
|
|
|
|
| |||||||||||||||||||||
FISCAL 2014 |
|
|
|
|
|
|
|
|
|
| |||||||||||||||||||||
First Quarter | $ | 103,680 | | $ | 34,916 | | $ | 20,934 | | $ | 20,736 | | $ | 14,003 | | $ | 0.38 | | $ | 0.38 | | $ | 34.04 | | $ | 25.46 | | $ | 0.12 | | |
Second Quarter | 93,421 | | 26,735 | | 12,568 | | 12,349 | | 8,333 | | 0.23 | | 0.23 | | 35.68 | | 28.82 | | 0.12 | | |||||||||||
Third Quarter | 104,938 | | 31,940 | | 18,132 | | 18,089 | | 12,289 | | 0.34 | | 0.34 | | 34.83 | | 28.38 | | 0.12 | | |||||||||||
Fourth Quarter | 92,638 | | 25,763 | | 12,360 | | 12,449 | | 8,278 | | 0.23 | | 0.23 | | 42.99 | | 32.64 | | 0.12 | | |||||||||||
Total Year | $ | 394,677 | | $ | 119,354 | | $ | 63,994 | | $ | 63,623 | | $ | 42,903 | | $ | 1.18 | | $ | 1.17 | | $ | 42.99 | | $ | 25.46 | | $ | 0.48 | | |
|
|
|
|
|
|
|
|
|
|
| |||||||||||||||||||||
FISCAL 2013 |
|
|
|
|
|
|
|
|
|
| |||||||||||||||||||||
First Quarter | $ | 117,915 | | $ | 41,135 | | $ | 28,432 | | $ | 28,380 | | $ | 19,043 | | $ | 0.53 | | $ | 0.52 | | $ | 35.56 | | $ | 28.16 | | $ | 0.105 | | |
Second Quarter | 101,674 | | 30,064 | | 17,407 | | 17,311 | | 11,546 | | 0.32 | | 0.32 | | 37.73 | | 28.59 | | 0.105 | | |||||||||||
Third Quarter | 97,011 | | 29,575 | | 16,372 | | 16,316 | | 10,859 | | 0.30 | | 0.30 | | 34.61 | | 26.78 | | 0.105 | | |||||||||||
Fourth Quarter | 89,575 | | 26,899 | | 15,481 | | 15,639 | | 11,097 | | 0.31 | | 0.30 | | 28.19 | | 23.01 | | 0.105 | | |||||||||||
Total Year | $ | 406,175 | | $ | 127,673 | | $ | 77,692 | | $ | 77,646 | | $ | 52,545 | | $ | 1.45 | | $ | 1.44 | | $ | 37.73 | | $ | 23.01 | | $ | 0.42 | | |
(a) | Net income per share is computed discretely by quarter and may not add to the full year. | ||||||||||||||||||||||||||||||
(b) | All per-share and market data reflect the July 2012 two-for-one stock split. | ||||||||||||||||||||||||||||||
As of January 31, 2015 , the Company had approximately 13,900 beneficial holders, which includes a substantial amount of the Company's common stock held of record by banks, brokers, and other financial institutions.
On November 3, 2014, the Company announced that its Board of Directors had authorized a $40.0 million stock buyback program.
No shares have been repurchased under this program as of January 31, 2015.
# 11
COMPARISON OF 5-YEAR CUMULATIVE TOTAL RETURN AMONG RAVEN INDUSTRIES, INC.,
S&P 1500 INDUSTRIAL MACHINERY INDEX AND RUSSELL 2000 INDEX
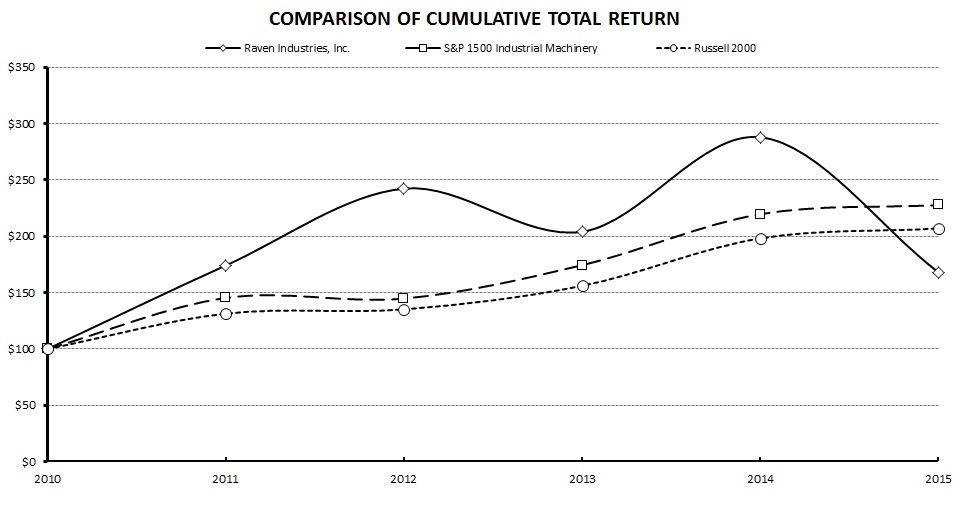
The above graph compares the cumulative total shareholders return on the Company's stock with the cumulative return of the S&P 1500 Industrial Machinery Index and the Russell 2000 index. Investors who bought $100 of the Company's stock on January 31, 2010 , held this for five years and reinvested the dividends would have seen its value increase to $167.94 . Stock performance on the graph is not necessarily indicative of future price performance.
|
| Years Ended January 31, |
| 5-Year | |||||||||||||||||||||||
Company / Index |
| 2010 |
| 2011 |
| 2012 |
| 2013 |
| 2014 |
| 2015 |
| CAGR (a) | |||||||||||||
|
|
|
|
|
|
|
|
|
|
|
|
|
|
| |||||||||||||
Raven Industries, Inc. |
| $ | 100.00 | |
| $ | 174.13 | |
| $ | 242.35 | |
| $ | 204.08 | |
| $ | 287.99 | |
| $ | 167.94 | |
| 10.9 | % |
S&P 1500 Industrial Machinery Index |
| 100.00 | |
| 145.29 | |
| 144.75 | |
| 174.35 | |
| 219.66 | |
| 227.73 | |
| 17.9 | % | ||||||
Russell 2000 Index |
| 100.00 | |
| 131.36 | |
| 135.12 | |
| 156.03 | |
| 198.20 | |
| 206.94 | |
| 15.7 | % | ||||||
(a) compound annual growth rate (CAGR) |
|
|
|
|
|
|
|
|
|
|
|
| |||||||||||||||
# 12
(This page is intentionally left blank)
# 13
ITEM 6. | SELECTED FINANCIAL DATA |
ELEVEN-YEAR FINANCIAL SUMMARY | ||||||||||||
(In thousands, except employee counts and per-share amounts) |
| For the years ended January 31, | ||||||||||
|
| 2015 |
| 2014 |
| 2013 | ||||||
OPERATIONS |
|
|
|
|
|
| ||||||
Net sales |
| $ | 378,153 | |
| $ | 394,677 | |
| $ | 406,175 | |
Gross profit |
| 103,246 | |
| 119,354 | |
| 127,673 | | |||
Operating income |
| 43,801 | |
| 63,994 | |
| 77,692 | | |||
Income before income taxes |
| 43,501 | |
| 63,623 | |
| 77,646 | | |||
Net income attributable to Raven Industries, Inc. |
| 31,733 | |
| 42,903 | |
| 52,545 | | |||
Net income % of sales |
| 8.4 | % |
| 10.9 | % |
| 12.9 | % | |||
Net income % of average equity |
| 11.4 | % |
| 18.2 | % |
| 26.2 | % | |||
Cash dividends (a) |
| $ | 18,519 | |
| $ | 17,465 | |
| $ | 15,244 | |
FINANCIAL POSITION |
|
|
|
|
|
| ||||||
Current assets |
| $ | 170,979 | |
| $ | 169,405 | |
| $ | 156,748 | |
Current liabilities |
| 31,843 | |
| 29,819 | |
| 33,061 | | |||
Working capital |
| $ | 139,136 | |
| $ | 139,586 | |
| $ | 123,687 | |
Current ratio |
| 5.37 | |
| 5.68 | |
| 4.74 | | |||
Property, plant and equipment |
| $ | 117,513 | |
| $ | 98,076 | |
| $ | 81,238 | |
Total assets |
| 362,873 | |
| 301,819 | |
| 273,210 | | |||
Long-term debt, less current portion |
| - | |
| - | |
| - | | |||
Raven Industries, Inc. shareholders' equity |
| $ | 305,153 | |
| $ | 251,362 | |
| $ | 221,346 | |
Long-term debt / total capitalization |
| - | % |
| - | % |
| - | % | |||
Inventory turnover (cost of sales / average inventory) |
| 4.9 | |
| 5.2 | |
| 5.4 | | |||
CASH FLOWS PROVIDED BY (USED IN) |
|
|
|
|
|
| ||||||
Operating activities |
| $ | 60,083 | |
| $ | 52,836 | |
| $ | 76,456 | |
Investing activities |
| (29,986 | ) |
| (31,615 | ) |
| (29,930 | ) | |||
Financing activities |
| (30,665 | ) |
| (17,354 | ) |
| (23,007 | ) | |||
Change in cash |
| (1,038 | ) |
| 3,634 | |
| 23,511 | | |||
COMMON STOCK DATA |
|
|
|
|
|
| ||||||
EPS - basic |
| $ | 0.86 | |
| $ | 1.18 | |
| $ | 1.45 | |
EPS - diluted |
| 0.86 | |
| 1.17 | |
| 1.44 | | |||
Cash dividends per share (a) |
| 0.50 | |
| 0.48 | |
| 0.42 | | |||
Book value per share (b) |
| 8.01 | |
| 6.89 | |
| 6.09 | | |||
Stock price range during the year |
|
|
|
|
|
| ||||||
High |
| $ | 40.06 | |
| $ | 42.99 | |
| $ | 37.73 | |
Low |
| 20.75 | |
| 25.46 | |
| 23.01 | | |||
Close |
| $ | 21.44 | |
| $ | 37.45 | |
| $ | 26.93 | |
Shares and stock units outstanding, year-end |
| 38,119 | |
| 36,492 | |
| 36,326 | | |||
Number of shareholders, year-end |
| 13,861 | |
| 11,764 | |
| 10,439 | | |||
OTHER DATA |
|
|
|
|
|
| ||||||
Price / earnings ratio (c) |
| 24.9 | |
| 32.0 | |
| 18.7 | | |||
Average number of employees |
| 1,251 | |
| 1,264 | |
| 1,350 | | |||
Sales per employee |
| $ | 302 | |
| $ | 312 | |
| $ | 301 | |
Backlog |
| $ | 26,718 | |
| $ | 51,793 | |
| $ | 51,121 | |
|
|
|
|
|
|
| ||||||
All per-share, shares outstanding and market price data reflect the July 2012 two-for-one stock split and the October 2004 two-for-one stock split. | ||||||||||||
| ||||||||||||
(a) Includes special dividends of $0.625 per share in fiscal 2011 and 2009 and $0.3125 per share in fiscal 2005. | ||||||||||||
(b) Raven Industries, Inc. shareholders' equity, excluding equity attributable to noncontrolling interests, divided by common shares and stock units outstanding. | ||||||||||||
(c) Closing stock price divided by EPS - diluted. |
|
|
|
|
|
| ||||||
# 14
|
|
|
|
|
|
|
|
|
|
|
|
|
|
| ||||||||||||||||
|
|
|
|
|
|
|
|
|
|
|
|
|
|
| ||||||||||||||||
2012 |
| 2011 |
| 2010 |
| 2009 |
| 2008 |
| 2007 |
| 2006 |
| 2005 | ||||||||||||||||
|
|
|
|
|
|
|
|
|
|
|
|
|
|
| ||||||||||||||||
$ | 381,511 | |
| $ | 314,708 | |
| $ | 237,782 | |
| $ | 279,913 | |
| $ | 233,957 | |
| $ | 217,529 | |
| $ | 204,528 | |
| $ | 168,086 | |
116,192 | |
| 91,429 | |
| 67,852 | |
| 73,448 | |
| 63,676 | |
| 57,540 | |
| 55,714 | |
| 45,212 | | ||||||||
75,641 | |
| 60,203 | |
| 43,220 | |
| 46,394 | |
| 41,145 | |
| 38,302 | |
| 37,284 | |
| 27,862 | | ||||||||
75,698 | |
| 60,282 | |
| 43,322 | |
| 46,901 | |
| 42,224 | |
| 38,835 | |
| 37,494 | |
| 27,955 | | ||||||||
50,569 | |
| $ | 40,537 | |
| $ | 28,574 | |
| $ | 30,770 | |
| $ | 27,802 | |
| $ | 25,441 | |
| $ | 24,262 | |
| $ | 17,891 | | |
13.3 | % |
| 12.9 | % |
| 12.0 | % |
| 11.0 | % |
| 11.9 | % |
| 11.7 | % |
| 11.9 | % |
| 10.6 | % | ||||||||
31.4 | % |
| 29.5 | % |
| 23.2 | % |
| 26.6 | % |
| 25.7 | % |
| 27.9 | % |
| 32.3 | % |
| 27.0 | % | ||||||||
$ | 13,025 | |
| $ | 34,095 | |
| $ | 9,911 | |
| $ | 31,884 | |
| $ | 7,966 | |
| $ | 6,507 | |
| $ | 5,056 | |
| $ | 15,298 | |
|
|
|
|
|
|
|
|
|
|
|
|
|
|
| ||||||||||||||||
$ | 147,559 | |
| $ | 128,181 | |
| $ | 117,747 | |
| $ | 98,073 | |
| $ | 100,869 | |
| $ | 73,219 | |
| $ | 71,345 | |
| $ | 61,592 | |
40,646 | |
| 34,335 | |
| 25,960 | |
| 23,322 | |
| 22,108 | |
| 16,464 | |
| 20,050 | |
| 20,950 | | ||||||||
$ | 106,913 | |
| $ | 93,846 | |
| $ | 91,787 | |
| $ | 74,751 | |
| $ | 78,761 | |
| $ | 56,755 | |
| $ | 51,295 | |
| $ | 40,642 | |
3.63 | |
| 3.73 | |
| 4.54 | |
| 4.21 | |
| 4.56 | |
| 4.45 | |
| 3.56 | |
| 2.94 | | ||||||||
$ | 61,894 | |
| $ | 41,522 | |
| $ | 33,029 | |
| $ | 35,880 | |
| $ | 35,743 | |
| $ | 36,264 | |
| $ | 25,602 | |
| $ | 19,964 | |
245,703 | |
| 187,760 | |
| 170,309 | |
| 144,415 | |
| 147,861 | |
| 119,764 | |
| 106,157 | |
| 88,509 | | ||||||||
- | |
| - | |
| - | |
| - | |
| - | |
| - | |
| 9 | |
| - | | ||||||||
$ | 180,499 | |
| $ | 141,214 | |
| $ | 133,251 | |
| $ | 113,556 | |
| $ | 118,275 | |
| $ | 98,268 | |
| $ | 84,389 | |
| $ | 66,082 | |
- | % |
| - | % |
| - | % |
| - | % |
| - | % |
| - | % |
| - | % |
| - | % | ||||||||
5.4 | |
| 5.6 | |
| 5.3 | |
| 5.2 | |
| 5.3 | |
| 5.4 | |
| 5.9 | |
| 5.8 | | ||||||||
|
|
|
|
|
|
|
|
|
|
|
|
|
|
| ||||||||||||||||
$ | 43,831 | |
| $ | 42,085 | |
| $ | 47,643 | |
| $ | 39,037 | |
| $ | 27,151 | |
| $ | 26,313 | |
| $ | 21,189 | |
| $ | 18,871 | |
(40,313 | ) |
| (11,418 | ) |
| (13,396 | ) |
| (7,000 | ) |
| (4,433 | ) |
| (18,664 | ) |
| (11,435 | ) |
| (7,631 | ) | ||||||||
(15,234 | ) |
| (33,834 | ) |
| (9,867 | ) |
| (36,969 | ) |
| (8,270 | ) |
| (10,277 | ) |
| (6,946 | ) |
| (19,063 | ) | ||||||||
(11,721 | ) |
| (3,121 | ) |
| 24,417 | |
| (5,005 | ) |
| 14,489 | |
| (2,626 | ) |
| 2,790 | |
| (7,823 | ) | ||||||||
|
|
|
|
|
|
|
|
|
|
|
|
|
|
| ||||||||||||||||
$ | 1.40 | |
| $ | 1.12 | |
| $ | 0.79 | |
| $ | 0.86 | |
| $ | 0.77 | |
| $ | 0.71 | |
| $ | 0.67 | |
| $ | 0.50 | |
1.39 | |
| 1.12 | |
| 0.79 | |
| 0.85 | |
| 0.77 | |
| 0.70 | |
| 0.66 | |
| 0.49 | | ||||||||
0.36 | |
| 0.95 | |
| 0.28 | |
| 0.89 | |
| 0.22 | |
| 0.18 | |
| 0.14 | |
| 0.43 | | ||||||||
4.97 | |
| 3.91 | |
| 3.69 | |
| 3.15 | |
| 3.26 | |
| 2.73 | |
| 2.34 | |
| 1.84 | | ||||||||
|
|
|
|
|
|
|
|
|
|
|
|
|
|
| ||||||||||||||||
$ | 34.65 | |
| $ | 24.80 | |
| $ | 16.59 | |
| $ | 23.91 | |
| $ | 22.93 | |
| $ | 21.35 | |
| $ | 16.58 | |
| $ | 13.47 | |
21.62 | |
| 13.27 | |
| 7.69 | |
| 10.30 | |
| 13.10 | |
| 12.73 | |
| 8.27 | |
| 6.54 | | ||||||||
$ | 32.45 | |
| $ | 23.62 | |
| $ | 14.29 | |
| $ | 10.91 | |
| $ | 15.01 | |
| $ | 14.22 | |
| $ | 15.80 | |
| $ | 9.19 | |
36,284 | |
| 36,178 | |
| 36,102 | |
| 36,054 | |
| 36,260 | |
| 36,088 | |
| 36,144 | |
| 35,998 | | ||||||||
10,618 | |
| 7,456 | |
| 7,767 | |
| 8,268 | |
| 8,700 | |
| 8,992 | |
| 9,263 | |
| 6,269 | | ||||||||
|
|
|
|
|
|
|
|
|
|
|
|
|
|
| ||||||||||||||||
23.4 | |
| 21.1 | |
| 18.1 | |
| 12.8 | |
| 19.6 | |
| 20.5 | |
| 23.9 | |
| 18.9 | | ||||||||
1,252 | |
| 1,036 | |
| 930 | |
| 1,070 | |
| 930 | |
| 884 | |
| 845 | |
| 835 | | ||||||||
$ | 305 | |
| $ | 304 | |
| $ | 256 | |
| $ | 262 | |
| $ | 252 | |
| $ | 246 | |
| $ | 242 | |
| $ | 201 | |
$ | 66,641 | |
| $ | 75,972 | |
| $ | 74,718 | |
| $ | 80,361 | |
| $ | 66,628 | |
| $ | 44,237 | |
| $ | 43,619 | |
| $ | 43,646 | |
|
|
|
|
|
|
|
|
|
|
|
|
|
|
| ||||||||||||||||
|
|
|
|
|
|
|
|
|
|
|
|
|
|
| ||||||||||||||||
|
|
|
|
|
|
|
|
|
|
|
|
|
|
| ||||||||||||||||
|
|
|
|
|
|
|
|
|
|
|
|
|
|
| ||||||||||||||||
|
|
|
|
|
|
|
|
|
|
|
|
|
|
| ||||||||||||||||
|
|
|
|
|
|
|
|
|
|
|
|
|
|
| ||||||||||||||||
# 15
BUSINESS SEGMENTS |
|
|
|
|
|
|
|
|
|
|
|
| ||||||||||||
(Dollars in thousands) |
|
|
|
|
|
|
|
|
|
|
|
| ||||||||||||
|
| For the years ended January 31, | ||||||||||||||||||||||
|
| 2015 |
| 2014 |
| 2013 |
| 2012 |
| 2011 |
| 2010 | ||||||||||||
APPLIED TECHNOLOGY DIVISION |
|
|
|
|
|
|
|
|
|
|
|
| ||||||||||||
Sales |
| $ | 142,154 | |
| $ | 170,461 | |
| $ | 171,778 | |
| $ | 145,261 | |
| $ | 107,910 | |
| $ | 94,005 | |
Operating income |
| 34,557 | |
| 57,000 | |
| 59,590 | |
| 49,750 | |
| 33,197 | |
| 27,538 | | ||||||
Assets |
| 88,764 | |
| 93,395 | |
| 84,224 | |
| 73,872 | |
| 55,740 | |
| 54,007 | | ||||||
Capital expenditures |
| 3,478 | |
| 9,324 | |
| 10,780 | |
| 11,971 | |
| 1,947 | |
| 1,092 | | ||||||
Depreciation and amortization |
| 5,569 | |
| 4,332 | |
| 3,874 | |
| 2,571 | |
| 2,483 | |
| 1,863 | | ||||||
ENGINEERED FILMS DIVISION |
|
|
|
|
|
|
|
|
|
|
|
| ||||||||||||
Sales |
| $ | 166,634 | |
| $ | 147,620 | |
| $ | 141,976 | |
| $ | 133,481 | |
| $ | 105,838 | |
| $ | 63,783 | |
Operating income (b) |
| 21,802 | |
| 18,154 | |
| 25,115 | |
| 21,501 | |
| 19,622 | |
| 10,232 | | ||||||
Assets |
| 140,023 | |
| 71,602 | |
| 65,801 | |
| 65,100 | |
| 46,519 | |
| 35,999 | | ||||||
Capital expenditures |
| 8,241 | |
| 6,681 | |
| 11,539 | |
| 10,937 | |
| 8,450 | |
| 1,460 | | ||||||
Depreciation and amortization |
| 6,096 | |
| 5,808 | |
| 5,814 | |
| 4,313 | |
| 3,452 | |
| 3,707 | | ||||||
AEROSTAR DIVISION |
|
|
|
|
|
|
|
|
|
|
|
| ||||||||||||
Sales |
| $ | 80,772 | |
| $ | 90,605 | |
| $ | 102,051 | |
| $ | 107,811 | |
| $ | 104,384 | |
| $ | 81,617 | |
Operating income |
| 8,983 | |
| 7,816 | |
| 10,341 | |
| 18,308 | |
| 17,209 | |
| 12,849 | | ||||||
Assets |
| 59,274 | |
| 63,017 | |
| 60,689 | |
| 72,089 | |
| 38,366 | |
| 28,665 | | ||||||
Capital expenditures |
| 2,799 | |
| 7,507 | |
| 2,081 | |
| 4,105 | |
| 2,621 | |
| 471 | | ||||||
Depreciation and amortization |
| 3,474 | |
| 2,616 | |
| 2,272 | |
| 1,684 | |
| 1,335 | |
| 1,151 | | ||||||
INTERSEGMENT ELIMINATIONS |
|
|
|
|
|
|
|
|
|
|
|
| ||||||||||||
Sales |
|
|
|
|
|
|
|
|
|
|
|
| ||||||||||||
Applied Technology Division |
| $ | (231 | ) |
| $ | (386 | ) |
| $ | (974 | ) |
| $ | (460 | ) |
| $ | (226 | ) |
| $ | (31 | ) |
Engineered Films Division |
| (652 | ) |
| (505 | ) |
| (124 | ) |
| (193 | ) |
| (307 | ) |
| (210 | ) | ||||||
Aerostar Division |
| (10,524 | ) |
| (13,118 | ) |
| (8,532 | ) |
| (4,389 | ) |
| (2,891 | ) |
| (1,382 | ) | ||||||
Operating income |
| 163 | |
| (111 | ) |
| (61 | ) |
| (188 | ) |
| (41 | ) |
| 8 | | ||||||
Assets |
| (148 | ) |
| (311 | ) |
| (347 | ) |
| (286 | ) |
| (98 | ) |
| (57 | ) | ||||||
CORPORATE & OTHER |
|
|
|
|
|
|
|
|
|
|
|
| ||||||||||||
Operating (loss) from administrative expenses |
| $ | (21,704 | ) |
| $ | (18,865 | ) |
| $ | (17,293 | ) |
| $ | (13,730 | ) |
| $ | (9,784 | ) |
| $ | (7,407 | ) |
Assets (a) |
| 74,960 | |
| 74,116 | |
| 62,843 | |
| 34,928 | |
| 47,233 | |
| 51,695 | | ||||||
Capital expenditures |
| 2,523 | |
| 7,189 | |
| 5,275 | |
| 2,002 | |
| 954 | |
| 279 | | ||||||
Depreciation and amortization |
| 2,230 | |
| 1,439 | |
| 1,138 | |
| 700 | |
| 361 | |
| 387 | | ||||||
TOTAL COMPANY |
|
|
|
|
|
|
|
|
|
|
|
| ||||||||||||
Sales |
| $ | 378,153 | |
| $ | 394,677 | |
| $ | 406,175 | |
| $ | 381,511 | |
| $ | 314,708 | |
| $ | 237,782 | |
Operating income (b) |
| 43,801 | |
| 63,994 | |
| 77,692 | |
| 75,641 | |
| 60,203 | |
| 43,220 | | ||||||
Assets |
| 362,873 | |
| 301,819 | |
| 273,210 | |
| 245,703 | |
| 187,760 | |
| 170,309 | | ||||||
Capital expenditures |
| 17,041 | |
| 30,701 | |
| 29,675 | |
| 29,015 | |
| 13,972 | |
| 3,302 | | ||||||
Depreciation and amortization |
| 17,369 | |
| 14,195 | |
| 13,098 | |
| 9,268 | |
| 7,631 | |
| 7,108 | | ||||||
| ||||||||||||||||||||||||
(a) Assets are principally cash, investments, deferred taxes and other receivables. |
|
| ||||||||||||||||||||||
(b) The year ended January 31, 2011 includes a $451 pre-tax gain on disposition of assets. |
|
| ||||||||||||||||||||||
# 16
ITEM 7. | MANAGEMENT'S DISCUSSION AND ANALYSIS OF FINANCIAL CONDITION AND RESULTS OF OPERATIONS |
The Management's Discussion and Analysis of Financial Condition and Results of Operations (MD&A) is designed to enhance overall financial disclosure with commentary on the operating results, liquidity, capital resources, and financial condition of Raven Industries, Inc. (the Company or Raven). This commentary provides management's analysis of the primary drivers of year-over-year changes in key financial statement elements, business segment results, and the impact of accounting principles on the Company's financial statements. The most significant risks and uncertainties impacting the operating performance and financial condition of the Company are discussed in Item 1A., Risk Factors, of this Annual Report on Form 10-K (Form 10-K).
This discussion should be read in conjunction with Raven's Consolidated Financial Statements and notes thereto in Item 8 of this Form 10-K.
The MD&A is organized as follows:
• | Executive Summary |
• | Results of Operations - Segment Analysis |
• | Outlook |
• | Liquidity and Capital Resources |
• | Off-balance Sheet Arrangements and Contractual Obligations |
• | Critical Accounting Estimates |
• | Accounting Pronouncements |
EXECUTIVE SUMMARY
Raven is a diversified technology company providing a variety of products to customers within the industrial, agricultural, energy, construction, aerospace and situational awareness markets. The Company is comprised of three unique operating units, classified into reportable segments: Applied Technology Division, Engineered Films Division, and Aerostar Division. As strategic actions have changed the Company's business over the last several years, Raven has remained committed to providing high-quality, high-value products. The Company's performance reflects our ongoing adjustment to conditions and opportunities.
Management uses a number of metrics to assess the Company's performance:
• | Consolidated net sales, gross margins, operating income, operating margins, net income, and earnings per share |
• | Cash flow from operations and shareholder returns |
• | Return on sales, assets, and equity |
• | Segment net sales, gross profit, gross margins, operating income, and operating margins |
Raven's growth strategy focuses on its proprietary product lines and the Company has made an intentional choice to move away from non-strategic product lines such as contract manufacturing. To assess the effectiveness of this strategy during the transition period, management is using two additional measures:
• | Consolidated net sales excluding contract manufacturing sales (adjusted sales) |
• | Segment net sales excluding contract manufacturing sales (adjusted sales) |
Information reported as net sales excluding contract manufacturing sales on both a consolidated and segment basis, exclude sales generated from contract manufacturing activities and do not conform to generally accepted accounting principles (GAAP). These non-GAAP measures should not be construed as an alternative to the reported results determined in accordance with GAAP. Management has included this non-GAAP information to assist in understanding the operating performance of the Company and its operating segments as well as the comparability of results. This non-GAAP information provided may not be consistent with the methodologies used by other companies. All non-GAAP information is reconciled with reported GAAP results in the tables below.
Vision and Strategy
At Raven, there is a singular purpose behind everything we do. It is: to solve great challenges. Great challenges require great solutions. Raven's three unique divisions share resources, ideas, and a passion to create technology that helps the world grow more food, produce more energy, protect the environment, and live safely.
# 17
The Raven business model is our platform for success. Our business model is defensible, sustainable, and gives us a consistent approach in the pursuit of quality financial results. This overall approach to creating value, which is employed across the three business segments, is summarized as follows:
• | Intentionally serve a set of diversified market segments with attractive near- and long-term growth prospects; |
• | Consistently manage a pipeline of growth initiatives within our market segments; |
• | Aggressively compete on quality, service, innovation, and peak performance; |
• | Hold ourselves accountable for continuous improvement; |
• | Value our balance sheet as a source of strength and stability with which to pursue strategic acquisitions; and |
• | Make corporate responsibility a top priority. |
This diversified business model enables us to better weather near-term challenges, while continuing to grow and build for our future. It is our culture and it is woven into how we do business.
The following discussion highlights the consolidated operating results. Segment operating results are more fully explained in the Results of Operations - Segment Analysis section.
|
| For the years ended January 31, | ||||||||||||||||
dollars in thousands, except per-share data |
| 2015 |
| % change |
| 2014 |
| % change |
| 2013 | ||||||||
Results of Operations |
|
|
|
|
|
|
|
|
|
| ||||||||
Net sales |
| $ | 378,153 | |
| (4.2 | )% |
| $ | 394,677 | |
| (2.8 | )% |
| $ | 406,175 | |
Gross margins (a) |
| 27.3 | % |
|
|
| 30.2 | % |
|
|
| 31.4 | % | |||||
Operating income |
| $ | 43,801 | |
| (31.6 | )% |
| $ | 63,994 | |
| (17.6 | )% |
| $ | 77,692 | |
Operating margins (a) |
| 11.6 | % |
|
|
| 16.2 | % |
|
|
| 19.1 | % | |||||
Net income attributable to Raven Industries, Inc. |
| $ | 31,733 | |
| (26.0 | )% |
| $ | 42,903 | |
| (18.4 | )% |
| $ | 52,545 | |
Diluted income per share (b) |
| $ | 0.86 | |
| (26.5 | )% |
| $ | 1.17 | |
| (18.8 | )% |
| $ | 1.44 | |
|
|
|
|
|
|
|
|
|
|
| ||||||||
Consolidated net sales, excluding contract manufacturing sales (c) |
| $ | 351,205 | |
| 1.8 | % |
| $ | 344,919 | |
| (2.3 | )% |
| $ | 353,004 | |
|
|
|
|
|
|
|
|
|
|
| ||||||||
|
|
|
|
|
|
|
|
|
|
| ||||||||
Cash Flow and Payments to Shareholders |
|
|
|
|
|
|
|
|
|
| ||||||||
Cash flow from operating activities |
| $ | 60,083 | |
|
|
| $ | 52,836 | |
|
|
| $ | 76,456 | | ||
Cash outflow for capital expenditures |
| $ | 17,041 | |
|
|
| $ | 30,701 | |
|
|
| $ | 29,675 | | ||
Cash dividends |
| $ | 18,519 | |
|
|
| $ | 17,465 | |
|
|
| $ | 15,244 | | ||
|
|
|
|
|
|
|
|
|
|
| ||||||||
Performance Measures |
|
|
|
|
|
|
|
|
|
| ||||||||
Return on net sales (d) |
| 8.4 | % |
|
|
| 10.9 | % |
|
|
| 12.9 | % | |||||
Return on average assets (e) |
| 9.5 | % |
|
|
| 14.9 | % |
|
|
| 20.3 | % | |||||
Return on average equity (f) |
| 11.4 | % |
|
|
| 18.2 | % |
|
|
| 26.2 | % | |||||
|
|
|
|
|
|
|
|
|
|
| ||||||||
|
|
|
|
|
|
|
|
|
|
| ||||||||
(a) The Company's gross and operating margins may not be comparable to industry peers due to variability in the classification of expenses | ||||||||||||||||||
across industries in which the Company operates. | ||||||||||||||||||
(b) Diluted income per share reflects a two-for-one stock split effective July 25, 2012. | ||||||||||||||||||
(c) Non-GAAP measure reconciled to GAAP in the table below. | ||||||||||||||||||
(d) Net income divided by sales. | ||||||||||||||||||
(e) Net income divided by average assets. | ||||||||||||||||||
(f) Net income divided by average equity. | ||||||||||||||||||
# 18
The following table reconciles the reported net sales to adjusted sales, a non-GAAP financial measure. Adjusted sales excludes contract manufacturing and represents the Company's sales from proprietary products.
|
| For the years ended January 31, | |||||||||||||||||
|
|
|
| % change |
|
|
| % change |
|
|
| ||||||||
dollars in thousands |
| 2015 |
|
| 2014 |
|
| 2013 |
| ||||||||||
Applied Technology |
|
|
|
|
|
|
|
|
|
|
| ||||||||
Reported net sales |
| $ | 142,154 | |
| (16.6 | )% |
| $ | 170,461 | |
| (0.8 | )% |
| $ | 171,778 | |
|
Less: Contract manufacturing sales |
| 5,832 | |
| (48.5 | )% |
| 11,324 | |
| (29.2 | )% |
| 15,998 | |
| |||
Applied Technology net sales, excluding contract manufacturing sales |
| $ | 136,322 | |
| (14.3 | )% |
| $ | 159,137 | |
| 2.2 | % |
| $ | 155,780 | |
|
|
|
|
|
|
|
|
|
|
|
|
| ||||||||
Aerostar |
|
|
|
|
|
|
|
|
|
|
| ||||||||
Reported net sales |
| $ | 80,772 | |
| (10.9 | )% |
| $ | 90,605 | |
| (11.2 | )% |
| $ | 102,051 | |
|
Less: Contract manufacturing sales |
| 31,669 | |
| (38.3 | )% |
| 51,311 | |
| 6.5 | % |
| 48,195 | |
| |||
Aerostar net sales, excluding contract manufacturing sales |
| $ | 49,103 | |
| 25.0 | % |
| $ | 39,294 | |
| (27.0 | )% |
| $ | 53,856 | |
|
|
|
|
|
|
|
|
|
|
|
|
| ||||||||
Consolidated Raven |
|
|
|
|
|
|
|
|
|
|
| ||||||||
Reported net sales |
| $ | 378,153 | |
| (4.2 | )% |
| $ | 394,677 | |
| (2.8 | )% |
| $ | 406,175 | |
|
Less: Contract manufacturing sales |
| 37,501 | |
| (40.1 | )% |
| 62,635 | |
| (2.4 | )% |
| 64,193 | |
| |||
Plus: Aerostar sales to Applied Technology |
| 10,553 | |
| (18.0 | )% |
| 12,877 | |
| 16.8 | % |
| 11,022 | |
| |||
Consolidated net sales, excluding contract manufacturing sales |
| $ | 351,205 | |
| 1.8 | % |
| $ | 344,919 | |
| (2.3 | )% |
| $ | 353,004 | |
|
|
|
|
|
|
|
|
|
|
|
|
| ||||||||
Results of Operations - Fiscal 2015 compared to Fiscal 2014
The Company's net sales in fiscal 2015 were $378.2 million, a decrease of $16.5 million, or 4%, from last year's net sales of $394.7 million. The Company's operating income decreased 32% from $64.0 million in fiscal 2014 to $43.8 million in fiscal 2015. Engineered Films' sales and operating profit increased. Aerostar's operating income increased despite lower net sales. These increases in operating income were offset by declines in Applied Technology, which is facing difficult end-market conditions. The Company is completing the exit of low-growth contract manufacturing business, which resides in both Applied Technology and Aerostar, and is working to grow its strategic proprietary product sales both organically and through acquisition. The challenges faced in the agricultural markets have resulted in an opportunity to rebalance the Company's profit mix by aggressively growing both the Aerostar and Engineered Films divisions. While Applied Technology's operating income decreased 39%, Aerostar's operating income grew 15% and Engineered Films' operating income increased 20%.
Engineered Films' fiscal 2015 net sales were up 13% over fiscal 2014, primarily driven by the agricultural and construction markets and the acquisition of Integra Plastics Inc. (Integra) more fully described in Note 5 Acquisitions of and Investments in Business and Technologies of this Form 10-K. Integra contributed $5.6 million in net sales in fiscal 2015.
Applied Technology's net sales declined reflecting persistent weakness in the precision agriculture markets, both domestic and international, and the anticipated decline of contract manufacturing sales to non-strategic legacy customers. Net sales at Applied Technology were $142.2 million in fiscal 2015 compared to $170.5 million in the prior fiscal year.
Aerostar net sales decreased $9.8 million, or 11%, compared to fiscal 2014. The decrease was due primarily to a shift away from Aerostar's contract manufacturing business. Increased sales of proprietary products, such as lighter-than-air products, aerostat products, and Vista radar system sales partially offset these expected decreases. Excluding contract manufacturing sales, Aerostar's net sales were up 25% year-over-year.
Raven's growth strategy focuses on its proprietary product lines and the Company has made an intentional choice to move away from non-strategic product lines such as contract manufacturing. For fiscal 2015, Raven continued to show growth in these strategic proprietary product lines as net sales, excluding contract manufacturing sales, increased $6.3 million, or 2%, to $351.2 million as compared to $344.9 million in the prior year.
# 19
Fiscal 2015 operating income decreased 32% from fiscal 2014 due primarily to the overall sales decline, lower gross profit margins in Applied Technology, and higher Corporate general administration spending.
Applied Technology's operating income decreased by 39% due to lower sales volumes as well as continued strategic investment in pursuing growth through international markets, new product development, and broadening original equipment manufacturer (OEM) relationships.
Engineered Films' operating income increased 20% as a result of overall selling price increases, higher sales of more profitable value-added films, continued operating improvements, and leveraging the Company's reclaim production line.
Aerostar posted an increase of 15% from the prior year operating income due to a lower level of contract manufacturing revenue relative to net sales and less operating expenses.
Results of Operations - Fiscal 2014 compared to Fiscal 2013
The Company's net sales in fiscal 2014 were $394.7 million, a decrease of $11.5 million, or 3%, from prior year record net sales of $406.2 million. Changes in net sales levels varied across the divisions. Engineered Films' fiscal 2014 net sales were up 4% over fiscal 2013 with a strong second half, led by higher agricultural sales and a recovery in demand for pit liners in the energy market. Weaker demand in the U.S. aftermarket offset the impact of the introduction of new products and higher OEM demand and, as a result, Applied Technology's net sales declined 1% in fiscal 2014 compared to fiscal 2013. In Aerostar, higher radar sales and high-altitude balloon and service-related revenues were not enough to offset the expected lower contract manufacturing, parachutes and protective wear revenues. Overall, Aerostar net sales decreased 11% from fiscal 2013 to fiscal 2014.
Fiscal 2014 operating income decreased 18% from fiscal 2013 due primarily to the overall sales decline, lower gross profit margins, and higher investment in research and development (R&D) expenses across all divisions. Applied Technology's operating income decreased by 4% due to lower sales volumes and product mix. Substantially higher resin costs combined with market conditions that did not allow for pass-through costs caused Engineered Films' operating income to decrease 28%. Aerostar posted a decline of 24% from the prior year operating income primarily due to lower sales and higher operating expense.
Cash Flow and Payments to Shareholders
The Company continues to generate strong operating cash flows and maintain a strong capital base as reflected in the $52.2 million cash and short-term investments balance as of January 31, 2015. Capital expenditures totaled $17.0 million in fiscal 2015 compared to $30.7 million in fiscal 2014 . Capital spending consisted primarily of expenditures to expand Engineered Films' manufacturing capacity. Fiscal 2014 spending included approximately $11.5 million for renovation of the corporate headquarters which was completed in early fiscal 2015.
During fiscal 2015 , $18.5 million was returned to shareholders though quarterly dividends. In the third quarter of fiscal 2015, the quarterly dividend was raised from 12 cents per share to 13 cents per share. During fiscal 2014 , $17.5 million was returned to shareholders through quarterly dividends.
Performance Measures
Returns on net sales, average assets and average equity are important gauges of Raven's ability to efficiently produce profits. Although the Company's fiscal 2015 returns were not at the level of the prior two years' results, they have remained at competitive levels as the Company has capitalized on competitive advantages in niche markets while investing in future product development.
RESULTS OF OPERATIONS - SEGMENT ANALYSIS
Applied Technology
Applied Technology designs, manufactures, sells, and services innovative precision agriculture products and information management tools that help growers reduce costs, precisely control inputs, and improve yields for the global agriculture market.
# 20
Financial highlights for the fiscal years ended January 31, | ||||||||||||||||||
dollars in thousands |
| 2015 |
| % change |
| 2014 |
| % change |
| 2013 | ||||||||
Net sales |
| $ | 142,154 | |
| (16.6 | )% |
| $ | 170,461 | |
| (0.8 | )% |
| $ | 171,778 | |
Gross profit |
| 58,325 | |
| (26.6 | )% |
| 79,499 | |
| (1.7 | )% |
| 80,853 | | |||
Gross margins |
| 41.0 | % |
|
|
| 46.6 | % |
|
|
| 47.1 | % | |||||
Operating expense |
| $ | 23,768 | | | 5.6 | % |
| $ | 22,499 | |
| 5.8 | % |
| $ | 21,263 | |
Operating expense as % of sales |
| 16.7 | % |
|
|
| 13.2 | % |
|
|
| 12.4 | % | |||||
Operating income |
| $ | 34,557 | |
| (39.4 | )% |
| $ | 57,000 | |
| (4.3 | )% |
| $ | 59,590 | |
Operating margins |
| 24.3 | % |
|
|
| 33.4 | % |
|
|
| 34.7 | % | |||||
Applied Technology net sales, excluding contract manufacturing sales |
| $ | 136,322 | |
| (14.3 | )% |
| $ | 159,137 | |
| 2.2 | % |
| $ | 155,780 | |
Net sales decreased $28.3 million , or 17% , to $142.2 million and operating income was down $22.4 million , or 39% , to $34.6 million for fiscal 2015 compared to fiscal 2014 .
Fiscal 2015 fourth quarter net sales declined $9.9 million , or 27% , to $26.5 million and operating income decreased $7.4 million , or 68% , to $3.4 million compared to fourth quarter fiscal 2014 .
A number of factors contributed to the full-year and fourth-quarter comparative results:
• | Market conditions. Continued softness in the agriculture market put pressure on Applied Technology throughout fiscal 2015. With contraction of end-market demand becoming even more pronounced than expected, several OEMs are reducing production levels again and lowering their outlooks for the year. With historically high corn inventories, cyclically high input costs, and waning grower sentiment, demand remains subdued for precision agricultural equipment and is not expected to recover until late in fiscal 2016 at best. With the world's population growing toward nine billion and income growth in emerging economies, greater demand for food will ultimately support healthy growth. The Company continues to invest in growth internationally for the long term. Emerging agriculture markets abroad are at varying life cycle stages providing opportunities for Raven's precision agriculture products to meet market needs. |
• | Sales volume and new products. Persistent headwinds in the agriculture equipment markets continued in the fourth quarter. Lower end-market demand drove sales lower in most of Applied Technology's product lines for the fourth quarter and year-to-date. New product sales were also affected by lower levels of demand but contributed approximately $16.5 million of sales in fiscal 2015. These declines were partially offset by sales contributed by SBG since the acquisition in May 2014. Year-to-date sales declined 17% to $142.2 million as compared to $170.5 million in the prior year. The sales decline reflects both lower international sales and weakness in the North American precision agriculture equipment market, in particular with OEM sales as the aftermarket conditions were slightly better. |
• | Strategic Sales . Applied Technology's net sales, excluding contract manufacturing sales, for fiscal 2015 were $136.3 million, a decrease of $22.8 million, or 14%, compared to fiscal 2014 net sales, excluding contract manufacturing sales of $159.1 million. |
• | International sales. Net sales outside the U.S. accounted for 22% of segment sales in fiscal 2015 compared to 24% in fiscal 2014. International sales decreased $10.5 million, or 25%, to $31.3 million in fiscal 2015 compared to fiscal 2014. Lower sales in Brazil and Canada were the main drivers of the decline, partially offset by increased sales in South Africa and $3.2 million of European revenues from the acquisition of SBG in May 2014. For the fourth quarter, international sales totaled $3.1 million, a decrease of 55% from the prior year comparative quarter. |
• | Gross margins. Gross margins declined from 46.6% in fiscal 2014 to 41.0% in fiscal 2015. Similar declines occurred in the fourth quarter as the gross margin for the three-months ended January 31, 2015 was 33.5% compared to 44.4% in the prior year fourth quarter. Lower net sales, lower production levels, and higher warranty expense contributed to the lower gross margins. |
• | Operating expenses. Fiscal 2015 operating expenses were 16.7% of net sales compared to 13.2% for the prior year. This increase is attributable to higher spending in research and development (R&D) to preserve future growth opportunities on lower sales volumes. |
For fiscal 2014 , net sales decreased $1.3 million , or 1% , to $170.5 million and operating income of $57.0 million was down $2.6 million , or 4% , from $59.6 million in fiscal 2013 .
# 21
Several factors contributed to the results for fiscal 2014 as compared to fiscal 2013:
• | Market conditions. Apprehension given drought conditions and falling commodity prices put pressure on domestic demand through the second quarter of fiscal 2014. Aftermarket demand rose in the third quarter but did not persist through the fourth quarter at normal levels. OEM demand stayed robust for certain products. |
• | Sales volume and new products. Strong international OEM demand for guidance and steering products and boom controls contributed sales increases, but these increases were more than offset by the impact of weaker aftermarket demand in the U.S. and Canada resulting in the slight decrease in net sales for fiscal 2014. |
• | International sales. Net sales outside the U.S. accounted for 24% of segment sales in fiscal 2014 compared to 25% in fiscal 2013. International sales decreased $0.7 million, or 2%, to $41.7 million in fiscal 2014 compared to fiscal 2013. Product deliveries to Brazil increased year-over-year; however, lower demand in Canada, South Africa and Eastern Europe offset this increase. |
• | Gross margins. Gross margins declined from 47.1% in fiscal 2013 to 46.6% in fiscal 2014 due to lower sales and production levels. |
• | Operating expenses. Fiscal 2014 operating expenses were 13.2% of net sales compared to 12.4% for the prior year. The increase was attributable to higher spending in R&D on relatively flat sales volumes. |
Engineered Films
Engineered Films manufactures high performance plastic films and sheeting for energy, agricultural, construction, geomembrane, and industrial applications.
The Company acquired Integra Plastics, Inc. (Integra) in a merger agreement that was effective November 3, 2014, valued at approximately $48.2 million, net of debt assumed. This acquisition expanded Engineered Films' production capacity, broadened its product offerings, and enhanced current converting capabilities. Adding Integra's fabrication and conversion skill sets with Raven's ability to develop value-added innovative products better serves our customers, strengthens the profit contributed by Engineered Films, and expands our major markets: energy, agriculture, construction, geomembrane, and industrial.
Financial highlights for the fiscal years ended January 31, |
| ||||||||||||||||||
dollars in thousands |
| 2015 |
| % change |
| 2014 |
| % change |
| 2013 |
| ||||||||
Net sales |
| $ | 166,634 | |
| 12.9 | % |
| $ | 147,620 | |
| 4.0 | % |
| $ | 141,976 | |
|
Gross profit |
| 28,104 | |
| 19.1 | % |
| 23,592 | |
| (23.2 | )% |
| 30,726 | |
| |||
Gross margins |
| 16.9 | % |
|
|
| 16.0 | % |
|
|
| 21.6 | % |
| |||||
Operating expenses |
| $ | 6,302 | |
| 15.9 | % |
| $ | 5,438 | |
| (3.1 | )% |
| $ | 5,611 | |
|
Operating expenses as % of sales |
| 3.8 | % |
|
|
| 3.7 | % |
|
|
| 4.0 | % |
| |||||
Operating income |
| $ | 21,802 | |
| 20.1 | % |
| $ | 18,154 | |
| (27.7 | )% |
| $ | 25,115 | |
|
Operating margins |
| 13.1 | % |
|
|
| 12.3 | % |
|
|
| 17.7 | % |
| |||||
Net sales increased $19.0 million , or 13% , to $166.6 million while operating income was up 20% to $21.8 million for fiscal 2015 compared to $18.2 million for fiscal 2014 .
Fiscal 2015 fourth quarter net sales increased $5.3 million , or 15% , from $35.6 million in the fiscal 2014 fourth quarter and operating income of $4.6 million was $1.2 million , or 37% , higher than the prior year fourth quarter.
These year-over-year and fourth-quarter changes were primarily driven by the following factors:
• | Market conditions. The recent Integra acquisition better positions Engineered Films to adapt to sales channel changes and customers' complex conversion needs emerging in the energy market. Recent declines in oil prices have tempered demand for pit liners. While this decline challenges sales development in the energy end market, it has a favorable impact on raw materials costs for the division. Despite the overall slowness in the agricultural equipment market served by Applied Technology, demand has continued to strengthen for agriculture barrier films used in high-value crop production. Strength in the construction market and efforts to increase market share have created opportunities to meet shifting market conditions and offset competitive pressures in the energy market. |
• | Sales volume and selling prices . Fiscal 2015 net sales were up 13% to $166.6 million compared to fiscal 2014 net sales of $147.6 million. Net sales of construction film and barrier films for specific high-value agriculture applications were the primary drivers of these increases in fiscal 2015. Sales volume and selling prices for fiscal 2015 were up 5% and 7%, respectively, compared to the prior-year period. |
# 22
• | Integra acquisition. Net sales contributed to Engineered Films from the fourth-quarter Integra acquisition was $5.6 million. Without the acquisition, fourth-quarter net sales would have been down slightly due to the declines in the energy market. |
• | Gross margins. Fiscal 2015 gross margins were 17% - continuing the trend of higher gross margins than the second half of fiscal 2014. These margins reflect the impact of higher average selling prices, higher sales of more profitable value-added films, and continued operating improvements and leveraging the Company's reclaim production line. |
• | Operating expenses. Fiscal 2015 operating expenses as a percentage of net sales increased to 3.8%, compared to 3.7% in the prior year. Higher selling expenses over higher sales levels drove the year-over-year increase. |
For fiscal 2014 , net sales increased $5.6 million , or 4% , to $147.6 million while operating income was down $7.0 million , or 28% , to $18.2 million compared to fiscal 2013 .
Fiscal 2014 results were primarily driven by the following factors:
• | Market conditions. Beginning in the second quarter of fiscal 2014, demand strengthened for agriculture barrier films used in high-value crop production. The addition of new extrusion capacity earlier in fiscal 2014 was a key factor in meeting demand for these high-tech films. Demand for pit liners in our energy market, declining since the beginning of the second half of fiscal 2013, rebounded during the second half of fiscal 2014. |
• | Sales volume and selling prices . Fiscal 2014 net sales were up 4% to $147.6 million compared to fiscal 2013 net sales of $142.0 million. Sales volume (as measured by pounds shipped), fueled by sales of fumigation and silage films in the agriculture market, was up about 5% as compared to the prior year. Average selling prices were virtually flat. Agriculture market sales were up, offsetting energy market declines and the completion of a significant geomembrane reservoir project in Ohio in the prior year. |
• | Gross margins. Fiscal 2014 gross margins decreased almost six percentage points as compared to the prior year. These margins were impacted by substantially higher resin costs combined with market conditions that did not allow pass-through of these higher costs. |
• | Operating expenses. Fiscal 2014 operating expenses as a percentage of net sales decreased to 3.7%, compared to 4.0% in the prior year. In addition to the sales increase, the improved percentage was also impacted by lower R&D spending influenced by project timing. |
Aerostar
Aerostar serves aerospace and situational awareness markets and produces products as a contract manufacturing services provider. These products have included military parachutes, uniforms, and protective wear as well as electronics manufacturing services. Aerostar designs and manufactures proprietary products including high-altitude balloons, tethered aerostats, and radar processing systems. These products can be integrated with additional third-party sensors to provide research, communications, and situational awareness to government and commercial customers. Like Applied Technology, Aerostar is near completion of a planned exit of its low-growth contract manufacturing business to focus on growing strategic proprietary product sales.
Through Vista Research, Inc. (Vista) and a separate business venture that is majority-owned by the Company, Aerostar pursues potential product and support services contracts for agencies and instrumentalities of the U.S. and foreign governments. Vista positions the Company to meet growing global demand for lower-cost detection and tracking systems used by government and law enforcement agencies. As a leading provider of surveillance systems that enhance the effectiveness of radar using sophisticated algorithms, Vista products and services enhance Aerostar's security solutions.
Financial highlights for the fiscal years ended January 31, | ||||||||||||||||||
dollars in thousands |
| 2015 |
| % change |
| 2014 |
| % change |
| 2013 | ||||||||
Net sales |
| $ | 80,772 | |
| (10.9 | )% |
| $ | 90,605 | |
| (11.2 | )% |
| $ | 102,051 | |
Gross profit |
| 16,654 | |
| 1.7 | % |
| 16,374 | |
| 1.4 | % |
| 16,155 | | |||
Gross margins |
| 20.6 | % |
|
|
| 18.1 | % |
|
|
| 15.8 | % | |||||
Operating expenses |
| $ | 7,671 | |
| (10.4 | %) |
| $ | 8,558 | |
| 47.2 | % |
| $ | 5,814 | |
Operating expenses as % of sales |
| 9.5 | % |
|
|
| 9.4 | % |
|
|
| 5.7 | % | |||||
Operating income |
| $ | 8,983 | |
| 14.9 | % |
| 7,816 | |
| (24.4 | )% |
| 10,341 | | ||
Operating margins |
| 11.1 | % |
|
|
| 8.6 | % |
|
|
| 10.1 | % | |||||
Aerostar net sales, excluding contract manufacturing sales |
| $ | 49,103 | |
| 25.0 | % |
| $ | 39,294 | |
| (27.0 | )% |
| $ | 53,856 | |
# 23
Net sales declined 11% to $80.8 million from last year's net sales of $90.6 million. Operating income was $9.0 million up $1.2 million , or 15% , compared to fiscal 2014 .
Fiscal 2015 comparative results were primarily attributable to the following:
• | Market conditions . Certain of Aerostar's markets are subject to significant variability due to U.S. federal spending. Uncertain demand in these markets continued into fiscal 2015. Aerostar's growth strategy emphasizes proprietary products over contract manufacturing. Focus is on proprietary technology opportunities, including advanced radar systems, high-altitude balloons, and aerostats to international markets. Aerostar is pioneering leading-edge applications of its high-altitude balloons in collaboration with Google on Project Loon, a program to provide high-speed wireless Internet accessibility and telecommunications to rural, remote and under-served areas of the world. |
• | Sales volumes. Fiscal 2015 net sales decreased $9.8 million from the prior year, a year-over-year decrease of 11%. The drivers of this decline were lower sales of parachutes and planned declines in avionics sales and other contract manufacturing sales. These decreases were partially offset by higher Vista revenues for support activities under existing contracts and increased aerostat product and service revenues associated with a government contract. |
• | Proprietary net sales. As discussed previously, Aerostar's growth strategy centers on proprietary products. For fiscal 2015, net sales for proprietary products were $49.1 million; a $9.8 million, or 25%, increase from the prior fiscal year while contract manufacturing revenues declined $19.6 million, or 38%, from $51.3 million to $31.7 million. |
• | Gross margins. Gross margins increased from 18.1% in fiscal 2014 to 20.6% for fiscal 2015. Despite the lower sales levels, gross profit margins have continued to increase in fiscal 2015 compared to the prior year. This improvement in gross margins was favorably impacted by additional proprietary product revenues, including Vista radar sales that normally carry higher margins than other products, as well as efficiencies achieved on last-run contract manufacturing business. |
• | Operating expenses. Fiscal 2015 operating expenses of $7.7 million were 9.5% of net sales compared to $8.6 million, or 9.4% of net sales in fiscal 2014. Operating spending was constrained beginning in the second quarter, driving lower spending levels in fiscal 2015. |
For the fiscal 2015 fourth-quarter, net sales increased $0.7 million to $24.6 million from $23.9 million in the comparative period of 2014. Fourth quarter gross profit also improved, climbing to $5.9 million compared to $5.0 million in the fourth quarter of fiscal 2014. Operating income increased $2.0 million to $4.3 million compared to fiscal 2014 fourth quarter.
Several factors contributed to the fourth quarter comparative results:
• | Sales volume and gross margins . Fourth quarter sales were up $0.7 million, or 3%, to $24.6 million compared to the prior year fourth quarter. Higher Vista radar net sales and additional high altitude balloon deliveries helped increase net sales quarter-over-quarter and improve gross margins as these product lines carry a higher margin than contract manufacturing services as well as higher margins earned on contract manufacturing services and the production efficiencies on last-run production. |
• | Proprietary net sales. As discussed previously, Aerostar's growth strategy centers on proprietary products. For the fourth quarter of fiscal 2015, net sales for proprietary products were $15.8 million; a $2.7 million, or 21%, increase from the prior fiscal year fourth quarter. |
• | Operating expenses. Operating expenses were $1.6 million, or 6.7% of net sales in the fourth quarter, a decrease of $1.1 million from $2.7 million, or 11.3% of net sales in the prior comparative period. In the prior year fourth quarter, increased R&D spending associated with product development drove the percentage higher. |
For fiscal 2014 , net sales decreased $11.4 million, or 11% , to $90.6 million compared to fiscal 2013. Operating income declined $2.5 million , or 24% , to $7.8 million as compared to fiscal 2013 .
Fiscal 2014 results were driven by the following:
• | Market conditions . Certain of Aerostar's markets are subject to significant variability due to U.S. federal spending. Uncertain demand in these markets continued throughout fiscal 2013 and fiscal 2014. |
• | Sales volumes. Fiscal 2014 net sales decreased $11.4 million from the prior year, a year-over-year decrease of 11%. The drivers of this decline were lower sales of parachutes and protective wear and the planned reduction of contract manufacturing business. These decreases were partially offset by revenues for Project Loon, higher Vista product and services revenue and increased intercompany sourcing to Applied Technology. |
• | Gross margins. Gross margins increased from 15.8% in fiscal 2013 to 18.1% for fiscal 2014. Despite the lower sales levels, gross profit margins increased 2.3 percentage points in fiscal 2014 compared to the prior year. This improvement in gross margins resulted from the increased sales of higher-margin product lines and increased Vista sales. |
# 24
• | Operating expenses. Fiscal 2014 operating expenses of $8.6 million were 9.4% of sales and increased from $5.8 million or 5.7% of sales in fiscal 2013. Increased R&D spending associated with Project Loon and business development costs over lower sales volumes drove the percentage higher in the current year. |
Corporate Expenses (administrative expenses; other income (expense), net; and income taxes)
|
| For the years ended January 31, | ||||||||||
dollars in thousands |
| 2015 |
| 2014 |
| 2013 | ||||||
Administrative expenses |
| $ | 21,704 | |
| $ | 18,865 | |
| $ | 17,293 | |
Administrative expenses as a % of sales |
| 5.7 | % |
| 4.8 | % |
| 4.3 | % | |||
Other (expense) income, net |
| $ | (300 | ) |
| $ | (371 | ) |
| $ | (46 | ) |
Effective tax rate |
| 26.9 | % |
| 32.6 | % |
| 32.3 | % | |||
Administrative expenses increased $2.8 million in fiscal 2015 compared with fiscal 2014 . Much of this increase is attributable to the fourth quarter of fiscal 2015. Administration expense was $6.0 million compared to $4.1 million in the prior year fiscal fourth quarter. This fiscal and fourth quarter year-over-year increase is due primarily to acquisition and integration costs and higher depreciation.
Other income (expense), net consists primarily of activity related to the Company's equity investment, interest income, and foreign currency transaction gains or losses.
The fiscal 2015 effective tax rate of 26.9% was lower than the fiscal 2014 effective tax rate of 32.6%. The lower effective tax rate was due to a recognition of $0.8 million of incremental R&D tax credits based upon a tax study undertaken for fiscal years 2011 to 2014. The rate was also favorably impacted by a discrete tax benefit of $1.0 million recognized upon settlement of a state tax liability that occurred in fiscal 2015 fourth quarter.
OUTLOOK
At Raven our enduring success is built on our ability to balance the Company's purpose and core values with necessary shifts in business strategy demanded by an ever-changing world.
Difficult end-market conditions for Applied Technology and the portion of Engineered Films focused on the energy market are expected to persist through fiscal 2016. With high corn inventories, continued high input costs, waning grower sentiment, and OEMs reducing production levels and lowering their outlooks for the year, the Company does not expect a rebound in demand in Applied Technology's markets until late in the year at best. Further, this decline in end-market demand seems to be worsening in the first quarter of fiscal 2016. For Engineered Films, the recent and dramatic decline in oil prices impacted exploration activity and significantly decreased demand for the division's pit liners. Despite the favorable raw materials costs for Engineered Films as a whole, the Company faces significant headwinds with the energy market.
For Aerostar and Applied Technology, the exit of low-growth contract manufacturing business is near completion. This allows the Company to focus on growing strategic product sales both organically and through acquisition. Further, the challenges in agriculture have given the Company an opportunity to rebalance the profit mix by aggressively growing Engineered Films and Aerostar and that is a goal moving forward. As the Company transforms and evolves to capitalize on key growth opportunities, investment focus is on essential strategic initiatives that will directly fuel growth while continuing to reduce operating expenses.
While the Company is confident in the long-term view of the North American agricultural market, on March 10, 2015 it announced and implemented a $13.0 million restructuring plan to further lower Raven's cost structure. The cost reductions covered all divisions and included the corporate offices, but were heavily weighted to Applied Technology. This action was taken in addition to a $2.5 million preemptive restructuring of the Engineered Films Division taken in the fourth quarter of fiscal 2015 to address the expected decline in demand in the energy sector as the result of falling oil prices, as well as the previously announced $7.0 million restructuring in Applied Technology.
Actions included in the $7.0 million restructuring plan included initiating the exit of Applied Technology's contract manufacturing services business. Subsequent to the end of fiscal 2015, the Company announced that the manufacturing operations in the St. Louis, Missouri area had been successfully sold and transferred. This operation produced bed controls and was one of the final pieces for completing the runoff of contract manufacturing previously discussed. The Company's financial statements at January 31, 2015 do not reflect any accrued liabilities with respect to these restructuring plans.
# 25
These actions were part of a multi-faceted approach expected to lead to improved financial results. The second element is to leverage the underlying strengths of Engineered Films and Aerostar. Both continue to demonstrate strong profit growth profiles and the Company expects to capitalize on the investments that have been made in these divisions. Further, the Company will capitalize on the strength of its balance sheet position and pursue strategic acquisitions that support the growth plans of our existing divisions. And, finally, the Company will continue to take actions to optimize internal investments in each of the three operating divisions and ensure continued investment in projects with the greatest long-term growth potential.
Despite near-term challenges, the Company's financial objectives remain unchanged and we continue to target long-term growth in operating income of 10 to 12 percent. Raven is committed to strengthening its overall business, ultimately creating an even healthier corporation to drive long-term success.
LIQUIDITY AND CAPITAL RESOURCES
The Company's balance sheet continues to reflect significant liquidity and a strong capital base. Management focuses on the current cash balance and operating cash flows in considering liquidity, as operating cash flows have historically been the Company's primary source of liquidity. Management expects that current cash, combined with the generation of positive operating cash flows, will be sufficient to fund the Company's normal operating, investing and financing activities. Management believes borrowing capacity is available, if necessary, for a large acquisition or major business expansion.
The Company's cash needs are seasonal, with working capital demands strongest in the first quarter. As a result, the discussion of trends in operating cash flows focuses on the primary drivers of year-over-year variability in working capital.
Cash and cash equivalents totaled $51.9 million at January 31, 2015 compared to $53.0 million on the same date in 2014 , a decrease of $1.1 million. The decrease was driven by cash outflows for acquisitions, repayment of debt assumed for current year acquisitions, dividends paid to shareholders, and capital expenditures. These cash outflows were partially offset by positive cash flows from operating activities. Short-term investments were $0.3 million as of January 31, 2015 and 2014. The Company had no short-term investments at January 31, 2013.
At January 31, 2015 the Company held cash and cash equivalents of $4.3 million and $0.3 million of short-term investments in accounts outside the United States. These balances included undistributed earnings of foreign subsidiaries we consider to be indefinitely reinvested. If repatriated, undistributed earnings of $1.5 million would be subject to United States federal taxation. This estimated tax liability is approximately $0.2 million net of foreign tax credits. Our liquidity is not materially impacted by the amount held in accounts outside of the United States.
Raven has an uncollateralized credit agreement that provides a $10.5 million line of credit and expires November 30, 2016 . There is no outstanding balance under the line of credit at January 31, 2015 . The line of credit is reduced by outstanding letters of credit totaling $0.9 million as of January 31, 2015 . Among the conditions of the credit agreement is a requirement for the Company to maintain a current ratio (defined as current assets divided by current liabilities) not less than 2.0 to 1.0 at each fiscal quarter end. The Company is in compliance with all covenants set forth in the credit agreement.
Operating Activities
Operating cash flows result primarily from cash received from customers, which is offset by cash payments for inventories, services, employee compensation, and income taxes. Management evaluates working capital levels through the computation of average days sales outstanding and inventory turnover. Average days sales outstanding is a measure of the Company's efficiency in enforcing its credit policy. The inventory turnover ratio is a metric used to evaluate the effectiveness of inventory management, with further consideration given to balancing the disadvantages of excess inventory with the risk of delayed customer deliveries.
Cash provided by operating activities was $60.1 million in fiscal 2015 compared with $52.8 million in fiscal 2014 . The increase in operating cash flows is the result of less cash consumed by the change in accounts receivable and inventory. These corresponding increases in cash flow were partially offset by lower company earnings. While the Company's earnings were lower, these earnings reflected the impact of higher depreciation and amortization expense.
In fiscal 2015, inventory generated $6.8 million of cash versus consuming $9.2 million in fiscal 2014. The Company's inventory turnover rate decreased slightly from the prior year primarily due to the higher average inventory levels at Engineered Films (trailing 12-month inventory turn of 4.9X in fiscal 2015 and 5.2X in fiscal 2014). Cash collections were efficient despite the increase in trailing 12 months days sales outstanding of 52 days in fiscal 2015 compared to 51 days in fiscal 2014. Accounts receivable generated $4.7 million in cash in fiscal 2015 as compared to generating $1.3 million cash in fiscal 2014. In fiscal 2015,
# 26
uncertain tax positions consumed $3.3 million of cash compared to generating cash of $0.7 million in fiscal 2014 due to a payment made to settle a state tax liability.
In fiscal 2014, inventory consumed $9.2 million of cash versus generating $8.6 million in fiscal 2013. The Company's inventory turnover rate decreased slightly from the prior year primarily due to the higher inventory levels at Engineered Films (trailing 12-month inventory turn of 5.2X in fiscal 2014 and 5.4X in fiscal 2013). Cash collections were efficient despite the increase in trailing 12 months days sales outstanding of 51 days in fiscal 2014 compared to 50 days in fiscal 2013. Accounts receivable generated $1.3 million in cash in fiscal 2014 as compared to generating $4.4 million cash in fiscal 2013. Year-over-year variability in accounts payable and accrued liabilities consumed $1.9 million of cash in fiscal 2014 compared to cash consumed of $4.6 million in fiscal 2013 due to timing of trade payable payments.
Investing Activities
Cash used in investing activities totaled $30.0 million in fiscal 2015 , $31.6 million in fiscal 2014 and $29.9 million in fiscal 2013 . Capital expenditures totaled $17.0 million in fiscal 2015 compared to $30.7 million in fiscal 2014 and $29.7 million in fiscal 2013. The change from the prior fiscal year includes lower spending as a result of completion of the renovation of the Company's headquarters early in fiscal 2015.
Net capital outlay related to the Integra and SBG business acquisitions was $12.5 million during fiscal 2015. There were no businesses acquired in fiscal 2014 or fiscal 2013.
Management anticipates capital spending in the $13 - $15 million range in fiscal 2016. Expansion of Engineered Films' capacity and Applied Technology's capital spending to advance product development are expected to continue. In addition, management will evaluate strategic acquisitions that result in expanded capabilities and improved competitive advantages.
Financing Activities
Financing activities consumed cash of $30.7 million in fiscal 2015 compared with $17.4 million in fiscal 2014 and $23.0 million in fiscal 2013 .
Quarterly dividends paid in fiscal 2015 were $18.5 million , or $0.50 per share, compared to $ 17.5 million in fiscal 2014 and $15.2 million in fiscal 2013 . In the third quarter of fiscal 2015, the Company increased the quarterly dividend rate (excluding special dividends).
The Company made net debt repayments totaling $12.0 million for assumed debt as part of the Integra and SBG acquisitions in fiscal 2015. There was no debt outstanding at January 31, 2015. No borrowings or debt repayments occurred in fiscal 2014 or fiscal 2013.
During fiscal 2015 and fiscal 2014, the Company made payments of $0.5 million and $0.4 million, respectively, of acquisition-related contingent liabilities. In fiscal 2013, the Company paid $8.4 million on acquisition-related contingent liabilities.
On November 3, 2014, the Company announced that its Board of Directors had authorized a $40.0 million stock buyback program.
No shares have been repurchased under this program as of January 31, 2015.
OFF-BALANCE SHEET ARRANGEMENTS AND CONTRACTUAL OBLIGATIONS
As of January 31, 2015 , the Company is obligated to make cash payments in connection with its non-cancelable operating leases for facilities and equipment and unconditional purchase obligations, primarily for raw materials, in the amounts listed below. The Company's known off-balance sheet debt and other unrecorded obligations are noted in the table below.
# 27
A summary of the obligations and commitments at January 31, 2015 is shown below.
dollars in thousands |
| Total |
| Less than 1 year |
| 1-3 years |
| 3-5 years |
| More than 5 years | |||||||||||
Operating leases |
| $ | 8,687 | |
| $ | 1,913 | |
| $ | 3,023 | |
| $ | 2,424 | |
| $ | 1,327 | | |
Unconditional purchase obligations |
| 42,436 | |
| 42,436 | |
| - | |
| - | |
| - | | ||||||
Postretirement benefits (a) |
| 29,593 | |
| 313 | |
| 686 | |
| 752 | |
| 27,842 | | ||||||
Acquisition-related contingent payments (b) |
| 12,316 | |
| 1,455 | |
| 4,430 | |
| 6,411 | |
| 20 | | ||||||
Uncertain tax positions (c) |
| - | |
| - | |
| - | |
| - | |
| - | | ||||||
Line of credit (c) |
| - | |
| - | |
| - | |
| - | |
| - | | ||||||
|
| $ | 93,032 | |
| $ | 46,117 | |
| $ | 8,139 | |
| $ | 9,587 | |
| $ | 29,189 | | |
|
| ||||||||||||||||||||
|
| ||||||||||||||||||||
(a) | Postretirement benefit amounts represent expected payments on the accumulated postretirement benefit obligation before it is discounted. | ||||||||||||||||||||
(b) | Amounts reflect the future earn-out payments with respect to business acquisitions. Actual payments on these obligations may vary from the reported amounts since the total payment amount due depends upon certain future conditions. See below for further detail on the specific obligations. | ||||||||||||||||||||
(c) | See below for further details on specific obligations. | ||||||||||||||||||||
Acquisition-related obligations
The Company has future obligations for earn-out payments associated with the acquisition of Vista completed in fiscal 2012 and of SBG completed in fiscal 2015. The total liability recorded on the Consolidated Balance Sheet as of January 31, 2015 related to these future obligations was $5.0 million, of which $1.4 million was classified as "Accrued liabilities" and $3.6 million as "Other liabilities". These liabilities represent the present value of earn-out payments classified as consideration at the acquisition date. Specific to the SBG acquisition, the Company may pay up to $2.5 million in additional earn-out payments calculated and paid quarterly over the next 10 years contingent upon SBG achieving certain revenues. Specific to the Vista acquisition, the Company agreed to pay additional contingent consideration not to exceed $15.0 million, based upon earn-out percentages on specific revenue streams until January 31, 2019. In a transaction separate from the Vista acquisition, the Company agreed to fund a revenue-based bonus pool, also not to exceed $15.0 million, which will be accrued when the specific revenue stream is recorded using those same earn-out percentages.
Uncertain tax positions
Raven reported a total liability for uncertain tax positions of $3.3 million at January 31, 2015. The Company is not able to reasonably estimate the timing of future payments relating to these non-current tax benefits. This obligation is retired when the uncertain tax position is settled or applicable tax year is no longer subject to examination by the tax authorities.
Line of credit
Raven has an uncollateralized credit agreement with Wells Fargo Bank, N.A. (Wells Fargo) providing a line of credit of $10.5 million with a maturity date of November 30, 2016 , bearing interest at 1.5% above the daily one-month London Inter-Bank Market Rate. Letters of credit totaling $0.9 million have been issued under the line, primarily to support self-insured workers' compensation bonding requirements. No borrowings were outstanding as of January 31, 2015 , 2014 , or 2013 . Net of the outstanding letters of credit, $9.6 million was available under the line of credit at January 31, 2015 . There have been no borrowings under the credit line with Wells Fargo in the last three fiscal years.
Among the conditions of the credit agreement is a requirement for the Company to maintain a current ratio (defined as current assets divided by current liabilities) not less than 2.0 to 1.0 at each fiscal quarter end. The Company is in compliance with all covenants set forth in the credit agreement. In the event the bank chooses not to renew the Company's line of credit, the letters of credit would cease and alternative methods of support for the insurance obligations would be necessary, would be more expensive and would require additional cash outlays. Management believes the chances of this are remote.
CRITICAL ACCOUNTING ESTIMATES
Critical accounting policies are those that require the application of judgment when valuing assets and liabilities on the Company's balance sheet. These policies are discussed below because a fluctuation in actual results versus expected results could materially effect operating results and because the policies require significant judgments and estimates to be made. Accounting related to these policies is initially based on best estimates at the time of original entry in the accounting records. Adjustments are periodically recorded when the Company's actual experience differs from the expected experience underlying the estimates. These adjustments could be material if experience were to change significantly in a short period of time. The Company does not enter into derivatives
# 28
or other financial instruments for trading or speculative purposes. However, Raven has used derivative financial instruments to manage the economic impact of fluctuations in currency exchange rates on transactions that are denominated in currency other than its functional currency, which is the U.S. dollar. The use of these financial instruments had no material effect on the Company's financial condition, results of operations or cash flows.
Inventories
The Company estimates inventory valuation each quarter. Typically, when a product reaches the end of its lifecycle, inventory value declines slowly or the product has alternative uses. Management uses its manufacturing resources planning data to help determine if inventory is slow-moving or has become obsolete due to an engineering change. The Company closely reviews items that have balances in excess of the forecasted requirements, or that have been dropped from production requirements. Despite these reviews, technological or strategic decisions made by management or the Company's customers may result in unexpected excess material. Further, a decline in the market demand for the Company's products may also result in write-down of inventory balances. The Company assesses current and expected selling prices in determining if inventory balances should be written down to net realizable value. For certain of the Company's product lines, such as the electronics manufacturing business in Aerostar Division the Company typically has/had recourse to customers for obsolete or excess material. When these customers authorize inventory purchases, especially with long lead-time items, they are required to take delivery of unused material or compensate the Company accordingly. In every Raven operating unit, management must manage obsolete inventory risk. The accounting judgment ultimately made is an evaluation of the success that management will have in controlling inventory risk and mitigating the impact of obsolescence when it does occur.
Warranties
Estimated warranty liability costs are based on historical warranty costs and average time elapsed between purchases and returns for each business segment. Warranty issues that are unusual in nature are accrued for individually.
Allowance for Doubtful Accounts
Determining the level of the allowance for doubtful accounts requires management's best estimate of the amount of probable credit losses based on historical write-off experience by segment and an estimate of the ability to collect any known problem accounts. Factors that are considered beyond historical experience include the length of time the receivables are outstanding, the current business climate and the customer's current financial condition. Accounts receivable and any related allowance are written off after all collection efforts have been exhausted.
Revenue Recognition
Estimated returns or sales allowances are recognized upon shipment of a product. The Company sells directly to customers or distributors that incur the expense and commitment for any post-sale obligations beyond stated warranty terms.
For certain service-related contracts, the Company recognizes revenue under the percentage-of-completion method of accounting, whereby contract revenues are recognized on a pro-rata basis based upon the ratio of costs incurred compared to total estimated contract costs. Contract costs include labor, material, subcontracting costs, as well as allocation of indirect costs. Revenues including estimated profits are recorded as costs are incurred. Losses estimated to be incurred upon completion of contracts are charged to operations when they become known.
Certain contracts contain provisions for incentive payments that the Company may receive based on performance criteria related to product design, development and production standards. Revenue related to the incentive payments is recognized when ultimate realization by the Company is assured, which generally occurs when the provisions and performance criteria required by the contract are met.
Goodwill and Long-lived Assets
Management assesses goodwill for impairment annually, or more frequently if events or changes in circumstances indicate that an asset might be impaired, using fair value measurement techniques. For goodwill, the Company performs impairment reviews by reporting units which are determined to be: Engineered Films Division; two separate reporting units in the Applied Technology Division, one of which is SBG and one of which is all other Applied Technology operations; and two separate reporting units in the Aerostar Division, one of which is Vista and one of which is all other Aerostar operations.
The Company has the option to perform a qualitative impairment assessment based on relevant events and circumstances to determine whether it is more likely than not that the fair value of a reporting unit is less than its carrying amount. Certain events and circumstances reviewed are economic outlooks, industry conditions, cost inputs, overall financial performance, and other relevant entity-specific events. If events and circumstances indicate the fair value of a reporting unit is more likely than not greater than its carrying amount, then no further goodwill impairment testing is needed. If events and circumstances indicate the fair
# 29
value of a reporting unit is less than its carrying value, or the Company does not elect to do the qualitative assessment, then the Company performs step one of the goodwill impairment analysis.
In step one of the impairment analysis, the fair value of each reporting unit is determined using a discounted cash flow analysis. Projecting discounted future cash flows requires the Company to make significant estimates and assumptions regarding future revenues and expenses, projected capital expenditures, changes in working capital and the appropriate discount rate.
In developing our discounted cash flow analysis, assumptions about future revenues and expenses, capital expenditures and changes in working capital are based on our annual operating plan and long-term business plan for each of our reporting units. These plans take into consideration numerous factors including experience, anticipated future economic conditions, changes in raw material prices and growth expectations. These assumptions are determined over a five-year strategic planning period. The five-year growth rates for revenues and operating profits vary for each reporting unit being evaluated.
Discount rate assumptions for each reporting unit take into consideration our assessment of risks inherent in the future cash flows of the respective reporting unit.
The estimated fair value of the reporting unit is then compared with its net assets. If the estimated fair value of the reporting unit is less than the net assets of the reporting unit, an impairment loss is possible and a more refined measurement of the impairment loss would take place. This is the second step of the goodwill impairment testing, in which management may use market comparisons and recent transactions to assign the fair value of the reporting unit to all of the assets and liabilities of that unit. The valuation methodologies in both steps of goodwill impairment testing use significant estimates and assumptions, which include projected future cash flows (including timing and the risks inherent in future cash flows), perpetual growth rates and determination of appropriate market comparables. Management evaluates the merits of each significant assumption used to determine the fair value of the reporting unit. The current fiscal year's calculated fair values of our reporting units exceeded their carrying values by at least 10% above the carrying value of the reporting unit's net assets. Actual results may differ from those used in our valuations.
For long-lived assets, including definite-lived intangibles, investments in affiliates and property plant and equipment, management tests for recoverability whenever events or changes in circumstances indicate that the asset's carrying amount may not be recoverable. Property, plant and equipment are depreciated over the estimated lives of the assets primarily using accelerated methods, which reduces the likelihood of an impairment loss. Management periodically discusses any significant changes in the utilization of long-lived assets, which may result from, but are not limited to, an adverse change in the asset's physical condition or a significant adverse change in the business climate. For purposes of recognition and measurement of an impairment loss, a long-lived asset is grouped with other assets and liabilities at the lowest level for which identifiable cash flows are largely independent of the cash flows of other assets and liabilities. An impairment loss is recognized when the carrying amount of an asset exceeds the estimated undiscounted cash flows used in determining its fair value.
Uncertain Tax Positions
Accounting for tax positions requires judgments, including estimating reserves for uncertainties associated with the interpretation of income tax laws and regulations and the resolution of tax positions with tax authorities after discussions and negotiations. The ultimate outcome of these matters could result in material favorable or unfavorable adjustments to the consolidated financial statements.
ACCOUNTING PRONOUNCEMENTS
Accounting Standards Adopted
There were no accounting standards adopted or effective in fiscal year 2015 that were of significance, or potential significance, to the Company .
Pending Accounting Standards
In January 2015 the Financial Accounting Standards Board (FASB) issued Accounting Standards Update (ASU) No. 2015-01, "Income Statement - Extraordinary and Unusual Items (Subtopic 225-20) Simplifying Income Statement Presentation by Eliminating the Concept of Extraordinary Items" (ASU 2015-01). The amendments in ASU 2015-01 eliminate the GAAP concept of extraordinary items and no longer requires that transactions that met the criteria for classification as extraordinary items be separately classified and reported in the financial statements. ASU 2015-01 retains the presentation and disclosure guidance for items that are unusual in nature or occur infrequently and expands them to include items that are both unusual in nature and infrequently occurring. ASU 2015-01 is effective for fiscal years beginning after December 15, 2015. The amendments may be applied prospectively or retrospectively to all prior periods presented. Early adoption is permitted. The Company does not expect the adoption of this guidance to have any impact on its consolidated financial statements or disclosures.
# 30
In August 2014 the FASB issued ASU No. 2014-15, "Presentation of Financial Statements - Going Concern (Subtopic 205-40) Disclosure of Uncertainties about an Entity's Ability to Continue as a Going Concern" (ASU 2014-15). The amendments in ASU 2014-15 require management to assess an entity's ability to continue as a going concern by incorporating and expanding upon certain principles that are currently in U.S. auditing standards. ASU 2014-15 requires certain financial statement disclosures when there is "substantial doubt about the entity's ability to continue as a going concern" within one year after the date that the financial statements are issued (or available to be issued). ASU 2014-15 is effective for fiscal years beginning after December 15, 2016. Early adoption is permitted. The Company does not expect the adoption of this guidance to have any impact on its consolidated financial statements or disclosures.
In June 2014 the FASB issued ASU No. 2014-12, "Compensation - Stock Compensation (Topic 718): Accounting for Share-Based Payments When the Terms of an Award Provide That a Performance Target Could be Achieved after the Requisite Service Period" (ASU 2014-12). ASU 2014-12 affects entities that grant their employees stock-based payments in which terms of the award provide that a performance target that affects vesting could be achieved after the requisite service period. The amendments in ASU 2014-12 require that a performance target that affects vesting and that could be achieved after the requisite service period be treated as a performance condition and specifies that a reporting entity should apply existing guidance in FASB Accounting Standards Codification (ASC) Topic 718 as it relates to awards with performance conditions that affect vesting to account for such awards. ASU 2014-12 is effective for fiscal years beginning after December 15, 2015. Early adoption is permitted. The Company does not believe the guidance applies to any awards that have been granted under the Company's share-based compensation plan. Accordingly, the Company does not expect the adoption of this guidance to have a material impact on its consolidated financial position, results of operations or cash flows.
In May 2014 the FASB issued ASU No. 2014-09, "Revenue from Contracts with Customers" (ASU 2014-09). ASU 2014-09 provides a comprehensive new recognition model that requires recognition of revenue when a company transfers promised goods or services to customers in an amount that reflects the consideration to which the company expects to receive in exchange for those goods or services. This guidance supersedes the revenue recognition requirements in FASB ASC Topic 605, "Revenue Recognition," and most industry-specific guidance. ASU 2014-09 defines a five-step process to achieve this core principle and, in doing so, companies will need to use more judgment and make more estimates than under the current guidance. It also requires additional disclosure about the nature, amount, timing and uncertainty of revenue and cash flows arising from customer contracts. This guidance will be effective for the Company for fiscal 2018 and interim periods therein. The guidance may be applied using either of the following transition methods: (i) a full retrospective approach reflecting the application of the standard in each prior reporting period with the option to elect certain practical expedients or (ii) a retrospective approach with the cumulative effect of initially adopting ASU 2014-09 recognized at the date of adoption (which includes additional footnote disclosures). Early adoption is not permitted. The Company is currently evaluating the method of adoption and impact the adoption of ASU 2014-09 will have on the Company's consolidated financial position and results of operations.
In April 2014 the FASB issued ASU No. 2014-08, "Presentation of Financial Statements (Topic 205) and Property, Plant, and Equipment (Topic 360): Reporting Discontinued Operations and Disclosures of Disposals of Components of an Entity" (ASU No. 2014-08). ASU No. 2014-8 changes the criteria for determining which disposals should be presented as discontinued operations and modifies the related disclosure requirements. Additionally, the new guidance requires that a business that qualifies as held for sale upon acquisition should be reported as discontinued operations. The new guidance is effective for the Company on February 1, 2015 and applies prospectively to new disposals and new classifications of disposal groups as held for sale after the effective date. The Company does not expect adoption of this guidance to have a material impact on its consolidated financial statements.
In January 2014 the FASB issued ASU No. 2014-05, "Service Concession Arrangements" (ASU No. 2014-05). ASU No. 2014-05 specifies that an operating entity entering into a service concession arrangement with a public-sector entity grantor within the scope of this guidance should not account for such arrangement as a lease in accordance with FASB ASC Topic 840, "Leases." This guidance is effective for annual periods beginning after December 15, 2014. Early adoption is permitted. The Company does not expect adoption of this guidance to have a material impact on its consolidated financial position, results of operations or cash flows.
# 31
FORWARD-LOOKING STATEMENTS
Certain statements contained in this report are "forward-looking statements" within the meaning of Section 27A of the Securities Act of 1933, as amended, and Section 21E of the Securities Exchange Act of 1934, as amended, including statements regarding the expectations, beliefs, intentions or strategies regarding the future. Without limiting the foregoing, the words "anticipates," "believes," "expects," "intends," "may," "plans" and similar expressions are intended to identify forward-looking statements. The Company intends that all forward-looking statements be subject to the safe harbor provisions of the Private Securities Litigation Reform Act. Although the Company believes that the expectations reflected in such forward-looking statements are based on reasonable assumptions, there is no assurance that such assumptions are correct or that these expectations will be achieved. Assumptions involve important risks and uncertainties that could significantly affect results in the future. These risks and uncertainties include, but are not limited to, those relating to weather conditions and commodity prices, which could affect sales and profitability in some of the Company's primary markets, such as agriculture and construction and oil and gas drilling; or changes in competition, raw material availability, technology or relationships with the Company's largest customers, risks and uncertainties relating to development of new technologies to satisfy customer requirements, possible development of competitive technologies, ability to scale production of new products without negatively impacting quality and cost, risks of operating in foreign markets, risks relating to acquisitions, including risks of integration or unanticipated liabilities or contingencies, and ability to finance investment and working capital needs for new development projects, any of which could adversely impact any of the Company's product lines, as well as other risks described in Item 1A., Risk Factors, of this Annual Report on Form 10-K. The foregoing list is not exhaustive and the Company disclaims any obligation to subsequently revise any forward-looking statements to reflect events or circumstances after the date of such statements. Past financial performance may not be a reliable indicator of future performance and historical trends should not be used to anticipate results or trends in future periods.
ITEM 7A. | QUANTITATIVE AND QUALITATIVE DISCLOSURES ABOUT MARKET RISK |
The exposure to market risks pertains mainly to changes in interest rates on cash and cash equivalents and short-term investments. The Company has no debt outstanding as of January 31, 2015. The Company does not expect operating results or cash flows to be significantly affected by changes in interest rates. Additionally, the Company does not enter into derivatives or other financial instruments for trading or speculative purposes. However, the Company does utilize derivative financial instruments to manage the economic impact of fluctuation in foreign currency exchange rates on those transactions that are denominated in currency other than its functional currency, which is the U.S. dollar, principally the Canadian dollar. The use of these financial instruments had no material effect on the Company's financial condition, results of operations or cash flows.
The Company's subsidiaries that operate outside the United States use their local currency as the functional currency. The functional currency is translated into U.S. dollars for balance sheet accounts using the period-end exchange rates, and average exchange rates for the statement of income. Adjustments resulting from financial statement translations are included as cumulative translation adjustments in "Accumulated other comprehensive income (loss)" within shareholders' equity. Foreign currency transaction gains or losses are recognized in the period incurred and are included in "Other income (expense), net" in the Consolidated Statements of Income and Comprehensive Income. Foreign currency fluctuations had no material effect on the Company's financial condition, results of operations or cash flows.
# 32
ITEM 8. | FINANCIAL STATEMENTS AND SUPPLEMENTARY DATA |
|
|
|
|
|
|
Index to Financial Statements |
| ||
|
|
|
|
|
|
| Page |
Management's Report on Internal Control Over Financial Reporting |
| 34 | |
Report of Independent Registered Public Accounting Firm |
| 35 | |
Consolidated Financial Statements |
|
| |
| Consolidated Balance Sheets |
| 36 |
| Consolidated Statements of Income and Comprehensive Income |
| 37 |
| Consolidated Statements of Shareholders' Equity |
| 38 |
| Consolidated Statements of Cash Flows |
| 39 |
| Notes to Consolidated Financial Statements |
| 40 |
Quarterly Information (Unaudited) - included in Item 5 |
| 11 | |
|
|
|
|
# 33
MANAGEMENT'S REPORT ON INTERNAL CONTROL OVER FINANCIAL REPORTING
Our management is responsible for establishing and maintaining effective internal control over financial reporting as defined in Rule 13a-15(f) of the Securities Exchange Act of 1934. Our internal control over financial reporting is designed to provide reasonable assurance regarding the reliability of financial reporting and the preparation of financial statements for external purposes in accordance with generally accepted accounting principles.
Our internal control over financial reporting includes those policies and procedures that (i) pertain to the maintenance of records that, in reasonable detail, accurately and fairly reflect the transactions and dispositions of our assets; (ii) provide reasonable assurance that transactions are recorded as necessary to permit preparation of financial statements in accordance with generally accepted accounting principles and that our receipts and expenditures are being made only in accordance with authorizations of our management and directors; and (iii) provide reasonable assurance regarding prevention or timely detection of unauthorized acquisition, use, or disposition of our assets that could have a material effect on the financial statements.
Because of its inherent limitations, internal control over financial reporting may not prevent or detect misstatements. Also, projections of any evaluation of effectiveness to future periods are subject to the risk that controls may become inadequate because of changes in conditions, or that the degree of compliance with the policies or procedures may deteriorate.
Management has assessed effectiveness of the Company's internal control over financial reporting as of January 31, 2015 . In making this assessment of effectiveness of internal controls over financial reporting, management excluded from this assessment the internal controls over financial reporting at Integra Plastics, Inc. which was acquired on November 3, 2014. The assets acquired comprise approximately 11% of the assets of the Company at January 31, 2015. Approximately 1% of net sales for the fiscal year 2015 were contributed by the acquired business since its acquisition.
In making its assessment of effectiveness of internal control over financial reporting, management used the criteria described by the Committee of Sponsoring Organizations of the Treadway Commission in Internal Control - Integrated Framework (2013). Based on this assessment using those criteria, we concluded that, as of January 31, 2015 , the Company's internal control over financial reporting was effective.
The effectiveness of our internal control over financial reporting as of January 31, 2015 has been audited by PricewaterhouseCoopers LLP, an independent registered public accounting firm, as stated in their report, which appears on the next page.
/s/ DANIEL A. RYKHUS |
| /s/ STEVEN E. BRAZONES |
Daniel A. Rykhus |
| Steven E. Brazones |
President and Chief Executive Officer |
| Vice President and Chief Financial Officer |
March 27, 2015
# 34
REPORT OF INDEPENDENT REGISTERED PUBLIC ACCOUNTING FIRM
To the Board of Directors and Shareholders of Raven Industries, Inc.:
In our opinion, the consolidated balance sheets and the related consolidated statements of income and comprehensive income, of shareholders' equity and of cash flows present fairly, in all material respects, the financial position of Raven Industries, Inc. and its subsidiaries at January 31, 2015, 2014, and 2013, and the results of their operations and their cash flows for each of the three years in the period ended January 31, 2015 in conformity with accounting principles generally accepted in the United States of America. In addition, in our opinion, the financial statement schedule listed in the index appearing under Item 15 presents fairly, in all material respects, the information set forth therein when read in conjunction with the related consolidated financial statements. Also in our opinion, the Company maintained, in all material respects, effective internal control over financial reporting as of January 31, 2015, based on criteria established in Internal Control - Integrated Framework (2013) issued by the Committee of Sponsoring Organizations of the Treadway Commission (COSO). The Company's management is responsible for these financial statements and financial statement schedule, for maintaining effective internal control over financial reporting and for its assessment of the effectiveness of internal control over financial reporting, included in Management's Report on Internal Control over Financial Reporting. Our responsibility is to express opinions on these financial statements, on the financial statement schedule, and on the Company's internal control over financial reporting based on our integrated audits. We conducted our audits in accordance with the standards of the Public Company Accounting Oversight Board (United States). Those standards require that we plan and perform the audits to obtain reasonable assurance about whether the financial statements are free of material misstatement and whether effective internal control over financial reporting was maintained in all material respects. Our audits of the financial statements included examining, on a test basis, evidence supporting the amounts and disclosures in the financial statements, assessing the accounting principles used and significant estimates made by management, and evaluating the overall financial statement presentation. Our audit of internal control over financial reporting included obtaining an understanding of internal control over financial reporting, assessing the risk that a material weakness exists, and testing and evaluating the design and operating effectiveness of internal control based on the assessed risk. Our audits also included performing such other procedures as we considered necessary in the circumstances. We believe that our audits provide a reasonable basis for our opinions.
A company's internal control over financial reporting is a process designed to provide reasonable assurance regarding the reliability of financial reporting and the preparation of financial statements for external purposes in accordance with generally accepted accounting principles. A company's internal control over financial reporting includes those policies and procedures that (i) pertain to the maintenance of records that, in reasonable detail, accurately and fairly reflect the transactions and dispositions of the assets of the company; (ii) provide reasonable assurance that transactions are recorded as necessary to permit preparation of financial statements in accordance with generally accepted accounting principles, and that receipts and expenditures of the company are being made only in accordance with authorizations of management and directors of the company; and (iii) provide reasonable assurance regarding prevention or timely detection of unauthorized acquisition, use, or disposition of the company's assets that could have a material effect on the financial statements.
Because of its inherent limitations, internal control over financial reporting may not prevent or detect misstatements. Also, projections of any evaluation of effectiveness to future periods are subject to the risk that controls may become inadequate because of changes in conditions, or that the degree of compliance with the policies or procedures may deteriorate.
As described in Management's Report on Internal Control Over Financial Reporting, management has excluded Integra Plastics, Inc. from its assessment of internal control over financial reporting as of January 31, 2015, because it was acquired by the Company in a purchase business combination during fiscal 2015. We have also excluded Integra Plastics, Inc. from our audit of internal control over financial reporting. The total assets and total net sales of Integra Plastics, Inc. represent approximately 11% and 1%, respectively, of the related consolidated financial statement amounts as of and for the year ended January 31, 2015.
/s/ PricewaterhouseCoopers LLP
Minneapolis, Minnesota
March 27, 2015
# 35
RAVEN INDUSTRIES, INC. |
CONSOLIDATED BALANCE SHEETS |
(Dollars and shares in thousands, except per-share amounts) |
| As of January 31, | ||||||||||
| 2015 |
| 2014 |
| 2013 | ||||||
ASSETS |
|
|
|
|
| ||||||
Current assets |
|
|
|
|
| ||||||
Cash and cash equivalents | $ | 51,949 | |
| $ | 52,987 | |
| $ | 49,353 | |
Short-term investments | 250 | |
| 250 | |
| - | | |||
Accounts receivable, net | 56,576 | |
| 54,643 | |
| 56,303 | | |||
Inventories | 55,152 | |
| 54,865 | |
| 46,189 | | |||
Deferred income taxes | 3,958 | |
| 3,372 | |
| 3,107 | | |||
Other current assets | 3,094 | |
| 3,288 | |
| 1,796 | | |||
Total current assets | 170,979 | |
| 169,405 | |
| 156,748 | | |||
|
|
|
|
|
| ||||||
Property, plant and equipment, net | 117,513 | |
| 98,076 | |
| 81,238 | | |||
Goodwill | 52,148 | |
| 22,274 | |
| 22,274 | | |||
Amortizable intangible assets, net | 18,490 | |
| 8,156 | |
| 8,681 | | |||
Other assets, net | 3,743 | |
| 3,908 | |
| 4,269 | | |||
TOTAL ASSETS | $ | 362,873 | |
| $ | 301,819 | |
| $ | 273,210 | |
|
|
|
|
|
| ||||||
LIABILITIES AND SHAREHOLDERS' EQUITY |
|
|
|
|
| ||||||
Current liabilities |
|
|
|
|
| ||||||
Accounts payable | $ | 11,545 | |
| $ | 12,324 | |
| $ | 14,438 | |
Accrued liabilities | 19,187 | |
| 16,248 | |
| 17,192 | | |||
Customer advances | 1,111 | |
| 1,247 | |
| 1,431 | | |||
Total current liabilities | 31,843 | |
| 29,819 | |
| 33,061 | | |||
|
|
|
|
|
| ||||||
Other liabilities | 25,793 | |
| 20,538 | |
| 18,702 | | |||
|
|
|
|
|
| ||||||
Commitments and contingencies | | |
| | |
| | | |||
|
|
|
|
|
| ||||||
Shareholders' equity |
|
|
|
|
| ||||||
Common stock, $1 par value, authorized shares 100,000; issued 66,947; 65,318; and 65,223, respectively | 66,947 | |
| 65,318 | |
| 65,223 | | |||
Paid-in capital | 53,237 | |
| 10,556 | |
| 5,885 | | |||
Retained earnings | 244,180 | |
| 231,029 | |
| 205,695 | | |||
Accumulated other comprehensive loss | (5,849 | ) |
| (2,179 | ) |
| (2,095 | ) | |||
Less treasury stock at cost, 28,897 shares | (53,362 | ) |
| (53,362 | ) |
| (53,362 | ) | |||
Total Raven Industries, Inc. shareholders' equity | 305,153 | |
| 251,362 | |
| 221,346 | | |||
Noncontrolling interest | 84 | |
| 100 | |
| 101 | | |||
Total shareholders' equity | 305,237 | |
| 251,462 | |
| 221,447 | | |||
TOTAL LIABILITIES AND SHAREHOLDERS' EQUITY | $ | 362,873 | |
| $ | 301,819 | |
| $ | 273,210 | |
|
|
|
|
|
| ||||||
The accompanying notes are an integral part of the consolidated financial statements. |
|
|
|
|
| ||||||
# 36
RAVEN INDUSTRIES, INC. |
CONSOLIDATED STATEMENTS OF INCOME AND COMPREHENSIVE INCOME |
(Dollars in thousands, except per-share amounts) |
| For the years ended January 31, | ||||||||||
| 2015 |
| 2014 |
| 2013 | ||||||
Net sales | $ | 378,153 | |
| $ | 394,677 | |
| $ | 406,175 | |
Cost of sales | 274,907 | |
| 275,323 | |
| 278,502 | | |||
Gross profit | 103,246 | |
| 119,354 | |
| 127,673 | | |||
|
|
|
|
|
| ||||||
Research and development expenses | 17,440 | |
| 16,576 | |
| 13,367 | | |||
Selling, general and administrative expenses | 42,005 | |
| 38,784 | |
| 36,614 | | |||
Operating income | 43,801 | |
| 63,994 | |
| 77,692 | | |||
|
|
|
|
|
| ||||||
Other (expense), net | (300 | ) |
| (371 | ) |
| (46 | ) | |||
Income before income taxes | 43,501 | |
| 63,623 | |
| 77,646 | | |||
|
|
|
|
|
| ||||||
Income taxes | 11,705 | |
| 20,721 | |
| 25,091 | | |||
Net income | 31,796 | |
| 42,902 | |
| 52,555 | | |||
|
|
|
|
|
| ||||||
Net income (loss) attributable to the noncontrolling interest | 63 | |
| (1 | ) |
| 10 | | |||
|
|
|
|
|
| ||||||
Net income attributable to Raven Industries, Inc. | $ | 31,733 | |
| $ | 42,903 | |
| $ | 52,545 | |
|
|
|
|
|
| ||||||
Net income per common share: |
|
|
|
|
| ||||||
─ Basic | $ | 0.86 | |
| $ | 1.18 | |
| $ | 1.45 | |
─ Diluted | $ | 0.86 | |
| $ | 1.17 | |
| $ | 1.44 | |
|
|
|
|
|
| ||||||
|
|
|
|
|
| ||||||
Comprehensive income: |
|
|
|
|
| ||||||
Net income | $ | 31,796 | |
| $ | 42,902 | |
| $ | 52,555 | |
|
|
|
|
|
| ||||||
Other comprehensive income (loss), net of tax: |
|
|
|
|
| ||||||
Foreign currency translation | (1,466 | ) |
| (424 | ) |
| (3 | ) | |||
Postretirement benefits, net of income tax benefit (expense) of $1,187, ($183), and $70, respectively | (2,204 | ) |
| 340 | |
| (130 | ) | |||
Other comprehensive income (loss), net of tax | (3,670 | ) |
| (84 | ) |
| (133 | ) | |||
|
|
|
|
|
| ||||||
Comprehensive income | 28,126 | |
| 42,818 | |
| 52,422 | | |||
|
|
|
|
|
| ||||||
Comprehensive income (loss) attributable to noncontrolling interest | 63 | |
| (1 | ) |
| 10 | | |||
|
|
|
|
|
| ||||||
Comprehensive income attributable to Raven Industries, Inc. | $ | 28,063 | |
| $ | 42,819 | |
| $ | 52,412 | |
The accompanying notes are an integral part of the consolidated financial statements. |
|
| |||||||||
# 37
RAVEN INDUSTRIES, INC. |
CONSOLIDATED STATEMENTS OF SHAREHOLDERS' EQUITY |
(Dollars and shares in thousands, except per-share amounts) |
|
|
|
|
|
|
|
|
|
|
| |||||||||||||||||
|
|
|
|
|
|
|
|
| |||||||||||||||||||
| $1 Par Common Stock | Paid-in Capital | Treasury Stock | Retained Earnings | Accumulated Other Comprehen-sive Income (Loss) | Raven Industries, Inc. Equity | Non-controlling Interest | Total Equity | |||||||||||||||||||
| Shares |
| Cost | ||||||||||||||||||||||||
Balance January 31, 2012 | $ | 32,566 | | $ | 9,607 | | (14,449 | ) |
| $ | (53,362 | ) | $ | 193,650 | | $ | (1,962 | ) | $ | 180,499 | | $ | 91 | | $ | 180,590 | |
Net income | - | | - | | - | |
| - | | 52,545 | | - | | 52,545 | | 10 | | 52,555 | | ||||||||
Other comprehensive income (loss), net of income tax | - | | - | | - | |
| - | | - | | (133 | ) | (133 | ) | - | | (133 | ) | ||||||||
Cash dividends ($0.42 per share) | - | | 63 | | - | |
| - | | (15,307 | ) | - | | (15,244 | ) | - | | (15,244 | ) | ||||||||
Two-for-one stock split | 32,598 | | (7,405 | ) | (14,448 | ) |
| - | | (25,193 | ) | - | | - | | - | | - | | ||||||||
Shares surrendered upon exercise of stock options | (36 | ) | (2,215 | ) | - | |
| - | | - | | - | | (2,251 | ) | - | | (2,251 | ) | ||||||||
Employees' stock options exercised | 95 | | 2,503 | | - | |
| - | | - | | - | | 2,598 | | - | | 2,598 | | ||||||||
Share-based compensation | - | | 3,075 | | - | |
| - | | - | | - | | 3,075 | | - | | 3,075 | | ||||||||
Tax benefit from exercise of stock options | - | | 257 | | - | |
| - | | - | | - | | 257 | | - | | 257 | | ||||||||
Balance January 31, 2013 | 65,223 | | 5,885 | | (28,897 | ) |
| (53,362 | ) | 205,695 | | (2,095 | ) | 221,346 | | 101 | | 221,447 | | ||||||||
Net income | - | | - | | - | |
| - | | 42,903 | | - | | 42,903 | | (1 | ) | 42,902 | | ||||||||
Other comprehensive income (loss), net of income tax | - | | - | | - | |
| - | | - | | (84 | ) | (84 | ) | - | | (84 | ) | ||||||||
Cash dividends ($0.48 per share) | - | | 104 | | - | |
| - | | (17,569 | ) | - | | (17,465 | ) | - | | (17,465 | ) | ||||||||
Shares surrendered upon exercise of stock options | (64 | ) | (2,041 | ) | - | |
| - | | - | | - | | (2,105 | ) | - | | (2,105 | ) | ||||||||
Employees' stock options exercised | 159 | | 2,111 | | - | |
| - | | - | | - | | 2,270 | | - | | 2,270 | | ||||||||
Share-based compensation | - | | 4,198 | | - | |
| - | | - | | - | | 4,198 | | - | | 4,198 | | ||||||||
Tax benefit from exercise of stock options | - | | 299 | | - | |
| - | | - | | - | | 299 | | - | | 299 | | ||||||||
Balance January 31, 2014 | 65,318 | | 10,556 | | (28,897 | ) |
| (53,362 | ) | 231,029 | | (2,179 | ) | 251,362 | | 100 | | 251,462 | | ||||||||
Net income | - | | - | | - | |
| - | | 31,733 | | - | | 31,733 | | 63 | | 31,796 | | ||||||||
Other comprehensive income (loss), net of income tax | - | | - | | - | |
| - | | - | | (3,670 | ) | (3,670 | ) | - | | (3,670 | ) | ||||||||
Cash dividends ($0.50 per share) | - | | 142 | | - | |
| - | | (18,582 | ) | - | | (18,440 | ) | - | | (18,440 | ) | ||||||||
Dividends of less than wholly-owned subsidiary paid to noncontrolling interest | - | | - | | - | |
| - | | - | | - | | - | | (79 | ) | (79 | ) | ||||||||
Shares issued in connection with business combination (net of issuance costs of $38) | 1,542 | | 37,672 | | - | |
| - | | - | | - | | 39,214 | |
| 39,214 | | |||||||||
Director shares issued | 18 | | (18 | ) | - | |
| - | | - | | - | | - | | - | | - | | ||||||||
Shares surrendered upon exercise of stock options | (37 | ) | (1,050 | ) | - | |
| - | | - | | - | | (1,087 | ) | - | | (1,087 | ) | ||||||||
Employees' stock options exercised | 106 | | 1,622 | | - | |
| - | | - | | - | | 1,728 | | - | | 1,728 | | ||||||||
Share-based compensation | - | | 4,213 | | - | |
| - | | - | | - | | 4,213 | | - | | 4,213 | | ||||||||
Tax benefit from exercise of stock options | - | | 100 | | - | |
| - | | - | | - | | 100 | | - | | 100 | | ||||||||
Balance January 31, 2015 | $ | 66,947 | | $ | 53,237 | | (28,897 | ) |
| $ | (53,362 | ) | $ | 244,180 | | $ | (5,849 | ) | $ | 305,153 | | $ | 84 | | $ | 305,237 | |
The accompanying notes are an integral part of the consolidated financial statements. |
|
|
|
| |||||||||||||||||||||||
# 38
RAVEN INDUSTRIES, INC. |
CONSOLIDATED STATEMENTS OF CASH FLOWS |
(Dollars in thousands) |
| For the years ended January 31, | ||||||||||
| 2015 |
| 2014 |
| 2013 | ||||||
OPERATING ACTIVITIES: |
|
|
|
|
| ||||||
Net income | $ | 31,796 | |
| $ | 42,902 | |
| $ | 52,555 | |
Adjustments to reconcile net income to net cash provided by operating activities: |
|
|
|
|
| ||||||
Depreciation | 14,761 | |
| 12,449 | |
| 11,496 | | |||
Amortization of intangible assets | 2,608 | |
| 1,746 | |
| 1,602 | | |||
Gain on acquisition-related contingent liability settlement | - | |
| - | |
| (508 | ) | |||
Change in fair value of acquisition-related contingent consideration | 714 | |
| 540 | |
| 784 | | |||
Income from equity investment | (28 | ) |
| (116 | ) |
| (156 | ) | |||
Deferred income taxes | (958 | ) |
| 623 | |
| (1,803 | ) | |||
Share-based compensation expense | 4,213 | |
| 4,198 | |
| 3,075 | | |||
Change in operating assets and liabilities | 7,973 | |
| (10,449 | ) |
| 9,199 | | |||
Other operating activities, net | (996 | ) |
| 943 | |
| 212 | | |||
Net cash provided by operating activities | 60,083 | |
| 52,836 | |
| 76,456 | | |||
|
|
|
|
|
| ||||||
INVESTING ACTIVITIES: |
|
|
|
|
| ||||||
Capital expenditures | (17,041 | ) |
| (30,701 | ) |
| (29,675 | ) | |||
Payments related to business acquisitions, net of cash acquired | (12,472 | ) |
| - | |
| - | | |||
Sales of short-term investments | 500 | |
| - | |
| - | | |||
Purchases of short-term investments | (500 | ) |
| (250 | ) |
| - | | |||
Other investing activities, net | (473 | ) |
| (664 | ) |
| (255 | ) | |||
Net cash used in investing activities | (29,986 | ) |
| (31,615 | ) |
| (29,930 | ) | |||
|
|
|
|
|
| ||||||
FINANCING ACTIVITIES: |
|
|
|
|
| ||||||
Dividends paid | (18,519 | ) |
| (17,465 | ) |
| (15,244 | ) | |||
Proceeds from revolving line of credit | 2,127 | |
| - | |
| - | | |||
Payment of revolving line of credit and acquisition-related debt | (14,116 | ) |
| - | |
| - | | |||
Payment of acquisition-related contingent liabilities | (533 | ) |
| (353 | ) |
| (8,367 | ) | |||
Employee stock option exercises and other financing activities, net | 376 | |
| 464 | |
| 604 | | |||
Net cash used in financing activities | (30,665 | ) |
| (17,354 | ) |
| (23,007 | ) | |||
|
|
|
|
|
| ||||||
Effect of exchange rate changes on cash | (470 | ) |
| (233 | ) |
| (8 | ) | |||
|
|
|
|
|
| ||||||
Net (decrease) increase in cash and cash equivalents | (1,038 | ) |
| 3,634 | |
| 23,511 | | |||
Cash and cash equivalents at beginning of year | 52,987 | |
| 49,353 | |
| 25,842 | | |||
Cash and cash equivalents at end of year | $ | 51,949 | |
| $ | 52,987 | |
| $ | 49,353 | |
|
|
|
|
|
| ||||||
The accompanying notes are an integral part of the consolidated financial statements. |
|
|
|
|
| ||||||
# 39
RAVEN INDUSTRIES, INC. |
NOTES TO CONSOLIDATED FINANCIAL STATEMENTS |
(Dollars in thousands, except per-share amounts) |
NOTE 1 | SUMMARY OF SIGNIFICANT ACCOUNTING POLICIES |
Basis of Presentation and Principles of Consolidation
Raven Industries, Inc. (the Company or Raven) is a diversified technology company providing a variety of products to customers within the industrial, agricultural, energy, construction, and military/aerospace markets. The Company conducts this business through the following direct and indirect subsidiaries: Aerostar International, Inc. (Aerostar); Vista Research, Inc. (Vista); Raven International Holding Company BV (Raven Holdings); Raven Industries Canada, Inc. (Raven Canada); SBG Innovatie BV; Navtronics BVBA; Raven Industries GmbH (Raven GmbH); Raven Industries Australia Pty Ltd (Raven Australia) and Raven Do Brazil Participacoes E Servicos Technicos LTDA (Raven Brazil). The Company and these subsidiaries comprise three unique operating units, or divisions, classified into reportable segments (Applied Technology, Engineered Films, and Aerostar).
The consolidated financial statements for the periods included herein have been prepared by the Company pursuant to the rules and regulations of the Securities and Exchange Commission (SEC). The accompanying consolidated financial statements include the accounts of the Company and its wholly-owned or controlled subsidiaries. All intercompany balances and transactions have been eliminated in consolidation.
Noncontrolling Interest
Noncontrolling interests represent capital contributions, income and loss attributable to the owners of less than wholly-owned and consolidated entities. The Company owns 75% of a business venture to pursue potential product and support services contracts for agencies and instrumentalities of the United States government. The business venture, Aerostar Integrated Systems (AIS), is included in the Aerostar business segment. No capital contributions were made by the noncontrolling interest since the initial capitalization in fiscal year 2012 . Given the Company's majority ownership interest, the accounts of the business venture have been consolidated with the accounts of the Company, and a noncontrolling interest has been recorded for the noncontrolling investor's interests in the net assets and operations of the business venture.
Investments in Affiliate
An affiliate investment over which the Company has significant influence, but neither a controlling interest nor a majority interest in the risks or rewards of the investee, is accounted for using the equity method. The investment balance is included in "Other assets, net," while the Company's share of the investee's results of operations is included in "Other income (expense), net." The Company considers whether the value of any of its equity method investments has been impaired whenever adverse events or changes in circumstances indicate that recorded values may not be recoverable. If the Company considered any such decline to be other than temporary (based on various factors, including historical financial results, product development activities and the overall health of the affiliate's industry), an impairment loss would be recorded.
Use of Estimates
Preparing the financial statements in conformity with accounting principles generally accepted in the United States of America (GAAP) requires management to make certain estimates and assumptions. These affect the reported amounts of assets and liabilities as of the date of the financial statements and the reported amounts of revenues and expenses during the reporting period. Actual results could differ from these estimates.
Foreign Currency
The Company's subsidiaries that operate outside the United States use the local currency as their functional currency. The functional currency is translated into U.S. dollars for balance sheet accounts using the period-end exchange rates and average exchange rates for the statement of income and comprehensive income. Adjustments resulting from financial statement translations are included as foreign currency translation adjustments in "Accumulated other comprehensive income (loss)" within shareholders' equity. Foreign currency transaction gains or losses are recognized in the period incurred and are included in "Other income (expense), net" in the Consolidated Statements of Income and Comprehensive Income. Foreign currency transaction gains or losses on intercompany notes receivable and notes payable denominated in foreign currencies for which settlement is not planned in the foreseeable future are considered part the net investment and are reported in the same manner as foreign currency translation adjustments.
# 40
(Dollars in thousands, except per-share amounts)
Cash and Cash Equivalents
The Company considers all highly liquid instruments with original maturities of three or fewer months to be cash equivalents. Cash and cash equivalent balances are principally concentrated in checking, money market and savings accounts. Certificates of deposit that mature in over 90 days but less than one year are considered short-term investments. Certificates of deposit that mature in one year or more are considered to be other long-term assets and carried at cost.
Accounts Receivable and Allowance for Doubtful Accounts
Trade accounts receivable are recorded at the invoiced amount, do not bear interest and are considered past due based on invoice terms. Unbilled receivables arise when revenues have been earned, but not billed, and are related to differences in timing. The allowance for doubtful accounts is the Company's best estimate of the amount of probable credit losses. This is based on historical write-off experience by segment and an estimate of the collectability of any known problem accounts.
Inventory Valuation
Inventories are carried at the lower of cost or market, with cost determined on the first-in, first-out basis. Market value encompasses consideration of all business factors including price, contract terms, and usefulness.
Property, Plant and Equipment
Property, plant and equipment held for use is carried at the asset's cost and depreciated over the estimated useful lives of the assets primarily using accelerated methods. The estimated useful lives used for computing depreciation are as follows:
Building and improvements | 15 - 39 years |
Manufacturing equipment by segment |
|
Applied Technology | 3 - 5 years |
Engineered Films | 5 - 12 years |
Aerostar | 3 - 5 years |
Furniture, fixtures, office equipment and other | 3 - 7 years |
The cost of maintenance and repairs is charged to expense in the period incurred, and renewals and betterments are capitalized. The cost and related accumulated depreciation of assets sold or disposed are removed from the accounts and the resulting gain or loss is reflected in operations.
The Company capitalizes certain internal costs incurred in connection with developing or obtaining internal-use software in accordance with the accounting guidance for such costs. These capitalized software costs totaled $0 in fiscal 2015 , $203 in fiscal 2014 and $7 in fiscal 2013 . The costs are included in "Property, plant and equipment, net" on the Consolidated Balance Sheets. Software costs that do not meet capitalization criteria are expensed as incurred. Amortization expense related to capitalized software is computed on the straight-line basis over the estimated lives ranging from 3 to 5 years and is included in depreciation.
Fair Value Measurements
Fair value is defined as an exit price representing the amount that would be received to sell an asset or paid to transfer a liability in an orderly transaction between market participants. As such, fair value is a market-based measurement that should be determined based on assumptions that market participants would use in pricing an asset or liability. The Company uses the established fair value hierarchy, which classifies or prioritizes the inputs used in measuring fair value. These classifications include:
Level 1 - Observable inputs such as quoted prices in active markets;
Level 2 - Inputs other than quoted prices in active markets that are either directly or indirectly observable; and
Level 3 - Unobservable inputs in which little or no market data exists, therefore, requiring an entity to develop its own assumptions.
The Company's financial assets required to be measured at fair value on a recurring basis include cash and cash equivalents and short-term investments. The Company determines fair value of its cash equivalents and short-term investments through quoted market prices.
The Company's goodwill and long-lived assets, including intangible assets subject to amortization, are measured at fair value on a non-recurring basis. These valuations are derived from valuation techniques in which one or more significant inputs are not observable. Our accounting policy and methodology for assessing impairment of these assets is further described below and in the Critical Accounting Estimates section of the Management's Discussion and Analysis in Part 7 of this Annual Report on Form 10-K (Form 10-K).
# 41
(Dollars in thousands, except per-share amounts)
For all acquisitions, the Company is required to measure the fair value of the net identifiable tangible and intangible assets acquired, excluding goodwill and deferred income taxes. In addition, the Company determines the estimated fair value of contingent consideration as of the acquisition date, and subsequently at the end of each reporting period. These valuations are derived from valuation techniques in which one or more significant inputs are not observable. Fair value measurements associated with acquisitions, including acquisition-related contingent liabilities, are described in Note 5 Acquisition of and Investments in Businesses and Technologies.
Intangible Assets
Intangible assets, primarily comprised of technologies acquired through acquisition, are recorded at cost and are presented net of accumulated amortization. Amortization is computed either on a straight-line basis or under the undiscounted cash flows method
over the estimated useful lives ranging from 3 to 20 years. The straight-line method of amortization is used when it reflects an appropriate allocation of the cost of the intangible assets to earnings in each reporting period.
Goodwill
The Company recognizes goodwill as the excess cost of an acquired business over the net amount assigned to assets acquired and liabilities assumed. Earn-out payments are accrued at fair value as of the purchase date and payments reduce the accrual without affecting goodwill. Any change in the fair value of the contingent consideration after the acquisition date is recognized in the Consolidated Statements of Income and Comprehensive Income.
Goodwill is tested for impairment on an annual basis during the fourth quarter and between annual tests whenever a triggering event indicates there may be an impairment. Impairment tests of goodwill are performed at the reporting unit level. A qualitative impairment assessment over relevant events and circumstances may be assessed to determine whether it is more likely than not that the fair value of a reporting unit is less than its carrying amount. If events and circumstances indicate the fair value of a reporting unit is less than its carrying value, then the fair values are estimated based on discounted cash flows and are compared with the corresponding carrying value of the reporting unit. If the fair value of the reporting unit is less than the carrying amount, the amount of the impairment loss must be measured and then recognized to the extent the carrying value of the goodwill exceeds the implied fair value.
Long-Lived Assets
The Company periodically assesses the recoverability of long-lived and intangible assets. An impairment loss is recognized when the carrying amount of an asset exceeds the estimated undiscounted cash flows used in determining the fair value of the assets. The amount of the impairment loss to be recorded is the excess of the carrying value of the asset over its fair value.
Long-lived assets determined to be held for sale and classified as such in accordance with the applicable guidance are reported as long-term assets at the lower of the asset's carrying amount or fair value less the estimated cost to sell. Depreciation is not recorded once a long-lived asset has been classified as held for sale.
Insurance Obligations
The Company utilizes insurance policies to cover workers' compensation and general liability costs. Liabilities are accrued related to claims filed and estimates for claims incurred but not reported. To the extent these obligations are expected to be reimbursed by insurance, the probable insurance policy benefit is included as a component of "Other current assets."
Contingencies
The Company is involved as a defendant in lawsuits, claims, regulatory inquiries, or disputes arising in the normal course of business. An estimate of the loss on these matters is charged to operations when it is probable that an asset has been impaired or a liability has been incurred, and the amount of the loss can be reasonably estimated. While the settlement of any claims cannot be determined, management believes that any liability resulting from these claims will be substantially covered by insurance. Accordingly, management does not believe that the ultimate outcome of these matters will have a significant impact on its results of operations, financial position or cash flows.
Revenue Recognition
The Company recognizes revenue when it is realized or realizable and has been earned. Revenue is recognized when there is persuasive evidence of an arrangement, the sales price is determinable, collectability is reasonably assured and shipment or delivery has occurred (depending on the terms of the sale). The Company sells directly to customers or distributors who incur the expense and commitment for any post-sale obligations beyond stated warranty terms. Estimated returns, sales allowances or warranty charges are recognized upon shipment of a product.
For certain service-related contracts, the Company recognizes revenue under the percentage-of-completion method of accounting, whereby contract revenues are recognized on a pro-rata basis based upon the ratio of costs incurred compared to total estimated
# 42
(Dollars in thousands, except per-share amounts)
contract costs. Contract costs include labor, material, subcontracting costs, as well as allocation of indirect costs. Revenues including estimated profits are recorded as costs are incurred. Losses estimated to be incurred upon completion of contracts are charged to operations when they become known.
Certain contracts contain provisions for incentive payments that the Company may receive based on performance criteria related to product design, development and production standards. Revenue related to the incentive payments is recognized when ultimate realization by the Company is assured, which generally occurs when the provisions and performance criteria required by the contract are met.
Operating Expenses
The primary types of operating expenses are classified in the income statement as follows:
Cost of sales |
| Research and development expenses |
| Selling, general and administrative expenses |
Direct material costs Material acquisition and handling costs Direct labor Factory overhead including depreciation and amortization Inventory obsolescence Product warranties Shipping and handling cost |
| Personnel costs Professional service fees Material and supplies Facility allocation |
| Personnel costs Professional service fees Advertising Promotions Information technology equipment depreciation Office supplies Facility allocation |
The Company's gross margins may not be comparable to industry peers due to variability in the classification of these expenses across the industries in which the Company operates.
Warranties
Accruals necessary for product warranties are estimated based on historical warranty costs and average time elapsed between purchases and returns for each division. Additional accruals are made for any significant, discrete warranty issues.
Share-Based Compensation
The Company records compensation expense related to its share-based compensation plans using the fair value method. Under this method, the fair value of share-based compensation is determined as of the grant date and the related expense is recorded over the period in which the share-based compensation vests.
Income Taxes
Deferred income taxes reflect future tax effects of temporary differences between the tax and financial reporting basis of the Company's assets and liabilities measured using enacted tax laws and statutory tax rates applicable to the periods when the temporary differences will affect taxable income. When necessary, deferred tax assets are reduced by a valuation allowance to reflect realizable value. Accruals are maintained for uncertain tax positions.
Accounting Pronouncements
Accounting Standards Adopted
There were no accounting standards adopted or effective in fiscal year 2015 that were of significance, or potential significance, to the Company .
Pending Accounting Standards
In January 2015 the Financial Accounting Standards Board (FASB) issued Accounting Standards Update (ASU) No. 2015-01, "Income Statement - Extraordinary and Unusual Items (Subtopic 225-20) Simplifying Income Statement Presentation by Eliminating the Concept of Extraordinary Items" (ASU 2015-01). The amendments in ASU 2015-01 eliminate the GAAP concept of extraordinary items and no longer requires that transactions that met the criteria for classification as extraordinary items be separately classified and reported in the financial statements. ASU 2015-01 retains the presentation and disclosure guidance for items that are unusual in nature or occur infrequently and expands them to include items that are both unusual in nature and infrequently occurring. ASU 2015-01 is effective for fiscal years beginning after December 15, 2015. The amendments may be applied prospectively or retrospectively to all prior periods presented. Early adoption is permitted. The Company does not expect the adoption of this guidance to have any impact on its consolidated financial statements or disclosures.
In August 2014 the FASB issued ASU No. 2014-15, "Presentation of Financial Statements - Going Concern (Subtopic 205-40) Disclosure of Uncertainties about an Entity's Ability to Continue as a Going Concern" (ASU 2014-15). The amendments in ASU 2014-15 require management to assess an entity's ability to continue as a going concern by incorporating and expanding upon
# 43
(Dollars in thousands, except per-share amounts)
certain principles that are currently in U.S. auditing standards. ASU 2014-15 requires certain financial statement disclosures when there is "substantial doubt about the entity's ability to continue as a going concern" within one year after the date that the financial statements are issued (or available to be issued). ASU 2014-15 is effective for fiscal years beginning after December 15, 2016. Early adoption is permitted. The Company does not expect the adoption of this guidance to have any impact on its consolidated financial statements or disclosures.
In June 2014 the FASB issued ASU No. 2014-12, "Compensation - Stock Compensation (Topic 718): Accounting for Share-Based Payments When the Terms of an Award Provide That a Performance Target Could be Achieved after the Requisite Service Period" (ASU 2014-12). ASU 2014-12 affects entities that grant their employees stock-based payments in which terms of the award provide that a performance target that affects vesting could be achieved after the requisite service period. The amendments in ASU 2014-12 require that a performance target that affects vesting and that could be achieved after the requisite service period be treated as a performance condition and specifies that a reporting entity should apply existing guidance in FASB Accounting Standards Codification (ASC) Topic 718 as it relates to awards with performance conditions that affect vesting to account for such awards. ASU 2014-12 is effective for fiscal years beginning after December 15, 2015. Early adoption is permitted. The Company does not believe the guidance applies to any awards that have been granted under the Company's share-based compensation plan. Accordingly, the Company does not expect the adoption of this guidance to have a material impact on its consolidated financial position, results of operations or cash flows.
In May 2014 the FASB issued ASU No. 2014-09, "Revenue from Contracts with Customers" (ASU 2014-09). ASU 2014-09 provides a comprehensive new recognition model that requires recognition of revenue when a company transfers promised goods or services to customers in an amount that reflects the consideration to which the company expects to receive in exchange for those goods or services. This guidance supersedes the revenue recognition requirements in FASB ASC Topic 605, "Revenue Recognition," and most industry-specific guidance. ASU 2014-09 defines a five-step process to achieve this core principle and, in doing so, companies will need to use more judgment and make more estimates than under the current guidance. It also requires additional disclosure about the nature, amount, timing and uncertainty of revenue and cash flows arising from customer contracts. This guidance will be effective for the Company for fiscal 2018 and interim periods therein. The guidance may be applied using either of the following transition methods: (i) a full retrospective approach reflecting the application of the standard in each prior reporting period with the option to elect certain practical expedients or (ii) a retrospective approach with the cumulative effect of initially adopting ASU 2014-09 recognized at the date of adoption (which includes additional footnote disclosures). Early adoption is not permitted. The Company is currently evaluating the method of adoption and impact the adoption of ASU 2014-09 will have on the Company's consolidated financial position and results of operations.
In April 2014 the FASB issued ASU No. 2014-08, "Presentation of Financial Statements (Topic 205) and Property, Plant, and Equipment (Topic 360): Reporting Discontinued Operations and Disclosures of Disposals of Components of an Entity" (ASU No. 2014-08). ASU No. 2014-8 changes the criteria for determining which disposals should be presented as discontinued operations and modifies the related disclosure requirements. Additionally, the new guidance requires that a business that qualifies as held for sale upon acquisition should be reported as discontinued operations. The new guidance is effective for the Company on February 1, 2015 and applies prospectively to new disposals and new classifications of disposal groups as held for sale after the effective date. The Company does not expect adoption of this guidance to have a material impact on its consolidated financial statements.
In January 2014 the FASB issued ASU No. 2014-05, "Service Concession Arrangements" (ASU No. 2014-05). ASU No. 2014-05 specifies that an operating entity entering into a service concession arrangement with a public-sector entity grantor within the scope of this guidance should not account for such arrangement as a lease in accordance with FASB ASC Topic 840, "Leases." This guidance is effective for annual periods beginning after December 15, 2014. Early adoption is permitted. The Company does not expect adoption of this guidance to have a material impact on its consolidated financial position, results of operations or cash flows.
# 44
(Dollars in thousands, except per-share amounts)
NOTE 2 | SELECTED BALANCE SHEET INFORMATION |
Following are the components of selected balance sheet items:
|
| As of January 31, | ||||||||||
|
| 2015 |
| 2014 |
| 2013 | ||||||
Accounts receivable, net: |
|
|
|
|
|
| ||||||
Trade accounts |
| $ | 56,895 | |
| $ | 54,962 | |
| $ | 56,508 | |
Allowance for doubtful accounts |
| (319 | ) |
| (319 | ) |
| (205 | ) | |||
|
| $ | 56,576 | |
| $ | 54,643 | |
| $ | 56,303 | |
Inventories: |
|
|
|
|
|
| ||||||
Finished goods |
| $ | 8,127 | |
| $ | 7,232 | |
| $ | 8,571 | |
In process |
| 1,317 | |
| 2,131 | |
| 2,675 | | |||
Materials |
| 45,708 | |
| 45,502 | |
| 34,943 | | |||
|
| $ | 55,152 | |
| $ | 54,865 | |
| $ | 46,189 | |
Other current assets: |
|
|
|
|
|
| ||||||
Insurance policy benefit |
| $ | 733 | |
| $ | 733 | |
| $ | 860 | |
Federal income tax receivable |
| 713 | |
| 1,197 | |
| - | | |||
Prepaid expenses and other |
| 1,648 | |
| 1,358 | |
| 936 | | |||
|
| $ | 3,094 | |
| $ | 3,288 | |
| $ | 1,796 | |
Property, plant and equipment, net: |
|
|
|
|
|
| ||||||
Held for use: |
|
|
|
|
|
| ||||||
Land |
| $ | 3,246 | |
| $ | 2,077 | |
| $ | 2,077 | |
Buildings and improvements |
| 78,140 | |
| 66,278 | |
| 52,936 | | |||
Machinery and equipment |
| 131,766 | |
| 114,345 | |
| 101,645 | | |||
Accumulated depreciation |
| (96,545 | ) |
| (84,624 | ) |
| (75,420 | ) | |||
|
| $ | 116,607 | |
| $ | 98,076 | |
| $ | 81,238 | |
|
|
|
|
|
|
| ||||||
Held for sale: |
|
|
|
|
|
| ||||||
Land |
| $ | 11 | |
| $ | - | |
| $ | - | |
Buildings and improvements |
| 1,522 | |
| - | |
| - | | |||
Accumulated depreciation |
| (627 | ) |
| - | |
| - | | |||
|
| 906 | |
| - | |
| - | | |||
|
| $ | 117,513 | |
| $ | 98,076 | |
| $ | 81,238 | |
Other assets, net: |
|
|
|
|
|
| ||||||
Investment in affiliate |
| $ | 3,217 | |
| $ | 3,684 | |
| $ | 4,063 | |
Other, net |
| 526 | |
| 224 | |
| 206 | | |||
|
| $ | 3,743 | |
| $ | 3,908 | |
| $ | 4,269 | |
Accrued liabilities: |
|
|
|
|
|
| ||||||
Salaries and related |
| $ | 4,063 | |
| $ | 2,210 | |
| $ | 4,422 | |
Benefits |
| 5,001 | |
| 5,538 | |
| 5,616 | | |||
Insurance obligations |
| 1,590 | |
| 1,598 | |
| 1,723 | | |||
Warranties |
| 3,120 | |
| 2,525 | |
| 1,888 | | |||
Income taxes |
| 536 | |
| 362 | |
| 114 | | |||
Other taxes |
| 1,240 | |
| 1,097 | |
| 1,139 | | |||
Acquisition-related contingent consideration |
| 1,375 | |
| 890 | |
| 712 | | |||
Other |
| 2,262 | |
| 2,028 | |
| 1,578 | | |||
|
| $ | 19,187 | |
| $ | 16,248 | |
| $ | 17,192 | |
Other liabilities: |
|
|
|
|
|
| ||||||
Postretirement benefits |
| $ | 11,812 | |
| $ | 7,998 | |
| $ | 8,072 | |
Acquisition-related contingent consideration |
| 3,631 | |
| 2,457 | |
| 2,359 | | |||
Deferred income taxes |
| 7,091 | |
| 3,526 | |
| 2,453 | | |||
Uncertain tax positions |
| 3,259 | |
| 6,557 | |
| 5,818 | | |||
|
| $ | 25,793 | |
| $ | 20,538 | |
| $ | 18,702 | |
# 45
(Dollars in thousands, except per-share amounts)
NOTE 3 | ACCUMULATED OTHER COMPREHENSIVE INCOME (LOSS) |
Other comprehensive income refers to revenue, expenses, gains, and losses that under GAAP are recorded as an element of shareholders' equity but are excluded from net income. The changes in the components of accumulated other comprehensive income (loss) (AOCI) are shown below:
|
| Cumulative foreign currency translation adjustment |
| Postretirement benefits |
| Total | ||||||
Balance at January 31, 2012 |
| $ | 145 | |
| $ | (2,107 | ) |
| $ | (1,962 | ) |
Other comprehensive (loss) before reclassifications |
| (3 | ) |
| - | |
| (3 | ) | |||
Amounts reclassified from accumulated other comprehensive (loss) after tax benefit of $70 |
| - | |
| (130 | ) |
| (130 | ) | |||
Balance at January 31, 2013 |
| 142 | |
| (2,237 | ) |
| (2,095 | ) | |||
Other comprehensive (loss) before reclassifications |
| (424 | ) |
| - | |
| (424 | ) | |||
Amounts reclassified from accumulated other comprehensive income after tax (expense) of ($183) |
| - | |
| 340 | |
| 340 | | |||
Balance at January 31, 2014 |
| (282 | ) |
| (1,897 | ) |
| (2,179 | ) | |||
Other comprehensive (loss) before reclassifications |
| (1,466 | ) |
| - | |
| (1,466 | ) | |||
Amounts reclassified from accumulated other comprehensive (loss) after tax benefit of $1,187 |
| - | |
| (2,204 | ) |
| (2,204 | ) | |||
Balance at January 31, 2015 |
| $ | (1,748 | ) |
| $ | (4,101 | ) |
| $ | (5,849 | ) |
Postretirement benefit cost components are reclassified in their entirety from AOCI to net periodic benefit cost. Net periodic benefit costs are reported in net income as "Cost of sales" or "Selling, general and administrative expenses" in a manner consistent with the classification of direct labor and personnel costs of the eligible employees.
NOTE 4 | SUPPLEMENTAL CASH FLOW INFORMATION |
|
| For the years ended January 31, | ||||||||||
|
| 2015 |
| 2014 |
| 2013 | ||||||
Changes in operating assets and liabilities: |
|
|
|
|
|
| ||||||
Accounts receivable |
| $ | 4,699 | |
| $ | 1,297 | |
| $ | 4,362 | |
Inventories |
| 6,753 | |
| (9,190 | ) |
| 8,567 | | |||
Prepaid expenses and other assets |
| 195 | |
| (239 | ) |
| 976 | | |||
Accounts payable |
| (3,578 | ) |
| (994 | ) |
| (2,937 | ) | |||
Accrued and other liabilities |
| 48 | |
| (1,150 | ) |
| (1,709 | ) | |||
Customer advances |
| (144 | ) |
| (173 | ) |
| (60 | ) | |||
|
| $ | 7,973 | |
| $ | (10,449 | ) |
| $ | 9,199 | |
|
|
|
|
|
|
| ||||||
Supplemental disclosures of cash flow information |
|
|
|
|
|
| ||||||
Cash paid during the year for income taxes |
| $ | 14,011 | |
| $ | 20,002 | |
| $ | 26,697 | |
Interest paid |
| $ | 160 | |
| $ | - | |
| $ | - | |
|
|
|
|
|
|
| ||||||
Significant non-cash transactions: |
|
|
|
|
|
| ||||||
Issuance of common stock for business acquisition |
| $ | 39,252 | |
| $ | - | |
| $ | - | |
Capital expenditures included in accounts payable |
| $ | 564 | |
| $ | 1,083 | |
| $ | 2,196 | |
# 46
(Dollars in thousands, except per-share amounts)
NOTE 5 | ACQUISITIONS OF AND INVESTMENTS IN BUSINESSES AND TECHNOLOGIES |
Integra
The Company acquired all of the issued and outstanding shares of Integra Plastics, Inc. (Integra) in a transaction that closed on November 3, 2014 . The total purchase price was valued at approximately $48,200 , net of an estimated working capital adjustment included in the terms of the merger and acquisition agreement. These terms provided for payment through the issuance of 1,541,696 shares of the Company's common stock valued at $39,252 , based on the closing stock price on the date of acquisition and cash payments of $9,361 . Integra, which was a privately-held company headquartered in Madison, South Dakota specializes in the manufacture and conversion of high-quality plastic film and sheeting. This acquisition immediately expanded Raven's Engineered Films Division's production capacity with additional extrusion and lamination operations in Brandon, South Dakota and fabrication locations in Madison, South Dakota and Midland, Texas, as well as broadened Engineered Films' product offerings and enhanced current converting capabilities. Results of operations subsequent to acquisition have been included in the Engineered Films segment.
The fair value of the business acquired was allocated to the assets acquired and liabilities assumed based on their estimated fair values. The excess of the fair value acquired over the identifiable assets acquired and liabilities assumed is reflected as goodwill. Goodwill recorded as part of the purchase price allocation was $27,216 , none of which is tax deductible. Goodwill resulting from this business combination is largely attributable to the experienced workforce of the acquired business and synergies expected to arise after integration of Integra products and operations into Engineered Films. Identifiable intangible assets acquired as part of the acquisition included definite-lived intangibles for customer relationships and other intangibles valued at $10,000 and $200 , respectively. These intangible assets are being amortized using the straight-line method over their estimated useful life as follows: customer relationships - twelve years and other intangibles - two years. Liabilities assumed from Integra included a revolving line of credit and long-term notes with Wells Fargo Bank N.A. (Wells Fargo). The Company has a related party relationship with Wells Fargo described in Note 10 Financing Arrangements. This debt was repaid by the Company and there was no debt outstanding at January 31, 2015 .
The total purchase price was allocated to the estimated fair values of assets acquired and liabilities assumed as follows:
Cash |
|
|
| $ | 1,600 | |
Accounts receivable |
|
|
| 4,808 | | |
Inventory |
|
|
| 7,555 | | |
Deferred income taxes |
|
|
| 520 | | |
Other current assets |
|
|
| 24 | | |
Property, plant and equipment, net |
|
|
| 17,088 | | |
Goodwill |
|
|
| 27,216 | | |
Customer relationships and other definite-lived intangibles |
|
|
| 10,200 | | |
Short-term and long-term debt |
|
|
| (11,341 | ) | |
Current liabilities |
|
|
| (4,084 | ) | |
Other liabilities |
|
|
| (5,344 | ) | |
Total purchase price |
|
|
| $ | 48,242 | |
Integra net sales and net loss recognized in fiscal 2015 from the acquisition date to January 31, 2015 were $5,627 and $(874) , respectively.
SBG
On May 1, 2014 , the Company completed the purchase of all issued and outstanding shares of SBG Innovatie BV and its affiliate, Navtronics BVBA (collectively, SBG). SBG has operations in the Netherlands just outside of Amsterdam and at Navtronics in Geel, Belgium. The acquisition broadens Applied Technology Division's guided steering system product line by adding high-accuracy implement steering applications. Additionally, SBG's headquarters will become the new home office for Raven in Europe, expanding the Company's global presence and reach into key European markets.
In connection with the purchase, the Company paid $5,000 and agreed to pay up to $2,500 in additional earn-out payments calculated using the undiscounted cash flows and paid quarterly over the next 10 years contingent upon achieving certain revenues. The fair value of this contingent consideration determined based on the discounted cash flows at January 31, 2015 is $1,432 , of which $236 was classified as "Accrued liabilities" and $1,196 was classified as "Other liabilities". The Company paid $79 in earn-out payments during fiscal 2015 .
# 47
(Dollars in thousands, except per-share amounts)
The fair value of the business acquired was allocated to the assets acquired and liabilities assumed based on their estimated fair values. The excess of the fair value acquired over the identifiable assets acquired and liabilities assumed is reflected as goodwill. Goodwill recorded as part of the purchase price allocation was $3,250 , none of which is tax deductible. Identifiable intangible assets acquired as part of the acquisition were $2,104 , and included definite-lived intangibles, such as customer relationships and proprietary technology. Amortization is being computed over the estimated useful life using the undiscounted cash flows method as follows: twelve years for customer relationships and five years for proprietary technology. Liabilities acquired included debts to the former owners, a long-term note with a third-party bank, and deferred income taxes. As further described in Note 10 Financing Arrangements this debt was repaid by the Company and there was no debt outstanding at January 31, 2015 .
SBG net sales and net income recognized in fiscal 2015 from the acquisition date to January 31, 2015 were $3,245 and $152 , respectively.
The following pro forma consolidated condensed financial results of operations are presented as if the acquisitions described above had been completed at the beginning of the period presented (unaudited):
|
| (Unaudited) | ||||||
|
| For the year ended January 31, | ||||||
|
| 2015 |
| 2014 | ||||
Net sales |
| $ | 408,906 | |
| $ | 431,917 | |
Net income attributable to Raven Industries, Inc. |
| 34,424 | |
| 45,747 | | ||
|
|
|
|
| ||||
Earnings per common share: |
|
|
|
| ||||
Basic |
| $ | 0.90 | |
| $ | 1.20 | |
Diluted |
| $ | 0.90 | |
| $ | 1.20 | |
These unaudited pro forma consolidated financial results have been prepared for comparative purposes only and include certain adjustments, such as amortization and acquisition cost. The pro forma information does not purport to be indicative of the results of operations that actually would have resulted had these business combinations occurred at the beginning of each period presented, or of future results of the consolidated entities.
Acquisition-related contingent consideration
In addition to the contingent consideration related to the acquisition of SBG, the Company has contingent liabilities related to prior year acquisitions. Related to the acquisition of Vista in 2012 , the Company is committed to make annual payments based upon earn-out percentages on specific revenue streams for seven years after the purchase date, not to exceed $15,000 . The fair value of these contingent considerations is $2,989 , of which $ 554 was classified in "Accrued liabilities" and $2,435 as "Other liabilities" in the Consolidated Balance Sheet for the year ended January 31, 2015 . At January 31, 2014 , the fair value of the contingent consideration for the Vista acquisition was $3,347 , of which $890 was classified as "Accrued liabilities" and $2,457 as "Other liabilities" in the Consolidated Balance Sheet for the year ended January 31, 2014 . At January 31, 2013 , the fair value of the contingent consideration for the Vista acquisition was $3,071 , of which $712 was classified as "Accrued liabilities" and $2,359 as "Other liabilities" in the Consolidated Balance Sheet for the year ended January 31, 2013 . These fair values were estimated using forecasted discounted cash flows. The Company paid $454 , $353 , and $6,500 in earn-out payments in fiscal year 2015 , 2014 and 2013 , respectively.
Pursuant to the Company's 2009 purchase of substantially all of the assets of Ranchview Inc. (Ranchview), a privately-held Canadian corporation, during fiscal 2013 the Company paid $1,841 in cash to the previous Ranchview owner for an early buyout of the outstanding acquisition-related contingent liability. This resulted in a gain of $508 which was included in Applied Technology operating income.
Equity Method Investment SST
In November 2009, the Company acquired a 20% interest in Site Specific Technology Development Group, Inc. (SST). SST is a privately-held agricultural software development and information services provider. Raven and SST are strategically aligned to provide customers with simple, more efficient ways to move and manage information in the precision agriculture market.
# 48
(Dollars in thousands, except per-share amounts)
Changes in the net carrying value of the investment in SST were as follows:
|
| As of January 31, | ||||||||||
|
| 2015 |
| 2014 |
| 2013 | ||||||
Balance at beginning of year |
| $ | 3,684 | |
| $ | 4,063 | |
| $ | 4,409 | |
Income from equity investment |
| 28 | |
| 116 | |
| 156 | | |||
Amortization of intangible assets |
| (495 | ) |
| (495 | ) |
| (477 | ) | |||
Dividend received |
| - | |
| - | |
| (25 | ) | |||
Balance at end of year |
| $ | 3,217 | |
| $ | 3,684 | |
| $ | 4,063 | |
In October 2012, SST purchased approximately 10% of its outstanding common stock to be held as treasury stock. The impact of this transaction on the Company's noncontrolling interest in SST and the carrying value of its investment was as follows: Raven's ownership interest in SST increased from 20% to 22% ; The basis in the net assets at acquisition decreased by $525 ; and the basis in the technology-related assets and goodwill increased $117 and $408 , respectively, with no net impact to the carrying value of the investment.
NOTE 6 | GOODWILL AND OTHER INTANGIBLES |
Goodwill
The changes in the carrying amount of goodwill by reporting segment are shown below:
|
| Applied Technology |
| Engineered Films |
| Aerostar |
| Total | ||||||||
Balance at January 31, 2012 |
| $ | 9,892 | |
| $ | 96 | |
| $ | 12,286 | |
| $ | 22,274 | |
Balance at January 31, 2013 |
| 9,892 | |
| 96 | |
| 12,286 | |
| 22,274 | | ||||
Balance at January 31, 2014 |
| 9,892 | |
| 96 | |
| 12,286 | |
| 22,274 | | ||||
Acquired goodwill |
| 3,250 | |
| 27,216 | |
| - | |
| 30,466 | | ||||
Foreign currency translation adjustment |
| (592 | ) |
| - | |
| - | |
| (592 | ) | ||||
Balance at January 31, 2015 |
| $ | 12,550 | |
| $ | 27,312 | |
| $ | 12,286 | |
| $ | 52,148 | |
Intangible Assets
The following table provides the gross carrying amount and related accumulated amortization of definite-lived intangible assets:
|
| For the years ended January 31, | ||||||||||||||||||||||||||||
|
| 2015 |
| 2014 |
| 2013 | ||||||||||||||||||||||||
|
|
| Accumulated |
|
|
| Accumulated |
|
|
| Accumulated |
| ||||||||||||||||||
|
| Amount | Amortization | Net |
| Amount | Amortization | Net |
| Amount | Amortization | Net | ||||||||||||||||||
Existing technology |
| $ | 8,870 | | $ | (5,239 | ) | $ | 3,631 | |
| $ | 7,840 | | $ | (4,164 | ) | $ | 3,676 | |
| $ | 7,500 | | $ | (3,375 | ) | $ | 4,125 | |
Customer relationships |
| 14,128 | | (1,271 | ) | 12,857 | |
| 3,494 | | (525 | ) | 2,969 | |
| 3,494 | | (300 | ) | 3,194 | | |||||||||
Other intangibles |
| 3,657 | | (1,655 | ) | 2,002 | |
| 2,891 | | (1,380 | ) | 1,511 | |
| 2,506 | | (1,144 | ) | 1,362 | | |||||||||
Total |
| $ | 26,655 | | $ | (8,165 | ) | $ | 18,490 | |
| $ | 14,225 | | $ | (6,069 | ) | $ | 8,156 | |
| $ | 13,500 | | $ | (4,819 | ) | $ | 8,681 | |
|
| 2016 |
| 2017 |
| 2018 |
| 2019 |
| 2020 | ||||||||||
Estimated amortization expense |
| $ | 3,655 | |
| $ | 3,521 | |
| $ | 2,890 | |
| $ | 2,024 | |
| $ | 1,437 | |
NOTE 7 | EMPLOYEE POSTRETIREMENT BENEFITS |
The Company has two 401(k) plans covering substantially all employees as of January 31, 2015 . One plan, which covers the majority of employees, matches employee contributions up to 4% . Under this plan all account balances and future contributions
# 49
(Dollars in thousands, except per-share amounts)
and related earnings can be invested in several investment alternatives as well as the Company's common stock in accordance with each participant's elections. Participants' contributions to the 401(k) and the employer matching contributions are limited to 20% investment in the Company's common stock. Participants may choose to make separate investment choices for current account balances and for future contributions. Officers of the Company may not include Raven's common stock in their 401(k) plan elections.
The other 401(k) plan was assumed as part of the Vista acquisition. Employee contributions under this plan include a 3% annual contribution. This plan was amended in fiscal 2015 to eliminate a provision allowing an additional annual discretionary contribution. The Company also assumed an additional 401(k) profit sharing plan as part of the Integra acquisition. This plan was merged into Raven's 401(k) plan on December 31, 2014. Total contribution expense to all such plans was $2,416 , $2,412 and $2,021 for fiscal 2015 , 2014 , and 2013 , respectively.
In addition, the Company provides postretirement medical and other benefits to senior executive officers and senior managers. These plan obligations are unfunded. The accumulated benefit obligation for these benefits is as follows:
|
| For the years ended January 31, | ||||||||||
|
| 2015 |
| 2014 |
| 2013 | ||||||
Benefit obligation at beginning of year |
| $ | 8,254 | |
| $ | 8,307 | |
| $ | 7,560 | |
Service cost |
| 195 | |
| 202 | |
| 187 | | |||
Interest cost |
| 366 | |
| 348 | |
| 335 | | |||
Actuarial loss (gain) and assumption changes |
| 3,543 | |
| (340 | ) |
| 433 | | |||
Retiree benefits paid |
| (233 | ) |
| (263 | ) |
| (208 | ) | |||
Benefit obligation at end of year |
| $ | 12,125 | |
| $ | 8,254 | |
| $ | 8,307 | |
|
| For the years ended January 31, | ||||||||||
|
| 2015 |
| 2014 |
| 2013 | ||||||
Amounts not yet recognized in net periodic benefit cost: |
|
|
|
|
|
| ||||||
Net actuarial loss |
| $ | 6,309 | |
| $ | 2,918 | |
| $ | 3,441 | |
Total pre-tax accumulated other comprehensive loss |
| $ | 6,309 | |
| $ | 2,918 | |
| $ | 3,441 | |
|
|
|
|
|
|
| ||||||
Pre-tax accumulated other comprehensive loss - beginning of year related to benefit obligation |
| $ | 2,918 | |
| $ | 3,441 | |
| $ | 3,241 | |
Reclassification adjustments recognized in benefit cost: |
|
|
|
|
|
| ||||||
Recognized net (loss) |
| (152 | ) |
| (183 | ) |
| (210 | ) | |||
Amortization of transition obligation |
| - | |
| - | |
| (23 | ) | |||
Amounts recognized in AOCI during the year: |
|
|
|
|
|
| ||||||
Net actuarial loss (gain) |
| 3,543 | |
| (340 | ) |
| 433 | | |||
Pre-tax accumulated other comprehensive loss - end of year related to benefit obligation |
| $ | 6,309 | |
| $ | 2,918 | |
| $ | 3,441 | |
The net actuarial loss for fiscal year 2015 was the result of a decrease in the discount rate and application of updated mortality assumptions. The net actuarial gain in fiscal year 2014 was driven by an increase in the discount rate. The net actuarial loss in fiscal year 2013 was driven by a decrease in the discount rate and demographic changes, partially offset by better than expected claims experience.
# 50
(Dollars in thousands, except per-share amounts)
The liability and net periodic benefit cost reflected in the Consolidated Balance Sheets and Consolidated Statements of Income and Comprehensive Income were as follows:
|
| For the years ended January 31, | ||||||||||
|
| 2015 |
| 2014 |
| 2013 | ||||||
Beginning liability balance |
| $ | 8,254 | |
| $ | 8,307 | |
| $ | 7,560 | |
Net periodic benefit cost |
| 713 | |
| 733 | |
| 755 | | |||
Other comprehensive loss (income) |
| 3,391 | |
| (523 | ) |
| 200 | | |||
Total recognized in net and other comprehensive income |
| 4,104 | |
| 210 | |
| 955 | | |||
Retiree benefits paid |
| (233 | ) |
| (263 | ) |
| (208 | ) | |||
Ending liability balance |
| $ | 12,125 | |
| $ | 8,254 | |
| $ | 8,307 | |
|
|
|
|
|
|
| ||||||
Current portion in accrued liabilities |
| $ | 313 | |
| $ | 255 | |
| $ | 235 | |
Long-term portion in other liabilities |
| $ | 11,812 | |
| $ | 7,999 | |
| $ | 8,072 | |
|
|
|
|
|
|
| ||||||
Assumptions used to calculate benefit obligation: |
|
|
|
|
|
| ||||||
Discount rate |
| 3.50 | % |
| 4.50 | % |
| 4.25 | % | |||
Wage inflation rate |
| 4.00 | % |
| 4.00 | % |
| 4.00 | % | |||
Health care cost trend rates: |
|
|
|
|
|
| ||||||
Health care cost trend rate assumed for next year |
| 7.20 | % |
| 7.70 | % |
| 8.10 | % | |||
Ultimate health care cost trend rate |
| 5.00 | % |
| 5.00 | % |
| 5.00 | % | |||
Year that the rate reaches the ultimate trend rate |
| 2025 | |
| 2025 | |
| 2025 | | |||
The discount rate is based on matching rates of return on high-quality fixed-income investments with the timing and amount of expected benefit payments. No material fluctuations in retiree benefit payments are expected in future years. The total estimated cost to be recognized from AOCI into net periodic benefit cost over the next fiscal year is $337 .
The assumed health care cost trend rate has a significant effect on the amounts reported. The impact of a one-percentage point change in assumed health care rates would have the following effects:
|
| January 31, 2015 | ||||||
|
| One-percentage-point increase |
| One-percentage-point decrease | ||||
Effect on total of service and interest cost components |
| $ | 291 | |
| $ | (203 | ) |
Effect on accumulated postretirement benefit obligation |
| $ | 2,865 | |
| $ | (2,138 | ) |
The Company expects to contribute $313 in postretirement medical and other benefit payments in fiscal 2016 . The following postretirement other than pension benefit payments, which reflect expected future service as appropriate, are expected to be paid:
Fiscal | 2017 |
| $ | 331 | |
Fiscal | 2018 |
| 355 | | |
Fiscal | 2019 |
| 370 | | |
Fiscal | 2020 |
| 382 | | |
Fiscal | 2021 - 2025 |
| 2,170 | | |
# 51
(Dollars in thousands, except per-share amounts)
NOTE 8 | WARRANTIES |
Changes in the warranty accrual were as follows:
|
| For the years ended January 31, | ||||||||||
|
| 2015 |
| 2014 |
| 2013 | ||||||
Beginning balance |
| $ | 2,525 | |
| $ | 1,888 | |
| $ | 1,699 | |
Acquired |
| 50 | |
| - | |
| - | | |||
Accrual for warranties |
| 3,467 | |
| 4,561 | |
| 2,968 | | |||
Settlements made |
| (2,922 | ) |
| (3,924 | ) |
| (2,779 | ) | |||
Ending balance |
| $ | 3,120 | |
| $ | 2,525 | |
| $ | 1,888 | |
NOTE 9 | INCOME TAXES |
|
| For the years ended January 31, | |||||||
|
| 2015 |
| 2014 |
| 2013 | |||
Tax at U.S. federal statutory rate |
| 35.0 | % |
| 35.0 | % |
| 35.0 | % |
State and local income taxes, net of U.S. federal tax benefit |
| (0.3 | ) |
| 1.5 | |
| 1.6 | |
Tax credit for research activities |
| (3.9 | ) |
| (1.2 | ) |
| (0.9 | ) |
Tax benefit on qualified production activities |
| (3.6 | ) |
| (2.9 | ) |
| (3.2 | ) |
Other, net |
| (0.3 | ) |
| 0.2 | |
| (0.2 | ) |
|
| 26.9 | % |
| 32.6 | % |
| 32.3 | % |
The effective tax rate for fiscal 2015 was impacted favorably by recognition of a $776 research and development tax credit based upon a tax study undertaken for fiscal years 2011 through 2014. The Company also recorded a $963 discrete tax benefit in fourth quarter after reaching a favorable tax settlement with a state tax authority on a previously recorded uncertain tax position.
Significant components of the Company's income tax provision were as follows:
|
| For the years ended January 31, | ||||||||||
|
| 2015 |
| 2014 |
| 2013 | ||||||
Income taxes: |
|
|
|
|
|
| ||||||
Currently payable |
| $ | 12,663 | |
| $ | 20,098 | |
| $ | 26,894 | |
Deferred (benefit) expense |
| (958 | ) |
| 623 | |
| (1,803 | ) | |||
|
| $ | 11,705 | |
| $ | 20,721 | |
| $ | 25,091 | |
# 52
(Dollars in thousands, except per-share amounts)
Deferred Tax Assets
Deferred income taxes reflect the net tax effects of temporary differences between the carrying amounts of assets and liabilities for financial reporting purposes and the amounts used for income tax purposes. Significant components of the Company's deferred tax assets and liabilities were as follows:
|
| As of January 31, | ||||||||||
|
| 2015 |
| 2014 |
| 2013 | ||||||
Current deferred tax assets: |
|
|
|
|
|
| ||||||
Accounts receivable |
| $ | 194 | |
| $ | 111 | |
| $ | 70 | |
Inventories |
| 873 | |
| 583 | |
| 507 | | |||
Accrued vacation |
| 940 | |
| 1,032 | |
| 1,118 | | |||
Insurance obligations |
| 271 | |
| 276 | |
| 302 | | |||
Accrued benefit liabilities |
| 261 | |
| 291 | |
| 274 | | |||
Warranty obligations |
| 1,225 | |
| 898 | |
| 661 | | |||
Other accrued liabilities |
| 194 | |
| 181 | |
| 175 | | |||
|
| 3,958 | |
| 3,372 | |
| 3,107 | | |||
|
|
|
|
|
|
| ||||||
Non-current deferred tax assets (liabilities): |
|
|
|
|
|
| ||||||
Postretirement benefits |
| 4,243 | |
| 2,799 | |
| 2,826 | | |||
Depreciation and amortization |
| (16,099 | ) |
| (11,522 | ) |
| (9,114 | ) | |||
Uncertain tax positions |
| 1,002 | |
| 2,219 | |
| 1,969 | | |||
Share-based compensation |
| 2,897 | |
| 2,309 | |
| 1,613 | | |||
Other |
| 866 | |
| 669 | |
| 253 | | |||
|
| (7,091 | ) |
| (3,526 | ) |
| (2,453 | ) | |||
Net deferred tax (liability) asset |
| $ | (3,133 | ) |
| $ | (154 | ) |
| $ | 654 | |
Pre-tax book income (loss) for the U.S. companies and the Canadian subsidiary was $ 42,282 and $ (38) , respectively. As of January 31, 2015 , undistributed earnings of $1,490 of the Canadian subsidiary were considered to have been reinvested indefinitely and, accordingly, the Company has not provided United States income taxes on such earnings. This estimated tax liability would be approximately $231 net of foreign tax credits.
Uncertain Tax Positions
A summary of the activity related to the gross unrecognized tax benefits (excluding interest and penalties) is as follows:
|
| For the years ended January 31, | ||||||||||
|
| 2015 |
| 2014 |
| 2013 | ||||||
Gross unrecognized tax benefits at beginning of year |
| $ | 4,660 | |
| $ | 4,213 | |
| $ | 3,567 | |
Increases in tax positions related to the current year |
| 909 | |
| 795 | |
| 993 | | |||
Decreases as a result of lapses in applicable statutes of limitation |
| (393 | ) |
| (348 | ) |
| (347 | ) | |||
Tax settlement with tax authorities |
| (2,869 | ) |
| - | |
| - | | |||
Gross unrecognized tax benefits at end of year |
| $ | 2,307 | |
| $ | 4,660 | |
| $ | 4,213 | |
Fiscal year 2015 changes to uncertain tax positions related to prior years resulted from both lapses of applicable statutes of limitation and a favorable settlement reached with a state tax authority. The total unrecognized tax benefits that, if recognized, would affect the Company's effective tax rate were $1,617 , $3,029 , and $2,738 as of January 31, 2015 , 2014, and 2013, respectively. The Company does not expect any significant change in the amount of unrecognized tax benefits in the next fiscal year.
The Company recognizes interest and penalties accrued related to unrecognized tax benefits in income tax expense. At January 31, 2015 , 2014, and 2013, accrued interest and penalties were $952 , $1,897 , and $1,605 , respectively.
The Company files tax returns, including returns for its subsidiaries, with various federal, state, and local jurisdictions. Uncertain tax positions are related to tax years that remain subject to examination. As of January 31, 2015 , federal tax returns filed in the U.S., Canada and Switzerland for fiscal years ended January 31, 2010 through January 31, 2014 remain subject to examination by federal tax authorities. In state and local jurisdictions, tax returns for fiscal years ended January 31, 2007 through January 31, 2014 remain subject to examination by state and local tax authorities.
# 53
(Dollars in thousands, except per-share amounts)
NOTE 10 | FINANCING ARRANGEMENTS |
The Company has an uncollateralized credit agreement with Wells Fargo providing a line of credit of $10,500 with a maturity date of November 30, 2016 , bearing interest at 1.5% above the daily one-month London Inter-Bank Market Rate. Letters of credit totaling $850 have been issued under the line, primarily to support self-insured workers' compensation bonding requirements. Among the conditions of the credit agreement is a requirement to maintain a current ratio (defined as current assets divided by current liabilities) not less than 2.0 to 1.0 at each fiscal quarter end. No borrowings were outstanding as of January 31, 2015 , 2014 or 2013 . Net of the outstanding letters of credit, $9,650 was available under the line of credit at January 31, 2015 . There have been no borrowings under the credit line with Wells Fargo in the last three fiscal years. The Company is in compliance with all covenants set forth in the credit agreement.
In addition to providing the line of credit, Wells Fargo holds the majority of the Company's cash and cash equivalents. One member of the Company's Board of Directors is also on the Board of Directors of Wells Fargo & Company, the parent company of Wells Fargo.
Pursuant to the acquisition of SBG and Integra as described in Note 5 Acquisitions of and Investments in Businesses and Technologies, the Company assumed liabilities including debts to former owners, a line of credit and long-term notes. Although there was a short-term working capital borrowing under Integra's line of credit, such borrowing and assumed debt was subsequently paid in full and the line of credit was closed. There was no debt outstanding at January 31, 2015.
The changes in the debt balance during the current fiscal year are shown below:
Debt Assumed | Acquired in Business Combination |
| Debt Assumed at Acquisition |
| Additional Borrowings |
| Debt Repayment |
| Debt Outstanding at January 31, 2015 | ||||||||
Line of credit | Integra |
| $ | 1,465 | |
| $ | 2,127 | |
| $ | (3,592 | ) |
| $ | - | |
Long-term notes | Integra |
| 9,876 | |
| - | |
| (9,876 | ) |
| - | | ||||
Notes with former owners and others | SBG |
| 648 | |
| - | |
| (648 | ) |
| - | | ||||
|
|
| $ | 11,989 | |
| $ | 2,127 | |
| $ | (14,116 | ) |
| $ | - | |
The Company leases certain vehicles, equipment and facilities under operating leases. Total rent and lease expense was $1,977 , $2,395 and $2,095 in fiscal 2015 , 2014 and 2013 , respectively.
Future minimum lease payments under non-cancelable operating leases are as follows:
|
| 2016 |
| 2017 |
| 2018 |
| 2019 |
| 2020 |
| Thereafter | ||||||||||||
Minimum lease payments |
| $ | 1,913 | |
| $ | 1,616 | |
| $ | 1,407 | |
| $ | 1,200 | |
| $ | 1,224 | |
| $ | 1,327 | |
NOTE 11 | SHARE-BASED COMPENSATION |
At January 31, 2015 , the Company had two shareholder approved share-based compensation plans, which are described below. The compensation cost and related income tax benefit for these plans were as follows:
|
| For the years ended January 31, | ||||||||||
|
| 2015 |
| 2014 |
| 2013 | ||||||
Share-based compensation cost |
| $ | 4,213 | |
| $ | 4,198 | |
| $ | 3,075 | |
Tax benefit |
| 1,504 | |
| 1,460 | |
| 1,057 | | |||
Share-based compensation cost capitalized as part of inventory is not significant.
Equity Compensation Plans
The Company reserved shares of its common stock for issuance to directors, officers, employees, and certain advisors of the Company through incentive stock options and non-statutory stock options, stock appreciation rights, stock awards, restricted stock, restricted stock units (RSUs), and performance awards to be granted under the Amended and Restated 2010 Stock Incentive Plan (the Plan) which was approved by shareholders on May 22, 2012 . The aggregate number of shares initially available for which
# 54
(Dollars in thousands, except per-share amounts)
options may be granted under the Plan was 2,000,000 . As of January 31, 2015 , the number of shares available for grant under the Plan was 622,085 . Option exercises under the Plan are settled in newly issued common shares.
The Plan is administered by the Personnel and Compensation Committee of the Board of Directors (the Committee), consisting of two or more independent directors of the Company. Subject to the provisions set forth in the Plan, all of the members of the Committee shall be non-employee members of the Board of Directors. The Committee determines the option exercise prices and the term of each grant. The Committee may accelerate the exercisability of awards under the Plan or extend the term of such awards to the extent allowed by the Plan to a maximum term of ten years. Two types of awards were granted under the Plan in fiscal 2015, stock options and restricted stock units.
Stock Option Awards
The Company granted 194,900 non-qualified stock options during fiscal 2015. Options are granted with exercise prices not less than market value of the Company's common stock at the date of grant. The stock options vest over a four -year period and expire after five years. Options contain retirement and change-in-control provisions that may accelerate the vesting period. The fair value of each option grant is estimated on the date of grant using the Black-Scholes option pricing model. The Company uses historical data to estimate option exercises, employee terminations, and volatility within this valuation model.
The weighted average assumptions used for the Black-Scholes option pricing model by grant year are as follows:
|
| For the years ended January 31, | ||||||||||
|
| 2015 |
| 2014 |
| 2013 | ||||||
Risk-free interest rate |
| 1.32 | % |
| 0.59 | % |
| 0.86 | % | |||
Expected dividend yield |
| 1.53 | % |
| 1.46 | % |
| 1.33 | % | |||
Expected volatility factor |
| 38.65 | % |
| 41.39 | % |
| 49.62 | % | |||
Expected option term (in years) |
| 4.00 | |
| 3.75 | |
| 3.75 | | |||
|
|
|
|
|
|
| ||||||
Weighted average grant date fair value |
| $ | 9.18 | |
| $ | 9.34 | |
| $ | 10.92 | |
Outstanding stock options as of January 31, 2015 and activity for the year then ended are presented below:
|
| Number |
| Weighted average exercise price |
| Aggregate intrinsic value |
| Weighted | |||||
Outstanding, January 31, 2014 |
| 946,133 | |
| $ | 26.88 | |
|
|
|
| ||
Granted |
| 194,900 | |
| 32.75 | |
|
|
|
| |||
Exercised |
| (106,383 | ) |
| 16.24 | |
|
|
|
| |||
Forfeited |
| (14,750 | ) |
| 31.24 | |
|
|
|
| |||
Expired |
| (4,625 | ) |
| 31.10 | |
|
|
|
| |||
Outstanding, January 31, 2015 |
| 1,015,275 | |
| $ | 29.04 | |
| $ | 298 | |
| 2.32 |
|
|
|
|
|
|
|
|
| |||||
Outstanding exercisable, January 31, 2015 |
| 557,600 | |
| $ | 26.40 | |
| $ | 298 | |
| 1.54 |
The intrinsic value of a stock award is the amount by which the fair value of the underlying stock exceeds the exercise price of the award. The total intrinsic value of options exercised was $1,467 , $3,019 , and $2,573 during the years ended January 31, 2015 , 2014 , and 2013 , respectively. As of January 31, 2015 , the total unrecognized compensation cost for non-vested awards was $2,856 , net of the effect of estimated forfeitures. This amount is expected to be recognized over a weighted average period of 2.26 years.
# 55
(Dollars in thousands, except per-share amounts)
Restricted Stock Unit Awards
The Company granted 27,741 time-vested RSUs to employees during the year ended January 31, 2015 . The fair value of a time-vested RSU is measured based upon the closing market price of the Company's common stock on the date of grant. Time-vested RSUs will vest if, at the end of the three -year period, the employee remains employed by the Company. RSUs contain retirement and change-in-control provisions that may accelerate the vesting period. Dividends are cumulatively earned on the time-vested RSUs over the vesting period.
Activity for time-vested RSUs under the Plan in fiscal 2015 was as follows:
|
| Number |
| Weighted | |||
Outstanding, January 31, 2014 |
| 43,360 | |
| $ | 32.32 | |
Granted |
| 27,741 | |
| 29.69 | | |
Vested |
| - | |
| - | | |
Forfeited |
| (2,964 | ) |
| 32.55 | | |
Outstanding, January 31, 2015 |
| 68,137 | |
| $ | 31.27 | |
|
|
|
|
| |||
Cumulative dividends, January 31, 2015 |
| 2,174 | |
|
| ||
The Company also granted performance-based RSUs during the year ended January 31, 2015 . The exact number of performance shares to be issued will vary from 0% to 150% of the target award, depending on the Company's actual performance over the three -year period in comparison to the target award. The target award for the fiscal 2015 grant is based on return on equity (ROE), which is defined as net income divided by the average of beginning and ending shareholders' equity for the fiscal year. The target award for the fiscal 2014 and fiscal 2013 grant is based on return on sales (ROS), which is defined as net income divided by net sales. The performance-based RSUs will vest if, at the end of the three -year performance period, the Company has achieved certain performance goals and the employee remains employed by the Company. Performance-based RSUs contain retirement and change-in-control provisions that may accelerate the vesting period. Dividends are cumulatively earned on performance-based RSUs over the vesting period.
The fair value of the performance-based restricted stock units is based upon the closing market price of the Company's common stock on the grant date. The number of restricted stock units granted is based on 100% of the target award. The number of RSUs that will vest is determined by the estimated ROE or ROS target over the three -year performance period. The estimated performance factor used to estimate the number of restricted stock units expected to vest is evaluated at least quarterly. The number of restricted stock units issued at the vesting date will be based on actual results.
Activity for performance-based RSUs under the Plan in fiscal 2015 was as follows:
|
| Number |
| Weighted | |||
Outstanding, January 31, 2014 |
| 135,935 | |
| $ | 32.27 | |
Granted |
| 54,490 | |
| 32.75 | | |
Vested |
| - | |
| - | | |
Forfeited |
| (6,073 | ) |
| 32.41 | | |
Performance-based adjustment |
| (31,913 | ) |
| 32.47 | | |
Outstanding, January 31, 2015 |
| 152,439 | |
| $ | 32.40 | |
|
|
|
|
| |||
Cumulative dividends, January 31, 2015 |
| 5,137 | |
|
| ||
As of January 31, 2015, the total unrecognized compensation cost for nonvested RSU awards was $2,738 net of the effect for estimated forfeitures. This amount is expected to be recognized over a weighted average period of 1.79 years.
# 56
(Dollars in thousands, except per-share amounts)
Deferred Stock Compensation Plan for Directors
The Company reserved 100,000 shares of its common stock for issuance to certain members of its Board of Directors under the Deferred Stock Compensation Plan for Directors of Raven Industries, Inc. (the Director Plan). The Director Plan is administered by the Personnel and Compensation Committee of the Board of Directors. Under the Director Plan, any non-employee director receives a grant of a number of stock units as deferred compensation to be converted into common stock after retirement from the Board of Directors and may elect to have a specified percentage of their annual retainer converted to stock units. Under the Director Plan, a stock unit is the right to receive one share of the Company's common stock as deferred compensation, to be distributed from an account established by the Company in the name of the non-employee director. Stock units have the same value as a share of common stock but cannot be sold. Stock units are a component of the Company's equity.
Stock units granted under the Director Plan vest immediately and are expensed at the date of grant. When dividends are paid on the Company's common shares, stock units are added to the directors' balances and a corresponding amount is removed from retained earnings. The intrinsic value of a stock unit is the fair value of the underlying shares.
Outstanding stock units as of January 31, 2015 and changes during the year then ended are presented below:
|
| Number |
| Weighted | |||
Outstanding, January 31, 2014 |
| 71,618 | |
| $ | 37.45 | |
Granted |
| 12,012 | |
| 29.97 | | |
Deferred retainers |
| 2,002 | |
| 29.97 | | |
Dividends |
| 1,304 | |
| 26.59 | | |
Converted into common shares |
| (17,589 | ) |
| 31.19 | | |
Outstanding, January 31, 2015 |
| 69,347 | |
| $ | 21.44 | |
NOTE 12 | NET INCOME PER SHARE |
Basic net income per share is computed by dividing net income by the weighted average common shares and stock units outstanding. Diluted net income per share is computed by dividing net income by the weighted average common and common equivalent shares outstanding (which includes the shares issuable upon exercise of employee stock options, net of shares assumed purchased with the option proceeds), stock units and restricted stock units outstanding. Performance share awards are included in the diluted calculation based upon what would be issued if the end of the most recent reporting period was the end of the term of the award. Certain outstanding options and restricted stock units were excluded from the diluted net income per-share calculations because their effect would have been anti-dilutive under the treasury stock method.
The options and restricted stock units excluded from the diluted net income per share calculation were as follows:
|
| For the years ended January 31, | |||||||
|
| 2015 |
| 2014 |
| 2013 | |||
Anti-dilutive options and restricted stock units |
| 781,988 | |
| 577,213 | |
| 397,600 | |
# 57
(Dollars in thousands, except per-share amounts)
The computation of earnings per share is presented below:
|
| For the years ended January 31, | ||||||||||
|
| 2015 |
| 2014 |
| 2013 | ||||||
Numerator: |
|
|
|
|
|
| ||||||
Net income attributable to Raven Industries, Inc. |
| $ | 31,733 | |
| $ | 42,903 | |
| $ | 52,545 | |
|
|
|
|
|
|
| ||||||
Denominator: |
|
|
|
|
|
| ||||||
Weighted average common shares outstanding |
| 36,859,026 | |
| 36,379,356 | |
| 36,290,329 | | |||
Weighted average stock units outstanding |
| 69,484 | |
| 67,724 | |
| 54,929 | | |||
Denominator for basic calculation |
| 36,928,510 | |
| 36,447,080 | |
| 36,345,258 | | |||
|
|
|
|
|
|
| ||||||
Weighted average common shares outstanding |
| 36,859,026 | |
| 36,379,356 | |
| 36,290,329 | | |||
Weighted average stock units outstanding |
| 69,484 | |
| 67,724 | |
| 54,929 | | |||
Dilutive impact of stock options and RSUs |
| 174,784 | |
| 198,295 | |
| 188,166 | | |||
Denominator for diluted calculation |
| 37,103,294 | |
| 36,645,375 | |
| 36,533,424 | | |||
|
|
|
|
|
|
| ||||||
Net income per share - basic |
| $ | 0.86 | |
| $ | 1.18 | |
| $ | 1.45 | |
Net income per share - diluted |
| $ | 0.86 | |
| $ | 1.17 | |
| $ | 1.44 | |
NOTE 13 | BUSINESS SEGMENTS AND MAJOR CUSTOMER INFORMATION |
The Company's reportable segments are defined by their product lines which have been grouped in these segments based on common technologies, production methods, and inventories. These segments reflect the Company's organization into two Raven divisions and the Aerostar subsidiary. The Company's reportable segments are Applied Technology Division, Engineered Films Division, and Aerostar Division. Raven Canada, SBG, Raven GmbH, Raven Australia, and Raven Brazil are included in the Applied Technology Division. Vista and AIS are included in the Aerostar Division. Substantially all of the Company's long-lived assets are located in the United States.
Applied Technology designs, manufactures, sells, and services innovative precision agriculture products and information management tools that help growers reduce costs, save time and improve farm yields around the world. Their product families include field computers, application controls, GPS-guidance and assisted-steering systems, automatic boom controls, yield monitoring and planter and seeder controls, harvest controls, motor controls, and an integrated RTK and information platform called Slingshot™. Applied Technology services include high-speed, in-field internet connectivity and cloud-based data management.
The Company's Engineered Films Division manufactures high-performance plastic films and sheeting for major markets throughout the United States and abroad. An important part of this business is highly technical, engineered geomembrane films that protect environmental resources through containment linings and coverings for energy, agriculture, construction, and industrial markets.
Aerostar designs and manufactures proprietary products including high-altitude balloons, tethered aerostats, and radar processing systems. These products can be integrated with additional third-party sensors to provide research, communications, and situational awareness to government and commercial customers. As the Company focused its growth strategy on its proprietary products, the Company made an intentional choice to move away from contract manufacturing. For Aerostar, product lines such as manufacturing military parachutes, uniforms and protective wear along with electronics manufacturing services are being phased out.
Through Vista and AIS, Aerostar pursues potential product and support services contracts for agencies and instrumentalities of the U.S. government. Vista positions the Company to meet growing global demand for lower-cost detection and tracking systems used by government and law enforcement agencies. As a leading provider of surveillance systems that enhance the effectiveness of radar using sophisticated algorithms, Vista products and services enhance Aerostar's tethered aerostat security solutions.
The Company measures the performance of its segments based on their operating income excluding administrative and general expenses. The accounting policies of the operating segments are the same as those described in Note 1 Summary of Significant Accounting Policies . Other income, interest expense, and income taxes are not allocated to individual operating segments, and assets not identifiable to an individual segment are included as corporate assets. Segment information is reported consistent with the Company's management reporting structure.
# 58
(Dollars in thousands, except per-share amounts)
Business segment information is as follows: |
|
|
|
| ||||||||
|
| For the years ended January 31, | ||||||||||
|
| 2015 |
| 2014 |
| 2013 | ||||||
APPLIED TECHNOLOGY DIVISION |
|
|
|
|
|
| ||||||
Sales |
| $ | 142,154 | |
| $ | 170,461 | |
| $ | 171,778 | |
Operating income |
| 34,557 | |
| 57,000 | |
| 59,590 | | |||
Assets |
| 88,764 | |
| 93,395 | |
| 84,224 | | |||
Capital expenditures |
| 3,478 | |
| 9,324 | |
| 10,780 | | |||
Depreciation and amortization |
| 5,569 | |
| 4,332 | |
| 3,874 | | |||
ENGINEERED FILMS DIVISION |
|
|
|
|
|
| ||||||
Sales |
| $ | 166,634 | |
| $ | 147,620 | |
| $ | 141,976 | |
Operating income |
| 21,802 | |
| 18,154 | |
| 25,115 | | |||
Assets |
| 140,023 | |
| 71,602 | |
| 65,801 | | |||
Capital expenditures |
| 8,241 | |
| 6,681 | |
| 11,539 | | |||
Depreciation and amortization |
| 6,096 | |
| 5,808 | |
| 5,814 | | |||
AEROSTAR DIVISION |
|
|
|
|
|
| ||||||
Sales |
| $ | 80,772 | |
| $ | 90,605 | |
| $ | 102,051 | |
Operating income |
| 8,983 | |
| 7,816 | |
| 10,341 | | |||
Assets |
| 59,274 | |
| 63,017 | |
| 60,689 | | |||
Capital expenditures |
| 2,799 | |
| 7,507 | |
| 2,081 | | |||
Depreciation and amortization |
| 3,474 | |
| 2,616 | |
| 2,272 | | |||
INTERSEGMENT ELIMINATIONS |
|
|
|
|
|
| ||||||
Sales |
|
|
|
|
|
| ||||||
Applied Technology Division |
| $ | (231 | ) |
| $ | (386 | ) |
| $ | (974 | ) |
Engineered Films Division |
| (652 | ) |
| (505 | ) |
| (124 | ) | |||
Aerostar Division |
| (10,524 | ) |
| (13,118 | ) |
| (8,532 | ) | |||
Operating income |
| 163 | |
| (111 | ) |
| (61 | ) | |||
Assets |
| (148 | ) |
| (311 | ) |
| (347 | ) | |||
REPORTABLE SEGMENTS TOTAL |
|
|
|
|
|
| ||||||
Sales |
| $ | 378,153 | |
| $ | 394,677 | |
| $ | 406,175 | |
Operating income |
| 65,505 | |
| 82,859 | |
| 94,985 | | |||
Assets |
| 287,913 | |
| 227,703 | |
| 210,367 | | |||
Capital expenditures |
| 14,518 | |
| 23,512 | |
| 24,400 | | |||
Depreciation and amortization |
| 15,139 | |
| 12,756 | |
| 11,960 | | |||
CORPORATE & OTHER |
|
|
|
|
|
| ||||||
Operating (loss) from administrative expenses |
| $ | (21,704 | ) |
| $ | (18,865 | ) |
| $ | (17,293 | ) |
Assets (a) |
| 74,960 | |
| 74,116 | |
| 62,843 | | |||
Capital expenditures |
| 2,523 | |
| 7,189 | |
| 5,275 | | |||
Depreciation and amortization |
| 2,230 | |
| 1,439 | |
| 1,138 | | |||
TOTAL COMPANY |
|
|
|
|
|
| ||||||
Sales |
| $ | 378,153 | |
| $ | 394,677 | |
| $ | 406,175 | |
Operating income |
| 43,801 | |
| 63,994 | |
| 77,692 | | |||
Assets |
| 362,873 | |
| 301,819 | |
| 273,210 | | |||
Capital expenditures |
| 17,041 | |
| 30,701 | |
| 29,675 | | |||
Depreciation and amortization |
| 17,369 | |
| 14,195 | |
| 13,098 | | |||
(a) Assets are principally cash, investments, deferred taxes and other receivables.
Sales to a customer of the Engineered Films segment accounted for 14% , 13% , and 11% of consolidated sales in fiscal years 2015 2014 and 2013 , respectively and accounted for 5% , 2% , and 3% of consolidated accounts receivable at January 31, 2015 , 2014 , and 2013 , respectively.
# 59
(Dollars in thousands, except per-share amounts)
Foreign sales are attributed to countries based on location of the customer. Net sales to customers outside the United States were as follows:
|
| For the years ended January 31, | ||||||||||
|
| 2015 |
| 2014 |
| 2013 | ||||||
Canada |
| $ | 14,432 | |
| $ | 16,141 | |
| $ | 20,640 | |
South America |
| 9,884 | |
| 22,090 | |
| 14,984 | | |||
Other foreign sales |
| 12,519 | |
| 7,662 | |
| 13,630 | | |||
Total foreign sales |
| 36,835 | |
| 45,893 | |
| 49,254 | | |||
United States |
| 341,318 | |
| 348,784 | |
| 356,921 | | |||
|
| $ | 378,153 | |
| $ | 394,677 | |
| $ | 406,175 | |
ITEM 9. | CHANGES IN AND DISAGREEMENTS WITH ACCOUNTANTS ON ACCOUNTING AND FINANCIAL DISCLOSURE |
None.
ITEM 9A. | CONTROLS AND PROCEDURES |
Disclosure Controls and Procedures
Disclosure controls and procedures (as defined in Exchange Act Rules 13a-15(e) and 15d-15(e) are our controls and other procedures that are designed to ensure that information required to be disclosed by us in the reports that we file or submit under the Securities Exchange Act of 1934 (the Exchange Act) is recorded, processed, summarized, and reported within the time periods specified in the SEC's rules and forms. Disclosure controls and procedures include, without limitation, controls and procedures designed to ensure that information required to be disclosed by us in the reports that we file or submit under the Exchange Act is accumulated and communicated to our management, including our Chief Executive Officer (CEO) and Chief Financial Officer (CFO), as appropriate to allow timely decisions regarding required disclosure.
As of January 31, 2015 , the end of the period covered by this report, management evaluated the effectiveness of the Company's disclosure controls and procedures as of such date.
Based on their evaluation, the CEO and CFO have concluded that the Company's disclosure controls and procedures are effective as of January 31, 2015.
Management's Report on Internal Control Over Financial Reporting
Pursuant to Section 404 of the Sarbanes-Oxley Act of 2002, the Company included management's assessment of the design and effectiveness of its internal controls over financial reporting as part of this Annual Report on Form 10-K for the fiscal year ended January 31, 2015. Management's report and the report of the Company's independent registered public accounting firm are included in Part II, Item 8. captioned "Management's Report on Internal Control Over Financial Reporting" and "Report of Independent Registered Public Accounting Firm" and are incorporated herein by reference. In making this assessment of effectiveness of internal controls over financial reporting, management excluded from this assessment the internal controls over financial reporting at Integra Plastics, Inc. which was acquired on November 3, 2014. The assets acquired comprise approximately 11% of the assets of the Company at January 31, 2015. Approximately 1% of net sales for the fiscal year 2015 were contributed by the acquired business since its acquisition.
Changes in Internal Control Over Financial Reporting
There were no changes in the Company's internal control over financial reporting (as defined in Rules 13a-15(f) and 15d-15(f) under the Exchange Act) that occurred during the quarter ended January 31, 2015 , that have materially affected, or are reasonably likely to materially affect, the Company's internal control over financial reporting.
ITEM 9B. | OTHER INFORMATION |
Not applicable.
# 60
PART III |
|
|
|
ITEMS 10, 11, 12, 13 and 14. | DIRECTORS, EXECUTIVE OFFICERS AND CORPORATE GOVERNANCE; EXECUTIVE COMPENSATION; SECURITY OWNERSHIP OF CERTAIN BENEFICIAL OWNERS AND MANAGEMENT AND RELATED SHAREHOLDER MATTERS; CERTAIN RELATIONSHIPS AND RELATED TRANSACTIONS AND DIRECTOR INDEPENDENCE; AND PRINCIPAL ACCOUNTANT FEES AND SERVICES |
The Company will file a definitive proxy statement with the Securities and Exchange Commission pursuant to Regulation 14A under the Securities Exchange Act of 1934 (the "Proxy Statement") relating to the Company's 2015 Annual Meeting of Shareholders. Information required by Items 10 through 14 will appear in the Proxy Statement and is incorporated herein by reference.
# 61
PART IV |
|
|
|
ITEM 15. | EXHIBITS, FINANCIAL STATEMENT SCHEDULE |
LIST OF DOCUMENTS FILED AS PART OF THIS REPORT
Financial Statements
See PART II, Item 8.
Financial Statement Schedule
Schedule II - Valuation and Qualifying Accounts
All other schedules for which provision is made in the applicable accounting regulations of the Securities and Exchange Commission are not required under the related instructions or are inapplicable and therefore have been omitted.
Exhibits
See index to Exhibits on the following page.
# 62
Exhibit Number |
| Description | |
|
|
| |
2(a) | |
| Stock Purchase Agreement, dated as of December 30, 2011, by and between Aerostar International, Inc. and Vista Applied Technologies Group, Inc. (incorporated herein by reference to Exhibit 2.1 of the Company's Form 8-K filed January 6, 2012). |
|
|
| |
2(b) | |
| Agreement and Plan of Merger and Reorganization, dated as of November 3, 2014, by and among Raven Industries, Inc., Infinity Acquisition, Inc., Integra Plastics, Inc. and Nikole Mulder, as the Shareholder Representative (incorporated herein by reference to Exhibit 2.1 of the Company's Form 8-K filed November 7, 2014). |
|
|
| |
3(a) | |
| Articles of Incorporation of Raven Industries, Inc. and all amendments thereto (incorporated herein by reference to the corresponding exhibit of the Company's 10-K for the year ended January 31, 1989). |
|
|
| |
3(b) | |
| Amended and Restated Bylaws of Raven Industries (incorporated herein by reference to Exhibit B of the Company's definitive Proxy Statement filed April 12, 2012). |
|
|
| |
4(a) | |
| Raven Industries Inc. Amended and Restated 2010 Stock Incentive Plan filed on June, 11, 2012 as Exhibit 4.1 of Raven Industries, Inc. Registration Statement on Form S-8, and incorporated herein by reference). |
|
|
| |
10(a) | |
| Employment Agreement between Raven Industries, Inc. and Daniel A. Rykhus dated as of February 1, 2009 (incorporated herein by reference to Exhibit 10.1 of the Company's 8-K filed February 1, 2009). † |
|
|
| |
10(b) | |
| Employment Agreement between Raven Industries, Inc. and Lon E. Stroschein dated as of October 1, 2010 (incorporated by reference to Exhibit 10.1 of the Company's 8-K filed October 1, 2010). † |
|
|
| |
10(c) | |
| Employment Agreement between Raven Industries, Inc. and Anthony D. Schmidt dated as of February 1, 2012 (incorporated herein by reference to Exhibit 10.1 of the Company's 8-K filed February 1, 2012). † |
|
|
| |
10(d) | |
| Employment Agreement between Raven Industries, Inc. and Thomas Iacarella dated as of February 1, 2004 (incorporated herein by reference to the corresponding exhibit number of the Company's 10-K for the year ended January 31, 2004). † |
|
|
| |
10(e) | |
| Schedule A to Employment Agreements between Raven Industries, Inc. and each of the following Senior Executive Officers: Daniel A. Rykhus and Thomas Iacarella (incorporated herein by reference to the corresponding exhibit number of the Company's 10-K filed March 31, 2011). † |
|
|
| |
10(f) | |
| Change in Control Agreement between Raven Industries, Inc. and each of the following officers and key employees: Daniel A. Rykhus and Thomas Iacarella, dated as of January 31, 2008 (incorporated herein by reference to Exhibit 10.1 of the Company's 8-K filed December 17, 2007). † |
|
|
| |
10(g) | |
| Raven Industries, Inc. 2000 Stock Option and Compensation Plan adopted May 24, 2000 (incorporated herein by reference to Exhibit A of the Company's definitive Proxy Statement filed April 19, 2000).† |
|
|
| |
10(h) | |
| Raven Industries, Inc. Deferred Compensation Plan for Directors adopted May 23, 2007 (incorporated herein by reference to Exhibit 10.1 of the Company's 8-K filed May 24, 2007). † |
|
|
| |
10(i) | |
| Employment Agreement between Raven Industries, Inc. and Matthew T. Burkhart dated February 1, 2010 (incorporated herein by reference to Exhibit 10.1 of the Company's 8-K filed February 2, 2010). † |
|
|
| |
10(j) | |
| Change in Control Agreement between Raven Industries, Inc. and Matthew T. Burkhart dated February 1, 2010 (incorporated herein by reference to Exhibit 10.3 of the Company's 8-K filed February 2, 2010). † |
|
|
| |
10(k) | |
| Change in Control Agreement between Raven Industries, Inc. and Lon E. Stroschein dated October 1, 2010 (incorporated herein by reference to Exhibit 10.3 of the Company's 8-K filed October 1, 2010). † |
|
|
| |
10(l) | |
| Schedule A to Employment Agreements between Raven Industries, Inc. and each of the following Senior Managers: Matthew T. Burkhart, Anthony D. Schmidt and Lon E. Stroschein (incorporated herein by reference to the corresponding exhibit number of the Company's 10-K filed March 31, 2011). † |
|
|
| |
10(m) | |
| Change in Control Agreement between Raven Industries, Inc. and Anthony D. Schmidt dated February 1, 2012 (incorporated herein by reference to Exhibit 10.3 of the Company's 8-K filed February 1, 2012). † |
|
|
| |
10(n) | |
| Employment Agreement between Raven Industries, Inc. and Janet L. Matthiesen (incorporated herein by reference to Exhibit 10.1 of the Company's 8-K filed April 20, 2012). † |
|
|
| |
10(o) | |
| Schedule A to Employment Agreement between Raven Industries, Inc. and Janet L. Matthiesen (incorporated herein by reference to Exhibit 10.2 of the Company's 8-K filed April 20, 2012). † |
|
|
| |
10(p) | |
| Change in Control Agreement between Raven Industries, Inc. and Janet L. Matthiesen (incorporated herein by reference to Exhibit 10.3 of the Company's 8-K filed April 20, 2012). † |
|
|
| |
10(q) | |
| Employment Agreement between Raven Industries, Inc. and Stephanie Herseth Sandlin dated August 27, 2012 (incorporated herein by reference to Exhibit 10.1 of the Company's 10-K filed March 29, 2013). † |
|
|
| |
10(r) | |
| Schedule A to Employment Agreement between Raven Industries, Inc. and Stephanie Herseth Sandlin dated August 27, 2012(incorporated herein by reference to Exhibit 10.2 of the Company's 10-K filed March 29, 2013). † |
|
|
| |
10(s) | |
| Change in Control Agreement between Raven Industries, Inc. and Stephanie Herseth Sandlin dated August 27, 2012 (incorporated herein by reference to Exhibit 10.3 of the Company's 10-K filed March 29, 2013). † |
|
|
| |
10(t) | |
| Employment Agreement between Raven Industries, Inc. and Steven E. Brazones dated December 1, 2014 (incorporated herein by reference to Exhibit 10.1 of the Company's 8-K filed December 4, 2014). † |
# 63
|
|
| |
10(u) | |
| Change in Control Agreement between Raven Industries, Inc. and Steven E. Brazones dated December 1, 2014 (incorporated herein by reference to Exhibit 10.2 of the Company's 8-K filed December 4, 2014). † |
|
|
| |
10(v) | |
| Offer Letter between Raven Industries, Inc. and Steven E. Brazones, dated as of October 10, 2014 (filed herewith as Exhibit 10.1). † |
|
|
| |
21 | |
| Subsidiaries of the Registrant. |
|
|
| |
23 | |
| Consent of Independent Registered Public Accounting Firm. |
|
|
| |
31.1 | |
| Certification of Chief Executive Officer Pursuant to Rule 13a-14(a) of the Securities Exchange Act of 1934, as adopted pursuant to Section 302 of the Sarbanes-Oxley Act of 2002. |
|
|
| |
31.2 | |
| Certification of Chief Financial Officer Pursuant to Rule 13a-14(a) of the Securities Exchange Act of 1934, as adopted pursuant to Section 302 of the Sarbanes-Oxley Act of 2002. |
|
|
| |
32.1 | |
| Certification of Chief Executive Officer Pursuant to 18 U.S.C. Section 1350, as adopted pursuant to Section 906 of the Sarbanes-Oxley Act of 2002. |
|
|
| |
32.2 | |
| Certification of Chief Financial Officer Pursuant to 18 U.S.C. Section 1350, as adopted pursuant to Section 906 of the Sarbanes-Oxley Act of 2002. |
|
|
| |
101.INS | |
| XBRL Instance Document |
|
|
| |
101.SCH | |
| XBRL Taxonomy Extension Schema |
|
|
| |
101.CAL | |
| XBRL Taxonomy Extension Calculation Linkbase |
|
|
| |
101.DEF | |
| XBRL Taxonomy Extension Definition Linkbase |
|
|
| |
101.LAB | |
| XBRL Taxonomy Extension Label Linkbase |
|
|
| |
101.PRE | |
| XBRL Taxonomy Extension Presentation Linkbase |
|
|
| |
† | |
| Management contract or compensatory plan or arrangement. |
# 64
SIGNATURES | |||
|
|
| |
|
|
| |
SIGNATURES |
|
| |
Pursuant to the requirements of Section 13 or 15(d) of the Securities Exchange Act of 1934, the Registrant has duly caused this report to be signed on its behalf by the undersigned, thereunto duly authorized. | |||
|
|
| |
RAVEN INDUSTRIES, INC.
|
|
| |
(Registrant) |
|
| |
|
|
| |
By: /s/ DANIEL A. RYKHUS |
|
| |
Daniel A. Rykhus |
|
| |
President and Chief Executive Officer |
|
| |
|
|
| |
Date: March 27, 2015 |
|
| |
Pursuant to the requirements of the Securities Exchange Act of 1934, this report has been signed below by the following persons on behalf of the Registrant and in the capacities and on the dates indicated. | ||
|
|
|
/s/ DANIEL A. RYKHUS |
| /s/ MARK E. GRIFFIN |
Daniel A. Rykhus |
| Mark E. Griffin |
President and Chief Executive Officer |
| Director |
(principal executive officer) and Director |
|
|
|
|
|
|
|
|
/s/ STEVEN E. BRAZONES |
| /s/ KEVIN T. KIRBY |
Steven E. Brazones |
| Kevin T. Kirby |
Vice President and Chief Financial Officer |
| Director |
(principal financial and accounting officer) |
|
|
|
|
|
|
|
|
/s/ THOMAS S. EVERIST |
| /s/ MARC E. LEBARON |
Thomas S. Everist |
| Marc E. LeBaron |
Chairman of the Board |
| Director |
|
|
|
|
|
|
/s/ JASON M. ANDRINGA |
| /s/ CYNTHIA H. MILLIGAN |
Jason M. Andringa |
| Cynthia H. Milligan |
Director |
| Director |
|
|
|
|
|
|
|
| Date: March 27, 2015 |
# 65
SCHEDULE II - VALUATION AND QUALIFYING ACCOUNTS
for the years ended January 31,
2015
,
2014
and
2013
(in thousands)
Column A | Column B | Column C | Column D | Column E | |||||||||||
|
| Additions |
|
| |||||||||||
Description | Balance at Beginning of Year | Charged to Costs and Expenses | Charged to Other Accounts | Deductions From Reserves (1) |
Balance at End of Year | ||||||||||
Deducted in the balance sheet from the asset to which it applies: |
|
|
|
|
| ||||||||||
Allowance for doubtful accounts: |
|
|
|
|
| ||||||||||
Year ended January 31, 2015 | $ | 319 | | $ | 211 | | $ | 19 | | $ | 230 | | $ | 319 | |
Year ended January 31, 2014 | $ | 205 | | $ | 129 | | $ | - | | $ | 15 | | $ | 319 | |
Year ended January 31, 2013 | $ | 170 | | $ | 355 | | $ | - | | $ | 320 | | $ | 205 | |
Note :
(1) | Represents uncollectable accounts receivable written off during the year, net of recoveries. |
# 66