UNITED STATES
SECURITIES AND EXCHANGE COMMISSION
Washington, DC 20549
FORM 10-Q
| x | QUARTERLY REPORT PURSUANT TO SECTION 13 OR 15(d) OF THE SECURITIES EXCHANGE ACT OF 1934 |
For the quarterly period ended September 30, 2015
or
| ¨ | TRANSITION REPORT PURSUANT TO SECTION 13 OR 15(d) OF THE SECURITIES EXCHANGE ACT OF 1934 |
For the transition period from to
Commission file number 001-09718
The PNC Financial Services Group, Inc.
(Exact name of registrant as specified in its charter)
| Pennsylvania | 25-1435979 | |
(State or other jurisdiction of incorporation or organization) | (I.R.S. Employer Identification No.) |
One PNC Plaza, 249 Fifth Avenue, Pittsburgh, Pennsylvania 15222-2707
(Address of principal executive offices, including zip code)
(412) 762-2000
(Registrant's telephone number, including area code)
(Former name, former address and former fiscal year, if changed since last report)
Indicate by check mark whether the registrant: (1) has filed all reports required to be filed by Section 13 or 15(d) of the Securities Exchange Act of 1934 during the preceding 12 months (or for such shorter period that the registrant was required to file such reports), and (2) has been subject to such filing requirements for the past 90 days. Yes x No ¨
Indicate by check mark whether the registrant has submitted electronically and posted on its corporate Web site, if any, every Interactive Data File required to be submitted and posted pursuant to Rule 405 of Regulation S-T (§232.405 of this chapter) during the preceding 12 months (or for such shorter period that the registrant was required to submit and post such files). Yes x No ¨
Indicate by check mark whether the registrant is a large accelerated filer, an accelerated filer, a non-accelerated filer, or a smaller reporting company. See the definitions of "large accelerated filer", "accelerated filer" and "smaller reporting company" in Rule 12b-2 of the Exchange Act.
| Large accelerated filer | x | Accelerated filer | ¨ | |||
| Non-accelerated filer | ¨ | Smaller reporting company | ¨ | |||
Indicate by check mark whether the registrant is a shell company (as defined in Rule 12b-2 of the Exchange Act). Yes ¨ No x
As of October 23, 2015, there were 507,805,789 shares of the registrant's common stock ($5 par value) outstanding.
T HE PNC F INANCIAL S ERVICES G ROUP , I NC .
Cross-Reference Index to Third Quarter 2015 Form 10-Q
| Pages | ||||
PART I – FINANCIAL INFORMATION | ||||
Item 1. Financial Statements (Unaudited). | ||||
Consolidated Income Statement | 56 | |||
Consolidated Statement of Comprehensive Income | 57 | |||
Consolidated Balance Sheet | 58 | |||
Consolidated Statement Of Cash Flows | 59 | |||
Notes To Consolidated Financial Statements (Unaudited) | ||||
Note 1 Accounting Policies | 61 | |||
Note 2 Loan Sale and Servicing Activities and Variable Interest Entities | 65 | |||
Note 3 Asset Quality | 69 | |||
Note 4 Purchased Loans | 82 | |||
Note 5 Allowances for Loan and Lease Losses and Unfunded Loan Commitments and Letters of Credit | 83 | |||
Note 6 Investment Securities | 86 | |||
Note 7 Fair Value | 90 | |||
Note 8 Goodwill and Intangible Assets | 102 | |||
Note 9 Capital Securities of a Subsidiary Trust and Perpetual Trust Securities | 104 | |||
Note 10 Certain Employee Benefit And Stock Based Compensation Plans | 104 | |||
Note 11 Financial Derivatives | 107 | |||
Note 12 Earnings Per Share | 113 | |||
Note 13 Total Equity And Other Comprehensive Income | 114 | |||
Note 14 Income Taxes | 119 | |||
Note 15 Legal Proceedings | 119 | |||
Note 16 Commitments and Guarantees | 122 | |||
Note 17 Segment Reporting | 127 | |||
Note 18 Subsequent Events | 131 | |||
Statistical Information (Unaudited) | ||||
Average Consolidated Balance Sheet And Net Interest Analysis | 132 | |||
Transitional Basel III and Pro forma Fully Phased-In Basel III Common Equity Tier 1 Capital Ratios – 2014 Periods | 134 | |||
Item 2. Management's Discussion and Analysis of Financial Condition and Results of Operations (MD&A). | ||||
Financial Review | ||||
Consolidated Financial Highlights | 1 | |||
Executive Summary | 3 | |||
Consolidated Income Statement Review | 8 | |||
Consolidated Balance Sheet Review | 11 | |||
Off-Balance Sheet Arrangements And Variable Interest Entities | 21 | |||
Fair Value Measurements | 22 | |||
Business Segments Review | 22 | |||
Critical Accounting Estimates and Judgments | 30 | |||
Status Of Qualified Defined Benefit Pension Plan | 31 | |||
Recourse And Repurchase Obligations | 31 | |||
Risk Management | 32 | |||
Internal Controls And Disclosure Controls And Procedures | 48 | |||
Glossary Of Terms | 49 | |||
Cautionary Statement Regarding Forward-Looking Information | 54 | |||
Item 3. Quantitative and Qualitative Disclosures About Market Risk. | 32-48, 90-101 and 107-113 | |||
Item 4. Controls and Procedures. | 48 | |||
PART II – OTHER INFORMATION | ||||
Item 1. Legal Proceedings. | 135 | |||
Item 1A. RiskFactors. | 135 | |||
Item 2. Unregistered Sales Of Equity Securities And Use Of Proceeds. | 136 | |||
Item 6. Exhibits. | 136 | |||
Exhibit Index. | 136 | |||
Corporate Information | 137 | |||
Signature | 139 | |||
T HE PNC F INANCIAL S ERVICES G ROUP , I NC .
Cross-Reference Index to Third Quarter 2015 Form 10-Q (continued)
MD&A TABLE REFERENCE
Table | Description | Page | ||||
1 | Consolidated Financial Highlights | 1 | ||||
2 | Summarized Average Balance Sheet | 7 | ||||
3 | Results Of Businesses – Summary | 8 | ||||
4 | Net Interest Income and Net Interest Margin | 8 | ||||
5 | Noninterest Income | 9 | ||||
6 | Summarized Balance Sheet Data | 11 | ||||
7 | Details Of Loans | 12 | ||||
8 | Accretion – Purchased Impaired Loans | 13 | ||||
9 | Purchased Impaired Loans – Accretable Yield | 13 | ||||
10 | Valuation of Purchased Impaired Loans | 13 | ||||
11 | Weighted Average Life of the Purchased Impaired Portfolios | 14 | ||||
12 | Estimated Derecognition Impact – Total ALLL to Total Loans | 14 | ||||
13 | Accretable Difference Sensitivity – Total Purchased Impaired Loans | 14 | ||||
14 | Commitments to Extend Credit | 15 | ||||
15 | Investment Securities | 15 | ||||
16 | Weighted-Average Expected Maturity of Mortgage and Other Asset-Backed Debt Securities | 16 | ||||
17 | Loans Held For Sale | 16 | ||||
18 | Details Of Funding Sources | 17 | ||||
19 | Shareholders' Equity | 18 | ||||
20 | Basel III Capital | 19 | ||||
21 | Fair Value Measurements – Summary | 22 | ||||
22 | Retail Banking Table | 23 | ||||
23 | Corporate & Institutional Banking Table | 25 | ||||
24 | Asset Management Group Table | 27 | ||||
25 | Residential Mortgage Banking Table | 28 | ||||
26 | BlackRock Table | 29 | ||||
27 | Non-Strategic Assets Portfolio Table | 29 | ||||
28 | Pension Expense – Sensitivity Analysis | 31 | ||||
29 | Nonperforming Assets By Type | 33 | ||||
30 | Change in Nonperforming Assets | 34 | ||||
31 | OREO and Foreclosed Assets | 34 | ||||
32 | Accruing Loans Past Due | 35 | ||||
33 | Home Equity Lines of Credit – Draw Period End Dates | 36 | ||||
34 | Consumer Real Estate Related Loan Modifications | 36 | ||||
35 | Summary of Troubled Debt Restructurings | 37 | ||||
36 | Loan Charge-Offs And Recoveries | 38 | ||||
37 | Allowance for Loan and Lease Losses | 39 | ||||
38 | PNC Bank Bank Notes Issued During 2015 | 41 | ||||
39 | PNC Bank Senior and Subordinated Debt | 41 | ||||
40 | FHLB Borrowings | 42 | ||||
41 | Parent Company Senior and Subordinated Debt and Hybrid Capital Instruments | 43 | ||||
42 | Credit Ratings as of September 30, 2015 for PNC and PNC Bank | 43 | ||||
43 | Contractual Obligations | 44 | ||||
44 | Other Commitments | 44 | ||||
45 | Interest Sensitivity Analysis | 45 | ||||
46 | Net Interest Income Sensitivity to Alternative Rate Scenarios (Third Quarter 2015) | 45 | ||||
47 | Alternate Interest Rate Scenarios: One Year Forward | 46 | ||||
48 | Enterprise-Wide Gains/Losses Versus Value-at-Risk | 46 | ||||
49 | Equity Investments Summary | 47 | ||||
50 | Financial Derivatives Summary | 48 | ||||
T HE PNC F INANCIAL S ERVICES G ROUP , I NC .
Cross-Reference Index to Third Quarter 2015 Form 10-Q (continued)
NOTES TO CONSOLIDATED FINANCIAL STATEMENTS TABLE REFERENCE
Table | Description | Page | ||||
51 | Cash Flows Associated with Loan Sale and Servicing Activities | 66 | ||||
52 | Principal Balance, Delinquent Loans, and Net Charge-offs Related to Serviced Loans For Others | 67 | ||||
53 | Consolidated VIEs – Carrying Value | 68 | ||||
54 | Non-Consolidated VIEs | 69 | ||||
55 | Analysis of Loan Portfolio | 70 | ||||
56 | Nonperforming Assets | 71 | ||||
57 | Commercial Lending Asset Quality Indicators | 73 | ||||
58 | Home Equity and Residential Real Estate Balances | 74 | ||||
59 | Home Equity and Residential Real Estate Asset Quality Indicators – Excluding Purchased Impaired Loans | 74 | ||||
60 | Home Equity and Residential Real Estate Asset Quality Indicators – Purchased Impaired Loans | 76 | ||||
61 | Credit Card and Other Consumer Loan Classes Asset Quality Indicators | 77 | ||||
62 | Summary of Troubled Debt Restructurings | 78 | ||||
63 | Financial Impact and TDRs by Concession Type | 78 | ||||
64 | TDRs that were Modified in the Past Twelve Months which have Subsequently Defaulted | 80 | ||||
65 | Impaired Loans | 81 | ||||
66 | Purchased Impaired Loans – Balances | 82 | ||||
67 | Purchased Impaired Loans – Accretable Yield | 83 | ||||
68 | Rollforward of Allowance for Loan and Lease Losses and Associated Loan Data | 84 | ||||
69 | Rollforward of Allowance for Unfunded Loan Commitments and Letters of Credit | 85 | ||||
70 | Investment Securities Summary | 86 | ||||
71 | Gross Unrealized Loss and Fair Value of Securities Available for Sale | 87 | ||||
72 | Gains (Losses) on Sales of Securities Available for Sale | 89 | ||||
73 | Contractual Maturity of Debt Securities | 89 | ||||
74 | Fair Value of Securities Pledged and Accepted as Collateral | 90 | ||||
75 | Fair Value Measurements – Recurring Basis Summary | 91 | ||||
76 | Reconciliation of Level 3 Assets and Liabilities | 92 | ||||
77 | Fair Value Measurements – Recurring Quantitative Information | 96 | ||||
78 | Fair Value Measurements – Nonrecurring | 98 | ||||
79 | Fair Value Measurements – Nonrecurring Quantitative Information | 98 | ||||
80 | Fair Value Option – Changes in Fair Value | 99 | ||||
81 | Fair Value Option – Fair Value and Principal Balances | 100 | ||||
82 | Additional Fair Value Information Related to Other Financial Instruments | 101 | ||||
83 | Goodwill by Business Segment | 102 | ||||
84 | Mortgage Servicing Rights | 102 | ||||
85 | Commercial Mortgage Loan Servicing Rights – Key Valuation Assumptions | 103 | ||||
86 | Residential Mortgage Loan Servicing Rights – Key Valuation Assumptions | 103 | ||||
87 | Fees from Mortgage Loan Servicing | 103 | ||||
88 | Other Intangible Assets | 103 | ||||
89 | Amortization Expense on Existing Intangible Assets | 103 | ||||
90 | Net Periodic Pension and Postretirement Benefits Costs | 105 | ||||
91 | Stock Option Rollforward | 106 | ||||
92 | Nonvested Incentive/Performance Unit Share Awards and Restricted Stock/Share Unit Awards – Rollforward | 106 | ||||
93 | Nonvested Cash-Payable Incentive/Performance Units and Restricted Share Units – Rollforward | 106 | ||||
94 | Total Gross Derivatives | 107 | ||||
95 | Derivatives Designated As Hedging Instruments under GAAP | 108 | ||||
96 | Gains (Losses) on Derivatives and Related Hedged Items – Fair Value Hedges | 108 | ||||
97 | Gains (Losses) on Derivatives and Related Cash Flows – Cash Flow Hedges | 109 | ||||
98 | Gains (Losses) on Derivatives – Net Investment Hedges | 109 | ||||
99 | Derivatives Not Designated As Hedging Instruments under GAAP | 110 | ||||
100 | Gains (Losses) on Derivatives Not Designated As Hedging Instruments under GAAP | 111 | ||||
101 | Derivative Assets and Liabilities Offsetting | 112 | ||||
T HE PNC F INANCIAL S ERVICES G ROUP , I NC .
Cross-Reference Index to Third Quarter 2015 Form 10-Q (continued)
NOTES TO CONSOLIDATED FINANCIAL STATEMENTS TABLE REFERENCE (continued)
Table | Description | Page | ||||
102 | Basic and Diluted Earnings per Common Share | 113 | ||||
103 | Rollforward of Total Equity | 114 | ||||
104 | Other Comprehensive Income | 115 | ||||
105 | Accumulated Other Comprehensive Income (Loss) Components | 118 | ||||
106 | Net Operating Loss Carryforwards and Tax Credit Carryforwards | 119 | ||||
107 | Commitments to Extend Credit and Other Commitments | 122 | ||||
108 | Internal Credit Ratings Related to Net Outstanding Standby Letters of Credit | 122 | ||||
109 | Reinsurance Agreements Exposure | 123 | ||||
110 | Reinsurance Reserves – Rollforward | 123 | ||||
111 | Analysis of Commercial Mortgage Recourse Obligations | 124 | ||||
112 | Analysis of Indemnification and Repurchase Liability for Asserted Claims and Unasserted Claims | 125 | ||||
113 | Resale and Repurchase Agreements Offsetting | 126 | ||||
114 | Repurchase Agreements By Type of Collateral Pledged | 126 | ||||
115 | Results Of Businesses | 129 | ||||
FINANCIAL RE VIEW
T HE PNC F INANCIAL S ERVICES G ROUP , I NC .
This Financial Review, including the Consolidated Financial Highlights, should be read together with our unaudited Consolidated Financial Statements and unaudited Statistical Information included elsewhere in this Report and with Items 6, 7, 8 and 9A of our 2014 Annual Report on Form 10-K (2014 Form 10-K). We have reclassified certain prior period amounts to conform with the current period presentation, which we believe is more meaningful to readers of our consolidated financial statements. For information regarding certain business, regulatory and legal risks, see the following sections as they appear in this Report and in our 2014 Form 10-K and our First and Second Quarter 2015 Form 10-Q: the Risk Management and Recourse And Repurchase Obligations sections of the Financial Review portion of the respective reports; Item 1A Risk Factors included in our 2014 Form 10-K; and the Legal Proceedings and Commitments and Guarantees Notes of the Notes To Consolidated Financial Statements included in the respective report. Also, see the Cautionary Statement Regarding Forward-Looking Information section in this Financial Review and the Critical Accounting Estimates And Judgments section in this Financial Review and in our 2014 Form 10-K for certain other factors that could cause actual results or future events to differ, perhaps materially, from historical performance and from those anticipated in the forward-looking statements included in this Report. See Note 17 Segment Reporting in the Notes To Consolidated Financial Statements included in Part I, Item 1 of this Report for a reconciliation of total business segment earnings to total PNC consolidated net income as reported on a GAAP basis.
Table 1: Consolidated Financial Highlights
T HE PNC F INANCIAL S ERVICES G ROUP , I NC . (PNC)
Dollars in millions, except per share data Unaudited | Three months ended September 30 | Nine months ended September 30 | ||||||||||||||
| 2015 | 2014 | 2015 | 2014 | |||||||||||||
Financial Results (a) | ||||||||||||||||
Revenue | ||||||||||||||||
Net interest income | $ | 2,062 | $ | 2,104 | $ | 6,186 | $ | 6,428 | ||||||||
Noninterest income | 1,713 | 1,737 | 5,186 | 5,000 | ||||||||||||
Total revenue | 3,775 | 3,841 | 11,372 | 11,428 | ||||||||||||
Noninterest expense | 2,352 | 2,357 | 7,067 | 6,949 | ||||||||||||
Pretax, pre-provision earnings (b) | 1,423 | 1,484 | 4,305 | 4,479 | ||||||||||||
Provision for credit losses | 81 | 55 | 181 | 221 | ||||||||||||
Income before income taxes and noncontrolling interests | $ | 1,342 | $ | 1,429 | $ | 4,124 | $ | 4,258 | ||||||||
Net income | $ | 1,073 | $ | 1,038 | $ | 3,121 | $ | 3,150 | ||||||||
Less: | ||||||||||||||||
Net income (loss) attributable to noncontrolling interests | 18 | 1 | 23 | 2 | ||||||||||||
Preferred stock dividends and discount accretion and redemptions | 64 | 71 | 182 | 189 | ||||||||||||
Net income attributable to common shareholders | $ | 991 | $ | 966 | $ | 2,916 | $ | 2,959 | ||||||||
Less: | ||||||||||||||||
Dividends and undistributed earnings allocated to nonvested restricted shares | – | 3 | 2 | 9 | ||||||||||||
Impact of BlackRock earnings per share dilution | 4 | 4 | 14 | 13 | ||||||||||||
Net income attributable to diluted common shares | $ | 987 | $ | 959 | $ | 2,900 | $ | 2,937 | ||||||||
Diluted earnings per common share | $ | 1.90 | $ | 1.79 | $ | 5.52 | $ | 5.45 | ||||||||
Cash dividends declared per common share | $ | .51 | $ | .48 | $ | 1.50 | $ | 1.40 | ||||||||
Effective tax rate (c) | 20.0 | % | 27.4 | % | 24.3 | % | 26.0 | % | ||||||||
Performance Ratios | ||||||||||||||||
Net interest margin (d) | 2.67 | % | 2.98 | % | 2.74 | % | 3.12 | % | ||||||||
Noninterest income to total revenue | 45 | 45 | 46 | 44 | ||||||||||||
Efficiency | 62 | 61 | 62 | 61 | ||||||||||||
Return on: | ||||||||||||||||
Average common shareholders' equity | 9.61 | 9.52 | 9.56 | 9.99 | ||||||||||||
Average assets | 1.19 | 1.25 | 1.18 | 1.30 | ||||||||||||
See page 49 for a glossary of certain terms used in this Report.
Certain prior period amounts have been reclassified to conform with the current period presentation, which we believe is more meaningful to readers of our consolidated financial statements.
| (a) | The Executive Summary and Consolidated Income Statement Review portions of the Financial Review section of this Report provide information regarding items impacting the comparability of the periods presented. |
| (b) | We believe that pretax, pre-provision earnings, a non-GAAP measure, is useful as a tool to help evaluate the ability to provide for credit costs through operations. |
| (c) | The effective income tax rates are generally lower than the statutory rate due to the relationship of pretax income to tax credits and earnings that are not subject to tax. |
| (d) | Calculated as annualized taxable-equivalent net interest income divided by average earning assets. The interest income earned on certain earning assets is completely or partially exempt from federal income tax. As such, these tax-exempt instruments typically yield lower returns than taxable investments. To provide more meaningful comparisons of net interest margins for all earning assets, we use net interest income on a taxable-equivalent basis in calculating net interest margin by increasing the interest income earned on tax-exempt assets to make it fully equivalent to interest income earned on taxable investments. This adjustment is not permitted under generally accepted accounting principles (GAAP) in the Consolidated Income Statement. The taxable-equivalent adjustments to net interest income for the three months ended September 30, 2015 and September 30, 2014 were $50 million and $47 million, respectively. The taxable-equivalent adjustments to net interest income for the nine months ended September 30, 2015 and September 30, 2014 were $148 million and $140 million, respectively. |
The PNC Financial Services Group, Inc. – Form 10-Q 1
Table 1: Consolidated Financial Highlights (Continued) (a)
| Unaudited | September 30 2015 | December 31 2014 | September 30 2014 | |||||||||
Balance Sheet Data (dollars in millions, except per share data) | ||||||||||||
Assets | $ | 362,125 | $ | 345,072 | $ | 334,424 | ||||||
Loans | 204,983 | 204,817 | 200,872 | |||||||||
Allowance for loan and lease losses | 3,237 | 3,331 | 3,406 | |||||||||
Interest-earning deposits with banks (b) | 34,224 | 31,779 | 26,247 | |||||||||
Investment securities | 68,066 | 55,823 | 55,039 | |||||||||
Loans held for sale | 2,060 | 2,262 | 2,143 | |||||||||
Goodwill | 9,103 | 9,103 | 9,074 | |||||||||
Mortgage servicing rights | 1,467 | 1,351 | 1,510 | |||||||||
Equity investments (c) | 10,497 | 10,728 | 10,763 | |||||||||
Other assets | 27,285 | 23,482 | 23,123 | |||||||||
Noninterest-bearing deposits | 78,239 | 73,479 | 72,963 | |||||||||
Interest-bearing deposits | 166,740 | 158,755 | 153,341 | |||||||||
Total deposits | 244,979 | 232,234 | 226,304 | |||||||||
Transaction deposits | 208,768 | 198,267 | 192,222 | |||||||||
Borrowed funds | 56,663 | 56,768 | 52,327 | |||||||||
Total shareholders' equity | 44,948 | 44,551 | 44,481 | |||||||||
Common shareholders' equity | 41,498 | 40,605 | 40,536 | |||||||||
Accumulated other comprehensive income | 615 | 503 | 727 | |||||||||
Book value per common share | $ | 81.42 | $ | 77.61 | $ | 76.71 | ||||||
Common shares outstanding (millions) | 510 | 523 | 528 | |||||||||
Loans to deposits | 84 | % | 88 | % | 89 | % | ||||||
Client Investment Assets (billions) | ||||||||||||
Discretionary client assets under management | $ | 132 | $ | 135 | $ | 132 | ||||||
Nondiscretionary client assets under administration | 124 | 128 | 127 | |||||||||
Total client assets under administration | 256 | 263 | 259 | |||||||||
Brokerage account client assets | 42 | 43 | 43 | |||||||||
Total | $ | 298 | $ | 306 | $ | 302 | ||||||
Capital Ratios | ||||||||||||
Transitional Basel III (d) (e) | ||||||||||||
Common equity Tier 1 | 10.6 | % | 10.9 | % | 11.1 | % | ||||||
Tier 1 risk-based | 12.0 | 12.6 | 12.8 | |||||||||
Total capital risk-based | 14.8 | 15.8 | 16.1 | |||||||||
Leverage | 10.2 | 10.8 | 11.1 | |||||||||
Pro forma Fully Phased-In Basel III (e) | ||||||||||||
Common equity Tier 1 | 10.1 | % | 10.0 | % | 10.1 | % | ||||||
Common shareholders' equity to assets | 11.5 | % | 11.8 | % | 12.1 | % | ||||||
Asset Quality | ||||||||||||
Nonperforming loans to total loans | 1.06 | % | 1.23 | % | 1.30 | % | ||||||
Nonperforming assets to total loans, OREO and foreclosed assets | 1.21 | 1.40 | 1.48 | |||||||||
Nonperforming assets to total assets | .69 | .83 | .89 | |||||||||
Net charge-offs to average loans (for the three months ended) (annualized) | .19 | .23 | .16 | |||||||||
Allowance for loan and lease losses to total loans (f) | 1.58 | 1.63 | 1.70 | |||||||||
Allowance for loan and lease losses to nonperforming loans (g) | 149 | % | 133 | % | 130 | % | ||||||
Accruing loans past due 90 days or more (in millions) | $ | 890 | $ | 1,105 | $ | 1,178 | ||||||
| (a) | The Executive Summary and Consolidated Balance Sheet Review portions of the Financial Review section of this Report provide information regarding items impacting the comparability of the periods presented. |
| (b) | Amounts include balances held with the Federal Reserve Bank of Cleveland (Federal Reserve Bank) of $33.8 billion, $31.4 billion, and $25.9 billion as of September 30, 2015, December 31, 2014 and September 30, 2014, respectively. |
| (c) | Amounts include our equity interest in BlackRock. |
| (d) | Calculated using the regulatory capital methodology applicable to PNC during each period presented. |
| (e) | See Basel III Capital discussion in the Capital portion of the Consolidated Balance Sheet Review section of this Financial Review and the capital discussion in the Banking Regulation and Supervision section of Item 1 Business in our 2014 Form 10-K. See also the Estimated Pro forma Fully Phased-In Basel III Common Equity Tier 1 Capital Ratio – 2014 Periods table in the Statistical Information section of this Report for a reconciliation of the 2014 periods' ratios. |
| (f) | The allowance for loan and lease losses includes impairment reserves attributable to purchased impaired loans. This ratio will be impacted by the expected change in our derecognition policy for purchased impaired loans that are pooled and accounted for as a single asset. For additional information on this policy change, see the Purchase Accounting Accretion and Valuation of Purchased Impaired Loans portion of the Consolidated Balance Sheet Review of this Financial Review. |
| (g) | The allowance for loan and lease losses includes impairment reserves attributable to purchased impaired loans. Nonperforming loans exclude certain government insured or guaranteed loans, loans held for sale, loans accounted for under the fair value option and purchased impaired loans. The allowance for loan and lease losses in this ratio will be impacted by the expected fourth quarter of 2015 change in our derecognition policy for purchased impaired loans that are pooled and accounted for as a single asset. For additional information on this policy change, see the Purchase Accounting Accretion and Valuation of Purchased Impaired Loans portion of the Consolidated Balance Sheet Review of this Financial Review. |
2 The PNC Financial Services Group, Inc. – Form 10-Q
E XECUTIVE S UMMARY
The PNC Financial Services Group, Inc. (PNC) is one of the largest diversified financial services companies in the United States and is headquartered in Pittsburgh, Pennsylvania.
We have businesses engaged in retail banking, corporate and institutional banking, asset management and residential mortgage banking, providing many of our products and services nationally, as well as other products and services in our primary geographic markets located in Pennsylvania, Ohio, New Jersey, Michigan, Illinois, Maryland, Indiana, North Carolina, Florida, Kentucky, Washington, D.C., Delaware, Virginia, Alabama, Missouri, Georgia, Wisconsin and South Carolina. We also provide certain products and services internationally.
Key Strategic Goals
At PNC we manage our company for the long term. We are focused on the fundamentals of growing customers, loans, deposits and fee revenue and improving profitability, while investing for the future and managing risk, expenses and capital. We continue to invest in our products, markets and brand, and embrace our corporate responsibility to the communities where we do business.
We strive to expand and deepen customer relationships by offering a broad range of deposit, fee-based and credit products and services. We are focused on delivering those products and services where, when and how our customers choose with the goal of offering insight that addresses their specific financial needs. Our approach is concentrated on organically growing and deepening client relationships that meet our risk/return measures. Our strategies for growing fee income across our lines of business are focused on achieving deeper market penetration and cross selling our diverse product mix.
Our strategic priorities are designed to enhance value over the long term. A key priority is to drive growth in acquired and underpenetrated geographic markets, including in the Southeast. In addition, we are seeking to attract more of the investable assets of new and existing clients. PNC is focused on transforming our retail banking business to a more customer-centric and sustainable model while lowering delivery costs as customer banking preferences evolve. We are also working to build a stronger residential mortgage banking business with the goal of becoming the provider of choice for our customers. Additionally, we continue to focus on expense management while investing in technology and business infrastructure and streamlining our processes.
Our capital priorities are to support client growth and business investment, maintain appropriate capital in light of economic conditions and the Basel III framework and return excess capital to shareholders, in accordance with the capital plan included in our 2015 Comprehensive Capital Analysis and
Review (CCAR) submission to the Board of Governors of the Federal Reserve System (Federal Reserve). New regulatory short-term liquidity standards became effective for PNC and PNC Bank, National Association (PNC Bank) beginning January 1, 2015. For more detail, see the Balance Sheet, Liquidity and Capital Highlights portion of this Executive Summary, the Capital portion of the Consolidated Balance Sheet Review section and the Liquidity Risk Management portion of the Risk Management section of this Financial Review and the Supervision and Regulation section in Item 1 Business of our 2014 Form 10-K.
Recent Market and Industry Developments
There have been numerous legislative and regulatory developments and significant changes in the competitive landscape of our industry over the last several years. The United States and other governments have undertaken major reform of the regulation of the financial services industry, including engaging in new efforts to impose requirements designed to strengthen the stability of the financial system and protect consumers and investors. The Dodd-Frank Wall Street Reform and Consumer Protection Act (Dodd-Frank), enacted in July 2010, mandates the most wide-ranging overhaul of financial industry regulation in decades. Many parts of the law are now in effect, and others are now in the implementation stage, which is likely to continue for several years. We expect to face additional regulation of our industry as a result of Dodd-Frank as well as other current and future initiatives intended to enhance the regulation of financial services companies, the stability of the financial system, the protection of consumers and investors, and the liquidity and solvency of financial institutions and markets. We also expect the scrutiny from our supervisors in the examination process and the enforcement of laws and regulations on both the federal and state levels to remain at elevated levels. Compliance with new regulations will increase our costs and reduce our revenue. Some new regulations may limit our ability to pursue certain desirable business opportunities.
On October 3, 2015, rules requiring mortgage lenders to issue new integrated disclosures under the Truth in Lending Act (TILA) and the Real Estate Settlement Procedures Act (RESPA) became effective. These rules, among other things, impose new timelines for the provision of disclosures to borrowers and provide additional limitations on increases to the fees and charges estimated and disclosed by lenders.
On October 22, 2015, the Office of the Comptroller of the Currency (OCC) approved final interagency rules (developed jointly with the Federal Reserve, Federal Deposit Insurance Corporation (FDIC) Farm Credit Administration and Federal Housing Finance Agency) governing margin and capital requirements for uncleared swaps entered into by swap dealers who are supervised by a prudential regulator. PNC Bank is registered as a swap dealer and will be subject to these rules. The compliance date for requirements under the final rules is subject to a substantial phase-in period that begins on September 1, 2016, for the largest market participants and, for
The PNC Financial Services Group, Inc. – Form 10-Q 3
PNC Bank, no earlier than March 1, 2017. While we continue to analyze fully the various requirements under the final rules, we expect that the rules will not have a material effect on PNC Bank.
Also on October 22, 2015, the FDIC requested comment on a proposed rule that would impose a surcharge, equal to 4.5 basis points of an institution's deposit insurance assessment base, on the quarterly deposit insurance assessments of all insured depository institutions with total consolidated assets of $10 billion or more (including PNC Bank). Under the proposal, the surcharge would take effect for assessments billed after the Deposit Insurance Fund (DIF) reserve ratio reaches 1.15 percent (estimated by the FDIC to most likely occur in the first quarter of 2016) or such later date as the proposed rule is finalized, and would continue until the reserve ratio reached 1.35 percent (estimated by the FDIC to occur under the proposal before the end of 2018). Based on data as of September 30, 2015, we estimate that the net effect of the proposed surcharge, together with the scheduled reduction of regular assessments that will go into effect when the DIF reserve ratio reaches 1.15 percent, would increase PNC Bank's quarterly assessment by approximately $20 million. The comment period on the proposed surcharge will run for 60 days after the proposal is published in the Federal Register.
For additional information concerning recent legislative and regulatory developments, as well as certain governmental, legislative and regulatory inquiries and investigations that may affect PNC, please see the Supervision and Regulation section of Item 1 Business, Item 1A Risk Factors, and Note 21 Legal Proceedings and Note 22 Commitments and Guarantees in the Notes To Consolidated Financial Statements in our 2014 Form 10-K, Recent Market and Industry Developments in the Executive Summary section of our First Quarter 2015 Form 10-Q and Second Quarter 2015 Form 10-Q as well as Note 15 Legal Proceedings and Note 16 Commitments and Guarantees in the Notes To Consolidated Financial Statements in Part I, Item 1 of this Report.
Key Factors Affecting Financial Performance
PNC faces a variety of risks that may impact various aspects of our risk profile from time to time. The extent of such impacts may vary depending on factors such as the current economic, political and regulatory environment, merger and acquisition activity and operational challenges. Many of these risks and our risk management strategies are described in more detail in our 2014 Form 10-K and elsewhere in this Report.
Our financial performance is substantially affected by a number of external factors outside of our control, including the following:
| • | General economic conditions, including the continuity, speed and stamina of the current U.S. |
economic expansion in general and on our customers in particular, |
| • | The monetary policy actions and statements of the Federal Reserve and the Federal Open Market Committee (FOMC), |
| • | The level of, and direction, timing and magnitude of movement in, interest rates and the shape of the interest rate yield curve, |
| • | The functioning and other performance of, and availability of liquidity in, the capital and other financial markets, |
| • | Loan demand, utilization of credit commitments and standby letters of credit, and asset quality, |
| • | Customer demand for non-loan products and services, |
| • | Changes in the competitive and regulatory landscape and in counterparty creditworthiness and performance as the financial services industry restructures in the current environment, |
| • | The impact of the extensive reforms enacted in the Dodd-Frank legislation and other legislative, regulatory and administrative initiatives and actions, including those outlined elsewhere in this Report, in our 2014 Form 10-K and in subsequent filings with the SEC, and |
| • | The impact of market credit spreads on asset valuations. |
In addition, our success will depend upon, among other things:
| • | Focused execution of strategic priorities for organic customer growth opportunities, |
| • | Further success in growing profitability through the acquisition and retention of customers and deepening relationships, |
| • | Driving growth in acquired and underpenetrated geographic markets, including our Southeast markets, |
| • | Our ability to effectively manage PNC's balance sheet and generate net interest income, |
| • | Revenue growth from fee income and our ability to provide innovative and valued products to our customers, |
| • | Our ability to utilize technology to develop and deliver products and services to our customers and protect PNC's systems and customer information, |
| • | Our ability to bolster our critical infrastructure and streamline our core processes, |
| • | Our ability to manage and implement strategic business objectives within the changing regulatory environment, |
| • | A sustained focus on expense management, |
| • | Managing our credit risk in our portfolio, |
| • | Managing the non-strategic assets portfolio and impaired assets, |
| • | Continuing to maintain and grow our deposit base as a low-cost funding source, |
| • | Prudent risk, liquidity and capital management related to our efforts to manage risk to acceptable |
4 The PNC Financial Services Group, Inc. – Form 10-Q
levels and to meet evolving regulatory capital, capital planning, stress testing and liquidity standards, |
| • | Actions we take within the capital and other financial markets, |
| • | The impact of legal and regulatory-related contingencies, and |
| • | The appropriateness of reserves needed for critical accounting estimates and related contingencies. |
For additional information, see the Cautionary Statement Regarding Forward-Looking Information section in this Financial Review and Item 1A Risk Factors in our 2014 Form 10-K.
Income Statement Highlights
Net income increased $35 million, or 3%, in the third quarter of 2015 to $1.1 billion, or $1.90 per diluted common share, compared to $1.0 billion, or $1.79 per diluted common share for the third quarter of 2014. Third quarter net income benefitted from a lower effective tax rate and slightly lower noninterest expense, partially offset by declines in net interest income and noninterest income.
| • | Net interest income of $2.1 billion for the third quarter of 2015 decreased 2% compared with the third quarter of 2014, reflective of the ongoing low rate environment, primarily resulting in lower interest-earning asset yields, and lower purchase accounting accretion, partially offset by commercial and commercial real estate loan growth and higher securities balances. |
| • | Net interest margin decreased to 2.67% for the third quarter of 2015 compared to 2.98% for the third quarter of 2014 principally due to the impact of increasing the company's liquidity position, lower benefit from purchase accounting accretion, and lower loan and securities yields. |
| • | Noninterest income of $1.7 billion for the third quarter of 2015 decreased $24 million, or 1% compared to the third quarter of 2014, due to declines in asset management and residential mortgage, partially offset by strong fee income growth in consumer and corporate services. |
| • | The provision for credit losses increased to $81 million for the third quarter of 2015 compared to $55 million for the third quarter of 2014. |
| • | Noninterest expense of $2.4 billion for the third quarter of 2015 decreased $5 million compared to the third quarter of 2014 mainly driven by lower expense related to third party services and lower asset impairment charges related to historic tax credits, mostly offset by investments in technology and business infrastructure in support of PNC's strategic priorities and higher personnel expense associated with higher business activity. |
| • | The effective tax rate was 20.0% for the third quarter of 2015 compared to 27.4% for the third quarter of 2014 reflecting tax benefits and additions to reserves, the largest components of which were a benefit of |
$75 million attributable to effectively settling acquired entity tax contingencies offset by additions to reserves of $10 million for various tax matters. |
For additional detail, see the Consolidated Income Statement Review section in this Financial Review.
Credit Quality Highlights
Overall credit quality improved during the first nine months of 2015.
| • | Nonperforming assets decreased $.4 billion, or 14%, to $2.5 billion at September 30, 2015 compared to December 31, 2014. Nonperforming assets to total assets were 0.69% at September 30, 2015, compared to 0.83% at December 31, 2014. |
| • | Overall loan delinquencies of $1.7 billion at September 30, 2015 decreased $.3 billion, or 15%, compared with December 31, 2014. |
| • | The allowance for loan and lease losses was 1.58% of total loans and 149% of nonperforming loans at September 30, 2015, compared with 1.63% and 133% at December 31, 2014, respectively. |
| • | Net charge-offs of $96 million for the third quarter of 2015 increased 17% compared to net charge-offs of $82 million for the third quarter of 2014. Annualized net charge-offs were 0.19% of average loans in the third quarter of 2015 and 0.16% of average loans in the third quarter of 2014. For the first nine months of 2015, net charge-offs were $266 million, and 0.17% of average loans on an annualized basis, compared with $413 million and 0.28% for the first nine months of 2014. |
For additional detail, see the Credit Risk Management portion of the Risk Management section and the Purchase Accounting Accretion and Valuation of Purchased Impaired Loans portion of the Consolidated Balance Sheet Review of this Financial Review.
Balance Sheet, Liquidity and Capital Highlights
PNC's balance sheet was well-positioned at September 30, 2015 reflecting strong liquidity and capital positions.
| • | Total loans increased by $.2 billion to $205.0 billion at September 30, 2015 compared to December 31, 2014. |
| – | Total commercial lending increased $2.8 billion, or 2%, due to growth in PNC's real estate business. |
| – | Total consumer lending decreased $2.6 billion, or 3%, due to declines in home equity, automobile, and education, including runoff in the non-strategic consumer loan portfolio. |
| • | Investment securities increased $12.2 billion, or 22%, to $68.1 billion at September 30, 2015 compared to December 31, 2014, primarily funded by deposit growth. |
The PNC Financial Services Group, Inc. – Form 10-Q 5
| • | Total deposits increased $12.7 billion, or 5%, to $245.0 billion at September 30, 2015 compared with December 31, 2014, driven by higher Retail Banking and Corporate & Institutional Banking deposits. |
| • | PNC's balance sheet remained core funded with a loans to deposits ratio of 84% at September 30, 2015. |
| • | PNC maintained a strong liquidity position. |
| – | New regulatory short-term liquidity standards became effective for PNC and PNC Bank as advanced approaches banking organizations beginning January 1, 2015, with a minimum phased-in Liquidity Coverage Ratio requirement of 80% in 2015, calculated as of month end. |
| – | The Liquidity Coverage Ratio (LCR) at September 30, 2015 exceeded 100% for both PNC and PNC Bank. |
| • | PNC maintained a strong capital position. |
| – | The Transitional Basel III common equity Tier 1 capital ratio was 10.6% at September 30, 2015 and 10.9% at December 31, 2014, calculated using the regulatory capital methodologies applicable to PNC during 2015 and 2014, respectively. The decline in the capital ratio during the comparable period was mainly due to higher risk weighting percentages applied to certain commercial real estate, equity and securities assets under the Basel III standardized rule which became effective in 2015. |
| – | Pro forma fully phased-in Basel III common equity Tier 1 capital ratio was an estimated 10.1% at September 30, 2015 and 10.0% at December 31, 2014 based on the standardized approach rules. See the Capital discussion and Table 20 in the Consolidated Balance Sheet Review section of this Financial Review and the December 31, 2014 capital ratio tables in the Statistical Information (Unaudited) section of this Report for more detail. |
| • | PNC returned capital to shareholders during the first nine months of 2015. |
| – | In the first quarter of 2015, in accordance with the 2014 capital plan, PNC repurchased 4.4 million common shares for an aggregate repurchase price of $.4 billion. These first quarter 2015 repurchases completed PNC's common stock repurchase program for the four quarter period that began in second quarter 2014 with total repurchases of 17.3 million common shares for $1.5 billion. |
| – | In connection with the 2015 CCAR process, PNC submitted its 2015 capital plan, as approved by its Board of Directors, to the Federal Reserve in January 2015. As we announced on March 11, 2015, the Federal Reserve accepted the capital plan and did not object to our proposed capital actions, which |
included the following that were completed during the second and third quarters of 2015: |
| – | PNC repurchased 6.2 million common shares for $.6 billion during the third quarter of 2015 and 5.9 million common shares for $.6 billion during the second quarter of 2015 under share repurchase programs of up to $2.875 billion for the five quarter period beginning in the second quarter of 2015. These programs include repurchases of up to $375 million related to stock issuances under employee benefit-related programs. |
| – | In April 2015, the Board of Directors raised the quarterly dividend on common stock to 51 cents per share, an increase of 3 cents per share, or 6%, effective with the May dividend. On October 1, 2015, the PNC Board of Directors declared a quarterly common stock cash dividend of 51 cents per share payable on November 5, 2015. |
| – | On May 4, 2015, we redeemed $500 million of PNC's Fixed-to-Floating Rate Non-Cumulative Perpetual Preferred Stock, Series K, as well as all Depositary Shares representing interests therein. Each Depositary Share represented a 1/10 interest in a share of the Series K Preferred Stock. All 50,000 shares of Series K Preferred Stock, as well as all 500,000 Depositary Shares representing interests therein, were redeemed. The redemption price was $10,000 per share of Series K Preferred Stock equivalent to $1,000 per Depositary Share, plus declared and unpaid dividends up to but excluding the redemption date. |
Our Consolidated Income Statement and Consolidated Balance Sheet Review sections of this Financial Review describe in greater detail the various items that impacted our results during the first nine months of 2015 and 2014 and balances at September 30, 2015 and December 31, 2014, respectively.
Our ability to take certain capital actions, including plans to pay or increase common stock dividends or to repurchase shares under current or future programs, is subject to the results of the supervisory assessment of capital adequacy undertaken by the Federal Reserve as part of the CCAR process. For additional information, see the Supervision and Regulation section in Item 1 Business of our 2014 Form 10-K.
See the Capital portion of the Consolidated Balance Sheet Review and the Liquidity Risk Management portion of the Risk Management section of this Financial Review for more detail on our 2015 capital and liquidity actions.
6 The PNC Financial Services Group, Inc. – Form 10-Q
Average Consolidated Balance Sheet Highlights
Table 2: Summarized Average Balance Sheet
| Nine months ended September 30 | Change | |||||||||||||||
| Dollars in millions | 2015 | 2014 | $ | % | ||||||||||||
Average assets | ||||||||||||||||
Interest-earning assets | ||||||||||||||||
Investment securities | $ | 59,578 | $ | 56,357 | $ | 3,221 | 6 | % | ||||||||
Loans | 205,122 | 198,559 | 6,563 | 3 | % | |||||||||||
Interest-earning deposits with banks | 33,380 | 16,341 | 17,039 | 104 | % | |||||||||||
Other | 9,048 | 8,476 | 572 | 7 | % | |||||||||||
Total interest-earning assets | 307,128 | 279,733 | 27,395 | 10 | % | |||||||||||
Noninterest-earning assets | 46,005 | 44,145 | 1,860 | 4 | % | |||||||||||
Total average assets | $ | 353,133 | $ | 323,878 | $ | 29,255 | 9 | % | ||||||||
Average liabilities and equity | ||||||||||||||||
Interest-bearing liabilities | ||||||||||||||||
Interest-bearing deposits | $ | 162,790 | $ | 151,757 | $ | 11,033 | 7 | % | ||||||||
Borrowed funds | 57,018 | 47,620 | 9,398 | 20 | % | |||||||||||
Total interest-bearing liabilities | 219,808 | 199,377 | 20,431 | 10 | % | |||||||||||
Noninterest-bearing deposits | 75,359 | 68,976 | 6,383 | 9 | % | |||||||||||
Other liabilities | 12,091 | 10,389 | 1,702 | 16 | % | |||||||||||
Equity | 45,875 | 45,136 | 739 | 2 | % | |||||||||||
Total average liabilities and equity | $ | 353,133 | $ | 323,878 | $ | 29,255 | 9 | % | ||||||||
Seasonal and other factors may impact our period-end balances, whereas average balances are generally more indicative of underlying business trends apart from the impact of acquisitions and divestitures. The Consolidated Balance Sheet Review section of this Financial Review provides information on changes in selected Consolidated Balance Sheet categories at September 30, 2015 compared with December 31, 2014. Total assets were $362.1 billion at September 30, 2015 compared with $345.1 billion at December 31, 2014.
Average investment securities increased in the first nine months of 2015 compared with the first nine months of 2014, due to increases in average agency residential mortgage-backed securities and U.S. Treasury and government agency securities, partially offset by a decrease in average non-agency residential mortgage-backed securities. Total investment securities comprised 19% of average interest-earning assets for the first nine months of 2015 and 20% for the first nine months of 2014.
Average total loans in the first nine months of 2015 increased compared with the first nine months of 2014 driven by growth in average commercial loans of $6.7 billion and average commercial real estate loans of $2.2 billion, principally in our Corporate & Institutional Banking segment. These increases were partially offset by a decrease in consumer loans of $2.2 billion primarily attributable to lower home equity and education loans. Runoff in the non-strategic portfolio of residential mortgage and brokered home equity loans contributed to the decrease in consumer loans.
Loans represented 67% of average interest-earning assets for the first nine months of 2015 and 71% of average interest-earning assets for the first nine months of 2014.
Average interest-earning deposits with banks, which are primarily maintained with the Federal Reserve Bank, increased in the comparison to the prior year period in part due to regulatory short-term liquidity standards phased in starting January 1, 2015 and also due to deposit growth.
The increase in average noninterest-earning assets in the first nine months of 2015 compared with the first nine months of 2014 was primarily driven by higher accounts receivable from trade date securities sales, which are included in noninterest-earning assets for average balance sheet purposes, and an increase in trading assets, primarily net customer-related derivatives values.
Average total deposits increased $17.4 billion, or 8%, to $238.1 billion in the first nine months of 2015 compared with the first nine months of 2014, primarily due to an increase in average transaction deposits, which grew to $203.8 billion for the first nine months of 2015. Higher average money market deposits, average noninterest-bearing deposits and average interest-bearing demand deposits were driven by both commercial and consumer deposit growth. These increases were partially offset by a decrease of $1.5 billion in average retail certificates of deposit attributable to runoff of maturing accounts.
Average total deposits represented 67% of average total assets for the first nine months of 2015 and 68% for the first nine months of 2014.
The increase in average borrowed funds in the first nine months of 2015 compared with the first nine months of 2014 was primarily due to increases in average Federal Home Loan Bank (FHLB) borrowings and average bank notes and senior debt. These increases were partially offset by lower average commercial paper balances, in part due to actions to enhance PNC's funding structure in light of regulatory liquidity standards and a rating agency methodology change. The Liquidity Risk Management portion of the Risk Management section of this Financial Review includes additional information regarding our sources and uses of borrowed funds.
The PNC Financial Services Group, Inc. – Form 10-Q 7
Business Segment Highlights
Total business segment earnings were $3.0 billion for both the first nine months of 2015 and 2014. The Business Segments Review section of this Financial Review includes further analysis of our business segment results over the first nine months of 2015 and 2014, including presentation differences from Note 17 Segment Reporting in our Notes To Consolidated Financial Statements of this Report. Note 17 Segment Reporting presents results of businesses for the three and nine months ended September 30, 2015 and 2014.
We provide a reconciliation of total business segment earnings to PNC total consolidated net income as reported on a GAAP basis in Note 17 Segment Reporting in our Notes To Consolidated Financial Statements of this Report.
Table 3: Results Of Businesses – Summary (a)
(Unaudited)
| Net Income | Revenue | Average Assets (b) | ||||||||||||||||||||||
| Nine months ended September 30 – in millions | 2015 | 2014 | 2015 | 2014 | 2015 | 2014 | ||||||||||||||||||
Retail Banking | $ | 694 | $ | 556 | $ | 4,804 | $ | 4,529 | $ | 73,430 | $ | 75,264 | ||||||||||||
Corporate & Institutional Banking | 1,492 | 1,542 | 4,010 | 4,032 | 131,678 | 121,232 | ||||||||||||||||||
Asset Management Group | 143 | 136 | 873 | 826 | 7,922 | 7,687 | ||||||||||||||||||
Residential Mortgage Banking | 43 | 44 | 579 | 618 | 6,962 | 7,889 | ||||||||||||||||||
BlackRock | 407 | 399 | 532 | 528 | 6,813 | 6,562 | ||||||||||||||||||
Non-Strategic Assets Portfolio | 205 | 291 | 336 | 447 | 6,880 | 8,563 | ||||||||||||||||||
Total business segments | 2,984 | 2,968 | 11,134 | 10,980 | 233,685 | 227,197 | ||||||||||||||||||
Other (c) (d) (e) | 137 | 182 | 238 | 448 | 119,448 | 96,681 | ||||||||||||||||||
Total | $ | 3,121 | $ | 3,150 | $ | 11,372 | $ | 11,428 | $ | 353,133 | $ | 323,878 | ||||||||||||
| (a) | Our business information is presented based on our internal management reporting practices. We periodically refine our internal methodologies as management reporting practices are enhanced. Net interest income in business segment results reflects PNC's internal funds transfer pricing methodology. Assets receive a funding charge and liabilities and capital receive a funding credit based on a transfer pricing methodology that incorporates product repricing characteristics, tenor and other factors. In the first quarter of 2015, enhancements were made to PNC's funds transfer pricing methodology primarily for costs related to the new regulatory short-term liquidity standards. The enhancements incorporate an additional charge assigned to assets, including for unfunded loan commitments. Conversely, a higher transfer pricing credit has been assigned to those deposits that are accorded higher value under LCR rules for liquidity purposes. These adjustments apply to business segment results, primarily favorably impacting Retail Banking and adversely impacting Corporate & Institutional Banking, prospectively beginning with the first quarter of 2015. Prior periods have not been adjusted due to the impracticability of estimating the impact of the change for prior periods. |
| (b) | Period-end balances for BlackRock. |
| (c) | "Other" average assets include investment securities associated with asset and liability management activities. |
| (d) | "Other" includes differences between the total business segment financial results and our total consolidated net income. Additional detail is included in the Business Segments Review section of this Financial Review and in Note 17 Segment Reporting in the Notes To Consolidated Financial Statements in this Report. |
| (e) | The decreases in net income and revenue in the first nine months of 2015 compared to the first nine months of 2014 for "Other" primarily reflected a decline in net interest income, partially offset by lower income tax expense, which reflected the $75 million tax benefit recorded in the third quarter of 2015. |
C ONSOLIDATED I NCOME S TATEMENT R EVIEW
Our Consolidated Income Statement is presented in Part I, Item 1 of this Report.
Net income for the third quarter of 2015 was $1.1 billion, an increase of 3% compared with $1.0 billion for third quarter of 2014. The increase was primarily driven by a lower effective income tax rate and slightly lower noninterest expense, partially offset by a 2% decrease in net interest income, higher provision for credit losses, and a 1% decrease in noninterest income.
For the first nine months of 2015, net income was $3.1 billion, a decrease of 1% compared with $3.2 billion for the first nine months of 2014. The decrease resulted from a 4% decline in net interest income and a 2% increase in noninterest expense, partially offset by a 4% increase in noninterest income, a lower effective income tax rate and lower provision for credit losses.
Net Interest Income
Table 4: Net Interest Income and Net Interest Margin
Three months ended September 30 | Nine months ended September 30 | |||||||||||||||
| Dollars in millions | 2015 | 2014 | 2015 | 2014 | ||||||||||||
Net interest income | $ | 2,062 | $ | 2,104 | $ | 6,186 | $ | 6,428 | ||||||||
Net interest margin | 2.67 | % | 2.98 | % | 2.74 | % | 3.12 | % | ||||||||
Changes in net interest income and margin result from the interaction of the volume and composition of interest-earning assets and related yields, interest-bearing liabilities and related rates paid, and noninterest-bearing sources of funding. See the Statistical Information (Unaudited) – Average Consolidated Balance Sheet And Net Interest Analysis section of this Report and the discussion of purchase accounting accretion on purchased impaired loans in the Consolidated Balance Sheet Review section of this Financial Review for additional information.
8 The PNC Financial Services Group, Inc. – Form 10-Q
Net interest income decreased by $42 million, or 2%, and $242 million, or 4%, for the third quarter and first nine months of 2015, respectively, compared to the same periods in 2014. The declines in both comparisons are reflective of the decreased purchase accounting accretion and the ongoing low rate environment, primarily resulting in lower interest-earning asset yields, partially offset by commercial and commercial real estate loan growth and higher securities balances. The year-to-date decline also reflected the impact from the second quarter 2014 correction to reclassify certain commercial facility fees from net interest income to noninterest income.
Lower net interest margins in both comparisons were driven by 28 basis point and 35 basis point declines in the yields on total interest-earning assets in the quarterly and year-to-date comparisons, respectively, which were principally due to the impact of increasing the company's liquidity position, lower loan and securities yields, and lower benefit from purchase accounting accretion. The year-to-date decline also included the impact of the second quarter 2014 correction to reclassify certain commercial facilities fees.
For full year 2015, we expect purchase accounting accretion to be down compared to 2014 by approximately $180 million to $200 million.
Noninterest Income
Table 5: Noninterest Income
| Three months ended September 30 | Nine months ended September 30 | |||||||||||||||||||||||||||||||
| Change | Change | |||||||||||||||||||||||||||||||
| Dollars in millions | 2015 | 2014 | $ | % | 2015 | 2014 | $ | % | ||||||||||||||||||||||||
Noninterest income | ||||||||||||||||||||||||||||||||
Asset management | $ | 376 | $ | 411 | $ | (35 | ) | (9 | )% | $ | 1,168 | $ | 1,137 | $ | 31 | 3 | % | |||||||||||||||
Consumer services | 341 | 320 | 21 | 7 | % | 986 | 933 | 53 | 6 | % | ||||||||||||||||||||||
Corporate services | 384 | 374 | 10 | 3 | % | 1,097 | 1,018 | 79 | 8 | % | ||||||||||||||||||||||
Residential mortgage | 125 | 140 | (15 | ) | (11 | )% | 453 | 483 | (30 | ) | (6 | )% | ||||||||||||||||||||
Service charges on deposits | 172 | 179 | (7 | ) | (4 | )% | 481 | 482 | (1 | ) | – | % | ||||||||||||||||||||
Net gains (losses) on sales of securities | (9 | ) | – | (9 | ) | * | 41 | 4 | 37 | * | ||||||||||||||||||||||
Other | 324 | 313 | 11 | 4 | % | 960 | 943 | 17 | 2 | % | ||||||||||||||||||||||
Total noninterest income | $ | 1,713 | $ | 1,737 | $ | (24 | ) | (1 | )% | $ | 5,186 | $ | 5,000 | $ | 186 | 4 | % | |||||||||||||||
| * | – Not meaningful |
Noninterest income decreased in the third quarter of 2015 compared to the same period in 2014 mainly attributable to declines in asset management and residential mortgage, partially offset by strong fee income growth in consumer and corporate services.
Year-to-date noninterest income increased compared to the first nine months of 2014 primarily driven by strong fee income growth in consumer and corporate services and higher gains on sales of securities.
Noninterest income as a percentage of total revenue was 45% for both the third quarters of 2015 and 2014. The comparable amounts for the year-to-date periods of 2015 and 2014 were 46% and 44%, respectively.
Asset management revenue decreased in the third quarter of 2015 compared to the same period of 2014 primarily as a result of elevated third quarter 2014 revenue attributable to PNC's investment in BlackRock, partially offset by fee growth. On a year-to-date comparison, asset management revenue increased due to stronger average equity markets and
new business and reflected a benefit from a $30 million trust settlement during the second quarter of 2015. Discretionary client assets under management were $132 billion at both September 30, 2015 and September 30, 2014.
Consumer service fees increased in both the quarterly and year-to-date comparisons, primarily due to growth in customer-initiated transaction volumes.
Corporate services revenue increased in both comparisons due to increased treasury management fees, partially offset by lower mergers and acquisition advisory fees. The increase in the year-to-date comparison also reflected the impact of the correction to reclassify certain commercial facility fees from net interest income to noninterest income beginning in second quarter 2014.
Residential mortgage revenue decreased in both quarterly and year-to-date comparisons mainly driven by lower loan sales revenue, reflecting the impact from the second quarter 2014 sale of previously underperforming portfolio loans and lower servicing fee revenue. The year-to-date decrease was partially
The PNC Financial Services Group, Inc. – Form 10-Q 9
offset by higher net hedging gains on residential mortgage servicing rights.
Other noninterest income for the third quarter of 2015 included gains of $43 million on the sale of 500,000 Visa Class B common shares compared with gains of $57 million on the sale of 1 million Visa Class B common shares in the third quarter of 2014. For the first nine months of 2015 and 2014, gains on sales of Visa Class B common shares were $122 million and $173 million on the sale of 1.5 million and 3 million shares, respectively. Gains on commercial mortgage loans held for sale increased on a year-to-date basis compared to the same period in 2014.
As of September 30, 2015, we held approximately 5.4 million Visa Class B common shares with a fair value of approximately $616 million and a recorded investment of approximately $43 million.
Other noninterest income typically fluctuates from period to period depending on the nature and magnitude of transactions completed. Details regarding our customer-related trading activities are included in the Market Risk Management – Customer-Related Trading Risk portion of the Risk Management section of this Financial Review. Details regarding private and other equity investments are included in the Market Risk Management – Equity And Other Investment Risk section, and further details regarding gains or losses related to our equity investment in BlackRock are included in the Business Segments Review section.
In the fourth quarter of 2015, we expect the fee categories of noninterest income (asset management, consumer services, corporate services, residential mortgage and service charges on deposits) to remain stable compared to third quarter of 2015.
Provision For Credit Losses
The provision for credit losses increased $26 million to $81 million in the third quarter of 2015 compared to the third quarter of 2014. The provision for credit losses decreased $40 million to $181 million for first nine months of 2015 compared to the same period in 2014 due to improved credit quality.
We expect our provision for credit losses in the fourth quarter of 2015 to be between $50 million and $100 million.
The Credit Risk Management portion of the Risk Management section of this Financial Review includes additional information regarding factors impacting the provision for credit losses.
Noninterest Expense
Noninterest expense decreased $5 million to $2.4 billion for the third quarter of 2015 compared to the third quarter of 2014. For the first nine months of 2015, noninterest expense increased $118 million, or 2%, to $7.1 billion compared to the same period of 2014.
Both comparisons reflected increased noninterest expense related to investments in technology and business infrastructure in support of PNC's strategic priorities and higher personnel expense associated with higher business activity. These increases were partially offset by lower asset impairment charges related to historic tax credits recorded as reductions to the associated investment asset balance beginning in the second quarter of 2015. In prior periods, these credits were recorded as a reduction to income tax expense. This change in application of historic tax credits was not material to PNC's financial results. In the quarterly comparison, expense for third party services also declined.
During the second quarter of 2015, we increased the savings goal of our annual continuous improvement program, which focuses on reducing costs in part to fund investments in technology and infrastructure, to $500 million for 2015. Through the first nine months of 2015, PNC has completed actions to capture 75% of this goal and is on track to reach the full year target.
For the fourth quarter of 2015, we expect noninterest expense to remain stable compared to third quarter 2015. We expect our full year 2015 expenses to be approximately one percent lower than full year 2014 expenses.
Effective Income Tax Rate
The effective income tax rate was 20.0% in the third quarter of 2015, compared to 27.4% in the third quarter of 2014 and 24.3% in the first nine months of 2015 compared to 26.0% in the same period of 2014. The effective tax rate is generally lower than the statutory rate primarily due to tax credits PNC receives from our investments in low income housing and new markets investments, as well as earnings in other tax exempt investments.
The lower effective tax rate for both 2015 periods reflected tax benefits of $75 million attributable to effectively settling acquired entity tax contingencies offset by additions to reserves of $10 million for various tax matters. These decreases were partially offset by the impact beginning in second quarter 2015 of historic tax credits recorded as a reduction to the associated investment asset balances, while in prior periods these credits were recorded as a reduction of income tax expense.
We expect our fourth quarter of 2015 effective tax rate to be approximately 26%.
10 The PNC Financial Services Group, Inc. – Form 10-Q
C ONSOLIDATED B ALANCE S HEET R EVIEW
Table 6: Summarized Balance Sheet Data
Dollars in millions | September 30 2015 | December 31 2014 | Change | |||||||||||||||
| $ | % | |||||||||||||||||
Assets | ||||||||||||||||||
Interest-earning deposits with banks | $ | 34,224 | $ | 31,779 | $ | 2,445 | 8 | % | ||||||||||
Loans held for sale | 2,060 | 2,262 | (202 | ) | (9 | )% | ||||||||||||
Investment securities | 68,066 | 55,823 | 12,243 | 22 | % | |||||||||||||
Loans | 204,983 | 204,817 | 166 | – | % | |||||||||||||
Allowance for loan and lease losses | (3,237 | ) | (3,331 | ) | 94 | (3 | )% | |||||||||||
Goodwill | 9,103 | 9,103 | – | – | % | |||||||||||||
Mortgage servicing rights | 1,467 | 1,351 | 116 | 9 | % | |||||||||||||
Other intangible assets | 407 | 493 | (86 | ) | (17 | )% | ||||||||||||
Other, net | 45,052 | 42,775 | 2,277 | 5 | % | |||||||||||||
Total assets | $ | 362,125 | $ | 345,072 | $ | 17,053 | 5 | % | ||||||||||
Liabilities | ||||||||||||||||||
Deposits | $ | 244,979 | $ | 232,234 | $ | 12,745 | 5 | % | ||||||||||
Borrowed funds | 56,663 | 56,768 | (105 | ) | – | % | ||||||||||||
Other | 14,205 | 9,996 | 4,209 | 42 | % | |||||||||||||
Total liabilities | 315,847 | 298,998 | 16,849 | 6 | % | |||||||||||||
Equity | ||||||||||||||||||
Total shareholders' equity | 44,948 | 44,551 | 397 | 1 | % | |||||||||||||
Noncontrolling interests | 1,330 | 1,523 | (193 | ) | (13 | )% | ||||||||||||
Total equity | 46,278 | 46,074 | 204 | – | % | |||||||||||||
Total liabilities and equity | $ | 362,125 | $ | 345,072 | $ | 17,053 | 5 | % | ||||||||||
The summarized balance sheet data above is based upon our Consolidated Balance Sheet in Part 1, Item 1 of this Report.
PNC's balance sheet reflected asset growth and strong liquidity and capital positions at September 30, 2015.
| • | Total assets increased $17.1 billion, or 5%, mainly due to an increase of $12.2 billion in investment securities driven by deposit growth and a $2.4 billion increase in interest-earning deposits with banks reflecting the impact of regulatory short-term liquidity standards phased in starting January 1, 2015. |
| • | Total liabilities increased $16.8 billion, or 6%, mainly due to an increase in deposits. |
| • | Total equity increased $.2 billion mainly due to increased retained earnings driven by net income, partially offset by share repurchases and redemption of preferred stock. |
An analysis of changes in selected balance sheet categories follows.
Loans
Outstanding loan balances of $205.0 billion at September 30, 2015 and $204.8 billion at December 31, 2014 were net of unearned income, net deferred loan fees, unamortized discounts and premiums, and purchase discounts and premiums totaling $1.5 billion at September 30, 2015 and $1.7 billion at December 31, 2014. The balances include purchased impaired loans but do not include future accretable net interest ( i.e. , the difference between the undiscounted expected cash flows and the carrying value of the loan) on those loans.
The PNC Financial Services Group, Inc. – Form 10-Q 11
Table 7: Details Of Loans
Dollars in millions | September 30 2015 | December 31 2014 | Change | |||||||||||||||
| $ | % | |||||||||||||||||
Commercial lending | ||||||||||||||||||
Commercial | ||||||||||||||||||
Retail/wholesale trade | $ | 16,986 | $ | 16,972 | $ | 14 | – | % | ||||||||||
Manufacturing | 19,649 | 18,744 | 905 | 5 | % | |||||||||||||
Service providers | 13,550 | 14,103 | (553 | ) | (4 | )% | ||||||||||||
Real estate related (a) | 11,492 | 10,812 | 680 | 6 | % | |||||||||||||
Financial services | 5,511 | 6,178 | (667 | ) | (11 | )% | ||||||||||||
Health care | 9,397 | 9,017 | 380 | 4 | % | |||||||||||||
Other industries | 20,842 | 21,594 | (752 | ) | (3 | )% | ||||||||||||
Total commercial | 97,427 | 97,420 | 7 | – | % | |||||||||||||
Commercial real estate | ||||||||||||||||||
Real estate projects (b) | 15,333 | 14,577 | 756 | 5 | % | |||||||||||||
Commercial mortgage | 10,760 | 8,685 | 2,075 | 24 | % | |||||||||||||
Total commercial real estate | 26,093 | 23,262 | 2,831 | 12 | % | |||||||||||||
Equipment lease financing | 7,644 | 7,686 | (42 | ) | (1 | )% | ||||||||||||
Total commercial lending (c) | 131,164 | 128,368 | 2,796 | 2 | % | |||||||||||||
Consumer lending | ||||||||||||||||||
Home equity | ||||||||||||||||||
Lines of credit | 19,309 | 20,361 | (1,052 | ) | (5 | )% | ||||||||||||
Installment | 13,697 | 14,316 | (619 | ) | (4 | )% | ||||||||||||
Total home equity | 33,006 | 34,677 | (1,671 | ) | (5 | )% | ||||||||||||
Residential real estate | ||||||||||||||||||
Residential mortgage | 14,038 | 13,885 | 153 | 1 | % | |||||||||||||
Residential construction | 454 | 522 | (68 | ) | (13 | )% | ||||||||||||
Total residential real estate | 14,492 | 14,407 | 85 | 1 | % | |||||||||||||
Credit card | 4,600 | 4,612 | (12 | ) | – | % | ||||||||||||
Other consumer | ||||||||||||||||||
Education | 6,070 | 6,626 | (556 | ) | (8 | )% | ||||||||||||
Automobile | 11,039 | 11,616 | (577 | ) | (5 | )% | ||||||||||||
Other | 4,612 | 4,511 | 101 | 2 | % | |||||||||||||
Total consumer lending | 73,819 | 76,449 | (2,630 | ) | (3 | )% | ||||||||||||
Total loans | $ | 204,983 | $ | 204,817 | $ | 166 | – | % | ||||||||||
| (a) | Includes loans to customers in the real estate and construction industries. |
| (b) | Includes both construction loans and intermediate financing for projects. |
| (c) | Construction loans with interest reserves and A/B Note restructurings are not significant to PNC. |
The slight increase in loans was the result of an increase in total commercial lending driven by commercial real estate loans, offset by a decline in consumer lending due to lower home equity, automobile and education loans.
Loans represented 57% of total assets at September 30, 2015 and 59% at December 31, 2014. Commercial lending represented 64% of the loan portfolio at September 30, 2015 and 63% at December 31, 2014. Consumer lending represented 36% of the loan portfolio at September 30, 2015 and 37% at December 31, 2014.
Commercial real estate loans represented 13% of total loans at September 30, 2015 and 11% of total loans at December 31, 2014 and represented 7% of total assets at both September 30, 2015 and December 31, 2014. See the Credit Risk Management portion of the Risk Management section of this Financial Review for additional information regarding our loan portfolio.
Total loans above include purchased impaired loans of $4.2 billion, or 2% of total loans, at September 30, 2015, and $4.9 billion, or 2% of total loans, at December 31, 2014.
12 The PNC Financial Services Group, Inc. – Form 10-Q
Our loan portfolio continued to be diversified among numerous industries, types of businesses and consumers across our principal geographic markets.
Allowance for Loan and Lease Losses (ALLL)
Information regarding our higher risk loans and ALLL is included in the Credit Risk Management portion of the Risk Management section of this Financial Review and Note 1 Accounting Policies, Note 3 Asset Quality and Note 5 Allowances for Loan and Lease Losses and Unfunded Loan Commitments and Letters of Credit in our Notes To Consolidated Financial Statements included in Part 1, Item 1 of this Report.
Purchase Accounting Accretion and Valuation of Purchased Impaired Loans
Information related to purchase accounting accretion and accretable yield for the third quarter and first nine months of 2015 and 2014 follows. Additional information on our policies for ALLL for purchased impaired loans is provided in Note 1 Accounting Policies in the Notes To Consolidated Financial Statements of this Report. A description of our purchased impaired loan accounting and loan data is included in Note 4 Purchased Loans in the Notes To Consolidated Financial Statements of this Report.
Table 8: Accretion – Purchased Impaired Loans
Three months ended September 30 | Nine months ended September 30 | |||||||||||||||
| In millions | 2015 | 2014 | 2015 | 2014 | ||||||||||||
Accretion on purchased impaired loans | ||||||||||||||||
Scheduled accretion | $ | 88 | $ | 109 | $ | 279 | $ | 354 | ||||||||
Reversal of contractual interest on impaired loans | (57 | ) | (57 | ) | (164 | ) | (195 | ) | ||||||||
Scheduled accretion net of contractual interest | 31 | 52 | 115 | 159 | ||||||||||||
Excess cash recoveries (a) | 19 | 31 | 80 | 95 | ||||||||||||
Total | $ | 50 | $ | 83 | $ | 195 | $ | 254 | ||||||||
| (a) | Relates to excess cash recoveries for purchased impaired commercial loans. |
Table 9: Purchased Impaired Loans – Accretable Yield
| In millions | 2015 | 2014 | ||||||
January 1 | $ | 1,558 | $ | 2,055 | ||||
Accretion (including excess cash recoveries) | (359 | ) | (449 | ) | ||||
Net reclassification to accretable from non-accretable and other activity (a) | 218 | 237 | ||||||
Disposals | (66 | ) | (24 | ) | ||||
September 30 (b) | $ | 1,351 | $ | 1,819 | ||||
| (a) | Approximately 66% and 68% of the net reclassification for the first nine months of 2015 and 2014, respectively, were driven by the consumer portfolio and were due to improvements of cash expected to be collected on loans in future periods. The remaining net reclassifications were predominantly due to future cash flow changes in the commercial portfolio. |
| (b) | As of September 30, 2015, we estimate that the reversal of contractual interest on purchased impaired loans will total approximately $0.7 billion in future periods. This will offset the total net accretable interest in future interest income of $1.4 billion on purchased impaired loans. |
Information related to the valuation of purchased impaired loans at September 30, 2015 and December 31, 2014 follows.
Table 10: Valuation of Purchased Impaired Loans
| September 30, 2015 | December 31, 2014 | |||||||||||||||
| Dollars in millions | Balance | Net Investment | Balance | Net Investment | ||||||||||||
Commercial and commercial real estate loans: | ||||||||||||||||
Outstanding balance (a) | $ | 296 | $ | 466 | ||||||||||||
Recorded investment | $ | 204 | $ | 310 | ||||||||||||
Allowance for loan losses | (67 | ) | (79 | ) | ||||||||||||
Net investment/Carrying value | $ | 137 | 46 | % | $ | 231 | 50 | % | ||||||||
Consumer and residential real estate loans: | ||||||||||||||||
Outstanding balance (a) | $ | 3,854 | $ | 4,541 | ||||||||||||
Recorded investment | $ | 3,963 | $ | 4,548 | ||||||||||||
Allowance for loan losses | (751 | ) | (793 | ) | ||||||||||||
Net investment/Carrying value | $ | 3,212 | 83 | % | $ | 3,755 | 83 | % | ||||||||
Total purchased impaired loans: | ||||||||||||||||
Outstanding balance (a) | $ | 4,150 | $ | 5,007 | ||||||||||||
Recorded investment | $ | 4,167 | $ | 4,858 | ||||||||||||
Allowance for loan losses | (818 | ) | (872 | ) | ||||||||||||
Net investment/Carrying value | $ | 3,349 | 81 | % | $ | 3,986 | 80 | % | ||||||||
| (a) | Outstanding balance represents the balance on the loan servicing system for active loans. It is possible for the outstanding balance to be lower than the recorded investment for certain loans due to the use of pool accounting. See Note 4 Purchased Loans for additional information on purchased impaired loans. |
The PNC Financial Services Group, Inc. – Form 10-Q 13
At September 30, 2015, our largest individual purchased impaired loan had a recorded investment of $9 million. We currently expect to collect total cash flows of $4.7 billion on purchased impaired loans, representing the $3.3 billion net investment at September 30, 2015 and the accretable net interest of $1.4 billion shown in Table 9.
Weighted Average Life of the Purchased Impaired Portfolios
The table below provides the weighted average life (WAL) for each of the purchased impaired portfolios as of September 30, 2015.
Table 11: Weighted Average Life of the Purchased Impaired Portfolios
As of September 30, 2015 Dollars in millions | Recorded Investment | WAL (a) | ||||||
Commercial | $ | 43 | 2.1 years | |||||
Commercial real estate | 161 | 1.4 years | ||||||
Consumer (b) | 1,753 | 4.0 years | ||||||
Residential real estate | 2,210 | 4.7 years | ||||||
Total | $ | 4,167 | 4.2 years | |||||
| (a) | Weighted average life represents the average number of years for which each dollar of unpaid principal remains outstanding. |
| (b) | Portfolio primarily consists of nonrevolving home equity products. |
Through the National City Corporation (National City) and RBC Bank (USA) acquisitions, we acquired purchased impaired loans with a recorded investment of $14.7 billion. As noted in Table 11 above, at September 30, 2015, those balances are now $4.2 billion, of which $4.0 billion in consumer and residential real estate loans is accounted for using pool accounting. In anticipation of the end of the life of our purchased impaired pooled consumer and residential real estate loans and pursuant to supervisory direction received regarding such loans, we will change our derecognition policy for these loans effective December 31, 2015. Pursuant to this change in policy, we will remove loans that have been paid off, sold, short sold, foreclosed upon, or that have nominal collateral value/expected cash flows from our loan pools. The result of this change will accelerate the derecognition of a pool's recorded investment and associated ALLL balance. As the loans that will be removed effective December 31, 2015 have been fully reserved for, this change will not impact the net carrying values of the pools, accretion accounting or result in additional provision for credit losses for purchased impaired loans that are pooled, as a pool's recorded investment and associated ALLL balance will be reduced in equal amounts. Upon implementation of this policy change in the fourth quarter of 2015, which is immaterial to our financial statements taken as a whole, we estimate that the recorded investment and associated ALLL balances for our purchased impaired pooled consumer and residential real estate loans will each be reduced by approximately $475 million. These amounts represent the net loss from loan dispositions or expected cash flow shortfalls that have been retained as part of the pools' recorded investment per our accounting for the pool
as a single asset. We expect the future impact of this policy change to the Consolidated Income Statement and Consolidated Balance Sheet to be immaterial on a quarterly basis. See Note 4 Purchased Loans and Note 5 Allowance for Loan and Lease Losses and Unfunded Commitments and Letters of Credit in the Notes To Consolidated Financial Statements in this Report for additional information.
The following table represents on a proforma basis as of September 30, 2015 the estimated impact of the change in our derecognition policy to total ALLL, total loans and ratio of total ALLL to total loans.
Table 12: Estimated Derecognition Impact – Total ALLL to Total Loans
| September 30, 2015 | ||||||||||||
| (Dollars in millions) | Actual | Adjustment (a) | Proforma | |||||||||
Total ALLL | $ | 3,237 | $ | (475 | ) | $ | 2,762 | |||||
Total Loans | 204,983 | (475 | ) | 204,508 | ||||||||
Ratio of Total ALLL to Total Loans | 1.58 | % | 1.35 | % | ||||||||
| (a) | The estimated reduction of ALLL and corresponding reduction in the purchased impaired loans recorded investment as of September 30, 2015 would be approximately the same as the expected amounts as of December 31, 2015. |
Purchased Impaired Loans – Accretable Difference Sensitivity Analysis
The following table provides a sensitivity analysis on the Total Purchased Impaired Loans portfolio. The analysis reflects hypothetical changes in key drivers for expected cash flows over the life of the loans under declining and improving conditions at a point in time. Any unusual significant economic events or changes, as well as other variables not considered below ( e.g ., natural or widespread disasters), could result in impacts outside of the ranges represented below. Additionally, commercial and commercial real estate loan settlements or sales proceeds can vary widely from appraised values due to a number of factors including, but not limited to, special use considerations, liquidity premiums and improvements/deterioration in other income sources.
Table 13: Accretable Difference Sensitivity – Total Purchased Impaired Loans
| In billions | September 30, 2015 | Declining Scenario (a) | Improving Scenario (b) | |||||||||
Expected cash flows | $ | 4.7 | $ | (.1 | ) | $ | .2 | |||||
Accretable difference | 1.4 | – | – | |||||||||
Allowance for loan and lease losses | (.8 | ) | (.1 | ) | .2 | |||||||
| (a) | Declining Scenario – Reflects hypothetical changes that would decrease future cash flow expectations. For consumer loans, we assume home price forecast decreases by ten percent and unemployment rate forecast increases by two percentage points; for commercial loans, we assume that collateral values decrease by ten percent. |
| (b) | Improving Scenario – Reflects hypothetical changes that would increase future cash flow expectations. For consumer loans, we assume home price forecast increases by ten percent, unemployment rate forecast decreases by two percentage points and interest rate forecast increases by two percentage points; for commercial loans, we assume that collateral values increase by ten percent. |
14 The PNC Financial Services Group, Inc. – Form 10-Q
The present value impact of declining cash flows is primarily reflected as an immediate impairment charge resulting in a provision for credit losses and an increase to the allowance for loan and lease losses. The present value impact of increased cash flows is first recognized as a reversal of the allowance with any additional cash flow increases reflected as an increase in accretable yield over the life of the loan.
Commitments to Extend Credit
Commitment to extend credit comprise the following:
Table 14: Commitments to Extend Credit (a)
| In millions | September 30 2015 | December 31 2014 | ||||||
Total commercial lending | $ | 100,323 | $ | 98,742 | ||||
Home equity lines of credit | 17,350 | 17,839 | ||||||
Credit card | 19,622 | 17,833 | ||||||
Other | 4,075 | 4,178 | ||||||
Total | $ | 141,370 | $ | 138,592 | ||||
| (a) | Commitments to extend credit, or net unfunded loan commitments, represent arrangements to lend funds or provide liquidity subject to specified contractual conditions. |
In addition to the credit commitments set forth in the table above, our net outstanding standby letters of credit totaled $9.1 billion at September 30, 2015 and $10.0 billion at December 31, 2014. Standby letters of credit commit us to make payments on behalf of our customers if specified future events occur.
Information regarding our commitments to extend credit and our allowance for unfunded loan commitments and letters of credit is included in Note 1 Accounting Policies, Note 5 Allowances for Loan and Lease Losses and Unfunded Loan Commitments and Letters of Credit and Note 16 Commitments and Guarantees in the Notes To Consolidated Financial Statements in Part 1, Item 1 of this Report.
I NVESTMENT S ECURITIES
The following table presents the distribution of our investment securities portfolio by credit rating. We have included credit ratings information because we believe that the information is an indicator of the degree of credit risk to which we are exposed. Changes in credit ratings classifications could indicate increased or decreased credit risk and could be accompanied by a reduction or increase in the fair value of our investment securities portfolio. For those securities on our balance sheet at September 30, 2015, where during our quarterly security-level impairment assessments we determined losses represented other-than-temporary impairment (OTTI), we have recorded cumulative credit losses of $1.1 billion in earnings and accordingly have reduced the amortized cost of our securities. The majority of these cumulative impairment charges related to non-agency residential mortgage-backed and asset-backed securities rated BB or lower.
Table 15: Investment Securities
| September 30, 2015 | December 31, 2014 | Ratings (a) As of September 30, 2015 | ||||||||||||||||||||||||||||||||||
| Dollars in millions | Amortized Cost | Fair Value | Amortized Cost | Fair Value | AAA/ AA | A | BBB | BB and Lower | No Rating | |||||||||||||||||||||||||||
U.S. Treasury and government agencies | $ | 8,368 | $ | 8,593 | $ | 5,485 | $ | 5,714 | 100 | % | ||||||||||||||||||||||||||
Agency residential mortgage-backed | 33,185 | 33,685 | 23,382 | 23,935 | 100 | |||||||||||||||||||||||||||||||
Non-agency residential mortgage-backed | 4,392 | 4,591 | 4,993 | 5,225 | 10 | 1 | % | 2 | % | 82 | % | 5 | % | |||||||||||||||||||||||
Agency commercial mortgage-backed | 3,077 | 3,155 | 3,378 | 3,440 | 100 | |||||||||||||||||||||||||||||||
Non-agency commercial mortgage-backed (b) | 5,477 | 5,544 | 5,095 | 5,191 | 77 | 12 | 2 | 3 | 6 | |||||||||||||||||||||||||||
Asset-backed (c) | 5,921 | 5,950 | 5,900 | 5,940 | 89 | 3 | 7 | 1 | ||||||||||||||||||||||||||||
State and municipal | 3,972 | 4,140 | 3,995 | 4,191 | 88 | 6 | 6 | |||||||||||||||||||||||||||||
Other debt | 2,157 | 2,194 | 2,099 | 2,142 | 56 | 35 | 9 | |||||||||||||||||||||||||||||
Corporate stock and other | 576 | 576 | 442 | 441 | 100 | |||||||||||||||||||||||||||||||
Total investment securities (d) | $ | 67,125 | $ | 68,428 | $ | 54,769 | $ | 56,219 | 88 | % | 3 | % | 1 | % | 6 | % | 2 | % | ||||||||||||||||||
| (a) | Ratings percentages allocated based on amortized cost. |
| (b) | Collateralized primarily by retail properties, office buildings, lodging properties and multi-family housing. |
| (c) | Collateralized primarily by government guaranteed student loans and other consumer credit products and corporate debt. |
| (d) | Includes available for sale and held to maturity securities. |
Investment securities represented 19% of total assets at September 30, 2015 and 16% at December 31, 2014.
The PNC Financial Services Group, Inc. – Form 10-Q 15
We evaluate our investment securities portfolio in light of changing market conditions and other factors and, where appropriate, take steps to improve our overall positioning. We consider the portfolio to be well-diversified and of high quality. At September 30, 2015, 88% of the securities in the portfolio were rated AAA/AA, with U.S. Treasury and government agencies, agency residential mortgage-backed and agency commercial mortgage-backed securities collectively representing 66% of the portfolio.
The investment securities portfolio includes both available for sale and held to maturity securities. Securities classified as available for sale are carried at fair value with net unrealized gains and losses, representing the difference between amortized cost and fair value, included in Shareholders' equity as Accumulated other comprehensive income or loss, net of tax, on our Consolidated Balance Sheet. Securities classified as held to maturity are carried at amortized cost. As of September 30, 2015, the amortized cost and fair value of available for sale securities totaled $52.7 billion and $53.7 billion, respectively, compared to an amortized cost and fair value as of December 31, 2014 of $43.2 billion and $44.2 billion, respectively. The amortized cost and fair value of held to maturity securities were $14.4 billion and $14.8 billion, respectively, at September 30, 2015, compared to $11.6 billion and $12.0 billion, respectively, at December 31, 2014.
The fair value of investment securities is impacted by interest rates, credit spreads, market volatility and liquidity conditions. The fair value of investment securities generally decreases when interest rates increase and vice versa. In addition, the fair value generally decreases when credit spreads widen and vice versa. Net unrealized gains in the total investment securities portfolio decreased to $1.3 billion at September 30, 2015 from $1.5 billion at December 31, 2014. The comparable amounts for the securities available for sale portfolio were $.9 billion at September 30, 2015 and $1.1 billion at December 31, 2014.
Unrealized gains and losses on available for sale debt securities do not impact liquidity. However these gains and losses do affect capital under the regulatory capital rules. Also, a change in the securities' credit ratings could impact the liquidity of the securities and may be indicative of a change in credit quality, which could affect our risk-weighted assets and, therefore, our risk-based regulatory capital ratios under the regulatory capital rules. In addition, the amount representing the credit-related portion of OTTI on securities would reduce our earnings and regulatory capital ratios.
The duration of investment securities was 2.5 years at September 30, 2015. We estimate that, at September 30, 2015, the effective duration of investment securities was 2.7 years for an immediate 50 basis points parallel increase in interest rates and 2.4 years for an immediate 50 basis points parallel decrease in interest rates. Comparable amounts at December 31, 2014 for the effective duration of investment securities were 2.2 years and 2.1 years, respectively.
Based on current interest rates and expected prepayment speeds, the weighed-average expected maturity of the investment securities portfolio (excluding corporate stock and other) was 4.4 years at September 30, 2015 compared to 4.3 years at December 31, 2014. The weighted-average expected maturities of mortgage and other asset-backed debt securities were as follows as of September 30, 2015:
Table 16: Weighted-Average Expected Maturity of Mortgage and Other Asset-Backed Debt Securities
| September 30, 2015 | Years | |||
Agency residential mortgage-backed securities | 4.2 | |||
Non-agency residential mortgage-backed securities | 5.4 | |||
Agency commercial mortgage-backed securities | 3.2 | |||
Non-agency commercial mortgage-backed securities | 3.1 | |||
Asset-backed securities | 3.0 | |||
At least quarterly, we conduct a comprehensive security-level impairment assessment on all securities. If economic conditions, including home prices, were to deteriorate from current levels, and if market volatility and liquidity were to deteriorate from current levels, or if market interest rates were to increase or credit spreads were to widen appreciably, the valuation of our investment securities portfolio would likely be adversely affected and we could incur additional OTTI credit losses that would impact our Consolidated Income Statement.
Additional information regarding our investment securities is included in Note 6 Investment Securities and Note 7 Fair Value in the Notes To Consolidated Financial Statements included in Part I, Item 1 of this Report.
Loans Held for Sale
T able 17: Loans Held For Sale
| In millions | September 30 2015 | December 31 2014 | ||||||
Commercial mortgages at fair value | $ | 802 | $ | 893 | ||||
Commercial mortgages at lower of cost or fair value | 58 | 29 | ||||||
Total commercial mortgages | 860 | 922 | ||||||
Residential mortgages at fair value | 1,086 | 1,261 | ||||||
Residential mortgages at lower of cost or fair value | 42 | 18 | ||||||
Total residential mortgages | 1,128 | 1,279 | ||||||
Other | 72 | 61 | ||||||
Total | $ | 2,060 | $ | 2,262 | ||||
As of September 1, 2014, we have elected to apply the fair value option to commercial mortgage loans held for sale to agencies. This election applies to all new commercial
16 The PNC Financial Services Group, Inc. – Form 10-Q
mortgage loans held for sale that have been originated for sale to the agencies effective on or after September 1, 2014. The election of fair value option aligns the accounting for the commercial mortgages with the related commitments to sell the loans.
We sold $3.0 billion of commercial mortgage loans to agencies during the first nine months of 2015 compared to $2.0 billion during the first nine months of 2014. Total gains of $64 million were recognized on the valuation and sale of commercial mortgage loans held for sale, net of hedges, during the first nine months of 2015, including $13 million in the third quarter. Comparable amounts for 2014 were $49 million and $20 million, respectively. These amounts are included in Other noninterest income on our Consolidated Income Statement.
Residential mortgage loan origination volume was $8.2 billion during the first nine months of 2015 compared to $7.1 billion during the first nine months of 2014. The majority of such loans were originated under agency or Federal Housing
Administration (FHA) standards. We sold $6.2 billion of loans and recognized loan sales revenue of $278 million during the first nine months of 2015, including $75 million in the third quarter. The comparable amounts for the first nine months of 2014 were $6.4 billion and $327 million, respectively, including $85 million in the third quarter. These loan sales revenue amounts are included in Residential mortgage noninterest income on our Consolidated Income Statement.
Interest income on loans held for sale was $68 million during the first nine months of 2015, including $22 million in the third quarter. Comparable amounts for 2014 were $73 million and $26 million, respectively. These amounts are included in Other interest income on our Consolidated Income Statement.
Additional information regarding our loan sale and servicing activities is included in Note 2 Loan Sale and Servicing Activities and Variable Interest Entities and Note 7 Fair Value in our Notes To Consolidated Financial Statements included in Part 1, Item 1 of this Report.
Funding Sources
Table 18: Details Of Funding Sources
Dollars in millions | September 30 2015 | December 31 2014 | Change | |||||||||||||||
| $ | % | |||||||||||||||||
Deposits | ||||||||||||||||||
Money market | $ | 125,135 | $ | 115,438 | $ | 9,697 | 8 | % | ||||||||||
Demand | 83,632 | 82,829 | 803 | 1 | % | |||||||||||||
Retail certificates of deposit | 18,337 | 18,544 | (207 | ) | (1 | )% | ||||||||||||
Savings | 15,330 | 12,571 | 2,759 | 22 | % | |||||||||||||
Time deposits in foreign offices and other time deposits | 2,545 | 2,852 | (307 | ) | (11 | )% | ||||||||||||
Total deposits | 244,979 | 232,234 | 12,745 | 5 | % | |||||||||||||
Borrowed funds | ||||||||||||||||||
Federal funds purchased and repurchase agreements | 2,077 | 3,510 | (1,433 | ) | (41 | )% | ||||||||||||
FHLB borrowings | 21,664 | 20,005 | 1,659 | 8 | % | |||||||||||||
Bank notes and senior debt | 19,749 | 15,750 | 3,999 | 25 | % | |||||||||||||
Subordinated debt | 9,242 | 9,151 | 91 | 1 | % | |||||||||||||
Commercial paper | 1,125 | 4,995 | (3,870 | ) | (77 | )% | ||||||||||||
Other | 2,806 | 3,357 | (551 | ) | (16 | )% | ||||||||||||
Total borrowed funds | 56,663 | 56,768 | (105 | ) | – | % | ||||||||||||
Total funding sources | $ | 301,642 | $ | 289,002 | $ | 12,640 | 4 | % | ||||||||||
See the Liquidity Risk Management portion of the Risk Management section of this Financial Review for additional information regarding our 2015 capital and liquidity activities.
Total deposits increased $12.7 billion at September 30, 2015 compared with December 31, 2014 due to strong growth in money market, savings and demand deposits, partially offset by time deposits in foreign offices and other time deposits and retail certificates of deposit. Interest-bearing deposits represented 68% of total deposits at both September 30, 2015 and December 31, 2014.
The PNC Financial Services Group, Inc. – Form 10-Q 17
Total borrowed funds decreased $.1 billion since December 31, 2014 as a decline in commercial paper, federal funds purchased and repurchase agreements, and other borrowed funds were partially offset by higher issuances of bank notes and senior debt and FHLB borrowings. The changes in the composition of funding sources are attributable to PNC's actions to enhance its funding structure in light of regulatory liquidity standards and a rating agency methodology change.
Capital
We manage our funding and capital positions by making adjustments to our balance sheet size and composition, issuing debt, equity or other capital instruments, executing treasury stock transactions and capital redemptions, managing dividend policies and retaining earnings.
We repurchase shares of PNC common stock under common stock repurchase authorizations approved from time to time by PNC's Board of Directors and consistent with capital plans submitted to, and accepted by, the Federal Reserve. Through the first quarter of 2015, we repurchased stock under our 2007 common stock repurchase program authorization that permitted us to purchase up to 25 million shares of PNC common stock on the open market or in privately negotiated transactions. Effective as of March 31, 2015, PNC's Board of Directors approved the termination of the 2007 common stock repurchase program authorization, and replaced it with a new stock repurchase program authorization in the amount of 100 million shares of PNC common stock, effective April 1, 2015. The extent and timing of share repurchases under this authorization will depend on a number of factors including, among others, market and general economic conditions, economic and regulatory capital considerations, alternative uses of capital, the potential impact on our credit ratings, contractual and regulatory limitations, and the results of future supervisory assessments of capital adequacy and capital planning processes undertaken by the Federal Reserve as part of the CCAR process.
In the first quarter of 2015, we completed our common stock repurchase programs for the four quarter period that began in second quarter 2014 with total repurchases over that period of 17.3 million common shares for $1.5 billion. These repurchases were included in our 2014 capital plan accepted by the Federal Reserve as part of our 2014 CCAR submission.
In connection with the 2015 CCAR process, we submitted our 2015 capital plan, as approved by PNC's Board of Directors, to the Federal Reserve in January 2015. The Federal Reserve accepted the capital plan and did not object to our proposed capital actions in March 2015. As provided for in the 2015 capital plan, we announced new share repurchase programs of up to $2.875 billion for the five quarter period beginning in the second quarter of 2015. These programs include repurchases of up to $375 million over the five quarter period related to stock issuances under employee benefit-related programs.
In the first quarter of 2015, PNC repurchased 4.4 million common shares for $.4 billion. In the second quarter of 2015, PNC repurchased 5.9 million common shares for $.6 billion. In the third quarter of 2015, PNC repurchased 6.2 million common shares for $.6 billion. All of these repurchases were under the authorizations and programs then in effect, as described above.
Under the Federal Reserve's capital plan rule, a bank holding company must resubmit a new capital plan prior to the annual submission date if, among other things, there has been or will be a material change in the bank holding company's risk profile, financial condition, or corporate structure since its last capital plan submission.
See the Supervision and Regulation section of Item 1 Business of our 2014 Form 10-K for further information concerning the CCAR process and the factors the Federal Reserve takes into consideration in its evaluation of capital plans and the Balance Sheet, Liquidity and Capital Highlights portion of the Executive Summary section of this Financial Review for the impact of the Federal Reserve's current supervisory assessment of the capital adequacy program.
Table 19: Shareholders' Equity
Dollars in millions | September 30 2015 | December 31 2014 | Change | |||||||||||||||
| $ | % | |||||||||||||||||
Shareholders' equity | ||||||||||||||||||
Preferred stock (a) | ||||||||||||||||||
Common stock | $ | 2,708 | $ | 2,705 | $ | 3 | – | % | ||||||||||
Capital surplus – preferred stock | 3,450 | 3,946 | (496 | ) | (13 | )% | ||||||||||||
Capital surplus – common stock and other | 12,675 | 12,627 | 48 | – | % | |||||||||||||
Retained earnings | 28,337 | 26,200 | 2,137 | 8 | % | |||||||||||||
Accumulated other comprehensive income | 615 | 503 | 112 | 22 | % | |||||||||||||
Common stock held in treasury at cost | (2,837 | ) | (1,430 | ) | (1,407 | ) | (98 | )% | ||||||||||
Total shareholders' equity | $ | 44,948 | $ | 44,551 | $ | 397 | 1 | % | ||||||||||
| (a) | Par value less than $.5 million at each date. |
18 The PNC Financial Services Group, Inc. – Form 10-Q
The increase in total shareholders' equity compared to December 31, 2014 was mainly due to a $2.1 billion increase in retained earnings, partially offset by common share repurchases of $1.6 billion and the redemption of $500 million of preferred stock. The increase in retained earnings was driven by net income of $3.1 billion, reduced by $957 million of common and preferred dividends declared and continued share repurchases. Common shares outstanding were 510 million at September 30, 2015 and 523 million at December 31, 2014.
Table 20: Basel III Capital
| September 30, 2015 | ||||||||
| Dollars in millions | Transitional Basel III (a) | Pro forma Fully Phased-In Basel III (b)(c) | ||||||
Common equity Tier 1 capital | ||||||||
Common stock plus related surplus, net of treasury stock | $ | 12,546 | $ | 12,546 | ||||
Retained earnings | 28,337 | 28,337 | ||||||
Accumulated other comprehensive income for securities currently and previously held as available for sale | 257 | 642 | ||||||
Accumulated other comprehensive income for pension and other postretirement plans | (193 | ) | (483 | ) | ||||
Goodwill, net of associated deferred tax liabilities | (8,845 | ) | (8,845 | ) | ||||
Other disallowed intangibles, net of deferred tax liabilities | (141 | ) | (352 | ) | ||||
Other adjustments/(deductions) | (111 | ) | (148 | ) | ||||
Total common equity Tier 1 capital before threshold deductions | 31,850 | 31,697 | ||||||
Total threshold deductions | (448 | ) | (1,135 | ) | ||||
Common equity Tier 1 capital | 31,402 | 30,562 | ||||||
Additional Tier 1 capital | ||||||||
Preferred stock plus related surplus | 3,450 | 3,450 | ||||||
Trust preferred capital securities | 50 | |||||||
Noncontrolling interests (d) | 604 | 45 | ||||||
Other adjustments/(deductions) | (91 | ) | (107 | ) | ||||
Tier 1 capital | 35,415 | 33,950 | ||||||
Additional Tier 2 capital | ||||||||
Qualifying subordinated debt | 4,709 | 4,298 | ||||||
Trust preferred capital securities | 149 | |||||||
Allowance for loan and lease losses included in Tier 2 capital | 3,502 | 356 | ||||||
Other | 6 | 10 | ||||||
Total Basel III capital | $ | 43,781 | $ | 38,614 | ||||
Risk-weighted assets | ||||||||
Basel III standardized approach risk-weighted assets (e) | $ | 295,384 | $ | 303,343 | ||||
Estimated Basel III advanced approaches risk-weighted assets (f) | N/A | 284,215 | ||||||
Average quarterly adjusted total assets | 348,477 | 347,541 | ||||||
Supplementary leverage exposure (g) | 411,182 | 410,369 | ||||||
Basel III risk-based capital and leverage ratios | ||||||||
Common equity Tier 1 | 10.6 | % | 10.1 | %(h)(j) | ||||
Tier 1 | 12.0 | 11.2 | (h)(k) | |||||
Total | 14.8 | 13.6 | (i)(l) | |||||
Leverage (m) | 10.2 | 9.8 | ||||||
Supplementary leverage ratio (n) | 8.6 | 8.3 | ||||||
| (a) | Calculated using the regulatory capital methodology applicable to PNC during 2015. |
| (b) | PNC utilizes the pro forma fully phased-in Basel III capital ratios to assess its capital position (without the benefit of phase-ins), including comparison to similar estimates made by other financial institutions. Pro forma fully phased-in capital amounts, ratios and risk-weighted and leverage-related assets are estimated. |
| (c) | Basel III capital ratios and estimates may be impacted by additional regulatory guidance or analysis and, in the case of those ratios calculated using the advanced approaches, the ongoing evolution, validation and regulatory approval of PNC's models integral to the calculation of advanced approaches risk-weighted assets. |
| (d) | Primarily includes REIT Preferred Securities. |
| (e) | Includes credit and market risk-weighted assets. |
| (f) | Includes credit, market and operational risk-weighted assets. |
| (g) | Supplementary leverage exposure is the sum of Adjusted average assets and certain off-balance sheet exposures including undrawn credit commitments and derivative potential future exposures. |
| (h) | Pro forma fully phased-in Basel III capital ratio based on estimated Basel III standardized approach risk-weighted assets and rules. |
| (i) | Pro forma fully phased-in Basel III capital ratio based on estimated Basel III advanced approaches risk-weighted assets and rules. |
| (j) | For comparative purposes only, the pro forma fully phased-in advanced approaches Basel III Common equity Tier 1 capital ratio estimate is 10.8%. This capital ratio is calculated using pro forma fully phased-in Common equity Tier 1 capital and dividing by estimated Basel III advanced approaches risk-weighted assets. |
| (k) | For comparative purposes only, the pro forma fully phased-in advanced approaches Basel III Tier 1 risk-based capital ratio estimate is 12.0%. This capital ratio is calculated using fully phased-in Tier 1 capital and dividing by estimated Basel III advanced approaches risk-weighted assets. |
| (l) | For comparative purposes only, the pro forma fully phased-in standardized approach Basel III Total capital risk-based capital ratio estimate is 13.8%. This ratio is calculated using fully phased-in additional Tier 2 capital which, under the standardized approach, reflects allowance for loan and lease losses of up to 1.25% of credit risk related risk-weighted assets and dividing by estimated Basel III standardized approach risk-weighted assets. |
| (m) | Leverage ratio is calculated based on Tier 1 capital divided by Average quarterly adjusted total assets. |
| (n) | Supplementary leverage ratio is calculated based on Tier 1 capital divided by Supplementary leverage exposure. As advanced approaches banking organizations, PNC and PNC Bank will be subject to a 3% minimum supplementary leverage ratio effective January 1, 2018. |
The PNC Financial Services Group, Inc. – Form 10-Q 19
The Basel II framework, which was adopted by the Basel Committee on Banking Supervision in 2004, seeks to provide more risk-sensitive regulatory capital calculations and promote enhanced risk management practices among large, internationally active banking organizations. The U.S. banking agencies initially adopted rules to implement the Basel II capital framework in 2004. In July 2013, the U.S. banking agencies adopted final rules (referred to as the advanced approaches) that modified the Basel II framework effective January 1, 2014. See the Supervision and Regulation section in Item 1 Business and Item 1A Risk Factors of our 2014 Form 10-K for additional information. Prior to fully implementing the advanced approaches to calculate risk-weighted assets, PNC and PNC Bank must successfully complete a "parallel run" qualification phase. Both PNC and PNC Bank entered this parallel run phase on January 1, 2013. Although the minimum parallel run qualification period is four quarters, the parallel run period for PNC and PNC Bank, now in its third year, is consistent with the experience of other U.S. advanced approaches banks that have all had multi-year parallel run periods. After PNC exits parallel run, its regulatory risk-based capital ratio for each measure ( e.g. , Common equity Tier 1 capital ratio) will be the lower of the ratios as calculated under the standardized approach and the advanced approaches.
As a result of the staggered effective dates of the final U.S. Basel III regulatory capital rules (Basel III rules), as well as the fact that PNC remains in the parallel run qualification phase for the advanced approaches, PNC's regulatory risk-based ratios in 2015 are calculated using the standardized approach, effective January 1, 2015, for determining risk-weighted assets, and the definitions of, and deductions from, regulatory capital under the Basel III rules (as such definitions and deductions are phased-in for 2015). We refer to the capital ratios calculated using the phased-in Basel III provisions in effect for 2015 and, for the risk-based ratios, standardized approach risk-weighted assets as the 2015 Transitional Basel III ratios. Under the standardized approach for determining credit risk-weighted assets, exposures are generally assigned a pre-defined risk weight. Exposures to high volatility commercial real estate, past due exposures, equity exposures and securitization exposures are generally subject to higher risk weights than other types of exposures.
Under the Basel III rules adopted by the U.S. banking agencies, significant common stock investments in unconsolidated financial institutions, mortgage servicing rights and deferred tax assets must be deducted from capital (subject to a phase-in schedule) to the extent they individually exceed 10%, or in the aggregate exceed 15%, of the institution's adjusted common equity Tier 1 capital. Also, Basel III regulatory capital includes (subject to a phase-in schedule) accumulated other comprehensive income related to securities currently and previously held as available for sale, as well as pension and other postretirement plans.
Federal banking regulators have stated that they expect the largest U.S. bank holding companies, including PNC, to have a level of regulatory capital well in excess of the regulatory minimum and have required the largest U.S. bank holding companies, including PNC, to have a capital buffer sufficient to withstand losses and allow them to meet the credit needs of their customers through estimated stress scenarios. We seek to manage our capital consistent with these regulatory principles, and believe that our September 30, 2015 capital levels were aligned with them.
At September 30, 2015, PNC and PNC Bank, our sole bank subsidiary, were both considered "well capitalized," based on applicable U.S. regulatory capital ratio requirements. To qualify as "well capitalized" during 2015, PNC and PNC Bank must have Transitional Basel III capital ratios of at least 6.5% for Common equity Tier 1 capital, 8% for Tier 1 risk-based and 10% for Total risk-based, and PNC Bank is required to have a Transitional Basel III leverage ratio of at least 5%.
The access to and cost of funding for new business initiatives, the ability to undertake new business initiatives including acquisitions, the ability to engage in expanded business activities, the ability to pay dividends or repurchase shares or other capital instruments, the level of deposit insurance costs, and the level and nature of regulatory oversight depend, in large part, on a financial institution's capital strength.
We provide additional information regarding regulatory capital requirements and some of their potential impacts on PNC in the Supervision and Regulation section of Item 1 Business, Item 1A Risk Factors and Note 20 Regulatory Matters in the Notes To Consolidated Financial Statements in Item 8 of our 2014 Form 10-K.
20 The PNC Financial Services Group, Inc. – Form 10-Q
O FF -B ALANCE S HEET A RRANGEMENTS AND V ARIABLE I NTEREST E NTITIES
We engage in a variety of activities that involve unconsolidated entities or that are otherwise not reflected in our Consolidated Balance Sheet that are generally referred to as "off-balance sheet arrangements." Additional information on these types of activities is included in our 2014 Form 10-K and in the following sections of this Report:
| • | Commitments, including contractual obligations and other commitments, included within the Risk Management section of this Financial Review, |
| • | Note 2 Loan Sale and Servicing Activities and Variable Interest Entities in the Notes To Consolidated Financial Statements, |
| • | Note 9 Capital Securities of a Subsidiary Trust and Perpetual Trust Securities in the Notes To Consolidated Financial Statements, and |
| • | Note 16 Commitments and Guarantees in the Notes To Consolidated Financial Statements. |
PNC consolidates variable interest entities (VIEs) when we are deemed to be the primary beneficiary. The primary beneficiary of a VIE is determined to be the party that meets both of the following criteria: (i) has the power to make decisions that most significantly affect the economic performance of the VIE and (ii) has the obligation to absorb losses or the right to receive benefits that in either case could potentially be significant to the VIE.
A summary of VIEs, including those that we have consolidated and those in which we hold variable interests but have not consolidated into our financial statements, as of September 30, 2015 and December 31, 2014 is included in Note 2 of this Report.
Trust Preferred Securities
We are subject to certain restrictions, including restrictions on dividend payments, in connection with $206 million in principal amount of an outstanding junior subordinated debenture associated with $200 million of trust preferred securities that were issued by PNC Capital Trust C, a subsidiary statutory trust (both amounts as of September 30, 2015). Generally, if there is (i) an event of default under the debenture, (ii) PNC elects to defer interest on the debenture, (iii) PNC exercises its right to defer payments on the related trust preferred security issued by the statutory trust or (iv) there is a default under PNC's guarantee of such payment obligations, as specified in the applicable governing documents, then PNC would be subject during the period of such default or deferral to restrictions on dividends and other provisions protecting the status of the debenture holders similar to or in some ways more restrictive than those potentially imposed under the Exchange Agreement with PNC Preferred Funding Trust II. See Note 12 Capital Securities of Subsidiary Trusts and Perpetual Trust Securities in the Notes To Consolidated Financial Statements in Item 8 of our 2014 Form 10-K for information on contractual limitations on dividend payments resulting from securities issued by PNC Preferred Funding Trust I and PNC Preferred Funding Trust II.
The PNC Financial Services Group, Inc. – Form 10-Q 21
F AIR V ALUE M EASUREMENTS
In addition to the following, see Note 7 Fair Value in the Notes To Consolidated Financial Statements in Part I, Item 1 of this Report for further information regarding fair value.
The following table summarizes the assets and liabilities measured at fair value on a recurring basis at September 30, 2015 and December 31, 2014, respectively, and the portions of such assets and liabilities that are classified within Level 3 of the valuation hierarchy. Level 3 assets and liabilities are those where the fair value is estimated using significant unobservable inputs.
Table 21: Fair Value Measurements – Summary
| September 30, 2015 | December 31, 2014 | |||||||||||||||
| Dollars in millions | Total Fair Value | Level 3 | Total Fair Value | Level 3 | ||||||||||||
Total assets | $ | 68,612 | $ | 9,384 | $ | 58,973 | $ | 10,257 | ||||||||
Total assets at fair value as a percentage of consolidated assets | 19 | % | 17 | % | ||||||||||||
Level 3 assets as a percentage of total assets at fair value | 14 | % | 17 | % | ||||||||||||
Level 3 assets as a percentage of consolidated assets | 3 | % | 3 | % | ||||||||||||
Total liabilities | $ | 5,783 | $ | 515 | $ | 5,799 | $ | 716 | ||||||||
Total liabilities at fair value as a percentage of consolidated liabilities | 2 | % | 2 | % | ||||||||||||
Level 3 liabilities as a percentage of total liabilities at fair value | 9 | % | 12 | % | ||||||||||||
Level 3 liabilities as a percentage of consolidated liabilities | <1 | % | <1 | % | ||||||||||||
The majority of assets recorded at fair value are included in the securities available for sale portfolio. The majority of Level 3 assets represent non-agency residential mortgage-backed securities in the securities available for sale portfolio, equity investments and mortgage servicing rights.
An instrument's categorization within the hierarchy is based on the lowest level of input that is significant to the fair value measurement. Changes from one quarter to the next related to the observability of inputs to a fair value measurement may result in a reclassification (transfer) of assets or liabilities between hierarchy levels. PNC's policy is to recognize transfers in and transfers out as of the end of the reporting period. For additional information regarding the transfers of assets or liabilities between hierarchy levels, see Note 7 Fair Value in the Notes To Consolidated Financial Statements in Part I, Item 1 of this Report.
B USINESS S EGMENTS R EVIEW
We have six reportable business segments:
| • | Retail Banking |
| • | Corporate & Institutional Banking |
| • | Asset Management Group |
| • | Residential Mortgage Banking |
| • | BlackRock |
| • | Non-Strategic Assets Portfolio |
Business segment results, including inter-segment revenues, and a description of each business are included in Note 17 Segment Reporting included in the Notes To Consolidated Financial Statements in Part I, Item 1 of this Report. Certain amounts included in this Financial Review differ from those amounts shown in Note 17 primarily due to the presentation in this Financial Review of business net interest revenue on a taxable-equivalent basis. Note 17 presents results of businesses for the first nine months and third quarter of 2015 and 2014.
Net interest income in business segment results reflects PNC's internal funds transfer pricing methodology. Assets receive a funding charge and liabilities and capital receive a funding credit based on a transfer pricing methodology that incorporates product repricing characteristics, tenor and other factors. In the first quarter of 2015, enhancements were made to PNC's funds transfer pricing methodology primarily for costs related to the new regulatory short-term liquidity standards. The enhancements incorporate an additional charge assigned to assets, including for unfunded loan commitments. Conversely, a higher transfer pricing credit has been assigned to those deposits that are accorded higher value under LCR rules for liquidity purposes. Please see the Supervision and Regulation section in Item 1 and the Liquidity Risk Management section in Item 7 of our 2014 Form 10-K for more information about the LCR. These adjustments apply to business segment results, primarily favorably impacting Retail Banking and adversely impacting Corporate & Institutional Banking, prospectively beginning with the first quarter of 2015. Prior periods have not been adjusted due to the impracticability of estimating the impact of the change for prior periods.
22 The PNC Financial Services Group, Inc. – Form 10-Q
Retail Banking
(Unaudited)
Table 22: Retail Banking Table
Nine months ended September 30 Dollars in millions, except as noted | 2015 | 2014 | ||||||
Income Statement | ||||||||
Net interest income | $ | 3,152 | $ | 2,938 | ||||
Noninterest income | ||||||||
Service charges on deposits | 459 | 461 | ||||||
Brokerage | 212 | 176 | ||||||
Consumer services | 747 | 714 | ||||||
Other | 234 | 240 | ||||||
Total noninterest income | 1,652 | 1,591 | ||||||
Total revenue | 4,804 | 4,529 | ||||||
Provision for credit losses | 151 | 223 | ||||||
Noninterest expense | 3,558 | 3,430 | ||||||
Pretax earnings | 1,095 | 876 | ||||||
Income taxes | 401 | 320 | ||||||
Earnings | $ | 694 | $ | 556 | ||||
Average Balance Sheet | ||||||||
Loans | ||||||||
Consumer | ||||||||
Home equity | $ | 27,810 | $ | 28,985 | ||||
Indirect auto | 9,318 | 9,093 | ||||||
Indirect other | 559 | 726 | ||||||
Education | 6,402 | 7,314 | ||||||
Credit cards | 4,476 | 4,327 | ||||||
Other | 2,383 | 2,200 | ||||||
Total consumer | 50,948 | 52,645 | ||||||
Commercial and commercial real estate | 10,580 | 10,924 | ||||||
Floor plan | 2,164 | 2,227 | ||||||
Residential mortgage | 704 | 618 | ||||||
Total loans | 64,396 | 66,414 | ||||||
Goodwill and other intangible assets | 5,975 | 6,043 | ||||||
Other assets | 3,059 | 2,807 | ||||||
Total assets | $ | 73,430 | $ | 75,264 | ||||
Deposits | ||||||||
Noninterest-bearing demand | $ | 23,353 | $ | 21,890 | ||||
Interest-bearing demand | 36,009 | 33,889 | ||||||
Money market | 54,775 | 49,945 | ||||||
Total transaction deposits | 114,137 | 105,724 | ||||||
Savings | 13,471 | 11,713 | ||||||
Certificates of deposit | 16,763 | 19,314 | ||||||
Total deposits | 144,371 | 136,751 | ||||||
Other liabilities | 612 | 440 | ||||||
Total liabilities | $ | 144,983 | $ | 137,191 | ||||
Performance Ratios | ||||||||
Return on average assets | 1.26 | % | .99 | % | ||||
Noninterest income to total revenue | 34 | 35 | ||||||
Efficiency | 74 | 76 | ||||||
Other Information (a) | ||||||||
Credit-related statistics : | ||||||||
Commercial nonperforming assets | $ | 116 | $ | 146 | ||||
Consumer nonperforming assets | 976 | 1,037 | ||||||
Total nonperforming assets (b) | $ | 1,092 | $ | 1,183 | ||||
Purchased impaired loans (c) | $ | 516 | $ | 600 | ||||
Commercial lending net (recoveries) charge-offs | $ | (5 | ) | $ | 33 | |||
Credit card lending net charge-offs | 104 | 109 | ||||||
Consumer lending (excluding credit card) net charge-offs | 152 | 212 | ||||||
Total net charge-offs | $ | 251 | $ | 354 | ||||
Commercial lending annualized net (recovery) charge-off ratio | (.06 | )% | .34 | % | ||||
Credit card lending annualized net charge-off ratio | 3.11 | % | 3.37 | % | ||||
Consumer lending (excluding credit card) annualized net charge-off ratio | .43 | % | .58 | % | ||||
Total annualized net charge-off ratio | .52 | % | .71 | % | ||||
| At September 30 | 2015 | 2014 | ||||||
Other Information (Continued) (a) | ||||||||
Home equity portfolio credit statistics : (d) | ||||||||
% of first lien positions at origination (e) | 56 | % | 53 | % | ||||
Weighted-average loan-to-value ratios (LTVs) (e) (f) | 74 | % | 78 | % | ||||
Weighted-average updated FICO scores (g) | 751 | 747 | ||||||
Annualized net charge-off ratio | .31 | % | .55 | % | ||||
Delinquency data – % of total loans: (h) | ||||||||
Loans 30 – 59 days past due | .20 | % | .19 | % | ||||
Loans 60 – 89 days past due | .09 | % | .07 | % | ||||
Accruing loans past due | .29 | % | .26 | % | ||||
Nonperforming loans | 3.09 | % | 3.04 | % | ||||
Other statistics : | ||||||||
ATMs | 8,996 | 8,178 | ||||||
Branches (i) | 2,645 | 2,691 | ||||||
Brokerage account client assets (in billions) (j) | $ | 42 | $ | 43 | ||||
Customer-related statistics (average) : | ||||||||
Non-teller deposit transactions (k) | 43 | % | 34 | % | ||||
Digital consumer customers (l) | 52 | % | 45 | % | ||||
| (a) | Presented as of September 30, except for net charge-offs, net charge-off ratios, which are for the nine months ended and customer-related statistics which are averages for the nine months ended. |
| (b) | Includes nonperforming loans of $1.0 billion at September 30, 2015 and $1.1 billion at September 30, 2014. |
| (c) | Recorded investment of purchased impaired loans related to acquisitions. |
| (d) | Lien position, LTV and FICO statistics are based upon customer balances. |
| (e) | Lien position and LTV calculations reflect management assumptions where data limitations exist. |
| (f) | LTV statistics are based upon current information. |
| (g) | Represents FICO scores that are updated at least quarterly. |
| (h) | Data based upon recorded investment. Past due amounts exclude purchased impaired loans, even if contractually past due, as we are currently accreting interest income over the expected life of the loans. |
| (i) | Excludes satellite offices ( e.g. , drive-ups, electronic branches and retirement centers) that provide limited products and/or services. |
| (j) | Amounts include cash and money market balances. |
| (k) | Percentage of total consumer and business banking deposit transactions processed at an ATM or through our mobile banking application. |
| (l) | Represents consumer checking relationships that process the majority of their transactions through non-teller channels. |
Retail Banking earned $694 million in the first nine months of 2015 compared with earnings of $556 million for the same period a year ago. The increase in earnings was driven by increased net interest income and noninterest income and lower provision for credit losses partially offset by higher noninterest expense. Noninterest income included lower gains on sales of Visa Class B common shares.
Retail Banking continues to enhance the customer experience with refinements to product offerings that drive product value for consumers and small businesses. We are focused on growing customer share of wallet through the sale of liquidity, banking, and investment products.
Retail Banking continued to focus on the strategic priority of transforming the customer experience through transaction migration, branch network transformation and multi-channel sales strategies.
| • | In the first nine months of 2015, approximately 52% of consumer customers used non-teller channels for the majority of their transactions compared with 45% for the same period in 2014. |
| • | Deposit transactions via ATM and mobile channels increased to 43% of total deposit transactions in the first nine months of 2015 compared with 34% for the same period a year ago. |
The PNC Financial Services Group, Inc. – Form 10-Q 23
| • | Integral to PNC's retail branch transformation strategy, more than 300 branches operate under the universal model designed to enhance sales opportunities for branch personnel, in part, by driving higher ATM and mobile deposits. During the first nine months of 2015, the total branch network was reduced by 52 branches and the ATM network was increased by 391 ATMs. PNC had a network of 2,645 branches and 8,996 ATMs at September 30, 2015. |
| • | Instant debit card issuance, which enables us to print a customer's debit card in a matter of minutes, is now available in more than 500 branches, approximately 20% of the branch network. |
| • | At the end of third quarter, Apple iPad™ technology was available in the majority of our branches to demonstrate product capabilities to customers and prospects. The remainder of the branch network will have this technology by year-end. |
Total revenue for the first nine months of 2015 increased $275 million compared to the same period a year ago, which included a $214 million increase in net interest income primarily from the enhancements to internal funds transfer pricing methodology in the first quarter of 2015.
Noninterest income increased $61 million compared to the first nine months of 2014. Noninterest income included gains on sales of Visa Class B common shares of $122 million on 1.5 million shares and $173 million on three million shares, in the first nine months of 2015 and 2014, respectively. Excluding these gains, noninterest income increased $112 million, or 8%, in the comparison. Execution on our share of wallet strategy resulted in increased fee income from payment-related products, specifically in debit, credit and merchant services, as well as increased brokerage fees.
Provision for credit losses and net charge-offs in the first nine months of 2015 declined by $72 million and $103 million, respectively, in the comparison to the same period a year ago due to improved credit quality.
Noninterest expense increased $128 million in the first nine months of 2015 compared to the same period in 2014. Increases in technology investments, sales-related and other compensation, marketing, and customer transaction-related costs were offset by reduced third party service expense and lower branch network expenses as a result of transaction migration to lower cost digital and ATM channels.
Growing core checking deposits is key to Retail Banking's growth and to providing a source of low-cost funding and liquidity to PNC. The deposit product strategy of Retail Banking is to remain disciplined on pricing, target specific products and markets for growth, and focus on the retention and growth of customer balances. In the first nine months of 2015, average total deposits increased $7.6 billion, or 6%, compared with the same period in 2014.
| • | Organic deposit growth drove the increases in average transaction deposits and savings deposits, |
which increased $8.4 billion and $1.8 billion, or 8% and 15%, respectively, in the comparison. Transaction deposits include demand and money market deposits, which increased $3.6 billion and $4.8 billion, respectively. |
| • | The expected run-off of maturing certificates of deposit partially offset these increases, reflecting a decline of $2.6 billion, or 13%, in the comparison. |
Retail Banking continued to focus on a relationship-based lending strategy that targets specific products and markets for growth. In the first nine months of 2015, average total loans declined $2.0 billion, or 3%, compared to the same period a year ago, driven by a decline in home equity loans and declines from run-off of non-strategic portions of the portfolios, as more fully described below.
| • | Average home equity loans decreased $1.2 billion, or 4%, compared to the first nine months of 2014. The overall portfolio decline resulted from pay-downs and payoffs on loans exceeding new booked volume, consistent with lower mortgage demand. Retail Banking's home equity loan portfolio is relationship based, with 97% of the portfolio attributable to borrowers in our primary geographic footprint. |
| • | Average commercial & commercial real estate loans declined $344 million, or 3%, as pay-downs and payoffs on loans exceeded new volume. |
| • | Average auto dealer floor plan loans declined $63 million, or 3%, in the first nine months of 2015 compared to the same period in 2014, primarily resulting from lower dealer line utilization. |
| • | Average indirect auto loans increased $225 million, or 2%, compared to the first nine months of 2014. The increase was primarily due to portfolio growth in previously underpenetrated markets. |
| • | Average credit card balances increased $149 million, or 3%, over the same period in 2014 as a result of efforts to increase credit card share of wallet through organic growth. |
| • | Average residential mortgage balances increased $86 million, or 14%, compared to the first nine months of 2014. The increase was due to the transfer of $198 million in Community Reinvestment Act (CRA) mortgage loans from the Residential Mortgage Banking business segment in January 2015. |
| • | In the first nine months of 2015, average loan balances for the remainder of the portfolio declined a net $896 million, compared to the same period a year ago, driven by declines in the education and indirect other portfolios of $912 million and $167 million, respectively, as the discontinued government guaranteed education loan and indirect other balances are primarily run-off portfolios. |
Nonperforming assets declined $91 million, or 8%, at September 30, 2015 compared to September 30, 2014. The decrease was driven by declines in both consumer and commercial non-performing loans.
24 The PNC Financial Services Group, Inc. – Form 10-Q
Corporate & Institutional Banking
(Unaudited)
Table 23: Corporate & Institutional Banking Table
Nine months ended September 30 Dollars in millions, except as noted | 2015 | 2014 | ||||||
Income Statement | ||||||||
Net interest income | $ | 2,613 | $ | 2,777 | ||||
Noninterest income | ||||||||
Corporate service fees | 1,007 | 926 | ||||||
Other | 390 | 329 | ||||||
Noninterest income | 1,397 | 1,255 | ||||||
Total revenue | 4,010 | 4,032 | ||||||
Provision for credit losses | 83 | 86 | ||||||
Noninterest expense | 1,594 | 1,520 | ||||||
Pretax earnings | 2,333 | 2,426 | ||||||
Income taxes | 841 | 884 | ||||||
Earnings | $ | 1,492 | $ | 1,542 | ||||
Average Balance Sheet | ||||||||
Loans | ||||||||
Commercial | $ | 85,304 | $ | 77,550 | ||||
Commercial real estate | 22,536 | 20,927 | ||||||
Equipment lease financing | 6,965 | 6,863 | ||||||
Total commercial lending | 114,805 | 105,340 | ||||||
Consumer | 971 | 1,116 | ||||||
Total loans | 115,776 | 106,456 | ||||||
Goodwill and other intangible assets | 3,850 | 3,812 | ||||||
Loans held for sale | 973 | 973 | ||||||
Other assets | 11,079 | 9,991 | ||||||
Total assets | $ | 131,678 | $ | 121,232 | ||||
Deposits | ||||||||
Noninterest-bearing demand | $ | 48,168 | $ | 43,348 | ||||
Money market | 22,319 | 20,930 | ||||||
Other | 9,776 | 7,646 | ||||||
Total deposits | 80,263 | 71,924 | ||||||
Other liabilities | 7,893 | 7,454 | ||||||
Total liabilities | $ | 88,156 | $ | 79,378 | ||||
Performance Ratios | ||||||||
Return on average assets | 1.51 | % | 1.70 | % | ||||
Noninterest income to total revenue | 35 | 31 | ||||||
Efficiency | 40 | 38 | ||||||
Commercial Loan Servicing Portfolio – Serviced For PNC and Others (in billions) | ||||||||
Beginning of period | $ | 377 | $ | 347 | ||||
Acquisitions/additions | 125 | 64 | ||||||
Repayments/transfers | (61 | ) | (48 | ) | ||||
End of period | $ | 441 | $ | 363 | ||||
Other Information | ||||||||
Consolidated revenue from: (a) | ||||||||
Treasury Management (b) | $ | 999 | $ | 950 | ||||
Capital Markets (b) | $ | 592 | $ | 547 | ||||
Commercial mortgage banking activities | ||||||||
Commercial mortgage loans held for sale (c) | $ | 94 | $ | 84 | ||||
Commercial mortgage loan servicing income (d) | 191 | 164 | ||||||
Commercial mortgage servicing rights valuation, net of economic hedge (e) | 25 | 33 | ||||||
Total | $ | 310 | $ | 281 | ||||
Average Loans (by C&IB business) | ||||||||
Corporate Banking | $ | 58,108 | $ | 53,530 | ||||
Real Estate | 30,621 | 27,260 | ||||||
Business Credit | 14,503 | 13,074 | ||||||
Equipment Finance | 10,956 | 10,362 | ||||||
Other | 1,588 | 2,230 | ||||||
Total average loans | $ | 115,776 | $ | 106,456 | ||||
Total loans (f) | $ | 116,238 | $ | 109,792 | ||||
Net carrying amount of commercial mortgage servicing rights (f) | $ | 505 | $ | 532 | ||||
Credit-related statistics: | ||||||||
Nonperforming assets (f) (g) | $ | 484 | $ | 616 | ||||
Purchased impaired loans (f) (h) | $ | 153 | $ | 316 | ||||
Net charge-offs (recoveries) | $ | 6 | $ | 10 | ||||
| (a) | Represents consolidated PNC amounts. See the additional revenue discussion regarding treasury management, capital markets-related products and services, and commercial mortgage banking activities in the Product Revenue section of the Corporate & Institutional Banking portion of this Business Segments Review section. |
| (b) | Includes amounts reported in net interest income, corporate service fees and other noninterest income. |
| (c) | Includes other noninterest income for valuations on commercial mortgage loans held for sale and related commitments, derivative valuations, origination fees, gains on sale of loans held for sale and net interest income on loans held for sale. |
| (d) | Includes net interest income and noninterest income, primarily in corporate services fees, from loan servicing and ancillary services, net of changes in fair value on commercial mortgage servicing rights due to time and payoffs. Commercial mortgage servicing rights valuation, net of economic hedge is shown separately. |
| (e) | Includes amounts reported in corporate services fees. |
| (f) | As of September 30. |
| (g) | Includes nonperforming loans of $.4 billion at September 30, 2015 and $.5 billion at September 30, 2014. |
| (h) | Recorded investment of purchased impaired loans related to acquisitions. |
Corporate & Institutional Banking earned $1.5 billion in the first nine months of 2015, a decrease of $50 million compared to the same period a year ago. The slight decrease in earnings was due to lower net interest income and an increase in noninterest expense, largely offset by higher noninterest income. We continue to focus on building client relationships where the risk-return profile is attractive, including the Southeast.
Net interest income decreased $164 million in the first nine months of 2015 compared to the first nine months of 2014. The decline was due to the impact of first quarter 2015 enhancements to internal funds transfer pricing methodology, continued spread compression on loans and deposits, and lower purchase accounting accretion, partially offset by the impact of higher average loans and deposits. Decreased net interest income in the comparison also reflected the impact from the second quarter 2014 correction to reclassify certain commercial facility usage fees from net interest income to corporate service fees.
Corporate service fees increased $81 million in the first nine months of 2015 compared to the first nine months of 2014. This increase was primarily due to the impact of the second quarter 2014 correction to reclassify certain commercial facility fees from net interest income to corporate service fees and increases in treasury management and equity capital markets advisory fees, partially offset by lower merger and acquisition advisory fees.
Other noninterest income increased $61 million in the first nine months of 2015 compared to the first nine months of 2014. This increase was driven by higher revenue associated with credit valuations for customer-related derivatives activities and related derivatives sales, higher multifamily loans originated for sale to agencies and higher corporate securities underwriting activity.
Noninterest expense increased $74 million in the first nine months of 2015 compared to the prior year period, primarily driven by investments in technology and treasury management operations, higher asset writedowns, and expenses related to equity capital markets advisory fees.
The PNC Financial Services Group, Inc. – Form 10-Q 25
Average loans increased $9.3 billion, or 9%, for the first nine months of 2015 compared to the first nine months of 2014, reflecting solid growth in Corporate Banking, Real Estate, Business Credit and Equipment Finance:
| • | Corporate Banking business provides lending, treasury management and capital markets-related products and services to midsized and large corporations, government and not-for-profit entities. Average loans for this business increased $4.6 billion, or 9%, in the first nine months of 2015 compared with the first nine months of 2014, primarily due to an increase in loan commitments from specialty lending businesses and large corporate clients. |
| • | PNC Real Estate provides banking, financing and servicing solutions for commercial real estate clients across the country. Average loans for this business increased $3.4 billion, or 12%, in first nine months of 2015 compared with the first nine months of 2014 due to increased originations and higher utilization. |
| • | PNC Business Credit provides asset-based lending. The loan portfolio is relatively high yielding, with acceptable risk as the loans are mainly secured by short-term assets. Average loans for this business increased $1.4 billion, or 11%, in first nine months of 2015 compared with the first nine months of 2014 due to new originations, increasing deal sizes and higher utilization. |
| • | PNC Equipment Finance provides equipment financing solutions for clients throughout the U.S. and Canada. Average equipment finance loans and operating leases were $11.8 billion in the first nine months of 2015, an increase of $.7 billion, or 6% compared with the first nine months of 2014. |
Period-end loan balances increased 6%, or $6.4 billion at September 30, 2015 compared to September 30, 2014, primarily due to growth in our Corporate Banking, Real Estate and Business Credit businesses.
Average deposits for the first nine months of 2015 increased $8.3 billion, or 12%, compared with the first nine months of 2014 as a result of business growth and inflows into demand, money market and certificates of deposit products.
The commercial loan servicing portfolio increased $78 billion, or 21% at September 30, 2015, compared to September 30, 2014, as servicing additions from new and existing customers exceeded portfolio run-off.
Nonperforming assets declined 21% at September 30, 2015 compared to September 30, 2014 reflecting improved credit quality.
Product Revenue
In addition to credit and deposit products for commercial customers, Corporate & Institutional Banking offers other services, including treasury management, capital markets-related products and services, and commercial mortgage banking activities, for customers of all business segments. On a consolidated basis, the revenue from these other services is included in net interest income, corporate service fees and other noninterest income. From a segment perspective, the majority of the revenue and expense related to these services is reflected in the Corporate & Institutional Banking segment results and the remainder is reflected in the results of other businesses. The Other Information section in Table 23 in the Corporate & Institutional Banking portion of this Business Segments Review section includes the consolidated revenue to PNC for these services. A discussion of the consolidated revenue from these services follows.
Treasury management revenue, comprised of fees and net interest income from customer deposit balances, increased $49 million in the comparison of the first nine months of 2015 to the first nine months of 2014, driven by growth in our commercial card, wholesale lockbox, PINACLE ® and liquidity-related revenue.
Capital markets revenue includes merger and acquisition advisory fees, loan syndications, derivatives, foreign exchange, asset-backed finance revenue and fixed income and equity capital markets advisory activities. Revenue from capital markets-related products and services increased $45 million in the first nine months of 2015 compared with the first nine months of 2014. The increase in the comparison was primarily driven by higher revenue associated with credit valuations for customer-related derivatives activities and related derivatives sales, higher equity capital markets advisory fees and increased corporate securities underwriting activity, partially offset by lower merger and acquisition advisory fees.
Commercial mortgage banking activities include revenue derived from commercial mortgage servicing (including net interest income and noninterest income) and revenue derived from commercial mortgage loans held for sale and related hedges. Revenue from total commercial mortgage banking activities increased $29 million in the first nine months of 2015 compared with the first nine months of 2014. The increase in the comparison was mainly due to higher mortgage servicing revenue and higher multifamily loans originated for sale to agencies.
26 The PNC Financial Services Group, Inc. – Form 10-Q
Asset Management Group
(Unaudited)
Table 24: Asset Management Group Table
Nine months ended September 30 Dollars in millions, except as noted | 2015 | 2014 | ||||||
Income Statement | ||||||||
Net interest income | $ | 215 | $ | 215 | ||||
Noninterest income | 658 | 611 | ||||||
Total revenue | 873 | 826 | ||||||
Provision for credit losses | 11 | 2 | ||||||
Noninterest expense | 636 | 610 | ||||||
Pretax earnings | 226 | 214 | ||||||
Income taxes | 83 | 78 | ||||||
Earnings | $ | 143 | $ | 136 | ||||
Average Balance Sheet | ||||||||
Loans | ||||||||
Consumer | $ | 5,656 | $ | 5,407 | ||||
Commercial and commercial real estate | 901 | 997 | ||||||
Residential mortgage | 899 | 794 | ||||||
Total loans | 7,456 | 7,198 | ||||||
Goodwill and other intangible assets | 230 | 264 | ||||||
Other assets | 236 | 225 | ||||||
Total assets | $ | 7,922 | $ | 7,687 | ||||
Deposits | ||||||||
Noninterest-bearing demand | $ | 1,207 | $ | 1,342 | ||||
Interest-bearing demand | 4,126 | 3,887 | ||||||
Money market | 5,072 | 3,918 | ||||||
Total transaction deposits | 10,405 | 9,147 | ||||||
CDs/IRAs/savings deposits | 472 | 448 | ||||||
Total deposits | 10,877 | 9,595 | ||||||
Other liabilities | 43 | 51 | ||||||
Total liabilities | $ | 10,920 | $ | 9,646 | ||||
Performance Ratios | ||||||||
Return on average assets | 2.41 | % | 2.37 | % | ||||
Noninterest income to total revenue | 75 | 74 | ||||||
Efficiency | 73 | 74 | ||||||
Other Information | ||||||||
Total nonperforming assets (a) (b) | $ | 52 | $ | 73 | ||||
Purchased impaired loans (a) (c) | $ | 75 | $ | 89 | ||||
Total net charge-offs | $ | 14 | $ | 3 | ||||
Client Assets Under Administration (a) (d) | ||||||||
Personal | $ | 110 | $ | 113 | ||||
Institutional | 146 | 146 | ||||||
Total | $ | 256 | $ | 259 | ||||
Asset Type | ||||||||
Equity | $ | 142 | $ | 147 | ||||
Fixed Income | 73 | 72 | ||||||
Liquidity/Other | 41 | 40 | ||||||
Total | $ | 256 | $ | 259 | ||||
Discretionary client assets under management | ||||||||
Personal | $ | 84 | $ | 85 | ||||
Institutional | 48 | 47 | ||||||
Total | $ | 132 | $ | 132 | ||||
Asset Type | ||||||||
Equity | $ | 70 | $ | 72 | ||||
Fixed Income | 40 | 40 | ||||||
Liquidity/Other | 22 | 20 | ||||||
Total | $ | 132 | $ | 132 | ||||
Nondiscretionary client assets under administration | ||||||||
Personal | $ | 26 | $ | 28 | ||||
Institutional | 98 | 99 | ||||||
Total | $ | 124 | $ | 127 | ||||
Asset Type | ||||||||
Equity | $ | 72 | $ | 75 | ||||
Fixed Income | 33 | 32 | ||||||
Liquidity/Other | 19 | 20 | ||||||
Total | $ | 124 | $ | 127 | ||||
| (a) | As of September 30. |
| (b) | Includes nonperforming loans of $48 million at September 30, 2015 and $67 million at September 30, 2014. |
| (c) | Recorded investment of purchased impaired loans related to acquisitions. |
| (d) | Excludes brokerage account client assets. |
Asset Management Group earned $143 million through the first nine months of 2015 compared with $136 million in the same period of 2014, driven by higher noninterest income, including a $30 million trust settlement in the second quarter of 2015, partially offset by higher noninterest expense. Assets under administration were $256 billion as of September 30, 2015 compared to $259 billion as of September 30, 2014, as nondiscretionary client assets under administration declined slightly and discretionary client assets under administration remained flat in the comparison.
The core growth strategies of the business include increasing sales sourced from other PNC lines of business, maximizing front line productivity and optimizing market presence in high opportunity markets. Wealth Management and Hawthorn have over 100 offices operating in 7 out of the 10 most affluent states in the U.S. with a majority co-located with retail banking branches. The businesses' strategies primarily focus on growing client assets under management through expanding relationships directly and through cross-selling from PNC's other lines of business.
Institutional Asset Management provides advisory, custody, and retirement administration services to institutional clients primarily within our banking footprint. The business also offers PNC proprietary mutual funds. Institutional Asset Management is strengthening its partnership with Corporate and Institutional Banking to drive growth and is focused on building retirement capabilities and expanding product solutions for all customers.
Discretionary client assets under management remained flat at September 30, 2015 compared to September 30, 2014, as lower equity markets were offset by new sales and positive net flows after adjustments for cyclical client activities.
Total revenue increased $47 million, or 6%, in the first nine months of 2015 compared with the same period in 2014, primarily relating to higher noninterest income due to the trust settlement in the second quarter of 2015, net new business, and strong average equity markets.
Noninterest expense increased $26 million, or 4% in the first nine months of 2015 compared to the prior year period, primarily attributable to higher compensation and technology expenses. Asset Management Group remains focused on disciplined expense management as it invests in strategic growth opportunities.
Average loan balances for the first nine months of 2015 increased $.3 billion, or 4%, compared to the prior year period. Asset Management Group's clients' preference for liquidity in the form of a new line of credit product has driven significant growth in the loan portfolio. The line of credit product is primarily secured by the market value of the client's underlying investment management account assets.
The PNC Financial Services Group, Inc. – Form 10-Q 27
Average transaction deposits for the first nine months of 2015 increased $1.3 billion, or 14%, over the prior year period, driven by an increase in interest bearing demand deposit accounts and money market products.
Residential Mortgage Banking
(Unaudited)
Table 25: Residential Mortgage Banking Table
Nine months ended September 30 Dollars in millions, except as noted | 2015 | 2014 | ||||||
Income Statement | ||||||||
Net interest income | $ | 91 | $ | 115 | ||||
Noninterest income | ||||||||
Loan servicing revenue | ||||||||
Servicing fees | 143 | 170 | ||||||
Mortgage servicing rights valuation, net of economic hedge | 70 | 11 | ||||||
Loan sales revenue | 278 | 327 | ||||||
Other | (3 | ) | (5 | ) | ||||
Total noninterest income | 488 | 503 | ||||||
Total revenue | 579 | 618 | ||||||
Provision for credit losses (benefit) | 2 | (1 | ) | |||||
Noninterest expense | 510 | 550 | ||||||
Pretax earnings | 67 | 69 | ||||||
Income taxes | 24 | 25 | ||||||
Earnings | $ | 43 | $ | 44 | ||||
Average Balance Sheet | ||||||||
Portfolio loans | $ | 1,175 | $ | 1,759 | ||||
Loans held for sale | 1,160 | 1,130 | ||||||
Mortgage servicing rights (MSR) | 967 | 1,036 | ||||||
Other assets | 3,660 | 3,964 | ||||||
Total assets | $ | 6,962 | $ | 7,889 | ||||
Deposits | $ | 2,415 | $ | 2,279 | ||||
Borrowings and other liabilities | 2,241 | 2,819 | ||||||
Total liabilities | $ | 4,656 | $ | 5,098 | ||||
Performance Ratios | ||||||||
Return on average assets | .83 | % | .75 | % | ||||
Noninterest income to total revenue | 84 | 81 | ||||||
Efficiency | 88 | 89 | ||||||
Residential Mortgage Servicing Portfolio – Serviced for Third Parties (in billions) | ||||||||
Beginning of period | $ | 108 | $ | 114 | ||||
Acquisitions | 24 | 4 | ||||||
Additions | 6 | 7 | ||||||
Repayments/transfers | (16 | ) | (14 | ) | ||||
End of period | $ | 122 | $ | 111 | ||||
Servicing portfolio – third-party statistics: (a) | ||||||||
Fixed rate | 94 | % | 94 | % | ||||
Adjustable rate/balloon | 6 | % | 6 | % | ||||
Weighted-average interest rate | 4.29 | % | 4.49 | % | ||||
MSR asset value (in billions) | $ | 1.0 | $ | 1.0 | ||||
MSR capitalization value (in basis points) | 79 | 88 | ||||||
Weighted-average servicing fee (in basis points) | 27 | 27 | ||||||
Residential Mortgage Repurchase Reserve | ||||||||
Beginning of period | $ | 107 | $ | 131 | ||||
(Benefit)/ Provision | 4 | (4 | ) | |||||
Losses – loan repurchases | (16 | ) | (19 | ) | ||||
End of Period | $ | 95 | $ | 108 | ||||
Other Information | ||||||||
Loan origination volume (in billions) | $ | 8.2 | $ | 7.1 | ||||
Loan sale margin percentage | 3.43 | % | 4.57 | % | ||||
Percentage of originations represented by: | ||||||||
Purchase volume (b) | 46 | % | 47 | % | ||||
Refinance volume | 54 | % | 53 | % | ||||
Total nonperforming assets (a) (c) | $ | 88 | $ | 135 | ||||
| (a) | As of September 30. |
| (b) | Mortgages with borrowers as part of residential real estate purchase transactions. |
| (c) | Includes nonperforming loans of $53 million at September 30, 2015 and $93 million at September 30, 2014. |
Residential Mortgage Banking earned $43 million in the first nine months of 2015 compared to $44 million in the first nine months of 2014. Earnings decreased slightly from the prior year as higher net hedging gains on residential mortgage servicing rights and lower noninterest expense were more than offset by lower loan sales and servicing revenue and decreased net interest income.
The strategic focus of the business is the acquisition of new customers through a retail loan officer sales force with an emphasis on home purchase transactions. Our strategy involves competing on the basis of superior service to new and existing customers in serving their home purchase and refinancing needs. A key consideration in pursuing this approach is the cross-sell opportunity, especially in the bank footprint markets.
Residential Mortgage Banking overview:
| • | Total loan originations increased $1.1 billion in the first nine months of 2015 compared to the same 2014 period. Loans continue to be originated primarily through direct channels under Federal National Mortgage Association (FNMA), Federal Home Loan Mortgage Corporation (FHLMC) and Federal Housing Administration (FHA)/Department of Veterans Affairs agency guidelines. Refinancings were 54% of originations for the first nine months of 2015 and 53% in the first nine months of 2014. During the first nine months of 2015, 13% of loan originations were under the original or revised Home Affordable Refinance Program (HARP or HARP 2). |
| • | Residential mortgage loans serviced for others increased $11 billion at September 30, 2015 compared to September 30, 2014. During the first nine months of 2015, $24 billion of residential mortgage servicing rights were acquired, compared with $4 billion in the comparable period of 2014. |
| • | Noninterest income declined $15 million in the first nine months of 2015 compared with the prior year period, as increased net hedging gains on residential mortgage servicing rights were more than offset by decreased loan sales revenue and servicing revenue. |
| • | Net interest income decreased $24 million in the first nine months of 2015 compared with the first nine months of 2014. This decline was primarily due to lower balances of portfolio loans held for investment. |
| • | Noninterest expense declined $40 million in the first nine months of 2015 compared with the same 2014 period, primarily as a result of lower legal accruals. |
| • | Investors having purchased mortgage loans may request PNC to indemnify them against losses on certain loans or to repurchase loans that they believe do not comply with applicable contractual loan |
28 The PNC Financial Services Group, Inc. – Form 10-Q
origination covenants and representations and warranties we have made. At September 30, 2015, the liability for estimated losses on repurchase and indemnification claims for the Residential Mortgage Banking business segment was $95 million, compared with $108 million at September 30, 2014. See the Recourse and Repurchase Obligations section of this Financial Review and Note 16 Commitments and Guarantees in the Notes To Consolidated Financial Statements of this Report for additional information. |
BlackRock
(Unaudited)
Table 26: BlackRock Table
Information related to our equity investment in BlackRock follows:
Nine months ended September 30 Dollars in millions | 2015 | 2014 | ||||||
Business segment earnings (a) | $ | 407 | $ | 399 | ||||
PNC's economic interest in BlackRock (b) | 22 | % | 22 | % | ||||
| (a) | Includes PNC's share of BlackRock's reported GAAP earnings and additional income taxes on those earnings incurred by PNC. |
| (b) | At September 30. |
| In billions | September 30 2015 | December 31 2014 | ||||||
Carrying value of PNC's investment in BlackRock (c) | $ | 6.6 | $ | 6.3 | ||||
Market value of PNC's investment in BlackRock (d) | 10.5 | 12.6 | ||||||
| (c) | PNC accounts for its investment in BlackRock under the equity method of accounting, exclusive of a related deferred tax liability of $2.1 billion at both September 30, 2015 and December 31, 2014. Our voting interest in BlackRock common stock was approximately 21% at September 30, 2015. |
| (d) | Does not include liquidity discount. |
In addition to our investment in BlackRock reflected in Table 26, at September 30, 2015, we held approximately 1.3 million shares of BlackRock Series C Preferred Stock valued at $312 million, which are available to fund our obligation in connection with certain BlackRock long-term incentive plan (LTIP) programs. We account for the BlackRock Series C Preferred Stock at fair value, which offsets the impact of marking-to-market the obligation to deliver these shares to BlackRock. The fair value amount of the BlackRock Series C Preferred Stock is included on our Consolidated Balance Sheet in the caption Other assets. Additional information regarding the valuation of the BlackRock Series C Preferred Stock is included in Note 7 Fair Value in the Notes To Consolidated Financial Statements in Part I, Item 1 of this Report and in Note 7 Fair Value in the Notes To Consolidated Financial Statements in Item 8 of our 2014 Form 10-K.
Our 2014 Form 10-K includes additional information about our investment in BlackRock.
Non-Strategic Assets Portfolio
(Unaudited)
Table 27: Non-Strategic Assets Portfolio Table
Nine months ended September 30 Dollars in millions | 2015 | 2014 | ||||||
Income Statement | ||||||||
Net interest income | $ | 302 | $ | 425 | ||||
Noninterest income | 34 | 22 | ||||||
Total revenue | 336 | 447 | ||||||
Provision for credit losses (benefit) | (61 | ) | (99 | ) | ||||
Noninterest expense | 73 | 86 | ||||||
Pretax earnings | 324 | 460 | ||||||
Income taxes | 119 | 169 | ||||||
Earnings | $ | 205 | $ | 291 | ||||
Average Balance Sheet | ||||||||
Commercial Lending: | ||||||||
Commercial/Commercial real estate | $ | 114 | $ | 190 | ||||
Lease financing | 628 | 686 | ||||||
Total commercial lending | 742 | 876 | ||||||
Consumer Lending: | ||||||||
Home equity | 2,859 | 3,477 | ||||||
Residential real estate | 3,981 | 4,952 | ||||||
Total consumer lending | 6,840 | 8,429 | ||||||
Total portfolio loans | 7,582 | 9,305 | ||||||
Other assets (a) | (702 | ) | (742 | ) | ||||
Total assets | $ | 6,880 | $ | 8,563 | ||||
Deposits and other liabilities | $ | 221 | $ | 227 | ||||
Total liabilities | $ | 221 | $ | 227 | ||||
Performance Ratios | ||||||||
Return on average assets | 3.98 | % | 4.54 | % | ||||
Noninterest income to total revenue | 10 | 5 | ||||||
Efficiency | 22 | 19 | ||||||
Other Information | ||||||||
Nonperforming assets (b) (c) | $ | 571 | $ | 731 | ||||
Purchased impaired loans (b) (d) | $ | 3,411 | $ | 4,147 | ||||
Net (recoveries) charge-offs | $ | (8 | ) | $ | 35 | |||
Annualized net (recovery) charge-off ratio | (.14 | )% | .50 | % | ||||
Loans (b) | ||||||||
Commercial Lending | ||||||||
Commercial/Commercial real estate | $ | 98 | $ | 162 | ||||
Lease financing | 633 | 691 | ||||||
Total commercial lending | 731 | 853 | ||||||
Consumer Lending | ||||||||
Home equity | 2,586 | 3,242 | ||||||
Residential real estate | 3,625 | 4,665 | ||||||
Total consumer lending | 6,211 | 7,907 | ||||||
Total loans | $ | 6,942 | $ | 8,760 | ||||
| (a) | Other assets includes deferred taxes, ALLL and other real estate owned (OREO). Other assets were negative in both periods due to the ALLL. |
| (b) | As of September 30. |
| (c) | Includes nonperforming loans of $.5 billion at September 30, 2015 and $.6 billion at September 30, 2014. |
| (d) | Recorded investment of purchased impaired loans related to acquisitions. This segment contained 82% of PNC's purchased impaired loans at September 30, 2015 and 80% at September 30, 2014. |
This business segment consists of non-strategic assets primarily obtained through acquisitions of other companies. The business activity of this segment is to manage the wind-down of the portfolios while maximizing the value and mitigating risk.
The PNC Financial Services Group, Inc. – Form 10-Q 29
Non-Strategic Assets Portfolio had earnings of $205 million in the first nine months of 2015 compared with $291 million in the first nine months of 2014. Earnings decreased year-over-year due to lower net interest income and a reduced benefit from the provision for credit losses.
Non-Strategic Assets Portfolio overview:
| • | Net interest income declined $123 million, or 29% in the first nine months of 2015 compared with the first nine months of 2014, resulting from lower purchase accounting accretion and the impact of the declining average balance of the loan portfolio. |
| • | Noninterest income increased $12 million, or 55% in the first nine months of 2015 compared to the first nine months of the 2014 driven by valuation gains, lower provision for estimated losses on repurchase obligations and loan sale gains. |
| • | Provision for credit losses was a benefit in both the first nine months of 2015 and 2014, reflecting continued improvements in credit quality. |
| • | Noninterest expense declined $13 million, or 15% in the first nine months of 2015 compared with in the first nine months of 2014, due to lower costs of managing and servicing the loan portfolios. |
| • | Average portfolio loans declined $1.7 billion, or 19% in the first nine months of 2015 compared to the first nine months of 2014, due to customer payment activity and portfolio management activities to reduce under-performing assets. |
C RITICAL A CCOUNTING E STIMATES AND J UDGMENTS
Note 1 Accounting Policies in Item 8 of our 2014 Form 10-K and in the Notes To Consolidated Financial Statements included in Part I, Item 1 of this Report describe the most significant accounting policies that we use to prepare our consolidated financial statements. Certain of these policies require us to make estimates or economic assumptions that may prove inaccurate or be subject to variations that may significantly affect our reported results and financial position for the period or in future periods.
We must use estimates, assumptions and judgments when assets and liabilities are required to be recorded at, or adjusted to reflect, fair value.
Assets and liabilities carried at fair value inherently result in a higher degree of financial statement volatility. Fair values and the information used to record valuation adjustments for certain assets and liabilities are based on either quoted market prices or are provided by independent third-party sources, including appraisers and valuation specialists, when available. When such third-party information is not available, we estimate fair value primarily by using discounted cash flow and other financial modeling techniques. Changes in underlying factors, assumptions or estimates could materially impact our future financial condition and results of operations.
We discuss the following critical accounting policies and judgments under this same heading in Item 7 of our 2014 Form 10-K:
| • | Fair Value Measurements |
| • | Allowances for Loan and Lease Losses and Unfunded Loan Commitments and Letters of Credit |
| • | Estimated Cash Flows on Purchased Impaired Loans |
| • | Goodwill |
| • | Lease Residuals |
| • | Revenue Recognition |
| • | Residential and Commercial Mortgage Servicing Rights |
| • | Income Taxes |
| • | Recently Issued Accounting Standards |
We provide additional information about many of these items in the Notes To Consolidated Financial Statements included in Part I, Item l of this Report.
Recently Issued Accounting Standards
In May 2014, the Financial Accounting Standard Board ("FASB") issued ASU 2014-09, Revenue from Contracts with Customers (Topic 606). This ASU clarifies the principles for recognizing revenue and replaces nearly all existing revenue recognition guidance in U.S. GAAP with one accounting model. The core principle of the guidance is that an entity should recognize revenue to depict the satisfaction of a performance obligation by transfer of promised goods or services to customers. The ASU also requires additional qualitative and quantitative disclosures relating to the nature, amount, timing, and uncertainty of revenue and cash flows arising from contracts with customers. In August 2015, the FASB issued guidance deferring the mandatory effective date of the ASU for one year, to annual reporting periods beginning after December 15, 2017. The requirements within ASU 2014-09 should be applied retrospectively to each prior period presented (with several practical expedients for certain completed contracts) or retrospectively with the cumulative effect of initially applying ASU 2014-09 recognized at the date of initial application. We plan to adopt the ASU consistent with the deferred mandatory effective date and continue to evaluate the impact of this ASU on our results of operations and financial position.
In February 2015, the FASB issued ASU 2015-02, Consolidation (Topic 810): Amendments to the Consolidation Analysis . All legal entities are subject to re-evaluation under this ASU, including investment companies and certain other entities measured in a manner consistent with ASC 946 Financial Services – Investment Companies which were previously excluded. The ASU will change the analysis that a reporting entity must perform to determine whether it should consolidate certain types of legal entities. Specifically, the ASU modifies the evaluation of whether limited partnerships and similar legal entities are variable interest entities (VIEs) or voting interest entities; eliminates the presumption that a
30 The PNC Financial Services Group, Inc. – Form 10-Q
general partner should consolidate a limited partnership; potentially changes the consolidation conclusions of reporting entities that are involved with VIEs, in particular those that have fee arrangements and related party arrangements, and provides a scope exception for reporting entities with interests held in certain money market funds. The ASU is effective for public business entities for annual periods, and interim periods within those annual periods, beginning after December 15, 2015 and may be applied through a retrospective or modified retrospective approach. We do not expect this ASU to have a material effect on our results of operations and financial position.
Recently Adopted Accounting Standards
See Note 1 Accounting Policies in the Notes To Consolidated Financial Statements included in Part I, Item I of this Report regarding the impact of new accounting pronouncements adopted in 2015.
S TATUS OF Q UALIFIED D EFINED B ENEFIT P ENSION P LAN
We have a noncontributory, qualified defined benefit pension plan (plan or pension plan) covering eligible employees. Benefits are determined using a cash balance formula where earnings credits are applied as a percentage of eligible compensation. We calculate the expense associated with the pension plan and the assumptions and methods that we use include a policy of reflecting plan assets at their fair market value. On an annual basis, we review the actuarial assumptions related to the pension plan.
We currently estimate pretax pension expense of $9 million in 2015 compared with pretax income of $7 million in 2014. This year-over-year expected increase in expense reflects the effects of the lower expected return on asset assumption, improved mortality, and the lower discount rate required to be used in 2015. These factors are partially offset by the favorable impact of the increase in plan assets at December 31, 2014 and the assumed return on a $200 million voluntary contribution to the plan made in February 2015.
The table below reflects the estimated effects on pension expense of certain changes in annual assumptions, using 2015 estimated expense as a baseline.
Table 28: Pension Expense – Sensitivity Analysis
| Change in Assumption (a) | Estimated Pension Expense (In millions) | |||
.5% decrease in discount rate | $ | 18 | ||
.5% decrease in expected long-term return on assets | $ | 22 | ||
.5% increase in compensation rate | $ | 2 | ||
| (a) | The impact is the effect of changing the specified assumption while holding all other assumptions constant. |
We provide additional information on our pension plan in Note 13 Employee Benefit Plans in the Notes To Consolidated Financial Statements in Item 8 of our 2014 Form 10-K.
R ECOURSE AND R EPURCHASE O BLIGATIONS
As discussed in Note 2 Loan Sale and Servicing Activities and Variable Interest Entities in the Notes To Consolidated Financial Statements in our 2014 Form 10-K, PNC has sold commercial mortgage, residential mortgage and home equity loans/lines of credit directly or indirectly through securitization and loan sale transactions in which we have continuing involvement. One form of continuing involvement includes certain recourse and loan repurchase obligations associated with the transferred assets.
Commercial Mortgage Loan Recourse Obligations
We originate and service certain multi-family commercial mortgage loans which are sold to FNMA under FNMA's Delegated Underwriting and Servicing (DUS) program. We participated in a similar program with the FHLMC. Our exposure and activity associated with these recourse obligations are reported in the Corporate & Institutional Banking segment. For more information regarding our Commercial Mortgage Loan Recourse Obligations, see the Recourse and Repurchase Obligations section of Note 16 Commitments and Guarantees included in the Notes To Consolidated Financial Statements in Part I, Item 1 of this Report.
Residential Mortgage Repurchase Obligations
While residential mortgage loans are sold on a non-recourse basis, we assume certain loan repurchase obligations associated with mortgage loans we have sold to investors. These loan repurchase obligations primarily relate to situations where PNC is alleged to have breached certain origination covenants and representations and warranties made to purchasers of the loans in the respective purchase and sale agreements. Residential mortgage loans covered by these loan repurchase obligations include first and second-lien mortgage loans we have sold through Agency securitizations, Non-Agency securitizations, and loan sale transactions. As discussed in Note 2 Loan Sale and Servicing Activities and Variable Interest Entities in our 2014 Form 10-K, Agency securitizations consist of mortgage loan sale transactions with FNMA, FHLMC and the Government National Mortgage Association (GNMA), while Non-Agency securitizations consist of mortgage loan sale transactions with private investors. Mortgage loan sale transactions that are not part of a securitization may involve FNMA, FHLMC or private investors. Our historical exposure and activity associated with Agency securitization repurchase obligations has primarily been related to transactions with FNMA and FHLMC, as indemnification and repurchase losses associated with FHA
The PNC Financial Services Group, Inc. – Form 10-Q 31
and VA-insured and uninsured loans pooled in GNMA securitizations historically have been minimal. In addition to indemnification and repurchase risk, we face other risks of loss with respect to our participation in these programs, some of which are described in Note 21 Legal Proceedings in the Notes To Consolidated Financial Statements in our 2014 Form 10-K with respect to governmental inquiries related to FHA-insured loans. Repurchase obligation activity associated with residential mortgages is reported in the Residential Mortgage Banking segment.
Origination and sale of residential mortgages is an ongoing business activity and, accordingly, management continually assesses the need to recognize indemnification and repurchase liabilities pursuant to the associated investor sale agreements. We establish indemnification and repurchase liabilities for estimated losses on sold first and second-lien mortgages for which indemnification is expected to be provided or for loans that are expected to be repurchased. For the first and second-lien mortgage sold portfolio, we have established an indemnification and repurchase liability pursuant to investor sale agreements based on claims made and our estimate of future claims on a loan by loan basis. To estimate the mortgage repurchase liability arising from breaches of representations and warranties, we consider the following factors: (i) borrower performance in our historically sold portfolio (both actual and estimated future defaults); (ii) the level of outstanding unresolved repurchase claims; (iii) estimated probable future repurchase claims, considering information about expected investor behaviors, delinquent and liquidated loans, resolved and unresolved mortgage insurance rescission notices and our historical experience with claim rescissions; (iv) the potential ability to cure the defects identified in the repurchase claims ("rescission rate"); (v) the availability of legal defenses; and (vi) the estimated severity of loss upon repurchase of the loan or collateral, make-whole settlement or indemnification.
We previously reached agreements with both FNMA and FHLMC to resolve their repurchase claims with respect to loans sold between 2000 and 2008. Thus, our repurchase obligations involve Agency securitizations and other loan sales with FNMA and FHLMC subsequent to 2008 only, as well as Agency securitizations with GNMA and Non-Agency securitizations and other loan sales with private investors. The unpaid principal balance of loans associated with our exposure to repurchase obligations totaled $66.0 billion at September 30, 2015, of which $1.2 billion was 90 days or more delinquent. The comparative amounts were $68.3 billion and $1.5 billion, respectively, at December 31, 2014.
We believe our indemnification and repurchase liability appropriately reflects the estimated probable losses on indemnification and repurchase claims for all residential mortgage loans sold and outstanding as of September 30, 2015 and December 31, 2014. In making these estimates we consider the losses that we expect to incur over the life of the
sold loans. See Note 16 Commitments and Guarantees in this Report for additional information on residential mortgage repurchase obligations.
Home Equity Repurchase Obligations
PNC's repurchase obligations include obligations with respect to certain brokered home equity loans/lines of credit that were sold to a limited number of private investors in the financial services industry by National City prior to our acquisition of National City. PNC is no longer engaged in the brokered home equity lending business, and our exposure under these loan repurchase obligations is limited to repurchases of the loans sold in these transactions. Repurchase activity associated with brokered home equity loans/lines of credit is reported in the Non-Strategic Assets Portfolio segment.
For more information regarding our Home Equity Repurchase Obligations, see the Recourse and Repurchase Obligations section under Item 7 of our 2014 Form 10-K and Note 16 Commitments and Guarantees included in this Report.
R ISK M ANAGEMENT
PNC encounters risk as part of the normal course of operating our business. Accordingly, we design risk management processes to help manage these risks.
The Risk Management section included in Item 7 of our 2014 Form 10-K describes our enterprise risk management framework including risk appetite and strategy, risk culture, risk organization and governance, risk identification and quantification, risk control and limits, and risk monitoring and reporting. Additionally, our 2014 Form 10-K provides an analysis of our key areas of risk, which include but are not limited to credit, operational, compliance, model, liquidity and market. Our use of financial derivatives as part of our overall asset and liability risk management process is also addressed within the Risk Management section.
The following information updates our 2014 Form 10-K risk management disclosures.
Credit Risk Management
As more fully discussed in the Credit Risk Management portion of the Risk Management section in our 2014 Form 10-K, credit risk represents the possibility that a customer, counterparty or issuer may not perform in accordance with contractual terms. Credit risk is inherent in the financial services business and results from extending credit to customers, purchasing securities, and entering into financial derivative transactions and certain guarantee contracts. Credit risk is one of our most significant risks. Our processes for managing credit risk are embedded in PNC's risk culture and in our decision-making processes using a systematic approach whereby credit risks and related exposures are identified and assessed, managed through specific policies and processes, measured and evaluated against our risk appetite and credit concentration limits, and reported, along with specific mitigation activities, to management and the Board through our governance structure.
32 The PNC Financial Services Group, Inc. – Form 10-Q
Asset Quality Overview
Asset quality trends improved overall during the first nine months of 2015.
| • | Nonperforming assets at September 30, 2015 decreased $390 million compared with December 31, 2014 as a result of improvements in both consumer lending and commercial lending nonperforming loans. Consumer lending nonperforming loans decreased $227 million and commercial lending nonperforming loans decreased another $106 million. Nonperforming assets were 0.69% of total assets at September 30, 2015 compared with 0.83% at December 31, 2014. |
| • | Overall loan delinquencies totaled $1.7 billion at September 30, 2015, a decrease of $283 million, or 15%, from year-end 2014 levels. The reduction was due in large part to a reduction in accruing government insured residential real estate loans past due 90 days or more of $161 million, the majority of which we took possession of and conveyed the real estate, or are in the process of conveyance and claim resolution. |
| • | Net charge-offs were $96 million in the third quarter of 2015, up 17%, or $14 million, from net charge-offs in the same quarter of 2014, as higher commercial loan and residential real estate loan net charge-offs were somewhat offset by lower home equity loan net charge-offs. For the nine months ended September 30, 2015, net charge-offs were $266 million, down from $413 million for the nine months ended September 30, 2014. |
| • | Provision for credit losses in the third quarter of 2015 increased to $81 million compared with $55 million in the third quarter of 2014. Provision for credit losses for the nine months ending September 30, 2015 declined to $181 million compared to $221 million for the nine months ending September 30, 2014. |
| • | The level of ALLL decreased to $3.2 billion at September 30, 2015 as compared to $3.3 billion at December 31, 2014. |
Nonperforming Assets and Loan Delinquencies
Nonperforming Assets, including OREO and Foreclosed Assets
Nonperforming assets include nonperforming loans and leases for which ultimate collectability of the full amount of contractual principal and interest is not probable and include nonperforming troubled debt restructurings (TDRs), OREO and foreclosed assets. Loans held for sale, certain government insured or guaranteed loans, purchased impaired loans and loans accounted for under the fair value option are excluded from nonperforming loans. Additional information regarding our nonperforming loans and nonaccrual policies is included in Note 1 Accounting Policies in the Notes To Consolidated Financial Statements in Part I, Item 1 of this Report. A summary of the major categories of nonperforming assets are presented in Table 29. See Note 3 Asset Quality in the Notes To Consolidated Financial Statements of this Report for further detail of nonperforming asset categories.
Table 29: Nonperforming Assets By Type
| Dollars in millions | September 30 2015 | December 31 2014 | ||||||
Nonperforming loans | ||||||||
Commercial lending | $ | 520 | $ | 626 | ||||
Consumer lending (a) (b) | 1,657 | 1,884 | ||||||
Total nonperforming loans (c) | 2,177 | 2,510 | ||||||
OREO and foreclosed assets | 313 | 370 | ||||||
Total nonperforming assets | $ | 2,490 | $ | 2,880 | ||||
Amount of TDRs included in nonperforming loans | $ | 1,171 | $ | 1,370 | ||||
Percentage of total nonperforming loans | 54 | % | 55 | % | ||||
Nonperforming loans to total loans | 1.06 | % | 1.23 | % | ||||
Nonperforming assets to total loans, OREO and foreclosed assets | 1.21 | 1.40 | ||||||
Nonperforming assets to total assets | .69 | .83 | ||||||
Allowance for loan and lease losses to total nonperforming loans (d) | 149 | 133 | ||||||
| (a) | Excludes most consumer loans and lines of credit, not secured by residential real estate, which are charged off after 120 to 180 days past due and are not placed on nonperforming status. |
| (b) | The recorded investment of loans collateralized by residential real estate property that are in process of foreclosure was $.6 billion and $.8 billion at September 30, 2015 and December 31, 2014, which included $.3 billion and $.5 billion, respectively, of loans that are government insured/guaranteed. |
| (c) | Nonperforming loans exclude certain government insured or guaranteed loans, loans held for sale, loans accounted for under the fair value option and purchased impaired loans. |
| (d) | The allowance for loan and lease losses in this ratio includes impairment reserves attributable to purchased impaired loans. See Note 1 Accounting Policies and Note 5 Allowances for Loan and Lease Losses and Unfunded Loan Commitments and Letters of Credit in the Notes To Consolidated Financial Statements in Part I, Item 1 of this Report for additional information. The allowance for loan and lease losses will be impacted by the expected fourth quarter 2015 change in our derecognition policy for purchased impaired loans that are pooled and accounted for as a single asset. For additional information on this policy change, see the Purchase Accounting Accretion and Valuation of Purchased Impaired Loans portion of the Consolidated Balance Sheet Review of this Financial Review. |
The PNC Financial Services Group, Inc. – Form 10-Q 33
Table 30: Change in Nonperforming Assets
| In millions | 2015 | 2014 | ||||||
January 1 | $ | 2,880 | $ | 3,457 | ||||
New nonperforming assets | 1,089 | 1,657 | ||||||
Charge-offs and valuation adjustments | (367 | ) | (427 | ) | ||||
Principal activity, including paydowns and payoffs | (544 | ) | (818 | ) | ||||
Asset sales and transfers to loans held for sale | (296 | ) | (440 | ) | ||||
Returned to performing status | (272 | ) | (454 | ) | ||||
September 30 | $ | 2,490 | $ | 2,975 | ||||
Nonperforming assets decreased $390 million at September 30, 2015 compared to December 31, 2014. Consumer lending nonperforming loans decreased $227 million and commercial lending nonperforming loans decreased another $106 million. As of September 30, 2015, approximately 89% of total nonperforming loans were secured by collateral which lessens reserve requirements and is expected to reduce credit losses in the event of default. As of September 30, 2015, commercial lending nonperforming loans were carried at approximately 60% of their unpaid principal balance, due to charge-offs recorded to date, before consideration of the ALLL. See Note 3 Asset Quality in the Notes To Consolidated Financial Statements in Part I, Item 1 of this Report for additional information on these loans.
Within consumer nonperforming loans, residential real estate TDRs comprise 69% of total residential real estate nonperforming loans at September 30, 2015, up from 60% at December 31, 2014. Home equity TDRs comprise 52% of home equity nonperforming loans at September 30, 2015, down from 54% at December 31, 2014. TDRs generally remain in nonperforming status until a borrower has made at least six consecutive months of both principal and interest payments under the modified terms or ultimate resolution occurs. Loans where borrowers have been discharged from personal liability through Chapter 7 bankruptcy and have not formally reaffirmed their loan obligations to PNC and loans to borrowers not currently obligated to make both principal and interest payments under the restructured terms are not returned to accrual status.
At September 30, 2015, our largest nonperforming asset was $34 million in the Real Estate, Rental and Leasing Industry and our average nonperforming loan associated with commercial lending was less than $1 million. The ten largest outstanding nonperforming assets are from the commercial lending portfolio and represent 18% and 4% of total commercial lending nonperforming loans and total nonperforming assets, respectively, as of September 30, 2015.
Purchased impaired loans are considered performing, even if contractually past due (or if we do not expect to receive payment in full based on the original contractual terms), as we accrete interest income over the expected life of the loans. Total nonperforming loans and assets in the tables above are significantly lower than they would have been due to this accounting treatment for purchased impaired loans. This treatment also results in a lower ratio of nonperforming loans to total loans and a higher ratio of ALLL to nonperforming loans. See Note 4 Purchased Loans in the Notes To Consolidated Financial Statements in Part I, Item 1 of this Report, as well as the Credit Risk Management portion of the Risk Management section in our 2014 Form 10-K for additional information, including the accounting treatment, on these loans.
Table 31: OREO and Foreclosed Assets
| In millions | September 30 2015 | December 31 2014 | ||||||
Other real estate owned (OREO): | ||||||||
Residential properties | $ | 147 | $ | 183 | ||||
Residential development properties | 38 | 48 | ||||||
Commercial properties | 108 | 120 | ||||||
Total OREO | 293 | 351 | ||||||
Foreclosed and other assets | 20 | 19 | ||||||
Total OREO and foreclosed assets | $ | 313 | $ | 370 | ||||
Total OREO and foreclosed assets decreased $57 million during the first nine months of 2015 and is 13% of total nonperforming assets at September 30, 2015. As of September 30, 2015 and December 31, 2014, 59% and 62%, respectively, of our OREO and foreclosed assets were comprised of residential related properties.
Loan Delinquencies
We regularly monitor the level of loan delinquencies and believe these levels may be a key indicator of loan portfolio asset quality. Measurement of delinquency status is based on the contractual terms of each loan. Loans that are 30 days or more past due in terms of payment are considered delinquent. Loan delinquencies exclude loans held for sale and purchased impaired loans, but include government insured or guaranteed loans and loans accounted for under the fair value option.
34 The PNC Financial Services Group, Inc. – Form 10-Q
Table 32: Accruing Loans Past Due (a) (b)
| Amount | Percentage of Total Outstandings | |||||||||||||||
| Dollars in millions | September 30 2015 | December 31 2014 | September 30 2015 | December 31 2014 | ||||||||||||
Early stage loan delinquencies | ||||||||||||||||
Accruing loans past due 30 to 59 days | $ | 508 | $ | 582 | .25 | % | .28 | % | ||||||||
Accruing loans past due 60 to 89 days | 265 | 259 | .13 | % | .13 | % | ||||||||||
Total | 773 | 841 | .38 | % | .41 | % | ||||||||||
Late stage loan delinquencies | ||||||||||||||||
Accruing loans past due 90 days or more | 890 | 1,105 | .43 | % | .54 | % | ||||||||||
Total | $ | 1,663 | $ | 1,946 | .81 | % | .95 | % | ||||||||
| (a) | Amounts in table represent recorded investment. |
| (b) | Past due loan amounts at September 30, 2015 include government insured or guaranteed loans of $181 million, $120 million, and $782 million for accruing loans past due 30 to 59 days, past due 60 to 89 days, and past due 90 days or more, respectively. The comparative amounts as of December 31, 2014 were $220 million, $136 million, and $996 million, respectively. |
Total early stage loan delinquencies (accruing loans past due 30 to 89 days) decreased $68 million, or 8%, at September 30, 2015 compared to December 31, 2014, driven by reductions in consumer early stage delinquencies, which more than offset an increase in commercial real estate lending early stage delinquencies.
Accruing loans past due 90 days or more decreased $215 million, or 19%, at September 30, 2015 compared to December 31, 2014 due to declines in government insured residential real estate loans of $161 million, the majority of which we took possession of and conveyed the real estate, or are in the process of conveyance and claim resolution and other consumer government insured of $53 million. Accruing loans past due 90 days or more are referred to as late stage loan delinquencies. These loans are not included in nonperforming loans and continue to accrue interest because they are well secured by collateral and are in the process of collection, or are managed in homogenous portfolios with specified charge-off timeframes adhering to regulatory guidelines, or are certain government insured or guaranteed loans.
On a regular basis our Special Asset Committee closely monitors loans, primarily commercial loans, that are not included in the nonperforming or accruing past due categories and for which we are uncertain about the borrower's ability to comply with existing repayment terms. These loans totaled $.2 billion at both September 30, 2015 and December 31, 2014.
See Note 1 Accounting Policies and Note 3 Asset Quality in the Notes To Consolidated Financial Statements of this Report for additional information regarding our nonperforming loan and nonaccrual policies and further information on loan delinquencies.
Home Equity Loan Portfolio
Our home equity loan portfolio totaled $33 billion as of September 30, 2015, or 16% of the total loan portfolio. Of that total, $19.3 billion, or 59%, was outstanding under primarily variable-rate home equity lines of credit and $13.7 billion, or 41%, consisted of closed-end home equity installment loans. Approximately 5% of the home equity portfolio was purchased credit impaired and 3% of the home equity portfolio was on nonperforming status as of September 30, 2015.
As of September 30, 2015, we are in an originated first lien position for approximately 53% of the total outstanding portfolio and, where originated as a second lien, we currently hold or service the first lien position for an additional 2% of the portfolio. The remaining 45% of the portfolio was secured by second liens where we do not hold the first lien position. The credit performance of the majority of the home equity portfolio where we are in, hold or service the first lien position, is superior to the portion of the portfolio where we hold the second lien position but do not hold the first lien.
Generally, our variable-rate home equity lines of credit have either a seven or ten year draw period, followed by a 20-year amortization term. During the draw period, we have home equity lines of credit where borrowers pay either interest or principal and interest. We view home equity lines of credit where borrowers are paying principal and interest under the draw period as less risky than those where the borrowers are paying interest only, as these borrowers have a demonstrated ability to make some level of principal and interest payments. The risk associated with the borrower's ability to satisfy the loan terms upon the draw period ending is considered in establishing our ALLL. Based upon outstanding balances at September 30, 2015, the following table presents the periods when home equity lines of credit draw periods are scheduled to end.
The PNC Financial Services Group, Inc. – Form 10-Q 35
Table 33: Home Equity Lines of Credit – Draw Period End Dates
| In millions | Interest Only Product | Principal and Interest Product | ||||||
Remainder of 2015 | $ | 224 | $ | 89 | ||||
2016 | 1,209 | 398 | ||||||
2017 | 2,180 | 554 | ||||||
2018 | 961 | 753 | ||||||
2019 | 672 | 591 | ||||||
2020 and thereafter | 3,390 | 5,652 | ||||||
Total (a) (b) | $ | 8,636 | $ | 8,037 | ||||
| (a) | Includes all home equity lines of credit that mature in the remainder of 2015 or later, including those with borrowers where we have terminated borrowing privileges. |
| (b) | Includes approximately $5 million, $43 million, $48 million, $35 million, $25 million and $539 million of home equity lines of credit with balloon payments, including those where we have terminated borrowing privileges, with draw periods scheduled to end in the remainder of 2015, 2016, 2017, 2018, 2019 and 2020 and thereafter, respectively. |
Based upon outstanding balances, and excluding purchased impaired loans, at September 30, 2015, for home equity lines of credit for which the borrower can no longer draw ( e.g. , draw period has ended or borrowing privileges have been terminated), approximately 3% were 30-89 days past due and approximately 5% were 90 days or more past due. Generally, when a borrower becomes 60 days past due, we terminate borrowing privileges and those privileges are not subsequently reinstated. At that point, we continue our collection/recovery processes, which may include loan modification resulting in a loan that is classified as a TDR.
See the Credit Risk Management portion of the Risk Management section in our 2014 Form 10-K for more information on our home equity loan portfolio.
Loan Modifications and Troubled Debt Restructurings
Consumer Loan Modifications
We modify loans under government and PNC-developed programs based upon our commitment to help eligible homeowners and borrowers avoid foreclosure, where appropriate. Initially, a borrower is evaluated for a modification under a government program. If a borrower does not qualify under a government program, the borrower is then evaluated under a PNC program. Our programs utilize both temporary and permanent modifications and typically reduce the interest rate, extend the term and/or defer principal. Loans that are either temporarily or permanently modified under programs involving a change to loan terms are generally classified as TDRs. Further, loans that have certain types of payment plans and trial payment arrangements which do not include a contractual change to loan terms may be classified as TDRs. Additional detail on TDRs is discussed below as well as in Note 3 Asset Quality in our 2014 Form 10-K.
A temporary modification, with a term between 3 and 24 months, involves a change in original loan terms for a period of time and reverts to a calculated exit rate for the remaining term of the loan as of a specific date. A permanent modification, with a term greater than 24 months, is a modification in which the terms of the original loan are changed. Permanent modification programs include the government-created Home Affordable Modification Program (HAMP) and PNC-developed HAMP-like modification programs. These programs first require a reduction of the interest rate followed by an extension of term and, if appropriate, deferral of principal payments.
We also monitor the success rates and delinquency status of our loan modification programs to assess their effectiveness in serving our borrowers' and servicing customers' needs while mitigating credit losses. Table 34 provides the number of bank-owned accounts and unpaid principal balance of modified consumer real estate related loans at the end of each year presented.
Table 34: Consumer Real Estate Related Loan Modifications
| September 30, 2015 | December 31, 2014 | |||||||||||||||
| Dollars in millions | Number of Accounts | Unpaid Principal Balance | Number of Accounts | Unpaid Principal Balance | ||||||||||||
Temporary modifications (a) | 4,604 | $ | 345 | 5,346 | $ | 417 | ||||||||||
Permanent modifications | ||||||||||||||||
Home equity | 14,309 | 1,019 | 13,128 | 968 | ||||||||||||
Residential real estate | 9,628 | 1,795 | 12,526 | 2,350 | ||||||||||||
Total permanent modifications | 23,937 | 2,814 | 25,654 | 3,318 | ||||||||||||
Total consumer real estate related loan modifications | 28,541 | $ | 3,159 | 31,000 | $ | 3,735 | ||||||||||
| (a) | All temporary modifications are home equity loans. |
36 The PNC Financial Services Group, Inc. – Form 10-Q
In addition to temporary loan modifications, we may make available to a borrower a payment plan or a HAMP trial payment period. Under a payment plan or a HAMP trial payment period, there is no change to the loan's contractual terms so the borrower remains legally responsible for payment of the loan under its original terms.
Payment plans may include extensions, re-ages and/or forbearance plans. All payment plans bring an account current once certain requirements are achieved and are primarily intended to demonstrate a borrower's renewed willingness and ability to re-pay. Due to the short term nature of the payment plan, there is a minimal impact to the ALLL.
Under a HAMP trial payment period, we establish an alternate payment, generally at an amount less than the contractual payment amount, for the borrower during this short time period. This allows a borrower to demonstrate successful payment performance before permanently restructuring the loan into a HAMP modification. Subsequent to successful borrower performance under the trial payment period, we will capitalize the original contractual amount past due, to include accrued interest and fees receivable, and restructure the loan's contractual terms, along with bringing the restructured account current. As the borrower is often already delinquent at the time of participation in the HAMP trial payment period, generally enrollment in the program does not significantly increase the ALLL. If the trial payment period is unsuccessful, the loan will be evaluated for further action based upon our existing policies.
Commercial Loan Modifications and Payment Plans
Modifications of terms for commercial loans are based on individual facts and circumstances. Commercial loan modifications may involve reduction of the interest rate, extension of the loan term and/or forgiveness of principal. Modified commercial loans are usually already nonperforming prior to modification. We evaluate these modifications for TDR classification based upon whether we granted a concession to a borrower experiencing financial difficulties. Additional detail on TDRs is discussed below as well as in Note 3 Asset Quality in our 2014 Form 10-K.
We have established certain commercial loan modification and payment programs for small business loans, Small Business Administration loans, and investment real estate loans. As of September 30, 2015 and December 31, 2014, $26 million and $34 million, respectively, in loan balances were covered under these modification and payment plan programs. Of these loan balances, $10 million and $12 million have been determined to be TDRs as of September 30, 2015 and December 31, 2014, respectively.
Troubled Debt Restructurings
A TDR is a loan whose terms have been restructured in a manner that grants a concession to a borrower experiencing
financial difficulties. TDRs result from our loss mitigation activities and include rate reductions, principal forgiveness, postponement/reduction of scheduled amortization and extensions, which are intended to minimize economic loss and to avoid foreclosure or repossession of collateral. Additionally, TDRs also result from borrowers that have been discharged from personal liability through Chapter 7 bankruptcy and have not formally reaffirmed their loan obligations to PNC.
Table 35: Summary of Troubled Debt Restructurings (a)
| In millions | September 30 2015 | December 31 2014 | ||||||
Consumer lending: | ||||||||
Real estate-related | $ | 1,801 | $ | 1,864 | ||||
Credit card | 112 | 130 | ||||||
Other consumer | 35 | 47 | ||||||
Total consumer lending (b) | 1,948 | 2,041 | ||||||
Total commercial lending | 420 | 542 | ||||||
Total TDRs | $ | 2,368 | $ | 2,583 | ||||
Nonperforming | $ | 1,171 | $ | 1,370 | ||||
Accruing | 1,085 | 1,083 | ||||||
Credit card | 112 | 130 | ||||||
Total TDRs | $ | 2,368 | $ | 2,583 | ||||
| (a) | Amounts in table represent recorded investment, which includes the unpaid principal balance plus accrued interest and net accounting adjustments, less any charge-offs. Recorded investment does not include any associated valuation allowance. |
| (b) | Excludes $1.2 billion and $.9 billion of consumer loans held for sale, loans accounted for under the fair value option and pooled purchased impaired loans, as well as certain government insured or guaranteed loans at September 30, 2015 and December 31, 2014, respectively. |
Total TDRs decreased $215 million, or 8%, during the first nine months of 2015. Nonperforming TDRs were approximately 54% of total nonperforming loans, and 49% of total TDRs.
TDRs that are performing, including credit card loans, are excluded from nonperforming loans. These TDRs remained generally flat during the first nine months of 2015 at $1.2 billion. Generally, the accruing category is comprised of loans where borrowers have been performing under the restructured terms for at least six consecutive months. Loans where borrowers have been discharged from personal liability through Chapter 7 bankruptcy and have not formally reaffirmed their loan obligations to PNC and loans to borrowers not currently obligated to make both principal and interest payments under the restructured terms are not returned to accrual status.
See Note 3 Asset Quality and the Credit Risk Management portion of the Risk Management section in our 2014 Form 10-K for additional information on loan modifications and TDRs.
The PNC Financial Services Group, Inc. – Form 10-Q 37
Allowances for Loan and Lease Losses and Unfunded Loan Commitments and Letters of Credit
Table 36: Loan Charge-Offs And Recoveries
Nine months ended September 30 Dollars in millions | Gross Charge-offs | Recoveries | Net Charge-offs / | Percent of Average Loans (annualized) | ||||||||||||
2015 | ||||||||||||||||
Commercial | $ | 145 | $ | 139 | $ | 6 | .01 | % | ||||||||
Commercial real estate | 29 | 46 | (17 | ) | (.09 | ) | ||||||||||
Equipment lease financing | 2 | 3 | (1 | ) | (.02 | ) | ||||||||||
Home equity | 139 | 69 | 70 | .28 | ||||||||||||
Residential real estate | 17 | 10 | 7 | .07 | ||||||||||||
Credit card | 121 | 16 | 105 | 3.13 | ||||||||||||
Other consumer | 136 | 40 | 96 | .58 | ||||||||||||
Total | $ | 589 | $ | 323 | $ | 266 | .17 | |||||||||
2014 | ||||||||||||||||
Commercial | $ | 231 | $ | 156 | $ | 75 | .11 | % | ||||||||
Commercial real estate | 46 | 64 | (18 | ) | (.11 | ) | ||||||||||
Equipment lease financing | 9 | 10 | (1 | ) | (.02 | ) | ||||||||||
Home equity | 213 | 58 | 155 | .58 | ||||||||||||
Residential real estate | 26 | 23 | 3 | .03 | ||||||||||||
Credit card | 125 | 16 | 109 | 3.36 | ||||||||||||
Other consumer | 136 | 46 | 90 | .53 | ||||||||||||
Total | $ | 786 | $ | 373 | $ | 413 | .28 | |||||||||
Total net charge-offs are lower than they would have been otherwise due to the accounting treatment for purchased impaired loans. This treatment also results in a lower ratio of net charge-offs to average loans. See Note 4 Purchased Loans in the Notes To Consolidated Financial Statements in Part I, Item 1 of this Report for additional information on net charge-offs related to these loans.
We maintain an ALLL to absorb losses from the loan and lease portfolio and determine this allowance based on quarterly assessments of the estimated probable credit losses incurred in the loan and lease portfolio. Our total ALLL of $3.2 billion at September 30, 2015 consisted of $1.6 billion established for each of the commercial lending and consumer lending categories. We maintain the ALLL at a level that we believe to be appropriate to absorb estimated probable credit losses incurred in the loan and lease portfolio as of the balance sheet date. The reserve calculation and determination process is dependent on the use of key assumptions. Key reserve assumptions and estimation processes react to and are influenced by observed changes in loan and lease portfolio performance experience, the financial strength of the borrower, and economic conditions. Key reserve assumptions are periodically updated.
We establish specific allowances for loans considered impaired using methods prescribed by GAAP. All impaired loans are subject to individual analysis, except leases and large groups of smaller-balance homogeneous loans which
may include, but are not limited to, credit card, residential real estate secured and consumer installment loans. Specific allowances for individual loans (including commercial and consumer TDRs) are determined based on an analysis of the present value of expected future cash flows from the loans discounted at their effective interest rate, observable market price or the fair value of the underlying collateral.
Reserves allocated to non-impaired commercial loan classes are based on PD and LGD credit risk ratings.
Our commercial pool reserve methodology is sensitive to changes in key risk parameters such as PD and LGD. The results of these parameters are then applied to the loan balance and unfunded loan commitments and letters of credit to determine the amount of the respective reserves. Our PDs and LGDs are primarily determined using internal commercial loan loss data. This internal data is supplemented with third-party data and management judgment, as deemed necessary. We continue to evaluate and enhance our use of internal commercial loss data and will periodically update our PDs and LGDs as well as consider third-party data, regulatory guidance and management judgment.
The majority of the commercial portfolio is secured by collateral, including loans to asset-based lending customers, which generally demonstrate lower LGD compared to loans not secured by collateral. Additionally, guarantees on loans greater than $1 million and owner guarantees for small business loans do not significantly impact our ALLL.
38 The PNC Financial Services Group, Inc. – Form 10-Q
Allocations to non-impaired consumer loan classes are primarily based upon a roll-rate model which uses statistical relationships, calculated from historical data that estimate the movement of loan outstandings through the various stages of delinquency and ultimately charge-off.
A portion of the ALLL is related to qualitative and measurement factors. These factors may include, but are not limited to, the following:
| • | Industry concentrations and conditions, |
| • | Recent credit quality trends, |
| • | Recent loss experience in particular portfolios, |
| • | Recent macro-economic factors, |
| • | Model imprecision, |
| • | Changes in lending policies and procedures, |
| • | Timing of available information, including the performance of first lien positions, and |
| • | Limitations of available historical data. |
Purchased impaired loans are initially recorded at fair value and applicable accounting guidance prohibits the carry over or creation of valuation allowances at acquisition. Because the initial fair values of these loans already reflect a credit component, additional reserves are established when performance is expected to be worse than our expectations as of the acquisition date. At September 30, 2015, we had established reserves of $.8 billion for purchased impaired loans. In addition, loans (purchased impaired and non-impaired) acquired after January 1, 2009 were recorded at fair value . No allowance for loan losses was carried over and no allowance was created at the date of acquisition. See Note 4 Purchased Loans in the Notes To Consolidated Financial Statements in Part I, Item 1 of this Report for additional information.
In determining the appropriateness of the ALLL, we make specific allocations to impaired loans and allocations to portfolios of commercial and consumer loans. We also allocate reserves to provide coverage for probable losses incurred in the portfolio at the balance sheet date based upon current market conditions, which may not be reflected in historical loss data. Commercial lending is the largest category of credits and is sensitive to changes in assumptions and judgments underlying the determination of the ALLL. We have allocated approximately $1.6 billion, or 50%, of the ALLL at September 30, 2015 to the commercial lending category. Consumer lending allocations are made based on historical loss experience adjusted for recent activity. Approximately $1.6 billion, or 50%, of the ALLL at September 30, 2015 has been allocated to these consumer lending categories.
In addition to the ALLL, we maintain an allowance for unfunded loan commitments and letters of credit. We report this allowance as a liability on our Consolidated Balance Sheet. We maintain the allowance for unfunded loan commitments and letters of credit at a level we believe is
appropriate to absorb estimated probable losses on these unfunded credit facilities. We determine this amount using estimates of the probability of the ultimate funding and losses related to those credit exposures. Other than the estimation of the probability of funding, this methodology is very similar to the one we use for determining our ALLL.
We refer you to Note 1 Accounting Policies and Note 3 Asset Quality in the Notes To Consolidated Financial Statements in Part I, Item 1 of this Report and in our 2014 Form 10-K for further information on certain key asset quality indicators that we use to evaluate our portfolios and establish the allowances.
Table 37: Allowance for Loan and Lease Losses
| Dollars in millions | 2015 | 2014 | ||||||
January 1 | $ | 3,331 | $ | 3,609 | ||||
Total net charge-offs | (266 | ) | (413 | ) | ||||
Provision for credit losses | 181 | 221 | ||||||
Net change in allowance for unfunded loan commitments and letters of credit | (7 | ) | (9 | ) | ||||
Other | (2 | ) | (2 | ) | ||||
September 30 | $ | 3,237 | $ | 3,406 | ||||
Net charge-offs to average loans (for the nine months ended) (annualized) | .17 | % | .28 | % | ||||
Total allowance for loan and lease losses to total loans (a) | 1.58 | 1.70 | ||||||
Commercial lending net (charge-offs) / recoveries | $ | 12 | $ | (56 | ) | |||
Consumer lending net charge-offs | (278 | ) | (357 | ) | ||||
Total net charge-offs | $ | (266 | ) | $ | (413 | ) | ||
Net charge-offs (recoveries) to average loans (for the nine months ended) (annualized) | ||||||||
Commercial lending | (.01 | )% | .06 | % | ||||
Consumer lending | .50 | .62 | ||||||
| (a) | This ratio will be impacted by the expected change in our derecognition policy for purchased impaired loans that are pooled and accounted for as a single asset. For additional information on this policy change, see the Purchase Accounting Accretion and Valuation of Purchased Impaired Loans portion of the Consolidated Balance Sheet Review of this Financial Review. |
The provision for credit losses totaled $181 million for the first nine months of 2015 compared to $221 million for the first nine months of 2014. For the first nine months of 2015, the provision for commercial lending credit losses decreased by $41 million, or 46%, from the first nine months of 2014. The provision for consumer lending credit losses increased $1 million, or 1%, from the first nine months of 2014.
At September 30, 2015, total ALLL to total nonperforming loans was 149%. The comparable amount for December 31, 2014 was 133%. These ratios are 98% and 85%, respectively, when excluding the $1.1 billion and $1.2 billion of ALLL at September 30, 2015 and December 31, 2014, respectively, allocated to consumer loans and lines of credit not secured by
The PNC Financial Services Group, Inc. – Form 10-Q 39
residential real estate and purchased impaired loans. We have excluded consumer loans and lines of credit not secured by real estate as they are charged off after 120 to 180 days past due and not placed on nonperforming status. Additionally, we have excluded purchased impaired loans as they are considered performing regardless of their delinquency status as interest is accreted in accordance with ASC 310-30 based on the recorded investment balance. See Table 29 within this Credit Risk Management section for additional information.
The ALLL balance increases or decreases across periods in relation to fluctuating risk factors, including asset quality trends, net charge-offs and changes in aggregate portfolio balances. During the first nine months of 2015, improved asset quality trends, including, but not limited to, delinquency status and improving economic conditions, as well as reduced net charge-offs combined to result in the ALLL balance decline of $.1 billion, or 3% to $3.2 billion as of September 30, 2015 compared to December 31, 2014.
See Note 1 Accounting Policies and Note 4 Purchased Loans in the Notes To Consolidated Financial Statements in Part I, Item 1 of this Report regarding changes in the ALLL and in the allowance for unfunded loan commitments and letters of credit. See also the Purchase Accounting Accretion and Valuation of Purchased Impaired Loans portion of the Consolidated Balance Sheet Review section of this Financial Review for additional information on our ALLL related to purchased impaired loans.
Liquidity Risk Management
Liquidity risk, including our liquidity monitoring measures and tools, is described in further detail in the Liquidity Risk Management section of our 2014 Form 10-K.
PNC also monitors its liquidity by reference to the LCR, a regulatory minimum liquidity requirement designed to ensure that covered banking organizations maintain an adequate level of liquidity to meet net liquidity needs over the course of a 30-day stress scenario. The LCR is calculated by dividing the amount of an institution's high quality, unencumbered liquid assets (HQLA), as defined and calculated in accordance with the LCR rules, by its estimated net cash outflow, with net cash outflows determined by applying the assumed outflow factors in the LCR rules. The resulting quotient is expressed as a percentage. For PNC and PNC Bank, the LCR became effective January 1, 2015. The minimum required LCR will be phased-in over a period of years. For 2015, PNC and PNC Bank are required to calculate the LCR on a month-end basis and the minimum LCR that PNC and PNC Bank are required to maintain is 80 percent. Effective July 1, 2016, PNC and PNC Bank must begin calculating their respective LCR ratios on a daily basis.
As of September 30, 2015, the LCR for PNC and PNC Bank exceeded 100 percent. The September 30, 2015 LCR calculation and the underlying components are based on PNC's current interpretation and understanding of the final LCR rules and are subject to, among other things, further regulatory guidance.
We provide additional information regarding regulatory liquidity requirements and their potential impact on PNC in the Supervision and Regulation section of Item 1 Business and Item 1A Risk Factors of our 2014 Form 10-K.
Bank Level Liquidity – Uses
At the bank level, primary contractual obligations include funding loan commitments, satisfying deposit withdrawal requests and maturities and debt service related to bank borrowings. As of September 30, 2015, there were approximately $6.7 billion of bank borrowings with contractual maturities of less than one year. We also maintain adequate bank liquidity to meet future potential loan demand and provide for other business needs, as necessary.
Bank Level Liquidity – Sources
Our largest source of bank liquidity on a consolidated basis is the deposit base generated by our retail and commercial banking businesses. Total deposits increased to $245.0 billion at September 30, 2015 from $232.2 billion at December 31, 2014, driven primarily by growth in money market and savings deposits. Assets determined by PNC to be liquid (liquid assets) and unused borrowing capacity from a number of sources are also available to maintain our liquidity position. Borrowed funds come from a diverse mix of short-term and long-term funding sources.
At September 30, 2015, our liquid assets consisted of short-term investments (Federal funds sold, resale agreements, trading securities and interest-earning deposits with banks) totaling $37.7 billion and securities available for sale totaling $53.7 billion. The level of liquid assets fluctuates over time based on many factors, including market conditions, loan and deposit growth and balance sheet management activities. Of our total liquid assets of $91.4 billion, we had $3.7 billion of securities available for sale and trading securities pledged as collateral to secure public and trust deposits, repurchase agreements and for other purposes. In addition to the liquid assets we pledged, $6.5 billion of securities held to maturity were also pledged as collateral for these purposes.
In addition to the customer deposit base, which has historically provided the single largest source of relatively stable and low-cost funding, the bank also obtains liquidity through the issuance of traditional forms of funding, including long-term debt (senior notes and subordinated debt and FHLB advances) and short-term borrowings (Federal funds purchased, securities sold under repurchase agreements, commercial paper and other short-term borrowings).
40 The PNC Financial Services Group, Inc. – Form 10-Q
Under the 2014 bank note program, PNC Bank may from time to time offer unsecured senior and subordinated notes with maturity dates more than nine months (in the case of senior notes) and five years or more (in the case of subordinated notes). On May 22, 2015, PNC Bank increased the capacity of this program by $5.0 billion to a maximum aggregate principal amount at any one time outstanding of $30.0 billion. The $30.0 billion of notes authorized to be issued and outstanding at any one time includes notes issued by PNC Bank under the 2004 bank note program and those notes PNC Bank has assumed through the acquisition of other banks, in each case for so long as such notes remain outstanding. The terms of the 2014 bank note program do not affect any of the bank notes issued prior to January 16, 2014. At September 30, 2015, PNC Bank had $22.3 billion of notes outstanding under this program. The following table details all issuances through September 30, 2015:
Table 38: PNC Bank Bank Notes Issued During 2015
| Issuance Date | Amount | Description of Issuance | ||
February 6, 2015 | $600 million | Floating rate senior notes issued to an affiliate with a maturity date of January 26, 2017. Interest is payable at the 3-month LIBOR rate, reset quarterly, plus a spread of .30%, on January 26, April 26, July 26 and October 26 of each year, beginning on April 26, 2015. | ||
February 23, 2015 | $750 million | Senior notes with a maturity date of February 23, 2025. Interest is payable semi-annually at a fixed rate of 2.950% on February 23 and August 23 of each year, beginning on August 23, 2015. | ||
February 23, 2015 | $1.0 billion | Senior notes with a maturity date of February 23, 2018. Interest is payable semi-annually at a fixed rate of 1.500% on February 23 and August 23 of each year, beginning on August 23, 2015. | ||
May 27, 2015 | $200 million | Floating rate senior notes with a maturity date of May 27, 2021. Interest is payable at the 3-month LIBOR rate, reset quarterly, plus a spread of .65%, on February 27, May 27, August 27 and November 27 of each year, beginning on August 27, 2015. | ||
June 1, 2015 | $550 million | Floating rate senior notes with a maturity date of June 1, 2018. Interest is payable at the 3-month LIBOR rate, reset quarterly, plus a spread of .42%, on March 1, June 1, September 1 and December 1 of each year, beginning on September 1, 2015. | ||
June 1, 2015 | $1.3 billion | Senior notes with a maturity date of June 1, 2018. Interest is payable semi-annually at a fixed rate of 1.600% on June 1 and December 1 of each year, beginning on December 1, 2015. | ||
June 1, 2015 | $750 million | Senior notes with a maturity date of June 1, 2020. Interest is payable semi-annually at a fixed rate of 2.300% on June 1 and December 1 of each year, beginning on December 1, 2015. | ||
June 1, 2015 | $400 million | Senior notes with a maturity date of June 1, 2025. Interest is payable semi-annually at a fixed rate of 3.250% on June 1 and December 1 of each year, beginning on December 1, 2015. | ||
July 21, 2015 | $750 million | Senior notes with a maturity date of July 20, 2018. Interest is payable semi-annually at a fixed rate of 1.850% on January 20 and July 20 of each year, beginning on January 20, 2016. | ||
July 21, 2015 | $750 million | Senior notes with a maturity date of July 21, 2020. Interest is payable semi-annually at a fixed rate of 2.600% on January 21 and July 21 of each year, beginning on January 21, 2016. | ||
Total senior and subordinated debt of PNC Bank increased to $24.0 billion at September 30, 2015 from $17.5 billion at December 31, 2014 due to the following activity in the period.
Table 39: PNC Bank Senior and Subordinated Debt
| In billions | 2015 | |||
January 1 | $ | 17.5 | ||
Issuances | 7.0 | |||
Calls and maturities | (.7 | ) | ||
Other | .2 | |||
September 30 | $ | 24.0 | ||
See Note 18 Subsequent Events in the Notes to Consolidated Financial Statements in Part I, Item 1 of this Report for information on two issuances of senior notes totaling $1.75 billion on November 3, 2015.
PNC Bank is a member of the FHLB-Pittsburgh and, as such, has access to advances from FHLB-Pittsburgh secured generally by residential mortgage loans, other mortgage-related loans and commercial mortgage-backed securities. At September 30, 2015, our unused secured borrowing capacity was $16.0 billion with the FHLB-Pittsburgh. Total FHLB borrowings increased to $21.7 billion at September 30, 2015 from $20.0 billion at December 31, 2014 due to the following activity in the period.
The PNC Financial Services Group, Inc. – Form 10-Q 41
Table 40: FHLB Borrowings
| In billions | 2015 | |||
January 1 | $ | 20.0 | ||
Issuances | 2.3 | |||
Calls and maturities | (.6 | ) | ||
September 30 | $ | 21.7 | ||
The FHLB-Pittsburgh also periodically provides standby letters of credit on behalf of PNC Bank to secure certain public deposits. PNC Bank began using standby letters of credit issued by the FHLB-Pittsburgh for these purposes in response to the regulatory liquidity standards finalized during 2014. If the FHLB-Pittsburgh is required to make payment for a beneficiary's draw, the payment amount is converted into a collateralized advance to PNC Bank. At September 30, 2015, standby letters of credit issued on our behalf by the FHLB-Pittsburgh totaled $6.0 billion.
PNC Bank has the ability to offer up to $10.0 billion of its commercial paper to provide additional liquidity. As of September 30, 2015, there was $1.1 billion outstanding under this program.
PNC Bank can also borrow from the Federal Reserve Bank discount window to meet short-term liquidity requirements. The Federal Reserve Bank, however, is not viewed as the primary means of funding our routine business activities, but rather as a potential source of liquidity in a stressed environment or during a market disruption. These potential borrowings are secured by commercial loans. At September 30, 2015, our unused secured borrowing capacity was $13.7 billion with the Federal Reserve Bank.
Parent Company Liquidity
As of September 30, 2015, available parent company liquidity totaled $5.0 billion. Parent company liquidity is primarily held in short-term investments, the terms of which provide for the availability of cash in 31 days or less. Investments with longer durations may also be acquired, but if so, the related maturities are aligned with scheduled cash needs, such as the maturity of parent company debt obligations.
Parent Company Liquidity – Uses
The parent company's contractual obligations consist primarily of debt service related to parent company borrowings and funding non-bank affiliates. As of September 30, 2015, there were approximately $1.9 billion of parent company borrowings with contractual maturities of less than one year. Additionally, the parent company maintains adequate liquidity to fund discretionary activities such as paying dividends to PNC shareholders, share repurchases, and acquisitions.
See Balance Sheet, Liquidity and Capital Highlights in the Executive Summary section of this Financial Review for information on our 2015 capital plan that was accepted by the
Federal Reserve. Our capital plan included a recommendation to increase the quarterly common stock dividend in the second quarter of 2015 and the ability to redeem the Series K Preferred Stock, as further described below, and also included share repurchase programs of up to $2.875 billion for the five quarter period beginning in the second quarter of 2015. See the Capital portion of the Consolidated Balance Sheet Review in this Financial Review for more information on our share repurchase programs, including detail on our first quarter repurchase of 4.4 million common shares for $.4 billion, our second quarter repurchase of 5.9 million common shares for $.6 billion and our third quarter repurchase of 6.2 million common shares for $.6 billion.
On April 2, 2015, consistent with our 2015 capital plan, our Board of Directors approved an increase to PNC's quarterly common stock dividend from 48 cents per common share to 51 cents per common share beginning with the May 5, 2015 dividend payment.
On May 4, 2015, we redeemed $500 million of PNC's Fixed-to-Floating Rate Non-Cumulative Perpetual Preferred Stock, Series K, as well as all Depositary Shares representing interests therein. Each Depositary Share represented a 1/10 interest in a share of the Series K Preferred Stock. All 50,000 shares of Series K Preferred Stock, as well as all 500,000 Depositary Shares representing interests therein, were redeemed. The redemption price was $10,000 per share of Series K Preferred Stock equivalent to $1,000 per Depositary Share, plus declared and unpaid dividends up to but excluding the redemption date.
See the Supervision and Regulation section of Item 1 Business in our 2014 Form 10-K for additional information regarding the Federal Reserve's CCAR process and the factors the Federal Reserve takes into consideration in evaluating capital plans, qualitative and quantitative liquidity risk management standards proposed by the U.S. banking agencies, and final rules issued by the Federal Reserve that make certain modifications to the Federal Reserve's capital planning and stress testing rules.
See Table 38 for information on an affiliate purchase of notes issued by PNC Bank during 2015.
Parent Company Liquidity – Sources
The principal source of parent company liquidity is the dividends it receives from its subsidiary bank, which may be impacted by the following:
| • | Bank-level capital needs, |
| • | Laws and regulations, |
| • | Corporate policies, |
| • | Contractual restrictions, and |
| • | Other factors. |
There are statutory and regulatory limitations on the ability of a national bank to pay dividends or make other capital distributions or to extend credit to the parent company or its non-bank subsidiaries. The amount available for dividend
42 The PNC Financial Services Group, Inc. – Form 10-Q
payments by PNC Bank to the parent company without prior regulatory approval was approximately $1.6 billion at September 30, 2015. See Note 20 Regulatory Matters in our 2014 Form 10-K for a further discussion of these limitations. We provide additional information on certain contractual restrictions in Note 12 Capital Securities of a Subsidiary Trust and Perpetual Trust Securities in our 2014 Form 10-K.
In addition to dividends from PNC Bank, other sources of parent company liquidity include cash and investments, as well as dividends and loan repayments from other subsidiaries and dividends or distributions from equity investments.
We can also generate liquidity for the parent company and PNC's non-bank subsidiaries through the issuance of debt and equity securities, including certain capital instruments, in public or private markets and commercial paper. We have an effective shelf registration statement pursuant to which we can issue additional debt, equity and other capital instruments.
Total parent company senior and subordinated debt and hybrid capital instruments decreased to $8.2 billion at September 30, 2015 from $10.1 billion at December 31, 2014 due to the following activity in the period.
Table 41: Parent Company Senior and Subordinated Debt and Hybrid Capital Instruments
| In billions | 2015 | |||
January 1 | $ | 10.1 | ||
Maturities | (1.9 | ) | ||
September 30 | $ | 8.2 | ||
The parent company has the ability to offer up to $5.0 billion of commercial paper to provide additional liquidity. As of September 30, 2015, there were no issuances outstanding under this program.
Status of Credit Ratings
The cost and availability of short-term and long-term funding, as well as collateral requirements for certain derivative instruments, is influenced by PNC's credit ratings.
In general, rating agencies base their ratings on many quantitative and qualitative factors, including capital adequacy, liquidity, asset quality, business mix, level and quality of earnings, and the current legislative and regulatory environment, including implied government support. In addition, rating agencies themselves have been subject to scrutiny arising from the most recent financial crisis and could make or be required to make substantial changes to their ratings policies and practices, particularly in response to legislative and regulatory changes. Potential changes in the legislative and regulatory environment and the timing of those changes could impact our ratings, which as noted above, could impact our liquidity and financial condition. A decrease, or potential decrease, in credit ratings could impact access to the capital markets and/or increase the cost of debt, and thereby adversely affect liquidity and financial condition.
In March 2015, Moody's Investors Service (Moody's) published a new bank ratings methodology which has been implemented on a global basis and includes assessment of expected loss ratings on instruments ranging from bank deposits to preferred stock. In the second quarter of 2015, Moody's concluded its review for PNC and PNC Bank under this new methodology. As a result, Moody's upgraded PNC Bank's long-term deposit rating three notches to Aa2, confirmed PNC Bank's senior debt and issuer ratings at A2, and confirmed PNC Bank's Prime-1 short-term notes rating. The Moody's rating outlook for PNC and PNC Bank is stable.
Table 42: Credit Ratings as of September 30, 2015 for PNC and PNC Bank
| Moody's | Standard & Poor's | Fitch | ||||||||||
PNC | ||||||||||||
Senior debt | A3 | A- | A+ | |||||||||
Subordinated debt | A3 | BBB+ | A | |||||||||
Preferred stock | Baa2 | BBB- | BBB- | |||||||||
PNC Bank | ||||||||||||
Senior debt | A2 | A | A+ | |||||||||
Subordinated debt | A3 | A- | A | |||||||||
Long-term deposits | Aa2 | A | AA- | |||||||||
Short-term deposits | P-1 | A-1 | F1+ | |||||||||
Short-term notes | P-1 | A-1 | F1 | |||||||||
The PNC Financial Services Group, Inc. – Form 10-Q 43
Commitments
The following tables set forth contractual obligations and various other commitments as of September 30, 2015 representing required and potential cash outflows.
Table 43: Contractual Obligations
| Payment Due By Period | ||||||||||||||||||||
| September 30, 2015 – in millions | Total | Less than one year | One to three years | Four to five years | After five years | |||||||||||||||
Remaining contractual maturities of time deposits (a) | $ | 20,882 | $ | 15,457 | $ | 1,608 | $ | 1,079 | $ | 2,738 | ||||||||||
Borrowed funds (a) (b) | 56,663 | 12,039 | 21,912 | 13,938 | 8,774 | |||||||||||||||
Minimum annual rentals on noncancellable leases | 2,713 | 380 | 656 | 488 | 1,189 | |||||||||||||||
Nonqualified pension and postretirement benefits | 519 | 56 | 109 | 108 | 246 | |||||||||||||||
Purchase obligations (c) | 879 | 449 | 252 | 143 | 35 | |||||||||||||||
Total contractual cash obligations | $ | 81,656 | $ | 28,381 | $ | 24,537 | $ | 15,756 | $ | 12,982 | ||||||||||
| (a) | Includes purchase accounting adjustments. |
| (b) | Includes basis adjustment relating to accounting hedges. |
| (c) | Includes purchase obligations for goods and services covered by noncancellable contracts and contracts including cancellation fees. |
At September 30, 2015, we had unrecognized tax benefits of $30 million, which represents a reserve for tax positions that we have taken in our tax returns which ultimately may not be sustained upon examination by taxing authorities. Since the ultimate amount and timing of any future cash settlements cannot be predicted with reasonable certainty, this estimate has been excluded from the contractual obligations table. See Note 14 Income Taxes in the Notes To Consolidated Financial Statements in Part I, Item 1 of this Report for additional information.
Our contractual obligations totaled $82.0 billion at December 31, 2014. The slight decrease in the comparison is primarily attributable to a decrease in time deposits. See Funding Sources in the Consolidated Balance Sheet Review section of this Financial Review for additional information regarding our funding sources.
Table 44: Other Commitments (a)
| Amount Of Commitment Expiration By Period | ||||||||||||||||||||
| September 30, 2015 – in millions | Total Amounts Committed | Less than one year | One to three years | Four to five years | After five years | |||||||||||||||
Commitments to extend credit (b) | $ | 141,370 | $ | 54,016 | $ | 47,888 | $ | 38,908 | $ | 558 | ||||||||||
Net outstanding standby letters of credit (c) | 9,112 | 4,433 | 3,728 | 925 | 26 | |||||||||||||||
Reinsurance agreements (d) | 2,054 | 9 | 19 | 27 | 1,999 | |||||||||||||||
Standby bond purchase agreements | 968 | 255 | 638 | 75 | ||||||||||||||||
Other commitments (e) | 990 | 735 | 224 | 31 | ||||||||||||||||
Total commitments | $ | 154,494 | $ | 59,448 | $ | 52,497 | $ | 39,966 | $ | 2,583 | ||||||||||
| (a) | Other commitments are funding commitments that could potentially require performance in the event of demands by third parties or contingent events. Loan commitments are reported net of syndications, assignments and participations. |
| (b) | Commitments to extend credit, or net unfunded loan commitments, represent arrangements to lend funds or provide liquidity subject to specified contractual conditions. |
| (c) | Includes $4.9 billion of standby letters of credit that support remarketing programs for customers' variable rate demand notes. |
| (d) | Reinsurance agreements are with third-party insurers related to insurance sold to or placed on behalf of our customers. Balances represent estimates based on availability of financial information. |
| (e) | Includes other commitments of $290 million that were not on our Consolidated Balance Sheet. The remaining $700 million of other commitments were included in Other liabilities on our Consolidated Balance Sheet. |
Our total commitments were $154.9 billion at December 31, 2014. See Note 16 Commitments and Guarantees in the Notes To Consolidated Financial Statements in Part I, Item 1 of this Report for additional information related to our commitments.
44 The PNC Financial Services Group, Inc. – Form 10-Q
Market Risk Management
Market risk is the risk of a loss in earnings or economic value due to adverse movements in market factors such as interest rates, credit spreads, foreign exchange rates, commodity prices and equity prices. We are exposed to market risk primarily by our involvement in the following activities, among others:
| • | Traditional banking activities of gathering deposits and extending loans, |
| • | Equity and other investments and activities whose economic values are directly impacted by market factors, and |
| • | Fixed income securities, derivatives and foreign exchange activities, as a result of customer activities and securities underwriting. |
We have established enterprise-wide policies and methodologies to identify, measure, monitor and report market risk. Market Risk Management provides independent oversight by monitoring compliance with these limits and guidelines, and reporting significant risks in the business to the Risk Committee of the Board.
Market Risk Management – Interest Rate Risk
Interest rate risk results primarily from our traditional banking activities of gathering deposits and extending loans. Many factors, including economic and financial conditions, movements in interest rates and consumer preferences, affect the difference between the interest that we earn on assets and the interest that we pay on liabilities and the level of our noninterest-bearing funding sources. Due to the repricing term mismatches and embedded options inherent in certain of these products, changes in market interest rates not only affect expected near-term earnings, but also the economic values of these assets and liabilities.
Asset and Liability Management centrally manages interest rate risk as prescribed in our risk management policies, which are approved by management's Asset and Liability Committee and the Risk Committee of the Board.
Sensitivity results and market interest rate benchmarks for the third quarters of 2015 and 2014 follow:
Table 45: Interest Sensitivity Analysis
| Third Quarter 2015 | Third Quarter 2014 | |||||||
Net Interest Income Sensitivity Simulation (a) | ||||||||
Effect on net interest income in first year from gradual interest rate change over the following 12 months of: | ||||||||
100 basis point increase | 2.7 | % | 2.8 | % | ||||
100 basis point decrease | (.7 | )% | (.6 | )% | ||||
Effect on net interest income in second year from gradual interest rate change over the preceding 12 months of: | ||||||||
100 basis point increase | 6.4 | % | 7.0 | % | ||||
100 basis point decrease | (5.3 | )% | (3.2 | )% | ||||
Duration of Equity Model (a) | ||||||||
Base case duration of equity (in years) | (5.2 | ) | (3.3 | ) | ||||
Key Period-End Interest Rates | ||||||||
One-month LIBOR | .19 | % | .16 | % | ||||
Three-year swap | .98 | % | 1.30 | % | ||||
| (a) | Given the inherent limitations in certain of these measurement tools and techniques, results become less meaningful as interest rates approach zero. |
In addition to measuring the effect on net interest income assuming parallel changes in current interest rates, we routinely simulate the effects of a number of nonparallel interest rate environments. Table 46 reflects the percentage change in net interest income over the next two 12-month periods assuming (i) the PNC Economist's most likely rate forecast, (ii) implied market forward rates and (iii) Yield Curve Slope Flattening (a 100 basis point yield curve slope flattening between 1-month and ten-year rates superimposed on current base rates) scenario.
Table 46: Net Interest Income Sensitivity to Alternative Rate Scenarios (Third Quarter 2015)
PNC Economist | Market Forward | Slope Flattening | ||||||||||
First year sensitivity | 4.8 | % | 1.8 | % | (1.0 | )% | ||||||
Second year sensitivity | 10.3 | % | 4.4 | % | (4.9 | )% | ||||||
All changes in forecasted net interest income are relative to results in a base rate scenario where current market rates are assumed to remain unchanged over the forecast horizon.
When forecasting net interest income, we make assumptions about interest rates and the shape of the yield curve, the volume and characteristics of new business and the behavior of existing on- and off-balance sheet positions. These assumptions determine the future level of simulated net interest income in the base interest rate scenario and the other interest rate scenarios presented in Tables 45 and 46 above. These simulations assume that as assets and liabilities mature, they are replaced or repriced at then current market rates. We also consider forward projections of purchase accounting accretion when forecasting net interest income.
The PNC Financial Services Group, Inc. – Form 10-Q 45
The following graph presents the LIBOR/Swap yield curves for the base rate scenario and each of the alternate scenarios one year forward.
Table 47: Alternate Interest Rate Scenarios: One Year Forward
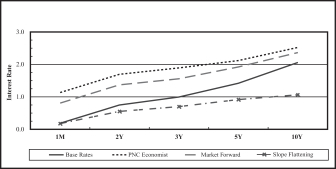
The third quarter 2015 interest sensitivity analyses indicate that our Consolidated Balance Sheet is positioned to benefit from an increase in interest rates and an upward sloping interest rate yield curve. We believe that we have the deposit funding base and balance sheet flexibility to adjust, where appropriate and permissible, to changing interest rates and market conditions.
Market Risk Management – Customer-Related Trading Risk
We engage in fixed income securities, derivatives and foreign exchange transactions to support our customers' investing and hedging activities. These transactions, related hedges and the credit valuation adjustment (CVA) related to our customer derivatives portfolio are marked-to-market daily and reported as customer-related trading activities. We do not engage in proprietary trading of these products.
We use value-at-risk (VaR) as the primary means to measure and monitor market risk in customer-related trading activities. We calculate a diversified VaR at a 95% confidence interval. VaR is used to estimate the probability of portfolio losses based on the statistical analysis of historical market risk factors. A diversified VaR reflects empirical correlations across different asset classes.
During the first nine months of 2015, our 95% VaR ranged between $1.4 million and $3.6 million, averaging $2.3 million. During the first nine months of 2014, our 95% VaR ranged between $.9 million and $3.9 million, averaging $2.5 million.
To help ensure the integrity of the models used to calculate VaR for each portfolio and enterprise-wide, we use a process known as backtesting. The backtesting process consists of comparing actual observations of gains or losses against the VaR levels that were calculated at the close of the prior day. This assumes that market exposures remain constant throughout the day and that recent historical market variability
is a good predictor of future variability. Our customer-related trading activity includes customer revenue and intraday hedging which helps to reduce losses, and may reduce the number of instances of actual losses exceeding the prior day VaR measure. There were six such instances during the first nine months of 2015 where actual losses exceeded the prior day VaR measure under our diversified VaR measure. In comparison, there were no such instances during the first nine months of 2014. We use a 500 day look back period for backtesting and include customer-related revenue.
The following graph shows a comparison of enterprise-wide gains and losses against prior day diversified VaR for the period indicated.
Table 48: Enterprise-Wide Gains/Losses Versus Value-at-Risk
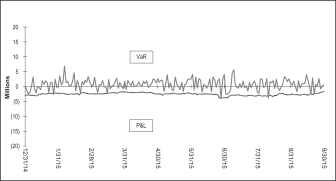
Customer-related trading revenue increased to $155 million for the first nine months of 2015 compared with $130 million for the first nine months of 2014. This increase was primarily due to market interest rate changes impacting credit valuations for customer-related derivatives activities and improved derivatives client sales revenues.
Customer-related trading revenue increased to $53 million for the third quarter of 2015 compared with $46 million for the third quarter of 2014. This increase was primarily due to improved derivative client sales revenues.
Market Risk Management – Equity And Other Investment Risk
Equity investment risk is the risk of potential losses associated with investing in both private and public equity markets. In addition to extending credit, taking deposits, and underwriting and trading financial instruments, we make and manage direct investments in a variety of transactions, including
management buyouts, recapitalizations, and growth financings in a variety of industries. We also have investments in affiliated and non-affiliated funds that make similar investments in private equity and in debt and equity-oriented hedge funds. The economic and/or book value of these investments and other assets such as loan servicing rights are directly affected by changes in market factors.
46 The PNC Financial Services Group, Inc. – Form 10-Q
The primary risk measurement for equity and other investments is economic capital. Economic capital is a common measure of risk for credit, market and operational risk. It is an estimate of the potential value depreciation over a one year horizon commensurate with solvency expectations of an institution rated single-A by the credit rating agencies. Given the illiquid nature of many of these types of investments, it can be a challenge to determine their fair values. See Note 7 Fair Value in the Notes To Consolidated Financial Statements in this Report and Note 7 Fair Value in our 2014 Form 10-K for additional information.
Various PNC business units manage our equity and other investment activities. Our businesses are responsible for making investment decisions within the approved policy limits and associated guidelines.
A summary of our equity investments follows:
Table 49: Equity Investments Summary
| In millions | September 30 2015 | December 31 2014 | ||||||
BlackRock | $ | 6,501 | $ | 6,265 | ||||
Tax credit investments | 2,171 | 2,616 | ||||||
Private equity | 1,616 | 1,615 | ||||||
Visa | 43 | 77 | ||||||
Other | 166 | 155 | ||||||
Total | $ | 10,497 | $ | 10,728 | ||||
BlackRock
PNC owned approximately 35 million common stock equivalent shares of BlackRock equity at September 30, 2015, accounted for under the equity method. The primary risk measurement, similar to other equity investments, is economic capital. The Business Segments Review section of this Financial Review includes additional information about BlackRock.
Tax Credit Investments
Included in our equity investments are direct tax credit investments and equity investments held by consolidated partnerships which totaled $2.2 billion at September 30, 2015 and $2.6 billion at December 31, 2014. These equity investment balances include unfunded commitments totaling $616 million and $717 million at September 30, 2015 and December 31, 2014, respectively. These unfunded commitments are included in Other Liabilities on our Consolidated Balance Sheet.
Note 2 Loan Sale and Servicing Activities and Variable Interest Entities in the Notes To Consolidated Financial Statements in Part I, Item 1 of this Report has further information on Tax Credit Investments.
Private Equity
The private equity portfolio is an illiquid portfolio comprised of mezzanine and equity investments that vary by industry, stage and type of investment.
Private equity investments carried at estimated fair value totaled $1.6 billion at both September 30, 2015 and December 31, 2014. As of September 30, 2015, $1.2 billion was invested directly in a variety of companies and $.4 billion was invested indirectly through various private equity funds. Included in direct investments are investment activities of two private equity funds that are consolidated for financial reporting purposes. The noncontrolling interests of these funds totaled $157 million as of September 30, 2015. The interests held in indirect private equity funds are not redeemable, but PNC may receive distributions over the life of the partnership from liquidation of the underlying investments. See Item 1 Business – Supervision and Regulation and Item 1A Risk Factors included in our 2014 Form 10-K for discussion of the potential impacts of the Volcker Rule provisions of Dodd-Frank on our interests in and sponsorship of private funds covered by the Volcker Rule.
Our unfunded commitments related to private equity totaled $139 million at September 30, 2015 compared with $140 million at December 31, 2014.
Visa
Our 2014 Form 10-K includes information regarding the October 2007 Visa restructuring, our involvement with judgment and loss sharing agreements with Visa and certain other banks, the status of pending interchange litigation, the sales of portions of our Visa Class B common shares and the related swap agreements with the purchaser.
During the first nine months of 2015, we sold 1.5 million Visa Class B common shares, in addition to the 16.5 million shares sold in previous years. We have entered into swap agreements with the purchasers of the shares as part of these sales. At September 30, 2015, our investment in Visa Class B common shares totaled approximately 5.4 million shares and had a carrying value of $43 million. Based on the September 30, 2015 closing price of $69.66 for the Visa Class A common shares, the fair value of our total investment was approximately $616 million at the current conversion rate. The Visa Class B common shares that we own are transferable only under limited circumstances until they can be converted into shares of the publicly traded class of stock, which cannot happen until the settlement of all of the specified litigation.
Other Investments
We also make investments in affiliated and non-affiliated funds with both traditional and alternative investment strategies. The economic values could be driven by either the fixed-income market or the equity markets, or both. At September 30, 2015 other investments totaled $166 million compared with $155 million at December 31, 2014. Net gains related to these investments were not significant for the first nine months of 2015 and 2014.
The PNC Financial Services Group, Inc. – Form 10-Q 47
Given the nature of these investments, if market conditions affecting their valuation were to worsen, we could incur future losses.
Our unfunded commitments related to other investments at September 30, 2015 and December 31, 2014 were not significant.
Financial Derivatives
We use a variety of financial derivatives as part of the overall asset and liability risk management process to help manage exposure to market and credit risk inherent in our business activities. Substantially all such instruments are used to manage risk related to changes in interest rates. Interest rate swaps, interest rate caps and floors, swaptions, options, forwards and futures contracts are the primary instruments we use for interest rate risk management. We also enter into derivatives with customers to facilitate their risk management activities.
Financial derivatives involve, to varying degrees, market and credit risk. Periodic cash payments are exchanged for interest rate swaps, options and futures contracts. Premiums are also exchanged for options contracts. Therefore, cash requirements and exposure to credit risk are significantly less than the notional amount on these instruments.
Further information on our financial derivatives is presented in Note 1 Accounting Policies and Note 7 Fair Value in our Notes To Consolidated Financial Statements under Item 8 of our 2014 Form 10-K and in Note 7 Fair Value and Note 11 Financial Derivatives in the Notes To Consolidated Financial Statements in Part I, Item 1 of this Report, which is incorporated here by reference.
Not all elements of market and credit risk are addressed through the use of financial derivatives, and such instruments may be ineffective for their intended purposes due to unanticipated market changes, among other reasons.
The following table summarizes the notional or contractual amounts and net fair value of financial derivatives at September 30, 2015 and December 31, 2014.
Table 50: Financial Derivatives Summary
| September 30, 2015 | December 31, 2014 | |||||||||||||||
| In millions | Notional/ Contractual Amount | Net Fair Value (a) | Notional/ Contractual Amount | Net Fair Value (a) | ||||||||||||
Derivatives designated as hedging instruments under GAAP | ||||||||||||||||
Total derivatives designated as hedging instruments | $ | 52,710 | $ | 1,387 | $ | 49,061 | $ | 1,075 | ||||||||
Derivatives not designated as hedging instruments under GAAP | ||||||||||||||||
Total derivatives used for residential mortgage banking activities | $ | 91,020 | $ | 420 | $ | 76,102 | $ | 409 | ||||||||
Total derivatives used for commercial mortgage banking activities | 27,338 | 43 | 26,290 | 26 | ||||||||||||
Total derivatives used for customer-related activities | 190,090 | 149 | 183,474 | 122 | ||||||||||||
Total derivatives used for other risk management activities | 5,535 | (357 | ) | 5,390 | (425 | ) | ||||||||||
Total derivatives not designated as hedging instruments | $ | 313,983 | $ | 255 | $ | 291,256 | $ | 132 | ||||||||
Total Derivatives | $ | 366,693 | $ | 1,642 | $ | 340,317 | $ | 1,207 | ||||||||
| (a) | Represents the net fair value of assets and liabilities. |
I NTERNAL C ONTROLS AND D ISCLOSURE C ONTROLS AND P ROCEDURES
As of September 30, 2015, we performed an evaluation under the supervision of and with the participation of our management, including the Chairman, President and Chief Executive Officer and the Executive Vice President and Chief Financial Officer, of the effectiveness of the design and operation of our disclosure controls and procedures and of changes in our internal control over financial reporting.
Based on that evaluation, our Chairman, President and Chief Executive Officer and our Executive Vice President and Chief Financial Officer concluded that our disclosure controls and procedures (as defined in Rule 13a-15(e) under the Securities and Exchange Act of 1934) were effective as of September 30, 2015, and that there has been no change in PNC's internal control over financial reporting that occurred during the third quarter of 2015 that has materially affected, or is reasonably likely to materially affect, our internal control over financial reporting.
48 The PNC Financial Services Group, Inc. – Form 10-Q
G LOSSARY OF T ERMS
Accretable net interest (Accretable yield) – The excess of cash flows expected to be collected on a purchased impaired loan over the carrying value of the loan. The accretable net interest is recognized into interest income over the remaining life of the loan using the constant effective yield method.
Adjusted average total assets – Primarily comprised of total average quarterly (or annual) assets plus (less) unrealized losses (gains) on investment securities, less goodwill and certain other intangible assets (net of eligible deferred taxes).
Annualized – Adjusted to reflect a full year of activity.
Basel III common equity Tier 1 capital – Common stock plus related surplus, net of treasury stock, plus retained earnings, plus accumulated other comprehensive income for securities currently and previously held as available for sale, plus accumulated other comprehensive income for pension and other postretirement benefit plans, less goodwill, net of associated deferred tax liabilities, less other disallowed intangibles, net of deferred tax liabilities and plus/less other adjustments.
Basel III common equity Tier 1 capital ratio – Common equity Tier 1 capital divided by period-end risk-weighted assets (as applicable).
Basel III Tier 1 capital – Common equity Tier 1 capital, plus preferred stock, plus certain trust preferred capital securities, plus certain noncontrolling interests that are held by others and plus/ less other adjustments.
Basel III Tier 1 capital ratio – Tier 1 capital divided by period-end risk-weighted assets (as applicable).
Basel III Total capital – Tier 1 capital plus qualifying subordinated debt, plus certain trust preferred securities, plus, under the Basel III transitional rules and the standardized approach, the allowance for loan and lease losses included in Tier 2 capital and other.
Basel III Total capital ratio – Total capital divided by period-end risk-weighted assets (as applicable).
Basis point – One hundredth of a percentage point.
Carrying value of purchased impaired loans – The net value on the balance sheet which represents the recorded investment less any valuation allowance.
Cash recoveries – Cash recoveries used in the context of purchased impaired loans represent cash payments for a single purchased impaired loan not included within a pool of loans from customers that exceeded the recorded investment of that loan.
Charge-off – Process of removing a loan or portion of a loan from our balance sheet because it is considered uncollectible. We also record a charge-off when a loan is transferred from portfolio holdings to held for sale by reducing the loan carrying amount to the fair value of the loan, if fair value is less than carrying amount.
Combined loan-to-value ratio (CLTV) – This is the aggregate principal balance(s) of the mortgages on a property divided by its appraised value or purchase price.
Common shareholders' equity to total assets – Common shareholders' equity divided by total assets. Common shareholders' equity equals total shareholders' equity less the liquidation value of preferred stock.
Core net interest income – Core net interest income is total net interest income less purchase accounting accretion.
Credit derivatives – Contractual agreements, primarily credit default swaps, that provide protection against a credit event of one or more referenced credits. The nature of a credit event is established by the protection buyer and protection seller at the inception of a transaction, and such events include bankruptcy, insolvency and failure to meet payment obligations when due. The buyer of the credit derivative pays a periodic fee in return for a payment by the protection seller upon the occurrence, if any, of a credit event.
Credit spread – The difference in yield between debt issues of similar maturity. The excess of yield attributable to credit spread is often used as a measure of relative creditworthiness, with a reduction in the credit spread reflecting an improvement in the borrower's perceived creditworthiness.
Credit valuation adjustment (CVA) – Represents an adjustment to the fair value of our derivatives for our own and counterparties' non-performance risk.
The PNC Financial Services Group, Inc. – Form 10-Q 49
Derivatives – Financial contracts whose value is derived from changes in publicly traded securities, interest rates, currency exchange rates or market indices. Derivatives cover a wide assortment of financial contracts, including but not limited to forward contracts, futures, options and swaps.
Discretionary client assets under management – Assets over which we have sole or shared investment authority for our customers/clients. We do not include these assets on our Consolidated Balance Sheet.
Duration of equity – An estimate of the rate sensitivity of our economic value of equity. A negative duration of equity is associated with asset sensitivity ( i.e. , positioned for rising interest rates), while a positive value implies liability sensitivity ( i.e. , positioned for declining interest rates). For example, if the duration of equity is -1.5 years, the economic value of equity increases by 1.5% for each 100 basis point increase in interest rates.
Earning assets – Assets that generate income, which include: federal funds sold; resale agreements; trading securities; interest-earning deposits with banks; loans held for sale; loans; investment securities; and certain other assets.
Effective duration – A measurement, expressed in years, that, when multiplied by a change in interest rates, would approximate the percentage change in value of on- and off- balance sheet positions.
Efficiency – Noninterest expense divided by total revenue.
Enterprise risk management framework – An enterprise process designed to identify potential risks that may affect PNC, manage risk to be within our risk appetite and provide reasonable assurance regarding achievement of our objectives.
Fair value – The price that would be received to sell an asset or paid to transfer a liability in an orderly transaction between market participants at the measurement date.
Fee income – When referring to the components of Noninterest income, we use the term fee income to refer to the following categories within Noninterest income: Asset management; Consumer services; Corporate services; Residential mortgage; and Service charges on deposits.
FICO score – A credit bureau-based industry standard score created by Fair Isaac Co. which predicts the likelihood of borrower default. We use FICO scores both in underwriting and assessing credit risk in our consumer lending portfolio. Lower FICO scores indicate likely higher risk of default, while higher FICO scores indicate likely lower risk of default. FICO scores are updated on a periodic basis.
Foreign exchange contracts – Contracts that provide for the future receipt and delivery of foreign currency at previously agreed-upon terms.
Funds transfer pricing – A management accounting methodology designed to recognize the net interest income effects of sources and uses of funds provided by the assets and liabilities of a business segment. Assets receive a funding charge and liabilities and capital receive a funding credit based on a transfer pricing methodology that incorporates product repricing characteristics, tenor and other factors.
Futures and forward contracts – Contracts in which the buyer agrees to purchase and the seller agrees to deliver a specific financial instrument at a predetermined price or yield. May be settled either in cash or by delivery of the underlying financial instrument.
GAAP – Accounting principles generally accepted in the United States of America.
Home price index (HPI) – A broad measure of the movement of single-family house prices in the U.S.
Impaired loans – Loans are determined to be impaired when, based on current information and events, it is probable that all contractually required payments will not be collected. Impaired loans include commercial nonperforming loans and consumer and commercial TDRs, regardless of nonperforming status. Excluded from impaired loans are nonperforming leases, loans held for sale, loans accounted for under the fair value option, smaller balance homogenous type loans and purchased impaired loans.
Interest rate floors and caps – Interest rate protection instruments that involve payment from the protection seller to the protection buyer of an interest differential, which represents the difference between a short-term rate ( e.g. , three-month LIBOR) and an agreed-upon rate (the strike rate) applied to a notional principal amount.
Interest rate swap contracts – Contracts that are entered into primarily as an asset/liability management strategy to reduce interest rate risk. Interest rate swap contracts are exchanges of interest rate payments, such as fixed-rate payments for floating-rate payments, based on notional principal amounts.
Intrinsic value – The difference between the price, if any, required to be paid for stock issued pursuant to an equity compensation arrangement and the fair market value of the underlying stock.
Leverage ratio – Tier 1 capital divided by average quarterly adjusted total assets.
50 The PNC Financial Services Group, Inc. – Form 10-Q
LIBOR – Acronym for London InterBank Offered Rate. LIBOR is the average interest rate charged when banks in the London wholesale money market (or interbank market) borrow unsecured funds from each other. LIBOR rates are used as a benchmark for interest rates on a global basis. PNC's product set includes loans priced using LIBOR as a benchmark.
Loan-to-value ratio (LTV) – A calculation of a loan's collateral coverage that is used both in underwriting and assessing credit risk in our lending portfolio. LTV is the sum total of loan obligations secured by collateral divided by the market value of that same collateral. Market values of the collateral are based on an independent valuation of the collateral. For example, a LTV of less than 90% is better secured and has less credit risk than a LTV of greater than or equal to 90%.
Loss given default (LGD) – An estimate of loss, net of recovery based on collateral type, collateral value, loan exposure, and other factors. Each loan has its own LGD. The LGD risk rating measures the percentage of exposure of a specific credit obligation that we expect to lose if default occurs. LGD is net of recovery, through any means, including
but not limited to the liquidation of collateral or deficiency judgments rendered from foreclosure or bankruptcy proceedings.
Net interest margin – Annualized taxable-equivalent net interest income divided by average earning assets.
Nonaccretable difference – Contractually required payments receivable on a purchased impaired loan in excess of the cash flows expected to be collected.
Nonaccrual loans – Loans for which we do not accrue interest income. Nonaccrual loans include nonperforming loans, in addition to loans accounted for under fair value option and loans accounted for as held for sale for which full collection of contractual principal and/or interest is not probable.
Nondiscretionary client assets under administration – Assets we hold for our customers/clients in a nondiscretionary, custodial capacity. We do not include these assets on our Consolidated Balance Sheet.
Nonperforming assets – Nonperforming assets include nonperforming loans and OREO and foreclosed assets, but exclude certain government insured or guaranteed loans for which we expect to collect substantially all principal and interest, loans held for sale, loans accounted for under the fair value option and purchased impaired loans. We do not accrue interest income on assets classified as nonperforming.
Nonperforming loans – Loans accounted for at amortized cost for which we do not accrue interest income. Nonperforming loans include loans to commercial, commercial real estate,
equipment lease financing, home equity, residential real estate, credit card and other consumer customers as well as TDRs which have not returned to performing status. Nonperforming loans exclude certain government insured or guaranteed loans for which we expect to collect substantially all principal and interest, loans held for sale, loans accounted for under the fair value option and purchased impaired loans. Nonperforming loans exclude purchased impaired loans as we are currently accreting interest income over the expected life of the loans.
Notional amount – A number of currency units, shares, or other units specified in a derivative contract.
Operating leverage – The period to period dollar or percentage change in total revenue (GAAP basis) less the dollar or percentage change in noninterest expense. A positive variance indicates that revenue growth exceeded expense growth ( i.e. , positive operating leverage) while a negative variance implies expense growth exceeded revenue growth ( i.e. , negative operating leverage).
Options – Contracts that grant the purchaser, for a premium payment, the right, but not the obligation, to either purchase or sell the associated financial instrument at a set price during a specified period or at a specified date in the future.
Other real estate owned (OREO) and foreclosed assets – Assets taken in settlement of troubled loans primarily through deed-in-lieu of foreclosure or foreclosure. Foreclosed assets include real and personal property, equity interests in corporations, partnerships, and limited liability companies. Excludes certain assets that have a government-guarantee which are classified as other receivables.
Other-than-temporary impairment (OTTI) – When the fair value of a security is less than its amortized cost basis, an assessment is performed to determine whether the impairment is other-than-temporary. If we intend to sell the security or more likely than not will be required to sell the security before recovery of its amortized cost basis less any current-period credit loss, an other-than-temporary impairment is considered to have occurred. In such cases, an other-than-temporary impairment is recognized in earnings equal to the entire difference between the investment's amortized cost basis and its fair value at the balance sheet date. Further, if we do not expect to recover the entire amortized cost of the security, an other-than-temporary impairment is considered to have occurred. However for debt securities, if we do not intend to sell the security and it is not more likely than not that we will be required to sell the security before its recovery, the other-than-temporary loss is separated into (a) the amount representing the credit loss, and (b) the amount related to all other factors. The other-than-temporary impairment related to credit losses is recognized in earnings while the amount related to all other factors is recognized in other comprehensive income, net of tax.
The PNC Financial Services Group, Inc. – Form 10-Q 51
Parent company liquidity coverage – Liquid assets divided by funding obligations within a two year period.
Pretax earnings – Income before income taxes and noncontrolling interests.
Pretax, pre-provision earnings – Total revenue less noninterest expense.
Primary client relationship – A corporate banking client relationship with annual revenue generation of $10,000 to $50,000 or more, and for Asset Management Group, a client relationship with annual revenue generation of $10,000 or more.
Probability of default (PD) – An internal risk rating that indicates the likelihood that a credit obligor will enter into default status.
Purchase accounting accretion – Accretion of the discounts and premiums on acquired assets and liabilities. The purchase accounting accretion is recognized in net interest income over
the weighted-average life of the financial instruments using the constant effective yield method. Accretion for a single purchased impaired loan not included within a pool of loans includes any cash recoveries on that loan received in excess of the recorded investment.
Purchased impaired loans – Acquired loans (or pools of loans) determined to be credit impaired under FASB ASC 310-30 (AICPA SOP 03-3). Loans (or pools of loans) are determined to be impaired if there is evidence of credit deterioration since origination and for which it is probable that all contractually required payments will not be collected.
Recorded investment (purchased impaired loans) – The initial investment of a purchased impaired loan plus interest accretion and less any cash payments and writedowns to date. The recorded investment excludes any valuation allowance which is included in our allowance for loan and lease losses.
Recovery – Cash proceeds received on a loan that we had previously charged off. We credit the amount received to the allowance for loan and lease losses.
Residential development loans – Project-specific loans to commercial customers for the construction or development of residential real estate including land, single family homes, condominiums and other residential properties.
Return on average assets – Annualized net income divided by average assets.
Return on average capital – Annualized net income divided by average capital.
Return on average common shareholders' equity – Annualized net income attributable to common shareholders divided by average common shareholders' equity.
Risk – The potential that an event or series of events could occur that would threaten PNC's ability to achieve its strategic objectives, thereby negatively affecting shareholder value or reputation.
Risk appetite – A dynamic, forward-looking view on the aggregate amount of risk PNC is willing and able to take in executing business strategy in light of the current business environment.
Risk limits – Quantitative measures based on forward looking assumptions that allocate the firm's aggregate risk appetite ( e.g. measure of loss or negative events) to business lines, legal entities, specific risk categories, concentrations and as appropriate, other levels.
Risk profile – The risk profile is a point-in-time assessment of risk. The profile represents overall risk position in relation to the desired risk appetite. The determination of the risk profile's position is based on qualitative and quantitative analysis of reported risk limits, metrics, operating guidelines and qualitative assessments.
Risk-weighted assets – Computed by the assignment of specific risk-weights (as defined by the Board of Governors of the Federal Reserve System) to assets and off-balance sheet instruments.
Securitization – The process of legally transforming financial assets into securities.
Servicing rights – An intangible asset or liability created by an obligation to service assets for others. Typical servicing rights include the right to receive a fee for collecting and forwarding payments on loans and related taxes and insurance premiums held in escrow.
52 The PNC Financial Services Group, Inc. – Form 10-Q
Swaptions – Contracts that grant the purchaser, for a premium payment, the right, but not the obligation, to enter into an interest rate swap agreement during a specified period or at a specified date in the future.
Taxable-equivalent interest – The interest income earned on certain assets is completely or partially exempt from Federal income tax. As such, these tax-exempt instruments typically yield lower returns than taxable investments. To provide more meaningful comparisons of yields and margins for all interest-earning assets, we use interest income on a taxable-equivalent basis in calculating average yields and net interest margins by increasing the interest income earned on tax-exempt assets to make it fully equivalent to interest income earned on other taxable investments. This adjustment is not permitted under GAAP on the Consolidated Income Statement.
Total equity – Total shareholders' equity plus noncontrolling interests.
Total return swap – A non-traditional swap where one party agrees to pay the other the "total return" of a defined underlying asset ( e.g., a loan), usually in return for receiving a stream of LIBOR-based cash flows. The total returns of the asset, including interest and any default shortfall, are passed through to the counterparty. The counterparty is, therefore, assuming the credit and economic risk of the underlying asset.
Transaction deposits – The sum of interest-bearing money market deposits, interest-bearing demand deposits, and noninterest-bearing deposits.
Transitional Basel III common equity – Common equity calculated under Basel III using phased in definitions and deductions applicable to PNC during the applicable presentation period.
Troubled debt restructuring (TDR) – A loan whose terms have been restructured in a manner that grants a concession to a borrower experiencing financial difficulties.
Value-at-risk (VaR) – A statistically-based measure of risk that describes the amount of potential loss which may be incurred due to adverse market movements. The measure is of the maximum loss which should not be exceeded on 95 out of 100 days for a 95% VaR.
Watchlist – A list of criticized loans, credit exposure or other assets compiled for internal monitoring purposes. We define criticized exposure for this purpose as exposure with an internal risk rating of other assets especially mentioned, substandard, doubtful or loss.
Yield curve – A graph showing the relationship between the yields on financial instruments or market indices of the same credit quality with different maturities. For example, a "normal" or "positive" yield curve exists when long-term bonds have higher yields than short-term bonds. A "flat" yield curve exists when yields are the same for short-term and long-term bonds. A "steep" yield curve exists when yields on long-term bonds are significantly higher than on short-term bonds. An "inverted" or "negative" yield curve exists when short-term bonds have higher yields than long-term bonds.
The PNC Financial Services Group, Inc. – Form 10-Q 53
C AUTIONARY S TATEMENT R EGARDING F ORWARD -L OOKING I NFORMATION
We make statements in this Report, and we may from time to time make other statements, regarding our outlook for earnings, revenues, expenses, capital and liquidity levels and ratios, asset levels, asset quality, financial position, and other matters regarding or affecting PNC and its future business and operations that are forward-looking statements within the meaning of the Private Securities Litigation Reform Act. Forward-looking statements are typically identified by words such as "believe," "plan," "expect," "anticipate," "see," "look," "intend," "outlook," "project," "forecast," "estimate," "goal," "will," "should" and other similar words and expressions. Forward-looking statements are subject to numerous assumptions, risks and uncertainties, which change over time.
Forward-looking statements speak only as of the date made. We do not assume any duty and do not undertake to update forward-looking statements. Actual results or future events could differ, possibly materially, from those anticipated in forward-looking statements, as well as from historical performance.
Our forward-looking statements are subject to the following principal risks and uncertainties.
| • | Our businesses, financial results and balance sheet values are affected by business and economic conditions, including the following: |
| – | Changes in interest rates and valuations in debt, equity and other financial markets. |
| – | Disruptions in the U.S. and global financial markets. |
| – | The impact on financial markets and the economy of any changes in the credit ratings of U.S. Treasury obligations and other U.S. government-backed debt, as well as issues surrounding the levels of U.S. and European government debt and concerns regarding the creditworthiness of certain sovereign governments, supranationals and financial institutions in Europe. |
| – | Actions by the Federal Reserve, U.S. Treasury and other government agencies, including those that impact money supply and market interest rates. |
| – | Changes in customers', suppliers' and other counterparties' performance and creditworthiness. |
| – | Slowing or reversal of the current U.S. economic expansion. |
| – | Continued residual effects of recessionary conditions and uneven spread of positive impacts of recovery on the economy and our counterparties, including adverse impacts on levels of unemployment, loan utilization rates, delinquencies, defaults and counterparty ability to meet credit and other obligations. |
| – | Changes in customer preferences and behavior, whether due to changing business and economic |
conditions, legislative and regulatory initiatives, or other factors. |
| • | Our forward-looking financial statements are subject to the risk that economic and financial market conditions will be substantially different than we are currently expecting. These statements are based on our current view that the U.S. economic expansion will speed up to an above trend growth rate near 2.5 percent in the fourth quarter of 2015, boosted by lower oil/energy prices and solid job gains, and that short-term interest rates and bond yields will rise slowly during the remainder of 2015. These forward-looking statements also do not, unless otherwise indicated, take into account the impact of potential legal and regulatory contingencies. |
| • | PNC's ability to take certain capital actions, including paying dividends and any plans to increase common stock dividends, repurchase common stock under current or future programs, or issue or redeem preferred stock or other regulatory capital instruments, is subject to the review of such proposed actions by the Federal Reserve as part of PNC's comprehensive capital plan for the applicable period in connection with the regulators' Comprehensive Capital Analysis and Review (CCAR) process and to the acceptance of such capital plan and non-objection to such capital actions by the Federal Reserve. |
| • | PNC's regulatory capital ratios in the future will depend on, among other things, the company's financial performance, the scope and terms of final capital regulations then in effect (particularly those implementing the Basel Capital Accords), and management actions affecting the composition of PNC's balance sheet. In addition, PNC's ability to determine, evaluate and forecast regulatory capital ratios, and to take actions (such as capital distributions) based on actual or forecasted capital ratios, will be dependent at least in part on the development, validation and regulatory approval of related models. |
| • | Legal and regulatory developments could have an impact on our ability to operate our businesses, financial condition, results of operations, competitive position, reputation, or pursuit of attractive acquisition opportunities. Reputational impacts could affect matters such as business generation and retention, liquidity, funding, and ability to attract and retain management. These developments could include: |
| – | Changes resulting from legislative and regulatory reforms, including major reform of the regulatory oversight structure of the financial services industry and changes to laws and regulations involving tax, pension, bankruptcy, consumer protection, and other industry aspects, and changes in accounting policies and principles. We will be impacted by extensive reforms provided for in the Dodd-Frank Wall Street Reform and Consumer Protection Act (the "Dodd-Frank Act") and otherwise growing out of the most recent financial crisis, the precise nature, extent and |
54 The PNC Financial Services Group, Inc. – Form 10-Q
timing of which, and their impact on us, remains uncertain. |
| – | Changes to regulations governing bank capital and liquidity standards, including due to the Dodd-Frank Act and to Basel-related initiatives. |
| – | Unfavorable resolution of legal proceedings or other claims and regulatory and other governmental investigations or other inquiries. In addition to matters relating to PNC's current and historical business and activities, such matters may include proceedings, claims, investigations, or inquiries relating to pre-acquisition business and activities of acquired companies, such as National City. These matters may result in monetary judgments or settlements or other remedies, including fines, penalties, restitution or alterations in our business practices, and in additional expenses and collateral costs, and may cause reputational harm to PNC. |
| – | Results of the regulatory examination and supervision process, including our failure to satisfy requirements of agreements with governmental agencies. |
| – | Impact on business and operating results of any costs associated with obtaining rights in intellectual property claimed by others and of adequacy of our intellectual property protection in general. |
| • | Business and operating results are affected by our ability to identify and effectively manage risks inherent in our businesses, including, where appropriate, through effective use of third-party insurance, derivatives, and capital management techniques, and to meet evolving regulatory capital and liquidity standards. In particular, our results currently depend on our ability to manage elevated levels of impaired assets. |
| • | Business and operating results also include impacts relating to our equity interest in BlackRock, Inc. and rely to a significant extent on information provided to us by BlackRock. Risks and uncertainties that could affect BlackRock are discussed in more detail by BlackRock in its SEC filings. |
| • | We grow our business in part by acquiring from time to time other financial services companies, financial services assets and related deposits and other liabilities. Acquisition risks and uncertainties include those presented by the nature of the business acquired, including in some cases those associated with our entry into new businesses or new geographic or other markets and risks resulting from our inexperience in those new areas, as well as risks and uncertainties related to the acquisition transactions themselves, regulatory issues, and the integration of the acquired businesses into PNC after closing. |
| • | Competition can have an impact on customer acquisition, growth and retention and on credit spreads and product pricing, which can affect market share, deposits and revenues. Industry restructuring in the current environment could also impact our business and financial performance through changes in counterparty creditworthiness and performance and in the competitive and regulatory landscape. Our ability to anticipate and respond to technological changes can also impact our ability to respond to customer needs and meet competitive demands. |
| • | Business and operating results can also be affected by widespread natural and other disasters, pandemics, dislocations, terrorist activities, cyberattacks or international hostilities through impacts on the economy and financial markets generally or on us or our counterparties specifically. |
We provide greater detail regarding these as well as other factors in our 2014 10-K, in our first and second quarter 2015 Form 10-Qs, and elsewhere in this Report, including in the Risk Factors and Risk Management sections and the Legal Proceedings and Commitments and Guarantees Notes of the Notes To Consolidated Financial Statements in such reports. Our forward-looking statements may also be subject to other risks and uncertainties, including those discussed elsewhere in this Report or in our other filings with the SEC.
The PNC Financial Services Group, Inc. – Form 10-Q 55
CONSOLIDATED INCOME STATEMENT
THE PNC FINANCIAL SERVICES GROUP, INC.
| Unaudited | Three months ended September 30 | Nine months ended September 30 | ||||||||||||||
| In millions, except per share data | 2015 | 2014 | 2015 | 2014 | ||||||||||||
Interest Income | ||||||||||||||||
Loans | $ | 1,804 | $ | 1,848 | $ | 5,397 | $ | 5,592 | ||||||||
Investment securities | 423 | 387 | 1,236 | 1,226 | ||||||||||||
Other | 114 | 93 | 332 | 276 | ||||||||||||
Total interest income | 2,341 | 2,328 | 6,965 | 7,094 | ||||||||||||
Interest Expense | ||||||||||||||||
Deposits | 107 | 81 | 297 | 239 | ||||||||||||
Borrowed funds | 172 | 143 | 482 | 427 | ||||||||||||
Total interest expense | 279 | 224 | 779 | 666 | ||||||||||||
Net interest income | 2,062 | 2,104 | 6,186 | 6,428 | ||||||||||||
Noninterest Income | ||||||||||||||||
Asset management | 376 | 411 | 1,168 | 1,137 | ||||||||||||
Consumer services | 341 | 320 | 986 | 933 | ||||||||||||
Corporate services | 384 | 374 | 1,097 | 1,018 | ||||||||||||
Residential mortgage | 125 | 140 | 453 | 483 | ||||||||||||
Service charges on deposits | 172 | 179 | 481 | 482 | ||||||||||||
Net gains (losses) on sales of securities | (9 | ) | – | 41 | 4 | |||||||||||
Other | 324 | 313 | 960 | 943 | ||||||||||||
Total noninterest income | 1,713 | 1,737 | 5,186 | 5,000 | ||||||||||||
Total revenue | 3,775 | 3,841 | 11,372 | 11,428 | ||||||||||||
Provision For Credit Losses | 81 | 55 | 181 | 221 | ||||||||||||
Noninterest Expense | ||||||||||||||||
Personnel | 1,222 | 1,189 | 3,579 | 3,441 | ||||||||||||
Occupancy | 209 | 200 | 634 | 617 | ||||||||||||
Equipment | 227 | 220 | 680 | 625 | ||||||||||||
Marketing | 64 | 66 | 193 | 186 | ||||||||||||
Other | 630 | 682 | 1,981 | 2,080 | ||||||||||||
Total noninterest expense | 2,352 | 2,357 | 7,067 | 6,949 | ||||||||||||
Income before income taxes and noncontrolling interests | 1,342 | 1,429 | 4,124 | 4,258 | ||||||||||||
Income taxes | 269 | 391 | 1,003 | 1,108 | ||||||||||||
Net income | 1,073 | 1,038 | 3,121 | 3,150 | ||||||||||||
Less: Net income (loss) attributable to noncontrolling interests | 18 | 1 | 23 | 2 | ||||||||||||
Preferred stock dividends and discount accretion and redemptions | 64 | 71 | 182 | 189 | ||||||||||||
Net income attributable to common shareholders | $ | 991 | $ | 966 | $ | 2,916 | $ | 2,959 | ||||||||
Earnings Per Common Share | ||||||||||||||||
Basic | $ | 1.93 | $ | 1.82 | $ | 5.64 | $ | 5.55 | ||||||||
Diluted | 1.90 | 1.79 | 5.52 | 5.45 | ||||||||||||
Average Common Shares Outstanding | ||||||||||||||||
Basic | 512 | 529 | 516 | 531 | ||||||||||||
Diluted | 520 | 537 | 525 | 539 | ||||||||||||
See accompanying Notes To Consolidated Financial Statements.
56 The PNC Financial Services Group, Inc. – Form 10-Q
CONSOLIDATED STATEMENT OF COMPREHENSIVE INCOME
THE PNC FINANCIAL SERVICES GROUP, INC.
Unaudited In millions | Three months ended September 30 | Nine months ended September 30 | ||||||||||||||
| 2015 | 2014 | 2015 | 2014 | |||||||||||||
Net income | $ | 1,073 | $ | 1,038 | $ | 3,121 | $ | 3,150 | ||||||||
Other comprehensive income (loss), before tax and net of reclassifications into Net income: | ||||||||||||||||
Net unrealized gains (losses) on non-OTTI securities | 154 | (132 | ) | (137 | ) | 269 | ||||||||||
Net unrealized gains (losses) on OTTI securities | 4 | 15 | 11 | 122 | ||||||||||||
Net unrealized gains (losses) on cash flow hedge derivatives | 234 | (81 | ) | 303 | (5 | ) | ||||||||||
Pension and other postretirement benefit plan adjustments | 7 | (2 | ) | 57 | 89 | |||||||||||
Other | (1 | ) | (12 | ) | (37 | ) | (5 | ) | ||||||||
Other comprehensive income (loss), before tax and net of reclassifications into Net income | 398 | (212 | ) | 197 | 470 | |||||||||||
Income tax benefit (expense) related to items of other comprehensive income | (162 | ) | 58 | (85 | ) | (179 | ) | |||||||||
Other comprehensive income (loss), after tax and net of reclassifications into Net income | 236 | (154 | ) | 112 | 291 | |||||||||||
Comprehensive income | 1,309 | 884 | 3,233 | 3,441 | ||||||||||||
Less: Comprehensive income (loss) attributable to noncontrolling interests | 18 | 1 | 23 | 2 | ||||||||||||
Comprehensive income attributable to PNC | $ | 1,291 | $ | 883 | $ | 3,210 | $ | 3,439 | ||||||||
See accompanying Notes To Consolidated Financial Statements.
The PNC Financial Services Group, Inc. – Form 10-Q 57
CONSOLIDATED BALANCE SHEET
THE PNC FINANCIAL SERVICES GROUP, INC.
Unaudited In millions, except par value | September 30 2015 | December 31 2014 | ||||||
Assets | ||||||||
Cash and due from banks (includes $5 and $6 for VIEs) (a) | $ | 3,835 | $ | 4,360 | ||||
Federal funds sold and resale agreements (includes $139 and $155 measured at fair value) (b) | 1,534 | 1,852 | ||||||
Trading securities | 1,901 | 2,353 | ||||||
Interest-earning deposits with banks (includes $5 and $6 for VIEs) (a) | 34,224 | 31,779 | ||||||
Loans held for sale (includes $1,888 and $2,154 measured at fair value) (b) | 2,060 | 2,262 | ||||||
Investment securities | 68,066 | 55,823 | ||||||
Loans (includes $1,354 and $1,606 for VIEs) (a) (includes $915 and $1,034 measured at fair value) (b) | 204,983 | 204,817 | ||||||
Allowance for loan and lease losses (includes $(43) and $(50) for VIEs) (a) | (3,237 | ) | (3,331 | ) | ||||
Net loans | 201,746 | 201,486 | ||||||
Goodwill | 9,103 | 9,103 | ||||||
Mortgage servicing rights | 1,467 | 1,351 | ||||||
Other intangible assets | 407 | 493 | ||||||
Equity investments (includes $114 and $492 for VIEs) (a) | 10,497 | 10,728 | ||||||
Other (includes $468 and $483 for VIEs) (a) (includes $349 and $412 measured at fair value) (b) | 27,285 | 23,482 | ||||||
Total assets | $ | 362,125 | $ | 345,072 | ||||
Liabilities | ||||||||
Deposits | ||||||||
Noninterest-bearing | $ | 78,239 | $ | 73,479 | ||||
Interest-bearing | 166,740 | 158,755 | ||||||
Total deposits | 244,979 | 232,234 | ||||||
Borrowed funds | ||||||||
Federal funds purchased and repurchase agreements | 2,077 | 3,510 | ||||||
Federal Home Loan Bank borrowings | 21,664 | 20,005 | ||||||
Bank notes and senior debt | 19,749 | 15,750 | ||||||
Subordinated debt | 9,242 | 9,151 | ||||||
Commercial paper | 1,125 | 4,995 | ||||||
Other (includes $207 and $347 for VIEs) (a) (includes $136 and $273 measured at fair value) (b) | 2,806 | 3,357 | ||||||
Total borrowed funds | 56,663 | 56,768 | ||||||
Allowance for unfunded loan commitments and letters of credit | 266 | 259 | ||||||
Accrued expenses (includes $55 and $70 for VIEs) (a) | 5,185 | 5,187 | ||||||
Other (includes $95 and $206 for VIEs) (a) | 8,754 | 4,550 | ||||||
Total liabilities | 315,847 | 298,998 | ||||||
Equity | ||||||||
Preferred stock (c) | ||||||||
Common stock ($5 par value, authorized 800 shares, issued 542 and 541 shares) | 2,708 | 2,705 | ||||||
Capital surplus – preferred stock | 3,450 | 3,946 | ||||||
Capital surplus – common stock and other | 12,675 | 12,627 | ||||||
Retained earnings | 28,337 | 26,200 | ||||||
Accumulated other comprehensive income (loss) | 615 | 503 | ||||||
Common stock held in treasury at cost: 32 and 18 shares | (2,837 | ) | (1,430 | ) | ||||
Total shareholders' equity | 44,948 | 44,551 | ||||||
Noncontrolling interests | 1,330 | 1,523 | ||||||
Total equity | 46,278 | 46,074 | ||||||
Total liabilities and equity | $ | 362,125 | $ | 345,072 | ||||
| (a) | Amounts represent the assets or liabilities of consolidated variable interest entities (VIEs). |
| (b) | Amounts represent items for which we have elected the fair value option. |
| (c) | Par value less than $.5 million at each date. |
See accompanying Notes To Consolidated Financial Statements.
58 The PNC Financial Services Group, Inc. – Form 10-Q
CONSOLIDATED STATEMENT OF CASH FLOWS
THE PNC FINANCIAL SERVICES GROUP, INC.
Unaudited In millions | Nine months ended September 30 | |||||||
| 2015 | 2014 | |||||||
Operating Activities | ||||||||
Net income | $ | 3,121 | $ | 3,150 | ||||
Adjustments to reconcile net income to net cash provided (used) by operating activities | ||||||||
Provision for credit losses | 181 | 221 | ||||||
Depreciation and amortization | 802 | 724 | ||||||
Deferred income taxes | 128 | 50 | ||||||
Net gains on sales of securities | (41 | ) | (4 | ) | ||||
Changes in fair value of mortgage servicing rights | 297 | 308 | ||||||
Gain on sales of Visa Class B common shares | (122 | ) | (173 | ) | ||||
Undistributed earnings of BlackRock | (292 | ) | (334 | ) | ||||
Excess tax benefits from share-based payment arrangements | (33 | ) | (23 | ) | ||||
Net change in | ||||||||
Trading securities and other short-term investments | 165 | 628 | ||||||
Loans held for sale | (86 | ) | (220 | ) | ||||
Other assets | (2,415 | ) | 170 | |||||
Accrued expenses and other liabilities | 2,280 | 332 | ||||||
Other | (385 | ) | (249 | ) | ||||
Net cash provided (used) by operating activities | 3,600 | 4,580 | ||||||
Investing Activities | ||||||||
Sales | ||||||||
Securities available for sale | 3,341 | 3,564 | ||||||
Loans | 1,613 | 1,866 | ||||||
Repayments/maturities | ||||||||
Securities available for sale | 6,013 | 5,349 | ||||||
Securities held to maturity | 1,541 | 1,648 | ||||||
Purchases | ||||||||
Securities available for sale | (17,546 | ) | (5,057 | ) | ||||
Securities held to maturity | (3,735 | ) | ||||||
Loans | (564 | ) | (544 | ) | ||||
Net change in | ||||||||
Federal funds sold and resale agreements | 317 | 222 | ||||||
Interest-earning deposits with banks | (2,445 | ) | (14,112 | ) | ||||
Loans | (1,502 | ) | (7,206 | ) | ||||
Other | (567 | ) | (277 | ) | ||||
Net cash provided (used) by investing activities | (13,534 | ) | (14,547 | ) | ||||
The PNC Financial Services Group, Inc. – Form 10-Q 59
(continued on following page)
CONSOLIDATED STATEMENT OF CASH FLOWS
THE PNC FINANCIAL SERVICES GROUP, INC.
(continued from previous page)
Unaudited In millions | Nine months ended September 30 | |||||||
| 2015 | 2014 | |||||||
Financing Activities | ||||||||
Net change in | ||||||||
Noninterest-bearing deposits | $ | 4,772 | $ 2,672 | |||||
Interest-bearing deposits | 7,985 | 2,716 | ||||||
Federal funds purchased and repurchase agreements | (1,433 | ) | (789 | ) | ||||
Commercial paper | (2 | ) | (268 | ) | ||||
Other borrowed funds | 276 | (156 | ) | |||||
Sales/issuances | ||||||||
Federal Home Loan Bank borrowings | 2,250 | 10,150 | ||||||
Bank notes and senior debt | 6,428 | 4,933 | ||||||
Subordinated debt | 745 | |||||||
Commercial paper | 1,394 | 6,737 | ||||||
Other borrowed funds | 613 | 470 | ||||||
Common and treasury stock | 130 | 203 | ||||||
Repayments/maturities | ||||||||
Federal Home Loan Bank borrowings | (591 | ) | (6,591 | ) | ||||
Bank notes and senior debt | (2,629 | ) | (2,194 | ) | ||||
Subordinated debt | 57 | 34 | ||||||
Commercial paper | (5,262 | ) | (6,657 | ) | ||||
Other borrowed funds | (1,557 | ) | (374 | ) | ||||
Preferred stock redemption | (500 | ) | ||||||
Excess tax benefits from share-based payment arrangements | 33 | 23 | ||||||
Acquisition of treasury stock | (1,598 | ) | (633 | ) | ||||
Preferred stock cash dividends paid | (178 | ) | (185 | ) | ||||
Common stock cash dividends paid | (779 | ) | (748 | ) | ||||
Net cash provided (used) by financing activities | 9,409 | 10,088 | ||||||
Net Increase (Decrease) In Cash And Due From Banks | (525 | ) | 121 | |||||
Cash and due from banks at beginning of period | 4,360 | 4,043 | ||||||
Cash and due from banks at end of period | $ | 3,835 | $ 4,164 | |||||
Supplemental Disclosures | ||||||||
Interest paid | $ | 764 | $ 627 | |||||
Income taxes paid | 527 | 689 | ||||||
Income taxes refunded | 2 | 9 | ||||||
Non-cash Investing and Financing Items | ||||||||
Transfer from (to) loans to (from) loans held for sale, net | 153 | 485 | ||||||
Transfer from loans to foreclosed assets | 340 | 465 | ||||||
See accompanying Notes To Consolidated Financial Statements.
60 The PNC Financial Services Group, Inc. – Form 10-Q
NOTES TO CONSOLIDATED FINANCIAL STATEMENTS (UNAUDITED)
T HE PNC F INANCIAL S ERVICES G ROUP , I NC .
B USINESS
The PNC Financial Services Group, Inc. (PNC) is one of the largest diversified financial services companies in the United States and is headquartered in Pittsburgh, Pennsylvania.
We have businesses engaged in retail banking, corporate and institutional banking, asset management and residential mortgage banking, providing many of our products and services nationally, as well as other products and services in our primary geographic markets located in Pennsylvania, Ohio, New Jersey, Michigan, Illinois, Maryland, Indiana, North Carolina, Florida, Kentucky, Washington, D.C., Delaware, Virginia, Alabama, Missouri, Georgia, Wisconsin and South Carolina. We also provide certain products and services internationally.
N OTE 1 A CCOUNTING P OLICIES
Basis Of Financial Statement Presentation
Our consolidated financial statements include the accounts of the parent company and its subsidiaries, most of which are wholly-owned, and certain partnership interests and variable interest entities.
We prepared these consolidated financial statements in accordance with accounting principles generally accepted in the United States of America (GAAP). We have eliminated intercompany accounts and transactions. We have also reclassified certain prior year amounts to conform to the 2015 presentation, which did not have a material impact on our consolidated financial condition or results of operations. Additionally, we evaluate the materiality of identified errors in the financial statements using both an income statement and a balance sheet approach, based on relevant quantitative and qualitative factors. The consolidated financial statements include certain adjustments to correct immaterial errors related to previously reported periods.
In our opinion, the unaudited interim consolidated financial statements reflect all normal, recurring adjustments needed to present fairly our results for the interim periods. The results of operations for interim periods are not necessarily indicative of the results that may be expected for the full year or any other interim period.
When preparing these unaudited interim consolidated financial statements, we have assumed that you have read the audited consolidated financial statements included in our 2014 Annual Report on Form 10-K. Reference is made to Note 1 Accounting Policies in the 2014 Form 10-K for a detailed description of significant accounting policies. Included herein are policies that are required to be disclosed on an interim basis as well as policies where there has been a significant change within the first nine months of 2015. These interim consolidated financial statements serve to update the 2014 Form 10-K and may not include all information and notes necessary to constitute a complete set of financial statements.
We have also considered the impact of subsequent events on these consolidated financial statements.
Use Of Estimates
We prepared these consolidated financial statements using financial information available at the time of preparation, which requires us to make estimates and assumptions that affect the amounts reported. Our most significant estimates pertain to our fair value measurements, allowances for loan and lease losses and unfunded loan commitments and letters of credit, and accretion on purchased impaired loans. Actual results may differ from the estimates and the differences may be material to the consolidated financial statements.
The PNC Financial Services Group, Inc. – Form 10-Q 61
Nonperforming Loans and Leases
The matrix below summarizes PNC's policies for classifying certain loans as nonperforming loans and/or discontinuing the accrual of loan interest income.
| Commercial loans | ||
| Loans Classified as Nonperforming and Accounted for as Nonaccrual | • Loans accounted for at amortized cost where: | |
– The loan is 90 days or more past due. | ||
– The loan is rated substandard or worse due to the determination that full collection of principal and interest is not probable as demonstrated by the following conditions: | ||
• The collection of principal or interest is 90 days or more past due; | ||
• Reasonable doubt exists as to the certainty of the borrower's future debt service ability, according to the terms of the credit arrangement, regardless of whether 90 days have passed or not; | ||
• The borrower has filed or will likely file for bankruptcy; | ||
• The bank advances additional funds to cover principal or interest; | ||
• We are in the process of liquidating a commercial borrower; or | ||
• We are pursuing remedies under a guarantee. | ||
| Loans Excluded from Nonperforming Classification but Accounted for as Nonaccrual | • Loans accounted for under the fair value option and full collection of principal and interest is not probable.
• Loans accounted for at the lower of cost or market less costs to sell (Held for Sale) and full collection of principal and interest is not probable. | |
| Loans Excluded from Nonperforming Classification and Nonaccrual Accounting | • Purchased impaired loans because interest income is accreted by nature of the accounting for these assets.
• Loans that are well secured and in the process of collection. | |
| Consumer loans | ||
| Loans Classified as Nonperforming and Accounted for as Nonaccrual | • Loans accounted for at amortized cost where full collection of contractual principal and interest is not deemed probable as demonstrated in the policies below: | |
– The loan is 90 days past due for home equity and installment loans, and 180 days past due for well secured residential real estate loans; | ||
– The loan has been modified and classified as a troubled debt restructuring (TDR); | ||
– Notification of bankruptcy has been received and the loan is 30 days or more past due; | ||
– The bank holds a subordinate lien position in the loan and the first lien loan is seriously stressed (i.e., 90 days or more past due); | ||
– Other loans within the same borrower relationship have been placed on nonaccrual or charge-offs have been taken on them; | ||
– The bank has repossessed non-real estate collateral securing the loan; or | ||
– The bank has charged-off the loan to the value of the collateral. | ||
| Loans Excluded from Nonperforming Classification but Accounted for as Nonaccrual | • Loans accounted for under the fair value option and full collection of principal and interest is not probable.
• Loans accounted for at the lower of cost or market less costs to sell (Held for Sale) and full collection of principal and interest is not probable. | |
| Loans Excluded from Nonperforming Classification and Nonaccrual Accounting | • Purchased impaired loans because interest income is accreted through the accounting model. | |
• Certain government insured loans where substantially all principal and interest is insured. | ||
• Residential real estate loans that are well secured and in the process of collection. | ||
• Consumer loans and lines of credit, not secured by residential real estate, as permitted by regulatory guidance. | ||
See Note 3 Asset Quality in this Report for additional detail on nonperforming assets and asset quality indicators for commercial and consumer loans.
62 The PNC Financial Services Group, Inc. – Form 10-Q
Commercial Loans
We generally charge off Commercial Lending (Commercial, Commercial Real Estate, and Equipment Lease Financing) nonperforming loans when we determine that a specific loan, or portion thereof, is uncollectible. This determination is based on the specific facts and circumstances of the individual loans. In making this determination, we consider the viability of the business or project as a going concern, the past due status when the asset is not well-secured, the expected cash flows to repay the loan, the value of the collateral, and the ability and willingness of any guarantors to perform.
Additionally, in general, for smaller dollar commercial loans of $1 million or less, a partial or full charge-off occurs at 120 days past due for term loans and 180 days past due for revolvers. Certain small business credit card balances that are placed on nonaccrual status when they become 90 days or more past due are charged-off at 180 days past due.
Consumer Loans
Home equity installment loans, home equity lines of credit, and residential real estate loans that are not well-secured and in the process of collection are charged-off at no later than 180 days past due. At that time, the basis in the loan is reduced to the fair value of the collateral less costs to sell. In addition to this policy, the bank recognizes a charge-off on a secured consumer loan when:
| • | The bank holds a subordinate lien position in the loan and a foreclosure notice has been received on the first lien loan; |
| • | The bank holds a subordinate lien position in the loan which is 30 days or more past due with a combined loan to value ratio of greater than or equal to 110% and the first lien loan is seriously stressed ( i.e ., 90 days or more past due); |
| • | The loan is modified or otherwise restructured in a manner that results in the loan becoming collateral dependent; |
| • | Notification of bankruptcy has been received within the last 60 days and the loan is 60 days or more past due; |
| • | The borrower has been discharged from personal liability through Chapter 7 bankruptcy and has not formally reaffirmed his or her loan obligation to PNC; or |
| • | The collateral securing the loan has been repossessed and the value of the collateral is less than the recorded investment of the loan outstanding. |
For loans that continue to meet any of the above policies, collateral values are updated annually and subsequent declines in collateral values are charged-off resulting in incremental provision for credit loss.
Most consumer loans and lines of credit, not secured by residential real estate, are charged off after 120-180 days past due.
Accounting for Nonperforming Loans and Leases and Other Nonaccrual Loans
For accrual loans, interest income is accrued on a monthly basis and certain fees and costs are deferred upon origination and recognized in income over the term of the loan utilizing an effective yield method. For nonaccrual loans, interest income accrual and deferred fee/cost amortization is discontinued. Additionally, the current year accrued and uncollected interest is reversed through Net interest income and prior year accrued and uncollected interest is charged-off. Nonaccrual loans may also be charged-off to reduce the basis to the fair value of collateral less costs to sell.
If payment is received on a nonaccrual loan, generally the payment is first applied to the recorded investment; payments are then applied to recover any charged-off amounts related to the loan. Finally, if both recorded investment and any charge-offs have been recovered, then the payment will be recorded as fee and interest income.
For TDRs, payments are applied based upon their contractual terms unless the related loan is deemed non-performing. TDRs are generally included in nonperforming and nonaccrual loans until returned to performing/accruing status through performance under restructured terms and other performance indicators for a reasonable period of time demonstrating that the bank expects to collect all of the loan's remaining contractual principal and interest. TDRs resulting from 1) borrowers that have been discharged from personal liability through Chapter 7 bankruptcy and have not formally reaffirmed their loan obligations to PNC and 2) borrowers that are not currently obligated to make both principal and interest payments under the restructured terms are not returned to accrual status.
Other nonaccrual loans are generally not returned to accrual status until the borrower has performed in accordance with the contractual terms and other performance indicators for at least six months, the period of time which was determined to demonstrate the expected collection of the loan's remaining contractual principal and interest. When a nonperforming loan is returned to accrual status, it is then considered a performing loan.
See Note 3 Asset Quality and Note 5 Allowances for Loan and Lease Losses and Unfunded Loan Commitments and Letters of Credit in this Report and in our 2014 Form 10-K for additional TDR information.
Allowance f or Loan and Lease Losses
We maintain the ALLL at a level that we believe to be appropriate to absorb estimated probable credit losses incurred in the loan and lease portfolios as of the balance sheet date. Our determination of the allowance is based on periodic evaluations of these loan and lease portfolios and other relevant factors. This critical estimate includes significant use
The PNC Financial Services Group, Inc. – Form 10-Q 63
of PNC's own historical data and complex methods to interpret this data. These evaluations are inherently subjective, as they require material estimates and may be susceptible to significant change, and include, among others:
| • | Probability of default (PD), |
| • | Loss given default (LGD), |
| • | Outstanding balance of the loan, |
| • | Movement through delinquency stages, |
| • | Amounts and timing of expected future cash flows, |
| • | Value of collateral, which may be obtained from third parties, and |
| • | Qualitative factors, such as changes in current economic conditions, that may not be reflected in modeled results. |
For all loans, except purchased impaired loans, the ALLL is the sum of three components: (i) asset specific/individual impaired reserves, (ii) quantitative (formulaic or pooled) reserves and (iii) qualitative (judgmental) reserves.
The reserve calculation and determination process is dependent on the use of key assumptions. Key reserve assumptions and estimation processes react to and are influenced by observed changes in loan portfolio performance experience, the financial strength of the borrower, and economic conditions. Key reserve assumptions are periodically updated.
Asset Specific/Individual Component
Nonperforming loans that are considered impaired under ASC 310 – Receivables, which include all commercial and consumer TDRs, are evaluated for a specific reserve. Specific reserve allocations are determined as follows:
| • | For commercial nonperforming loans and commercial TDRs greater than or equal to a defined dollar threshold, specific reserves are based on an analysis of the present value of the loan's expected future cash flows, the loan's observable market price or the fair value of the collateral. |
| • | For commercial nonperforming loans and commercial TDRs below the defined dollar threshold, the individual loan's loss given default (LGD) percentage is multiplied by the loan balance and the results are aggregated for purposes of measuring specific reserve impairment. |
| • | Consumer nonperforming loans are collectively reserved for unless classified as consumer TDRs. For consumer TDRs, specific reserves are determined through an analysis of the present value of the loan's expected future cash flows, except for those instances where loans have been deemed collateral dependent, including loans where borrowers have been discharged from personal liability through Chapter 7 bankruptcy and have not formally reaffirmed their loan obligations to PNC. Once that determination has been made, those TDRs are charged down to the fair value of the collateral less costs to sell at each period end. |
Commercial Lending Quantitative Component
The estimates of the quantitative component of ALLL for incurred losses within the commercial lending portfolio segment are determined through statistical loss modeling utilizing PD, LGD and outstanding balance of the loan. Based upon loan risk ratings, we assign PDs and LGDs. Each of these statistical parameters is determined based on internal historical data and market data. PD is influenced by such factors as liquidity, industry, obligor financial structure, access to capital and cash flow. LGD is influenced by collateral type, original and/or updated loan-to-value ratio (LTV), facility structure and other factors.
Consumer Lending Quantitative Component
Quantitative estimates within the consumer lending portfolio segment are calculated primarily using a roll-rate model based on statistical relationships, calculated from historical data that estimate the movement of loan outstandings through the various stages of delinquency and ultimately charge-off over our loss emergence period.
Qualitative Component
While our reserve methodologies strive to reflect all relevant risk factors, there continues to be uncertainty associated with, but not limited to, potential imprecision in the estimation process due to the inherent time lag of obtaining information and normal variations between estimates and actual outcomes. We provide additional reserves that are designed to provide coverage for losses attributable to such risks. The ALLL also includes factors that may not be directly measured in the determination of specific or pooled reserves. Such qualitative factors may include:
| • | Industry concentrations and conditions, |
| • | Recent credit quality trends, |
| • | Recent loss experience in particular portfolios, |
| • | Recent macro-economic factors, |
| • | Model imprecision, |
| • | Changes in lending policies and procedures, |
| • | Timing of available information, including the performance of first lien positions, and |
| • | Limitations of available historical data. |
Allowance for Purchased Non-Impaired Loans
ALLL for purchased non-impaired loans is determined based upon a comparison between the methodologies described above and the remaining acquisition date fair value discount that has yet to be accreted into interest income. After making the comparison, an ALLL is recorded for the amount greater than the discount, or no ALLL is recorded if the discount is greater.
Allowance for Purchased Impaired Loans
ALLL for purchased impaired loans is determined in accordance with ASC 310-30 by comparing the net present value of the cash flows expected to be collected to the recorded investment for a given loan (or pool of loans). In cases where the net present value of expected cash flows is
64 The PNC Financial Services Group, Inc. – Form 10-Q
lower than the recorded investment, ALLL is established. Cash flows expected to be collected represent management's best estimate of the cash flows expected over the life of a loan (or pool of loans). For large balance commercial loans, cash flows are separately estimated at the loan level. For smaller balance pooled loans, pool cash flows are estimated using cash flow models. Pools were defined at acquisition based on the risk characteristics of the loan. Our cash flow models use loan data including, but not limited to, contractual loan balance, delinquency status of the loan, updated borrower FICO credit scores, geographic information, historical loss experience, and updated LTVs, as well as best estimates for changes in unemployment rates, home prices and other economic factors, to determine estimated cash flows.
See Note 4 Purchased Loans and Note 5 Allowances for Loan and Lease Losses and Unfunded Loan Commitments and Letters of Credit for additional loan data and application of the policies disclosed herein.
Our credit risk management policies, procedures and practices are designed to promote sound lending standards and prudent credit risk management. We have policies, procedures and practices that address financial statement requirements, collateral review and appraisal requirements, advance rates based upon collateral types, appropriate levels of exposure, cross-border risk, lending to specialized industries or borrower type, guarantor requirements, and regulatory compliance.
Allowance for Unfunded Loan Commitments and Letters of Credit
We maintain the allowance for unfunded loan commitments and letters of credit at a level we believe is appropriate to absorb estimated probable credit losses incurred on these unfunded credit facilities as of the balance sheet date. We determine the allowance based on periodic evaluations of the unfunded credit facilities, including an assessment of the probability of commitment usage, credit risk factors, and, solely for commercial lending, the terms and expiration dates of the unfunded credit facilities. Other than the estimation of the probability of funding, the reserve for unfunded loan commitments is estimated in a manner similar to the methodology used for determining reserves for funded exposures. The allowance for unfunded loan commitments and letters of credit is recorded as a liability on the Consolidated Balance Sheet. Net adjustments to the allowance for unfunded loan commitments and letters of credit are included in the provision for credit losses.
See Note 5 Allowances for Loan and Lease Losses and Unfunded Loan Commitments and Letters of Credit for additional loan data and application of the policies disclosed herein.
Earnings Per Common Share
Basic earnings per common share is calculated using the two-class method to determine income attributable to common shareholders. Unvested share-based payment awards that contain nonforfeitable rights to dividends or dividend equivalents are considered participating securities under the two-class method. Income attributable to common shareholders is then divided by the weighted-average common shares outstanding for the period.
Diluted earnings per common share is calculated under the more dilutive of either the treasury method or the two-class method. For the diluted calculation, we increase the weighted-average number of shares of common stock outstanding by the assumed conversion of outstanding convertible preferred stock from the beginning of the year or date of issuance, if later, and the number of shares of common stock that would be issued assuming the exercise of stock options and warrants and the issuance of incentive shares using the treasury stock method. These adjustments to the weighted-average number of shares of common stock outstanding are made only when such adjustments will dilute earnings per common share. See Note 12 Earnings Per Share for additional information.
Recently Adopted Accounting Standards
We did not adopt any new accounting standards during the third quarter of 2015.
N OTE 2 L OAN S ALE AND S ERVICING A CTIVITIES AND V ARIABLE I NTEREST E NTITIES
Loan Sale and Servicing Activities
As more fully described in Note 2 Loan Sale and Servicing Activities and Variable Interest Entities in our 2014 Form 10-K, we have transferred residential and commercial mortgage loans in securitization or sales transactions in which we have continuing involvement. Our continuing involvement generally consists of servicing, repurchasing previously transferred loans under certain conditions and loss share arrangements, and, in limited circumstances, holding of mortgage-backed securities issued by the securitization SPEs.
We earn servicing and other ancillary fees for our role as servicer and, depending on the contractual terms of the servicing arrangement, we can be terminated as servicer with or without cause. At the consummation date of each type of loan transfer where PNC retains the servicing, we recognize a servicing right at fair value. See Note 8 Goodwill and Other Intangible Assets for information on our servicing rights, including the carrying value of servicing assets.
The PNC Financial Services Group, Inc. – Form 10-Q 65
The following table provides cash flows associated with PNC's loan sale and servicing activities:
Table 51: Cash Flows Associated with Loan Sale and Servicing Activities
| In millions | Residential Mortgages | Commercial Mortgages (a) | Home Equity Loans/Lines (b) | |||||||||
CASH FLOWS – Three months ended September 30, 2015 | ||||||||||||
Sales of loans (c) | $ | 2,329 | $ | 846 | ||||||||
Repurchases of previously transferred loans (d) | 129 | $ | 90 | |||||||||
Servicing fees (e) | 84 | 35 | 4 | |||||||||
Servicing advances recovered/(funded), net | 32 | (6 | ) | 3 | ||||||||
Cash flows on mortgage-backed securities held (f) | 424 | 41 | ||||||||||
CASH FLOWS – Three months ended September 30, 2014 | ||||||||||||
Sales of loans (c) | $ | 2,153 | $ | 1,091 | ||||||||
Repurchases of previously transferred loans (d) | 188 | $ | 4 | |||||||||
Servicing fees (e) | 86 | 34 | 4 | |||||||||
Servicing advances recovered/(funded), net | 15 | 38 | ||||||||||
Cash flows on mortgage-backed securities held (f) | 238 | 51 | ||||||||||
CASH FLOWS – Nine months ended September 30, 2015 | ||||||||||||
Sales of loans (c) | $ | 6,284 | $ | 3,025 | ||||||||
Repurchases of previously transferred loans (d) | 432 | $ | 92 | |||||||||
Servicing fees (e) | 249 | 103 | 12 | |||||||||
Servicing advances recovered/(funded), net | 70 | 22 | 28 | |||||||||
Cash flows on mortgage-backed securities held (f) | 1,093 | 155 | ||||||||||
CASH FLOWS – Nine months ended September 30, 2014 | ||||||||||||
Sales of loans (c) | $ | 6,437 | $ | 2,026 | ||||||||
Repurchases of previously transferred loans (d) | 556 | $ | 13 | |||||||||
Servicing fees (e) | 260 | 101 | 14 | |||||||||
Servicing advances recovered/(funded), net | 84 | 93 | 6 | |||||||||
Cash flows on mortgage-backed securities held (f) | 724 | 242 | ||||||||||
| (a) | Represents cash flow information associated with both commercial mortgage loan transfer and servicing activities. |
| (b) | These activities were part of an acquired brokered home equity lending business in which PNC is no longer engaged. |
| (c) | Gains/losses recognized on sales of loans were insignificant for the periods presented. |
| (d) | Includes government insured or guaranteed loans eligible for repurchase through the exercise of our ROAP option and loans repurchased due to breaches of origination covenants or representations and warranties made to purchasers. |
| (e) | Includes contractually specified servicing fees, late charges and ancillary fees. |
| (f) | Represents cash flows on securities we hold issued by a securitization SPE in which PNC transferred to and/or services loans. The carrying value of such securities held were $5.8 billion in residential mortgage-backed securities and $1.1 billion in commercial mortgage-backed securities at September 30, 2015 and $3.5 billion in residential mortgage-backed securities and $1.2 billion in commercial mortgage-backed securities at September 30, 2014. Additionally, at December 31, 2014, the carrying value of such securities held were $3.4 billion in residential mortgage-backed securities and $1.3 billion in commercial mortgage-backed securities. |
66 The PNC Financial Services Group, Inc. – Form 10-Q
The table below presents information about the principal balances of transferred loans that we service and are not recorded on our Consolidated Balance Sheet. We would only experience a loss on these transferred loans if we were required to repurchase a loan due to a breach in representations and warranties or a loss sharing arrangement associated with our continuing involvement of these loans. For more information regarding our recourse and repurchase obligations, including our reserve of estimated losses, see the Recourse and Repurchase Obligations section of Note 16 Commitments and Guarantees.
Table 52: Principal Balance, Delinquent Loans, and Net Charge-offs Related to Serviced Loans For Others
| In millions | Residential Mortgages | Commercial Mortgages (a) | Home Equity Loans/Lines (b) | |||||||||
September 30, 2015 | ||||||||||||
Total principal balance | $ | 74,338 | $ | 53,466 | $ | 3,009 | ||||||
Delinquent loans (c) | 2,014 | 792 | 933 | |||||||||
December 31, 2014 | ||||||||||||
Total principal balance | $ | 79,108 | $ | 60,873 | $ | 3,833 | ||||||
Delinquent loans (c) | 2,657 | 707 | 1,303 | |||||||||
Three months ended September 30, 2015 | ||||||||||||
Net charge-offs (d) | $ | 23 | $ | 236 | $ | 6 | ||||||
Three months ended September 30, 2014 | ||||||||||||
Net charge-offs (d) | $ | 33 | $ | 439 | $ | 15 | ||||||
Nine months ended September 30, 2015 | ||||||||||||
Net charge-offs (d) | $ | 92 | $ | 491 | $ | 21 | ||||||
Nine months ended September 30, 2014 | ||||||||||||
Net charge-offs (d) | $ | 108 | $ | 1,139 | $ | 47 | ||||||
| (a) | Represents information at the securitization level in which PNC has sold loans and is the servicer for the securitization. |
| (b) | These activities were part of an acquired brokered home equity lending business in which PNC is no longer engaged. |
| (c) | Serviced delinquent loans are 90 days or more past due or are in process of foreclosure. |
| (d) | Net charge-offs for Residential mortgages and Home equity loans/lines represent credit losses less recoveries distributed and as reported to investors during the period. Net charge-offs for Commercial mortgages represent credit losses less recoveries distributed and as reported by the trustee for CMBS securitizations. Realized losses for Agency securitizations are not reflected as we do not manage the underlying real estate upon foreclosure and, as such, do not have access to loss information. |
The PNC Financial Services Group, Inc. – Form 10-Q 67
Variable Interest Entities (VIEs)
As discussed in Note 2 Loan Sale and Servicing Activities and Variable Interest Entities in our 2014 Form 10-K, we are involved with various entities in the normal course of business that are deemed to be VIEs. The following provides a summary of VIEs, including those that we have consolidated and those in which we hold variable interests but have not consolidated into our financial statements as of September 30, 2015 and December 31, 2014, respectively. We have not provided additional financial support to these entities which we are not contractually required to provide.
Table 53: Consolidated VIEs – Carrying Value (a) (b)
September 30, 2015 In millions | Credit Card and Other Securitization Trusts | Tax Credit Investments | Total | |||||||||
Assets | ||||||||||||
Cash and due from banks | $ | 5 | $ | 5 | ||||||||
Interest-earning deposits with banks | 5 | 5 | ||||||||||
Loans | $ | 1,348 | 6 | 1,354 | ||||||||
Allowance for loan and lease losses | (43 | ) | (43 | ) | ||||||||
Equity investments | 114 | 114 | ||||||||||
Other assets | 19 | 449 | 468 | |||||||||
Total assets | $ | 1,324 | $ | 579 | $ | 1,903 | ||||||
Liabilities | ||||||||||||
Other borrowed funds | $ | 51 | $ | 156 | $ | 207 | ||||||
Accrued expenses | 55 | 55 | ||||||||||
Other liabilities | 95 | 95 | ||||||||||
Total liabilities | $ | 51 | $ | 306 | $ | 357 | ||||||
December 31, 2014 In millions | Credit Card and Other Securitization Trusts | Tax Credit Investments | Total | |||||||||
Assets | ||||||||||||
Cash and due from banks | $ | 6 | $ | 6 | ||||||||
Interest-earning deposits with banks | 6 | 6 | ||||||||||
Loans | $ | 1,606 | 1,606 | |||||||||
Allowance for loan and lease losses | (50 | ) | (50 | ) | ||||||||
Equity investments | 492 | 492 | ||||||||||
Other assets | 31 | 452 | 483 | |||||||||
Total assets | $ | 1,587 | $ | 956 | $ | 2,543 | ||||||
Liabilities | ||||||||||||
Other borrowed funds | $ | 166 | $ | 181 | $ | 347 | ||||||
Accrued expenses | 70 | 70 | ||||||||||
Other liabilities | 206 | 206 | ||||||||||
Total liabilities | $ | 166 | $ | 457 | $ | 623 | ||||||
| (a) | Amounts represent carrying value on PNC's Consolidated Balance Sheet. |
| (b) | Difference between total assets and total liabilities represents the equity portion of the VIE or intercompany assets and liabilities which are eliminated in consolidation. |
68 The PNC Financial Services Group, Inc. – Form 10-Q
Table 54: Non-Consolidated VIEs
| In millions | PNC Risk of Loss (a) | Carrying Value of Assets Owned by PNC | Carrying Value of Liabilities Owned by PNC | |||||||||
September 30, 2015 | ||||||||||||
Commercial Mortgage-Backed Securitizations (b) | $ | 1,314 | $ | 1,314 | (c) | |||||||
Residential Mortgage-Backed Securitizations (b) | 5,783 | 5,783 | (c) | $ | 1 | (e) | ||||||
Tax Credit Investments and Other | 2,388 | 2,447 | (d) | 719 | (f) | |||||||
Total | $ | 9,485 | $ | 9,544 | $ | 720 | ||||||
| In millions | PNC Risk of Loss (a) | Carrying Value of Assets Owned by PNC | Carrying Value of Liabilities Owned by PNC | |||||||||
December 31, 2014 | ||||||||||||
Commercial Mortgage-Backed Securitizations (b) | $ | 1,550 | $ | 1,550 | (c) | $ | 1 | (e) | ||||
Residential Mortgage-Backed Securitizations (b) | 3,385 | 3,385 | (c) | 4 | (e) | |||||||
Tax Credit Investments and Other | 2,270 | 2,304 | (d) | 777 | (f) | |||||||
Total | $ | 7,205 | $ | 7,239 | $ | 782 | ||||||
| (a) | This represents loans, investments and other assets related to non-consolidated VIEs, net of collateral (if applicable). |
| (b) | Amounts reflect involvement with securitization SPEs where PNC transferred to and/or services loans for an SPE and we hold securities issued by that SPE. Values disclosed in the PNC Risk of Loss column represent our maximum exposure to loss for those securities' holdings. Additionally, we also invest in other mortgage and asset-backed securities issued by third-party VIEs with which we have no continuing involvement. Further information on these securities is included in Note 6 Investment Securities. |
| (c) | Included in Trading securities, Investment securities, Other intangible assets and Other assets on our Consolidated Balance Sheet. |
| (d) | Included in Loans, Equity investments and Other assets on our Consolidated Balance Sheet. |
| (e) | Included in Other liabilities on our Consolidated Balance Sheet. |
| (f) | Included in Deposits and Other liabilities on our Consolidated Balance Sheet. |
Our involvement with VIEs is discussed in further detail in Note 2 Loan Sale and Servicing Activities and Variable Interest Entities in our 2014 Form 10-K.
N OTE 3 A SSET Q UALITY
Asset Quality
We closely monitor economic conditions and loan performance trends to manage and evaluate our exposure to credit risk. Trends in delinquency rates may be a key indicator, among other considerations, of credit risk within the loan portfolios. The measurement of delinquency status is based on the contractual terms of each loan. Loans that are 30 days or more past due in terms of payment are considered delinquent. Loan delinquencies exclude loans held for sale, purchased impaired loans, nonperforming loans and loans accounted for under the fair value option which are on nonaccrual status, but include government insured or guaranteed loans and accruing loans accounted for under the fair value option.
Nonperforming assets include nonperforming loans and leases, OREO and foreclosed assets, and nonperforming TDRs. Nonperforming loans are those loans accounted for at amortized cost whose credit quality has deteriorated to the extent that full collection of contractual principal and interest is not probable. Interest income is not recognized on these loans. Loans accounted for under the fair value option are reported as performing loans as these loans are accounted for at fair value. However, when nonaccrual criteria is met, interest income is not recognized on these loans. Additionally, certain government insured or guaranteed loans for which we expect to collect substantially all principal and interest are not reported as nonperforming loans and continue to accrue interest. Purchased impaired loans are excluded from nonperforming loans as we are currently accreting interest income over the expected life of the loans. See Note 4 Purchased Loans for further information.
See Note 1 Accounting Policies for additional delinquency, nonperforming, and charge-off information.
The PNC Financial Services Group, Inc. – Form 10-Q 69
The following tables display the delinquency status of our loans and our nonperforming assets at September 30, 2015 and December 31, 2014, respectively.
Table 55: Analysis of Loan Portfolio (a)
| Accruing | ||||||||||||||||||||||||||||||||||||
| Dollars in millions | Current or Less Than 30 Days Past Due | 30-59 Days Past Due | 60-89 Days Past Due | 90 Days Or More Past Due | Total Past Due (b) | Nonperforming Loans | Fair Value Option Nonaccrual Loans (c) | Purchased Impaired Loans | Total Loans | |||||||||||||||||||||||||||
September 30, 2015 | ||||||||||||||||||||||||||||||||||||
Commercial Lending | ||||||||||||||||||||||||||||||||||||
Commercial | $ | 96,952 | $ | 56 | $ | 39 | $ | 36 | $ | 131 | $ | 301 | $ | 43 | $ | 97,427 | ||||||||||||||||||||
Commercial real estate | 25,671 | 32 | 17 | 49 | 212 | 161 | 26,093 | |||||||||||||||||||||||||||||
Equipment lease financing | 7,635 | 2 | 2 | 7 | 7,644 | |||||||||||||||||||||||||||||||
Total commercial lending | 130,258 | 90 | 56 | 36 | 182 | 520 | 204 | 131,164 | ||||||||||||||||||||||||||||
Consumer Lending | ||||||||||||||||||||||||||||||||||||
Home equity | 30,124 | 69 | 31 | 100 | 1,029 | 1,753 | 33,006 | |||||||||||||||||||||||||||||
Residential real estate (f) | 10,691 | 146 | 58 | 585 | 789 | 571 | $ | 231 | 2,210 | 14,492 | ||||||||||||||||||||||||||
Credit card | 4,523 | 26 | 18 | 30 | 74 | 3 | 4,600 | |||||||||||||||||||||||||||||
Other consumer (g) | 21,149 | 177 | 102 | 239 | 518 | 54 | 21,721 | |||||||||||||||||||||||||||||
Total consumer lending | 66,487 | 418 | 209 | 854 | 1,481 | 1,657 | 231 | 3,963 | 73,819 | |||||||||||||||||||||||||||
Total | $ | 196,745 | $ | 508 | $ | 265 | $ | 890 | $ | 1,663 | $ | 2,177 | $ | 231 | $ | 4,167 | $ | 204,983 | ||||||||||||||||||
Percentage of total loans | 95.99 | % | .25 | % | .13 | % | .43 | % | .81 | % | 1.06 | % | .11 | % | 2.03 | % | 100.00 | % | ||||||||||||||||||
December 31, 2014 | ||||||||||||||||||||||||||||||||||||
Commercial Lending | ||||||||||||||||||||||||||||||||||||
Commercial | $ | 96,922 | $ | 73 | $ | 24 | $ | 37 | $ | 134 | $ | 290 | $ | 74 | $ | 97,420 | ||||||||||||||||||||
Commercial real estate | 22,667 | 23 | 2 | 25 | 334 | 236 | 23,262 | |||||||||||||||||||||||||||||
Equipment lease financing | 7,672 | 11 | 1 | 12 | 2 | 7,686 | ||||||||||||||||||||||||||||||
Total commercial lending | 127,261 | 107 | 27 | 37 | 171 | 626 | 310 | 128,368 | ||||||||||||||||||||||||||||
Consumer Lending | ||||||||||||||||||||||||||||||||||||
Home equity | 31,474 | 70 | 32 | 102 | 1,112 | 1,989 | 34,677 | |||||||||||||||||||||||||||||
Residential real estate (f) | 9,900 | 163 | 68 | 742 | 973 | 706 | $ | 269 | 2,559 | 14,407 | ||||||||||||||||||||||||||
Credit card | 4,528 | 28 | 20 | 33 | 81 | 3 | 4,612 | |||||||||||||||||||||||||||||
Other consumer (g) | 22,071 | 214 | 112 | 293 | 619 | 63 | 22,753 | |||||||||||||||||||||||||||||
Total consumer lending | 67,973 | 475 | 232 | 1,068 | 1,775 | 1,884 | 269 | 4,548 | 76,449 | |||||||||||||||||||||||||||
Total | $ | 195,234 | $ | 582 | $ | 259 | $ | 1,105 | $ | 1,946 | $ | 2,510 | $ | 269 | $ | 4,858 | $ | 204,817 | ||||||||||||||||||
Percentage of total loans | 95.32 | % | .28 | % | .13 | % | .54 | % | .95 | % | 1.23 | % | .13 | % | 2.37 | % | 100.00 | % | ||||||||||||||||||
| (a) | Amounts in table represent recorded investment and exclude loans held for sale. |
| (b) | Past due loan amounts exclude purchased impaired loans, even if contractually past due (or if we do not expect to receive payment in full based on the original contractual terms), as we are currently accreting interest income over the expected life of the loans. |
| (c) | Consumer loans accounted for under the fair value option for which we do not expect to collect substantially all principal and interest are subject to nonaccrual accounting and classification upon meeting any of our nonaccrual policies. Given that these loans are not accounted for at amortized cost, these loans have been excluded from the nonperforming loan population. |
| (d) | Net of unearned income, net deferred loan fees, unamortized discounts and premiums, and purchase discounts and premiums totaling $1.5 billion and $1.7 billion at September 30, 2015 and December 31, 2014, respectively. |
| (e) | Future accretable yield related to purchased impaired loans is not included in the analysis of loan portfolio. |
| (f) | Past due loan amounts at September 30, 2015 include government insured or guaranteed Residential real estate mortgages totaling $62 million for 30 to 59 days past due, $40 million for 60 to 89 days past due and $558 million for 90 days or more past due. Past due loan amounts at December 31, 2014 include government insured or guaranteed Residential real estate mortgages totaling $68 million for 30 to 59 days past due, $43 million for 60 to 89 days past due and $719 million for 90 days or more past due. |
| (g) | Past due loan amounts at September 30, 2015 include government insured or guaranteed Other consumer loans totaling $119 million for 30 to 59 days past due, $80 million for 60 to 89 days past due and $224 million for 90 days or more past due. Past due loan amounts at December 31, 2014 include government insured or guaranteed Other consumer loans totaling $152 million for 30 to 59 days past due, $93 million for 60 to 89 days past due and $277 million for 90 days or more past due. |
70 The PNC Financial Services Group, Inc. – Form 10-Q
At September 30, 2015, we pledged $18.9 billion of commercial loans to the Federal Reserve Bank (FRB) and $54.2 billion of residential real estate and other loans to the Federal Home Loan Bank (FHLB) as collateral for the contingent ability to borrow, if necessary. The comparable amounts at December 31, 2014 were $19.2 billion and $52.8 billion, respectively.
In the normal course of business, we originate or purchase loan products with contractual characteristics that, when concentrated, may increase our exposure as a holder of those loan products. Possible product features that may create a concentration of credit risk would include a high original or updated LTV ratio, terms that may expose the borrower to future increases in repayments above increases in market interest rates, and interest-only loans, among others.
We originate interest-only loans to commercial borrowers. Such credit arrangements are usually designed to match borrower cash flow expectations (e.g., working capital lines, revolvers). These products are standard in the financial services industry and product features are considered during the underwriting process to mitigate the increased risk that the interest-only feature may result in borrowers not being able to make interest and principal payments when due. We do not believe that these product features create a concentration of credit risk.
Table 56: Nonperforming Assets
| Dollars in millions | September 30 2015 | December 31 2014 | ||||||
Nonperforming loans | ||||||||
Total commercial lending | $ | 520 | $ | 626 | ||||
Total consumer lending (a)(b) | 1,657 | 1,884 | ||||||
Total nonperforming loans (c) | 2,177 | 2,510 | ||||||
OREO and foreclosed assets | ||||||||
Other real estate owned (OREO) | 293 | 351 | ||||||
Foreclosed and other assets | 20 | 19 | ||||||
Total OREO and foreclosed assets | 313 | 370 | ||||||
Total nonperforming assets | $ | 2,490 | $ | 2,880 | ||||
Nonperforming loans to total loans | 1.06 | % | 1.23 | % | ||||
Nonperforming assets to total loans, OREO and foreclosed assets | 1.21 | 1.40 | ||||||
Nonperforming assets to total assets | .69 | .83 | ||||||
| (a) | Excludes most consumer loans and lines of credit, not secured by residential real estate, which are charged off after 120 to 180 days past due and are not placed on nonperforming status. |
| (b) | The recorded investment of loans collateralized by residential real estate property that are in process of foreclosure was $.6 billion and $.8 billion at September 30, 2015 and December 31, 2014, which included $.3 billion and $.5 billion, respectively, of loans that are government insured/guaranteed. |
| (c) | Nonperforming loans exclude certain government insured or guaranteed loans, loans held for sale, loans accounted for under the fair value option and purchased impaired loans. |
Nonperforming loans also include certain loans whose terms have been restructured in a manner that grants a concession to a borrower experiencing financial difficulties. In accordance with applicable accounting guidance, these loans are considered TDRs. See Note 1 Accounting Policies and the TDR section of Note 3 in our 2014 Form 10-K for additional information.
Total nonperforming loans in the nonperforming assets table above include TDRs of $1.2 billion at September 30, 2015 and $1.4 billion at December 31, 2014. TDRs that are performing, including credit card TDR loans, totaled $1.2 billion at September 30, 2015 and December 31, 2014 and are excluded from nonperforming loans. These include TDRs that are not placed on nonaccrual status as permitted by regulatory guidance. Nonperforming TDRs are returned to accrual and classified as performing after demonstrating a period of at least six months of consecutive performance under the restructured terms. Loans where borrowers have been discharged from personal liability through Chapter 7 bankruptcy and have not formally reaffirmed their loan obligations to PNC and loans to borrowers not currently obligated to make both principal and interest payments under the restructured terms are not returned to accrual status.
Additional Asset Quality Indicators
We have two overall portfolio segments – Commercial Lending and Consumer Lending. Each of these two segments is comprised of multiple loan classes. Classes are characterized by similarities in initial measurement, risk attributes and the manner in which we monitor and assess credit risk. The Commercial Lending segment is comprised of the commercial, commercial real estate, equipment lease financing, and commercial purchased impaired loan classes. The Consumer Lending segment is comprised of the home equity, residential real estate, credit card, other consumer, and consumer purchased impaired loan classes.
Commercial Lending Asset Classes
Commercial Loan Class
For commercial loans, we monitor the performance of the borrower in a disciplined and regular manner based upon the level of credit risk inherent in the loan. To evaluate the level of credit risk, we assign an internal risk rating reflecting the borrower's PD and LGD. This two-dimensional credit risk rating methodology provides granularity in the risk monitoring process on an ongoing basis. These ratings are reviewed and updated, generally at least once per year. Additionally, no less frequently than on an annual basis, we review PD rates related to each rating grade based upon internal historical data. These rates are updated as needed and augmented by market data as deemed necessary. For small balance homogenous pools of commercial loans, mortgages and leases, we apply statistical modeling to assist in determining the probability of default within these pools. Further, on a periodic basis, we update our
The PNC Financial Services Group, Inc. – Form 10-Q 71
LGD estimates associated with each rating grade based upon historical data. The combination of the PD and LGD ratings assigned to a commercial loan, capturing both the combination of expectations of default and loss severity in event of default, reflects the relative estimated likelihood of loss for that loan at the reporting date. In general, loans with better PD and LGD tend to have a lower likelihood of loss compared to loans with worse PD and LGD. The loss amount also considers an estimate of exposure at date of default, which we also periodically update based upon historical data.
Based upon the amount of the lending arrangement and our risk rating assessment, we follow a formal schedule of written periodic review. Quarterly, we conduct formal reviews of a market's or business unit's entire loan portfolio, focusing on those loans which we perceive to be of higher risk, based upon PDs and LGDs, or loans for which credit quality is weakening. If circumstances warrant, it is our practice to review any customer obligation and its level of credit risk more frequently. We attempt to proactively manage our loans by using various procedures that are customized to the risk of a given loan, including ongoing outreach, contact, and assessment of obligor financial conditions, collateral inspection and appraisal.
Commercial Real Estate Loan Class
We manage credit risk associated with our commercial real estate projects and commercial mortgage activities similar to commercial loans by analyzing PD and LGD. Additionally, risks connected with commercial real estate projects and commercial mortgage activities tend to be correlated to the loan structure and collateral location, project progress and business environment. As a result, these attributes are also monitored and utilized in assessing credit risk.
As with the commercial class, a formal schedule of periodic review is also performed to assess market/geographic risk and business unit/industry risk. Often as a result of these overviews, more in-depth reviews and increased scrutiny are placed on areas of higher risk, including adverse changes in risk ratings, deteriorating operating trends, and/or areas that concern management. These reviews are designed to assess risk and take actions to mitigate our exposure to such risks.
Equipment Lease Financing Loan Class
We manage credit risk associated with our equipment lease financing loan class similar to commercial loans by analyzing PD and LGD.
Based upon the dollar amount of the lease and of the level of credit risk, we follow a formal schedule of periodic review. Generally, this occurs quarterly, although we have established practices to review such credit risk more frequently if circumstances warrant. Our review process entails analysis of the following factors: equipment value/residual value, exposure levels, jurisdiction risk, industry risk, guarantor requirements, and regulatory compliance.
Commercial Purchased Impaired Loan Class
Estimates of the expected cash flows primarily determine the valuation of commercial purchased impaired loans. Commercial cash flow estimates are influenced by a number of credit related items, which include but are not limited to: estimated collateral value, receipt of additional collateral, secondary trading prices, circumstances of possible and/or ongoing liquidation, capital availability, business operations and payment patterns.
We attempt to proactively manage these factors by using various procedures that are customized to the risk of a given loan. These procedures include a review by our Special Asset Committee (SAC), ongoing outreach, contact, and assessment of obligor financial conditions, collateral inspection and appraisal.
See Note 4 Purchased Loans for additional information.
72 The PNC Financial Services Group, Inc. – Form 10-Q
Table 57: Commercial Lending Asset Quality Indicators (a)(b)
| Criticized Commercial Loans | ||||||||||||||||||||
| In millions | Pass Rated | Special Mention (c) | Substandard (d) | Doubtful (e) | Total Loans | |||||||||||||||
September 30, 2015 | ||||||||||||||||||||
Commercial | $ | 92,334 | $ | 1,971 | $ | 2,962 | $ | 117 | $ | 97,384 | ||||||||||
Commercial real estate | 25,224 | 203 | 478 | 27 | 25,932 | |||||||||||||||
Equipment lease financing | 7,375 | 75 | 189 | 5 | 7,644 | |||||||||||||||
Purchased impaired loans | 7 | 164 | 33 | 204 | ||||||||||||||||
Total commercial lending | $ | 124,933 | $ | 2,256 | $ | 3,793 | $ | 182 | $ | 131,164 | ||||||||||
December 31, 2014 | ||||||||||||||||||||
Commercial | $ | 92,884 | $ | 1,984 | $ | 2,424 | $ | 55 | $ | 97,347 | ||||||||||
Commercial real estate | 22,066 | 285 | 639 | 35 | 23,025 | |||||||||||||||
Equipment lease financing | 7,518 | 73 | 93 | 2 | 7,686 | |||||||||||||||
Purchased impaired loans | 4 | 280 | 26 | 310 | ||||||||||||||||
Total commercial lending | $ | 122,468 | $ | 2,346 | $ | 3,436 | $ | 118 | $ | 128,368 | ||||||||||
| (a) | Based upon PDs and LGDs. We apply a split rating classification to certain loans meeting threshold criteria. By assigning a split classification, a loan's exposure amount may be split into more than one classification category in the above table. |
| (b) | Loans are included above based on the Regulatory Classification definitions of "Pass", "Special Mention", "Substandard" and "Doubtful". |
| (c) | Special Mention rated loans have a potential weakness that deserves management's close attention. If left uncorrected, these potential weaknesses may result in deterioration of repayment prospects at some future date. These loans do not expose us to sufficient risk to warrant a more adverse classification at this time. |
| (d) | Substandard rated loans have a well-defined weakness or weaknesses that jeopardize the collection or liquidation of debt. They are characterized by the distinct possibility that we will sustain some loss if the deficiencies are not corrected. |
| (e) | Doubtful rated loans possess all the inherent weaknesses of a Substandard loan with the additional characteristics that the weakness makes collection or liquidation in full improbable due to existing facts, conditions, and values. |
Consumer Lending Asset Classes
Home Equity and Residential Real Estate Loan Classes
We use several credit quality indicators, including delinquency information, nonperforming loan information, updated credit scores, originated and updated LTV ratios, and geography, to monitor and manage credit risk within the home equity and residential real estate loan classes. We evaluate mortgage loan performance by source originators and loan servicers. A summary of asset quality indicators follows:
Delinquency/Delinquency Rates : We monitor trending of delinquency/delinquency rates for home equity and residential real estate loans. See the Asset Quality section of this Note 3 for additional information.
Nonperforming Loans : We monitor trending of nonperforming loans for home equity and residential real estate loans. See the Asset Quality section of this Note 3 for additional information.
Credit Scores : We use a national third-party provider to update FICO credit scores for home equity loans and lines of credit and residential real estate loans at least quarterly. The updated scores are incorporated into a series of credit management reports, which are utilized to monitor the risk in the loan classes.
LTV (inclusive of combined loan-to-value (CLTV) for first and subordinate lien positions) : At least annually, we update the property values of real estate collateral and calculate an
updated LTV ratio. For open-end credit lines secured by real estate in regions experiencing significant declines in property values, more frequent valuations may occur. We examine LTV migration and stratify LTV into categories to monitor the risk in the loan classes.
Historically, we used, and we continue to use, a combination of original LTV and updated LTV for internal risk management and reporting purposes ( e.g. , line management, loss mitigation strategies). In addition to the fact that estimated property values by their nature are estimates, given certain data limitations it is important to note that updated LTVs may be based upon management's assumptions ( e.g. , if an updated LTV is not provided by the third-party service provider, home price index (HPI) changes will be incorporated in arriving at management's estimate of updated LTV).
Geography : Geographic concentrations are monitored to evaluate and manage exposures. Loan purchase programs are sensitive to, and focused within, certain regions to manage geographic exposures and associated risks.
A combination of updated FICO scores, originated and updated LTV ratios and geographic location assigned to home equity loans and lines of credit and residential real estate loans is used to monitor the risk in the loan classes. Loans with higher FICO scores and lower LTVs tend to have a lower level of risk. Conversely, loans with lower FICO scores, higher LTVs, and in certain geographic locations tend to have a higher level of risk.
The PNC Financial Services Group, Inc. – Form 10-Q 73
Consumer Purchased Impaired Loan Class
Estimates of the expected cash flows primarily determine the valuation of consumer purchased impaired loans. Consumer cash flow estimates are influenced by a number of credit related items, which include, but are not limited to: estimated real estate values, payment patterns, updated FICO scores, the current economic environment, updated LTV ratios and the date of origination. These key factors are monitored to help ensure that concentrations of risk are managed and cash flows are maximized.
See Note 4 Purchased Loans for additional information.
Table 58: Home Equity and Residential Real Estate Balances
| In millions | September 30 2015 | December 31 2014 | ||||||
Home equity and residential real estate loans – excluding purchased impaired loans (a) | $ | 42,582 | $ | 43,348 | ||||
Home equity and residential real estate loans – purchased impaired loans (b) | 3,853 | 4,541 | ||||||
Government insured or guaranteed residential real estate mortgages (a) | 953 | 1,188 | ||||||
Difference between outstanding balance and recorded investment in purchased impaired loans (c) | 110 | 7 | ||||||
Total home equity and residential real estate loans (a) | $ | 47,498 | $ | 49,084 | ||||
| (a) | Represents recorded investment. |
| (b) | Represents outstanding balance. |
| (c) | Outstanding balance represents the balance on the loan servicing system for active loans. It is possible for the outstanding balance to be lower than the recorded investment for certain loans due to the use of pool accounting. |
Table 59: Home Equity and Residential Real Estate Asset Quality Indicators – Excluding Purchased Impaired Loans (a) (b)
| Home Equity | Residential Real Estate | |||||||||||||||
| September 30, 2015 – in millions | 1st Liens | 2nd Liens | Total | |||||||||||||
Current estimated LTV ratios (c) | ||||||||||||||||
Greater than or equal to 125% and updated FICO scores: | ||||||||||||||||
Greater than 660 | $ | 300 | $ | 1,050 | $ | 315 | $ | 1,665 | ||||||||
Less than or equal to 660 (d) (e) | 44 | 208 | 72 | 324 | ||||||||||||
Missing FICO | 1 | 7 | 5 | 13 | ||||||||||||
Greater than or equal to 100% to less than 125% and updated FICO scores: | ||||||||||||||||
Greater than 660 | 703 | 1,892 | 607 | 3,202 | ||||||||||||
Less than or equal to 660 (d) (e) | 98 | 317 | 113 | 528 | ||||||||||||
Missing FICO | 2 | 6 | 6 | 14 | ||||||||||||
Greater than or equal to 90% to less than 100% and updated FICO scores: | ||||||||||||||||
Greater than 660 | 780 | 1,569 | 660 | 3,009 | ||||||||||||
Less than or equal to 660 | 101 | 228 | 96 | 425 | ||||||||||||
Missing FICO | 1 | 3 | 8 | 12 | ||||||||||||
Less than 90% and updated FICO scores: | ||||||||||||||||
Greater than 660 | 14,069 | 7,650 | 8,770 | 30,489 | ||||||||||||
Less than or equal to 660 | 1,276 | 899 | 576 | 2,751 | ||||||||||||
Missing FICO | 32 | 17 | 101 | 150 | ||||||||||||
Total home equity and residential real estate loans | $ | 17,407 | $ | 13,846 | $ | 11,329 | $ | 42,582 | ||||||||
74 The PNC Financial Services Group, Inc. – Form 10-Q
| Home Equity | Residential Real Estate | |||||||||||||||
| December 31, 2014 – in millions | 1st Liens | 2nd Liens | Total | |||||||||||||
Current estimated LTV ratios (c) | ||||||||||||||||
Greater than or equal to 125% and updated FICO scores: | ||||||||||||||||
Greater than 660 | $ | 333 | $ | 1,399 | $ | 360 | $ | 2,092 | ||||||||
Less than or equal to 660 (d) (e) | 57 | 273 | 92 | 422 | ||||||||||||
Missing FICO | 1 | 9 | 8 | 18 | ||||||||||||
Greater than or equal to 100% to less than 125% and updated FICO scores: | ||||||||||||||||
Greater than 660 | 839 | 2,190 | 772 | 3,801 | ||||||||||||
Less than or equal to 660 (d) (e) | 118 | 383 | 153 | 654 | ||||||||||||
Missing FICO | 1 | 5 | 12 | 18 | ||||||||||||
Greater than or equal to 90% to less than 100% and updated FICO scores: | ||||||||||||||||
Greater than 660 | 891 | 1,703 | 755 | 3,349 | ||||||||||||
Less than or equal to 660 | 103 | 271 | 118 | 492 | ||||||||||||
Missing FICO | 2 | 3 | 5 | 10 | ||||||||||||
Less than 90% and updated FICO scores: | ||||||||||||||||
Greater than 660 | 13,878 | 7,874 | 7,703 | 29,455 | ||||||||||||
Less than or equal to 660 | 1,319 | 995 | 573 | 2,887 | ||||||||||||
Missing FICO | 27 | 14 | 109 | 150 | ||||||||||||
Total home equity and residential real estate loans | $ | 17,569 | $ | 15,119 | $ | 10,660 | $ | 43,348 | ||||||||
| (a) | Excludes purchased impaired loans of approximately $4.0 billion and $4.5 billion in recorded investment, certain government insured or guaranteed residential real estate mortgages of approximately $1.0 billion and $1.2 billion, and loans held for sale at September 30, 2015 and December 31, 2014, respectively. See the Home Equity and Residential Real Estate Asset Quality Indicators – Purchased Impaired Loans table below for additional information on purchased impaired loans. |
| (b) | Amounts shown represent recorded investment. |
| (c) | Based upon updated LTV (inclusive of combined loan-to-value (CLTV) for first and subordinate lien positions). Updated LTV is estimated using modeled property values. These ratios are updated at least semi-annually. The related estimates and inputs are based upon an approach that uses a combination of third-party automated valuation models (AVMs), broker price opinions (BPOs), HPI indices, property location, internal and external balance information, origination data and management assumptions. We generally utilize origination lien balances provided by a third-party, where applicable, which do not include an amortization assumption when calculating updated LTV. Accordingly, the results of these calculations do not represent actual appraised loan level collateral or updated LTV based upon lien balances held by others, and as such, are necessarily imprecise and subject to change as we enhance our methodology. |
| (d) | Higher risk loans are defined as loans with both an updated FICO score of less than or equal to 660 and an updated LTV greater than or equal to 100%. |
| (e) | The following states had the highest percentage of higher risk loans at September 30, 2015: New Jersey 15%, Pennsylvania 13%, Ohio 11%, Illinois 11%, Florida 7%, Maryland 7% and Michigan 5%. The remainder of the states had lower than 4% of the higher risk loans individually, and collectively they represent approximately 31% of the higher risk loans. The following states had the highest percentage of higher risk loans at December 31, 2014: New Jersey 14%, Illinois 12%, Pennsylvania 12%, Ohio 12%, Florida 8%, Maryland 6%, Michigan 5%, and North Carolina 4%. The remainder of the states had lower than 4% of the high risk loans individually, and collectively they represent approximately 28% of the higher risk loans. |
The PNC Financial Services Group, Inc. – Form 10-Q 75
Table 60: Home Equity and Residential Real Estate Asset Quality Indicators – Purchased Impaired Loans (a)
| Home Equity (b) (c) | Residential Real Estate (b) (c) | |||||||||||||||
| September 30, 2015 – in millions | 1st Liens | 2nd Liens | Total | |||||||||||||
Current estimated LTV ratios (d) | ||||||||||||||||
Greater than or equal to 125% and updated FICO scores: | ||||||||||||||||
Greater than 660 | $ | 8 | $ | 195 | $ | 182 | $ | 385 | ||||||||
Less than or equal to 660 | 8 | 92 | 89 | 189 | ||||||||||||
Missing FICO | 7 | 6 | 13 | |||||||||||||
Greater than or equal to 100% to less than 125% and updated FICO scores: | ||||||||||||||||
Greater than 660 | 12 | 355 | 201 | 568 | ||||||||||||
Less than or equal to 660 | 10 | 158 | 131 | 299 | ||||||||||||
Missing FICO | 9 | 7 | 16 | |||||||||||||
Greater than or equal to 90% to less than 100% and updated FICO scores: | ||||||||||||||||
Greater than 660 | 9 | 170 | 137 | 316 | ||||||||||||
Less than or equal to 660 | 7 | 82 | 81 | 170 | ||||||||||||
Missing FICO | 4 | 3 | 7 | |||||||||||||
Less than 90% and updated FICO scores: | ||||||||||||||||
Greater than 660 | 110 | 337 | 649 | 1,096 | ||||||||||||
Less than or equal to 660 | 94 | 179 | 461 | 734 | ||||||||||||
Missing FICO | 1 | 12 | 28 | 41 | ||||||||||||
Missing LTV and updated FICO scores: | ||||||||||||||||
Greater than 660 | 1 | 10 | 11 | |||||||||||||
Less than or equal to 660 | 3 | 5 | 8 | |||||||||||||
Total home equity and residential real estate loans | $ | 263 | $ | 1,600 | $ | 1,990 | $ | 3,853 | ||||||||
| Home Equity (b) (c) | Residential Real Estate (b) (c) | |||||||||||||||
| December 31, 2014 – in millions | 1st Liens | 2nd Liens | Total | |||||||||||||
Current estimated LTV ratios (d) | ||||||||||||||||
Greater than or equal to 125% and updated FICO scores: | ||||||||||||||||
Greater than 660 | $ | 8 | $ | 243 | $ | 276 | $ | 527 | ||||||||
Less than or equal to 660 | 9 | 125 | 144 | 278 | ||||||||||||
Missing FICO | 8 | 6 | 14 | |||||||||||||
Greater than or equal to 100% to less than 125% and updated FICO scores: | ||||||||||||||||
Greater than 660 | 15 | 426 | 272 | 713 | ||||||||||||
Less than or equal to 660 | 12 | 194 | 200 | 406 | ||||||||||||
Missing FICO | 11 | 5 | 16 | |||||||||||||
Greater than or equal to 90% to less than 100% and updated FICO scores: | ||||||||||||||||
Greater than 660 | 12 | 207 | 186 | 405 | ||||||||||||
Less than or equal to 660 | 9 | 93 | 123 | 225 | ||||||||||||
Missing FICO | 5 | 3 | 8 | |||||||||||||
Less than 90% and updated FICO scores: | ||||||||||||||||
Greater than 660 | 102 | 339 | 626 | 1,067 | ||||||||||||
Less than or equal to 660 | 109 | 200 | 515 | 824 | ||||||||||||
Missing FICO | 1 | 12 | 15 | 28 | ||||||||||||
Missing LTV and updated FICO scores: | ||||||||||||||||
Greater than 660 | 1 | 14 | 15 | |||||||||||||
Less than or equal to 660 | 4 | 10 | 14 | |||||||||||||
Missing FICO | 1 | 1 | ||||||||||||||
Total home equity and residential real estate loans | $ | 282 | $ | 1,863 | $ | 2,396 | $ | 4,541 | ||||||||
76 The PNC Financial Services Group, Inc. – Form 10-Q
| (a) | Amounts shown represent outstanding balance. See Note 4 Purchased Loans for additional information. |
| (b) | For the estimate of cash flows utilized in our purchased impaired loan accounting, other assumptions and estimates are made, including amortization of first lien balances, pre-payment rates, etc., which are not reflected in this table. |
| (c) | The following states had the highest percentage of purchased impaired loans at September 30, 2015: California 16%, Florida 14%, Illinois 11%, Ohio 9%, North Carolina 7%, and Michigan 5%. The remainder of the states had lower than a 4% concentration of purchased impaired loans individually, and collectively they represent approximately 38% of the purchased impaired portfolio. The following states had the highest percentage of purchased impaired loans at December 31, 2014: California 17%, Florida 15%, Illinois 11%, Ohio 8%, North Carolina 7% and Michigan 5%. The remainder of the states had lower than a 4% concentration of purchased impaired loans individually, and collectively they represent approximately 37% of the purchased impaired portfolio. |
| (d) | Based upon updated LTV (inclusive of combined loan-to-value (CLTV) for first and subordinate lien positions). Updated LTV is estimated using modeled property values. These ratios are updated at least semi-annually. The related estimates and inputs are based upon an approach that uses a combination of third-party automated valuation models (AVMs), broker price opinions (BPOs), HPI indices, property location, internal and external balance information, origination data and management assumptions. We generally utilize origination lien balances provided by a third-party, where applicable, which do not include an amortization assumption when calculating updated LTV. Accordingly, the results of these calculations do not represent actual appraised loan level collateral or updated LTV based upon lien balances held by others, and as such, are necessarily imprecise and subject to change as we enhance our methodology. |
Credit Card and Other Consumer Loan Classes
Table 61: Credit Card and Other Consumer Loan Classes Asset Quality Indicators
| Credit Card (a) | Other Consumer (b) | |||||||||||||||
| Dollars in millions | Amount | % of Total Loans Using FICO Credit Metric | Amount | % of Total Loans Using FICO Credit Metric | ||||||||||||
September 30, 2015 | ||||||||||||||||
FICO score greater than 719 | $ | 2,729 | 59 | % | $ | 9,396 | 65 | % | ||||||||
650 to 719 | 1,295 | 28 | 3,501 | 24 | ||||||||||||
620 to 649 | 197 | 4 | 509 | 4 | ||||||||||||
Less than 620 | 211 | 5 | 580 | 4 | ||||||||||||
No FICO score available or required (c) | 168 | 4 | 423 | 3 | ||||||||||||
Total loans using FICO credit metric | 4,600 | 100 | % | 14,409 | 100 | % | ||||||||||
Consumer loans using other internal credit metrics (b) | 7,312 | |||||||||||||||
Total loan balance | $ | 4,600 | $ | 21,721 | ||||||||||||
Weighted-average updated FICO score (d) | 733 | 745 | ||||||||||||||
December 31, 2014 | ||||||||||||||||
FICO score greater than 719 | $ | 2,717 | 59 | % | $ | 9,156 | 64 | % | ||||||||
650 to 719 | 1,288 | 28 | 3,459 | 24 | ||||||||||||
620 to 649 | 203 | 4 | 528 | 4 | ||||||||||||
Less than 620 | 239 | 5 | 619 | 4 | ||||||||||||
No FICO score available or required (c) | 165 | 4 | 557 | 4 | ||||||||||||
Total loans using FICO credit metric | 4,612 | 100 | % | 14,319 | 100 | % | ||||||||||
Consumer loans using other internal credit metrics (b) | 8,434 | |||||||||||||||
Total loan balance | $ | 4,612 | $ | 22,753 | ||||||||||||
Weighted-average updated FICO score (d) | 732 | 744 | ||||||||||||||
| (a) | At September 30, 2015, we had $31 million of credit card loans that are higher risk (i.e., loans with both updated FICO scores less than 660 and in late stage (90+ days) delinquency status). The majority of the September 30, 2015 balance related to higher risk credit card loans was geographically distributed throughout the following areas: Ohio 17%, Pennsylvania 16%, Michigan 9%, New Jersey 8%, Florida 7%, Illinois 7%, Indiana 5%, Maryland 5% and North Carolina 4%. All other states had less than 4% individually and make up the remainder of the balance. At December 31, 2014, we had $35 million of credit card loans that are higher risk. The majority of the December 31, 2014 balance related to higher risk credit card loans was geographically distributed throughout the following areas: Ohio 17%, Pennsylvania 16%, Michigan 9%, Illinois 7%, New Jersey 7%, Indiana 6%, Florida 6% and North Carolina 4%. All other states had less than 4% individually and make up the remainder of the balance. |
| (b) | Other consumer loans for which updated FICO scores are used as an asset quality indicator include non-government guaranteed or insured education loans, automobile loans and other secured and unsecured lines and loans. Other consumer loans for which other internal credit metrics are used as an asset quality indicator include primarily government guaranteed or insured education loans, as well as consumer loans to high net worth individuals. Other internal credit metrics may include delinquency status, geography or other factors. |
| (c) | Credit card loans and other consumer loans with no FICO score available or required generally refers to new accounts issued to borrowers with limited credit history, accounts for which we cannot obtain an updated FICO score (e.g., recent profile changes), cards issued with a business name, and/or cards secured by collateral. Management proactively assesses the risk and size of this loan portfolio and, when necessary, takes actions to mitigate the credit risk. |
| (d) | Weighted-average updated FICO score excludes accounts with no FICO score available or required. |
Troubled Debt Restructurings (TDRs)
See Note 3 Asset Quality in our 2014 Form 10-K for additional discussion on TDRs. We held specific reserves in the ALLL of $.3 billion and $.4 billion at September 30, 2015 and December 31, 2014, respectively, for the total TDR portfolio.
The PNC Financial Services Group, Inc. – Form 10-Q 77
Table 62: Summary of Troubled Debt Restructurings
| In millions | September 30 2015 | December 31 2014 | ||||||
Total consumer lending | $ | 1,948 | $ | 2,041 | ||||
Total commercial lending | 420 | 542 | ||||||
Total TDRs | $ | 2,368 | $ | 2,583 | ||||
Nonperforming | $ | 1,171 | $ | 1,370 | ||||
Accruing (a) | 1,085 | 1,083 | ||||||
Credit card | 112 | 130 | ||||||
Total TDRs | $ | 2,368 | $ | 2,583 | ||||
| (a) | Accruing TDR loans have demonstrated a period of at least six months of performance under the restructured terms and are excluded from nonperforming loans. Loans where borrowers have been discharged from personal liability through Chapter 7 bankruptcy and have not formally reaffirmed their loan obligations to PNC and loans to borrowers not currently obligated to make both principal and interest payments under the restructured terms are not returned to accrual status. |
Table 63 quantifies the number of loans that were classified as TDRs as well as the change in the recorded investments as a result of the TDR classification during the first nine months and third quarters of 2015 and 2014, respectively. Additionally, the table provides information about the types of TDR concessions. The Principal Forgiveness TDR category includes principal forgiveness and accrued interest forgiveness. These types of TDRs result in a write down of the recorded investment and a charge-off if such action has not already taken place. The Rate Reduction TDR category includes reduced interest rate and interest deferral. The TDRs within this category result in
reductions to future interest income. The Other TDR category primarily includes consumer borrowers that have been discharged from personal liability through Chapter 7 bankruptcy and have not formally reaffirmed their loan obligations to PNC, as well as postponement/reduction of scheduled amortization and contractual extensions for both consumer and commercial borrowers.
In some cases, there have been multiple concessions granted on one loan. This is most common within the commercial loan portfolio. When there have been multiple concessions granted in the commercial loan portfolio, the principal forgiveness concession was prioritized for purposes of determining the inclusion in Table 63. For example, if there is principal forgiveness in conjunction with lower interest rate and postponement of amortization, the type of concession will be reported as Principal Forgiveness. Second in priority would be rate reduction. For example, if there is an interest rate reduction in conjunction with postponement of amortization, the type of concession will be reported as a Rate Reduction. In the event that multiple concessions are granted on a consumer loan, concessions resulting from discharge from personal liability through Chapter 7 bankruptcy without formal affirmation of the loan obligations to PNC would be prioritized and included in the Other type of concession in the table below. After that, consumer loan concessions would follow the previously discussed priority of concessions for the commercial loan portfolio.
Table 63: Financial Impact and TDRs by Concession Type (a)
Pre-TDR Recorded | Post-TDR Recorded Investment (c) | |||||||||||||||||||||||
During the three months ended September 30, 2015 Dollars in millions | Number of Loans | Principal Forgiveness | Rate Reduction | Other | Total | |||||||||||||||||||
Commercial lending | ||||||||||||||||||||||||
Commercial | 33 | $ | 63 | $ | 9 | $ | 43 | $ | 52 | |||||||||||||||
Commercial real estate | 6 | 17 | 6 | 4 | 10 | |||||||||||||||||||
Total commercial lending | 39 | 80 | 15 | 47 | 62 | |||||||||||||||||||
Consumer lending | ||||||||||||||||||||||||
Home equity | 788 | 42 | $ | 27 | 13 | 40 | ||||||||||||||||||
Residential real estate | 329 | 35 | 21 | 13 | 34 | |||||||||||||||||||
Credit card | 1,651 | 14 | 14 | 14 | ||||||||||||||||||||
Other consumer | 246 | 4 | 2 | 2 | ||||||||||||||||||||
Total consumer lending | 3,014 | 95 | 62 | 28 | 90 | |||||||||||||||||||
Total TDRs | 3,053 | $ | 175 | $ | 15 | $ | 62 | $ | 75 | $ | 152 | |||||||||||||
During the three months ended September 30, 2014 Dollars in millions | ||||||||||||||||||||||||
Commercial lending | ||||||||||||||||||||||||
Commercial | 35 | $ | 39 | $ | 2 | $ | 8 | $ | 14 | $ | 24 | |||||||||||||
Commercial real estate | 19 | 63 | 2 | 1 | 54 | 57 | ||||||||||||||||||
Total commercial lending (d) | 54 | 102 | 4 | 9 | 68 | 81 | ||||||||||||||||||
Consumer lending | ||||||||||||||||||||||||
Home equity | 942 | 66 | 12 | 52 | 64 | |||||||||||||||||||
Residential real estate | 159 | 18 | 8 | 8 | 16 | |||||||||||||||||||
Credit card | 1,860 | 15 | 15 | 15 | ||||||||||||||||||||
Other consumer | 307 | 5 | 4 | 4 | ||||||||||||||||||||
Total consumer lending | 3,268 | 104 | 35 | 64 | 99 | |||||||||||||||||||
Total TDRs | 3,322 | $ | 206 | $ | 4 | $ | 44 | $ | 132 | $ | 180 | |||||||||||||
78 The PNC Financial Services Group, Inc. – Form 10-Q
Table 63: Financial Impact and TDRs by Concession Type (Continued) (a)
Pre-TDR Recorded | Post-TDR Recorded Investment (c) | |||||||||||||||||||||||
During the nine months ended September 30, 2015 Dollars in millions | Number of Loans | Principal Forgiveness | Rate Reduction | Other | Total | |||||||||||||||||||
Commercial lending | ||||||||||||||||||||||||
Commercial | 90 | $ | 154 | $ | 14 | $ | 3 | $ | 112 | $ | 129 | |||||||||||||
Commercial real estate | 23 | 31 | 6 | 1 | 8 | 15 | ||||||||||||||||||
Equipment lease financing | 1 | – | – | |||||||||||||||||||||
Total commercial lending | 114 | 185 | 20 | 4 | 120 | 144 | ||||||||||||||||||
Consumer lending | ||||||||||||||||||||||||
Home equity | 2,318 | 144 | 77 | 60 | 137 | |||||||||||||||||||
Residential real estate | 477 | 55 | 32 | 23 | 55 | |||||||||||||||||||
Credit card | 4,855 | 40 | 39 | 39 | ||||||||||||||||||||
Other consumer | 750 | 11 | 2 | 6 | 8 | |||||||||||||||||||
Total consumer lending | 8,400 | 250 | 150 | 89 | 239 | |||||||||||||||||||
Total TDRs | 8,514 | $ | 435 | $ | 20 | $ | 154 | $ | 209 | $ | 383 | |||||||||||||
During the nine months ended September 30, 2014 Dollars in millions | ||||||||||||||||||||||||
Commercial lending | ||||||||||||||||||||||||
Commercial | 98 | $ | 128 | $ | 5 | $ | 12 | $ | 92 | $ | 109 | |||||||||||||
Commercial real estate | 65 | 144 | 21 | 5 | 97 | 123 | ||||||||||||||||||
Total commercial lending (d) | 163 | 272 | 26 | 17 | 189 | 232 | ||||||||||||||||||
Consumer lending | ||||||||||||||||||||||||
Home equity | 2,334 | 158 | 41 | 108 | 149 | |||||||||||||||||||
Residential real estate | 439 | 58 | 21 | 35 | 56 | |||||||||||||||||||
Credit card | 5,226 | 43 | 41 | 41 | ||||||||||||||||||||
Other consumer | 794 | 13 | 10 | 10 | ||||||||||||||||||||
Total consumer lending | 8,793 | 272 | 103 | 153 | 256 | |||||||||||||||||||
Total TDRs | 8,956 | $ | 544 | $ | 26 | $ | 120 | $ | 342 | $ | 488 | |||||||||||||
| (a) | Impact of partial charge-offs at TDR date are included in this table. |
| (b) | Represents the recorded investment of the loans as of the quarter end immediately preceding TDR designation, and excludes immaterial amounts of accrued interest receivable. |
| (c) | Represents the recorded investment of the TDRs as of the quarter end and immediately following the TDR designation, and excludes immaterial amounts of accrued interest receivable. |
| (d) | During the three months ended September 30, 2015 and 2014, and nine months ended September 30, 2015, there were no loans classified as TDRs in the Equipment lease financing loan class. |
After a loan is determined to be a TDR, we continue to track its performance under its most recent restructured terms. In Table 64, we consider a TDR to have subsequently defaulted when it becomes 60 days past due after the most recent date the loan was restructured. The following table presents the recorded investment of loans that both (i) were classified as TDRs or were subsequently modified during each 12-month period preceding July 1, 2015, January 1, 2015, July 1, 2014 and January 1, 2014, respectively, and (ii) subsequently defaulted during these reporting periods.
The PNC Financial Services Group, Inc. – Form 10-Q 79
Table 64: TDRs that were Modified in the Past Twelve Months which have Subsequently Defaulted
During the three months ended September 30, 2015 Dollars in millions | Number of Contracts | Recorded Investment | ||||||
Commercial lending | ||||||||
Commercial | 7 | $ | 4 | |||||
Commercial real estate | 3 | 1 | ||||||
Total commercial lending (a) | 10 | 5 | ||||||
Consumer lending | ||||||||
Home equity | 170 | 8 | ||||||
Residential real estate | 33 | 5 | ||||||
Credit card | 1,337 | 11 | ||||||
Other consumer | 50 | – | ||||||
Total consumer lending | 1,590 | 24 | ||||||
Total TDRs | 1,600 | $ | 29 | |||||
During the three months ended September 30, 2014 Dollars in millions | Number of Contracts | Recorded Investment | ||||||
Commercial lending | ||||||||
Commercial | 1 | $ | 1 | |||||
Commercial real estate | 13 | 14 | ||||||
Total commercial lending (a) | 14 | 15 | ||||||
Consumer lending | ||||||||
Home equity | 99 | 4 | ||||||
Residential real estate | 52 | 6 | ||||||
Credit card | 1,665 | 14 | ||||||
Other consumer | 31 | – | ||||||
Total consumer lending | 1,847 | 24 | ||||||
Total TDRs | 1,861 | $ | 39 | |||||
During the nine months ended September 30, 2015 Dollars in millions | Number of Contracts | Recorded Investment | ||||||
Commercial lending | ||||||||
Commercial | 20 | $ | 8 | |||||
Commercial real estate | 11 | 10 | ||||||
Equipment lease financing | 1 | – | ||||||
Total commercial lending | 32 | 18 | ||||||
Consumer lending | ||||||||
Home equity | 338 | 17 | ||||||
Residential real estate | 104 | 15 | ||||||
Credit card | 2,197 | 18 | ||||||
Other consumer | 125 | 1 | ||||||
Total consumer lending | 2,764 | 51 | ||||||
Total TDRs | 2,796 | $ | 69 | |||||
During the nine months ended September 30, 2014 Dollars in millions | Number of Contracts | Recorded Investment | ||||||
Commercial lending | ||||||||
Commercial | 34 | $ | 23 | |||||
Commercial real estate | 34 | 45 | ||||||
Total commercial lending (a) | 68 | 68 | ||||||
Consumer lending | ||||||||
Home equity | 315 | 17 | ||||||
Residential real estate | 128 | 20 | ||||||
Credit card | 2,393 | 19 | ||||||
Other consumer | 110 | 1 | ||||||
Total consumer lending | 2,946 | 57 | ||||||
Total TDRs | 3,014 | $ | 125 | |||||
| (a) | During the three months ended September 30, 2015 and the three and nine months ended September 30, 2014, there were no loans classified as TDRs in the Equipment lease financing loan class that have subsequently defaulted. |
Impaired Loans
Impaired loans include commercial nonperforming loans and consumer and commercial TDRs, regardless of nonperforming status. TDRs that were previously recorded at amortized cost and are now classified and accounted for as held for sale are also included. Excluded from impaired loans are nonperforming leases, loans accounted for as held for sale other than the TDRs described in the preceding sentence, loans accounted for under the fair value option, smaller balance homogeneous type loans and purchased impaired loans. See Note 4 Purchased Loans for additional information. Nonperforming equipment lease financing loans of $7 million at September 30, 2015 and $2 million at December 31, 2014 are excluded from impaired loans pursuant to authoritative lease accounting guidance. We did not recognize any interest income on impaired loans that have not returned to performing status, while they were impaired during the nine months ended September 30, 2015 and September 30, 2014. The following table provides further detail on impaired loans individually evaluated for impairment and the associated ALLL. Certain commercial and consumer impaired loans do not have a related ALLL as the valuation of these impaired loans exceeded the recorded investment.
80 The PNC Financial Services Group, Inc. – Form 10-Q
Table 65: Impaired Loans
| In millions | Unpaid Principal Balance | Recorded Investment (a) | Associated Allowance (b) | Average Recorded Investment (c) | ||||||||||||
September 30, 2015 | ||||||||||||||||
Impaired loans with an associated allowance | ||||||||||||||||
Commercial | $ | 379 | $ | 280 | $ | 73 | $ | 299 | ||||||||
Commercial real estate | 314 | 161 | 36 | 213 | ||||||||||||
Home equity | 999 | 967 | 188 | 979 | ||||||||||||
Residential real estate | 442 | 333 | 49 | 382 | ||||||||||||
Credit card | 112 | 112 | 25 | 121 | ||||||||||||
Other consumer | 31 | 27 | 1 | 33 | ||||||||||||
Total impaired loans with an associated allowance | $ | 2,277 | $ | 1,880 | $ | 372 | $ | 2,027 | ||||||||
Impaired loans without an associated allowance | ||||||||||||||||
Commercial | $ | 166 | $ | 99 | $ | 79 | ||||||||||
Commercial real estate | 219 | 171 | 171 | |||||||||||||
Home equity | 430 | 149 | 146 | |||||||||||||
Residential real estate | 369 | 352 | 334 | |||||||||||||
Other consumer | 24 | 8 | 8 | |||||||||||||
Total impaired loans without an associated allowance | $ | 1,208 | $ | 779 | $ | 738 | ||||||||||
Total impaired loans | $ | 3,485 | $ | 2,659 | $ | 372 | $ | 2,765 | ||||||||
December 31, 2014 | ||||||||||||||||
Impaired loans with an associated allowance | ||||||||||||||||
Commercial | $ | 432 | $ | 318 | $ | 74 | $ | 360 | ||||||||
Commercial real estate | 418 | 262 | 65 | 283 | ||||||||||||
Home equity | 1,021 | 984 | 215 | 986 | ||||||||||||
Residential real estate | 397 | 420 | 75 | 422 | ||||||||||||
Credit card | 130 | 130 | 32 | 147 | ||||||||||||
Other consumer | 64 | 47 | 2 | 51 | ||||||||||||
Total impaired loans with an associated allowance | $ | 2,462 | $ | 2,161 | $ | 463 | $ | 2,249 | ||||||||
Impaired loans without an associated allowance | ||||||||||||||||
Commercial | $ | 106 | $ | 84 | $ | 133 | ||||||||||
Commercial real estate | 249 | 187 | 276 | |||||||||||||
Home equity | 403 | 145 | 134 | |||||||||||||
Residential real estate | 344 | 315 | 365 | |||||||||||||
Total impaired loans without an associated allowance | $ | 1,102 | $ | 731 | $ | 908 | ||||||||||
Total impaired loans | $ | 3,564 | $ | 2,892 | $ | 463 | $ | 3,157 | ||||||||
| (a) | Recorded investment in a loan includes the unpaid principal balance plus accrued interest and net accounting adjustments, less any charge-offs. Recorded investment does not include any associated valuation allowance. |
| (b) | Associated allowance amounts include $.3 billion and $.4 billion for TDRs at September 30, 2015 and December 31, 2014, respectively. |
| (c) | Average recorded investment is for the nine months ended September 30, 2015 and the year ended December 31, 2014, respectively. |
The PNC Financial Services Group, Inc. – Form 10-Q 81
N OTE 4 P URCHASED L OANS
Purchased Impaired Loans
Purchased impaired loan accounting addresses differences between contractual cash flows and cash flows expected to be collected from the initial investment in loans if those differences are attributable, at least in part, to credit quality. Several factors were considered when evaluating whether a loan was considered a purchased impaired loan, including the delinquency status of the loan, updated borrower credit status, geographic information, and updated LTV. GAAP allows purchasers to account for loans individually or to aggregate purchased impaired loans acquired in the same fiscal quarter into one or more pools, provided that the loans have common risk characteristics. A pool is then accounted for as a single asset with a single composite interest rate and an aggregate expectation of cash flows. Purchased impaired homogeneous consumer, residential real estate and smaller balance commercial loans with common risk characteristics are aggregated into pools where appropriate, whereas commercial loans with a total commitment greater than a defined threshold are accounted for individually. For pooled loans, proceeds of individual loans are not applied individually to each loan within a pool, but to the pool's recorded investment since it is
accounted for as a single asset. Upon final disposition of a loan within a pool ( e.g ., payoff, short-sale, foreclosure, etc .), the loan's carrying value is removed from the pool and any gain or loss associated with the transaction is retained in the pool's recorded investment. For example, upon final disposition of a loan by short-sale, the proceeds of the short-sale may be less (or more) than the loan's recorded investment. This shortfall or loss (excess or gain) is not accounted for as an individual loan sale in our income statement and is instead retained as part of the pool's recorded investment consistent with our accounting for the pool as a single asset. This treatment is designed to maintain a constant effective yield for recognition of interest income. Accordingly, a pool's recorded investment includes the net accumulation of realized losses or gains attributable to these final dispositions. As there are no future expected cash flows related to these dispositions, their net carrying value is $0. The recorded investment, including these realized losses and gains, is evaluated for collectability based upon the net present value of the pool's remaining expected cash flows when establishing our ALLL. See below and Note 1 Accounting Policies and Note 5 Allowances for Loan and Lease Losses and Unfunded Loan Commitments and Letters of Credit for additional information.
The following table provides balances of purchased impaired loans at September 30, 2015 and December 31, 2014:
Table 66: Purchased Impaired Loans – Balances
| September 30, 2015 | December 31, 2014 | |||||||||||||||||||||||
| In millions | Outstanding Balance (a) | Recorded Investment | Carrying Value | Outstanding Balance (a) | Recorded Investment | Carrying Value | ||||||||||||||||||
Commercial lending | ||||||||||||||||||||||||
Commercial | $ | 112 | $ | 43 | $ | 29 | $ | 159 | $ | 74 | $ | 57 | ||||||||||||
Commercial real estate | 184 | 161 | 108 | 307 | 236 | 174 | ||||||||||||||||||
Total commercial lending | 296 | 204 | 137 | 466 | 310 | 231 | ||||||||||||||||||
Consumer lending | ||||||||||||||||||||||||
Consumer | 1,864 | 1,753 | 1,468 | 2,145 | 1,989 | 1,661 | ||||||||||||||||||
Residential real estate | 1,990 | 2,210 | 1,744 | 2,396 | 2,559 | 2,094 | ||||||||||||||||||
Total consumer lending | 3,854 | 3,963 | 3,212 | 4,541 | 4,548 | 3,755 | ||||||||||||||||||
Total | $ | 4,150 | $ | 4,167 | $ | 3,349 | $ | 5,007 | $ | 4,858 | $ | 3,986 | ||||||||||||
| (a) | Outstanding balance represents the balance on the loan servicing system for active loans. It is possible for the outstanding balance to be lower than the recorded investment for certain loans due to the use of pool accounting. |
The excess of undiscounted cash flows expected at acquisition over the estimated fair value is referred to as the accretable yield and is recognized as interest income over the remaining life of the loan using the constant effective yield method. The difference between contractually required payments at acquisition and the cash flows expected to be collected at acquisition is referred to as the non-accretable difference and is not recognized in income. Subsequent changes in the expected cash flows of individual or pooled purchased impaired loans will either impact the accretable yield or result in an impairment charge to provision for credit losses in the period in which the changes become probable. Decreases to
the net present value of expected cash flows will generally result in an impairment charge recorded as a provision for credit losses, resulting in an increase to the ALLL, and a reclassification from accretable yield to non-accretable difference.
During the first nine months of 2015, $47 million of provision recapture was recorded for purchased impaired loans compared to $86 million of provision recapture during the first nine months of 2014. Charge-offs (which were specifically for commercial loans greater than a defined threshold) during the first nine months of 2015 were $7 million compared to $28
82 The PNC Financial Services Group, Inc. – Form 10-Q
million during the first nine months of 2014. At September 30, 2015 and December 31, 2014, the ALLL on total purchased impaired loans was $.8 billion and $.9 billion, respectively. For purchased impaired loan pools where an allowance has been recognized, subsequent increases in the net present value of cash flows will result in a provision recapture of any previously recorded ALLL to the extent applicable, and/or a reclassification from non-accretable difference to accretable yield, which will be recognized prospectively. Individual loan transactions where final dispositions have occurred (as noted above) result in removal of the loans from their applicable pools for cash flow estimation purposes. The cash flow re-estimation process is completed quarterly to evaluate the appropriateness of the ALLL associated with the purchased impaired loans.
Activity for the accretable yield during the first nine months of 2015 and 2014 follows:
Table 67: Purchased Impaired Loans – Accretable Yield
| In millions | 2015 | 2014 | ||||||
January 1 | $ | 1,558 | $ | 2,055 | ||||
Accretion (including excess cash recoveries) | (359 | ) | (449 | ) | ||||
Net reclassifications to accretable from non-accretable (a) | 218 | 237 | ||||||
Disposals | (66 | ) | (24 | ) | ||||
September 30 | $ | 1,351 | $ | 1,819 | ||||
| (a) | Approximately 66% and 68% of the net reclassifications for the nine months ended September 30, 2015 and 2014, respectively, were driven by the consumer portfolio and were due to improvements of cash expected to be collected on loans in future periods. The remaining net reclassifications were predominantly due to future cash flow changes in the commercial portfolio. |
N OTE 5 A LLOWANCES FOR L OAN AND L EASE L OSSES AND U NFUNDED L OAN C OMMITMENTS AND L ETTERS OF C REDIT
Allowance for Loan and Lease Losses
We maintain the ALLL at levels that we believe to be appropriate to absorb estimated probable credit losses incurred in the portfolios as of the balance sheet date. We use the two main portfolio segments – Commercial Lending and Consumer Lending – and develop and document the ALLL under separate methodologies for each of these segments as discussed in Note 1 Accounting Policies. A rollforward of the ALLL and associated loan data follows.
The PNC Financial Services Group, Inc. – Form 10-Q 83
Table 68: Rollforward of Allowance for Loan and Lease Losses and Associated Loan Data
| In millions | Commercial Lending | Consumer Lending | Total | |||||||||
September 30, 2015 | ||||||||||||
Allowance for Loan and Lease Losses | ||||||||||||
January 1 | $ | 1,571 | $ | 1,760 | $ | 3,331 | ||||||
Charge-offs | (176 | ) | (413 | ) | (589 | ) | ||||||
Recoveries | 188 | 135 | 323 | |||||||||
Net (charge-offs) / recoveries | 12 | (278 | ) | (266 | ) | |||||||
Provision for credit losses | 48 | 133 | 181 | |||||||||
Net change in allowance for unfunded loan commitments and letters of credit | (7 | ) | (7 | ) | ||||||||
Other | (2 | ) | (2 | ) | ||||||||
September 30 | $ | 1,622 | $ | 1,615 | $ | 3,237 | ||||||
TDRs individually evaluated for impairment | $ | 39 | $ | 263 | $ | 302 | ||||||
Other loans individually evaluated for impairment | 70 | 70 | ||||||||||
Loans collectively evaluated for impairment | 1,446 | 601 | 2,047 | |||||||||
Purchased impaired loans | 67 | 751 | 818 | |||||||||
September 30 | $ | 1,622 | $ | 1,615 | $ | 3,237 | ||||||
Loan Portfolio | ||||||||||||
TDRs individually evaluated for impairment (a) | $ | 420 | $ | 1,948 | $ | 2,368 | ||||||
Other loans individually evaluated for impairment | 291 | 291 | ||||||||||
Loans collectively evaluated for impairment (b) | 130,249 | 66,993 | 197,242 | |||||||||
Fair value option loans (c) | 915 | 915 | ||||||||||
Purchased impaired loans | 204 | 3,963 | 4,167 | |||||||||
September 30 | $ | 131,164 | $ | 73,819 | $ | 204,983 | ||||||
Portfolio segment ALLL as a percentage of total ALLL | 50 | % | 50 | % | 100 | % | ||||||
Ratio of the allowance for loan and lease losses to total loans | 1.24 | % | 2.19 | % | 1.58 | % | ||||||
September 30, 2014 | ||||||||||||
Allowance for Loan and Lease Losses | ||||||||||||
January 1 | $ | 1,547 | $ | 2,062 | $ | 3,609 | ||||||
Charge-offs | (286 | ) | (500 | ) | (786 | ) | ||||||
Recoveries | 230 | 143 | 373 | |||||||||
Net charge-offs | (56 | ) | (357 | ) | (413 | ) | ||||||
Provision for credit losses | 89 | 132 | 221 | |||||||||
Net change in allowance for unfunded loan commitments and letters of credit | (9 | ) | (9 | ) | ||||||||
Other | (2 | ) | (2 | ) | ||||||||
September 30 | $ | 1,569 | $ | 1,837 | $ | 3,406 | ||||||
TDRs individually evaluated for impairment | $ | 26 | $ | 382 | $ | 408 | ||||||
Other loans individually evaluated for impairment | 98 | 98 | ||||||||||
Loans collectively evaluated for impairment | 1,349 | 660 | 2,009 | |||||||||
Purchased impaired loans | 96 | 795 | 891 | |||||||||
September 30 | $ | 1,569 | $ | 1,837 | $ | 3,406 | ||||||
Loan Portfolio | ||||||||||||
TDRs individually evaluated for impairment (a) | $ | 551 | $ | 2,064 | $ | 2,615 | ||||||
Other loans individually evaluated for impairment | 402 | 402 | ||||||||||
Loans collectively evaluated for impairment (b) | 122,705 | 68,966 | 191,671 | |||||||||
Fair value option loans (c) | 1,017 | 1,017 | ||||||||||
Purchased impaired loans | 405 | 4,762 | 5,167 | |||||||||
September 30 | $ | 124,063 | $ | 76,809 | $ | 200,872 | ||||||
Portfolio segment ALLL as a percentage of total ALLL | 46 | % | 54 | % | 100 | % | ||||||
Ratio of the allowance for loan and lease losses to total loans | 1.26 | % | 2.39 | % | 1.70 | % | ||||||
| (a) | TDRs individually evaluated for impairment exclude TDRs that were subsequently accounted for as held for sale loans, but continue to be disclosed as TDRs. |
| (b) | Includes $157 million of loans collectively evaluated for impairment based upon collateral values and written down to the respective collateral value less costs to sell at September 30, 2015. Accordingly, there is no allowance recorded for these loans. The comparative amount as of September 30, 2014 was $221 million. |
| (c) | Loans accounted for under the fair value option are not evaluated for impairment as these loans are accounted for at fair value. Accordingly, there is no allowance recorded on these loans. |
84 The PNC Financial Services Group, Inc. – Form 10-Q
Allowance for Unfunded Loan Commitments and Letters of Credit
We maintain the allowance for unfunded loan commitments and letters of credit at a level we believe is appropriate to absorb estimated probable credit losses incurred on these unfunded credit facilities as of the balance sheet date as discussed in Note 1 Accounting Policies. A rollforward of the allowance is presented below.
Table 69: Rollforward of Allowance for Unfunded Loan Commitments and Letters of Credit
| In millions | 2015 | 2014 | ||||||
January 1 | $ | 259 | $ | 242 | ||||
Net change in allowance for unfunded loan commitments and letters of credit | 7 | 9 | ||||||
September 30 | $ | 266 | $ | 251 | ||||
The PNC Financial Services Group, Inc. – Form 10-Q 85
N OTE 6 I NVESTMENT S ECURITIES
Table 70: Investment Securities Summary
Amortized Cost | Unrealized | Fair Value | ||||||||||||||
| In millions | Gains | Losses | ||||||||||||||
September 30, 2015 | ||||||||||||||||
Securities Available for Sale | ||||||||||||||||
Debt securities | ||||||||||||||||
U.S. Treasury and government agencies | $ | 8,113 | $ | 197 | $ | (19 | ) | $ | 8,291 | |||||||
Residential mortgage-backed | ||||||||||||||||
Agency | 24,141 | 402 | (34 | ) | 24,509 | |||||||||||
Non-agency | 4,151 | 269 | (81 | ) | 4,339 | |||||||||||
Commercial mortgage-backed | ||||||||||||||||
Agency | 1,942 | 25 | (4 | ) | 1,963 | |||||||||||
Non-agency | 4,709 | 59 | (11 | ) | 4,757 | |||||||||||
Asset-backed | 5,195 | 72 | (33 | ) | 5,234 | |||||||||||
State and municipal | 1,999 | 69 | (7 | ) | 2,061 | |||||||||||
Other debt | 1,896 | 43 | (6 | ) | 1,933 | |||||||||||
Total debt securities | 52,146 | 1,136 | (195 | ) | 53,087 | |||||||||||
Corporate stocks and other | 576 | 1 | (1 | ) | 576 | |||||||||||
Total securities available for sale | $ | 52,722 | $ | 1,137 | $ | (196 | ) | $ | 53,663 | |||||||
Securities Held to Maturity (a) | ||||||||||||||||
Debt securities | ||||||||||||||||
U.S. Treasury and government agencies | $ | 255 | $ | 47 | $ | 302 | ||||||||||
Residential mortgage-backed | ||||||||||||||||
Agency | 9,044 | 155 | $ | (23 | ) | 9,176 | ||||||||||
Non-agency | 241 | 11 | 252 | |||||||||||||
Commercial mortgage-backed | ||||||||||||||||
Agency | 1,135 | 57 | 1,192 | |||||||||||||
Non-agency | 768 | 19 | 787 | |||||||||||||
Asset-backed | 726 | – | (10 | ) | 716 | |||||||||||
State and municipal | 1,973 | 106 | 2,079 | |||||||||||||
Other debt | 261 | 1 | (1 | ) | 261 | |||||||||||
Total securities held to maturity | $ | 14,403 | $ | 396 | $ | (34 | ) | $ | 14,765 | |||||||
December 31, 2014 | ||||||||||||||||
Securities Available for Sale | ||||||||||||||||
Debt securities | ||||||||||||||||
U.S. Treasury and government agencies | $ | 5,237 | $ | 186 | $ | (1 | ) | $ | 5,422 | |||||||
Residential mortgage-backed | ||||||||||||||||
Agency | 17,646 | 438 | (41 | ) | 18,043 | |||||||||||
Non-agency | 4,723 | 318 | (99 | ) | 4,942 | |||||||||||
Commercial mortgage-backed | ||||||||||||||||
Agency | 2,178 | 23 | (14 | ) | 2,187 | |||||||||||
Non-agency | 4,085 | 88 | (11 | ) | 4,162 | |||||||||||
Asset-backed | 5,141 | 78 | (32 | ) | 5,187 | |||||||||||
State and municipal | 1,953 | 88 | (3 | ) | 2,038 | |||||||||||
Other debt | 1,776 | 43 | (6 | ) | 1,813 | |||||||||||
Total debt securities | 42,739 | 1,262 | (207 | ) | 43,794 | |||||||||||
Corporate stocks and other | 442 | (1 | ) | 441 | ||||||||||||
Total securities available for sale | $ | 43,181 | $ | 1,262 | $ | (208 | ) | $ | 44,235 | |||||||
Securities Held to Maturity (a) | ||||||||||||||||
Debt securities | ||||||||||||||||
U.S. Treasury and government agencies | $ | 248 | $ | 44 | $ | 292 | ||||||||||
Residential mortgage-backed | ||||||||||||||||
Agency | 5,736 | 166 | $ | (10 | ) | 5,892 | ||||||||||
Non-agency | 270 | 13 | 283 | |||||||||||||
Commercial mortgage-backed | ||||||||||||||||
Agency | 1,200 | 53 | 1,253 | |||||||||||||
Non-agency | 1,010 | 19 | 1,029 | |||||||||||||
Asset-backed | 759 | 2 | (8 | ) | 753 | |||||||||||
State and municipal | 2,042 | 111 | 2,153 | |||||||||||||
Other debt | 323 | 6 | 329 | |||||||||||||
Total securities held to maturity | $ | 11,588 | $ | 414 | $ | (18 | ) | $ | 11,984 | |||||||
| (a) | Held to maturity securities transferred from available for sale are included in held to maturity at fair value at the time of transfer. The amortized cost of held to maturity securities included net unrealized gains of $104 million and $125 million at September 30, 2015 and December 31, 2014, respectively, related to securities transferred, which are offset in Accumulated Other Comprehensive Income, net of tax. |
86 The PNC Financial Services Group, Inc. – Form 10-Q
The fair value of investment securities is impacted by interest rates, credit spreads, market volatility and liquidity conditions. Net unrealized gains and losses in the securities available for sale portfolio are included in Shareholders' equity as Accumulated other comprehensive income or loss, net of tax, unless credit-related. Securities held to maturity are carried at amortized cost. At September 30, 2015, Accumulated other comprehensive income included pretax gains of $98 million from derivatives that hedged the purchase of investment securities classified as held to maturity. The gains will be accreted into interest income as an adjustment of yield on the securities.
Table 71 presents gross unrealized losses on securities available for sale at September 30, 2015 and December 31, 2014. The securities are segregated between investments that have been in a continuous unrealized loss position for less than twelve months and twelve months or more based on the point in time that the fair value declined below the amortized cost basis. The table includes debt securities where a portion of other-than-temporary impairment (OTTI) has been recognized in Accumulated other comprehensive income (loss).
Table 71: Gross Unrealized Loss and Fair Value of Securities Available for Sale
| In millions | Unrealized loss position less than 12 months | Unrealized loss position 12 months or more | Total | |||||||||||||||||||||
| Unrealized Loss | Fair Value | Unrealized Loss | Fair Value | Unrealized Loss | Fair Value | |||||||||||||||||||
September 30, 2015 | ||||||||||||||||||||||||
Debt securities | ||||||||||||||||||||||||
U.S. Treasury and government agencies | $ | (19 | ) | $ | 3,402 | $ | (19 | ) | $ | 3,402 | ||||||||||||||
Residential mortgage-backed | ||||||||||||||||||||||||
Agency | (17 | ) | 3,516 | $ | (17 | ) | $ | 963 | (34 | ) | 4,479 | |||||||||||||
Non-agency | (4 | ) | 290 | (77 | ) | 1,412 | (81 | ) | 1,702 | |||||||||||||||
Commercial mortgage-backed | ||||||||||||||||||||||||
Agency | (1 | ) | 230 | (3 | ) | 143 | (4 | ) | 373 | |||||||||||||||
Non-agency | (10 | ) | 1,735 | (1 | ) | 337 | (11 | ) | 2,072 | |||||||||||||||
Asset-backed | (17 | ) | 2,088 | (16 | ) | 464 | (33 | ) | 2,552 | |||||||||||||||
State and municipal | (5 | ) | 363 | (2 | ) | 43 | (7 | ) | 406 | |||||||||||||||
Other debt | (3 | ) | 210 | (3 | ) | 134 | (6 | ) | 344 | |||||||||||||||
Total debt securities | (76 | ) | 11,834 | (119 | ) | 3,496 | (195 | ) | 15,330 | |||||||||||||||
Corporate stocks and other | (1 | ) | 16 | (1 | ) | 16 | ||||||||||||||||||
Total | $ | (76 | ) | $ | 11,834 | $ | (120 | ) | $ | 3,512 | $ | (196 | ) | $ | 15,346 | |||||||||
December 31, 2014 | ||||||||||||||||||||||||
Debt securities | ||||||||||||||||||||||||
U.S. Treasury and government agencies | $ | (1 | ) | $ | 1,426 | $ | (1 | ) | $ | 1,426 | ||||||||||||||
Residential mortgage-backed | ||||||||||||||||||||||||
Agency | (4 | ) | 644 | $ | (37 | ) | $ | 1,963 | (41 | ) | 2,607 | |||||||||||||
Non-agency | (5 | ) | 276 | (94 | ) | 1,487 | (99 | ) | 1,763 | |||||||||||||||
Commercial mortgage-backed | ||||||||||||||||||||||||
Agency | (2 | ) | 681 | (12 | ) | 322 | (14 | ) | 1,003 | |||||||||||||||
Non-agency | (4 | ) | 928 | (7 | ) | 335 | (11 | ) | 1,263 | |||||||||||||||
Asset-backed | (4 | ) | 913 | (28 | ) | 1,133 | (32 | ) | 2,046 | |||||||||||||||
State and municipal | (a) | 41 | (3 | ) | 77 | (3 | ) | 118 | ||||||||||||||||
Other debt | (2 | ) | 314 | (4 | ) | 186 | (6 | ) | 500 | |||||||||||||||
Total debt securities | (22 | ) | 5,223 | (185 | ) | 5,503 | (207 | ) | 10,726 | |||||||||||||||
Corporate stocks and other | (1 | ) | 15 | (1 | ) | 15 | ||||||||||||||||||
Total | $ | (22 | ) | $ | 5,223 | $ | (186 | ) | $ | 5,518 | $ | (208 | ) | $ | 10,741 | |||||||||
| (a) | The unrealized loss on these securities was less than $.5 million. |
The PNC Financial Services Group, Inc. – Form 10-Q 87
The gross unrealized loss on debt securities held to maturity was $36 million at September 30, 2015, with $18 million of the loss related to securities with a fair value of $3.2 billion that had been in a continuous loss position less than 12 months and $18 million of the loss related to securities with a fair value of $ 972 million that had been in a continuous loss position for more than 12 months. The gross unrealized loss on debt securities held to maturity was $22 million at December 31, 2014, with $1 million of the loss related to securities with a fair value of $134 million that had been in a continuous loss position less than 12 months and $21 million of the loss related to securities with a fair value of $1.6 billion that had been in a continuous loss position for more than 12 months. For securities transferred to held to maturity from available for sale, the unrealized loss for purposes of this analysis is determined by comparing the security's original amortized cost to its current estimated fair value.
Evaluating Investment Securities for Other-than-Temporary Impairments
For the securities in the preceding Table 71, as of September 30, 2015 we do not intend to sell and believe we will not be required to sell the securities prior to recovery of the amortized cost basis.
At least quarterly, we conduct a comprehensive security-level assessment on all securities. For those securities in an unrealized loss position we determine if OTTI exists. An unrealized loss exists when the current fair value of an individual security is less than its amortized cost basis. An OTTI loss must be recognized for a debt security in an unrealized loss position if we intend to sell the security or it is more likely than not we will be required to sell the security prior to recovery of its amortized cost basis. In this situation, the amount of loss recognized in income is equal to the difference between the fair value and the amortized cost basis of the security. Even if we do not expect to sell the security, we must evaluate the expected cash flows to be received to determine if we believe a credit loss has occurred. In the event of a credit loss, only the amount of impairment associated with the credit loss is recognized in income. The portion of the unrealized loss relating to other factors, such as liquidity conditions in the market or changes in market interest rates, is recorded in accumulated other comprehensive income (loss).
The security-level assessment is performed on each investment security. Our assessment considers the security structure, recent security collateral performance metrics if applicable, external credit ratings, failure of the issuer to make scheduled interest or principal payments, our judgment and expectations of future performance, and relevant independent industry research, analysis and forecasts. Results of the periodic assessment are reviewed by a cross-functional senior management team representing Asset & Liability Management, Finance, and Market Risk Management. The senior management team considers the results of the assessments, as well as other factors, in determining whether the impairment is other-than-temporary.
Substantially all of the credit impairment we have recognized relates to non-agency residential mortgage-backed securities and asset-backed securities collateralized by first-lien and second-lien non-agency residential mortgage loans. Potential credit losses on these securities are evaluated on a security-by-security basis. Collateral performance assumptions are developed for each security after reviewing collateral composition and collateral performance statistics. This includes analyzing recent delinquency roll rates, loss severities, voluntary prepayments and various other collateral and performance metrics. This information is then combined with general expectations on the housing market, employment and other macroeconomic factors to develop estimates of future performance.
Security level assumptions for prepayments, loan defaults and loss given default are applied to each non-agency residential mortgage-backed security and asset-backed security collateralized by first-lien and second-lien non-agency residential mortgage loans using a third-party cash flow model. The third-party cash flow model then generates projected cash flows according to the structure of each security. Based on the results of the cash flow analysis, we determine whether we expect that we will recover the amortized cost basis of our security.
For those securities on our balance sheet where we determined losses represented OTTI, we have recorded cumulative credit losses of $1.1 billion at September 30, 2015. During the first nine months and third quarters of 2015 and 2014, the OTTI credit losses recognized in noninterest income and the OTTI noncredit losses recognized in accumulated other comprehensive income (loss), net of tax, on securities were not significant.
88 The PNC Financial Services Group, Inc. – Form 10-Q
Information relating to gross realized securities gains and losses from the sales of securities is set forth in the following table.
Table 72: Gains (Losses) on Sales of Securities Available for Sale
| In millions | Proceeds | Gross Gains | Gross Losses | Net Gains | Tax Expense | |||||||||||||||
Nine months ended September 30 | ||||||||||||||||||||
2015 | $ | 3,445 | $ | 54 | $ | (13 | ) | $ | 41 | $ | 14 | |||||||||
2014 | $ | 3,606 | $ | 29 | $ | (25 | ) | $ | 4 | $ | 1 | |||||||||
The following table presents, by remaining contractual maturity, the amortized cost, fair value and weighted-average yield of debt securities at September 30, 2015.
Table 73: Contractual Maturity of Debt Securities
| September 30, 2015 Dollars in millions | 1 Year or Less | After 1 Year through 5 Years | After 5 Years through 10 Years | After 10 Years | Total | |||||||||||||||
Securities Available for Sale | ||||||||||||||||||||
U.S. Treasury and government agencies | $ | 509 | $ | 1,607 | $ | 5,469 | $ | 528 | $ | 8,113 | ||||||||||
Residential mortgage-backed | ||||||||||||||||||||
Agency | 109 | 981 | 23,051 | 24,141 | ||||||||||||||||
Non-agency | 4 | 4,147 | 4,151 | |||||||||||||||||
Commercial mortgage-backed | ||||||||||||||||||||
Agency | 86 | 114 | 83 | 1,659 | 1,942 | |||||||||||||||
Non-agency | 50 | 28 | 8 | 4,623 | 4,709 | |||||||||||||||
Asset-backed | 14 | 1,257 | 1,826 | 2,098 | 5,195 | |||||||||||||||
State and municipal | 3 | 122 | 328 | 1,546 | 1,999 | |||||||||||||||
Other debt | 142 | 1,230 | 358 | 166 | 1,896 | |||||||||||||||
Total debt securities available for sale | $ | 804 | $ | 4,471 | $ | 9,053 | $ | 37,818 | $ | 52,146 | ||||||||||
Fair value | $ | 810 | $ | 4,550 | $ | 9,185 | $ | 38,542 | $ | 53,087 | ||||||||||
Weighted-average yield, GAAP basis | 2.82 | % | 2.25 | % | 2.36 | % | 2.95 | % | 2.78 | % | ||||||||||
Securities Held to Maturity | ||||||||||||||||||||
U.S. Treasury and government agencies | $ | 255 | $ | 255 | ||||||||||||||||
Residential mortgage-backed | ||||||||||||||||||||
Agency | $ | 199 | 8,845 | 9,044 | ||||||||||||||||
Non-agency | 241 | 241 | ||||||||||||||||||
Commercial mortgage-backed | ||||||||||||||||||||
Agency | $ | 935 | 143 | 57 | 1,135 | |||||||||||||||
Non-agency | 6 | 762 | 768 | |||||||||||||||||
Asset-backed | 5 | 591 | 130 | 726 | ||||||||||||||||
State and municipal | 56 | 888 | 1,029 | 1,973 | ||||||||||||||||
Other debt | 261 | 261 | ||||||||||||||||||
Total debt securities held to maturity | $ | 1,002 | $ | 2,082 | $ | 11,319 | $ | 14,403 | ||||||||||||
Fair value | $ | 1,045 | $ | 2,147 | $ | 11,573 | $ | 14,765 | ||||||||||||
Weighted-average yield, GAAP basis | 3.50 | % | 3.09 | % | 3.50 | % | 3.44 | % | ||||||||||||
The PNC Financial Services Group, Inc. – Form 10-Q 89
Weighted-average yields are based on historical cost with effective yields weighted for the contractual maturity of each security. At September 30, 2015, there were no securities of a single issuer, other than FNMA, that exceeded 10% of Total shareholders' equity.
The following table presents the fair value of securities that have been either pledged to or accepted from others to collateralize outstanding borrowings.
Table 74: Fair Value of Securities Pledged and Accepted as Collateral
| In millions | September 30 2015 | December 31 2014 | ||||||
Pledged to others | $ | 10,186 | $ | 10,874 | ||||
Accepted from others: | ||||||||
Permitted by contract or custom to sell or repledge | 1,167 | 1,658 | ||||||
Permitted amount repledged to others | 1,008 | 1,488 | ||||||
The securities pledged to others include positions held in our portfolio of investment securities, trading securities, and securities accepted as collateral from others that we are permitted by contract or custom to sell or repledge, and were used to secure public and trust deposits, repurchase agreements, and for other purposes.
N OTE 7 F AIR V ALUE
Fair Value Measurement
PNC measures certain financial assets and liabilities at fair value in accordance with GAAP. Fair value is defined in GAAP as the price that would be received to sell an asset or the price that would be paid to transfer a liability on the measurement date. GAAP focuses on the exit price in the principal or most advantageous market for the asset or liability in an orderly transaction between market participants. GAAP also establishes a fair value hierarchy to maximize the use of observable inputs when measuring fair value. For more information regarding the fair value hierarchy see Note 7 Fair Value in our 2014 Form 10-K.
Assets and Liabilities Measured at Fair Value on a Recurring Basis
For more information on the valuation methodologies used to measure assets and liabilities at fair value on a recurring basis, see Note 7 Fair Value in our 2014 Form 10-K. The following table summarizes our assets and liabilities measured at fair value on a recurring basis, including instruments for which PNC has elected the fair value option.
90 The PNC Financial Services Group, Inc. – Form 10-Q
Table 75: Fair Value Measurements – Recurring Basis Summary
| September 30, 2015 | December 31, 2014 | |||||||||||||||||||||||||||||||
| In millions | Level 1 | Level 2 | Level 3 | Total Fair Value | Level 1 | Level 2 | Level 3 | Total Fair Value | ||||||||||||||||||||||||
Assets | ||||||||||||||||||||||||||||||||
Securities available for sale | ||||||||||||||||||||||||||||||||
U.S. Treasury and government agencies | $ | 7,674 | $ | 617 | $ | 8,291 | $ | 4,795 | $ | 627 | $ | 5,422 | ||||||||||||||||||||
Residential mortgage-backed | ||||||||||||||||||||||||||||||||
Agency | 24,509 | 24,509 | 18,043 | 18,043 | ||||||||||||||||||||||||||||
Non-agency | 124 | $ | 4,215 | 4,339 | 144 | $ | 4,798 | 4,942 | ||||||||||||||||||||||||
Commercial mortgage-backed | ||||||||||||||||||||||||||||||||
Agency | 1,963 | 1,963 | 2,187 | 2,187 | ||||||||||||||||||||||||||||
Non-agency | 4,757 | 4,757 | 4,162 | 4,162 | ||||||||||||||||||||||||||||
Asset-backed | 4,723 | 511 | 5,234 | 4,624 | 563 | 5,187 | ||||||||||||||||||||||||||
State and municipal | 2,045 | 16 | 2,061 | 1,904 | 134 | 2,038 | ||||||||||||||||||||||||||
Other debt | 1,903 | 30 | 1,933 | 1,783 | 30 | 1,813 | ||||||||||||||||||||||||||
Total debt securities | 7,674 | 40,641 | 4,772 | 53,087 | 4,795 | 33,474 | 5,525 | 43,794 | ||||||||||||||||||||||||
Corporate stocks and other | 513 | 63 | 576 | 426 | 15 | 441 | ||||||||||||||||||||||||||
Total securities available for sale | 8,187 | 40,704 | 4,772 | 53,663 | 5,221 | 33,489 | 5,525 | 44,235 | ||||||||||||||||||||||||
Financial derivatives (a) (b) | ||||||||||||||||||||||||||||||||
Interest rate contracts | 4 | 5,823 | 43 | 5,870 | 4 | 4,874 | 40 | 4,918 | ||||||||||||||||||||||||
Other contracts | 360 | 2 | 362 | 314 | 2 | 316 | ||||||||||||||||||||||||||
Total financial derivatives | 4 | 6,183 | 45 | 6,232 | 4 | 5,188 | 42 | 5,234 | ||||||||||||||||||||||||
Residential mortgage loans held for sale (c) | 1,081 | 5 | 1,086 | 1,255 | 6 | 1,261 | ||||||||||||||||||||||||||
Trading securities (d) | ||||||||||||||||||||||||||||||||
Debt (e) | 915 | 974 | 3 | 1,892 | 1,340 | 960 | 32 | 2,332 | ||||||||||||||||||||||||
Equity | 9 | 9 | 21 | 21 | ||||||||||||||||||||||||||||
Total trading securities | 924 | 974 | 3 | 1,901 | 1,361 | 960 | 32 | 2,353 | ||||||||||||||||||||||||
Trading loans (a) | 37 | 37 | 30 | 7 | 37 | |||||||||||||||||||||||||||
Residential mortgage servicing rights | 962 | 962 | 845 | 845 | ||||||||||||||||||||||||||||
Commercial mortgage servicing rights | 505 | 505 | 506 | 506 | ||||||||||||||||||||||||||||
Commercial mortgage loans held for sale (c) | 802 | 802 | 893 | 893 | ||||||||||||||||||||||||||||
Equity investments (a) | ||||||||||||||||||||||||||||||||
Direct investments | 1,215 | 1,215 | 1,152 | 1,152 | ||||||||||||||||||||||||||||
Indirect investments (f) | 406 | 406 | 469 | 469 | ||||||||||||||||||||||||||||
Total equity investments | 1,621 | 1,621 | 1,621 | 1,621 | ||||||||||||||||||||||||||||
Customer resale agreements (g) | 139 | 139 | 155 | 155 | ||||||||||||||||||||||||||||
Loans (h) | 565 | 350 | 915 | 637 | 397 | 1,034 | ||||||||||||||||||||||||||
Other assets (a) | ||||||||||||||||||||||||||||||||
BlackRock Series C Preferred Stock (i) | 312 | 312 | 375 | 375 | ||||||||||||||||||||||||||||
Other | 238 | 192 | 7 | 437 | 190 | 226 | 8 | 424 | ||||||||||||||||||||||||
Total other assets | 238 | 192 | 319 | 749 | 190 | 226 | 383 | 799 | ||||||||||||||||||||||||
Total assets | $ | 9,353 | $ | 49,875 | $ | 9,384 | $ | 68,612 | $ | 6,776 | $ | 41,940 | $ | 10,257 | $ | 58,973 | ||||||||||||||||
Liabilities | ||||||||||||||||||||||||||||||||
Financial derivatives (b) (j) | ||||||||||||||||||||||||||||||||
Interest rate contracts | $ | 4 | $ | 3,892 | $ | 9 | $ | 3,905 | $ | 3,260 | $ | 12 | $ | 3,272 | ||||||||||||||||||
BlackRock LTIP | 312 | 312 | 375 | 375 | ||||||||||||||||||||||||||||
Other contracts | 251 | 122 | 373 | 241 | 139 | 380 | ||||||||||||||||||||||||||
Total financial derivatives | 4 | 4,143 | 443 | 4,590 | 3,501 | 526 | 4,027 | |||||||||||||||||||||||||
Trading securities sold short (k) | ||||||||||||||||||||||||||||||||
Debt | 1,035 | 7 | 1,042 | $ | 1,479 | 11 | 1,490 | |||||||||||||||||||||||||
Total trading securities sold short | 1,035 | 7 | 1,042 | 1,479 | 11 | 1,490 | ||||||||||||||||||||||||||
Other borrowed funds (k) | 74 | 62 | 136 | 92 | 181 | 273 | ||||||||||||||||||||||||||
Other liabilities (j) | 5 | 10 | 15 | 9 | 9 | |||||||||||||||||||||||||||
Total liabilities | $ | 1,039 | $ | 4,229 | $ | 515 | $ | 5,783 | $ | 1,479 | $ | 3,604 | $ | 716 | $ | 5,799 | ||||||||||||||||
(continued on following page)
The PNC Financial Services Group, Inc. – Form 10-Q 91
(continued from following page)
| (a) | Included in Other assets on our Consolidated Balance Sheet. |
| (b) | Amounts at September 30, 2015 and December 31, 2014, are presented gross and are not reduced by the impact of legally enforceable master netting agreements that allow PNC to net positive and negative positions and cash collateral held or placed with the same counterparty. At September 30, 2015 and December 31, 2014, the net asset amounts were $3.6 billion and $2.6 billion, respectively, and the net liability amounts were $1.9 billion and $1.4 billion, respectively. |
| (c) | Included in Loans held for sale on our Consolidated Balance Sheet. PNC has elected the fair value option for certain residential and commercial mortgage loans held for sale. |
| (d) | Fair value includes net unrealized gains of $43 million at September 30, 2015 compared with net unrealized gains of $54 million at December 31, 2014. |
| (e) | Approximately 33% of these securities are residential mortgage-backed securities and 48% are U.S. Treasury and government agencies securities at September 30, 2015. Comparable amounts at December 31, 2014 were 34% and 57%, respectively. |
| (f) | The indirect equity funds are not redeemable, but PNC receives distributions over the life of the partnership from liquidation of the underlying investments by the investee, which we expect to occur over the next twelve years. The amount of unfunded contractual commitments as of September 30, 2015 related to indirect equity investments was $113 million and related to direct equity investments was $26 million, respectively. Comparable amounts at December 31, 2014 were $112 million and $28 million, respectively. |
| (g) | Included in Federal funds sold and resale agreements on our Consolidated Balance Sheet. PNC has elected the fair value option for these items. |
| (h) | Included in Loans on our Consolidated Balance Sheet. |
| (i) | PNC has elected the fair value option for these shares. |
| (j) | Included in Other liabilities on our Consolidated Balance Sheet. |
| (k) | Included in Other borrowed funds on our Consolidated Balance Sheet. |
Reconciliations of assets and liabilities measured at fair value on a recurring basis using Level 3 inputs for the three and nine months ended September 30, 2015 and 2014 follow:
Table 76: Reconciliation of Level 3 Assets and Liabilities
Three Months Ended September 30, 2015
Total realized / unrealized gains or losses | Unrealized gains (losses) on assets and liabilities held on Consolidated Balance Sheet at 2015 (c) | |||||||||||||||||||||||||||||||||||||||||||
Level 3 Instruments Only In millions | Fair Value June 30, 2015 | Included in Earnings | Included in Other comprehensive income | Purchases | Sales | Issuances | Settlements | Transfers into Level 3 (b) | Transfers out of Level 3 (b) | Fair Value Sept. 30, 2015 | ||||||||||||||||||||||||||||||||||
Assets | ||||||||||||||||||||||||||||||||||||||||||||
Securities available for sale | ||||||||||||||||||||||||||||||||||||||||||||
Residential mortgage-backed non-agency | $ | 4,424 | $ | 30 | $ | (9 | ) | $ | (230 | ) | $ | 4,215 | ||||||||||||||||||||||||||||||||
Asset-backed | 531 | 5 | 2 | (27 | ) | 511 | (1 | ) | ||||||||||||||||||||||||||||||||||||
State and municipal | 16 | 16 | ||||||||||||||||||||||||||||||||||||||||||
Other debt | 33 | (1 | ) | $ | 8 | $ | (5 | ) | (5 | ) | 30 | |||||||||||||||||||||||||||||||||
Total securities available for sale | 5,004 | 35 | (8 | ) | 8 | (5 | ) | (262 | ) | 4,772 | (1 | ) | ||||||||||||||||||||||||||||||||
Financial derivatives | 36 | 39 | (30 | ) | 45 | 48 | ||||||||||||||||||||||||||||||||||||||
Residential mortgage loans held for sale | 10 | 1 | 4 | (1 | ) | $ | 2 | $ | (11 | ) | 5 | |||||||||||||||||||||||||||||||||
Trading securities – Debt | 3 | 3 | ||||||||||||||||||||||||||||||||||||||||||
Residential mortgage servicing rights | 1,015 | (137 | ) | 111 | 23 | (50 | ) | 962 | (136 | ) | ||||||||||||||||||||||||||||||||||
Commercial mortgage servicing rights | 543 | (44 | ) | 15 | 14 | (23 | ) | 505 | (44 | ) | ||||||||||||||||||||||||||||||||||
Commercial mortgage loans held for sale | 757 | 19 | 874 | (848 | ) | 802 | 7 | |||||||||||||||||||||||||||||||||||||
Equity investments | ||||||||||||||||||||||||||||||||||||||||||||
Direct investments | 1,191 | 36 | 87 | (99 | ) | 1,215 | 39 | |||||||||||||||||||||||||||||||||||||
Indirect investments | 425 | 27 | 3 | (49 | ) | 406 | 27 | |||||||||||||||||||||||||||||||||||||
Total equity investments | 1,616 | 63 | 90 | (148 | ) | 1,621 | 66 | |||||||||||||||||||||||||||||||||||||
Loans | 365 | 4 | 29 | (13 | ) | (24 | ) | 10 | (21 | ) | 350 | 1 | ||||||||||||||||||||||||||||||||
Other assets | ||||||||||||||||||||||||||||||||||||||||||||
BlackRock Series C Preferred Stock | 363 | (51 | ) | 312 | (51 | ) | ||||||||||||||||||||||||||||||||||||||
Other | 7 | 7 | ||||||||||||||||||||||||||||||||||||||||||
Total other assets | 370 | (51 | ) | 319 | (51 | ) | ||||||||||||||||||||||||||||||||||||||
Total assets | $ | 9,719 | $ | (71 | ) (e) | $ | (8 | ) | $ | 257 | $ | (167 | ) | $ | 911 | $ | (1,237 | ) | $ | 12 | $ | (32 | ) | $ | 9,384 | $ | (110 | ) (f) | ||||||||||||||||
Liabilities | ||||||||||||||||||||||||||||||||||||||||||||
Financial derivatives (d) | $ | 498 | $ | (54 | ) | $ | (1 | ) | $ | 443 | $ | (57 | ) | |||||||||||||||||||||||||||||||
Other borrowed funds | 165 | 1 | $ | 23 | (127 | ) | 62 | |||||||||||||||||||||||||||||||||||||
Other liabilities | 10 | 10 | ||||||||||||||||||||||||||||||||||||||||||
Total liabilities | $ | 673 | $ | (53 | ) (e) | $ | 23 | $ | (128 | ) | $ | 515 | $ | (57 | ) (f) | |||||||||||||||||||||||||||||
92 The PNC Financial Services Group, Inc. – Form 10-Q
Three Months Ended September 30, 2014
Total realized / unrealized gains or losses for the period (a) | Unrealized Consolidated | |||||||||||||||||||||||||||||||||||||||||||
Level 3 Instruments Only In millions | Fair Value June 30, 2014 | Included in Earnings | Included in Other comprehensive income | Purchases | Sales | Issuances | Settlements | Transfers into Level 3 (b) | Transfers out of Level 3 (b) | Fair Value Sept. 30, 2014 | ||||||||||||||||||||||||||||||||||
Assets | ||||||||||||||||||||||||||||||||||||||||||||
Securities available for sale | ||||||||||||||||||||||||||||||||||||||||||||
Residential mortgage-backed non-agency | $ | 5,107 | $ | 31 | $ | (5 | ) | $ | (222 | ) | $ | 4,911 | $ | (1 | ) | |||||||||||||||||||||||||||||
Asset-backed | 619 | 3 | 9 | (39 | ) | 592 | ||||||||||||||||||||||||||||||||||||||
State and municipal | 345 | 1 | 346 | |||||||||||||||||||||||||||||||||||||||||
Other debt | 31 | 31 | ||||||||||||||||||||||||||||||||||||||||||
Total securities available for sale | 6,102 | 34 | 5 | (261 | ) | 5,880 | (1 | ) | ||||||||||||||||||||||||||||||||||||
Financial derivatives | 41 | 46 | $ | 1 | (59 | ) | 29 | 30 | ||||||||||||||||||||||||||||||||||||
Residential mortgage loans held for sale | 4 | 3 | $ | 5 | $ | (8 | ) | 4 | ||||||||||||||||||||||||||||||||||||
Trading securities – Debt | 33 | 1 | 34 | |||||||||||||||||||||||||||||||||||||||||
Residential mortgage servicing rights | 967 | (4 | ) | 28 | $ | 23 | (36 | ) | 978 | (3 | ) | |||||||||||||||||||||||||||||||||
Commercial mortgage servicing rights | 515 | 5 | 16 | 19 | (23 | ) | 532 | 5 | ||||||||||||||||||||||||||||||||||||
Commercial mortgage loans held for sale | 521 | 6 | 349 | (9 | ) | 867 | 6 | |||||||||||||||||||||||||||||||||||||
Equity investments | ||||||||||||||||||||||||||||||||||||||||||||
Direct investments | 1,219 | 48 | 93 | $ | (125 | ) | 1,235 | 38 | ||||||||||||||||||||||||||||||||||||
Indirect investments | 574 | 28 | 7 | (56 | ) | 553 | 27 | |||||||||||||||||||||||||||||||||||||
Total equity investments | 1,793 | 76 | 100 | (181 | ) | 1,788 | 65 | |||||||||||||||||||||||||||||||||||||
Loans (g) | 373 | 22 | 29 | (4 | ) | (22 | ) | 7 | (22 | ) | 383 | 20 | ||||||||||||||||||||||||||||||||
Other assets | ||||||||||||||||||||||||||||||||||||||||||||
BlackRock Series C Preferred Stock | 335 | 10 | 345 | 10 | ||||||||||||||||||||||||||||||||||||||||
Other | 8 | 8 | ||||||||||||||||||||||||||||||||||||||||||
Total other assets | 343 | 10 | 353 | 10 | ||||||||||||||||||||||||||||||||||||||||
Total assets | $ | 10,692 | $ | 196 | (e) | $ | 5 | $ | 177 | $ | (185 | ) | $ | 391 | $ | (410 | ) | $ | 12 | $ | (30 | ) | $ | 10,848 | $ | 132 | (f) | |||||||||||||||||
Liabilities | ||||||||||||||||||||||||||||||||||||||||||||
Financial derivatives (d) | $ | 454 | $ | 75 | $ | (30 | ) | $ | 499 | $ | 51 | |||||||||||||||||||||||||||||||||
Other borrowed funds | 183 | 3 | $ | 10 | (16 | ) | 180 | |||||||||||||||||||||||||||||||||||||
Total liabilities | $ | 637 | $ | 78 | (e) | $ | 10 | $ | (46 | ) | $ | 679 | $ | 51 | (f) | |||||||||||||||||||||||||||||
(continued on following page)
The PNC Financial Services Group, Inc. – Form 10-Q 93
(continued from previous page)
Nine Months Ended September 30, 2015
Total realized / unrealized gains or losses for | Unrealized liabilities | |||||||||||||||||||||||||||||||||||||||||||
Level 3 Instruments Only In millions | Fair Dec. 31, | Included in Earnings | Included in Other comprehensive income | Purchases | Sales | Issuances | Settlements | Transfers into Level 3 (b) | Transfers out of Level 3 (b) | Fair Value Sept. 30, 2015 | ||||||||||||||||||||||||||||||||||
Assets | ||||||||||||||||||||||||||||||||||||||||||||
Securities available for sale | ||||||||||||||||||||||||||||||||||||||||||||
Residential mortgage- backed non-agency | $ | 4,798 | $ | 85 | $ | (31 | ) | $ | (637 | ) | $ | 4,215 | $ | (1 | ) | |||||||||||||||||||||||||||||
Commercial mortgage backed non-agency | 8 | (8 | ) | |||||||||||||||||||||||||||||||||||||||||
Asset-backed | 563 | 16 | 11 | (79 | ) | 511 | (1 | ) | ||||||||||||||||||||||||||||||||||||
State and municipal | 134 | (1 | ) | (117 | ) | 16 | ||||||||||||||||||||||||||||||||||||||
Other debt | 30 | 1 | (1 | ) | $ | 11 | $ | (5 | ) | (6 | ) | 30 | ||||||||||||||||||||||||||||||||
Total securities available for sale | 5,525 | 110 | (22 | ) | 11 | (5 | ) | (847 | ) | 4,772 | (2 | ) | ||||||||||||||||||||||||||||||||
Financial derivatives | 42 | 126 | 1 | (124 | ) | 45 | 115 | |||||||||||||||||||||||||||||||||||||
Residential mortgage loans held for sale | 6 | 1 | 21 | (3 | ) | (1 | ) | $ | 4 | $ | (23 | ) | 5 | 1 | ||||||||||||||||||||||||||||||
Trading securities – Debt | 32 | (29 | ) | 3 | ||||||||||||||||||||||||||||||||||||||||
Trading loans | 7 | (7 | ) | |||||||||||||||||||||||||||||||||||||||||
Residential mortgage servicing rights | 845 | (69 | ) | 261 | 61 | (136 | ) | 962 | (69 | ) | ||||||||||||||||||||||||||||||||||
Commercial mortgage servicing rights | 506 | (26 | ) | 43 | 48 | (66 | ) | 505 | (26 | ) | ||||||||||||||||||||||||||||||||||
Commercial mortgage loans held for sale | 893 | 63 | (56 | ) | 2,965 | (3,063 | ) | 802 | 3 | |||||||||||||||||||||||||||||||||||
Equity investments | ||||||||||||||||||||||||||||||||||||||||||||
Direct investments | 1,152 | 92 | 225 | (254 | ) | 1,215 | 79 | |||||||||||||||||||||||||||||||||||||
Indirect investments | 469 | 62 | 11 | (136 | ) | 406 | 60 | |||||||||||||||||||||||||||||||||||||
Total equity investments | 1,621 | 154 | 236 | (390 | ) | 1,621 | 139 | |||||||||||||||||||||||||||||||||||||
Loans | 397 | 19 | 84 | (21 | ) | (96 | ) | 21 | (54 | ) | 350 | 10 | ||||||||||||||||||||||||||||||||
Other assets | ||||||||||||||||||||||||||||||||||||||||||||
BlackRock Series C Preferred Stock | 375 | (63 | ) | 312 | (63 | ) | ||||||||||||||||||||||||||||||||||||||
Other | 8 | (1 | ) | 7 | ||||||||||||||||||||||||||||||||||||||||
Total other assets | 383 | (63 | ) | (1 | ) | 319 | (63 | ) | ||||||||||||||||||||||||||||||||||||
Total assets | $ | 10,257 | $ | 315 | (e) | $ | (22 | ) | $ | 657 | $ | (482 | ) | $ | 3,074 | $ | (4,363 | ) | $ | 25 | $ | (77 | ) | $ | 9,384 | $ | 108 | (f) | ||||||||||||||||
Liabilities | ||||||||||||||||||||||||||||||||||||||||||||
Financial derivatives (d) | $ | 526 | $ | (28 | ) | $ | 1 | $ | (56 | ) | $ | 443 | $ | (69 | ) | |||||||||||||||||||||||||||||
Other borrowed funds | 181 | 4 | $ | 69 | (192 | ) | 62 | |||||||||||||||||||||||||||||||||||||
Other liabilities | 9 | 1 | 10 | |||||||||||||||||||||||||||||||||||||||||
Total liabilities | $ | 716 | $ | (23 | ) (e) | $ | 1 | $ | 69 | $ | (248 | ) | $ | 515 | $ | (69 | ) (f) | |||||||||||||||||||||||||||
94 The PNC Financial Services Group, Inc. – Form 10-Q
Nine Months Ended September 30, 2014
Total realized / unrealized gains or losses for the period (a) | Unrealized liabilities | |||||||||||||||||||||||||||||||||||||||||||
Level 3 Instruments Only In millions | Fair Value Dec. 31, 2013 | Included in Earnings | Included in Other comprehensive income | Purchases | Sales | Issuances | Settlements | Transfers into Level 3 (b) | Transfers out of Level 3 (b) | Fair Value Sept. 30, 2014 | ||||||||||||||||||||||||||||||||||
Assets | ||||||||||||||||||||||||||||||||||||||||||||
Securities available for sale | ||||||||||||||||||||||||||||||||||||||||||||
Residential mortgage-backed non-agency | $ | 5,358 | $ | 105 | $ | 80 | $ | (632 | ) | $ | 4,911 | $ | (4 | ) | ||||||||||||||||||||||||||||||
Asset-backed | 641 | 11 | 28 | (88 | ) | 592 | ||||||||||||||||||||||||||||||||||||||
State and municipal | 333 | (2 | ) | 15 | 346 | |||||||||||||||||||||||||||||||||||||||
Other debt | 38 | 1 | $ | 1 | $ | (7 | ) | (2 | ) | 31 | ||||||||||||||||||||||||||||||||||
Total securities available for sale | 6,370 | 115 | 123 | 1 | (7 | ) | (722 | ) | 5,880 | (4 | ) | |||||||||||||||||||||||||||||||||
Financial derivatives | 36 | 165 | 2 | (174 | ) | 29 | 105 | |||||||||||||||||||||||||||||||||||||
Residential mortgage loans held for sale | 8 | 1 | 11 | (3 | ) | (1 | ) | $ | 9 | $ | (21 | ) | 4 | 1 | ||||||||||||||||||||||||||||||
Trading securities – Debt | 32 | 2 | 34 | 2 | ||||||||||||||||||||||||||||||||||||||||
Residential mortgage servicing rights | 1,087 | (120 | ) | 45 | $ | 66 | (100 | ) | 978 | (115 | ) | |||||||||||||||||||||||||||||||||
Commercial mortgage servicing rights | (20 | ) | 32 | 36 | 484 | (g) | 532 | (20 | ) | |||||||||||||||||||||||||||||||||||
Commercial mortgage loans held for sale | 586 | 13 | 349 | (81 | ) | 867 | 13 | |||||||||||||||||||||||||||||||||||||
Equity investments | ||||||||||||||||||||||||||||||||||||||||||||
Direct investments | 1,069 | 120 | 261 | (215 | ) | 1,235 | 101 | |||||||||||||||||||||||||||||||||||||
Indirect investments | 595 | 61 | 19 | (121 | ) | (1 | ) | 553 | 59 | |||||||||||||||||||||||||||||||||||
Total equity investments | 1,664 | 181 | 280 | (336 | ) | (1 | ) | 1,788 | 160 | |||||||||||||||||||||||||||||||||||
Loans (g) | 527 | 41 | 85 | (142 | ) | (69 | ) | 17 | (76 | ) | 383 | 34 | ||||||||||||||||||||||||||||||||
Other assets | ||||||||||||||||||||||||||||||||||||||||||||
BlackRock Series C Preferred Stock | 332 | 13 | 345 | 13 | ||||||||||||||||||||||||||||||||||||||||
Other | 8 | 8 | ||||||||||||||||||||||||||||||||||||||||||
Total other assets | 340 | 13 | 353 | 13 | ||||||||||||||||||||||||||||||||||||||||
Total assets | $ | 10,650 | $ | 391 | (e) | $ | 123 | $ | 456 | $ | (488 | ) | $ | 451 | $ | (664 | ) | $ | 26 | $ | (97 | ) | $ | 10,848 | $ | 189 | (f) | |||||||||||||||||
Liabilities | ||||||||||||||||||||||||||||||||||||||||||||
Financial derivatives (d) | $ | 439 | $ | 145 | $ | 1 | $ | (86 | ) | $ | 499 | $ | 9 | |||||||||||||||||||||||||||||||
Other borrowed funds | 199 | $ | 29 | (48 | ) | 180 | ||||||||||||||||||||||||||||||||||||||
Total liabilities | $ | 638 | $ | 145 | (e) | $ | 1 | $ | 29 | $ | (134 | ) | $ | 679 | $ | 9 | (f) | |||||||||||||||||||||||||||
| (a) | Losses for assets are bracketed while losses for liabilities are not. |
| (b) | PNC's policy is to recognize transfers in and transfers out as of the end of the reporting period. |
| (c) | The amount of the total gains or losses for the period included in earnings that is attributable to the change in unrealized gains or losses related to those assets and liabilities held at the end of the reporting period. |
| (d) | Includes swaps entered into in connection with sales of certain Visa Class B common shares. |
| (e) | Net losses (realized and unrealized) included in earnings relating to Level 3 assets and liabilities were $18 million for the third quarter of 2015, while for the first nine months of 2015 there were $338 million of net gains (realized and unrealized) included in earnings. The comparative amounts included net gains (realized and unrealized) of $118 million for the third quarter of 2014 and net gains (realized and unrealized) of $246 million for the first nine months of 2014. These amounts also included amortization and accretion of $36 million for the third quarter of 2015 and $113 million for the first nine months of 2015. The comparative amounts were $37 million for the third quarter of 2014 and $122 million for the first nine months of 2014. The amortization and accretion amounts were included in Interest income on the Consolidated Income Statement and the remaining net gains/(losses) (realized and unrealized) were included in Noninterest income on the Consolidated Income Statement. |
| (f) | Net unrealized losses relating to those assets and liabilities held at the end of the reporting period were $53 million for the third quarter of 2015, while for the first nine months of 2015 there were $177 million of net unrealized gains. The comparative amounts included net unrealized gains of $81 million for the third quarter of 2014 and net unrealized gains of $180 million for the first nine months of 2014. These amounts were included in Noninterest income on the Consolidated Income Statement. |
| (g) | Settlements relating to commercial MSRs include $552 million, which represents the fair value as of January 1, 2014 as a result of an irrevocable election to measure all classes of commercial MSRs at fair value. Refer to Note 8 Goodwill and Other Intangible Assets in our 2014 Form 10-K for additional information on this election. |
The PNC Financial Services Group, Inc. – Form 10-Q 95
An instrument's categorization within the hierarchy is based on the lowest level of input that is significant to the fair value measurement. Changes from one quarter to the next related to the observability of inputs to a fair value measurement may result in a reclassification (transfer) of assets or liabilities between hierarchy levels. PNC's policy is to recognize transfers in and transfers out as of the end of the reporting period. There were no significant transfers into or out of Level 3 assets and liabilities during the first nine months of 2015 and 2014.
Quantitative information about the significant unobservable inputs within Level 3 recurring assets and liabilities follows.
Table 77: Fair Value Measurements – Recurring Quantitative Information
September 30, 2015
Level 3 Instruments Only Dollars in millions | Fair Value | Valuation Techniques | Unobservable Inputs | Range (Weighted Average) | ||||||||||
Residential mortgage-backed non-agency securities |
$ |
4,215 |
|
Priced by a third-party vendor using a discounted cash flow pricing model (a) |
Constant prepayment rate (CPR) Constant default rate (CDR) Loss severity |
1.0%-24.2% (7.0%) 0.0%-16.7% (5.4%) 10.0%-98.5% (53.2%) |
|
(a) |
| |||||
| Spread over the benchmark curve (b) | 252bps weighted average | (a) | ||||||||||||
Asset-backed securities | 511 | Priced by a third-party vendor | Constant prepayment rate (CPR) | 1.0%-15.7% (6.5%) | (a) | |||||||||
| using a discounted cash flow | Constant default rate (CDR) | 1.7%-13.9% (6.8%) | (a) | |||||||||||
| pricing model (a) | Loss severity | 15.0%-100% (76.5%) | (a) | |||||||||||
| Spread over the benchmark curve (b) | 333bps weighted average | (a) | ||||||||||||
Residential mortgage servicing rights | 962 | Discounted cash flow | Constant prepayment rate (CPR) | 0.3%-34.8% (11.8%) | ||||||||||
| Spread over the benchmark curve (b) | 555bps-1,851bps (932bps) | |||||||||||||
Commercial mortgage servicing rights | 505 | Discounted cash flow | Constant prepayment rate (CPR) Discount rate | 5.7%-29.1% (7.2%) 1.8%-7.6% (7.4%) | ||||||||||
Commercial mortgage loans held for sale | 802 | Discounted cash flow | Spread over the benchmark curve (b) Estimated servicing cash flows | 62bps-3,595bps (468bps) 0.0%-3.8% (0.6%) | ||||||||||
Equity investments – Direct investments | 1,215 | Multiple of adjusted earnings | Multiple of earnings | 4.2x-15.0x (7.9x) | ||||||||||
Equity investments – Indirect (d) | 406 | Net asset value | Net asset value | |||||||||||
Loans – Residential real estate | 121 | Consensus pricing (c) | Cumulative default rate | 2.0%-100% (85.5%) | ||||||||||
| Loss severity | 0.0%-100% (28.9%) | |||||||||||||
| Discount rate | 4.9%-7.0% (5.2%) | |||||||||||||
| 118 | Discounted cash flow | Loss severity | 8.0% weighted average | |||||||||||
| Discount rate | 3.5% weighted average | |||||||||||||
Loans – Home equity | 111 | Consensus pricing (c) | Credit and Liquidity discount | 26.0%-99.0% (53.0%) | ||||||||||
BlackRock Series C Preferred Stock | 312 | Consensus pricing (c) | Liquidity discount | 20.0% | ||||||||||
BlackRock LTIP | (312 | ) | Consensus pricing (c) | Liquidity discount | 20.0% | |||||||||
Swaps related to sales of certain Visa Class B common shares | (117 | ) | Discounted cash flow | Estimated conversion factor of Class | 164.3% | (e | ) | |||||||
| B shares into Class A shares | ||||||||||||||
| Estimated growth rate of Visa | ||||||||||||||
| Class A share price | 18.0% | |||||||||||||
Other borrowed funds – non-agency securitization | (51 | ) | Consensus pricing (c) | Credit and Liquidity discount | 0%-100.0% (10.0%) | |||||||||
Insignificant Level 3 assets, net of liabilities (f) | 71 | |||||||||||||
|
| |||||||||||||
| Total Level 3 assets, net of liabilities (g) | $ | 8,869 | ||||||||||||
96 The PNC Financial Services Group, Inc. – Form 10-Q
December 31, 2014
Level 3 Instruments Only Dollars in millions | Fair Value | Valuation Techniques | Unobservable Inputs | Range (Weighted Average) | ||||||||||
Residential mortgage-backed non-agency securities |
$ |
4,798 |
|
Priced by a third-party vendor using a discounted cash flow pricing model (a) |
Constant prepayment rate (CPR) Constant default rate (CDR) Loss severity |
1.0%-28.9% (6.8%) 0.0%-16.7% (5.6%) 6.1%-100.0% (53.1%) |
|
(a) (a) (a) |
| |||||
| Spread over the benchmark curve (b) | 249bps weighted average | (a) | ||||||||||||
Asset-backed securities | 563 | Priced by a third-party vendor | Constant prepayment rate (CPR) | 1.0%-15.7% (5.9%) | (a) | |||||||||
| using a discounted cash flow | Constant default rate (CDR) | 1.7%-13.9% (7.6%) | (a) | |||||||||||
| pricing model (a) | Loss severity | 14.6%-100.0% (73.5%) | (a) | |||||||||||
| Spread over the benchmark curve (b) | 352bps weighted average | (a) | ||||||||||||
State and municipal securities | 132 | Discounted cash flow | Spread over the benchmark curve (b) | 55bps-165bps (67bps) | ||||||||||
| 2 | Consensus pricing (c) | Credit and Liquidity discount | 0.0%-20.0% (14.9%) | |||||||||||
Other debt securities | 30 | Consensus pricing (c) | Credit and Liquidity discount | 7.0%-95.0% (88.6%) | ||||||||||
Trading securities – Debt | 32 | Consensus pricing (c) | Credit and Liquidity discount | 0.0%-15.0% (8.0%) | ||||||||||
Residential mortgage servicing rights | 845 | Discounted cash flow | Constant prepayment rate (CPR) | 3.8%-32.7% (11.2%) | ||||||||||
| Spread over the benchmark curve (b) | 889bps-1,888bps (1,036bps) | |||||||||||||
Commercial mortgage servicing rights | 506 | Discounted cash flow | Constant prepayment rate (CPR) | 7.0%-16.8% (8.0%) | ||||||||||
| Discount rate | 2.5%-8.6% (6.6%) | |||||||||||||
Commercial mortgage loans held for sale | 893 | Discounted cash flow | Spread over the benchmark curve (b) | 37bps-4,025bps (549bps) | ||||||||||
| Estimated servicing cash flows | 0.0%-2.0% (1.2%) | |||||||||||||
Equity investments – Direct investments | 1,152 | Multiple of adjusted earnings | Multiple of earnings | 3.2x-13.9x (7.7x) | ||||||||||
Equity investments – Indirect (d) | 469 | Net asset value | Net asset value | |||||||||||
Loans – Residential real estate | 114 | Consensus pricing (c) | Cumulative default rate | 2.0%-100.0% (90.5%) | ||||||||||
| Loss severity | 0.0%-100.0% (35.6%) | |||||||||||||
| Discount rate | 5.4%-7.0% (6.4%) | |||||||||||||
| 154 | Discounted cash flow | Loss severity | 8.0% weighted average | |||||||||||
| Discount rate | 3.4% weighted average | |||||||||||||
Loans – Home equity | 129 | Consensus pricing (c) | Credit and Liquidity discount | 26.0%-99.0% (51.0%) | ||||||||||
BlackRock Series C Preferred Stock | 375 | Consensus pricing (c) | Liquidity discount | 20.0% | ||||||||||
BlackRock LTIP | (375 | ) | Consensus pricing (c) | Liquidity discount | 20.0% | |||||||||
Swaps related to sales of certain Visa Class B common shares | (135 | ) | Discounted cash flow | Estimated conversion factor of | ||||||||||
| Class B shares into Class A shares | 41.1% | |||||||||||||
| Estimated growth rate of Visa Class A share price | 14.8% | |||||||||||||
Other borrowed funds – non-agency securitization | (166 | ) | Consensus pricing (c) | Credit and Liquidity discount | 0.0%-99.0% (18.0%) | |||||||||
| Spread over the benchmark curve (b) | 113bps | |||||||||||||
Insignificant Level 3 assets, net of liabilities (f) | 23 | |||||||||||||
|
| |||||||||||||
| Total Level 3 assets, net of liabilities (g) | $ | 9,541 | ||||||||||||
| (a) | Level 3 residential mortgage-backed non-agency and asset-backed securities with fair values as of September 30, 2015 totaling $3,561 million and $478 million, respectively, were priced by a third-party vendor using a discounted cash flow pricing model that incorporates consensus pricing, where available. The comparable amounts as of December 31, 2014 were $4,081 million and $532 million, respectively. The significant unobservable inputs for these securities were provided by the third-party vendor and are disclosed in the table. Our procedures to validate the prices provided by the third-party vendor related to these securities are discussed further in the Fair Value Measurement section of Note 7 Fair Value in our 2014 Form 10-K. Certain Level 3 residential mortgage-backed non-agency and asset-backed securities with fair values as of September 30, 2015 of $654 million and $33 million, respectively, were valued using a pricing source, such as a dealer quote or comparable security price, for which the significant unobservable inputs used to determine the price were not reasonably available. The comparable amounts as of December 31, 2014 were $717 million and $31 million, respectively. |
| (b) | The assumed yield spread over the benchmark curve for each instrument is generally intended to incorporate non-interest-rate risks, such as credit and liquidity risks. |
| (c) | Consensus pricing refers to fair value estimates that are generally internally developed using information such as dealer quotes or other third-party provided valuations or comparable asset prices. |
| (d) | The range on these indirect equity investments has not been disclosed since these investments are recorded at their net asset redemption values. |
| (e) | This conversion factor reflects the 4-for-1 split of Visa Class A common shares, which occurred during the first quarter of 2015. |
| (f) | Represents the aggregate amount of Level 3 assets and liabilities measured at fair value on a recurring basis that are individually and in the aggregate insignificant. The amount includes certain financial derivative assets and liabilities, trading securities (for the 2015 period), state and municipal securities (for the 2015 period), other debt securities (for 2015 period), residential mortgage loans held for sale, trading loans, other assets, other borrowed funds (ROAPs) and other liabilities. For additional information, please see the Fair Value Measurement discussion included in Note 7 Fair Value in our 2014 Form 10-K. |
| (g) | Consisted of total Level 3 assets of $9,384 million and total Level 3 liabilities of $515 million as of September 30, 2015 and $10,257 million and $716 million as of December 31, 2014, respectively. |
The PNC Financial Services Group, Inc. – Form 10-Q 97
Financial Assets Accounted for at Fair Value on a Nonrecurring Basis
We may be required to measure certain financial assets at fair value on a nonrecurring basis. These adjustments to fair value usually result from the application of lower of amortized cost or fair value accounting or write-downs of individual assets due to impairment and are included in Table 78 and Table 79. For more information regarding the valuation methodologies of our financial assets measured at fair value on a nonrecurring basis, see Note 7 Fair Value in our 2014 Form 10-K.
Table 78: Fair Value Measurements – Nonrecurring
| Fair Value (a) | Gains (Losses) Three months ended | Gains (Losses) Nine months ended | ||||||||||||||||||||||
| In millions | September 30 2015 | December 31 2014 | September 30 2015 | September 30 2014 | September 30 2015 | September 30 2014 | ||||||||||||||||||
Assets | ||||||||||||||||||||||||
Nonaccrual loans | $ | 44 | $ | 54 | $ | (41 | ) | $ | (3 | ) | $ | (48 | ) | $ | (12 | ) | ||||||||
Loans held for sale | 8 | |||||||||||||||||||||||
Equity investments | 1 | 17 | ||||||||||||||||||||||
OREO and foreclosed assets | 129 | 168 | (6 | ) | (7 | ) | (18 | ) | (16 | ) | ||||||||||||||
Long-lived assets held for sale | 18 | 22 | (2 | ) | (2 | ) | (16 | ) | (12 | ) | ||||||||||||||
Total assets | $ | 192 | $ | 269 | $ | (49 | ) | $ | (12 | ) | $ | (82 | ) | $ | (40 | ) | ||||||||
| (a) | All Level 3 as of September 30, 2015 and December 31, 2014, except for $8 million included in Loans held for sale which was categorized as Level 2 as of December 31, 2014. |
Quantitative information about the significant unobservable inputs within Level 3 nonrecurring assets follows.
Table 79: Fair Value Measurements – Nonrecurring Quantitative Information
Level 3 Instruments Only Dollars in millions | Fair Value | Valuation Techniques | Unobservable Inputs | Range (Weighted Average) | ||||||
September 30, 2015 | ||||||||||
Assets | ||||||||||
Nonaccrual loans (a) | $ | 24 | LGD percentage (b) | Loss severity | 9.0%-75.3% (60.9%) | |||||
Equity investments | 1 | Discounted cash flow | Market rate of return | 5.0% | ||||||
Other (c) | 167 | Fair value of property or collateral | Appraised value/sales price | Not meaningful | ||||||
|
| |||||||||
Total assets | $ | 192 | ||||||||
December 31, 2014 | ||||||||||
Assets | ||||||||||
Nonaccrual loans (a) | $ | 29 | LGD percentage (b) | Loss severity | 2.9%-68.5% (42.1%) | |||||
Equity investments | 17 | Discounted cash flow | Market rate of return | 6.0% | ||||||
Other (c) | 215 | Fair value of property or collateral | Appraised value/sales price | Not meaningful | ||||||
|
| |||||||||
Total assets | $ | 261 | ||||||||
| (a) | The fair value of nonaccrual loans included in this line item is determined based on internal loss rates. The fair value of nonaccrual loans where the fair value is determined based on the appraised value or sales price is included within Other, below. |
| (b) | LGD percentage represents the amount that PNC expects to lose in the event a borrower defaults on an obligation. |
| (c) | Other included Nonaccrual loans of $20 million, OREO and foreclosed assets of $129 million and Long-lived assets held for sale of $18 million as of September 30, 2015. Comparably, as of December 31, 2014, Other included Nonaccrual loans of $25 million, OREO and foreclosed assets of $168 million and Long-lived assets held for sale of $22 million. The fair value of these assets is determined based on appraised value or sales price, the range of which is not meaningful to disclose. |
98 The PNC Financial Services Group, Inc. – Form 10-Q
Financial Instruments Accounted For Under Fair Value Option
We elect the fair value option to account for certain financial instruments. For more information on these financial instruments for which the fair value option election has been made, please refer to Note 7 Fair Value in our 2014 Form 10-K.
The changes in fair value included in Noninterest income for items for which we elected the fair value option follow.
Table 80: Fair Value Option – Changes in Fair Value (a)
Gains (Losses) Three months ended | Gains (Losses) Nine months ended | |||||||||||||||
| In millions | September 30 2015 | September 30 2014 | September 30 2015 | September 30 2014 | ||||||||||||
Assets | ||||||||||||||||
Customer resale agreements | $ | (1 | ) | $ | (2 | ) | $ | (1 | ) | $ | (3 | ) | ||||
Trading loans | 2 | 1 | ||||||||||||||
Commercial mortgage loans held for sale | 25 | 6 | 81 | 13 | ||||||||||||
Residential mortgage loans held for sale | 56 | 26 | 127 | 155 | ||||||||||||
Residential mortgage loans – portfolio | 8 | 26 | 37 | 113 | ||||||||||||
BlackRock Series C Preferred Stock | (51 | ) | 10 | (63 | ) | 13 | ||||||||||
Liabilities | ||||||||||||||||
Other borrowed funds | (2 | ) | (3 | ) | (4 | ) | ||||||||||
| (a) | The impact on earnings of offsetting hedged items or hedging instruments is not reflected in these amounts. |
Fair values and aggregate unpaid principal balances of items for which we elected the fair value option follow.
The PNC Financial Services Group, Inc. – Form 10-Q 99
Table 81: Fair Value Option – Fair Value and Principal Balances
| In millions | Fair Value | Aggregate Unpaid Principal Balance | Difference | |||||||||
September 30, 2015 | ||||||||||||
Assets | ||||||||||||
Customer resale agreements | $ | 139 | $ | 134 | $ | 5 | ||||||
Trading loans | 37 | 37 | ||||||||||
Residential mortgage loans held for sale | ||||||||||||
Performing loans | 1,074 | 1,025 | 49 | |||||||||
Accruing loans 90 days or more past due | 3 | 3 | ||||||||||
Nonaccrual loans | 9 | 10 | (1 | ) | ||||||||
Total | 1,086 | 1,038 | 48 | |||||||||
Commercial mortgage loans held for sale (a) | ||||||||||||
Performing loans | 800 | 813 | (13 | ) | ||||||||
Nonaccrual loans | 2 | 3 | (1 | ) | ||||||||
Total | 802 | 816 | (14 | ) | ||||||||
Residential mortgage loans – portfolio | ||||||||||||
Performing loans | 221 | 278 | (57 | ) | ||||||||
Accruing loans 90 days or more past due | 462 | 465 | (3 | ) | ||||||||
Nonaccrual loans | 232 | 378 | (146 | ) | ||||||||
Total | 915 | 1,121 | (206 | ) | ||||||||
Liabilities | ||||||||||||
Other borrowed funds | $ | 136 | $ | 135 | $ | 1 | ||||||
December 31, 2014 | ||||||||||||
Assets | ||||||||||||
Customer resale agreements | $ | 155 | $ | 148 | $ | 7 | ||||||
Trading loans | 37 | 37 | ||||||||||
Residential mortgage loans held for sale | ||||||||||||
Performing loans | 1,236 | 1,176 | 60 | |||||||||
Accruing loans 90 days or more past due | 9 | 9 | ||||||||||
Nonaccrual loans | 16 | 17 | (1 | ) | ||||||||
Total | 1,261 | 1,202 | 59 | |||||||||
Commercial mortgage loans held for sale (a) | ||||||||||||
Performing loans | 873 | 908 | (35 | ) | ||||||||
Nonaccrual loans | 20 | 64 | (44 | ) | ||||||||
Total | 893 | 972 | (79 | ) | ||||||||
Residential mortgage loans – portfolio | ||||||||||||
Performing loans | 194 | 256 | (62 | ) | ||||||||
Accruing loans 90 days or more past due | 570 | 573 | (3 | ) | ||||||||
Nonaccrual loans | 270 | 449 | (179 | ) | ||||||||
Total | 1,034 | 1,278 | (244 | ) | ||||||||
Liabilities | ||||||||||||
Other borrowed funds | $ | 273 | $ | 312 | $ | (39 | ) | |||||
| (a) | There were no accruing loans 90 days or more past due within this category at September 30, 2015 or December 31, 2014. |
100 The PNC Financial Services Group, Inc. – Form 10-Q
Additional Fair Value Information Related to Other Financial Instruments
The following table presents the carrying amounts and estimated fair values, including the level within the fair value hierarchy, of all other financial instruments that are not measured on the consolidated financial statements at fair value as of September 30, 2015 and December 31, 2014.
Table 82: Additional Fair Value Information Related to Other Financial Instruments
Carrying Amount | Fair Value | |||||||||||||||||||
| In millions | Total | Level 1 | Level 2 | Level 3 | ||||||||||||||||
September 30, 2015 | ||||||||||||||||||||
Assets | ||||||||||||||||||||
Cash and due from banks | $ | 3,835 | $ | 3,835 | $ | 3,835 | ||||||||||||||
Short-term assets | 36,644 | 36,644 | $ | 36,644 | ||||||||||||||||
Securities held to maturity | 14,403 | 14,765 | 302 | 14,456 | $ | 7 | ||||||||||||||
Loans held for sale | 172 | 181 | 117 | 64 | ||||||||||||||||
Net loans (excludes leases) | 193,170 | 195,774 | 195,774 | |||||||||||||||||
Other assets | 1,900 | 2,473 | 1,857 | 616 | (a) | |||||||||||||||
Total assets | $ | 250,124 | $ | 253,672 | $ | 4,137 | $ | 53,074 | $ | 196,461 | ||||||||||
Liabilities | ||||||||||||||||||||
Demand, savings and money market deposits | $ | 224,097 | $ | 224,097 | $ | 224,097 | ||||||||||||||
Time deposits | 20,882 | 20,934 | 20,934 | |||||||||||||||||
Borrowed funds | 55,790 | 56,066 | 54,674 | $ | 1,392 | |||||||||||||||
Unfunded loan commitments and letters of credit | 249 | 249 | 249 | |||||||||||||||||
Total liabilities | $ | 301,018 | $ | 301,346 | $ | 299,705 | $ | 1,641 | ||||||||||||
December 31, 2014 | ||||||||||||||||||||
Assets | ||||||||||||||||||||
Cash and due from banks | $ | 4,360 | $ | 4,360 | $ | 4,360 | ||||||||||||||
Short-term assets | 34,380 | 34,380 | $ | 34,380 | ||||||||||||||||
Securities held to maturity | 11,588 | 11,984 | 292 | 11,683 | $ | 9 | ||||||||||||||
Loans held for sale | 108 | 108 | 56 | 52 | ||||||||||||||||
Net loans (excludes leases) | 192,573 | 194,564 | 194,564 | |||||||||||||||||
Other assets | 1,879 | 2,544 | 1,802 | 742 | (a) | |||||||||||||||
Total assets | $ | 244,888 | $ | 247,940 | $ | 4,652 | $ | 47,921 | $ | 195,367 | ||||||||||
Liabilities | ||||||||||||||||||||
Demand, savings and money market deposits | $ | 210,838 | $ | 210,838 | $ | 210,838 | ||||||||||||||
Time deposits | 21,396 | 21,392 | 21,392 | |||||||||||||||||
Borrowed funds | 55,329 | 56,011 | 54,574 | $ | 1,437 | |||||||||||||||
Unfunded loan commitments and letters of credit | 240 | 240 | 240 | |||||||||||||||||
Total liabilities | $ | 287,803 | $ | 288,481 | $ | 286,804 | $ | 1,677 | ||||||||||||
| (a) | Represents estimated fair value of Visa Class B common shares, which was estimated solely based upon the September 30, 2015 and December 31, 2014 closing price for the Visa Class A common shares, respectively, and the Visa Class B common share conversion rate, which reflects adjustments in respect of all litigation funding by Visa as of that date. The transfer restrictions on the Visa Class B common shares could impact the aforementioned estimate, until they can be converted to Class A common shares. See Note 22 Commitments and Guarantees in our 2014 Form 10-K for additional information. |
The aggregate fair values in the preceding table represent only a portion of the total market value of PNC's assets and liabilities as, in accordance with the guidance related to fair values of financial instruments, Table 82 excludes the following:
| • | financial instruments recorded at fair value on a recurring basis, |
| • | real and personal property, |
| • | lease financing, |
| • | loan customer relationships, |
| • | deposit customer intangibles, |
| • | mortgage servicing rights, |
| • | retail branch networks, |
| • | fee-based businesses, such as asset management and brokerage, and |
| • | trademarks and brand names. |
For more information regarding the methods and assumptions used to estimate the fair values of financial instruments included in Table 82, see Note 7 Fair Value in our 2014 Form 10-K.
The PNC Financial Services Group, Inc. – Form 10-Q 101
N OTE 8 G OODWILL AND I NTANGIBLE A SSETS
Goodwill
Goodwill by business segment consisted of the following:
Table 83: Goodwill by Business Segment (a)
| In millions | September 30 2015 | December 31 2014 | ||||||
Retail Banking | $ | 5,795 | $ | 5,795 | ||||
Corporate & Institutional Banking | 3,244 | 3,244 | ||||||
Asset Management Group | 64 | 64 | ||||||
Total | $ | 9,103 | $ | 9,103 | ||||
| (a) | The Residential Mortgage Banking and Non-Strategic Assets Portfolio business segments did not have any goodwill allocated to them as of September 30, 2015 and December 31, 2014. |
Mortgage Servicing Rights
We recognize the right to service mortgage loans for others as an intangible asset. MSRs are purchased or originated when loans are sold with servicing retained. MSRs totaled $1.5 billion and $1.4 billion at September 30, 2015 and December 31, 2014, respectively, and consisted of loan servicing contracts for commercial and residential mortgages measured at fair value.
MSRs are subject to declines in value from actual or expected prepayment of the underlying loans and defaults as well as market driven changes in interest rates. We manage this risk by economically hedging the fair value of MSRs with securities and derivative instruments which are expected to increase (or decrease) in value when the value of MSRs declines (or increases).
See the Sensitivity Analysis section of this Note 8, as well as Note 7 Fair Value for more detail on our fair value measurement of MSRs. Refer to Note 8 Goodwill and Other Intangible Assets in our 2014 Form 10-K for more information on our accounting and measurement of MSRs.
Changes in the commercial and residential MSRs follow:
Table 84: Mortgage Servicing Rights
| Commercial MSRs | Residential MSRs | |||||||||||||||
| In millions | 2015 | 2014 | 2015 | 2014 | ||||||||||||
January 1 | $ | 506 | $ | 552 | $ | 845 | $ | 1,087 | ||||||||
Additions: | ||||||||||||||||
From loans sold with servicing retained | 48 | 36 | 61 | 66 | ||||||||||||
Purchases | 43 | 32 | 261 | 45 | ||||||||||||
Changes in fair value due to: | ||||||||||||||||
Time and payoffs (a) | (66 | ) | (68 | ) | (136 | ) | (100 | ) | ||||||||
Other (b) | (26 | ) | (20 | ) | (69 | ) | (120 | ) | ||||||||
September 30 | $ | 505 | $ | 532 | $ | 962 | $ | 978 | ||||||||
Related unpaid principal balance at September 30 | $ | 143,915 | $ | 143,449 | $ | 121,680 | $ | 110,749 | ||||||||
Servicing advances at September 30 | $ | 277 | $ | 318 | $ | 431 | $ | 486 | ||||||||
| (a) | Represents decrease in MSR value due to passage of time, including the impact from both regularly scheduled loan principal payments and loans that were paid down or paid off during the period. |
| (b) | Represents MSR value changes resulting primarily from market-driven changes in interest rates. |
Sensitivity Analysis
The fair value of commercial and residential MSRs and significant inputs to the valuation models as of September 30, 2015 are shown in the tables below. The expected and actual rates of mortgage loan prepayments are significant factors driving the fair value. Management uses both internal proprietary models and a third-party model to estimate future commercial mortgage loan prepayments and a third-party model to estimate future residential mortgage loan prepayments. These models have been refined based on current market conditions and management judgment. Future interest rates are another important factor in the valuation of MSRs. Management utilizes market implied forward interest
rates to estimate the future direction of mortgage and discount rates. The forward rates utilized are derived from the current yield curve for U.S. dollar interest rate swaps and are consistent with pricing of capital markets instruments. Changes in the shape and slope of the forward curve in future periods may result in volatility in the fair value estimate.
A sensitivity analysis of the hypothetical effect on the fair value of MSRs to adverse changes in key assumptions is presented below. These sensitivities do not include the impact of the related hedging activities. Changes in fair value generally cannot be extrapolated because the relationship of the change in the assumption to the change in fair value may
102 The PNC Financial Services Group, Inc. – Form 10-Q
not be linear. Also, the effect of a variation in a particular assumption on the fair value of the MSRs is calculated independently without changing any other assumption. In reality, changes in one factor may result in changes in another (for example, changes in mortgage interest rates, which drive changes in prepayment rate estimates, could result in changes in the interest rate spread), which could either magnify or counteract the sensitivities.
The following tables set forth the fair value of commercial and residential MSRs and the sensitivity analysis of the hypothetical effect on the fair value of MSRs to immediate adverse changes of 10% and 20% in those assumptions:
Table 85: Commercial Mortgage Loan Servicing Rights – Key Valuation Assumptions
| Dollars in millions | September 30 2015 | December 31 2014 | ||||||
Fair value | $ | 505 | $ | 506 | ||||
Weighted-average life (years) | 4.8 | 4.7 | ||||||
Weighted-average constant prepayment rate | 7.22 | % | 8.03 | % | ||||
Decline in fair value from 10% adverse change | $ | 10 | $ | 10 | ||||
Decline in fair value from 20% adverse change | $ | 20 | $ | 19 | ||||
Effective discount rate | 7.36 | % | 6.59 | % | ||||
Decline in fair value from 10% adverse change | $ | 14 | $ | 13 | ||||
Decline in fair value from 20% adverse change | $ | 28 | $ | 26 | ||||
Table 86: Residential Mortgage Loan Servicing Rights – Key Valuation Assumptions
| Dollars in millions | September 30 2015 | December 31 2014 | ||||||
Fair value | $ | 962 | $ | 845 | ||||
Weighted-average life (years) | 5.9 | 6.1 | ||||||
Weighted-average constant prepayment rate | 11.82 | % | 11.16 | % | ||||
Decline in fair value from 10% adverse change | $ | 45 | $ | 36 | ||||
Decline in fair value from 20% adverse change | $ | 86 | $ | 69 | ||||
Weighted-average option adjusted spread | 9.32 | % | 10.36 | % | ||||
Decline in fair value from 10% adverse change | $ | 33 | $ | 31 | ||||
Decline in fair value from 20% adverse change | $ | 64 | $ | 61 | ||||
Fees from mortgage loan servicing, comprised of contractually specified servicing fees, late fees and ancillary fees, follows:
Table 87: Fees from Mortgage Loan Servicing
| In millions | 2015 | 2014 | ||||||
Nine months ended September 30 | $ | 381 | $ | 381 | ||||
Three months ended September 30 | $ | 133 | $ | 125 | ||||
We also generate servicing fees from fee-based activities provided to others for which we do not have an associated servicing asset.
Fees from commercial and residential MSRs are reported on our Consolidated Income Statement in the line items Corporate services and Residential mortgage, respectively.
Other Intangible Assets
Other intangible assets consist primarily of core deposit intangibles, customer lists and non-compete agreements. Core deposit intangibles are amortized on an accelerated basis, whereas the remaining other intangible assets are amortized on a straight-line basis. The estimated remaining useful lives of our other intangible assets range from 1 year to 9 years, with a weighted-average remaining useful life of 6 years.
Other intangible assets were as follows at September 30, 2015 and December 31, 2014:
Table 88: Other Intangible Assets
| In millions | September 30 2015 | December 31 2014 | ||||||
Gross carrying amount | $ | 1,499 | $ | 1,502 | ||||
Accumulated amortization | (1,092 | ) | (1,009 | ) | ||||
Net carrying amount | $ | 407 | $ | 493 | ||||
Amortization expense on existing other intangible assets for the first nine months of 2015 and 2014, as well as future amortization expense for the remainder of 2015 and the next five fiscal years, follows:
Table 89: Amortization Expense on Existing Other Intangible Assets
| In millions | ||||
Nine months ended September 30, 2015 | $ | 86 | ||
Nine months ended September 30, 2014 | 96 | |||
Remainder of 2015 | 28 | |||
2016 | 97 | |||
2017 | 83 | |||
2018 | 72 | |||
2019 | 61 | |||
2020 | 37 | |||
The PNC Financial Services Group, Inc. – Form 10-Q 103
N OTE 9 C APITAL S ECURITIES OF A S UBSIDIARY T RUST AND P ERPETUAL T RUST S ECURITIES
Capital Securities of a Subsidiary Trust
Our capital securities of a subsidiary trust ("Trust") are described in Note 12 Capital Securities of a Subsidiary Trust and Perpetual Trust Securities in our 2014 Form 10-K. This Trust is a wholly-owned finance subsidiary of PNC. In the event of certain changes or amendments to regulatory requirements or federal tax rules, the capital securities are redeemable in whole. In accordance with GAAP, the financial statements of the Trust are not included in PNC's consolidated financial statements.
The obligations of the parent of the Trust, when taken collectively, are the equivalent of a full and unconditional guarantee of the obligations of the Trust under the terms of the Capital Securities. Such guarantee is subordinate in right of payment in the same manner as other junior subordinated debt. There are certain restrictions on PNC's overall ability to obtain funds from its subsidiaries. For additional disclosure on these funding restrictions, including an explanation of dividend and intercompany loan limitations, see Note 20 Regulatory Matters in our 2014 Form 10-K.
PNC is also subject to restrictions on dividends and other provisions potentially imposed under the Exchange Agreement with PNC Preferred Funding Trust II, as described in Note 12 in our 2014 Form 10-K in the Perpetual Trust Securities section, and to other provisions similar to or in some ways more restrictive than those potentially imposed under that agreement.
Perpetual Trust Securities
Our perpetual trust securities are described in Note 12 in our 2014 Form 10-K. Our 2014 Form 10-K also includes additional information regarding the PNC Preferred Funding Trust I and Trust II Securities, including descriptions of replacement capital and dividend restriction covenants.
N OTE 10 C ERTAIN E MPLOYEE B ENEFIT AND S TOCK B ASED C OMPENSATION P LANS
Pension And Postretirement Plans
As described in Note 13 Employee Benefit Plans in our 2014 Form 10-K, we have a noncontributory, qualified defined benefit pension plan covering eligible employees. Benefits are determined using a cash balance formula where earnings credits are a percentage of eligible compensation. Pension contributions are based on an actuarially determined amount necessary to fund total benefits payable to plan participants.
We also maintain nonqualified supplemental retirement plans for certain employees and provide certain health care and life insurance benefits for qualifying retired employees (postretirement benefits) through various plans. The nonqualified pension and postretirement benefit plans are unfunded. PNC reserves the right to terminate plans or make plan changes at any time.
104 The PNC Financial Services Group, Inc. – Form 10-Q
The components of our net periodic pension and postretirement benefit cost for the first nine months of 2015 and 2014, respectively, were as follows:
Table 90: Net Periodic Pension and Postretirement Benefits Costs
Three months ended September 30 In millions | Qualified Pension Plan | Nonqualified Retirement Plans | Postretirement Benefits | |||||||||||||||||||||
| 2015 | 2014 | 2015 | 2014 | 2015 | 2014 | |||||||||||||||||||
Net periodic cost consists of: | ||||||||||||||||||||||||
Service cost | $ | 27 | $ | 26 | $ | 1 | $ | 1 | $ | 2 | ||||||||||||||
Interest cost | 44 | 46 | 3 | $ | 3 | 4 | 4 | |||||||||||||||||
Expected return on plan assets | (75 | ) | (72 | ) | ||||||||||||||||||||
Amortization of prior service credit | (2 | ) | (2 | ) | (1 | ) | (1 | ) | ||||||||||||||||
Amortization of actuarial losses | 8 | 2 | 1 | |||||||||||||||||||||
Net periodic cost/(benefit) | $ | 2 | $ | (2 | ) | $ | 6 | $ | 4 | $ | 4 | $ | 5 | |||||||||||
Nine months ended September 30 In millions | Qualified Pension Plan | Nonqualified Retirement Plans | Postretirement Benefits | |||||||||||||||||||||
| 2015 | 2014 | 2015 | 2014 | 2015 | 2014 | |||||||||||||||||||
Net periodic cost consists of: | ||||||||||||||||||||||||
Service cost | $ | 80 | $ | 77 | $ | 2 | $ | 2 | $ | 4 | $ | 4 | ||||||||||||
Interest cost | 133 | 140 | 9 | 9 | 11 | 12 | ||||||||||||||||||
Expected return on plan assets | (223 | ) | (216 | ) | ||||||||||||||||||||
Amortization of prior service credit | (6 | ) | (6 | ) | (1 | ) | (1 | ) | ||||||||||||||||
Amortization of actuarial losses | 23 | 5 | 3 | |||||||||||||||||||||
Net periodic cost/(benefit) | $ | 7 | $ | (5 | ) | $ | 16 | $ | 14 | $ | 14 | $ | 15 | |||||||||||
Stock Based Compensation Plans
As more fully described in Note 14 Stock Based Compensation Plans in our 2014 Form 10-K, we have long-term incentive award plans (Incentive Plans) that provide for the granting of incentive stock options, nonqualified stock options, stock appreciation rights, incentive shares/performance units, restricted stock, restricted share units, other share-based awards and dollar-denominated awards to executives and, other than incentive stock options, to non-employee directors. Certain Incentive Plan awards may be paid in stock, cash or a combination of stock and cash. We typically grant a substantial portion of our stock-based compensation awards during the first quarter of the year. As of September 30, 2015, no stock appreciation rights were outstanding.
Total compensation expense recognized related to all share-based payment arrangements during the first nine months of 2015 and 2014 was $118 million and $133 million, respectively. At September 30, 2015, there was $215 million of unamortized share-based compensation expense related to nonvested equity compensation arrangements, including liability awards granted under the Incentive Plans. This unamortized cost is expected to be recognized as expense over a period of no longer than five years.
Nonqualified Stock Options
Beginning in 2014, PNC discontinued the use of stock options as a standard element of our long-term equity incentive compensation programs under our Incentive Plans. Additional information regarding PNC stock options is more fully described in Note 14 Stock Based Compensation Plans in our 2014 Form 10-K.
The PNC Financial Services Group, Inc. – Form 10-Q 105
The following table represents the stock option activity for the first nine months of 2015.
Table 91: Stock Option Rollforward
| PNC | PNC Options Converted From National City Options | Total | ||||||||||||||||||||||
| In thousands, except weighted-average data | Shares | Weighted-Average Exercise Price | Shares | Weighted-Average Exercise Price | Shares | Weighted-Average Exercise Price | ||||||||||||||||||
Outstanding at December 31, 2014 | 6,701 | $ | 56.41 | 343 | $ | 585.23 | 7,044 | $ | 82.17 | |||||||||||||||
Granted (a) | ||||||||||||||||||||||||
Exercised | (1,649 | ) | 59.09 | (1,649 | ) | 59.09 | ||||||||||||||||||
Cancelled | (29 | ) | 44.61 | (34 | ) | 731.38 | (63 | ) | 412.47 | |||||||||||||||
Outstanding at September 30, 2015 | 5,023 | $ | 55.60 | 309 | $ | 569.21 | 5,332 | $ | 85.39 | |||||||||||||||
Exercisable at September 30, 2015 | 4,975 | $ | 55.52 | 309 | $ | 569.21 | 5,284 | $ | 85.59 | |||||||||||||||
| (a) | PNC did not grant any stock options in the first nine months of 2015. |
During the first nine months of 2015, we issued approximately 1.2 million common shares from treasury stock in connection with stock option exercise activity. As with past exercise activity, we currently intend to utilize primarily treasury stock for any future stock option exercises.
Incentive/Performance Unit Share Awards and Restricted Stock/Share Unit Awards
Information on incentive/performance unit share awards and restricted stock/share unit awards is more fully described in Note 14 Stock Based Compensation Plans in our 2014 Form 10-K.
Table 92: Nonvested Incentive/Performance Unit Share Awards and Restricted Stock/Share Unit Awards – Rollforward
| Shares in thousands | Nonvested Incentive/ Performance Unit Shares | Weighted- Average Grant Date Fair Value | Nonvested Restricted Stock/ Share Units | Weighted- Average Grant Date Fair Value | ||||||||||||
December 31, 2014 | 1,837 | $ | 69.84 | 3,652 | $ | 69.03 | ||||||||||
Granted | 649 | 90.35 | 1,048 | 92.35 | ||||||||||||
Vested/Released | (682 | ) | 66.17 | (1,199 | ) | 61.14 | ||||||||||
Forfeited | (37 | ) | 73.56 | (130 | ) | 78.13 | ||||||||||
September 30, 2015 | 1,767 | $ | 78.71 | 3,371 | $ | 78.82 | ||||||||||
In the preceding table, the unit shares and related weighted-average grant date fair value of the incentive/performance awards exclude the effect of dividends on the underlying shares, as those dividends will be paid in cash if and when the underlying unit shares are released to the participants.
Liability Awards
A summary of all nonvested, cash-payable incentive/performance units and restricted share unit activity follows:
Table 93: Nonvested Cash-Payable Incentive/Performance Units and Restricted Share Units – Rollforward
| In thousands | Cash-Payable Incentive/ Performance Units | Cash-Payable Restricted Share Units | Total | |||||||||
Outstanding at December 31, 2014 | 177 | 658 | 835 | |||||||||
Granted | 81 | 364 | 445 | |||||||||
Vested and Released | (98 | ) | (349 | ) | (447 | ) | ||||||
Forfeited | (43 | ) | (6 | ) | (49 | ) | ||||||
Outstanding at September 30, 2015 | 117 | 667 | 784 | |||||||||
Included in the preceding table are cash-payable restricted share units granted to certain executives. These grants were made primarily as part of an annual bonus incentive deferral plan. While there are time-based and other vesting criteria, there are generally no market or performance criteria associated with these awards. Prior to the 2015 grant, compensation expense recognized related to these awards was recorded in prior periods as part of the annual cash bonus process. Due to certain requisite service period changes in the award agreements starting with the 2015 grant (for the 2014 performance year), compensation expense is recognized ratably over a four year period commensurate with the performance year plus the three years of service-based vesting requirements. As of September 30, 2015, the aggregate intrinsic value of all outstanding nonvested cash-payable incentive/performance units and restricted share units was approximately $70 million.
106 The PNC Financial Services Group, Inc. – Form 10-Q
N OTE 11 F INANCIAL D ERIVATIVES
We use derivative financial instruments (derivatives) primarily to help manage exposure to interest rate, market and credit risk and reduce the effects that changes in interest rates may have on net income, the fair value of assets and liabilities, and cash flows. We also enter into derivatives with customers to facilitate their risk management activities. Derivatives represent contracts between parties that usually require little or no initial net investment and result in one party delivering cash or another type of asset to the other party based on a notional amount and an underlying as specified in the contract.
For more information regarding derivatives see Note 1 Accounting Policies and Note 15 Financial Derivatives in our Notes To Consolidated Financial Statements under Item 8 of our 2014 Form 10-K.
The following table presents the notional amounts and gross fair values of all derivative assets and liabilities held by PNC:
Table 94: Total Gross Derivatives
| September 30, 2015 | December 31, 2014 | |||||||||||||||||||||||
| In millions | Notional/ Contract Amount | Asset Fair Value (a) | Liability Fair Value (b) | Notional/ Contract Amount | Asset Fair Value (a) | Liability Fair Value (b) | ||||||||||||||||||
Derivatives designated as hedging instruments under GAAP | $ | 52,710 | $ | 1,604 | $ | 217 | $ | 49,061 | $ | 1,261 | $ | 186 | ||||||||||||
Derivatives not designated as hedging instruments under GAAP | 313,983 | 4,628 | 4,373 | 291,256 | 3,973 | 3,841 | ||||||||||||||||||
Total gross derivatives | $ | 366,693 | $ | 6,232 | $ | 4,590 | $ | 340,317 | $ | 5,234 | $ | 4,027 | ||||||||||||
| (a) | Included in Other assets on our Consolidated Balance Sheet. |
| (b) | Included in Other liabilities on our Consolidated Balance Sheet. |
All derivatives are carried on our Consolidated Balance Sheet at fair value. Derivative balances are presented on the Consolidated Balance Sheet on a net basis taking into consideration the effects of legally enforceable master netting agreements and any related cash collateral exchanged with counterparties. Further discussion regarding the rights of setoff associated with these legally enforceable master netting agreements is included in the Offsetting, Counterparty Credit Risk, and Contingent Features section below. Any nonperformance risk, including credit risk, is included in the determination of the estimated net fair value of the derivatives.
Derivatives Designated As Hedging Instruments under GAAP
Certain derivatives used to manage interest rate and foreign exchange risk as part of our asset and liability risk management activities are designated as accounting hedges under GAAP. Derivatives hedging the risks associated with changes in the fair value of assets or liabilities are considered fair value hedges, derivatives hedging the variability of expected future cash flows are considered cash flow hedges, and derivatives hedging a net investment in a foreign subsidiary are considered net investment hedges. Designating derivatives as accounting hedges allows for gains and losses on those derivatives, to the extent effective, to be recognized in the income statement in the same period the hedged items affect earnings.
The PNC Financial Services Group, Inc. – Form 10-Q 107
Further detail regarding the notional amounts and fair values related to derivatives designated in hedge relationships is presented in the following table:
Table 95: Derivatives Designated As Hedging Instruments under GAAP
| September 30, 2015 | December 31, 2014 | |||||||||||||||||||||||
| In millions | Notional/ Contract Amount | Asset Fair Value (a) | Liability Fair Value (b) | Notional/ Contract Amount | Asset Fair Value (a) | Liability Fair Value (b) | ||||||||||||||||||
Interest rate contracts: | ||||||||||||||||||||||||
Fair value hedges: | ||||||||||||||||||||||||
Receive-fixed swaps | $ | 24,651 | $ | 975 | $ | 20,930 | $ | 827 | $ | 38 | ||||||||||||||
Pay-fixed swaps (c) | 5,145 | $ | 217 | 4,233 | 3 | 138 | ||||||||||||||||||
Subtotal | $ | 29,796 | $ | 975 | $ | 217 | $ | 25,163 | $ | 830 | $ | 176 | ||||||||||||
Cash flow hedges: | ||||||||||||||||||||||||
Receive-fixed swaps | $ | 20,423 | $ | 579 | $ | 19,991 | $ | 400 | $ | 10 | ||||||||||||||
Forward purchase commitments | 1,366 | 12 | 2,778 | 25 | ||||||||||||||||||||
Subtotal | $ | 21,789 | $ | 591 | $ | 22,769 | $ | 425 | $ | 10 | ||||||||||||||
Foreign exchange contracts: | ||||||||||||||||||||||||
Net investment hedges | $ | 1,125 | 38 | $ | 1,129 | $ | 6 | |||||||||||||||||
Total derivatives designated as hedging instruments | $ | 52,710 | $ | 1,604 | $ | 217 | $ | 49,061 | $ | 1,261 | $ | 186 | ||||||||||||
| (a) | Included in Other assets on our Consolidated Balance Sheet. |
| (b) | Included in Other liabilities on our Consolidated Balance Sheet. |
| (c) | Includes zero-coupon swaps. |
Fair Value Hedges
We enter into receive-fixed, pay-variable interest rate swaps to hedge changes in the fair value of outstanding fixed-rate debt and borrowings caused by fluctuations in market interest rates. We also enter into pay-fixed, receive-variable interest rate swaps and zero-coupon swaps to hedge changes in the fair value of fixed rate and zero-coupon investment securities caused by fluctuations in market interest rates. For these hedge relationships, we use statistical regression analysis to assess hedge effectiveness at both the inception of the hedge relationship and on an ongoing basis. There were no components of derivative gains or losses excluded from the assessment of hedge effectiveness.
Further detail regarding gains (losses) on fair value hedge derivatives and related hedged items is presented in the following table:
Table 96: Gains (Losses) on Derivatives and Related Hedged Items – Fair Value Hedges
| Three months ended | Nine months ended | |||||||||||||||||||||||||||||||||||
| September 30, 2015 | September 30, 2014 | September 30, 2015 | September 30, 2014 | |||||||||||||||||||||||||||||||||
| In millions | Hedged Items | Location | Gain (Loss) on Derivatives Recognized in Income | Gain (Loss) on Related Hedged Items Recognized in Income | Gain (Loss) on Derivatives Recognized in Income | Gain (Loss) on Related Hedged Items Recognized in Income | Gain (Loss) on Derivatives Recognized in Income | Gain (Loss) on Related Hedged Items Recognized in Income | Gain (Loss) on Derivatives Recognized in Income | Gain (Loss) on Related Hedged Items Recognized in Income | ||||||||||||||||||||||||||
| Amount | Amount | Amount | Amount | Amount | Amount | Amount | Amount | |||||||||||||||||||||||||||||
Interest rate contracts | U.S. Treasury and Government Agencies Securities | Investment securities (interest income) | $ | (91 | ) | $ | 93 | $ | 31 | $ | (31 | ) | $ | (79 | ) | $ | 81 | $ | (52 | ) | $ | 55 | ||||||||||||||
Interest rate contracts | Other Debt Securities | Investment securities (interest income) | (1 | ) | 1 | 2 | (2 | ) | (1 | ) | 1 | 1 | (1 | ) | ||||||||||||||||||||||
Interest rate contracts | Subordinated debt | Borrowed funds (interest expense) | 92 | (104 | ) | (69 | ) | 66 | 8 | (37 | ) | 5 | (23 | ) | ||||||||||||||||||||||
Interest rate contracts | Bank notes and senior debt | Borrowed funds (interest expense) | 213 | (219 | ) | (78 | ) | 77 | 190 | (199 | ) | (19 | ) | 15 | ||||||||||||||||||||||
Total (a) | $ | 213 | $ | (229 | ) | $ | (114 | ) | $ | 110 | $ | 118 | $ | (154 | ) | $ | (65 | ) | $ | 46 | ||||||||||||||||
| (a) | The ineffective portion of the change in value of our fair value hedge derivatives resulted in net losses of $16 million for the three months ended September 30, 2015 and net losses of $36 million for the nine months ended September 30, 2015 compared with net losses of $4 million for the three months ended September 30, 2014 and net losses of $19 million for the nine months ended September 30, 2014. |
108 The PNC Financial Services Group, Inc. – Form 10-Q
Cash Flow Hedges
We enter into receive-fixed, pay-variable interest rate swaps to modify the interest rate characteristics of designated commercial loans from variable to fixed in order to reduce the impact of changes in future cash flows due to market interest rate changes. For these cash flow hedges, any changes in the fair value of the derivatives that are effective in offsetting changes in the forecasted interest cash flows are recorded in Accumulated other comprehensive income and are reclassified to interest income in conjunction with the recognition of interest received on the loans. In the 12 months that follow September 30, 2015, we expect to reclassify from the amount currently reported in Accumulated other comprehensive income, net derivative gains of $243 million pretax, or $158 million after-tax, in association with interest received on the hedged loans. This amount could differ from amounts actually recognized due to changes in interest rates, hedge de-designations, and the addition of other hedges subsequent to September 30, 2015. The maximum length of time over which forecasted loan cash flows are hedged is 10 years. We use statistical regression analysis to assess the effectiveness of these hedge relationships at both the inception of the hedge relationship and on an ongoing basis.
We also periodically enter into forward purchase and sale contracts to hedge the variability of the consideration that will be paid or received related to the purchase or sale of investment securities. The forecasted purchase or sale is consummated upon gross settlement of the forward contract itself. As a result, hedge ineffectiveness, if any, is typically minimal. Gains and losses on these forward contracts are recorded in Accumulated other comprehensive income and are recognized in earnings when the hedged cash flows affect earnings. In the 12 months that follow September 30, 2015, we expect to reclassify from the amount currently reported in Accumulated other comprehensive income, net derivative gains of $33 million pretax, or $22 million after-tax, as adjustments of yield on investment securities. As of September 30, 2015, the maximum length of time over which forecasted purchase contracts are hedged is three months.
There were no components of derivative gains or losses excluded from the assessment of hedge effectiveness related to either cash flow hedge strategy.
During the first nine months of 2015 and 2014, there were no gains or losses from cash flow hedge derivatives reclassified to earnings because it became probable that the original forecasted transaction would not occur.
Further detail regarding gains (losses) on derivatives and related cash flows is presented in the following table:
Table 97: Gains (Losses) on Derivatives and Related Cash Flows – Cash Flow Hedges (a) (b)
| Three months ended September 30 | Nine months ended September 30 | |||||||||||||||
| In millions | 2015 | 2014 | 2015 | 2014 | ||||||||||||
Gains (losses) on derivatives recognized in OCI – (effective portion) | $ | 326 | $ | (17 | ) | $ | 522 | $ | 193 | |||||||
Less: Gains (losses) reclassified from accumulated OCI into income – (effective portion) | ||||||||||||||||
Interest income | 80 | 64 | 220 | 200 | ||||||||||||
Noninterest income | 12 | (1 | ) | (2 | ) | |||||||||||
Total gains (losses) reclassified from accumulated OCI into income – (effective portion) | 92 | 64 | 219 | 198 | ||||||||||||
Net unrealized gains (losses) on cash flow hedge derivatives | $ | 234 | $ | (81 | ) | $ | 303 | $ | (5 | ) | ||||||
| (a) | All cash flow hedge derivatives are interest rate contracts as of September 30, 2015 and September 30, 2014. |
| (b) | The amount of cash flow hedge ineffectiveness recognized in income was not material for the periods presented. |
Net Investment Hedges
We enter into foreign currency forward contracts to hedge non-U.S. Dollar (USD) net investments in foreign subsidiaries against adverse changes in foreign exchange rates. We assess whether the hedging relationship is highly effective in achieving offsetting changes in the value of the hedge and hedged item by qualitatively verifying that the critical terms of the hedge and hedged item match at the inception of the hedging relationship and on an ongoing basis. There were no components of derivative gains or losses excluded from the assessment of the hedge effectiveness.
For the first nine months of 2015 and 2014, there was no net investment hedge ineffectiveness.
Further detail on gains (losses) on net investment hedge derivatives is presented in the following table:
Table 98: Gains (Losses) on Derivatives – Net Investment Hedges
| Three months ended September 30 | Nine months ended September 30 | |||||||||||||||
| In millions | 2015 | 2014 | 2015 | 2014 | ||||||||||||
Gains (losses) on derivatives recognized in OCI (effective portion) | ||||||||||||||||
Foreign exchange contracts | $ | 43 | $ | 51 | $ | 32 | $ | 18 | ||||||||
The PNC Financial Services Group, Inc. – Form 10-Q 109
Derivatives Not Designated As Hedging Instruments under GAAP
We also enter into derivatives that are not designated as accounting hedges under GAAP.
For additional information on derivatives not designated as hedging instruments under GAAP see Note 15 Financial Derivatives in our 2014 Form 10-K.
Further detail regarding the notional amounts and fair values related to derivatives not designated in hedge relationships is presented in the following table:
Table 99: Derivatives Not Designated As Hedging Instruments under GAAP
| September 30, 2015 | December 31, 2014 | |||||||||||||||||||||||
| In millions | Notional/ Contract Amount | Asset Fair Value (a) | Liability Fair Value (b) | Notional/ Contract Amount | Asset Fair Value (a) | Liability Fair Value (b) | ||||||||||||||||||
Derivatives used for residential mortgage banking activities: | ||||||||||||||||||||||||
Residential mortgage servicing | ||||||||||||||||||||||||
Interest rate contracts: | ||||||||||||||||||||||||
Swaps | $ | 35,752 | $ | 972 | $ | 599 | $ | 32,459 | $ | 777 | $ | 394 | ||||||||||||
Swaptions | 928 | 31 | 14 | 1,498 | 29 | 22 | ||||||||||||||||||
Futures (c) | 25,204 | 22,084 | ||||||||||||||||||||||
Futures options | 17,000 | 4 | 4 | 12,225 | 4 | |||||||||||||||||||
Mortgage-backed securities commitments | 3,990 | 20 | 2 | 710 | 4 | |||||||||||||||||||
Subtotal | 82,874 | 1,027 | 619 | 68,976 | 814 | 416 | ||||||||||||||||||
Loan sales | ||||||||||||||||||||||||
Interest rate contracts: | ||||||||||||||||||||||||
Futures (c) | 30 | 58 | ||||||||||||||||||||||
Bond options | 300 | 1 | 300 | |||||||||||||||||||||
Mortgage-backed securities commitments | 6,027 | 9 | 26 | 4,916 | 10 | 21 | ||||||||||||||||||
Residential mortgage loan commitments | 1,789 | 28 | 1,852 | 22 | ||||||||||||||||||||
Subtotal | 8,146 | 38 | 26 | 7,126 | 32 | 21 | ||||||||||||||||||
Subtotal | $ | 91,020 | $ | 1,065 | $ | 645 | $ | 76,102 | $ | 846 | $ | 437 | ||||||||||||
Derivatives used for commercial mortgage banking activities: | ||||||||||||||||||||||||
Interest rate contracts: | ||||||||||||||||||||||||
Swaps | $ | 3,822 | $ | 103 | $ | 67 | $ | 3,801 | $ | 67 | $ | 48 | ||||||||||||
Swaptions | 439 | 439 | 2 | 1 | ||||||||||||||||||||
Futures (c) | 21,391 | 19,913 | ||||||||||||||||||||||
Commercial mortgage loan commitments | 1,607 | 14 | 7 | 2,042 | 16 | 10 | ||||||||||||||||||
Subtotal | 27,259 | 117 | 74 | 26,195 | 85 | 59 | ||||||||||||||||||
Credit contracts: | ||||||||||||||||||||||||
Credit default swaps | 79 | 95 | ||||||||||||||||||||||
Subtotal | $ | 27,338 | $ | 117 | $ | 74 | $ | 26,290 | $ | 85 | $ | 59 | ||||||||||||
Derivatives used for customer-related activities: | ||||||||||||||||||||||||
Interest rate contracts: | ||||||||||||||||||||||||
Swaps | $ | 152,068 | $ | 2,985 | $ | 2,938 | $ | 146,008 | $ | 2,632 | $ | 2,559 | ||||||||||||
Caps/floors – Sold | 5,292 | 13 | 4,846 | 16 | ||||||||||||||||||||
Caps/floors – Purchased | 6,585 | 29 | 6,339 | 34 | ||||||||||||||||||||
Swaptions | 5,161 | 103 | 10 | 3,361 | 62 | 12 | ||||||||||||||||||
Futures (c) | 1,367 | 3,112 | ||||||||||||||||||||||
Mortgage-backed securities commitments | 3,299 | 6 | 8 | 2,137 | 3 | 3 | ||||||||||||||||||
Subtotal | 173,772 | 3,123 | 2,969 | 165,803 | 2,731 | 2,590 | ||||||||||||||||||
Foreign exchange contracts | 11,183 | 244 | 246 | 12,547 | 223 | 240 | ||||||||||||||||||
Credit contracts: | ||||||||||||||||||||||||
Risk participation agreements | 5,135 | 2 | 5 | 5,124 | 2 | 4 | ||||||||||||||||||
Subtotal | $ | 190,090 | $ | 3,369 | $ | 3,220 | $ | 183,474 | $ | 2,956 | $ | 2,834 | ||||||||||||
Derivatives used for other risk management activities: | ||||||||||||||||||||||||
Interest rate contracts | $ | 833 | $ | 1 | ||||||||||||||||||||
Foreign exchange contracts | $ | 3,357 | $ | 77 | $ | 5 | 2,661 | 85 | $ | 1 | ||||||||||||||
Credit contracts: | ||||||||||||||||||||||||
Credit default swaps | 15 | 15 | ||||||||||||||||||||||
Other contracts (d) | 2,163 | 429 | 1,881 | 510 | ||||||||||||||||||||
Subtotal | 5,535 | 77 | 434 | 5,390 | 86 | 511 | ||||||||||||||||||
Total derivatives not designated as hedging instruments | $ | 313,983 | $ | 4,628 | $ | 4,373 | $ | 291,256 | $ | 3,973 | $ | 3,841 | ||||||||||||
| (a) | Included in Other assets on our Consolidated Balance Sheet. |
| (b) | Included in Other liabilities on our Consolidated Balance Sheet. |
| (c) | Futures contracts settle in cash daily and, therefore, no derivative asset or derivative liability is recognized on our Consolidated Balance Sheet. |
| (d) | Includes PNC's obligation to fund a portion of certain BlackRock LTIP programs and the swaps entered into in connection with sales of a portion of Visa Class B common shares. |
110 The PNC Financial Services Group, Inc. – Form 10-Q
Further detail regarding the gains (losses) on derivatives not designated in hedging relationships is presented in the following table:
Table 100: Gains (Losses) on Derivatives Not Designated As Hedging Instruments under GAAP
| Three months ended September 30 | Nine months ended September 30 | |||||||||||||||
| In millions | 2015 | 2014 | 2015 | 2014 | ||||||||||||
Derivatives used for residential mortgage banking activities: | ||||||||||||||||
Residential mortgage servicing | ||||||||||||||||
Interest rate contracts | $ | 144 | $ | 15 | $ | 159 | $ | 125 | ||||||||
Loan sales | ||||||||||||||||
Interest rate contracts | (6 | ) | 17 | 62 | 5 | |||||||||||
Gains (losses) included in residential mortgage banking activities (a) | $ | 138 | $ | 32 | $ | 221 | $ | 130 | ||||||||
Derivatives used for commercial mortgage banking activities: | ||||||||||||||||
Interest rate contracts (b) (c) | $ | 42 | $ | 4 | $ | 47 | $ | 47 | ||||||||
Credit contracts (c) | (1 | ) | ||||||||||||||
Gains (losses) from commercial mortgage banking activities | $ | 42 | $ | 4 | $ | 47 | $ | 46 | ||||||||
Derivatives used for customer-related activities: | ||||||||||||||||
Interest rate contracts | $ | 10 | $ | 15 | $ | 44 | $ | 25 | ||||||||
Foreign exchange contracts | 23 | (5 | ) | 56 | 43 | |||||||||||
Gains (losses) from customer-related activities (c) | $ | 33 | $ | 10 | $ | 100 | $ | 68 | ||||||||
Derivatives used for other risk management activities: | ||||||||||||||||
Interest rate contracts | $ | $ | 1 | $ | 1 | $ | (14 | ) | ||||||||
Foreign exchange contracts | 94 | 80 | 208 | 73 | ||||||||||||
Other contracts (d) | 47 | (52 | ) | 54 | (79 | ) | ||||||||||
Gains (losses) from other risk management activities (c) | $ | 141 | $ | 29 | $ | 263 | $ | (20 | ) | |||||||
Total gains (losses) from derivatives not designated as hedging instruments | $ | 354 | $ | 75 | $ | 631 | $ | 224 | ||||||||
| (a) | Included in Residential mortgage noninterest income. |
| (b) | Included in Corporate services noninterest income. |
| (c) | Included in Other noninterest income. |
| (d) | Includes BlackRock LTIP funding obligation and the swaps entered into in connection with sales of a portion of Visa Class B common shares. |
Credit Derivatives
We have historically entered into credit derivatives, specifically credit default swaps and risk participation agreements, as part of our commercial mortgage banking hedging activities and for customer and other risk management purposes.
Credit Default Swaps
We no longer actively enter into these types of credit derivatives. For more information regarding credit default swaps, see Note 15 Financial Derivatives in our Notes To Consolidated Financial Statements under Item 8 of our 2014 Form 10-K.
Risk Participation Agreements
We have entered into risk participation agreements to share some of the credit exposure with other counterparties related to interest rate derivative contracts or to take on credit exposure to generate revenue. The notional amount of risk participation agreements sold was $2.8 billion at both September 30, 2015 and December 31, 2014. For more information regarding risk participation agreements, see Note 15 Financial Derivatives in our Notes To Consolidated
Financial Statements under Item 8 of our 2014 Form 10-K. Assuming all underlying third party customers referenced in the swap contracts defaulted at September 30, 2015, the exposure from these agreements would be $148 million based on the fair value of the underlying swaps, compared with $124 million at December 31, 2014.
Offsetting, Counterparty Credit Risk, and Contingent Features
We, generally, utilize a net presentation on the Consolidated Balance Sheet for those derivative financial instruments entered into with counterparties under legally enforceable master netting agreements. The master netting agreements reduce credit risk by permitting the closeout netting of various types of derivative instruments with the same counterparty upon the occurrence of an event of default.
For additional information on derivative offsetting, counterparty credit risk, and contingent features see Note 15 Financial Derivatives in our 2014 Form 10-K. Refer to Note 16 Commitments and Guarantees in this Report for additional information related to resale and repurchase agreements offsetting.
The PNC Financial Services Group, Inc. – Form 10-Q 111
The following derivative Table 101 shows the impact legally enforceable master netting agreements had on our derivative assets and derivative liabilities as of September 30, 2015 and December 31, 2014. The table also includes the fair value of any securities collateral held or pledged under legally enforceable master netting agreements. Cash and securities collateral amounts are included in the table only to the extent of the related net derivative fair values.
Table 101: Derivative Assets and Liabilities Offsetting
Gross Derivative | Amounts Offset on the Consolidated Balance Sheet | Net Derivative | Securities Master Netting | Net Amounts | ||||||||||||||||||||
September 30, 2015 In millions | Fair Value Offset Amount | Cash Collateral | ||||||||||||||||||||||
Derivative assets | ||||||||||||||||||||||||
Interest rate contracts | $ | 5,871 | $ | 1,956 | $ | 432 | $ | 3,483 | $ | 240 | $ | 3,243 | ||||||||||||
Foreign exchange contracts | 359 | 201 | 22 | 136 | 5 | 131 | ||||||||||||||||||
Credit contracts | 2 | 1 | 1 | |||||||||||||||||||||
Total derivative assets (a) | $ | 6,232 | $ | 2,158 | $ | 455 | $ | 3,619 | (b) | $ | 245 | $ | 3,374 | |||||||||||
Gross Derivative | Amounts Offset on the Consolidated Balance Sheet | Net Derivative | Securities Master Netting | Net Amounts | ||||||||||||||||||||
September 30, 2015 In millions | Fair Value Offset Amount | Cash Collateral | ||||||||||||||||||||||
Derivative liabilities | ||||||||||||||||||||||||
Interest rate contracts | $ | 3,905 | $ | 2,028 | $ | 539 | $ | 1,338 | $ | 1,338 | ||||||||||||||
Foreign exchange contracts | 251 | 126 | 22 | 103 | 103 | |||||||||||||||||||
Credit contracts | 5 | 4 | 1 | |||||||||||||||||||||
Other contracts | 429 | 429 | 429 | |||||||||||||||||||||
Total derivative liabilities (a) | $ | 4,590 | $ | 2,158 | $ | 562 | $ | 1,870 | (c) | $ | 1,870 | |||||||||||||
Gross Derivative | Amounts Offset on the Consolidated Balance Sheet | Net Fair Value Derivative | Securities Master Netting | Net Amounts | ||||||||||||||||||||
December 31, 2014 In millions | Fair Value Offset Amount | Cash Collateral | ||||||||||||||||||||||
Derivative assets | ||||||||||||||||||||||||
Interest rate contracts | $ | 4,918 | $ | 1,981 | $ | 458 | $ | 2,479 | $ | 143 | $ | 2,336 | ||||||||||||
Foreign exchange contracts | 314 | 159 | 47 | 108 | 1 | 107 | ||||||||||||||||||
Credit contracts | 2 | 1 | 1 | |||||||||||||||||||||
Total derivative assets (a) | $ | 5,234 | $ | 2,141 | $ | 506 | $ | 2,587 | (b) | $ | 144 | $ | 2,443 | |||||||||||
Gross Derivative | Amounts Offset on the Consolidated Balance Sheet | Net Derivative | Securities Master Netting | Net Amounts | ||||||||||||||||||||
December 31, 2014 In millions | Fair Value Offset Amount | Cash Collateral | ||||||||||||||||||||||
Derivative liabilities | ||||||||||||||||||||||||
Interest rate contracts | $ | 3,272 | $ | 2,057 | $ | 483 | $ | 732 | $ | 732 | ||||||||||||||
Foreign exchange contracts | 241 | 80 | 20 | 141 | 141 | |||||||||||||||||||
Credit contracts | 4 | 4 | ||||||||||||||||||||||
Other contracts | 510 | 510 | 510 | |||||||||||||||||||||
Total derivative liabilities (a) | $ | 4,027 | $ | 2,141 | $ | 503 | $ | 1,383 | (c) | $ | 1,383 | |||||||||||||
| (a) | Included derivative assets and derivative liabilities as of September 30, 2015 totaling $1.4 billion and $1.3 billion, respectively, related to interest rate contracts executed bilaterally with counterparties in the U.S. over-the-counter market and novated to and cleared through a central clearing house. The comparable amounts as of December 31, 2014 totaled $807 million and $657 million, respectively. Derivative assets and liabilities as of September 30, 2015 and December 31, 2014 related to exchange-traded interest rate contracts were not material. As of September 30, 2015 and December 31, 2014, these contracts were not subject to offsetting. The remaining gross and net derivative assets and liabilities relate to contracts executed bilaterally with counterparties that are not settled through an organized exchange or central clearing house. |
| (b) | Represents the net amount of derivative assets included in Other assets on our Consolidated Balance Sheet. |
| (c) | Represents the net amount of derivative liabilities included in Other liabilities on our Consolidated Balance Sheet. |
In addition to using master netting and related collateral agreements to reduce credit risk associated with derivative instruments, we also seek to manage credit risk by evaluating credit ratings of counterparties, by taking collateral and by using internal credit analysis, limits, and monitoring procedures. Collateral may also be exchanged under certain derivative agreements that are not considered master netting agreements.
112 The PNC Financial Services Group, Inc. – Form 10-Q
At September 30, 2015, we held cash, U.S. government securities and mortgage-backed securities totaling $1.1 billion under master netting and other collateral agreements to collateralize net derivative assets due from counterparties, and we have pledged cash totaling $.9 billion under these agreements to collateralize net derivative liabilities owed to counterparties. These totals may differ from the amounts presented in the preceding offsetting table because they may include collateral exchanged under an agreement that does not qualify as a master netting agreement or because the total amount of collateral held or pledged exceeds the net derivative fair value with the counterparty as of the balance sheet date due to timing or other factors. To the extent not netted against the derivative fair value under a master netting agreement, the receivable for cash pledged is included in Other assets and the obligation for cash held is included in Other borrowed funds on our Consolidated Balance Sheet. Securities held from counterparties are not recognized on our balance sheet. Likewise securities we have pledged to counterparties remain on our balance sheet.
Certain of the master netting agreements and certain other derivative agreements also contain provisions that require PNC's debt to maintain an investment grade credit rating from each of the major credit rating agencies. If PNC's debt ratings were to fall below investment grade, we would be in violation of these provisions and the counterparties to the derivative instruments could request immediate payment or demand immediate and ongoing full overnight collateralization on derivative instruments in net liability positions. The aggregate fair value of all derivative instruments with credit-risk-related contingent features that were in a net liability position on September 30, 2015 was $.9 billion for which PNC had posted collateral of $.7 billion in the normal course of business. The maximum additional amount of collateral PNC would have been required to post if the credit-risk-related contingent features underlying these agreements had been triggered on September 30, 2015 would be $.2 billion.
N OTE 12 E ARNINGS P ER S HARE
Table 102: Basic and Diluted Earnings per Common Share
| Three months ended September 30 | Nine months ended September 30 | |||||||||||||||
| In millions, except per share data | 2015 | 2014 | 2015 | 2014 | ||||||||||||
Basic | ||||||||||||||||
Net income | $ | 1,073 | $ | 1,038 | $ | 3,121 | $ | 3,150 | ||||||||
Less: | ||||||||||||||||
Net income (loss) attributable to noncontrolling interests | 18 | 1 | 23 | 2 | ||||||||||||
Preferred stock dividends and discount accretion and redemptions | 64 | 71 | 182 | 189 | ||||||||||||
Net income attributable to common shares | 991 | 966 | 2,916 | 2,959 | ||||||||||||
Less: | ||||||||||||||||
Dividends and undistributed earnings allocated to nonvested restricted shares | 3 | 2 | 9 | |||||||||||||
Net income attributable to basic common shares | $ | 991 | $ | 963 | $ | 2,914 | $ | 2,950 | ||||||||
Basic weighted-average common shares outstanding | 512 | 529 | 516 | 531 | ||||||||||||
Basic earnings per common share (a) | $ | 1.93 | $ | 1.82 | $ | 5.64 | $ | 5.55 | ||||||||
Diluted | ||||||||||||||||
Net income attributable to basic common shares | $ | 991 | $ | 963 | $ | 2,914 | $ | 2,950 | ||||||||
Less: Impact of BlackRock earnings per share dilution | 4 | 4 | 14 | 13 | ||||||||||||
Net income attributable to diluted common shares | $ | 987 | $ | 959 | $ | 2,900 | $ | 2,937 | ||||||||
Basic weighted-average common shares outstanding | 512 | 529 | 516 | 531 | ||||||||||||
Dilutive potential common shares (b) (c) | 8 | 8 | 9 | 8 | ||||||||||||
Diluted weighted-average common shares outstanding | 520 | 537 | 525 | 539 | ||||||||||||
Diluted earnings per common share (a) | $ | 1.90 | $ | 1.79 | $ | 5.52 | $ | 5.45 | ||||||||
| (a) | Basic and diluted earnings per share under the two-class method are determined on net income reported on the income statement less earnings allocated to nonvested restricted shares (participating securities). |
| (b) | No stock options were considered to be anti-dilutive for the three and nine months ended September 30, 2015 and September 30, 2014, respectively. |
| (c) | No warrants were considered to be anti-dilutive for the three and nine months ended September 30, 2015 and September 30, 2014, respectively. |
The PNC Financial Services Group, Inc. – Form 10-Q 113
N OTE 13 T OTAL E QUITY AND O THER C OMPREHENSIVE I NCOME
Activity in total equity for the first nine months of 2014 and 2015 follows.
Table 103: Rollforward of Total Equity
| Shareholders' Equity | ||||||||||||||||||||||||||||||||||||
| In millions | Shares Outstanding Common Stock | Common Stock | Capital Surplus - Preferred Stock | Capital Surplus - Common Stock and Other | Retained Earnings | Accumulated Other Income (Loss) | Treasury Stock | Non- controlling Interests | Total Equity | |||||||||||||||||||||||||||
Balance at December 31, 2013 | 533 | $ | 2,698 | $ | 3,941 | $ | 12,416 | $ | 23,251 | $ | 436 | $ | (408 | ) | $ | 1,703 | $ | 44,037 | ||||||||||||||||||
Cumulative effect of adopting ASC 860-50 (a) | 2 | 2 | ||||||||||||||||||||||||||||||||||
Balance at January 1, 2014 | 533 | $ | 2,698 | $ | 3,941 | $ | 12,416 | $ | 23,253 | $ | 436 | $ | (408 | ) | $ | 1,703 | $ | 44,039 | ||||||||||||||||||
Net income | 3,148 | 2 | 3,150 | |||||||||||||||||||||||||||||||||
Other comprehensive income (loss), net of tax | 291 | 291 | ||||||||||||||||||||||||||||||||||
Cash dividends declared | ||||||||||||||||||||||||||||||||||||
Common ($1.40 per share) | (748 | ) | (748 | ) | ||||||||||||||||||||||||||||||||
Preferred | (185 | ) | (185 | ) | ||||||||||||||||||||||||||||||||
Preferred stock discount accretion | 4 | (4 | ) | |||||||||||||||||||||||||||||||||
Common stock activity | 1 | 5 | 56 | 61 | ||||||||||||||||||||||||||||||||
Treasury stock activity | (6 | ) | 12 | (523 | ) | (511 | ) | |||||||||||||||||||||||||||||
Other | 89 | (191 | ) | (102 | ) | |||||||||||||||||||||||||||||||
Balance at September 30, 2014 (b) | 528 | $ | 2,703 | $ | 3,945 | $ | 12,573 | $ | 25,464 | $ | 727 | $ | (931 | ) | $ | 1,514 | $ | 45,995 | ||||||||||||||||||
Balance at January 1, 2015 | 523 | $ | 2,705 | $ | 3,946 | $ | 12,627 | $ | 26,200 | $ | 503 | $ | (1,430 | ) | $ | 1,523 | $ | 46,074 | ||||||||||||||||||
Net income | 3,098 | 23 | 3,121 | |||||||||||||||||||||||||||||||||
Other comprehensive income (loss), net of tax | 112 | 112 | ||||||||||||||||||||||||||||||||||
Cash dividends declared | ||||||||||||||||||||||||||||||||||||
Common ($1.50 per share) | (779 | ) | (779 | ) | ||||||||||||||||||||||||||||||||
Preferred | (178 | ) | (178 | ) | ||||||||||||||||||||||||||||||||
Preferred stock discount accretion | 4 | (4 | ) | |||||||||||||||||||||||||||||||||
Common stock activity | 1 | 3 | 36 | 39 | ||||||||||||||||||||||||||||||||
Treasury stock activity | (14 | ) | (58 | ) | (1,407 | ) | (1,465 | ) | ||||||||||||||||||||||||||||
Preferred stock redemption – Series K (c) | (500 | ) | (500 | ) | ||||||||||||||||||||||||||||||||
Other | 70 | (216 | ) | (146 | ) | |||||||||||||||||||||||||||||||
Balance at September 30, 2015 (b) | 510 | $ | 2,708 | $ | 3,450 | $ | 12,675 | $ | 28,337 | $ | 615 | $ | (2,837 | ) | $ | 1,330 | $ | 46,278 | ||||||||||||||||||
| (a) | Amount represents the cumulative impact of our January 1, 2014 irrevocable election to prospectively measure all classes of commercial MSRs at fair value. See Note 1 Accounting Policies and Note 8 Goodwill and Other Intangible Assets for more information on this election in our Notes To Consolidated Financial Statements under Item 8 of our 2014 Form 10-K. |
| (b) | The par value of our preferred stock outstanding was less than $.5 million at each date and, therefore, is excluded from this presentation. |
| (c) | On May 4, 2015, PNC redeemed all 50,000 shares of its Series K Preferred Stock, as well as all 500,000 Depositary Shares representing fractional interests in such shares, resulting in net outflow of $500 million. |
Warrants
We had 13,385,615 warrants outstanding as of September 30, 2015 compared to 16,885,192 as of December 31, 2014. The reduction was due to 3,499,577 warrants that were exercised during 2015. Each warrant entitles the holder to purchase one share of PNC common stock at an exercise price of $67.33 per share. In accordance with the terms of the warrants, the warrants are exercised on a non-cash net basis with the warrant holder receiving PNC common shares determined based on the excess of the market price of PNC common stock on the exercise date over the exercise price of the warrant. In 2015, we issued 1,059,612 common shares resulting from the exercise of the warrants. The issuance of these shares resulted in a reclassification within Capital surplus – Common stock and other with no impact on PNC's Shareholder's equity. The remaining outstanding warrants will expire as of December 31, 2018, and are considered in the calculation of diluted earnings per common share in Note 12 Earnings Per Share in this Report.
114 The PNC Financial Services Group, Inc. – Form 10-Q
Table 104: Other Comprehensive Income
Details of other comprehensive income (loss) are as follows:
| In millions | Pretax | Tax | After-tax | |||||||||
Net unrealized gains (losses) on non-OTTI securities | ||||||||||||
Balance at June 30, 2014 | $ | 1,048 | $ | (385 | ) | $ | 663 | |||||
Third Quarter 2014 activity | ||||||||||||
Increase in net unrealized gains (losses) on non-OTTI securities | (125 | ) | 46 | (79 | ) | |||||||
Less: Net gains (losses) realized as a yield adjustment reclassified to investment securities interest income | 7 | (3 | ) | 4 | ||||||||
Net unrealized gains (losses) on non-OTTI securities | (132 | ) | 49 | (83 | ) | |||||||
Balance at September 30, 2014 | 916 | (336 | ) | 580 | ||||||||
Balance at June 30, 2015 | 731 | (268 | ) | 463 | ||||||||
Third Quarter 2015 activity | ||||||||||||
Increase in net unrealized gains (losses) on non-OTTI securities | 139 | (52 | ) | 87 | ||||||||
Less: Net gains (losses) realized as a yield adjustment reclassified to investment securities interest income | 6 | (2 | ) | 4 | ||||||||
Less: Net gains (losses) realized on sales of securities reclassified to noninterest income | (21 | ) | 7 | (14 | ) | |||||||
Net unrealized gains (losses) on non-OTTI securities | 154 | (57 | ) | 97 | ||||||||
Balance at September 30, 2015 | $ | 885 | $ | (325 | ) | $ | 560 | |||||
Net unrealized gains (losses) on OTTI securities | ||||||||||||
Balance at June 30, 2014 | $ | 143 | $ | (51 | ) | $ | 92 | |||||
Third Quarter 2014 activity | ||||||||||||
Increase in net unrealized gains (losses) on OTTI securities | 14 | (5 | ) | 9 | ||||||||
Less: OTTI losses realized on securities reclassified to noninterest income | (1 | ) | 1 | |||||||||
Net unrealized gains (losses) on OTTI securities | 15 | (6 | ) | 9 | ||||||||
Balance at September 30, 2014 | 158 | (57 | ) | 101 | ||||||||
Balance at June 30, 2015 | 122 | (44 | ) | 78 | ||||||||
Third Quarter 2015 activity | ||||||||||||
Increase in net unrealized gains (losses) on OTTI securities | 3 | (1 | ) | 2 | ||||||||
Less: OTTI losses realized on securities reclassified to noninterest income | (1 | ) | (1 | ) | ||||||||
Net unrealized gains (losses) on OTTI securities | 4 | (1 | ) | 3 | ||||||||
Balance at September 30, 2015 | $ | 126 | $ | (45 | ) | $ | 81 | |||||
Net unrealized gains (losses) on cash flow hedge derivatives | ||||||||||||
Balance at June 30, 2014 | $ | 460 | $ | (168 | ) | $ | 292 | |||||
Third Quarter 2014 activity | ||||||||||||
Increase in net unrealized gains (losses) on cash flow hedge derivatives | (17 | ) | 6 | (11 | ) | |||||||
Less: Net gains (losses) realized as a yield adjustment reclassified to loan interest income (a) | 61 | (22 | ) | 39 | ||||||||
Less: Net gains (losses) realized as a yield adjustment reclassified to investment securities interest income (a) | 3 | (1 | ) | 2 | ||||||||
Net unrealized gains (losses) on cash flow hedge derivatives | (81 | ) | 29 | (52 | ) | |||||||
Balance at September 30, 2014 | 379 | (139 | ) | 240 | ||||||||
Balance at June 30, 2015 | 621 | (227 | ) | 394 | ||||||||
Third Quarter 2015 activity | ||||||||||||
Increase in net unrealized gains (losses) on cash flow hedge derivatives | 326 | (119 | ) | 207 | ||||||||
Less: Net gains (losses) realized as a yield adjustment reclassified to loan interest income (a) | 74 | (27 | ) | 47 | ||||||||
Less: Net gains (losses) realized as a yield adjustment reclassified to investment securities interest income (a) | 6 | (2 | ) | 4 | ||||||||
Less: Net gains (losses) realized on sales of securities reclassified to noninterest income (a) | 12 | (4 | ) | 8 | ||||||||
Net unrealized gains (losses) on cash flow hedge derivatives | 234 | (86 | ) | 148 | ||||||||
Balance at September 30, 2015 | $ | 855 | $ | (313 | ) | $ | 542 | |||||
(continued on following page)
The PNC Financial Services Group, Inc. – Form 10-Q 115
(continued from previous page)
| In millions | Pretax | Tax | After-tax | |||||||||
Pension and other postretirement benefit plan adjustments | ||||||||||||
Balance at June 30, 2014 | $ | (283 | ) | $ | 103 | $ | (180 | ) | ||||
Third Quarter 2014 activity | ||||||||||||
Amortization of actuarial loss (gain) reclassified to other noninterest expense | 1 | 1 | ||||||||||
Amortization of prior service cost (credit) reclassified to other noninterest expense | (3 | ) | 1 | (2 | ) | |||||||
Total Third Quarter 2014 activity | (2 | ) | 1 | (1 | ) | |||||||
Balance at September 30, 2014 | (285 | ) | 104 | (181 | ) | |||||||
Balance at June 30, 2015 | (770 | ) | 282 | (488 | ) | |||||||
Third Quarter 2015 activity | ||||||||||||
Net pension and other postretirement benefit plan activity | ||||||||||||
Amortization of actuarial loss (gain) reclassified to other noninterest expense | 10 | (3 | ) | 7 | ||||||||
Amortization of prior service cost (credit) reclassified to other noninterest expense | (3 | ) | 1 | (2 | ) | |||||||
Total Third Quarter 2015 activity | 7 | (2 | ) | 5 | ||||||||
Balance at September 30, 2015 | $ | (763 | ) | $ | 280 | $ | (483 | ) | ||||
Other | ||||||||||||
Balance at June 30, 2014 | $ | (13 | ) | $ | 27 | $ | 14 | |||||
Third Quarter 2014 Activity | ||||||||||||
PNC's portion of BlackRock's OCI | (10 | ) | 4 | (6 | ) | |||||||
Net investment hedge derivatives (b) | 51 | (19 | ) | 32 | ||||||||
Foreign currency translation adjustments (c) | (53 | ) | (53 | ) | ||||||||
Total Third Quarter 2014 activity | (12 | ) | (15 | ) | (27 | ) | ||||||
Balance at September 30, 2014 | (25 | ) | 12 | (13 | ) | |||||||
Balance at June 30, 2015 | (95 | ) | 27 | (68 | ) | |||||||
Third Quarter 2015 Activity | ||||||||||||
PNC's portion of BlackRock's OCI | ||||||||||||
Net investment hedge derivatives (b) | 43 | (16 | ) | 27 | ||||||||
Foreign currency translation adjustments (c) | (44 | ) | (44 | ) | ||||||||
Total Third Quarter 2015 activity | (1 | ) | (16 | ) | (17 | ) | ||||||
Balance at September 30, 2015 | $ | (96 | ) | $ | 11 | $ | (85 | ) | ||||
116 The PNC Financial Services Group, Inc. – Form 10-Q
| In millions | Pretax | Tax | After-tax | |||||||||
Net unrealized gains (losses) on non-OTTI securities | ||||||||||||
Balance at December 31, 2013 | $ | 647 | $ | (238 | ) | $ | 409 | |||||
2014 activity | ||||||||||||
Increase in net unrealized gains (losses) on non-OTTI securities | 296 | (108 | ) | 188 | ||||||||
Less: Net gains (losses) realized as a yield adjustment reclassified to investment securities interest income | 21 | (8 | ) | 13 | ||||||||
Less: Net gains (losses) realized on sales of securities reclassified to noninterest income | 6 | (2 | ) | 4 | ||||||||
Net unrealized gains (losses) on non-OTTI securities | 269 | (98 | ) | 171 | ||||||||
Balance at September 30, 2014 | 916 | (336 | ) | 580 | ||||||||
Balance at December 31, 2014 | 1,022 | (375 | ) | 647 | ||||||||
2015 activity | ||||||||||||
Increase in net unrealized gains (losses) on non-OTTI securities | (75 | ) | 27 | (48 | ) | |||||||
Less: Net gains (losses) realized as a yield adjustment reclassified to investment securities interest income | 20 | (7 | ) | 13 | ||||||||
Less: Net gains (losses) realized on sales of securities reclassified to noninterest income | 42 | (16 | ) | 26 | ||||||||
Net unrealized gains (losses) on non-OTTI securities | (137 | ) | 50 | (87 | ) | |||||||
Balance at September 30, 2015 | $ | 885 | $ | (325 | ) | $ | 560 | |||||
Net unrealized gains (losses) on OTTI securities | ||||||||||||
Balance at December 31, 2013 | $ | 36 | $ | (12 | ) | $ | 24 | |||||
2014 activity | ||||||||||||
Increase in net unrealized gains (losses) on OTTI securities | 118 | (43 | ) | 75 | ||||||||
Less: OTTI losses realized on securities reclassified to noninterest income | (4 | ) | 2 | (2 | ) | |||||||
Net unrealized gains (losses) on OTTI securities | 122 | (45 | ) | 77 | ||||||||
Balance at September 30, 2014 | 158 | (57 | ) | 101 | ||||||||
Balance at December 31, 2014 | 115 | (41 | ) | 74 | ||||||||
2015 activity | ||||||||||||
Increase in net unrealized gains (losses) on OTTI securities | 8 | (3 | ) | 5 | ||||||||
Less: OTTI losses realized on securities reclassified to noninterest income | (3 | ) | 1 | (2 | ) | |||||||
Net unrealized gains (losses) on OTTI securities | 11 | (4 | ) | 7 | ||||||||
Balance at September 30, 2015 | $ | 126 | $ | (45 | ) | $ | 81 | |||||
Net unrealized gains (losses) on cash flow hedge derivatives | ||||||||||||
Balance at December 31, 2013 | $ | 384 | $ | (141 | ) | $ | 243 | |||||
2014 activity | ||||||||||||
Increase in net unrealized gains (losses) on cash flow hedge derivatives | 193 | (72 | ) | 121 | ||||||||
Less: Net gains (losses) realized as a yield adjustment reclassified to loan interest income (a) | 191 | (70 | ) | 121 | ||||||||
Less: Net gains (losses) realized as a yield adjustment reclassified to investment securities interest income (a) | 9 | (4 | ) | 5 | ||||||||
Less: Net gains (losses) realized on sales of securities reclassified to noninterest income (a) | (2 | ) | (2 | ) | ||||||||
Net unrealized gains (losses) on cash flow hedge derivatives | (5 | ) | 2 | (3 | ) | |||||||
Balance at September 30, 2014 | 379 | (139 | ) | 240 | ||||||||
Balance at December 31, 2014 | 552 | (202 | ) | 350 | ||||||||
2015 activity | ||||||||||||
Increase in net unrealized gains (losses) on cash flow hedge derivatives | 522 | (191 | ) | 331 | ||||||||
Less: Net gains (losses) realized as a yield adjustment reclassified to loan interest income (a) | 202 | (74 | ) | 128 | ||||||||
Less: Net gains (losses) realized as a yield adjustment reclassified to investment securities interest income (a) | 18 | (7 | ) | 11 | ||||||||
Less: Net gains (losses) realized on sales of securities reclassified to noninterest income (a) | (1 | ) | 1 | |||||||||
Net unrealized gains (losses) on cash flow hedge derivatives | 303 | (111 | ) | 192 | ||||||||
Balance at September 30, 2015 | $ | 855 | $ | (313 | ) | $ | 542 | |||||
(continued on following page)
The PNC Financial Services Group, Inc. – Form 10-Q 117
(continued from previous page)
| In millions | Pretax | Tax | After-tax | |||||||||
Pension and other postretirement benefit plan adjustments | ||||||||||||
Balance at December 31, 2013 | $ | (374 | ) | $ | 137 | $ | (237 | ) | ||||
2014 Activity | ||||||||||||
Net pension and other postretirement benefit plan activity | 93 | (35 | ) | 58 | ||||||||
Amortization of actuarial loss (gain) reclassified to other noninterest expense | 3 | (1 | ) | 2 | ||||||||
Amortization of prior service cost (credit) reclassified to other noninterest expense | (7 | ) | 3 | (4 | ) | |||||||
Total 2014 activity | 89 | (33 | ) | 56 | ||||||||
Balance at September 30, 2014 | (285 | ) | 104 | (181 | ) | |||||||
Balance at December 31, 2014 | (820 | ) | 300 | (520 | ) | |||||||
2015 Activity | ||||||||||||
Net pension and other postretirement benefit plan activity | 36 | (13 | ) | 23 | ||||||||
Amortization of actuarial loss (gain) reclassified to other noninterest expense | 28 | (10 | ) | 18 | ||||||||
Amortization of prior service cost (credit) reclassified to other noninterest expense | (7 | ) | 3 | (4 | ) | |||||||
Total 2015 Activity | 57 | (20 | ) | 37 | ||||||||
Balance at September 30, 2015 | $ | (763 | ) | $ | 280 | $ | (483 | ) | ||||
Other | ||||||||||||
Balance at December 31, 2013 | $ | (20 | ) | $ | 17 | $ | (3 | ) | ||||
2014 Activity | ||||||||||||
PNC's portion of BlackRock's OCI | (3 | ) | 2 | (1 | ) | |||||||
Net investment hedge derivatives (b) | 18 | (7 | ) | 11 | ||||||||
Foreign currency translation adjustments | (20 | ) | (20 | ) | ||||||||
Total 2014 activity | (5 | ) | (5 | ) | (10 | ) | ||||||
Balance at September 30, 2014 | (25 | ) | 12 | (13 | ) | |||||||
Balance at December 31, 2014 | (59 | ) | 11 | (48 | ) | |||||||
2015 Activity | ||||||||||||
PNC's portion of BlackRock's OCI | (34 | ) | 12 | (22 | ) | |||||||
Net investment hedge derivatives (b) | 32 | (12 | ) | 20 | ||||||||
Foreign currency translation adjustments (c) | (35 | ) | (35 | ) | ||||||||
Total 2015 activity | (37 | ) | (37 | ) | ||||||||
Balance at September 30, 2015 | $ | (96 | ) | $ | 11 | $ | (85 | ) | ||||
| (a) | Cash flow hedge derivatives are interest rate contract derivatives designated as hedging instruments under GAAP. |
| (b) | Net investment hedge derivatives are foreign exchange contracts designated as hedging instruments under GAAP. |
| (c) | The earnings of PNC's Luxembourg-UK lending business have been indefinitely reinvested: therefore, no U.S. deferred income tax has been recorded on the foreign currency translation of the investment. |
Table 105: Accumulated Other Comprehensive Income (Loss) Components
| September 30, 2015 | December 31, 2014 | |||||||||||||||
| In millions | Pretax | After-tax | Pretax | After-tax | ||||||||||||
Net unrealized gains (losses) on non-OTTI securities | $ | 885 | $ | 560 | $ | 1,022 | $ | 647 | ||||||||
Net unrealized gains (losses) on OTTI securities | 126 | 81 | 115 | 74 | ||||||||||||
Net unrealized gains (losses) on cash flow hedge derivatives | 855 | 542 | 552 | 350 | ||||||||||||
Pension and other postretirement benefit plan adjustments | (763 | ) | (483 | ) | (820 | ) | (520 | ) | ||||||||
Other | (96 | ) | (85 | ) | (59 | ) | (48 | ) | ||||||||
Accumulated other comprehensive income (loss) | $ | 1,007 | $ | 615 | $ | 810 | $ | 503 | ||||||||
118 The PNC Financial Services Group, Inc. – Form 10-Q
N OTE 14 I NCOME T AXES
Table 106: Net Operating Loss Carryforwards and Tax Credit Carryforwards
| In millions | September 30 2015 | December 31 2014 | ||||||
Net Operating Loss Carryforwards: | ||||||||
Federal | $ | 918 | $ | 997 | ||||
State | $ | 2,433 | $ | 2,594 | ||||
Tax Credit Carryforwards: | ||||||||
Federal | $ | 35 | $ | 35 | ||||
State | $ | 7 | $ | 7 | ||||
The federal net operating loss carryforwards expire in 2032. The state net operating loss carryforwards will expire from 2015 to 2035. The majority of the tax credit carryforwards expire in 2032. All federal and most state net operating loss and credit carryforwards are from acquired entities and utilization is subject to various statutory limitations. It is anticipated that the company will be able to fully utilize its carryforwards for federal tax purposes, but a valuation allowance of $63 million has been recorded against certain state tax carryforwards as of September 30, 2015. If select uncertain tax positions were successfully challenged by a state, the state net operating losses listed above could be reduced by $60 million.
The Internal Revenue Service (IRS) is currently examining PNC's 2011 through 2013 returns. Examinations by the IRS relating to National City's consolidated federal income tax returns through 2008 were effectively settled.
The Company had unrecognized tax benefits of $30 million at September 30, 2015 and $77 million at December 31, 2014. At September 30, 2015, $23 million of unrecognized tax benefits, if recognized, would favorably impact the effective income tax rate.
It is reasonably possible that the balance of unrecognized tax benefits could increase or decrease in the next twelve months due to completion of tax authorities' exams or the expiration of statutes of limitations. Management estimates that the balance of unrecognized tax benefits could decrease by $10 million within the next twelve months.
During the nine months ended September 30, 2015, we recognized $154 million of amortization, $167 million of tax credits, and $56 million of other tax benefits associated with qualified investments in low income housing tax credits within Income taxes. The amounts for the third quarter of 2015 were $52 million, $56 million and $19 million, respectively.
N OTE 15 L EGAL P ROCEEDINGS
We establish accruals for legal proceedings, including litigation and regulatory and governmental investigations and inquiries, when information related to the loss contingencies represented by those matters indicates both that a loss is probable and that the amount of loss can be reasonably estimated. Any such accruals are adjusted thereafter as appropriate to reflect changed circumstances. When we are able to do so, we also determine estimates of possible losses or ranges of possible losses, whether in excess of any related accrued liability or where there is no accrued liability, for disclosed legal proceedings ("Disclosed Matters," which are those matters disclosed in this Note 15 as well as those matters disclosed in Note 21 Legal Proceedings in Part II, Item 8 of our 2014 Form 10-K and in Note 15 Legal Proceedings in Part I, Item 1 of our first and second quarter 2015 Forms 10-Q (such prior disclosure collectively referred to as "Prior Disclosure")). For Disclosed Matters where we are able to estimate such possible losses or ranges of possible losses, as of September 30, 2015, we estimate that it is reasonably possible that we could incur losses in excess of related accrued liabilities, if any, in an aggregate amount of up to approximately $725 million. The estimates included in this amount are based on our analysis of currently available information and are subject to significant judgment and a variety of assumptions and uncertainties. As new information is obtained we may change our estimates. Due to the inherent subjectivity of the assessments and unpredictability of outcomes of legal proceedings, any amounts accrued or included in this aggregate amount may not represent the ultimate loss to us from the legal proceedings in question. Thus, our exposure and ultimate losses may be higher, and possibly significantly so, than the amounts accrued or this aggregate amount.
In our experience, legal proceedings are inherently unpredictable. One or more of the following factors frequently contribute to this inherent unpredictability: the proceeding is in its early stages; the damages sought are unspecified, unsupported or uncertain; it is unclear whether a case brought as a class action will be allowed to proceed on that basis or, if permitted to proceed as a class action, how the class will be defined; the other party is seeking relief other than or in addition to compensatory damages (including, in the case of regulatory and governmental investigations and inquiries, the possibility of fines and penalties); the matter presents meaningful legal uncertainties, including novel issues of law; we have not engaged in meaningful settlement discussions; discovery has not started or is not complete; there are significant facts in dispute; the possible outcomes may not be amenable to the use of statistical or quantitative analytical tools; predicting possible outcomes depends on making assumptions about future decisions of courts or regulatory bodies or the behavior of other parties; and there are a large number of parties named as defendants (including where it is
The PNC Financial Services Group, Inc. – Form 10-Q 119
uncertain how damages or liability, if any, will be shared among multiple defendants). Generally, the less progress that has been made in the proceedings or the broader the range of potential results, the harder it is for us to estimate losses or ranges of losses that it is reasonably possible we could incur.
As a result of these types of factors, we are unable, at this time, to estimate the losses that it is reasonably possible that we could incur or ranges of such losses with respect to some of the matters disclosed, and the aggregate estimated amount provided above does not include an estimate for every Disclosed Matter. Therefore, as the estimated aggregate amount disclosed above does not include all of the Disclosed Matters, the amount disclosed above does not represent our maximum reasonably possible loss exposure for all of the Disclosed Matters. The estimated aggregate amount also does not reflect any of our exposure to matters not so disclosed, as discussed below under "Other."
We include in some of the descriptions of individual Disclosed Matters certain quantitative information related to the plaintiff's claim against us as alleged in the plaintiff's pleadings or other public filings or otherwise publicly available information. While information of this type may provide insight into the potential magnitude of a matter, it does not necessarily represent our estimate of reasonably possible loss or our judgment as to any currently appropriate accrual.
Some of our exposure in Disclosed Matters may be offset by applicable insurance coverage. We do not consider the possible availability of insurance coverage in determining the amounts of any accruals (although we record the amount of related insurance recoveries that are deemed probable up to the amount of the accrual) or in determining any estimates of possible losses or ranges of possible losses.
The following updates our disclosure of legal proceedings from that provided in Prior Disclosure.
Interchange Litigation
The appeal of the order of approval of the United States District Court for the Eastern District of New York in the cases consolidated in that court under the caption In re Payment Card Interchange Fee and Merchant-Discount Antitrust Litigation (Master File No. 1:05-md-1720-JG-JO) was argued in September 2015 and remains pending. In addition, in July 2015 several objectors filed a motion with the district court to vacate the court's judgment, including the approval of the settlement, based on alleged misconduct by one of the counsel for MasterCard and one of the counsel for plaintiffs. This motion remains pending.
CBNV Mortgage Litigation
In the cases consolidated for pre-trial proceedings in the United States District Court for the Western District of Pennsylvania under the caption In re: Community Bank of Northern Virginia Lending Practices Litigation (No. 03-0425 (W.D. Pa.), MDL No. 1674), we moved for a rehearing by the United States Court of Appeals for the Third Circuit of its affirmance of the grant of class certification by the district court. Our motion was denied in October 2015.
Overdraft Litigation
In Dasher v. RBC Bank (10-cv-22190-JLK), currently pending for pre-trial proceedings in the United States District Court for the Southern District of Florida, we filed a motion in December 2014 to compel arbitration as to the claims of the plaintiff based on an arbitration provision added to the PNC account agreement in 2013. In August 2015, the district court denied our motion. Later in August 2015, we appealed the denial of our arbitration motion to the court of appeals. The appeal is pending.
Lender Placed Insurance Litigation
In Montoya, et al. v. PNC Bank, N.A., et al. , (Case No. 1:14-cv-20474-JEM), pending in the United States District Court for the Southern District of Florida, the court granted preliminary approval of the settlement in September 2015. Notice to the class members will be provided following this preliminary approval.
Patent Infringement Litigation
In October 2015, the plaintiffs in Intellectual Ventures I LLC and Intellectual Ventures II LLC vs. PNC Financial Services Group, Inc., and PNC Bank, NA , (Case No. 2:13-cv-00740-AJS)(IV 1), pending in the United States District Court for the Western District of Pennsylvania, moved to dismiss with prejudice their claims arising from the patents that had not been subject to prior dismissal in this lawsuit. The court has granted this motion.
Also in October 2015, in Intellectual Ventures I LLC and Intellectual Ventures II LLC v. PNC Bank Financial Services Group, Inc., PNC Bank NA, and PNC Merchant Services Company, LP (Case No. 2:14-cv-00832-AKS)(IV 2), pending in the same court as IV 1 , the plaintiffs voluntarily dismissed without prejudice their claims with respect to three patents that had been invalidated in other lawsuits, leaving two patents at issue in this lawsuit. The plaintiffs moved to deconsolidate IV 1 and IV 2 and to lift the stay. In October this motion was denied.
Mortgage Repurchase Litigation
In September 2015, in Residential Funding Company, LLC v. PNC Bank, N.A., et al. (Civil No. 13-3498- JRT-JSM), Residential Funding Company (RFC) filed a motion for leave
120 The PNC Financial Services Group, Inc. – Form 10-Q
to file a second amended complaint to add claims based on an asserted principle that loan sellers had a continuing contractual obligation to provide notice of loan defects, which RFC claims should allow it to assert contract claims as to pre-May 14, 2006 loans notwithstanding the prior dismissal of those claims with prejudice.
Pre-need Funeral Arrangements
In Jo Ann Howard, P.C., et al. v. Cassity, et al. (No. 4:09-CV-1252-ERW), pending in the United States District Court for the Eastern District of Missouri, the parties' post-trial motions were argued in August 2015.
DD Growth Premium Master Fund
In June 2014, the liquidators of the DD Growth Premium Master Fund (DD Growth) issued a Plenary Summons in the High Court, Dublin, Ireland, in connection with the provision of administration services to DD Growth by a European subsidiary (GIS Europe) of PNC Global Investment Servicing (PNC GIS), a former subsidiary of PNC. The Plenary Summons was served on GIS Europe in June 2015.
In July 2010, PNC completed the sale of PNC GIS to The Bank of New York Mellon Corporation (BNY Mellon). Beginning in February 2014, BNY Mellon has provided notice to PNC of three indemnification claims related to DD Growth funds. PNC's responsibility for this litigation is subject to the terms and limitations included in the indemnification provisions of the stock purchase agreement.
In its Statement of Claim, which the liquidator served in July 2015, the liquidator alleges, among other things, that GIS Europe breached its contractual duties to DD Growth as well as an alleged duty of care to DD Growth, and to investors in DD Growth, and makes claims of breach of the administration and accounting services agreement, breach of the middle office agreement, negligence, gross negligence, and breach of duty. The statement of claim further alleges claims for loss in the net asset value of the fund and loss of certain subscriptions paid into the fund in the amounts of approximately $283 million and $134 million, respectively. The statement of claim seeks, among other things, damages, costs, and interest.
Other Regulatory and Governmental Inquiries
PNC is the subject of investigations, audits and other forms of regulatory and governmental inquiry covering a broad range of issues in our banking, securities and other financial services businesses, in some cases as part of reviews of specified activities at multiple industry participants. Over the last few years, we have experienced an increase in regulatory and governmental investigations, audits and other inquiries. Areas of current regulatory or governmental inquiry with respect to PNC include consumer protection, fair lending, mortgage origination and servicing, mortgage and non mortgage-related insurance and reinsurance, municipal finance activities, conduct by broker-dealers, automobile lending practices, and participation in government insurance or guarantee programs, some of which are described in Prior Disclosure. These inquiries, including those described in Prior Disclosure, may lead to administrative, civil or criminal proceedings, and possibly result in remedies including fines, penalties, restitution, or alterations in our business practices, and in additional expenses and collateral costs.
Our practice is to cooperate fully with regulatory and governmental investigations, audits and other inquiries, including those described in Prior Disclosure.
Other
In addition to the proceedings or other matters described above, PNC and persons to whom we may have indemnification obligations, in the normal course of business, are subject to various other pending and threatened legal proceedings in which claims for monetary damages and other relief are asserted. We do not anticipate, at the present time, that the ultimate aggregate liability, if any, arising out of such other legal proceedings will have a material adverse effect on our financial position. However, we cannot now determine whether or not any claims asserted against us or others to whom we may have indemnification obligations, whether in the proceedings or other matters described above or otherwise, will have a material adverse effect on our results of operations in any future reporting period, which will depend on, among other things, the amount of the loss resulting from the claim and the amount of income otherwise reported for the reporting period.
See Note 16 Commitments and Guarantees for additional information regarding the Visa indemnification and our other obligations to provide indemnification, including to current and former officers, directors, employees and agents of PNC and companies we have acquired.
The PNC Financial Services Group, Inc. – Form 10-Q 121
N OTE 16 C OMMITMENTS AND G UARANTEES
Commitments
In the normal course of business, we have various commitments outstanding, certain of which are not included on our Consolidated Balance Sheet. The following table presents our outstanding commitments to extend credit along with significant other commitments as of September 30, 2015 and December 31, 2014, respectively.
Table 107: Commitments to Extend Credit and Other Commitments
| In millions | September 30 2015 | December 31 2014 | ||||||
Commitments to extend credit | ||||||||
Total commercial lending | $ | 100,323 | $ | 98,742 | ||||
Home equity lines of credit | 17,350 | 17,839 | ||||||
Credit card | 19,622 | 17,833 | ||||||
Other | 4,075 | 4,178 | ||||||
Total commitments to extend credit | 141,370 | 138,592 | ||||||
Net outstanding standby letters of credit (a) | 9,112 | 9,991 | ||||||
Reinsurance agreements | 2,054 | 4,297 | ||||||
Standby bond purchase agreements (b) | 968 | 1,095 | ||||||
Other commitments (c) | 990 | 962 | ||||||
Total commitments to extend credit and other commitments | $ | 154,494 | $ | 154,937 | ||||
| (a) | Net outstanding standby letters of credit include $4.9 billion and $5.2 billion which support remarketing programs at September 30, 2015 and December 31, 2014, respectively. |
| (b) | We enter into standby bond purchase agreements to support municipal bond obligations. |
| (c) | Includes $441 million related to investments in qualified affordable housing projects at both September 30, 2015 and December 31, 2014. |
Commitments to Extend Credit
Commitments to extend credit, or net unfunded loan commitments, represent arrangements to lend funds or provide liquidity subject to specified contractual conditions. These commitments generally have fixed expiration dates, may require payment of a fee, and contain termination clauses in the event the customer's credit quality deteriorates. Based on our historical experience, some commitments expire unfunded, and therefore cash requirements are substantially less than the total commitment.
Net Outstanding Standby Letters of Credit
We issue standby letters of credit and share in the risk of standby letters of credit issued by other financial institutions, in each case to support obligations of our customers to third parties, such as insurance requirements and the facilitation of transactions involving capital markets product execution. Internal credit ratings related to our net outstanding standby letters of credit were as follows:
Table 108: Internal Credit Ratings Related to Net Outstanding Standby Letters of Credit
| September 30 2015 | December 31 2014 | |||||||
Internal credit ratings (as a percentage of portfolio): | ||||||||
Pass (a) | 94 | % | 95 | % | ||||
Below pass (b) | 6 | % | 5 | % | ||||
| (a) | Indicates that expected risk of loss is currently low. |
| (b) | Indicates a higher degree of risk of default. |
If the customer fails to meet its financial or performance obligation to the third party under the terms of the contract or there is a need to support a remarketing program, then upon a draw by a beneficiary, subject to the terms of the letter of credit, we would be obligated to make payment to them. The standby letters of credit outstanding on September 30, 2015 had terms ranging from less than 1 year to 7 years.
As of September 30, 2015, assets of $1.0 billion secured certain specifically identified standby letters of credit. In addition, a portion of the remaining standby letters of credit issued on behalf of specific customers is also secured by collateral or guarantees that secure the customers' other obligations to us. The carrying amount of the liability for our obligations related to standby letters of credit and
participations in standby letters of credit was $182 million at September 30, 2015 and is included in Other liabilities on our Consolidated Balance Sheet.
122 The PNC Financial Services Group, Inc. – Form 10-Q
Reinsurance Agreements
We have a wholly-owned captive insurance subsidiary which provides reinsurance for accidental death & dismemberment, credit life, accident & health and lender placed hazard, all of which are in run-off. Aggregate maximum exposure up to the specified limits for all reinsurance contracts is as follows:
Table 109: Reinsurance Agreements Exposure (a)
| In millions | September 30 2015 | December 31 2014 | ||||||
Accidental Death & Dismemberment | $ | 1,678 | $ | 1,774 | ||||
Credit Life, Accident & Health | 376 | 467 | ||||||
Lender Placed Hazard (b) (c) | 2,056 | |||||||
Maximum Exposure (d) | $ | 2,054 | $ | 4,297 | ||||
Maximum Exposure to Quota Share Agreements with 100% Reinsurance | $ | 375 | $ | 466 | ||||
| (a) | Reinsurance agreements exposure balances represent estimates based on availability of financial information from insurance carriers. |
| (b) | Through the purchase of catastrophe reinsurance connected to the Lender Placed Hazard Exposure, should a catastrophic event occur, PNC will benefit from this reinsurance. No credit for the catastrophe reinsurance protection is applied to the aggregate exposure figure. |
| (c) | Program was placed into run-off for coverage issued or renewed on or after June 1, 2014 with policy terms one year or less. |
| (d) | The Borrower and Lender Paid Mortgage Insurance program was placed into run-off. Most of these policies carry no liability to PNC, and due to immateriality this program is no longer included in the maximum exposure amount. |
A rollforward of the reinsurance reserves for probable losses for the first nine months of 2015 and 2014 is as follows:
Table 110: Reinsurance Reserves – Rollforward
| In millions | 2015 | 2014 | ||||||
January 1 | $ | 13 | $ | 32 | ||||
Paid Losses | (8 | ) | (17 | ) | ||||
Net Provision | 5 | 10 | ||||||
Changes to Agreements | (10 | ) | ||||||
September 30 | $ | 10 | $ | 15 | ||||
The reinsurance reserves are declining as the programs are in run-off. There were no other changes to existing agreements nor did we enter into any new relationships.
There is a reasonable possibility that losses could be more than or less than the amount reserved due to ongoing uncertainty in various economic, social and other factors that could impact the frequency and severity of claims covered by these reinsurance agreements. At September 30, 2015, the reasonably possible loss above our accrual was not material.
Indemnifications
We are a party to numerous acquisition or divestiture agreements under which we have purchased or sold, or agreed to purchase or sell, various types of assets. These agreements can cover the purchase or sale of entire businesses, loan
portfolios, branch banks, partial interests in companies, or other types of assets.
These agreements generally include indemnification provisions under which we indemnify the third parties to these agreements against a variety of risks to the indemnified parties as a result of the transaction in question. When PNC is the seller, the indemnification provisions will generally also provide the buyer with protection relating to the quality of the assets we are selling and the extent of any liabilities being assumed by the buyer. Due to the nature of these indemnification provisions, we cannot quantify the total potential exposure to us resulting from them.
We provide indemnification in connection with securities offering transactions in which we are involved. When we are the issuer of the securities, we provide indemnification to the underwriters or placement agents analogous to the indemnification provided to the purchasers of businesses from us, as described above. When we are an underwriter or placement agent, we provide a limited indemnification to the issuer related to our actions in connection with the offering and, if there are other underwriters, indemnification to the other underwriters intended to result in an appropriate sharing of the risk of participating in the offering. Due to the nature of these indemnification provisions, we cannot quantify the total potential exposure to us resulting from them.
In the ordinary course of business, we enter into certain types of agreements that include provisions for indemnifying third parties. We also enter into certain types of agreements, including leases, assignments of leases, and subleases, in which we agree to indemnify third parties for acts by our agents, assignees and/or sublessees, and employees. We also enter into contracts for the delivery of technology service in which we indemnify the other party against claims of patent and copyright infringement by third parties. Due to the nature of these indemnification provisions, we cannot calculate our aggregate potential exposure under them.
In the ordinary course of business, we enter into contracts with third parties under which the third parties provide services on behalf of PNC. In many of these contracts, we agree to indemnify the third party service provider under certain circumstances. The terms of the indemnity vary from contract to contract and the amount of the indemnification liability, if any, cannot be determined.
We are a general or limited partner in certain asset management and investment limited partnerships, many of which contain indemnification provisions that would require us to make payments in excess of our remaining unfunded commitments. While in certain of these partnerships the maximum liability to us is limited to the sum of our unfunded commitments and partnership distributions received by us, in the others the indemnification liability is unlimited. As a
The PNC Financial Services Group, Inc. – Form 10-Q 123
result, we cannot determine our aggregate potential exposure for these indemnifications.
In some cases, indemnification obligations of the types described above arise under arrangements entered into by predecessor companies for which we become responsible as a result of the acquisition.
Pursuant to their bylaws, PNC and its subsidiaries provide indemnification to directors, officers and, in some cases, employees and agents against certain liabilities incurred as a result of their service on behalf of or at the request of PNC and its subsidiaries. PNC and its subsidiaries also advance on behalf of covered individuals costs incurred in connection with certain claims or proceedings, subject to written undertakings by each such individual to repay all amounts advanced if it is ultimately determined that the individual is not entitled to indemnification. We generally are responsible for similar indemnifications and advancement obligations that companies we acquire had to their officers, directors and sometimes employees and agents at the time of acquisition. We advanced such costs on behalf of several such individuals with respect to pending litigation or investigations during 2015. It is not possible for us to determine the aggregate potential exposure resulting from the obligation to provide this indemnity or to advance such costs.
Visa Indemnification
Our payment services business issues and acquires credit and debit card transactions through Visa U.S.A. Inc. card association or its affiliates (Visa). For additional information on our Visa indemnification and the related interchange litigation see Note 21 Legal Proceedings and Note 22 Commitments and Guarantees in our 2014 Form 10-K.
Recourse and Repurchase Obligations
As discussed in Note 2 Loan Sale and Servicing Activities and Variable Interest Entities, PNC has sold commercial mortgage, residential mortgage and home equity loans/lines of credit directly or indirectly through securitization and loan sale transactions in which we have continuing involvement. One form of continuing involvement includes certain recourse and loan repurchase obligations associated with the transferred assets.
Commercial Mortgage Loan Recourse Obligations
We originate and service certain multi-family commercial mortgage loans which are sold to FNMA under FNMA's Delegated Underwriting and Servicing (DUS) program. We participated in a similar program with the FHLMC.
Under these programs, we generally assume up to a one-third pari passu risk of loss on unpaid principal balances through a loss share arrangement. At September 30, 2015 and December 31, 2014, the unpaid principal balance outstanding
of loans sold as a participant in these programs was $13.0 billion and $12.3 billion, respectively. The potential maximum exposure under the loss share arrangements was $3.9 billion at September 30, 2015 and $3.7 billion at December 31, 2014.
If payment is required under these programs, we would not have a contractual interest in the collateral underlying the mortgage loans on which losses occurred, although the value of the collateral is taken into account in determining our share of such losses. Our exposure and activity associated with these recourse obligations are reported in the Corporate & Institutional Banking segment.
We maintain a reserve for estimated losses based upon our exposure. The reserve for losses under these programs totaled $38 million and $36 million at September 30, 2015 and September 30, 2014, respectively, and was included in Other liabilities on our Consolidated Balance Sheet. An analysis of the changes in this liability during 2015 and 2014 follows:
Table 111: Analysis of Commercial Mortgage Recourse Obligations
| In millions | 2015 | 2014 | ||||||
January 1 | $ | 35 | $ | 33 | ||||
Reserve adjustments, net | 3 | 3 | ||||||
September 30 | $ | 38 | $ | 36 | ||||
Residential Mortgage Loan and Home Equity Loan/ Line of Credit Repurchase Obligations
While residential mortgage loans are sold on a non-recourse basis, we assume certain loan repurchase obligations associated with mortgage loans we have sold to investors. These loan repurchase obligations primarily relate to situations where PNC is alleged to have breached certain origination covenants and representations and warranties made to purchasers of the loans in the respective purchase and sale agreements. Repurchase obligation activity associated with residential mortgages is reported in the Residential Mortgage Banking segment.
PNC's repurchase obligations also include certain brokered home equity loans/lines of credit that were sold to a limited number of private investors in the financial services industry by National City prior to our acquisition of National City. PNC is no longer engaged in the brokered home equity lending business, and our exposure under these loan repurchase obligations is limited to repurchases of loans sold in these transactions. Repurchase activity associated with brokered home equity loans/lines of credit is reported in the Non-Strategic Assets Portfolio segment.
Indemnification and repurchase liabilities are initially recognized when loans are sold to investors and are subsequently evaluated by management. Initial recognition and subsequent adjustments to the indemnification and
124 The PNC Financial Services Group, Inc. – Form 10-Q
repurchase liability for the sold residential mortgage portfolio are recognized in Residential mortgage revenue on the Consolidated Income Statement. Since PNC is no longer engaged in the brokered home equity lending business, only
subsequent adjustments are recognized to the home equity loans/lines indemnification and repurchase liability. These adjustments are recognized in Other noninterest income on the Consolidated Income Statement.
Management's subsequent evaluation of these indemnification and repurchase liabilities is based upon trends in indemnification and repurchase requests, actual loss experience, risks in the underlying serviced loan portfolios, and current economic conditions. As part of its evaluation, management considers estimated loss projections over the life of the subject loan portfolio. At September 30, 2015 and September 30, 2014, the total indemnification and repurchase liability for estimated losses on indemnification and repurchase claims totaled $117 million and $132 million, respectively, and was included in Other liabilities on the Consolidated Balance Sheet. An analysis of the changes in this liability during 2015 and 2014 follows:
Table 112: Analysis of Indemnification and Repurchase Liability for Asserted Claims and Unasserted Claims
| 2015 | 2014 | |||||||||||||||||||||||
| In millions | Residential Mortgages (a) | Home Equity Loans/ Lines (b) | Total | Residential Mortgages (a) | Home Equity Loans/ Lines (b) | Total | ||||||||||||||||||
January 1 | $ | 107 | $ | 29 | $ | 136 | $ | 131 | $ | 22 | $ | 153 | ||||||||||||
Reserve adjustments, net | 4 | (5 | ) | (1 | ) | (4 | ) | 14 | 10 | |||||||||||||||
Losses – loan repurchases and private investor settlements | (16 | ) | (2 | ) | (18 | ) | (19 | ) | (12 | ) | (31 | ) | ||||||||||||
September 30 | $ | 95 | $ | 22 | $ | 117 | $ | 108 | $ | 24 | $ | 132 | ||||||||||||
| (a) | The unpaid principal balance of loans associated with our exposure to repurchase obligations totaled $66.0 billion and $69.0 billion at September 30, 2015 and September 30, 2014, respectively. |
| (b) | Repurchase obligation was associated with sold loan portfolios of $2.2 billion and $2.6 billion at September 30, 2015 and September 30, 2014, respectively. PNC is no longer engaged in the brokered home equity lending business, which was acquired with National City. |
Management believes the indemnification and repurchase liabilities appropriately reflect the estimated probable losses on indemnification and repurchase claims for all loans sold and outstanding as of September 30, 2015. In making these estimates, we consider the losses that we expect to incur over the life of the sold loans. While management seeks to obtain all relevant information in estimating the indemnification and repurchase liability, the estimation process is inherently uncertain and imprecise and, accordingly, it is reasonably possible that future indemnification and repurchase losses could be more or less than our established liability. Factors that could affect our estimate include the volume of valid claims driven by investor strategies and behavior, our ability to successfully negotiate claims with investors, housing prices and other economic conditions. At September 30, 2015, we estimate that it is reasonably possible that we could incur additional losses in excess of our accrued indemnification and repurchase liability of up to approximately $78 million for our portfolio of residential mortgage loans sold. At September 30, 2015, the reasonably possible loss above our accrual for our portfolio of home equity loans/lines of credit sold was not material. This estimate of potential additional losses in excess of our liability is based on assumed higher repurchase claims and lower claim rescissions than our current assumptions.
Resale and Repurchase Agreements
We enter into repurchase and resale agreements where we transfer investment securities to/from a third party with the agreement to repurchase/resell those investment securities at a
future date for a specified price. These agreements are entered into primarily to provide short-term financing for securities inventory positions, acquire securities to cover short positions and accommodate customers' investing and financing needs. Repurchase and resale agreements are treated as collateralized financing transactions for accounting purposes and are generally carried at the amounts at which the securities will be subsequently reacquired or resold, including accrued interest. Our policy is to take possession of securities purchased under agreements to resell. We monitor the market value of securities to be repurchased and resold and additional collateral may be obtained where considered appropriate to protect against credit exposure.
Repurchase and resale agreements are typically entered into with counterparties under industry standard master netting agreements which provide for the right to setoff amounts owed to one another with respect to multiple repurchase and resale agreements under such master netting agreement (referred to as netting arrangements) and liquidate the purchased or borrowed securities in the event of counterparty default. In order for an arrangement to be eligible for netting under GAAP, we must obtain the requisite assurance that the offsetting rights included in the master netting agreement would be legally enforceable in the event of bankruptcy, insolvency, or a similar proceeding of such third party. Enforceability is evidenced by obtaining a legal opinion that supports, with sufficient confidence, the enforceability of the master netting agreement in bankruptcy.
The PNC Financial Services Group, Inc. – Form 10-Q 125
Table 113 shows the amounts owed under resale and repurchase agreements and the securities collateral associated with those agreements where a legal opinion supporting the enforceability of the offsetting rights has been obtained. We do not present resale and repurchase agreements entered into with the same counterparty under a legally enforceable master netting agreement on a net basis on our Consolidated Balance
Sheet or within Table 113. The amounts reported in Table 113 exclude the fair value adjustment on the structured resale agreements of $5 million and $7 million at September 30, 2015 and December 31, 2014, respectively, that we have elected to account for at fair value. Refer to Note 7 Fair Value for additional information regarding the structured resale agreements at fair value.
Refer to Note 11 Financial Derivatives for additional information related to offsetting of financial derivatives.
Table 113: Resale and Repurchase Agreements Offsetting
| In millions | Gross Resale Agreements | Amounts on the | Net Resale | Securities Held Under | Net Amounts (c) | |||||||||||||
Resale Agreements | ||||||||||||||||||
September 30, 2015 | $ | 1,143 | $ | 1,143 | $ | 1,069 | $ | 74 | ||||||||||
December 31, 2014 | $ | 1,646 | $ | 1,646 | $ | 1,569 | $ | 77 | ||||||||||
| In millions | Gross Repurchase Agreements | Amounts on the | Net Repurchase Agreements (d) | Securities Collateral Pledged Under Master Netting Agreements (b) | Net Amounts (e) | |||||||||||||
Repurchase Agreements | ||||||||||||||||||
September 30, 2015 | $ | 2,003 | $ | 2,003 | $ | 1,183 | $ | 820 | ||||||||||
December 31, 2014 | $ | 3,406 | $ | 3,406 | $ | 2,580 | $ | 826 | ||||||||||
| (a) | Represents the resale agreement amount included in Federal funds sold and resale agreements on our Consolidated Balance Sheet and the related accrued interest income in the amount of less than $1 million at September 30, 2015 and $1 million at December 31, 2014, respectively, which is included in Other Assets on the Consolidated Balance Sheet. |
| (b) | Represents the fair value of securities collateral purchased or sold, up to the amount owed under the agreement, for agreements supported by a legally enforceable master netting agreement. |
| (c) | Represents certain long term resale agreements which are fully collateralized but do not have the benefits of a netting opinion and, therefore, might be subject to a stay in insolvency proceedings and therefore are not eligible under ASC 210-20 for netting. |
| (d) | Represents the repurchase agreement amount included in Federal funds purchased and repurchase agreements on our Consolidated Balance Sheet and the related accrued interest expense in the amount of less than $1 million at both September 30, 2015 and December 31, 2014, which is included in Other Liabilities on the Consolidated Balance Sheet. |
| (e) | Represents overnight repurchase agreements entered into with municipalities, pension plans, and certain trusts and insurance companies which are fully collateralized but do not have the benefits of a netting opinion and, therefore, might be subject to a stay in insolvency proceedings and therefore are not eligible under ASC 210-20 for netting. There were no long term repurchase agreements as of September 30, 2015 and December 31, 2014. |
Table 114 summarizes our gross repurchase agreements as of September 30, 2015 by type of collateral pledged. All repurchase agreements have remaining contractual maturities that are classified as overnight or continuous as of September 30, 2015. Overnight repurchase agreements have a one-day maturity while continuous repurchase agreements have no fixed maturity date and are cancellable by either party at any time.
Table 114: Repurchase Agreements By Type of Collateral Pledged
September 30, 2015 in millions | Overnight or Continuous | |||
Gross Repurchase Agreements | ||||
U.S. Treasury and government agency securities | $ | 88 | ||
Residential mortgage-backed agency securities | 1,847 | |||
Commercial mortgage-backed agency securities | 68 | |||
Total | $ | 2,003 | ||
126 The PNC Financial Services Group, Inc. – Form 10-Q
N OTE 17 S EGMENT R EPORTING
We have six reportable business segments:
| • | Retail Banking |
| • | Corporate & Institutional Banking |
| • | Asset Management Group |
| • | Residential Mortgage Banking |
| • | BlackRock |
| • | Non-Strategic Assets Portfolio |
Results of individual businesses are presented based on our internal management reporting practices. There is no comprehensive, authoritative body of guidance for management accounting equivalent to GAAP; therefore, the financial results of our individual businesses are not necessarily comparable with similar information for any other company. We periodically refine our internal methodologies as management reporting practices are enhanced. To the extent practicable, retrospective application of new methodologies is made to prior period reportable business segment results and disclosures to create comparability with the current period.
Financial results are presented, to the extent practicable, as if each business operated on a stand-alone basis. Additionally, we have aggregated the results for corporate support functions within "Other" for financial reporting purposes.
Net interest income in business segment results reflects PNC's internal funds transfer pricing methodology. Assets receive a funding charge and liabilities and capital receive a funding credit based on a transfer pricing methodology that incorporates product repricing characteristics, tenor and other factors. In the first quarter of 2015, enhancements were made to PNC's funds transfer pricing methodology primarily for costs related to the new regulatory short-term liquidity standards. The enhancements incorporate an additional charge assigned to assets, including for unfunded loan commitments. Conversely, a higher transfer pricing credit has been assigned to those deposits that are accorded higher value under Liquidity Coverage Ratio (LCR) rules for liquidity purposes. Please see the Supervision and Regulation section in Item 1 and the Liquidity Risk Management section in Item 7 of our 2014 Form 10-K for more information about the LCR. These adjustments apply to business segment results, primarily favorably impacting Retail Banking and adversely impacting
Corporate & Institutional Banking, prospectively beginning with the first quarter of 2015. Prior periods have not been adjusted due to the impracticability of estimating the impact of the change for prior periods.
A portion of capital is intended to cover unexpected losses and is assigned to our business segments using our risk-based economic capital model, including consideration of the goodwill at those business segments, as well as the diversification of risk among the business segments, ultimately reflecting PNC's portfolio risk adjusted capital allocation.
We have allocated the allowances for loan and lease losses and for unfunded loan commitments and letters of credit based on the loan exposures within each business segment's portfolio. Key reserve assumptions and estimation processes react to and are influenced by observed changes in loan portfolio performance experience, the financial strength of the borrower, and economic conditions. Key reserve assumptions are periodically updated.
Our allocation of the costs incurred by operations and other shared support areas not directly aligned with the businesses is primarily based on the use of services.
Total business segment financial results differ from total consolidated net income. The impact of these differences is reflected in the "Other" category in the business segment tables. "Other" includes residual activities that do not meet the criteria for disclosure as a separate reportable business, such as gains or losses related to BlackRock transactions, integration costs, asset and liability management activities including net securities gains or losses, other-than-temporary impairment of investment securities and certain trading activities, exited businesses, private equity investments, intercompany eliminations, most corporate overhead, tax adjustments that are not allocated to business segments, and differences between business segment performance reporting and financial statement reporting (GAAP), including the presentation of net income attributable to noncontrolling interests as the segments' results exclude their portion of net income attributable to noncontrolling interests. Assets, revenue and earnings attributable to foreign activities were not material in the periods presented for comparative purposes.
The PNC Financial Services Group, Inc. – Form 10-Q 127
Business Segment Products and Services
Retail Banking provides deposit, lending, brokerage, investment management and cash management services to consumer and small business customers within our primary geographic markets. Our customers are serviced through our branch network, ATMs, call centers, online banking and mobile channels. The branch network is located primarily in Pennsylvania, Ohio, New Jersey, Michigan, Illinois, Maryland, Indiana, North Carolina, Florida, Kentucky, Washington, D.C., Delaware, Virginia, Alabama, Missouri, Georgia, Wisconsin and South Carolina.
Corporate & Institutional Banking provides lending, treasury management, and capital markets-related products and services to mid-sized and large corporations, government and not-for-profit entities. Lending products include secured and unsecured loans, letters of credit and equipment leases. Treasury management services include cash and investment management, receivables management, disbursement services, funds transfer services, information reporting and global trade services. Capital markets-related products and services include foreign exchange, derivatives, securities, loan syndications, mergers and acquisitions advisory, equity capital markets advisory and related services. We also provide commercial loan servicing and real estate advisory and technology solutions for the commercial real estate finance industry. Products and services are generally provided within our primary geographic markets, with certain products and services offered nationally and internationally.
Asset Management Group includes personal wealth management for high net worth and ultra high net worth clients and institutional asset management. Wealth management products and services include investment and retirement planning, customized investment management, private banking, tailored credit solutions, and trust management and administration for individuals and their families. Hawthorn provides multi-generational family planning including wealth strategy, investment management, private banking, tax and estate planning guidance, performance reporting and personal administration services to ultra high net worth families. Institutional asset management provides investment management, custody administration and retirement administration services. The business also offers PNC proprietary mutual funds. Institutional clients include corporations, unions, municipalities, non-profits, foundations and endowments, primarily located in our geographic footprint.
Residential Mortgage Banking directly originates first lien residential mortgage loans on a nationwide basis with a significant presence within the retail banking footprint. Mortgage loans represent loans collateralized by one-to-four family residential real estate. These loans are typically underwritten to government agency and/or third-party standards, and either sold, servicing retained, or held on PNC's balance sheet. Loan sales are primarily to secondary mortgage conduits of FNMA, FHLMC, Federal Home Loan Banks and third-party investors, or are securitized and issued under the GNMA program. The mortgage servicing operation performs all functions related to servicing mortgage loans, primarily those in first lien position, for various investors and for loans owned by PNC.
BlackRock is a leading publicly traded investment management firm providing a broad range of investment and risk management services to institutional and retail clients worldwide. Using a diverse platform of active and index investment strategies across asset classes, BlackRock develops investment outcomes and asset allocation solutions for clients. Product offerings include single- and multi-asset class portfolios investing in equities, fixed income, alternatives and money market instruments. BlackRock also offers an investment and risk management technology platform, risk analytics and advisory services and solutions to a broad base of institutional investors.
We hold an equity investment in BlackRock, which is a key component of our diversified revenue strategy. BlackRock is a publicly traded company, and additional information regarding its business is available in its filings with the Securities and Exchange Commission (SEC). At September 30, 2015, our economic interest in BlackRock was 22%.
PNC received cash dividends from BlackRock of $240 million and $214 million during the first nine months of 2015 and 2014, respectively.
Non-Strategic Assets Portfolio includes a consumer portfolio of mainly residential mortgage and brokered home equity loans and lines of credit, and a small commercial/commercial real estate loan and lease portfolio. We obtained a significant portion of these non-strategic assets through acquisitions of other companies.
128 The PNC Financial Services Group, Inc. – Form 10-Q
Table 115: Results Of Businesses
Three months ended September 30 In millions | Retail Banking | Corporate & Institutional Banking | Asset Management Group | Residential Mortgage Banking | BlackRock | Non-Strategic Assets Portfolio | Other | Consolidated | ||||||||||||||||||||||||
2015 | ||||||||||||||||||||||||||||||||
Income Statement | ||||||||||||||||||||||||||||||||
Net interest income | $ | 1,068 | $ | 855 | $ | 71 | $ | 31 | $ | 90 | $ | (53 | ) | $ | 2,062 | |||||||||||||||||
Noninterest income | 574 | 476 | 207 | 135 | $ | 181 | 16 | 124 | 1,713 | |||||||||||||||||||||||
Total revenue | 1,642 | 1,331 | 278 | 166 | 181 | 106 | 71 | 3,775 | ||||||||||||||||||||||||
Provision for credit losses (benefit) | 57 | 46 | (2 | ) | 2 | (25 | ) | 3 | 81 | |||||||||||||||||||||||
Depreciation and amortization | 42 | 36 | 10 | 4 | 109 | 201 | ||||||||||||||||||||||||||
Other noninterest expense | 1,148 | 497 | 201 | 167 | 23 | 115 | 2,151 | |||||||||||||||||||||||||
Income (loss) before income taxes and noncontrolling interests | 395 | 752 | 69 | (7 | ) | 181 | 108 | (156 | ) | 1,342 | ||||||||||||||||||||||
Income taxes (benefit) | 144 | 250 | 25 | (3 | ) | 42 | 40 | (229 | ) | 269 | ||||||||||||||||||||||
Net income (loss) | $ | 251 | $ | 502 | $ | 44 | $ | (4 | ) | $ | 139 | $ | 68 | $ | 73 | $ | 1,073 | |||||||||||||||
Inter-segment revenue | $ | 7 | $ | 2 | $ | 5 | $ | 3 | $ | (2 | ) | $ | (15 | ) | ||||||||||||||||||
Average Assets (a) | $ | 72,916 | $ | 131,613 | $ | 7,902 | $ | 6,513 | $ | 6,813 | $ | 6,460 | $ | 126,370 | $ | 358,587 | ||||||||||||||||
2014 | ||||||||||||||||||||||||||||||||
Income Statement | ||||||||||||||||||||||||||||||||
Net interest income | $ | 983 | $ | 890 | $ | 72 | $ | 38 | $ | 146 | $ | (25 | ) | $ | 2,104 | |||||||||||||||||
Noninterest income | 536 | 464 | 205 | 147 | $ | 196 | 6 | 183 | 1,737 | |||||||||||||||||||||||
Total revenue | 1,519 | 1,354 | 277 | 185 | 196 | 152 | 158 | 3,841 | ||||||||||||||||||||||||
Provision for credit losses (benefit) | 74 | (4 | ) | (4 | ) | (1 | ) | (8 | ) | (2 | ) | 55 | ||||||||||||||||||||
Depreciation and amortization | 43 | 33 | 10 | 3 | 105 | 194 | ||||||||||||||||||||||||||
Other noninterest expense | 1,132 | 495 | 199 | 165 | 30 | 142 | 2,163 | |||||||||||||||||||||||||
Income (loss) before income taxes and noncontrolling interests | 270 | 830 | 72 | 18 | 196 | 130 | (87 | ) | 1,429 | |||||||||||||||||||||||
Income taxes (benefit) | 97 | 281 | 26 | 6 | 50 | 48 | (117 | ) | 391 | |||||||||||||||||||||||
Net income | $ | 173 | $ | 549 | $ | 46 | $ | 12 | $ | 146 | $ | 82 | $ | 30 | $ | 1,038 | ||||||||||||||||
Inter-segment revenue | $ | 2 | $ | 13 | $ | 3 | $ | 13 | $ | 4 | $ | (7 | ) | $ | (28 | ) | ||||||||||||||||
Average Assets (a) | $ | 74,682 | $ | 123,671 | $ | 7,775 | $ | 7,418 | $ | 6,562 | $ | 8,231 | $ | 101,106 | $ | 329,445 | ||||||||||||||||
(continued on following page)
The PNC Financial Services Group, Inc. – Form 10-Q 129
(continued from previous page)
Nine months ended September 30 In millions | Retail Banking | Corporate & Institutional Banking | Asset Management Group | Residential Mortgage Banking | BlackRock | Non-Strategic Assets Portfolio | Other | Consolidated | ||||||||||||||||||||||||
2015 | ||||||||||||||||||||||||||||||||
Income Statement | ||||||||||||||||||||||||||||||||
Net interest income | $ | 3,150 | $ | 2,515 | $ | 215 | $ | 91 | $ | 302 | $ | (87 | ) | $ | 6,186 | |||||||||||||||||
Noninterest income | 1,652 | 1,397 | 658 | 488 | $ | 532 | 34 | 425 | 5,186 | |||||||||||||||||||||||
Total revenue | 4,802 | 3,912 | 873 | 579 | 532 | 336 | 338 | 11,372 | ||||||||||||||||||||||||
Provision for credit losses (benefit) | 151 | 83 | 11 | 2 | (61 | ) | (5 | ) | 181 | |||||||||||||||||||||||
Depreciation and amortization | 127 | 109 | 33 | 11 | 315 | 595 | ||||||||||||||||||||||||||
Other noninterest expense | 3,431 | 1,485 | 603 | 499 | 73 | 381 | 6,472 | |||||||||||||||||||||||||
Income (loss) before income taxes and noncontrolling interests | 1,093 | 2,235 | 226 | 67 | 532 | 324 | (353 | ) | 4,124 | |||||||||||||||||||||||
Income taxes (benefit) | 399 | 743 | 83 | 24 | 125 | 119 | (490 | ) | 1,003 | |||||||||||||||||||||||
Net income | $ | 694 | $ | 1,492 | $ | 143 | $ | 43 | $ | 407 | $ | 205 | $ | 137 | $ | 3,121 | ||||||||||||||||
Inter-segment revenue | $ | 1 | $ | 20 | $ | 7 | $ | 14 | $ | 11 | $ | (6 | ) | $ | (47 | ) | ||||||||||||||||
Average Assets (a) | $ | 73,430 | $ | 131,678 | $ | 7,922 | $ | 6,962 | $ | 6,813 | $ | 6,880 | $ | 119,448 | $ | 353,133 | ||||||||||||||||
2014 | ||||||||||||||||||||||||||||||||
Income Statement | ||||||||||||||||||||||||||||||||
Net interest income | $ | 2,936 | $ | 2,681 | $ | 215 | $ | 115 | $ | 425 | $ | 56 | $ | 6,428 | ||||||||||||||||||
Noninterest income | 1,591 | 1,255 | 611 | 503 | $ | 528 | 22 | 490 | 5,000 | |||||||||||||||||||||||
Total revenue | 4,527 | 3,936 | 826 | 618 | 528 | 447 | 546 | 11,428 | ||||||||||||||||||||||||
Provision for credit losses (benefit) | 223 | 86 | 2 | (1 | ) | (99 | ) | 10 | 221 | |||||||||||||||||||||||
Depreciation and amortization | 131 | 96 | 31 | 9 | 293 | 560 | ||||||||||||||||||||||||||
Other noninterest expense | 3,299 | 1,424 | 579 | 541 | 86 | 460 | 6,389 | |||||||||||||||||||||||||
Income (loss) before income taxes and noncontrolling interests | 874 | 2,330 | 214 | 69 | 528 | 460 | (217 | ) | 4,258 | |||||||||||||||||||||||
Income taxes (benefit) | 318 | 788 | 78 | 25 | 129 | 169 | (399 | ) | 1,108 | |||||||||||||||||||||||
Net income | $ | 556 | $ | 1,542 | $ | 136 | $ | 44 | $ | 399 | $ | 291 | $ | 182 | $ | 3,150 | ||||||||||||||||
Inter-segment revenue | $ | 4 | $ | 18 | $ | 9 | $ | 25 | $ | 12 | $ | (15 | ) | $ | (53 | ) | ||||||||||||||||
Average Assets (a) | $ | 75,264 | $ | 121,232 | $ | 7,687 | $ | 7,889 | $ | 6,562 | $ | 8,563 | $ | 96,681 | $ | 323,878 | ||||||||||||||||
| (a) | Period-end balances for BlackRock. |
130 The PNC Financial Services Group, Inc. – Form 10-Q
N OTE 18 S UBSEQUENT E VENTS
On November 3, 2015, PNC Bank issued:
| • | $1.0 billion of senior notes with a maturity date of November 5, 2018. Interest is payable semi-annually at a fixed rate of 1.800% on May 5 and November 5 of each year, beginning on May 5, 2016, and |
| • | $750 million of senior notes with a maturity date of November 5, 2020. Interest is payable semi-annually at a fixed rate of 2.450% on May 5 and November 5 of each year, beginning on May 5, 2016. |
The PNC Financial Services Group, Inc. – Form 10-Q 131
STATISTICAL INFORMATION (UNAUDITED)
The PNC Financial Services Group, Inc.
Average Consolidated Balance Sheet And Net Interest Analysis (a) (b) (c)
| Nine months ended September 30 | ||||||||||||||||||||||||
| 2015 | 2014 | |||||||||||||||||||||||
Taxable-equivalent basis Dollars in millions | Average Balances | Interest Income/ Expense | Average Yields/ Rates | Average Balances | Interest Income/ Expense | Average Yields/ Rates | ||||||||||||||||||
Assets | ||||||||||||||||||||||||
Interest-earning assets: | ||||||||||||||||||||||||
Investment securities | ||||||||||||||||||||||||
Securities available for sale | ||||||||||||||||||||||||
Residential mortgage-backed | ||||||||||||||||||||||||
Agency | $ | 20,560 | $ | 388 | 2.52 | % | $ | 19,344 | $ | 382 | 2.63 | % | ||||||||||||
Non-agency | 4,471 | 157 | 4.68 | 5,199 | 192 | 4.92 | ||||||||||||||||||
Commercial mortgage-backed | 6,258 | 147 | 3.14 | 5,339 | 143 | 3.56 | ||||||||||||||||||
Asset-backed | 5,219 | 83 | 2.12 | 5,399 | 78 | 1.92 | ||||||||||||||||||
U.S. Treasury and government agencies | 5,640 | 54 | 1.26 | 4,734 | 41 | 1.16 | ||||||||||||||||||
State and municipal | 1,979 | 70 | 4.68 | 2,220 | 73 | 4.40 | ||||||||||||||||||
Other debt | 1,803 | 40 | 2.99 | 2,096 | 38 | 2.39 | ||||||||||||||||||
Corporate stocks and other | 471 | 1 | .16 | 392 | .10 | |||||||||||||||||||
Total securities available for sale | 46,401 | 940 | 2.70 | 44,723 | 947 | 2.82 | ||||||||||||||||||
Securities held to maturity | ||||||||||||||||||||||||
Residential mortgage-backed | 7,865 | 181 | 3.07 | 5,903 | 155 | 3.49 | ||||||||||||||||||
Commercial mortgage-backed | 2,009 | 58 | 3.82 | 2,584 | 76 | 3.93 | ||||||||||||||||||
Asset-backed | 744 | 9 | 1.54 | 956 | 11 | 1.60 | ||||||||||||||||||
U.S. Treasury and government agencies | 252 | 7 | 3.80 | 242 | 7 | 3.80 | ||||||||||||||||||
State and municipal | 2,000 | 82 | 5.50 | 1,618 | 67 | 5.50 | ||||||||||||||||||
Other | 307 | 7 | 3.11 | 331 | 7 | 2.91 | ||||||||||||||||||
Total securities held to maturity | 13,177 | 344 | 3.49 | 11,634 | 323 | 3.70 | ||||||||||||||||||
Total investment securities | 59,578 | 1,284 | 2.87 | 56,357 | 1,270 | 3.00 | ||||||||||||||||||
Loans | ||||||||||||||||||||||||
Commercial | 98,053 | 2,230 | 3.00 | 91,321 | 2,286 | 3.30 | ||||||||||||||||||
Commercial real estate | 24,659 | 659 | 3.52 | 22,468 | 689 | 4.04 | ||||||||||||||||||
Equipment lease financing | 7,593 | 196 | 3.45 | 7,548 | 202 | 3.58 | ||||||||||||||||||
Consumer | 60,426 | 1,887 | 4.17 | 62,636 | 1,965 | 4.19 | ||||||||||||||||||
Residential real estate | 14,391 | 523 | 4.85 | 14,586 | 546 | 5.00 | ||||||||||||||||||
Total loans | 205,122 | 5,495 | 3.55 | 198,559 | 5,688 | 3.80 | ||||||||||||||||||
Interest-earning deposits with banks | 33,380 | 63 | .25 | 16,341 | 29 | .24 | ||||||||||||||||||
Loans held for sale | 2,128 | 68 | 4.25 | 2,095 | 73 | 4.65 | ||||||||||||||||||
Federal funds sold and resale agreements | 1,737 | 4 | .25 | 1,336 | 4 | .39 | ||||||||||||||||||
Other | 5,183 | 199 | 5.13 | 5,045 | 170 | 4.49 | ||||||||||||||||||
Total interest-earning assets/interest income | 307,128 | 7,113 | 3.08 | 279,733 | 7,234 | 3.43 | ||||||||||||||||||
Noninterest-earning assets: | ||||||||||||||||||||||||
Allowance for loan and lease losses | (3,297 | ) | (3,515 | ) | ||||||||||||||||||||
Cash and due from banks | 3,969 | 3,867 | ||||||||||||||||||||||
Other | 45,333 | 43,793 | ||||||||||||||||||||||
Total assets | $ | 353,133 | $ | 323,878 | ||||||||||||||||||||
Liabilities and Equity | ||||||||||||||||||||||||
Interest-bearing liabilities: | ||||||||||||||||||||||||
Interest-bearing deposits | ||||||||||||||||||||||||
Money market | $ | 82,151 | 163 | .27 | $ | 74,777 | 100 | .18 | ||||||||||||||||
Demand | 46,269 | 19 | .05 | 43,023 | 16 | .05 | ||||||||||||||||||
Savings | 13,663 | 17 | .17 | 11,848 | 9 | .10 | ||||||||||||||||||
Retail certificates of deposit | 18,422 | 95 | .69 | 19,951 | 111 | .74 | ||||||||||||||||||
Time deposits in foreign offices and other time | 2,285 | 3 | .18 | 2,158 | 3 | .18 | ||||||||||||||||||
Total interest-bearing deposits | 162,790 | 297 | .24 | 151,757 | 239 | .21 | ||||||||||||||||||
Borrowed funds | ||||||||||||||||||||||||
Federal funds purchased and repurchase agreements | 2,708 | 3 | .13 | 3,634 | 2 | .09 | ||||||||||||||||||
Federal Home Loan Bank borrowings | 21,556 | 76 | .47 | 14,215 | 53 | .49 | ||||||||||||||||||
Bank notes and senior debt | 17,087 | 165 | 1.27 | 13,682 | 149 | 1.44 | ||||||||||||||||||
Subordinated debt | 8,862 | 179 | 2.69 | 8,475 | 161 | 2.53 | ||||||||||||||||||
Commercial paper | 3,486 | 9 | .35 | 4,903 | 11 | .29 | ||||||||||||||||||
Other | 3,319 | 50 | 1.99 | 2,711 | 51 | 2.48 | ||||||||||||||||||
Total borrowed funds | 57,018 | 482 | 1.12 | 47,620 | 427 | 1.19 | ||||||||||||||||||
Total interest-bearing liabilities/interest expense | 219,808 | 779 | .47 | 199,377 | 666 | .44 | ||||||||||||||||||
Noninterest-bearing liabilities and equity: | ||||||||||||||||||||||||
Noninterest-bearing deposits | 75,359 | 68,976 | ||||||||||||||||||||||
Allowance for unfunded loan commitments and letters of credit | 246 | 234 | ||||||||||||||||||||||
Accrued expenses and other liabilities | 11,845 | 10,155 | ||||||||||||||||||||||
Equity | 45,875 | 45,136 | ||||||||||||||||||||||
Total liabilities and equity | $ | 353,133 | $ | 323,878 | ||||||||||||||||||||
Interest rate spread | 2.61 | 2.99 | ||||||||||||||||||||||
Impact of noninterest-bearing sources | .13 | .13 | ||||||||||||||||||||||
Net interest income/margin | $ | 6,334 | 2.74 | % | $ | 6,568 | 3.12 | % | ||||||||||||||||
| (a) | Nonaccrual loans are included in loans, net of unearned income. The impact of financial derivatives used in interest rate risk management is included in the interest income/expense and average yields/rates of the related assets and liabilities. Basis adjustments related to hedged items are included in noninterest-earning assets and noninterest-bearing liabilities. Average balances of securities are based on amortized historical cost (excluding adjustments to fair value, which are included in other assets). Average balances for certain loans and borrowed funds accounted for at fair value, with changes in fair value recorded in trading noninterest income, are included in noninterest-earning assets and noninterest-bearing liabilities. |
132 The PNC Financial Services Group, Inc. – Form 10-Q
| Third Quarter 2015 | Second Quarter 2015 | Third Quarter 2014 | ||||||||||||||||||||||||||||||||
Average Balances | Interest Income/ Expense | Average Yields/ Rates | Average Balances | Interest Income/ Expense | Average Yields/ Rates | Average Balances | Interest Income/ Expense | Average Yields/ Rates | ||||||||||||||||||||||||||
| $21,813 | $ | 134 | 2.47 | % | $ | 20,550 | $ | 125 | 2.43 | % | $ | 18,134 | $ | 120 | 2.64 | % | ||||||||||||||||||
| 4,279 | 52 | 4.83 | 4,480 | 52 | 4.70 | 5,021 | 58 | 4.64 | ||||||||||||||||||||||||||
| 6,228 | 49 | 3.20 | 6,286 | 48 | 3.03 | 5,147 | 47 | 3.61 | ||||||||||||||||||||||||||
| 5,287 | 28 | 2.15 | 5,228 | 28 | 2.12 | 5,207 | 26 | 2.01 | ||||||||||||||||||||||||||
| 6,558 | 23 | 1.36 | 5,204 | 15 | 1.12 | 5,142 | 13 | 1.01 | ||||||||||||||||||||||||||
| 1,995 | 25 | 4.83 | 1,973 | 23 | 4.76 | 1,913 | 19 | 3.98 | ||||||||||||||||||||||||||
| 1,837 | 11 | 2.44 | 1,796 | 18 | 4.01 | 1,763 | 11 | 2.41 | ||||||||||||||||||||||||||
| 542 | 1 | .26 | 414 | .10 | 404 | .10 | ||||||||||||||||||||||||||||
| 48,539 | 323 | 2.66 | 45,931 | 309 | 2.69 | 42,731 | 294 | 2.75 | ||||||||||||||||||||||||||
| 8,352 | 63 | 3.05 | 8,196 | 61 | 2.95 | 5,778 | 49 | 3.35 | ||||||||||||||||||||||||||
| 1,927 | 18 | 3.65 | 2,005 | 18 | 3.63 | 2,409 | 24 | 3.99 | ||||||||||||||||||||||||||
| 733 | 4 | 1.57 | 743 | 2 | 1.53 | 874 | 3 | 1.75 | ||||||||||||||||||||||||||
| 254 | 2 | 3.82 | 252 | 3 | 3.81 | 245 | 2 | 3.81 | ||||||||||||||||||||||||||
| 1,979 | 27 | 5.50 | 2,004 | 27 | 5.49 | 2,058 | 29 | 5.50 | ||||||||||||||||||||||||||
| 289 | 2 | 3.37 | 311 | 3 | 3.12 | 325 | 2 | 2.84 | ||||||||||||||||||||||||||
| 13,534 | 116 | 3.43 | 13,511 | 114 | 3.37 | 11,689 | 109 | 3.73 | ||||||||||||||||||||||||||
| 62,073 | 439 | 2.83 | 59,442 | 423 | 2.85 | 54,420 | 403 | 2.96 | ||||||||||||||||||||||||||
| 97,926 | 756 | 3.02 | 98,364 | 746 | 3.00 | 92,547 | 751 | 3.17 | ||||||||||||||||||||||||||
| 25,228 | 216 | 3.35 | 24,812 | 215 | 3.44 | 22,961 | 229 | 3.90 | ||||||||||||||||||||||||||
| 7,683 | 66 | 3.42 | 7,556 | 65 | 3.45 | 7,610 | 66 | 3.48 | ||||||||||||||||||||||||||
| 59,584 | 628 | 4.18 | 60,240 | 621 | 4.13 | 62,351 | 654 | 4.16 | ||||||||||||||||||||||||||
| 14,406 | 171 | 4.76 | 14,416 | 177 | 4.91 | 14,359 | 180 | 5.03 | ||||||||||||||||||||||||||
| 204,827 | 1,837 | 3.54 | 205,388 | 1,824 | 3.54 | 199,828 | 1,880 | 3.71 | ||||||||||||||||||||||||||
| 37,289 | 24 | .25 | 32,368 | 20 | .25 | 22,108 | 12 | .23 | ||||||||||||||||||||||||||
| 2,048 | 22 | 4.23 | 2,092 | 23 | 4.33 | 2,272 | 26 | 4.48 | ||||||||||||||||||||||||||
| 1,598 | 2 | .33 | 1,959 | 1 | .22 | 1,409 | 2 | .38 | ||||||||||||||||||||||||||
| 5,033 | 67 | 5.33 | 5,470 | 63 | 4.65 | 4,914 | 52 | 4.24 | ||||||||||||||||||||||||||
| 312,868 | 2,391 | 3.02 | 306,719 | 2,354 | 3.06 | 284,951 | 2,375 | 3.30 | ||||||||||||||||||||||||||
| (3,265) | (3,309 | ) | (3,445 | ) | ||||||||||||||||||||||||||||||
| 3,890 | 3,954 | 3,934 | ||||||||||||||||||||||||||||||||
| 45,094 | 45,276 | 44,005 | ||||||||||||||||||||||||||||||||
| $358,587 | $ | 352,640 | $ | 329,445 | ||||||||||||||||||||||||||||||
| $84,554 | 61 | .29 | $ | 81,857 | 55 | .27 | $ | 76,014 | 35 | .18 | ||||||||||||||||||||||||
| 46,390 | 7 | .06 | 46,281 | 5 | .05 | 43,112 | 6 | .05 | ||||||||||||||||||||||||||
| 14,150 | 6 | .18 | 13,775 | 6 | .17 | 12,152 | 3 | .12 | ||||||||||||||||||||||||||
| 18,392 | 32 | .68 | 18,334 | 31 | .68 | 19,317 | 36 | .73 | ||||||||||||||||||||||||||
| 2,361 | 1 | .17 | 2,300 | 1 | .16 | 2,235 | 1 | .18 | ||||||||||||||||||||||||||
| 165,847 | 107 | .26 | 162,547 | 98 | .24 | 152,830 | 81 | .21 | ||||||||||||||||||||||||||
| 2,298 | 1 | .14 | 2,718 | 1 | .14 | 3,319 | .08 | |||||||||||||||||||||||||||
| 21,882 | 27 | .49 | 22,001 | 25 | .46 | 15,328 | 19 | .48 | ||||||||||||||||||||||||||
| 19,455 | 63 | 1.27 | 16,408 | 50 | 1.19 | 14,221 | 48 | 1.33 | ||||||||||||||||||||||||||
| 8,882 | 63 | 2.81 | 8,861 | 58 | 2.61 | 8,804 | 53 | 2.40 | ||||||||||||||||||||||||||
| 1,867 | 2 | .38 | 3,640 | 3 | .35 | 4,863 | 4 | .30 | ||||||||||||||||||||||||||
| 3,147 | 16 | 2.03 | 3,537 | 18 | 1.95 | 2,801 | 19 | 2.62 | ||||||||||||||||||||||||||
| 57,531 | 172 | 1.18 | 57,165 | 155 | 1.07 | 49,336 | 143 | 1.14 | ||||||||||||||||||||||||||
| 223,378 | 279 | .49 | 219,712 | 253 | .46 | 202,166 | 224 | .44 | ||||||||||||||||||||||||||
| 77,553 | 75,299 | 70,993 | ||||||||||||||||||||||||||||||||
| 246 | 234 | 232 | ||||||||||||||||||||||||||||||||
| 11,667 | 11,540 | 10,307 | ||||||||||||||||||||||||||||||||
| 45,743 | 45,855 | 45,747 | ||||||||||||||||||||||||||||||||
| $358,587 | $ | 352,640 | $ | 329,445 | ||||||||||||||||||||||||||||||
| 2.53 | 2.60 | 2.86 | ||||||||||||||||||||||||||||||||
| .14 | .13 | .12 | ||||||||||||||||||||||||||||||||
| $ | 2,112 | 2.67 | % | $ | 2,101 | 2.73 | % | $ | 2,151 | 2.98 | % | |||||||||||||||||||||||
| (b) | Loan fees for the nine months ended September 30, 2015 and September 30, 2014 were $76 million and $125 million, respectively. Loan fees for the three months ended September 30, 2015, June 30, 2015 and September 30, 2014 were $26 million, $23 million and $33 million, respectively. |
| (c) | Interest income includes the effects of taxable-equivalent adjustments using a statutory federal income tax rate of 35% to increase tax-exempt interest income to a taxable-equivalent basis. The taxable-equivalent adjustments to interest income for the nine months ended September 30, 2015 and September 30, 2014 were $148 million and $140 million, respectively. The taxable-equivalent adjustments to interest income for the three months ended September 30, 2015, June 30, 2015 and September 30, 2014 were $50 million, $49 million and $47 million, respectively. |
The PNC Financial Services Group, Inc. – Form 10-Q 133
Transitional Basel III and Pro forma Fully Phased-In Basel III Common Equity Tier 1 Capital Ratios – 2014 Periods
| 2014 Transitional Basel III | Pro forma Fully Phased-In Basel III (a) (b) | |||||||||||||||
| Dollars in millions | December 31 2014 | September 30 2014 | December 31 2014 | September 30 2014 | ||||||||||||
Common stock, related surplus and retained earnings, net of treasury stock | $ | 40,103 | $ | 39,808 | $ | 40,103 | $ | 39,808 | ||||||||
Less regulatory capital adjustments: | ||||||||||||||||
Goodwill and disallowed intangibles, net of deferred tax liabilities | (8,939 | ) | (8,914 | ) | (9,276 | ) | (9,234 | ) | ||||||||
Basel III total threshold deductions | (212 | ) | (214 | ) | (1,081 | ) | (1,067 | ) | ||||||||
Accumulated other comprehensive income (c) | 40 | 100 | 201 | 501 | ||||||||||||
All other adjustments | (63 | ) | (28 | ) | (121 | ) | (93 | ) | ||||||||
Estimated Basel III Common equity Tier 1 capital | $ | 30,929 | $ | 30,752 | $ | 29,826 | $ | 29,915 | ||||||||
Estimated Basel I risk-weighted assets calculated in accordance with transition rules (d) | $ | 284,018 | $ | 277,348 | N/A | N/A | ||||||||||
Estimated Basel III standardized approach risk-weighted assets (e) | N/A | N/A | $ | 298,786 | $ | 295,665 | ||||||||||
Estimated Basel III advanced approaches risk-weighted assets (f) | N/A | N/A | $ | 285,870 | $ | 289,405 | ||||||||||
Estimated Basel III Common equity Tier 1 capital ratio | 10.9 | % | 11.1 | % | 10.0 | % | 10.1 | % | ||||||||
Risk weight and associated rules utilized | | Basel I (with 2014 transition adjustments) | | Standardized | ||||||||||||
| (a) | PNC utilizes the pro forma fully phased-in Basel III capital ratios to assess its capital position (without the benefit of phase-ins), including comparison to similar estimates made by other financial institutions. |
| (b) | Basel III capital ratios and estimates may be impacted by additional regulatory guidance and, in the case of those ratios calculated using the advanced approaches, the ongoing evolution, validation and regulatory approval of PNC's models integral to the calculation of advanced approaches risk-weighted assets. |
| (c) | Represents net adjustments related to accumulated other comprehensive income for securities currently and previously held as available for sale, as well as pension and other postretirement plans. |
| (d) | Includes credit and market risk-weighted assets. |
| (e) | Basel III standardized approach risk-weighted assets were estimated based on the Basel III standardized approach rules and include credit and market risk-weighted assets. |
| (f) | Basel III advanced approaches risk-weighted assets were estimated based on the Basel III advanced approaches rules, and include credit, market and operational risk-weighted assets. |
134 The PNC Financial Services Group, Inc. – Form 10-Q
PART II – OTHER INFORMATION
ITEM 1. LEGAL PROCEEDINGS
See the information set forth in Note 15 Legal Proceedings in the Notes To Consolidated Financial Statements under Part I, Item 1 of this Report, which is incorporated by reference in response to this item.
ITEM 1A. RISK FACTORS
There are no material changes from any of the risk factors previously disclosed in PNC's 2014 Form 10-K in response to Part I, Item 1A.
The PNC Financial Services Group, Inc. – Form 10-Q 135
ITEM 2. UNREGISTERED SALES OF EQUITY SECURITIES AND USE OF PROCEEDS
Details of our repurchases of PNC common stock during the third quarter of 2015 are included in the following table:
2015 period In thousands, except per share data | Total shares purchased (a) | Average price paid per share | Total shares purchased as part of publicly announced programs (b) | Maximum of
shares | ||||||||||||
July 1 – 31 | 2,794 | $ | 97.53 | 2,777 | 91,355 | |||||||||||
August 1 – 31 | 1,603 | $ | 95.35 | 1,603 | 89,752 | |||||||||||
September 1 – 30 | 1,833 | $ | 89.31 | 1,833 | 87,919 | |||||||||||
Total | 6,230 | $ | 94.55 | |||||||||||||
| (a) | Includes PNC common stock purchased in connection with our various employee benefit plans generally related to forfeitures of unvested restricted stock awards and shares used to cover employee payroll tax withholding requirements. Note 13 Employee Benefit Plans and Note 14 Stock Based Compensation Plans in the Notes To Consolidated Financial Statements in Item 8 of our 2014 Annual Report on Form 10-K include additional information regarding our employee benefit and equity compensation plans that use PNC common stock. |
| (b) | On March 11, 2015, we announced that our Board of Directors had approved the establishment of a new stock repurchase program authorization in the amount of 100 million shares of PNC common stock, effective April 1, 2015. Repurchases are made in open market or privately negotiated transactions and the timing and exact amount of common stock repurchases will depend on a number of factors including, among others, market and general economic conditions, economic capital and regulatory capital considerations, alternative uses of capital, the potential impact on our credit ratings, and contractual and regulatory limitations, including the results of the supervisory assessment of capital adequacy and capital planning processes undertaken by the Federal Reserve as part of the CCAR process. |
Our 2015 capital plan, submitted as part of the CCAR process and accepted by the Federal Reserve, included share repurchase programs of up to $2.875 billion for the five quarter period beginning with the second quarter of 2015. This amount does not include share repurchases in connection with various employee benefit plans referenced in note (a). In the third quarter of 2015, in accordance with PNC's 2015 capital plan and under the share repurchase authorization in effect during that period, we repurchased 6.2 million shares of common stock on the open market, with an average price of $94.54 per share and an aggregate repurchase price of $.6 billion. See the Capital portion of the Consolidated Balance Sheet Review in Part I, Item 2 of this Report for more information on the share repurchase programs under the new share repurchase authorization referenced above for the period April 1, 2015 through June 30, 2016 included in the 2015 capital plan accepted by the Federal Reserve.
ITEM 6. EXHIBITS
The following exhibit index lists Exhibits filed, or in the case of Exhibits 32.1 and 32.2 furnished, with this Quarterly Report on Form 10-Q:
E XHIBIT I NDEX
| 12.1 | Computation of Ratio of Earnings to Fixed Charges | |
| 12.2 | Computation of Ratio of Earnings to Fixed Charges and Preferred Stock Dividends | |
| 31.1 | Certification of Chief Executive Officer pursuant to Section 302 of the Sarbanes-Oxley Act of 2002 | |
| 31.2 | Certification of Chief Financial Officer pursuant to Section 302 of the Sarbanes-Oxley Act of 2002 | |
| 32.1 | Certification by Chief Executive Officer pursuant to 18 U.S.C. Section 1350 | |
| 32.2 | Certification by Chief Financial Officer pursuant to 18 U.S.C. Section 1350 | |
| 101 | Interactive Data File (XBRL) | |
You can obtain copies of these Exhibits electronically at the SEC's website at www.sec.gov or by mail from the Public Reference Section of the SEC at 100 F Street, N.E., Washington, DC 20549 at prescribed rates. The Exhibits are also available as part of this Form 10-Q on PNC's corporate website at www.pnc.com/secfilings. Shareholders and bondholders may also obtain copies of Exhibits, without charge, by contacting Shareholder Relations at 800-843-2206 or via e-mail at [email protected]. The interactive data file (XBRL) exhibit is only available electronically.
136 The PNC Financial Services Group, Inc. – Form 10-Q
CORPORATE INFORMATION
The PNC Financial Services Group, Inc.
Corporate Headquarters
The PNC Financial Services Group, Inc.
One PNC Plaza, 249 Fifth Avenue
Pittsburgh, Pennsylvania 15222-2707
412-762-2000
Stock Listing
The common stock of The PNC Financial Services Group, Inc. is listed on the New York Stock Exchange under the symbol "PNC".
Internet Information
The PNC Financial Services Group, Inc.'s financial reports and information about its products and services are available on the internet at www.pnc.com. We provide information for investors on our corporate website under "About Us – Investor Relations," such as Investor Events, SEC Filings, Financial Information (including Quarterly Earnings, Annual Reports, Proxy Statements and Regulatory Disclosures), Financial Press Releases, Message from the Chairman and Corporate Governance. Under "Investor Relations," we will from time to time post information that we believe may be important or useful to investors. We use our Twitter account, @pncnews, as an additional way of disseminating public information from time to time to investors. We generally post the following on our corporate website shortly before or promptly following its first use or release: financially-related press releases (including earnings releases), various SEC filings, including annual, quarterly and current reports, presentation materials associated with earnings and other investor conference calls or events, and access to live and recorded audio from earnings and other investor conference calls or events. In some cases, we may post the presentation materials for other investor conference calls or events several days prior to the call or event. For earnings and other conference calls or events, we generally include in our posted materials a cautionary statement regarding forward-looking and adjusted information and we provide GAAP reconciliations when we refer to adjusted information and results. Where applicable, we provide GAAP reconciliations for such additional information in materials for that event or in materials for other prior investor presentations or in our annual, quarterly or current reports. When warranted, we will also use our website to expedite public access to time-critical information regarding PNC in advance of distribution of a press release or a filing with the SEC disclosing the same information.
PNC was also required to provide additional public disclosure regarding estimated income, losses and pro forma regulatory capital ratios in March 2015 under a supervisory hypothetical severely adverse economic scenario and a similar public disclosure in July 2015 under a PNC-developed hypothetical severely adverse economic scenario, as well as information concerning its capital stress testing processes, pursuant to the stress testing regulations adopted by the Federal Reserve and the OCC. PNC is also required to make certain additional regulatory capital-related public disclosures about PNC's capital structure, risk exposures, risk assessment processes, risk-weighted assets and overall capital adequacy, including market risk-related disclosures, under the regulatory capital rules adopted by the Federal banking agencies. Under these regulations, PNC may satisfy these requirements through postings on its website, and PNC has done so and expects to continue to do so without also providing disclosure of this information through filings with the SEC. We also post on our website communications to our shareholders, such as the letter to shareholders that accompanies the Form 10-K distributed to shareholders, and may not file them as exhibits to filings with the SEC when not expressly required.
You can also find the SEC reports and corporate governance information described in the sections below in the Investor Relations section of our website.
Where we have included web addresses in this Report, such as our web address and the web address of the SEC, we have included those web addresses as inactive textual references only. Except as specifically incorporated by reference into this Report, information on those websites is not part hereof.
The PNC Financial Services Group, Inc. – Form 10-Q 137
Financial Information
We are subject to the informational requirements of the Securities Exchange Act of 1934 (Exchange Act) and, in accordance with the Exchange Act, we file annual, quarterly and current reports, proxy statements, and other information with the SEC. Our SEC File Number is 001-09718. You can obtain copies of these and other filings, including exhibits, electronically at the SEC's internet website at www.sec.gov or on PNC's corporate internet website at www.pnc.com/secfilings. Shareholders and bond holders may also obtain copies of these filings without charge by contacting Shareholder Services at 800-982-7652 or via the online contact form at www.computershare.com/contactus for copies without exhibits, and by contacting Shareholder Relations at 800-843-2206 or via email at [email protected] for copies of exhibits, including financial statement and schedule exhibits where applicable. The interactive data file (XBRL) exhibit is only available electronically.
Corporate Governance at PNC
Information about our Board of Directors and its committees and corporate governance at PNC is available on PNC's corporate website at www.pnc.com/corporategovernance. Our PNC Code of Business Conduct and Ethics is available on our corporate website at www.pnc.com/corporategovernance. In addition, any future amendments to, or waivers from, a provision of the PNC Code of Business Conduct and Ethics that applies to our directors or executive officers (including our principal executive officer, principal financial officer, and principal accounting officer or controller) will be posted at this internet address.
Shareholders who would like to request printed copies of the PNC Code of Business Conduct and Ethics or our Corporate Governance Guidelines or the charters of our Board's Audit, Nominating and Governance, Personnel and Compensation, or Risk Committees (all of which are posted on the PNC corporate website) may do so by sending their requests to PNC's Corporate Secretary at corporate headquarters at the above address. Copies will be provided without charge to shareholders.
Inquiries
For financial services call 888-PNC-2265.
Individual shareholders should contact Shareholder Services at 800-982-7652.
Analysts and institutional investors should contact William H. Callihan, Senior Vice President, Director of Investor Relations, at 412-762-8257 or via email at [email protected].
News media representatives and others seeking general information should contact Fred Solomon, Senior Vice President, Corporate Communications, at 412-762-4550 or via email at [email protected].
Common Stock Prices/Dividends Declared
The table below sets forth by quarter the range of high and low sale and quarter-end closing prices for The PNC Financial Services Group, Inc. common stock and the cash dividends declared per common share.
| High | Low | Close | Cash Dividends Declared (a) | |||||||||||||
2015 Quarter | ||||||||||||||||
First | $ | 96.71 | $ | 81.84 | $ | 93.24 | $ | .48 | ||||||||
Second | 99.61 | 90.42 | 95.65 | .51 | ||||||||||||
Third | 100.52 | 82.77 | 89.20 | .51 | ||||||||||||
Total | $ | 1.50 | ||||||||||||||
2014 Quarter | ||||||||||||||||
First | $ | 87.80 | $ | 76.06 | $ | 87.00 | $ | .44 | ||||||||
Second | 89.85 | 79.80 | 89.05 | .48 | ||||||||||||
Third | 90.00 | 80.43 | 85.58 | .48 | ||||||||||||
Fourth | 93.45 | 76.69 | 91.23 | .48 | ||||||||||||
Total | $ | 1.88 | ||||||||||||||
| (a) | Our Board approved a fourth quarter 2015 cash dividend of $.51 per common share, which was payable on November 5, 2015. |
138 The PNC Financial Services Group, Inc. – Form 10-Q
Dividend Policy
Holders of PNC common stock are entitled to receive dividends when declared by the Board of Directors out of funds legally available for this purpose. Our Board of Directors may not pay or set apart dividends on the common stock until dividends for all past dividend periods on any series of outstanding preferred stock have been paid or declared and set apart for payment. The Board presently intends to continue the policy of paying quarterly cash dividends. The amount of any future dividends will depend on economic and market conditions, our financial condition and operating results, and other factors, including contractual restrictions and applicable government regulations and policies (such as those relating to the ability of bank and non-bank subsidiaries to pay dividends to the parent company and regulatory capital limitations). The amount of our dividend is also currently subject to the results of the supervisory assessment of capital adequacy and capital planning processes undertaken by the Federal Reserve as part of the 2015 Comprehensive Capital Analysis and Review (CCAR) process as described in the Executive Summary section of the Financial Review of this Report and in Supervision and Regulation section in Item 1 of our 2014 Form 10-K.
Dividend Reinvestment And Stock Purchase Plan
The PNC Financial Services Group, Inc. Dividend Reinvestment and Stock Purchase Plan enables holders of our common and preferred Series B stock to conveniently purchase additional shares of common stock. You can obtain a prospectus and enrollment form by contacting Shareholder Services at 800-982-7652.
Stock Transfer Agent And Registrar
Computershare Trust Company, N.A.
250 Royall Street
Canton, MA 02021
800-982-7652
Registered shareholders may contact the above phone number regarding dividends and other shareholder services.
SIGNATURE
Pursuant to the requirements of the Securities Exchange Act of 1934, the registrant has duly caused this report to be signed on November 4, 2015 on its behalf by the undersigned thereunto duly authorized.
The PNC Financial Services Group, Inc.
/s/ Robert Q. Reilly
Robert Q. Reilly
Executive Vice President and Chief Financial Officer
(Principal Financial Officer)
The PNC Financial Services Group, Inc. – Form 10-Q 139