UNITED STATES
SECURITIES AND EXCHANGE COMMISSION
Washington, DC 20549
FORM 10-K
Annual Report Pursuant to Section 13 or 15(d) of the Securities Exchange Act of 1934
For the fiscal year ended December 31, 2015
Commission file number 001-09718
THE PNC FINANCIAL SERVICES GROUP, INC.
(Exact name of registrant as specified in its charter)
Pennsylvania | 25-1435979 | |||||||
| (State or other jurisdiction of incorporation or organization) | (I.R.S. Employer Identification No.) |
The Tower at PNC Plaza
300 Fifth Avenue
Pittsburgh, Pennsylvania 15222-2401
(Address of principal executive offices, including zip code)
Registrant's telephone number, including area code - (412) 762-2000
Securities registered pursuant to Section 12(b) of the Act:
| Title of Each Class | Name of Each Exchange on Which Registered | |||
Common Stock, par value $5.00 | New York Stock Exchange | |||
Depositary Shares Each Representing a 1/4,000 Interest in a Share of Fixed-to-Floating Rate Non-Cumulative Perpetual Preferred Stock, Series P | New York Stock Exchange | |||
Depositary Shares Each Representing a 1/4,000 Interest in a Share of 5.375% Non-Cumulative Perpetual Preferred Stock, Series Q Warrants (expiring December 31, 2018) to purchase Common Stock | New York Stock Exchange
New York Stock Exchange |
Securities registered pursuant to Section 12(g) of the Act:
$1.80 Cumulative Convertible Preferred Stock – Series B, par value $1.00
Indicate by check mark if the registrant is a well-known seasoned issuer, as defined in Rule 405 of the Securities Act. Yes X No
Indicate by check mark if the registrant is not required to file reports pursuant to Section 13 or Section 15(d) of the Act. Yes No X
Indicate by check mark whether the registrant: (1) has filed all reports required to be filed by Section 13 or 15(d) of the Securities Exchange Act of 1934 during the preceding 12 months (or for such shorter period that the registrant was required to file such reports), and (2) has been subject to such filing requirements for the past 90 days. Yes X No
Indicate by check mark whether the registrant has submitted electronically and posted on its corporate Web site, if any, every Interactive Data File required to be submitted and posted pursuant to Rule 405 of Regulation S-T (§232.405 of this chapter) during the preceding 12 months (or for such shorter period that the registrant was required to submit and post such files). Yes X No
Indicate by check mark if the disclosure of delinquent filers pursuant to Item 405 of Regulation S-K is not contained herein, and will not be contained, to the best of registrant's knowledge, in definitive proxy or information statements incorporated by reference in Part III of this Form 10-K or any amendment to this Form 10-K. X
Indicate by check mark whether the registrant is a large accelerated filer, an accelerated filer, a non-accelerated filer, or a smaller reporting company. See the definitions of "large accelerated filer", "accelerated filer" and "smaller reporting company" in Rule 12b-2 of the Exchange Act.
Large accelerated filer X | Accelerated filer | Non-accelerated filer | Smaller reporting company |
Indicate by check mark whether the registrant is a shell company (as defined in Rule 12b-2 of the Act). Yes No X
The aggregate market value of the registrant's outstanding voting common stock held by nonaffiliates on June 30, 2015, determined using the per share closing price on that date on the New York Stock Exchange of $95.65, was approximately $49.2 billion. There is no non-voting common equity of the registrant outstanding.
Number of shares of registrant's common stock outstanding at February 12, 2016: 501,105,185
DOCUMENTS INCORPORATED BY REFERENCE
Portions of the definitive Proxy Statement of The PNC Financial Services Group, Inc. to be filed pursuant to Regulation 14A for the 2016 annual meeting of shareholders (Proxy Statement) are incorporated by reference into Part III of this Form 10-K.
T HE PNC F INANCIAL S ERVICES G ROUP , I NC .
Cross-Reference Index to 2015 Form 10-K
TABLE OF CONTENTS
| Page | ||||||
PART I | ||||||
Item 1 | Business. | 1 | ||||
Item 1A | Risk Factors. | 16 | ||||
Item 1B | Unresolved Staff Comments. | 27 | ||||
Item 2 | Properties. | 27 | ||||
Item 3 | Legal Proceedings. | 27 | ||||
Item 4 | Mine Safety Disclosures. | 27 | ||||
Executive Officers of the Registrant | 27 | |||||
Directors of the Registrant | 29 | |||||
PART II | ||||||
Item 5 | Market for Registrant's Common Equity, Related Stockholder Matters and Issuer Purchases of Equity Securities. | 29 | ||||
| Common Stock Performance Graph | 31 | |||||
Item 6 | Selected Financial Data. | 32 | ||||
Item 7 | Management's Discussion and Analysis of Financial Condition and Results of Operations (MD&A). | 34 | ||||
Executive Summary | 34 | |||||
Consolidated Income Statement Review | 38 | |||||
Consolidated Balance Sheet Review | 40 | |||||
Off-Balance Sheet Arrangements And Variable Interest Entities | 50 | |||||
Fair Value Measurements | 51 | |||||
Business Segments Review | 51 | |||||
Critical Accounting Estimates And Judgments | 62 | |||||
Status Of Qualified Defined Benefit Pension Plan | 66 | |||||
Recourse And Repurchase Obligations | 67 | |||||
Risk Management | 69 | |||||
2014 Versus 2013 | 92 | |||||
Glossary Of Terms | 96 | |||||
Cautionary Statement Regarding Forward-Looking Information | 100 | |||||
Item 7A | Quantitative and Qualitative Disclosures About Market Risk. | 101 | ||||
Item 8 | Financial Statements and Supplementary Data. | 102 | ||||
| Report of Independent Registered Public Accounting Firm | 102 | |||||
| Consolidated Income Statement | 103 | |||||
| Consolidated Statement of Comprehensive Income | 104 | |||||
| Consolidated Balance Sheet | 105 | |||||
| Consolidated Statement Of Changes In Equity | 106 | |||||
| Consolidated Statement Of Cash Flows | 107 | |||||
| Notes To Consolidated Financial Statements | 109 | |||||
Note 1 Accounting Policies | 109 | |||||
Note 2 Loan Sale and Servicing Activities and Variable Interest Entities | 121 | |||||
Note 3 Asset Quality | 126 | |||||
T HE PNC F INANCIAL S ERVICES G ROUP , I NC .
Cross-Reference Index to 2015 Form 10-K (continued)
TABLE OF CONTENTS (Continued)
| Page | ||||||
Item 8 | Financial Statements and Supplementary Data. (continued) | |||||
Note 4 Purchased Loans | 140 | |||||
Note 5 Allowances for Loan and Lease Losses and Unfunded Loan Commitments and Letters of Credit | 141 | |||||
Note 6 Investment Securities | 144 | |||||
Note 7 Fair Value | 149 | |||||
Note 8 Goodwill and Intangible Assets | 166 | |||||
Note 9 Premises, Equipment and Leasehold Improvements | 169 | |||||
Note 10 Time Deposits | 169 | |||||
Note 11 Borrowed Funds | 169 | |||||
Note 12 Employee Benefit Plans | 170 | |||||
Note 13 Stock Based Compensation Plans | 177 | |||||
Note 14 Financial Derivatives | 180 | |||||
Note 15 Earnings Per Share | 188 | |||||
Note 16 Equity | 188 | |||||
Note 17 Other Comprehensive Income | 192 | |||||
Note 18 Income Taxes | 193 | |||||
Note 19 Regulatory Matters | 195 | |||||
Note 20 Legal Proceedings | 196 | |||||
Note 21 Commitments and Guarantees | 205 | |||||
Note 22 Parent Company | 209 | |||||
Note 23 Segment Reporting | 210 | |||||
Note 24 Subsequent Events | 212 | |||||
| Statistical Information (Unaudited) | 213 | |||||
Item 9 | Changes in and Disagreements With Accountants on Accounting and Financial Disclosure. | 222 | ||||
Item 9A | Controls and Procedures. | 222 | ||||
Item 9B | Other Information. | 222 | ||||
PART III | ||||||
Item 10 | Directors, Executive Officers and Corporate Governance. | 222 | ||||
Item 11 | Executive Compensation. | 223 | ||||
Item 12 | Security Ownership of Certain Beneficial Owners and Management and Related Stockholder Matters. | 223 | ||||
Item 13 | Certain Relationships and Related Transactions, and Director Independence. | 223 | ||||
Item 14 | Principal Accounting Fees and Services. | 223 | ||||
PART IV | ||||||
Item 15 | Exhibits, Financial Statement Schedules. | 223 | ||||
SIGNATURES | 224 | |||||
EXHIBIT INDEX | E-1 | |||||
T HE PNC F INANCIAL S ERVICES G ROUP , I NC .
Cross-Reference Index to 2015 Form 10-K (continued)
MD&A TABLE REFERENCE
Table | Description | Page | ||||
1 | Summary Financial Results | 35 | ||||
2 | Summarized Average Balance Sheet | 37 | ||||
3 | Results Of Businesses – Summary | 38 | ||||
4 | Net Interest Income and Net Interest Margin | 38 | ||||
5 | Noninterest Income | 39 | ||||
6 | Summarized Balance Sheet Data | 40 | ||||
7 | Details Of Loans | 41 | ||||
8 | Accretion – Purchased Impaired Loans | 42 | ||||
9 | Purchased Impaired Loans – Accretable Yield | 42 | ||||
10 | Valuation of Purchased Impaired Loans | 42 | ||||
11 | Weighted Average Life of the Purchased Impaired Portfolios | 43 | ||||
12 | Accretable Difference Sensitivity – Total Purchased Impaired Loans | 43 | ||||
13 | Commitments to Extend Credit | 44 | ||||
14 | Investment Securities | 44 | ||||
15 | Weighted-Average Expected Maturity of Mortgage and Other Asset-Backed Debt Securities | 45 | ||||
16 | Loans Held For Sale | 45 | ||||
17 | Details Of Funding Sources | 46 | ||||
18 | Shareholders' Equity | 47 | ||||
19 | Basel III Capital | 48 | ||||
20 | Fair Value Measurements – Summary | 51 | ||||
21 | Retail Banking Table | 52 | ||||
22 | Corporate & Institutional Banking Table | 55 | ||||
23 | Asset Management Group Table | 57 | ||||
24 | Residential Mortgage Banking Table | 59 | ||||
25 | BlackRock Table | 60 | ||||
26 | Non-Strategic Assets Portfolio Table | 61 | ||||
27 | Pension Expense – Sensitivity Analysis | 67 | ||||
28 | Nonperforming Assets By Type | 72 | ||||
29 | Change in Nonperforming Assets | 72 | ||||
30 | OREO and Foreclosed Assets | 73 | ||||
31 | Accruing Loans Past Due | 73 | ||||
32 | Home Equity Lines of Credit – Draw Period End Dates | 75 | ||||
33 | Consumer Real Estate Related Loan Modifications | 76 | ||||
34 | Summary of Troubled Debt Restructurings | 77 | ||||
35 | Loan Charge-Offs And Recoveries | 77 | ||||
36 | Allowance for Loan and Lease Losses | 79 | ||||
37 | PNC Bank Notes Issued During 2015 | 84 | ||||
38 | PNC Bank Senior and Subordinated Debt | 85 | ||||
39 | FHLB Borrowings | 85 | ||||
T HE PNC F INANCIAL S ERVICES G ROUP , I NC .
Cross-Reference Index to 2015 Form 10-K (continued)
MD&A TABLE REFERENCE (Continued)
Table | Description | Page | ||||
40 | Parent Company Senior and Subordinated Debt and Hybrid Capital Instruments | 86 | ||||
41 | Credit Ratings as of December 31, 2015 for PNC and PNC Bank | 86 | ||||
42 | Contractual Obligations | 87 | ||||
43 | Other Commitments | 87 | ||||
44 | Interest Sensitivity Analysis | 88 | ||||
45 | Net Interest Income Sensitivity to Alternative Rate Scenarios (Fourth Quarter 2015) | 88 | ||||
46 | Alternate Interest Rate Scenarios: One Year Forward | 89 | ||||
47 | Enterprise-Wide Gains/Losses Versus Value-at-Risk | 89 | ||||
48 | Equity Investments Summary | 90 | ||||
49 | Financial Derivatives Summary | 91 | ||||
T HE PNC F INANCIAL S ERVICES G ROUP , I NC .
Cross-Reference Index to 2015 Form 10-K (continued)
NOTES TO CONSOLIDATED FINANCIAL STATEMENTS TABLE REFERENCE
Table | Description | Page | ||||
50 | Cash Flows Associated with Loan Sale and Servicing Activities | 122 | ||||
51 | Principal Balance, Delinquent Loans, and Net Charge-offs Related to Serviced Loans For Others | 123 | ||||
52 | Consolidated VIEs – Carrying Value | 123 | ||||
53 | Non-Consolidated VIEs | 125 | ||||
54 | Analysis of Loan Portfolio | 127 | ||||
55 | Nonperforming Assets | 128 | ||||
56 | Commercial Lending Asset Quality Indicators | 130 | ||||
57 | Home Equity and Residential Real Estate Balances | 131 | ||||
58 | Home Equity and Residential Real Estate Asset Quality Indicators – Excluding Purchased Impaired Loans | 131 | ||||
59 | Home Equity and Residential Real Estate Asset Quality Indicators – Purchased Impaired Loans | 133 | ||||
60 | Credit Card and Other Consumer Loan Classes Asset Quality Indicators | 135 | ||||
61 | Summary of Troubled Debt Restructurings | 136 | ||||
62 | Financial Impact and TDRs by Concession Type | 137 | ||||
63 | TDRs that were Modified in the Past Twelve Months which have Subsequently Defaulted | 138 | ||||
64 | Impaired Loans | 139 | ||||
65 | Purchased Impaired Loans – Balances | 140 | ||||
66 | Purchased Impaired Loans – Accretable Yield | 141 | ||||
67 | Rollforward of Allowance for Loan and Lease Losses and Associated Loan Data | 142 | ||||
68 | Rollforward of Allowance for Unfunded Loan Commitments and Letters of Credit | 143 | ||||
69 | Investment Securities Summary | 144 | ||||
70 | Gross Unrealized Loss and Fair Value of Securities Available for Sale | 146 | ||||
71 | Gains (Losses) on Sales of Securities Available for Sale | 147 | ||||
72 | Contractual Maturity of Debt Securities | 148 | ||||
73 | Fair Value of Securities Pledged and Accepted as Collateral | 148 | ||||
74 | Fair Value Measurements – Recurring Basis Summary | 155 | ||||
75 | Reconciliation of Level 3 Assets and Liabilities | 156 | ||||
76 | Fair Value Measurements – Recurring Quantitative Information | 158 | ||||
77 | Fair Value Measurements – Nonrecurring | 161 | ||||
78 | Fair Value Measurements – Nonrecurring Quantitative Information | 161 | ||||
79 | Fair Value Option – Changes in Fair Value | 162 | ||||
80 | Fair Value Option – Fair Value and Principal Balances | 163 | ||||
81 | Additional Fair Value Information Related to Other Financial Instruments | 164 | ||||
82 | Goodwill by Business Segment | 166 | ||||
83 | Commercial Mortgage Servicing Rights Accounted for at Fair Value | 166 | ||||
84 | Commercial Mortgage Servicing Rights Accounted for Under the Amortization Method | 167 | ||||
85 | Residential Mortgage Servicing Rights | 167 | ||||
86 | Commercial Mortgage Loan Servicing Rights – Key Valuation Assumptions | 168 | ||||
87 | Residential Mortgage Loan Servicing Rights – Key Valuation Assumptions | 168 | ||||
88 | Fees from Mortgage Loan Servicing | 168 | ||||
T HE PNC F INANCIAL S ERVICES G ROUP , I NC .
Cross-Reference Index to 2015 Form 10-K (continued)
NOTES TO CONSOLIDATED FINANCIAL STATEMENTS TABLE REFERENCE (Continued)
Table | Description | Page | ||||
89 | Other Intangible Assets | 168 | ||||
90 | Summary of Changes in Other Intangible Assets | 168 | ||||
91 | Amortization Expense on Existing Intangible Assets | 169 | ||||
92 | Premises, Equipment and Leasehold Improvements | 169 | ||||
93 | Depreciation and Amortization Expense | 169 | ||||
94 | Lease Rental Expense | 169 | ||||
95 | FHLB Borrowings, Bank Notes, Senior Debt and Subordinated Debt | 170 | ||||
96 | Reconciliation of Changes in Projected Benefit Obligation and Change in Plan Assets | 171 | ||||
97 | Asset Strategy Allocations | 172 | ||||
98 | Pension Plan Assets – Fair Value Hierarchy | 174 | ||||
99 | Rollforward of Pension Plan Level 3 Assets | 174 | ||||
100 | Estimated Cash Flows | 175 | ||||
101 | Components of Net Periodic Benefit Cost | 175 | ||||
102 | Net Periodic Costs – Assumptions | 176 | ||||
103 | Other Pension Assumptions | 176 | ||||
104 | Effect of One Percent Change in Assumed Health Care Cost | 176 | ||||
105 | Estimated Amortization of Unamortized Actuarial Gains and Losses – 2016 | 176 | ||||
106 | Option Pricing Assumptions | 177 | ||||
107 | Stock Option Rollforward | 178 | ||||
108 | Nonvested Incentive/Performance Unit Awards and Restricted Share/Restricted Share Unit Awards – Rollforward | 179 | ||||
109 | Nonvested Cash-Payable Incentive/Performance Units and Restricted Share Units – Rollforward | 179 | ||||
110 | Employee Stock Purchase Plan – Summary | 179 | ||||
111 | Total Gross Derivatives | 180 | ||||
112 | Derivatives Designated As Hedging Instruments under GAAP | 181 | ||||
113 | Gains (Losses) on Derivatives and Related Hedged Items – Fair Value Hedges | 181 | ||||
114 | Gains (Losses) on Derivatives and Related Cash Flows – Cash Flow Hedges | 182 | ||||
115 | Derivatives Not Designated As Hedging Instruments under GAAP | 183 | ||||
116 | Gains (Losses) on Derivatives Not Designated As Hedging Instruments under GAAP | 185 | ||||
117 | Derivative Assets and Liabilities Offsetting | 186 | ||||
118 | Basic and Diluted Earnings per Common Share | 188 | ||||
119 | Preferred Stock – Authorized, Issued and Outstanding | 188 | ||||
120 | Terms of Outstanding Preferred Stock | 189 | ||||
121 | Summary of Replacement Capital Covenants of Perpetual Trust Securities | 191 | ||||
122 | Summary of Contractual Commitments of Perpetual Trust Securities | 191 | ||||
123 | Other Comprehensive Income | 192 | ||||
124 | Accumulated Other Comprehensive Income (Loss) Components | 193 | ||||
125 | Components of Income Tax Expense | 193 | ||||
126 | Deferred Tax Assets and Liabilities | 193 | ||||
127 | Reconciliation of Statutory and Effective Tax Rates | 194 | ||||
T HE PNC F INANCIAL S ERVICES G ROUP , I NC .
Cross-Reference Index to 2015 Form 10-K (continued)
NOTES TO CONSOLIDATED FINANCIAL STATEMENTS TABLE REFERENCE (Continued)
Table | Description | Page | ||||
128 | Net Operating Loss Carryforwards and Tax Credit Carryforwards | 194 | ||||
129 | Change in Unrecognized Tax Benefits | 194 | ||||
130 | Basel Regulatory Capital | 195 | ||||
131 | Commitments to Extend Credit and Other Commitments | 205 | ||||
132 | Internal Credit Ratings Related to Net Outstanding Standby Letters of Credit | 205 | ||||
133 | Resale and Repurchase Agreements Offsetting | 208 | ||||
134 | Parent Company – Income Statement | 209 | ||||
135 | Parent Company – Balance Sheet | 209 | ||||
136 | Parent Company – Interest Paid and Income Tax Refunds (Payments) | 209 | ||||
137 | Parent Company – Statement of Cash Flows | 210 | ||||
138 | Results Of Businesses | 212 | ||||
PART I
Forward-Looking Statements: From time to time, The PNC Financial Services Group, Inc. (PNC or the Corporation) has made and may continue to make written or oral forward-looking statements regarding our outlook for earnings, revenues, expenses, capital and liquidity levels and ratios, asset levels, asset quality, financial position and other matters regarding or affecting PNC and its future business and operations or the impact of legal, regulatory or supervisory matters on our business operations or performance. This Annual Report on Form 10-K (the Report or Form 10-K) also includes forward-looking statements. With respect to all such forward-looking statements, you should review our Risk Factors discussion in Item 1A, our Risk Management, Critical Accounting Estimates And Judgments, and Cautionary Statement Regarding Forward-Looking Information sections included in Item 7, and Note 20 Legal Proceedings and Note 21 Commitments and Guarantees in the Notes To Consolidated Financial Statements included in Item 8 of this Report. See page 96 for a glossary of certain terms used in this Report.
ITEM 1 – BUSINESS
Business Overview
Headquartered in Pittsburgh, Pennsylvania, we are one of the largest diversified financial services companies in the United States. We have businesses engaged in retail banking, corporate and institutional banking, asset management, and residential mortgage banking, providing many of our products and services nationally, as well as other products and services in our primary geographic markets located in Pennsylvania, Ohio, New Jersey, Michigan, Illinois, Maryland, Indiana, Florida, North Carolina, Kentucky, Washington, D.C., Delaware, Virginia, Alabama, Georgia, Missouri, Wisconsin and South Carolina. We also provide certain products and services internationally. At December 31, 2015, our consolidated total assets, total deposits and total shareholders' equity were $358.5 billion, $249.0 billion and $44.7 billion, respectively.
We were incorporated under the laws of the Commonwealth of Pennsylvania in 1983 with the consolidation of Pittsburgh National Corporation and Provident National Corporation. Since 1983, we have diversified our geographical presence, business mix and product capabilities through internal growth, strategic bank and non-bank acquisitions and equity investments, and the formation of various non-banking subsidiaries.
Review of Business Segments
In addition to the following information relating to our lines of business, we incorporate the information under the captions Business Segment Highlights and Business Segments Review in Item 7 of this Report here by reference. Also, we include the financial and other information by business in Note 23 Segment Reporting in the Notes To Consolidated Financial Statements in Item 8 of this Report here by reference.
Assets, revenue and earnings attributable to foreign activities were not material in the periods presented. We periodically refine our internal methodologies as management reporting practices are enhanced. To the extent significant and practicable, retrospective application of new methodologies is made to prior period reportable business segment results and disclosures to create comparability with the current period.
See Note 23 Segment Reporting in the Notes To Consolidated Financial Statements in Item 8 of this Report for information on enhancements made in the first quarter of 2015 to PNC's internal funds transfer pricing methodology.
Retail Banking provides deposit, lending, brokerage, investment management and cash management services to consumer and small business customers within our primary geographic markets. Our customers are serviced through our branch network, ATMs, call centers, online banking and mobile channels. The branch network is located primarily in Pennsylvania, Ohio, New Jersey, Michigan, Illinois, Maryland, Indiana, Florida, North Carolina, Kentucky, Washington, D.C., Delaware, Virginia, Alabama, Georgia, Missouri, Wisconsin and South Carolina.
Our core strategy is to acquire and retain customers who maintain their primary checking and transaction relationships with PNC. We also seek revenue growth by deepening our share of our customers' financial assets, such as savings and liquidity deposits, loans and investable assets, including retirement assets. A strategic priority for PNC is to redefine the retail banking business in response to changing customer preferences. A key element of this strategy is to expand the use of lower-cost alternative distribution channels while continuing to optimize the traditional branch network. In addition, we have a disciplined process to continually improve the engagement of both our employees and customers, which is a strong indicator of customer growth, retention and relationship expansion.
Corporate & Institutional Banking provides lending, treasury management, and capital markets-related products and services to mid-sized and large corporations, government and not-for-profit entities. Lending products include secured and unsecured loans, letters of credit and equipment leases. Treasury management services include cash and investment management, receivables management, disbursement services, funds transfer services, information reporting and global trade services. Capital markets-related products and services include foreign exchange, derivatives, securities sales and underwriting, loan syndications, mergers and acquisitions advisory, equity capital markets advisory and related services. We also provide commercial loan servicing and technology solutions for the commercial real estate finance industry.
| The PNC Financial Services Group, Inc. – Form 10-K 1 |
Products and services are generally provided within our primary geographic markets, with certain products and services offered nationally and internationally.
Corporate & Institutional Banking's strategy is to be the leading relationship-based provider of traditional banking products and services to its customers through the economic cycles. We aim to expand our market share and drive higher returns by growing and deepening customer relationships by driving solutions-based selling, while maintaining prudent risk and expense management.
Asset Management Group includes personal wealth management for high net worth and ultra high net worth clients and institutional asset management. Wealth management products and services include investment and retirement planning, customized investment management, private banking, tailored credit solutions, and trust management and administration for individuals and their families. Our Hawthorn unit provides multi-generational family planning including wealth strategy, investment management, private banking, tax and estate planning guidance, performance reporting and personal administration services to ultra high net worth families. Institutional asset management provides investment management, custody administration and retirement administration services. The business also offers PNC proprietary mutual funds. Institutional clients include corporations, unions, municipalities, non-profits, foundations and endowments, primarily located in our geographic footprint.
Asset Management Group is focused on being one of the premier bank-held individual and institutional asset managers in each of the markets it serves. The business seeks to deliver high quality banking, trust and investment management services to our high net worth, ultra high net worth and institutional client sectors through a broad array of products and services. Asset Management Group's primary goals are to service our clients, grow the business and deliver solid financial performance with prudent risk and expense management.
Residential Mortgage Banking directly originates first lien residential mortgage loans on a nationwide basis with a significant presence within the retail banking footprint. Mortgage loans represent loans collateralized by one-to-four-family residential real estate. These loans are typically underwritten to government agency and/or third-party standards, and either sold, servicing retained, or held on PNC's balance sheet. Loan sales are primarily to secondary mortgage conduits of Federal National Mortgage Association (FNMA), Federal Home Loan Mortgage Corporation (FHLMC), Federal Home Loan Banks and third-party investors, or are securitized and issued under the Government National Mortgage Association (GNMA) program, as
described in more detail in Note 2 Loan Sale and Servicing Activities and Variable Interest Entities in Item 8 of this Report and included here by reference. The mortgage servicing operation performs all functions related to servicing mortgage loans, primarily those in first lien position, for various investors and for loans owned by PNC.
Residential Mortgage Banking is focused on adding value to the PNC franchise by building stronger customer relationships, providing quality investment loans and mortgage servicing opportunities, and delivering acceptable returns consistent with our desired risk appetite. A strategic priority for PNC is to build a stronger residential mortgage business offering seamless delivery to customers while improving efficiencies. Our national distribution capability provides volume that drives economies of scale, risk dispersion and cost-effective extension of the retail banking footprint for cross-selling opportunities.
BlackRock , in which we hold an equity investment, is a leading publicly traded investment management firm providing a broad range of investment and risk management services to institutional and retail clients worldwide. Using a diverse platform of active and index investment strategies across asset classes, BlackRock develops investment outcomes and asset allocation solutions for clients. Product offerings include single- and multi-asset class portfolios investing in equities, fixed income, alternatives and money market instruments. BlackRock also offers an investment and risk management technology platform, risk analytics and advisory services and solutions to a broad base of institutional investors. Our equity investment in BlackRock provides us with an additional source of noninterest income and increases our overall revenue diversification. BlackRock is a publicly traded company, and additional information regarding its business is available in its filings with the Securities and Exchange Commission (SEC).
Non-Strategic Assets Portfolio includes a consumer portfolio of mainly residential mortgage and brokered home equity loans and lines of credit and a small commercial/commercial real estate loan and lease portfolio. We obtained a significant portion of these non-strategic assets through acquisitions of other companies.
Subsidiaries
Our corporate legal structure at December 31, 2015 consisted of one domestic subsidiary bank, including its subsidiaries, and approximately 70 active non-bank subsidiaries, in addition to various affordable housing investments. Our bank subsidiary is PNC Bank, National Association (PNC Bank), a national bank headquartered in Pittsburgh, Pennsylvania. For additional information on our subsidiaries, see Exhibit 21 to this Report.
| 2 The PNC Financial Services Group, Inc. – Form 10-K |
Statistical Disclosure By Bank Holding Companies
The following statistical information is included on the indicated pages of this Report and is incorporated herein by reference:
| Form 10-K page | ||
Average Consolidated Balance Sheet And Net Interest Analysis | 214-215 | |
Analysis Of Year-To-Year Changes In Net Interest Income | 216 | |
Book Values Of Securities | 44-45 and 144-148 | |
Maturities And Weighted-Average Yield Of Securities | 45 and 148 | |
Loan Types | 41-43, 127-128 and 217 | |
Selected Loan Maturities And Interest Sensitivity | 220 | |
Nonaccrual, Past Due And Restructured Loans And Other Nonperforming Assets | 71-77, 113-116, 126-139 and 218 | |
Potential Problem Loans And Loans Held For Sale | 45-46 and 71-79 | |
Summary Of Loan Loss Experience | 77-79, 141-143 and 219 | |
Allocation Of Allowance For Loan And Lease Losses | 77-79 and 220 | |
Average Amount And Average Rate Paid On Deposits | 214-215 | |
Time Deposits Of $100,000 Or More | 220 | |
Selected Consolidated Financial Data | 32-33 | |
Short-term borrowings – not included as average balances during 2015, 2014, and 2013 were less than 30% of total shareholders' equity at the end of each period. |
Supervision and Regulation
PNC is a bank holding company (BHC) registered under the Bank Holding Company Act of 1956 (BHC Act) and a financial holding company under the Gramm-Leach-Bliley Act (GLB Act).
We are subject to numerous governmental regulations, some of which are highlighted below. See Note 19 Regulatory Matters in the Notes To Consolidated Financial Statements in Item 8 of this Report for additional information regarding our regulatory matters. Applicable laws and regulations restrict our permissible activities and investments, impose conditions and requirements on the products and services we offer and
the manner in which they are offered and sold, and require compliance with protections for loan, deposit, brokerage, fiduciary, investment management and other customers, among other things. They also restrict our ability to repurchase stock or pay dividends, or to receive dividends from our bank subsidiary, and impose capital adequacy and liquidity requirements. The consequences of noncompliance can include substantial monetary and nonmonetary sanctions.
In addition, we are subject to comprehensive supervision and periodic examination by, among other regulatory bodies, the Board of Governors of the Federal Reserve System (Federal Reserve) and the Office of the Comptroller of the Currency (OCC). These examinations consider not only compliance with applicable laws, regulations and supervisory policies of the agency, but also capital levels, asset quality, risk management effectiveness, management ability and performance, earnings, liquidity and various other factors. The results of examination activity by any of our federal bank regulators potentially can result in the imposition of significant limitations on our activities and growth. These regulatory agencies generally have broad discretion to impose restrictions and limitations on the operations of a regulated entity and take enforcement action against a regulated entity where the relevant agency determines, among other things, that such operations fail to comply with applicable law or regulations or are conducted in an unsafe or unsound manner. This supervisory framework, including the examination reports and supervisory ratings (which are not publicly available) of the agencies, could materially impact the conduct, growth and profitability of our operations.
The Consumer Financial Protection Bureau (CFPB) is responsible for examining PNC Bank and its affiliates (including PNC) for compliance with most federal consumer financial protection laws, including the laws relating to fair lending and prohibiting unfair, deceptive or abusive acts or practices in connection with the offer, sale or provision of consumer financial products or services, and for enforcing such laws with respect to PNC Bank and its affiliates. The results of the CFPB's examinations, which are not publicly available, also can result in restrictions or limitations on the operations of a regulated entity as well as enforcement actions against a regulated entity, including the imposition of substantial monetary penalties and nonmonetary requirements.
We also are subject to regulation by the SEC by virtue of our status as a public company and by the SEC and the Commodity Futures Trading Commission (CFTC) due to the nature of some of our businesses. Our banking and securities businesses with operations outside the United States, including those conducted by BlackRock, are also subject to regulation by appropriate authorities in the foreign jurisdictions in which they do business.
As a regulated financial services firm, our relationships and good standing with regulators are of fundamental importance
| The PNC Financial Services Group, Inc. – Form 10-K 3 |
to the operation and growth of our businesses. The Federal Reserve, OCC, CFPB, SEC, CFTC and other domestic and foreign regulators have broad enforcement powers, and certain of the regulators have the power to approve, deny, or refuse to act upon our applications or notices to conduct new activities, acquire or divest businesses, assets or deposits, or reconfigure existing operations.
We anticipate new legislative and regulatory initiatives over the next several years, focused specifically on banking and other financial services in which we are engaged. Legislative and regulatory developments to date, as well as those that come in the future, have had and are likely to continue to have an impact on the conduct of our business. The more detailed description of the significant regulations to which we are subject included in this Report is based on the current regulatory environment and is subject to potentially material change. See also the additional information included as Risk Factors in Item 1A of this Report discussing the impact of financial regulatory reform initiatives, including the Dodd-Frank Wall Street Reform and Consumer Protection Act (Dodd-Frank), and regulations promulgated to implement it, on the regulatory environment for PNC and the financial services industry.
Among other areas that have been receiving a high level of regulatory focus over the last several years are compliance with the Bank Secrecy Act and anti-money laundering laws, the oversight of arrangements with third-party vendors and suppliers, the protection of confidential customer information, capital and liquidity management, the structure and effectiveness of enterprise risk management frameworks, and cyber-security. In addition, there is an increased focus on fair lending and other consumer protection issues.
Additional legislation, changes in rules promulgated by federal financial regulators, other federal and state regulatory authorities and self-regulatory organizations, or changes in the interpretation or enforcement of existing laws and rules, may directly affect the method of operation and profitability of our businesses. The profitability of our businesses could also be affected by rules and regulations that impact the business and financial sectors in general, including changes to the laws governing taxation, antitrust regulation and electronic commerce.
There are numerous rules governing the regulation of financial services institutions and their holding companies. Accordingly, the following discussion is general in nature and does not purport to be complete or to describe all of the laws, regulations and supervisory policies that apply to us. To a substantial extent, the purpose of the regulation and supervision of financial services institutions and their holding companies is not to protect our shareholders and our non-customer creditors, but rather to protect our customers (including depositors) and the financial markets in general.
Dodd-Frank Act
Dodd-Frank, which was signed into law on July 21, 2010, comprehensively reformed the regulation of financial institutions, products and services. Dodd-Frank requires various federal regulatory agencies to implement numerous new rules and regulations. Because federal agencies are granted broad discretion in drafting these rules and regulations, and many implementing rules have not yet been issued, have only been issued in proposed form, or have only recently been finalized, some of the details and the full impact of Dodd-Frank may not be known for months or years. Among other things, Dodd-Frank established the CFPB; provided for new capital standards that eliminate the treatment of trust preferred securities as Tier 1 regulatory capital; required that deposit insurance assessments be calculated based on an insured depository institution's assets rather than its insured deposits; raised the minimum Designated Reserve Ratio (the balance in the Deposit Insurance Fund divided by estimated insured deposits) to 1.35%; established a comprehensive regulatory regime for the derivatives activities of financial institutions; prohibited banking entities, after a transition period and subject to certain exceptions and exemptions, from engaging in proprietary trading, as well as acquiring or retaining ownership interests in, sponsoring, and having certain types of relationships with hedge funds, private equity funds, and other private funds (through provisions commonly referred to as the "Volcker Rule"); placed limitations on the interchange fees charged for debit card transactions; and established new minimum mortgage underwriting standards for residential mortgages.
Financial Stability Oversight Council . Dodd-Frank also established the 10-member inter-agency Financial Stability Oversight Council (FSOC), which is charged with identifying and monitoring systemic risks and strengthening the regulation of financial holding companies and certain non-bank companies deemed to be "systemically important." In extraordinary cases, the FSOC, in conjunction with the Federal Reserve, could order the break-up of financial firms that are deemed to present a grave threat to the financial stability of the United States.
Banking Regulation and Supervision
Enhanced Prudential Requirements . Dodd-Frank requires the Federal Reserve to establish enhanced prudential standards for BHCs with total consolidated assets of $50 billion or more, such as PNC, as well as systemically important non-bank financial companies designated by the FSOC for Federal Reserve supervision. For such BHCs, these enhanced standards must be more stringent than the standards and requirements applicable to BHCs with less than $50 billion in assets, and must increase in stringency based on the Federal Reserve's assessment of a BHC's risk to the financial system. The FSOC may make recommendations to the Federal Reserve concerning the establishment and refinement of these enhanced prudential standards.
| 4 The PNC Financial Services Group, Inc. – Form 10-K |
The Federal Reserve's enhanced prudential standards related to liquidity risk management and overall risk management took effect for PNC on January 1, 2015. These rules, among other things, require that covered BHCs conduct liquidity stress tests at least monthly, maintain a contingency funding plan and sufficient highly liquid assets to meet net stress cash-flow needs (as projected under the company's liquidity stress tests) for 30 days, and establish certain oversight and governance responsibilities for the chief risk officer, the board of directors, and the risk committee of the board of directors of a covered company. These standards also require the Federal Reserve to impose a maximum 15-to-1 debt to equity ratio on a BHC if the FSOC determines that the company poses a grave threat to the financial stability of the United States and that the imposition of such a debt-to-equity requirement would mitigate such risk. The Federal Reserve continues to work towards finalizing the other enhanced prudential standards that it must establish under Dodd-Frank, including counterparty credit exposure limits and early remediation requirements. For additional information see Item 1A Risk Factors of this Report.
Regulatory Capital Requirements, Stress Testing and Capital Planning . PNC and PNC Bank are subject to the regulatory capital requirements established by the Federal Reserve and the OCC, respectively. Under the regulatory capital rules, a banking organization's risk-based capital ratios are calculated by allocating assets and specified off-balance sheet financial instruments into risk-weighted categories (with higher levels of capital being required for the categories perceived as representing greater risk), which are used to determine the amount of a banking organization's total risk-weighted assets. The foundation of the agencies' regulatory capital rules is the international regulatory capital framework developed by the Basel Committee on Banking Supervision (Basel Committee), the international body responsible for developing global regulatory standards for banking organizations for consideration and adoption by national jurisdictions. In July 2013, the U.S. banking agencies adopted rules to implement the new international regulatory capital standards established by the Basel Committee, known as "Basel III", as well as to implement certain provisions of Dodd-Frank. Many provisions are phased-in over a period of years, with the rules generally fully phased-in as of January 1, 2019.
The rules adopted in July 2013 generally have three fundamental parts. The first part, referred to as the Basel III capital rule, among other things, narrows the definition of regulatory capital, requires banking organizations with $15 billion or more in assets (including PNC) to phase-out trust preferred securities from Tier 1 regulatory capital, establishes a new common equity Tier 1 (CET1) capital regulatory requirement for banking organizations, and revises the capital levels at which PNC and PNC Bank would be subject to prompt corrective action. These rules also require that significant common stock investments in unconsolidated financial institutions, as well as mortgage servicing rights and
deferred tax assets, be deducted from CET1 regulatory capital to the extent such items individually exceed 10%, or in the aggregate exceed 15%, of the organization's adjusted Basel III CET1 regulatory capital. Our common stock investment in BlackRock is treated as a significant common stock investment in an unconsolidated financial institution for these purposes. We previously referred to Basel III CET1 capital as Basel III Tier 1 common capital. The Basel III capital rule also significantly limits the extent to which minority interests in consolidated subsidiaries (including minority interests in the form of REIT preferred securities) may be included in regulatory capital. In addition, for banking organizations, like PNC, which are subject to the advanced approaches (described below), the rule includes other comprehensive income related to both available for sale securities and pension and other post-retirement plans as a component of CET1 capital. The Basel III capital rule became effective on January 1, 2014 for PNC and PNC Bank, although many provisions are phased-in over a period of years.
The second part of the rules adopted in July 2013 is referred to as the advanced approaches and materially revises the framework for the risk-weighting of assets under Basel II. The Basel II framework, which was adopted by the Basel Committee in 2004, seeks to provide more risk-sensitive regulatory capital calculations and promote enhanced risk management practices among large, internationally active banking organizations. Advanced approaches risk-weighted assets take account of credit, market and operational risk and rely to a significant extent on internal models. The advanced approaches modifications adopted by the U.S. banking agencies became effective on January 1, 2014, and generally apply to banking organizations (such as PNC and PNC Bank) that have $250 billion or more in total consolidated assets or that have $10 billion or more in on-balance sheet foreign exposure. Prior to fully implementing the advanced approaches to calculate risk-weighted assets, PNC and PNC Bank must successfully complete a "parallel run" qualification phase. PNC and PNC Bank entered this parallel run qualification phase on January 1, 2013. Although the minimum parallel run qualification period is four quarters, the parallel run period for PNC and PNC Bank, now in its fourth year, is consistent with the experience of other U.S. banks that have all had multi-year parallel run periods.
The third major part of the rules adopted in July 2013 is referred to as the standardized approach and materially revises the framework for the risk-weighting of assets under Basel I. The standardized approach for risk-weighted assets takes into account credit and market risk. Under the standardized approach for credit risk, the nominal dollar amounts of assets and credit equivalent amounts of off-balance sheet items are generally multiplied by one of several risk adjustment percentages set forth in the rules and that increase as the perceived credit risk of the relevant asset increases. For certain types of exposures, such as securitization exposures, the standardized approach establishes one or more
| The PNC Financial Services Group, Inc. – Form 10-K 5 |
methodologies that are to be used to calculate the risk-weighted asset amount for the exposure. The standardized approach took effect on January 1, 2015.
The risk-based capital and leverage rules that the federal banking regulators have adopted require the capital-to-assets ratios of banking organizations, including PNC and PNC Bank, to meet certain minimum standards. The Basel III rule generally divides regulatory capital into three components: CET1 capital, additional Tier 1 capital (which, together with CET1 capital, comprises Tier 1 capital) and Tier 2 capital. CET1 capital is generally common stock, retained earnings, qualifying minority interest and, for advanced approaches banking organizations, accumulated other comprehensive income, less the deductions required to be made from CET1 capital. Additional Tier 1 capital generally includes, among other things, perpetual preferred stock and qualifying minority interests, less the deductions required to be made from additional Tier 1. Tier 2 capital generally comprises qualifying subordinated debt, less any required deductions from Tier 2 capital. Total capital is the sum of Tier 1 capital and Tier 2 capital, less the deductions required from total capital.
As a result of the staggered effective dates of the final U.S. capital rules issued in July 2013, as well as the fact that PNC remains in the parallel run qualification phase for the advanced approaches, PNC's regulatory risk-based capital ratios in 2015 were based on the definitions of, and deductions from, capital under Basel III (as such definitions and deductions were phased-in for 2015) and the standardized approach for determining risk-weighted assets. Until PNC has exited parallel run, PNC's regulatory risk-based Basel III ratios will be calculated using the standardized approach for determining risk-weighted assets, and the definitions of, and deductions from, capital under Basel III (as such definitions and deductions are phased-in through 2019). Once PNC exits parallel run, its regulatory risk-based capital ratios will be the lower of the ratios calculated under the standardized approach and the advanced approaches. We refer to the capital ratios calculated using the phased-in Basel III provisions as the Transitional Basel III ratios. The Transitional Basel III regulatory capital ratios of PNC and PNC Bank as of December 31, 2015 exceeded the applicable minimum levels in effect for 2015. For additional information regarding the Transitional Basel III capital ratios of PNC and PNC Bank as of December 31, 2015, as well as the levels needed to be considered "well capitalized", see the Capital portion of the Consolidated Balance Sheet Review section of Item 7 of this Report.
The Basel III capital rule requires that banking organizations maintain a minimum CET1 ratio of 4.5%, a Tier 1 capital ratio of 6.0%, and a total capital ratio of 8.0% to be considered "adequately capitalized." The Basel III capital rule also includes a capital conservation buffer requirement above the minimum risk-based capital ratio requirements that banking organizations must meet in order to avoid limitations on capital distributions (including dividends and repurchases of
any Tier 1 capital instrument, including common and qualifying preferred stock) and certain discretionary incentive compensation payments. The multi-year phase-in of the capital conservation buffer requirement began on January 1, 2016, and, for 2016, banking organizations (including PNC and PNC Bank) are required to maintain a CET1 capital ratio of at least 5.125%, a Tier 1 capital ratio of at least 6.625%, and a total capital ratio of at least 8.625% to avoid limitations on capital distributions and certain discretionary incentive compensation payments. When fully phased-in on January 1, 2019, banking organizations must maintain a CET1 capital ratio of at least 7.0%, a Tier 1 capital ratio of at least 8.5%, and a total capital ratio of at least 10.5% to avoid limitations on capital distributions and certain discretionary incentive compensation payments.
For banking organizations that are subject to the advanced approaches (such as PNC and PNC Bank), these higher capital conservation buffer levels above the regulatory minimums could be supplemented by a countercyclical capital buffer based on U.S. credit exposures of up to an additional 2.5% of risk-weighted assets (once fully phased-in), although this buffer is currently set at zero in the United States. In December 2015, the Federal Reserve issued for public comment a proposed policy statement on the framework and factors the Federal Reserve would use in setting and adjusting the amount of the U.S. countercyclical capital buffer. Under the Basel III rule, covered banking organizations would generally have 12 months after the announcement of any increase in the countercyclical capital buffer to meet the increased buffer requirement amount, unless the Federal Reserve determines to establish an earlier effective date. Under the phase-in schedule for the countercyclical capital buffer, the maximum potential countercyclical capital buffer amount is 0.625% in 2016, 1.25% in 2017, 1.875% in 2018, and 2.5% in 2019 and thereafter. When fully phased-in and if the full buffer amount is implemented, covered banking organizations would be required to maintain a CET1 capital ratio of at least 9.5%, a Tier 1 capital ratio of at least 11%, and a total capital ratio of at least 13% to avoid limitations on capital distributions and certain discretionary incentive compensation payments.
In July 2015, the Federal Reserve adopted final rules to apply an additional risk-based CET1 capital surcharge of between 1.0% and 4.5% (when fully phased-in on January 1, 2019) to U.S. firms identified as globally systemically important banks (GSIBs) using a scoring methodology that is based on five measures of global systemic importance (size, interconnectedness, substitutability, complexity, and cross-jurisdictional activity). Based on the methodology, PNC is not subject to this GSIB surcharge.
In October 2015, the Federal Reserve requested public comment on proposed rules that would require U.S. GSIBs and the U.S. operations of foreign-based GSIBs to meet a new minimum long-term debt requirement and a new minimum
| 6 The PNC Financial Services Group, Inc. – Form 10-K |
total loss-absorbing capacity (TLAC) requirement. Under the proposed rules, once the requirements are fully phased-in, U.S. GSIBs would be required to maintain at a minimum (i) a long-term debt amount of the greater of 6 percent plus its GSIB risk-based surcharge of risk-weighted assets or 4.5 percent of total leverage exposure; and (ii) a TLAC amount of the greater of 18 percent of risk-weighted assets or 9.5 percent of total leverage exposure. As proposed, these requirements would not apply to PNC.
The regulatory capital framework adopted by the federal banking regulators also requires that banking organizations maintain a minimum amount of Tier 1 capital to average consolidated assets, referred to as the leverage ratio. Banking organizations are required to maintain a minimum leverage ratio of Tier 1 capital to total assets of 4.0%. As of December 31, 2015, the leverage ratios of PNC and PNC Bank were above the required minimum level.
Under the Basel III capital rule, banking organizations subject to the advanced approaches (such as PNC and PNC Bank) also will be subject to a new minimum 3.0% supplementary leverage ratio that becomes effective on January 1, 2018. The supplementary leverage ratio is calculated by dividing Tier 1 capital by total leverage exposure and takes into account on balance sheet assets as well as certain off-balance sheet items, including loan commitments and potential future exposure under derivative contracts. BHCs with total consolidated assets of more than $700 billion or assets under custody of more than $10 trillion, as well as the insured depository institution subsidiaries of these BHCs, are subject to a higher supplementary leverage ratio requirement. These higher supplementary leverage requirements do not apply to PNC or PNC Bank.
Failure to meet applicable capital guidelines could subject a banking organization to a variety of enforcement remedies available to the federal bank regulatory agencies, including a limitation on the ability to pay dividends or repurchase shares, the issuance of a capital directive to increase capital and, in severe cases, the termination of deposit insurance by the Federal Deposit Insurance Corporation (FDIC), and the appointment of a conservator or receiver. In some cases, the extent of these powers depends upon whether the institution in question is considered "well capitalized," "adequately capitalized," "undercapitalized," "significantly undercapitalized" or "critically undercapitalized." Generally, the smaller an institution's capital base in relation to its risk-weighted or total assets, the greater the scope and severity of the agencies' powers. Business activities may also be affected by an institution's capital classification. For instance, only a "well capitalized" insured depository institution may accept brokered deposits without prior regulatory approval. In addition, in order for PNC to remain a financial holding company and engage in the broader range of financial activities authorized for such a company, PNC and PNC Bank must remain "well capitalized." At December 31, 2015, PNC
and PNC Bank exceeded the required ratios for classification as "well capitalized." The Basel III capital rule revised the thresholds at which an insured depositary institution is considered "well capitalized," "adequately capitalized," "undercapitalized," "significantly undercapitalized" or "critically undercapitalized." The revised thresholds, among other things, (i) include the CET1 capital metric; (ii) generally increase the amount of Tier 1 capital required to remain within each capital category (other than the "critically undercapitalized" category); and (iii) for institutions subject to the advanced approaches, include a supplementary leverage ratio threshold in the definitions of "adequately capitalized" and "undercapitalized" once the supplementary leverage ratio takes effect as a minimum requirement in 2018. The revised thresholds generally took effect on January 1, 2015. For additional discussion of capital adequacy requirements, we refer you to the Capital portion of the Consolidated Balance Sheet Review section of Item 7 of this Report and to Note 19 Regulatory Matters in the Notes To Consolidated Financial Statements in Item 8 of this Report.
In addition to these regulatory capital requirements, PNC is subject to the Federal Reserve's capital plan rule, annual capital stress testing requirements and Comprehensive Capital Analysis and Review (CCAR) process, as well as the annual and mid-year Dodd-Frank capital stress testing (DFAST) requirements of the Federal Reserve and the OCC. As part of the CCAR process, the Federal Reserve undertakes a supervisory assessment of the capital adequacy of BHCs, including PNC, that have $50 billion or more in total consolidated assets. This capital adequacy assessment is based on a review of a comprehensive capital plan submitted by each participating BHC to the Federal Reserve that describes the company's planned capital actions, such as plans to pay or increase common stock dividends, reinstate or increase common stock repurchase programs, or redeem preferred stock or other regulatory capital instruments, during the nine quarter review period, as well as the results of stress tests conducted by both the company and the Federal Reserve under different hypothetical macro-economic scenarios, including a supervisory adverse scenario and severely adverse scenario provided by the Federal Reserve. The Federal Reserve can object to a BHC's capital plan for qualitative or quantitative reasons, in which case the BHC cannot make capital distributions without specific Federal Reserve approval.
In evaluating a BHC's capital plan, the Federal Reserve considers a number of qualitative factors, which have become increasingly important in the CCAR process in recent years. The Federal Reserve's supervisory expectations for the capital planning and stress testing processes at large and complex BHCs, including PNC, are heightened relative to smaller and less complex BHCs. In assessing a BHC's capital planning and stress testing processes, the Federal Reserve considers whether the BHC has sound and effective governance to oversee these processes. The Federal Reserve's evaluation
| The PNC Financial Services Group, Inc. – Form 10-K 7 |
focuses on whether a BHC's capital planning and stress testing processes are supported by a strong risk management framework to identify, measure and assess material risks and to provide a strong foundation to capital planning. The Federal Reserve also considers the comprehensiveness of a BHC's control framework and evaluates a BHC's policy guidelines for capital planning and assessing capital adequacy. A BHC's scenario design processes and approaches for estimating the impact of stress on its capital position are comprehensively reviewed to ensure that projections reflect the impact of appropriately stressful conditions on its capital position. Significant deficiencies in a BHC's capital planning and stress testing processes may result in a qualitative objection by the Federal Reserve to its capital plan.
From a quantitative perspective, the Federal Reserve considers whether under different hypothetical macro-economic scenarios, including the supervisory severely adverse scenario, the company would be able to maintain throughout each quarter of the nine quarter planning horizon, even if it maintained its base case planned capital actions, projected regulatory risk-based and leverage capital ratios that exceed the minimums that are, or would then be, in effect for the company, taking into account the Basel III capital rules and any applicable phase-in periods. Failure to meet a minimum regulatory risk-based or leverage capital requirement on a projected stress basis is grounds for objection to a BHC's capital plan. In addition, the Federal Reserve evaluates a company's projected path towards compliance with the Basel III regulatory capital framework on a fully implemented basis.
In connection with the 2016 CCAR exercise, PNC must file its capital plan and stress testing results using financial data as of December 31, 2015 with the Federal Reserve by April 5, 2016. PNC expects to receive the Federal Reserve's response (either a non-objection or objection) to the capital plan submitted as part of the 2016 CCAR in June 2016.
As part of the CCAR and annual DFAST processes, both the Federal Reserve and PNC release certain revenue, loss and capital results from their stress testing exercises. For the 2016 exercises, the Federal Reserve has announced that it intends to publish its supervisory revenue, loss and capital projections for participating BHCs under the supervisory adverse and severely adverse macro-economic scenarios using the common assumptions concerning capital distributions established by the Federal Reserve in its DFAST regulations (DFAST capital action assumptions), as well as capital ratio information using the company's proposed base case capital actions. Within 15 days after the Federal Reserve publishes its DFAST results, PNC also is required to publicly disclose its own estimates of certain capital, revenue and loss information under the same hypothetical supervisory severely adverse macro-economic scenario and applying the DFAST capital action assumptions.
Federal Reserve regulations also require that PNC and other large BHCs conduct a separate stress test using financial data
as of June 30 and three company-derived macro-economic scenarios (base, adverse and severely adverse) and publish a summary of the results under the severely adverse scenario. For the 2016 stress test cycle, PNC must publish its results in the period between October 5 and November 4, 2016.
The Federal Reserve's capital plan rule provides that a BHC must resubmit a new capital plan prior to the annual submission date if, among other things, there has been or will be a material change in the BHC's risk profile, financial condition, or corporate structure since its last capital plan submission. Under the "de minimis" safe harbor of the Federal Reserve's capital plan rule, PNC may make limited repurchases of common stock or other capital distributions in amounts that exceed the amounts included in its most recently approved capital plan, provided that, among other things, such distributions do not exceed, in the aggregate, 1% of PNC's Tier 1 capital and the Federal Reserve does not object to the additional repurchases or distributions.
Basel III Liquidity and Other Requirements . The Basel III framework adopted by the Basel Committee included short-term liquidity standards (the "Liquidity Coverage Ratio" or "LCR") and long-term funding standards (the "Net Stable Funding Ratio" or "NSFR").
The rules adopted by the U.S. banking agencies to implement the LCR took effect on January 1, 2015. The LCR rules are designed to ensure that covered banking organizations maintain an adequate level of cash and high quality, unencumbered liquid assets (HQLA) to meet estimated net liquidity needs in a short-term stress scenario using liquidity inflow and outflow assumptions provided in the rules (net cash outflow). A company's LCR is the amount of its HQLA, as defined and calculated in accordance with the haircuts and limitations in the rule, divided by its net cash outflow, with the quotient expressed as a percentage.
Top-tier BHCs (like PNC) that are subject to the advanced approaches for regulatory capital purposes, as well as any subsidiary depository institution of such a company that has $10 billion or more in total consolidated assets (such as PNC Bank), are subject to the full LCR (rather than the less stringent modified LCR). However, the minimum required LCR is subject to a phase-in. The minimum LCR PNC and PNC Bank must maintain was 80% in 2015, increased to 90% in 2016 and increases to 100% when fully phased-in starting in 2017. PNC and PNC Bank are required to calculate the LCR on a month-end basis until June 30, 2016, and then on a daily basis beginning on July 1, 2016. An institution required to calculate its LCR on a month-end basis must consult with its primary federal regulator if its LCR falls below the required minimum for three consecutive days to determine whether the institution must provide a plan for achieving compliance with the minimum LCR. An institution required to calculate the LCR on a daily basis must promptly provide its
| 8 The PNC Financial Services Group, Inc. – Form 10-K |
regulator with a plan for achieving compliance with the minimum if its LCR is below the minimum for three consecutive business days.
The Federal Reserve also has adopted new liquidity risk management requirements for BHCs with $50 billion or more in consolidated total assets (like PNC) that became effective on January 1, 2015. The new rules require covered BHCs to, among other things, conduct internal liquidity stress tests over a range of time horizons, maintain a buffer of highly liquid assets sufficient to meet projected net outflows under the BHC's 30-day liquidity stress test, and maintain a contingency funding plan that meets detailed requirements.
For additional discussion of regulatory liquidity requirements, please refer to the Liquidity Risk Management portion of the Risk Management section of Item 7 of this Report.
In November 2015, the Federal Reserve issued a proposed rule for public comment that would require large BHCs, including PNC, to publicly disclose quantitative and qualitative measures of their liquidity profile. The proposed disclosure would include a common disclosure template that would include the components used to calculate the LCR (e.g., HQLA, cash outflows and inflows for the consolidated parent company), and a qualitative discussion of the LCR results, including, among other things, key drivers of the results, composition of HQLA and concentration of funding sources. As proposed, PNC would be required to make these disclosures starting with the third quarter, 2017.
The NSFR is designed to promote a stable maturity structure of assets and liabilities of banking organizations over a one-year time horizon. The Basel Committee, in October 2014, released the final NSFR framework. Under that framework, the NSFR would take effect as a minimum regulatory standard on January 1, 2018, although the U.S. banking agencies have not yet proposed rules to implement the NSFR.
Parent Company Liquidity and Dividends . The principal source of our liquidity at the parent company level is dividends from PNC Bank. PNC Bank is subject to various restrictions on its ability to pay dividends to PNC Bancorp, Inc., its direct parent, which is a wholly-owned direct subsidiary of PNC. PNC Bank is also subject to federal laws limiting extensions of credit to its parent holding company and non-bank affiliates as discussed in Note 19 Regulatory Matters in the Notes To Consolidated Financial Statements in Item 8 of this Report. Further information on bank level liquidity and parent company liquidity and on certain contractual restrictions is also available in the Liquidity Risk Management portion of the Risk Management section of Item 7 of this Report, and in Note 11 Borrowed Funds and Note 16 Equity in the Notes To Consolidated Financial Statements in Item 8 of this Report.
Federal Reserve rules provide that a BHC is expected to serve as a source of financial strength to its subsidiary banks and to commit resources to support such banks if necessary. Consistent with the "source of strength" policy for subsidiary banks, the Federal Reserve has stated that, as a matter of prudent banking, a BHC generally should not maintain a rate of cash dividends unless its net income available to common shareholders has been sufficient to fully fund the dividends and the prospective rate of earnings retention appears to be consistent with the corporation's capital needs, asset quality and overall financial condition. Further, in providing guidance to the large BHCs participating in the 2016 CCAR, discussed above, the Federal Reserve stated that it expects capital plans submitted in 2016 to reflect conservative dividend payout ratios and net share repurchase programs, and that requests that imply common dividend payout ratios above 30% of projected after-tax net income available to common shareholders will receive particularly close scrutiny.
Additional Powers Under the GLB Act . The GLB Act permits a qualifying BHC to become a "financial holding company" and thereby engage in, or affiliate with financial companies engaging in, a broader range of activities than would otherwise be permitted for a BHC. Permitted affiliates include securities underwriters and dealers, insurance companies and companies engaged in other activities that are determined by the Federal Reserve, in consultation with the Secretary of the Treasury, to be "financial in nature or incidental thereto" or are determined by the Federal Reserve unilaterally to be "complementary" to financial activities. PNC became a financial holding company as of March 13, 2000. In order to be and remain a financial holding company, a BHC and its subsidiary depository institutions must be "well capitalized" and "well managed." In addition, a financial holding company generally may not engage in a new financial activity authorized by the GLB Act, or acquire a company engaged in such a new activity, if any of its insured depository institutions received a less than Satisfactory rating at its most recent evaluation under the Community Reinvestment Act (CRA). Among other activities, we currently rely on our status as a financial holding company to conduct merchant banking activities and securities underwriting and dealing activities. As subsidiaries of a financial holding company under the GLB Act, our non-bank subsidiaries are generally allowed to conduct new financial activities, and PNC is generally permitted to acquire non-bank financial companies that have less than $10 billion in assets, with after-the-fact notice to the Federal Reserve.
The Federal Reserve is the "umbrella" regulator of a financial holding company, with its operating entities, such as its subsidiary broker-dealers, investment advisers, insurance companies and banks, as well as investment companies advised by investment adviser subsidiaries of the financial holding company, also being subject to the jurisdiction of various federal and state "functional" regulators with normal regulatory responsibility for companies in their lines of business.
| The PNC Financial Services Group, Inc. – Form 10-K 9 |
In addition, the GLB Act permits qualifying national banks to engage in expanded activities through the formation of a "financial subsidiary." PNC Bank has filed a financial subsidiary certification with the OCC and currently engages in insurance agency activities through financial subsidiaries. PNC Bank may also generally engage through a financial subsidiary in any activity that is determined to be financial in nature or incidental to a financial activity by the Secretary of the Treasury, in consultation with the Federal Reserve (other than insurance underwriting activities, insurance company investment activities and merchant banking). In order to have a financial subsidiary, a national bank and each of its depository institution affiliates must be and remain "well capitalized" and "well managed." In addition, a financial subsidiary generally may not engage in a new financial activity authorized by the GLB Act, or acquire a company engaged in such a new financial activity, if the national bank or any of its insured depository institution affiliates received a less than Satisfactory rating at its most recent evaluation under the CRA.
Volcker Rule . In December 2013, the U.S. banking agencies, SEC and CFTC issued final rules to implement the "Volcker Rule" provisions of Dodd-Frank. The Volcker Rule's prohibitions and restrictions generally became effective on July 21, 2015. The rules prohibit banks and their affiliates (collectively, banking entities) from trading as principal on a short-term basis in securities, derivatives and certain other financial instruments, but also includes several important exclusions and exemptions from this prohibition. These exclusions and exemptions, for example, permit banking entities, subject to a variety of conditions and restrictions, to trade as principal for securities underwriting, market making and risk-mitigating hedging purposes, and to trade in U.S. government and municipal securities. We currently do not expect the proprietary trading aspects of the final rules to have a material effect on PNC's businesses or revenue. However, the limits and restrictions of the Volcker Rule could, depending on the agencies' approach to interpreting the rules, cause PNC to forego engaging in hedging or other transactions that it would otherwise undertake in the ordinary course of business and, thus, to some extent, may limit the ability of PNC to most effectively hedge its risks, manage its balance sheet or provide products or services to its customers.
The rules also prohibit banking entities from acquiring and retaining ownership interests in, sponsoring, and having certain relationships with private funds (such as, for example, private equity and hedge funds) that would be an investment company for purposes of the Investment Company Act of 1940 but for the exemptions in sections 3(c)(1) or 3(c)(7) of that act (covered funds). Again there are exemptions from these restrictions which themselves are subject to a variety of conditions. Moreover, the rules prohibit banking entities from engaging in permitted trading or covered fund activities if the activity would involve or result in a material conflict of interest between the banking entity and its clients, customers,
or counterparties, result in a material exposure by the banking entity to a high-risk asset or a high-risk trading strategy, or pose a threat to the safety and soundness of the banking entity or to the financial stability of the United States. Banking entities, like PNC, that have $50 billion or more in total assets are required to establish and maintain an enhanced compliance program designed to ensure that the entity complies with the requirements of the final rules.
In December 2014, the Federal Reserve granted an extension of the conformance period to give all banking entities until July 21, 2016 to conform their investments in, and relationships with, covered funds that were held or existed prior to December 31, 2013 (legacy covered funds). Moreover, the Federal Reserve indicated its intent to grant an additional one-year extension of the conformance period for legacy covered funds, which would give banking entities until July 21, 2017 to conform their ownership interests in, and relationships with, legacy covered funds subject to the Volcker Rule. The Federal Reserve also has the ability to provide up to an additional 5-year conformance period for investments held as of May 1, 2010 in qualifying illiquid funds. For additional information concerning the potential impact of the Volcker Rule on PNC's operations, please refer to Item 1A Risk Factors of this Report.
Other Federal Reserve and OCC Regulation and Supervision . Laws and regulations limit the scope of our permitted activities and investments. The federal banking agencies also possess broad powers to take corrective action as deemed appropriate for an insured depository institution and its holding company.
Moreover, examination ratings of "3" or lower, lower capital ratios than peer group institutions, regulatory concerns regarding management, controls, assets, operations or other factors, can all potentially result in practical limitations on the ability of a bank or BHC to engage in new activities, grow, acquire new businesses, repurchase its stock or pay dividends, or to continue to conduct existing activities. The OCC, moreover, has established certain heightened risk management and governance standards for large banks, including PNC Bank, as enforceable guidelines under section 39 of the Federal Deposit Insurance Act (FDI Act). The guidelines, among other things, establish minimum standards for the design and implementation of a risk governance framework, describe the appropriate risk management roles and responsibilities of front line units, independent risk management, internal audit, and the board of directors, and provide that a covered bank should have a comprehensive written statement that articulates its risk appetite and serves as a basis for the framework (a risk appetite statement). If the OCC determines that a covered national bank is not in compliance with these or other guidelines established under section 39 of the FDI Act (including the guidelines relating to information security standards), the OCC may require the bank to submit a corrective action plan and may initiate
| 10 The PNC Financial Services Group, Inc. – Form 10-K |
enforcement action against the bank if an acceptable plan is not submitted or the bank fails to comply with an approved plan.
Sections 23A and 23B of the Federal Reserve Act and the Federal Reserve's implementing regulation, Regulation W, place quantitative and qualitative restrictions on covered transactions between a bank and its affiliates (for example between PNC Bank, on the one hand, and PNC and its nonbank subsidiaries, on the other hand). In general, section 23A and Regulation W limit the total amount of covered transactions between a bank and any single affiliate to 10 percent of the bank's capital stock and surplus, limit the total amount of covered transactions between a bank and all its affiliates to 20 percent of the bank's capital stock and surplus, prohibit a bank from purchasing low-quality assets from an affiliate, and require certain covered transactions to be secured with prescribed amounts of collateral. Section 23B generally requires that transactions between a bank and its affiliates be on terms that are at least as favorable to the bank as the terms that would apply in comparable transactions between the bank and a third party. Dodd-Frank amended section 23A of the Federal Reserve Act to include as a covered transaction the credit exposure of a bank to an affiliate arising from a derivative transaction with the affiliate. The Federal Reserve has yet to propose rules to implement these revisions.
The Federal Reserve's prior approval is required whenever we propose to acquire all or substantially all of the assets of any bank or savings association, to acquire direct or indirect ownership or control of more than 5% of any class of voting securities of any bank or savings association, or to merge or consolidate with any other BHC or savings and loan holding company. The BHC Act and other federal law enumerates the factors the Federal Reserve must consider when reviewing the merger of BHCs, the acquisition of banks, or the acquisition of voting securities of a bank or BHC. These factors include the competitive effects of the proposal in the relevant geographic markets; the financial and managerial resources and future prospects of the companies and banks involved in the transaction; the effect of the transaction on the financial stability of the United States; the organizations' compliance with anti-money laundering laws and regulations; the convenience and needs of the communities to be served; and the records of performance under the CRA of the insured depository institutions involved in the transaction. In cases involving interstate bank acquisitions, the Federal Reserve also must consider the concentration of deposits nationwide and in certain individual states. Under Dodd-Frank, a BHC is generally prohibited from merging or consolidating with, or acquiring, another company if the resulting company's liabilities upon consummation would exceed 10% of the aggregate liabilities of the U.S. financial sector (including the U.S. liabilities of foreign financial companies). OCC prior approval is required for PNC Bank to acquire another insured bank or savings association by merger or to acquire deposits
or substantially all of the assets of such institutions. In deciding whether to approve such a transaction, the OCC is required to consider factors similar to those that must be considered by the Federal Reserve. Approval of the FDIC is required to merge a nonbank entity into PNC Bank. Our ability to grow through acquisitions or reorganize our operations could be limited by these approval requirements.
At December 31, 2015, PNC Bank had an "Outstanding" rating with respect to the CRA.
As a national bank, PNC Bank is required to be a member of the Federal Reserve System. A member bank is required to subscribe to stock in its regional Federal Reserve Bank and receives an annual dividend on the amount of paid-in stock. Effective January 1, 2016, the annual dividend rate paid by a Federal Reserve Bank to stockholders with total consolidated assets of $10 billion or more, such as PNC Bank, was changed (from a flat 6 percent rate) to be the lower of (i) the rate equal to the high yield of the 10-year Treasury note auctioned at the last auction before the dividend is paid, or (ii) 6 percent.
Because of PNC's ownership interest in BlackRock, BlackRock is subject to the supervision and regulation of the Federal Reserve.
FDIC Insurance and Related Matters . PNC Bank is insured by the FDIC and subject to deposit premium assessments. Regulatory matters could increase the cost of FDIC deposit insurance premiums to an insured bank as FDIC deposit insurance premiums are "risk based." Therefore, higher fee percentages would be charged to banks that have lower capital ratios or higher risk profiles. These risk profiles take into account, among other things, weaknesses that are found by the primary banking regulator through its examination and supervision of the bank and the bank's holdings of assets or liabilities classified as higher risk by the FDIC. For example, an insured depository institution's examination rating and the amount of brokered deposits (as defined under the FDI Act) held by an insured depository institution, among other things, can adversely affect the institution's deposit insurance assessments. A negative evaluation by the FDIC or a bank's primary federal banking regulator could increase the costs to a bank and result in an aggregate cost of deposit funds higher than that of competing banks in a lower risk category. The methodology for the deposit insurance base calculation currently uses average assets less average tangible equity.
Federal banking laws and regulations also apply a variety of requirements or restrictions on insured depository institutions with respect to brokered deposits. For example, brokered deposits are generally subject to higher outflow assumptions than other types of deposits for purposes of the LCR. In 2015, the FDIC issued a set of frequently asked questions (FAQs) regarding the definition of brokered deposits under the FDI Act and then requested public comment on potential revisions to the FAQs.
| The PNC Financial Services Group, Inc. – Form 10-K 11 |
The Dodd-Frank Act mandated an increase in the Designated Reserve Ratio (the balance in the Deposit Insurance Fund divided by estimated insured deposits) from 1.15% to 1.35% by September 30, 2020, and required that insured depository institutions with $10 billion or more in total assets, such as PNC, bear the cost of the increase. In October 2015, the FDIC requested comment on a proposed rule that would impose a surcharge, equal to 4.5 basis points of an institution's deposit insurance assessment base, on the quarterly deposit insurance assessments of all insured depository institutions with total consolidated assets of $10 billion or more (including PNC Bank) in order to fund this increase in the Designated Reserve Ratio. Under the proposal, the surcharge would take effect for assessments billed after the Designated Reserve Ratio reaches 1.15 percent (estimated by the FDIC to most likely occur in the first quarter of 2016) or such later date as the proposed rule is finalized, and would continue until the reserve ratio reached 1.35 percent (estimated by the FDIC to occur under the proposal before the end of 2018). Based on data as of December 31, 2015, we estimate that the net effect of the proposed surcharge, together with the scheduled reduction of regular assessments that will go into effect when the Designated Reserve Ratio reaches 1.15 percent, would increase PNC Bank's quarterly assessment by approximately $20 million. The comment period closed on January 5, 2016.
Recovery and Resolution Planning . Dodd-Frank requires BHCs that have $50 billion or more in assets, such as PNC, to periodically submit to the Federal Reserve and the FDIC a resolution plan that includes, among other things, an analysis of how the company could be resolved in a rapid and orderly fashion if the company were to fail or experience material financial distress. The Federal Reserve and the FDIC may jointly impose restrictions on a covered BHC, including additional capital requirements or limitations on growth, if the agencies jointly determine that the company's plan is not credible or would not facilitate a rapid and orderly resolution of the company under the U.S. Bankruptcy Code (or other applicable resolution framework), and additionally could require the company to divest assets or take other actions if the company did not submit an acceptable resolution plan within two years after any such restrictions were imposed. The FDIC also requires large insured depository institutions, including PNC Bank, to periodically submit a resolution plan to the FDIC that includes, among other things, an analysis of how the institution could be resolved under the FDI Act in a manner that protects depositors and limits losses or costs to creditors of the bank in accordance with the FDI Act. Depending on how the agencies conduct their review of the resolution plans submitted by PNC and PNC Bank, these requirements could affect the ways in which PNC structures and conducts its business and result in higher compliance and operating costs. PNC and PNC Bank submitted their 2015 resolution plans under these rules in December 2015.
In December 2015, the OCC issued for public comment proposed enforceable guidelines under section 39 of the FDI
Act that would establish standards for recovery planning for insured national banks, with average total consolidated assets of $50 billion or more, including PNC Bank. The proposed guidelines would require a covered bank to develop and maintain a recovery plan that, among other things, identifies a range of options that could be undertaken by the banking organization to restore its financial and operational strength and viability should identified triggering events reflecting the banking organization's vulnerabilities occur. The proposal does not specify an effective date for the guidelines. The public comment period for the enforceable guidelines closed on February 16, 2016.
CFPB Regulation and Supervision . As noted above, Dodd-Frank gives the CFPB authority to examine PNC and PNC Bank for compliance with a broad range of federal consumer financial laws and regulations, including the laws and regulations that relate to deposit products, credit card, mortgage, automobile and other consumer loans, and other consumer financial products and services we offer. The CFPB also has the power to issue regulations and take enforcement actions to prevent and remedy acts and practices relating to consumer financial products and services that it deems to be unfair, deceptive or abusive, and to impose new disclosure requirements for any consumer financial product or service. In addition to these authorities, on July 21, 2011, and pursuant to Dodd-Frank, the CFPB assumed authorities under other consumer financial laws in effect on that date governing the provision of consumer financial products and services.
The CFPB has engaged in extensive rulemaking activities, including adopting comprehensive new rules on mortgage related topics required under Dodd-Frank, including borrower ability-to-repay and qualified mortgage standards, mortgage servicing standards and loan originator compensation standards.
In October 2015, broad new regulations took effect that substantially revised the disclosures we provide to prospective residential mortgage customers. These regulations, among other things, require the provision of new disclosures near the time a prospective borrower submits an application and three days prior to closing of a mortgage loan. The CFPB is also engaged or expected to engage in rulemakings that impact products and services offered by PNC Bank, including regulations impacting prepaid cards, overdraft fees charged on deposit accounts and arbitration provisions included in customer account agreements.
Securities and Derivatives Regulation
Our registered broker-dealer and investment adviser subsidiaries are subject to rules and regulations promulgated by the SEC.
Several of our subsidiaries are registered with the SEC as investment advisers and may provide investment advisory services to clients, other PNC affiliates or related entities, including registered investment companies. Certain of these
| 12 The PNC Financial Services Group, Inc. – Form 10-K |
advisers are registered as investment advisers to private equity funds under rules adopted under Dodd-Frank.
Broker-dealer subsidiaries are registered with the SEC and subject to the requirements of the Securities Exchange Act of 1934 and related regulations. The Financial Industry Regulatory Authority (FINRA) is the primary self-regulatory organization (SRO) for our registered broker-dealer subsidiaries. Investment adviser subsidiaries are subject to the requirements of the Investment Advisers Act of 1940 and related regulations. Our investment adviser subsidiary that serves as adviser to registered investment companies is also subject to the requirements of the Investment Company Act of 1940 and related regulations. Our broker-dealer and investment adviser subsidiaries also are subject to additional regulation by states or local jurisdictions.
Over the past several years, the SEC and other regulatory agencies have increased their focus on the asset management, mutual fund and broker-dealer industries. Congress and the SEC have adopted regulatory reforms and are considering additional reforms that have increased, and are likely to continue to increase, the extent of regulation of the mutual fund, investment adviser and broker-dealer industries and impose additional compliance obligations and costs on our subsidiaries involved with those industries. Under provisions of the federal securities laws applicable to broker-dealers, investment advisers and registered investment companies and their service providers, a determination by a court or regulatory agency that certain violations have occurred at a company or its affiliates can result in fines, restitution, a limitation on permitted activities, disqualification to continue to conduct certain activities and an inability to rely on certain favorable exemptions. Certain types of infractions and violations can also affect a public company in its ability to expeditiously issue new securities into the capital markets. In addition, certain changes in the activities of a broker-dealer require approval from FINRA, and FINRA takes into account a variety of considerations in acting upon applications for such approval, including internal controls, capital levels, management experience and quality, prior enforcement and disciplinary history and supervisory concerns.
Title VII of Dodd-Frank imposes new comprehensive and significant regulations on the activities of financial institutions that are active in the U.S. over-the-counter derivatives and foreign exchange markets. Title VII was enacted to (i) address systemic risk issues, (ii) bring greater transparency to the derivatives markets, (iii) provide enhanced disclosures and protection to customers, and (iv) promote market integrity. Among other things, Title VII: (i) requires the registration of both "swap dealers" and "major swap participants" with one or both of the CFTC (in the case of non security-based swaps) and the SEC (in the case of security-based swaps); (ii) requires that most standardized swaps be centrally cleared through a regulated clearing house and traded on a centralized exchange or swap execution facility; (iii) subjects swap
dealers and major swap participants to capital and margin requirements in excess of historical practice; (iv) subjects swap dealers and major swap participants to comprehensive new recordkeeping and real-time public reporting requirements; (v) subjects swap dealers and major swap participants to new business conduct requirements, including the provision of daily marks to counterparties and disclosing to counterparties (pre-execution) the material risks, material incentives, and any conflicts of interest associated with their swap; and (vi) imposes special duties on swap dealers and major swap participants when transacting a swap with a "special entity" ( e.g. , governmental agency (federal, state or local) or political subdivision thereof, pension plan or endowment).
Based on the definition of a "swap dealer" under Title VII, PNC Bank registered with the CFTC as a swap dealer on January 31, 2013. As a result, PNC Bank is subject to the regulations and requirements imposed on registered swap dealers, and the CFTC (and for certain delegated responsibilities, the National Futures Association) will have a meaningful supervisory role with respect to PNC Bank's derivatives and foreign exchange businesses. Because of the limited volume of our security-based swap activities, PNC Bank has not registered with the SEC as a security-based swap dealer. The regulations and requirements applicable to swap dealers will collectively impose implementation and ongoing compliance burdens on PNC Bank and will introduce additional legal risks (including as a result of newly applicable antifraud and anti-manipulation provisions and private rights of action).
As originally enacted, the so-called "swap push-out" provisions of Section 716 of Dodd-Frank required an insured depository institution that is a "swaps entity" (defined to include a registered swap dealer like PNC Bank) to cease engaging in certain types of swaps by July 16, 2013, although the institution's appropriate Federal banking agency could extend this transition period. In 2013, PNC Bank received such an extension of the transition period to July 16, 2015 from its appropriate Federal banking agency. In December 2014, the U.S. Congress significantly narrowed the "push-out" restrictions of Section 716. These amendments generally allow insured depository institutions that are a swaps entity to engage in all types of swaps other than structured finance swaps (defined as a swap that references either an asset-backed security or a group or index primarily comprised of asset-backed securities). However, an insured depository institution is permitted to engage in structured finance swaps for hedging or other risk mitigating purposes. An insured depository institution that fails to comply with the restrictions in Section 716 could face restrictions on the institution's access to the Federal Reserve's discount window or FDIC deposit insurance or guarantees. These provisions, as amended, do not prohibit PNC Bank from engaging in its current swap activities.
| The PNC Financial Services Group, Inc. – Form 10-K 13 |
BlackRock has subsidiaries in securities and related businesses subject to SEC, other governmental agencies, state, local and FINRA regulation, and a federally chartered nondepository trust company subsidiary subject to supervision and regulation by the OCC. For additional information about the regulation of BlackRock by these agencies and otherwise, we refer you to the discussion under the "Regulation" section of Item 1 Business in BlackRock's most recent Annual Report on Form 10-K, which may be obtained electronically at the SEC's website at www.sec.gov.
Competition
We are subject to intense competition from other regulated banking organizations, as well as various other types of financial institutions and non-bank entities that can offer a number of similar products and services without being subject to bank regulatory supervision and restrictions.
In making loans, PNC Bank competes with traditional banking institutions as well as consumer finance companies, leasing companies and other non-bank lenders, and institutional investors including collateralized loan obligation (CLO) managers, hedge funds, mutual fund complexes and private equity firms. Loan pricing, structure and credit standards are extremely important in the current environment as we seek to achieve appropriate risk-adjusted returns. Traditional deposit-taking activities are also subject to pricing pressures and to customer migration as a result of intense competition for deposits and investments.
PNC Bank competes for deposits with:
| • | Other commercial banks, |
| • | Savings banks, |
| • | Savings and loan associations, |
| • | Credit unions, |
| • | Treasury management service companies, |
| • | Insurance companies, and |
| • | Issuers of commercial paper and other securities, including mutual funds. |
Our various non-bank businesses engaged in investment banking and alternative investment activities compete with:
| • | Commercial banks, |
| • | Investment banking firms, |
| • | Merchant banks, |
| • | Insurance companies, |
| • | Private equity firms, and |
| • | Other investment vehicles. |
In providing asset management services, our businesses compete with:
| • | Investment management firms, |
| • | Large banks and other financial institutions, |
| • | Brokerage firms, |
| • | Mutual fund complexes, and |
| • | Insurance companies. |
Competitors may seek to compete with us through traditional channels (such as physical locations) or primarily through on-line or mobile channels. We include here by reference the additional information regarding competition and factors affecting our competitive position included in the Item 1A Risk Factors of this Report.
Employees
Employees totaled 52,513 at December 31, 2015. This total includes 49,148 full-time and 3,365 part-time employees, of which 21,896 full-time and 2,877 part-time employees were employed by our Retail Banking business.
SEC Reports and Corporate Governance Information
We are subject to the informational requirements of the Securities Exchange Act of 1934 (Exchange Act) and, in accordance with the Exchange Act, we file annual, quarterly and current reports, proxy statements, and other information with the SEC. Our SEC File Number is 001-09718. You may read and copy this information at the SEC's Public Reference Room located at 100 F Street NE, Room 1580, Washington, D.C. 20549. You can obtain information on the operation of the Public Reference Room by calling the SEC at 1-800-SEC-0330.
You can also obtain copies of this information by mail from the Public Reference Section of the SEC, 100 F Street NE, Washington, D.C. 20549, at prescribed rates.
The SEC also maintains an internet website that contains reports, including exhibits, proxy and information statements, and other information about issuers, like us, who file electronically with the SEC. The address of that site is www.sec.gov. You can also inspect reports, proxy statements and other information about us at the offices of the New York Stock Exchange, 20 Broad Street, New York, New York 10005.
We also make our Annual Report on Form 10-K, Quarterly Reports on Form 10-Q, Current Reports on Form 8-K, and amendments to those reports filed with or furnished to the SEC pursuant to Section 13(a) or 15(d) of the Exchange Act available free of charge on our internet website as soon as reasonably practicable after we electronically file such material with, or furnish it to, the SEC. PNC's corporate internet address is www.pnc.com and you can find this information at www.pnc.com/secfilings. Shareholders and bondholders may also obtain copies of these filings without charge by contacting Shareholder Services at 800-982-7652 or via the online contact form at www.computershare.com/contactus for copies without exhibits, and by contacting Shareholder Relations at 800-843-2206 or via e-mail at [email protected] for copies of exhibits, including financial statement and schedule exhibits where applicable. The interactive data file (XBRL) exhibit is only available electronically.
| 14 The PNC Financial Services Group, Inc. – Form 10-K |
Information about our Board of Directors and its committees and corporate governance at PNC is available on PNC's corporate website at www.pnc.com/corporategovernance. Our PNC Code of Business Conduct and Ethics is available on our corporate website at www.pnc.com/corporategovernance. In addition, any future amendments to, or waivers from, a provision of the PNC Code of Business Conduct and Ethics that applies to our directors or executive officers (including our principal executive officer, principal financial officer, and principal accounting officer or controller) will be posted at this internet address.
Shareholders who would like to request printed copies of the PNC Code of Business Conduct and Ethics or our Corporate Governance Guidelines or the charters of our Board's Audit, Nominating and Governance, Personnel and Compensation, or Risk Committees (all of which are posted on the PNC corporate website at www.pnc.com/corporategovernance) may do so by sending their requests to PNC's Corporate Secretary at corporate headquarters at The Tower at PNC Plaza, 300 Fifth Avenue, Pittsburgh, Pennsylvania 15222-2401. Copies will be provided without charge to shareholders.
Our common stock is listed on the New York Stock Exchange (NYSE) under the symbol "PNC."
Internet Information
The PNC Financial Services Group, Inc.'s financial reports and information about its products and services are available on the internet at www.pnc.com. We provide information for investors on our corporate website under "About Us – Investor Relations." We use our Twitter account, @pncnews, as an additional way of disseminating public information from time to time to investors.
We generally post the following under "About Us – Investor Relations" shortly before or promptly following its first use or release: financially-related press releases, including earnings releases, and supplemental financial information, various SEC filings, including annual, quarterly and current reports and proxy statements, presentation materials associated with earnings and other investor conference calls or events, and access to live and recorded audio from earnings and other
investor conference calls or events. In some cases, we may post the presentation materials for other investor conference calls or events several days prior to the call or event. When warranted, we will also use our website to expedite public access to time-critical information regarding PNC in advance of distribution of a press release or a filing with the SEC disclosing the same information. For earnings and other conference calls or events, we generally include in our posted materials a cautionary statement regarding forward-looking and adjusted information and we provide GAAP reconciliations when we refer to adjusted information and results. Where applicable, we provide GAAP reconciliations for such additional information in materials for that event or in materials for other prior investor presentations or in our annual, quarterly or current reports.
PNC is required to provide additional public disclosure regarding estimated income, losses and pro forma regulatory capital ratios under supervisory and PNC-developed hypothetical severely adverse economic scenarios, as well as information concerning its capital stress testing processes, pursuant to the stress testing regulations adopted by the Federal Reserve and the OCC. PNC is also required to make certain additional regulatory capital-related public disclosures about PNC's capital structure, risk exposures, risk assessment processes, risk-weighted assets and overall capital adequacy, including market risk-related disclosures, under the regulatory capital rules adopted by the Federal banking agencies. Under these regulations, PNC may satisfy these requirements through postings on its website, and PNC has done so and expects to continue to do so without also providing disclosure of this information through filings with the SEC.
Other information posted on our corporate website that may not be available in our filings with the SEC include information relating to our corporate governance and quarterly and annual communications from our chairman to shareholders.
Where we have included web addresses in this Report, such as our web address and the web address of the SEC, we have included those web addresses as inactive textual references only. Except as specifically incorporated by reference into this Report, information on those websites is not part hereof.
| The PNC Financial Services Group, Inc. – Form 10-K 15 |
ITEM 1A – RISK FACTORS
We are subject to a number of risks potentially impacting our business, financial condition, results of operations and cash flows. As a financial services organization, certain elements of risk are inherent in our transactions and operations and are present in the business decisions we make. Thus, we encounter risk as part of the normal course of our business, and we design risk management processes to help manage these risks.
Our success is dependent on our ability to identify, understand and manage the risks presented by our business activities so that we can appropriately balance revenue generation and profitability. These risks include, but are not limited to, credit risk, market risk, liquidity risk, operational risk, model risk, technology, compliance and legal risk, and strategic and reputation risk. We discuss our principal risk management processes and, in appropriate places, related historical performance in the Risk Management section included in Item 7 of this Report.
The following are the key risk factors that affect us. Any one or more of these risk factors could have a material adverse impact on our business, financial condition, results of
operations or cash flows, in addition to presenting other possible adverse consequences, including those described below. These risk factors and other risks are also discussed further in other sections of this Report.
Difficult economic conditions or volatility in the financial markets would likely have an adverse effect on our business, financial position and results of operations.
As a financial services company, PNC's business and overall financial performance are vulnerable to the impact of poor or weak economic conditions, particularly in the United States but also to some extent in the global economy. Recessionary conditions, particularly if severe such as was experienced starting in late 2007 and ending in 2009, are likely to have a negative financial impact across the financial services industry, including on PNC. Recessionary economic conditions can lead to turmoil and volatility in financial markets, which can increase the adverse impact on financial institutions such as PNC, with the impact increased to the extent the conditions are more severe. A return to recessionary economic conditions in the United States would likely adversely affect PNC, its business and financial performance, with the impact potentially as or more detrimental than that of the last recession.
The economic recovery from the 2008-2009 recession continued in 2015, but at a slower pace than for recoveries from prior recessions. Although unemployment rates have dropped significantly from the highest levels during the recession, wage growth has been muted. Consumer and business confidence is improving but remains in the cautious zone.
The beginning of 2016 has seen significant market volatility driven in part by concerns related to, among other things, the Chinese economy and the impact of low commodity prices, including oil and gas. The continued impact of these issues, including related market volatility, could adversely affect the U.S. or global economies, with direct or indirect impacts on PNC and its business. Results could include drops in consumer and business confidence, credit deterioration, diminished capital markets activity, delays in Federal Reserve increases in interest rates, and reduced exports related to further strengthening of the U.S. dollar.
Over the last several years, there have been several instances where there has been uncertainty regarding the ability of Congress and the President collectively to reach agreement on federal budgetary, taxing and spending matters. A continuation of divisions within government on these subjects, which could be exacerbated as a result of the upcoming presidential and congressional elections, could lead to increased concern on these topics, which could affect business activity and consumer and business confidence. A period of failure to reach agreement on these matters, particularly if accompanied by an actual or threatened government shutdown or default, would likely have at least a short term adverse impact on the U.S. economy.
The global recession and disruption of the financial markets in 2008-2009 led to concerns over the solvency of certain European countries, affecting these countries' capital markets access and in some cases sovereign credit ratings, as well as market perception of financial institutions that have significant direct or indirect exposure to these countries. These concerns continue even as the global economy is recovering and some previously stressed European economies have experienced at least partial recoveries from their lowpoint during the recession. If measures to address sovereign debt and financial sector problems in Europe are inadequate, they may delay or weaken economic recovery, or result in the exit of one or more member states from the Eurozone or more severe economic and financial conditions. If realized, these risk scenarios could contribute to severe financial market stress or a global recession, likely affecting the economy and capital markets in the United States as well.
Other Risk Factors, presented below, address specific ways in which we may be adversely impacted by economic conditions.
Our business and financial results are subject to risks associated with the creditworthiness of our customers and counterparties.
Credit risk is inherent in the financial services business and results from, among other things, extending credit to customers, purchasing securities, and entering into financial derivative transactions and certain guarantee contracts. Credit risk is one of our most significant risks, particularly given the high percentage of our assets represented directly or indirectly
| 16 The PNC Financial Services Group, Inc. – Form 10-K |
by loans and securities and the importance of lending to our overall business. We manage credit risk by assessing and monitoring the creditworthiness of our customers and counterparties, by diversifying our loan portfolio and by investing primarily in high quality securities. Many factors impact credit risk.
A borrower's ability to repay a loan can be adversely affected by several factors, such as business performance, job losses or health issues. A weak or deteriorating economy and changes in the United States or global markets also could adversely impact the ability of our borrowers to repay outstanding loans. Any decrease in our borrowers' ability to repay loans would result in higher levels of nonperforming loans, net charge-offs, provision for credit losses and valuation adjustments on loans held for sale.
Financial services institutions are interrelated as a result of trading, clearing, counterparty, and other relationships. We have exposure to many different industries and counterparties, and we routinely execute transactions with counterparties in the financial services industry, including brokers and dealers, commercial banks, investment banks, mutual and hedge funds, and other institutional clients. Many of these transactions expose us to credit risk in the event of default of our counterparty or client.
Despite maintaining a diversified loan and securities portfolio, in the ordinary course of business, we may have concentrated credit exposure to a particular person or entity, industry, region, market or counterparty. Loans secured by commercial and residential real estate represent a significant percentage of our overall credit portfolio as well as of the assets underlying our investment securities. Events adversely affecting specific customers, industries, regions or markets, a decrease in the credit quality of a customer base, or an adverse change in the risk profile of a market, industry, or group of customers could adversely affect us.
Our credit risk may be exacerbated when collateral held by us to secure obligations to us cannot be realized upon or is liquidated at prices that are not sufficient to recover the full amount of the loan or derivative exposure due us.
In part due to improvement in economic conditions, as well as actions taken by PNC to manage its portfolio, PNC's provision for credit losses has declined substantially every year since the end of the recent recession. If we were to once again experience higher levels of provision for credit losses, it could result in lower levels of net income.
Our business and financial performance is impacted significantly by market interest rates and movements in those rates. The monetary, tax and other policies of governmental agencies, including the Federal Reserve, have a significant impact on interest rates and overall
financial market performance over which we have no control and which we may not be able to predict adequately .
As a result of the high percentage of our assets and liabilities that are in the form of interest-bearing or interest-related instruments, changes in interest rates, in the shape of the yield curve, or in spreads between different market interest rates can have a material effect on our business, our profitability and the value of our financial assets and liabilities. For example:
| • | Changes in interest rates or interest rate spreads can affect the difference between the interest that we earn on assets and the interest that we pay on liabilities, which impacts our overall net interest income and profitability. |
| • | Such changes can affect the ability of borrowers to meet obligations under variable or adjustable rate loans and other debt instruments, and can, in turn, affect our loss rates on those assets. |
| • | Such changes may decrease the demand for interest rate-based products and services, including loans and deposit accounts. |
| • | Such changes can also affect our ability to hedge various forms of market and interest rate risk and may decrease the effectiveness of those hedges in helping to manage such risks. |
| • | Movements in interest rates also affect mortgage prepayment speeds and could result in impairments of mortgage servicing assets or otherwise affect the profitability of such assets. |
The monetary, tax and other policies of the government and its agencies, including the Federal Reserve, have a significant impact on interest rates and overall financial market performance. These governmental policies can thus affect the activities and results of operations of banking companies such as PNC. An important function of the Federal Reserve is to regulate the national supply of bank credit and certain interest rates. The actions of the Federal Reserve influence the rates of interest that we charge on loans and that we pay on borrowings and interest-bearing deposits and can also affect the value of our on-balance sheet and off-balance sheet financial instruments. Both due to the impact on rates and by controlling access to direct funding from the Federal Reserve Banks, the Federal Reserve's policies also influence, to a significant extent, our cost of funding. We cannot predict the nature or timing of future changes in monetary, tax and other policies or the effects that they may have on our activities and financial results. The current very low interest rate environment has had a negative impact on our ability to increase our net interest income. Although the Federal Reserve increased its benchmark interest rate in December 2015, ending approximately seven years of near zero rates, and is expected to continue raising rates through 2016, there is no assurance that it will do so, particularly in light of recent market turmoil. The failure to continue raising rates could affect consumer and business behavior in ways that are
| The PNC Financial Services Group, Inc. – Form 10-K 17 |
adverse to us in addition to continuing to affect our net interest income. Even if the Federal Reserve continues to increase the interest rates it directly influences, there may be a prolonged period before interest rates return to more historically typical levels.
In addition, monetary and fiscal policy actions by governmental and regulatory decision makers in other countries or in the European Union could have an impact on global interest rates, affecting rates in the United States as well as rates on instruments denominated in currencies other than the United States dollar, any of which could have one or more of the potential effects on PNC described above.
While we have not experienced negative interest rates in the United States, some central banks in Europe and Asia have cut interest rates below zero. It is unclear what the impact of these actions will be. If U.S. interest rates fell below zero, it could significantly affect our businesses and results of operation.
Our business and financial performance are vulnerable to the impact of changes in the values of financial assets.
As a financial institution, a substantial majority of PNC's assets and liabilities are financial in nature (items such as loans, securities, servicing rights, deposits and borrowings). Such assets and liabilities will fluctuate in value, often significantly, due to movements in the financial markets or market volatility as well as developments specific to the asset or liability in question.
Credit-based assets and liabilities will fluctuate in value due to changes in the perceived creditworthiness of the borrowers and also due to changes in market interest rates. A lessening of confidence in the creditworthiness of the United States or other governments whose securities we hold could impact the value of those holdings. Changes in loan prepayment speeds, usually based on fluctuations in market interest rates, could adversely impact the value of our mortgage servicing rights. The financial strength of counterparties, with whom we have hedged some of our exposure to certain types of assets, could affect the value of such transactions and assets. Additionally, the underlying value of an asset under lease may decrease due to supply and demand for the asset or the condition of the asset at the end of the lease. This could cause our recorded lease value to decline.
In many cases, PNC marks its assets and liabilities to market on its financial statements, either through its Net income and Retained earnings or through adjustments to Accumulated other comprehensive income on its balance sheet. We may need to record losses in the value of financial assets even where our expectation of realizing the face value of the underlying instrument has not changed.
In addition, asset management revenue is primarily based on a percentage of the value of the assets being managed and thus
is impacted by general changes in market valuations. Thus, although we are not directly impacted by changes in the value of such assets, decreases in the value of those assets would affect related fee income.
Our business and financial performance are dependent on our ability to attract and retain customers for our products and services, which may be negatively impacted by a lack of consumer and business economic confidence as well as our actions, including our ability to anticipate and satisfy customer demands for products and services.
As a financial institution, our performance is subject to risks associated with the loss of customer confidence and demand. Economic and market developments, particularly in the United States, Europe and Asia, may affect consumer and business confidence levels. If customers lose confidence due to a weak or deteriorating economy or uncertainty surrounding the future of the economy, the demand for our products and services could suffer.
We may also fail to attract or retain customers if we are unable to develop and market products and services that meet evolving customer needs or demands or if we are unable to deliver them effectively and securely to our customers, particularly to the extent that our competitors are able to do so.
News or other publicity that impairs our reputation, or the reputation of our industry generally, also could cause a loss of customers.
If we fail to attract and retain customers, demand for our loans and other financial products and services could decrease and we could experience adverse changes in payment patterns. We could lose interest income from a decline in credit usage and fee income from a decline in product sales, investments and other transactions. PNC's customers could remove money from checking and savings accounts and other types of deposit accounts in favor of other banks or other types of investment products. Deposits are a low cost source of funds. Therefore, losing deposits could increase our funding costs and reduce our net interest income.
For several years, the United States has been in a very low interest rate environment. This situation has decreased the attractiveness of alternatives to bank checking and savings accounts, which may lack deposit insurance and some of the convenience associated with more traditional banking products and which may no longer be able to offer much higher interest rates. If interest rates were to rise significantly, customers may be less willing to maintain balances in non-interest bearing or low interest bank accounts, which could result in a loss of deposits or a relatively higher cost of funds to PNC. This could also result in a loss of fee income.
In our asset management business, investment performance is an important factor influencing the level of assets that we
| 18 The PNC Financial Services Group, Inc. – Form 10-K |
manage. Poor investment performance could impair revenue and growth as existing clients might withdraw funds in favor of better performing products. Additionally, the ability to attract funds from existing and new clients might diminish. Overall economic conditions may limit the amount that customers are able or willing to invest as well as the value of the assets they do invest. The failure or negative performance of products of other financial institutions could lead to a loss of confidence in similar products offered by us without regard to the performance of our products. Such a negative contagion could lead to withdrawals, redemptions and liquidity issues in such products and have a material adverse impact on our assets under management and asset management revenues and earnings.
As a regulated financial services firm, we are subject to numerous governmental regulations, and the financial services industry as a whole is subject to significant regulatory reform initiatives in the United States and elsewhere.
PNC is a bank holding company (BHC) and a financial holding company and is subject to numerous governmental regulations involving both its business and organization.
Our businesses are subject to regulation by multiple banking, consumer protection, securities and derivatives regulatory bodies. Applicable laws and regulations restrict our ability to repurchase stock or to receive dividends from subsidiaries that operate in the banking and securities businesses and impose capital adequacy requirements. PNC's ability to service its obligations and pay dividends to shareholders is largely dependent on the receipt of dividends and advances from its subsidiaries, primarily PNC Bank. The Federal Reserve requires a BHC to act as a source of financial and managerial strength for its subsidiary banks. The Federal Reserve could require PNC to commit resources to PNC Bank when doing so is not otherwise in the interests of PNC or its shareholders or creditors.
Applicable laws and regulations restrict permissible activities and investments and require compliance with provisions designed to protect loan, deposit, brokerage, fiduciary, mutual fund and other customers, and for the protection of customer information, among other things. We are also subject to laws and regulations designed to combat money laundering, terrorist financing, and transactions with persons, companies or foreign governments designated by U.S. authorities.
Starting shortly after the beginning of the financial crisis in 2007, we have faced, and expect to continue to face for the foreseeable future, increased regulation of the financial services industry as a result of initiatives intended to promote the safety and soundness of financial institutions, financial market stability, the transparency and liquidity of financial markets, and consumer and investor protection. We also expect, in many cases, more intense scrutiny from bank,
consumer protection and other supervisors in the examination process and more aggressive enforcement of laws and regulations on both the federal and state levels. Compliance with regulations and other supervisory initiatives will likely increase the company's costs and reduce its revenue, and may limit the company's ability to pursue certain desirable business opportunities. New reforms will also introduce additional legal risk (including as a result of newly applicable antifraud and anti-manipulation provisions and private rights of action) and affect regulatory oversight, applicable capital and liquidity requirements, and residential mortgage and other consumer financial products. The consequences of noncompliance with applicable laws and regulations can include substantial monetary and nonmonetary sanctions as well as damage to our reputation and businesses.
A number of reform provisions are likely to significantly impact the ways in which banks and BHCs, including PNC, do business. Some of the reform initiatives have led to the formation of new regulatory bodies, such as the CFPB, which has authority to regulate consumer financial products and services sold by banks and non-bank companies and to supervise banks with assets of more than $10 billion and their affiliates for compliance with federal consumer protection laws. Other agencies have significant new powers relevant to PNC, such as the authority now held by the CFTC to regulate non security-based swaps, which, among other things, led PNC Bank to register with the CFTC as a swap dealer in early 2013.
See Supervision and Regulation in Item 1 of this Report for more information concerning the regulation of PNC and recent initiatives to reform financial institution regulation, including some of the matters discussed in this Risk Factor. Note 19 Regulatory Matters in the Notes To Consolidated Financial Statements in Item 8 of this Report also discusses some of the regulation applicable to PNC.
The following describes the key risks associated with some of the initiatives recently undertaken as part of the regulatory reform initiatives affecting the financial services industry, either where pending rules have not yet been finalized or where the impact of new rules has not been substantially realized.
| • | In December 2013, the U.S. banking agencies, the SEC and the CFTC adopted final rules implementing the Volcker Rule provisions of Dodd-Frank. The Volcker Rule prohibits banks and their affiliates from engaging in proprietary trading and acquiring and retaining ownership interests in, sponsoring, or having specified other financial relationships with certain types of private funds (referred to as covered funds), unless the activity qualifies for an exemption or exception under the Rule. We discuss the Volcker Rule in the Supervision and Regulation section included in Item 1 of this Report. PNC discontinued its designated proprietary trading operations several years ago. |
| The PNC Financial Services Group, Inc. – Form 10-K 19 |
| • | As of December 31, 2015, PNC held interests in private equity and hedge funds that are covered funds subject to the final Volcker Rule totaling approximately $446 million, including $128 million of sponsored funds. Certain of PNC's REIT preferred securities also were issued by statutory trusts that, as currently structured, are considered covered funds. As of December 31, 2015, PNC also held approximately $1.1 billion of senior debt interests in collateralized loan obligations and certain other investment securities that may be considered ownership interests in covered funds. The net unrealized gain associated with these securities was approximately $13 million. In December 2014, the Federal Reserve extended the conformance period for the Volcker Rule, which generally went into effect on July 21, 2015, to give all banking entities until July 21, 2016 to conform their ownership interests in, and relationships with, covered funds subject to the Volcker Rule that were held or existed, respectively, prior to December 31, 2013 (legacy covered fund interests and relationships). Moreover, the Federal Reserve also indicated its intent to grant an additional one-year extension of the conformance period until July 21, 2017 to conform their legacy covered fund interests and relationships. PNC's remaining ownership interests in and sponsorship relationships with covered funds qualify for this legacy covered fund extended conformance period. Moreover, certain of PNC's legacy covered fund interests may qualify for an additional 5-year conformance period (i.e., until July 21, 2022), subject to Federal Reserve approval. It is likely that at least some of the amounts invested in legacy covered funds will reduce over time in the ordinary course before compliance is required. A forced sale or restructuring of PNC's investments due to the Volcker Rule would likely result in PNC receiving less value than it would otherwise have received or experiencing other adverse consequences. In addition, if we cannot otherwise bring PNC's REIT preferred securities into compliance with the Volcker Rule during the applicable conformance period, we will need to redeem them. The next par redemption date for such securities is in March 2017. For additional information regarding the redemption terms of PNC's REIT preferred securities, see Note 16 Equity in the Notes To the Consolidated Financial Statements in Item 8 of this Report. |
| • | The Federal Reserve continues to develop certain enhanced prudential standards that are required under Dodd-Frank for bank holding companies with $50 billion or more in consolidated total assets, including the counterparty credit exposure limits and early remediation requirements that were the subject of proposed rules issued in December 2011. Under these proposed rules, PNC could be subject to increasingly |
stringent actions by the Federal Reserve if its financial condition or risk management deteriorated as reflected by the company's current or projected post-stress capital levels, compliance with supervisory liquidity and risk management standards and, in some instances, market-based indicators, such as credit default swap spreads. In addition, the Federal Reserve has indicated that it intends to continue to develop the set of enhanced prudential standards that apply to large BHCs in order to further promote the resiliency of such firms and the U.S. financial system. Until the Federal Reserve's rules and initiatives to establish these enhanced prudential standards are completed, we are unable to fully estimate their impact on PNC, although we expect these initiatives will result in increased compliance costs. |
| • | Dodd-Frank requires that the Federal Reserve, OCC, FDIC, National Credit Union Administration, SEC and Federal Housing Finance Agency jointly adopt regulations or guidelines to prohibit incentive-based compensation arrangements that are determined to encourage inappropriate risk-taking and require that a covered institution (which would include PNC and PNC Bank) provide its appropriate regulator information concerning the structure of its incentive-based compensation arrangements. The agencies in April 2011, requested public comment on proposed rules to implement these requirements, but agency officials have indicated that the rules will likely be re-proposed in modified form for public comment. The nature, scope and terms of any final regulations adopted by the agencies could negatively affect PNC's ability to attract and retain officers and employees with appropriate skills and experience and compete with non-bank financial services providers that would not be subject to these rules. |
| • | In October 2014, six federal agencies (the Federal Reserve, OCC, FDIC, SEC, Federal Housing Finance Agency and the Department of Housing and Urban Development) adopted final rules to implement the credit risk retention requirements of Section 941 of Dodd-Frank for asset-backed securitization transactions. The regulations specify when and how securitizers of different types of asset-backed securitizations, including transactions backed by residential mortgages, commercial mortgages, and commercial, credit card and auto loans, must comply with the Dodd-Frank requirement that they retain at least five percent of the credit risk of the assets being securitized. The final rules also implement the exemptions from these credit risk retention requirements for transactions that are backed by "qualified residential mortgages" or other high-quality commercial mortgage, commercial or automobile loans, each as defined in the final rules. The regulations took effect on December 24, 2015 |
| 20 The PNC Financial Services Group, Inc. – Form 10-K |
with respect to new securitization transactions backed by residential mortgages and will take effect on December 24, 2016 with respect to new securitization transactions backed by other types of assets. The final rules are likely to have an impact on PNC both directly as well as indirectly. Although the initial impact of the regulations that took effect in December 2015 has not been material, the ultimate extent and magnitude of these impacts is not yet known and will, to some extent, depend on how the markets and market participants (including PNC) adjust to the new rules. |
PNC also originates loans of a variety of types, including residential and commercial mortgages, credit card, auto, and student, that historically have commonly been securitized, and PNC is also a significant servicer of residential and commercial mortgages held by others, including securitization vehicles. PNC anticipates that the risk retention requirements will impact the market for loans of types that historically have been securitized, potentially affecting the volumes of loans securitized, the types of loan products made available, the terms on which loans are offered, consumer and business demand for loans, and the market for third-party loan servicers. The risk retention rules also could have the effect of slowing the rebound in the securitization markets. One effect of having substantially reduced opportunities to securitize loans would likely be a reduction in the willingness of banks, including PNC, to make loans due to balance sheet management requirements. Any of these potential impacts of the Dodd-Frank risk retention rules could affect the way in which PNC conducts its business, including its product offerings.
Even after new rules are finalized and become effective, it still may take a period of time before the manner in which the rules will be interpreted and administered by the relevant agencies becomes clarified and known. A failure to comply, or to have adequate policies and procedures designed to comply, with these and other regulatory requirements could expose us to damages, fines and regulatory penalties and other regulatory actions, which could be significant, and could also injure our reputation with customers and others with whom we do business.
New capital and liquidity standards will result in banks and bank holding companies needing to maintain more and higher quality capital and greater liquidity than has historically been the case.
We are subject to regulatory capital and liquidity requirements established by the Federal Reserve and the OCC, and discuss these requirements and standards in the Supervision and Regulation section included in Item 1 of this Report.
The regulatory capital requirements applicable to banks and BHCs have undergone, and continue to undergo, significant
changes. For example, the final rules adopted by the U.S. banking agencies in July 2013 to implement the new international guidelines for determining regulatory capital established by the Basel Committee known as "Basel III", as well as to implement certain provisions of Dodd-Frank, fundamentally altered the U.S. regulatory capital requirements for U.S. BHCs and banks. Significant parts of these rules are now effective for PNC, although as a result of the staggered effective dates of the rules many provisions are phased-in over a period of years, with the rules generally fully phased-in as of January 1, 2019. The Basel Committee, moreover, continues to consider additional, significant changes to the international capital framework for banking organizations, including modifications that would significantly alter the international frameworks governing the market risk capital requirements for trading positions and the standardized risk weighting approach for credit risk, establish a capital floor for banking organizations subject to the advanced approaches for the risk weighting of assets, modify the treatment of securitization positions, and seek to enhance the transparency and consistency of capital requirements amongst banks and jurisdictions. It is unclear how these or other initiatives by the Basel Committee may be finalized and implemented in the United States and, thus, we are unable to estimate what potential impact such initiatives may have on PNC.
The liquidity standards applicable to large U.S. banking organizations also are expected to be supplemented in the coming years. For example, the Basel Committee, in October 2014, released the final framework for the NSFR standard, which is designed to ensure that banking organizations maintain a stable, long-term funding profile in relation to their asset composition and off-balance sheet activities. Under that framework, the NSFR would take effect as a minimum regulatory standard on January 1, 2018. The U.S. banking agencies have not yet proposed rules to implement the NSFR and, thus, the potential impact of the rules on PNC remains unclear.
The need to maintain more and higher quality capital, as well as greater liquidity, going forward than historically has been required could limit PNC's business activities, including lending, and its ability to expand, either organically or through acquisitions. It could also result in PNC taking steps to increase its capital that may be dilutive to shareholders or being limited in its ability to pay dividends or otherwise return capital to shareholders, or selling or refraining from acquiring
assets, the capital requirements for which are inconsistent with the assets' underlying risks. In addition, the new liquidity standards require PNC to maintain holdings of highly liquid short-term investments, thereby reducing PNC's ability to invest in longer-term or less liquid assets even if more desirable from a balance sheet or interest rate risk management perspective. Moreover, although these new requirements are being phased in over time, U.S. federal banking agencies have been taking into account expectations regarding the ability of banks to meet these new requirements,
| The PNC Financial Services Group, Inc. – Form 10-K 21 |
including under stressed conditions, in approving actions that represent uses of capital, such as dividend increases, share repurchases and acquisitions. Moreover, PNC, as a BHC that is subject to the advanced approaches for regulatory capital purposes, is subject to a higher LCR requirement than other BHCs that have more than $50 billion in total assets but are not subject to the advanced approaches. Until the scope and terms of pending or future rulemakings relating to capital, liquidity, or liability composition are known, the extent to which such rules may apply to PNC and the potential impact of such rules on PNC will remain uncertain.
We depend on information systems, both internally and through third-parties, to conduct our business and could suffer a material adverse impact from interruptions in the effective operation of, or security breaches affecting, those systems.
As a large financial company, we handle a substantial volume of customer and other financial transactions virtually on a continuous basis. As a result, we rely heavily on information systems to conduct our business and to process, record, and monitor our transactions. In recent years, PNC has increased substantially in size, scope and complexity. We have also seen more customer usage of technological solutions for financial needs and higher expectations of customers and regulators regarding effective and safe systems operation. We expect these trends to continue for the foreseeable future. The need to ensure proper functioning of these systems has become more challenging, and the costs involved in that effort are greater than ever.
The risks to these systems result from a variety of factors, both internal and external. In some cases, these factors relate to the potential for bad acts on the part of hackers, criminals, foreign governments or their agents, employees and others, and to some extent will be beyond our ability to prevent. In other cases, our systems could fail to operate as needed, including failures to prevent access in an unauthorized manner, due to factors such as design or performance issues, human error, unexpected transaction volumes, or inadequate measures to protect against unauthorized access or transmissions. We are also at risk for the impact of natural or other disasters, terrorism, international hostilities and the like on our systems or for the effect of outages or other failures involving power or communications systems operated by others. In addition, we face a variety of types of cyber attacks, some of which are discussed in more detail below. Cyber attacks often include efforts to disrupt our ability to provide services or to gain access to, or destroy, confidential company and customer information.
We rely on other companies for the provision of a broad range of products and services. Many of these products and services include information systems themselves or involve the use of such systems in connection with providing the products or services. In some cases, these other companies provide the infrastructure that supports electronic communications. These
other companies are generally subject to many of the same risks we face with respect to our systems. To the extent we rely on these other companies, we could be adversely affected if they are impacted by system failures, cyber attacks or employee misconduct.
All of these types of events, whether resulting from cyber attacks or other internal or external sources, expose customer and other confidential information to security risks. They also could disrupt our ability to use our accounting, deposit, loan and other systems and could cause errors in transactions with customers, vendors or other counterparties.
In addition, our customers often use their own devices, such as computers, smartphones and tablets, to do business with us and may provide their PNC customer information (including passwords) to a third party in connection with obtaining services from the third party. We have limited ability to assure the safety and security of our customers' transactions with us and their customer information to the extent they are utilizing their own devices or providing third parties access to their accounts.
We are faced with ongoing efforts by others to breach data security at financial institutions or with respect to financial transactions. Some of these involve efforts to enter our systems directly by going through or around our security protections. Others involve the use of schemes such as "phishing" to gain access to identifying customer information, often from customers themselves. Most corporate and commercial transactions are now handled electronically, and our retail customers increasingly use online access and mobile devices to bank with us. The ability to conduct business with us in this manner depends on the transmission of confidential information, which increases the risk of data security breaches.
Starting in late 2012, there have been several well-publicized series of apparently related denial of service attacks on large financial services companies, including PNC. In a denial of service attack, individuals or organizations flood commercial websites with extraordinarily high volumes of traffic, with the goal of disrupting the ability of commercial enterprises to process transactions and possibly making their websites unavailable to customers for extended periods of time. The attacks against PNC have resulted in temporary disruptions in customers' ability to access the corporate website and to perform on-line banking transactions. To date, no customer data has been lost or compromised as a result of these attacks and these efforts have not had a material impact on PNC. We cannot, however, provide assurance that future attacks of this type might not have a greater effect on PNC.
As our customers regularly use PNC-issued credit and debit cards to pay for transactions with retailers and other businesses, there is the risk of data security breaches at those other businesses covering PNC account information. When our customers use PNC-issued cards to make purchases from
| 22 The PNC Financial Services Group, Inc. – Form 10-K |
those businesses, card account information may be provided to the business. If the business's systems that process or store card account information are subject to a data security breach, holders of our cards who have made purchases from that business may experience fraud on their card accounts. PNC may suffer losses associated with reimbursing our customers for such fraudulent transactions on customers' card accounts, as well as for other costs related to data security compromise events, such as replacing cards associated with compromised card accounts. In addition, PNC provides card transaction processing services to some merchant customers under agreements we have with payment networks such as Visa and MasterCard. Under these agreements, we may be responsible for certain losses and penalties if one of our merchant customers suffers a data security breach.
Over the last few years, several large retailers, prominently including Target and Home Depot, disclosed that they had suffered substantial data security breaches compromising millions of card accounts. To date, PNC's losses and costs related to these breaches have not been material, but other similar events in the future could be more significant to PNC.
There have been other recent publicly announced cyber attacks that were not focused on gaining access to credit card information but instead sought access to a range of other types of confidential information including internal emails and other forms of customer financial information or sought to capture and possibly shutdown systems and devices maintained by target companies. Notable examples include attacks in 2014 on JP Morgan Chase and Sony Pictures and in 2015 on Anthem. These other attacks have generally not had any financial impact on PNC but demonstrate the risks to confidential information and systems operations potentially posed by cyber attacks.
Methods used by others to attack information systems change frequently (with generally increasing sophistication), often are not recognized until launched against a target, may be supported by foreign governments or other well-financed entities, and may originate from less regulated and remote areas around the world. As a result, we may be unable to address these methods in advance of attacks, including by implementing adequate preventive measures.
We have policies, procedures and systems (including business continuity programs) designed to prevent or limit the effect of possible failures, interruptions or breaches in security of information systems. We design our business continuity and other information and technology risk management programs to manage our capabilities to provide services in the case of an event resulting in material disruptions of business activities affecting our employees, facilities, technology or suppliers. We regularly seek to test the effectiveness of and enhance these policies, procedures and systems.
Our ability to mitigate the adverse consequences of such occurrences is in part dependent on the quality of our business continuity planning and our ability to anticipate the timing and nature of any such event that occurs. The adverse impact of natural and other disasters, terrorist activities, international hostilities and the like could be increased to the extent that there is a lack of preparedness on the part of national or regional governments, including emergency responders, or on the part of other organizations and businesses with which we deal, particularly those on which we depend but have no control over.
In recent years, we have incurred significant expense towards improving the reliability of our systems and their security against external and internal threats. Nonetheless, there remains the risk that one or more adverse events might occur. If one does occur, we might not be able to remediate the event or its consequences timely or adequately. To the extent that the risk relates to products or services provided by others, we seek to engage in due diligence and monitoring to limit the risk, but here, as well, we cannot eliminate it. Should an adverse event affecting another company's systems occur, we may not have indemnification or other protection from the other company sufficient to compensate us or otherwise protect us from the consequences.
The occurrence of any failure, interruption or security breach of any of our information or communications systems, or the systems of other companies on which we rely, could result in a wide variety of adverse consequences to PNC. This risk is greater if the issue is widespread or results in financial losses to our customers. Possible adverse consequences include damage to our reputation or a loss of customer business. We also could face litigation or additional regulatory scrutiny. Litigation or regulatory actions in turn could lead to liability or other sanctions, including fines and penalties or reimbursement of customers adversely affected by a systems problem or security breach. Even if we do not suffer any material adverse consequences as a result of events affecting us directly, successful attacks or systems failures at other financial institutions could lead to a general loss of customer confidence in financial institutions, including PNC. Also, systems problems, including those resulting from third party attacks, whether at PNC or at our competitors, would likely increase regulatory and customer concerns regarding the functioning, safety and security of such systems generally. In that case, we would expect to incur even higher levels of costs with respect to prevention and mitigation of these risks.
We continually encounter technological change and we could falter in our ability to remain competitive in this arena.
The financial services industry is continually undergoing rapid technological change with frequent introductions of new technology-driven products and services. The effective use of technology increases efficiency and enables financial institutions to better serve customers and to reduce costs. We
| The PNC Financial Services Group, Inc. – Form 10-K 23 |
have been investing in technology and connectivity to automate functions previously performed manually, to facilitate the ability of customers to engage in financial transactions, and otherwise to enhance the customer experience with respect to our products and services. On the retail side, this has included developments such as more sophisticated ATMs and expanded access to banking transactions through the internet, smart phones, tablets and other remote devices. These efforts have all been in response to actual and anticipated customer behavior and expectations. Our continued success depends, in part, upon our ability to address the needs of our customers by using technology to provide products and services that satisfy customer demands, including demands for faster and more secure payment services, and create efficiencies in our operations. A failure to maintain or enhance our competitive position with respect to technology, whether because we fail to anticipate customer expectations or because our technological developments fail to perform as desired or are not rolled out in a timely manner, may cause us to lose market share or incur additional expense.
There are risks resulting from the extensive use of models in our business.
PNC relies on quantitative models to measure risks and to estimate certain financial values. Models may be used in such processes as determining the pricing of various products, grading loans and extending credit, measuring interest rate and other market risks, predicting or estimating losses, assessing capital adequacy, and calculating economic and regulatory capital levels, as well as to estimate the value of financial instruments and balance sheet items. Poorly designed or implemented models present the risk that our business decisions based on information incorporating model output will be adversely affected due to the inadequacy of that information. Also, information we provide to the public or to our regulators based on poorly designed or implemented models could be inaccurate or misleading. Some of the decisions that our regulators make, including those related to capital distributions to our shareholders, could be affected adversely due to their perception that the quality of the models used to generate the relevant information is insufficient. See the Model Risk Management portion of the Risk Management section included in Item 7 of this Report.
Our asset and liability valuations and the determination of the amount of loss allowances and impairments taken on our assets are highly subjective, and inaccurate estimates could materially impact our results of operations or financial position.
We must use estimates, assumptions, and judgments when assets and liabilities are measured and reported at fair value. Assets and liabilities carried at fair value inherently result in a higher degree of financial statement volatility. Changes in underlying factors or assumptions in any of the areas
underlying our estimates could materially impact our future financial condition and results of operations. During periods of market disruption, it may be more difficult to value certain of our assets if trading becomes less frequent and/or market data becomes less observable. There may be certain asset classes that were historically in active markets with significant observable data that rapidly become illiquid due to market volatility, a loss in market confidence or other factors. Further, rapidly changing and unprecedented market conditions in any particular market could materially impact the valuation of assets as reported within our consolidated financial statements.
The determination of the amount of loss allowances and asset impairments varies by asset type and is based upon our periodic evaluation and assessment of known and inherent risks associated with the respective asset class. Management updates its evaluations regularly and reflects changes in allowances and impairments in operations as such evaluations are revised. Although we have policies and procedures in place to determine loss allowance and asset impairments, due to the substantial subjective nature of this area, there can be no assurance that our management has accurately assessed the level of impairments taken and allowances reflected in our financial statements. Furthermore, additional impairments may need to be taken or allowances provided for in the future. Historical trends may not be indicative of future impairments or allowances.
Our business and financial results could be impacted materially by adverse results in legal proceedings.
Many aspects of our business involve substantial risk of legal liability. We have been named or threatened to be named as defendants in various lawsuits arising from our business activities (and in some cases from the activities of companies we have acquired). In addition, we are regularly the subject of governmental investigations and other forms of regulatory inquiry. We also are at risk when we have agreed to indemnify others for losses related to legal proceedings, including litigation and governmental investigations and inquiries, they face, such as in connection with the sale of a business or assets by us. The results of these legal proceedings could lead to significant monetary damages or penalties, restrictions on the way in which we conduct our business, or reputational harm.
Although we establish accruals for legal proceedings when information related to the loss contingencies represented by those matters indicates both that a loss is probable and that the amount of loss can be reasonably estimated, we do not have accruals for all legal proceedings where we face a risk of loss. In addition, due to the inherent subjectivity of the assessments and unpredictability of the outcome of legal proceedings, amounts accrued may not represent the ultimate loss to us from the legal proceedings in question. Thus, our ultimate losses may be higher, and possibly significantly so, than the amounts accrued for legal loss contingencies.
| 24 The PNC Financial Services Group, Inc. – Form 10-K |
We discuss further the unpredictability of legal proceedings and describe certain of our pending legal proceedings in Note 20 Legal Proceedings in the Notes To Consolidated Financial Statements in Item 8 of this Report.
PNC faces legal and regulatory risk arising out of its residential mortgage businesses.
Numerous federal and state governmental, legislative and regulatory authorities are investigating practices in the business of mortgage and home equity loan lending and servicing and in the mortgage-related insurance and reinsurance industries. PNC has received inquiries from governmental, legislative and regulatory authorities on these topics and is responding to these inquiries. These inquiries and investigations could lead to administrative, civil or criminal proceedings, possibly resulting in remedies including fines, penalties, restitution, alterations in our business practices and additional expenses and collateral costs. They could also result in reputational harm to PNC, either individually or as part of the overall industry, regardless of the extent to which PNC is penalized.
In addition to governmental or regulatory inquiries and investigations, PNC, like other companies with residential mortgage and home equity loan origination and servicing operations, faces the risk of class actions, other litigation and claims from: the owners of, investors in, or purchasers of such loans originated or serviced by PNC (or securities backed by such loans), homeowners involved in foreclosure proceedings or various mortgage-related insurance programs, downstream purchasers of homes sold after foreclosure, title insurers, and other potential claimants. Included among these claims are claims from purchasers of mortgage and home equity loans seeking the repurchase of loans where the loans allegedly breached origination covenants and representations and warranties made to the purchasers in the purchase and sale agreements.
At this time PNC cannot predict the ultimate overall cost to or effect upon PNC from governmental, legislative or regulatory actions and private litigation or claims arising out of residential mortgage and home equity loan lending, servicing or reinsurance practices, although such actions, litigation and claims could, individually or in the aggregate, result in significant expense. See Note 20 Legal Proceedings and Note 21 Commitments and Guarantees in the Notes To Consolidated Financial Statements in Item 8 of this Report for additional information regarding federal and state governmental, legislative and regulatory inquiries and investigations and additional information regarding potential repurchase obligations relating to mortgage and home equity loans.
There is a continuing risk of incurring costs related to further remedial and related efforts required by governmental or regulatory authorities and related to repurchase requests arising out of either the foreclosure process or origination
issues. Reputational damage arising out of this industry-wide inquiry could also have an adverse effect upon our existing mortgage and home equity loan business and could reduce future business opportunities. Investors in mortgage loans and other assets that we sell are more likely to seek indemnification from us against losses or otherwise seek to have us share in such losses.
The CFPB has issued new rules for mortgage origination and mortgage servicing. Both the origination and servicing rules create new private rights of action for consumers against lenders and servicers like PNC in the event of certain violations. For additional information concerning the mortgage rules, see Supervision and Regulation in Item 1 of this Report.
Additionally, two government-sponsored enterprises (GSEs) (FHLMC and FNMA) are currently in conservatorship, with their primary regulator acting as a conservator. We cannot predict when or if the conservatorships will end or whether, as a result of legislative or regulatory action, there will be any associated changes to the structure of these GSEs or the housing finance industry more generally, including, but not limited to, changes to the relationship among these GSEs, the government and the private markets. The effects of any such reform on our business and financial results are uncertain.
Our regional concentrations make us at risk to adverse economic conditions in our primary retail banking footprint.
Our retail banking business is primarily concentrated within our retail branch network footprint. Although our other businesses are national in scope, to a lesser extent these other businesses also have a greater presence within these primary geographic markets. Thus, we are particularly vulnerable to adverse changes in economic conditions in the Mid-Atlantic, Midwest, and Southeast regions.
We grow our business in part by acquiring other financial services companies or assets from time to time, and these acquisitions present a number of risks and uncertainties related both to the acquisition transactions themselves and to the integration of the acquired businesses into PNC after closing.
Acquisitions of other financial services companies, financial assets and related deposits and other liabilities present risks and uncertainties to PNC in addition to those presented by the nature of the business acquired.
In general, acquisitions may be substantially more expensive or take longer to complete than anticipated (including unanticipated costs incurred in connection with the integration of the acquired company). Anticipated benefits (including anticipated cost savings and strategic gains, for example resulting from being able to offer product sets to a broader
| The PNC Financial Services Group, Inc. – Form 10-K 25 |
potential customer base) may be significantly harder or take longer to achieve than expected or may not be achieved in their entirety as a result of unexpected factors or events.
Our ability to achieve anticipated results from acquisitions is often dependent also on the extent of credit losses in the acquired loan portfolios and the extent of deposit attrition, which are, in part, related to the state of economic and financial markets.
Also, litigation and governmental investigations that may be pending at the time of the acquisition or be filed or commenced thereafter, as a result of an acquisition or otherwise, could impact the timing or realization of anticipated benefits to PNC. Note 20 Legal Proceedings in the Notes To Consolidated Financial Statements in Item 8 of this Report describes several legal proceedings related to pre-acquisition activities of companies we have acquired, including National City. Other such legal proceedings may be commenced in the future.
Integration of an acquired company's business and operations into PNC, including conversion of the acquired company's different systems and procedures, may take longer than anticipated or be more costly than anticipated or have unanticipated adverse results relating to the acquired company's or PNC's existing businesses. In some cases, acquisitions involve our entry into new businesses or new geographic or other markets, and these situations also present risks and uncertainties in instances where we may be inexperienced in these new areas.
Our ability to analyze the risks presented by prospective acquisitions, as well as our ability to prepare in advance of closing for integration, depends, in part, on the information we can gather with respect to the target, which is more limited than the information we have regarding companies we already own.
As a regulated financial institution, our ability to pursue or complete attractive acquisition opportunities could be negatively impacted by regulatory delays or other regulatory issues. In addition, our ability to make large acquisitions in the future may be negatively impacted by regulatory rules or future regulatory initiatives designed to limit the potential for a financial institution to become "too big to fail."
We operate in a highly competitive environment, in terms of the products and services we offer and the geographic markets in which we conduct business, as well as in our labor markets where we compete for talented employees. Competition could adversely impact our customer acquisition, growth and retention, as well as our credit spreads and product pricing, causing us to lose market share and deposits and revenues.
We are subject to intense competition from various financial institutions as well as from non-bank entities that engage in
many similar activities without being subject to bank regulatory supervision and restrictions. This competition is described in Item 1 of this Report under "Competition." Competition in our industry could intensify as a result of the increasing consolidation of financial services companies, in connection with current market conditions or otherwise.
In all, the principal bases for competition are pricing (including the interest rates charged on loans or paid on interest-bearing deposits), product structure, the range of products and services offered, and the quality of customer service (including convenience and responsiveness to customer needs and concerns). The ability to access and use technology is an increasingly important competitive factor in the financial services industry, and it is a critically important component to customer satisfaction as it affects our ability to deliver the right products and services. Banks generally are facing the risk of increased competition from products and services offered by non-bank financial technology companies, particularly related to payment services.
Another increasingly competitive factor in the financial services industry is the competition to attract and retain talented employees across many of our business and support areas. This competition leads to increased expenses in many business areas and can also cause us to not pursue certain business opportunities. Limitations on the manner in which regulated financial institutions can compensate their officers and employees may make it more difficult for regulated financial institutions to compete with unregulated financial institutions for talent.
A failure to adequately address the competitive pressures we face could make it harder for us to attract and retain customers across our businesses. On the other hand, meeting these competitive pressures could require us to incur significant additional expense or to accept risk beyond what we would otherwise view as desirable under the circumstances. In addition, in our interest rate sensitive businesses, pressures to increase rates on deposits or decrease rates on loans could reduce our net interest margin with a resulting negative impact on our net interest income.
Our business and financial performance could be adversely affected, directly or indirectly, by disasters, natural or otherwise, by terrorist activities or by international hostilities.
Neither the occurrence nor the potential impact of disasters (such as earthquakes, hurricanes, tornadoes, floods and other severe weather conditions, pandemics, dislocations, fires, explosions, and other catastrophic accidents or events), terrorist activities and international hostilities can be predicted. However, these occurrences could impact us directly (for example, by causing significant damage to our facilities or preventing us from conducting our business in the ordinary course), or indirectly as a result of their impact on
| 26 The PNC Financial Services Group, Inc. – Form 10-K |
our borrowers, depositors, other customers, suppliers or other counterparties. We could also suffer adverse consequences to the extent that disasters, terrorist activities or international hostilities affect the financial markets or the economy in general or in any particular region. These types of impacts could lead, for example, to an increase in delinquencies, bankruptcies or defaults that could result in our experiencing higher levels of nonperforming assets, net charge-offs and provisions for credit losses.
Our ability to mitigate the adverse consequences of such occurrences is in part dependent on the quality of our resiliency planning, and our ability, if any, to anticipate the nature of any such event that occurs. The adverse impact of disasters or terrorist activities or international hostilities also could be increased to the extent that there is a lack of preparedness on the part of national or regional emergency responders or on the part of other organizations and businesses that we deal with, particularly those that we depend upon but have no control over.
ITEM 1B – UNRESOLVED STAFF COMMENTS
There are no SEC staff comments regarding PNC's periodic or current reports under the Exchange Act that are pending resolution.
ITEM 2 – PROPERTIES
Our executive and primary administrative offices are currently located at The Tower at PNC Plaza, Pittsburgh, Pennsylvania. The 33-story structure is owned by PNC Bank, National Association.
We own or lease numerous other premises for use in conducting business activities, including operations centers, offices, and branch and other facilities. We consider the facilities owned or occupied under lease by our subsidiaries to be adequate for the purposes of our business operations. We include here by reference the additional information regarding our properties in Note 9 Premises, Equipment and Leasehold Improvements in the Notes To Consolidated Financial Statements in Item 8 of this Report.
ITEM 3 – LEGAL PROCEEDINGS
See the information set forth in Note 20 Legal Proceedings in the Notes To Consolidated Financial Statements in Item 8 of this Report, which is incorporated here by reference.
ITEM 4 – MINE SAFETY DISCLOSURES
Not applicable
EXECUTIVE OFFICERS OF THE REGISTRANT
Information regarding each of our executive officers as of February 22, 2016 is set forth below. Executive officers do not have a stated term of office. Each executive officer has held the position or positions indicated or another executive position with the same entity or one of its affiliates for the past five years unless otherwise indicated below.
| Name | Age | Position with PNC | Year Employed (a) | |||||||
William S. Demchak | 53 | Chairman, President and Chief Executive Officer (b) | 2002 | |||||||
Joseph C. Guyaux | 65 | Senior Vice Chairman and President and Chief Executive Officer of PNC Mortgage | 1972 | |||||||
Orlando C. Esposito | 57 | Executive Vice President and Head of Asset Management Group | 1988 | |||||||
Neil F. Hall | 67 | Executive Vice President and Head of Retail Banking | 1995 | |||||||
Michael J. Hannon | 59 | Executive Vice President and Chief Credit Officer | 1982 | |||||||
Vicki C. Henn | 47 | Executive Vice President and Chief Human Resources Officer | 1994 | |||||||
Gregory B. Jordan | 56 | Executive Vice President, General Counsel and Chief Administrative Officer | 2013 | |||||||
Stacy M. Juchno | 40 | Executive Vice President and General Auditor | 2009 | |||||||
Karen L. Larrimer | 53 | Executive Vice President and Chief Customer Officer | 1995 | |||||||
Michael P. Lyons | 45 | Executive Vice President and Head of Corporate & Institutional Banking | 2011 | |||||||
E William Parsley, III | 50 | Executive Vice President, Treasurer and Chief Investment Officer | 2003 | |||||||
Robert Q. Reilly | 51 | Executive Vice President and Chief Financial Officer | 1987 | |||||||
Joseph E. Rockey | 51 | Executive Vice President and Chief Risk Officer | 1999 | |||||||
Steven Van Wyk | 57 | Executive Vice President and Head of Technology and Operations | 2013 | |||||||
Gregory H. Kozich | 52 | Senior Vice President and Controller | 2010 | |||||||
| (a) | Where applicable, refers to year employed by predecessor company. |
| (b) | Mr. Demchak also serves as a director. Biographical information for Mr. Demchak is included in "Election of Directors (Item 1)" in our proxy statement for the 2016 annual meeting of shareholders. See Item 10 of this Report. |
| The PNC Financial Services Group, Inc. – Form 10-K 27 |
Joseph C. Guyaux has served as Senior Vice Chairman since February 2012 and was appointed chief executive officer and president of PNC Mortgage in January 2015. Mr. Guyaux was Chief Risk Officer from February 2012 to January 2015, prior to which he served as President. Mr. Guyaux has announced that he will retire in the spring of 2016.
Orlando C. Esposito was appointed Executive Vice President and head of PNC's Asset Management Group in April 2013. Prior to being named to his current position, he held numerous leadership positions including Executive Vice President of Corporate Banking from November 2006 to April 2013.
Neil F. Hall has been an Executive Vice President since April 2012 and head of PNC's Retail Banking since February 2012. Prior to being named to his current position, Mr. Hall led the delivery of sales and service to PNC's retail and small business customers, directed branch banking, business banking, community development and PNC Investments. Mr. Hall has announced that he will retire on July 1, 2016.
Michael J. Hannon has served as Executive Vice President since February 2009, prior to which he served as Senior Vice President. He has served as Chief Credit Officer since November 2001. He also served as Interim Chief Risk Officer from December 2011 to February 2012.
Vicki C. Henn has served as Executive Vice President and Chief Human Resources Officer of PNC since July 2014. Ms. Henn joined PNC in 1994 and has held numerous management positions. Prior to being named to her current position, Ms. Henn was a Senior Vice President, responsible for Human Resources for Retail Banking.
Gregory B. Jordan joined PNC as Executive Vice President, General Counsel and Head of Regulatory and Government Affairs in October 2013. In February 2016, Mr. Jordan was also appointed Chief Administrative Officer. Prior to joining PNC, he served as the Global Managing Partner for the last 13 years of his 29 year tenure at Reed Smith LLP.
Stacy M. Juchno has served as Executive Vice President and General Auditor of PNC since April 2014. Ms. Juchno joined PNC in 2009 and previously served as a Senior Vice President and Finance Governance and Oversight Director.
Karen L. Larrimer was appointed Executive Vice President in May 2013. She has served as Chief Customer Officer since April 2014, prior to which she served as Chief Marketing Officer. Ms. Larrimer will become head of PNC's Retail Banking later this year in addition to retaining her role as Chief Customer Officer.
Michael P. Lyons has been an Executive Vice President since November 2011 and is head of PNC's Corporate and Institutional Banking. Prior to joining PNC in October 2011,
from May 2010 until October 2011, Mr. Lyons was head of corporate development and strategic planning for Bank of America.
E William Parsley, III has served as Treasurer and Chief Investment Officer since January 2004. He was appointed Executive Vice President in February 2009. In addition to retaining his current roles, Mr. Parsley will become head of PNC Mortgage in spring 2016 upon Mr. Guyaux's retirement.
Robert Q. Reilly was appointed Chief Financial Officer in August 2013. He served as the head of PNC's Asset Management Group from 2005 until April 2013. Previously, he held numerous management roles in both Corporate Banking and Asset Management. He was appointed Executive Vice President in February 2009.
Joseph E. Rockey was appointed Chief Risk Officer in January 2015. Prior to his appointment, Mr. Rockey led enterprise risk management and the Basel office within PNC's risk management organization. Mr. Rockey joined PNC in 1999 and was appointed Executive Vice President in January 2015.
Steven Van Wyk joined PNC as Head of Technology and Operations in January 2013. From 2007 until joining PNC, Mr. Van Wyk served as Global Chief Operating Officer for ING. He was appointed Executive Vice President of PNC in February 2013.
Gregory H. Kozich has served as a Controller of PNC since 2011. He was appointed as Senior Vice President in November 2010.
| 28 The PNC Financial Services Group, Inc. – Form 10-K |
DIRECTORS OF THE REGISTRANT
The name, age and principal occupation of each of our directors as of February 22, 2016 and the year he or she first became a director is set forth below:
| • | Charles E. Bunch, 66, Executive Chairman of PPG Industries, Inc. ( coatings, sealants and glass products ) (2007) |
| • | Paul W. Chellgren, 73, Operating Partner, Snow Phipps Group, LLC ( private equity ) (1995) |
| • | Marjorie Rodgers Cheshire, 47, President and Chief Operating Officer, A&R Development Corp. ( real estate development company ) (2014) |
| • | William S. Demchak, 53, Chairman, Chief Executive Officer and President of PNC (2013) |
| • | Andrew T. Feldstein, 51, Chief Executive Officer and Co-Chief Investment Officer of BlueMountain Capital Management, LLC ( asset management firm ) (2013) |
| • | Daniel R. Hesse, 62, Retired President and Chief Executive Officer of Sprint Corporation ( telecommunications ) (2016) |
| • | Kay Coles James, 66, President and Founder of The Gloucester Institute ( non-profit ) (2006) |
| • | Richard B. Kelson, 69, Chairman, President and Chief Executive Officer, ServCo LLC ( strategic sourcing, supply chain management ) (2002) |
| • | Anthony A. Massaro, 71, Retired Chairman and Chief Executive Officer of Lincoln Electric Holdings, Inc. ( manufacturer of welding and cutting products ) (2002) |
| • | Jane G. Pepper, 70, Retired President of the Pennsylvania Horticultural Society ( non-profit ) (1997) |
| • | Donald J. Shepard, 69, Retired Chairman of the Executive Board and Chief Executive Officer of AEGON N.V. ( insurance ) (2007) |
| • | Lorene K. Steffes, 70, Independent Business Advisor ( executive, business management and technical expertise ) (2000) |
| • | Dennis F. Strigl, 69, Retired President and Chief Operating Officer of Verizon Communications Inc. ( telecommunications ) (2001) |
| • | Thomas J. Usher, 73, Non-executive Chairman of Marathon Petroleum Corporation ( oil and gas industry ) (1992) |
| • | Michael J. Ward, 65, Chairman and Chief Executive Officer CSX Corporation ( railroads, transportation ) (2016) |
| • | Gregory D. Wasson, 57, Retired President and Chief Executive Officer of Walgreens Boots Alliance (pharmacy, health and wellbeing enterprise) (2015) |
PART II
ITEM 5 – MARKET FOR REGISTRANT'S COMMON EQUITY, RELATED STOCKHOLDER MATTERS AND ISSUER PURCHASES OF EQUITY SECURITIES
(a) (1) Our common stock is listed on the New York Stock Exchange and is traded under the symbol "PNC." At the close of business on February 17, 2016, there were 64,309 common shareholders of record.
Holders of PNC common stock are entitled to receive dividends when declared by the Board of Directors out of funds legally available for this purpose. Our Board of Directors may not pay or set apart dividends on the common stock until dividends for all past dividend periods on any series of outstanding preferred stock and certain outstanding capital securities issued by the parent company have been paid or declared and set apart for payment. The Board presently intends to continue the policy of paying quarterly cash dividends. The amount of any future dividends will depend on economic and market conditions, our financial condition and operating results, and other factors, including contractual restrictions and applicable government regulations and policies (such as those relating to the ability of bank and non-bank subsidiaries to pay dividends to the parent company and regulatory capital limitations). The amount of our dividend is also currently subject to the results of the supervisory assessment of capital adequacy and capital planning processes undertaken by the Federal Reserve and our primary bank regulators as part of the Comprehensive Capital Analysis and Review (CCAR) process as described in the Supervision and Regulation section in Item 1 of this Report.
The Federal Reserve has the power to prohibit us from paying dividends without its approval. For further information concerning dividend restrictions and other factors that could limit PNC's ability to pay dividends, as well as restrictions on loans, dividends or advances from bank subsidiaries to the parent company, see the Supervision and Regulation section in Item 1, Item 1A Risk Factors, the Capital portion of the Consolidated Balance Sheet Review section and the Liquidity Risk Management portion of the Risk Management section in Item 7, and Note 11 Borrowed Funds, Note 16 Equity and Note 19 Regulatory Matters in the Notes To Consolidated Financial Statements in Item 8 of this Report, which we include here by reference.
| The PNC Financial Services Group, Inc. – Form 10-K 29 |
We include here by reference additional information relating to PNC common stock under the Common Stock Prices/Dividends Declared section in the Statistical Information (Unaudited) section of Item 8 of this Report.
We include here by reference the information regarding our compensation plans under which PNC equity securities are authorized for issuance as of December 31, 2015 in the table (with introductory paragraph and notes) that appears under the caption "Approval of 2016 Incentive Award Plan – Item 3" in our Proxy Statement to be filed for the 2016 annual meeting of shareholders and is incorporated by reference herein and in Item 12 of this Report.
Our stock transfer agent and registrar is:
Computershare Trust Company, N.A.
250 Royall Street
Canton, MA 02021
800-982-7652
Registered shareholders may contact the above phone number regarding dividends and other shareholder services.
We include here by reference the information that appears under the Common Stock Performance Graph caption at the end of this Item 5.
| (a)(2) | None. |
| (b) | Not applicable. |
| (c) | Details of our repurchases of PNC common stock during the fourth quarter of 2015 are included in the following table: |
In thousands, except per share data
| 2015 period | Total shares purchased (a) | Average price paid per share | Total shares purchased as part of publicly announced programs (b) | Maximum number of shares that may yet be purchased under the programs (b) | ||||||||||||
October 1 – 31 | 2,528 | $ | 89.24 | 2,506 | 85,413 | |||||||||||
November 1 – 30 | 1,923 | $ | 94.06 | 1,923 | 83,490 | |||||||||||
December 1 – 31 | 1,379 | $ | 95.20 | 1,379 | 82,111 | |||||||||||
Total | 5,830 | $ | 92.24 | |||||||||||||
| (a) | Includes PNC common stock purchased in connection with our various employee benefit plans generally related to forfeitures of unvested restricted stock awards and shares used to cover employee payroll tax withholding requirements. Note 12 Employee Benefit Plans and Note 13 Stock Based Compensation Plans in the Notes To Consolidated Financial Statements in Item 8 of this Report include additional information regarding our employee benefit and equity compensation plans that use PNC common stock. |
| (b) | On March 11, 2015, we announced that our Board of Directors had approved the establishment of a new stock repurchase program authorization in the amount of 100 million shares of PNC common stock, effective April 1, 2015. Repurchases are made in open market or privately negotiated transactions and the timing and exact amount of common stock repurchases will depend on a number of factors including, among others, market and general economic conditions, economic capital and regulatory capital considerations, alternative uses of capital, the potential impact on our credit ratings, and contractual and regulatory limitations, including the results of the supervisory assessment of capital adequacy and capital planning processes undertaken by the Federal Reserve as part of the CCAR process. |
| Our 2015 capital plan, submitted as part of the CCAR process and accepted by the Federal Reserve, included share repurchase programs of up to $2.875 billion for the five quarter period beginning with the second quarter of 2015. This amount does not include share repurchases in connection with various employee benefit plans referenced in note (a). In the fourth quarter of 2015, in accordance with PNC's 2015 capital plan and under the share repurchase authorization in effect during that period, we repurchased 5.8 million shares of common stock on the open market, with an average price of $92.26 per share and an aggregate repurchase price of $.5 billion. |
| 30 The PNC Financial Services Group, Inc. – Form 10-K |
Common Stock Performance Graph
This graph shows the cumulative total shareholder return ( i.e. , price change plus reinvestment of dividends) on our common stock during the five-year period ended December 31, 2015, as compared with: (1) a selected peer group as set forth below and referred to as the "Peer Group;" (2) an overall stock market index, the S&P 500 Index; and (3) a published industry index, the S&P 500 Banks. The yearly points marked on the horizontal axis of the graph correspond to December 31 of that year. The stock performance graph assumes that $100 was invested on January 1, 2011 for the five-year period and that any dividends were reinvested. The table below the graph shows the resultant compound annual growth rate for the performance period.
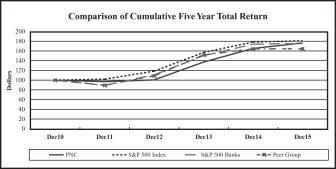
| Base Period | Assumes $100 investment at Close of Market on December 31, 2010 Total Return = Price change plus reinvestment of dividends | 5-Year Compound Growth Rate | ||||||||||||||||||||||||||
| Dec. 10 | Dec. 11 | Dec. 12 | Dec. 13 | Dec. 14 | Dec. 15 | |||||||||||||||||||||||
PNC | 100 | 96.94 | 100.49 | 137.13 | 164.99 | 176.22 | 12.00 | % | ||||||||||||||||||||
S&P 500 Index | 100 | 102.11 | 118.44 | 156.78 | 178.22 | 180.67 | 12.56 | % | ||||||||||||||||||||
S&P 500 Banks | 100 | 89.28 | 110.76 | 150.33 | 173.64 | 175.12 | 11.86 | % | ||||||||||||||||||||
Peer Group | 100 | 89.57 | 108.81 | 151.61 | 164.35 | 164.38 | 10.45 | % | ||||||||||||||||||||
The Peer Group for the preceding chart and table consists of the following companies: BB&T Corporation; Fifth Third Bancorp; KeyCorp; The PNC Financial Services Group, Inc.; SunTrust Banks, Inc.; U.S. Bancorp; Regions Financial Corporation; Wells Fargo & Company; Capital One Financial, Inc.; Bank of America Corporation; M&T Bank; and JP Morgan Chase and Company. This Peer Group was approved for 2015 by the Board's Personnel and Compensation Committee. Such Committee has approved the same peer group for 2016.
Each yearly point for the Peer Group is determined by calculating the cumulative total shareholder return for each company in the Peer Group from December 31, 2010 to December 31 of that year (End of Month Dividend Reinvestment Assumed) and then using the median of these returns as the yearly plot point.
In accordance with the rules of the SEC, this section, captioned "Common Stock Performance Graph," shall not be incorporated by reference into any of our future filings made under the Securities Exchange Act of 1934 or the Securities Act of 1933. The Common Stock Performance Graph, including its accompanying table and footnotes, is not deemed to be soliciting material or to be filed under the Exchange Act or the Securities Act.
| The PNC Financial Services Group, Inc. – Form 10-K 31 |
ITEM 6 – SELECTED FINANCIAL DATA
| Year ended December 31 | ||||||||||||||||||||||
| Dollars in millions, except per share data | 2015 (a) | 2014 (a) | 2013 (a) | 2012 (a) | 2011 | |||||||||||||||||
| S UMMARY O F O PERATIONS | ||||||||||||||||||||||
Interest income | $ | 9,323 | $ | 9,431 | $ | 10,007 | $ | 10,734 | $ | 10,194 | ||||||||||||
Interest expense | 1,045 | 906 | 860 | 1,094 | 1,494 | |||||||||||||||||
Net interest income | 8,278 | 8,525 | 9,147 | 9,640 | 8,700 | |||||||||||||||||
Noninterest income | 6,947 | 6,850 | 6,865 | 5,872 | 5,626 | |||||||||||||||||
Total revenue | 15,225 | 15,375 | 16,012 | 15,512 | 14,326 | |||||||||||||||||
Provision for credit losses | 255 | 273 | 643 | 987 | 1,152 | |||||||||||||||||
Noninterest expense | 9,463 | 9,488 | 9,681 | 10,486 | 9,022 | |||||||||||||||||
Income before income taxes and noncontrolling interests | 5,507 | 5,614 | 5,688 | 4,039 | 4,152 | |||||||||||||||||
Income taxes | 1,364 | 1,407 | 1,476 | 1,045 | 1,087 | |||||||||||||||||
Net income | 4,143 | 4,207 | 4,212 | 2,994 | 3,065 | |||||||||||||||||
Less: Net income (loss) attributable to noncontrolling interests | 37 | 23 | 11 | (7 | ) | 16 | ||||||||||||||||
Preferred stock dividends | 220 | 232 | 237 | 177 | 56 | |||||||||||||||||
Preferred stock discount accretion and redemptions | 5 | 5 | 12 | 4 | 2 | |||||||||||||||||
Net income attributable to common shareholders | $ | 3,881 | $ | 3,947 | $ | 3,952 | $ | 2,820 | $ | 2,991 | ||||||||||||
P ER C OMMON S HARE | ||||||||||||||||||||||
Basic earnings | $ | 7.52 | $ | 7.44 | $ | 7.45 | $ | 5.33 | $ | 5.69 | ||||||||||||
Diluted earnings | $ | 7.39 | $ | 7.30 | $ | 7.36 | $ | 5.28 | $ | 5.62 | ||||||||||||
Book value | $ | 81.84 | $ | 77.61 | $ | 72.07 | $ | 66.95 | $ | 61.44 | ||||||||||||
Cash dividends declared | $ | 2.01 | $ | 1.88 | $ | 1.72 | $ | 1.55 | $ | 1.15 | ||||||||||||
| (a) | Includes the impact of RBC Bank (USA), which we acquired on March 2, 2012. |
Certain prior period amounts have been reclassified to conform with the current period presentation, which we believe is more meaningful to readers of our consolidated financial statements.
This Selected Financial Data should be reviewed in conjunction with the Consolidated Financial Statements and Notes included in Item 8 of this Report as well as the other disclosure in this Report concerning our historical financial performance, our future prospects and the risks associated with our business and financial performance.
| 32 The PNC Financial Services Group, Inc. – Form 10-K |
| At or for the year ended December 31 | ||||||||||||||||||||||
| Dollars in millions, except as noted | 2015 (a) | 2014 (a) | 2013 (a) | 2012 (a) | 2011 | |||||||||||||||||
B ALANCE S HEET H IGHLIGHTS | ||||||||||||||||||||||
Assets (b) | $ | 358,493 | $ | 345,072 | $ | 320,192 | $ | 305,029 | $ | 271,141 | ||||||||||||
Loans (b) (c) | 206,696 | 204,817 | 195,613 | 185,856 | 159,014 | |||||||||||||||||
Allowance for loan and lease losses (b) | 2,727 | 3,331 | 3,609 | 4,036 | 4,347 | |||||||||||||||||
Interest-earning deposits with banks (b) (d) | 30,546 | 31,779 | 12,135 | 3,984 | 1,169 | |||||||||||||||||
Investment securities (b) | 70,528 | 55,823 | 60,294 | 61,406 | 60,634 | |||||||||||||||||
Loans held for sale (c) | 1,540 | 2,262 | 2,255 | 3,693 | 2,936 | |||||||||||||||||
Goodwill | 9,103 | 9,103 | 9,074 | 9,072 | 8,285 | |||||||||||||||||
Mortgage servicing rights | 1,589 | 1,351 | 1,636 | 1,071 | 1,117 | |||||||||||||||||
Equity investments (b) (e) | 10,587 | 10,728 | 10,560 | 10,799 | 10,070 | |||||||||||||||||
Other assets (b) (c) | 23,092 | 23,482 | 22,552 | 23,679 | 22,698 | |||||||||||||||||
Noninterest-bearing deposits | 79,435 | 73,479 | 70,306 | 69,980 | 59,048 | |||||||||||||||||
Interest-bearing deposits | 169,567 | 158,755 | 150,625 | 143,162 | 128,918 | |||||||||||||||||
Total deposits | 249,002 | 232,234 | 220,931 | 213,142 | 187,966 | |||||||||||||||||
Borrowed funds (b) (c) (f) | 54,532 | 56,768 | 46,105 | 40,907 | 36,704 | |||||||||||||||||
Total shareholders' equity | 44,710 | 44,551 | 42,334 | 38,948 | 34,010 | |||||||||||||||||
Common shareholders' equity | 41,258 | 40,605 | 38,392 | 35,358 | 32,374 | |||||||||||||||||
Accumulated other comprehensive income (loss) | 130 | 503 | 436 | 834 | (105 | ) | ||||||||||||||||
C LIENT I NVESTMENT A SSETS (billions) | ||||||||||||||||||||||
Discretionary client assets under management | $ | 134 | $ | 135 | $ | 127 | $ | 112 | $ | 107 | ||||||||||||
Nondiscretionary client assets under management | 125 | 128 | 120 | 112 | 103 | |||||||||||||||||
Total client assets under administration | 259 | 263 | 247 | 224 | 210 | |||||||||||||||||
Brokerage account client assets | 43 | 43 | 41 | 38 | 34 | |||||||||||||||||
Total | $ | 302 | $ | 306 | $ | 288 | $ | 262 | $ | 244 | ||||||||||||
S ELECTED R ATIOS | ||||||||||||||||||||||
Net interest margin (g) | 2.74 | % | 3.08 | % | 3.57 | % | 3.94 | % | 3.92 | % | ||||||||||||
Noninterest income to total revenue | 46 | 45 | 43 | 38 | 39 | |||||||||||||||||
Efficiency | 62 | 62 | 60 | 68 | 63 | |||||||||||||||||
Return on | ||||||||||||||||||||||
Average common shareholders' equity | 9.50 | 9.91 | 10.85 | 8.29 | 9.56 | |||||||||||||||||
Average assets | 1.17 | 1.28 | 1.38 | 1.02 | 1.16 | |||||||||||||||||
Loans to deposits | 83 | 88 | 89 | 87 | 85 | |||||||||||||||||
Dividend payout | 27.0 | 25.3 | 23.1 | 29.1 | 20.2 | |||||||||||||||||
Transitional Basel III common equity Tier 1 capital ratio (h) (i) (j) | 10.6 | 10.9 | N/A | N/A | N/A | |||||||||||||||||
Transitional Basel III Tier 1 risk-based capital ratio (h) (i) (j) | 12.0 | 12.6 | N/A | N/A | N/A | |||||||||||||||||
Pro forma fully phased-in Basel III common equity Tier 1 capital ratio (i) (j) (k) | 10.0 | 10.0 | 9.4 | 7.5 | N/A | |||||||||||||||||
Basel I Tier 1 common capital ratio (j) | N/A | N/A | 10.5 | 9.6 | 10.3 | |||||||||||||||||
Basel I Tier 1 risk-based capital ratio (j) | N/A | N/A | 12.4 | 11.6 | 12.6 | |||||||||||||||||
Common shareholders' equity to total assets | 11.5 | 11.8 | 12.0 | 11.6 | 11.9 | |||||||||||||||||
Average common shareholders' equity to average assets | 11.5 | 12.1 | 11.9 | 11.5 | 11.9 | |||||||||||||||||
S ELECTED S TATISTICS | ||||||||||||||||||||||
Employees | 52,513 | 53,587 | 54,433 | 56,285 | 51,891 | |||||||||||||||||
Retail Banking branches | 2,616 | 2,697 | 2,714 | 2,881 | 2,511 | |||||||||||||||||
ATMs | 8,956 | 8,605 | 7,445 | 7,282 | 6,806 | |||||||||||||||||
Residential mortgage servicing portfolio – Serviced for Third Parties (in billions) | $ | 123 | $ | 108 | $ | 114 | $ | 119 | $ | 118 | ||||||||||||
Commercial loan servicing portfolio – Serviced for PNC and Others (in billions) | $ | 447 | $ | 377 | $ | 347 | $ | 322 | $ | 309 | ||||||||||||
| (a) | Includes the impact of RBC Bank (USA), which we acquired on March 2, 2012. |
| (b) | Amounts include consolidated variable interest entities. See Consolidated Balance Sheet in Item 8 of this Report for additional information. |
| (c) | Amounts include assets and liabilities for which we have elected the fair value option. See Consolidated Balance Sheet in Item 8 of this Report for additional information. |
| (d) | Amounts include balances held with the Federal Reserve Bank of Cleveland of $30.0 billion, $31.4 billion, $11.7 billion, $3.5 billion and $.4 billion as of December 31, 2015, 2014, 2013, 2012 and 2011, respectively. |
| (e) | Amounts include our equity interest in BlackRock. |
| (f) | Includes long-term borrowings of $43.6 billion, $41.5 billion, $27.6 billion, $19.3 billion and $20.9 billion for 2015, 2014, 2013, 2012 and 2011, respectively. Borrowings which mature more than one year after December 31, 2015 are considered to be long-term. |
| (g) | Calculated as taxable-equivalent net interest income divided by average earning assets. The interest income earned on certain earning assets is completely or partially exempt from federal income tax. As such, these tax-exempt instruments typically yield lower returns than taxable investments. To provide more meaningful comparisons of net interest margins for all earning assets, we use net interest income on a taxable-equivalent basis in calculating net interest margin by increasing the interest income earned on tax-exempt assets to make it fully equivalent to interest income earned on taxable investments. This adjustment is not permitted under accounting principles generally accepted in the United States of America (GAAP) on the Consolidated Income Statement. The taxable-equivalent adjustments to net interest income for the years 2015, 2014, 2013, 2012 and 2011 were $196 million, $189 million, $168 million, $144 million and $104 million, respectively. |
| (h) | Calculated using the regulatory capital methodology applicable to PNC during 2015 and 2014, respectively. |
| (i) | See capital ratios discussion in the Supervision and Regulation section of Item 1 and in the Capital portion of the Consolidated Balance Sheet Review section in Item 7 of this Report for additional discussion on these capital ratios. |
| (j) | See additional information on the pro forma ratios, the 2014 Transitional Basel III ratios and Basel I ratios in the Statistical Information (Unaudited) section in Item 8 of this Report. |
| (k) | Pro forma ratios as of December 31, 2015, December 31, 2014 and December 31, 2013 were calculated under the standardized approach and the pro forma ratio as of December 31, 2012 was calculated under the advanced approaches. The 2012 and 2013 ratios have not been updated to reflect the first quarter 2014 adoption of ASU 2014-01 related to investments in low income housing tax credits. |
| The PNC Financial Services Group, Inc. – Form 10-K 33 |
ITEM 7 – MANAGEMENT'S DISCUSSION AND ANALYSIS OF FINANCIAL CONDITION AND RESULTS OF OPERATIONS (MD&A)
E XECUTIVE S UMMARY
Key Strategic Goals
At PNC we manage our company for the long term. We are focused on the fundamentals of growing customers, loans, deposits and fee revenue and improving profitability, while investing for the future and managing risk, expenses and capital. We continue to invest in our products, markets and brand, and embrace our corporate responsibility to the communities where we do business.
We strive to expand and deepen customer relationships by offering a broad range of deposit, fee-based and credit products and services. We are focused on delivering those products and services where, when and how our customers choose with the goal of offering insight that addresses their specific financial objectives. Our approach is concentrated on organically growing and deepening client relationships that meet our risk/return measures. Our strategies for growing fee income across our lines of business are focused on achieving deeper market penetration and cross selling our diverse product mix to meet the broad range of financial needs of our customers.
Our strategic priorities are designed to enhance value over the long term. A key priority is to build a leading banking franchise in our underpenetrated geographic markets. In addition, we are seeking to attract more of the investable assets of new and existing clients. PNC is focused on redefining the retail banking experience by transforming to a more customer-centric and sustainable model while lowering delivery costs as customer banking preferences evolve. Additionally, we continue to focus on expense management while investing in technology to bolster critical business infrastructure and streamline core processes.
Our capital priorities are to support client growth and business investment, maintain appropriate capital in light of economic conditions and the Basel III framework and return excess capital to shareholders, in accordance with the capital plan included in the current Comprehensive Capital Analysis and Review (CCAR) submission to the Board of Governors of the Federal Reserve System (Federal Reserve). New regulatory short-term liquidity standards became effective for PNC and PNC Bank, National Association (PNC Bank) beginning January 1, 2015. For more detail, see the Balance Sheet, Liquidity and Capital Highlights portion of this Executive Summary, the Capital portion of the Consolidated Balance Sheet Review section and the Liquidity Risk Management portion of the Risk Management section of this Item 7 and the
Supervision and Regulation section in Item 1 Business of this Report.
Key Factors Affecting Financial Performance
PNC faces a variety of risks that may impact various aspects of our risk profile from time to time. The extent of such impacts may vary depending on factors such as the current economic, political and regulatory environment, merger and acquisition activity and operational challenges. Many of these risks and our risk management strategies are described in more detail elsewhere in this Report.
Our financial performance is substantially affected by a number of external factors outside of our control, including the following:
| • | Domestic and global economic conditions, including the continuity, speed and stamina of the current U.S. economic expansion in general and its impact on our customers in particular; |
| • | The monetary policy actions and statements of the Federal Reserve and the Federal Open Market Committee (FOMC); |
| • | The level of, and direction, timing and magnitude of movement in, interest rates and the shape of the interest rate yield curve; |
| • | The functioning and other performance of, and availability of liquidity in, the capital and other financial markets; |
| • | Changes in the competitive and regulatory landscape and in counterparty creditworthiness and performance as the financial services industry restructures in the current environment; |
| • | The impact of the extensive reforms enacted by the Dodd-Frank legislation and other legislative, regulatory and administrative initiatives and actions, including those outlined elsewhere in this Report and in subsequent filings with the SEC; |
| • | The impact of market credit spreads on asset valuations; |
| • | Loan demand, utilization of credit commitments and standby letters of credit, and asset quality; and |
| • | Customer demand for non-loan products and services. |
In addition, our success will depend upon, among other things:
| • | Focused execution of our strategic priorities and achieving targeted outcomes, including our ability to: |
| • | Build a leading banking franchise in our underpenetrated geographic markets; |
| • | Grow profitability through the acquisition and retention of customers and deepening relationships that meet our risk/return measures; |
| • | Increase revenue from fee income and provide innovative and valued products and services to our customers; |
| 34 The PNC Financial Services Group, Inc. – Form 10-K |
| • | Bolster our critical infrastructure and streamline our core processes; |
| • | Utilize technology to develop and deliver products and services to our customers and protect PNC's systems and customer information; and |
| • | Sustain our expense management. |
| • | Effectively managing capital and liquidity including: |
| • | Continuing to maintain and grow our deposit base as a low-cost stable funding source; |
| • | Prudent liquidity and capital management to meet evolving regulatory capital, capital planning, stress testing and liquidity standards; and |
| • | Actions we take within the capital and other financial markets. |
| • | Managing credit risk in our portfolio; |
| • | Our ability to manage and implement strategic business objectives within the changing regulatory environment; |
| • | The impact of legal and regulatory-related contingencies; and |
| • | The appropriateness of reserves needed for critical accounting estimates and related contingencies. |
For additional information, see the Cautionary Statement Regarding Forward-Looking Information section in this Item 7 and Item 1A Risk Factors in this Report.
Table 1: Summary Financial Results
| Year ended December 31 | 2015 | 2014 | ||||||
Net income (millions) | $ | 4,143 | $ | 4,207 | ||||
Diluted earnings per common share from net income | $ | 7.39 | $ | 7.30 | ||||
Return from net income on: | ||||||||
Average common shareholders' equity | 9.50 | % | 9.91 | % | ||||
Average assets | 1.17 | % | 1.28 | % | ||||
Income Statement Highlights
Our performance in 2015 included the following:
| • | Net income for 2015 of $4.1 billion decreased 2% compared to 2014, as a 1% decline in revenue was partially offset by reductions in noninterest expense and the provision for credit losses. Lower revenue was driven by a 3% decrease in net interest income, offset in part by a 1% increase in noninterest income reflecting strong fee income growth. For additional detail, see the Consolidated Income Statement Review section in this Item 7. |
| • | Net interest income of $8.3 billion for 2015 decreased 3% compared to 2014 due to lower purchase accounting accretion and lower interest-earning asset yields, partially offset by commercial and commercial real estate loan growth and higher securities balances. |
| • | Net interest margin decreased to 2.74% for 2015 compared to 3.08% for 2014, principally due to the impact of increasing the company's liquidity position, lower benefit from purchase accounting accretion, and lower loan and securities yields. |
| • | Noninterest income of $6.9 billion for 2015 increased 1% compared with 2014, primarily driven by strong growth in consumer and corporate services fees and asset management revenue, partially offset by lower gains on asset sales and lower residential mortgage revenue. |
| • | The provision for credit losses decreased to $255 million for 2015 compared to $273 million for 2014 due to improved credit quality. |
| • | Noninterest expense decreased $25 million to $9.5 billion for 2015 compared to 2014, reflecting PNC's focus on expense management as higher personnel expense associated with higher business activity and investments in technology and business infrastructure were more than offset by lower legal and residential mortgage compliance costs and lower third party expenses. |
Credit Quality Highlights
| • | Overall credit quality in 2015 improved from 2014. For additional detail, see the Credit Risk Management portion of the Risk Management section of this Item 7. |
| • | Nonperforming assets decreased $.5 billion, or 16%, to $2.4 billion at December 31, 2015 compared to December 31, 2014. Nonperforming assets to total assets were 0.68% at December 31, 2015, compared to 0.83% at December 31, 2014. |
| • | Overall loan delinquencies of $1.6 billion at December 31, 2015 decreased $.3 billion, or 16%, compared with December 31, 2014. |
| • | Net charge-offs of $.4 billion in 2015 declined 27% compared to net charge-offs of $.5 billion for 2014. Net charge-offs were 0.19% of average loans in 2015 and 0.27% of average loans in 2014. |
| • | The allowance for loan and lease losses was 1.32% of total loans and 128% of nonperforming loans at December 31, 2015, compared with 1.63% and 133% at December 31, 2014, respectively. The decline in these ratios reflected PNC's implementation of its change in the derecognition policy for purchased impaired pooled consumer and residential real estate loans, effective December 31, 2015. This change resulted in the derecognition of the recorded investment balance included in total loans and the associated allowance for loan losses balance each by $468 million. |
| The PNC Financial Services Group, Inc. – Form 10-K 35 |
For additional detail, see the Credit Risk Management portion of the Risk Management section and the Purchase Accounting Accretion and Valuation of Purchased Impaired Loans portion of the Consolidated Balance Sheet Review of this Item 7.
Balance Sheet, Liquidity and Capital Highlights
PNC's balance sheet was well-positioned at December 31, 2015 reflecting strong liquidity and capital positions.
| • | Total loans increased by $1.9 billion to $206.7 billion at December 31, 2015 compared to December 31, 2014. |
| • | Total commercial lending grew $5.2 billion, or 4%, as a result of increases in commercial real estate and commercial loans. |
| • | Total consumer lending decreased $3.3 billion, or 4%, due to declines in home equity, education, and automobile loans, and included declines in the non-strategic consumer loan portfolio. |
| • | Total deposits increased $16.8 billion, or 7%, to $249.0 billion at December 31, 2015 compared with December 31, 2014, reflecting overall strong deposit growth. |
| • | Investment securities increased $14.7 billion, or 26%, to $70.5 billion at December 31, 2015 compared to December 31, 2014. |
| • | PNC's balance sheet remained core funded with a loans to deposits ratio of 83% at December 31, 2015. |
| • | PNC maintained a strong liquidity position. |
| • | New regulatory short-term liquidity standards became effective for PNC and PNC Bank as advanced approaches banking organizations beginning January 1, 2015, with a minimum phased-in Liquidity Coverage Ratio (LCR) requirement of 80% in 2015, calculated as of month end. |
| • | The Liquidity Coverage Ratio at December 31, 2015 exceeded 100% for both PNC and PNC Bank. |
| • | PNC maintained a strong capital position. |
| • | The Transitional Basel III common equity Tier 1 capital ratio was 10.6% at December 31, 2015 and 10.9% at December 31, 2014, calculated using the regulatory capital methodologies applicable to PNC during 2015 and 2014, respectively. |
| • | Pro forma fully phased-in Basel III common equity Tier 1 capital ratio was an estimated 10.0% at both December 31, 2015 and December 31, 2014 based on the standardized approach rules. See the Capital discussion and Table 19 in the Consolidated Balance Sheet Review section of this Item 7 and the December 31, 2014 capital ratio tables in the Statistical Information (Unaudited) section in Item 8 of this Report for more detail. |
| • | PNC returned capital to shareholders during 2015. |
| • | For full year 2015, PNC repurchased 22.3 million common shares for $2.1 billion. |
| • | In April 2015, the Board of Directors raised the quarterly cash dividend on common stock to 51 cents per share, an increase of 3 cents per share, or 6%, effective with the May dividend. |
| • | In May 2015, we redeemed $500 million of PNC's Fixed-to-Floating Rate Non-Cumulative Perpetual Preferred Stock, Series K, as well as all Depositary Shares representing interests therein. |
See the Capital portion of the Consolidated Balance Sheet Review for more detail on the 2015 preferred stock redemption and common share repurchases, including the completion of share repurchases included in our 2014 capital plan and repurchases authorized by our 2015 capital plan, and the Liquidity Risk Management portion of the Risk Management section of this Item 7 for more detail on our other 2015 capital and liquidity actions.
Our ability to take certain capital actions, including plans to pay or increase common stock dividends or to repurchase shares under current or future programs, is subject to the results of the supervisory assessment of capital adequacy undertaken by the Federal Reserve as part of the CCAR process. For additional information, see the Supervision and Regulation section in Item 1 Business of this Report.
Our Consolidated Income Statement and Consolidated Balance Sheet Review sections of this Item 7 describe in greater detail the various items that impacted our results during 2015 and 2014 and balances at December 31, 2015 and December 31, 2014, respectively.
| 36 The PNC Financial Services Group, Inc. – Form 10-K |
Average Consolidated Balance Sheet Highlights
Table 2: Summarized Average Balance Sheet
| Year ended December 31 | Change | |||||||||||||||
| Dollars in millions | 2015 | 2014 | $ | % | ||||||||||||
Average assets | ||||||||||||||||
Interest-earning assets | ||||||||||||||||
Investment securities | $ | 61,665 | $ | 55,820 | $ | 5,845 | 10 | % | ||||||||
Loans | 205,349 | 199,648 | 5,701 | 3 | % | |||||||||||
Interest-earning deposits with banks | 32,908 | 19,204 | 13,704 | 71 | % | |||||||||||
Other | 8,903 | 8,633 | 270 | 3 | % | |||||||||||
Total interest-earning assets | 308,825 | 283,305 | 25,520 | 9 | % | |||||||||||
Noninterest-earning assets | 46,139 | 44,548 | 1,591 | 4 | % | |||||||||||
Total average assets | $ | 354,964 | $ | 327,853 | $ | 27,111 | 8 | % | ||||||||
Average liabilities and equity | ||||||||||||||||
Interest-bearing liabilities | ||||||||||||||||
Interest-bearing deposits | $ | 163,965 | $ | 152,814 | $ | 11,151 | 7 | % | ||||||||
Borrowed funds | 56,513 | 48,817 | 7,696 | 16 | % | |||||||||||
Total interest-bearing liabilities | 220,478 | 201,631 | 18,847 | 9 | % | |||||||||||
Noninterest-bearing deposits | 76,398 | 70,108 | 6,290 | 9 | % | |||||||||||
Other liabilities | 12,210 | 10,768 | 1,442 | 13 | % | |||||||||||
Equity | 45,878 | 45,346 | 532 | 1 | % | |||||||||||
Total average liabilities and equity | $ | 354,964 | $ | 327,853 | $ | 27,111 | 8 | % | ||||||||
Total assets were $358.5 billion at December 31, 2015 compared with $345.1 billion at December 31, 2014. The increase from year end 2014 was primarily due to higher investment securities and loan growth.
Various seasonal and other factors impact our period-end balances, whereas average balances are generally more indicative of underlying business trends apart from the impact of acquisitions and divestitures. The Consolidated Balance Sheet Review section of this Item 7 provides information on changes in selected Consolidated Balance Sheet categories at December 31, 2015 compared with December 31, 2014.
Average investment securities increased during 2015 compared with 2014, primarily due to increases in average agency residential mortgage-backed securities and U.S. Treasury and government agency securities, partially offset by a decrease in average non-agency residential mortgage-backed securities.
Total investment securities comprised 20% of average interest-earning assets in 2015 and 2014.
Average loans grew in 2015, driven by increases in average commercial loans of $5.7 billion and average commercial real estate loans of $2.5 billion. These increases were partially offset by a decrease in consumer loans of $2.4 billion primarily attributable to lower home equity and education loans, which included declines in the non-strategic consumer loan portfolio.
Loans represented 66% of average interest-earning assets for 2015 and 70% of average interest-earning assets for 2014.
Average interest-earning deposits with banks, which are primarily maintained with the Federal Reserve Bank, increased significantly in the comparison to the prior year in part due to regulatory short-term liquidity standards phased in starting January 1, 2015 and also due to deposit growth.
Average noninterest-earning assets increased in 2015 compared with 2014, primarily driven by higher receivables from unsettled securities sales, which are included in noninterest-earning assets for average balance sheet purposes, and an increase in trading assets, primarily net customer-related derivatives values.
Average total deposits increased $17.4 billion, or 8%, in 2015 compared with the prior year, primarily due to increases in average money market deposits, average noninterest-bearing deposits and average interest-bearing demand deposits driven by both commercial and retail deposit growth.
Average total deposits represented 68% of average total assets for 2015 and 2014.
Average borrowed funds increased in 2015 compared with 2014 primarily due to increases in average Federal Home Loan Bank (FHLB) borrowings and average bank notes and senior debt. These increases were partially offset by a decline in average commercial paper balances, in part due to actions to enhance PNC's funding structure in light of regulatory liquidity standards and a rating agency methodology change. The Liquidity Risk Management portion of the Risk Management section of this Item 7 includes additional information regarding our borrowed funds.
| The PNC Financial Services Group, Inc. – Form 10-K 37 |
Business Segment Highlights
Total business segment earnings were $4.0 billion in 2015 and $3.9 billion in 2014. The Business Segments Review section of this Item 7 includes further analysis of our business segment results during 2015 and 2014, including presentation differences from Note 23 Segment Reporting in our Notes To Consolidated Financial Statements in Item 8 of this Report. Note 23 Segment Reporting presents results of businesses for 2015, 2014 and 2013, as well as a reconciliation of total business segment earnings to PNC total consolidated net income as reported on a GAAP basis.
Table 3: Results Of Businesses – Summary (a)
(Unaudited)
| Year ended December 31 | Net Income | Revenue | Average Assets (b) | |||||||||||||||||||||
| In millions | 2015 | 2014 | 2015 | 2014 | 2015 | 2014 | ||||||||||||||||||
Retail Banking | $ | 907 | $ | 728 | $ | 6,449 | $ | 6,049 | $ | 73,240 | $ | 75,046 | ||||||||||||
Corporate & Institutional Banking | 2,031 | 2,106 | 5,429 | 5,476 | 132,032 | 122,927 | ||||||||||||||||||
Asset Management Group | 194 | 181 | 1,161 | 1,107 | 7,920 | 7,745 | ||||||||||||||||||
Residential Mortgage Banking | 26 | 35 | 734 | 800 | 6,840 | 7,857 | ||||||||||||||||||
BlackRock | 548 | 530 | 717 | 703 | 6,983 | 6,640 | ||||||||||||||||||
Non-Strategic Assets Portfolio | 301 | 367 | 445 | 587 | 6,706 | 8,338 | ||||||||||||||||||
Total business segments | 4,007 | 3,947 | 14,935 | 14,722 | 233,721 | 228,553 | ||||||||||||||||||
Other (c) (d) (e) | 136 | 260 | 290 | 653 | 121,243 | 99,300 | ||||||||||||||||||
Total | $ | 4,143 | $ | 4,207 | $ | 15,225 | $ | 15,375 | $ | 354,964 | $ | 327,853 | ||||||||||||
| (a) | Our business information is presented based on our internal management reporting practices. We periodically refine our internal methodologies as management reporting practices are enhanced. Net interest income in business segment results reflects PNC's internal funds transfer pricing methodology. Assets receive a funding charge and liabilities and capital receive a funding credit based on a transfer pricing methodology that incorporates product repricing characteristics, tenor and other factors. In the first quarter of 2015, enhancements were made to PNC's funds transfer pricing methodology primarily for costs related to the new regulatory short-term liquidity standards. The enhancements incorporate an additional charge assigned to assets, including for unfunded loan commitments. Conversely, a higher transfer pricing credit has been assigned to those deposits that are accorded higher value under LCR rules for liquidity purposes. These adjustments apply to business segment results, primarily favorably impacting Retail Banking and adversely impacting Corporate & Institutional Banking, prospectively beginning with the first quarter of 2015. Prior periods have not been adjusted due to the impracticability of estimating the impact of the change for prior periods. |
| (b) | Period-end balances for BlackRock. |
| (c) | "Other" average assets include investment securities associated with asset and liability management activities. |
| (d) | "Other" includes differences between the total business segment financial results and our total consolidated net income. Additional detail is included in Note 23 Segment Reporting in the Notes To Consolidated Financial Statements in Item 8 of this Report. |
| (e) | The decrease in net income during 2015 compared to 2014 for "Other" primarily reflected lower noninterest income and net interest income, partially offset by lower noninterest expense. |
C ONSOLIDATED I NCOME S TATEMENT R EVIEW
Our Consolidated Income Statement is presented in Item 8 of this Report.
Net income for 2015 of $4.1 billion decreased 2% compared to 2014, as a 1% decline in revenue was partially offset by reductions in noninterest expense and the provision for credit losses. Lower revenue was driven by a 3% decrease in net interest income, offset in part by a 1% increase in noninterest income reflecting strong fee income growth.
Net Interest Income
Table 4: Net Interest Income and Net Interest Margin
| Year ended December 31 | ||||||||
| Dollars in millions | 2015 | 2014 | ||||||
Net interest income | $ | 8,278 | $ | 8,525 | ||||
Net interest margin | 2.74 | % | 3.08 | % | ||||
Changes in net interest income and margin result from the interaction of the volume and composition of interest-earning assets and related yields, interest-bearing liabilities and related rates paid, and noninterest-bearing sources of funding. See the Statistical Information (Unaudited) – Average Consolidated Balance Sheet And Net Interest Analysis and Analysis Of Year-To-Year Changes In Net Interest Income in Item 8 of this Report and the discussion of purchase accounting accretion on purchased impaired loans in the Consolidated Balance Sheet Review section in this Item 7 for additional information.
Net interest income decreased $247 million, or 3%, in 2015 compared with 2014 due to lower purchase accounting accretion and lower interest-earning asset yields driven by the ongoing low rate environment, partially offset by commercial and commercial real estate loan growth and higher securities balances. The decline also reflected the impact from the second quarter 2014 correction to reclassify certain commercial facility fees from net interest income to noninterest income.
| 38 The PNC Financial Services Group, Inc. – Form 10-K |
Net interest margin decreased in the comparison to the prior year, driven by a 32 basis point decline in the yield on total interest-earning assets, which was principally due to the impact of increasing the company's liquidity position, lower loan and securities yields, and lower benefit from purchase accounting accretion. The decline also included the impact of the second quarter 2014 correction to reclassify certain commercial facility fees.
We expect net interest income for the first quarter of 2016 to be stable, compared with fourth quarter 2015 in light of an unlikely increase in interest rates during the first quarter of 2016. For full year 2016, we expect purchase accounting accretion to be down approximately $175 million compared to 2015.
Noninterest Income
Table 5: Noninterest Income
| Year ended December 31 | Change | |||||||||||||||
| Dollars in millions | 2015 | 2014 | $ | % | ||||||||||||
Noninterest income | ||||||||||||||||
Asset management | $ | 1,567 | $ | 1,513 | $ | 54 | 4 | % | ||||||||
Consumer services | 1,335 | 1,254 | 81 | 6 | % | |||||||||||
Corporate services | 1,491 | 1,415 | 76 | 5 | % | |||||||||||
Residential mortgage | 566 | 618 | (52 | ) | (8 | )% | ||||||||||
Service charges on deposits | 651 | 662 | (11 | ) | (2 | )% | ||||||||||
Net gains on sales of securities | 43 | 4 | 39 | * | ||||||||||||
Other | 1,294 | 1,384 | (90 | ) | (7 | )% | ||||||||||
Total noninterest income | $ | 6,947 | $ | 6,850 | $ | 97 | 1 | % | ||||||||
* – Not meaningful
Noninterest income in 2015 increased compared to the prior year, driven by strong growth in consumer and corporate services fees and asset management revenue, partially offset by lower gains on asset sales and lower residential mortgage revenue. Noninterest income as a percentage of total revenue was 46% for 2015, up from 45% for 2014.
Asset management revenue increased in 2015 compared to 2014, driven by new sales production and stronger average equity markets, as well as the benefit from a $30 million trust settlement during the second quarter of 2015. Discretionary client assets under management in the Asset Management Group were $134 billion at December 31, 2015 compared with $135 billion at December 31, 2014.
Consumer service fees increased in the comparison to the prior year, primarily due to growth in customer-initiated transaction volumes related to debit card, credit card and merchant services activity, along with higher brokerage revenue.
Corporate service fees increased in 2015 compared to 2014, driven by higher treasury management, commercial mortgage servicing and equity capital markets advisory fees, partially offset by lower mergers and acquisition advisory fees. The increase also reflected the impact of the correction to reclassify certain commercial facility fees from net interest income to noninterest income beginning in the second quarter of 2014.
Residential mortgage revenue decreased in 2015 compared to 2014, primarily due to lower loan sales and servicing revenue, partially offset by higher net hedging gains on residential mortgage servicing rights.
Other noninterest income decreased in 2015 compared to the prior year, primarily attributable to lower gains on asset dispositions, including the impact of the fourth quarter 2014 gain of $94 million on the sale of PNC's Washington, D.C. regional headquarters building and lower gains on sales of Visa Class B common shares.
Gains on sales of two million Visa Class B Common shares equaled $169 million in 2015 compared to gains of $209 million on sales of 3.5 million shares in 2014. As of December 31, 2015, we held approximately 4.9 million Visa Class B common shares with a fair value of approximately $622 million and a recorded investment of approximately $31 million.
Other noninterest income typically fluctuates from period to period depending on the nature and magnitude of transactions completed. Further details regarding our customer-related trading activities are included in the Market Risk Management – Customer-Related Trading Risk portion of the Risk Management section of this Item 7. Further details regarding private and other equity investments are included in the Market Risk Management – Equity And Other Investment Risk section, and further details regarding gains or losses related to our equity investment in BlackRock are included in the Business Segments Review section of this Item 7.
In the first quarter of 2016, we expect fee income, consisting of asset management, consumer services, corporate services, residential mortgage and service charges on deposits, to be down mid-single digits, on a percentage basis, compared with the fourth quarter of 2015 due to seasonality and typically lower first quarter client activity. Continued volatility in the equity markets in combination with other economic factors could add to pressure on noninterest income. For full year 2016, we expect modest growth in revenue.
| The PNC Financial Services Group, Inc. – Form 10-K 39 |
Provision For Credit Losses
The provision for credit losses totaled $255 million in 2015 compared with $273 million in 2014, reflecting improved credit quality.
We expect our provision for credit losses in the first quarter of 2016 to be between $75 million and $125 million. The performance of certain energy related loans during the first quarter could result in provision for credit losses at the high end of this range.
The Credit Risk Management portion of the Risk Management section of this Item 7 includes additional information regarding factors impacting the provision for credit losses.
Noninterest Expense
Noninterest expense decreased $25 million to $9.5 billion in 2015 compared to 2014, reflecting PNC's focus on expense management. Higher personnel expense associated with higher business activity and investments in technology and business infrastructure were more than offset by lower legal and residential mortgage compliance costs and third party expenses, as well as the impact of the fourth quarter 2014 contribution to the PNC Foundation.
During 2015, we completed actions and exceeded our 2015 continuous improvement program goal of $500 million in cost savings. The program focuses on reducing costs in part to fund investments in technology and business infrastructure. In 2016, we have a goal of $400 million in cost savings through our continuous improvement program, which we expect will help to fund a significant portion of our business and technology investments.
For the first quarter of 2016, we expect noninterest expense to be down low-single digits, on a percentage basis, compared with the fourth quarter of 2015. For full year 2016, we expect total noninterest expense to be stable compared to 2015.
Effective Income Tax Rate
The effective income tax rate was 24.8% for 2015 compared with 25.1% for 2014. The effective tax rate is generally lower than the statutory rate primarily due to tax credits PNC receives from our investments in low income housing and new markets investments, as well as earnings in other tax exempt investments.
The effective tax rate for 2015 included tax benefits attributable to settling acquired entity tax contingencies.
We expect our 2016 effective tax rate to be between 25% and 26%.
C ONSOLIDATED B ALANCE S HEET R EVIEW
Table 6: Summarized Balance Sheet Data
Dollars in millions | December 31 2015 | December 31 2014 | Change | |||||
| $ | % | |||||||
Assets | ||||||||
Interest-earning deposits with banks | $30,546 | $31,779 | $(1,233) | (4)% | ||||
Loans held for sale | 1,540 | 2,262 | (722) | (32)% | ||||
Investment securities | 70,528 | 55,823 | 14,705 | 26% | ||||
Loans | 206,696 | 204,817 | 1,879 | 1% | ||||
Allowance for loan and lease losses | (2,727) | (3,331) | 604 | (18)% | ||||
Goodwill | 9,103 | 9,103 | – | –% | ||||
Mortgage servicing rights | 1,589 | 1,351 | 238 | 18% | ||||
Other intangible assets | 379 | 493 | (114) | (23)% | ||||
Other, net | 40,839 | 42,775 | (1,936) | (5)% | ||||
Total assets | $358,493 | $345,072 | $13,421 | 4% | ||||
Liabilities | ||||||||
Deposits | $249,002 | $232,234 | $16,768 | 7% | ||||
Borrowed funds | 54,532 | 56,768 | (2,236) | (4)% | ||||
Other | 8,979 | 9,996 | (1,017) | (10)% | ||||
Total liabilities | 312,513 | 298,998 | 13,515 | 5% | ||||
Equity | ||||||||
Total shareholders' equity | 44,710 | 44,551 | 159 | –% | ||||
Noncontrolling interests | 1,270 | 1,523 | (253) | (17)% | ||||
Total equity | 45,980 | 46,074 | (94) | –% | ||||
Total liabilities and equity | $358,493 | $345,072 | $13,421 | 4% | ||||
| 40 The PNC Financial Services Group, Inc. – Form 10-K |
The summarized balance sheet data above is based upon our Consolidated Balance Sheet in Item 8 of this Report.
PNC's balance sheet reflected asset growth and strong liquidity and capital positions at December 31, 2015.
| • | Total assets increased in 2015 compared to the prior year primarily due to an increase of $14.7 billion in investment securities driven by deposit growth. |
| • | Total liabilities increased in 2015 compared to 2014 mainly due to an increase in deposits. |
| • | Total equity in 2015 remained relatively stable compared to the prior year mainly due to increased retained earnings driven by net income, offset by share repurchases and the redemption of preferred stock. |
Loans
Outstanding loan balances of $206.7 billion at December 31, 2015 and $204.8 billion at December 31, 2014 were net of unearned income, net deferred loan fees, unamortized discounts and premiums, and purchase discounts and premiums totaling $1.4 billion at December 31, 2015 and $1.7 billion at December 31, 2014. The balances include purchased impaired loans but do not include future accretable net interest on those loans.
Table 7: Details Of Loans
| December 31 | December 31 | Change | ||||||||||||||
| Dollars in millions | 2015 | 2014 | $ | % | ||||||||||||
Commercial lending | ||||||||||||||||
Commercial | ||||||||||||||||
Manufacturing | $ | 19,014 | $ | 18,744 | $ | 270 | 1 | % | ||||||||
Retail/wholesale trade | 16,661 | 16,972 | (311 | ) | (2 | )% | ||||||||||
Service providers | 13,970 | 14,103 | (133 | ) | (1 | )% | ||||||||||
Real estate related (a) | 11,659 | 10,812 | 847 | 8 | % | |||||||||||
Health care | 9,210 | 9,017 | 193 | 2 | % | |||||||||||
Financial services | 7,234 | 6,178 | 1,056 | 17 | % | |||||||||||
Other industries | 20,860 | 21,594 | (734 | ) | (3 | )% | ||||||||||
Total commercial | 98,608 | 97,420 | 1,188 | 1 | % | |||||||||||
Commercial real estate | ||||||||||||||||
Real estate projects (b) | 15,697 | 14,577 | 1,120 | 8 | % | |||||||||||
Commercial mortgage | 11,771 | 8,685 | 3,086 | 36 | % | |||||||||||
Total commercial real estate | 27,468 | 23,262 | 4,206 | 18 | % | |||||||||||
Equipment lease financing | 7,468 | 7,686 | (218 | ) | (3 | )% | ||||||||||
Total commercial lending | 133,544 | 128,368 | 5,176 | 4 | % | |||||||||||
Consumer lending | ||||||||||||||||
Home equity | ||||||||||||||||
Lines of credit | 18,828 | 20,361 | (1,533 | ) | (8 | )% | ||||||||||
Installment | 13,305 | 14,316 | (1,011 | ) | (7 | )% | ||||||||||
Total home equity | 32,133 | 34,677 | (2,544 | ) | (7 | )% | ||||||||||
Residential real estate | ||||||||||||||||
Residential mortgage | 14,162 | 13,885 | 277 | 2 | % | |||||||||||
Residential construction | 249 | 522 | (273 | ) | (52 | )% | ||||||||||
Total residential real estate | 14,411 | 14,407 | 4 | – | % | |||||||||||
Credit card | 4,862 | 4,612 | 250 | 5 | % | |||||||||||
Other consumer | ||||||||||||||||
Automobile | 11,157 | 11,616 | (459 | ) | (4 | )% | ||||||||||
Education | 5,881 | 6,626 | (745 | ) | (11 | )% | ||||||||||
Other | 4,708 | 4,511 | 197 | 4 | % | |||||||||||
Total consumer lending | 73,152 | 76,449 | (3,297 | ) | (4 | )% | ||||||||||
Total Loans | $ | 206,696 | $ | 204,817 | $ | 1,879 | 1 | % | ||||||||
| (a) | Includes loans to customers in the real estate and construction industries. |
| (b) | Includes both construction loans and intermediate financing for projects. |
| The PNC Financial Services Group, Inc. – Form 10-K 41 |
The increase in loans was the result of an increase in total commercial lending driven by commercial real estate loans, partially offset by a decline in consumer lending due to lower home equity, education, and automobile loans.
Loans represented 58% of total assets at December 31, 2015 and 59% at December 31, 2014. Commercial lending represented 65% of the loan portfolio at December 31, 2015 and 63% at December 31, 2014. Consumer lending represented 35% of the loan portfolio at December 31, 2015 and 37% at December 31, 2014.
Commercial real estate loans represented 13% of total loans at December 31, 2015 and 11% of total loans at December 31, 2014 and represented 8% and 7% of total assets at December 31, 2015 and December 31, 2014, respectively. See the Credit Risk Management portion of the Risk Management section of this Item 7 for additional information regarding our loan portfolio.
Total loans above include purchased impaired loans of $3.5 billion, or 2% of total loans, at December 31, 2015, and $4.9 billion, or 2% of total loans, at December 31, 2014.
Our loan portfolio continued to be diversified among numerous industries, types of businesses and consumers across our principal geographic markets.
For the first quarter of 2016, we expect total loans to be stable with the fourth quarter of 2015.
Allowance for Loan and Lease Losses (ALLL)
Information regarding our higher risk loans and ALLL is included in the Credit Risk Management portion of the Risk Management section of this Item 7 and Note 1 Accounting Policies, Note 3 Asset Quality and Note 5 Allowances for Loan and Lease Losses and Unfunded Loan Commitments and Letters of Credit in our Notes To Consolidated Financial Statements included in Item 8 of this Report.
Purchase Accounting Accretion and Valuation of Purchased Impaired Loans
Information related to purchase accounting accretion and accretable yield for 2015 and 2014 follows. Additional information on our policies for ALLL for purchased impaired loans is provided in Note 1 Accounting Policies in the Notes To Consolidated Financial Statements included in Item 8 of this Report. A description of our purchased impaired loan accounting and loan data is included in Note 4 Purchased Loans in the Notes To Consolidated Financial Statements included in Item 8 of this Report.
Table 8: Accretion – Purchased Impaired Loans
| In millions | 2015 | 2014 | ||||||
Accretion on purchased impaired loans | ||||||||
Scheduled accretion | $ | 360 | $ | 460 | ||||
Reversal of contractual interest on impaired loans | (217 | ) | (253 | ) | ||||
Scheduled accretion net of contractual interest | 143 | 207 | ||||||
Excess cash recoveries (a) | 106 | 127 | ||||||
Total | $ | 249 | $ | 334 | ||||
| (a) | Relates to excess cash recoveries for purchased impaired commercial loans. |
Table 9: Purchased Impaired Loans – Accretable Yield
| In millions | 2015 | 2014 | ||||||
January 1 | $ | 1,558 | $ | 2,055 | ||||
Accretion (including excess cash recoveries) | (466 | ) | (587 | ) | ||||
Net reclassification to accretable from non-accretable and other activity | 226 | 208 | ||||||
Disposals | (68 | ) | (118 | ) | ||||
December 31 (a) | $ | 1,250 | $ | 1,558 | ||||
| (a) | As of December 31, 2015, we estimate that the reversal of contractual interest on purchased impaired loans will total approximately $0.7 billion in future periods. This will offset the total net accretable interest in future interest income of $1.2 billion on purchased impaired loans. |
Information related to the valuation of purchased impaired loans at December 31, 2015 and December 31, 2014 follows.
Table 10: Valuation of Purchased Impaired Loans
| December 31, 2015 | December 31, 2014 | |||||||||||||||
| Dollars in millions | Balance | Net Investment | Balance | Net Investment | ||||||||||||
Total purchased impaired loans: | ||||||||||||||||
Outstanding balance | $ | 3,933 | $ | 5,007 | ||||||||||||
Recorded investment (a) | $ | 3,522 | $ | 4,858 | ||||||||||||
Allowance for loan losses (a) | (310 | ) | (872 | ) | ||||||||||||
Net investment/Carrying value | $ | 3,212 | 82 | % | $ | 3,986 | 80 | % | ||||||||
| (a) | The December 31, 2015 amounts were impacted by the change in derecognition policy for purchased impaired pooled consumer and residential real estate loans as of December 31, 2015. For additional information, see the discussion below, as well as Note 4 Purchased Loans in the Notes To Consolidated Financial Statements in Item 8 of this Report. |
At December 31, 2015, our largest individual purchased impaired loan had a recorded investment of $8 million. We currently expect to collect total cash flows of $4.4 billion on purchased impaired loans, representing the $3.2 billion net investment at December 31, 2015 and the accretable net interest of $1.2 billion shown in Table 9.
| 42 The PNC Financial Services Group, Inc. – Form 10-K |
Weighted Average Life of the Purchased Impaired Portfolios
The table below provides the weighted average life (WAL) for each of the purchased impaired portfolios as of December 31, 2015.
Table 11: Weighted Average Life of the Purchased Impaired Portfolios
As of December 31, 2015 Dollars in millions | Recorded Investment | WAL (a) | ||||||
Commercial | $ | 36 | 2.0 years | |||||
Commercial real estate | 133 | 1.6 years | ||||||
Consumer (b) | 1,407 | 3.9 years | ||||||
Residential real estate | 1,946 | 4.5 years | ||||||
Total | $ | 3,522 | 4.1 years | |||||
| (a) | Weighted average life represents the average number of years for which each dollar of unpaid principal remains outstanding. |
| (b) | Portfolio primarily consists of nonrevolving home equity products. |
Through the National City Corporation (National City) and RBC Bank (USA) acquisitions, we acquired purchased impaired loans with a recorded investment of $14.7 billion. As noted in Table 11 above, at December 31, 2015, those balances are now $3.5 billion, of which $3.4 billion in consumer and residential real estate loans is accounted for using pool accounting. Prior to December 31, 2015, upon final disposition of a loan within a pool and for loans that had nominal collateral value/expected cash flows, the loan's carrying value was removed from the pool and any gain or loss associated with the transaction was retained in the pool's recorded investment. Effective December 31, 2015, in anticipation of the end of the life of our purchased impaired pooled consumer and residential real estate loans, and pursuant to supervisory direction, we changed our derecognition policy for these loans such that we will write-off the loan's recorded investment and derecognize the associated ALLL upon final disposition. Gains and losses on such loans will be recognized as either an adjustment to the pool's associated ALLL, or yield, as appropriate. The transition to this new policy on December 31, 2015 resulted in a $468 million derecognition of recorded investment and associated ALLL on such loans, which is immaterial to our financial statements taken as a whole.
The result of this change accelerated the derecognition of a pool's recorded investment and associated ALLL balance. These amounts represented the net loss from loan dispositions or expected cash flow shortfalls that had been retained as part of the pools' recorded investment per our accounting for the pool as a single asset. The recorded investment that was derecognized effective December 31, 2015 had been fully reserved for. Therefore, there was no impact to the net carrying values of the pools, or accretion accounting and no additional provision for credit losses for these derecognized loans was recorded, as the recorded investment and associated ALLL balance were reduced in equal amounts. We expect the
future impact of this policy change to the Consolidated Income Statement and Consolidated Balance Sheet to be immaterial. See Note 4 Purchased Loans and Note 5 Allowance for Loan and Lease Losses and Unfunded Commitments and Letters of Credit in the Notes To Consolidated Financial Statements included in Item 8 of this Report for additional information.
Purchased Impaired Loans – Accretable Difference Sensitivity Analysis
The following table provides a sensitivity analysis on the Total Purchased Impaired Loans portfolio. The analysis reflects hypothetical changes in key drivers for expected cash flows over the life of the loans under declining and improving conditions at a point in time. Any unusual significant economic events or changes, as well as other variables not considered below ( e.g ., natural or widespread disasters), could result in impacts outside of the ranges represented below. Additionally, commercial and commercial real estate loan settlements or sales proceeds can vary widely from appraised values due to a number of factors including, but not limited to, special use considerations, liquidity premiums and improvements/deterioration in other income sources.
Table 12: Accretable Difference Sensitivity-Total Purchased Impaired Loans
| In billions | December 31, 2015 | Declining Scenario (a) | Improving Scenario (b) | |||||||||
Expected cash flows | $ | 4.4 | $ | (.1 | ) | $ | .1 | |||||
Accretable difference | 1.2 | – | – | |||||||||
Allowance for loan and lease losses | (.3 | ) | (.1 | ) | .1 | |||||||
| (a) | Declining Scenario – Reflects hypothetical changes that would decrease future cash flow expectations. For consumer loans, we assume home price forecast decreases by ten percent and unemployment rate forecast increases by two percentage points; for commercial loans, we assume that collateral values decrease by ten percent. |
| (b) | Improving Scenario – Reflects hypothetical changes that would increase future cash flow expectations. For consumer loans, we assume home price forecast increases by ten percent, unemployment rate forecast decreases by two percentage points and interest rate forecast increases by two percentage points; for commercial loans, we assume that collateral values increase by ten percent. |
The present value impact of declining cash flows is primarily reflected as an immediate impairment charge resulting in a provision for credit losses and an increase to the allowance for loan and lease losses. The present value impact of increased cash flows is first recognized as a reversal of the allowance with any additional cash flow increases reflected as an increase in accretable yield over the life of the loan.
| The PNC Financial Services Group, Inc. – Form 10-K 43 |
Commitments to Extend Credit
Commitments to extend credit comprise the following:
Table 13: Commitments to Extend Credit (a)
| In millions | December 31 2015 | December 31 2014 | ||||||
Total commercial lending | $ | 101,252 | $ | 98,742 | ||||
Home equity lines of credit | 17,268 | 17,839 | ||||||
Credit card | 19,937 | 17,833 | ||||||
Other | 4,032 | 4,178 | ||||||
Total | $ | 142,489 | $ | 138,592 | ||||
| (a) | Commitments to extend credit, or net unfunded loan commitments, represent arrangements to lend funds or provide liquidity subject to specified contractual conditions. |
In addition to the credit commitments set forth in the table above, our net outstanding standby letters of credit totaled $8.8 billion at December 31, 2015 and $10.0 billion at December 31, 2014. Standby letters of credit commit us to make payments on behalf of our customers if specified future events occur.
Information regarding our commitments to extend credit and our allowance for unfunded loan commitments and letters of credit is included in Note 1 Accounting Policies, Note 5 Allowances for Loan and Lease Losses and Unfunded Loan Commitments and Letters of Credit and Note 21 Commitments and Guarantees in the Notes To Consolidated Financial Statements in Item 8 of this Report.
Investment Securities
The following table presents the distribution of our investment securities portfolio by credit rating. We have included credit ratings information because we believe that the information is an indicator of the degree of credit risk to which we are exposed. Changes in credit ratings classifications could indicate increased or decreased credit risk and could be accompanied by a reduction or increase in the fair value of our investment securities portfolio. For those securities on our balance sheet at December 31, 2015, where during our quarterly security-level impairment assessments we determined losses represented other-than-temporary impairment (OTTI), we have recorded cumulative credit losses of $1.1 billion in earnings and accordingly have reduced the amortized cost of our securities. The majority of these cumulative impairment charges related to non-agency residential mortgage-backed and asset-backed securities rated BB or lower.
Table 14: Investment Securities
| December 31, 2015 | December 31, 2014 | Ratings (a) As of December 31, 2015 | ||||||||||||||||||||||||||||||||||
| Dollars in millions | Amortized Cost | Fair Value | Amortized Cost | Fair Value | AAA/ AA | A | BBB | BB and Lower | No Rating | |||||||||||||||||||||||||||
U.S. Treasury and government agencies | $ | 10,022 | $ | 10,172 | $ | 5,485 | $ | 5,714 | 100 | % | ||||||||||||||||||||||||||
Agency residential mortgage-backed | 34,250 | 34,408 | 23,382 | 23,935 | 100 | |||||||||||||||||||||||||||||||
Non-agency residential mortgage-backed | 4,225 | 4,392 | 4,993 | 5,225 | 10 | 1 | % | 4 | % | 80 | % | 5 | % | |||||||||||||||||||||||
Agency commercial mortgage-backed | 3,045 | 3,086 | 3,378 | 3,440 | 100 | |||||||||||||||||||||||||||||||
Non-agency commercial mortgage-backed (b) | 5,624 | 5,630 | 5,095 | 5,191 | 78 | 10 | 2 | 3 | 7 | |||||||||||||||||||||||||||
Asset-backed (c) | 6,134 | 6,130 | 5,900 | 5,940 | 89 | 3 | 7 | 1 | ||||||||||||||||||||||||||||
State and municipal | 3,936 | 4,126 | 3,995 | 4,191 | 88 | 6 | 6 | |||||||||||||||||||||||||||||
Other debt | 2,211 | 2,229 | 2,099 | 2,142 | 56 | 31 | 13 | |||||||||||||||||||||||||||||
Corporate stock and other | 590 | 589 | 442 | 441 | 100 | |||||||||||||||||||||||||||||||
Total investment securities (d) | $ | 70,037 | $ | 70,762 | $ | 54,769 | $ | 56,219 | 89 | % | 2 | % | 1 | % | 6 | % | 2 | % | ||||||||||||||||||
| (a) | Ratings percentages allocated based on amortized cost. |
| (b) | Collateralized primarily by retail properties, office buildings, lodging properties and multi-family housing. |
| (c) | Collateralized primarily by corporate debt, government guaranteed student loans and other consumer credit products. |
| (d) | Includes available for sale and held to maturity securities. |
Investment securities represented 20% of total assets at December 31, 2015 and 16% at December 31, 2014.
We evaluate our investment securities portfolio in light of changing market conditions and other factors and, where appropriate, take steps to improve our overall positioning. We consider the portfolio to be well-diversified and of high quality. At December 31, 2015, 89% of the securities in the portfolio were rated AAA/AA, with U.S. Treasury and
government agencies, agency residential mortgage-backed and agency commercial mortgage-backed securities collectively representing 67% of the portfolio.
The investment securities portfolio includes both available for sale and held to maturity securities. Securities classified as available for sale are carried at fair value with net unrealized gains and losses, representing the difference between
| 44 The PNC Financial Services Group, Inc. – Form 10-K |
amortized cost and fair value, included in Shareholders' equity as Accumulated other comprehensive income or loss, net of tax, on our Consolidated Balance Sheet. Securities classified as held to maturity are carried at amortized cost. As of December 31, 2015, the amortized cost and fair value of available for sale securities totaled $55.3 billion and $55.8 billion, respectively, compared to an amortized cost and fair value as of December 31, 2014 of $43.2 billion and $44.2 billion, respectively. The amortized cost and fair value of held to maturity securities were $14.8 billion and $15.0 billion, respectively, at December 31, 2015, compared to $11.6 billion and $12.0 billion, respectively, at December 31, 2014.
The fair value of investment securities is impacted by interest rates, credit spreads, market volatility and liquidity conditions. The fair value of investment securities generally decreases when interest rates increase and vice versa. In addition, the fair value generally decreases when credit spreads widen and vice versa. Net unrealized gains in the total investment securities portfolio decreased to $.7 billion at December 31, 2015 from $1.5 billion at December 31, 2014. The comparable amounts for the securities available for sale portfolio were $.5 billion at December 31, 2015 and $1.1 billion at December 31, 2014.
Unrealized gains and losses on available for sale debt securities do not impact liquidity; however these gains and losses do affect capital under the regulatory capital rules. Also, a change in the securities' credit ratings could impact the liquidity of the securities and may be indicative of a change in credit quality, which could affect our risk-weighted assets and, therefore, our risk-based regulatory capital ratios under the regulatory capital rules. In addition, the amount representing the credit-related portion of OTTI on securities would reduce our earnings and regulatory capital ratios.
The duration of investment securities was 2.7 years at December 31, 2015. We estimate that, at December 31, 2015, the effective duration of investment securities was 2.8 years for an immediate 50 basis points parallel increase in interest rates and 2.6 years for an immediate 50 basis points parallel decrease in interest rates. Comparable amounts at December 31, 2014 for the effective duration of investment securities were 2.2 years and 2.1 years, respectively.
Based on current interest rates and expected prepayment speeds, the weighed-average expected maturity of the investment securities portfolio (excluding corporate stock and other) was 4.8 years at December 31, 2015 compared to 4.3 years at December 31, 2014. The weighted-average expected maturities of mortgage and other asset-backed debt securities were as follows as of December 31, 2015:
Table 15: Weighted-Average Expected Maturity of Mortgage and Other Asset-Backed Debt Securities
| December 31, 2015 | Years | |||
Agency residential mortgage-backed securities | 4.8 | |||
Non-agency residential mortgage-backed securities | 5.6 | |||
Agency commercial mortgage-backed securities | 3.2 | |||
Non-agency commercial mortgage-backed securities | 3.4 | |||
| Asset-backed securities | 2.9 | |||
At least quarterly, we conduct a comprehensive security-level impairment assessment on all securities. If economic conditions, including home prices, were to deteriorate from current levels, and if market volatility and liquidity were to deteriorate from current levels, or if market interest rates were to increase or credit spreads were to widen appreciably, the valuation of our investment securities portfolio would likely be adversely affected and we could incur additional OTTI credit losses that would impact our Consolidated Income Statement.
Additional information regarding our investment securities is included in Note 6 Investment Securities and Note 7 Fair Value in the Notes To Consolidated Financial Statements included in Item 8 of this Report.
Loans Held for Sale
Table 16: Loans Held For Sale
| In millions | December 31 2015 | December 31 2014 | ||||||
Commercial mortgages at fair value | $ | 641 | $ | 893 | ||||
Commercial mortgages at lower of cost or fair value | 27 | 29 | ||||||
Total commercial mortgages | 668 | 922 | ||||||
Residential mortgages at fair value | 843 | 1,261 | ||||||
Residential mortgages at lower of cost or fair value | 7 | 18 | ||||||
Total residential mortgages | 850 | 1,279 | ||||||
Other | 22 | 61 | ||||||
Total | $ | 1,540 | $ | 2,262 | ||||
| The PNC Financial Services Group, Inc. – Form 10-K 45 |
We sold $4.4 billion of commercial mortgage loans to agencies during 2015 compared to $3.5 billion during 2014. Total revenue of $99 million was recognized on the valuation and sale of commercial mortgage loans held for sale, net of hedges, during 2015 and $80 million in 2014. These amounts are included in Other noninterest income on the Consolidated Income Statement.
Residential mortgage loan origination volume was $10.5 billion during 2015 compared to $9.5 billion during 2014. The majority of such loans were originated under agency or Federal Housing Administration (FHA) standards. We sold $8.1 billion of loans and recognized loan sales revenue of $342 million during 2015. The comparable amounts for 2014
were $8.3 billion and $420 million, respectively. These loan sales revenue amounts are included in Residential mortgage noninterest income on the Consolidated Income Statement.
Interest income on loans held for sale was $90 million and $99 million during 2015 and 2014, respectively. These amounts are included in Other interest income on the Consolidated Income Statement.
Additional information regarding our loan sale and servicing activities is included in Note 2 Loan Sale and Servicing Activities and Variable Interest Entities and Note 7 Fair Value in our Notes To Consolidated Financial Statements included in Item 8 of this Report.
Funding Sources
Table 17: Details Of Funding Sources
| Dollars in millions | December 31 2015 | December 31 2014 | Change | |||||||||||||
| $ | % | |||||||||||||||
Deposits | ||||||||||||||||
Money market | $ | 118,079 | $ | 115,438 | $ | 2,641 | 2 | % | ||||||||
Demand | 90,038 | 82,829 | 7,209 | 9 | % | |||||||||||
Savings | 20,375 | 12,571 | 7,804 | 62 | % | |||||||||||
Retail certificates of deposit | 17,405 | 18,544 | (1,139 | ) | (6 | )% | ||||||||||
Time deposits in foreign offices and other time deposits | 3,105 | 2,852 | 253 | 9 | % | |||||||||||
Total deposits | 249,002 | 232,234 | 16,768 | 7 | % | |||||||||||
Borrowed funds | ||||||||||||||||
Federal funds purchased and repurchase agreements | 1,777 | 3,510 | (1,733 | ) | (49 | )% | ||||||||||
FHLB borrowings | 20,108 | 20,005 | 103 | 1 | % | |||||||||||
Bank notes and senior debt | 21,298 | 15,750 | 5,548 | 35 | % | |||||||||||
Subordinated debt | 8,556 | 9,151 | (595 | ) | (7 | )% | ||||||||||
Commercial paper | 14 | 4,995 | (4,981 | ) | (100 | )% | ||||||||||
Other | 2,779 | 3,357 | (578 | ) | (17 | )% | ||||||||||
Total borrowed funds | 54,532 | 56,768 | (2,236 | ) | (4 | )% | ||||||||||
Total funding sources | $ | 303,534 | $ | 289,002 | $ | 14,532 | 5 | % | ||||||||
See the Liquidity Risk Management portion of the Risk Management section of this Item 7 for additional information regarding our 2015 capital and liquidity activities.
Total deposits increased in the comparison due to strong growth in savings, demand, and money market deposits, partially offset by a decline in retail certificates of deposit. Interest-bearing deposits represented 68% of total deposits at both December 31, 2015 and December 31, 2014.
Total borrowed funds decreased in the comparison as declines in commercial paper, federal funds purchased, repurchase agreements and subordinated debt were partially offset by higher net issuances of bank notes and senior debt. The changes in the composition of funding sources are attributable to PNC's actions to enhance its funding structure in light of regulatory liquidity standards and a rating agency methodology change.
Capital
We manage our funding and capital positions by making adjustments to our balance sheet size and composition, issuing debt, equity or other capital instruments, executing treasury stock transactions and capital redemptions, managing dividend policies and retaining earnings.
We repurchase shares of PNC common stock under common stock repurchase authorizations approved from time to time by PNC's Board of Directors and consistent with capital plans submitted to, and accepted by, the Federal Reserve. Through the first quarter of 2015, we repurchased stock under our 2007 common stock repurchase program authorization that permitted us to purchase up to 25 million shares of PNC common stock on the open market or in privately negotiated transactions. Effective as of March 31, 2015, PNC's Board of
| 46 The PNC Financial Services Group, Inc. – Form 10-K |
Directors approved the termination of the 2007 common stock repurchase program authorization, and replaced it with a new stock repurchase program authorization in the amount of 100 million shares of PNC common stock, effective April 1, 2015. The extent and timing of share repurchases under this authorization will depend on a number of factors including, among others, market and general economic conditions, economic and regulatory capital considerations, alternative uses of capital, the potential impact on our credit ratings, contractual and regulatory limitations, and the results of future supervisory assessments of capital adequacy and capital planning processes undertaken by the Federal Reserve as part of the CCAR process.
In the first quarter of 2015, we repurchased 4.4 million common shares for $.4 billion and completed our common stock repurchase programs for the four quarter period that began in second quarter 2014 with total repurchases over that period of 17 million common shares for $1.5 billion. These repurchases were included in our 2014 capital plan accepted by the Federal Reserve as part of our 2014 CCAR submission.
In connection with the 2015 CCAR process, we submitted our 2015 capital plan, as approved by PNC's Board of Directors, to the Federal Reserve in January 2015. The Federal Reserve accepted the capital plan and did not object to our proposed capital actions in March 2015. As provided for in the 2015 capital plan, we announced new share repurchase programs of
up to $2.875 billion for the five quarter period beginning in the second quarter of 2015. These programs include repurchases of up to $375 million over the five quarter period related to stock issuances under employee benefit-related programs.
PNC repurchased 17.9 million common shares for $1.7 billion in the second through fourth quarters of 2015 under the current share repurchase programs described above.
For 2015, PNC repurchased a total of 22.3 million common shares for $2.1 billion.
On May 4, 2015, we redeemed $500 million of PNC's Fixed-to-Floating Rate Non-Cumulative Perpetual Preferred Stock, Series K, as well as all Depositary Shares representing interests therein. All 50,000 shares of Series K Preferred Stock, as well as all 500,000 Depositary Shares representing interests therein, were redeemed. The redemption price was $10,000 per share of Series K Preferred Stock equivalent to $1,000 per Depositary Share, plus declared and unpaid dividends up to but excluding the redemption date.
See the Supervision and Regulation section of Item 1 Business in this Report for further information concerning the CCAR process and the factors the Federal Reserve takes into consideration in its evaluation of capital plans.
Table 18: Shareholders' Equity
| Dollars in millions | December 31 2015 | December 31 2014 | Change | |||||||||||||
| $ | % | |||||||||||||||
Shareholders' equity | ||||||||||||||||
Preferred stock (a) | ||||||||||||||||
Common stock | $ | 2,708 | $ | 2,705 | $ | 3 | – | % | ||||||||
Capital surplus – preferred stock | 3,452 | 3,946 | (494 | ) | (13 | )% | ||||||||||
Capital surplus – common stock and other | 12,745 | 12,627 | 118 | 1 | % | |||||||||||
Retained earnings | 29,043 | 26,200 | 2,843 | 11 | % | |||||||||||
Accumulated other comprehensive income | 130 | 503 | (373 | ) | (74 | )% | ||||||||||
Common stock held in treasury at cost | (3,368 | ) | (1,430 | ) | (1,938 | ) | (136 | )% | ||||||||
Total shareholders' equity | $ | 44,710 | $ | 44,551 | $ | 159 | – | % | ||||||||
| (a) | Par value less than $.5 million at each date. |
The increase in total shareholders' equity compared to December 31, 2014 was mainly due to a $2.8 billion increase in retained earnings, partially offset by common share repurchases of $2.1 billion and the redemption of $500 million of preferred stock. The increase in retained earnings was driven by net income of $4.1 billion, reduced by $1.3 billion of common and preferred dividends declared. Common shares outstanding were 504 million and 523 million at December 31, 2015 and 2014, respectively.
| The PNC Financial Services Group, Inc. – Form 10-K 47 |
Table 19: Basel III Capital
| December 31, 2015 | ||||||||
| Dollars in millions | Transitional Basel III (a) | Pro forma Fully Phased-In Basel III (b)(c) | ||||||
Common equity Tier 1 capital | ||||||||
Common stock plus related surplus, net of treasury stock | $ | 12,085 | $ | 12,085 | ||||
Retained earnings | 29,043 | 29,043 | ||||||
Accumulated other comprehensive income for securities currently and previously held as available for sale | 141 | 353 | ||||||
Accumulated other comprehensive income for pension and other postretirement plans | (222 | ) | (554 | ) | ||||
Goodwill, net of associated deferred tax liabilities | (8,839 | ) | (8,839 | ) | ||||
Other disallowed intangibles, net of deferred tax liabilities | (133 | ) | (333 | ) | ||||
Other adjustments/(deductions) | (112 | ) | (182 | ) | ||||
Total common equity Tier 1 capital before threshold deductions | 31,963 | 31,573 | ||||||
Total threshold deductions | (470 | ) | (1,294 | ) | ||||
Common equity Tier 1 capital | 31,493 | 30,279 | ||||||
Additional Tier 1 capital | ||||||||
Preferred stock plus related surplus | 3,452 | 3,452 | ||||||
Trust preferred capital securities | 50 | |||||||
Noncontrolling interests (d) | 604 | 44 | ||||||
Other adjustments/(deductions) | (77 | ) | (109 | ) | ||||
Tier 1 capital | 35,522 | 33,666 | ||||||
Additional Tier 2 capital | ||||||||
Qualifying subordinated debt | 4,597 | 4,253 | ||||||
Trust preferred capital securities | 149 | |||||||
Allowance for loan and lease losses included in Tier 2 capital | 2,988 | 2,988 | ||||||
Other | 4 | 10 | ||||||
Total Basel III capital | $ | 43,260 | $ | 40,917 | ||||
Risk-weighted assets | ||||||||
Basel III standardized approach risk-weighted assets (e) | $ | 295,905 | $ | 303,707 | ||||
Estimated Basel III advanced approaches risk-weighted assets (f) | N/A | 264,931 | ||||||
Average quarterly adjusted total assets | 350,143 | 349,020 | ||||||
Supplementary leverage exposure (g) | 413,111 | 411,988 | ||||||
Basel III risk-based capital and leverage ratios | ||||||||
Common equity Tier 1 | 10.6 | % | 10.0 | % (h)(i) | ||||
Tier 1 | 12.0 | 11.1 | (h)(j) | |||||
Total | 14.6 | 13.5 | (h)(k) | |||||
Leverage (l) | 10.1 | 9.6 | ||||||
Supplementary leverage ratio (m) | 8.6 | 8.2 | ||||||
| (a) | Calculated using the regulatory capital methodology applicable to PNC during 2015. |
| (b) | PNC utilizes the pro forma fully phased-in Basel III capital ratios to assess its capital position (without the benefit of phase-ins), including comparison to similar estimates made by other financial institutions. Pro forma fully phased-in capital amounts, ratios and risk-weighted and leverage-related assets are estimated. |
| (c) | Basel III capital ratios and estimates may be impacted by additional regulatory guidance or analysis and, in the case of those ratios calculated using the advanced approaches, the ongoing evolution, validation and regulatory approval of PNC's models integral to the calculation of advanced approaches risk-weighted assets. |
| (d) | Primarily includes REIT preferred securities. |
| (e) | Includes credit and market risk-weighted assets. |
| (f) | Basel III advanced approaches risk-weighted assets were estimated based on the Basel III advanced approaches rules, and include credit, market and operational risk-weighted assets. During the parallel run qualification phase PNC has refined the data, models and internal processes used as part of the advanced approaches for determining risk-weighted assets. Refinements implemented in the fourth quarter of 2015 reduced estimated Basel III advanced approaches risk-weighted assets. We anticipate additional refinements may result in increases or decreases to this estimate through the parallel run qualification phase. |
| (g) | Supplementary leverage exposure is the sum of Adjusted average assets and certain off-balance sheet exposures including undrawn credit commitments and derivative potential future exposures. |
| (h) | Pro forma fully phased-in Basel III capital ratio based on estimated Basel III standardized approach risk-weighted assets and rules. |
| (i) | For comparative purposes only, the pro forma fully phased-in advanced approaches Basel III Common equity Tier 1 capital ratio estimate is 11.4%. This capital ratio is calculated using pro forma fully phased-in Common equity Tier 1 capital and dividing by estimated Basel III advanced approaches risk-weighted assets. |
| (j) | For comparative purposes only, the pro forma fully phased-in advanced approaches Basel III Tier 1 risk-based capital ratio estimate is 12.7%. This capital ratio is calculated using fully phased-in Tier 1 capital and dividing by estimated Basel III advanced approaches risk-weighted assets. |
| (k) | For comparative purposes only, the pro forma fully phased-in advanced approaches Basel III Total capital risk-based capital ratio estimate is 14.3%. This ratio is calculated using fully phased-in Total Basel III capital, which under the advanced approaches, Additional Tier 2 capital includes allowance for loan and leases losses in excess of Basel expected credit losses, if any, up to 0.6% of credit risk-weighted assets, and dividing by estimated Basel III advanced approaches risk-weighted assets. |
| (l) | Leverage ratio is calculated based on Tier 1 capital divided by Average quarterly adjusted total assets. |
| (m) | Supplementary leverage ratio is calculated based on Tier 1 capital divided by Supplementary leverage exposure. As advanced approaches banking organizations, PNC and PNC Bank will be subject to a 3% minimum supplementary leverage ratio effective January 1, 2018. |
| 48 The PNC Financial Services Group, Inc. – Form 10-K |
The Basel II framework, which was adopted by the Basel Committee on Banking Supervision in 2004, seeks to provide more risk-sensitive regulatory capital calculations and promote enhanced risk management practices among large, internationally active banking organizations. The U.S. banking agencies initially adopted rules to implement the Basel II capital framework in 2004. In July 2013, the U.S. banking agencies adopted final rules (referred to as the advanced approaches) that modified the Basel II framework effective January 1, 2014. See the Supervision and Regulation section in Item 1 Business and Item 1A Risk Factors of this Report for additional information. Prior to fully implementing the advanced approaches to calculate risk-weighted assets, PNC and PNC Bank must successfully complete a "parallel run" qualification phase. Both PNC and PNC Bank entered this parallel run phase on January 1, 2013. Although the minimum parallel run qualification period is four quarters, the parallel run period for PNC and PNC Bank, now in its third year, is consistent with the experience of other U.S. advanced approaches banks that have all had multi-year parallel run periods. After PNC exits parallel run, its regulatory risk-based capital ratio for each measure ( e.g. , Common equity Tier 1 capital ratio) will be the lower of the ratios as calculated under the standardized approach and the advanced approaches.
As a result of the staggered effective dates of the final U.S. Basel III regulatory capital rules (Basel III rules), as well as the fact that PNC remains in the parallel run qualification phase for the advanced approaches, PNC's regulatory risk-based ratios in 2015 were calculated using the standardized approach, effective January 1, 2015, for determining risk-weighted assets, and the definitions of, and deductions from, regulatory capital under the Basel III rules (as such definitions and deductions are phased-in for 2015). We refer to the capital ratios calculated using the phased-in Basel III provisions in effect for 2015 and, for the risk-based ratios, standardized approach risk-weighted assets as the 2015 Transitional Basel III ratios. Under the standardized approach for determining credit risk-weighted assets, exposures are generally assigned a pre-defined risk weight. Exposures to high volatility commercial real estate, past due exposures, equity exposures and securitization exposures are generally subject to higher risk weights than other types of exposures.
Under the Basel III rules adopted by the U.S. banking agencies, significant common stock investments in unconsolidated financial institutions, mortgage servicing rights and deferred tax assets must be deducted from capital (subject to a phase-in schedule) to the extent they individually exceed 10%, or in the aggregate exceed 15%, of the institution's adjusted common equity Tier 1 capital. Also, Basel III regulatory capital includes (subject to a phase-in schedule) accumulated other comprehensive income related to securities currently and previously held as available for sale, as well as pension and other postretirement plans.
Federal banking regulators have stated that they expect the largest U.S. bank holding companies, including PNC, to have a level of regulatory capital well in excess of the regulatory minimum and have required the largest U.S. bank holding companies, including PNC, to have a capital buffer sufficient to withstand losses and allow them to meet the credit needs of their customers through estimated stress scenarios. We seek to manage our capital consistent with these regulatory principles, and believe that our December 31, 2015 capital levels were aligned with them.
At December 31, 2015, PNC and PNC Bank, our sole bank subsidiary, were both considered "well capitalized," based on applicable U.S. regulatory capital ratio requirements. Beginning in 2015, to qualify as "well capitalized", PNC must have Transitional Basel III capital ratios of at least 6% for Tier 1 risk-based capital and 10% for Total risk-based capital, and PNC Bank must have Transitional Basel III capital ratios of at least 6.5% for Common equity Tier 1 risk-based capital, 8% for Tier 1 risk-based capital, 10% for Total risk-based capital, and a Leverage ratio of at least 5%. To qualify as "well capitalized" in 2014, regulators required insured depository institutions, such as PNC Bank, to maintain Transitional Basel III capital ratios of at least 6% for Tier 1 risk-based, 10% for Total risk-based and 5% for Leverage, and required bank holding companies, such as PNC, to maintain Transitional Basel III regulatory capital ratios of at least 6% Tier 1 risk-based and 10% for Total risk-based.
The access to and cost of funding for new business initiatives, the ability to undertake new business initiatives including acquisitions, the ability to engage in expanded business activities, the ability to pay dividends or repurchase shares or other capital instruments, the level of deposit insurance costs, and the level and nature of regulatory oversight depend, in large part, on a financial institution's capital strength.
We provide additional information regarding regulatory capital requirements and some of their potential impacts on PNC in the Supervision and Regulation section of Item 1 Business, Item 1A Risk Factors and Note 19 Regulatory Matters in the Notes To Consolidated Financial Statements in Item 8 of this Report.
| The PNC Financial Services Group, Inc. – Form 10-K 49 |
O FF -B ALANCE S HEET A RRANGEMENTS A ND V ARIABLE I NTEREST E NTITIES
We engage in a variety of activities that involve entities that are not consolidated or otherwise reflected in our Consolidated Balance Sheet that are generally referred to as "off-balance sheet arrangements." Additional information on these types of activities is included in the following sections of this Report:
| • | Commitments, including contractual obligations and other commitments, included within the Risk Management section of this Item 7, and |
| • | Note 2 Loan Sale and Servicing Activities and Variable Interest Entities, |
| • | Note 11 Borrowed Funds, |
| • | Note 16 Equity, and |
| • | Note 21 Commitments and Guarantees, all of which are in the Notes To Consolidated Financial Statements included in Item 8 of this Report. |
PNC consolidates variable interest entities (VIEs) when we are deemed to be the primary beneficiary. The primary beneficiary of a VIE is determined to be the party that meets both of the following criteria: (i) has the power to make decisions that most significantly affect the economic performance of the VIE; and (ii) has the obligation to absorb losses or the right to receive benefits that in either case could potentially be significant to the VIE.
A summary of VIEs, including those that we have consolidated and those in which we hold variable interests but have not consolidated into our financial statements, as of December 31, 2015 and December 31, 2014 is included in Note 2 in the Notes To Consolidated Financial Statements included in Item 8 of this Report.
Trust Preferred Securities and REIT Preferred Securities
See Note 11 Borrowed Funds and Note 16 Equity in the Notes To Consolidated Financial Statements in Item 8 of this Report for additional information on trust preferred securities issued by PNC Capital Trust C and REIT preferred securities issued by PNC Preferred Funding Trust I and PNC Preferred Funding Trust II including information on contractual limitations potentially imposed on payments (including dividends) with respect to PNC and PNC Bank's equity capital securities.
| 50 The PNC Financial Services Group, Inc. – Form 10-K |
F AIR V ALUE M EASUREMENTS
In addition to the following, see Note 7 Fair Value in the Notes To Consolidated Financial Statements in Item 8 of this Report for further information regarding fair value.
The following table summarizes the assets and liabilities measured at fair value on a recurring basis at December 31, 2015 and December 31, 2014, respectively, and the portions of such assets and liabilities that are classified within Level 3 of the valuation hierarchy. Level 3 assets and liabilities are those where the fair value is estimated using significant unobservable inputs.
Table 20: Fair Value Measurements – Summary
| December 31, 2015 | December 31, 2014 | |||||||||||||||
| Dollars in millions | Total Fair Value | Level 3 | Total Fair Value | Level 3 | ||||||||||||
Total assets | $ | 68,804 | $ | 8,606 | $ | 58,973 | $ | 9,788 | ||||||||
Total assets at fair value as a percentage of consolidated assets | 19 | % | 17 | % | ||||||||||||
Level 3 assets as a percentage of total assets at fair value | 13 | % | 17% | |||||||||||||
Level 3 assets as a percentage of consolidated assets | 2 | % | 3% | |||||||||||||
Total liabilities | $ | 4,892 | $ | 495 | $ | 5,799 | $ | 716 | ||||||||
Total liabilities at fair value as a percentage of consolidated liabilities | 2 | % | 2 | % | ||||||||||||
Level 3 liabilities as a percentage of total liabilities at fair value | 10 | % | 12% | |||||||||||||
Level 3 liabilities as a percentage of consolidated liabilities | <1 | % | <1% | |||||||||||||
The majority of assets recorded at fair value are included in the securities available for sale portfolio. The majority of Level 3 assets represent non-agency residential mortgage-backed securities in the securities available for sale portfolio, equity investments and mortgage servicing rights.
An instrument's categorization within the hierarchy is based on the lowest level of input that is significant to the fair value measurement. Changes from one quarter to the next related to the observability of inputs to a fair value measurement may result in a reclassification (transfer) of assets or liabilities between hierarchy levels. PNC's policy is to recognize transfers in and transfers out as of the end of the reporting period. For additional information regarding the transfers of assets or liabilities between hierarchy levels, see Note 7 Fair Value in the Notes To Consolidated Financial Statements in Item 8 of this Report.
B USINESS S EGMENTS R EVIEW
We have six reportable business segments:
| • | Retail Banking |
| • | Corporate & Institutional Banking |
| • | Asset Management Group |
| • | Residential Mortgage Banking |
| • | BlackRock |
| • | Non-Strategic Assets Portfolio |
Business segment results, including the basis of presentation of inter-segment revenues, and a description of each business are included in Note 23 Segment Reporting included in the Notes To Consolidated Financial Statements in Item 8 of this Report. Certain amounts included in this Business Segments Review section and the Business Segment Highlights in the Executive Summary section of this Item 7 differ from those amounts shown in Note 23, primarily due to the presentation in Item 7 of this Report of business net interest revenue on a taxable-equivalent basis. Note 23 presents results of businesses for 2015, 2014 and 2013.
| The PNC Financial Services Group, Inc. – Form 10-K 51 |
Retail Banking
(Unaudited)
Table 21: Retail Banking Table
Year ended December 31 Dollars in millions, except as noted | 2015 | 2014 | ||||||
I NCOME S TATEMENT | ||||||||
Net interest income | $ | 4,226 | $ | 3,924 | ||||
Noninterest income | ||||||||
Service charges on deposits | 623 | 633 | ||||||
Brokerage | 284 | 240 | ||||||
Consumer services | 1,015 | 961 | ||||||
Other | 301 | 291 | ||||||
Total noninterest income | 2,223 | 2,125 | ||||||
Total revenue | 6,449 | 6,049 | ||||||
Provision for credit losses | 259 | 277 | ||||||
Noninterest expense | 4,761 | 4,625 | ||||||
Pretax earnings | 1,429 | 1,147 | ||||||
Income taxes | 522 | 419 | ||||||
Earnings | $ | 907 | $ | 728 | ||||
A VERAGE B ALANCE S HEET | ||||||||
Loans | ||||||||
Consumer | ||||||||
Home equity | $ | 27,657 | $ | 28,852 | ||||
Indirect auto | 9,367 | 9,122 | ||||||
Indirect other | 540 | 703 | ||||||
Education | 6,307 | 7,208 | ||||||
Credit cards | 4,527 | 4,364 | ||||||
Other | 2,407 | 2,238 | ||||||
Total consumer | 50,805 | 52,487 | ||||||
Commercial and commercial real estate | 10,520 | 10,867 | ||||||
Floor plan | 2,185 | 2,215 | ||||||
Residential mortgage | 680 | 601 | ||||||
Total loans | 64,190 | 66,170 | ||||||
Goodwill and other intangible assets | 5,968 | 6,034 | ||||||
Other assets | 3,082 | 2,842 | ||||||
Total assets | $ | 73,240 | $ | 75,046 | ||||
Deposits | ||||||||
Noninterest-bearing demand | $ | 24,119 | $ | 22,134 | ||||
Interest-bearing demand | 36,189 | 33,992 | ||||||
Money market | 54,576 | 50,263 | ||||||
Savings | 14,358 | 11,847 | ||||||
Certificates of deposit | 16,518 | 18,972 | ||||||
Total deposits | 145,760 | 137,208 | ||||||
Other liabilities | 609 | 469 | ||||||
Total liabilities | $ | 146,369 | $ | 137,677 | ||||
Year ended December 31 Dollars in millions, except as noted | 2015 | 2014 | ||||||
P ERFORMANCE R ATIOS | ||||||||
Return on average assets | 1.24 | % | .97 | % | ||||
Noninterest income to total revenue | 34 | 35 | ||||||
Efficiency | 74 | 76 | ||||||
O THER I NFORMATION (a) | ||||||||
Credit-related statistics : | ||||||||
Commercial nonperforming assets | $ | 111 | $ | 139 | ||||
Consumer nonperforming assets | 934 | 1,059 | ||||||
Total nonperforming assets (b) | $ | 1,045 | $ | 1,198 | ||||
Purchased impaired loans (c) | $ | 462 | $ | 575 | ||||
Commercial lending net (recoveries) charge-offs | $ | (1 | ) | $ | 31 | |||
Credit card lending net charge-offs | 138 | 142 | ||||||
Consumer lending (excluding credit card) net charge-offs | 207 | 285 | ||||||
Total net charge-offs | $ | 344 | $ | 458 | ||||
Commercial lending net (recovery) charge-off ratio | (.01 | )% | .24 | % | ||||
Credit Card lending net charge-off ratio | 3.06 | % | 3.25 | % | ||||
Consumer lending (excluding credit card) net charge-off ratio | .44 | % | .58 | % | ||||
Total net charge-off ratio | .54 | % | .69 | % | ||||
Home equity portfolio credit statistics : (d) | ||||||||
% of first lien positions at origination (e) | 56 | % | 54 | % | ||||
Weighted-average loan-to-value ratios (LTVs) (e) (f) | 73 | % | 77 | % | ||||
Weighted-average updated FICO scores (g) | 752 | 748 | ||||||
Net charge-off ratio | .30 | % | .54 | % | ||||
Delinquency data – % of total loans: (h) | ||||||||
Loans 30 – 59 days past due | .18 | % | .20 | % | ||||
Loans 60 – 89 days past due | .09 | % | .09 | % | ||||
Accruing loans past due | .27 | % | .29 | % | ||||
Nonperforming loans | 2.96 | % | 3.13 | % | ||||
Other statistics : | ||||||||
ATMs | 8,956 | 8,605 | ||||||
Branches (i) | 2,616 | 2,697 | ||||||
Brokerage account client assets (in billions) (j) | $ | 43 | $ | 43 | ||||
Customer-related statistics (average) : | ||||||||
Non-teller deposit transactions (k) | 43 | % | 35 | % | ||||
Digital consumer customers (l) | 52 | % | 46 | % | ||||
| (a) | Presented as of December 31, except for net charge-offs and net charge-off ratios, which are for the year ended, and customer-related statistics, which are averages for the year ended. |
| (b) | Includes nonperforming loans of $1.0 billion at December 31, 2015 and $1.1 billion at December 31, 2014. |
| (c) | Recorded investment of purchased impaired loans related to acquisitions. |
| (d) | Lien position, LTV and FICO statistics are based upon customer balances. |
| (e) | Lien position and LTV calculations reflect management assumptions where data limitations exist. |
| (f) | LTV statistics are based upon current information. |
| (g) | Represents FICO scores that are updated at least quarterly. |
| (h) | Data based upon recorded investment. Past due amounts exclude purchased impaired loans, even if contractually past due, as we are currently accreting interest income over the expected life of the loans. |
| (i) | Excludes satellite offices ( e.g. , drive-ups, electronic branches and retirement centers) that provide limited products and/or services. |
| (j) | Amounts include cash and money market balances. |
| (k) | Percentage of total consumer and business banking deposit transactions processed at an ATM or through our mobile banking application. |
| (l) | Represents consumer checking relationships that process the majority of their transactions through non-teller channels. |
| 52 The PNC Financial Services Group, Inc. – Form 10-K |
Retail Banking earned $907 million in 2015 compared with earnings of $728 million in 2014. The increase in earnings was driven by increased net interest income and noninterest income, partially offset by higher noninterest expense. Retail Banking continues to enhance the customer experience with refinements to product offerings that drive product value for consumers and small businesses. We are focused on growing customer share of wallet through the sale of liquidity, banking, and investment products that meet the broad range of financial needs of our customers.
Retail Banking continued to focus on the strategic priority of transforming the customer experience through transaction migration, branch network transformation and multi-channel sales and service strategies.
| • | In 2015, approximately 52% of consumer customers used non-teller channels for the majority of their transactions compared with 46% in 2014. |
| • | Deposit transactions via ATM and mobile channels increased to 43% of total deposit transactions in 2015 compared with 35% for 2014. |
| • | Integral to PNC's retail branch transformation strategy, more than 375 branches operate under the universal model designed to enhance sales opportunities for branch personnel, in part, by driving higher ATM and mobile deposits. During 2015, the total branch network was reduced by 81 branches and the ATM network was increased by 351 ATMs. PNC had a network of 2,616 branches and 8,956 ATMs at December 31, 2015. |
| • | Instant debit card issuance, which enables us to print a customer's debit card in a matter of minutes, is now available in nearly 700 branches, over 26% of the branch network. |
| • | Apple iPad™ technology is available in all of our branches to demonstrate product capabilities to customers and prospects. |
Total revenue for 2015 increased $400 million compared to 2014, which included a $302 million increase in net interest income primarily from the enhancements to internal funds transfer pricing methodology in the first quarter of 2015, as well as increases in deposit balances and interest rate spread on the value of deposits, partially offset by lower loan balances and interest rate spread compression on the value of loans.
Noninterest income increased $98 million in 2015 compared to 2014. Execution on our share of wallet strategy resulted in strong growth in consumer service fee income from payment-related products, specifically in debit, credit and merchant services, as well as increased brokerage fees. Noninterest income included gains on sales of Visa Class B common shares of $169 million on two million shares in 2015 compared to $209 million on 3.5 million shares in 2014. Excluding these gains, noninterest income increased $138 million, or 7%, in the comparison.
Provision for credit losses and net charge-offs in 2015 declined by $18 million and $114 million, respectively, compared to 2014 due to improved credit quality.
Noninterest expense in 2015 increased $136 million over 2014. Increases in technology investments, sales-related and other compensation, and customer transaction-related costs were partially offset by reduced third party service expense and non-credit losses, as well as lower branch network expenses as a result of transaction migration to lower cost digital and ATM channels.
The deposit strategy of Retail Banking is to remain disciplined on pricing, focused on growing and retaining relationship-based balances, executing on market specific deposit growth strategies, and providing a source of low-cost funding and liquidity to PNC.
In 2015, average total deposits of $145.8 billion increased $8.6 billion, or 6%, compared to 2014, driven by organic growth in the following deposit categories:
| • | Money market deposits increased $4.3 billion, or 9%, to $54.6 billion. |
| • | Demand deposits increased $4.2 billion, or 7%, to $60.3 billion. |
| • | Savings deposits increased $2.5 billion, or 21%, to $14.4 billion. |
The expected run-off of maturing certificates of deposit partially offset these increases, declining $2.4 billion, or 13%, in the comparison.
| The PNC Financial Services Group, Inc. – Form 10-K 53 |
Retail Banking continued to focus on a relationship-based lending strategy that targets specific products and markets for growth. In 2015, average total loans declined $2.0 billion, or 3%, compared to 2014, driven by a decline in home equity loans and declines from run-off of non-strategic portions of the portfolios, as more fully described below.
| • | Average home equity loans decreased $1.2 billion, or 4%, as pay-downs and payoffs on loans exceeded new booked volume, consistent with lower mortgage demand. Retail Banking's home equity loan portfolio is relationship based, with over 97% of the portfolio attributable to borrowers in our primary geographic footprint. |
| • | Average commercial & commercial real estate loans declined $347 million, or 3%, as pay-downs and payoffs on loans exceeded new volume. |
| • | Average auto dealer floor plan loans declined $30 million, or 1%, primarily resulting from lower dealer line utilization. |
| • | Average indirect auto loans increased $245 million, or 3%, primarily due to portfolio growth in previously underpenetrated markets. |
| • | Average credit card balances increased $163 million, or 4%, as a result of efforts to increase credit card share of wallet through organic growth. |
| • | Average residential mortgage balances increased $79 million, or 13%, due to the transfer of $198 million in CRA mortgage loans from the Residential Mortgage Banking business segment in January 2015. |
| • | In 2015, average loan balances for the remainder of the portfolio declined $895 million, compared to 2014, driven by declines in the education and indirect other portfolios of $901 million and $163 million, respectively, as the discontinued government guaranteed education loan and indirect other balances are primarily run-off portfolios. |
Nonperforming assets declined $153 million, or 13%, at December 31, 2015 compared to December 31, 2014. The decrease was driven by declines in both consumer and commercial non-performing loans.
| 54 The PNC Financial Services Group, Inc. – Form 10-K |
Corporate & Institutional Banking
(Unaudited)
Table 22: Corporate & Institutional Banking Table
Year ended December 31 Dollars in millions, except as noted | 2015 | 2014 | ||||||
I NCOME S TATEMENT | ||||||||
Net interest income | $ | 3,494 | $ | 3,733 | ||||
Noninterest income | ||||||||
Corporate service fees | 1,383 | 1,295 | ||||||
Other | 552 | 448 | ||||||
Noninterest income | 1,935 | 1,743 | ||||||
Total revenue | 5,429 | 5,476 | ||||||
Provision for credit losses | 106 | 107 | ||||||
Noninterest expense | 2,148 | 2,064 | ||||||
Pretax earnings | 3,175 | 3,305 | ||||||
Income taxes | 1,144 | 1,199 | ||||||
Earnings | $ | 2,031 | $ | 2,106 | ||||
A VERAGE B ALANCE S HEET | ||||||||
Loans | ||||||||
Commercial | $ | 85,416 | $ | 78,688 | ||||
Commercial real estate | 23,036 | 21,127 | ||||||
Equipment lease financing | 6,940 | 6,892 | ||||||
Total commercial lending | 115,392 | 106,707 | ||||||
Consumer | 866 | 1,198 | ||||||
Total loans | 116,258 | 107,905 | ||||||
Goodwill and other intangible assets | 3,847 | 3,826 | ||||||
Loans held for sale | 966 | 1,006 | ||||||
Other assets | 10,961 | 10,190 | ||||||
Total assets | $ | 132,032 | $ | 122,927 | ||||
Deposits | ||||||||
Noninterest-bearing demand | $ | 48,318 | $ | 44,210 | ||||
Money market | 22,185 | 21,377 | ||||||
Other | 10,189 | 7,958 | ||||||
Total deposits | 80,692 | 73,545 | ||||||
Other liabilities | 7,746 | 7,551 | ||||||
Total liabilities | $ | 88,438 | $ | 81,096 | ||||
P ERFORMANCE R ATIOS | ||||||||
Return on average assets | 1.54 | % | 1.71 | % | ||||
Noninterest income to total revenue | 36 | 32 | ||||||
Efficiency | 40 | 38 | ||||||
C OMMERCIAL L OAN S ERVICING P ORTFOLIO – S ERVICED F OR PNC AND O THERS (in billions) | ||||||||
Beginning of period | $ | 377 | $ | 347 | ||||
Acquisitions/additions | 156 | 99 | ||||||
Repayments/transfers | (86 | ) | (69 | ) | ||||
End of period | $ | 447 | $ | 377 | ||||
O THER I NFORMATION | ||||||||
Consolidated revenue from: (a) | ||||||||
Treasury Management (b) | $ | 1,388 | $ | 1,288 | ||||
Capital Markets (b) | $ | 813 | $ | 777 | ||||
Commercial mortgage banking activities | ||||||||
Commercial mortgage loans held for sale (c) | $ | 140 | $ | 126 | ||||
Commercial mortgage loan servicing income (d) | 261 | 222 | ||||||
Commercial mortgage servicing rights valuation, net of economic hedge (e) | 28 | 38 | ||||||
Total | $ | 429 | $ | 386 | ||||
Year ended December 31 Dollars in millions, except as noted | 2015 | 2014 | ||||||
Average Loans (by C&IB business) | ||||||||
Corporate Banking | $ | 57,774 | $ | 54,341 | ||||
Real Estate | 31,312 | 27,740 | ||||||
Business Credit | 14,615 | 13,270 | ||||||
Equipment Finance | 10,954 | 10,474 | ||||||
Other | 1,603 | 2,080 | ||||||
Total average loans | $ | 116,258 | $ | 107,905 | ||||
Total loans (f) | $ | 118,607 | $ | 113,935 | ||||
Net carrying amount of commercial mortgage servicing rights (f) | $ | 526 | $ | 506 | ||||
Credit-related statistics: | ||||||||
Nonperforming assets (f) (g) | $ | 518 | $ | 557 | ||||
Purchased impaired loans (f) (h) | $ | 137 | $ | 246 | ||||
Net charge-offs (recoveries) | $ | 30 | $ | 8 | ||||
| (a) | Represents consolidated PNC amounts. See the additional revenue discussion regarding treasury management, capital markets-related products and services, and commercial mortgage banking activities in the Product Revenue section of the Corporate & Institutional Banking portion of this Business Segments Review section. |
| (b) | Includes amounts reported in net interest income, corporate service fees and other noninterest income. |
| (c) | Includes other noninterest income for valuations on commercial mortgage loans held for sale and related commitments, derivative valuations, origination fees, gains on sale of loans held for sale and net interest income on loans held for sale. |
| (d) | Includes net interest income and noninterest income (primarily in corporate services fees) from loan servicing net of reduction in commercial mortgage servicing rights due to time decay and payoffs. Commercial mortgage servicing rights valuation, net of economic hedge is shown separately. |
| (e) | Amounts reported in corporate services fees. |
| (f) | As of December 31. |
| (g) | Includes nonperforming loans of $.4 billion at December 31, 2015 and $.5 billion at December 31, 2014. |
| (h) | Recorded investment of purchased impaired loans related to acquisitions. |
Corporate & Institutional Banking earned $2.0 billion in 2015, a decrease of $75 million, or 4%, compared with 2014. The slight decrease in earnings was due to lower net interest income and an increase in noninterest expense, largely offset by higher noninterest income. We continue to focus on building client relationships where the risk-return profile is attractive, including in the Southeast.
Net interest income decreased $239 million, or 6%, in 2015 compared with 2014, primarily due to the impact of first quarter 2015 enhancements to internal funds transfer pricing methodology, continued interest rate spread compression on loans and deposits and lower purchase accounting accretion, partially offset by the impact of higher average loans and deposits. Decreased net interest income in the comparison also reflected the impact from the second quarter 2014 correction to reclassify certain commercial facility usage fees from net interest income to corporate service fees.
Corporate service fees increased $88 million, or 7%, in 2015 compared with 2014, primarily due to an increase in treasury management, commercial mortgage servicing and equity capital markets advisory fees, partially offset by lower merger and acquisition advisory fees. The prior year comparison also reflected the impact of the second quarter 2014 correction to reclassify certain commercial facility fees from net interest income to corporate service fees.
| The PNC Financial Services Group, Inc. – Form 10-K 55 |
Other noninterest income increased $104 million, or 23%, in 2015 compared to 2014, driven by higher corporate securities underwriting activity, multifamily loans originated for sale to agencies, derivative sales, and revenue associated with credit valuations for customer-related derivative activities.
Overall credit quality remained generally stable in 2015. The provision for credit losses was essentially unchanged from 2014 and net charge-offs continued to be low relative to recent historic levels. Nonperforming assets declined 7% in the year-over-year comparison; however, there was an increase in the fourth quarter of 2015, compared to the third quarter of 2015, driven by deterioration in the oil and gas sector.
Noninterest expense increased $84 million, or 4%, in 2015 compared to 2014, primarily driven by investments in technology, other costs associated with business activities and higher asset writedowns.
Average loans increased $8.4 billion, or 8%, in 2015 compared to the prior year, and period-end loan balances increased $4.7 billion, or 4%, at December 31, 2015 compared to prior year-end, reflecting solid growth in Real Estate, Corporate Banking, Business Credit and Equipment Finance:
| • | PNC Real Estate provides banking, financing and servicing solutions for commercial real estate clients across the country. Average loans for this business increased $3.6 billion, or 13%, in 2015 compared with 2014, due to increased originations and higher utilization. |
| • | Corporate Banking business provides lending, treasury management and capital markets-related products and services to midsized and large corporations, government and not-for-profit entities. Average loans for this business increased $3.4 billion, or 6%, in 2015 compared with 2014, primarily due to an increase in loan commitments from large corporate clients and specialty lending businesses, partially offset by the impact of ongoing capital and liquidity management activities. |
| • | PNC Business Credit provides asset-based lending. The loan portfolio is relatively high yielding, with acceptable risk as the loans are mainly secured by short-term assets. Average loans for this business increased $1.3 billion, or 10%, in 2015 compared with 2014, due to new originations. |
| • | PNC Equipment Finance provides equipment financing solutions for clients throughout the U.S. and Canada. Average loans and operating leases were $11.8 billion in 2015, an increase of $.6 billion, or 5%, compared with 2014. |
Average deposits increased $7.1 billion, or 10%, in 2015 compared to the prior year, as a result of business growth and increases in demand, money market and certificates of deposit products.
The commercial loan servicing portfolio increased $70 billion, or 19%, at December 31, 2015 compared to December 31, 2014, as servicing additions from new and existing customers exceeded portfolio run-off.
Product Revenue
In addition to credit and deposit products for commercial customers, Corporate & Institutional Banking offers other services, including treasury management, capital markets-related products and services, and commercial mortgage banking activities. On a consolidated basis, the revenue from these other services is included in net interest income, corporate service fees and other noninterest income. From a segment perspective, the majority of the revenue and expense related to these services is reflected in the Corporate & Institutional Banking segment results and the remainder is reflected in the results of other businesses. The Other Information section in Table 22 in the Corporate & Institutional Banking portion of this Business Segments Review section includes the consolidated revenue to PNC for these services. A discussion of the consolidated revenue from these services follows.
Treasury management revenue, comprised of fees and net interest income from customer deposit balances, increased $100 million, or 8%, in 2015 compared with 2014, driven by growth in our commercial card, wholesale lockbox, PINACLE ® , funds transfer fees and liquidity-related revenue.
Capital markets-related products and services include foreign exchange, derivatives, securities, loan syndications, mergers and acquisitions advisory, and equity capital markets advisory activities and related services. Revenue from capital markets-related products and services increased $36 million, or 5%, in 2015 compared with 2014. The increase in the comparison was primarily driven by higher derivative sales and revenue associated with credit valuations for customer-related derivative activities, increased corporate securities underwriting activity and higher equity capital markets advisory fees, partially offset by lower merger and acquisition advisory fees.
Commercial mortgage banking activities include revenue derived from commercial mortgage servicing (including net interest income and noninterest income) and revenue derived from commercial mortgage loans held for sale and related hedges. Total commercial mortgage banking activities increased $43 million, or 11%, in 2015 compared with 2014. The increase in the comparison was mainly due to higher mortgage servicing revenue and higher multifamily loans originated for sale to agencies, partially offset by lower net valuation adjustment on commercial mortgage servicing rights.
| 56 The PNC Financial Services Group, Inc. – Form 10-K |
Asset Management Group
(Unaudited)
Table 23: Asset Management Group Table
Year ended December 31 Dollars in millions, except as noted | 2015 | 2014 | ||||||
I NCOME S TATEMENT | ||||||||
Net interest income | $ | 292 | $ | 289 | ||||
Noninterest income | 869 | 818 | ||||||
Total revenue | 1,161 | 1,107 | ||||||
Provision for credit losses (benefit) | 9 | (1 | ) | |||||
Noninterest expense | 846 | 821 | ||||||
Pretax earnings | 306 | 287 | ||||||
Income taxes | 112 | 106 | ||||||
Earnings | $ | 194 | $ | 181 | ||||
A VERAGE B ALANCE S HEET | ||||||||
Loans | ||||||||
Consumer | $ | 5,655 | $ | 5,457 | ||||
Commercial and commercial real estate | 880 | 986 | ||||||
Residential mortgage | 919 | 809 | ||||||
Total loans | 7,454 | 7,252 | ||||||
Goodwill and other intangible assets | 226 | 259 | ||||||
Other assets | 240 | 234 | ||||||
Total assets | $ | 7,920 | $ | 7,745 | ||||
Deposits | ||||||||
Noninterest-bearing demand | $ | 1,272 | $ | 1,366 | ||||
Interest-bearing demand | 4,144 | 3,954 | ||||||
Money market | 5,161 | 3,944 | ||||||
CDs/IRAs/savings deposits | 638 | 454 | ||||||
Total deposits | 11,215 | 9,718 | ||||||
Other liabilities | 42 | 51 | ||||||
Total liabilities | $ | 11,257 | $ | 9,769 | ||||
P ERFORMANCE R ATIOS | ||||||||
Return on average assets | 2.45 | % | 2.34 | % | ||||
Noninterest income to total revenue | 75 | 74 | ||||||
Efficiency | 73 | 74 | ||||||
O THER I NFORMATION | ||||||||
Total nonperforming assets (a) (b) | $ | 53 | $ | 66 | ||||
Purchased impaired loans (a) (c) | $ | 72 | $ | 83 | ||||
Total net charge-offs | $ | 13 | $ | 3 | ||||
Year ended December 31 Dollars in millions, except as noted | 2015 | 2014 | ||||||
C LIENT A SSETS U NDER A DMINISTRATION (a) (d) (in billions) | ||||||||
Personal | $ | 111 | $ | 115 | ||||
Institutional | 148 | 148 | ||||||
Total | $ | 259 | $ | 263 | ||||
Asset Type | ||||||||
Equity | $ | 145 | $ | 151 | ||||
Fixed Income | 72 | 72 | ||||||
Liquidity/Other | 42 | 40 | ||||||
Total | $ | 259 | $ | 263 | ||||
Discretionary client assets under management | ||||||||
Personal | $ | 85 | $ | 87 | ||||
Institutional | 49 | 48 | ||||||
Total | $ | 134 | $ | 135 | ||||
Asset Type | ||||||||
Equity | $ | 72 | $ | 75 | ||||
Fixed Income | 40 | 40 | ||||||
Liquidity/Other | 22 | 20 | ||||||
Total | $ | 134 | $ | 135 | ||||
Nondiscretionary client assets under administration | ||||||||
Personal | $ | 26 | $ | 28 | ||||
Institutional | 99 | 100 | ||||||
Total | $ | 125 | $ | 128 | ||||
Asset Type | ||||||||
Equity | $ | 73 | $ | 76 | ||||
Fixed Income | 32 | 32 | ||||||
Liquidity/Other | 20 | 20 | ||||||
Total | $ | 125 | $ | 128 | ||||
| (a) | As of December 31. |
| (b) | Includes nonperforming loans of $48 million at December 31, 2015 and $62 million at December 31, 2014. |
| (c) | Recorded investment of purchased impaired loans related to acquisitions. |
| (d) | Excludes brokerage account client assets. |
| The PNC Financial Services Group, Inc. – Form 10-K 57 |
Asset Management Group earned $194 million in 2015 compared to $181 million in 2014, an increase of $13 million, or 7%. Earnings increased due to increases in net interest income and noninterest income, partially offset by an increase in noninterest expense.
Total revenue for 2015 increased $54 million compared to 2014. Noninterest income increased $51 million, or 6%, primarily relating to the impact from a $30 million trust settlement in the second quarter of 2015, new sales production and stronger average equity markets. Net interest income increased $3 million, or 1%, in 2015 compared to 2014, primarily due to an increase in average loan and deposit balances, partially offset by continued spread compression.
Noninterest expense increased by $25 million, or 3%, in 2015 compared to the prior year, primarily attributable to higher compensation expense and investments in technology. Asset Management Group remains focused on disciplined expense management as it invests in strategic growth opportunities.
The core growth strategies of the business include increasing sales sourced from other PNC lines of business, maximizing front line productivity and optimizing market presence in high opportunity markets. Wealth Management and Hawthorn have over 100 offices operating in 7 out of the 10 most affluent states in the U.S. with a majority co-located with retail banking branches. The businesses' strategies primarily focus on growing client assets under management through expanding relationships directly and through cross-selling from PNC's other lines of business.
Institutional Asset Management provides advisory, custody, and retirement administration services to institutional clients primarily within our banking footprint. The business also offers PNC proprietary mutual funds and investment strategies. Institutional Asset Management is strengthening its partnership with Corporate and Institutional Banking and other internal channels to drive growth and is focused on building retirement capabilities and expanding product solutions for all customers.
Assets under administration were $259 billion as of December 31, 2015 compared to $263 billion as of December 31, 2014, largely due to a decline in nondiscretionary client assets under administration. Discretionary client assets under management decreased $1 billion at December 31, 2015 compared to December 31, 2014, driven by lower equity markets on a spot basis, partially offset by positive net flows, after adjustments for cyclical client activities.
Average loan balances increased $.2 billion, or 3%, in 2015 compared to the prior year due to continued growth in the consumer loan portfolio. Asset Management Group's clients' preference for liquidity in the form of a new line of credit product has driven significant growth in the loan portfolio. The line of credit product is primarily secured by the market value of the client's underlying investment management account assets. Average deposits for 2015 increased $1.5 billion, or 15%, compared to the prior year, driven by an increase in money market products.
| 58 The PNC Financial Services Group, Inc. – Form 10-K |
Residential Mortgage Banking
(Unaudited)
Table 24: Residential Mortgage Banking Table
Year ended December 31 Dollars in millions, except as noted | 2015 | 2014 | ||||||
I NCOME S TATEMENT | ||||||||
Net interest income | $ | 121 | $ | 149 | ||||
Noninterest income | ||||||||
Loan servicing revenue | ||||||||
Servicing fees | 201 | 224 | ||||||
Mortgage servicing rights valuation, net of economic hedge | 71 | 12 | ||||||
Loan sales revenue | 342 | 420 | ||||||
Other | (1 | ) | (5 | ) | ||||
Total noninterest income | 613 | 651 | ||||||
Total revenue | 734 | 800 | ||||||
Provision for credit losses (benefit) | 2 | (2 | ) | |||||
Noninterest expense | 691 | 746 | ||||||
Pretax earnings | 41 | 56 | ||||||
Income taxes | 15 | 21 | ||||||
Earnings | $ | 26 | $ | 35 | ||||
A VERAGE B ALANCE S HEET | ||||||||
Portfolio loans | $ | 1,140 | $ | 1,689 | ||||
Loans held for sale | 1,107 | 1,120 | ||||||
Mortgage servicing rights (MSR) | 991 | 1,014 | ||||||
Other assets | 3,602 | 4,034 | ||||||
Total assets | $ | 6,840 | $ | 7,857 | ||||
Deposits | $ | 2,428 | $ | 2,285 | ||||
Borrowings and other liabilities | 2,044 | 2,879 | ||||||
Total liabilities | $ | 4,472 | $ | 5,164 | ||||
P ERFORMANCE R ATIOS | ||||||||
Return on average assets | .38 | % | .45 | % | ||||
Noninterest income to total revenue | 84 | 81 | ||||||
Efficiency | 94 | 93 | ||||||
Year ended December 31 Dollars in millions, except as noted | 2015 | 2014 | ||||||
R ESIDENTIAL M ORTGAGE S ERVICING P ORTFOLIO – S ERVICED FOR T HIRD P ARTIES (in billions) | ||||||||
Beginning of period | $ | 108 | $ | 114 | ||||
Acquisitions | 29 | 4 | ||||||
Additions | 8 | 8 | ||||||
Repayments/transfers | (22 | ) | (18 | ) | ||||
End of period | $ | 123 | $ | 108 | ||||
Servicing portfolio – third-party statistics: (a) | ||||||||
Fixed rate | 95 | % | 94 | % | ||||
Adjustable rate/balloon | 5 | % | 6 | % | ||||
Weighted-average interest rate | 4.25 | % | 4.47 | % | ||||
MSR asset value (in billions) | $ | 1.1 | $ | 0.8 | ||||
MSR capitalization value (in basis points) | 86 | 78 | ||||||
Weighted-average servicing fee (in basis points) | 27 | 27 | ||||||
R ESIDENTIAL M ORTGAGE R EPURCHASE R ESERVE | ||||||||
Beginning of period | $ | 107 | $ | 131 | ||||
Provision | 5 | – | ||||||
Losses – loan repurchases | (18 | ) | (24 | ) | ||||
End of Period | $ | 94 | $ | 107 | ||||
O THER I NFORMATION | ||||||||
Loan origination volume (in billions) | $ | 10.5 | $ | 9.5 | ||||
Loan sale margin percentage | 3.32 | % | 4.41 | % | ||||
Percentage of originations represented by: | ||||||||
Purchase volume (b) | 45 | % | 45 | % | ||||
Refinance volume | 55 | % | 55 | % | ||||
Total nonperforming assets (a) (c) | $ | 81 | $ | 120 | ||||
| (a) | As of December 31. |
| (b) | Mortgages with borrowers as part of residential real estate purchase transactions. |
| (c) | Includes nonperforming loans of $46 million at December 31, 2015 and $79 million at December 31, 2014. |
| The PNC Financial Services Group, Inc. – Form 10-K 59 |
Residential Mortgage Banking earned $26 million in 2015 compared to $35 million in 2014. Earnings decreased from the prior year as higher net hedging gains on residential mortgage servicing rights and lower noninterest expense were more than offset by lower loan sales and servicing revenue and decreased net interest income.
The strategic focus of the business is the acquisition of new customers through a retail loan officer sales force with an emphasis on home purchase transactions. Our strategy involves competing on the basis of superior service to new and existing customers in serving their home purchase and refinancing needs. A key consideration in pursuing this approach is the cross-sell opportunity, especially in the bank footprint markets.
Residential Mortgage Banking overview:
| • | Total loan originations increased $1 billion in 2015 compared to 2014. Loans continue to be originated primarily through direct channels under FNMA, FHLMC and FHA/Department of Veterans Affairs agency guidelines. Refinancings were 55% of originations for both 2015 and 2014. During 2015, 12% of loan originations were under the original or revised Home Affordable Refinance Program (HARP or HARP 2). |
| • | Residential mortgage loans serviced for others increased $15 billion at December 31, 2015 compared to December 31, 2014. During 2015, $29 billion of residential mortgage servicing rights were acquired, compared with $4 billion in 2014. |
| • | Net interest income decreased $28 million in 2015 compared to 2014, primarily due to lower balances of portfolio loans held for investment. |
| • | Noninterest income declined $38 million in 2015 compared with the prior year period, as increased net hedging gains on residential mortgage servicing rights were more than offset by decreased loan sales and servicing revenue. |
| • | Noninterest expense declined $55 million in 2015 compared with the 2014 period, primarily as a result of lower legal accruals and mortgage compliance costs. |
| • | Investors having purchased mortgage loans may request PNC to indemnify them against losses on certain loans or to repurchase loans that they believe do not comply with applicable contractual loan origination covenants and representations and warranties we have made. At December 31, 2015, the liability for estimated losses on repurchase and indemnification claims for the Residential Mortgage Banking business segment was $94 million, compared with $107 million at December 31, 2014. See the Recourse and Repurchase Obligations section of this Item 7 and Note 21 Commitments and Guarantees in the Notes To Consolidated Financial Statements of this Report for additional information. |
BlackRock
(Unaudited)
Table 25: BlackRock Table
Information related to our equity investment in BlackRock follows:
Year ended December 31 Dollars in millions | 2015 | 2014 | ||||||
Business segment earnings (a) | $ | 548 | $ | 530 | ||||
PNC's economic interest in BlackRock (b) | 22 | % | 22 | % | ||||
| (a) | Includes PNC's share of BlackRock's reported GAAP earnings and additional income taxes on those earnings incurred by PNC. |
| (b) | At December 31. |
In billions | December 31 2015 | December 31 2014 | ||||||
Carrying value of PNC's investment in BlackRock (c) | $ | 6.7 | $ | 6.3 | ||||
Market value of PNC's investment in BlackRock (d) | 12.0 | 12.6 | ||||||
| (c) | PNC accounts for its investment in BlackRock under the equity method of accounting, exclusive of a related deferred tax liability of $2.2 billion at December 31, 2015 and $2.1 billion at December 31, 2014. Our voting interest in BlackRock common stock was approximately 21% at December 31, 2015. |
| (d) | Does not include liquidity discount. |
In addition to our investment in BlackRock reflected in Table 25, at December 31, 2015, we held approximately 1.3 million shares of BlackRock Series C Preferred Stock valued at $357 million, which are available to fund our obligation in connection with certain BlackRock long-term incentive plan (LTIP) programs. Additional information regarding our BlackRock LTIP share obligations is included in Note 13 Stock Based Compensation Plans in the Notes to Consolidated Financial Statements in Item 8 of this Report.
We account for the BlackRock Series C Preferred Stock at fair value, which offsets the impact of marking-to-market the obligation to deliver these shares to BlackRock. The fair value amount of the BlackRock Series C Preferred Stock is included on our Consolidated Balance Sheet in the caption Other assets. Additional information regarding the valuation of the BlackRock Series C Preferred Stock is included in Note 7 Fair Value in the Notes To Consolidated Financial Statements in Item 8 of this Report.
See Note 24 Subsequent Events in Item 8 of this Report for information on our February 1, 2016 transfer of 0.5 million shares of Series C Preferred Stock to BlackRock to satisfy a portion of our LTIP obligation.
| 60 The PNC Financial Services Group, Inc. – Form 10-K |
Non-Strategic Assets Portfolio
(Unaudited)
Table 26: Non-Strategic Assets Portfolio Table
Year ended December 31 Dollars in millions | 2015 | 2014 | ||||||
I NCOME S TATEMENT | ||||||||
Net interest income | $ | 392 | $ | 547 | ||||
Noninterest income | 53 | 40 | ||||||
Total revenue | 445 | 587 | ||||||
Provision for credit losses (benefit) | (114 | ) | (119 | ) | ||||
Noninterest expense | 83 | 125 | ||||||
Pretax earnings | 476 | 581 | ||||||
Income taxes | 175 | 214 | ||||||
Earnings | $ | 301 | $ | 367 | ||||
A VERAGE B ALANCE S HEET | ||||||||
Commercial Lending | ||||||||
Commercial/Commercial real estate | $ | 107 | $ | 180 | ||||
Lease financing | 630 | 675 | ||||||
Total commercial lending | 737 | 855 | ||||||
Consumer Lending | ||||||||
Home equity | 2,774 | 3,396 | ||||||
Residential real estate | 3,877 | 4,812 | ||||||
Total consumer lending | 6,651 | 8,208 | ||||||
Total portfolio loans | 7,388 | 9,063 | ||||||
Other assets (a) | (682 | ) | (725 | ) | ||||
Total assets | $ | 6,706 | $ | 8,338 | ||||
Deposits and other liabilities | $ | 186 | $ | 225 | ||||
Total liabilities | $ | 186 | $ | 225 | ||||
P ERFORMANCE R ATIOS | ||||||||
Return on average assets | 4.49 | % | 4.40 | % | ||||
Noninterest income to total revenue | 12 | 7 | ||||||
Efficiency | 19 | 21 | ||||||
O THER I NFORMATION | ||||||||
Nonperforming assets (b) (c) | $ | 529 | $ | 710 | ||||
Purchased impaired loans (b) (d) | $ | 2,839 | $ | 3,943 | ||||
Net (recoveries) charge-offs | $ | (4 | ) | $ | 47 | |||
Net (recovery) charge-off ratio | (.06 | )% | .52 | % | ||||
Loans (b) | ||||||||
Commercial Lending | ||||||||
Commercial/Commercial real estate | $ | 75 | $ | 130 | ||||
Lease financing | 638 | 625 | ||||||
Total commercial lending | 713 | 755 | ||||||
Consumer Lending | ||||||||
Home equity | 2,203 | 3,091 | ||||||
Residential real estate | 3,300 | 4,290 | ||||||
Total consumer lending | 5,503 | 7,381 | ||||||
Total loans | $ | 6,216 | $ | 8,136 | ||||
| (a) | Other assets includes deferred taxes, ALLL and other real estate owned (OREO). Other assets were negative in both periods due to the ALLL. |
| (b) | As of December 31. |
| (c) | Includes nonperforming loans of $.4 billion at December 31, 2015 and $.6 billion at December 31, 2014. |
| (d) | Recorded investment of purchased impaired loans related to acquisitions. This segment contained 81% of PNC's purchased impaired loans at December 31, 2015 and 80% at December 31, 2014. |
This business segment consists of non-strategic assets primarily obtained through acquisitions of other companies. The business activity of this segment is to manage the wind-down of the portfolios while maximizing the value and mitigating risk.
Non-Strategic Assets Portfolio had earnings of $301 million in 2015 compared with $367 million in 2014. Earnings decreased year-over-year primarily due to a declining balance in the loan portfolio.
Non-Strategic Assets Portfolio overview:
| • | Net interest income declined $155 million, or 28%, in 2015 compared with 2014, resulting from lower purchase accounting accretion and the impact of the declining average balance of the loan portfolio. |
| • | Noninterest income increased $13 million, or 33%, in 2015 compared to 2014 driven by lower provision for estimated losses on repurchase obligations. |
| • | Provision for credit losses was a benefit in both 2015 and 2014, reflecting continued improvements in credit quality. |
| • | Noninterest expense declined $42 million, or 34%, in 2015 compared with 2014, due to lower costs of managing and servicing the loan portfolio and a release of legal reserves in December 2015. |
| • | Average portfolio loans declined $1.7 billion, or 18%, in 2015 compared to 2014, due to customer payment activity and portfolio management activities to reduce under-performing assets. |
| • | Effective December 31, 2015, PNC implemented its change in the derecognition policy for purchased impaired pooled consumer and residential real estate loans, resulting in the derecognition of the recorded investment balance included in total loans and the associated allowance for loan losses balance each by $468 million, 93% of which was recorded in the Non-Strategic Assets Portfolio. The decline in average loans in the year-over-year comparison reflected the impact of this change. |
| The PNC Financial Services Group, Inc. – Form 10-K 61 |
C RITICAL A CCOUNTING E STIMATES AND J UDGMENTS
Our consolidated financial statements are prepared by applying certain accounting policies. Note 1 Accounting Policies in the Notes To Consolidated Financial Statements in Item 8 of this Report describes the most significant accounting policies that we use. Certain of these policies require us to make estimates or economic assumptions that may vary under different assumptions or conditions and such variations may significantly affect our reported results and financial position for the period or in future periods.
Fair Value Measurements
We must use estimates, assumptions, and judgments when assets and liabilities are required to be recorded at, or adjusted to reflect, fair value.
Assets and liabilities carried at fair value inherently result in a higher degree of financial statement volatility. Fair values and the information used to record valuation adjustments for certain assets and liabilities are based on either quoted market prices or are provided by independent third-party sources, including appraisers and valuation specialists, when available. When such third-party information is not available, we estimate fair value primarily by using cash flow and other financial modeling techniques. Changes in underlying factors, assumptions, or estimates in any of these areas could materially impact our future financial condition and results of operations.
PNC applies ASC 820 – Fair Value Measurements. This guidance defines fair value as the price that would be received to sell a financial asset or paid to transfer a financial liability in an orderly transaction between market participants at the measurement date. This guidance requires a three level hierarchy for disclosure of assets and liabilities recorded at fair value. The classification of assets and liabilities within the hierarchy is based on whether the inputs to the valuation methodology used in the measurement are observable or unobservable.
The following sections of this Report provide further information on this type of activity:
| • | Fair Value Measurements included within this Item 7, and |
| • | Note 7 Fair Value included in the Notes To Consolidated Financial Statements in Item 8 of this Report. |
Allowances for Loan and Lease Losses and Unfunded Loan Commitments and Letters of Credit
We maintain the ALLL and the Allowance for Unfunded Loan Commitments and Letters of Credit at levels that we believe to be appropriate to absorb estimated probable credit losses incurred in the loan and lease portfolios and on these unfunded credit facilities as of the balance sheet date. Our determination of the allowances is based on periodic evaluations of the loan and lease portfolios and unfunded credit facilities and other relevant factors. These critical estimates include significant use of PNC's own historical data and complex methods to interpret them. We have an ongoing process to evaluate and enhance the quality, quantity and timeliness of our data and interpretation methods used in the determination of these allowances. These evaluations are inherently subjective, as they require material estimates and may be susceptible to significant change, and include, among others:
| • | Probability of default (PD), |
| • | Loss given default (LGD), |
| • | Outstanding balance of the loan, |
| • | Movement through delinquency stages, |
| • | Amounts and timing of expected future cash flows, |
| • | Value of collateral, which may be obtained from third parties, and |
| • | Qualitative factors, such as changes in current economic conditions, that may not be reflected in modeled results. |
For all loans, the ALLL is the sum of three components: (i) asset specific/individual impaired reserves, (ii) quantitative (formulaic or pooled) reserves and (iii) qualitative (judgmental) reserves. The reserve calculation and determination process is dependent on the use of key assumptions. Key reserve assumptions and estimation processes react to and are influenced by observed changes in loan portfolio performance experience, the financial strength of the borrower, and economic conditions. For unfunded commitments, the reserve estimate also includes estimation of the probability of funding. Key reserve assumptions are periodically updated.
To the extent actual outcomes differ from our estimates, additional provision for credit losses may be required that would reduce future earnings. See the following for additional information:
| • | Allowances For Loan And Lease Losses And Unfunded Loan Commitments And Letters Of Credit in the Credit Risk Management section of this Item 7, and |
| • | Note 1 Accounting Policies and Note 5 Allowances for Loan and Lease Losses and Unfunded Loan Commitments and Letters of Credit in the Notes To Consolidated Financial Statements and Allocation of Allowance for Loan and Lease Losses in the Statistical Information (Unaudited) section of Item 8 of this Report. |
| 62 The PNC Financial Services Group, Inc. – Form 10-K |
Estimated Cash Flows On Purchased Impaired Loans
ASC 310-30 – Loans and Debt Securities Acquired with Deteriorated Credit Quality (formerly SOP 03-3) provides the GAAP guidance for the accounting for purchased impaired loans. These loans have experienced a deterioration of credit quality from origination to acquisition for which it is probable that the investor will be unable to collect all contractually required payments receivable, including both principal and interest.
In our assessment of credit quality deterioration, we must make numerous assumptions, interpretations and judgments, using internal and third-party credit quality information to determine whether it is probable that we will be able to collect all contractually required payments. This point in time assessment is inherently subjective due to the nature of the available information and judgment involved.
Those loans that qualify under ASC 310-30 are recorded at fair value at acquisition, which involves estimating the expected cash flows to be received. Measurement of the fair value of the loan is based on the provisions of ASC 820. ASC 310-30 prohibits the carryover or establishment of an allowance for loan losses on the acquisition date.
Subsequent to the acquisition of the loan, we are required to continue to estimate cash flows expected to be collected over the life of the loan (or pool of loans). The measurement of expected cash flows involves assumptions and judgments as to credit risk, interest rate risk, prepayment risk, default rates, loss severity, payment speeds and collateral values. All of these factors are inherently subjective and can result in significant changes in the cash flow estimates over the life of the loan. Such changes in expected cash flows could increase future earnings volatility.
See Note 1 Accounting Policies, Note 4 Purchased Loans, and Note 5 Allowances for Loan and Lease Losses and Unfunded Loan Commitments and Letters of Credit in the Notes To Consolidated Financial Statements in Item 8 of this Report for additional information.
Goodwill
Goodwill arising from business acquisitions represents the value attributable to unidentifiable intangible elements in the business acquired. Most of our goodwill relates to value inherent in the Retail Banking and Corporate & Institutional Banking businesses. The value of this goodwill is dependent upon our ability to provide quality, cost-effective services in the face of competition from other market participants on a national and, with respect to some products and services, an international basis. We also rely upon continuing investments in processing systems, the development of value-added service features, and the ease of access by customers to our services.
As such, the value of goodwill is supported by earnings, which is driven by transaction volume and, for certain businesses, the market value of assets under administration or for which processing services are provided. Lower earnings resulting from a lack of growth or our inability to deliver cost-effective services over sustained periods can lead to impairment of goodwill, which could result in a current period charge to earnings. At least annually, in the fourth quarter, or more frequently if events occur or circumstances have changed significantly from the annual test date, management reviews the current operating environment and strategic direction of each reporting unit taking into consideration any events or changes in circumstances that may have an effect on the unit. For this review, inputs are generated and used in calculating the fair value of the reporting unit, which is compared to its carrying amount ("Step 1" of the goodwill impairment test) as further discussed below. The fair values of the majority of our reporting units are determined using a discounted cash flow valuation model with assumptions based upon market comparables. Additionally, we may also evaluate certain financial metrics that are indicative of fair value, including market quotes, price to earnings ratios and recent acquisitions involving other financial institutions. A reporting unit is defined as an operating segment or one level below an operating segment. If the fair value of the reporting unit exceeds its carrying amount, the reporting unit is not considered impaired. However, if the fair value of the reporting unit is less than its carrying amount, the reporting unit's goodwill would be evaluated for impairment. In this circumstance, the implied fair value of reporting unit goodwill would be compared to the carrying amount of that goodwill ("Step 2" of the goodwill impairment test). If the carrying amount of goodwill exceeds the implied fair value of goodwill, the difference is recognized as an impairment loss. The implied fair value of reporting unit goodwill is determined by assigning the fair value of a reporting unit to its assets and liabilities (including any unrecognized intangible assets) with the residual amount equal to the implied fair value of goodwill as if the reporting unit had been acquired in a business combination.
A reporting unit's carrying amount is based upon assigned economic capital as determined by PNC's internal management methodologies. Additionally, in performing Step 1 of our goodwill impairment testing, we utilize three equity metrics:
| • | Assigned reporting unit economic capital as determined by our internal management methodologies, inclusive of goodwill. |
| • | A 7% fully phased-in Basel III common equity Tier 1 capital ratio for the reporting unit consistent with PNC's risk framework guidelines. |
| • | The capital levels for comparable companies (as reported in comparable company public financial statements), adjusted for differences in risk characteristics between the comparable companies and the reporting unit. |
| The PNC Financial Services Group, Inc. – Form 10-K 63 |
For reporting units with goodwill, when determining the reporting unit's fair value and comparing it to its carrying value, we generally utilize the highest of these three amounts (the "targeted equity") in our discounted cash flow methodology. Under this methodology, if necessary, we will infuse capital to achieve the targeted equity amount. As of October 1, 2015 (annual impairment testing date), unallocated excess capital (difference between shareholders' equity minus total economic capital assigned and increased by the incremental targeted equity net capital infusion) represented capital reserved for potential future capital needs.
The results of our annual 2015 impairment test indicated that the estimated fair values of our reporting units with goodwill exceeded their carrying values by at least 10% and are not considered to be at risk of not passing Step 1. By definition, assumptions utilized in estimating the fair value of a reporting unit are judgmental and inherently uncertain, but absent a significant change in economic conditions of a reporting unit, we would not expect the fair values of these reporting units to decrease below their respective carrying values. Similarly, there were no impairment charges related to goodwill in 2014 or 2013.
See Note 8 Goodwill and Intangible Assets in the Notes To Consolidated Financial Statements in Item 8 of this Report for additional information.
Lease Residuals
We provide financing for various types of equipment, including aircraft, energy and power systems, and vehicles through a variety of lease arrangements. Direct financing leases are carried at the sum of lease payments and the estimated residual value of the leased property, less unearned income. Residual values are subject to judgments as to the value of the underlying equipment that can be affected by changes in economic and market conditions and the financial viability of the residual guarantors. Residual values are derived from historical remarketing experience, secondary market contacts, and industry publications. To the extent not guaranteed or assumed by a third-party, we bear the risk of ownership of the leased assets. This includes the risk that the actual value of the leased assets at the end of the lease term will be less than the estimated residual value, which could result in an impairment charge and reduce earnings in the future. Residual values are reviewed for impairment at least annually.
Revenue Recognition
We earn net interest and noninterest income from various sources, including:
| • | Lending, |
| • | Securities portfolio, |
| • | Asset management, |
| • | Customer deposits, |
| • | Loan sales and servicing, |
| • | Brokerage services, |
| • | Sale of loans and securities, |
| • | Certain private equity activities, and |
| • | Securities, derivatives and foreign exchange activities. |
We also earn fees and commissions from issuing loan commitments, standby letters of credit and financial guarantees, selling various insurance products, providing treasury management services, providing merger and acquisition advisory and related services, and participating in certain capital markets transactions. Revenue earned on interest-earning assets, including the accretion of discounts recognized on acquired or purchased loans recorded at fair value, is recognized based on the constant effective yield of the financial instrument or based on other applicable accounting guidance.
The timing and amount of revenue that we recognize in any period is dependent on estimates, judgments, assumptions, and interpretation of contractual terms. Changes in these factors can have a significant impact on revenue recognized in any period due to changes in products, market conditions or industry norms.
Residential And Commercial Mortgage Servicing Rights
We elect to measure our residential and commercial mortgage servicing rights (MSRs) at fair value. This election was made to be consistent with our risk management strategy to hedge changes in the fair value of these assets. The fair value of residential and commercial MSRs is estimated by using a cash flow valuation model which calculates the present value of estimated future net servicing cash flows, taking into consideration actual and expected mortgage loan prepayment rates, discount rates, servicing costs, and other economic factors which are determined based on current market conditions. Prior to 2014, commercial MSRs were initially recorded at fair value and subsequently accounted for at the lower of amortized cost or fair value. Commercial MSRs were periodically evaluated for impairment.
PNC employs risk management strategies designed to protect the value of MSRs from changes in interest rates and related market factors. The values of the residential and commercial MSRs are economically hedged with securities and derivatives, including interest-rate swaps, options, and forward mortgage-backed and futures contracts. As interest rates change, these financial instruments are expected to have changes in fair value negatively correlated to the change in fair value of the hedged MSR portfolios. The hedge relationships are actively managed in response to changing market conditions over the life of the MSRs. Selecting appropriate financial instruments to economically hedge residential or commercial MSRs requires significant
| 64 The PNC Financial Services Group, Inc. – Form 10-K |
management judgment to assess how mortgage rates and prepayment speeds could affect the future values of MSRs. Hedging results can frequently be less predictable in the short term, but over longer periods of time are expected to protect the economic value of the MSRs.
The following sections of this Report provide further information on residential and commercial MSRs:
| • | Note 7 Fair Value included in the Notes To Consolidated Financial Statements in Item 8 of this Report. |
| • | Note 8 Goodwill and Intangible Assets included in the Notes To Consolidated Financial Statements in Item 8 of this Report. |
Income Taxes
In the normal course of business, we and our subsidiaries enter into transactions for which the tax treatment is unclear or subject to varying interpretations. In addition, filing requirements, methods of filing and the calculation of taxable income in various state and local jurisdictions are subject to differing interpretations.
We evaluate and assess the relative risks and merits of the tax treatment of transactions, filing positions, filing methods and taxable income calculations after considering statutes, regulations, judicial precedent, and other information, and maintain tax accruals consistent with our evaluation of these relative risks and merits. The result of our evaluation and assessment is by its nature an estimate. We and our subsidiaries are routinely subject to audit and challenges from taxing authorities. In the event we resolve a challenge for an amount different than amounts previously accrued, we will account for the difference in the period in which we resolve the matter.
Recently Issued Accounting Standards
In May 2014, the Financial Accounting Standard Board (FASB) issued ASU 2014-09, Revenue from Contracts with Customers (Topic 606). This ASU clarifies the principles for recognizing revenue and replaces nearly all existing revenue recognition guidance in U.S. GAAP with one accounting model. The core principle of the guidance is that an entity should recognize revenue to depict the satisfaction of a performance obligation by transfer of promised goods or services to customers. The ASU also requires additional qualitative and quantitative disclosures relating to the nature, amount, timing, and uncertainty of revenue and cash flows arising from contracts with customers. In August 2015, the FASB issued guidance deferring the mandatory effective date of the ASU for one year, to annual reporting periods beginning after December 15, 2017. The requirements within ASU 2014-09 should be applied retrospectively to each prior period presented (with several practical expedients for certain completed contracts) or retrospectively with the cumulative effect of initially applying ASU 2014-09 recognized at the
date of initial application. We plan to adopt the ASU consistent with the deferred mandatory effective date. Based on our evaluation to date, we do not expect the adoption of this standard to have a significant impact on our consolidated results of operations or our consolidated financial position. Additionally, we will continue to evaluate this standard's impact as standard-setting, regulatory views and interpretations evolve.
In February 2015, the FASB issued ASU 2015-02, Consolidation (Topic 810): Amendments to the Consolidation Analysis . All legal entities are subject to re-evaluation under this ASU, including investment companies and certain other entities measured in a manner consistent with ASC 946 Financial Services – Investment Companies which were previously excluded. The ASU will change the analysis that a reporting entity must perform to determine whether it should consolidate certain types of legal entities. Specifically, the ASU modifies the evaluation of whether limited partnerships and similar legal entities are variable interest entities (VIEs) or voting interest entities; eliminates the presumption that a general partner should consolidate a limited partnership; potentially changes the consolidation conclusions of reporting entities that are involved with VIEs, in particular those that have fee arrangements and related party arrangements, and provides a scope exception for reporting entities with interests held in certain money market funds. The ASU is effective for public business entities for annual periods, and interim periods within those annual periods, beginning after December 15, 2015 and may be applied through a retrospective or modified retrospective approach. We adopted this standard as of January 1, 2016 under a modified retrospective approach. The impact of adoption did not have a significant impact on our consolidated results of operations or our consolidated financial position.
In January 2016, the FASB issued ASU 2016-01, Financial Instruments – Overall (Subtopic 825-10): Recognition and Measurement of Financial Assets and Financial Liabilities. This ASU changes the accounting for certain equity investments, financial liabilities under the fair value option and presentation and disclosure requirements for financial instruments. Equity investments not accounted for under the equity method of accounting will be measured at fair value with any changes in fair value recognized in net income. Equity investments without readily determinable fair values may be measured at cost, adjusted for impairment and other changes resulting from observable price changes in orderly transactions for a similar investment of the same issuer. A qualitative assessment may be utilized to evaluate equity investments without readily determinable fair values for impairment. If impairment exists, the investment is required to be measured at fair value. In addition to the changes for certain equity investments, the ASU also 1) requires that instrument-specific credit risk changes in the fair value of a financial liability accounted for under the fair value option be
| The PNC Financial Services Group, Inc. – Form 10-K 65 |
presented in other comprehensive income, 2) clarifies that an entity should consider deferred tax assets related to available-for-sale securities when evaluating the need for a valuation allowance on deferred tax assets, 3) eliminates the requirement for entities to disclose the methods and significant assumptions used to estimate disclosed fair values for financial instruments measured at amortized cost, 4) requires that the disclosed fair values represent an exit price, and 5) requires that financial assets and liabilities be presented by measurement category and form of instrument on the balance sheet or within the accompanying notes to the financial statements. The ASU is effective for annual periods, and interim periods within those annual periods, beginning after December 15, 2017 and should be applied through a cumulative-effect adjustment to the balance sheet, except for the amendment related to equity securities without readily determinable fair values, which should be applied prospectively. We plan to adopt all provisions consistent with the effective date and are currently evaluating the impact of this ASU on our results of operations and financial position.
Recently Adopted Accounting Pronouncements
See Note 1 Accounting Policies in the Notes To the Consolidated Financial Statements in Item 8 of this Report regarding the impact of new accounting pronouncements which we have adopted.
S TATUS OF Q UALIFIED D EFINED B ENEFIT P ENSION P LAN
We have a noncontributory, qualified defined benefit pension plan (plan or pension plan) covering eligible employees. Benefits are determined using a cash balance formula where earnings credits are applied as a percentage of eligible compensation. Pension contributions are based on an actuarially determined amount necessary to fund total benefits payable to plan participants. Consistent with our investment strategy, plan assets are primarily invested in equity investments and fixed income instruments. Plan fiduciaries determine and review the plan's investment policy, which is described more fully in Note 12 Employee Benefit Plans in the Notes To Consolidated Financial Statements in Item 8 of this Report.
We calculate the expense associated with the pension plan and the assumptions and methods that we use include a policy of reflecting plan assets at their fair market value. On an annual basis, we review the actuarial assumptions related to the pension plan. The primary assumptions used to measure pension obligations and costs are the discount rate, mortality, compensation increase and expected long-term return on plan assets. Among these, the compensation increase assumption does not significantly affect pension expense.
ASC 715-30 and ASC 715-60 stipulate that each individual assumption, including mortality, should reflect the plan
sponsor's best estimate. PNC has historically utilized a version of the Society of Actuaries' (SOA) published mortality tables in developing its best estimate of mortality. On October 27, 2014, the SOA published a new study on mortality rates that included updated mortality tables and mortality improvement scale, which both reflect longer life expectancy. Based on an evaluation of the mortality experience of PNC's qualified pension plan participants in conjunction with the updated SOA mortality study, PNC adopted an adjusted version of the SOA's new mortality table and improvement scale for purposes of measuring the plan's benefit obligations at December 31, 2014. During 2015, the SOA released an updated mortality improvement scale that generally validated the information that was considered when setting the current assumption, which remains unchanged from the mortality assumption adopted in 2014.
The discount rate used to measure pension obligations is determined by comparing the expected future benefits that will be paid under the plan with yields available on high quality corporate bonds of similar duration. The impact on pension expense of a .5% decrease in discount rate in the current environment is an increase of $18 million per year. This sensitivity depends on the economic environment and amount of unrecognized actuarial gains or losses on the measurement date.
The expected long-term return on assets assumption also has a significant effect on pension expense. The expected return on plan assets is a long-term assumption established by considering historical and anticipated returns of the asset classes invested in by the pension plan and the asset allocation policy currently in place. For purposes of setting and reviewing this assumption, "long term" refers to the period over which the plan's projected benefit obligations will be disbursed. We review this assumption at each measurement date and adjust it if warranted. Our selection process references certain historical data and the current environment, but primarily utilizes qualitative judgment regarding future return expectations.
To evaluate the continued reasonableness of our assumption, we examine a variety of viewpoints and data. Various studies have shown that portfolios comprised primarily of U.S. equity securities have historically returned approximately 9% annually over long periods of time, while U.S. debt securities have returned approximately 6% annually over long periods. Application of these historical returns to the plan's allocation ranges for equities and bonds produces a result between 6.50% and 7.25% and is one point of reference, among many other factors, that is taken into consideration. We also examine the plan's actual historical returns over various periods and consider the current economic environment. Recent experience is considered in our evaluation with appropriate consideration that, especially for short time periods, recent returns are not reliable indicators of future returns. While annual returns can vary significantly (actual returns for 2015,
| 66 The PNC Financial Services Group, Inc. – Form 10-K |
2014 and 2013 were (.1%), 6.50%, and 15.48%, respectively), the selected assumption represents our estimated long-term average prospective returns.
Acknowledging the potentially wide range for this assumption, we also annually examine the assumption used by other companies with similar pension investment strategies, so that we can ascertain whether our determinations markedly differ from others. In all cases, however, this data simply informs our process, which places the greatest emphasis on our qualitative judgment of future investment returns, given the conditions existing at each annual measurement date.
Taking into consideration all of these factors, the expected long-term return on plan assets for determining net periodic pension cost for 2015 was 6.75%, down from 7.00% for 2014. This reduction was made after considering the views of both internal and external capital market advisors, particularly with regard to the effects of the recent economic environment on long-term prospective fixed income returns. We are maintaining our expected long-term return on assets at 6.75% for determining pension cost for 2016.
Under current accounting rules, the difference between expected long-term returns and actual returns is accumulated and amortized to pension expense over future periods. Each one percentage point difference in actual return compared with our expected return can cause expense in subsequent years to increase or decrease by up to $8 million as the impact is amortized into results of operations.
We currently estimate pretax pension expense of $43 million for 2016 compared with pretax expense of $9 million in 2015. This year-over-year expected increase in expense is mainly due to lower than expected asset returns during 2015, which reduced year-end pension asset balances and increased the amortization of actuarial losses in 2016.
The table below reflects the estimated effects on pension expense of certain changes in annual assumptions, using 2016 estimated expense as a baseline.
Table 27: Pension Expense – Sensitivity Analysis
Change in Assumption (a) (In millions) | Estimated | |||
.5% decrease in discount rate | $ | 18 | ||
.5% decrease in expected long-term return on assets | $ | 21 | ||
.5% increase in compensation rate | $ | 2 | ||
| (a) | The impact is the effect of changing the specified assumption while holding all other assumptions constant. |
Our pension plan contribution requirements are not particularly sensitive to actuarial assumptions. Investment
performance has the most impact on contribution requirements and will drive the amount of required contributions in future years. Also, current law, including the provisions of the Pension Protection Act of 2006, sets limits as to both minimum and maximum contributions to the plan. We do not expect to be required to make any contributions to the plan during 2016. In February 2015, PNC made a $200 million voluntary contribution.
We maintain other defined benefit plans that have a less significant effect on financial results, including various nonqualified supplemental retirement plans for certain employees, which are described more fully in Note 12 Employee Benefit Plans in the Notes To Consolidated Financial Statements in Item 8 of this Report.
R ECOURSE AND R EPURCHASE O BLIGATIONS
As discussed in Note 2 Loan Sale and Servicing Activities and Variable Interest Entities in the Notes To Consolidated Financial Statements in Item 8 of this Report, PNC has sold commercial mortgage, residential mortgage and home equity loans/lines of credit directly or indirectly through securitization and loan sale transactions in which we have continuing involvement. One form of continuing involvement includes certain recourse and loan repurchase obligations associated with the transferred assets.
Commercial Mortgage Loan Recourse Obligations
We originate and service certain multi-family commercial mortgage loans which are sold to FNMA under FNMA's Delegated Underwriting and Servicing (DUS) program. We participated in a similar program with the FHLMC. Our exposure and activity associated with these recourse obligations are reported in the Corporate & Institutional Banking segment. For more information regarding our Commercial Mortgage Loan Recourse Obligations, see the Recourse and Repurchase Obligations section of Note 21 Commitments and Guarantees included in the Notes To Consolidated Financial Statements in Item 8 of this Report.
Residential Mortgage and Home Equity Repurchase Obligations
As a result of alleged breaches of loan covenants and representations and warranties, investors may request PNC to indemnify them against losses on certain loans or to repurchase loans. Indemnification and repurchase claims are often settled on an individual basis through make whole payments or loan repurchases, although we may also negotiate pooled settlements with investors. In connection with pooled settlements, we typically do not repurchase loans and the consummation of such transactions generally results in us no longer having indemnification and repurchase exposure with the investor in the transaction.
| The PNC Financial Services Group, Inc. – Form 10-K 67 |
Residential Mortgage Loan Repurchase Obligations
While residential mortgage loans are sold on a non-recourse basis, we assume certain loan repurchase obligations associated with mortgage loans we have sold to investors. These loan repurchase obligations primarily relate to situations where PNC is alleged to have breached certain origination covenants and representations and warranties made to purchasers of the loans in the respective purchase and sale agreements. Residential mortgage loans covered by these loan repurchase obligations include first and second-lien mortgage loans we have sold through Agency securitizations, Non-Agency securitizations, and loan sale transactions. As discussed in Note 2 Loan Sale and Servicing Activities and Variable Interest Entities in the Notes To Consolidated Financial Statements in Item 8 of this Report, Agency securitizations consist of mortgage loan sale transactions with FNMA, FHLMC and the Government National Mortgage Association (GNMA), while Non-Agency securitizations consist of mortgage loan sale transactions with private investors. Mortgage loan sale transactions that are not part of a securitization may involve FNMA, FHLMC or private investors. Our historical exposure and activity associated with Agency securitization repurchase obligations has primarily been related to transactions with FNMA and FHLMC, as indemnification and repurchase losses associated with FHA and VA-insured and uninsured loans pooled in GNMA securitizations historically have been minimal. In addition to indemnification and repurchase risk, we face other risks of loss with respect to our participation in these programs, some of which are described in Note 20 Legal Proceedings in the Notes To Consolidated Financial Statements in Item 8 of this Report with respect to governmental inquiries related to FHA-insured loans. Repurchase obligation activity associated with residential mortgages is reported in the Residential Mortgage Banking segment.
Origination and sale of residential mortgages is an ongoing business activity and, accordingly, management continually assesses the need to recognize indemnification and repurchase liabilities pursuant to the associated investor sale agreements. We establish indemnification and repurchase liabilities for estimated losses on sold first and second-lien mortgages for which indemnification is expected to be provided or for loans that are expected to be repurchased. For the first and second-lien mortgage sold portfolio, we have established an indemnification and repurchase liability pursuant to investor sale agreements based on claims made and our estimate of future claims on a loan by loan basis. To estimate the mortgage repurchase liability arising from breaches of representations and warranties, we consider the following factors: (i) borrower performance in our historically sold portfolio (both actual and estimated future defaults); (ii) the level of outstanding unresolved repurchase claims; (iii) estimated probable future repurchase claims, considering information about expected investor behaviors, delinquent and liquidated loans, resolved and unresolved mortgage insurance rescission notices and our historical experience with claim
rescissions; (iv) the potential ability to cure the defects identified in the repurchase claims ("rescission rate"); (v) the availability of legal defenses; and (vi) the estimated severity of loss upon repurchase of the loan or collateral, make-whole settlement or indemnification.
We previously reached agreements with both FNMA and FHLMC to resolve their repurchase claims with respect to loans sold between 2000 and 2008. Thus, our repurchase obligations involve Agency securitizations and other loan sales with FNMA and FHLMC subsequent to 2008 only, as well as Agency securitizations with GNMA and Non-Agency securitizations and other loan sales with private investors. The unpaid principal balance of loans associated with our exposure to repurchase obligations totaled $65.3 billion at December 31, 2015, of which $1.2 billion was 90 days or more delinquent. The comparative amounts were $68.3 billion and $1.5 billion, respectively, at December 31, 2014.
We believe our indemnification and repurchase liability appropriately reflects the estimated probable losses on indemnification and repurchase claims for all residential mortgage loans sold and outstanding as of December 31, 2015 and December 31, 2014. In making these estimates we consider the losses that we expect to incur over the life of the sold loans. See Note 21 Commitments and Guarantees in this Report for additional information on residential mortgage repurchase obligations.
Home Equity Loan/Line of Credit Repurchase Obligations
PNC's repurchase obligations include obligations with respect to certain brokered home equity loans/lines of credit that were sold to a limited number of private investors in the financial services industry by National City prior to our acquisition of National City. PNC is no longer engaged in the brokered home equity lending business, and our exposure under these loan repurchase obligations is limited to repurchases of the loans sold in these transactions. Repurchase activity associated with brokered home equity loans/lines of credit is reported in the Non-Strategic Assets Portfolio segment.
Loan covenants and representations and warranties were established through loan sale agreements with various investors to provide assurance that loans PNC sold to the investors were of sufficient investment quality. Key aspects of such covenants and representations and warranties include the loan's compliance with any applicable loan criteria established for the transaction, including underwriting standards, delivery of all required loan documents to the investor or its designated party, sufficient collateral valuation, and the validity of the lien securing the loan. As a result of alleged breaches of these contractual obligations, investors may request PNC to indemnify them against losses on certain loans or to repurchase loans.
Investor indemnification or repurchase claims are typically settled on an individual loan basis through make-whole
| 68 The PNC Financial Services Group, Inc. – Form 10-K |
payments or loan repurchases; however, on occasion we may negotiate pooled settlements with investors. In connection with pooled settlements, we typically do not repurchase loans and the consummation of such transactions generally results in us no longer having indemnification and repurchase exposure with the investor in the transaction.
An indemnification and repurchase liability for estimated losses for which indemnification is expected to be provided or for loans that are expected to be repurchased was established at the acquisition of National City. Management's evaluation of these indemnification and repurchase liabilities is based upon trends in indemnification and repurchase claims, actual loss experience, risks in the underlying serviced loan portfolios, current economic conditions and the periodic negotiations that management may enter into with investors to settle existing and potential future claims.
Indemnification and repurchase liabilities, which are included in Other liabilities on the Consolidated Balance sheet, are evaluated by management on a quarterly basis. Initial recognition and subsequent adjustments to the indemnification are recognized in Other noninterest income on the Consolidated Income Statement. For more information regarding our Home Equity Loan/Line of Credit Repurchase Obligations, see Note 21 Commitments and Guarantees in the Notes To Consolidated Statements in Item 8 of this Report.
R ISK M ANAGEMENT
Enterprise Risk Management
PNC encounters risk as part of the normal course of operating our business. Accordingly, we design risk management processes to help manage this risk. PNC manages risk in light of our risk appetite to optimize long term shareholder value while supporting our employees, customers, and communities.
This Risk Management section describes our risk framework, including risk appetite and strategy, culture, risk organization and governance, risk identification and quantification, risk controls and limits and risk monitoring and reporting. The overall Risk Management section of this Item 7 also provides an analysis of our key areas of risk, which include but are not limited to credit, operational, compliance, market, liquidity and model. Our use of financial derivatives as part of our overall asset and liability risk management process is also addressed within the risk management section.
PNC operates within a rapidly evolving regulatory environment. Accordingly, we are actively focused on the timely adoption of regulatory pronouncements within our Enterprise Risk Management (ERM) Framework.
We view risk management as a cohesive combination of the following risk elements which form PNC's ERM Framework:
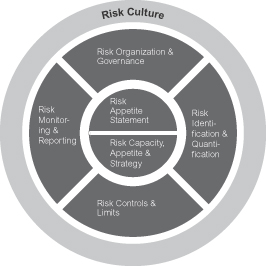
Risk Appetite and Strategy
PNC's risk appetite represents the organization's desired enterprise risk position, set within our capital-based risk and liquidity capacity to achieve our strategic objectives and business plans. Reviewed periodically through the risk reporting and Strategic Planning processes, the risk appetite serves as an operating guide for making balanced risk decisions that support our business strategies; it will adjust over time to reflect the current and anticipated economic environment, growth objectives, risk capacity and our risk profile.
We establish guiding principles for each of the risks within our taxonomy to support the Risk Appetite Statement. The guiding principles are qualitative statements that guide risk-taking activities and are supported by quantitative metrics, risk limits, and risk appetite descriptions as defined in policy and managed through the ERM framework.
Risk Culture
All employees are considered risk managers, and are responsible for understanding PNC's Risk Appetite Statement, guiding principles and ERM framework and how they apply to their respective roles. PNC's governance structure establishes clear roles and responsibilities for risk management throughout the organization. All employees are encouraged to collaborate across groups to identify and mitigate risks and elevate issues as required. PNC reinforces risk management responsibilities through a performance management system where employee performance goals include risk management objectives and incentives for employees to reinforce balanced measures of risk adjusted performance.
Proactive communication, between groups and up to the Board of Directors, facilitates timely identification and resolution of risk issues. PNC's multi-level risk committee structure provides a formal channel to identify, decision, and report risk. Risk
| The PNC Financial Services Group, Inc. – Form 10-K 69 |
committee membership includes representatives from business and risk stakeholder groups that are responsible for helping ensure risk issues are proactively identified, decisioned, monitored, communicated and managed appropriately within the risk management framework.
Risk Organization and Governance
PNC employs a comprehensive risk management governance framework to help ensure that risks are identified, balanced decisions are made that consider risk and return, and risks are adequately monitored and managed. Risk committees established within this governance framework provide oversight for risk management activities at the Board, corporate, and business levels. Committee composition is designed to provide effective oversight balanced across the three lines of defense in accordance with the OCC's heightened risk management and governance expectations and guidelines. See further discussion in the Supervision and Regulation section in Item 1 of this Report.
Risk is managed across three lines of defense:
Business Front Line Units (BFLU) – As the first line of defense, business front line units are accountable for identifying, owning and managing risks to within acceptable levels while adhering to the risk management framework established by Independent Risk Management. Our businesses strive to enhance risk management and internal control processes. Integrated and comprehensive processes are designed to adequately identify, measure, manage, monitor and report risks which may significantly impact each business.
Independent Risk Management (IRM) – As the second line of defense, IRM oversees risk management and establishes standards at the enterprise level to support business management in meeting their responsibilities for managing risk. IRM is independent from BFLUs and is responsible for identifying, measuring, monitoring and controlling aggregate risks.
Internal Audit – As the third line of defense, Internal Audit is independent from BFLUs and IRM and develops a risk based audit program to provide assurance on the management of risk throughout the organization. This includes auditing business processes across the organization and reporting on the effectiveness of controls, as well as auditing the risk management policy and infrastructure implemented by IRM.
Within the three lines of defense, the risk organization has sufficient authority to influence material decisions. The Board oversees enterprise risk management of PNC for any material changes to the risk profile and periodically reviews core elements of enterprise risk including the Risk Appetite Statement, Risk Capacity, Appetite and Strategy, and Risk Controls and Limits.
We use our governance structure to assess the effectiveness of our risk management practices on an ongoing basis, based on how we manage our day-to-day business activities and on our development and execution of more specific strategies to mitigate risks. Specific responsibilities include:
Board of Directors – The Board oversees enterprise risk management. The Risk Committee of the Board of Directors evaluates PNC's risk appetite, management's assessment of the enterprise risk profile, and the enterprise-wide risk structure and processes established by management to identify, measure, monitor, and manage risk. The Audit Committee of the Board also has responsibility for select areas of risk ( e.g. , Financial Reporting, Ethics and Internal Controls over Financial Reporting).
Corporate Committees – The corporate committees are responsible for overseeing risk standards and strategies, recommending risk limits, policies and metrics, monitoring risk exposures, reviewing risk profiles and key risk issues, and approving significant transactions and initiatives. At the management level, PNC has established several senior management-level committees to facilitate the review, evaluation, and management of risk. The management-level Executive Committee (EC) is the corporate committee that is responsible for developing enterprise-wide strategy and achieving PNC's strategic objectives. The EC evaluates risk management, in part, by monitoring risk reporting from the other corporate committees, which are the supporting committees for EC.
Working Committees – The working committees are generally subcommittees of the corporate committees and include risk management committees for each of PNC's major businesses or functions. Working committees are intended to define, design and develop the risk management framework, including risk appetite, at the business or function level. The working committees help to implement key enterprise-level activities within a business or function. These committees recommend risk management policies for the business or function that are consistent with the enterprise-wide risk management objectives and policies. The business level committees are also responsible for approving significant initiatives under a certain threshold.
Policies and Procedures – PNC has established risk management policies and procedures to provide direction, guidance, and clarity on roles and responsibilities to management and the Board of Directors. These policies and procedures are organized in a multi-tiered framework and require periodic review and approval by relevant committees within the governance structure.
| 70 The PNC Financial Services Group, Inc. – Form 10-K |
Risk Identification and Quantification
Risk identification takes place across a variety of risk types throughout the organization. These risk types consist of, but are not limited to, credit, operational, compliance, market, liquidity and model. Risks are identified based on a balanced use of analytical tools and management judgment for both on- and off-balance sheet exposures. Our governance structure supports risk identification by facilitating assessment of key risk issues, emerging risks, and idiosyncratic risks and implementation of mitigation strategies as appropriate. These risks are prioritized based on quantitative and qualitative analysis and assessed against the risk appetite. Multiple tools and approaches are used to help identify and prioritize risks, including Risk Appetite Metrics, Key Risk Indicators (KRIs), Key Performance Indicators (KPIs), Risk Control and Self-Assessments (RCSAs), scenario analysis, stress testing and special investigations.
Risks are aggregated and assessed within and across risk functions or businesses. The aggregated risk information is reviewed and reported at an enterprise level for adherence to the risk appetite framework as established through the policy framework and approved by the Board of Directors or by appropriate managing committees. This enterprise aggregation and reporting approach promotes the identification and appropriate escalation of material risks across the organization and supports an understanding of the cumulative impact of risk in relation to our risk appetite.
Risk Control and Limits
Risk controls and limits provide the linkage from PNC's Risk Appetite Statement and associated guiding principles to the risk taking activities of our businesses. Risk limits are quantitative measures, including forward looking assumptions, which allocate the firm's aggregate risk appetite statement to lines of business and functional risk areas. They are established within policy across risk categories and are embedded within each risk appetite description.
When setting risk limits, PNC considers major risks, aligns with the established risk appetite, balances risk-reward, leverages analytics including stressed scenarios along with historical data, and adjusts limits in a timely manner in response to changes in internal and external environments. Quantitative and qualitative operating guidelines support risk limits and serve as an early warning system for potential violations of the limits. These operating guidelines trigger mitigation strategies and management escalation protocols if limits are breached.
PNC's control structure is balanced in terms of efficiency and effectiveness with the risks that we are willing to take, as defined by our risk appetite. Controls are in place across the risk taxonomy to monitor established risk limits.
PNC uses a multi-tiered risk policy, procedure, and committee charter framework to provide direction and guidance for identifying, decisioning, monitoring, communicating and managing risk, including appropriate processes to escalate control parameter exceptions when applicable.
Risk Monitoring and Reporting
PNC uses similar tools to monitor and report risk when performing Risk Identification. These tools include Risk Appetite Metrics, KRIs, KPIs, RCSAs, scenario analysis, stress testing and special investigations.
The risk identification and quantification processes, the risk control and limits reviews, and the tools used for risk monitoring provide the basis for risk reporting. The objective of risk reporting is comprehensive risk aggregation and transparent communication of aggregated risks, issues, risk level compared to appetite, outlook as well as mitigation strategies where appropriate, to the Risk Committee of the Board of Directors, Corporate Committees, Working Committees and other designated parties for effective decision making.
Risk reports are produced at the line of business, functional risk and the enterprise levels. The enterprise level risk report aggregates risks identified in the functional and business reports to define the enterprise risk profile. The enterprise risk profile is a point-in-time assessment of enterprise risk. The risk profile represents PNC's overall risk position in relation to the desired enterprise risk appetite and overall risk capacity. The determination of the enterprise risk profile is based on analysis of quantitative reporting of risk limits and other measures along with qualitative assessments. Quarterly aggregation of our risk profile enables a clear view of our risk level relative to our quantitative risk appetite and overall risk capacity. The enterprise level report is provided through the governance structure to the Board of Directors.
Credit Risk Management
Credit risk represents the possibility that a customer, counterparty or issuer may not perform in accordance with contractual terms. Credit risk is inherent in the financial services business and results from extending credit to customers, purchasing securities, and entering into financial derivative transactions and certain guarantee contracts. Credit risk is one of our most significant risks. Our processes for managing credit risk are embedded in PNC's risk culture and in our decision-making processes using a systematic approach whereby credit risks and related exposures are identified and assessed, managed through specific policies and processes, measured and evaluated against our risk appetite and credit concentration limits, and reported, along with specific mitigation activities, to management and the Board through our governance structure.
| The PNC Financial Services Group, Inc. – Form 10-K 71 |
Asset Quality Overview
Asset quality trends improved overall during 2015.
| • | Nonperforming assets at December 31, 2015 decreased $455 million compared with December 31, 2014 as a result of improvements in both consumer lending and commercial lending nonperforming loans. Consumer lending nonperforming loans decreased $303 million and commercial lending nonperforming loans decreased $81 million. Nonperforming assets were 0.68% of total assets at December 31, 2015 compared with 0.83% at December 31, 2014. |
| • | Overall loan delinquencies totaled $1.6 billion at December 31, 2015, a decrease of $306 million, or 16%, from year-end 2014. The reduction was due in large part to a reduction in accruing government insured residential real estate loans past due 90 days or more of $174 million, the majority of which we took possession of and conveyed the real estate, or are in the process of conveyance and claim resolution. |
| • | Net charge-offs were $386 million in 2015, down 27%, or $145 million, from net charge-offs in 2014. |
| • | Provision for credit losses for the year ended December 31, 2015 declined to $255 million compared to $273 million for the year ended December 31, 2014. |
| • | The level of ALLL decreased to $2.7 billion at December 31, 2015 as compared to $3.3 billion at December 31, 2014, primarily due to a change to our derecognition policy effective December 31, 2015 for purchased impaired pooled consumer and residential real estate loans. |
Nonperforming Assets and Loan Delinquencies
Nonperforming Assets, including OREO and Foreclosed Assets
Nonperforming assets include nonperforming loans and leases for which ultimate collectability of the full amount of contractual principal and interest is not probable and include nonperforming troubled debt restructurings (TDRs), OREO and foreclosed assets. Loans held for sale, certain government insured or guaranteed loans, purchased impaired loans and loans accounted for under the fair value option are excluded from nonperforming loans. Additional information regarding our nonperforming loans and nonaccrual policies is included in Note 1 Accounting Policies in the Notes To Consolidated Financial Statements in Item 8 of this Report. A summary of the major categories of nonperforming assets are presented in Table 28. See Note 3 Asset Quality in the Notes To Consolidated Financial Statements in Item 8 of this Report for further detail of nonperforming asset categories.
Table 28: Nonperforming Assets By Type
| Dollars in millions | December 31 2015 | December 31 2014 | ||||||
Nonperforming loans | ||||||||
Commercial lending | $ | 545 | $ | 626 | ||||
Consumer lending (a)(b) | 1,581 | 1,884 | ||||||
Total nonperforming loans (c) | 2,126 | 2,510 | ||||||
OREO and foreclosed assets | 299 | 370 | ||||||
Total nonperforming assets | $ | 2,425 | $ | 2,880 | ||||
Amount of TDRs included in nonperforming loans | $ | 1,119 | $ | 1,370 | ||||
Percentage of total nonperforming loans | 53 | % | 55 | % | ||||
Nonperforming loans to total loans | 1.03 | % | 1.23 | % | ||||
Nonperforming assets to total loans, OREO and foreclosed assets | 1.17 | 1.40 | ||||||
Nonperforming assets to total assets | .68 | .83 | ||||||
Allowance for loan and lease losses to total nonperforming loans (d) | 128 | 133 | ||||||
| (a) | Excludes most consumer loans and lines of credit, not secured by residential real estate, which are charged off after 120 to 180 days past due and are not placed on nonperforming status. |
| (b) | The recorded investment of loans collateralized by residential real estate property that are in process of foreclosure was $.6 billion and $.8 billion at December 31, 2015 and December 31, 2014, respectively, and included $.3 billion and $.5 billion, respectively, of loans that are government insured/guaranteed. |
| (c) | Nonperforming loans exclude certain government insured or guaranteed loans, loans held for sale, loans accounted for under the fair value option and purchased impaired loans. |
| (d) | The December 31, 2015 ratio was impacted by the change in derecognition policy for purchased impaired pooled consumer and residential real estate loans as of December 31, 2015. For additional information see Note 4 Purchased Loans in the Notes To Consolidated Financial Statements in Item 8 of this Report. |
Table 29: Change in Nonperforming Assets
| In millions | 2015 | 2014 | ||||||
January 1 | $ | 2,880 | $ | 3,457 | ||||
New nonperforming assets | 1,459 | 2,127 | ||||||
Charge-offs and valuation adjustments | (499 | ) | (585 | ) | ||||
Principal activity, including paydowns and payoffs | (687 | ) | (1,001 | ) | ||||
Asset sales and transfers to loans held for sale | (364 | ) | (570 | ) | ||||
Returned to performing status | (364 | ) | (548 | ) | ||||
December 31 | $ | 2,425 | $ | 2,880 | ||||
Nonperforming assets decreased $455 million at December 31, 2015 compared to December 31, 2014. Consumer lending nonperforming loans decreased $303 million and commercial lending nonperforming loans decreased $81 million. As of December 31, 2015, approximately 90% of total nonperforming loans were secured by collateral which lessens reserve requirements and is expected to reduce credit losses in the event of default. As of December 31, 2015, commercial lending nonperforming loans were carried at approximately 62% of their unpaid principal balance, due to charge-offs recorded to date, before consideration of the ALLL. See Note 3 Asset Quality in the
| 72 The PNC Financial Services Group, Inc. – Form 10-K |
Notes To Consolidated Financial Statements in Item 8 of this Report for additional information on these loans.
Within consumer nonperforming loans, residential real estate TDRs comprise 68% of total residential real estate nonperforming loans at December 31, 2015, up from 60% at December 31, 2014. Home equity TDRs comprise 51% of home equity nonperforming loans at December 31, 2015, down from 54% at December 31, 2014. TDRs generally remain in nonperforming status until a borrower has made at least six consecutive months of both principal and interest payments under the modified terms or ultimate resolution occurs. Loans where borrowers have been discharged from personal liability through Chapter 7 bankruptcy and have not formally reaffirmed their loan obligations to PNC and loans to borrowers not currently obligated to make both principal and interest payments under the restructured terms are not returned to accrual status.
At December 31, 2015, our largest nonperforming asset was $33 million in the Real Estate, Rental and Leasing Industry and our average nonperforming loan associated with commercial lending was less than $1 million. The ten largest outstanding nonperforming assets are from the commercial lending portfolio and represent 37% and 8% of total commercial lending nonperforming loans and total nonperforming assets, respectively, as of December 31, 2015.
Purchased impaired loans are considered performing, even if contractually past due (or if we do not expect to receive payment in full based on the original contractual terms), as we accrete interest income over the expected life of the loans. The accretable yield represents the excess of the expected cash flows on the loans at the measurement date over the carrying value. Generally decreases, other than interest rate decreases for variable rate notes, in the net present value of expected cash flows of individual commercial or pooled purchased impaired loans would result in an impairment charge to the provision for credit losses in the period in which the change is deemed probable. Generally increases in the net present value
first result in a recovery of previously recorded allowance for loan losses, to the extent applicable, and then an increase to accretable yield for the remaining life of the purchased impaired loans. Total nonperforming loans and assets in the tables above are significantly lower than they would have been due to this accounting treatment for purchased impaired loans. This treatment also results in a lower ratio of nonperforming loans to total loans and a higher ratio of ALLL to nonperforming loans. See Note 4 Purchased Loans in the Notes To Consolidated Financial Statements in Item 8 of this Report, for additional information, including the accounting treatment, on these loans.
Table 30: OREO and Foreclosed Assets
| In millions | December 31 2015 | December 31 2014 | ||||||
Other real estate owned (OREO): | ||||||||
Residential properties | $ | 146 | $ | 183 | ||||
Residential development properties | 31 | 48 | ||||||
Commercial properties | 102 | 120 | ||||||
Total OREO | 279 | 351 | ||||||
Foreclosed and other assets | 20 | 19 | ||||||
Total OREO and foreclosed assets | $ | 299 | $ | 370 | ||||
Total OREO and foreclosed assets decreased $71 million during 2015 and is 12% of total nonperforming assets at December 31, 2015. As of December 31, 2015 and December 31, 2014, 59% and 62%, respectively, of our OREO and foreclosed assets were comprised of residential related properties.
Loan Delinquencies
We regularly monitor the level of loan delinquencies and believe these levels may be a key indicator of loan portfolio asset quality. Measurement of delinquency status is based on the contractual terms of each loan. Loans that are 30 days or more past due in terms of payment are considered delinquent. Loan delinquencies exclude loans held for sale and purchased impaired loans, but include government insured or guaranteed loans and loans accounted for under the fair value option.
Table 31: Accruing Loans Past Due (a) (b)
| Amount | Percentage of Total Outstandings | |||||||||||||||
| Dollars in millions | December 31 2015 | December 31 2014 | December 31 2015 | December 31 2014 | ||||||||||||
Early stage loan delinquencies | ||||||||||||||||
Accruing loans past due 30 to 59 days | $ | 511 | $ | 582 | .25 | % | .28 | % | ||||||||
Accruing loans past due 60 to 89 days | 248 | 259 | .12 | % | .13 | % | ||||||||||
Total | 759 | 841 | .37 | % | .41 | % | ||||||||||
Late stage loan delinquencies | ||||||||||||||||
Accruing loans past due 90 days or more | 881 | 1,105 | .43 | % | .54 | % | ||||||||||
Total | $ | 1,640 | $ | 1,946 | .80 | % | .95 | % | ||||||||
| (a) | Amounts in table represent recorded investment. |
| (b) | Past due loan amounts at December 31, 2015 include government insured or guaranteed loans of $172 million, $120 million, and $765 million for accruing loans past due 30 to 59 days, past due 60 to 89 days, and past due 90 days or more, respectively. The comparative amounts as of December 31, 2014 were $220 million, $136 million, and $996 million, respectively. |
| The PNC Financial Services Group, Inc. – Form 10-K 73 |
Total early stage loan delinquencies (accruing loans past due 30 to 89 days) decreased $82 million, or 10%, at December 31, 2015 compared to December 31, 2014, driven by reductions in consumer early stage delinquencies.
Accruing loans past due 90 days or more decreased $224 million, or 20%, at December 31, 2015 compared to December 31, 2014 due to declines in government insured residential real estate loans of $174 million, the majority of which we took possession of and conveyed the real estate, or are in the process of conveyance and claim resolution. Accruing loans past due 90 days or more are referred to as late stage loan delinquencies. These loans are not included in nonperforming loans and continue to accrue interest because they are well secured by collateral and are in the process of collection, or are managed in homogenous portfolios with specified charge-off timeframes adhering to regulatory guidelines, or are certain government insured or guaranteed loans.
On a regular basis our Special Asset Committee closely monitors loans, primarily commercial loans, that are not included in the nonperforming or accruing past due categories and for which we are uncertain about the borrower's ability to comply with existing repayment terms. These loans totaled $.1 billion and $.2 billion at December 31, 2015 and December 31, 2014, respectively.
See Note 1 Accounting Policies and Note 3 Asset Quality in the Notes To Consolidated Financial Statements in Item 8 of this Report for additional information regarding our nonperforming loan and nonaccrual policies and further information on loan delinquencies.
Home Equity Loan Portfolio
Our home equity loan portfolio totaled $32.1 billion as of December 31, 2015, or 16% of the total loan portfolio. Of that total, $18.8 billion, or 59%, was outstanding under primarily variable-rate home equity lines of credit and $13.3 billion, or 41%, consisted of closed-end home equity installment loans. Approximately 4% of the home equity portfolio was purchased impaired and 3% of the home equity portfolio was on nonperforming status as of December 31, 2015.
As of December 31, 2015, we are in an originated first lien position for approximately 53% of the total outstanding portfolio and, where originated as a second lien, we currently hold or service the first lien position for an additional 2% of the portfolio. The remaining 45% of the portfolio was secured by second liens where we do not hold the first lien position. The credit performance of the majority of the home equity portfolio where we are in, hold or service the first lien position, is superior to the portion of the portfolio where we hold the second lien position but do not hold the first lien.
Lien position information is generally based upon original LTV at the time of origination. However, after origination
PNC is not typically notified when a senior lien position that is not held by PNC is satisfied. Therefore, information about the current lien status of junior lien loans is less readily available in cases where PNC does not also hold the senior lien. Additionally, PNC is not typically notified when a junior lien position is added after origination of a PNC first lien. This updated information for both junior and senior liens must be obtained from external sources, and therefore, PNC has contracted with an industry-leading third-party service provider to obtain updated loan, lien and collateral data that is aggregated from public and private sources.
We track borrower performance monthly, including obtaining original LTVs, updated FICO scores at least quarterly, updated LTVs semi-annually, and other credit metrics at least quarterly, including the historical performance of any mortgage loans regardless of lien position that we do or do not hold. This information is used for internal reporting and risk management. For internal reporting and risk management we also segment the population into pools based on product type ( e.g. , home equity loans, brokered home equity loans, home equity lines of credit, brokered home equity lines of credit). As part of our overall risk analysis and monitoring, we segment the home equity portfolio based upon the loan delinquency, modification status and bankruptcy status, as well as the delinquency, modification status and bankruptcy status of any mortgage loan with the same borrower (regardless of whether it is a first lien senior to our second lien).
In establishing our ALLL for non-impaired loans, we primarily utilize a delinquency roll-rate methodology for pools of loans. In accordance with accounting principles, under this methodology, we establish our allowance based upon incurred losses, not lifetime expected losses. The roll-rate methodology estimates transition/roll of loan balances from one delinquency state ( e.g. , 30-59 days past due) to another delinquency state ( e.g. , 60-89 days past due) and ultimately to charge-off. The roll through to charge-off is based on PNC's actual loss experience for each type of pool. Each of our home equity pools contains both first and second liens. Our experience has been that the ratio of first to second lien loans has been consistent over time and the charge-off amounts for the pools, used to establish our allowance, include losses on both first and second liens loans.
Generally, our variable-rate home equity lines of credit have either a seven or ten year draw period, followed by a 20-year amortization term. During the draw period, we have home equity lines of credit where borrowers pay either interest or principal and interest. We view home equity lines of credit where borrowers are paying principal and interest under the draw period as less risky than those where the borrowers are paying interest only, as these borrowers have a demonstrated ability to make some level of principal and interest payments. The risk associated with the borrower's ability to satisfy the loan terms upon the draw period ending is considered in
| 74 The PNC Financial Services Group, Inc. – Form 10-K |
establishing our ALLL. Based upon outstanding balances at December 31, 2015, the following table presents the periods when home equity lines of credit draw periods are scheduled to end.
Table 32: Home Equity Lines of Credit – Draw Period End Dates
| In millions | Interest Only Product | Principal and Interest Product | ||||||
2016 | $ | 1,121 | $ | 369 | ||||
2017 | 2,107 | 538 | ||||||
2018 | 927 | 734 | ||||||
2019 | 648 | 576 | ||||||
2020 and thereafter | 3,321 | 5,758 | ||||||
Total (a) (b) | $ | 8,124 | $ | 7,975 | ||||
| (a) | Includes all home equity lines of credit that mature in 2016 or later, including those with borrowers where we have terminated borrowing privileges. |
| (b) | Includes approximately $40 million, $48 million, $34 million, $26 million and $534 million of home equity lines of credit with balloon payments, including those where we have terminated borrowing privileges, with draw periods scheduled to end in 2016, 2017, 2018, 2019 and 2020 and thereafter, respectively. |
Based upon outstanding balances, and excluding purchased impaired loans, at December 31, 2015, for home equity lines of credit for which the borrower can no longer draw ( e.g. , draw period has ended or borrowing privileges have been terminated), approximately 3% were 30-89 days past due and approximately 5% were 90 days or more past due. Generally, when a borrower becomes 60 days past due, we terminate borrowing privileges and those privileges are not subsequently reinstated. At that point, we continue our collection/recovery processes, which may include loan modification resulting in a loan that is classified as a TDR.
See Note 3 Asset Quality in the Notes To Consolidated Financial Statements in Item 8 of this Report for additional information.
Auto Loan Portfolio
The auto loan portfolio totaled $11.2 billion as of December 31, 2015, or 5% of our total loan portfolio. Of that total, $9.6 billion resides in the indirect auto portfolio, $1.1 billion in the direct auto portfolio, and $.5 billion in acquired or securitized portfolios, which has been declining as no pools have been recently acquired. The indirect auto portfolio is the largest segment and generates auto loan applications from franchised automobile dealers. This business is strategically aligned with our core retail business.
We have elected not to pursue non-prime auto lending as evidenced by an average new loan origination FICO score over the last twelve months of 758 for indirect auto loans and 773 for direct auto loans. As of December 31, 2015, 0.3% of the portfolio was nonperforming and 0.5% of our auto loan portfolio was accruing past due. We
offer both new and used automobile financing to customers through our various channels. The portfolio comprised 60% new vehicle loans and 40% used vehicle loans at December 31, 2015.
The auto loan portfolio's performance is measured monthly, including updated collateral values that are obtained monthly and updated FICO scores that are obtained at least quarterly. For internal reporting and risk management, we analyze the portfolio by product channel and product type, and regularly evaluate default and delinquency experience. As part of our overall risk analysis and monitoring, we segment the portfolio by loan structure, collateral attributes, and credit metrics which include FICO score, loan-to-value and term.
Oil and Gas Portfolio
Our portfolio in the oil and gas industry totaled $2.6 billion as of December 31, 2015, or 1% of our total loan portfolio and 2% of our total commercial lending portfolio. This portfolio comprised approximately $1 billion in the midstream and downstream sectors, $.9 billion of oil services companies and $.7 billion related to energy and production companies.
Of the oil services portfolio, approximately $.2 billion is not asset-based or investment grade. Our ALLL at December 31, 2015 reflects the incremental impact of the continued decline in oil and gas prices.
See Note 3 Asset Quality in the Notes To Consolidated Financial Statements in Item 8 of this Report for additional information.
Loan Modifications and Troubled Debt Restructurings
Consumer Loan Modifications
We modify loans under government and PNC-developed programs based upon our commitment to help eligible homeowners and borrowers avoid foreclosure, where appropriate. Initially, a borrower is evaluated for a modification under a government program. If a borrower does not qualify under a government program, the borrower is then evaluated under a PNC program. Our programs utilize both temporary and permanent modifications and typically reduce the interest rate, extend the term and/or defer principal. Loans that are either temporarily or permanently modified under programs involving a change to loan terms are generally classified as TDRs. Further, loans that have certain types of payment plans and trial payment arrangements which do not include a contractual change to loan terms may be classified as TDRs. Additional detail on TDRs is discussed below as well as in Note 3 Asset Quality in the Notes To Consolidated Financial Statements in Item 8 of this Report.
A temporary modification, with a term between 3 and 24 months, involves a change in original loan terms for a period
| The PNC Financial Services Group, Inc. – Form 10-K 75 |
of time and reverts to a calculated exit rate for the remaining term of the loan as of a specific date. A permanent modification, with a term greater than 24 months, is a modification in which the terms of the original loan are changed. Permanent modification programs, including both government-created Home Affordable Modification Program (HAMP) and PNC-developed modification programs, generally result in principal forgiveness, interest rate reduction, term extension, capitalization of past due amounts, interest only period or deferral of principal.
We also monitor the success rates and delinquency status of our loan modification programs to assess their effectiveness in serving our borrowers' and servicing customers' needs while mitigating credit losses. Table 33 provides the number of bank-owned accounts and unpaid principal balance of modified consumer real estate related loans at the end of each year presented.
Table 33: Consumer Real Estate Related Loan Modifications
| December 31, 2015 | December 31, 2014 | |||||||||||||||
| Dollars in millions | Number of Accounts | Unpaid Principal Balance | Number of Accounts | Unpaid Principal Balance | ||||||||||||
Temporary modifications (a) | 4,469 | $ | 337 | 5,346 | $ | 417 | ||||||||||
Permanent modifications | ||||||||||||||||
Home equity | 15,268 | 1,088 | 13,128 | 968 | ||||||||||||
Residential real estate | 8,787 | 1,721 | 12,526 | 2,350 | ||||||||||||
Total permanent modifications | 24,055 | 2,809 | 25,654 | 3,318 | ||||||||||||
Total consumer real estate related loan modifications | 28,524 | $ | 3,146 | 31,000 | $ | 3,735 | ||||||||||
| (a) | All temporary modifications are home equity loans. |
In addition to temporary loan modifications, we may make available to a borrower a payment plan or a HAMP trial payment period. Under a payment plan or a HAMP trial payment period, there is no change to the loan's contractual terms so the borrower remains legally responsible for payment of the loan under its original terms.
Payment plans may include extensions, re-ages and/or forbearance plans. All payment plans bring an account current once certain requirements are achieved and are primarily intended to demonstrate a borrower's renewed willingness and ability to re-pay. Due to the short term nature of the payment plan, there is a minimal impact to the ALLL.
Under a HAMP trial payment period, we establish an alternate payment, generally at an amount less than the contractual payment amount, for the borrower during this short time period. This allows a borrower to demonstrate successful payment performance before permanently restructuring the loan into a HAMP modification. Subsequent to successful borrower performance under the trial payment period, we will capitalize the original contractual amount past due, to include accrued interest and fees receivable, and restructure the loan's contractual terms, along with bringing the restructured account current. As the borrower is often already delinquent at the time of participation in the HAMP trial payment period, generally enrollment in the program does not significantly increase the ALLL. If the trial payment period is unsuccessful, the loan will be evaluated for further action based upon our existing policies.
Commercial Loan Modifications and Payment Plans
Modifications of terms for commercial loans are based on individual facts and circumstances. Commercial loan modifications may involve reduction of the interest rate, extension of the loan term and/or forgiveness of principal. Modified commercial loans are usually already nonperforming prior to modification. We evaluate these modifications for TDR classification based upon whether we granted a concession to a borrower experiencing financial difficulties. Additional detail on TDRs is discussed below as well as in Note 3 Asset Quality in the Notes To Consolidated Financial Statements in Item 8 of this Report.
We have established certain commercial loan modification and payment programs for small business loans, Small Business Administration loans, and investment real estate loans. As of December 31, 2015 and December 31, 2014, $23 million and $34 million, respectively, in loan balances were covered under these modification and payment plan programs. Of these loan balances, $9 million and $12 million have been determined to be TDRs as of December 31, 2015 and December 31, 2014, respectively.
| 76 The PNC Financial Services Group, Inc. – Form 10-K |
Troubled Debt Restructurings
A TDR is a loan whose terms have been restructured in a manner that grants a concession to a borrower experiencing financial difficulties. TDRs result from our loss mitigation activities and include rate reductions, principal forgiveness, postponement/reduction of scheduled amortization and extensions, which are intended to minimize economic loss and to avoid foreclosure or repossession of collateral. Additionally, TDRs also result from borrowers that have been discharged from personal liability through Chapter 7 bankruptcy and have not formally reaffirmed their loan obligations to PNC.
Table 34: Summary of Troubled Debt Restructurings (a)
| In millions | December 31 2015 | December 31 2014 | ||||||
Consumer lending: | ||||||||
Real estate-related | $ | 1,775 | $ | 1,864 | ||||
Credit card | 108 | 130 | ||||||
Other consumer | 34 | 47 | ||||||
Total consumer lending (b) | 1,917 | 2,041 | ||||||
Total commercial lending | 434 | 542 | ||||||
Total TDRs | $ | 2,351 | $ | 2,583 | ||||
Nonperforming | $ | 1,119 | $ | 1,370 | ||||
Accruing | 1,232 | 1,213 | ||||||
Total TDRs | $ | 2,351 | $ | 2,583 | ||||
| (a) | Amounts in table represent recorded investment, which includes the unpaid principal balance plus accrued interest and net accounting adjustments, less any charge-offs. Recorded investment does not include any associated valuation allowance. |
| (b) | Excludes $1.2 billion and $.9 billion of consumer loans held for sale, loans accounted for under the fair value option and pooled purchased impaired loans, as well as certain government insured or guaranteed loans at December 31, 2015 and December 31, 2014, respectively. |
Total TDRs decreased $232 million, or 9%, during 2015. Nonperforming TDRs were approximately 53% of total nonperforming loans, and 48% of total TDRs.
TDRs that are performing, including credit card loans, are excluded from nonperforming loans. These TDRs remained generally flat during 2015 at $1.2 billion. Generally, the accruing category is comprised of loans where borrowers have been performing under the restructured terms for at least six consecutive months. Loans where borrowers have been discharged from personal liability through Chapter 7 bankruptcy and have not formally reaffirmed their loan obligations to PNC and loans to borrowers not currently obligated to make both principal and interest payments under the restructured terms are not returned to accrual status.
See Note 3 Asset Quality in the Notes To Consolidated Financial Statements in Item 8 of this Report for additional information on loan modifications and TDRs.
Allowances for Loan and Lease Losses and Unfunded Loan Commitments and Letters of Credit
Table 35: Loan Charge-Offs And Recoveries
Year ended December 31 Dollars in millions | Gross Charge-offs | Recoveries | Net Charge-offs / | Percent of Average Loans | ||||||||||||
2015 | ||||||||||||||||
Commercial | $ | 206 | $ | 170 | $ | 36 | .04 | % | ||||||||
Commercial real estate | 44 | 66 | (22 | ) | (.09 | ) | ||||||||||
Equipment lease financing | 5 | 4 | 1 | .01 | ||||||||||||
Home equity | 181 | 93 | 88 | .26 | ||||||||||||
Residential real estate | 24 | 13 | 11 | .08 | ||||||||||||
Credit card | 160 | 21 | 139 | 3.06 | ||||||||||||
Other consumer | 185 | 52 | 133 | .60 | ||||||||||||
Total | $ | 805 | $ | 419 | $ | 386 | .19 | |||||||||
2014 | ||||||||||||||||
Commercial | $ | 276 | $ | 207 | $ | 69 | .07 | % | ||||||||
Commercial real estate | 70 | 84 | (14 | ) | (.06 | ) | ||||||||||
Equipment lease financing | 14 | 14 | ||||||||||||||
Home equity | 275 | 78 | 197 | .56 | ||||||||||||
Residential real estate | 40 | 26 | 14 | .10 | ||||||||||||
Credit card | 163 | 21 | 142 | 3.24 | ||||||||||||
Other consumer | 183 | 60 | 123 | .54 | ||||||||||||
Total | $ | 1,021 | $ | 490 | $ | 531 | .27 | |||||||||
Total net charge-offs are lower than they would have been otherwise due to the accounting treatment for purchased impaired loans. This treatment also results in a lower ratio of net charge-offs to average loans. See Note 4 Purchased Loans in the Notes To Consolidated Financial Statements in Item 8 of this Report for additional information on net charge-offs related to these loans.
We maintain an ALLL to absorb losses from the loan and lease portfolio and determine this allowance based on quarterly assessments of the estimated probable credit losses incurred in the loan and lease portfolio. Our total ALLL of $2.7 billion at December 31, 2015 consisted of $1.6 billion and $1.1 billion established for the commercial lending and consumer lending categories, respectively. We maintain the ALLL at a level that we believe to be appropriate to absorb estimated probable credit losses incurred in the loan and lease portfolio as of the balance sheet date. The reserve calculation and determination process is dependent on the use of key assumptions. Key reserve assumptions and estimation processes react to and are influenced by observed changes in loan and lease portfolio performance experience, the financial strength of the borrower, and economic conditions. Key reserve assumptions are periodically updated.
| The PNC Financial Services Group, Inc. – Form 10-K 77 |
We establish specific allowances for loans considered impaired using methods prescribed by GAAP. All impaired loans are subject to individual analysis, except leases and large groups of smaller-balance homogeneous loans which may include, but are not limited to, credit card, residential real estate secured and consumer installment loans. Specific allowances for individual loans (including commercial and consumer TDRs) are determined based on an analysis of the present value of expected future cash flows from the loans discounted at their effective interest rate, observable market price or the fair value of the underlying collateral.
Reserves allocated to non-impaired commercial loan classes are based on PD and LGD credit risk ratings.
Our commercial pool reserve methodology is sensitive to changes in key risk parameters such as PD and LGD. The results of these parameters are then applied to the loan balance and unfunded loan commitments and letters of credit to determine the amount of the respective reserves. Our PDs and LGDs are primarily determined using internal commercial loan loss data. This internal data is supplemented with third-party data and management judgment, as deemed necessary. We continue to evaluate and enhance our use of internal commercial loss data and will periodically update our PDs and LGDs as well as consider third-party data, regulatory guidance and management judgment.
The majority of the commercial portfolio is secured by collateral, including loans to asset-based lending customers, which generally demonstrate lower LGD compared to loans not secured by collateral. Additionally, guarantees on loans greater than $1 million and owner guarantees for small business loans do not significantly impact our ALLL.
Allocations to non-impaired consumer loan classes are primarily based upon a roll-rate model which uses statistical relationships, calculated from historical data that estimate the movement of loan outstandings through the various stages of delinquency and ultimately charge-off.
A portion of the ALLL is related to qualitative and measurement factors. These factors may include, but are not limited to, the following:
| • | Industry concentrations and conditions, |
| • | Recent credit quality trends, |
| • | Recent loss experience in particular portfolios, |
| • | Recent macro-economic factors, |
| • | Model imprecision, |
| • | Changes in lending policies and procedures, |
| • | Timing of available information, including the performance of first lien positions, and |
| • | Limitations of available historical data. |
PNC's determination of the ALLL for non-impaired loans is sensitive to the risk grades assigned to commercial loans and loss rates for consumer loans. There are several other
qualitative and quantitative factors considered in determining the ALLL. This sensitivity analysis does not necessarily reflect the nature and extent of future changes in the ALLL. It is intended to provide insight into the impact of adverse changes to risk grades and loss rates only and does not imply any expectation of future deterioration in the risk ratings or loss rates. Given the current processes used, we believe the risk grades and loss rates currently assigned are appropriate. In the hypothetical event that the aggregate weighted average commercial loan risk grades would experience a 1% deterioration, assuming all other variables remain constant, the allowance for commercial loans would increase by approximately $44 million as of December 31, 2015. In the hypothetical event that consumer loss rates would increase by 10%, assuming all other variables remain constant, the allowance for consumer loans would increase by approximately $24 million at December 31, 2015.
Purchased impaired loans are initially recorded at fair value and applicable accounting guidance prohibits the carry over or creation of valuation allowances at acquisition. Because the initial fair values of these loans already reflect a credit component, additional reserves are established when performance is expected to be worse than our expectations as of the acquisition date. At December 31, 2015, we had established reserves of $.3 billion for purchased impaired loans. In addition, loans (purchased impaired and non-impaired) acquired after January 1, 2009 were recorded at fair value . No allowance for loan losses was carried over and no allowance was created at the date of acquisition. See Note 4 Purchased Loans in the Notes To Consolidated Financial Statements in Item 8 of this Report for additional information.
In determining the appropriateness of the ALLL, we make specific allocations to impaired loans and allocations to portfolios of commercial and consumer loans. We also allocate reserves to provide coverage for probable losses incurred in the portfolio at the balance sheet date based upon current market conditions, which may not be reflected in historical loss data. Commercial lending is the largest category of credits and is sensitive to changes in assumptions and judgments underlying the determination of the ALLL. We have allocated approximately $1.6 billion, or 59%, of the ALLL at December 31, 2015 to the commercial lending category. Consumer lending allocations are made based on historical loss experience adjusted for recent activity. Approximately $1.1 billion, or 41%, of the ALLL at December 31, 2015 has been allocated to these consumer lending categories.
In addition to the ALLL, we maintain an allowance for unfunded loan commitments and letters of credit. We report this allowance as a liability on our Consolidated Balance Sheet. We maintain the allowance for unfunded loan commitments and letters of credit at a level we believe is appropriate to absorb estimated probable losses on these unfunded credit facilities. We determine this amount using
| 78 The PNC Financial Services Group, Inc. – Form 10-K |
estimates of the probability of the ultimate funding and losses related to those credit exposures. Other than the estimation of the probability of funding, this methodology is very similar to the one we use for determining our ALLL.
We refer you to Note 1 Accounting Policies and Note 3 Asset Quality in the Notes To Consolidated Financial Statements in Item 8 of this Report for further information on certain key asset quality indicators that we use to evaluate our portfolios and establish the allowances.
Table 36: Allowance for Loan and Lease Losses
| Dollars in millions | 2015 | 2014 | ||||||
January 1 | $ | 3,331 | $ | 3,609 | ||||
Total net charge-offs | (386 | ) | (531 | ) | ||||
Provision for credit losses | 255 | 273 | ||||||
Net change in allowance for unfunded loan commitments and letters of credit | (2 | ) | (17 | ) | ||||
Write-offs of purchased impaired loans (a) | (468 | ) | ||||||
Other | (3 | ) | (3 | ) | ||||
December 31 | $ | 2,727 | $ | 3,331 | ||||
Net charge-offs to average loans (for the year ended) | .19 | % | .27 | % | ||||
Allowance for loan and lease losses to total loans (a) | 1.32 | 1.63 | ||||||
Commercial lending net charge-offs | $ | (15 | ) | $ | (55 | ) | ||
Consumer lending net charge-offs | (371 | ) | (476 | ) | ||||
Total net charge-offs | $ | (386 | ) | $ | (531 | ) | ||
Net charge-offs to average loans (for the year ended) | ||||||||
Commercial lending | .01 | % | .04 | % | ||||
Consumer lending | .50 | .62 | ||||||
| (a) | A portion of the ALLL associated with purchased impaired pooled consumer and residential real estate loans was derecognized on December 31, 2015 due to the change in the derecognition policy for these loans. The December 31, 2015 ratio of ALLL to total loans was impacted by the derecognition. For additional information see Note 4 Purchased Loans in the Notes To Consolidated Financial Statements in Item 8 of this Report. |
The provision for credit losses decreased to $255 million for 2015 compared to $273 million for 2014 due to improved credit quality. For 2015, the provision for commercial lending credit losses decreased by $45 million, or 45%, from 2014. The provision for consumer lending credit losses increased $27 million, or 16%, from 2014.
At December 31, 2015, total ALLL to total nonperforming loans was 128%. The comparable amount for December 31, 2014 was 133%. These ratios are 98% and 85%, respectively, when excluding the $.6 billion and $1.2 billion, respectively, of ALLL at December 31, 2015 and December 31, 2014 allocated to consumer loans and lines of credit not secured by residential real estate and purchased impaired loans. We have excluded consumer loans and lines of credit not secured by real estate as they are charged off after 120 to 180 days past
due and not placed on nonperforming status. Additionally, we have excluded purchased impaired loans as they are considered performing regardless of their delinquency status as interest is accreted in accordance with ASC 310-30 based on the recorded investment balance. Additional allowance is recorded when the net present value of expected cash flows is lower than the recorded investment balance. See Table 28 within this Credit Risk Management section for additional information.
The ALLL balance increases or decreases across periods in relation to fluctuating risk factors, including asset quality trends, net charge-offs and changes in aggregate portfolio balances. The ALLL balance declined $.6 billion, or 18%, as of December 31, 2015 compared to December 31, 2014. During 2015, the decline was driven by improved asset quality trends, including, but not limited to, delinquency status and improving economic conditions, as well as reduced net charge-offs, coupled with the derecognition of $468 million of ALLL related to purchased impaired pooled consumer and residential real estate loans. These impacts to ALLL were partially offset by continued portfolio growth over the recent quarters.
See Note 1 Accounting Policies and Note 4 Purchased Loans in the Notes To Consolidated Financial Statements in Item 8 of this Report regarding changes in the ALLL and in the allowance for unfunded loan commitments and letters of credit.
Operational Risk Management
Operational risk is the risk of loss resulting from inadequate or failed internal processes or systems, human factors, or external events. This includes losses that may arise as a result of non-compliance with laws or regulations, failure to fulfill fiduciary responsibilities, as well as litigation or other legal actions. Operational risk may occur in any of our business activities and manifests itself in various ways, including but not limited to:
| • | Transaction processing errors, |
| • | Unauthorized transactions and fraud by employees or third parties, |
| • | Material disruption in business activities, |
| • | System breaches and misuse of sensitive information, |
| • | Regulatory or governmental actions, fines or penalties, and |
| • | Significant legal expenses, judgments or settlements. |
PNC's Operational Risk Management is inclusive of Technology Risk Management and Business Continuity Risk. Enterprise Compliance is responsible for coordinating the compliance risk component of PNC's Operational Risk framework. Operational Risk Management focuses on balancing business needs, regulatory expectations and risk management priorities through an adaptive and proactive program that is designed to provide a strong governance
| The PNC Financial Services Group, Inc. – Form 10-K 79 |
model, sound and consistent risk management processes and transparent operational risk reporting across the enterprise.
The PNC Board determines the strategic approach to operational risk via establishment of guiding principles, risk appetite and appropriate risk management structure. This includes establishment of risk metrics and limits and operational risk committee hierarchy and reporting structure to identify, understand and manage operational risks.
Executive Management has responsibility for operational risk management. The executive management team is responsible for monitoring significant risks, key controls and related issues through management reporting and a governance structure of risk committees, to help ensure that objectives are pursued within the bounds of our risk appetite.
Within the Independent Risk Management function, Operational Risk Management (ORM) is responsible for developing and maintaining the policies, methodologies, tools, and technology utilized across the enterprise to identify, assess, monitor, and report operational risks. ORM monitors enterprise-wide adherence with related policies and procedures and regularly assesses overall program effectiveness. In addition, ORM independently challenges the results and conclusions generated by the business units during the execution of the operational risk management program.
Business Unit management is responsible for the day-to-day management of operational risks inherent in the products, services, and activities for which they are responsible. Business Unit management is also responsible for adhering to PNC's enterprise-wide operational risk management policies and procedures including regularly identifying, measuring, and monitoring operational risks in their respective areas, as well as capturing, analyzing and reporting operational risks and issues.
Management of operational risk is based upon a comprehensive framework designed to enable PNC to determine the enterprise and individual business unit's operational risk profile in comparison to the established risk appetite and identify operational risks that may require further mitigation. This framework is established around a set of enterprise-wide policies and a system of internal controls that are designed to manage risk and to provide management with timely and accurate information about the operations of PNC. This framework employs a number of techniques to manage operational risk, including:
| • | Risk and Control Self Assessments (RCSAs) that are performed at least annually across PNC's businesses, processes, systems and products. RCSA methodology is a standard process for business units to document and assess operational risks, evaluate key control design and operating effectiveness, and determine if control enhancements are required, |
| • | A Scenario Analysis program that is leveraged to proactively evaluate operational risks with the potential for severe business, financial, operational or regulatory impact on the company or a major business unit. This methodology leverages standard processes and tools to evaluate a wide range of business and operational risks encompassing both external and internal events relevant to the company. Based upon scenario analysis conclusions, management may implement additional controls or risk management activities to reduce exposure to an acceptable level, |
| • | A Metrics and Key Risk Indicator framework that allows management to proactively monitor and assess shifts in operational risk exposure or key control effectiveness compared to expectations and thresholds. Enterprise-level Operational Risk Appetite metrics support PNC's Operational Risk Management framework and guiding principles with the objective of maintaining a risk profile within risk appetite. A broad set of operational risk indicators are in place to monitor and report exposures across the different inherent operational risk types. Lastly, business-specific risk indicators are established to monitor the most significant risks and controls identified in the individual risk and control self assessments, and |
| • | Operational loss events as well as technology and operational breakdowns that do not result in direct loss (near miss events) across the enterprise are continuously captured and maintained in a central repository. This information is analyzed and used to help determine the root causes of these events and to identify trends that could indicate changes in the company's risk exposure or control effectiveness. PNC's External Loss Event program utilizes a number of sources to monitor and identify external loss events occurring across the financial services industry. Relevant external events are evaluated by appropriate business and risk management personnel to determine whether PNC is exposed to similar events, and if so, whether appropriate controls are in place. |
We continue to refine our methodology to estimate capital requirements for operational risk using a proprietary version of an Advanced Measurement Approach (AMA) as prescribed in Basel II. Under the AMA, the results of the program elements described above are key inputs directly incorporated into the capital calculation methodology.
Risk professionals from Operational Risk, Technology Risk Management, Compliance and Legal work closely with business areas to evaluate risks and challenge that appropriate key controls are established prior to the introduction of new or enhanced products, services and technologies. These risk
| 80 The PNC Financial Services Group, Inc. – Form 10-K |
professionals also challenge Business Units' design and implementation of mitigation strategies to address risks and issues identified through ongoing assessment and monitoring activities.
PNC's Technology Risk Management (TRM) program is aligned with the operational risk framework. Technology risk represents the risk associated with the use, ownership, operation, involvement, influence and adoption of technology within an enterprise.
Management of technology risk is embedded into the culture and decision-making processes of PNC through an information and technology risk management framework designed to help ensure secure, sound, and compliant IT systems and infrastructure in support of business strategies and goals. The management of technology risk is a core business skill and an integral part of day-to-day activity.
Cybersecurity is a principal concern for financial institutions and is a very high priority for PNC. The ever changing and complex threat landscape is closely monitored and PNC participates in proactive information sharing with intelligence sources, law enforcement, and the private sector. The cyber security program is based on a continuous improvement strategy by assessing current and emerging threats to protect our critical business functions, as well as the integrity, privacy, and confidentiality of data. We continue to strengthen our controls, processes and systems to help protect our networks, computers, software, and data from attack, damage or unauthorized access. See Item 1A Risk Factors in this Report for additional information regarding the risk of a material adverse impact from interruptions in the effective operation of, or security breaches affecting, those systems.
Managers and staff at all levels are responsible for applying risk management policies, procedures, and strategies in their areas of responsibility. PNC's TRM function supports enterprise management of technology risk by independently assessing technology and information security risks, and by serving in an oversight role by measuring, monitoring, and challenging enterprise technology capabilities. Specifically, Technology Risk Management has the following objectives:
| • | A sound control infrastructure is in place to effectively manage technology risks to help drive informed business decisions, |
| • | Technology risks related to ongoing business and operational activities are identified, assessed, and monitored, |
| • | Technology risks related to new key initiatives are assessed and appropriately managed, and |
| • | Emerging technology risks are monitored and assessed to verify their potential impact to PNC's overall risk profile. |
To support PNC's overall risk profile within risk appetite and the Enterprise Risk Appetite Statement, Technology Risk Management has established governance, operating structures, metrics, and guiding principles designed to ensure that technology risk is distinctly considered in business activities and strategic decision making processes.
PNC has defined an enterprise-wide business continuity program that provides structure and guidelines to ensure resiliency and recovery of PNC's facilities, employees, suppliers and technology should there be a business disruption. It is a comprehensive program based upon a life cycle containing repeatable activities to identify and mitigate internal and external business disruptive threats. It is the responsibility of PNC's business units to execute and comply with the business continuity program. The program is administered by a separate group, with governance and oversight being provided by additional resources in the Independent Risk Management function.
PNC's Corporate Insurance Group is responsible for managing insurance risk across the organization, and is aligned within the enterprise risk management governance framework. PNC retains select corporate risks through its wholly-owned captive insurance company Alpine Indemnity Limited, and transfers excess risk through the purchase of insurance where appropriate, to mitigate the effects of operational loss events. PNC's risks associated with its participation as an insurer for these programs are mitigated through policy and annual aggregate limits. Decisions surrounding PNC's retention of its operating risks through deductibles or captive participation are made in conjunction with the enterprise risk management governance framework.
The Corporate Insurance Group monitors and manages insurable risks through a combination of risk mitigation, retention and transfer consistent with the organization's risk appetite and philosophy. To ensure the lines of business have a clear understanding of insurance risk and the ability to retain or transfer risk, management holds regular meetings with the lines of business regarding risk evaluation and the utilization of insurance as a risk transfer technique. Furthermore, Corporate Insurance management and the Insurance Risk Committee have primary oversight of reporting insurance related activities through the governance structure that allows management to fully vet risk information.
Quarterly, an enterprise operational risk report is developed to report key operational risks to senior management and the Board of Directors. The report encompasses key operational risk management conclusions, including the overall operational risk level, risk management effectiveness and outlook, grounded in quantitative measures and qualitative factors. Key enterprise operational risks are also included in the enterprise risk report. In addition, operational risk is an integrated part of the quarterly business-specific risk reports.
| The PNC Financial Services Group, Inc. – Form 10-K 81 |
Compliance Risk
Enterprise Compliance is responsible for coordinating the compliance risk component of PNC's Operational Risk framework. Compliance issues are identified and tracked through enterprise-wide monitoring and tracking programs. Key compliance risk issues are escalated through a comprehensive risk reporting process at both a business and enterprise level and incorporated, as appropriate, into the development and assessment of the firm's operational risk profile. The Compliance, Conflicts & Ethics Policy Committee, chaired by the Chief Compliance Officer, provides oversight for compliance, conflicts and ethics programs and strategies across PNC. This committee also oversees the compliance processes related to fiduciary and investment risk. In order to help understand, and where appropriate, proactively address emerging regulatory issues, Enterprise Compliance communicates regularly with various regulators with supervisory or regulatory responsibilities with respect to PNC, its subsidiaries or businesses and participates in forums focused on regulatory and compliance matters in the financial services industry.
Risk professionals from Operational Risk, Technology Risk Management, Compliance and Legal work closely with business areas to evaluate risks and challenge that appropriate key controls are established prior to the introduction of new or enhanced products, services and technologies. These risk professionals also challenge Business Units' design and implementation of mitigation strategies to address risks and issues identified through ongoing assessment and monitoring activities.
Model Risk Management
PNC relies on quantitative models to measure risks, to estimate certain financial values, and to support or inform certain business decisions. Models may be used in processes such as determining the pricing of various products, grading and granting loans, measuring interest rate risks and other market risks, predicting losses, and assessing capital adequacy, as well as to estimate the value of financial instruments and balance sheet items.
There are risks involved in the use of models as they have the potential to provide inaccurate output or results, could be used for purposes other than those for which they have been designed, or may be operated in an uncontrolled environment where unauthorized changes can take place and where other control risks exist.
The Model Risk Management Group is responsible for policies and procedures describing how model risk is evaluated and managed, and the application of the governance process to implement these practices throughout the enterprise. The Model Risk Management Group, a subcommittee of the Enterprise Risk Management Committee, oversees all aspects of model risk, including PNC's
compliance with regulatory requirements related to model risk management, and approves exceptions to policy when appropriate.
To better manage our business, our practices around the use of models, and to comply with regulatory guidance and requirements, we have policies and procedures in place that define our governance processes for assessing and controlling model risk. These processes focus on identifying, reporting and remediating any problems with the soundness, accuracy, improper use or operating environment of our models. We recognize that models must be monitored over time to ensure their continued accuracy and functioning, and our policies also address the type and frequency of performance monitoring that is appropriate according to the importance of each model. PNC also monitors key metrics designed to assess our level of model risk and its alignment with our risk appetite.
There are a number of practices we undertake to identify and control model risk. A primary consideration is that models be well understood by those who use them as well as by other parties. Our policies require detailed written model documentation for significant models to assist in making their use transparent and understood by users, independent reviewers, and regulatory and auditing bodies. The documentation must include details on the data and methods used to develop each model, assumptions utilized within the model, an assessment of model performance and a description of model limitations and circumstances in which a model should not be relied upon.
Our modeling methods and data are reviewed by independent model reviewers not involved in the development of the model to identify possible errors or areas where the soundness of the model could be in question. Issues identified by the independent reviewer are tracked and reported using our existing governance structure until the issue has been fully remediated.
It is important that models operate in a controlled environment where access to code or the ability to make changes is limited to those who are authorized to do so. Additionally, proper back-up and recovery mechanisms are needed for the ongoing functioning of models. Our use of independent model control reviewers aids in the evaluation of the existing control mechanisms to help ensure that controls are appropriate and are functioning properly.
Liquidity Risk Management
Liquidity risk has two fundamental components. The first is potential loss assuming we were unable to meet our funding requirements at a reasonable cost. The second is the potential inability to operate our businesses because adequate contingent liquidity is not available. We manage liquidity risk at the consolidated company level (bank, parent company, and nonbank subsidiaries combined) to help ensure that we can
| 82 The PNC Financial Services Group, Inc. – Form 10-K |
obtain cost-effective funding to meet current and future obligations under both normal "business as usual" and stressful circumstances, and to help ensure that we maintain an appropriate level of contingent liquidity.
Management monitors liquidity through a series of early warning indicators that may indicate a potential market, or PNC-specific, liquidity stress event. In addition, management performs a set of liquidity stress tests over multiple time horizons with varying levels of severity and maintains a contingency funding plan to address a potential stress event. In the most severe liquidity stress simulation, we assume that PNC's liquidity position is under pressure, while the market in general is under systemic pressure. The simulation considers, among other things, the impact of restricted access to both secured and unsecured external sources of funding, accelerated run-off of customer deposits, valuation pressure on assets and heavy demand to fund contingent obligations. Parent company liquidity guidelines are designed to help ensure that sufficient liquidity is available to meet our parent company obligations over the succeeding 24-month period. Liquidity-related risk limits are established within our Enterprise Liquidity Management Policy and supporting policies. Management committees, including the Asset and Liability Committee, and the Board of Directors and its Risk Committee regularly review compliance with key established limits.
In addition to these liquidity monitoring measures and tools described above, PNC also monitors its liquidity by reference to the LCR, a regulatory minimum liquidity requirement designed to ensure that covered banking organizations maintain an adequate level of liquidity to meet net liquidity needs over the course of a 30-day stress scenario. The LCR is calculated by dividing the amount of an institution's high quality, unencumbered liquid assets (HQLA), as defined and calculated in accordance with the LCR rules, by its estimated net cash outflow, with net cash outflows determined by applying the assumed outflow factors in the LCR rules. The resulting quotient is expressed as a percentage. For PNC and PNC Bank, the LCR became effective January 1, 2015. The minimum required LCR will be phased-in over a period of years. The minimum LCR that PNC and PNC Bank were required to maintain was 80% in 2015 and such minimum increased to 90% in 2016. Between January 1, 2016 and June 30, 2016, PNC and PNC Bank are required to calculate the LCR on a month-end basis. Effective July 1, 2016, PNC and PNC Bank must begin calculating their respective LCR ratios on a daily basis.
As of December 31, 2015, the LCR for PNC and PNC Bank exceeded 100 percent. The December 31, 2015 LCR calculation and the underlying components are based on PNC's current interpretation and understanding of the final LCR rules and are subject to, among other things, further regulatory guidance.
We provide additional information regarding regulatory liquidity requirements and their potential impact on PNC in the Supervision and Regulation section of Item 1 Business and Item 1A Risk Factors of this Report.
Bank Level Liquidity – Uses
At the bank level, primary contractual obligations include funding loan commitments, satisfying deposit withdrawal requests and maturities and debt service related to bank borrowings. As of December 31, 2015, there were approximately $8.3 billion of bank borrowings with contractual maturities of less than one year, including $1.8 billion in borrowings from an affiliate. We also maintain adequate bank liquidity to meet future potential loan demand and provide for other business needs, as necessary.
Bank Level Liquidity – Sources
Our largest source of bank liquidity on a consolidated basis is the deposit base generated by our retail and commercial banking businesses. Total deposits increased to $249.0 billion at December 31, 2015 from $232.2 billion at December 31, 2014, driven primarily by growth in savings and demand deposits. Assets determined by PNC to be liquid (liquid assets) and unused borrowing capacity from a number of sources are also available to maintain our liquidity position. Borrowed funds come from a diverse mix of short-term and long-term funding sources.
At December 31, 2015, our liquid assets consisted of short-term investments (Federal funds sold, resale agreements, trading securities and interest-earning deposits with banks) totaling $33.6 billion and securities available for sale totaling $55.8 billion. The level of liquid assets fluctuates over time based on many factors, including market conditions, loan and deposit growth and balance sheet management activities. Of our total liquid assets of $89.4 billion, we had $3.2 billion of securities available for sale and trading securities pledged as collateral to secure public and trust deposits, repurchase agreements and for other purposes. In addition to the liquid assets we pledged, $6.5 billion of securities held to maturity were also pledged as collateral for these purposes.
In addition to the customer deposit base, which has historically provided the single largest source of relatively stable and low-cost funding, the bank also obtains liquidity through the issuance of traditional forms of funding, including long-term debt (senior notes, subordinated debt and FHLB advances) and short-term borrowings (Federal funds purchased, securities sold under repurchase agreements, commercial paper and other short-term borrowings).
| The PNC Financial Services Group, Inc. – Form 10-K 83 |
Under the 2014 bank note program, PNC Bank may from time to time offer unsecured senior and subordinated notes with maturity dates more than nine months (in the case of senior notes) and five years or more (in the case of subordinated notes). On May 22, 2015, PNC Bank increased the capacity of this program by $5.0 billion to a maximum aggregate principal amount at any one time outstanding of $30.0 billion. The $30.0 billion of notes authorized to be issued and outstanding at any one time includes notes issued by PNC Bank under the 2004 bank note program and those notes PNC Bank has assumed through the acquisition of other banks, in each case for so long as such notes remain outstanding. The terms of the 2014 bank note program do not affect any of the bank notes issued prior to January 16, 2014. At December 31, 2015, PNC Bank had $24.1 billion of notes outstanding under this program of which $17.9 billion was senior bank notes and $6.2 billion was subordinated bank notes. The following table details all issuances during 2015:
Table 37: PNC Bank Notes Issued During 2015
| Issuance Date | Amount | Description of Issuance | ||
February 6, 2015 | $600 million | Floating rate senior notes issued to an affiliate with a maturity date of January 26, 2017. Interest is payable at the 3-month LIBOR rate, reset quarterly, plus a spread of .30%, on January 26, April 26, July 26 and October 26 of each year, beginning on April 26, 2015. | ||
February 23, 2015 | $750 million | Senior notes with a maturity date of February 23, 2025. Interest is payable semi-annually at a fixed rate of 2.950% on February 23 and August 23 of each year, beginning on August 23, 2015. | ||
February 23, 2015 | $1.0 billion | Senior notes with a maturity date of February 23, 2018. Interest is payable semi-annually at a fixed rate of 1.500% on February 23 and August 23 of each year, beginning on August 23, 2015. | ||
May 27, 2015 | $200 million | Floating rate senior notes with a maturity date of May 27, 2021. Interest is payable at the 3-month LIBOR rate, reset quarterly, plus a spread of .65%, on February 27, May 27, August 27 and November 27 of each year, beginning on August 27, 2015. | ||
June 1, 2015 | $550 million | Floating rate senior notes with a maturity date of June 1, 2018. Interest is payable at the 3-month LIBOR rate, reset quarterly, plus a spread of .42%, on March 1, June 1, September 1 and December 1 of each year, beginning on September 1, 2015. | ||
June 1, 2015 | $1.3 billion | Senior notes with a maturity date of June 1, 2018. Interest is payable semi-annually at a fixed rate of 1.600% on June 1 and December 1 of each year, beginning on December 1, 2015. | ||
June 1, 2015 | $750 million | Senior notes with a maturity date of June 1, 2020. Interest is payable semi-annually at a fixed rate of 2.300% on June 1 and December 1 of each year, beginning on December 1, 2015. | ||
June 1, 2015 | $400 million | Senior notes with a maturity date of June 1, 2025. Interest is payable semi-annually at a fixed rate of 3.250% on June 1 and December 1 of each year, beginning on December 1, 2015. | ||
July 21, 2015 | $750 million | Senior notes with a maturity date of July 20, 2018. Interest is payable semi-annually at a fixed rate of 1.850% on January 20 and July 20 of each year, beginning on January 20, 2016. | ||
July 21, 2015 | $750 million | Senior notes with a maturity date of July 21, 2020. Interest is payable semi-annually at a fixed rate of 2.600% on January 21 and July 21 of each year, beginning on January 21, 2016. | ||
November 3, 2015 | $1.0 billion | Senior notes with a maturity date of November 5, 2018. Interest is payable semi-annually at a fixed rate of 1.800% on May 5 and November 5 of each year, beginning on May 5, 2016. | ||
November 3, 2015 | $750 million | Senior notes with a maturity date of November 5, 2020. Interest is payable semi-annually at a fixed rate of 2.450% on May 5 and November 5 of each year, beginning on May 5, 2016. |
| 84 The PNC Financial Services Group, Inc. – Form 10-K |
Total senior and subordinated debt of PNC Bank increased to $25.5 billion at December 31, 2015 from $17.5 billion at December 31, 2014 due to the following activity in the period.
Table 38: PNC Bank Senior and Subordinated Debt
| In billions | 2015 | |||
January 1 | $ | 17.5 | ||
Issuances | 8.8 | |||
Calls and maturities | (.8 | ) | ||
December 31 | $ | 25.5 | ||
PNC Bank is a member of the FHLB-Pittsburgh and, as such, has access to advances from FHLB-Pittsburgh secured generally by residential mortgage loans, other mortgage-related loans and commercial mortgage-backed securities. At December 31, 2015, our unused secured borrowing capacity was $19.4 billion with the FHLB-Pittsburgh. Total FHLB borrowings increased to $20.1 billion at December 31, 2015 from $20.0 billion at December 31, 2014 due to the following activity in the period.
Table 39: FHLB Borrowings
| In billions | 2015 | |||
January 1 | $ | 20.0 | ||
Issuances | 2.2 | |||
Calls and maturities | (2.1 | ) | ||
December 31 | $ | 20.1 | ||
The FHLB-Pittsburgh also periodically provides standby letters of credit on behalf of PNC Bank to secure certain public deposits. PNC Bank began using standby letters of credit issued by the FHLB-Pittsburgh for these purposes in response to the regulatory liquidity standards finalized during 2014. If the FHLB-Pittsburgh is required to make payment for a beneficiary's draw, the payment amount is converted into a collateralized advance to PNC Bank. At December 31, 2015, standby letters of credit issued on our behalf by the FHLB-Pittsburgh totaled $5.3 billion.
PNC Bank has the ability to offer up to $10.0 billion of its commercial paper to provide additional liquidity. As of December 31, 2015, there was $14 million outstanding under this program.
PNC Bank can also borrow from the Federal Reserve Bank discount window to meet short-term liquidity requirements. The Federal Reserve Bank, however, is not viewed as the primary means of funding our routine business activities, but rather as a potential source of liquidity in a stressed environment or during a market disruption. These potential borrowings are secured by commercial loans. At December 31, 2015, our unused secured borrowing capacity was $14.4 billion with the Federal Reserve Bank.
Parent Company Liquidity
As of December 31, 2015, available parent company liquidity totaled $4.6 billion. Parent company liquidity is primarily held in short-term investments, the terms of which provide for the availability of cash in 31 days or less. Investments with longer durations may also be acquired, but if so, the related maturities are aligned with scheduled cash needs, such as the maturity of parent company debt obligations.
Parent Company Liquidity – Uses
The parent company's contractual obligations consist primarily of debt service related to parent company borrowings and funding non-bank affiliates. As of December 31, 2015, there were approximately $1.3 billion of parent company borrowings with contractual maturities of less than one year. Additionally, the parent company maintains adequate liquidity to fund discretionary activities such as paying dividends to PNC shareholders, share repurchases, and acquisitions.
See Balance Sheet, Liquidity and Capital Highlights in the Executive Summary section of this Item 7 for information on our 2015 capital plan that was accepted by the Federal Reserve. Our capital plan included a recommendation to increase the quarterly common stock dividend in the second quarter of 2015 and the ability to redeem the Series K Preferred Stock, as further described below, and also included share repurchase programs of up to $2.875 billion for the five quarter period beginning in the second quarter of 2015. See the Capital portion of the Consolidated Balance Sheet Review in this Item 7 for more information on our share repurchase programs.
On April 2, 2015, consistent with our 2015 capital plan, our Board of Directors approved an increase to PNC's quarterly common stock dividend from 48 cents per common share to 51 cents per common share beginning with the May 5, 2015 dividend payment.
On May 4, 2015, we redeemed $500 million of PNC's Fixed-to-Floating Rate Non-Cumulative Perpetual Preferred Stock, Series K, as well as all Depositary Shares representing interests therein. Each Depositary Share represented a 1/10 interest in a share of the Series K Preferred Stock. All 50,000 shares of Series K Preferred Stock, as well as all 500,000 Depositary Shares representing interests therein, were redeemed. The redemption price was $10,000 per share of Series K Preferred Stock equivalent to $1,000 per Depositary Share, plus declared and unpaid dividends up to but excluding the redemption date.
See the Supervision and Regulation section in Item 1 of this Report for additional information regarding the Federal Reserve's CCAR process and the factors the Federal Reserve takes into consideration in evaluating capital plans, qualitative and quantitative liquidity risk management standards proposed
| The PNC Financial Services Group, Inc. – Form 10-K 85 |
by the U.S. banking agencies, and final rules issued by the Federal Reserve that make certain modifications to the Federal Reserve's capital planning and stress testing rules.
See Table 37 for information on an affiliate purchase of notes issued by PNC Bank during 2015.
Parent Company Liquidity – Sources
The principal source of parent company liquidity is the dividends it receives from its subsidiary bank, which may be impacted by the following:
| • | Bank-level capital needs, |
| • | Laws and regulations, |
| • | Corporate policies, |
| • | Contractual restrictions, and |
| • | Other factors. |
There are statutory and regulatory limitations on the ability of a national bank to pay dividends or make other capital distributions or to extend credit to the parent company or its non-bank subsidiaries. The amount available for dividend payments by PNC Bank to the parent company without prior regulatory approval was approximately $1.7 billion at December 31, 2015. See Note 19 Regulatory Matters in the Notes To Consolidated Financial Statements in Item 8 of this Report for a further discussion of these limitations. We provide additional information on certain contractual restrictions in Note 16 Equity in the Notes To Consolidated Financial Statements in Item 8 of this Report.
In addition to dividends from PNC Bank, other sources of parent company liquidity include cash and investments, as well as dividends and loan repayments from other subsidiaries and dividends or distributions from equity investments.
We can also generate liquidity for the parent company and PNC's non-bank subsidiaries through the issuance of debt and equity securities, including certain capital instruments, in public or private markets and commercial paper.
Total parent company senior and subordinated debt and hybrid capital instruments decreased to $7.5 billion at December 31, 2015 from $10.1 billion at December 31, 2014 due to the following activity in the period.
Table 40: Parent Company Senior and Subordinated Debt and Hybrid Capital Instruments
| In billions | 2015 | |||
January 1 | $ | 10.1 | ||
Maturities | (2.5 | ) | ||
Other | (.1 | ) | ||
December 31 | $ | 7.5 | ||
The parent company has the ability to offer up to $5.0 billion of commercial paper to provide additional liquidity. As of December 31, 2015, there were no issuances outstanding under this program.
Status of Credit Ratings
The cost and availability of short-term and long-term funding, as well as collateral requirements for certain derivative instruments, is influenced by PNC's credit ratings.
In general, rating agencies base their ratings on many quantitative and qualitative factors, including capital adequacy, liquidity, asset quality, business mix, level and quality of earnings, and the current legislative and regulatory environment, including implied government support. In addition, rating agencies themselves have been subject to scrutiny arising from the most recent financial crisis and could make or be required to make substantial changes to their ratings policies and practices, particularly in response to legislative and regulatory changes. Potential changes in the legislative and regulatory environment and the timing of those changes could impact our ratings, which as noted above, could impact our liquidity and financial condition. A decrease, or potential decrease, in credit ratings could impact access to the capital markets and/or increase the cost of debt, and thereby adversely affect liquidity and financial condition.
In March 2015, Moody's Investors Service (Moody's) published a new bank ratings methodology which has been implemented on a global basis and includes assessment of expected loss ratings on instruments ranging from bank deposits to preferred stock. In the second quarter of 2015, Moody's concluded its review for PNC and PNC Bank under this new methodology. As a result, Moody's upgraded PNC Bank's long-term deposit rating three notches to Aa2, confirmed PNC Bank's senior debt and issuer ratings at A2, and confirmed PNC Bank's Prime-1 short-term notes rating. The Moody's rating outlook for PNC and PNC Bank is stable.
Table 41: Credit Ratings as of December 31, 2015 for PNC and PNC Bank
| Moody's | Standard & Poor's | Fitch | ||||||||||
PNC | ||||||||||||
Senior debt | A3 | A- | A+ | |||||||||
Subordinated debt | A3 | BBB+ | A | |||||||||
Preferred stock | Baa2 | BBB- | BBB- | |||||||||
PNC Bank | ||||||||||||
Senior debt | A2 | A | A+ | |||||||||
Subordinated debt | A3 | A- | A | |||||||||
Long-term deposits | Aa2 | A | AA- | |||||||||
Short-term deposits | P-1 | A-1 | F1+ | |||||||||
Short-term notes | P-1 | A-1 | F1 | |||||||||
| 86 The PNC Financial Services Group, Inc. – Form 10-K |
Commitments
The following tables set forth contractual obligations and various other commitments as of December 31, 2015 representing required and potential cash outflows.
Table 42: Contractual Obligations
| Payment Due By Period | ||||||||||||||||||||
| December 31, 2015 – in millions | Total | Less than one year | One to three years | Four to five years | After five years | |||||||||||||||
Remaining contractual maturities of time deposits (a) | $ | 20,510 | $ | 15,092 | $ | 1,541 | $ | 1,249 | $ | 2,628 | ||||||||||
Borrowed funds (a) (b) | 54,532 | 10,863 | 21,888 | 13,052 | 8,729 | |||||||||||||||
Minimum annual rentals on noncancellable leases | 2,687 | 378 | 665 | 486 | 1,158 | |||||||||||||||
Nonqualified pension and postretirement benefits | 491 | 51 | 105 | 102 | 233 | |||||||||||||||
Purchase obligations (c) | 859 | 361 | 289 | 153 | 56 | |||||||||||||||
Total contractual cash obligations | $ | 79,079 | $ | 26,745 | $ | 24,488 | $ | 15,042 | $ | 12,804 | ||||||||||
| (a) | Includes purchase accounting adjustments. |
| (b) | Includes basis adjustment relating to accounting hedges. |
| (c) | Includes purchase obligations for goods and services covered by noncancellable contracts and contracts including cancellation fees. |
At December 31, 2015, we had unrecognized tax benefits of $26 million, which represents a reserve for tax positions that we have taken in our tax returns which ultimately may not be sustained upon examination by taxing authorities. Since the ultimate amount and timing of any future cash settlements cannot be predicted with reasonable certainty, this estimate has been excluded from the contractual obligations table. See Note 18 Income Taxes in the Notes To Consolidated Financial Statements in Item 8 of this Report for additional information.
Our contractual obligations totaled $82.0 billion at December 31, 2014. The decrease in the comparison is primarily attributable to declines in borrowed funds and time deposits. See Funding Sources in the Consolidated Balance Sheet Review section of this Item 7 for additional information regarding our funding sources.
Table 43: Other Commitments (a)
| Amount Of Commitment Expiration By Period | ||||||||||||||||||||
| December 31, 2015 – in millions | Total Amounts Committed | Less than one year | One to three years | Four to five years | After five years | |||||||||||||||
Commitments to extend credit (b) | $ | 142,489 | $ | 54,840 | $ | 48,291 | $ | 38,750 | $ | 608 | ||||||||||
Net outstanding standby letters of credit (c) | 8,765 | 4,808 | 3,323 | 633 | 1 | |||||||||||||||
Reinsurance agreements (d) | 2,010 | 7 | 20 | 26 | 1,957 | |||||||||||||||
Standby bond purchase agreements | 911 | 209 | 677 | 25 | ||||||||||||||||
Other commitments (e) | 966 | 666 | 258 | 42 | ||||||||||||||||
Total commitments | $ | 155,141 | $ | 60,530 | $ | 52,569 | $ | 39,476 | $ | 2,566 | ||||||||||
| (a) | Other commitments are funding commitments that could potentially require performance in the event of demands by third parties or contingent events. Loan commitments are reported net of syndications, assignments and participations. |
| (b) | Commitments to extend credit, or net unfunded loan commitments, represent arrangements to lend funds or provide liquidity subject to specified contractual conditions. |
| (c) | Includes $4.7 billion of standby letters of credit that support remarketing programs for customers' variable rate demand notes. |
| (d) | Reinsurance agreements are with third-party insurers related to insurance sold to or placed on behalf of our customers. Balances represent estimates based on availability of financial information. |
| (e) | Includes other commitments of $216 million that were not on our Consolidated Balance Sheet. The remaining $750 million of other commitments were included in Other liabilities on our Consolidated Balance Sheet. |
| The PNC Financial Services Group, Inc. – Form 10-K 87 |
Our total commitments were $154.9 billion at December 31, 2014. The increase in the comparison is primarily attributable to an increase in commitments to extend credit, partially offset by declines in reinsurance agreements and net outstanding standby letters of credit. See Note 21 Commitments and Guarantees in the Notes To Consolidated Financial Statements in Item 8 of this Report for additional information related to our commitments.
Market Risk Management
Market risk is the risk of a loss in earnings or economic value due to adverse movements in market factors such as interest rates, credit spreads, foreign exchange rates, commodity prices and equity prices. We are exposed to market risk primarily by our involvement in the following activities, among others:
| • | Traditional banking activities of gathering deposits and extending loans, |
| • | Equity and other investments and activities whose economic values are directly impacted by market factors, and |
| • | Fixed income securities, derivatives and foreign exchange activities, as a result of customer activities and securities underwriting. |
We have established enterprise-wide policies and methodologies to identify, measure, monitor and report market risk. Market Risk Management provides independent oversight by monitoring compliance with established guidelines, and reporting significant risks in the business to the Risk Committee of the Board.
Market Risk Management – Interest Rate Risk
Interest rate risk results primarily from our traditional banking activities of gathering deposits and extending loans. Many factors, including economic and financial conditions, movements in interest rates and consumer preferences, affect the difference between the interest that we earn on assets and the interest that we pay on liabilities and the level of our noninterest-bearing funding sources. Due to the repricing term mismatches and embedded options inherent in certain of these products, changes in market interest rates not only affect expected near-term earnings, but also the economic values of these assets and liabilities.
Asset and Liability Management centrally manages interest rate risk as prescribed in our risk management policies, which are approved by management's Asset and Liability Committee and the Risk Committee of the Board.
Sensitivity results and market interest rate benchmarks for the fourth quarters of 2015 and 2014 follow:
Table 44: Interest Sensitivity Analysis
| Fourth Quarter 2015 | Fourth Quarter 2014 | |||||||
Net Interest Income Sensitivity Simulation (a) | ||||||||
Effect on net interest income in first year from gradual interest rate change over the following 12 months of: | ||||||||
100 basis point increase | 2.4 | % | 2.1 | % | ||||
100 basis point decrease | (1.9 | )% | (1.0 | )% | ||||
Effect on net interest income in second year from gradual interest rate change over the preceding 12 months of: | ||||||||
100 basis point increase | 5.3 | % | 5.8 | % | ||||
100 basis point decrease | (5.3 | )% | (5.7 | )% | ||||
Duration of Equity Model (a) | ||||||||
Base case duration of equity (in years) | (4.1 | ) | (4.6 | ) | ||||
Key Period-End Interest Rates | ||||||||
One-month LIBOR | .43 | % | .17 | % | ||||
Three-year swap | 1.42 | % | 1.30 | % | ||||
| (a) | Given the inherent limitations in certain of these measurement tools and techniques, results become less meaningful as interest rates approach zero. |
In addition to measuring the effect on net interest income assuming parallel changes in current interest rates, we routinely simulate the effects of a number of nonparallel interest rate environments. Table 45 reflects the percentage change in net interest income over the next two 12-month periods assuming (i) the PNC Economist's most likely rate forecast, (ii) implied market forward rates and (iii) Yield Curve Slope Flattening (a 100 basis point yield curve slope flattening between 1-month and ten-year rates superimposed on current base rates) scenario.
Table 45: Net Interest Income Sensitivity to Alternative Rate Scenarios (Fourth Quarter 2015)
PNC Economist | Market Forward | Slope Flattening | ||||||||||
First year sensitivity | 4.1 | % | 2.1 | % | (1.7 | )% | ||||||
Second year sensitivity | 8.7 | % | 3.9 | % | (5.5 | )% | ||||||
All changes in forecasted net interest income are relative to results in a base rate scenario where current market rates are assumed to remain unchanged over the forecast horizon.
When forecasting net interest income, we make assumptions about interest rates and the shape of the yield curve, the volume and characteristics of new business and the behavior of existing on- and off-balance sheet positions. These assumptions determine the future level of simulated net interest income in the base interest rate scenario and the other interest rate scenarios presented in Tables 44 and 45 above. These simulations assume that as assets and liabilities mature, they are replaced or repriced at then current market rates. We
| 88 The PNC Financial Services Group, Inc. – Form 10-K |
also consider forward projections of purchase accounting accretion when forecasting net interest income.
The following graph presents the LIBOR/Swap yield curves for the base rate scenario and each of the alternate scenarios one year forward.
Table 46: Alternate Interest Rate Scenarios: One Year Forward
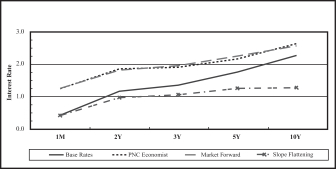
The fourth quarter 2015 interest sensitivity analyses indicate that our Consolidated Balance Sheet is positioned to benefit from an increase in interest rates and an upward sloping interest rate yield curve. We believe that we have the deposit funding base and balance sheet flexibility to adjust, where appropriate and permissible, to changing interest rates and market conditions.
Market Risk Management – Customer-Related Trading Risk
We engage in fixed income securities, derivatives and foreign exchange transactions to support our customers' investing and hedging activities. These transactions, related hedges and the credit valuation adjustment (CVA) related to our customer derivatives portfolio are marked-to-market daily and reported as customer-related trading activities. We do not engage in proprietary trading of these products.
We use value-at-risk (VaR) as the primary means to measure and monitor market risk in customer-related trading activities. We calculate a diversified VaR at a 95% confidence interval. VaR is used to estimate the probability of portfolio losses based on the statistical analysis of historical market risk factors. A diversified VaR reflects empirical correlations across different asset classes.
During 2015, our 95% VaR ranged between $.8 million and $3.6 million, averaging $2.1 million. During 2014, our 95% VaR ranged between $.8 million and $3.9 million, averaging $2.1 million.
To help ensure the integrity of the models used to calculate VaR for each portfolio and enterprise-wide, we use a process known as backtesting. The backtesting process consists of comparing actual observations of gains or losses against the VaR levels that were calculated at the close of the prior day.
This assumes that market exposures remain constant throughout the day and that recent historical market variability is a good predictor of future variability. Our customer-related trading activity includes customer revenue and intraday hedging which helps to reduce losses, and may reduce the number of instances of actual losses exceeding the prior day VaR measure. There were seven instances during 2015 under our diversified VaR measure where actual losses exceeded the prior day VaR measure. In comparison, there were two such instance during 2014. We use a 500 day look back period for backtesting and include customer-related trading revenue.
The following graph shows a comparison of enterprise-wide gains and losses against prior day diversified VaR for the period indicated.
Table 47: Enterprise-Wide Gains/Losses Versus Value-at-Risk
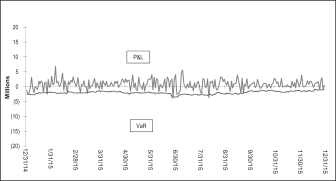
Customer-related trading revenue increased to $210 million for 2015 compared with $178 million for 2014. The increase was primarily due to higher derivative client sales revenues and market interest rate changes impacting credit valuations for customer-related derivatives.
Market Risk Management – Equity And Other Investment Risk
Equity investment risk is the risk of potential losses associated with investing in both private and public equity markets. In addition to extending credit, taking deposits, securities underwriting and trading financial instruments, we make and manage direct investments in a variety of transactions, including management buyouts, recapitalizations and growth financings in a variety of industries. We also have investments in affiliated and non-affiliated funds that make similar investments in private equity and in debt and equity-oriented hedge funds. The economic and/or book value of these investments and other assets such as loan servicing rights are directly affected by changes in market factors.
The primary risk measurement for equity and other investments is economic capital. Economic capital is a common measure of risk for credit, market and operational risk. It is an estimate of the potential value depreciation over a one year horizon commensurate with solvency expectations of
| The PNC Financial Services Group, Inc. – Form 10-K 89 |
an institution rated single-A by the credit rating agencies. Given the illiquid nature of many of these types of investments, it can be a challenge to determine their fair values. See Note 7 Fair Value in the Notes To Consolidated Financial Statements in Item 8 of this Report for additional information.
Various PNC business units manage our equity and other investment activities. Our businesses are responsible for making investment decisions within the approved policy limits and associated guidelines.
A summary of our equity investments follows:
Table 48: Equity Investments Summary
| In millions | December 31 2015 | December 31 2014 | ||||||
BlackRock | $ | 6,626 | $ | 6,265 | ||||
Tax credit investments | 2,254 | 2,616 | ||||||
Private equity | 1,441 | 1,615 | ||||||
Visa | 31 | 77 | ||||||
Other | 235 | 155 | ||||||
Total | $ | 10,587 | $ | 10,728 | ||||
BlackRock
PNC owned approximately 35 million common stock equivalent shares of BlackRock equity at December 31, 2015, accounted for under the equity method. The primary risk measurement, similar to other equity investments, is economic capital. The Business Segments Review section of this Item 7 includes additional information about BlackRock.
Tax Credit Investments
Included in our equity investments are direct tax credit investments and equity investments held by consolidated partnerships which totaled $2.3 billion at December 31, 2015 and $2.6 billion at December 31, 2014. These equity investment balances include unfunded commitments totaling $669 million and $717 million at December 31, 2015 and December 31, 2014, respectively. These unfunded commitments are included in Other Liabilities on our Consolidated Balance Sheet.
Note 2 Loan Sale and Servicing Activities and Variable Interest Entities in the Notes To Consolidated Financial Statements in Item 8 of this Report has further information on Tax Credit Investments.
Private Equity
The private equity portfolio is an illiquid portfolio comprised of mezzanine and equity investments that vary by industry, stage and type of investment.
Private equity investments carried at estimated fair value totaled $1.4 billion at December 31, 2015 and $1.6 billion at December 31, 2014. As of December 31, 2015, $1.1 billion was invested directly in a variety of companies and $.3 billion was invested indirectly through various private equity funds. Included in direct investments are investment activities of two private equity funds that are consolidated for financial reporting purposes. The noncontrolling interests of these funds totaled $170 million as of December 31, 2015. The interests held in indirect private equity funds are not redeemable, but PNC may receive distributions over the life of the partnership from liquidation of the underlying investments. See Item 1 Business – Supervision and Regulation and Item 1A Risk Factors of this Report for discussion of the potential impacts of the Volcker Rule provisions of Dodd-Frank on our interests in and of private funds covered by the Volcker Rule.
In 2015, PNC invested with six other banks in Early Warning Services (EWS), a provider of fraud prevention and risk management solutions. EWS then acquired ClearXchange, a network through which customers send and receive person-to-person payments. Integrating these businesses will enable us to, among other things, create a secure, real-time payments network.
Our unfunded commitments related to private equity totaled $126 million at December 31, 2015 compared with $140 million at December 31, 2014.
Visa
See Note 7 Fair Value, Note 20 Legal Proceedings and Note 21 Commitments and Guarantees in the Notes To Consolidated Financial Statements in Item 8 of this Report for additional information regarding the October 2007 Visa restructuring, our involvement with judgment and loss sharing agreements with Visa and certain other banks, the status of pending interchange litigation, the sales of portions of our Visa Class B common shares and the related swap agreements with the purchasers.
During 2015, we sold 2.0 million Visa Class B common shares, in addition to the 16.5 million shares sold in previous years. We have entered into swap agreements with the purchasers of the shares as part of these sales. See Note 7 Fair Value in the Notes To Consolidated Financial Statements in Item 8 of this Report for additional information. At December 31, 2015, our investment in Visa Class B common shares totaled approximately 4.9 million shares and had a carrying value of $31 million. Based on the December 31, 2015 closing price of $77.55 for the Visa Class A common shares, the fair value of our total investment was approximately $622 million at the current conversion rate. The Visa Class B common shares that we own are transferable only under limited circumstances until they can be converted into shares of the publicly traded class of stock, which cannot happen until the settlement of all of the specified litigation.
| 90 The PNC Financial Services Group, Inc. – Form 10-K |
Other Equity Investments
We also have certain other equity investments, the majority of which represent investments in affiliated and non-affiliated funds with both traditional and alternative investment strategies. The economic values could be driven by either the fixed-income market or the equity markets, or both. Given the nature of these investments, if market conditions affecting their valuation were to worsen, we could incur future losses. Net gains related to these investments were not significant during 2015 and 2014.
Our unfunded commitments related to other investments at December 31, 2015 and December 31, 2014 were not significant.
Impact of Inflation
Our assets and liabilities are primarily financial in nature and typically have varying maturity dates. Accordingly, future changes in prices do not affect the obligations to pay or receive fixed and determinable amounts of money. However, during periods of inflation, there may be a subsequent impact affecting certain fixed costs or expenses, an erosion of consumer and customer purchasing power, and fluctuations in the need or demand for our products and services. Should significant levels of inflation occur, our business could potentially be impacted by, among other things, reducing our tolerance for extending credit or causing us to incur additional credit losses resulting from possible increased default rates.
Financial Derivatives
We use a variety of financial derivatives as part of the overall asset and liability risk management process to help manage exposure to market and credit risk inherent in our business activities. Substantially all such instruments are used to manage risk related to changes in interest rates. Interest rate swaps, interest rate caps and floors, swaptions, options, forwards and futures contracts are the primary instruments we use for interest rate risk management. We also enter into derivatives with customers to facilitate their risk management activities.
Financial derivatives involve, to varying degrees, market and credit risk. Periodic cash payments are exchanged for interest rate swaps, options and future contracts. Premiums are also exchanged for options contracts. Therefore, cash requirements and exposure to credit risk are significantly less than the notional amount on these instruments.
Further information on our financial derivatives is presented in Note 1 Accounting Policies, Note 7 Fair Value and Note 14 Financial Derivatives in the Notes To Consolidated Financial Statements in Item 8 of this Report, which is incorporated here by reference.
Not all elements of market and credit risk are addressed through the use of financial derivatives, and such instruments may be ineffective for their intended purposes due to unanticipated market changes, among other reasons.
The following table summarizes the notional or contractual amounts and net fair value of financial derivatives at December 31, 2015 and December 31, 2014.
Table 49: Financial Derivatives Summary
| December 31, 2015 | December 31, 2014 | |||||||||||||||
| In millions | Notional/ Contractual Amount | Net Fair Value (a) | Notional/ Contractual Amount | Net Fair Value (a) | ||||||||||||
Derivatives designated as hedging instruments under GAAP | ||||||||||||||||
Total derivatives designated as hedging instruments | $ | 52,074 | $ | 985 | $ | 49,061 | $ | 1,075 | ||||||||
Derivatives not designated as hedging instruments under GAAP | ||||||||||||||||
Total derivatives used for residential mortgage banking activities | $ | 73,891 | $ | 376 | $ | 76,102 | $ | 409 | ||||||||
Total derivatives used for commercial mortgage banking activities | 24,091 | 36 | 26,290 | 26 | ||||||||||||
Total derivatives used for customer-related activities | 192,621 | 151 | 183,474 | 122 | ||||||||||||
Total derivatives used for other risk management activities | 5,299 | (409 | ) | 5,390 | (425 | ) | ||||||||||
Total derivatives not designated as hedging instruments | $ | 295,902 | $ | 154 | $ | 291,256 | $ | 132 | ||||||||
Total Derivatives | $ | 347,976 | $ | 1,139 | $ | 340,317 | $ | 1,207 | ||||||||
| (a) | Represents the net fair value of assets and liabilities. |
| The PNC Financial Services Group, Inc. – Form 10-K 91 |
2014 V ERSUS 2013
Consolidated Income Statement Review
Summary Results
Net income for 2014 of $4.2 billion, or $7.30 per diluted common share, was stable compared with 2013 results of $4.2 billion, or $7.36 per diluted common share. A decrease in revenue of 4% mainly due to lower yields on loans and investment securities was mostly offset by a reduction in provision for credit losses and a 2% decline in noninterest expense.
Net Interest Income
Net interest income was $8.5 billion in 2014 and decreased by $622 million, or 7%, compared with 2013 reflecting the ongoing low rate environment. Lower yields on loans and investment securities, a decline in investment securities balances and a reduction in purchase accounting accretion were partially offset by commercial and commercial real estate loan growth. Lower net interest income also included the impact from the second quarter 2014 correction to reclassify certain commercial facility fees from net interest income to noninterest income.
Net interest margin was 3.08% in 2014 and 3.57% in 2013. The decrease in the comparison was driven by a 50 basis point decline in the yield on total interest-earning assets, which included the impact of lower purchase accounting accretion, continued spread compression, and repricing of new and existing loans and securities in the ongoing low rate environment. The decline also included the impact of the second quarter 2014 correction to reclassify certain commercial facility fees and the impact of higher interest-earning deposits maintained with the Federal Reserve Bank.
Noninterest Income
Noninterest income was $6.9 billion for 2014 and 2013, as strong overall client fee income was offset by lower residential mortgage revenue, declines in asset valuations and reduced sales of securities. Noninterest income as a percentage of total revenue was 45% for 2014, up from 43% for 2013.
Asset management revenue increased $171 million, or 13%, in 2014 to $1.5 billion, compared to 2013, driven by increased earnings from our BlackRock investment, as well as stronger average equity markets and positive net flows, after adjustments for cyclical client activities. Discretionary client assets under management in the Asset Management Group increased to $135 billion at December 31, 2014 compared with $127 billion at December 31, 2013.
Consumer service fees were $1.3 billion for 2014 and 2013, as higher consumer service fees in Retail Banking were offset by lower revenue from previously discontinued insurance programs, as well as the termination of our debit card rewards program in the fourth quarter of 2013, which resulted in a prior year benefit and consequently diluted the year-over-year growth comparison.
Corporate service fees increased to $1.4 billion in 2014 compared to $1.2 billion in 2013, driven by higher merger and acquisition advisory fees from a record year for our mergers and acquisition advisory firm, Harris Williams, and the impact of the second quarter 2014 correction to reclassify certain commercial facility fees from net interest income to noninterest income. These increases were partially offset by lower net commercial mortgage servicing rights valuation gains.
Residential mortgage revenue decreased to $618 million in 2014 from $871 million in 2013, primarily due to lower loan sales revenue from a reduction in origination volume and significantly lower net hedging gains on residential mortgage servicing rights, partially offset by higher loan servicing fee revenue and the impact of second quarter 2014 gains on sales of previously underperforming portfolio loans.
Lower residential mortgage revenue in the comparison also reflected the impact of the 2013 net benefit from release of reserves for residential mortgage repurchase obligations, as the impact to 2014 was not significant. This net release of reserves in 2013 was largely the result of agreements with FHLMC and FNMA for loans sold into agency securitizations.
Service charges on deposits increased to $662 million in 2014 compared to $597 million in 2013, benefitting from changes in product offerings and higher customer-related activity.
Other noninterest income decreased to $1.4 billion in 2014 compared to $1.5 billion in 2013. The decline was driven by a reduction in asset valuations, lower revenue associated with private equity investments, decreased revenue due to the lower market value of investments related to deferred compensation obligations, and lower revenue associated with customer-related derivative activities, including credit valuations, which were primarily driven by market interest rate changes impacting the valuations. These decreases were partially offset by higher gains on sales of other assets.
Higher gains on sales of other assets in 2014 included the sale of PNC's Washington, D.C. regional headquarters building, as well as increased gains on sales of Visa Class B Common shares, which were $209 million on sales of 3.5 million shares in 2014 compared to $168 million on the sale of 4 million shares in 2013. As of December 31, 2014, we held approximately 7 million Visa Class B common shares with a fair value of approximately $742 million and a recorded investment of approximately $77 million.
| 92 The PNC Financial Services Group, Inc. – Form 10-K |
Provision For Credit Losses
The provision for credit losses totaled $273 million in 2014 compared with $643 million in 2013. The decrease in provision reflected improved overall credit quality, including lower consumer loan delinquencies. A contributing economic factor was the increasing value of residential real estate, which improved expected cash flows from our purchased impaired loans.
Noninterest Expense
Noninterest expense was $9.5 billion for 2014, a decrease of $.2 billion, or 2%, compared to 2013, reflecting overall disciplined expense management. The decline was driven by a decrease in personnel expense related to lower headcount and benefits costs, partially offset by investments in technology and infrastructure. Additionally, noncash charges in 2013 for unamortized discounts related to redemption of trust preferred securities contributed to the decline. See Note 14 Capital Securities of Subsidiary Trusts and Perpetual Trust Securities in Item 8 of our 2013 Form 10-K for additional detail on the 2013 redemption of trust preferred securities.
During 2014, we completed actions and exceeded our 2014 continuous improvement goal of $500 million in cost savings. These cost savings funded investments in our infrastructure, including those related to cybersecurity and our datacenters, and investments in our diversified businesses, including our Retail Banking transformation, consistent with our strategic priorities.
Effective Income Tax Rate
The effective income tax rate was 25.1% for 2014 compared with 25.9% for 2013. The effective tax rate is generally lower than the statutory rate primarily due to tax credits PNC receives from our investments in low income housing and new markets investments, as well as earnings in other tax exempt investments.
Consolidated Balance Sheet Review
Loans
Loans increased $9.2 billion to $204.8 billion as of December 31, 2014 compared with December 31, 2013. The increase in loans was driven by the increase in commercial lending as a result of growth in commercial and commercial real estate loans, primarily from new customers and organic growth. The decline in consumer lending resulted from lower home equity, education and residential mortgage loans, partially offset by growth in automobile loans.
Average total loans increased by $9.7 billion to $199.6 billion in 2014, which was driven by increases in average commercial loans of $6.4 billion and average commercial real estate loans of $3.2 billion. The overall increase in loans reflected organic loan growth, primarily in our Corporate & Institutional
Banking segment. Average total loans were 70% and 73% of average interest-earning assets in 2014 and 2013, respectively.
Loans represented 59% of total assets at December 31, 2014 and 61% at December 31, 2013. Commercial lending represented 63% of the loan portfolio at December 31, 2014 and 60% at December 31, 2013. Consumer lending represented 37% of the loan portfolio at December 31, 2014 and 40% at December 31, 2013. Commercial real estate loans represented 11% of total loans at both December 31, 2014 and December 31, 2013 and represented 7% of total assets at both December 31, 2014 and December 31, 2013.
Total loans above include purchased impaired loans of $4.9 billion, or 2% of total loans, at December 31, 2014, and $6.1 billion, or 3% of total loans, at December 31, 2013.
Investment Securities
As of December 31, 2014, the amortized cost and fair value of available for sale securities totaled $43.2 billion and $44.2 billion, respectively, compared to an amortized cost and fair value as of December 31, 2013 of $48.0 billion and $48.6 billion, respectively. The amortized cost and fair value of held to maturity securities were $11.6 billion and $12.0 billion, respectively, at December 31, 2014, compared to $11.7 billion and $11.8 billion, respectively, at December 31, 2013. Investment securities represented 16% of total assets at December 31, 2014 and 19% at December 31, 2013. Average investment securities decreased to $55.8 billion during 2014 compared to $57.3 billion during 2013. Average investment securities were 20% and 22% of average interest-earning assets in 2014 and 2013, respectively.
The fair value of investment securities is impacted by interest rates, credit spreads, market volatility and liquidity conditions. The fair value of investment securities generally decreases when interest rates increase and vice versa. In addition, the fair value generally decreases when credit spreads widen and vice versa. Net unrealized gains in the total investment securities portfolio increased to $1.5 billion at December 31, 2014 from $.7 billion at December 31, 2013 primarily due to the impact of market interest rates and credit spreads. The comparable amounts for the securities available for sale portfolio were $1.1 billion and $.6 billion, respectively.
During 2014, we transferred securities with a fair value of $1.4 billion from available for sale to held to maturity. We changed our intent and committed to hold these high-quality securities to maturity in order to reduce the impact of price volatility on Accumulated other comprehensive income and certain capital measures, after taking into consideration market conditions and regulatory capital requirements under Basel III capital standards.
The weighted-average expected maturity of the investment securities portfolio (excluding corporate stocks and other) was 4.3 years at December 31, 2014 and 4.9 years at December 31, 2013.
| The PNC Financial Services Group, Inc. – Form 10-K 93 |
Loans Held For Sale
Loans held for sale totaled $2.3 billion at both December 31, 2014 and December 31, 2013.
For commercial mortgages held for sale designated at fair value, the balance relating to these loans was $893 million at December 31, 2014 compared to $586 million at December 31, 2013. For commercial mortgages held for sale carried at lower of cost or fair value, we sold $3.5 billion in 2014 compared to $2.8 billion in 2013. Total gains of $80 million were recognized on the valuation and sale of commercial mortgage loans held for sale, net of hedges, in 2014, and $79 million in 2013.
Residential mortgage loan origination volume was $9.5 billion in 2014 compared to $15.1 billion in 2013. The majority of such loans were originated under agency or Federal Housing Administration (FHA) standards. We sold $8.3 billion of loans and recognized loan sales revenue of $420 million in 2014. The comparable amounts for 2013 were $14.7 billion and $568 million, respectively.
Asset Quality
Overall asset quality trends in 2014 improved from 2013. Nonperforming assets decreased $.6 billion, or 17%, to $2.9 billion at December 31, 2014 compared to December 31, 2013. Nonperforming assets to total assets were 0.83% at December 31, 2014, compared to 1.08% at December 31, 2013. Overall loan delinquencies of $1.9 billion at December 31, 2014 decreased $.5 billion, or 22%, compared with December 31, 2013. Net charge-offs of $.5 billion in 2014 declined 51% compared to net charge-offs of $1.1 billion for 2013. Net charge-offs were 0.27% of average loans in 2014 and 0.57% of average loans in 2013.
The net charge-off comparisons above were impacted by alignment with interagency guidance in the first quarter of 2013 on practices for loans and lines of credit related to consumer lending. In the first quarter 2013, this alignment had the overall effect of (i) accelerating charge-offs, (ii) increasing nonperforming loans and (iii) in the case of loans accounted for under the fair value option, increasing nonaccrual loans.
The ALLL was $3.3 billion, or 1.63% of total loans and 133% of nonperforming loans, as of December 31, 2014, compared to $3.6 billion, or 1.84% of total loans and 117% of nonperforming loans, as of December 31, 2013.
At December 31, 2014, our largest nonperforming asset was $35 million in the Real Estate, Rental and Leasing Industry and our average nonperforming loans associated with commercial lending were under $1 million.
Funding Sources
Total funding sources increased $22.0 billion to $289.0 billion at December 31, 2014 compared with December 31, 2013.
Total deposits increased $11.3 billion to $232.2 billion at December 31, 2014 compared with December 31, 2013 due to strong growth in demand and money market, partially offset by lower retail certificates of deposit. Interest-bearing deposits represented 68% of total deposits at both December 31, 2014 and December 31, 2013.
Average total deposits increased $10.8 billion to $222.9 billion in 2014 compared with the prior year. Higher average money market deposits, average noninterest-bearing deposits, and average interest-bearing demand deposits drove the increase in both commercial and consumer average deposits. These increases were partially offset by a decrease of $2.6 billion in average retail certificates of deposit attributable to runoff of maturing accounts. Average total deposits represented 68% of average total assets for 2014 and 69% for 2013.
Total borrowed funds increased $10.7 billion to $56.8 billion at December 31, 2014 compared with December 31, 2013 as higher Federal Home Loan Bank (FHLB) borrowings and issuances of bank notes and senior debt and subordinated debt were partially offset by a decline in federal funds purchased and repurchase agreements.
Average borrowed funds were $48.8 billion in 2014 compared with $40.0 billion in 2013. The increase was primarily due to increases in average FHLB borrowings, average bank notes and senior debt, and average subordinated debt, in part to enhance our liquidity position. These increases were partially offset by a decline in average commercial paper.
| 94 The PNC Financial Services Group, Inc. – Form 10-K |
Shareholders' Equity
Total shareholders' equity increased $2.2 billion, to $44.6 billion at December 31, 2014 compared with December 31, 2013, primarily reflecting an increase in retained earnings, partially offset by share repurchases of $1.2 billion under PNC's existing common stock repurchase authorization. The increase in retained earnings was driven by net income of $4.2 billion, reduced by $1.2 billion of common and preferred dividends declared. Accumulated other comprehensive income increased slightly as the impact of market interest rates and credit spreads on securities available for sale and derivatives that are part of cash flow hedging strategies were mostly offset by the impact of pension and other postretirement benefit plan adjustments. Common shares outstanding were 523 million at December 31, 2014 and 533 million at December 31, 2013.
Risk-Based Capital
As a result of the staggered effective dates of the final U.S. Basel III regulatory capital rules (Basel III rules), as well as the fact that PNC remains in the parallel run qualification phase for the advanced approaches, PNC's regulatory risk-based ratios in 2014 were based on the definitions of, and deductions from, capital under Basel III (as such definitions and deductions were phased-in for 2014) and Basel I risk weighted assets (subject to certain adjustments as defined by the Basel III rules). We refer to the capital ratios calculated using the phased-in Basel III provisions in effect for 2014 and applicable risk-weighted assets as the 2014 Transitional Basel III ratios.
Our 2014 Transitional Basel III ratios at December 31, 2014 were 10.9% for Tier 1 common, 10.8% for leverage, 12.6% for Tier 1 risk-based and 15.8% for total risk-based capital.
PNC's Basel I ratios as of December 31, 2013, which were PNC's effective regulatory capital ratios as of that date, were 10.5% for Tier 1 common, 11.1% for leverage, 12.4% for Tier 1 risk-based and 15.8% for total risk-based capital.
We provide additional information on our 2014 risk-based capital ratios in the Capital portion of the Balance Sheet Review section in Item 7 of our 2014 Form 10-K. For additional information on our 2014 Transitional Basel III ratios and 2013 Basel I Tier 1 ratio, see also the Statistical Information (Unaudited) section in Item 8 of this Report.
| The PNC Financial Services Group, Inc. – Form 10-K 95 |
G LOSSARY O F T ERMS
Accretable net interest (Accretable yield) – The excess of cash flows expected to be collected on a purchased impaired loan over the carrying value of the loan. The accretable net interest is recognized into interest income over the remaining life of the loan using the constant effective yield method.
Adjusted average total assets – Primarily comprised of total average quarterly (or annual) assets plus (less) unrealized losses (gains) on investment securities, less goodwill and certain other intangible assets (net of eligible deferred taxes).
Annualized – Adjusted to reflect a full year of activity.
Basel III common equity Tier 1 capital – Common stock plus related surplus, net of treasury stock, plus retained earnings, plus accumulated other comprehensive income for securities currently and previously held as available for sale, plus accumulated other comprehensive income for pension and other postretirement benefit plans, less goodwill, net of associated deferred tax liabilities, less other disallowed intangibles, net of deferred tax liabilities and plus/less other adjustments.
Basel III common equity Tier 1 capital ratio – Common equity Tier 1 capital divided by period-end risk-weighted assets (as applicable).
Basel III Tier 1 capital – Common equity Tier 1 capital, plus preferred stock, plus certain trust preferred capital securities, plus certain noncontrolling interests that are held by others and plus/less other adjustments.
Basel III Tier 1 capital ratio – Tier 1 capital divided by period-end risk-weighted assets (as applicable).
Basel III Total capital – Tier 1 capital plus qualifying subordinated debt, plus certain trust preferred securities, plus, under the Basel III transitional rules and the standardized approach, the allowance for loan and lease losses included in Tier 2 capital and other.
Basel III Total capital ratio – Total capital divided by period-end risk-weighted assets (as applicable).
Basis point – One hundredth of a percentage point.
Carrying value of purchased impaired loans – The net value on the balance sheet which represents the recorded investment less any valuation allowance.
Cash recoveries – Cash recoveries used in the context of purchased impaired loans represent cash payments for a single purchased impaired loan not included within a pool of loans from customers that exceeded the recorded investment of that loan.
Charge-off – Process of removing a loan or portion of a loan from our balance sheet because it is considered uncollectible. We also record a charge-off when a loan is transferred from portfolio holdings to held for sale by reducing the loan carrying amount to the fair value of the loan, if fair value is less than carrying amount.
Combined loan-to-value ratio (CLTV) – This is the aggregate principal balance(s) of the mortgages on a property divided by its appraised value or purchase price.
Common shareholders' equity to total assets – Common shareholders' equity divided by total assets. Common shareholders' equity equals total shareholders' equity less the liquidation value of preferred stock.
Core net interest income – Core net interest income is total net interest income less purchase accounting accretion.
Credit derivatives – Contractual agreements, primarily credit default swaps, that provide protection against a credit event of one or more referenced credits. The nature of a credit event is established by the protection buyer and protection seller at the inception of a transaction, and such events include bankruptcy, insolvency and failure to meet payment obligations when due. The buyer of the credit derivative pays a periodic fee in return for a payment by the protection seller upon the occurrence, if any, of a credit event.
Credit spread – The difference in yield between debt issues of similar maturity. The excess of yield attributable to credit spread is often used as a measure of relative creditworthiness, with a reduction in the credit spread reflecting an improvement in the borrower's perceived creditworthiness.
Credit valuation adjustment (CVA) – Represents an adjustment to the fair value of our derivatives for our own and counterparties' non-performance risk.
Derivatives – Financial contracts whose value is derived from changes in publicly traded securities, interest rates, currency exchange rates or market indices. Derivatives cover a wide assortment of financial contracts, including but not limited to forward contracts, futures, options and swaps.
Discretionary client assets under management – Assets over which we have sole or shared investment authority for our customers/clients. We do not include these assets on our Consolidated Balance Sheet.
Duration of equity – An estimate of the rate sensitivity of our economic value of equity. A negative duration of equity is associated with asset sensitivity ( i.e. , positioned for rising interest rates), while a positive value implies liability sensitivity ( i.e. , positioned for declining interest rates). For example, if the duration of equity is -1.5 years, the economic value of equity increases by 1.5% for each 100 basis point increase in interest rates.
| 96 The PNC Financial Services Group, Inc. – Form 10-K |
Earning assets – Assets that generate income, which include: federal funds sold; resale agreements; trading securities; interest-earning deposits with banks; loans held for sale; loans; investment securities; and certain other assets.
Effective duration – A measurement, expressed in years, that, when multiplied by a change in interest rates, would approximate the percentage change in value of on- and off- balance sheet positions.
Efficiency – Noninterest expense divided by total revenue.
Enterprise risk management framework – An enterprise process designed to identify potential risks that may affect PNC, manage risk to be within our risk appetite and provide reasonable assurance regarding achievement of our objectives.
Fair value – The price that would be received to sell an asset or paid to transfer a liability in an orderly transaction between market participants at the measurement date.
Fee income – When referring to the components of Noninterest income, we use the term fee income to refer to the following categories within Noninterest income: Asset management; Consumer services; Corporate services; Residential mortgage; and Service charges on deposits.
FICO score – A credit bureau-based industry standard score created by Fair Isaac Co. which predicts the likelihood of borrower default. We use FICO scores both in underwriting and assessing credit risk in our consumer lending portfolio. Lower FICO scores indicate likely higher risk of default, while higher FICO scores indicate likely lower risk of default. FICO scores are updated on a periodic basis.
Foreign exchange contracts – Contracts that provide for the future receipt and delivery of foreign currency at previously agreed-upon terms.
Funds transfer pricing – A management accounting methodology designed to recognize the net interest income effects of sources and uses of funds provided by the assets and liabilities of a business segment. Assets receive a funding charge and liabilities and capital receive a funding credit based on a transfer pricing methodology that incorporates product repricing characteristics, tenor and other factors.
Futures and forward contracts – Contracts in which the buyer agrees to purchase and the seller agrees to deliver a specific financial instrument at a predetermined price or yield. May be settled either in cash or by delivery of the underlying financial instrument.
GAAP – Accounting principles generally accepted in the United States of America.
Home price index (HPI) – A broad measure of the movement of single-family house prices in the U.S.
Impaired loans – Loans are determined to be impaired when, based on current information and events, it is probable that all contractually required payments will not be collected. Impaired loans include commercial nonperforming loans and consumer and commercial TDRs, regardless of nonperforming status. Excluded from impaired loans are nonperforming leases, loans held for sale, loans accounted for under the fair value option, smaller balance homogenous type loans and purchased impaired loans.
Interest rate floors and caps – Interest rate protection instruments that involve payment from the protection seller to the protection buyer of an interest differential, which represents the difference between a short-term rate ( e.g. , three-month LIBOR) and an agreed-upon rate (the strike rate) applied to a notional principal amount.
Interest rate swap contracts – Contracts that are entered into primarily as an asset/liability management strategy to reduce interest rate risk. Interest rate swap contracts are exchanges of interest rate payments, such as fixed-rate payments for floating-rate payments, based on notional principal amounts.
Intrinsic value – The difference between the price, if any, required to be paid for stock issued pursuant to an equity compensation arrangement and the fair market value of the underlying stock.
Leverage ratio – Tier 1 capital divided by average quarterly adjusted total assets.
LIBOR – Acronym for London InterBank Offered Rate. LIBOR is the average interest rate charged when banks in the London wholesale money market (or interbank market) borrow unsecured funds from each other. LIBOR rates are used as a benchmark for interest rates on a global basis. PNC's product set includes loans priced using LIBOR as a benchmark.
Loan-to-value ratio (LTV) – A calculation of a loan's collateral coverage that is used both in underwriting and assessing credit risk in our lending portfolio. LTV is the sum total of loan obligations secured by collateral divided by the market value of that same collateral. Market values of the collateral are based on an independent valuation of the collateral. For example, a LTV of less than 90% is better secured and has less credit risk than a LTV of greater than or equal to 90%.
Loss given default (LGD) – An estimate of loss, net of recovery based on collateral type, collateral value, loan
| The PNC Financial Services Group, Inc. – Form 10-K 97 |
exposure, and other factors. Each loan has its own LGD. The LGD risk rating measures the percentage of exposure of a specific credit obligation that we expect to lose if default occurs. LGD is net of recovery, through any means, including but not limited to the liquidation of collateral or deficiency judgments rendered from foreclosure or bankruptcy proceedings.
Net interest margin – Annualized taxable-equivalent net interest income divided by average earning assets.
Nonaccretable difference – Contractually required payments receivable on a purchased impaired loan in excess of the cash flows expected to be collected.
Nonaccrual loans – Loans for which we do not accrue interest income. Nonaccrual loans include nonperforming loans, in addition to loans accounted for under fair value option and loans accounted for as held for sale for which full collection of contractual principal and/or interest is not probable.
Nondiscretionary client assets under administration – Assets we hold for our customers/clients in a nondiscretionary, custodial capacity. We do not include these assets on our Consolidated Balance Sheet.
Nonperforming assets – Nonperforming assets include nonperforming loans and OREO and foreclosed assets, but exclude certain government insured or guaranteed loans for which we expect to collect substantially all principal and interest, loans held for sale, loans accounted for under the fair value option and purchased impaired loans. We do not accrue interest income on assets classified as nonperforming.
Nonperforming loans – Loans accounted for at amortized cost for which we do not accrue interest income. Nonperforming loans include loans to commercial, commercial real estate, equipment lease financing, home equity, residential real estate, credit card and other consumer customers as well as TDRs which have not returned to performing status. Nonperforming loans exclude certain government insured or guaranteed loans for which we expect to collect substantially all principal and interest, loans held for sale, loans accounted for under the fair value option and purchased impaired loans. Nonperforming loans exclude purchased impaired loans as we are currently accreting interest income over the expected life of the loans.
Notional amount – A number of currency units, shares, or other units specified in a derivative contract.
Operating leverage – The period to period dollar or percentage change in total revenue (GAAP basis) less the dollar or percentage change in noninterest expense. A positive variance indicates that revenue growth exceeded expense growth ( i.e. , positive operating leverage) while a negative variance implies
expense growth exceeded revenue growth ( i.e. , negative operating leverage).
Options – Contracts that grant the purchaser, for a premium payment, the right, but not the obligation, to either purchase or sell the associated financial instrument at a set price during a specified period or at a specified date in the future.
Other real estate owned (OREO) and foreclosed assets – Assets taken in settlement of troubled loans primarily through deed-in-lieu of foreclosure or foreclosure. Foreclosed assets include real and personal property, equity interests in corporations, partnerships, and limited liability companies. Excludes certain assets that have a government-guarantee which are classified as other receivables.
Other-than-temporary impairment (OTTI) – When the fair value of a security is less than its amortized cost basis, an assessment is performed to determine whether the impairment is other-than-temporary. If we intend to sell the security or more likely than not will be required to sell the security before recovery of its amortized cost basis less any current-period credit loss, an other-than-temporary impairment is considered to have occurred. In such cases, an other-than-temporary impairment is recognized in earnings equal to the entire difference between the investment's amortized cost basis and its fair value at the balance sheet date. Further, if we do not expect to recover the entire amortized cost of the security, an other-than-temporary impairment is considered to have occurred. However for debt securities, if we do not intend to sell the security and it is not more likely than not that we will be required to sell the security before its recovery, the other-than-temporary loss is separated into (a) the amount representing the credit loss, and (b) the amount related to all other factors. The other-than-temporary impairment related to credit losses is recognized in earnings while the amount related to all other factors is recognized in other comprehensive income, net of tax.
Parent company liquidity coverage – Liquid assets divided by funding obligations within a two year period.
Pretax earnings – Income before income taxes and noncontrolling interests.
Pretax, pre-provision earnings – Total revenue less noninterest expense.
Primary client relationship – An Asset Management Group client relationship with annual revenue generation of $10,000 or more.
Probability of default (PD) – An internal risk rating that indicates the likelihood that a credit obligor will enter into default status.
| 98 The PNC Financial Services Group, Inc. – Form 10-K |
Purchase accounting accretion – Accretion of the discounts and premiums on acquired assets and liabilities. The purchase accounting accretion is recognized in net interest income over the weighted-average life of the financial instruments using the constant effective yield method. Accretion for a single purchased impaired loan not included within a pool of loans includes any cash recoveries on that loan received in excess of the recorded investment.
Purchased impaired loans – Acquired loans (or pools of loans) determined to be credit impaired under FASB ASC 310-30 (AICPA SOP 03-3). Loans (or pools of loans) are determined to be impaired if there is evidence of credit deterioration since origination and for which it is probable that all contractually required payments will not be collected.
Recorded investment (purchased impaired loans) – The initial investment of a purchased impaired loan plus interest accretion and less any cash payments and writedowns to date. The recorded investment excludes any valuation allowance which is included in our allowance for loan and lease losses.
Recovery – Cash proceeds received on a loan that we had previously charged off. We credit the amount received to the allowance for loan and lease losses.
Residential development loans – Project-specific loans to commercial customers for the construction or development of residential real estate including land, single family homes, condominiums and other residential properties.
Return on average assets – Annualized net income divided by average assets.
Return on average capital – Annualized net income divided by average capital.
Return on average common shareholders' equity – Annualized net income attributable to common shareholders divided by average common shareholders' equity.
Risk – The potential that an event or series of events could occur that would threaten PNC's ability to achieve its strategic objectives, thereby negatively affecting shareholder value or reputation.
Risk appetite – A dynamic, forward-looking view on the aggregate amount of risk PNC is willing and able to take in executing business strategy in light of the current business environment.
Risk limits – Quantitative measures based on forward looking assumptions that allocate the firm's aggregate risk appetite ( e.g. measure of loss or negative events) to business lines, legal entities, specific risk categories, concentrations and as appropriate, other levels.
Risk profile – The risk profile is a point-in-time assessment of risk. The profile represents overall risk position in relation to the desired risk appetite. The determination of the risk profile's position is based on qualitative and quantitative analysis of reported risk limits, metrics, operating guidelines and qualitative assessments.
Risk-weighted assets – Computed by the assignment of specific risk-weights (as defined by the Board of Governors of the Federal Reserve System) to assets and off-balance sheet instruments.
Securitization – The process of legally transforming financial assets into securities.
Servicing rights – An intangible asset or liability created by an obligation to service assets for others. Typical servicing rights include the right to receive a fee for collecting and forwarding payments on loans and related taxes and insurance premiums held in escrow.
Swaptions – Contracts that grant the purchaser, for a premium payment, the right, but not the obligation, to enter into an interest rate swap agreement during a specified period or at a specified date in the future.
Taxable-equivalent interest – The interest income earned on certain assets is completely or partially exempt from Federal income tax. As such, these tax-exempt instruments typically yield lower returns than taxable investments. To provide more meaningful comparisons of yields and margins for all interest-earning assets, we use interest income on a taxable-equivalent basis in calculating average yields and net interest margins by increasing the interest income earned on tax-exempt assets to make it fully equivalent to interest income earned on other taxable investments. This adjustment is not permitted under GAAP on the Consolidated Income Statement.
Total equity – Total shareholders' equity plus noncontrolling interests.
Total return swap – A non-traditional swap where one party agrees to pay the other the "total return" of a defined underlying asset ( e.g., a loan), usually in return for receiving a stream of LIBOR-based cash flows. The total returns of the asset, including interest and any default shortfall, are passed through to the counterparty. The counterparty is, therefore, assuming the credit and economic risk of the underlying asset.
Transitional Basel III common equity – Common equity calculated under Basel III using phased in definitions and deductions applicable to PNC during the applicable presentation period.
Troubled debt restructuring (TDR) – A loan whose terms have been restructured in a manner that grants a concession to a borrower experiencing financial difficulties.
| The PNC Financial Services Group, Inc. – Form 10-K 99 |
Value-at-risk (VaR) – A statistically-based measure of risk that describes the amount of potential loss which may be incurred due to adverse market movements. The measure is of the maximum loss which should not be exceeded on 95 out of 100 days for a 95% VaR.
Watchlist – A list of criticized loans, credit exposure or other assets compiled for internal monitoring purposes. We define criticized exposure for this purpose as exposure with an internal risk rating of other assets especially mentioned, substandard, doubtful or loss.
Yield curve – A graph showing the relationship between the yields on financial instruments or market indices of the same credit quality with different maturities. For example, a "normal" or "positive" yield curve exists when long-term bonds have higher yields than short-term bonds. A "flat" yield curve exists when yields are the same for short-term and long-term bonds. A "steep" yield curve exists when yields on long-term bonds are significantly higher than on short-term bonds. An "inverted" or "negative" yield curve exists when short-term bonds have higher yields than long-term bonds.
C AUTIONARY S TATEMENT R EGARDING F ORWARD -L OOKING I NFORMATION
We make statements in this Report, and we may from time to time make other statements, regarding our outlook for earnings, revenues, expenses, capital and liquidity levels and ratios, asset levels, asset quality, financial position, and other matters regarding or affecting PNC and its future business and operations that are forward-looking statements within the meaning of the Private Securities Litigation Reform Act. Forward-looking statements are typically identified by words such as "believe," "plan," "expect," "anticipate," "see," "look," "intend," "outlook," "project," "forecast," "estimate," "goal," "will," "should" and other similar words and expressions. Forward-looking statements are subject to numerous assumptions, risks and uncertainties, which change over time.
Forward-looking statements speak only as of the date made. We do not assume any duty and do not undertake to update forward-looking statements. Actual results or future events could differ, possibly materially, from those anticipated in forward-looking statements, as well as from historical performance.
Our forward-looking statements are subject to the following principal risks and uncertainties.
| • | Our businesses, financial results and balance sheet values are affected by business and economic conditions, including the following: |
| – | Changes in interest rates and valuations in debt, equity and other financial markets. |
| – | Disruptions in the U.S. and global financial markets. |
| – | The impact on financial markets and the economy of any changes in the credit ratings of U.S. Treasury obligations and other U.S. government-backed debt, as well as issues surrounding the levels of U.S. and European government debt and concerns regarding the creditworthiness of certain sovereign governments, supranationals and financial institutions in Europe. |
| – | Actions by the Federal Reserve, U.S. Treasury and other government agencies, including those that impact money supply and market interest rates. |
| – | Changes in customers', suppliers' and other counterparties' performance and creditworthiness. |
| – | Slowing or reversal of the current U.S. economic expansion. |
| – | Continued residual effects of recessionary conditions and uneven spread of positive impacts of recovery on the economy and our counterparties, including adverse impacts on levels of unemployment, loan utilization rates, delinquencies, defaults and counterparty ability to meet credit and other obligations. |
| – | Commodity price volatility. |
| – | Changes in customer preferences and behavior, whether due to changing business and economic conditions, legislative and regulatory initiatives, or other factors. |
| • | Our forward-looking financial statements are subject to the risk that economic and financial market conditions will be substantially different than we are currently expecting. These statements are based on our current view that the U.S. economy will grow moderately again in 2016, boosted by lower oil/energy prices, improving housing activity and solid job gains, and that short-term interest rates and bond yields will rise very gradually during 2016. These forward-looking statements also do not, unless otherwise indicated, take into account the impact of potential legal and regulatory contingencies. |
| • | PNC's ability to take certain capital actions, including paying dividends and any plans to increase common stock dividends, repurchase common stock under current or future programs, or issue or redeem preferred stock or other regulatory capital instruments, is subject to the review of such proposed actions by the Federal Reserve as part of PNC's comprehensive capital plan for the applicable period in connection with the regulators' CCAR process and to the acceptance of such capital plan and non-objection to such capital actions by the Federal Reserve. |
| • | PNC's regulatory capital ratios in the future will depend on, among other things, the company's financial performance, the scope and terms of final capital regulations then in effect (particularly those implementing the Basel Capital Accords), and management actions affecting the composition of PNC's balance sheet. In addition, PNC's ability to determine, evaluate and |
| 100 The PNC Financial Services Group, Inc. – Form 10-K |
forecast regulatory capital ratios, and to take actions (such as capital distributions) based on actual or forecasted capital ratios, will be dependent at least in part on the development, validation and regulatory approval of related models. |
| • | Legal and regulatory developments could have an impact on our ability to operate our businesses, financial condition, results of operations, competitive position, reputation, or pursuit of attractive acquisition opportunities. Reputational impacts could affect matters such as business generation and retention, liquidity, funding, and ability to attract and retain management. These developments could include: |
| – | Changes resulting from legislative and regulatory reforms, including major reform of the regulatory oversight structure of the financial services industry and changes to laws and regulations involving tax, pension, bankruptcy, consumer protection, and other industry aspects, and changes in accounting policies and principles. We will be impacted by extensive reforms provided for in the Dodd-Frank Act and otherwise growing out of the most recent financial crisis, the precise nature, extent and timing of which, and their impact on us, remains uncertain. |
| – | Changes to regulations governing bank capital and liquidity standards, including due to the Dodd-Frank Act and to Basel-related initiatives. |
| – | Unfavorable resolution of legal proceedings or other claims and regulatory and other governmental investigations or other inquiries. In addition to matters relating to PNC's current and historical business and activities, such matters may include proceedings, claims, investigations, or inquiries relating to pre-acquisition business and activities of acquired companies, such as National City. These matters may result in monetary judgments or settlements or other remedies, including fines, penalties, restitution or alterations in our business practices, and in additional expenses and collateral costs, and may cause reputational harm to PNC. |
| – | Results of the regulatory examination and supervision process, including our failure to satisfy requirements of agreements with governmental agencies. |
| – | Impact on business and operating results of any costs associated with obtaining rights in intellectual property claimed by others and of adequacy of our intellectual property protection in general. |
| • | Business and operating results are affected by our ability to identify and effectively manage risks inherent in our businesses, including, where appropriate, through effective use of third-party insurance, derivatives, and capital management techniques, and to meet evolving regulatory capital and liquidity standards. In particular, our results currently depend on our ability to manage elevated levels of impaired assets. |
| • | Business and operating results also include impacts relating to our equity interest in BlackRock, Inc. and rely to a significant extent on information provided to us by BlackRock. Risks and uncertainties that could affect BlackRock are discussed in more detail by BlackRock in its SEC filings. |
| • | We grow our business in part by acquiring from time to time other financial services companies, financial services assets and related deposits and other liabilities. Acquisition risks and uncertainties include those presented by the nature of the business acquired, including in some cases those associated with our entry into new businesses or new geographic or other markets and risks resulting from our inexperience in those new areas, as well as risks and uncertainties related to the acquisition transactions themselves, regulatory issues, and the integration of the acquired businesses into PNC after closing. |
| • | Competition can have an impact on customer acquisition, growth and retention and on credit spreads and product pricing, which can affect market share, deposits and revenues. Industry restructuring in the current environment could also impact our business and financial performance through changes in counterparty creditworthiness and performance and in the competitive and regulatory landscape. Our ability to anticipate and respond to technological changes can also impact our ability to respond to customer needs and meet competitive demands. |
| • | Business and operating results can also be affected by widespread natural and other disasters, pandemics, dislocations, terrorist activities, cyberattacks or international hostilities through impacts on the economy and financial markets generally or on us or our counterparties specifically. |
We provide greater detail regarding these as well as other factors elsewhere in this Report, including in the Risk Factors and Risk Management sections and the Legal Proceedings and Commitments and Guarantees Notes of the Notes To Consolidated Financial Statements in this Report. Our forward-looking statements may also be subject to other risks and uncertainties, including those discussed elsewhere in this Report or in our other filings with the SEC.
ITEM 7A – QUANTITATIVE AND QUALITATIVE DISCLOSURES ABOUT MARKET RISK
This information is set forth in the Risk Management section of Item 7 and in Note 1 Accounting Policies, Note 7 Fair Value, and Note 14 Financial Derivatives in the Notes To Consolidated Financial Statements in Item 8 of this Report.
| The PNC Financial Services Group, Inc. – Form 10-K 101 |
ITEM 8 – FINANCIAL STATEMENTS AND SUPPLEMENTARY DATA
R EPORT OF I NDEPENDENT R EGISTERED P UBLIC A CCOUNTING F IRM
To the Board of Directors and Shareholders of The PNC Financial Services Group, Inc.
In our opinion, the accompanying consolidated balance sheets and the related consolidated statements of income, of comprehensive income, of changes in equity, and of cash flows present fairly, in all material respects, the financial position of The PNC Financial Services Group, Inc. and its subsidiaries at December 31, 2015 and December 31, 2014, and the results of their operations and their cash flows for each of the three years in the period ended December 31, 2015 in conformity with accounting principles generally accepted in the United States of America. Also in our opinion, the Company maintained, in all material respects, effective internal control over financial reporting as of December 31, 2015, based on criteria established in Internal Control-Integrated Framework (2013) issued by the Committee of Sponsoring Organizations of the Treadway Commission (COSO). The Company's management is responsible for these financial statements, for maintaining effective internal control over financial reporting and for its assessment of the effectiveness of internal control over financial reporting, included in Management's Report on Internal Control over Financial Reporting under Item 9A. Our responsibility is to express opinions on these financial statements and on the Company's internal control over financial reporting based on our integrated audits. We conducted our audits in accordance with the standards of the Public Company Accounting Oversight Board (United States). Those standards require that we plan and perform the audits to obtain reasonable assurance about whether the financial statements are free of material misstatement and whether effective internal control over financial reporting was maintained in all material respects. Our audits of the financial statements included examining, on a test basis, evidence supporting the amounts and disclosures in the financial statements, assessing the accounting principles
used and significant estimates made by management, and evaluating the overall financial statement presentation. Our audit of internal control over financial reporting included obtaining an understanding of internal control over financial reporting, assessing the risk that a material weakness exists, and testing and evaluating the design and operating effectiveness of internal control based on the assessed risk. Our audits also included performing such other procedures as we considered necessary in the circumstances. We believe that our audits provide a reasonable basis for our opinions.
A company's internal control over financial reporting is a process designed to provide reasonable assurance regarding the reliability of financial reporting and the preparation of financial statements for external purposes in accordance with generally accepted accounting principles. A company's internal control over financial reporting includes those policies and procedures that (i) pertain to the maintenance of records that, in reasonable detail, accurately and fairly reflect the transactions and dispositions of the assets of the company; (ii) provide reasonable assurance that transactions are recorded as necessary to permit preparation of financial statements in accordance with generally accepted accounting principles, and that receipts and expenditures of the company are being made only in accordance with authorizations of management and directors of the company; and (iii) provide reasonable assurance regarding prevention or timely detection of unauthorized acquisition, use, or disposition of the company's assets that could have a material effect on the financial statements.
Because of its inherent limitations, internal control over financial reporting may not prevent or detect misstatements. Also, projections of any evaluation of effectiveness to future periods are subject to the risk that controls may become inadequate because of changes in conditions, or that the degree of compliance with the policies or procedures may deteriorate.
| /s/ PricewaterhouseCoopers LLP |
Pittsburgh, Pennsylvania
February 26, 2016
| 102 The PNC Financial Services Group, Inc. – Form 10-K |
CONSOLIDATED INCOME STATEMENT
THE PNC FINANCIAL SERVICES GROUP, INC.
| Year ended December 31 | ||||||||||||
| In millions, except per share data | 2015 | 2014 | 2013 | |||||||||
Interest Income | ||||||||||||
Loans | $ | 7,203 | $ | 7,427 | $ | 7,866 | ||||||
Investment securities | 1,679 | 1,624 | 1,749 | |||||||||
Other | 441 | 380 | 392 | |||||||||
Total interest income | 9,323 | 9,431 | 10,007 | |||||||||
Interest Expense | ||||||||||||
Deposits | 403 | 325 | 344 | |||||||||
Borrowed funds | 642 | 581 | 516 | |||||||||
Total interest expense | 1,045 | 906 | 860 | |||||||||
Net interest income | 8,278 | 8,525 | 9,147 | |||||||||
Noninterest Income | ||||||||||||
Asset management | 1,567 | 1,513 | 1,342 | |||||||||
Consumer services | 1,335 | 1,254 | 1,253 | |||||||||
Corporate services | 1,491 | 1,415 | 1,210 | |||||||||
Residential mortgage | 566 | 618 | 871 | |||||||||
Service charges on deposits | 651 | 662 | 597 | |||||||||
Net gains on sales of securities | 43 | 4 | 99 | |||||||||
Other | 1,294 | 1,384 | 1,493 | |||||||||
Total noninterest income | 6,947 | 6,850 | 6,865 | |||||||||
Total revenue | 15,225 | 15,375 | 16,012 | |||||||||
Provision For Credit Losses | 255 | 273 | 643 | |||||||||
Noninterest Expense | ||||||||||||
Personnel | 4,831 | 4,611 | 4,743 | |||||||||
Occupancy | 842 | 833 | 833 | |||||||||
Equipment | 925 | 859 | 763 | |||||||||
Marketing | 249 | 253 | 246 | |||||||||
Other | 2,616 | 2,932 | 3,096 | |||||||||
Total noninterest expense | 9,463 | 9,488 | 9,681 | |||||||||
Income before income taxes and noncontrolling interests | 5,507 | 5,614 | 5,688 | |||||||||
Income taxes | 1,364 | 1,407 | 1,476 | |||||||||
Net income | 4,143 | 4,207 | 4,212 | |||||||||
Less: Net income (loss) attributable to noncontrolling interests | 37 | 23 | 11 | |||||||||
Preferred stock dividends | 220 | 232 | 237 | |||||||||
Preferred stock discount accretion and redemptions | 5 | 5 | 12 | |||||||||
Net income attributable to common shareholders | $ | 3,881 | $ | 3,947 | $ | 3,952 | ||||||
Earnings Per Common Share | ||||||||||||
Basic | $ | 7.52 | $ | 7.44 | $ | 7.45 | ||||||
Diluted | $ | 7.39 | $ | 7.30 | $ | 7.36 | ||||||
Average Common Shares Outstanding | ||||||||||||
Basic | 514 | 529 | 528 | |||||||||
Diluted | 521 | 537 | 532 | |||||||||
See accompanying Notes To Consolidated Financial Statements.
| The PNC Financial Services Group, Inc. – Form 10-K 103 |
CONSOLIDATED STATEMENT OF COMPREHENSIVE INCOME
THE PNC FINANCIAL SERVICES GROUP, INC.
| Year ended December 31 | ||||||||||||
| In millions | 2015 | 2014 | 2013 | |||||||||
Net income | $ | 4,143 | $ | 4,207 | $ | 4,212 | ||||||
Other comprehensive income (loss), before tax and net of reclassifications into Net income: | ||||||||||||
Net unrealized gains (losses) on non-OTTI securities | (569 | ) | 375 | (1,211 | ) | |||||||
Net unrealized gains (losses) on OTTI securities | (13 | ) | 79 | 231 | ||||||||
Net unrealized gains (losses) on cash flow hedge derivatives | 127 | 168 | (527 | ) | ||||||||
Pension and other postretirement benefit plan adjustments | (54 | ) | (446 | ) | 852 | |||||||
Other | (42 | ) | (39 | ) | 21 | |||||||
Other comprehensive income (loss), before tax and net of reclassifications into Net income | (551 | ) | 137 | (634 | ) | |||||||
Income tax benefit (expense) related to items of other comprehensive income | 178 | (70 | ) | 236 | ||||||||
Other comprehensive income (loss), after tax and net of reclassifications into Net income | (373 | ) | 67 | (398 | ) | |||||||
Comprehensive income | 3,770 | 4,274 | 3,814 | |||||||||
Less: Comprehensive income (loss) attributable to noncontrolling interests | 37 | 23 | 11 | |||||||||
Comprehensive income attributable to PNC | $ | 3,733 | $ | 4,251 | $ | 3,803 | ||||||
See accompanying Notes To Consolidated Financial Statements.
| 104 The PNC Financial Services Group, Inc. – Form 10-K |
CONSOLIDATED BALANCE SHEET
THE PNC FINANCIAL SERVICES GROUP, INC.
In millions, except par value | December 31 2015 | December 31 2014 | ||||||
Assets | ||||||||
Cash and due from banks (a) | $ | 4,065 | $ | 4,360 | ||||
Federal funds sold and resale agreements (b) | 1,369 | 1,852 | ||||||
Trading securities | 1,726 | 2,353 | ||||||
Interest-earning deposits with banks (a) | 30,546 | 31,779 | ||||||
Loans held for sale (b) | 1,540 | 2,262 | ||||||
Investment securities | 70,528 | 55,823 | ||||||
Loans (b) | 206,696 | 204,817 | ||||||
Allowance for loan and lease losses | (2,727 | ) | (3,331 | ) | ||||
Net loans (a) | 203,969 | 201,486 | ||||||
Goodwill | 9,103 | 9,103 | ||||||
Mortgage servicing rights | 1,589 | 1,351 | ||||||
Other intangible assets | 379 | 493 | ||||||
Equity investments (a) | 10,587 | 10,728 | ||||||
Other (a) (b) | 23,092 | 23,482 | ||||||
Total assets | $ | 358,493 | $ | 345,072 | ||||
Liabilities | ||||||||
Deposits | ||||||||
Noninterest-bearing | $ | 79,435 | $ | 73,479 | ||||
Interest-bearing | 169,567 | 158,755 | ||||||
Total deposits | 249,002 | 232,234 | ||||||
Borrowed funds | ||||||||
Federal funds purchased and repurchase agreements | 1,777 | 3,510 | ||||||
Federal Home Loan Bank borrowings | 20,108 | 20,005 | ||||||
Bank notes and senior debt | 21,298 | 15,750 | ||||||
Subordinated debt | 8,556 | 9,151 | ||||||
Commercial paper | 14 | 4,995 | ||||||
Other (c) (d) | 2,779 | 3,357 | ||||||
Total borrowed funds | 54,532 | 56,768 | ||||||
Allowance for unfunded loan commitments and letters of credit | 261 | 259 | ||||||
Accrued expenses (c) | 4,975 | 5,187 | ||||||
Other (c) | 3,743 | 4,550 | ||||||
Total liabilities | 312,513 | 298,998 | ||||||
Equity | ||||||||
Preferred stock (e) | ||||||||
Common stock ($5 par value, authorized 800 shares, issued 542 and 541 shares) | 2,708 | 2,705 | ||||||
Capital surplus – preferred stock | 3,452 | 3,946 | ||||||
Capital surplus – common stock and other | 12,745 | 12,627 | ||||||
Retained earnings | 29,043 | 26,200 | ||||||
Accumulated other comprehensive income (loss) | 130 | 503 | ||||||
Common stock held in treasury at cost: 38 and 18 shares | (3,368 | ) | (1,430 | ) | ||||
Total shareholders' equity | 44,710 | 44,551 | ||||||
Noncontrolling interests | 1,270 | 1,523 | ||||||
Total equity | 45,980 | 46,074 | ||||||
Total liabilities and equity | $ | 358,493 | $ | 345,072 | ||||
| (a) | Our consolidated assets at December 31, 2015 included the following assets of certain variable interest entities (VIEs): Cash and due from banks of $11 million, Interest-earning deposits with banks of $4 million, Net loans of $1.3 billion, Equity investments of $183 million, and Other assets of $402 million. Our consolidated assets at December 31, 2014 included the following assets of certain VIEs: Cash and due from banks of $6 million, Interest-earning deposits with banks of $6 million, Net loans of $1.6 billion, Equity investments of $492 million, and Other assets of $483 million. |
| (b) | Our consolidated assets at December 31, 2015 included the following for which we have elected the fair value option: Federal funds sold and resale agreements of $137 million, Loans held for sale of $1.5 billion, Loans of $.9 billion, and Other assets of $521 million. Our consolidated assets at December 31, 2014 included the following for which we have elected the fair value option: Federal funds sold and resale agreements of $155 million, Loans held for sale of $2.2 billion, Loans of $1.0 billion, and Other assets of $412 million. |
| (c) | Our consolidated liabilities at December 31, 2015 included the following liabilities of certain VIEs: Other borrowed funds of $148 million, Accrued expenses of $44 million, and Other liabilities of $202 million. Our consolidated liabilities at December 31, 2014 included the following liabilities of certain VIEs: Other borrowed funds of $347 million, Accrued expenses of $70 million, and Other liabilities of $206 million. |
| (d) | Our consolidated liabilities at December 31, 2015 and December 31, 2014 included Other borrowed funds of $93 million and $273 million, respectively, for which we have elected the fair value option. |
| (e) | Par value less than $.5 million at each date. |
See accompanying Notes To Consolidated Financial Statements.
| The PNC Financial Services Group, Inc. – Form 10-K 105 |
CONSOLIDATED STATEMENT OF CHANGES IN EQUITY
THE PNC FINANCIAL SERVICES GROUP, INC.
| Shareholders' Equity | ||||||||||||||||||||||||||||||||||||
| In millions | Shares Outstanding Common Stock | Common Stock | Capital Surplus - Preferred Stock | Capital Surplus - Common Stock and Other | Retained Earnings | Accumulated Other Comprehensive Income (Loss) | Treasury Stock | Noncontrolling Interests | Total Equity | |||||||||||||||||||||||||||
Balance at December 31, 2012 (a) | 528 | $ | 2,690 | $ | 3,590 | $ | 12,193 | $ | 20,210 | $ | 834 | $ | (569 | ) | $ | 2,772 | $ | 41,720 | ||||||||||||||||||
Net income (loss) | 4,201 | 11 | 4,212 | |||||||||||||||||||||||||||||||||
Other comprehensive income (loss), net of tax | (398 | ) | (398 | ) | ||||||||||||||||||||||||||||||||
Cash dividends declared | ||||||||||||||||||||||||||||||||||||
Common | (911 | ) | (911 | ) | ||||||||||||||||||||||||||||||||
Preferred | (237 | ) | (237 | ) | ||||||||||||||||||||||||||||||||
Preferred stock discount accretion | 5 | (5 | ) | |||||||||||||||||||||||||||||||||
Redemption of noncontrolling interests (b) | (7 | ) | (368 | ) | (375 | ) | ||||||||||||||||||||||||||||||
Common stock activity | 2 | 8 | 97 | 105 | ||||||||||||||||||||||||||||||||
Treasury stock activity | 3 | (47 | ) | 161 | 114 | |||||||||||||||||||||||||||||||
Preferred stock redemption – Series L (c) | (150 | ) | (150 | ) | ||||||||||||||||||||||||||||||||
Preferred stock issuance – Series R (d) | 496 | 496 | ||||||||||||||||||||||||||||||||||
Other (e) | 173 | (712 | ) | (539 | ) | |||||||||||||||||||||||||||||||
Balance at December 31, 2013 (a) | 533 | $ | 2,698 | $ | 3,941 | $ | 12,416 | $ | 23,251 | $ | 436 | $ | (408 | ) | $ | 1,703 | $ | 44,037 | ||||||||||||||||||
Cumulative effect of adopting ASC 860-50 (f) | 2 | 2 | ||||||||||||||||||||||||||||||||||
Balance at January 1, 2014 | 533 | $ | 2,698 | $ | 3,941 | $ | 12,416 | $ | 23,253 | $ | 436 | $ | (408 | ) | $ | 1,703 | $ | 44,039 | ||||||||||||||||||
Net income | 4,184 | 23 | 4,207 | |||||||||||||||||||||||||||||||||
Other comprehensive income, net of tax | 67 | 67 | ||||||||||||||||||||||||||||||||||
Cash dividends declared | ||||||||||||||||||||||||||||||||||||
Common | (1,000 | ) | (1,000 | ) | ||||||||||||||||||||||||||||||||
Preferred | (232 | ) | (232 | ) | ||||||||||||||||||||||||||||||||
Preferred stock discount accretion | 5 | (5 | ) | |||||||||||||||||||||||||||||||||
Common stock activity | 1 | 7 | 81 | 88 | ||||||||||||||||||||||||||||||||
Treasury stock activity | (11 | ) | 14 | (1,022 | ) | (1,008 | ) | |||||||||||||||||||||||||||||
Other | 116 | (203 | ) | (87 | ) | |||||||||||||||||||||||||||||||
Balance at December 31, 2014 (a) | 523 | $ | 2,705 | $ | 3,946 | $ | 12,627 | $ | 26,200 | $ | 503 | $ | (1,430 | ) | $ | 1,523 | $ | 46,074 | ||||||||||||||||||
Net income | 4,106 | 37 | 4,143 | |||||||||||||||||||||||||||||||||
Other comprehensive income (loss), net of tax | (373 | ) | (373 | ) | ||||||||||||||||||||||||||||||||
Cash dividends declared | ||||||||||||||||||||||||||||||||||||
Common | (1,038 | ) | (1,038 | ) | ||||||||||||||||||||||||||||||||
Preferred | (219 | ) | (219 | ) | ||||||||||||||||||||||||||||||||
Preferred stock discount accretion | 6 | (6 | ) | |||||||||||||||||||||||||||||||||
Common stock activity | 1 | 3 | 46 | 49 | ||||||||||||||||||||||||||||||||
Treasury stock activity | (20 | ) | (56 | ) | (1,938 | ) | (1,994 | ) | ||||||||||||||||||||||||||||
Preferred stock redemption – Series K (g) | (500 | ) | (500 | ) | ||||||||||||||||||||||||||||||||
Other | 128 | (290 | ) | (162 | ) | |||||||||||||||||||||||||||||||
Balance at December 31, 2015 (a) | 504 | $ | 2,708 | $ | 3,452 | $ | 12,745 | $ | 29,043 | $ | 130 | $ | (3,368 | ) | $ | 1,270 | $ | 45,980 | ||||||||||||||||||
| (a) | The par value of our preferred stock outstanding was less than $.5 million at each date and, therefore, is excluded from this presentation. |
| (b) | Relates to the redemption of REIT preferred securities in the first quarter of 2013. See Note 16 Equity for additional information. |
| (c) | 1,500 Series L preferred shares with a $1 par value were redeemed on April 19, 2013. |
| (d) | 5,000 Series R preferred shares with a $1 par value were issued on May 7, 2013. |
| (e) | Includes an impact to noncontrolling interests for deconsolidation of limited partnership or non-managing member interests related to tax credit investments in the amount of $675 million during the second quarter of 2013. |
| (f) | Amount represents the cumulative impact of our January 1, 2014 irrevocable election to prospectively measure all classes of commercial MSRs at fair value. See Note 1 Accounting Policies for more information on this election. |
| (g) | On May 4, 2015, PNC redeemed all 50,000 shares of its Series K Preferred Stock, as well as all 500,000 Depositary Shares representing fractional interests in such shares, resulting in net outflow of $500 million. |
See accompanying Notes To Consolidated Financial Statements
| 106 The PNC Financial Services Group, Inc. – Form 10-K |
CONSOLIDATED STATEMENT OF CASH FLOWS
THE PNC FINANCIAL SERVICES GROUP, INC.
| Year ended December 31 | ||||||||||||
| In millions | 2015 | 2014 | 2013 | |||||||||
Operating Activities | ||||||||||||
Net income | $ | 4,143 | $ | 4,207 | $ | 4,212 | ||||||
Adjustments to reconcile net income to net cash provided (used) by operating activities | ||||||||||||
Provision for credit losses | 255 | 273 | 643 | |||||||||
Depreciation and amortization | 1,088 | 988 | 1,146 | |||||||||
Deferred income taxes | 404 | 255 | 1,196 | |||||||||
Net gains on sales of securities | (43 | ) | (4 | ) | (99 | ) | ||||||
Changes in fair value of mortgage servicing rights | 274 | 514 | (261 | ) | ||||||||
Gain on sales of Visa Class B common shares | (169 | ) | (209 | ) | (168 | ) | ||||||
Noncash charges on trust preferred securities redemptions | 57 | |||||||||||
Undistributed earnings of BlackRock | (407 | ) | (441 | ) | (373 | ) | ||||||
Excess tax benefits from share-based payment arrangements | (29 | ) | (28 | ) | (23 | ) | ||||||
Net change in | ||||||||||||
Trading securities and other short-term investments | 203 | 757 | (455 | ) | ||||||||
Loans held for sale | 393 | (405 | ) | (94 | ) | |||||||
Other assets | 1,568 | (8 | ) | 3,954 | ||||||||
Accrued expenses and other liabilities | (1,788 | ) | 169 | (3,990 | ) | |||||||
Other | (396 | ) | (511 | ) | (190 | ) | ||||||
Net cash provided (used) by operating activities | 5,496 | 5,557 | 5,555 | |||||||||
Investing Activities | ||||||||||||
Sales | ||||||||||||
Securities available for sale | 6,723 | 4,432 | 7,974 | |||||||||
Loans | 2,040 | 2,870 | 2,559 | |||||||||
Repayments/maturities | ||||||||||||
Securities available for sale | 7,920 | 6,915 | 9,668 | |||||||||
Securities held to maturity | 2,032 | 1,987 | 2,483 | |||||||||
Purchases | ||||||||||||
Securities available for sale | (26,367 | ) | (7,989 | ) | (18,419 | ) | ||||||
Securities held to maturity | (4,896 | ) | (500 | ) | (1,883 | ) | ||||||
Loans | (748 | ) | (750 | ) | (1,975 | ) | ||||||
Net change in | ||||||||||||
Federal funds sold and resale agreements | 481 | 131 | (530 | ) | ||||||||
Interest-earning deposits with banks | 1,233 | (19,643 | ) | (8,151 | ) | |||||||
Loans | (3,972 | ) | (12,147 | ) | (10,790 | ) | ||||||
Net cash (paid for) received from acquisition and divestiture activity | (62 | ) | ||||||||||
Other | (706 | ) | (137 | ) | 129 | |||||||
Net cash provided (used) by investing activities | (16,260 | ) | (24,893 | ) | (18,935 | ) | ||||||
(continued on following page)
| The PNC Financial Services Group, Inc. – Form 10-K 107 |
CONSOLIDATED STATEMENT OF CASH FLOWS
THE PNC FINANCIAL SERVICES GROUP, INC.
(continued from previous page)
| Year ended December 31 | ||||||||||||
| In millions | 2015 | 2014 | 2013 | |||||||||
Financing Activities | ||||||||||||
Net change in | ||||||||||||
Noninterest-bearing deposits | $ | 5,765 | $ | 3,182 | $ | 341 | ||||||
Interest-bearing deposits | 10,812 | 8,130 | 7,463 | |||||||||
Federal funds purchased and repurchase agreements | (1,733 | ) | (778 | ) | 965 | |||||||
Commercial paper | (156 | ) | (112 | ) | (5,607 | ) | ||||||
Other borrowed funds | 147 | 221 | 221 | |||||||||
Sales/issuances | ||||||||||||
Federal Home Loan Bank borrowings | 2,250 | 15,685 | 16,435 | |||||||||
Bank notes and senior debt | 8,173 | 6,184 | 3,938 | |||||||||
Subordinated debt | 745 | 1,986 | ||||||||||
Commercial paper | 1,394 | 8,797 | 12,595 | |||||||||
Other borrowed funds | 694 | 505 | 695 | |||||||||
Preferred stock | 496 | |||||||||||
Common and treasury stock | 139 | 252 | 244 | |||||||||
Repayments/maturities | ||||||||||||
Federal Home Loan Bank borrowings | (2,147 | ) | (8,592 | ) | (12,960 | ) | ||||||
Bank notes and senior debt | (2,624 | ) | (3,089 | ) | (1,420 | ) | ||||||
Subordinated debt | (524 | ) | 57 | (731 | ) | |||||||
Commercial paper | (6,219 | ) | (8,687 | ) | (10,444 | ) | ||||||
Other borrowed funds | (1,622 | ) | (467 | ) | (340 | ) | ||||||
Preferred stock redemption | (500 | ) | (150 | ) | ||||||||
Excess tax benefits from share-based payment arrangements | 29 | 28 | 23 | |||||||||
Redemption of noncontrolling interests | (375 | ) | ||||||||||
Acquisition of treasury stock | (2,152 | ) | (1,176 | ) | (24 | ) | ||||||
Preferred stock cash dividends paid | (219 | ) | (232 | ) | (237 | ) | ||||||
Common stock cash dividends paid | (1,038 | ) | (1,000 | ) | (911 | ) | ||||||
Net cash provided (used) by financing activities | 10,469 | 19,653 | 12,203 | |||||||||
Net Increase (Decrease) In Cash And Due From Banks | (295 | ) | 317 | (1,177 | ) | |||||||
Cash and due from banks at beginning of period | 4,360 | 4,043 | 5,220 | |||||||||
Cash and due from banks at end of period | $ | 4,065 | $ | 4,360 | $ | 4,043 | ||||||
Supplemental Disclosures | ||||||||||||
Interest paid | $ | 1,005 | $ | 863 | $ | 891 | ||||||
Income taxes paid | 919 | 1,102 | 234 | |||||||||
Income taxes refunded | 286 | 12 | 3 | |||||||||
Non-cash Investing and Financing Items | ||||||||||||
Transfer from (to) loans to (from) loans held for sale, net | 285 | 724 | (119 | ) | ||||||||
Transfer from loans to foreclosed assets | 435 | 604 | 703 | |||||||||
See accompanying Notes To Consolidated Financial Statements.
| 108 The PNC Financial Services Group, Inc. – Form 10-K |
NOTES TO CONSOLIDATED FINANCIAL STATEMENTS
T HE PNC F INANCIAL S ERVICES G ROUP , I NC .
B USINESS
The PNC Financial Services Group, Inc. (PNC) is one of the largest diversified financial services companies in the United States and is headquartered in Pittsburgh, Pennsylvania.
We have businesses engaged in retail banking, corporate and institutional banking, asset management and residential mortgage banking, providing many of our products and services nationally, as well as other products and services in our primary geographic markets located in Pennsylvania, Ohio, New Jersey, Michigan, Illinois, Maryland, Indiana, Florida, North Carolina, Kentucky, Washington, D.C., Delaware, Virginia, Alabama, Georgia, Missouri, Wisconsin and South Carolina. We also provide certain products and services internationally.
N OTE 1 A CCOUNTING P OLICIES
Basis of Financial Statement Presentation
Our consolidated financial statements include the accounts of the parent company and its subsidiaries, most of which are wholly-owned, and certain partnership interests and variable interest entities.
We prepared these consolidated financial statements in accordance with accounting principles generally accepted in the United States of America (GAAP). We have eliminated intercompany accounts and transactions. We have also reclassified certain prior year amounts to conform to the 2015 presentation, which did not have a material impact on our consolidated financial condition or results of operations. Additionally, we evaluate the materiality of identified errors in the financial statements using both an income statement and a balance sheet approach, based on relevant quantitative and qualitative factors. The consolidated financial statements include certain adjustments to correct immaterial errors related to previously reported periods.
We have also considered the impact of subsequent events on these consolidated financial statements.
Use of Estimates
We prepared these consolidated financial statements using financial information available at the time of preparation, which requires us to make estimates and assumptions that affect the amounts reported. Our most significant estimates pertain to our fair value measurements, allowances for loan and lease losses and unfunded loan commitments and letters of credit, and accretion on purchased impaired loans. Actual results may differ from the estimates and the differences may be material to the consolidated financial statements.
Investment in BlackRock, Inc.
We account for our investment in the common stock and Series B Preferred Stock of BlackRock (deemed to be in-substance common stock) under the equity method of accounting. The investment in BlackRock is reflected on our Consolidated Balance Sheet in Equity investments, while our equity in earnings of BlackRock is reported on our Consolidated Income Statement in Asset management revenue.
We also hold shares of Series C Preferred Stock of BlackRock pursuant to our obligation to partially fund a portion of certain BlackRock long-term incentive plan (LTIP) programs. Since these preferred shares are not deemed to be in-substance common stock, we have elected to account for these preferred shares at fair value and the changes in fair value will offset the impact of marking-to-market the obligation to deliver these shares to BlackRock. Our investment in the BlackRock Series C Preferred Stock is included on our Consolidated Balance Sheet in Other assets. Our obligation to transfer these shares to BlackRock is classified as a derivative not designated as a hedging instrument under GAAP as disclosed in Note 14 Financial Derivatives.
Special Purpose Entities
Special purpose entities (SPEs) are defined as legal entities structured for a particular purpose. We use special purpose entities in various legal forms to conduct normal business activities. We review the structure and activities of special purpose entities for possible consolidation under the applicable GAAP guidance.
A variable interest entity (VIE) is a corporation, partnership, limited liability company, or any other legal structure used to conduct activities or hold assets that either:
| • | Does not have equity investors with voting rights that can directly or indirectly make decisions about the entity's activities through those voting rights or similar rights, or |
| • | Has equity investors that do not provide sufficient equity for the entity to finance its activities without additional subordinated financial support. |
A VIE often holds financial assets, including loans or receivables, real estate or other property.
VIEs are assessed for consolidation under ASC 810 – Consolidation when we hold a variable interest in these entities. We consolidate a VIE if we are its primary beneficiary. The primary beneficiary of a VIE is determined to be the party that meets both of the following criteria: (i) has the power to make decisions that most significantly affect the economic performance of the VIE; and (ii) has the obligation
| The PNC Financial Services Group, Inc. – Form 10-K 109 |
to absorb losses or the right to receive benefits that in either case could potentially be significant to the VIE. Upon consolidation of a VIE, we recognize all of the VIE's assets, liabilities and noncontrolling interests on our Consolidated Balance Sheet. On a quarterly basis, we determine whether any changes occurred requiring a reassessment of whether PNC is the primary beneficiary of an entity.
In applying this guidance, we consolidate a credit card securitization trust and certain tax credit investments. See Note 2 Loan Sale and Servicing Activities and Variable Interest Entities for information about VIEs that we consolidate as well as those that we do not consolidate but in which we hold a significant variable interest.
Revenue Recognition
We earn interest and noninterest income from various sources, including:
| • | Lending, |
| • | Securities portfolio, |
| • | Asset management, |
| • | Customer deposits, |
| • | Loan sales and servicing, |
| • | Brokerage services, |
| • | Sale of loans and securities, |
| • | Certain private equity activities, and |
| • | Securities, derivatives and foreign exchange activities. |
We earn fees and commissions from:
| • | Issuing loan commitments, standby letters of credit and financial guarantees, |
| • | Selling various insurance products, |
| • | Providing treasury management services, |
| • | Providing merger and acquisition advisory and related services, and |
| • | Participating in certain capital markets transactions. |
Revenue earned on interest-earning assets, including unearned income and the amortization/accretion of premiums or discounts recognized on acquired loans and debt securities, is recognized based on the constant effective yield of the financial instrument or based on other applicable accounting guidance.
The Consolidated Income Statement caption Asset management includes asset management fees, which are generally based on a percentage of the fair value of the assets under management. Additionally, Asset management noninterest income includes our share of the earnings of BlackRock recognized under the equity method of accounting.
Service charges on deposit accounts are recognized when earned. Brokerage fees and gains and losses on the sale of securities and certain derivatives are recognized on a trade-date basis.
We record private equity income or loss based on changes in the valuation of the underlying investments or when we dispose of our interest.
We recognize gain/(loss) on changes in the fair value of certain financial instruments where we have elected the fair value option. These financial instruments include certain commercial and residential mortgage loans originated for sale, certain residential mortgage portfolio loans, resale agreements and our investment in BlackRock Series C preferred stock. We also recognize gain/(loss) on changes in the fair value of residential and commercial mortgage servicing rights (MSRs).
We recognize revenue from servicing residential mortgages, commercial mortgages and other consumer loans as earned based on the specific contractual terms. These revenues are reported on the Consolidated Income Statement in the line items Residential mortgage, Corporate services and Consumer services. We recognize revenue from securities, derivatives and foreign exchange customer-related trading, as well as securities underwriting activities, as these transactions occur or as services are provided. We generally recognize gains from the sale of loans upon receipt of cash. Mortgage revenue recognized is reported net of mortgage repurchase reserves.
When appropriate, revenue is reported net of associated expenses in accordance with GAAP.
Cash And Cash Equivalents
Cash and due from banks are considered "cash and cash equivalents" for financial reporting purposes.
Investments
We hold interests in various types of investments. The accounting for these investments is dependent on a number of factors including, but not limited to, items such as:
| • | Ownership interest, |
| • | Our plans for the investment, and |
| • | The nature of the investment. |
Debt Securities
Debt securities are recorded on a trade-date basis. We classify debt securities as held to maturity and carry them at amortized cost if we have the positive intent and ability to hold the securities to maturity. Debt securities that we purchase for certain risk management activities or customer-related trading activities are carried at fair value and classified as Trading securities on our Consolidated Balance Sheet. Realized and unrealized gains and losses on trading securities are included in Other noninterest income.
Debt securities not classified as held to maturity or trading are designated as securities available for sale and carried at fair value with unrealized gains and losses, net of income taxes, reflected in Accumulated other comprehensive income (loss).
| 110 The PNC Financial Services Group, Inc. – Form 10-K |
On at least a quarterly basis, we review all debt securities that are in an unrealized loss position for other than temporary impairment (OTTI). An investment security is deemed impaired if the fair value of the investment is less than its amortized cost. Amortized cost includes adjustments (if any) made to the cost basis of an investment for accretion, amortization, previous other-than-temporary impairments and hedging gains and losses. After an investment security is determined to be impaired, we evaluate whether the decline in value is other-than-temporary. As part of this evaluation, we take into consideration whether we intend to sell the security or whether it is more likely than not that we will be required to sell the security before expected recovery of its amortized cost. We also consider whether or not we expect to receive all of the contractual cash flows from the investment based on factors that include, but are not limited to: the creditworthiness of the issuer and, in the case of securities collateralized by consumer and commercial loan assets, the historical and projected performance of the underlying collateral. In addition, we may also evaluate the business and financial outlook of the issuer, as well as broader industry and sector performance indicators. Declines in the fair value of available for sale debt securities that are deemed other-than-temporary and are attributable to credit deterioration are recognized in Other noninterest income on our Consolidated Income Statement in the period in which the determination is made. Declines in fair value which are deemed other-than-temporary and attributable to factors other than credit deterioration are recognized in Accumulated other comprehensive income (loss) on our Consolidated Balance Sheet.
We include all interest on debt securities, including amortization of premiums and accretion of discounts on investment securities, in net interest income using the constant effective yield method. Effective yields reflect either the effective interest rate implicit in the security at the date of acquisition or the effective interest rate determined based on improved cash flows subsequent to impairment. We compute gains and losses realized on the sale of available for sale debt securities on a specific security basis. These securities gains/(losses) are included in the caption Net gains on sales of securities on the Consolidated Income Statement.
In certain situations, management may elect to transfer certain debt securities from the securities available for sale to the held to maturity classification. In such cases, the securities are reclassified at fair value at the time of transfer. Any unrealized gain or loss included in Accumulated other comprehensive income (loss) at the time of transfer is retained therein and amortized over the remaining life of the security as a yield adjustment, such that only the remaining initial discount/premium from the purchase date is recognized in income.
Equity Securities and Partnership Interests
We account for equity securities and equity investments other than BlackRock and private equity investments under one of the following methods:
| • | Marketable equity securities are recorded on a trade-date basis and are accounted for based on the securities' quoted market prices from a national securities exchange. Those purchased with the intention of selling in the near term are classified as trading and included in Trading securities on our Consolidated Balance Sheet. Both realized and unrealized gains and losses on trading securities are included in Noninterest income. Marketable equity securities not classified as trading are designated as securities available for sale with unrealized gains and losses, net of income taxes, reflected in Accumulated other comprehensive income (loss). Any unrealized losses that we have determined to be other-than-temporary on securities classified as available for sale are recognized in current period earnings. |
| • | For investments in limited partnerships, limited liability companies and other investments that are not required to be consolidated, we use either the equity method or the cost method of accounting. We use the equity method for general and limited partner ownership interests and limited liability companies in which we are considered to have significant influence over the operations of the investee. Under the equity method, we record our equity ownership share of net income or loss of the investee in Noninterest income. We use the cost method for all other investments. Under the cost method, there is no change to the cost basis unless there is an other-than-temporary decline in value or dividends received are considered a return on investment. If the decline is determined to be other-than-temporary, we write down the cost basis of the investment to a new cost basis that represents realizable value. The amount of the write-down is accounted for as a loss included in Noninterest income. Distributions received from the income of an investee on cost method investments are included in Noninterest income. Investments described above are included in the caption Equity investments on the Consolidated Balance Sheet. |
Private Equity Investments
We report private equity investments, which include direct investments in companies, affiliated partnership interests and indirect investments in private equity funds, at estimated fair value. These estimates are based on available information and may not necessarily represent amounts that we will ultimately realize through distribution, sale or liquidation of the investments. Fair values of publicly traded direct investments are determined using quoted market prices and are subject to various discount factors for lack of marketability, when appropriate. The valuation procedures applied to direct
| The PNC Financial Services Group, Inc. – Form 10-K 111 |
investments in private companies include techniques such as multiples of adjusted earnings of the entity, independent appraisals, anticipated financing and sale transactions with third parties, or the pricing used to value the entity in a recent financing transaction. We value affiliated partnership interests based on the underlying investments of the partnership using procedures consistent with those applied to direct investments. We value indirect investments in private equity funds based on net asset value as provided in the financial statements that we receive from their managers. Due to the time lag in our receipt of the financial information and based on a review of investments and valuation techniques applied, adjustments to the manager-provided values are made when available recent portfolio company information or market information indicates significant changes in value from that provided by the manager of the fund. We include all private equity investments on the Consolidated Balance Sheet in the caption Equity investments. Changes in the fair value of private equity investments are recognized in Noninterest income.
We consolidate affiliated partnerships when we are the general partner and have determined that we have control of the partnership or are the primary beneficiary if the entity is a VIE. The portion we do not own is reflected in the caption Noncontrolling interests on the Consolidated Balance Sheet.
Loans
Loans are classified as held for investment when management has both the intent and ability to hold the loan for the foreseeable future, or until maturity or payoff. Management's intent and view of the foreseeable future may change based on changes in business strategies, the economic environment, market conditions and the availability of government programs.
Measurement of delinquency status is based on the contractual terms of each loan. Loans that are 30 days or more past due in terms of payment are considered delinquent.
Except as described below, loans held for investment are stated at the principal amounts outstanding, net of unearned income, unamortized deferred fees and costs on originated loans, and premiums or discounts on purchased loans. Interest on performing loans (excluding interest on purchased impaired loans, which is further discussed below) is accrued based on the principal amount outstanding and recorded in Interest income as earned using the constant effective yield method. Loan origination fees, direct loan origination costs, and loan premiums and discounts are deferred and accreted or amortized into Net interest income, over periods not exceeding the contractual life of the loan.
When loans are redesignated from held for investment to held for sale, specific reserves and allocated pooled reserves included in the Allowance for loan and lease losses (ALLL) are charged-off to reduce the basis of the loans to the lower of cost or estimated fair value less cost to sell.
In addition to originating loans, we also acquire loans through portfolio purchases or acquisitions of other financial services
companies. For certain acquired loans that have experienced a deterioration of credit quality, we follow the guidance contained in ASC 310-30-Loans and Debt Securities Acquired with Deteriorated Credit Quality. Under this guidance, acquired purchased impaired loans are to be recorded at fair value without the carryover of any existing valuation allowances. Evidence of credit quality deterioration may include information and statistics regarding bankruptcy events, updated borrower credit scores, such as Fair Isaac Corporation scores (FICO), past due status, and updated loan-to-value (LTV) ratios. We review the loans acquired for evidence of credit quality deterioration and determine if it is probable that we will be unable to collect all contractual amounts due, including both principal and interest. When both conditions exist, we estimate the amount and timing of undiscounted expected cash flows at acquisition for each loan either individually or on a pool basis. We estimate the cash flows expected to be collected using internal models that incorporate management's best estimate of current key assumptions, such as default rates, loss severity and payment speeds. Collateral values are also incorporated into cash flow estimates. Late fees, which are contractual but not expected to be collected, are excluded from expected future cash flows.
The excess of cash flows expected to be collected on a purchased impaired loan (or pool of loans) over its carrying value represents the accretable yield which is recognized into interest income over the remaining life of the loan (or pool of loans) using the constant effective yield method. The accretable yield is calculated based upon the difference between the undiscounted expected future cash flows of the loans and the recorded investment in the loans. Subsequent decreases in expected cash flows that are attributable, at least in part, to credit quality are recognized as impairments through a charge to the provision for credit losses resulting in an increase in the ALLL. Subsequent increases in expected cash flows are recognized as a provision recapture of previously recorded ALLL or prospectively through an adjustment of the loan's or pool's yield over its remaining life.
Prior to December 31, 2015, upon final disposition of a loan within a pool and for loans that had nominal collateral value/expected cash flows, the loan's carrying value was removed from the pool and any gain or loss associated with the transaction was retained in the pool's recorded investment. Effective December 31, 2015, in anticipation of the end of the life of our purchased impaired pooled consumer and residential real estate loans and pursuant to supervisory direction, we changed our derecognition policy for these loans such that we will write-off the loan's recorded investment and derecognize the associated ALLL upon final disposition. Gains and losses on such loans will be recognized as either an adjustment to the pool's associated ALLL, or yield as appropriate. The transition to this new policy on December 31, 2015 resulted in a $468 million derecognition of recorded investment and associated ALLL on such loans. See Note 4 Purchased Loans and Note 5 Allowances for Loan and Lease
| 112 The PNC Financial Services Group, Inc. – Form 10-K |
Losses and Unfunded Loan Commitments and Letters of Credit for additional loan data and application of the policies disclosed herein.
Leases
We provide financing for various types of equipment, including aircraft, energy and power systems, and vehicles through a variety of lease arrangements. Direct financing leases are carried at the aggregate of lease payments plus estimated residual value of the leased property, less unearned income. Leveraged leases, a form of financing lease, are carried net of nonrecourse debt. We recognize income over the term of the lease using the constant effective yield method. Lease residual values are reviewed for impairment at least annually. Gains or losses on the sale of leased assets are included in Other noninterest income while valuation adjustments on lease residuals are included in Other noninterest expense.
Loan Sales, Loan Securitizations And Retained Interests
We recognize the sale of loans or other financial assets when the transferred assets are legally isolated from our creditors and the appropriate accounting criteria are met. We have sold mortgage, credit card and other loans through securitization transactions. In a securitization, financial assets are transferred into trusts or to SPEs in transactions to effectively legally isolate the assets from PNC.
ASC 860 – Transfers and Servicing requires a true sale legal analysis to address several relevant factors, such as the nature and level of recourse to the transferor, and the amount and nature of retained interests in the loans sold to support whether the transferred loans would be legally isolated from the transferor's assets in the case of bankruptcy. Once the legal isolation test has been met, other factors concerning the nature and extent of the transferor's control and the rights of the transferee over the transferred assets are taken into account in order to determine whether derecognition of assets is warranted.
In a securitization, the trust or SPE issues beneficial interests in the form of senior and subordinated securities backed or collateralized by the assets sold to the trust. The senior classes of the asset-backed securities typically receive investment grade credit ratings at the time of issuance. These ratings are generally achieved through the creation of lower-rated subordinated classes of asset-backed securities, as well as subordinated or residual interests. In certain cases, we may retain a portion or all of the securities issued, interest-only strips, one or more subordinated tranches, servicing rights and, in some cases, cash reserve accounts. Securitized loans are removed from the balance sheet and a net gain or loss is recognized in Noninterest income at the time of initial sale. Gains or losses recognized on the sale of the loans depend on the fair value of the loans sold and the retained interests at the date of sale. We generally estimate the fair value of the retained interests based on the present value of future expected cash flows using assumptions as to discount rates, interest rates, prepayment speeds, credit losses and servicing costs, if applicable.
With the exception of loan sales to certain U.S. government-chartered entities, our loan sales and securitizations are generally structured without recourse to us except for representations and warranties and with no restrictions on the retained interests. We originate, sell and service commercial mortgage loans under the Federal National Mortgage Association (FNMA) Delegated Underwriting and Servicing (DUS) program. Under the provisions of the DUS program, we participate in a loss-sharing arrangement with FNMA. We participated in a similar program with the Federal Home Loan Mortgage Corporation (FHLMC). When we are obligated for loss-sharing or recourse, our policy is to record such liabilities initially at fair value and subsequently reserve for estimated losses in accordance with guidance contained in applicable GAAP. Refer to Note 21 Commitments and Guarantees for more information about our obligations related to sales of loans under these programs.
Loans Held For Sale
We designate loans as held for sale when we have the intent to sell them. We transfer loans to the Loans held for sale category at the lower of cost or estimated fair value less cost to sell. At the time of transfer, write-downs on the loans are recorded as charge-offs. We establish a new cost basis upon transfer. Any subsequent lower-of-cost-or-market adjustment is determined on an individual loan basis and is recognized as a valuation allowance with any charges included in Other noninterest income. Sale proceeds that are in excess of the new cost basis upon transfer and are received within 90 days of classifying the loan as held for sale are recorded as a recovery to the ALLL up to the amount previously charged off. Any remaining proceeds that exist after recovery are recorded as a gain on sale included in Other noninterest income. Sale proceeds that are less than the new cost basis upon transfer and are received within 90 days of classifying the loan as held for sale are recorded as a charge off to the ALLL. Any proceeds received after 90 days of classifying the loan as held for sale are recorded as a gain or loss on sale and included in Other noninterest income.
We have elected to account for certain commercial and residential mortgage loans held for sale at fair value. The changes in the fair value of the commercial mortgage loans are measured and recorded in Other noninterest income while the residential mortgage loans are measured and recorded in Residential mortgage noninterest income each period. See Note 7 Fair Value for additional information.
Interest income with respect to loans held for sale is accrued based on the principal amount outstanding and the loan's contractual interest rate.
In certain circumstances, loans designated as held for sale may be transferred to held for investment based on a change in strategy. We transfer these loans at the lower of cost or estimated fair value; however, any loans originated or purchased for held for sale and designated at fair value remain at fair value for the life of the loan.
| The PNC Financial Services Group, Inc. – Form 10-K 113 |
Nonperforming Loans and Leases
The matrix below summarizes PNC's policies for classifying certain loans as nonperforming loans and/or discontinuing the accrual of loan interest income.
| Commercial loans | ||
Loans Classified as Nonperforming and Accounted for as Nonaccrual | • Loans accounted for at amortized cost where: | |
– The loan is 90 days or more past due. | ||
– The loan is rated substandard or worse due to the determination that full collection of principal and interest is not probable as demonstrated by the following conditions: | ||
• The collection of principal or interest is 90 days or more past due; | ||
• Reasonable doubt exists as to the certainty of the borrower's future debt service ability, according to the terms of the credit arrangement, regardless of whether 90 days have passed or not; | ||
• The borrower has filed or will likely file for bankruptcy; | ||
• The bank advances additional funds to cover principal or interest; | ||
• We are in the process of liquidating a commercial borrower; or | ||
• We are pursuing remedies under a guarantee. | ||
Loans Excluded from Nonperforming Classification but Accounted for as Nonaccrual | • Loans accounted for under the fair value option and full collection of principal and interest is not probable. | |
• Loans accounted for at the lower of cost or market less costs to sell (Held for Sale) and full collection of principal and interest is not probable. | ||
Loans Excluded from Nonperforming Classification and Nonaccrual Accounting | • Purchased impaired loans because interest income is accreted by nature of the accounting for these assets. | |
• Loans that are well secured and in the process of collection. | ||
| Consumer loans | ||
Loans Classified as Nonperforming and Accounted for as Nonaccrual | • Loans accounted for at amortized cost where full collection of contractual principal and interest is not deemed probable as demonstrated in the policies below: | |
– The loan is 90 days past due for home equity and installment loans, and 180 days past due for well secured residential real estate loans; | ||
– The loan has been modified and classified as a troubled debt restructuring (TDR); | ||
– Notification of bankruptcy has been received and the loan is 30 days or more past due; | ||
– The bank holds a subordinate lien position in the loan and the first lien loan is seriously stressed (i.e., 90 days or more past due); | ||
– Other loans within the same borrower relationship have been placed on nonaccrual or charge-offs have been taken on them; | ||
– The bank has repossessed non-real estate collateral securing the loan; or | ||
– The bank has charged-off the loan to the value of the collateral. | ||
Loans Excluded from Nonperforming Classification but Accounted for as Nonaccrual | • Loans accounted for under the fair value option and full collection of principal and interest is not probable. | |
• Loans accounted for at the lower of cost or market less costs to sell (Held for Sale) and full collection of principal and interest is not probable. | ||
Loans Excluded from Nonperforming Classification and Nonaccrual Accounting | • Purchased impaired loans because interest income is accreted through the accounting model. | |
• Certain government insured loans where substantially all principal and interest is insured. | ||
• Residential real estate loans that are well secured and in the process of collection. | ||
• Consumer loans and lines of credit, not secured by residential real estate, as permitted by regulatory guidance. | ||
| 114 The PNC Financial Services Group, Inc. – Form 10-K |
See Note 3 Asset Quality in this Report for additional detail on nonperforming assets and asset quality indicators for commercial and consumer loans.
Commercial Loans
We generally charge off Commercial Lending (Commercial, Commercial Real Estate, and Equipment Lease Financing) nonperforming loans when we determine that a specific loan, or portion thereof, is uncollectible. This determination is based on the specific facts and circumstances of the individual loans. In making this determination, we consider the viability of the business or project as a going concern, the past due status when the asset is not well-secured, the expected cash flows to repay the loan, the value of the collateral, and the ability and willingness of any guarantors to perform.
Additionally, in general, for smaller dollar commercial loans of $1 million or less, a partial or full charge-off occurs at 120 days past due for term loans and 180 days past due for revolvers. Certain small business credit card balances that are placed on nonaccrual status when they become 90 days or more past due are charged-off at 180 days past due.
Consumer Loans
Home equity installment loans, home equity lines of credit, and residential real estate loans that are not well-secured and in the process of collection are charged-off at no later than 180 days past due. At that time, the basis in the loan is reduced to the fair value of the collateral less costs to sell. In addition to this policy, the bank recognizes a charge-off on a secured consumer loan when:
| • | The bank holds a subordinate lien position in the loan and a foreclosure notice has been received on the first lien loan; |
| • | The bank holds a subordinate lien position in the loan which is 30 days or more past due with a combined loan to value ratio of greater than or equal to 110% and the first lien loan is seriously stressed ( i.e ., 90 days or more past due); |
| • | The loan is modified or otherwise restructured in a manner that results in the loan becoming collateral dependent; |
| • | Notification of bankruptcy has been received within the last 60 days and the loan is 60 days or more past due; |
| • | The borrower has been discharged from personal liability through Chapter 7 bankruptcy and has not formally reaffirmed his or her loan obligation to PNC; or |
| • | The collateral securing the loan has been repossessed and the value of the collateral is less than the recorded investment of the loan outstanding. |
For loans that continue to meet any of the above policies, collateral values are updated annually and subsequent declines in collateral values are charged-off resulting in incremental provision for credit loss.
Most consumer loans and lines of credit, not secured by residential real estate, are charged off after 120-180 days past due.
Accounting for Nonperforming Assets and Leases and Other Nonaccrual Loans
For accrual loans, interest income is accrued on a monthly basis and certain fees and costs are deferred upon origination and recognized in income over the term of the loan utilizing an effective yield method. For nonaccrual loans, interest income accrual and deferred fee/cost recognition is discontinued. Additionally, the current year accrued and uncollected interest is reversed through Net interest income and prior year accrued and uncollected interest is charged-off. Nonaccrual loans may also be charged-off to reduce the basis to the fair value of collateral less costs to sell.
If payment is received on a nonaccrual loan, generally the payment is first applied to the recorded investment; payments are then applied to recover any charged-off amounts related to the loan. Finally, if both recorded investment and any charge-offs have been recovered, then the payment will be recorded as fee and interest income.
For TDRs, payments are applied based upon their contractual terms unless the related loan is deemed non-performing. TDRs are generally included in nonperforming and nonaccrual loans. However, after a reasonable period of time in which the loan performs under restructured terms and meets other performance indicators, it is returned to performing/accruing status. This return to performing/accruing status demonstrates that the bank expects to collect all of the loan's remaining contractual principal and interest. TDRs resulting from 1) borrowers that have been discharged from personal liability through Chapter 7 bankruptcy and have not formally reaffirmed their loan obligations to PNC and 2) borrowers that are not currently obligated to make both principal and interest payments under the restructured terms are not returned to accrual status.
Other nonaccrual loans are generally not returned to accrual status until the borrower has performed in accordance with the contractual terms and other performance indicators for at least six months, the period of time which was determined to demonstrate the expected collection of the loan's remaining contractual principal and interest. When a nonperforming loan is returned to accrual status, it is then considered a performing loan.
See Note 3 Asset Quality and Note 5 Allowances for Loan and Lease Losses and Unfunded Loan Commitments and Letters of Credit in this Report for additional TDR information.
Foreclosed assets are comprised of any asset seized or property acquired through a foreclosure proceeding or acceptance of a deed-in-lieu of foreclosure. Other real estate owned is comprised principally of commercial and residential
| The PNC Financial Services Group, Inc. – Form 10-K 115 |
real estate properties obtained in partial or total satisfaction of loan obligations. After obtaining a foreclosure judgment, or in some jurisdictions the initiation of proceedings under a power of sale in the loan instruments, the property will be sold. When we are awarded title or completion of deed in lieu of foreclosure, we transfer the loan to foreclosed assets included in Other assets on our Consolidated Balance Sheet. Property obtained in satisfaction of a loan is initially recorded at estimated fair value less cost to sell. Based upon the estimated fair value less cost to sell, the recorded investment of the loan is adjusted and, typically, a charge-off/recovery is recognized to the Allowance for Loan and Lease Losses (ALLL). We estimate fair values primarily based on appraisals, or sales agreements with third parties. Subsequently, foreclosed assets are valued at the lower of the amount recorded at acquisition date or estimated fair value less cost to sell. Valuation adjustments on these assets and gains or losses realized from disposition of such property are reflected in Other noninterest expense.
For certain mortgage loans that have a government guarantee, we establish a separate other receivable upon foreclosure. The receivable is measured based on the loan balance (inclusive of principal and interest) that is expected to be recovered from the guarantor.
Allowance for Loan and Lease Losses
We maintain the ALLL at a level that we believe to be appropriate to absorb estimated probable credit losses incurred in the loan and lease portfolios as of the balance sheet date. Our determination of the allowance is based on periodic evaluations of these loan and lease portfolios and other relevant factors. This critical estimate includes significant use of PNC's own historical data and complex methods to interpret this data. These evaluations are inherently subjective, as they require material estimates and may be susceptible to significant change, and include, among others:
| • | Probability of default (PD), |
| • | Loss given default (LGD), |
| • | Outstanding balance of the loan, |
| • | Movement through delinquency stages, |
| • | Amounts and timing of expected future cash flows, |
| • | Value of collateral, which may be obtained from third parties, and |
| • | Qualitative factors, such as changes in current economic conditions, that may not be reflected in modeled results. |
For all loans, except purchased impaired loans, the ALLL is the sum of three components: (i) asset specific/individual impaired reserves, (ii) quantitative (formulaic or pooled) reserves and (iii) qualitative (judgmental) reserves.
The reserve calculation and determination process is dependent on the use of key assumptions. Key reserve assumptions and estimation processes react to and are
influenced by observed changes in loan portfolio performance experience, the financial strength of the borrower, and economic conditions. Key reserve assumptions are periodically updated.
Asset Specific/Individual Component
Nonperforming loans that are considered impaired under ASC 310 – Receivables, which include all commercial and consumer TDRs, are evaluated for a specific reserve. Specific reserve allocations are determined as follows:
| • | For commercial nonperforming loans and commercial TDRs greater than or equal to a defined dollar threshold, specific reserves are based on an analysis of the present value of the loan's expected future cash flows, the loan's observable market price or the fair value of the collateral. |
| • | For commercial nonperforming loans and commercial TDRs below the defined dollar threshold, the individual loan's loss given default (LGD) percentage is multiplied by the loan balance and the results are aggregated for purposes of measuring specific reserve impairment. |
| • | Consumer nonperforming loans are collectively reserved for unless classified as consumer TDRs. For consumer TDRs, specific reserves are determined through an analysis of the present value of the loan's expected future cash flows, except for those instances where loans have been deemed collateral dependent, including loans where borrowers have been discharged from personal liability through Chapter 7 bankruptcy and have not formally reaffirmed their loan obligations to PNC. Once that determination has been made, those TDRs are charged down to the fair value of the collateral less costs to sell at each period end. |
Commercial Lending Quantitative Component
The estimates of the quantitative component of ALLL for incurred losses within the commercial lending portfolio segment are determined through statistical loss modeling utilizing PD, LGD and outstanding balance of the loan. Based upon loan risk ratings, we assign PDs and LGDs. Each of these statistical parameters is determined based on internal historical data and market data. PD is influenced by such factors as liquidity, industry, obligor financial structure, access to capital and cash flow. LGD is influenced by collateral type, original and/or updated loan-to-value ratio (LTV), facility structure and other factors.
Consumer Lending Quantitative Component
Quantitative estimates within the consumer lending portfolio segment are calculated primarily using a roll-rate model based on statistical relationships, calculated from historical data that estimate the movement of loan outstandings through the various stages of delinquency and ultimately charge-off over our loss emergence period.
| 116 The PNC Financial Services Group, Inc. – Form 10-K |
Qualitative Component
While our reserve methodologies strive to reflect all relevant risk factors, there continues to be uncertainty associated with, but not limited to, potential imprecision in the estimation process due to the inherent time lag of obtaining information and normal variations between estimates and actual outcomes. We provide additional reserves that are designed to provide coverage for losses attributable to such risks. The ALLL also includes factors that may not be directly measured in the determination of specific or pooled reserves. Such qualitative factors may include:
| • | Industry concentrations and conditions, |
| • | Recent credit quality trends, |
| • | Recent loss experience in particular portfolios, |
| • | Recent macro-economic factors, |
| • | Model imprecision, |
| • | Changes in lending policies and procedures, |
| • | Timing of available information, including the performance of first lien positions, and |
| • | Limitations of available historical data. |
Allowance for Purchased Non-Impaired Loans
ALLL for purchased non-impaired loans is determined based upon a comparison between the methodologies described above and the remaining acquisition date fair value discount that has yet to be accreted into interest income. After making the comparison, an ALLL is recorded for the amount greater than the discount, or no ALLL is recorded if the discount is greater.
Allowance for Purchased Impaired Loans
ALLL for purchased impaired loans is determined in accordance with ASC 310-30 by comparing the net present value of the cash flows expected to be collected to the recorded investment for a given loan (or pool of loans). In cases where the net present value of expected cash flows is lower than the recorded investment, ALLL is established. Cash flows expected to be collected represent management's best estimate of the cash flows expected over the life of a loan (or pool of loans). For large balance commercial loans, cash flows are separately estimated at the loan level. For smaller balance pooled loans, pool cash flows are estimated using cash flow models. Pools were defined at acquisition based on the risk characteristics of the loan. Our cash flow models use loan data including, but not limited to, contractual loan balance, delinquency status of the loan, updated borrower FICO credit scores, geographic information, historical loss experience, and updated LTVs, as well as best estimates for changes in unemployment rates, home prices and other economic factors, to determine estimated cash flows.
Our credit risk management policies, procedures and practices are designed to promote sound lending standards and prudent credit risk management. We have policies, procedures and practices that address financial statement requirements, collateral review and appraisal requirements, advance rates
based upon collateral types, appropriate levels of exposure, cross-border risk, lending to specialized industries or borrower type, guarantor requirements, and regulatory compliance.
Allowance for Unfunded Loan Commitments and Letters of Credit
We maintain the allowance for unfunded loan commitments and letters of credit at a level we believe is appropriate to absorb estimated probable credit losses incurred on these unfunded credit facilities as of the balance sheet date. We determine the allowance based on periodic evaluations of the unfunded credit facilities, including an assessment of the probability of commitment usage, credit risk factors, and, solely for commercial lending, the terms and expiration dates of the unfunded credit facilities. Other than the estimation of the probability of funding, the reserve for unfunded loan commitments is estimated in a manner similar to the methodology used for determining reserves for funded exposures. The allowance for unfunded loan commitments and letters of credit is recorded as a liability on the Consolidated Balance Sheet. Net adjustments to the allowance for unfunded loan commitments and letters of credit are included in the provision for credit losses.
See Note 5 Allowances for Loan and Lease Losses and Unfunded Loan Commitments and Letters of Credit for additional loan data and application of the policies disclosed herein.
Mortgage And Other Servicing Rights
We provide servicing under various loan servicing contracts for commercial, residential and other consumer loans. These contracts are either purchased in the open market or retained as part of a loan securitization or loan sale. All newly acquired or originated servicing rights are initially measured at fair value. Fair value is based on the present value of the expected future net cash flows, including assumptions as to:
| • | Deposit balances and interest rates for escrow and commercial reserve earnings, |
| • | Discount rates, |
| • | Estimated prepayment speeds, and |
| • | Estimated servicing costs. |
As of January 1, 2014, PNC made an irrevocable election to subsequently measure all classes of commercial MSRs at fair value in order to eliminate any potential measurement mismatch between our economic hedges and the commercial MSRs. The impact was not material. As a result of that election, changes in the fair value of commercial MSRs are recognized as gains/(losses).
Prior to January 1, 2014, we elected to utilize the amortization method for subsequent measurement of our commercial mortgage loan servicing rights. This election was made based on the unique characteristics of the commercial mortgage
| The PNC Financial Services Group, Inc. – Form 10-K 117 |
loans underlying these servicing rights. Specific risk characteristics of commercial mortgages include loan type, currency or exchange rate, interest rates, expected cash flows and changes in the cost of servicing. We amortized these servicing assets over their estimated lives based on estimated net servicing income. On a quarterly basis, we tested the assets for impairment by categorizing the pools of assets underlying the servicing rights into various strata. If the estimated fair value of the assets was less than the carrying value, an impairment loss was recognized and a valuation reserve was established.
For servicing rights related to residential real estate loans, we apply the fair value method. This election was made to be consistent with our risk management strategy to hedge changes in the fair value of these assets. We manage this risk by hedging the fair value of this asset with derivatives and securities which are expected to increase in value when the value of the servicing right declines. The fair value of these servicing rights is estimated by using a cash flow valuation model which calculates the present value of estimated future net servicing cash flows, taking into consideration actual and expected mortgage loan prepayment rates, discount rates, servicing costs, and other economic factors which are determined based on current market conditions.
Fair Value Of Financial Instruments
The fair value of financial instruments and the methods and assumptions used in estimating fair value amounts and financial assets and liabilities for which fair value was elected are detailed in Note 7 Fair Value.
Goodwill And Other Intangible Assets
We assess goodwill for impairment at least annually, in the fourth quarter, or when events or changes in circumstances indicate the assets might be impaired. Finite-lived intangible assets are amortized to expense using accelerated or straight-line methods over their respective estimated useful lives. We review finite-lived intangible assets for impairment when events or changes in circumstances indicate that the asset's carrying amount may not be recoverable from undiscounted future cash flows or that it may exceed its fair value.
Depreciation And Amortization
For financial reporting purposes, we depreciate premises and equipment, net of salvage value, principally using the straight-line method over their estimated useful lives.
We use estimated useful lives for furniture and equipment ranging from one to 10 years, and depreciate buildings over an estimated useful life of up to 40 years. We amortize leasehold improvements over their estimated useful lives of up to 15 years or the respective lease terms, whichever is shorter.
We purchase, as well as internally develop and customize, certain software to enhance or perform internal business
functions. Software development costs incurred in the planning and post-development project stages are charged to Noninterest expense. Costs associated with designing software configuration and interfaces, installation, coding programs and testing systems are capitalized and amortized using the straight-line method over periods ranging from one to 10 years.
Repurchase And Resale Agreements
Repurchase and resale agreements are treated as collateralized financing transactions and are carried at the amounts at which the securities will be subsequently reacquired or resold, including accrued interest, as specified in the respective agreements. Our policy is to take possession of securities purchased under agreements to resell. We monitor the market value of securities to be repurchased and resold and additional collateral may be obtained where considered appropriate to protect against credit exposure. We have elected to account for structured resale agreements at fair value.
Other Comprehensive Income
Other comprehensive income consists, on an after-tax basis, primarily of unrealized gains or losses, excluding OTTI attributable to credit deterioration, on investment securities classified as available for sale, unrealized gains or losses on derivatives designated as cash flow hedges, and changes in pension and other postretirement benefit plan liability adjustments. Details of each component are included in Note 17 Other Comprehensive Income.
Treasury Stock
We record common stock purchased for treasury at cost. At the date of subsequent reissue, the treasury stock account is reduced by the cost of such stock on the first-in, first-out basis.
Derivative Instruments And Hedging Activities
We use a variety of financial derivatives as part of our overall asset and liability risk management process to help manage exposure to interest rate, market and credit risk inherent in our business activities. Interest rate and total return swaps, swaptions, interest rate caps and floors, options, forwards, and futures contracts are the primary instruments we use for interest rate risk management.
Financial derivatives involve, to varying degrees, interest rate, market and credit risk. We manage these risks as part of our asset and liability management process and through credit policies and procedures.
We recognize all derivative instruments at fair value as either Other assets or Other liabilities on the Consolidated Balance Sheet and the related cash flows in the Operating Activities section of the Consolidated Statement Of Cash Flows. Adjustments for counterparty credit risk are included in the determination of fair value. The accounting for changes in the
| 118 The PNC Financial Services Group, Inc. – Form 10-K |
fair value of a derivative instrument depends on whether it has been designated and qualifies as part of a cash flow or net investment hedging relationship. For all other derivatives, changes in fair value are recognized in earnings.
We utilize a net presentation for derivative instruments on the Consolidated Balance Sheet taking into consideration the effects of legally enforceable master netting agreements. Cash collateral exchanged with counterparties is also netted against the applicable derivative exposures by offsetting obligations to return, or general rights to reclaim, cash collateral against the fair values of the net derivatives being collateralized.
For those derivative instruments that are designated and qualify as accounting hedges, we designate the hedging instrument, based on the exposure being hedged, as a fair value hedge, a cash flow hedge or a hedge of the net investment in a foreign operation.
We formally document the relationship between the hedging instruments and hedged items, as well as the risk management objective and strategy, before undertaking an accounting hedge. To qualify for hedge accounting, the derivatives and related hedged items must be designated as a hedge at inception of the hedge relationship. For accounting hedge relationships, we formally assess, both at the inception of the hedge and on an ongoing basis, if the derivatives are highly effective in offsetting designated changes in the fair value or cash flows of the hedged item. If it is determined that the derivative instrument is not highly effective, hedge accounting is discontinued.
For derivatives that are designated as fair value hedges ( i.e ., hedging the exposure to changes in the fair value of an asset or a liability attributable to a particular risk, such as changes in LIBOR), changes in the fair value of the hedging instrument are recognized in earnings and offset by also recognizing in earnings the changes in the fair value of the hedged item attributable to the hedged risk. To the extent the change in fair value of the derivative does not offset the change in fair value of the hedged item, the difference or ineffectiveness is reflected in the Consolidated Income Statement in the same financial statement category as the hedged item.
For derivatives designated as cash flow hedges ( i.e ., hedging the exposure to variability in expected future cash flows), the effective portions of the gain or loss on derivatives are reported as a component of Accumulated other comprehensive income (loss) and subsequently reclassified to income in the same period or periods during which the hedged transaction affects earnings. The change in fair value attributable to the ineffective portion of the hedging instrument is recognized immediately in Noninterest income.
For derivatives designated as a hedge of net investment in a foreign operation, the effective portions of the gain or loss on
the derivatives are reported as a component of Accumulated other comprehensive income (loss). The change in fair value attributable to the ineffective portion of the hedging instrument is recognized immediately in Noninterest income.
We discontinue hedge accounting when it is determined that the derivative no longer qualifies as an effective hedge; the derivative expires or is sold, terminated or exercised; or the derivative is de-designated as a fair value or cash flow hedge or, for a cash flow hedge, it is no longer probable that the forecasted transaction will occur by the end of the originally specified time period. If we determine that the derivative no longer qualifies as a fair value or cash flow hedge and hedge accounting is discontinued, the derivative will continue to be recorded on the balance sheet at its fair value with changes in fair value included in current earnings. For a discontinued fair value hedge, the previously hedged item is no longer adjusted for changes in fair value.
When hedge accounting is discontinued because it is no longer probable that a forecasted transaction will occur, the derivative will continue to be recorded on the balance sheet at its fair value with changes in fair value included in current earnings, and the gains and losses in Accumulated other comprehensive income (loss) will be recognized immediately into earnings. When we discontinue hedge accounting because the hedging instrument is sold, terminated or no longer designated, the amount reported in Accumulated other comprehensive income (loss) up to the date of sale, termination or de-designation continues to be reported in Other comprehensive income or loss until the forecasted transaction affects earnings. We did not terminate any cash flow hedges in 2015, 2014 or 2013 due to a determination that a forecasted transaction was no longer probable of occurring.
We purchase or originate financial instruments that contain an embedded derivative. At the inception of the transaction, we assess if the economic characteristics of the embedded derivative are clearly and closely related to the economic characteristics of the host contract, whether the hybrid financial instrument is measured at fair value with changes in fair value reported in earnings, and whether a separate instrument with the same terms as the embedded derivative would be a derivative. If the embedded derivative does not meet all of these conditions, the embedded derivative is recorded separately from the host contract with changes in fair value recorded in earnings, unless we elect to account for the hybrid instrument at fair value.
We have elected on an instrument-by-instrument basis, fair value measurement for certain financial instruments with embedded derivatives.
We enter into commitments to originate residential and commercial mortgage loans for sale. We also enter into commitments to purchase or sell commercial and residential real estate loans. These commitments are accounted for as
| The PNC Financial Services Group, Inc. – Form 10-K 119 |
free-standing derivatives which are recorded at fair value in Other assets or Other liabilities on the Consolidated Balance Sheet. Any gain or loss from the change in fair value after the inception of the commitment is recognized in Noninterest income.
Income Taxes
We account for income taxes under the asset and liability method. Deferred tax assets and liabilities are determined based on differences between the financial reporting and tax bases of assets and liabilities and are measured using the enacted tax rates and laws that we expect will apply at the time when we believe the differences will reverse. The recognition of deferred tax assets requires an assessment to determine the realization of such assets. Realization refers to the incremental benefit achieved through the reduction in future taxes payable or refunds receivable from the deferred tax assets, assuming that the underlying deductible differences and carryforwards are the last items to enter into the determination of future taxable income. We establish a valuation allowance for tax assets when it is more likely than not that they will not be realized, based upon all available positive and negative evidence.
We use the deferral method of accounting on investments that generate investment tax credits. Under this method, the investment tax credits are recognized as a reduction to the related asset.
Earnings Per Common Share
Basic earnings per common share is calculated using the two-class method to determine income attributable to common shareholders. Unvested share-based payment awards that contain nonforfeitable rights to dividends or dividend equivalents are considered participating securities under the two-class method. Distributed dividends and dividend equivalents related to participating securities and an allocation of undistributed net income reduce the amount of income attributable to common shareholders. Income attributable to common shareholders is then divided by the weighted-average common shares outstanding for the period.
Diluted earnings per common share is calculated under the more dilutive of either the treasury method or the two-class method. For the diluted calculation, we increase the weighted-average number of shares of common stock outstanding by the assumed conversion of outstanding convertible preferred stock from the beginning of the year or date of issuance, if later, and the number of shares of common stock that would be issued assuming the exercise of stock options and warrants and the issuance of incentive shares using the treasury stock method. These adjustments to the weighted-average number of shares of common stock outstanding are made only when such adjustments will dilute earnings per common share. See Note 15 Earnings Per Share for additional information.
Recently Adopted Accounting Standards
In May 2015, the Financial Accounting Standards Board (FASB) issued ASU 2015-07, Fair Value Measurements (Topic 820): Disclosures for Investments in Certain Entities That Calculate Net Asset Value per Share (or its Equivalent). The ASU was issued to reduce diversity in practice related to how certain investments measured at net asset value with future redemption dates are categorized in the fair value hierarchy. The ASU eliminates the requirement (i) to categorize within the fair value hierarchy investments whose fair value is measured using the NAV per share practical expedient, and (ii) to make certain disclosures for those investments for which an entity has elected to measure the fair value using the practical expedient. We elected to early adopt the ASU as of December 31, 2015 which reduced the disclosure of level 3 assets by $347 million and $469 million as of December 31, 2015 and December 31, 2014, respectively. Adoption of this ASU did not have a material impact on our results of operations or financial position.
In June 2014, the FASB issued ASU 2014-11, Transfers and Servicing (Topic 860): Repurchase-to-Maturity Transactions, Repurchase Financings, and Disclosures. This ASU impacts the accounting for repurchase-to-maturity transactions and transfers executed contemporaneously with a repurchase agreement with the same counterparty ( i.e. , a repurchase financing) by requiring secured borrowing accounting. We adopted this accounting as of January 1, 2015. Pursuant to this guidance, the disclosure requirements were adopted in the second quarter of 2015. Adoption of this ASU did not have a material effect on our results of operations or financial position.
In August 2014, the FASB issued Accounting Standards Update (ASU) 2014-14, Receivables – Troubled Debt Restructurings by Creditors (Subtopic 310-40): Classification of Certain Government-Guaranteed Mortgage Loans upon Foreclosure (a consensus of the FASB Emerging Issues Task Force) . This ASU requires that a mortgage loan be derecognized and that a separate other receivable be recognized upon foreclosure when (i) the loan has a government guarantee that is not separable from the loan before foreclosure; (ii) the creditor has the intent to convey the real estate to the guarantor and make a claim on the guarantee and the creditor has the ability to recover under that claim at the time of foreclosure; and (iii) any amount of the claim that is determined upon the basis of the real estate is fixed at the time of foreclosure. The receivable should be measured based on the loan balance (inclusive of principal and interest) that is expected to be recovered from the guarantor. This ASU is effective for annual periods, and interim periods within those annual periods, beginning after December 15, 2014. The ASU may be adopted using either a prospective or modified retrospective transition method consistent with the method elected to adopt ASU 2014-04, Receivables – Troubled Debt Restructurings by Creditors (Subtopic 310-40):
| 120 The PNC Financial Services Group, Inc. – Form 10-K |
Reclassification of Residential Real Estate Collateralized Consumer Mortgage Loans upon Foreclosure. We adopted this guidance as of January 1, 2015. Adoption of this ASU did not have a material effect on our results of operations or financial position.
In January 2014, the FASB issued ASU 2014-04, Receivables – Troubled Debt Restructurings by Creditors (Subtopic 310-40): Reclassification of Residential Real Estate Collateralized Consumer Mortgage Loans upon Foreclosure . This ASU clarifies that an in substance repossession or foreclosure is considered to have occurred, and a creditor is considered to have received physical possession of residential real estate property collateralizing a consumer mortgage loan, upon a) the creditor obtaining legal title to the residential real estate property upon completion of a foreclosure or b) the borrower conveying all interest in the residential real estate property to the creditor to satisfy the loan through completion of a deed in lieu of foreclosure or through a similar legal agreement. We adopted this guidance as of January 1, 2015. Adoption of this ASU did not have a material effect on our results of operations or financial position.
N OTE 2 L OAN S ALE AND S ERVICING A CTIVITIES AND V ARIABLE I NTEREST E NTITIES
Loan Sale and Servicing Activities
We have transferred residential and commercial mortgage loans in securitization or sales transactions in which we have continuing involvement. These transfers have occurred through Agency securitization, Non-agency securitization, and loan sale transactions. Agency securitizations consist of securitization transactions with Federal National Mortgage Association (FNMA), Federal Home Loan Mortgage Corporation (FHLMC) and Government National Mortgage Association (GNMA) (collectively the Agencies). FNMA and FHLMC generally securitize our transferred loans into mortgage-backed securities for sale into the secondary market through special purpose entities (SPEs) that they sponsor. We, as an authorized GNMA issuer/servicer, pool Federal Housing Administration (FHA) and Department of Veterans Affairs (VA) insured loans into mortgage-backed securities for sale into the secondary market. In Non-agency securitizations, we have transferred loans into securitization SPEs. In other instances, third-party investors have also purchased our loans in loan sale transactions and in certain instances have subsequently sold these loans into securitization SPEs. Securitization SPEs utilized in the Agency and Non-agency securitization transactions are variable interest entities (VIEs).
Our continuing involvement in the FNMA, FHLMC, and GNMA securitizations, Non-agency securitizations, and loan sale transactions generally consists of servicing, repurchasing previously transferred loans under certain conditions and loss share arrangements, and, in limited circumstances, holding of mortgage-backed securities issued by the securitization SPEs.
Depending on the transaction, we may act as the master, primary, and/or special servicer to the securitization SPEs or third-party investors. Servicing responsibilities typically consist of collecting and remitting monthly borrower principal and interest payments, maintaining escrow deposits, performing loss mitigation and foreclosure activities, and, in certain instances, funding of servicing advances. Servicing advances, which are reimbursable, are made for principal and interest and collateral protection and are carried in Other assets at cost.
We earn servicing and other ancillary fees for our role as servicer and, depending on the contractual terms of the servicing arrangement, we can be terminated as servicer with or without cause. At the consummation date of each type of loan transfer where PNC retains the servicing, we recognize a servicing right at fair value. See Note 7 Fair Value and Note 8 Goodwill and Intangible Assets for further discussion of our servicing rights.
| The PNC Financial Services Group, Inc. – Form 10-K 121 |
Certain loans transferred to the Agencies contain removal of account provisions (ROAPs). Under these ROAPs, we hold an option to repurchase at par individual delinquent loans that meet certain criteria. In other limited cases, the U.S. Department of Housing and Urban Development (HUD) has granted us the right to repurchase current loans when we intend to modify the borrower's interest rate under established guidelines. When we have the unilateral ability to repurchase a loan, effective control over the loan has been regained and we recognize an asset (in either Loans or Loans held for sale) and a corresponding liability (in Other borrowed funds) on the balance sheet regardless of our intent to repurchase the loan. At December 31, 2015 and December 31, 2014, these assets and liabilities both totaled $120 million and $136 million, respectively.
The Agency and Non-agency mortgage-backed securities issued by the securitization SPEs that are purchased and held on our balance sheet are typically purchased in the secondary market. PNC does not retain any credit risk on its Agency mortgage-backed security positions as FNMA, FHLMC, and the U.S. Government (for GNMA) guarantee losses of principal and interest.
We also have involvement with certain Agency and Non-agency commercial securitization SPEs where we have not transferred commercial mortgage loans. These SPEs were sponsored by independent third-parties and the loans held by these entities were purchased exclusively from other third-parties. Generally, our involvement with these SPEs is as servicer with servicing activities consistent with those described above.
We recognize a liability for our loss exposure associated with contractual obligations to repurchase previously transferred loans due to breaches of representations and warranties and also for loss sharing arrangements (recourse obligations) with the Agencies. Other than providing temporary liquidity under servicing advances and our loss exposure associated with our repurchase and recourse obligations, we have not provided nor are we required to provide any type of credit support, guarantees, or commitments to the securitization SPEs or third-party investors in these transactions. See Note 21 Commitments and Guarantees for further discussion of our repurchase and recourse obligations.
The following table provides cash flows associated with PNC's loan sale and servicing activities:
Table 50: Cash Flows Associated with Loan Sale and Servicing Activities
| In millions | Residential Mortgages | Commercial Mortgages (a) | Home Equity Loans/Lines (b) | |||||||||
CASH FLOWS – Year ended December 31, 2015 | ||||||||||||
Sales of loans (c) | $ | 8,121 | $ | 4,398 | ||||||||
Repurchases of previously transferred loans (d) | 580 | $ | 135 | |||||||||
Servicing fees (e) | 339 | 120 | 15 | |||||||||
Servicing advances recovered/(funded), net | 90 | 48 | 3 | |||||||||
Cash flows on mortgage-backed securities held (f) | 1,458 | 184 | ||||||||||
CASH FLOWS – Year ended December 31, 2014 | ||||||||||||
Sales of loans (c) | $ | 8,344 | $ | 3,469 | ||||||||
Repurchases of previously transferred loans (d) | 744 | $ | 14 | |||||||||
Servicing fees (e) | 346 | 132 | 19 | |||||||||
Servicing advances recovered/(funded), net | 70 | 113 | (20 | ) | ||||||||
Cash flows on mortgage-backed securities held (f) | 934 | 308 | ||||||||||
| (a) | Represents cash flow information associated with both commercial mortgage loan transfer and servicing activities. |
| (b) | These activities were part of an acquired brokered home equity lending business in which PNC is no longer engaged. |
| (c) | Gains/losses recognized on sales of loans were insignificant for the periods presented. |
| (d) | Includes residential mortgage government insured or guaranteed loans eligible for repurchase through the exercise of our ROAP option, and loans repurchased due to alleged breaches of origination covenants or representations and warranties made to purchasers. Includes home equity lines of credit repurchased at the end of their draw periods due to contractual requirements. |
| (e) | Includes contractually specified servicing fees, late charges and ancillary fees. |
| (f) | Represents cash flows on securities we hold issued by a securitization SPE in which PNC transferred to and/or services loans. The carrying value of such securities held were $6.6 billion in residential mortgage-backed securities and $1.3 billion in commercial mortgage-backed securities at December 31, 2015 and $3.4 billion in residential mortgage-backed securities and $1.3 billion in commercial mortgage-backed securities at December 31, 2014. |
| 122 The PNC Financial Services Group, Inc. – Form 10-K |
The table below presents information about the principal balances of transferred loans that we service and are not recorded on our Consolidated Balance Sheet. We would only experience a loss on these transferred loans if we were required to repurchase a loan due to a breach in representations and warranties or a loss sharing arrangement associated with our continuing involvement with these loans. For more information regarding our recourse and repurchase obligations, including our reserve of estimated losses, see the Recourse and Repurchase Obligations section of Note 21 Commitments and Guarantees.
Table 51: Principal Balance, Delinquent Loans, and Net Charge-offs Related to Serviced Loans For Others
| In millions | Residential Mortgages | Commercial Mortgages (a) | Home Equity Loans/Lines (b) | |||||||||
December 31, 2015 | ||||||||||||
Total principal balance | $ | 72,898 | $ | 53,789 | $ | 2,806 | ||||||
Delinquent loans (c) | 1,923 | 1,057 | 904 | |||||||||
December 31, 2014 | ||||||||||||
Total principal balance | $ | 79,108 | $ | 60,873 | $ | 3,833 | ||||||
Delinquent loans (c) | 2,657 | 707 | 1,303 | |||||||||
Year ended December 31, 2015 | ||||||||||||
Net charge-offs (d) | $ | 117 | $ | 595 | $ | 28 | ||||||
Year ended December 31, 2014 | ||||||||||||
Net charge-offs (d) | $ | 136 | $ | 1,288 | $ | 61 | ||||||
| (a) | Represents information at the securitization level in which PNC has sold loans and is the servicer for the securitization. |
| (b) | These activities were part of an acquired brokered home equity lending business in which PNC is no longer engaged. |
| (c) | Serviced delinquent loans are 90 days or more past due or are in process of foreclosure. |
| (d) | Net charge-offs for Residential mortgages and Home equity loans/lines represent credit losses less recoveries distributed and as reported to investors during the period. Net charge-offs for Commercial mortgages represent credit losses less recoveries distributed and as reported by the trustee for commercial mortgage backed securitizations. Realized losses for Agency securitizations are not reflected as we do not manage the underlying real estate upon foreclosure and, as such, do not have access to loss information. |
Variable Interest Entities (VIEs)
We are involved with various entities in the normal course of business that are deemed to be VIEs. We assess VIEs for consolidation based upon the accounting policies described in Note 1 Accounting Policies. The following provides a summary of VIEs, including those that we have consolidated and those in which we hold variable interests but have not consolidated into our financial statements as of December 31, 2015 and December 31, 2014. We have not provided additional financial support to these entities which we are not contractually required to provide.
Table 52: Consolidated VIEs – Carrying Value (a) (b)
| In millions | Credit Card and Other Securitization Trusts | Tax Credit Investments | Total | |||||||||
December 31, 2015 | ||||||||||||
Assets | ||||||||||||
Cash and due from banks | $ | 11 | $ | 11 | ||||||||
Interest-earning deposits with banks | 4 | 4 | ||||||||||
Loans | $ | 1,335 | 6 | 1,341 | ||||||||
Allowance for loan and lease losses | (48 | ) | (48 | ) | ||||||||
Equity investments | 183 | 183 | ||||||||||
Other assets | 22 | 380 | 402 | |||||||||
Total assets | $ | 1,309 | $ | 584 | $ | 1,893 | ||||||
Liabilities | ||||||||||||
Other borrowed funds | $ | 148 | $ | 148 | ||||||||
Accrued expenses | 44 | 44 | ||||||||||
Other liabilities | 202 | 202 | ||||||||||
Total liabilities | $ | 394 | $ | 394 | ||||||||
December 31, 2014 | ||||||||||||
Assets | ||||||||||||
Cash and due from banks | $ | 6 | $ | 6 | ||||||||
Interest-earning deposits with banks | 6 | 6 | ||||||||||
Loans | $ | 1,606 | 1,606 | |||||||||
Allowance for loan and lease losses | (50 | ) | (50 | ) | ||||||||
Equity investments | 492 | 492 | ||||||||||
Other assets | 31 | 452 | 483 | |||||||||
Total assets | $ | 1,587 | $ | 956 | $ | 2,543 | ||||||
Liabilities | ||||||||||||
Other borrowed funds | $ | 166 | $ | 181 | $ | 347 | ||||||
Accrued expenses | 70 | 70 | ||||||||||
Other liabilities | 206 | 206 | ||||||||||
Total liabilities | $ | 166 | $ | 457 | $ | 623 | ||||||
| (a) | Amounts represent carrying value on PNC's Consolidated Balance Sheet. |
| (b) | Difference between total assets and total liabilities represents the equity portion of the VIE or intercompany assets and liabilities which are eliminated in consolidation. |
| The PNC Financial Services Group, Inc. – Form 10-K 123 |
Credit Card Securitization Trust
We were the sponsor of several credit card securitizations facilitated through a trust. This bankruptcy-remote SPE was established to purchase credit card receivables from the sponsor and to issue and sell asset-backed securities created by it to independent third-parties. The SPE was financed primarily through the sale of these asset-backed securities. These transactions were originally structured to provide liquidity and to afford favorable capital treatment.
Our continuing involvement in these securitization transactions consisted primarily of holding certain retained interests and acting as the primary servicer. We consolidated the SPE as we were deemed the primary beneficiary of the entity based upon our level of continuing involvement. Our role as primary servicer gave us the power to direct the activities of the SPE that most significantly affect its economic performance and our holding of retained interests gave us the obligation to absorb expected losses, or the ability to receive residual returns that could be potentially significant to the SPE. The underlying assets of the consolidated SPE were restricted only for payment of the beneficial interests issued by the SPE. Additionally, creditors of the SPE have no direct recourse to PNC.
During 2012, the last series issued by the SPE, Series 2007-1, matured. At December 31, 2015, we continued to consolidate this SPE as we were the primary beneficiary of the SPE through our holding of seller's interest and our role as the primary servicer.
Tax Credit Investments
We make certain equity investments in various tax credit limited partnerships or limited liability companies (LLCs). The purpose of these investments is to achieve a satisfactory return on capital and to assist us in achieving goals associated with the Community Reinvestment Act.
Also, we are a national syndicator of affordable housing equity. In these syndication transactions, we create funds in which our subsidiaries are the general partner or managing member and sell limited partnership or non-managing member interests to third parties. In some cases PNC may also
purchase a limited partnership or non-managing member interest in the fund. The purpose of this business is to generate income from the syndication of these funds, generate servicing fees by managing the funds, and earn tax credits to reduce our tax liability. General partner or managing member activities include identifying, evaluating, structuring, negotiating, and closing the fund investments in operating limited partnerships or LLCs, as well as oversight of the ongoing operations of the fund portfolio.
Typically, the general partner or managing member will be the party that has the right to make decisions that will most significantly impact the economic performance of the entity. However, certain partnership or LLC agreements provide the limited partner or non-managing member the ability to remove the general partner or managing member without cause. This results in the limited partner or non-managing member being the party that has the right to make decisions that will most significantly impact the economic performance of the entity. The primary sources of benefits for these investments are the tax credits and passive losses which reduce our tax liability. We have consolidated investments in which we have the power to direct the activities that most significantly impact the entity's performance, and have an obligation to absorb expected losses or receive benefits that could be potentially significant. The assets are primarily included in Equity investments and Other assets on our Consolidated Balance Sheet with the liabilities classified in Other borrowed funds, Accrued expenses, and Other liabilities and the third-party investors' interests included in the Equity section as Noncontrolling interests. Neither creditors nor equity investors in these investments have any recourse to our general credit. The consolidated assets and liabilities of these investments are provided in Table 52.
The following table provides a summary of non-consolidated VIEs with which we have significant continuing involvement but are not the primary beneficiary. We do not consider our continuing involvement to be significant when it relates to a VIE where we only invest in securities issued by the VIE and were not involved in the design of the VIE or where no transfers have occurred between PNC and the VIE. We have excluded certain transactions with non-consolidated VIEs from the balances presented in Table 53 where we have determined that our continuing involvement is not significant.
| 124 The PNC Financial Services Group, Inc. – Form 10-K |
Table 53: Non-Consolidated VIEs
| In millions | PNC Risk of Loss (a) | Carrying Value of Assets Owned by PNC | Carrying Value of Liabilities Owned by PNC | |||||||||
December 31, 2015 | ||||||||||||
Commercial Mortgage-Backed Securitizations (b) | $ | 1,498 | $ | 1,498 | (c) | $ | 1 | (e) | ||||
Residential Mortgage-Backed Securitizations (b) | 6,680 | 6,680 | (c) | 1 | (e) | |||||||
Tax Credit Investments and Other | 2,551 | 2,622 | (d) | 836 | (f) | |||||||
Total | $ | 10,729 | $ | 10,800 | $ | 838 | ||||||
December 31, 2014 | ||||||||||||
Commercial Mortgage-Backed Securitizations (b) | $ | 1,550 | $ | 1,550 | (c) | $ | 1 | (e) | ||||
Residential Mortgage-Backed Securitizations (b) | 3,385 | 3,385 | (c) | 4 | (e) | |||||||
Tax Credit Investments and Other | 2,270 | 2,304 | (d) | 777 | (f) | |||||||
Total | $ | 7,205 | $ | 7,239 | $ | 782 | ||||||
| (a) | This represents loans, investments and other assets related to non-consolidated VIEs, net of collateral (if applicable). |
| (b) | Amounts reflect involvement with securitization SPEs where PNC transferred to and/or services loans for an SPE and we hold securities issued by that SPE. Values disclosed in the PNC Risk of Loss column represent our maximum exposure to loss for those securities' holdings. |
| (c) | Included in Trading securities, Investment securities, Other intangible assets and Other assets on our Consolidated Balance Sheet. |
| (d) | Included in Loans, Equity investments and Other assets on our Consolidated Balance Sheet. |
| (e) | Included in Other liabilities on our Consolidated Balance Sheet. |
| (f) | Included in Deposits and Other liabilities on our Consolidated Balance Sheet. |
Residential and Commercial Mortgage-Backed Securitizations
In connection with each Agency and Non-agency securitization discussed above, we evaluate each SPE utilized in these transactions for consolidation. In performing these assessments, we evaluate our level of continuing involvement in these transactions as the nature of our involvement ultimately determines whether or not we hold a variable interest and/or are the primary beneficiary of the SPE. Factors we consider in our consolidation assessment include the significance of (i) our role as servicer, (ii) our holdings of mortgage-backed securities issued by the securitization SPE, and (iii) the rights of third-party variable interest holders.
The first step in our assessment is to determine whether we hold a variable interest in the securitization SPE. We hold variable interests in Agency and Non-agency securitization SPEs through our holding of mortgage-backed securities issued by the SPEs and/or our recourse obligations. Each SPE in which we hold a variable interest is evaluated to determine whether we are the primary beneficiary of the entity. For Agency securitization transactions, our contractual role as servicer does not give us the power to direct the activities that most significantly affect the economic performance of the SPEs. Thus, we are not the primary beneficiary of these entities. For Non-agency securitization transactions, we would be the primary beneficiary to the extent our servicing activities give us the power to direct the activities that most significantly affect the economic performance of the SPE and we hold a more than insignificant variable interest in the entity.
Details about the Agency and Non-agency securitization SPEs where we hold a variable interest and are not the primary beneficiary are included in Table 53. Our maximum exposure to loss as a result of our involvement with these SPEs is the carrying value of the mortgage-backed securities, servicing assets, servicing advances, and our liabilities associated with our recourse obligations. Creditors of the securitization SPEs have no recourse to PNC's assets or general credit.
Tax Credit Investments and Other
For tax credit investments in which we do not have the right to make decisions that will most significantly impact the economic performance of the entity, we are not the primary beneficiary and thus they are not consolidated. These investments are disclosed in Table 53. The table also reflects our maximum exposure to loss exclusive of any potential tax credit recapture. Our maximum exposure to loss is equal to our legally binding equity commitments adjusted for recorded impairment, partnership results, or amortization for qualifying low income housing tax credit investments when applicable. For all legally binding unfunded equity commitments, we increase our recognized investment and recognize a liability. As of December 31, 2015, we had a liability for unfunded commitments of $.5 billion related to investments in qualified affordable housing projects which is reflected in Other liabilities on our Consolidated Balance Sheet.
Table 53 also includes our involvement in lease financing transactions with LLCs engaged in solar power generation that to a large extent provided returns in the form of tax credits. The outstanding financings and operating lease assets are reflected as Loans and Other assets, respectively, on our Consolidated Balance Sheet, whereas related liabilities are reported in Deposits and Other liabilities.
| The PNC Financial Services Group, Inc. – Form 10-K 125 |
N OTE 3 A SSET Q UALITY
We closely monitor economic conditions and loan performance trends to manage and evaluate our exposure to credit risk. Trends in delinquency rates may be a key indicator, among other considerations, of credit risk within the loan portfolios. The measurement of delinquency status is based on the contractual terms of each loan. Loans that are 30 days or more past due in terms of payment are considered delinquent. Loan delinquencies exclude loans held for sale, purchased impaired loans, nonperforming loans and loans accounted for under the fair value option which are on nonaccrual status, but include government insured or guaranteed loans and accruing loans accounted for under the fair value option.
Nonperforming assets include nonperforming loans and leases, OREO and foreclosed assets, and nonperforming TDRs. Nonperforming loans are those loans accounted for at amortized cost whose credit quality has deteriorated to the extent that full collection of contractual principal and interest is not probable. Interest income is not recognized on these loans. Loans accounted for under the fair value option are reported as performing loans as these loans are accounted for at fair value. However, when nonaccrual criteria is met, interest income is not recognized on these loans. Additionally, certain government insured or guaranteed loans for which we expect to collect substantially all principal and interest are not reported as nonperforming loans and continue to accrue interest. Purchased impaired loans are excluded from nonperforming loans as we are currently accreting interest income over the expected life of the loans. See Note 4 Purchased Loans for further information.
See Note 1 Accounting Policies for additional delinquency, nonperforming, and charge-off information.
| 126 The PNC Financial Services Group, Inc. – Form 10-K |
The following tables display the delinquency status of our loans and our nonperforming assets at December 31, 2015 and December 31, 2014, respectively.
Table 54: Analysis of Loan Portfolio (a)
| Accruing | ||||||||||||||||||||||||||||||||||||
| Dollars in millions | Current or Less Than 30 Days Past Due | 30-59 Days Past Due | 60-89 Days Past Due | 90 Days Or More Past Due | Total Past Due (b) | Nonperforming Loans | Fair Value Option Nonaccrual Loans (c) | Purchased Impaired Loans | Total Loans (d) (e) | |||||||||||||||||||||||||||
December 31, 2015 | ||||||||||||||||||||||||||||||||||||
Commercial Lending | ||||||||||||||||||||||||||||||||||||
Commercial | $ | 98,075 | $ | 69 | $ | 32 | $ | 45 | $ | 146 | $ | 351 | $ | 36 | $ | 98,608 | ||||||||||||||||||||
Commercial real estate | 27,134 | 10 | 4 | 14 | 187 | 133 | 27,468 | |||||||||||||||||||||||||||||
Equipment lease financing | 7,440 | 19 | 2 | 21 | 7 | 7,468 | ||||||||||||||||||||||||||||||
Total commercial lending | 132,649 | 98 | 38 | 45 | 181 | 545 | 169 | 133,544 | ||||||||||||||||||||||||||||
Consumer Lending | ||||||||||||||||||||||||||||||||||||
Home equity | 29,656 | 63 | 30 | 93 | 977 | 1,407 | 32,133 | |||||||||||||||||||||||||||||
Residential real estate (f) | 10,918 | 142 | 65 | 566 | 773 | 549 | $ | 225 | 1,946 | 14,411 | ||||||||||||||||||||||||||
Credit card | 4,779 | 28 | 19 | 33 | 80 | 3 | 4,862 | |||||||||||||||||||||||||||||
Other consumer (g) | 21,181 | 180 | 96 | 237 | 513 | 52 | 21,746 | |||||||||||||||||||||||||||||
Total consumer lending | 66,534 | 413 | 210 | 836 | 1,459 | 1,581 | 225 | 3,353 | 73,152 | |||||||||||||||||||||||||||
Total | $ | 199,183 | $ | 511 | $ | 248 | $ | 881 | $ | 1,640 | $ | 2,126 | $ | 225 | $ | 3,522 | $ | 206,696 | ||||||||||||||||||
Percentage of total loans | 96.36 | % | .25 | % | .12 | % | .43 | % | .80 | % | 1.03 | % | .11 | % | 1.70 | % | 100.00 | % | ||||||||||||||||||
December 31, 2014 | ||||||||||||||||||||||||||||||||||||
Commercial Lending | ||||||||||||||||||||||||||||||||||||
Commercial | $ | 96,922 | $ | 73 | $ | 24 | $ | 37 | $ | 134 | $ | 290 | $ | 74 | $ | 97,420 | ||||||||||||||||||||
Commercial real estate | 22,667 | 23 | 2 | 25 | 334 | 236 | 23,262 | |||||||||||||||||||||||||||||
Equipment lease financing | 7,672 | 11 | 1 | 12 | 2 | 7,686 | ||||||||||||||||||||||||||||||
Total commercial lending | 127,261 | 107 | 27 | 37 | 171 | 626 | 310 | 128,368 | ||||||||||||||||||||||||||||
Consumer Lending | ||||||||||||||||||||||||||||||||||||
Home equity | 31,474 | 70 | 32 | 102 | 1,112 | 1,989 | 34,677 | |||||||||||||||||||||||||||||
Residential real estate (f) | 9,900 | 163 | 68 | 742 | 973 | 706 | $ | 269 | 2,559 | 14,407 | ||||||||||||||||||||||||||
Credit card | 4,528 | 28 | 20 | 33 | 81 | 3 | 4,612 | |||||||||||||||||||||||||||||
Other consumer (g) | 22,071 | 214 | 112 | 293 | 619 | 63 | 22,753 | |||||||||||||||||||||||||||||
Total consumer lending | 67,973 | 475 | 232 | 1,068 | 1,775 | 1,884 | 269 | 4,548 | 76,449 | |||||||||||||||||||||||||||
Total | $ | 195,234 | $ | 582 | $ | 259 | $ | 1,105 | $ | 1,946 | $ | 2,510 | $ | 269 | $ | 4,858 | $ | 204,817 | ||||||||||||||||||
Percentage of total loans | 95.32 | % | .28 | % | .13 | % | .54 | % | .95 | % | 1.23 | % | .13 | % | 2.37 | % | 100.00 | % | ||||||||||||||||||
| (a) | Amounts in table represent recorded investment and exclude loans held for sale. Recorded investment in a loan includes the unpaid principal balance plus accrued interest and net accounting adjustments, less any charge-offs. Recorded investment does not include any associated valuation allowance. |
| (b) | Past due loan amounts exclude purchased impaired loans, even if contractually past due (or if we do not expect to receive payment in full based on the original contractual terms), as we are currently accreting interest income over the expected life of the loans. |
| (c) | Consumer loans accounted for under the fair value option for which we do not expect to collect substantially all principal and interest are subject to nonaccrual accounting and classification upon meeting any of our nonaccrual policies. Given that these loans are not accounted for at amortized cost, these loans have been excluded from the nonperforming loan population. |
| (d) | Net of unearned income, net deferred loan fees, unamortized discounts and premiums, and purchase discounts and premiums totaling $1.4 billion and $1.7 billion at December 31, 2015 and December 31, 2014, respectively. |
| (e) | Future accretable yield related to purchased impaired loans is not included in the analysis of loan portfolio. |
| (f) | Past due loan amounts at December 31, 2015 include government insured or guaranteed Residential real estate mortgages totaling $56 million for 30 to 59 days past due, $45 million for 60 to 89 days past due and $545 million for 90 days or more past due. Past due loan amounts at December 31, 2014 include government insured or guaranteed Residential real estate mortgages totaling $68 million for 30 to 59 days past due, $43 million for 60 to 89 days past due and $719 million for 90 days or more past due. |
| (g) | Past due loan amounts at December 31, 2015 include government insured or guaranteed Other consumer loans totaling $116 million for 30 to 59 days past due, $75 million for 60 to 89 days past due and $220 million for 90 days or more past due. Past due loan amounts at December 31, 2014 include government insured or guaranteed Other consumer loans totaling $152 million for 30 to 59 days past due, $93 million for 60 to 89 days past due and $277 million for 90 days or more past due. |
| The PNC Financial Services Group, Inc. – Form 10-K 127 |
In the normal course of business, we originate or purchase loan products with contractual characteristics that, when concentrated, may increase our exposure as a holder of those loan products. Possible product features that may create a concentration of credit risk would include a high original or updated LTV ratio, terms that may expose the borrower to future increases in repayments above increases in market interest rates, and interest-only loans, among others. We also originate home equity and residential real estate loans that are concentrated in our primary geographic markets.
We originate interest-only loans to commercial borrowers. Such credit arrangements are usually designed to match borrower cash flow expectations ( e.g. , working capital lines, revolvers). These products are standard in the financial services industry and product features are considered during the underwriting process to mitigate the increased risk that the interest-only feature may result in borrowers not being able to make interest and principal payments when due. We do not believe that these product features create a concentration of credit risk.
At December 31, 2015, we pledged $20.2 billion of commercial loans to the Federal Reserve Bank (FRB) and $56.4 billion of residential real estate and other loans to the Federal Home Loan Bank (FHLB) as collateral for the contingent ability to borrow, if necessary. The comparable amounts at December 31, 2014 were $19.2 billion and $52.8 billion, respectively.
Table 55: Nonperforming Assets
| Dollars in millions | December 31 2015 | December 31 2014 | ||||||
Nonperforming loans | ||||||||
Total commercial lending | $ | 545 | $ | 626 | ||||
Total consumer lending (a) | 1,581 | 1,884 | ||||||
Total nonperforming loans (b) | 2,126 | 2,510 | ||||||
OREO and foreclosed assets | ||||||||
Other real estate owned (OREO) | 279 | 351 | ||||||
Foreclosed and other assets | 20 | 19 | ||||||
Total OREO and foreclosed assets (c) | 299 | 370 | ||||||
Total nonperforming assets | $ | 2,425 | $ | 2,880 | ||||
Nonperforming loans to total loans | 1.03 | % | 1.23 | % | ||||
Nonperforming assets to total loans, OREO and foreclosed assets | 1.17 | 1.40 | ||||||
Nonperforming assets to total assets | .68 | .83 | ||||||
Interest on nonperforming loans | ||||||||
Computed on original terms | 115 | 125 | ||||||
Recognized prior to nonperforming status | 22 | 25 | ||||||
| (a) | Excludes most consumer loans and lines of credit, not secured by residential real estate, which are charged off after 120 to 180 days past due and are not placed on nonperforming status. |
| (b) | Nonperforming loans exclude certain government insured or guaranteed loans, loans held for sale, loans accounted for under the fair value option and purchased impaired loans. |
| (c) | The recorded investment of loans collateralized by residential real estate property that are in process of foreclosure was $.6 billion and $.8 billion at December 31, 2015 and December 31, 2014, which included $.3 billion and $.5 billion, respectively, of loans that are government insured/guaranteed. |
Nonperforming loans also include certain loans whose terms have been restructured in a manner that grants a concession to a borrower experiencing financial difficulties. In accordance with applicable accounting guidance, these loans are considered TDRs. See Note 1 Accounting Policies and the TDR section within this Note.
Total nonperforming loans in the nonperforming assets table above include TDRs of $1.1 billion at December 31, 2015 and $1.4 billion at December 31, 2014. TDRs that are performing, including consumer credit card TDR loans, totaled $1.2 billion at December 31, 2015 and December 31, 2014 and are excluded from nonperforming loans. These include TDRs that are not placed on nonaccrual status as permitted by regulatory guidance. Nonperforming TDRs are returned to accrual and
classified as performing after demonstrating a period of at least six months of consecutive performance under the restructured terms. Loans where borrowers have been discharged from personal liability through Chapter 7 bankruptcy and have not formally reaffirmed their loan obligations to PNC and loans to borrowers not currently obligated to make both principal and interest payments under the restructured terms are not returned to accrual status.
Additional Asset Quality Indicators
We have two overall portfolio segments – Commercial Lending and Consumer Lending. Each of these two segments is comprised of multiple loan classes. Classes are characterized by similarities in initial measurement, risk
| 128 The PNC Financial Services Group, Inc. – Form 10-K |
attributes and the manner in which we monitor and assess credit risk. The Commercial Lending segment is comprised of the commercial, commercial real estate, equipment lease financing, and commercial purchased impaired loan classes. The Consumer Lending segment is comprised of the home equity, residential real estate, credit card, other consumer, and consumer purchased impaired loan classes.
Commercial Lending Asset Classes
Commercial Loan Class
For commercial loans, we monitor the performance of the borrower in a disciplined and regular manner based upon the level of credit risk inherent in the loan. To evaluate the level of credit risk, we assign an internal risk rating reflecting the borrower's PD and LGD. This two-dimensional credit risk rating methodology provides granularity in the risk monitoring process on an ongoing basis. These ratings are reviewed and updated, generally at least once per year. Additionally, no less frequently than on an annual basis, we review PD rates related to each rating grade based upon internal historical data. These rates are updated as needed and augmented by market data as deemed necessary. For small balance homogenous pools of commercial loans, mortgages and leases, we apply statistical modeling to assist in determining the probability of default within these pools. Further, on a periodic basis, we update our LGD estimates associated with each rating grade based upon historical data. The combination of the PD and LGD ratings assigned to a commercial loan, capturing both the combination of expectations of default and loss severity in event of default, reflects the relative estimated likelihood of loss for that loan at the reporting date. In general, loans with better PD and LGD tend to have a lower likelihood of loss compared to loans with worse PD and LGD. The loss amount also considers an estimate of exposure at date of default, which we also periodically update based upon historical data.
Based upon the amount of the lending arrangement and our risk rating assessment, we follow a formal schedule of written periodic review. Quarterly, we conduct formal reviews of a market's or business unit's entire loan portfolio, focusing on those loans which we perceive to be of higher risk, based upon PDs and LGDs, or loans for which credit quality is weakening. If circumstances warrant, it is our practice to review any customer obligation and its level of credit risk more frequently. We attempt to proactively manage our loans by using various procedures that are customized to the risk of a given loan, including ongoing outreach, contact, and assessment of obligor financial conditions, collateral inspection and appraisal.
Commercial Real Estate Loan Class
We manage credit risk associated with our commercial real estate projects and commercial mortgage activities similar to commercial loans by analyzing PD and LGD. Additionally, risks connected with commercial real estate projects and commercial mortgage activities tend to be correlated to the loan structure and collateral location, project progress and business environment. As a result, these attributes are also monitored and utilized in assessing credit risk.
As with the commercial class, a formal schedule of periodic review is also performed to assess market/geographic risk and business unit/industry risk. Often as a result of these overviews, more in-depth reviews and increased scrutiny are placed on areas of higher risk, including adverse changes in risk ratings, deteriorating operating trends, and/or areas that concern management. These reviews are designed to assess risk and take actions to mitigate our exposure to such risks.
Equipment Lease Financing Loan Class
We manage credit risk associated with our equipment lease financing loan class similar to commercial loans by analyzing PD and LGD.
Based upon the dollar amount of the lease and of the level of credit risk, we follow a formal schedule of periodic review. Generally, this occurs quarterly, although we have established practices to review such credit risk more frequently if circumstances warrant. Our review process entails analysis of the following factors: equipment value/residual value, exposure levels, jurisdiction risk, industry risk, guarantor requirements, and regulatory compliance.
Commercial Purchased Impaired Loan Class
Estimates of the expected cash flows primarily determine the valuation of commercial purchased impaired loans. Commercial cash flow estimates are influenced by a number of credit related items, which include but are not limited to: estimated collateral value, receipt of additional collateral, secondary trading prices, circumstances of possible and/or ongoing liquidation, capital availability, business operations and payment patterns.
We attempt to proactively manage these factors by using various procedures that are customized to the risk of a given loan. These procedures include a review by our Special Asset Committee (SAC), ongoing outreach, contact, and assessment of obligor financial conditions, collateral inspection and appraisal.
See Note 4 Purchased Loans for additional information.
| The PNC Financial Services Group, Inc. – Form 10-K 129 |
Table 56: Commercial Lending Asset Quality Indicators (a)(b)
| Criticized Commercial Loans | ||||||||||||||||||||
| In millions | Pass Rated | Special Mention (c) | Substandard (d) | Doubtful (e) | Total Loans | |||||||||||||||
December 31, 2015 | ||||||||||||||||||||
Commercial | $ | 93,364 | $ | 2,029 | $ | 3,089 | $ | 90 | $ | 98,572 | ||||||||||
Commercial real estate | 26,729 | 120 | 481 | 5 | 27,335 | |||||||||||||||
Equipment lease financing | 7,230 | 87 | 150 | 1 | 7,468 | |||||||||||||||
Purchased impaired loans | 6 | 157 | 6 | 169 | ||||||||||||||||
Total commercial lending | $ | 127,323 | $ | 2,242 | $ | 3,877 | $ | 102 | $ | 133,544 | ||||||||||
December 31, 2014 | ||||||||||||||||||||
Commercial | $ | 92,884 | $ | 1,984 | $ | 2,424 | $ | 55 | $ | 97,347 | ||||||||||
Commercial real estate | 22,066 | 285 | 639 | 35 | 23,025 | |||||||||||||||
Equipment lease financing | 7,518 | 73 | 93 | 2 | 7,686 | |||||||||||||||
Purchased impaired loans | 4 | 280 | 26 | 310 | ||||||||||||||||
Total commercial lending | $ | 122,468 | $ | 2,346 | $ | 3,436 | $ | 118 | $ | 128,368 | ||||||||||
| (a) | Based upon PDs and LGDs. We apply a split rating classification to certain loans meeting threshold criteria. By assigning a split classification, a loan's exposure amount may be split into more than one classification category in the above table. |
| (b) | Loans are included above based on the Regulatory Classification definitions of "Pass", "Special Mention", "Substandard" and "Doubtful". |
| (c) | Special Mention rated loans have a potential weakness that deserves management's close attention. If left uncorrected, these potential weaknesses may result in deterioration of repayment prospects at some future date. These loans do not expose us to sufficient risk to warrant a more adverse classification at this time. |
| (d) | Substandard rated loans have a well-defined weakness or weaknesses that jeopardize the collection or liquidation of debt. They are characterized by the distinct possibility that we will sustain some loss if the deficiencies are not corrected. |
| (e) | Doubtful rated loans possess all the inherent weaknesses of a Substandard loan with the additional characteristics that the weakness makes collection or liquidation in full improbable due to existing facts, conditions, and values. |
Consumer Lending Asset Classes
Home Equity and Residential Real Estate Loan Classes
We use several credit quality indicators, including delinquency information, nonperforming loan information, updated credit scores, originated and updated LTV ratios, and geography, to monitor and manage credit risk within the home equity and residential real estate loan classes. We evaluate mortgage loan performance by source originators and loan servicers. A summary of asset quality indicators follows:
Delinquency/Delinquency Rates : We monitor trending of delinquency/delinquency rates for home equity and residential real estate loans. See the Asset Quality section of this Note 3 for additional information.
Nonperforming Loans : We monitor trending of nonperforming loans for home equity and residential real estate loans. See the Asset Quality section of this Note 3 for additional information.
Credit Scores : We use a national third-party provider to update FICO credit scores for home equity loans and lines of credit and residential real estate loans at least quarterly. The updated scores are incorporated into a series of credit management reports, which are utilized to monitor the risk in the loan classes.
LTV (inclusive of combined loan-to-value (CLTV) for first and subordinate lien positions) : At least annually, we update the property values of real estate collateral and calculate an
updated LTV ratio. For open-end credit lines secured by real estate in regions experiencing significant declines in property values, more frequent valuations may occur. We examine LTV migration and stratify LTV into categories to monitor the risk in the loan classes.
Historically, we used, and we continue to use, a combination of original LTV and updated LTV for internal risk management and reporting purposes ( e.g. , line management, loss mitigation strategies). In addition to the fact that estimated property values by their nature are estimates, given certain data limitations it is important to note that updated LTVs may be based upon management's assumptions ( e.g. , if an updated LTV is not provided by the third-party service provider, home price index (HPI) changes will be incorporated in arriving at management's estimate of updated LTV).
Geography : Geographic concentrations are monitored to evaluate and manage exposures. Loan purchase programs are sensitive to, and focused within, certain regions to manage geographic exposures and associated risks.
A combination of updated FICO scores, originated and updated LTV ratios and geographic location assigned to home equity loans and lines of credit and residential real estate loans is used to monitor the risk in the loan classes. Loans with higher FICO scores and lower LTVs tend to have a lower level of risk. Conversely, loans with lower FICO scores, higher LTVs, and in certain geographic locations tend to have a higher level of risk.
| 130 The PNC Financial Services Group, Inc. – Form 10-K |
Consumer Purchased Impaired Loan Class
Estimates of the expected cash flows primarily determine the valuation of consumer purchased impaired loans. Consumer cash flow estimates are influenced by a number of credit related items, which include, but are not limited to: estimated real estate values, payment patterns, updated FICO scores, the current economic environment, updated LTV ratios and the date of origination. These key factors are monitored to help ensure that concentrations of risk are managed and cash flows are maximized.
See Note 4 Purchased Loans for additional information.
Table 57: Home Equity and Residential Real Estate Balances
| In millions | December 31 2015 | December 31 2014 | ||||||
Home equity and residential real estate loans – excluding purchased impaired loans (a) | $ | 42,268 | $ | 43,348 | ||||
Home equity and residential real estate loans – purchased impaired loans (b) | 3,684 | 4,541 | ||||||
Government insured or guaranteed residential real estate mortgages (a) | 923 | 1,188 | ||||||
Difference between outstanding balance and recorded investment in purchased impaired loans (c) | (331 | ) | 7 | |||||
Total home equity and residential real estate loans (a) | $ | 46,544 | $ | 49,084 | ||||
| (a) | Represents recorded investment. |
| (b) | Represents outstanding balance. |
| (c) | The December 31, 2015 amount was impacted by the change in derecognition policy for purchased impaired pooled consumer and residential real estate loans. See Note 4 Purchased Loans for additional information. |
Table 58: Home Equity and Residential Real Estate Asset Quality Indicators – Excluding Purchased Impaired Loans (a) (b)
| Home Equity | Residential Real Estate | |||||||||||||||
| December 31, 2015 – in millions | 1st Liens | 2nd Liens | Total | |||||||||||||
Current estimated LTV ratios (c) | ||||||||||||||||
Greater than or equal to 125% and updated FICO scores: | ||||||||||||||||
Greater than 660 | $ | 283 | $ | 960 | $ | 284 | $ | 1,527 | ||||||||
Less than or equal to 660 (d) (e) | 40 | 189 | 68 | 297 | ||||||||||||
Missing FICO | 1 | 8 | 5 | 14 | ||||||||||||
Greater than or equal to 100% to less than 125% and updated FICO scores: | ||||||||||||||||
Greater than 660 | 646 | 1,733 | 564 | 2,943 | ||||||||||||
Less than or equal to 660 (d) (e) | 92 | 302 | 102 | 496 | ||||||||||||
Missing FICO | 3 | 4 | 8 | 15 | ||||||||||||
Greater than or equal to 90% to less than 100% and updated FICO scores: | ||||||||||||||||
Greater than 660 | 698 | 1,492 | 615 | 2,805 | ||||||||||||
Less than or equal to 660 | 88 | 226 | 94 | 408 | ||||||||||||
Missing FICO | 1 | 3 | 10 | 14 | ||||||||||||
Less than 90% and updated FICO scores: | ||||||||||||||||
Greater than 660 | 13,895 | 7,808 | 9,117 | 30,820 | ||||||||||||
Less than or equal to 660 | 1,282 | 923 | 570 | 2,775 | ||||||||||||
Missing FICO | 31 | 18 | 105 | 154 | ||||||||||||
Total home equity and residential real estate loans | $ | 17,060 | $ | 13,666 | $ | 11,542 | $ | 42,268 | ||||||||
(continued on following page)
| The PNC Financial Services Group, Inc. – Form 10-K 131 |
(continued from previous page)
| Home Equity | Residential Real Estate | |||||||||||||||
| December 31, 2014 – in millions | 1st Liens | 2nd Liens | Total | |||||||||||||
Current estimated LTV ratios (c) | ||||||||||||||||
Greater than or equal to 125% and updated FICO scores: | ||||||||||||||||
Greater than 660 | $ | 333 | $ | 1,399 | $ | 360 | $ | 2,092 | ||||||||
Less than or equal to 660 (d) (e) | 57 | 273 | 92 | 422 | ||||||||||||
Missing FICO | 1 | 9 | 8 | 18 | ||||||||||||
Greater than or equal to 100% to less than 125% and updated FICO scores: | ||||||||||||||||
Greater than 660 | 839 | 2,190 | 772 | 3,801 | ||||||||||||
Less than or equal to 660 (d) (e) | 118 | 383 | 153 | 654 | ||||||||||||
Missing FICO | 1 | 5 | 12 | 18 | ||||||||||||
Greater than or equal to 90% to less than 100% and updated FICO scores: | ||||||||||||||||
Greater than 660 | 891 | 1,703 | 755 | 3,349 | ||||||||||||
Less than or equal to 660 | 103 | 271 | 118 | 492 | ||||||||||||
Missing FICO | 2 | 3 | 5 | 10 | ||||||||||||
Less than 90% and updated FICO scores: | ||||||||||||||||
Greater than 660 | 13,878 | 7,874 | 7,703 | 29,455 | ||||||||||||
Less than or equal to 660 | 1,319 | 995 | 573 | 2,887 | ||||||||||||
Missing FICO | 27 | 14 | 109 | 150 | ||||||||||||
Total home equity and residential real estate loans | $ | 17,569 | $ | 15,119 | $ | 10,660 | $ | 43,348 | ||||||||
| (a) | Excludes purchased impaired loans of approximately $3.4 billion and $4.5 billion in recorded investment, certain government insured or guaranteed residential real estate mortgages of approximately $0.9 billion and $1.2 billion, and loans held for sale at December 31, 2015 and December 31, 2014, respectively. See the Home Equity and Residential Real Estate Asset Quality Indicators – Purchased Impaired Loans table below for additional information on purchased impaired loans. |
| (b) | Amounts shown represent recorded investment. |
| (c) | Based upon updated LTV (inclusive of combined loan-to-value (CLTV) for first and subordinate lien positions). Updated LTV is estimated using modeled property values. These ratios are updated at least semi-annually. The related estimates and inputs are based upon an approach that uses a combination of third-party automated valuation models (AVMs), broker price opinions (BPOs), HPI indices, property location, internal and external balance information, origination data and management assumptions. We generally utilize origination lien balances provided by a third-party, where applicable, which do not include an amortization assumption when calculating updated LTV. Accordingly, the results of these calculations do not represent actual appraised loan level collateral or updated LTV based upon lien balances held by others, and as such, are necessarily imprecise and subject to change as we enhance our methodology. |
| (d) | Higher risk loans are defined as loans with both an updated FICO score of less than or equal to 660 and an updated LTV greater than or equal to 100%. |
| (e) | The following states had the highest percentage of higher risk loans at December 31, 2015: New Jersey 14%, Pennsylvania 12%, Illinois 11%, Ohio 11%, Florida 7%, Maryland 7% and Michigan 5%. The remainder of the states had lower than 4% of the higher risk loans individually, and collectively they represent approximately 33% of the higher risk loans. The following states had the highest percentage of higher risk loans at December 31, 2014: New Jersey 14%, Pennsylvania 12%, Illinois 12%, Ohio 12%, Florida 8%, Maryland 6%, Michigan 5%, and North Carolina 4%. The remainder of the states had lower than 4% of the high risk loans individually, and collectively they represent approximately 28% of the higher risk loans. |
| 132 The PNC Financial Services Group, Inc. – Form 10-K |
Table 59: Home Equity and Residential Real Estate Asset Quality Indicators – Purchased Impaired Loans (a)
| Home Equity (b) (c) | Residential Real Estate (b) (c) | |||||||||||||||
| December 31, 2015 – in millions | 1st Liens | 2nd Liens | Total | |||||||||||||
Current estimated LTV ratios (d) | ||||||||||||||||
Greater than or equal to 125% and updated FICO scores: | ||||||||||||||||
Greater than 660 | $ | 6 | $ | 164 | $ | 147 | $ | 317 | ||||||||
Less than or equal to 660 | 6 | 79 | 76 | 161 | ||||||||||||
Missing FICO | 7 | 5 | 12 | |||||||||||||
Greater than or equal to 100% to less than 125% and updated FICO scores: | ||||||||||||||||
Greater than 660 | 12 | 331 | 186 | 529 | ||||||||||||
Less than or equal to 660 | 9 | 145 | 118 | 272 | ||||||||||||
Missing FICO | 8 | 7 | 15 | |||||||||||||
Greater than or equal to 90% to less than 100% and updated FICO scores: | ||||||||||||||||
Greater than 660 | 10 | 167 | 133 | 310 | ||||||||||||
Less than or equal to 660 | 6 | 75 | 68 | 149 | ||||||||||||
Missing FICO | 4 | 3 | 7 | |||||||||||||
Less than 90% and updated FICO scores: | ||||||||||||||||
Greater than 660 | 106 | 345 | 665 | 1,116 | ||||||||||||
Less than or equal to 660 | 91 | 182 | 455 | 728 | ||||||||||||
Missing FICO | 1 | 13 | 31 | 45 | ||||||||||||
Missing LTV and updated FICO scores: | ||||||||||||||||
Greater than 660 | 1 | 14 | 15 | |||||||||||||
Less than or equal to 660 | 1 | 6 | 7 | |||||||||||||
Missing FICO | 1 | 1 | ||||||||||||||
Total home equity and residential real estate loans | $ | 249 | $ | 1,520 | $ | 1,915 | $ | 3,684 | ||||||||
(continued on following page)
| The PNC Financial Services Group, Inc. – Form 10-K 133 |
(continued from previous page)
| Home Equity (b) (c ) | Residential Real Estate (b) (c) | |||||||||||||||
| December 31, 2014 – in millions | 1st Liens | 2nd Liens | Total | |||||||||||||
Current estimated LTV ratios (d) | ||||||||||||||||
Greater than or equal to 125% and updated FICO scores: | ||||||||||||||||
Greater than 660 | $ | 8 | $ | 243 | $ | 276 | $ | 527 | ||||||||
Less than or equal to 660 | 9 | 125 | 144 | 278 | ||||||||||||
Missing FICO | 8 | 6 | 14 | |||||||||||||
Greater than or equal to 100% to less than 125% and updated FICO scores: | ||||||||||||||||
Greater than 660 | 15 | 426 | 272 | 713 | ||||||||||||
Less than or equal to 660 | 12 | 194 | 200 | 406 | ||||||||||||
Missing FICO | 11 | 5 | 16 | |||||||||||||
Greater than or equal to 90% to less than 100% and updated FICO scores: | ||||||||||||||||
Greater than 660 | 12 | 207 | 186 | 405 | ||||||||||||
Less than or equal to 660 | 9 | 93 | 123 | 225 | ||||||||||||
Missing FICO | 5 | 3 | 8 | |||||||||||||
Less than 90% and updated FICO scores: | ||||||||||||||||
Greater than 660 | 102 | 339 | 626 | 1,067 | ||||||||||||
Less than or equal to 660 | 109 | 200 | 515 | 824 | ||||||||||||
Missing FICO | 1 | 12 | 15 | 28 | ||||||||||||
Missing LTV and updated FICO scores: | ||||||||||||||||
Greater than 660 | 1 | 14 | 15 | |||||||||||||
Less than or equal to 660 | 4 | 10 | 14 | |||||||||||||
Missing FICO | 1 | 1 | ||||||||||||||
Total home equity and residential real estate loans | $ | 282 | $ | 1,863 | $ | 2,396 | $ | 4,541 | ||||||||
| (a) | Amounts shown represent outstanding balance. See Note 4 Purchased Loans for additional information. |
| (b) | For the estimate of cash flows utilized in our purchased impaired loan accounting, other assumptions and estimates are made, including amortization of first lien balances, pre-payment rates, etc., which are not reflected in this table. |
| (c) | The following states had the highest percentage of purchased impaired loans at December 31, 2015: California 16%, Florida 14%, Illinois 11%, Ohio 9%, North Carolina 7%, and Michigan 5%. The remainder of the states had lower than a 4% concentration of purchased impaired loans individually, and collectively they represent approximately 38% of the purchased impaired portfolio. The following states had the highest percentage of purchased impaired loans at December 31, 2014: California 17%, Florida 15%, Illinois 11%, Ohio 8%, North Carolina 7% and Michigan 5%. The remainder of the states had lower than a 4% concentration of purchased impaired loans individually, and collectively they represent approximately 37% of the purchased impaired portfolio. |
| (d) | Based upon updated LTV (inclusive of combined loan-to-value (CLTV) for first and subordinate lien positions). Updated LTV is estimated using modeled property values. These ratios are updated at least semi-annually. The related estimates and inputs are based upon an approach that uses a combination of third-party automated valuation models (AVMs), broker price opinions (BPOs), HPI indices, property location, internal and external balance information, origination data and management assumptions. We generally utilize origination lien balances provided by a third-party, where applicable, which do not include an amortization assumption when calculating updated LTV. Accordingly, the results of these calculations do not represent actual appraised loan level collateral or updated LTV based upon lien balances held by others, and as such, are necessarily imprecise and subject to change as we enhance our methodology. |
| 134 The PNC Financial Services Group, Inc. – Form 10-K |
Credit Card and Other Consumer Loan Classes
We monitor a variety of asset quality information in the management of the credit card and other consumer loan classes. Other consumer loan classes include education, automobile, and other secured and unsecured lines and loans. Along with the trending of delinquencies and losses for each class, FICO credit score updates are generally obtained monthly, as well as a variety of credit bureau attributes. Loans with high FICO scores tend to have a lower likelihood of loss. Conversely, loans with low FICO scores tend to have a higher likelihood of loss.
Table 60: Credit Card and Other Consumer Loan Classes Asset Quality Indicators
| Credit Card (a) | Other Consumer (b) | |||||||||||||||
| Dollars in millions | Amount | % of Total Loans Using FICO Credit Metric | Amount | % of Total Loans Using FICO Credit Metric | ||||||||||||
December 31, 2015 | ||||||||||||||||
FICO score greater than 719 | $ | 2,936 | 60 | % | $ | 9,371 | 65 | % | ||||||||
650 to 719 | 1,346 | 28 | 3,534 | 24 | ||||||||||||
620 to 649 | 202 | 4 | 523 | 4 | ||||||||||||
Less than 620 | 227 | 5 | 604 | 4 | ||||||||||||
No FICO score available or required (c) | 151 | 3 | 501 | 3 | ||||||||||||
Total loans using FICO credit metric | 4,862 | 100 | % | 14,533 | 100 | % | ||||||||||
Consumer loans using other internal credit metrics (b) | 7,213 | |||||||||||||||
Total loan balance | $ | 4,862 | $ | 21,746 | ||||||||||||
Weighted-average updated FICO score (d) | 734 | 744 | ||||||||||||||
December 31, 2014 | ||||||||||||||||
FICO score greater than 719 | $ | 2,717 | 59 | % | $ | 9,156 | 64 | % | ||||||||
650 to 719 | 1,288 | 28 | 3,459 | 24 | ||||||||||||
620 to 649 | 203 | 4 | 528 | 4 | ||||||||||||
Less than 620 | 239 | 5 | 619 | 4 | ||||||||||||
No FICO score available or required (c) | 165 | 4 | 557 | 4 | ||||||||||||
Total loans using FICO credit metric | 4,612 | 100 | % | 14,319 | 100 | % | ||||||||||
Consumer loans using other internal credit metrics (b) | 8,434 | |||||||||||||||
Total loan balance | $ | 4,612 | $ | 22,753 | ||||||||||||
Weighted-average updated FICO score (d) | 732 | 744 | ||||||||||||||
| (a) | At December 31, 2015, we had $34 million of credit card loans that are higher risk (i.e., loans with both updated FICO scores less than 660 and in late stage (90+ days) delinquency status). The majority of the December 31, 2015 balance related to higher risk credit card loans was geographically distributed throughout the following areas: Ohio 17%, Pennsylvania 15%, Michigan 8%, New Jersey 8%, Florida 7%, Illinois 6%, Indiana 6%, Maryland 4% and North Carolina 4%. All other states had less than 4% individually and make up the remainder of the balance. At December 31, 2014, we had $35 million of credit card loans that are higher risk. The majority of the December 31, 2014 balance related to higher risk credit card loans was geographically distributed throughout the following areas: Ohio 17%, Pennsylvania 16%, Michigan 9%, Illinois 7%, New Jersey 7%, Indiana 6%, Florida 6% and North Carolina 4%. All other states had less than 4% individually and make up the remainder of the balance. |
| (b) | Other consumer loans for which updated FICO scores are used as an asset quality indicator include non-government guaranteed or insured education loans, automobile loans and other secured and unsecured lines and loans. Other consumer loans for which other internal credit metrics are used as an asset quality indicator include primarily government guaranteed or insured education loans, as well as consumer loans to high net worth individuals. Other internal credit metrics may include delinquency status, geography or other factors. |
| (c) | Credit card loans and other consumer loans with no FICO score available or required generally refers to new accounts issued to borrowers with limited credit history, accounts for which we cannot obtain an updated FICO score (e.g., recent profile changes), cards issued with a business name, and/or cards secured by collateral. Management proactively assesses the risk and size of this loan portfolio and, when necessary, takes actions to mitigate the credit risk. |
| (d) | Weighted-average updated FICO score excludes accounts with no FICO score available or required. |
| The PNC Financial Services Group, Inc. – Form 10-K 135 |
Troubled Debt Restructurings (TDRs)
A TDR is a loan whose terms have been restructured in a manner that grants a concession to a borrower experiencing financial difficulty. TDRs result from our loss mitigation activities, and include rate reductions, principal forgiveness, postponement/reduction of scheduled amortization, and extensions, which are intended to minimize economic loss and to avoid foreclosure or repossession of collateral. Additionally, TDRs also result from borrowers that have been discharged from personal liability through Chapter 7 bankruptcy and have not formally reaffirmed their loan obligations to PNC. In those situations where principal is forgiven, the amount of such principal forgiveness is immediately charged off.
Some TDRs may not ultimately result in the full collection of principal and interest, as restructured, and result in potential incremental losses. These potential incremental losses have been factored into our overall ALLL estimate. The level of any subsequent defaults will likely be affected by future economic conditions. Once a loan becomes a TDR, it will continue to be reported as a TDR until it is ultimately repaid in full, the collateral is foreclosed upon, or it is fully charged off. We held specific reserves in the ALLL of $.3 billion and $.4 billion at December 31, 2015 and December 31, 2014, respectively, for the total TDR portfolio.
Table 61: Summary of Troubled Debt Restructurings
| In millions | December 31 2015 | December 31 2014 | ||||||
Total consumer lending | $ | 1,917 | $ | 2,041 | ||||
Total commercial lending | 434 | 542 | ||||||
Total TDRs | $ | 2,351 | $ | 2,583 | ||||
Nonperforming | $ | 1,119 | $ | 1,370 | ||||
Accruing (a) | 1,232 | 1,213 | ||||||
Total TDRs | $ | 2,351 | $ | 2,583 | ||||
| (a) | Accruing loans include consumer credit card loans and loans that have demonstrated a period of at least six months of performance under the restructured terms and are excluded from nonperforming loans. Loans where borrowers have been discharged from personal liability through Chapter 7 bankruptcy and have not formally reaffirmed their loan obligations to PNC and loans to borrowers not currently obligated to make both principal and interest payments under the restructured terms are not returned to accrual status. |
Table 62 quantifies the number of loans that were classified as TDRs as well as the change in the recorded investments as a result of the TDR classification during the years 2015, 2014 and 2013 respectively. Additionally, the table provides information about the types of TDR concessions. The Principal Forgiveness TDR category includes principal forgiveness and accrued interest forgiveness. These types of TDRs result in a write down of the recorded investment and a charge-off if such action has not already taken place. The Rate Reduction TDR category includes reduced interest rate and interest deferral. The TDRs within this category result in reductions to future interest income. The Other TDR category primarily includes consumer borrowers that have been discharged from personal liability through Chapter 7 bankruptcy and have not formally reaffirmed their loan obligations to PNC, as well as postponement/reduction of scheduled amortization and contractual extensions for both consumer and commercial borrowers.
In some cases, there have been multiple concessions granted on one loan. This is most common within the commercial loan portfolio. When there have been multiple concessions granted in the commercial loan portfolio, the principal forgiveness concession was prioritized for purposes of determining the inclusion in Table 62. For example, if there is principal forgiveness in conjunction with lower interest rate and postponement of amortization, the type of concession will be reported as Principal Forgiveness. Second in priority would be rate reduction. For example, if there is an interest rate reduction in conjunction with postponement of amortization, the type of concession will be reported as a Rate Reduction. In the event that multiple concessions are granted on a consumer loan, concessions resulting from discharge from personal liability through Chapter 7 bankruptcy without formal affirmation of the loan obligations to PNC would be prioritized and included in the Other type of concession in the table below. After that, consumer loan concessions would follow the previously discussed priority of concessions for the commercial loan portfolio.
| 136 The PNC Financial Services Group, Inc. – Form 10-K |
Table 62: Financial Impact and TDRs by Concession Type (a)
Number of Loans | Pre-TDR Recorded | Post-TDR Recorded Investment (c) | ||||||||||||||||||||||
During the year ended December 31, 2015 Dollars in millions | Principal Forgiveness | Rate Reduction | Other | Total | ||||||||||||||||||||
Commercial lending | ||||||||||||||||||||||||
Commercial | 130 | $ | 246 | $ | 15 | $ | 3 | $ | 186 | $ | 204 | |||||||||||||
Commercial real estate | 27 | 37 | 6 | 1 | 12 | 19 | ||||||||||||||||||
Equipment lease financing | 1 | 1 | 1 | 1 | ||||||||||||||||||||
Total commercial lending | 158 | 284 | 22 | 4 | 198 | 224 | ||||||||||||||||||
Consumer lending | ||||||||||||||||||||||||
Home equity | 2,890 | 182 | 100 | 73 | 173 | |||||||||||||||||||
Residential real estate | 530 | 61 | 36 | 25 | 61 | |||||||||||||||||||
Credit card | 6,549 | 53 | 52 | 52 | ||||||||||||||||||||
Other consumer | 993 | 15 | 2 | 8 | 10 | |||||||||||||||||||
Total consumer lending | 10,962 | 311 | 190 | 106 | 296 | |||||||||||||||||||
Total TDRs | 11,120 | $ | 595 | $ | 22 | $ | 194 | $ | 304 | $ | 520 | |||||||||||||
During the year ended December 31, 2014 Dollars in millions | ||||||||||||||||||||||||
Commercial lending | ||||||||||||||||||||||||
Commercial | 131 | $ | 192 | $ | 10 | $ | 11 | $ | 137 | $ | 158 | |||||||||||||
Commercial real estate | 79 | 171 | 27 | 11 | 100 | 138 | ||||||||||||||||||
Total commercial lending (d) | 210 | 363 | 37 | 22 | 237 | 296 | ||||||||||||||||||
Consumer lending | ||||||||||||||||||||||||
Home equity | 2,950 | 193 | 51 | 132 | 183 | |||||||||||||||||||
Residential real estate | 527 | 73 | 26 | 45 | 71 | |||||||||||||||||||
Credit card | 7,720 | 60 | 57 | 57 | ||||||||||||||||||||
Other consumer | 1,092 | 18 | 1 | 13 | 14 | |||||||||||||||||||
Total consumer lending | 12,289 | 344 | 135 | 190 | 325 | |||||||||||||||||||
Total TDRs | 12,499 | $ | 707 | $ | 37 | $ | 157 | $ | 427 | $ | 621 | |||||||||||||
During the year ended December 31, 2013 Dollars in millions | ||||||||||||||||||||||||
Commercial lending | ||||||||||||||||||||||||
Commercial | 168 | $ | 216 | $ | 10 | $ | 21 | $ | 132 | $ | 163 | |||||||||||||
Commercial real estate | 116 | 284 | 28 | 51 | 144 | 223 | ||||||||||||||||||
Equipment lease financing | 1 | 3 | ||||||||||||||||||||||
Total commercial lending | 285 | 503 | 38 | 72 | 276 | 386 | ||||||||||||||||||
Consumer lending | ||||||||||||||||||||||||
Home equity | 4,132 | 289 | 139 | 126 | 265 | |||||||||||||||||||
Residential real estate | 911 | 127 | 39 | 86 | 125 | |||||||||||||||||||
Credit card | 8,397 | 64 | 61 | 61 | ||||||||||||||||||||
Other consumer | 1,379 | 22 | 1 | 19 | 20 | |||||||||||||||||||
Total consumer lending | 14,819 | 502 | 240 | 231 | 471 | |||||||||||||||||||
Total TDRs | 15,104 | $ | 1,005 | $ | 38 | $ | 312 | $ | 507 | $ | 857 | |||||||||||||
| (a) | Impact of partial charge-offs at TDR date are included in this table. |
| (b) | Represents the recorded investment of the loans as of the quarter end prior to TDR designation, and excludes immaterial amounts of accrued interest receivable. |
| (c) | Represents the recorded investment of the TDRs as of the end of the quarter in which the TDR occurs, and excludes immaterial amounts of accrued interest receivable. |
| (d) | During the twelve months ended December 31, 2014, there were no loans classified as TDRs in the Equipment lease financing loan class. |
| The PNC Financial Services Group, Inc. – Form 10-K 137 |
TDRs may result in charge-offs and interest income not being recognized. The amount of principal balance charged off at or around the time of modification for the twelve months ended December 31, 2015 was not material. A financial effect of rate reduction TDRs is that interest income is not recognized for the difference between the original contractual interest rate terms and the restructured terms. Interest income not recognized that otherwise would have been earned in the twelve months ended December 31, 2015 and 2014, related to all commercial TDRs and consumer TDRs, was not material.
After a loan is determined to be a TDR, we continue to track its performance under its most recent restructured terms. In Table 63, we consider a TDR to have subsequently defaulted when it becomes 60 days past due after the most recent date the loan was restructured. The following table presents the recorded investment of loans that both (i) were classified as TDRs or were subsequently modified during each 12-month period preceding January 1, 2015, 2014, and 2013 respectively, and (ii) subsequently defaulted during these reporting periods.
Table 63: TDRs that were Modified in the Past Twelve Months which have Subsequently Defaulted
During the year ended December 31, 2015 Dollars in millions | Number of Contracts | Recorded Investment | ||||||
Commercial lending | ||||||||
Commercial | 23 | $ | 9 | |||||
Commercial real estate | 13 | 13 | ||||||
Equipment lease financing | 1 | 1 | ||||||
Total commercial lending | 37 | 23 | ||||||
Consumer lending | ||||||||
Home equity | 458 | 26 | ||||||
Residential real estate | 150 | 22 | ||||||
Credit card | 3,045 | 24 | ||||||
Other consumer | 167 | 1 | ||||||
Total consumer lending | 3,820 | 73 | ||||||
Total TDRs | 3,857 | $ | 96 | |||||
During the year ended December 31, 2014 Dollars in millions | Number of Contracts | Recorded Investment | ||||||
Commercial lending | ||||||||
Commercial | 38 | $ | 26 | |||||
Commercial real estate | 43 | 80 | ||||||
Total commercial lending (a) | 81 | 106 | ||||||
Consumer lending | ||||||||
Home equity | 400 | 21 | ||||||
Residential real estate | 155 | 24 | ||||||
Credit card | 3,397 | 27 | ||||||
Other consumer | 132 | 1 | ||||||
Total consumer lending | 4,084 | 73 | ||||||
Total TDRs | 4,165 | $ | 179 | |||||
During the year ended December 31, 2013 Dollars in millions | Number of Contracts | Recorded Investment | ||||||
Commercial lending | ||||||||
Commercial | 67 | $ | 47 | |||||
Commercial real estate | 38 | 59 | ||||||
Total commercial lending (a) | 105 | 106 | ||||||
Consumer lending | ||||||||
Home equity | 592 | 39 | ||||||
Residential real estate | 255 | 35 | ||||||
Credit card | 4,598 | 34 | ||||||
Other consumer | 249 | 4 | ||||||
Total consumer lending | 5,694 | 112 | ||||||
Total TDRs | 5,799 | $ | 218 | |||||
| (a) | During the twelve months ended December 31, 2014 and 2013, there were no loans classified as TDRs in the Equipment lease financing loan class that have subsequently defaulted. |
The impact to the ALLL for commercial lending TDRs is the effect of moving to the specific reserve methodology from the quantitative reserve methodology, for those loans that were not already classified as nonaccrual. There is generally an impact to the ALLL as a result of the concession made, which generally results in a reduction of expected future cash flows. The decline in expected future cash flows, consideration of collateral value, and/or the application of a present value discount rate, when compared to the recorded investment, results in either an increased ALLL or a charge-off. As TDRs are individually evaluated under the specific reserve methodology, which builds in expectations of future performance, subsequent defaults generally do not significantly impact the ALLL.
For consumer lending TDRs, except TDRs resulting from borrowers that have been discharged from personal liability through Chapter 7 bankruptcy and have not formally reaffirmed their loan obligations to PNC as discussed in Note 1 Accounting Policies under the Allowance for Loans and Lease Losses section, the ALLL is calculated using a discounted cash flow model, which leverages subsequent default, prepayment, and severity rate assumptions based upon historically observed data. Similar to the commercial lending specific reserve methodology, the reduced expected cash flows resulting from the concessions granted impact the consumer lending ALLL. The decline in expected cash flows due to the application of a present value discount rate or the consideration of collateral value, when compared to the recorded investment, results in either an increased ALLL or a charge-off. Loans where a borrower has been discharged from personal liability in bankruptcy and has not formally reaffirmed its loan obligation to PNC are charged off to collateral value less costs to sell, and any associated allowance at the time of charge-off is reduced to zero.
| 138 The PNC Financial Services Group, Inc. – Form 10-K |
Impaired Loans
Impaired loans include commercial nonperforming loans and consumer and commercial TDRs, regardless of nonperforming status. TDRs that were previously recorded at amortized cost and are now classified and accounted for as held for sale are also included. Excluded from impaired loans are nonperforming leases, loans accounted for as held for sale other than the TDRs described in the preceding sentence, loans accounted for under the fair value option, smaller balance homogeneous type loans and purchased impaired loans. See Note 4 Purchased Loans for additional information. Nonperforming equipment lease financing loans of $7 million and $2 million at December 31, 2015 and 2014, respectively, are excluded from impaired loans pursuant to authoritative lease accounting guidance. We did not recognize any interest income on impaired loans that have not returned to performing status, while they were impaired during the years ended December 31, 2015 and 2014. The following table provides further detail on impaired loans individually evaluated for impairment and the associated ALLL. Certain commercial and consumer impaired loans do not have a related ALLL as the valuation of these impaired loans exceeded the recorded investment.
Table 64: Impaired Loans
| In millions | Unpaid Principal Balance | Recorded Investment | Associated Allowance (a) | Average Recorded Investment (b) | ||||||||||||
December 31, 2015 | ||||||||||||||||
Impaired loans with an associated allowance | ||||||||||||||||
Commercial | $ | 442 | $ | 337 | $ | 84 | $ | 306 | ||||||||
Commercial real estate | 254 | 130 | 35 | 197 | ||||||||||||
Home equity | 978 | 909 | 216 | 965 | ||||||||||||
Residential real estate | 272 | 264 | 35 | 359 | ||||||||||||
Credit card | 108 | 108 | 24 | 118 | ||||||||||||
Other consumer | 31 | 26 | 1 | 32 | ||||||||||||
Total impaired loans with an associated allowance | $ | 2,085 | $ | 1,774 | $ | 395 | $ | 1,977 | ||||||||
Impaired loans without an associated allowance | ||||||||||||||||
Commercial | $ | 201 | $ | 118 | $ | 87 | ||||||||||
Commercial real estate | 206 | 158 | 168 | |||||||||||||
Home equity | 464 | 206 | 158 | |||||||||||||
Residential real estate | 512 | 396 | 346 | |||||||||||||
Other consumer | 24 | 8 | 8 | |||||||||||||
Total impaired loans without an associated allowance | $ | 1,407 | $ | 886 | $ | 767 | ||||||||||
Total impaired loans | $ | 3,492 | $ | 2,660 | $ | 395 | $ | 2,744 | ||||||||
December 31, 2014 | ||||||||||||||||
Impaired loans with an associated allowance | ||||||||||||||||
Commercial | $ | 432 | $ | 318 | $ | 74 | $ | 360 | ||||||||
Commercial real estate | 418 | 262 | 65 | 283 | ||||||||||||
Home equity | 1,021 | 984 | 215 | 986 | ||||||||||||
Residential real estate | 397 | 420 | 75 | 422 | ||||||||||||
Credit card | 130 | 130 | 32 | 147 | ||||||||||||
Other consumer | 64 | 47 | 2 | 51 | ||||||||||||
Total impaired loans with an associated allowance | $ | 2,462 | $ | 2,161 | $ | 463 | $ | 2,249 | ||||||||
Impaired loans without an associated allowance | ||||||||||||||||
Commercial | $ | 106 | $ | 84 | $ | 133 | ||||||||||
Commercial real estate | 249 | 187 | 276 | |||||||||||||
Home equity | 403 | 145 | 134 | |||||||||||||
Residential real estate | 344 | 315 | 365 | |||||||||||||
Total impaired loans without an associated allowance | $ | 1,102 | $ | 731 | $ | 908 | ||||||||||
Total impaired loans | $ | 3,564 | $ | 2,892 | $ | 463 | $ | 3,157 | ||||||||
| (a) | Associated allowance amounts include $.3 billion and $.4 billion for TDRs at December 31, 2015 and December 31, 2014, respectively. |
| (b) | Average recorded investment is for the years ended December 31, 2015 and December 31, 2014, respectively. |
| The PNC Financial Services Group, Inc. – Form 10-K 139 |
N OTE 4 P URCHASED L OANS
Purchased Impaired Loans
Purchased impaired loan accounting addresses differences between contractual cash flows and cash flows expected to be collected from the initial investment in loans if those differences are attributable, at least in part, to credit quality. Several factors were considered when evaluating whether a loan was considered a purchased impaired loan, including the delinquency status of the loan, updated borrower credit status, geographic information, and updated LTV. GAAP allows purchasers to account for loans individually or to aggregate purchased impaired loans acquired in the same fiscal quarter into one or more pools, provided that the loans have common risk characteristics. A pool is then accounted for as a single asset with a single composite interest rate and an aggregate expectation of cash flows. Purchased impaired homogeneous consumer, residential real estate and smaller balance commercial loans with common risk characteristics are aggregated into pools where appropriate, whereas commercial loans with a total commitment greater than a defined threshold are accounted for individually. For pooled loans, proceeds of individual loans are not applied individually to each loan within a pool, but to the pool's recorded investment since it is accounted for as a single asset.
Prior to December 31, 2015, upon final disposition of a loan within a pool and for loans that had nominal collateral value/expected cash flows, the loan's carrying value was removed from the pool and any gain or loss associated with the transaction was retained in the pool's recorded investment. Effective December 31, 2015, in anticipation of the end of the life of our purchased impaired pooled consumer and residential real estate loans, and pursuant to supervisory direction, we changed our derecognition policy for these loans such that we will write-off the loan's recorded investment and derecognize the associated ALLL upon final disposition. Gains and losses on such loans will be recognized as either an adjustment to the pool's associated ALLL, or yield, as appropriate. The transition to this new policy on December 31, 2015 resulted in a $468 million derecognition of recorded investment and associated ALLL on such loans. See the discussion below and Note 1 Accounting Policies and Note 5 Allowances for Loan and Lease Losses and Unfunded Loan Commitments and Letters of Credit for additional information.
The following table provides balances of purchased impaired loans at December 31, 2015 and December 31, 2014:
Table 65: Purchased Impaired Loans – Balances
| December 31, 2015 | December 31, 2014 | |||||||||||||||||||||||
| In millions | Outstanding Balance (a) | Recorded Investment | Carrying Value | Outstanding Balance (a) | Recorded Investment | Carrying Value | ||||||||||||||||||
Commercial lending | ||||||||||||||||||||||||
Commercial | $ | 94 | $ | 36 | $ | 24 | $ | 159 | $ | 74 | $ | 57 | ||||||||||||
Commercial real estate | 155 | 133 | 96 | 307 | 236 | 174 | ||||||||||||||||||
Total commercial lending | 249 | 169 | 120 | 466 | 310 | 231 | ||||||||||||||||||
Consumer lending | ||||||||||||||||||||||||
Consumer | 1,769 | 1,407 | 1,392 | 2,145 | 1,989 | 1,661 | ||||||||||||||||||
Residential real estate | 1,915 | 1,946 | 1,700 | 2,396 | 2,559 | 2,094 | ||||||||||||||||||
Total consumer lending | 3,684 | 3,353 | 3,092 | 4,541 | 4,548 | 3,755 | ||||||||||||||||||
Total | $ | 3,933 | $ | 3,522 | $ | 3,212 | $ | 5,007 | $ | 4,858 | $ | 3,986 | ||||||||||||
| (a) | Outstanding balance represents the balance on the loan servicing system. Recorded investment may be greater than the outstanding balance due to expected recoveries of collateral. |
The excess of undiscounted cash flows expected at acquisition over the estimated fair value is referred to as the accretable yield and is recognized as interest income over the remaining life of the loan using the constant effective yield method. The difference between contractually required payments at acquisition and the cash flows expected to be collected at acquisition is referred to as the non-accretable difference and is not recognized in income. Subsequent changes in the expected cash flows of individual or pooled purchased impaired loans will either impact the accretable yield or result in an impairment charge to provision for credit losses in the period in which the changes become probable. Decreases to the net present value of expected cash flows will generally result in an impairment charge recorded as a provision for credit losses, resulting in an increase to the ALLL, and a reclassification from accretable yield to non-accretable difference.
| 140 The PNC Financial Services Group, Inc. – Form 10-K |
During 2015, $82 million of provision recapture was recorded for purchased impaired loans compared to $91 million of provision recapture during 2014. Charge-offs (which were specifically for commercial loans greater than a defined threshold) during 2015 were $12 million compared to $42 million during 2014. At December 31, 2015 and December 31, 2014, the ALLL on total purchased impaired loans was $.3 billion and $.9 billion, respectively. The decline in ALLL was primarily due to the change in our derecognition policy. For purchased impaired loan pools where an allowance has been recognized, subsequent increases in the net present value of cash flows will result in a provision recapture of any previously recorded ALLL to the extent applicable, and/or a reclassification from non-accretable difference to accretable yield, which will be recognized prospectively. Individual loan transactions where final dispositions have occurred (as noted above) result in removal of the loans from their applicable pools for cash flow estimation purposes. The cash flow re-estimation process is completed quarterly to evaluate the appropriateness of the ALLL associated with the purchased impaired loans.
Activity for the accretable yield during 2015 and 2014 follows:
Table 66: Purchased Impaired Loans – Accretable Yield
| In millions | 2015 | 2014 | ||||||
January 1 | $ | 1,558 | $ | 2,055 | ||||
Accretion (including excess cash recoveries) | (466 | ) | (587 | ) | ||||
Net reclassifications to accretable from non-accretable | 226 | 208 | ||||||
Disposals | (68 | ) | (118 | ) | ||||
December 31 | $ | 1,250 | $ | 1,558 | ||||
N OTE 5 A LLOWANCES FOR L OAN AND L EASE L OSSES AND U NFUNDED L OAN C OMMITMENTS AND L ETTERS OF C REDIT
Allowance for Loan and Lease Losses
We maintain the ALLL at levels that we believe to be appropriate to absorb estimated probable credit losses incurred in the portfolios as of the balance sheet date. We use the two main portfolio segments – Commercial Lending and Consumer Lending – and develop and document the ALLL under separate methodologies for each of these segments as discussed in Note 1 Accounting Policies. A rollforward of the ALLL and associated loan data follows.
| The PNC Financial Services Group, Inc. – Form 10-K 141 |
Table 67: Rollforward of Allowance for Loan and Lease Losses and Associated Loan Data
| In millions | Commercial Lending | Consumer Lending | Total | |||||||||
December 31, 2015 | ||||||||||||
Allowance for Loan and Lease Losses | ||||||||||||
January 1 | $ | 1,571 | $ | 1,760 | $ | 3,331 | ||||||
Charge-offs | (255 | ) | (550 | ) | (805 | ) | ||||||
Recoveries | 240 | 179 | 419 | |||||||||
Net (charge-offs) / recoveries | (15 | ) | (371 | ) | (386 | ) | ||||||
Provision for credit losses | 55 | 200 | 255 | |||||||||
Net change in allowance for unfunded loan commitments and letters of credit | (3 | ) | 1 | (2 | ) | |||||||
Write-offs of purchased impaired loans (a) | (468 | ) | (468 | ) | ||||||||
Other | (3 | ) | (3 | ) | ||||||||
December 31 | $ | 1,605 | $ | 1,122 | $ | 2,727 | ||||||
TDRs individually evaluated for impairment | $ | 43 | $ | 276 | $ | 319 | ||||||
Other loans individually evaluated for impairment | 76 | 76 | ||||||||||
Loans collectively evaluated for impairment | 1,437 | 585 | 2,022 | |||||||||
Purchased impaired loans | 49 | 261 | 310 | |||||||||
December 31 | $ | 1,605 | $ | 1,122 | $ | 2,727 | ||||||
Loan Portfolio | ||||||||||||
TDRs individually evaluated for impairment (b) | $ | 434 | $ | 1,917 | $ | 2,351 | ||||||
Other loans individually evaluated for impairment | 309 | 309 | ||||||||||
Loans collectively evaluated for impairment (c) | 132,632 | 66,977 | 199,609 | |||||||||
Fair value option loans (d) | 905 | 905 | ||||||||||
Purchased impaired loans | 169 | 3,353 | 3,522 | |||||||||
December 31 | $ | 133,544 | $ | 73,152 | $ | 206,696 | ||||||
Portfolio segment ALLL as a percentage of total ALLL | 59 | % | 41 | % | 100 | % | ||||||
Ratio of the allowance for loan and lease losses to total loans (a) | 1.20 | % | 1.53 | % | 1.32 | % | ||||||
December 31, 2014 | ||||||||||||
Allowance for Loan and Lease Losses | ||||||||||||
January 1 | $ | 1,547 | $ | 2,062 | $ | 3,609 | ||||||
Charge-offs | (360 | ) | (661 | ) | (1,021 | ) | ||||||
Recoveries | 305 | 185 | 490 | |||||||||
Net charge-offs | (55 | ) | (476 | ) | (531 | ) | ||||||
Provision for credit losses | 100 | 173 | 273 | |||||||||
Net change in allowance for unfunded loan commitments and letters of credit | (18 | ) | 1 | (17 | ) | |||||||
Other | (3 | ) | (3 | ) | ||||||||
December 31 | $ | 1,571 | $ | 1,760 | $ | 3,331 | ||||||
TDRs individually evaluated for impairment | $ | 62 | $ | 324 | $ | 386 | ||||||
Other loans individually evaluated for impairment | 77 | 77 | ||||||||||
Loans collectively evaluated for impairment | 1,353 | 643 | 1,996 | |||||||||
Purchased impaired loans | 79 | 793 | 872 | |||||||||
December 31 | $ | 1,571 | $ | 1,760 | $ | 3,331 | ||||||
Loan Portfolio | ||||||||||||
TDRs individually evaluated for impairment (b) | $ | 542 | $ | 2,041 | $ | 2,583 | ||||||
Other loans individually evaluated for impairment | 309 | 309 | ||||||||||
Loans collectively evaluated for impairment (c) | 127,207 | 68,826 | 196,033 | |||||||||
Fair value option loans (d) | 1,034 | 1,034 | ||||||||||
Purchased impaired loans | 310 | 4,548 | 4,858 | |||||||||
December 31 | $ | 128,368 | $ | 76,449 | $ | 204,817 | ||||||
Portfolio segment ALLL as a percentage of total ALLL | 47 | % | 53 | % | 100 | % | ||||||
Ratio of the allowance for loan and lease losses to total loans | 1.22 | % | 2.30 | % | 1.63 | % | ||||||
| 142 The PNC Financial Services Group, Inc. – Form 10-K |
| In millions | Commercial Lending | Consumer Lending | Total | |||||||||
December 31, 2013 | ||||||||||||
Allowance for Loan and Lease Losses | ||||||||||||
January 1 | $ | 1,774 | $ | 2,262 | $ | 4,036 | ||||||
Charge-offs (e) | (606 | ) | (982 | ) | (1,588 | ) | ||||||
Recoveries | 357 | 154 | 511 | |||||||||
Net charge-offs | (249 | ) | (828 | ) | (1,077 | ) | ||||||
Provision for credit losses | 36 | 607 | 643 | |||||||||
Net change in allowance for unfunded loan commitments and letters of credit | (13 | ) | 21 | 8 | ||||||||
Other | (1 | ) | (1 | ) | ||||||||
December 31 | $ | 1,547 | $ | 2,062 | $ | 3,609 | ||||||
TDRs individually evaluated for impairment | $ | 24 | $ | 446 | $ | 470 | ||||||
Other loans individually evaluated for impairment | 155 | 155 | ||||||||||
Loans collectively evaluated for impairment | 1,235 | 745 | 1,980 | |||||||||
Purchased impaired loans | 133 | 871 | 1,004 | |||||||||
December 31 | $ | 1,547 | $ | 2,062 | $ | 3,609 | ||||||
Loan Portfolio | ||||||||||||
TDRs individually evaluated for impairment (b) | $ | 578 | $ | 2,161 | $ | 2,739 | ||||||
Other loans individually evaluated for impairment | 649 | 649 | ||||||||||
Loans collectively evaluated for impairment (c) | 115,245 | 69,724 | 184,969 | |||||||||
Fair value option loans (d) | 1,150 | 1,150 | ||||||||||
Purchased impaired loans | 673 | 5,433 | 6,106 | |||||||||
December 31 | $ | 117,145 | $ | 78,468 | $ | 195,613 | ||||||
Portfolio segment ALLL as a percentage of total ALLL | 43 | % | 57 | % | 100 | % | ||||||
Ratio of the allowance for loan and lease losses to total loans | 1.32 | % | 2.63 | % | 1.84 | % | ||||||
| (a) | A portion of the ALLL associated with purchased impaired pooled consumer and residential real estate loans was derecognized on December 31, 2015 due to the change in the derecognition policy for these loans. The December 31, 2015 ratio of ALLL to total loans was impacted by the derecognition. See Note 4 Purchased Loans for additional information. |
| (b) | TDRs individually evaluated for impairment exclude TDRs that were subsequently accounted for as held for sale loans, but continue to be disclosed as TDRs. |
| (c) | Includes $150 million of loans collectively evaluated for impairment based upon collateral values and written down to the respective collateral value less costs to sell at December 31, 2015. Accordingly, there is no allowance recorded for these loans. The comparative amounts as of December 31, 2014 and December 31, 2013 were $195 million and $252 million, respectively. |
| (d) | Loans accounted for under the fair value option are not evaluated for impairment as these loans are accounted for at fair value. Accordingly there is no allowance recorded on these loans. |
| (e) | Pursuant to alignment with interagency guidance on practices for loans and lines of credit related to consumer lending in the first quarter of 2013, additional charge-offs of $134 million were taken. |
Net interest income less the provision for credit losses was $8.0 billion for 2015 compared with $8.3 billion for 2014 and $8.5 billion for 2013.
Allowance for Unfunded Loan Commitments and Letters of Credit
We maintain the allowance for unfunded loan commitments and letters of credit at a level we believe is appropriate to absorb estimated probable credit losses incurred on these unfunded credit facilities as of the balance sheet date as discussed in Note 1 Accounting Policies. A rollforward of the allowance is presented below.
Table 68: Rollforward of Allowance for Unfunded Loan Commitments and Letters of Credit
| In millions | 2015 | 2014 | 2013 | |||||||||
January 1 | $ | 259 | $ | 242 | $ | 250 | ||||||
Net change in allowance for unfunded loan commitments and letters of credit | 2 | 17 | (8 | ) | ||||||||
December 31 | $ | 261 | $ | 259 | $ | 242 | ||||||
| The PNC Financial Services Group, Inc. – Form 10-K 143 |
N OTE 6 I NVESTMENT S ECURITIES
Table 69: Investment Securities Summary
Amortized Cost | Unrealized | Fair Value | ||||||||||||||
| In millions | Gains | Losses | ||||||||||||||
December 31, 2015 | ||||||||||||||||
S ECURITIES A VAILABLE FOR S ALE | ||||||||||||||||
Debt securities | ||||||||||||||||
U.S. Treasury and government agencies | $ | 9,764 | $ | 152 | $ | (42 | ) | $ | 9,874 | |||||||
Residential mortgage-backed | ||||||||||||||||
Agency | 24,698 | 250 | (128 | ) | 24,820 | |||||||||||
Non-agency | 3,992 | 247 | (88 | ) | 4,151 | |||||||||||
Commercial mortgage-backed | ||||||||||||||||
Agency | 1,917 | 11 | (10 | ) | 1,918 | |||||||||||
Non-agency | 4,902 | 30 | (29 | ) | 4,903 | |||||||||||
Asset-backed | 5,417 | 54 | (48 | ) | 5,423 | |||||||||||
State and municipal | 1,982 | 79 | (5 | ) | 2,056 | |||||||||||
Other debt | 2,007 | 31 | (12 | ) | 2,026 | |||||||||||
Total debt securities | 54,679 | 854 | (362 | ) | 55,171 | |||||||||||
Corporate stocks and other | 590 | (1 | ) | 589 | ||||||||||||
Total securities available for sale | $ | 55,269 | $ | 854 | $ | (363 | ) | $ | 55,760 | |||||||
S ECURITIES H ELD TO M ATURITY (a) | ||||||||||||||||
Debt securities | ||||||||||||||||
U.S. Treasury and government agencies | $ | 258 | $ | 40 | $ | 298 | ||||||||||
Residential mortgage-backed | ||||||||||||||||
Agency | 9,552 | 101 | $ | (65 | ) | 9,588 | ||||||||||
Non-agency | 233 | 8 | 241 | |||||||||||||
Commercial mortgage-backed | ||||||||||||||||
Agency | 1,128 | 40 | 1,168 | |||||||||||||
Non-agency | 722 | 6 | (1 | ) | 727 | |||||||||||
Asset-backed | 717 | (10 | ) | 707 | ||||||||||||
State and municipal | 1,954 | 116 | 2,070 | |||||||||||||
Other debt | 204 | (1 | ) | 203 | ||||||||||||
Total securities held to maturity | $ | 14,768 | $ | 311 | $ | (77 | ) | $ | 15,002 | |||||||
December 31, 2014 | ||||||||||||||||
S ECURITIES A VAILABLE FOR S ALE | ||||||||||||||||
Debt securities | ||||||||||||||||
U.S. Treasury and government agencies | $ | 5,237 | $ | 186 | $ | (1 | ) | $ | 5,422 | |||||||
Residential mortgage-backed | ||||||||||||||||
Agency | 17,646 | 438 | (41 | ) | 18,043 | |||||||||||
Non-agency | 4,723 | 318 | (99 | ) | 4,942 | |||||||||||
Commercial mortgage-backed | ||||||||||||||||
Agency | 2,178 | 23 | (14 | ) | 2,187 | |||||||||||
Non-agency | 4,085 | 88 | (11 | ) | 4,162 | |||||||||||
Asset-backed | 5,141 | 78 | (32 | ) | 5,187 | |||||||||||
State and municipal | 1,953 | 88 | (3 | ) | 2,038 | |||||||||||
Other debt | 1,776 | 43 | (6 | ) | 1,813 | |||||||||||
Total debt securities | 42,739 | 1,262 | (207 | ) | 43,794 | |||||||||||
Corporate stocks and other | 442 | (1 | ) | 441 | ||||||||||||
Total securities available for sale | $ | 43,181 | $ | 1,262 | $ | (208 | ) | $ | 44,235 | |||||||
S ECURITIES H ELD TO M ATURITY (a) | ||||||||||||||||
Debt securities | ||||||||||||||||
U.S. Treasury and government agencies | $ | 248 | $ | 44 | $ | 292 | ||||||||||
Residential mortgage-backed | ||||||||||||||||
Agency | 5,736 | 166 | $ | (10 | ) | 5,892 | ||||||||||
Non-agency | 270 | 13 | 283 | |||||||||||||
| 144 The PNC Financial Services Group, Inc. – Form 10-K |
Amortized Cost | Unrealized | Fair Value | ||||||||||||||
| In millions | Gains | Losses | ||||||||||||||
Commercial mortgage-backed | ||||||||||||||||
Agency | 1,200 | 53 | 1,253 | |||||||||||||
Non-agency | 1,010 | 19 | 1,029 | |||||||||||||
Asset-backed | 759 | 2 | (8 | ) | 753 | |||||||||||
State and municipal | 2,042 | 111 | 2,153 | |||||||||||||
Other debt | 323 | 6 | 329 | |||||||||||||
Total securities held to maturity | $ | 11,588 | $ | 414 | $ | (18 | ) | $ | 11,984 | |||||||
| (a) | Held to maturity securities transferred from available for sale are recorded in held to maturity at fair value at the time of transfer. The amortized cost of held to maturity securities included net unrealized gains of $97 million and $125 million at December 31, 2015 and December 31, 2014, respectively, related to securities transferred, which are offset in Accumulated Other Comprehensive Income, net of tax. |
The fair value of investment securities is impacted by interest rates, credit spreads, market volatility and liquidity conditions. Net unrealized gains and losses in the securities available for sale portfolio are included in Shareholders' equity as Accumulated other comprehensive income or loss, net of tax, unless credit-related. Securities held to maturity are carried at amortized cost. At December 31, 2015, Accumulated other comprehensive income included pretax gains of $98 million from derivatives that hedged the purchase of investment securities classified as held to maturity. The gains will be accreted into interest income as an adjustment of yield on the securities.
Table 70 presents gross unrealized losses on securities available for sale at December 31, 2015 and December 31, 2014. The securities are segregated between investments that have been in a continuous unrealized loss position for less than twelve months and twelve months or more based on the point in time that the fair value declined below the amortized cost basis. The table includes debt securities where a portion of other-than-temporary impairment (OTTI) has been recognized in Accumulated other comprehensive income (loss). The increase in total unrealized losses at December 31, 2015 when compared to December 31, 2014 was primarily due to higher interest rates.
| The PNC Financial Services Group, Inc. – Form 10-K 145 |
Table 70: Gross Unrealized Loss and Fair Value of Securities Available for Sale
| In millions | Unrealized loss position less than 12 months | Unrealized loss position 12 months or more | Total | |||||||||||||||||||||
| Unrealized Loss | Fair Value | Unrealized Loss | Fair Value | Unrealized Loss | Fair Value | |||||||||||||||||||
December 31, 2015 | ||||||||||||||||||||||||
Debt securities | ||||||||||||||||||||||||
U.S. Treasury and government agencies | $ | (40 | ) | $ | 5,885 | $ | (2 | ) | $ | 120 | $ | (42 | ) | $ | 6,005 | |||||||||
Residential mortgage-backed | ||||||||||||||||||||||||
Agency | (103 | ) | 11,799 | (25 | ) | 1,094 | (128 | ) | 12,893 | |||||||||||||||
Non-agency | (3 | ) | 368 | (85 | ) | 1,527 | (88 | ) | 1,895 | |||||||||||||||
Commercial mortgage-backed | ||||||||||||||||||||||||
Agency | (7 | ) | 745 | (3 | ) | 120 | (10 | ) | 865 | |||||||||||||||
Non-agency | (22 | ) | 2,310 | (7 | ) | 807 | (29 | ) | 3,117 | |||||||||||||||
Asset-backed | (30 | ) | 3,477 | (18 | ) | 494 | (48 | ) | 3,971 | |||||||||||||||
State and municipal | (3 | ) | 326 | (2 | ) | 60 | (5 | ) | 386 | |||||||||||||||
Other debt | (8 | ) | 759 | (4 | ) | 188 | (12 | ) | 947 | |||||||||||||||
Total debt securities | (216 | ) | 25,669 | (146 | ) | 4,410 | (362 | ) | 30,079 | |||||||||||||||
Corporate stocks and other | (a | ) | 46 | (1 | ) | 15 | (1 | ) | 61 | |||||||||||||||
Total | $ | (216 | ) | $ | 25,715 | $ | (147 | ) | $ | 4,425 | $ | (363 | ) | $ | 30,140 | |||||||||
December 31, 2014 | ||||||||||||||||||||||||
Debt securities | ||||||||||||||||||||||||
U.S. Treasury and government agencies | $ | (1 | ) | $ | 1,426 | $ | (1 | ) | $ | 1,426 | ||||||||||||||
Residential mortgage-backed | ||||||||||||||||||||||||
Agency | (4 | ) | 644 | $ | (37 | ) | $ | 1,963 | (41 | ) | 2,607 | |||||||||||||
Non-agency | (5 | ) | 276 | (94 | ) | 1,487 | (99 | ) | 1,763 | |||||||||||||||
Commercial mortgage-backed | ||||||||||||||||||||||||
Agency | (2 | ) | 681 | (12 | ) | 322 | (14 | ) | 1,003 | |||||||||||||||
Non-agency | (4 | ) | 928 | (7 | ) | 335 | (11 | ) | 1,263 | |||||||||||||||
Asset-backed | (4 | ) | 913 | (28 | ) | 1,133 | (32 | ) | 2,046 | |||||||||||||||
State and municipal | (a | ) | 41 | (3 | ) | 77 | (3 | ) | 118 | |||||||||||||||
Other debt | (2 | ) | 314 | (4 | ) | 186 | (6 | ) | 500 | |||||||||||||||
Total debt securities | (22 | ) | 5,223 | (185 | ) | 5,503 | (207 | ) | 10,726 | |||||||||||||||
Corporate stocks and other | (1 | ) | 15 | (1 | ) | 15 | ||||||||||||||||||
Total | $ | (22 | ) | $ | 5,223 | $ | (186 | ) | $ | 5,518 | $ | (208 | ) | $ | 10,741 | |||||||||
| (a) | The unrealized loss on these securities was less than $.5 million. |
The gross unrealized loss on debt securities held to maturity was $82 million at December 31, 2015, with $59 million of the loss related to securities with a fair value of $5.5 billion that had been in a continuous loss position less than 12 months and $23 million of the loss related to securities with a fair value of $ 953 million that had been in a continuous loss position for more than 12 months. The gross unrealized loss on debt securities held to maturity was $22 million at December 31, 2014, with $1 million of the loss related to
securities with a fair value of $134 million that had been in a continuous loss position less than 12 months and $21 million of the loss related to securities with a fair value of $1.6 billion that had been in a continuous loss position for more than 12 months. For securities transferred to held to maturity from available for sale, the unrealized loss for purposes of this analysis is determined by comparing the security's original amortized cost to its current estimated fair value.
| 146 The PNC Financial Services Group, Inc. – Form 10-K |
Evaluating Investment Securities for Other-than-Temporary Impairments
For the securities in the preceding Table 70, as of December 31, 2015 we do not intend to sell and believe we will not be required to sell the securities prior to recovery of the amortized cost basis.
At least quarterly, we conduct a comprehensive security-level assessment on all securities. For those securities in an unrealized loss position we determine if OTTI exists. An unrealized loss exists when the current fair value of an individual security is less than its amortized cost basis. An OTTI loss must be recognized for a debt security in an unrealized loss position if we intend to sell the security or it is more likely than not we will be required to sell the security prior to recovery of its amortized cost basis. In this situation, the amount of loss recognized in income is equal to the difference between the fair value and the amortized cost basis of the security. Even if we do not expect to sell the security, we must evaluate the expected cash flows to be received to determine if we believe a credit loss has occurred. In the event of a credit loss, only the amount of impairment associated with the credit loss is recognized in income. The portion of the unrealized loss relating to other factors, such as liquidity conditions in the market or changes in market interest rates, is recorded in accumulated other comprehensive income (loss).
The security-level assessment is performed on each investment security. Our assessment considers the security structure, recent security collateral performance metrics if applicable, external credit ratings, failure of the issuer to make scheduled interest or principal payments, our judgment and expectations of future performance, and relevant independent industry research, analysis and forecasts. Results of the
periodic assessment are reviewed by a cross-functional senior management team representing Asset & Liability Management, Finance, and Market Risk Management. The senior management team considers the results of the assessments, as well as other factors, in determining whether the impairment is other-than-temporary.
Substantially all of the credit impairment we have recognized relates to non-agency residential mortgage-backed securities and asset-backed securities collateralized by first-lien and second-lien non-agency residential mortgage loans. Potential credit losses on these securities are evaluated on a security-by-security basis. Collateral performance assumptions are developed for each security after reviewing collateral composition and collateral performance statistics. This includes analyzing recent delinquency roll rates, loss severities, voluntary prepayments and various other collateral and performance metrics. This information is then combined with general expectations on the housing market, employment and other macroeconomic factors to develop estimates of future performance.
Security level assumptions for prepayments, loan defaults and loss given default are applied to each non-agency residential mortgage-backed security and asset-backed security collateralized by first-lien and second-lien non-agency residential mortgage loans using a third-party cash flow model. The third-party cash flow model then generates projected cash flows according to the structure of each security. Based on the results of the cash flow analysis, we determine whether we expect that we will recover the amortized cost basis of our security.
For those securities on our balance sheet where we determined losses represented OTTI, we have recorded cumulative credit losses of $1.1 billion at December 31, 2015. During 2015 and 2014, the OTTI credit losses recognized in noninterest income and the OTTI noncredit losses recognized in accumulated other comprehensive income (loss), net of tax, on securities were not significant.
Information relating to gross realized securities gains and losses from the sales of securities is set forth in the following table.
Table 71: Gains (Losses) on Sales of Securities Available for Sale
| In millions | Proceeds | Gross Gains | Gross Losses | Net Gains | Tax Expense | |||||||||||||||
For the year ended December 31 | ||||||||||||||||||||
2015 | $ | 6,829 | $ | 56 | $ | (13 | ) | $ | 43 | $ | 15 | |||||||||
2014 | 4,480 | 33 | (29 | ) | 4 | 1 | ||||||||||||||
2013 | 8,178 | 146 | (47 | ) | 99 | 35 | ||||||||||||||
| The PNC Financial Services Group, Inc. – Form 10-K 147 |
The following table presents, by remaining contractual maturity, the amortized cost, fair value and weighted-average yield of debt securities at December 31, 2015.
Table 72: Contractual Maturity of Debt Securities
December 31, 2015 Dollars in millions | 1 Year or Less | After 1 Year through 5 Years | After 5 Years through 10 Years | After 10 Years | Total | |||||||||||||||
Securities Available for Sale | ||||||||||||||||||||
U.S. Treasury and government agencies | $ | 586 | $ | 4,172 | $ | 4,234 | $ | 772 | $ | 9,764 | ||||||||||
Residential mortgage-backed | ||||||||||||||||||||
Agency | 99 | 986 | 23,613 | 24,698 | ||||||||||||||||
Non-agency | 3 | 3,989 | 3,992 | |||||||||||||||||
Commercial mortgage-backed | ||||||||||||||||||||
Agency | 22 | 109 | 232 | 1,554 | 1,917 | |||||||||||||||
Non-agency | 50 | 28 | 8 | 4,816 | 4,902 | |||||||||||||||
Asset-backed | 9 | 1,526 | 1,787 | 2,095 | 5,417 | |||||||||||||||
State and municipal | 1 | 127 | 336 | 1,518 | 1,982 | |||||||||||||||
Other debt | 186 | 1,377 | 289 | 155 | 2,007 | |||||||||||||||
Total debt securities available for sale | $ | 854 | $ | 7,441 | $ | 7,872 | $ | 38,512 | $ | 54,679 | ||||||||||
Fair value | $ | 861 | $ | 7,497 | $ | 7,926 | $ | 38,887 | $ | 55,171 | ||||||||||
Weighted-average yield, GAAP basis | 2.76 | % | 2.23 | % | 2.28 | % | 2.91 | % | 2.73 | % | ||||||||||
Securities Held to Maturity | ||||||||||||||||||||
U.S. Treasury and government agencies | $ | 258 | $ | 258 | ||||||||||||||||
Residential mortgage-backed | ||||||||||||||||||||
Agency | $ | 4 | $ | 321 | 9,227 | 9,552 | ||||||||||||||
Non-agency | 233 | 233 | ||||||||||||||||||
Commercial mortgage-backed | ||||||||||||||||||||
Agency | $ | 119 | 810 | 142 | 57 | 1,128 | ||||||||||||||
Non-agency | 722 | 722 | ||||||||||||||||||
Asset-backed | 3 | 590 | 124 | 717 | ||||||||||||||||
State and municipal | 62 | 938 | 954 | 1,954 | ||||||||||||||||
Other debt | 204 | 204 | ||||||||||||||||||
Total debt securities held to maturity | $ | 119 | $ | 1,083 | $ | 1,991 | $ | 11,575 | $ | 14,768 | ||||||||||
Fair value | $ | 119 | $ | 1,112 | $ | 2,059 | $ | 11,712 | $ | 15,002 | ||||||||||
Weighted-average yield, GAAP basis | 3.02 | % | 3.41 | % | 3.18 | % | 3.46 | % | 3.42 | % | ||||||||||
Weighted-average yields are based on historical cost with effective yields weighted for the contractual maturity of each security. At December 31, 2015, there were no securities of a single issuer, other than FHLMC and FNMA, that exceeded 10% of Total shareholders' equity. The FHLMC investments had a total amortized cost of $4.9 billion and fair value of $5.0 billion. The FNMA investments had a total amortized cost of $21.0 billion and fair value of $21.1 billion.
The following table presents the fair value of securities that have been either pledged to or accepted from others to collateralize outstanding borrowings.
Table 73: Fair Value of Securities Pledged and Accepted as Collateral
| In millions | December 31 2015 | December 31 2014 | ||||||
Pledged to others | $ | 9,674 | $ | 10,874 | ||||
Accepted from others: | ||||||||
Permitted by contract or custom to sell or repledge | 1,100 | 1,658 | ||||||
Permitted amount repledged to others | 943 | 1,488 | ||||||
The securities pledged to others include positions held in our portfolio of investment securities, trading securities, and securities accepted as collateral from others that we are permitted by contract or custom to sell or repledge, and were used to secure public and trust deposits, repurchase agreements, and for other purposes.
| 148 The PNC Financial Services Group, Inc. – Form 10-K |
N OTE 7 F AIR V ALUE
Fair Value Measurement
PNC measures certain financial assets and liabilities at fair value in accordance with GAAP. Fair value is defined in GAAP as the price that would be received to sell an asset or the price that would be paid to transfer a liability on the measurement date. GAAP focuses on the exit price in the principal or most advantageous market for the asset or liability in an orderly transaction between market participants. GAAP also establishes a fair value hierarchy to maximize the use of observable inputs when measuring fair value and defines the three levels of inputs as noted below.
Level 1
Fair value is determined using a quoted price in an active market for identical assets or liabilities. Level 1 assets and liabilities may include debt securities, equity securities and listed derivative contracts that are traded in an active exchange market and certain U.S. Treasury securities that are actively traded in over-the-counter markets.
Level 2
Fair value is estimated using inputs other than quoted prices included within Level 1 that are observable for assets or liabilities, either directly or indirectly. The majority of Level 2 assets and liabilities include debt securities, equity securities and listed derivative contracts with quoted prices that are traded in markets that are not active, and certain debt and equity securities and over-the-counter derivative contracts whose fair value is determined using a pricing model without significant unobservable inputs.
Level 3
Fair value is estimated using unobservable inputs that are significant to the fair value of the assets or liabilities. Level 3 assets and liabilities include financial instruments whose value is determined using pricing models and discounted cash flow methodologies, or similar techniques for which the significant valuation inputs are not observable and the determination of fair value requires significant management judgment or estimation.
Certain assets which have been adjusted due to impairment are accounted for at lower of amortized cost or fair value on a nonrecurring basis and consist primarily of certain nonaccrual loans, OREO and foreclosed assets and long-lived assets held for sale. These assets, which are generally classified as Level 3, are included in Table 77 in this Note 7.
We characterize active markets as those where transaction volumes are sufficient to provide objective pricing information, with reasonably narrow bid/ask spreads and where dealer quotes received do not vary widely and are based on current information. Inactive markets are typically characterized by low transaction volumes, price quotations that vary substantially among market participants or are not based on current information, wide bid/ask spreads, a significant increase in implied liquidity risk premiums, yields, or performance indicators for observed transactions or quoted prices compared to historical periods, a significant decline or absence of a market for new issuance, or any combination of the above factors. We also consider nonperformance risks including credit risk as part of our valuation methodology for all assets and liabilities measured at fair value.
Any models used to determine fair values or to validate dealer quotes based on the descriptions below are subject to review and independent testing as part of our model validation and internal control testing processes. Our Model Risk Management Committee reviews significant models on at least an annual basis. In addition, the Valuation Committee approves valuation methodologies and reviews the results of independent valuation reviews and processes for assets and liabilities measured at fair value on a recurring basis.
Assets and liabilities measured at fair value, by their nature, result in a higher degree of financial statement volatility. Assets and liabilities classified within Level 3 inherently require the use of various assumptions, estimates and judgments when measuring their fair value. As observable market activity is commonly not available to use when estimating the fair value of Level 3 assets and liabilities, we must estimate fair value using various modeling techniques. These techniques include the use of a variety of inputs/assumptions including credit quality, liquidity, interest rates or other relevant inputs across the entire population of our Level 3 assets and liabilities. Changes in the significant underlying factors or assumptions (either an increase or a decrease) in any of these areas underlying our estimates may result in a significant increase/decrease in the Level 3 fair value measurement of a particular asset and/or liability from period to period.
| The PNC Financial Services Group, Inc. – Form 10-K 149 |
Assets and Liabilities Measured at Fair Value on a Recurring Basis
Securities Available for Sale and Trading Securities
Securities accounted for at fair value include both the available for sale and trading portfolios. We primarily use prices obtained from pricing services, dealer quotes, or recent trades to determine the fair value of securities. As of December 31, 2015, 87% of the positions in these portfolios were priced by using pricing services provided by third-party vendors. The third-party vendors use a variety of methods when pricing securities that incorporate relevant market data to arrive at an estimate of what a buyer in the marketplace would pay for a security under current market conditions. One of the vendor's prices are set with reference to market activity for highly liquid assets, such as U.S. Treasury and agency securities and agency residential mortgage-backed securities, and matrix pricing for other asset classes, such as commercial mortgage-backed and other asset-backed securities. Another vendor primarily uses discounted cash flow pricing models considering adjustments for spreads and prepayments for the instruments we value using this service, such as non-agency residential mortgage-backed securities, agency adjustable rate mortgage securities, agency collateralized mortgage obligations (CMOs), commercial mortgage-backed securities and municipal bonds. The vendors we use provide pricing services on a global basis and have quality management processes in place to monitor the integrity of the valuation inputs and the prices provided to users, including procedures to consider and incorporate information received from pricing service users who may challenge a price. We monitor and validate the reliability of vendor pricing on an ongoing basis through pricing methodology reviews, by performing detailed reviews of the assumptions and inputs used by the vendor to price individual securities, and through price validation testing. Price validation testing is performed independent of the risk-taking function and involves corroborating the prices received from third-party vendors with prices from another third-party source, by reviewing valuations of comparable instruments, by comparison to internal valuations, or by reference to recent sales of similar securities. Securities not priced by one of our pricing vendors may be valued using a dealer quote. Dealer quotes received are typically non-binding. Securities priced using a dealer quote are subject to corroboration either with another dealer quote, by comparison to similar securities priced by either a third-party vendor or another dealer, or through internal valuation in order to validate that the quote is representative of the market. Security prices are also validated through actual cash settlement upon sale of a security.
Securities are classified within the fair value hierarchy after giving consideration to the activity level in the market for the security type and the observability of the inputs used to determine the fair value. When a quoted price in an active market exists for the identical security, this price is used to determine fair value and the security is classified within Level 1
of the hierarchy. Level 1 securities include certain U.S. Treasury securities and exchange-traded equities. When a quoted price in an active market for the identical security is not available, fair value is estimated using either an alternative market approach, such as a recent trade or matrix pricing, or an income approach, such as a discounted cash flow pricing model. If the inputs to the valuation are based primarily on market observable information, then the security is classified within Level 2 of the hierarchy. Level 2 securities include agency debt securities, agency residential mortgage-backed securities, agency and non-agency commercial mortgage-backed securities, certain non-agency residential mortgage-backed securities, asset-backed securities collateralized by non-mortgage-related consumer loans, municipal securities, and other debt securities. Level 2 securities are predominantly priced by third parties, either a pricing vendor or dealer.
In certain cases where there is limited activity or less transparency around the inputs to the valuation, securities are classified within Level 3 of the hierarchy. Securities classified as Level 3 consist primarily of non-agency residential mortgage-backed and asset-backed securities collateralized by first- and second-lien residential mortgage loans. Fair value for these securities is primarily estimated using pricing obtained from third-party vendors. In some cases, fair value is estimated using a dealer quote, by reference to prices of securities of a similar vintage and collateral type or by reference to recent sales of similar securities. Market activity for these security types is limited with little price transparency. As a result, these securities are generally valued by the third-party vendor using a discounted cash flow approach that incorporates observable market activity where available. Significant inputs to the valuation include prepayment projections and credit loss assumptions (default rate and loss severity) and discount rates that are deemed representative of current market conditions. The discount rates used incorporate a spread over the benchmark curve that takes into consideration liquidity risk and potential credit risk not already included in the credit loss assumptions. Significant increases (decreases) in any of those assumptions in isolation would result in a significantly lower (higher) fair value measurement. Prepayment estimates generally increase when market interest rates decline and decrease when market interest rates rise. Credit loss estimates are driven by the ability of borrowers to pay their loans and housing market prices and are impacted by changes in overall macroeconomic conditions, typically increasing when economic conditions worsen and decreasing when conditions improve. An increase in the estimated prepayment rate typically results in a decrease in estimated credit losses and vice versa. Discount rates typically increase when market interest rates increase and/or credit and liquidity risks increase. Similarly, discount rates typically decrease when market interest rates decline and/or credit and liquidity conditions improve. Price validation procedures performed for these securities include comparing current prices to historical pricing trends by collateral type and vintage, and by obtaining corroborating prices from another third-party source.
| 150 The PNC Financial Services Group, Inc. – Form 10-K |
Certain infrequently traded debt securities within the State and municipal and Other debt securities available-for-sale and Trading securities categories are also classified in Level 3 and are included in the Insignificant Level 3 assets, net of liabilities line item in Table 76 (for the 2015 period). The significant unobservable inputs used to estimate the fair value of these securities include an estimate of expected credit losses and a discount for liquidity risk. These inputs are incorporated into the fair value measurement by either increasing the spread over the benchmark curve or by applying a credit and liquidity discount to the par value of the security. Significant increases (decreases) in credit and/or liquidity risk could result in a significantly lower (higher) fair value estimate.
Financial Derivatives
Exchange-traded derivatives are valued using quoted market prices and are classified as Level 1. However, the majority of derivatives that we enter into are executed over-the-counter and are valued using internal models. These derivatives are primarily classified as Level 2 as the readily observable market inputs to these models are validated to external sources. The external sources for these inputs include industry pricing services, or are corroborated through recent trades, dealer quotes, yield curves, implied volatility or other market-related data. Level 2 financial derivatives are primarily estimated using a combination of Eurodollar future prices and observable benchmark interest rate swaps to construct projected discounted cash flows. Financial derivatives that are priced using significant management judgment or assumptions are classified as Level 3.
Fair value information for Level 3 financial derivatives is presented separately for interest rate contracts and other contracts. Interest rate contracts include residential and commercial mortgage interest rate lock commitments and certain interest rate options. Other contracts include risk participation agreements, swaps related to the sale of certain Visa Class B common shares and other types of contracts.
The fair values of residential mortgage loan commitment assets as of December 31, 2015 and 2014 are included in the Insignificant Level 3 assets, net of liabilities line item in Table 76 in this Note 7. Significant unobservable inputs for these commitments include the probability of funding and embedded servicing. The probability of funding for residential mortgage loan commitments represents the expected proportion of loan commitments in the pipeline that will fund. Additionally, embedded in the market price of the underlying loan is a value for retaining servicing of the loan once it is sold. Significant increases (decreases) in the fair value of a residential mortgage loan commitment asset (liability) result when the probability of funding increases (decreases) and when the embedded servicing value increases (decreases).
The fair values of commercial mortgage loan commitment assets and liabilities as of December 31, 2015 and 2014 are
included in the Insignificant Level 3 assets, net of liabilities line item in Table 76 in this Note 7. Significant unobservable inputs for these commitments include spread over the benchmark interest rate and the estimated servicing cash flows for loans sold to the agencies with servicing retained. The spread over the benchmark curve reflects management assumptions regarding credit and liquidity risks. Significant increases (decreases) in the fair value of commercial mortgage loan commitments result when the spread over the benchmark curve decreases (increases) or the estimated servicing cash flows for loans sold to the agencies with servicing retained increases (decreases).
The fair values of interest rate option assets and liabilities as of December 31, 2015 and 2014 are included in the Insignificant Level 3 assets, net of liabilities line item in Table 76 in this Note 7. The significant unobservable input used in the fair value measurement of the interest rate options is expected interest rate volatility. Significant increases (decreases) in interest rate volatility would result in a significantly higher (lower) fair value measurement.
The fair values of risk participation agreement assets and liabilities as of December 31, 2015 and 2014 are included in the Insignificant Level 3 assets, net of liabilities line item in Table 76 in this Note 7. The significant unobservable inputs used in the fair value measurement of risk participation agreements are probability of default and loss severity. Significant increases (decreases) in probability of default and loss severity would result in a significantly higher (lower) fair value measurement.
In connection with the sales of portions of our Visa Class B common shares, we entered into swap agreements with the purchasers of the shares to account for any future risk of converting Class B common shares to Class A common shares and to account for the corresponding change in value to the Class B shares. These adjustments result from resolution of the specified litigation or the changes in the amount in the litigation escrow account funded by Visa as well as from changes in the estimated litigation resolution date (see Note 20 Legal Proceedings and Note 21 Commitments and Guarantees for additional information). These swaps also require payments calculated by reference to the market price of the Class A common shares and a fixed rate of interest. The swaps are classified as Level 3 instruments and the fair values of the liability positions totaled $104 million at December 31, 2015 and $135 million at December 31, 2014, respectively. The fair values of the swap agreements are determined using a discounted cash flow methodology. The significant unobservable inputs to the valuations are estimated changes in the conversion rate of the Class B common shares into Class A common shares and the estimated growth rate of the Class A share price. A decrease in the conversion rate will have a negative impact on the fair value of the swaps and vice versa. Independent of changes in the conversion rate, an increase in the estimated growth rate of the Class A share
| The PNC Financial Services Group, Inc. – Form 10-K 151 |
price will have a negative impact on the fair value of the swaps and vice versa, through its impact on periodic payments due to the counterparty until the maturity dates of the swaps.
The fair values of our derivatives include a credit valuation adjustment (CVA) to reflect our own and our counterparties' nonperformance risk. Our CVA is computed using new loan pricing and considers externally available bond spreads, in conjunction with internal historical recovery observations.
Residential Mortgage Loans Held for Sale
We account for certain residential mortgage loans originated for sale at fair value on a recurring basis. The election of the fair value option aligns the accounting for the residential mortgages with the related hedges. Additionally, we have elected to account for loans repurchased due to breaches of representations and warranties at fair value.
Residential mortgage loans are valued based on quoted market prices, where available, prices for other traded mortgage loans with similar characteristics, and purchase commitments and bid information received from market participants. The prices are adjusted as necessary to include the embedded servicing value in the loans and to take into consideration the specific characteristics of certain loans that are priced based on the pricing of similar loans. These adjustments represent unobservable inputs to the valuation but are not considered significant given the relative insensitivity of the value to changes in these inputs to the fair value of the loans. Accordingly, the majority of residential mortgage loans held for sale are classified as Level 2. This category also includes repurchased and temporarily unsalable residential mortgage loans. These loans are repurchased due to a breach of representations and warranties in the loan sales agreement and typically occur after the loan is in default. The temporarily unsalable loans have an origination defect that makes them currently unable to be sold into the performing loan sales market. Because transaction details regarding sales of this type of loan are often unavailable, unobservable bid information from brokers and investors is heavily relied upon. Accordingly, based on the significance of unobservable inputs, these loans are classified as Level 3.
Residential Mortgage Servicing Rights
Residential MSRs are carried at fair value on a recurring basis. Assumptions incorporated into the residential MSRs valuation model reflect management's best estimate of factors that a market participant would use in valuing the residential MSRs. Although sales of residential MSRs do occur, residential MSRs do not trade in an active, open market with readily observable prices so the precise terms and conditions of sales are not available. As a benchmark for the reasonableness of its residential MSRs fair value, PNC obtained opinions of value from independent parties ("brokers"). These brokers provided a range (+/- 10 bps) based upon their own discounted cash flow calculations of our portfolio that reflect conditions in the secondary market and any recently executed servicing
transactions. PNC compares its internally-developed residential MSRs value to the ranges of values received from the brokers. If our residential MSRs fair value falls outside of the brokers' ranges, management will assess whether a valuation adjustment is warranted. For the periods presented, PNC's residential MSRs value did not fall outside of the brokers' ranges. We consider our residential MSRs value to represent a reasonable estimate of fair value. Due to the nature of the unobservable valuation inputs, residential MSRs are classified as Level 3.
The significant unobservable inputs used in the fair value measurement of residential MSRs are constant prepayment rates and spread over the benchmark curve. Significant increases (decreases) in prepayment rates and spread over the benchmark curve would result in lower (higher) fair market value of residential MSRs.
Commercial Mortgage Servicing Rights
Commercial MSRs are carried at fair value on a recurring basis. Assumptions incorporated into the commercial valuation model reflect management's best estimate of factors that a market participant would use in valuing the commercial MSRs. Although sales of commercial MSRs do occur, commercial MSRs do not trade in an active, open market with readily observable prices so the precise terms and conditions of sales are not available. Due to the nature of the valuation inputs and the limited availability of market pricing, commercial MSRs are classified as Level 3.
The fair value of commercial MSRs is estimated by using a discounted cash flow model incorporating unobservable inputs for assumptions such as constant prepayment rates, discount rates and other factors. Significant increases/(decreases) in constant prepayment rates and discount rates would result in significantly lower/(higher) commercial MSR value determined based on current market conditions and expectations.
Commercial Mortgage Loans Held for Sale
We account for certain commercial mortgage loans classified as held for sale in whole loan transactions at fair value. In addition, as of September 1, 2014, we have elected to apply the fair value option to commercial mortgage loans held for sale to agencies. This election applies to all new commercial mortgage loans held for sale originated for sale to the agencies effective on or after September 1, 2014. The election of the fair value option aligns the accounting for the commercial mortgages with the related commitments to sell the loans.
We determine the fair value of commercial mortgage loans held for sale based upon discounted cash flows. Fair value is determined using sale valuation assumptions that management believes a market participant would use in pricing the loans. Valuation assumptions may include observable inputs based on the benchmark interest rate swap curves, whole loan sales and agency sales transactions. The significant unobservable
| 152 The PNC Financial Services Group, Inc. – Form 10-K |
inputs are management's assumption of the spread applied to the benchmark rate and the estimated servicing cash flows for loans sold to the agencies with servicing retained. The spread over the benchmark curve includes management's assumptions of the impact of credit and liquidity risk. Significant increases (decreases) in the spread applied to the benchmark would result in a significantly lower (higher) asset value. The wide range of the spread over the benchmark curve is due to the varying risk and underlying property characteristics within our portfolio. Significant increases (decreases) in the estimated servicing cash flows would result in significantly higher (lower) asset value. Based on the significance of unobservable inputs, we classified this portfolio as Level 3.
Equity Investments – Direct Investments
The valuation of direct and indirect private equity investments requires significant management judgment due to the absence of quoted market prices, inherent lack of liquidity and the long-term nature of such investments. The carrying values of direct and affiliated partnership interests reflect the expected exit price and are based on various techniques including multiples of adjusted earnings of the entity, independent appraisals, anticipated financing and sale transactions with third parties, or the pricing used to value the entity in a recent financing transaction. A multiple of adjusted earnings calculation is the valuation technique utilized most frequently and the multiple of earnings is the primary and most significant unobservable input used in such calculation. The multiple of earnings is utilized in conjunction with portfolio company financial results and our ownership interest in portfolio company securities to determine PNC's interest in the enterprise value of the portfolio company. Significant decreases (increases) in the multiple of earnings could result in a significantly lower (higher) fair value measurement. The magnitude of the change in fair value is dependent on the significance of the change in the multiple of earnings and the significance of portfolio company adjusted earnings. Valuation inputs or analysis are supported by portfolio company or market documentation. Due to the size, private and unique nature of each portfolio company, lack of liquidity and the long-term nature of investments, relevant benchmarking is not always feasible. A valuation committee reviews the portfolio company valuations on a quarterly basis and oversight is provided by senior management of the business. These investments are classified as Level 3.
Unfunded commitments related to direct investments totaled $23 million and $28 million at December 31, 2015 and December 31, 2014, respectively. Outstanding contractual obligations to existing direct investments totaled $11 million and $9 million at December 31, 2015 and December 31, 2014, respectively. During 2015, $5 million of financial support was provided to existing direct investments compared to $39 million during 2014.
Equity Investments – Indirect Investments
We value indirect investments in private equity funds based on net asset value (NAV) as provided in the financial statements that we receive from their managers. Due to the time lag in our receipt of the financial information and based on a review of investments and valuation techniques applied, adjustments to the manager-provided value are made when available recent portfolio company information or market information indicates a significant change in value from that provided by the manager of the fund. In accordance with ASC 820-10, these investments are not classified in the fair value hierarchy.
These indirect investments are not redeemable, however PNC receives distributions over the life of the partnerships from liquidation of the underlying investments by the investee, which we expect to occur over the next twelve years. The forced sale or restructuring of these investments would likely result in PNC receiving less value than it would otherwise have received in the ordinary course of business. Unfunded commitments related to indirect investments totaled $103 million and $112 million at of December 31, 2015 and December 31, 2014, respectively. During 2015, $17 million of financial support was provided to indirect investments to satisfy capital calls for commitments. The comparable amount was $24 million during 2014.
Customer Resale Agreements
We have elected to account for structured resale agreements, which are economically hedged using free-standing financial derivatives, at fair value. The fair value for structured resale agreements is determined using a model that includes observable market data such as interest rates as inputs. Readily observable market inputs to this model can be validated to external sources, including yield curves, implied volatility or other market-related data. These instruments are classified as Level 2.
Loans
Loans accounted for at fair value consist primarily of residential mortgage loans. These loans are generally valued similarly to residential mortgage loans held for sale and are classified as Level 2. However, similar to residential mortgage loans held for sale, if these loans are repurchased and unsalable, they are classified as Level 3. In addition, repurchased VA loans, where only a portion of the principal will be reimbursed, are classified as Level 3. The fair value is determined using a discounted cash flow calculation based on our historical loss rate. Due to the unobservable nature of this pool level approach, these loans are classified as Level 3.
Additionally, we have elected to account for certain home equity lines of credit at fair value. These loans are classified as Level 3. This category also includes repurchased brokered home equity loans. These loans are repurchased due to a breach of representations or warranties in the loan sales agreement and occur typically after the loan is in default.
| The PNC Financial Services Group, Inc. – Form 10-K 153 |
Similar to existing loans classified as Level 3 due to being repurchased and unsalable, the fair value price is based on bids and market observations of transactions of similar vintage. Because transaction details regarding the credit and underwriting quality are often unavailable, unobservable bid information from brokers and investors is heavily relied upon. Accordingly, based on the significance of unobservable inputs, these loans are classified as Level 3. The fair value of these loans is included in the Loans – Home equity line item in Table 76 in this Note 7.
Significant inputs to the valuation of residential mortgage loans include credit and liquidity discount, cumulative default rate, loss severity and gross discount rate and are deemed representative of current market conditions. Significant increases (decreases) in an assumption would result in a significantly lower (higher) fair value measurement.
BlackRock Series C Preferred Stock
We have elected to account for the shares of BlackRock Series C Preferred Stock received in a stock exchange with BlackRock at fair value. As of both December 31, 2015 and December 31, 2014, we hold approximately 1.3 million shares of BlackRock Series C Preferred Stock, which are available to fund our obligation in connection with the BlackRock LTIP programs. See Note 24 Subsequent Events for information on the February 1, 2016 transfer of 0.5 million shares of the Series C Preferred Stock to BlackRock to satisfy a portion of our LTIP obligation. The Series C Preferred Stock economically hedges the BlackRock LTIP liability that is accounted for as a derivative. The fair value of the Series C Preferred Stock is determined using a third-party modeling approach, which includes both observable and unobservable inputs. This approach considers expectations of a default/liquidation event and the use of liquidity discounts based on our inability to sell the security at a fair, open market price in a timely manner. Although dividends are equal to common shares and other preferred series, significant transfer restrictions exist on our Series C shares for any purpose other than to satisfy the BlackRock LTIP obligation. Due to the significance of unobservable inputs, this security is classified as Level 3. Significant increases (decreases) in the liquidity discount would result in a significantly lower (higher) asset value for the BlackRock Series C and vice versa for the BlackRock LTIP liability.
Other Assets and Liabilities
We have entered into a prepaid forward contract with a financial institution to mitigate the risk on a portion of PNC's deferred compensation, supplemental incentive savings plan liabilities and certain stock based compensation awards that are based on PNC's stock price and are subject to market risk. The prepaid forward contract is initially valued at the transaction price and is subsequently valued by reference to the market price of PNC's stock and is recorded in either Other Assets or Other Liabilities at fair value and is classified as Level 2.
In addition, deferred compensation and supplemental incentive savings plan participants may also invest based on fixed income and equity-based funds. PNC utilizes a Rabbi Trust to hedge the returns by purchasing similar funds on which the participant returns are based. The Rabbi Trust balances are recorded in Other Assets at fair value using the quoted market price. These assets are primarily being classified in Levels 1 and 2. The other asset category also includes FHLB interests and the retained interests related to the Small Business Administration (SBA) securitizations which are classified as Level 3, and certain trading loans which are classified as level 2. The other liabilities category includes a contingent liability which is classified as Level 3.
All Level 3 other assets and liabilities are included in the Insignificant Level 3 assets, net of liabilities line item in Table 76 in this Note 7.
Other Borrowed Funds
We have elected to account for other borrowed funds at fair value consisting of the related liability for transferred loans over which PNC regained effective control pursuant to ASC 860. These other borrowed funds are classified as either Level 2 or Level 3 consistent with the corresponding loans described above. All Level 3 amounts are included in the Insignificant Level 3 assets, net of liabilities line item in Table 76 in this Note 7.
Other borrowed funds also included certain liabilities consisting primarily of secured debt at fair value. As of December 31, 2015, this secured debt was no longer outstanding due to repurchases. These other borrowed funds were classified as Level 3. Significant unobservable inputs for these borrowed funds include credit and liquidity discount and spread over the benchmark curve. Significant increases (decreases) in these input assumptions would result in significantly lower (higher) fair value measurement.
| 154 The PNC Financial Services Group, Inc. – Form 10-K |
Table 74: Fair Value Measurements – Recurring Basis Summary
| December 31, 2015 | December 31, 2014 | |||||||||||||||||||||||||||||||
| In millions | Level 1 | Level 2 | Level 3 | Total Fair Value | Level 1 | Level 2 | Level 3 | Total Fair Value | ||||||||||||||||||||||||
Assets | ||||||||||||||||||||||||||||||||
Securities available for sale | ||||||||||||||||||||||||||||||||
U.S. Treasury and government agencies | $ | 9,267 | $ | 607 | $ | 9,874 | $ | 4,795 | $ | 627 | $ | 5,422 | ||||||||||||||||||||
Residential mortgage-backed | ||||||||||||||||||||||||||||||||
Agency | 24,820 | 24,820 | 18,043 | 18,043 | ||||||||||||||||||||||||||||
Non-agency | 143 | $ | 4,008 | 4,151 | 144 | $ | 4,798 | 4,942 | ||||||||||||||||||||||||
Commercial mortgage-backed | ||||||||||||||||||||||||||||||||
Agency | 1,918 | 1,918 | 2,187 | 2,187 | ||||||||||||||||||||||||||||
Non-agency | 4,903 | 4,903 | 4,162 | 4,162 | ||||||||||||||||||||||||||||
Asset-backed | 4,941 | 482 | 5,423 | 4,624 | 563 | 5,187 | ||||||||||||||||||||||||||
State and municipal | 2,041 | 15 | 2,056 | 1,904 | 134 | 2,038 | ||||||||||||||||||||||||||
Other debt | 1,996 | 30 | 2,026 | 1,783 | 30 | 1,813 | ||||||||||||||||||||||||||
Total debt securities | 9,267 | 41,369 | 4,535 | 55,171 | 4,795 | 33,474 | 5,525 | 43,794 | ||||||||||||||||||||||||
Corporate stocks and other | 527 | 62 | 589 | 426 | 15 | 441 | ||||||||||||||||||||||||||
Total securities available for sale | 9,794 | 41,431 | 4,535 | 55,760 | 5,221 | 33,489 | 5,525 | 44,235 | ||||||||||||||||||||||||
Financial derivatives (a) (b) | ||||||||||||||||||||||||||||||||
Interest rate contracts | 4,626 | 29 | 4,655 | 4 | 4,874 | 40 | 4,918 | |||||||||||||||||||||||||
Other contracts | 284 | 2 | 286 | 314 | 2 | 316 | ||||||||||||||||||||||||||
Total financial derivatives | 4,910 | 31 | 4,941 | 4 | 5,188 | 42 | 5,234 | |||||||||||||||||||||||||
Residential mortgage loans held for sale (c) | 838 | 5 | 843 | 1,255 | 6 | 1,261 | ||||||||||||||||||||||||||
Trading securities (d) | ||||||||||||||||||||||||||||||||
Debt (e) | 987 | 727 | 3 | 1,717 | 1,340 | 960 | 32 | 2,332 | ||||||||||||||||||||||||
Equity | 9 | 9 | 21 | 21 | ||||||||||||||||||||||||||||
Total trading securities | 996 | 727 | 3 | 1,726 | 1,361 | 960 | 32 | 2,353 | ||||||||||||||||||||||||
Residential mortgage servicing rights | 1,063 | 1,063 | 845 | 845 | ||||||||||||||||||||||||||||
Commercial mortgage servicing rights | 526 | 526 | 506 | 506 | ||||||||||||||||||||||||||||
Commercial mortgage loans held for sale (c) | 641 | 641 | 893 | 893 | ||||||||||||||||||||||||||||
Equity investments – direct investments | 1,098 | 1,098 | 1,152 | 1,152 | ||||||||||||||||||||||||||||
Equity investments – indirect investments (f) | 347 | 469 | ||||||||||||||||||||||||||||||
Customer resale agreements (g) | 137 | 137 | 155 | 155 | ||||||||||||||||||||||||||||
Loans (h) | 565 | 340 | 905 | 637 | 397 | 1,034 | ||||||||||||||||||||||||||
Other assets (a) | ||||||||||||||||||||||||||||||||
BlackRock Series C Preferred Stock (i) | 357 | 357 | 375 | 375 | ||||||||||||||||||||||||||||
Other | 254 | 199 | 7 | 460 | 190 | 256 | 15 | 461 | ||||||||||||||||||||||||
Total other assets | 254 | 199 | 364 | 817 | 190 | 256 | 390 | 836 | ||||||||||||||||||||||||
Total assets | $ | 11,044 | $ | 48,807 | $ | 8,606 | $ | 68,804 | $ | 6,776 | $ | 41,940 | $ | 9,788 | $ | 58,973 | ||||||||||||||||
Liabilities | ||||||||||||||||||||||||||||||||
Financial derivatives (b) (j) | ||||||||||||||||||||||||||||||||
Interest rate contracts | $ | 1 | $ | 3,124 | $ | 7 | $ | 3,132 | $ | 3,260 | $ | 12 | $ | 3,272 | ||||||||||||||||||
BlackRock LTIP | 357 | 357 | 375 | 375 | ||||||||||||||||||||||||||||
Other contracts | 204 | 109 | 313 | 241 | 139 | 380 | ||||||||||||||||||||||||||
Total financial derivatives | 1 | 3,328 | 473 | 3,802 | 3,501 | 526 | 4,027 | |||||||||||||||||||||||||
Trading securities sold short (k) | ||||||||||||||||||||||||||||||||
Debt | 960 | 27 | 987 | $ | 1,479 | 11 | 1,490 | |||||||||||||||||||||||||
Total trading securities sold short | 960 | 27 | 987 | 1,479 | 11 | 1,490 | ||||||||||||||||||||||||||
Other borrowed funds (k) | 81 | 12 | 93 | 92 | 181 | 273 | ||||||||||||||||||||||||||
Other liabilities (j) | 10 | 10 | 9 | 9 | ||||||||||||||||||||||||||||
Total liabilities | $ | 961 | $ | 3,436 | $ | 495 | $ | 4,892 | $ | 1,479 | $ | 3,604 | $ | 716 | $ | 5,799 | ||||||||||||||||
(continued on following page)
| The PNC Financial Services Group, Inc. – Form 10-K 155 |
| (a) | Included in Other assets on the Consolidated Balance Sheet. |
| (b) | Amounts at December 31, 2015 and December 31, 2014, are presented gross and are not reduced by the impact of legally enforceable master netting agreements that allow PNC to net positive and negative positions and cash collateral held or placed with the same counterparty. At December 31, 2015 and December 31, 2014, the net asset amounts were $1.8 billion and $2.6 billion, respectively, and the net liability amounts were $.6 billion and $1.4 billion, respectively. |
| (c) | Included in Loans held for sale on the Consolidated Balance Sheet. PNC has elected the fair value option for certain residential and commercial mortgage loans held for sale. |
| (d) | Fair value includes net unrealized gains of $23 million at December 31, 2015 compared with net unrealized gains of $54 million at December 31, 2014. |
| (e) | Approximately 28% of these securities are residential mortgage-backed securities and 57% are U.S. Treasury and government agencies securities at December 31, 2015. Comparable amounts at December 31, 2014 were 34% and 57%, respectively. |
| (f) | In accordance with ASC 820-10, certain investments that are measured at fair value using the NAV per share (or its equivalent) practical expedient have not been classified in the fair value hierarchy. The fair value amounts presented in this table are intended to permit reconciliation of the fair value hierarchy to the amounts presented on the Consolidated Balance Sheet. |
| (g) | Included in Federal funds sold and resale agreements on the Consolidated Balance Sheet. PNC has elected the fair value option for these items. |
| (h) | Included in Loans on the Consolidated Balance Sheet. |
| (i) | PNC has elected the fair value option for these shares. |
| (j) | Included in Other liabilities on the Consolidated Balance Sheet. |
| (k) | Included in Other borrowed funds on the Consolidated Balance Sheet. |
Reconciliations of assets and liabilities measured at fair value on a recurring basis using Level 3 inputs for 2015 and 2014 follow.
Table 75: Reconciliation of Level 3 Assets and Liabilities
Year Ended December 31, 2015
| Total realized /
unrealized gains or losses for the period (a) | Unrealized gains (losses) on assets and liabilities held on | |||||||||||||||||||||||||||||||||||||||||||
Level 3 Instruments Only In millions | Fair Value Dec. 31, 2014 | Included in Earnings | Included in Other | Purchases | Sales | Issuances | Settlements | Transfers into Level 3 | Transfers out of Level 3 | Fair Value Dec. 31, 2015 | ||||||||||||||||||||||||||||||||||
Assets | ||||||||||||||||||||||||||||||||||||||||||||
Securities available for sale | ||||||||||||||||||||||||||||||||||||||||||||
Residential mortgage-backed non-agency | $ | 4,798 | $ | 114 | $ | (58 | ) | $ | (846 | ) | $ | 4,008 | $ | (2 | ) | |||||||||||||||||||||||||||||
Commercial mortgage backed non-agency | 8 | (8 | ) | |||||||||||||||||||||||||||||||||||||||||
Asset-backed | 563 | 20 | (101 | ) | 482 | (2 | ) | |||||||||||||||||||||||||||||||||||||
State and municipal | 134 | (1 | ) | (118 | ) | 15 | ||||||||||||||||||||||||||||||||||||||
Other debt | 30 | 2 | (1 | ) | $ | 13 | $ | (7 | ) | (7 | ) | 30 | ||||||||||||||||||||||||||||||||
Total securities available for sale | 5,525 | 144 | (60 | ) | 13 | (7 | ) | (1,080 | ) | 4,535 | (4 | ) | ||||||||||||||||||||||||||||||||
Financial derivatives | 42 | 135 | 3 | (149 | ) | 31 | 126 | |||||||||||||||||||||||||||||||||||||
Residential mortgage loans held for sale | 6 | 1 | 25 | (4 | ) | $ | 6 | $ | (29 | ) (c) | 5 | 1 | ||||||||||||||||||||||||||||||||
Trading securities – Debt | 32 | (29 | ) | 3 | ||||||||||||||||||||||||||||||||||||||||
Residential mortgage servicing rights | 845 | 2 | 316 | $ | 78 | (178 | ) | 1,063 | 5 | |||||||||||||||||||||||||||||||||||
Commercial mortgage servicing rights | 506 | (9 | ) | 55 | 63 | (89 | ) | 526 | (10 | ) | ||||||||||||||||||||||||||||||||||
Commercial mortgage loans held for sale | 893 | 76 | (56 | ) | 4,163 | (4,435 | ) | 641 | (5 | ) | ||||||||||||||||||||||||||||||||||
Equity investments – direct investments | 1,152 | 120 | 274 | (448 | ) | 1,098 | 86 | |||||||||||||||||||||||||||||||||||||
Loans | 397 | 23 | 114 | (26 | ) | (122 | ) | 25 | (c) | (71 | ) (d) | 340 | 12 | |||||||||||||||||||||||||||||||
Other assets | ||||||||||||||||||||||||||||||||||||||||||||
BlackRock Series C Preferred Stock | 375 | (18 | ) | 357 | (18 | ) | ||||||||||||||||||||||||||||||||||||||
Other | 15 | (7 | ) | (1 | ) | 7 | ||||||||||||||||||||||||||||||||||||||
Total other assets | 390 | (18 | ) | (7 | ) | (1 | ) | 364 | (18 | ) | ||||||||||||||||||||||||||||||||||
Total assets | $ | 9,788 | $ | 474 | (e) | $ | (60 | ) | $ | 800 | $ | (548 | ) | $ | 4,304 | $ | (6,083 | ) | $ | 31 | $ | (100 | ) | $ | 8,606 | $ | 193 | (f) | ||||||||||||||||
Liabilities | ||||||||||||||||||||||||||||||||||||||||||||
Financial derivatives (g) | $ | 526 | $ | 22 | $ | 1 | $ | (76 | ) | $ | 473 | $ | 4 | |||||||||||||||||||||||||||||||
Other borrowed funds | 181 | (3 | ) | $ | 92 | (258 | ) | 12 | ||||||||||||||||||||||||||||||||||||
Other liabilities | 9 | 1 | 10 | |||||||||||||||||||||||||||||||||||||||||
Total liabilities | $ | 716 | $ | 20 | (e) | $ | 1 | $ | 92 | $ | (334 | ) | $ | 495 | $ | 4 | (f) | |||||||||||||||||||||||||||
| 156 The PNC Financial Services Group, Inc. – Form 10-K |
Year Ended December 31, 2014
| Total realized /
unrealized gains or losses for the period (a) | Unrealized gains (losses) on liabilities held on | |||||||||||||||||||||||||||||||||||||||||||
Level 3 Instruments Only In millions | Fair Value Dec. 31, 2013 | Included in Earnings | Included in Other comprehensive income | Purchases | Sales | Issuances | Settlements | Transfers into Level 3 | Transfers out of Level 3 | Fair Value Dec. 31, 2014 | ||||||||||||||||||||||||||||||||||
Assets | ||||||||||||||||||||||||||||||||||||||||||||
Securities available for sale | ||||||||||||||||||||||||||||||||||||||||||||
Residential mortgage-backed non-agency | $ | 5,358 | $ | 120 | $ | 64 | $ | (821 | ) | $ | 77 | (h) | $ | 4,798 | $ | (10 | ) | |||||||||||||||||||||||||||
Commercial mortgage-backed non-agency | 1 | (1 | ) | |||||||||||||||||||||||||||||||||||||||||
Asset-backed | 641 | 13 | 23 | (114 | ) | 563 | (1 | ) | ||||||||||||||||||||||||||||||||||||
State and municipal | 333 | (2 | ) | 15 | (198 | ) | $ | (14 | ) | 134 | ||||||||||||||||||||||||||||||||||
Other debt | 38 | 1 | $ | 1 | $ | (8 | ) | (2 | ) | 30 | ||||||||||||||||||||||||||||||||||
Total securities available for sale | 6,370 | 133 | 102 | 1 | (8 | ) | (1,136 | ) | 77 | (14 | ) | 5,525 | (11 | ) | ||||||||||||||||||||||||||||||
Financial derivatives | 36 | 226 | 3 | (223 | ) | 42 | 142 | |||||||||||||||||||||||||||||||||||||
Residential mortgage loans held for sale | 8 | 1 | 15 | (3 | ) | (1 | ) | 11 | (25 | )(c) | 6 | 1 | ||||||||||||||||||||||||||||||||
Trading securities – Debt | 32 | 2 | (31 | ) | 29 | (h) | 32 | 2 | ||||||||||||||||||||||||||||||||||||
Residential mortgage servicing rights | 1,087 | (238 | ) | 45 | $ | 85 | (134 | ) | 845 | (231 | ) | |||||||||||||||||||||||||||||||||
Commercial mortgage servicing rights | (53 | ) | 43 | 53 | 463 | (i) | 506 | (53 | ) | |||||||||||||||||||||||||||||||||||
Commercial mortgage loans held for sale | 586 | 38 | 1,790 | (1,521 | ) | 893 | 6 | |||||||||||||||||||||||||||||||||||||
Equity investments -direct investments | 1,069 | 184 | 306 | (407 | ) | 1,152 | 134 | |||||||||||||||||||||||||||||||||||||
Loans | 527 | 74 | 120 | (153 | ) | (86 | ) | 20 | (c) | (105 | )(d) | 397 | 46 | |||||||||||||||||||||||||||||||
Other assets | ||||||||||||||||||||||||||||||||||||||||||||
BlackRock Series C Preferred Stock | 332 | 43 | 375 | 43 | ||||||||||||||||||||||||||||||||||||||||
Other | 8 | 7 | 15 | |||||||||||||||||||||||||||||||||||||||||
Total other assets | 340 | 43 | 7 | 390 | 43 | |||||||||||||||||||||||||||||||||||||||
Total assets | $ | 10,055 | $ | 410 | (e) | $ | 102 | $ | 533 | $ | (571 | ) | $ | 1,928 | $ | (2,669 | ) | $ | 144 | $ | (144 | ) | $ | 9,788 | $ | 79 | (f) | |||||||||||||||||
Liabilities | ||||||||||||||||||||||||||||||||||||||||||||
Financial derivatives (g) | $ | 439 | $ | 222 | $ | 1 | $ | (136 | ) | $ | 526 | $ | (51 | ) | ||||||||||||||||||||||||||||||
Other borrowed funds | 199 | 5 | $ | 57 | (80 | ) | 181 | |||||||||||||||||||||||||||||||||||||
Other liabilities | 9 | 9 | ||||||||||||||||||||||||||||||||||||||||||
Total liabilities | $ | 638 | $ | 227 | (e) | $ | 1 | $ | 57 | $ | (207 | ) | $ | 716 | $ | (51 | ) (f) | |||||||||||||||||||||||||||
| (a) | Losses for assets are bracketed while losses for liabilities are not. |
| (b) | The amount of the total gains or losses for the period included in earnings that is attributable to the change in unrealized gains or losses related to those assets and liabilities held at the end of the reporting period. |
| (c) | Primarily reflects the reclassification of residential mortgage loans from held for sale to portfolio loans. |
| (d) | Reflects transfers out of Level 3 due to the transfer of residential mortgage loans to OREO. |
| (e) | Net gains (realized and unrealized) included in earnings relating to Level 3 assets and liabilities were $454 million for 2015 compared with net gains (realized and unrealized) of $183 million for 2014. These amounts also included amortization and accretion of $147 million for 2015 compared with $146 million for 2014. The amortization and accretion amounts were included in Interest income on the Consolidated Income Statement, and the remaining net gains/(losses) (realized and unrealized) were included in Noninterest income on the Consolidated Income Statement. |
| (f) | Net unrealized losses relating to those assets and liabilities held at the end of the reporting period were $189 million for 2015, compared with net unrealized gains of $130 million for 2014. These amounts were included in Noninterest income on the Consolidated Income Statement. |
| (g) | Includes swaps entered into in connection with sales of certain Visa Class B common shares. |
| (h) | Reflects transfers from Level 2 to Level 3 due to valuation inputs that were deemed to be unobservable. |
| (i) | Settlements relating to commercial MSRs include $552 million, which represents the fair value as of January 1, 2014 as a result of an irrevocable election to measure all classes of commercial MSRs at fair value. Refer to Note 8 Goodwill and Intangible Assets for additional information on commercial MSRs. |
An instrument's categorization within the hierarchy is based on the lowest level of input that is significant to the fair value measurement. Changes from one quarter to the next related to the observability of inputs to a fair value measurement may result in a reclassification (transfer) of assets or liabilities between hierarchy levels. PNC's policy is to recognize transfers in and transfers out as of the end of the reporting period.
| The PNC Financial Services Group, Inc. – Form 10-K 157 |
Quantitative information about the significant unobservable inputs within Level 3 recurring assets and liabilities follows.
Table 76: Fair Value Measurements – Recurring Quantitative Information
December 31, 2015
Level 3 Instruments Only Dollars in millions | Fair Value | Valuation Techniques | Unobservable Inputs | Range (Weighted Average) | ||||||||||
Residential mortgage-backed non-agency securities | $ | 4,008 | Priced by a third-party vendor using a discounted cash flow | Constant prepayment rate (CPR) Constant default rate (CDR) | 1.0%-24.2% (7.0%) 0.0%-16.7% (5.4%) |
| (a) (a) |
| ||||||
| pricing model (a) | Loss severity Spread over the benchmark curve (b) | 10.0%-98.5% (53.3%) 241bps weighted average |
| (a) (a) |
| |||||||||
Asset-backed securities | 482 | Priced by a third-party vendor | Constant prepayment rate (CPR) | 1.0%-14.0% (6.3%) | (a) | |||||||||
| using a discounted cash flow | Constant default rate (CDR) | 1.7%-13.9% (6.8%) | (a) | |||||||||||
| pricing model (a) | Loss severity | 24.2%-100% (77.5%) | (a) | |||||||||||
| Spread over the benchmark curve (b) | 324bps weighted average | (a) | ||||||||||||
Residential mortgage servicing rights | 1,063 | Discounted cash flow | Constant prepayment rate (CPR) | 0.3%-46.5% (10.6%) | ||||||||||
| Spread over the benchmark curve (b) | 559bps-1,883bps (893bps) | |||||||||||||
Commercial mortgage servicing rights | 526 | Discounted cash flow | Constant prepayment rate (CPR) | 3.9%-26.5% (5.7%) | ||||||||||
| Discount rate | 2.6%-7.7% (7.5%) | |||||||||||||
Commercial mortgage loans held for sale | 641 | Discounted cash flow | Spread over the benchmark curve (b) | 85bps-4,270bps (547bps) | ||||||||||
| Estimated servicing cash flows | 0.0%-7.0% (0.9%) | |||||||||||||
Equity investments – Direct investments | 1,098 | Multiple of adjusted earnings | Multiple of earnings | 4.2x-14.1x (7.6x) | ||||||||||
Loans – Residential real estate | 123 | Consensus pricing (c) | Cumulative default rate | 2.0%-100% (85.1%) | ||||||||||
| Loss severity | 0.0%-100% (27.3%) | |||||||||||||
| Discount rate | 4.9%-7.0% (5.2%) | |||||||||||||
| 116 | Discounted cash flow | Loss severity | 8.0% weighted average | |||||||||||
| Discount rate | 3.9% weighted average | |||||||||||||
Loans – Home equity | 101 | Consensus pricing (c) | Credit and Liquidity discount | 26.0%-99.0% (54.0%) | ||||||||||
BlackRock Series C Preferred Stock | 357 | Consensus pricing (c) | Liquidity discount | 20.0% | ||||||||||
BlackRock LTIP | (357 | ) | Consensus pricing (c) | Liquidity discount | 20.0% | |||||||||
Swaps related to sales of certain Visa Class B common shares | (104 | ) | Discounted cash flow | Estimated conversion factor of Estimated growth rate of Visa | 164.3%
16.3% |
| (d)
|
| ||||||
Insignificant Level 3 assets, net of liabilities (e) | 57 | |||||||||||||
|
| |||||||||||||
Total Level 3 assets, net of liabilities (f) | $ | 8,111 | ||||||||||||
| 158 The PNC Financial Services Group, Inc. – Form 10-K |
December 31, 2014
Level 3 Instruments Only Dollars in millions | Fair Value | Valuation Techniques | Unobservable Inputs | Range (Weighted Average) | ||||||||||
Residential mortgage-backed non-agency securities | $ | 4,798 | Priced by a third-party vendor using a discounted cash flow | Constant prepayment rate (CPR) Constant default rate (CDR) | 1.0%-28.9% (6.8%) 0.0%-16.7% (5.6%) |
| (a) (a) |
| ||||||
| pricing model (a) | Loss severity Spread over the benchmark curve (b) | 6.1%-100.0% (53.1%) 249bps weighted average |
| (a) (a) |
| |||||||||
Asset-backed securities | 563 | Priced by a third-party vendor | Constant prepayment rate (CPR) | 1.0%-15.7% (5.9%) | (a) | |||||||||
| using a discounted cash flow | Constant default rate (CDR) | 1.7%-13.9% (7.6%) | (a) | |||||||||||
| pricing model (a) | Loss severity | 14.6%-100.0% (73.5%) | (a) | |||||||||||
| Spread over the benchmark curve (b) | 352bps weighted average | (a) | ||||||||||||
State and municipal securities | 132 | Discounted cash flow | Spread over the benchmark curve (b) | 55bps-165bps (67bps) | ||||||||||
| 2 | Consensus pricing (c) | Credit and Liquidity discount | 0.0%-20.0% (14.9%) | |||||||||||
Other debt securities | 30 | Consensus pricing (c) | Credit and Liquidity discount | 7.0%-95.0% (88.6%) | ||||||||||
Trading securities – Debt | 32 | Consensus pricing (c) | Credit and Liquidity discount | 0.0%-15.0% (8.0%) | ||||||||||
Residential mortgage servicing rights | 845 | Discounted cash flow | Constant prepayment rate (CPR) | 3.8%-32.7% (11.2%) | ||||||||||
| Spread over the benchmark curve (b) | 889bps-1,888bps (1,036bps) | |||||||||||||
Commercial mortgage servicing rights | 506 | Discounted cash flow | Constant prepayment rate (CPR) | 7.0%-16.8% (8.0%) | ||||||||||
| Discount rate | 2.5%-8.6% (6.6%) | |||||||||||||
Commercial mortgage loans held for sale | 893 | Discounted cash flow | Spread over the benchmark curve (b) Estimated servicing cash flows | 37bps-4,025bps (549bps) 0.0%-2.0% (1.2%) | ||||||||||
Equity investments –Direct investments | 1,152 | Multiple of adjusted earnings | Multiple of earnings | 3.2x-13.9x (7.7x) | ||||||||||
Loans – Residential real estate | 114 | Consensus pricing (c) | Cumulative default rate | 2.0%-100.0% (90.5%) | ||||||||||
| Loss severity | 0.0%-100.0% (35.6%) | |||||||||||||
| Discount rate | 5.4%-7.0% (6.4%) | |||||||||||||
| 154 | Discounted cash flow | Loss severity | 8.0% weighted average | |||||||||||
| Discount rate | 3.4% weighted average | |||||||||||||
Loans – Home equity | 129 | Consensus pricing (c) | Credit and Liquidity discount | 26.0%-99.0% (51.0%) | ||||||||||
BlackRock Series C Preferred Stock | 375 | Consensus pricing (c) | Liquidity discount | 20.0% | ||||||||||
BlackRock LTIP | (375 | ) | Consensus pricing (c) | Liquidity discount | 20.0% | |||||||||
Swaps related to sales of certain Visa Class B common shares | (135 | ) | Discounted cash flow | Estimated conversion factor of Estimated growth rate of Visa Class A | 41.1%
14.8% | |||||||||
Other borrowed funds –non-agency securitization | (166 | ) | Consensus pricing (c) | Credit and Liquidity discount Spread over the benchmark curve (b) | 0.0%-99.0% (18.0%) 113bps | |||||||||
Insignificant Level 3 assets, net of liabilities (e) | 23 | |||||||||||||
|
| |||||||||||||
Total Level 3 assets, net of liabilities (f) | $ | 9,072 | ||||||||||||
| (a) | Level 3 residential mortgage-backed non-agency and asset-backed securities with fair values as of December 31, 2015 totaling $3,379 million and $448 million, respectively, were priced by a third-party vendor using a discounted cash flow pricing model that incorporates consensus pricing, where available. The comparable amounts as of December 31, 2014 were $4,081 million and $532 million, respectively. The significant unobservable inputs for these securities were provided by the third-party vendor and are disclosed in the table. Our procedures to validate the prices provided by the third-party vendor related to these securities are discussed further in the Fair Value Measurement section of this Note 7. Certain Level 3 residential mortgage-backed non-agency and asset-backed securities with fair values as of December 31, 2015 of $629 million and $34 million, respectively, were valued using a pricing source, such as a dealer quote or comparable security price, for which the significant unobservable inputs used to determine the price were not reasonably available. The comparable amounts as of December 31, 2014 were $717 million and $31 million, respectively. |
| (b) | The assumed yield spread over the benchmark curve for each instrument is generally intended to incorporate non-interest-rate risks, such as credit and liquidity risks. |
| (c) | Consensus pricing refers to fair value estimates that are generally internally developed using information such as dealer quotes or other third-party provided valuations or comparable asset prices. |
| (d) | This conversion factor reflects the 4-for-1 split of Visa Class A common shares, which occurred during the first quarter of 2015. |
| (e) | Represents the aggregate amount of Level 3 assets and liabilities measured at fair value on a recurring basis that are individually and in the aggregate insignificant. The amount includes certain financial derivative assets and liabilities, trading securities (for the 2015 period), state and municipal securities (for the 2015 period), other debt securities (for 2015 period), residential mortgage loans held for sale, other assets, other borrowed funds (ROAPs) and other liabilities. For additional information, please see the Fair Value Measurement discussion included in this Note 7. |
| (f) | Consisted of total Level 3 assets of $8,606 million and total Level 3 liabilities of $495 million as of December 31, 2015 and $9,788 million and $716 million as of December 31, 2014, respectively. |
| The PNC Financial Services Group, Inc. – Form 10-K 159 |
Financial Assets Accounted for at Fair Value on a Nonrecurring Basis
We may be required to measure certain financial assets at fair value on a nonrecurring basis. These adjustments to fair value usually result from the application of lower of amortized cost or fair value accounting or write-downs of individual assets due to impairment and are included in Table 77 and Table 78.
Nonaccrual Loans
Nonaccrual loans represent the fair value of those loans which have been adjusted due to impairment. The impairment is primarily based on the appraised value of the collateral or LGD percentage. The LGD percentage is used to determine the weighted average loss severity of the nonaccrual loans.
As part of the appraisal process, persons ordering or reviewing appraisals are independent of the asset manager. Appraisals must be provided by licensed or certified appraisers and conform to the Uniform Standards of Professional Appraisal Practice. For loans secured by commercial properties where the underlying collateral is in excess of $250,000, appraisals are obtained at least annually. In certain instances ( e.g. , physical changes in the property), a more recent appraisal is obtained. Additionally, borrower ordered appraisals are not permitted, and PNC ordered appraisals are regularly reviewed. For loans secured by commercial properties where the underlying collateral is $250,000 and less, there is no requirement to obtain an appraisal. In instances where an appraisal is not obtained, the collateral value is determined consistent with external third-party appraisal standards by an internal person independent of the asset manager. PNC has a real estate valuation services group whose sole function is to manage the real estate appraisal solicitation and evaluation process for commercial loans. All third-party appraisals are reviewed by this group, including consideration of comments/questions on the appraisal by the reviewer, customer relationship manager, credit officer, and underwriter. Upon resolving these comments/questions through discussions with the third-party appraiser, adjustments to the initial appraisal may occur and be incorporated into the final issued appraisal report.
If an appraisal is outdated due to changed project or market conditions, or if the net book value is utilized, management uses an LGD percentage which represents the exposure PNC expects to lose in the event a borrower defaults on an obligation. Accordingly, LGD, which represents the loss severity, is a function of collateral recovery rates and loan-to-value. Those rates are established based upon actual PNC loss experience and external market data. In instances where we have agreed to sell the property to a third party, the fair value is based on the contractual sales price adjusted for costs to sell. In these instances, the most significant unobservable input is the appraised value or the sales price. The estimated costs to sell are incremental direct costs to transact a sale such as broker commissions, legal, closing costs and title transfer fees. The costs must be essential to the sale and would not
have been incurred if the decision to sell had not been made. The costs to sell are based on costs associated with our actual sales of commercial and residential OREO and foreclosed assets, which are assessed annually.
Loans Held for Sale
Loans held for sale includes syndicated commercial loan inventory. The fair value of the syndicated commercial loan inventory is primarily determined based on prices provided by a third-party vendor. The third-party vendor prices are based upon dealer quotes. For nonrecurring fair value measurements, these instruments are classified within Level 2.
Prior to September 1, 2014, loans held for sale also included the carrying value of commercial mortgage loans which are intended to be sold to agencies with servicing retained. The fair value of the commercial mortgage loans held for sale is determined using discounted cash flows. Significant observable market data includes the applicable benchmark interest rates. These instruments are classified within Level 3. Significant unobservable inputs include a spread over the benchmark curve and the estimated servicing cash flows for loans sold to the agencies with servicing retained. Significant increases (decreases) to the spread over the benchmark curve would result in a significantly lower (higher) carrying value of the assets. Significant increases (decreases) in the estimated servicing cash flows for loans sold to the agencies with servicing retained would result in significantly higher (lower) carrying value.
Refer to the Fair Value Measurement section of this Note 7 for information on commercial mortgages held for sale to agencies subsequent to our September 1, 2014 election of fair value option.
Equity Investments
Equity investments represent the carrying value of Low Income Housing Tax Credit (LIHTC) investments held for sale calculated using a discounted cash flow model. The significant unobservable input is management's estimate of required market rate of return. The market rate of return is based on comparison to recent LIHTC sales in the market. Significant increases (decreases) in this input would result in a significantly lower (higher) carrying value of the investments.
OREO and Foreclosed Assets
OREO and foreclosed assets represent the carrying value of OREO and foreclosed assets for which valuation adjustments were recorded subsequent to the transfer to OREO and foreclosed assets. Valuation adjustments are based on the fair value less cost to sell of the property. Fair value is based on appraised value or sales price.
The appraisal process for OREO and foreclosed properties is the same as described above for nonaccrual loans. In instances where we have agreed to sell the property to a third party, the fair value is based on the contractual sale price adjusted for
| 160 The PNC Financial Services Group, Inc. – Form 10-K |
costs to sell. The significant unobservable inputs for OREO and foreclosed assets are the appraised value or the sales price. The estimated costs to sell are incremental direct costs to transact a sale such as broker commissions, legal, closing costs and title transfer fees. The costs must be essential to the sale and would not have been incurred if the decision to sell had not been made. The costs to sell are based on costs associated with our sales of commercial and residential OREO and foreclosed assets, which are assessed annually.
Long-Lived Assets Held for Sale
Long-lived assets held for sale represent the carrying value of the asset for which valuation adjustments were recorded during the current year and subsequent to the transfer to Long-lived assets held for sale. Valuation adjustments are based on the fair value of the property less an estimated cost to sell. Fair value is determined either by a recent appraisal, recent sales offer or changes in market or property conditions. Appraisals are provided by licensed or certified appraisers. Where we have agreed to sell the property to a third party, the fair value is based on the contractual sale price. The significant unobservable inputs for Long-lived assets held for sale are the appraised value, the sales price or the changes in market or property conditions. Changes in market or property conditions are subjectively determined by management through observation of the physical condition of the property along with the condition of properties in the surrounding market place. The availability and recent sales of similar properties is also considered. The range of fair values can vary significantly as this category often includes smaller properties such as offsite ATM locations and smaller rural branches up to large commercial buildings, operation centers or urban branches.
Table 77: Fair Value Measurements – Nonrecurring
| Fair Value | ||||||||
| In millions | December 31 2015 | December 31 2014 | ||||||
Assets (a) | ||||||||
Nonaccrual loans | $ | 30 | $ | 54 | ||||
Loans held for sale (b) | 8 | |||||||
Equity investments | 5 | 17 | ||||||
OREO and foreclosed assets | 137 | 168 | ||||||
Long-lived assets held for sale | 23 | 22 | ||||||
Total assets | $ | 195 | $ | 269 | ||||
| Year ended December 31 | Gains (Losses) | |||||||||||
| In millions | 2015 | 2014 | 2013 | |||||||||
Assets | ||||||||||||
Nonaccrual loans | $ | (44 | ) | $ | (19 | ) | $ | (8 | ) | |||
Loans held for sale (b) | (7 | ) | ||||||||||
Equity investments | (3 | ) | (2 | ) | (1 | ) | ||||||
Commercial mortgage servicing rights (c) | 88 | |||||||||||
OREO and foreclosed assets | (18 | ) | (19 | ) | (26 | ) | ||||||
Long-lived assets held for sale | (20 | ) | (14 | ) | (40 | ) | ||||||
Total assets | $ | (85 | ) | $ | (54 | ) | $ | 6 | ||||
| (a) | All Level 3 as of December 31, 2015 and 2014 except for $8 million included in Loans held for sale which was categorized as Level 2 as of December 31, 2014. |
| (b) | As of September 1, 2014, PNC elected to account for agency loans held for sale at fair value. Accordingly, beginning on September 1, 2014, all new commercial mortgage loans held for sale originated for sale to the agencies are measured at fair value on a recurring basis. |
| (c) | As of January 1, 2014, PNC made an irrevocable election to subsequently measure all classes of commercial MSRs at fair value. Accordingly, beginning with the first quarter of 2014, commercial MSRs are measured at fair value on a recurring basis. |
Quantitative information about the significant unobservable inputs within Level 3 nonrecurring assets follows.
Table 78: Fair Value Measurements – Nonrecurring Quantitative Information
Level 3 Instruments Only Dollars in millions | Fair Value | Valuation Techniques | Unobservable Inputs | Range (Weighted Average) | ||||||
December 31, 2015 | ||||||||||
Assets | ||||||||||
Nonaccrual loans (a) | $ | 20 | LGD percentage (b) | Loss severity | 8.1%-73.3% (58.6%) | |||||
Equity investments | 5 | Discounted cash flow | Market rate of return | 5.0% | ||||||
Other (c) | 170 | Fair value of property or collateral | Appraised value/sales price | Not meaningful | ||||||
|
| |||||||||
Total assets | $ | 195 | ||||||||
December 31, 2014 | ||||||||||
Assets | ||||||||||
Nonaccrual loans (a) | $ | 29 | LGD percentage (b) | Loss severity | 2.9%-68.5% (42.1%) | |||||
Equity investments | 17 | Discounted cash flow | Market rate of return | 6.0% | ||||||
Other (c) | 215 | Fair value of property or collateral | Appraised value/sales price | Not meaningful | ||||||
|
| |||||||||
Total assets | $ | 261 | ||||||||
| (a) | The fair value of nonaccrual loans included in this line item is determined based on internal loss rates. The fair value of nonaccrual loans where the fair value is determined based on the appraised value or sales price is included within Other, below. |
| (b) | LGD percentage represents the amount that PNC expects to lose in the event a borrower defaults on an obligation. |
| (c) | Other included Nonaccrual loans of $10 million, OREO and foreclosed assets of $137 million and Long-lived assets held for sale of $23 million as of December 31, 2015. Comparably, as of December 31, 2014, Other included Nonaccrual loans of $25 million, OREO and foreclosed assets of $168 million and Long-lived assets held for sale of $22 million. The fair value of these assets is determined based on appraised value or sales price, the range of which is not meaningful to disclose. |
| The PNC Financial Services Group, Inc. – Form 10-K 161 |
Financial Instruments Accounted For Under Fair Value Option
We elect the fair value option to account for certain financial instruments. For more information on these financial instruments for which the fair value option election has been made, please refer to the Fair Value Measurement section of this Note 7. These financial instruments are initially measured at fair value, gains and losses from initial measurement and any changes in fair value are subsequently recognized in earnings. Additional information about the financial instruments for which we elected the fair value option follows.
Customer Resale Agreements
Interest income on structured resale agreements is reported on the Consolidated Income Statement in Other interest income. Changes in fair value due to instrument-specific credit risk for 2015 and 2014 were not material.
Commercial Mortgage Loans Held for Sale
Interest income on these loans is recorded as earned and reported on the Consolidated Income Statement in Other interest income. Changes in fair value due to instrument-specific credit risk for both 2015 and 2014 were not material.
Residential Mortgage Loans Held for Sale
Interest income on these loans is recorded as earned and reported on the Consolidated Income Statement in Other interest income. Throughout 2015 and 2014, certain residential mortgage loans for which we elected the fair value option were subsequently reclassified to portfolio loans. Changes in fair value due to instrument-specific credit risk for 2015 and 2014 were not material.
Residential Mortgage Loans – Portfolio
Interest income on these loans is recorded as earned and reported on the Consolidated Income Statement in either Loan interest income or Other interest income. Interest income on
the Home Equity Lines of Credit for which we elected the fair value option during first quarter 2013 is reported on the Consolidated Income Statement in Loan interest income.
Other Assets
Interest income on trading loans is reported on the Consolidated Income Statement in Other interest income. Changes in value on the prepaid forward contract are reported on the Consolidated Income Statement in Other noninterest expense.
Other Borrowed Funds
Interest expense on the Other borrowed funds for which we have elected the fair value option is reported on the Consolidated Income Statement in Borrowed funds interest expense.
The changes in fair value for items for which we elected the fair value option and are included in Noninterest income and Noninterest expense on the Consolidated Income Statement are as follows.
Table 79: Fair Value Option – Changes in Fair Value (a)
| Year ended December 31 | Gains (Losses) | |||||||||||
| In millions | 2015 | 2014 | 2013 | |||||||||
Assets | ||||||||||||
Customer resale agreements | $ | (2 | ) | $ | (3 | ) | $ | (7 | ) | |||
Commercial mortgage loans held for sale | 96 | 50 | (10 | ) | ||||||||
Residential mortgage loans held for sale | 152 | 212 | 213 | |||||||||
Residential mortgage loans – portfolio | 43 | 157 | 60 | |||||||||
BlackRock Series C Preferred Stock | (18 | ) | 43 | 122 | ||||||||
Other assets | 12 | 2 | 3 | |||||||||
Liabilities | ||||||||||||
Other borrowed funds | 4 | (5 | ) | (9 | ) | |||||||
| (a) | The impact on earnings of offsetting hedged items or hedging instruments is not reflected in these amounts. |
| 162 The PNC Financial Services Group, Inc. – Form 10-K |
Fair values and aggregate unpaid principal balances of items for which we elected the fair value option follow.
Table 80: Fair Value Option – Fair Value and Principal Balances
| In millions | Fair Value | Aggregate Unpaid Principal Balance | Difference | |||||||||
December 31, 2015 | ||||||||||||
Assets | ||||||||||||
Customer resale agreements | $ | 137 | $ | 133 | $ | 4 | ||||||
Residential mortgage loans held for sale | ||||||||||||
Performing loans | 832 | 804 | 28 | |||||||||
Accruing loans 90 days or more past due | 4 | 4 | ||||||||||
Nonaccrual loans | 7 | 8 | (1 | ) | ||||||||
Total | 843 | 816 | 27 | |||||||||
Commercial mortgage loans held for sale (a) | ||||||||||||
Performing loans | 639 | 659 | (20 | ) | ||||||||
Nonaccrual loans | 2 | 3 | (1 | ) | ||||||||
Total | 641 | 662 | (21 | ) | ||||||||
Residential mortgage loans – portfolio | ||||||||||||
Performing loans | 204 | 260 | (56 | ) | ||||||||
Accruing loans 90 days or more past due | 475 | 478 | (3 | ) | ||||||||
Nonaccrual loans | 226 | 361 | (135 | ) | ||||||||
Total | 905 | 1,099 | (194 | ) | ||||||||
Other assets | 164 | 159 | 5 | |||||||||
Liabilities | ||||||||||||
Other borrowed funds | $ | 93 | $ | 95 | $ | (2 | ) | |||||
December 31, 2014 | ||||||||||||
Assets | ||||||||||||
Customer resale agreements | $ | 155 | $ | 148 | $ | 7 | ||||||
Residential mortgage loans held for sale | ||||||||||||
Performing loans | 1,236 | 1,176 | 60 | |||||||||
Accruing loans 90 days or more past due | 9 | 9 | ||||||||||
Nonaccrual loans | 16 | 17 | (1 | ) | ||||||||
Total | 1,261 | 1,202 | 59 | |||||||||
Commercial mortgage loans held for sale (a) | ||||||||||||
Performing loans | 873 | 908 | (35 | ) | ||||||||
Nonaccrual loans | 20 | 64 | (44 | ) | ||||||||
Total | 893 | 972 | (79 | ) | ||||||||
Residential mortgage loans – portfolio | ||||||||||||
Performing loans | 194 | 256 | (62 | ) | ||||||||
Accruing loans 90 days or more past due | 570 | 573 | (3 | ) | ||||||||
Nonaccrual loans | 270 | 449 | (179 | ) | ||||||||
Total | 1,034 | 1,278 | (244 | ) | ||||||||
Other assets | 37 | 37 | ||||||||||
Liabilities | ||||||||||||
Other borrowed funds | $ | 273 | $ | 312 | $ | (39 | ) | |||||
| (a) | There were no accruing loans 90 days or more past due within this category at December 31, 2015 or December 31, 2014. |
The PNC Financial Services Group, Inc. – Form 10-K 163
Additional Fair Value Information Related to Other Financial Instruments
The following table presents the carrying amounts and estimated fair values, including the level within the fair value hierarchy, of all other financial instruments that are not measured on the consolidated financial statements at fair value as of December 31, 2015 and December 31, 2014.
Table 81: Additional Fair Value Information Related to Other Financial Instruments
| In millions | Carrying Amount | Fair Value | ||||||||||||||||||
| Total | Level 1 | Level 2 | Level 3 | |||||||||||||||||
December 31, 2015 | ||||||||||||||||||||
Assets | ||||||||||||||||||||
Cash and due from banks | $ | 4,065 | $ | 4,065 | $ | 4,065 | ||||||||||||||
Short-term assets | 32,959 | 32,959 | $ | 32,959 | ||||||||||||||||
Securities held to maturity | 14,768 | 15,002 | 298 | 14,698 | $ | 6 | ||||||||||||||
Loans held for sale | 56 | 56 | 22 | 34 | ||||||||||||||||
Net loans (excludes leases) | 195,579 | 197,611 | 197,611 | |||||||||||||||||
Other assets | 1,817 | 2,408 | 1,786 | 622 | (a) | |||||||||||||||
Total assets | $ | 249,244 | $ | 252,101 | $ | 4,363 | $ | 49,465 | $ | 198,273 | ||||||||||
Liabilities | ||||||||||||||||||||
Demand, savings and money market deposits | $ | 228,492 | $ | 228,492 | $ | 228,492 | ||||||||||||||
Time deposits | 20,510 | 20,471 | 20,471 | |||||||||||||||||
Borrowed funds | 53,761 | 54,002 | 52,578 | $ | 1,424 | |||||||||||||||
Unfunded loan commitments and letters of credit | 245 | 245 | 245 | |||||||||||||||||
Total liabilities | $ | 303,008 | $ | 303,210 | $ | 301,541 | $ | 1,669 | ||||||||||||
December 31, 2014 | ||||||||||||||||||||
Assets | ||||||||||||||||||||
Cash and due from banks | $ | 4,360 | $ | 4,360 | $ | 4,360 | ||||||||||||||
Short-term assets | 34,380 | 34,380 | $ | 34,380 | ||||||||||||||||
Securities held to maturity | 11,588 | 11,984 | 292 | 11,683 | $ | 9 | ||||||||||||||
Loans held for sale | 108 | 108 | 56 | 52 | ||||||||||||||||
Net loans (excludes leases) | 192,573 | 194,564 | 194,564 | |||||||||||||||||
Other assets | 1,879 | 2,544 | 1,802 | 742 | (a) | |||||||||||||||
Total assets | $ | 244,888 | $ | 247,940 | $ | 4,652 | $ | 47,921 | $ | 195,367 | ||||||||||
Liabilities | ||||||||||||||||||||
Demand, savings and money market deposits | $ | 210,838 | $ | 210,838 | $ | 210,838 | ||||||||||||||
Time deposits | 21,396 | 21,392 | 21,392 | |||||||||||||||||
Borrowed funds | 55,329 | 56,011 | 54,574 | $ | 1,437 | |||||||||||||||
Unfunded loan commitments and letters of credit | 240 | 240 | 240 | |||||||||||||||||
Total liabilities | $ | 287,803 | $ | 288,481 | $ | 286,804 | $ | 1,677 | ||||||||||||
| (a) | Represents estimated fair value of Visa Class B common shares, which was estimated solely based upon the December 31, 2015 and December 31, 2014 closing price for the Visa Class A common shares, respectively, and the Visa Class B common share conversion rate, which reflects adjustments in respect of all litigation funding by Visa as of that date. The transfer restrictions on the Visa Class B common shares could impact the aforementioned estimate, until they can be converted to Class A common shares. See Note 21 Commitments and Guarantees for additional information. |
| 164 The PNC Financial Services Group, Inc. – Form 10-K |
The aggregate fair values in the preceding table represent only a portion of the total market value of PNC's assets and liabilities as, in accordance with the guidance related to fair values of financial instruments, Table 81 excludes the following:
| • | financial instruments recorded at fair value on a recurring basis, |
| • | real and personal property, |
| • | lease financing, |
| • | loan customer relationships, |
| • | deposit customer intangibles, |
| • | mortgage servicing rights, |
| • | retail branch networks, |
| • | fee-based businesses, such as asset management and brokerage, and |
| • | trademarks and brand names. |
We used the following methods and assumptions to estimate the fair value amounts for financial instruments included in Table 81.
General
For short-term financial instruments realizable in three months or less, the carrying amount reported on our Consolidated Balance Sheet approximates fair value. Unless otherwise stated, the rates used in discounted cash flow analyses are based on market yield curves.
Cash and due from banks
The carrying amounts reported on our Consolidated Balance Sheet for cash and due from banks approximate fair values. For purposes of this disclosure only, cash and due from banks includes the following:
| • | due from banks, and |
| • | non-interest-earning deposits with banks. |
Short-Term Assets
The carrying amounts reported on our Consolidated Balance Sheet for short-term investments approximate fair values primarily due to their short-term nature. For purposes of this disclosure only, short-term assets include the following:
| • | federal funds sold and resale agreements, |
| • | cash collateral, |
| • | customers' acceptances, |
| • | accrued interest receivable, and |
| • | interest-earning deposits with banks. |
Securities held to maturity
We primarily use prices obtained from pricing services, dealer quotes or recent trades to determine the fair value of securities. As of December 31, 2015, 95% of the positions in the held to maturity portfolio were priced by pricing services provided by third-party vendors. Refer to the Fair Value Measurement section of this Note 7 for additional information relating to our pricing processes and procedures.
Net Loans And Loans Held For Sale
Fair values are estimated based on the discounted value of expected net cash flows incorporating assumptions about prepayment rates, net credit losses and servicing fees. For revolving home equity loans and commercial credit lines, this fair value does not include any amount for new loans or the related fees that will be generated from the existing customer relationships. Nonaccrual loans are valued at their estimated recovery value. Loans are presented net of the ALLL and do not include future accretable discounts related to purchased impaired loans.
Other Assets
Other assets as shown in Table 81 includes equity investments carried at cost as well as FHLB and FRB stock. The aggregate carrying value of our FHLB and FRB stock was $1.8 billion at both December 31, 2015 and December 31, 2014, which approximates fair value at each date.
Investments accounted for under the equity method, including our investment in BlackRock, are not included in Table 81.
Deposits
For deposits with no defined maturity, such as noninterest-bearing and interest-bearing demand and interest-bearing money market and savings deposits, carrying values approximate fair values. For time deposits, fair values are estimated by discounting contractual cash flows using current market rates for instruments with similar maturities. The value of long-term relationships with depositors was not taken into account in estimating fair values.
Borrowed Funds
For short-term borrowings, including Federal funds purchased, commercial paper, repurchase agreements, and certain other short-term borrowings and payables, carrying values approximated fair values. For long-term borrowed funds, quoted market prices are used, when available, to estimate fair value. When quoted market prices are not available, fair value is estimated based on current market interest rates and credit spreads for debt with similar terms and maturities.
Unfunded Loan Commitments And Letters Of Credit
The fair value of unfunded loan commitments and letters of credit is determined from a market participant's view including the impact of changes in interest rates and credit. Because our obligation on substantially all unfunded loan commitments and letters of credit varies with changes in interest rates, these instruments are subject to little fluctuation in fair value due to changes in interest rates. We establish a liability on these facilities related to the creditworthiness of our counterparty.
| The PNC Financial Services Group, Inc. – Form 10-K 165 |
N OTE 8 G OODWILL AND I NTANGIBLE A SSETS
Assets and liabilities of acquired entities are recorded at estimated fair value as of the acquisition date.
Goodwill
Changes in goodwill by business segment during 2015 and 2014 follow:
Table 82: Goodwill by Business Segment (a)
| In millions | Retail Banking | Corporate & Institutional Banking | Asset Management Group | Total | ||||||||||||
December 31, 2013 | $ | 5,795 | $ | 3,215 | $ | 64 | $ | 9,074 | ||||||||
Other | 29 | 29 | ||||||||||||||
December 31, 2014 | $ | 5,795 | $ | 3,244 | $ | 64 | $ | 9,103 | ||||||||
December 31, 2015 | $ | 5,795 | $ | 3,244 | $ | 64 | $ | 9,103 | ||||||||
| (a) | The Residential Mortgage Banking, BlackRock and Non-Strategic Assets Portfolio business segments did not have any goodwill allocated to them during 2015, 2014, and 2013. |
We conduct a goodwill impairment test on our reporting units at least annually, in the fourth quarter, or more frequently if events occur or circumstances have changed significantly from the annual test date. The fair value of our reporting units with goodwill is determined by using discounted cash flow and, when applicable, market comparability methodologies. Based on the results of our analysis, there were no impairment charges related to goodwill in 2015 or 2014.
Mortgage Servicing Rights
We recognize the right to service mortgage loans for others as an intangible asset. MSRs are purchased or originated when loans are sold with servicing retained. MSRs totaled $1.6 billion and $1.4 billion at December 31, 2015 and December 31, 2014, respectively, and consisted of loan servicing contracts for commercial and residential mortgages measured at fair value.
Commercial Mortgage Servicing Rights
As of January 1, 2014, PNC made an irrevocable election to subsequently measure all classes of commercial MSRs at fair value in order to eliminate any potential measurement mismatch between our economic hedges and the commercial MSRs. The impact of the cumulative-effect adjustment to retained earnings was not material, and the valuation allowance associated with the commercial MSRs was reclassified to the gross carrying amount of commercial MSRs. We recognize gains/(losses) on changes in the fair value of commercial MSRs as a result of the election. Commercial MSRs are subject to declines in value from actual or expected prepayment of the underlying loans and defaults as well as market driven changes in interest rates. We manage this risk by economically hedging the fair value of commercial MSRs with securities and derivative instruments which are expected to increase (or decrease) in value when the value of commercial MSRs declines (or increases).
The fair value of commercial MSRs is estimated by using a discounted cash flow model incorporating inputs for assumptions as to constant prepayment rates, discount rates and other factors determined based on current market conditions and expectations.
Changes in the commercial MSRs accounted for at fair value during 2015 and 2014, follow:
Table 83: Commercial Mortgage Servicing Rights Accounted for at Fair Value
| In millions | 2015 | 2014 | ||||||
January 1 | $ | 506 | $ | 552 | ||||
Additions: | ||||||||
From loans sold with servicing retained | 63 | 53 | ||||||
Purchases | 55 | 43 | ||||||
Changes in fair value due to: | ||||||||
Time and payoffs (a) | (89 | ) | (89 | ) | ||||
Other (b) | (9 | ) | (53 | ) | ||||
December 31 | $ | 526 | $ | 506 | ||||
Related unpaid principal balance at December 31 | $ | 145,823 | $ | 143,738 | ||||
Servicing advances at December 31 | $ | 251 | $ | 299 | ||||
| (a) | Represents decrease in MSR value due to passage of time, including the impact from both regularly scheduled loan principal payments and loans that were paid down or paid off during the period. |
| (b) | Represents MSR value changes resulting primarily from market-driven changes in interest rates. |
Prior to 2014, commercial MSRs were initially recorded at fair value and subsequently accounted for at the lower of amortized cost or fair value. These rights were substantially amortized in proportion to and over the period of estimated net servicing income of 5 to 10 years. Commercial MSRs were periodically evaluated for impairment. For purposes of impairment, the commercial MSRs were stratified based on asset type, which characterized the predominant risk of the underlying financial asset. If the carrying amount of any individual stratum exceeded its fair value, a valuation reserve was established with a corresponding charge to Corporate services on our Consolidated Income Statement.
| 166 The PNC Financial Services Group, Inc. – Form 10-K |
Changes in commercial MSRs during 2013, prior to the irrevocable fair value election, follow:
Table 84: Commercial Mortgage Servicing Rights Accounted for Under the Amortization Method
| In millions | 2013 | |||
Commercial Mortgage Servicing Rights – Net Carrying Amount | ||||
January 1 | $ | 420 | ||
Additions (a) | 138 | |||
Amortization expense | (97 | ) | ||
Change in valuation allowance | 88 | |||
December 31 | $ | 549 | ||
Servicing advances at December 31 | $ | 412 | ||
Commercial Mortgage Servicing Rights – Valuation Allowance | ||||
January 1 | $ | (176 | ) | |
Provision | (21 | ) | ||
Recoveries | 108 | |||
Other | 1 | |||
December 31 | $ | (88 | ) | |
| (a) | Additions for 2013 included $53 million from loans sold with servicing retained and $85 million from purchases of servicing rights from third parties. |
Residential Mortgage Servicing Rights
We recognize mortgage servicing right assets on residential real estate loans when we retain the obligation to service these loans upon sale and the servicing fee is more than adequate compensation. Residential MSRs are subject to declines in value from actual or expected prepayment of the underlying loans and defaults as well as market driven changes in interest rates. We manage this risk by economically hedging the fair value of residential MSRs with securities and derivative instruments which are expected to increase (or decrease) in value when the value of residential MSRs declines (or increases).
The fair value of residential MSRs is estimated by using a discounted cash flow valuation model which calculates the present value of estimated future net servicing cash flows, taking into consideration actual and expected mortgage loan prepayment rates, discount rates, servicing costs, and other economic factors which are determined based on current market conditions.
Changes in the residential MSRs follow:
Table 85: Residential Mortgage Servicing Rights
| In millions | 2015 | 2014 | 2013 | |||||||||
January 1 | $ | 845 | $ | 1,087 | $ | 650 | ||||||
Additions: | ||||||||||||
From loans sold with servicing retained | 78 | 85 | 158 | |||||||||
Purchases | 316 | 45 | 110 | |||||||||
Sales | (4 | ) | ||||||||||
Changes in fair value due to: | ||||||||||||
Time and payoffs (a) | (178 | ) | (134 | ) | (193 | ) | ||||||
Other (b) | 2 | (238 | ) | 366 | ||||||||
December 31 | $ | 1,063 | $ | 845 | $ | 1,087 | ||||||
Unpaid principal balance of loans serviced for others at December 31 | $ | 123,466 | $ | 108,010 | $ | 113,994 | ||||||
Servicing advances at December 31 | $ | 411 | $ | 501 | $ | 571 | ||||||
| (a) | Represents decrease in MSR value due to passage of time, including the impact from both regularly scheduled loan principal payments and loans that were paid down or paid off during the period. |
| (b) | Represents MSR value changes resulting primarily from market-driven changes in interest rates. |
Sensitivity Analysis
The fair value of commercial and residential MSRs and significant inputs to the valuation models as of December 31, 2015 are shown in the tables below. The expected and actual rates of mortgage loan prepayments are significant factors driving the fair value. Management uses both internal proprietary models and a third-party model to estimate future commercial mortgage loan prepayments and a third-party model to estimate future residential mortgage loan prepayments. These models have been refined based on current market conditions and management judgment. Future interest rates are another important factor in the valuation of MSRs. Management utilizes market implied forward interest rates to estimate the future direction of mortgage and discount rates. The forward rates utilized are derived from the current yield curve for U.S. dollar interest rate swaps and are consistent with pricing of capital markets instruments. Changes in the shape and slope of the forward curve in future periods may result in volatility in the fair value estimate.
A sensitivity analysis of the hypothetical effect on the fair value of MSRs to adverse changes in key assumptions is presented below. These sensitivities do not include the impact of the related hedging activities. Changes in fair value generally cannot be extrapolated because the relationship of the change in the assumption to the change in fair value may not be linear. Also, the effect of a variation in a particular assumption on the fair value of the MSRs is calculated independently without changing any other assumption. In reality, changes in one factor may result in changes in another (for example, changes in mortgage interest rates, which drive
| The PNC Financial Services Group, Inc. – Form 10-K 167 |
changes in prepayment rate estimates, could result in changes in the interest rate spread), which could either magnify or counteract the sensitivities.
The following tables set forth the fair value of commercial and residential MSRs and the sensitivity analysis of the hypothetical effect on the fair value of MSRs to immediate adverse changes of 10% and 20% in those assumptions:
Table 86: Commercial Mortgage Loan Servicing Rights – Key Valuation Assumptions
| Dollars in millions | December 31 2015 | December 31 2014 | ||||||
Fair value | $ | 526 | $ | 506 | ||||
Weighted-average life (years) | 4.7 | 4.7 | ||||||
Weighted-average constant prepayment rate | 5.71 | % | 8.03 | % | ||||
Decline in fair value from 10% adverse change | $ | 10 | $ | 10 | ||||
Decline in fair value from 20% adverse change | $ | 19 | $ | 19 | ||||
Effective discount rate | 7.49 | % | 6.59 | % | ||||
Decline in fair value from 10% adverse change | $ | 14 | $ | 13 | ||||
Decline in fair value from 20% adverse change | $ | 29 | $ | 26 | ||||
Table 87: Residential Mortgage Loan Servicing Rights – Key Valuation Assumptions
| Dollars in millions | December 31 2015 | December 31 2014 | ||||||
Fair value | $ | 1,063 | $ | 845 | ||||
Weighted-average life (years) | 6.3 | 6.1 | ||||||
Weighted-average constant prepayment rate | 10.61 | % | 11.16 | % | ||||
Decline in fair value from 10% adverse change | $ | 44 | $ | 36 | ||||
Decline in fair value from 20% adverse change | $ | 85 | $ | 69 | ||||
Weighted-average option adjusted spread | 8.93 | % | 10.36 | % | ||||
Decline in fair value from 10% adverse change | $ | 34 | $ | 31 | ||||
Decline in fair value from 20% adverse change | $ | 67 | $ | 61 | ||||
Fees from mortgage loan servicing, which includes contractually specified servicing fees, late fees and ancillary fees, follows:
Table 88: Fees from Mortgage Loan Servicing
| In millions | 2015 | 2014 | 2013 | |||||||||
Fees from mortgage loan servicing | $ | 510 | $ | 503 | $ | 544 | ||||||
We also generate servicing fees from fee-based activities provided to others for which we do not have an associated servicing asset.
Fees from commercial and residential MSRs are reported on our Consolidated Income Statement in the line items Corporate services and Residential mortgage, respectively.
Other Intangible Assets
Other intangible assets consist primarily of core deposit intangibles, customer lists and non-compete agreements. Core deposit intangibles are amortized on an accelerated basis, whereas the remaining other intangible assets are amortized on a straight-line basis. The estimated remaining useful lives of our other intangible assets range from 1 year to 9 years, with a weighted-average remaining useful life of 6 years.
Other intangible assets were as follows at December 31, 2015 and December 31, 2014:
Table 89: Other Intangible Assets
| In millions | December 31 2015 | December 31 2014 | ||||||
Gross carrying amount | $ | 1,499 | $ | 1,502 | ||||
Accumulated amortization | (1,120 | ) | (1,009 | ) | ||||
Net carrying amount | $ | 379 | $ | 493 | ||||
Changes in other intangible assets during 2015 and 2014 follow:
Table 90: Summary of Changes in Other Intangible Assets
| In millions | ||||
December 31, 2013 | $ | 580 | ||
Additions | 41 | |||
Amortization | (128 | ) | ||
December 31, 2014 | $ | 493 | ||
Amortization | (114 | ) | ||
December 31, 2015 | $ | 379 | ||
| 168 The PNC Financial Services Group, Inc. – Form 10-K |
Amortization expense on existing other intangible assets for 2015, 2014 and 2013, as well as estimated future amortization expense for the next five fiscal years, follows:
Table 91: Amortization Expense on Existing Intangible Assets
| In millions | ||||
2013 (a) | $ | 243 | ||
2014 | 128 | |||
2015 | 114 | |||
2016 | 97 | |||
2017 | 83 | |||
2018 | 72 | |||
2019 | 61 | |||
2020 | 37 | |||
| (a) | Amounts include amortization expense related to commercial MSRs. As of January 1, 2014, PNC made an irrevocable election to measure commercial MSRs at fair value, and, accordingly, amortization expense for commercial MSRs is no longer recorded. |
N OTE 9 P REMISES , E QUIPMENT AND L EASEHOLD I MPROVEMENTS
Premises, equipment and leasehold improvements, stated at cost less accumulated depreciation and amortization, were as follows:
Table 92: Premises, Equipment and Leasehold Improvements
| In millions | December 31 2015 | December 31 2014 | ||||||
Total Premises, equipment and leasehold improvements (a) | $ | 10,257 | $ | 9,416 | ||||
Accumulated depreciation and amortization | (4,349 | ) | (3,773 | ) | ||||
Net book value | $ | 5,908 | $ | 5,643 | ||||
| (a) | Primarily relates to equipment and buildings. |
Depreciation expense on premises, equipment and leasehold improvements and amortization expense, excluding intangible assets, primarily for capitalized internally developed software was as follows:
Table 93: Depreciation and Amortization Expense
Year ended December 31 In millions | 2015 | 2014 | 2013 | |||||||||
Depreciation | $ | 643 | $ | 618 | $ | 546 | ||||||
Amortization | 40 | 30 | 23 | |||||||||
Total depreciation and amortization | 683 | 648 | 569 | |||||||||
We lease certain facilities and equipment under agreements expiring at various dates through the year 2081. We account for these as operating leases. Rental expense on such leases was as follows:
Table 94: Lease Rental Expense
Year ended December 31 In millions | 2015 | 2014 | 2013 | |||||||||
Lease rental expense: | $ | 460 | $ | 414 | $ | 412 | ||||||
Required minimum annual rentals that we owe on noncancelable leases having initial or remaining terms in excess of one year totaled $2.7 billion at December 31, 2015. Future minimum annual rentals are as follows:
| • | 2016: $378 million, |
| • | 2017: $350 million, |
| • | 2018: $315 million, |
| • | 2019: $264 million, |
| • | 2020: $222 million, and |
| • | 2021 and thereafter: $1.2 billion. |
N OTE 10 T IME D EPOSITS
Total time deposits of $20.5 billion at December 31, 2015 have future contractual maturities, including related purchase accounting adjustments, as follows:
| • | 2016: $15.1 billion, |
| • | 2017: $1.2 billion, |
| • | 2018: $0.4 billion, |
| • | 2019: $0.4 billion, |
| • | 2020: $0.8 billion, and |
| • | 2021 and thereafter: $2.6 billion. |
N OTE 11 B ORROWED F UNDS
The following shows the carrying value of total borrowed funds of $54.5 billion at December 31, 2015 (including adjustments related to purchase accounting, accounting hedges and unamortized original issuance discounts) by remaining contractual maturity:
| • | 2016: $10.9 billion, |
| • | 2017: $10.6 billion, |
| • | 2018: $11.2 billion, |
| • | 2019: $8.4 billion, |
| • | 2020: $4.7 billion, and |
| • | 2021 and thereafter: $8.7 billion. |
| The PNC Financial Services Group, Inc. – Form 10-K 169 |
The following table presents the contractual rates and maturity dates of our FHLB borrowings, bank notes, senior debt and subordinated debt as of December 31, 2015.
Table 95: FHLB Borrowings, Bank Notes, Senior Debt and Subordinated Debt
| December 31, 2015 – Dollars in millions | Carrying Value | Stated Rate | Maturity | |||||||||
FHLB (a) | $ | 20,108 | zero-6.50 | % | 2016-2030 | |||||||
Bank notes and senior debt | ||||||||||||
Bank notes | $ | 16,033 | zero-3.30 | % | 2016-2043 | |||||||
Senior debt | 5,265 | 2.70%-6.70 | % | 2016-2022 | ||||||||
Total bank notes and senior debt | $ | 21,298 | ||||||||||
Subordinated debt | ||||||||||||
Junior | $ | 205 | .98 | % | 2028 | |||||||
Other | 8,351 | .82%-6.88 | % | 2016-2025 | ||||||||
Total subordinated debt | $ | 8,556 | ||||||||||
| (a) | FHLB borrowings are generally collateralized by residential mortgage loans, other mortgage-related loans and commercial mortgage-backed securities. |
In the table above, the carrying values for bank notes, senior debt and subordinated debt include basis adjustments of $36 million, $175 million and $246 million, respectively, related to fair value accounting hedges as of December 31, 2015.
Also included in borrowed funds are repurchase agreements. See Note 21 Commitments and Guarantees for additional information on those agreements. Additionally, certain borrowings are reported at fair value. Refer to Note 7 Fair Value for more information on those borrowings.
Junior Subordinated Debentures
PNC Capital Trust C, a wholly-owned finance subsidiary of PNC, owns junior subordinated debentures issued by PNC with a carrying value of $205 million. In June 1998, PNC Capital Trust C issued $200 million of trust preferred securities which bear interest at an annual rate of 3 month LIBOR plus 57 basis points. The trust preferred securities are due June 1, 2028 and are currently redeemable by PNC Capital Trust C at par. At December 31, 2015, the interest rate in effect was .98%. This carrying value and related net discounts of $1 million comprise the $206 million principal amount of junior subordinated debentures associated with $200 million of trust preferred securities that were issued by the Trust. In accordance with GAAP, the financial statements of the Trust are not included in PNC's consolidated financial statements.
The obligations of PNC, as the parent of the Trust, when taken collectively, are the equivalent of a full and unconditional guarantee of the obligations of the Trust under the terms of the trust preferred securities. Such guarantee is subordinate in
right of payment in the same manner as other junior subordinated debt. There are certain restrictions on PNC's overall ability to obtain funds from its subsidiaries. For additional disclosure on these funding restrictions, see Note 19 Regulatory Matters. PNC and PNC Bank are also subject to restrictions on dividends and other provisions potentially imposed by the REIT preferred securities, including under the Exchange Agreement with PNC Preferred Funding Trust II, as described in Note 16 Equity.
PNC is subject to certain restrictions, including restrictions on dividend payments, in connection with the outstanding junior subordinated debentures. Generally, if there is (i) an event of default under the debenture, (ii) PNC elects to defer interest on the debenture, (iii) PNC exercises its right to defer payments on the related trust preferred securities, or (iv) there is a default under PNC's guarantee of such payment obligations, then PNC would be subject during the period of such default or deferral to restrictions on dividends and other provisions protecting the status of the debenture holders similar to or in some ways more restrictive than those potentially imposed under the Exchange Agreement with PNC Preferred Funding Trust II, as described in Note 16 Equity.
N OTE 12 E MPLOYEE B ENEFIT P LANS
Pension and Postretirement Plans
We have a noncontributory, qualified defined benefit pension plan covering eligible employees. Benefits are determined using a cash balance formula where earnings credits are a percentage of eligible compensation. Earnings credit percentages for those employees who were plan participants on December 31, 2009 are frozen at the level earned to that point. Earnings credits for all employees who become participants on or after January 1, 2010 are a flat 3% of eligible compensation. All plan participants earn interest on their cash balances based on 30-year Treasury securities rates with those who were participants at December 31, 2009 earning a minimum rate. New participants on or after January 1, 2010 are not subject to the minimum rate. Any pension contributions to the plan are based on an actuarially determined amount necessary to fund total benefits payable to plan participants. In February 2015, PNC made a voluntary contribution of $200 million to the qualified pension plan.
We also maintain nonqualified supplemental retirement plans for certain employees and provide certain health care and life insurance benefits for qualifying retired employees (postretirement benefits) through various plans. PNC reserves the right to terminate or make changes to these plans at any time. The nonqualified pension plan is unfunded. In November of 2015, PNC established a voluntary employee beneficiary association (VEBA) to partially fund postretirement medical and life insurance benefit obligations. PNC made a contribution of $200 million to the VEBA in December 2015.
| 170 The PNC Financial Services Group, Inc. – Form 10-K |
We use a measurement date of December 31 for plan assets and benefit obligations. A reconciliation of the changes in the projected benefit obligation for qualified pension, nonqualified pension and postretirement benefit plans as well as the change in plan assets for the qualified pension plan follows.
Table 96: Reconciliation of Changes in Projected Benefit Obligation and Change in Plan Assets
| Qualified Pension | Nonqualified Pension | Postretirement Benefits | ||||||||||||||||||||||
| December 31 (Measurement Date) – in millions | 2015 | 2014 | 2015 | 2014 | 2015 | 2014 | ||||||||||||||||||
Accumulated benefit obligation at end of year | $ | 4,330 | $ | 4,427 | $ | 292 | $ | 316 | ||||||||||||||||
Projected benefit obligation at beginning of year | $ | 4,499 | $ | 3,966 | $ | 322 | $ | 292 | $ | 379 | $ | 375 | ||||||||||||
Service cost | 107 | 103 | 3 | 3 | 5 | 5 | ||||||||||||||||||
Interest cost | 177 | 187 | 11 | 12 | 15 | 16 | ||||||||||||||||||
Plan amendments | (7 | ) | ||||||||||||||||||||||
Actuarial (gains)/losses and changes in assumptions | (126 | ) | 504 | (10 | ) | 40 | (9 | ) | 4 | |||||||||||||||
Participant contributions | 5 | 8 | ||||||||||||||||||||||
Federal Medicare subsidy on benefits paid | 2 | 2 | ||||||||||||||||||||||
Benefits paid | (260 | ) | (254 | ) | (28 | ) | (25 | ) | (28 | ) | (31 | ) | ||||||||||||
Settlement payments | (1 | ) | ||||||||||||||||||||||
Projected benefit obligation at end of year | $ | 4,397 | $ | 4,499 | $ | 298 | $ | 322 | $ | 368 | $ | 379 | ||||||||||||
Fair value of plan assets at beginning of year | $ | 4,357 | $ | 4,252 | ||||||||||||||||||||
Actual return on plan assets | 19 | 359 | ||||||||||||||||||||||
Employer contribution | 200 | $ | 28 | $ | 25 | $ | 222 | $ | 21 | |||||||||||||||
Participant contributions | 5 | 8 | ||||||||||||||||||||||
Federal Medicare subsidy on benefits paid | 2 | 2 | ||||||||||||||||||||||
Benefits paid | (260 | ) | (254 | ) | (28 | ) | (25 | ) | (28 | ) | (31 | ) | ||||||||||||
Settlement payments | (1 | ) | ||||||||||||||||||||||
Fair value of plan assets at end of year | $ | 4,316 | $ | 4,357 | $ | 200 | ||||||||||||||||||
Funded status | $ | (81 | ) | $ | (142 | ) | $ | (298 | ) | $ | (322 | ) | $ | (168 | ) | $ | (379 | ) | ||||||
Amounts recognized on the consolidated balance sheet | ||||||||||||||||||||||||
Noncurrent asset | ||||||||||||||||||||||||
Current liability | $ | (27 | ) | $ | (31 | ) | $ | (2 | ) | $ | (25 | ) | ||||||||||||
Noncurrent liability | $ | (81 | ) | $ | (142 | ) | (271 | ) | (291 | ) | (166 | ) | (354 | ) | ||||||||||
Net amount recognized on the consolidated balance sheet | $ | (81 | ) | $ | (142 | ) | $ | (298 | ) | $ | (322 | ) | $ | (168 | ) | $ | (379 | ) | ||||||
Amounts recognized in accumulated other comprehensive income consist of: | ||||||||||||||||||||||||
Prior service cost (credit) | $ | (13 | ) | $ | (22 | ) | $ | 1 | $ | 1 | $ | (3 | ) | $ | (4 | ) | ||||||||
Net actuarial loss | 794 | 673 | 71 | 88 | 22 | 31 | ||||||||||||||||||
Amount recognized in AOCI | $ | 781 | $ | 651 | $ | 72 | $ | 89 | $ | 19 | $ | 27 | ||||||||||||
At December 31, 2015, the fair value of the qualified pension plan assets was less than both the accumulated benefit obligation and the projected benefit obligation.
The nonqualified pension plan is unfunded. Contributions from PNC and, in the case of the postretirement benefit plans, participant contributions cover all benefits paid under the nonqualified pension plan and postretirement benefit plans. The postretirement plan provides benefits to certain retirees that are at least actuarially equivalent to those provided by Medicare Part D and accordingly, we receive a federal subsidy as shown in Table 96.
In March 2010, the Patient Protection and Affordable Care Act (PPACA) was enacted. Key aspects of the PPACA which
are reflected in our consolidated financial statements include the excise tax on high-cost health plans beginning in 2018 and fees for the Transitional Reinsurance Program and the Patient-Centered Outcomes Research Institute. These provisions did not have a significant effect on our postretirement medical liability or costs. The Early Retiree Reinsurance Program (ERRP) was established by the PPACA. Congress appropriated funding of $5.0 billion for this temporary ERRP to provide financial assistance to employers, unions, and state and local governments to help them maintain coverage for early retirees age 55 and older who are not yet eligible for Medicare, including their spouses, surviving spouses, and dependents. PNC did not receive reimbursement in 2014 related to the 2013 plan year. The ERRP terminated effective January 1, 2014.
| The PNC Financial Services Group, Inc. – Form 10-K 171 |
PNC Pension Plan Assets
Assets related to our qualified pension plan (the Plan) are held in trust (the Trust). Effective July 1, 2011, the trustee is The Bank of New York Mellon. The Trust is exempt from tax pursuant to section 501(a) of the Internal Revenue Code (the Code). The Plan is qualified under section 401(a) of the Code. Plan assets consist primarily of listed domestic and international equity securities, U.S. government and agency securities, corporate debt securities, and real estate investments. The Plan held no PNC common stock as of December 31, 2015 and December 31, 2014.
The PNC Financial Services Group, Inc. Administrative Committee (the Administrative Committee) adopted the Pension Plan Investment Policy Statement, including target allocations and allowable ranges, on August 13, 2008. On February 25, 2010, the Administrative Committee amended the investment policy to include a dynamic asset allocation approach and also updated target allocation ranges for certain asset categories. On February 24, 2014, the Administrative Committee amended the investment policy to update the target allocation ranges for certain asset categories.
The long-term investment strategy for pension plan assets is to:
| • | Meet present and future benefit obligations to all participants and beneficiaries, |
| • | Cover reasonable expenses incurred to provide such benefits, including expenses incurred in the administration of the Trust and the Plan, |
| • | Provide sufficient liquidity to meet benefit and expense payment requirements on a timely basis, and |
| • | Provide a total return that, over the long term, maximizes the ratio of trust assets to liabilities by maximizing investment return, at an appropriate level of risk. |
Under the dynamic asset allocation strategy, scenarios are outlined in which the Administrative Committee has the ability to make short to intermediate term asset allocation shifts based on factors such as the Plan's funded status, the Administrative Committee's view of return on equities relative to long term expectations, the Administrative Committee's view on the direction of interest rates and credit spreads, and other relevant financial or economic factors which would be expected to impact the ability of the Trust to meet its obligation to participants and beneficiaries. Accordingly, the allowable asset allocation ranges have been updated to incorporate the flexibility required by the dynamic allocation policy.
The Plan's specific investment objective is to meet or exceed the investment policy benchmark over the long term. The investment policy benchmark compares actual performance to a weighted market index, and measures the contribution of active investment management and policy implementation. This investment objective is expected to be achieved over the long term (one or more market cycles) and is measured over
rolling five-year periods. Total return calculations are time-weighted and are net of investment-related fees and expenses.
The asset strategy allocations for the Trust at the end of 2015 and 2014, and the target allocation range at the end of 2015, by asset category, are as follows.
Table 97: Asset Strategy Allocations
| Target Allocation Range | Target Percentage of Plan Assets by Strategy at December 31 | |||||||||||
| PNC Pension Plan | 2015 | 2014 | ||||||||||
Asset Category | ||||||||||||
Domestic Equity | 20 – 40 | % | 32 | % | 34 | % | ||||||
International Equity | 10 – 25 | % | 23 | % | 23 | % | ||||||
Private Equity | 0 – 15 | % | 8 | % | 6 | % | ||||||
Total Equity | 40 – 70 | % | 63 | % | 63 | % | ||||||
Domestic Fixed Income | 10 – 40 | % | 17 | % | 17 | % | ||||||
High Yield Fixed Income | 0 – 25 | % | 12 | % | 13 | % | ||||||
Total Fixed Income | 10 – 65 | % | 29 | % | 30 | % | ||||||
Real estate | 0 – 15 | % | 5 | % | 5 | % | ||||||
Other | 0 – 5 | % | 3 | % | 2 | % | ||||||
Total | 100 | % | 100 | % | 100 | % | ||||||
The asset category represents the allocation of Plan assets in accordance with the investment objective of each of the Plan's investment managers. Certain domestic equity investment managers utilize derivatives and fixed income securities as described in their Investment Management Agreements to achieve their investment objective under the Investment Policy Statement. Other investment managers may invest in eligible securities outside of their assigned asset category to meet their investment objectives. The actual percentage of the fair value of total Plan assets held as of December 31, 2015 for equity securities, fixed income securities, real estate and all other assets are 70%, 21%, 5% and 4%, respectively.
We believe that, over the long term, asset allocation is the single greatest determinant of risk. Asset allocation will deviate from the target percentages due to market movement, cash flows, investment manager performance and implementation of shifts under the dynamic allocation policy. Material deviations from the asset allocation targets can alter the expected return and risk of the Trust. On the other hand, frequent rebalancing to the asset allocation targets may result in significant transaction costs, which can impair the Trust's ability to meet its investment objective. Accordingly, the Trust portfolio is periodically rebalanced to maintain asset allocation within the target ranges described above.
In addition to being diversified across asset classes, the Trust is diversified within each asset class. Secondary diversification provides a reasonable basis for the expectation that no single security or class of securities will have a disproportionate impact on the total risk and return of the Trust.
| 172 The PNC Financial Services Group, Inc. – Form 10-K |
The Administrative Committee selects investment managers for the Trust based on the contributions that their respective investment styles and processes are expected to make to the investment performance of the overall portfolio. The managers' Investment Objectives and Guidelines, which are a part of each manager's Investment Management Agreement, document performance expectations and each manager's role in the portfolio. The Administrative Committee uses the Investment Objectives and Guidelines to establish, guide, control and measure the strategy and performance for each manager.
The purpose of investment manager guidelines is to:
| • | Establish the investment objective and performance standards for each manager, |
| • | Provide the manager with the capability to evaluate the risks of all financial instruments or other assets in which the manager's account is invested, and |
| • | Prevent the manager from exposing its account to excessive levels of risk, undesired or inappropriate risk, or disproportionate concentration of risk. |
The guidelines also indicate which investments and strategies the manager is permitted to use to achieve its performance objectives, and which investments and strategies it is prohibited from using.
Where investment strategies permit the use of derivatives and/or currency management, language is incorporated in the managers' guidelines to define allowable and prohibited transactions and/or strategies. Derivatives are typically employed by investment managers to modify risk/return characteristics of their portfolio(s), implement asset allocation changes in a cost-effective manner, or reduce transaction costs. Under the managers' investment guidelines, derivatives may not be used solely for speculation or leverage. Derivatives are to be used only in circumstances where they offer the most efficient economic means of improving the risk/reward profile of the portfolio.
BlackRock receives compensation for providing investment management services. The Asset Management Group business segment also receives compensation for payor-related services. Compensation for such services is paid by PNC and was not significant for 2015, 2014 or 2013. Non-affiliate service providers for the Trust are compensated from Plan assets.
Fair Value Measurements
As further described in Note 7 Fair Value, GAAP establishes the framework for measuring fair value, including a hierarchy used to classify the inputs used in measuring fair value.
A description of the valuation methodologies used for assets measured at fair value at both December 31, 2015 and December 31, 2014 follows:
| • | Money market and mutual funds are valued at the net asset value of the shares held by the pension plan at year end. |
| • | U.S. government and agency securities, corporate debt, common stock and preferred stock are valued at the closing price reported on the active market on which the individual securities are traded. If quoted market prices are not available for the specific security, then fair values are estimated by using pricing models or quoted prices of securities with similar characteristics. Such securities are generally classified within Level 2 of the valuation hierarchy but may be a Level 3 depending on the level of liquidity and activity in the market for the security. |
| • | The collective trust fund investments are valued based upon the units of such collective trust fund held by the Plan at year end multiplied by the respective unit value. The unit value of the collective trust fund is based upon significant observable inputs, although it is not based upon quoted marked prices in an active market. The underlying investments of the collective trust funds consist primarily of equity securities, debt obligations, short-term investments, and other marketable securities. Due to the nature of these securities, there are no unfunded commitments or redemption restrictions. Certain collective trust fund investments based on net asset value are not classified as part of fair value hierarchy, in accordance with ASU 2015-07. |
| • | Limited partnerships are valued by investment managers based on recent financial information used to estimate fair value. Other investments held by the pension plan include derivative financial instruments and real estate, which are recorded at estimated fair value as determined by third-party appraisals and pricing models, and group annuity contracts, which are measured at fair value by discounting the related cash flows based on current yields of similar instruments with comparable durations considering the credit-worthiness of the issuer. In accordance with ASC 820-10, these investments are not classified in the fair value hierarchy. |
These methods may result in fair value calculations that may not be indicative of net realizable values or future fair values. Furthermore, while the pension plan believes its valuation methods are appropriate and consistent with other market participants, the use of different methodologies or assumptions to determine the fair value of certain financial instruments could result in a different fair value measurement at the reporting date.
| The PNC Financial Services Group, Inc. – Form 10-K 173 |
The following table sets forth by level, within the fair value hierarchy, the Plan's assets at fair value as of December 31, 2015 and 2014.
Table 98: Pension Plan Assets – Fair Value Hierarchy
| Fair Value Measurements Using: | ||||||||||||||||
| In millions | December 31, 2015 Fair Value | Quoted Prices in Active Markets For Identical Assets (Level 1) | Significant Other Observable Inputs (Level 2) | Significant Unobservable Inputs (Level 3) | ||||||||||||
Money market funds | $ | 154 | $ | 154 | ||||||||||||
U.S. government and agency securities | 324 | 186 | $ | 138 | ||||||||||||
Corporate debt (a) | 575 | 568 | $ | 7 | ||||||||||||
Common stock | 660 | 630 | 30 | |||||||||||||
Preferred stock | 7 | 7 | ||||||||||||||
Mutual funds | 213 | 5 | 208 | |||||||||||||
Interest in Collective Funds (b) | 1,888 | 1,888 | ||||||||||||||
Other | 13 | 1 | 12 | |||||||||||||
Investments measured at net asset value (d) | 482 | |||||||||||||||
Total | $ | 4,316 | $ | 976 | $ | 2,851 | $ | 7 | ||||||||
| Fair Value Measurements Using: | ||||||||||||||||
| In millions | December 31, 2014 Fair Value | Quoted Prices in Active Markets For Identical Assets (Level 1) | Significant Other Observable Inputs (Level 2) | Significant Unobservable Inputs (Level 3) | ||||||||||||
Money market funds | $ | 121 | $ | 121 | ||||||||||||
U.S. government and agency securities | 294 | 147 | $ | 147 | ||||||||||||
Corporate debt (a) | 648 | 638 | $ | 10 | ||||||||||||
Common stock | 1,041 | 1,040 | 1 | |||||||||||||
Preferred Stock | 6 | 6 | ||||||||||||||
Mutual funds | 220 | 2 | 218 | |||||||||||||
Interest in Collective Funds (c) | 1,589 | 1,589 | ||||||||||||||
Limited partnerships | 2 | 2 | ||||||||||||||
Other | 55 | (4 | ) | 59 | ||||||||||||
Investments measured at net asset value (d) | 381 | |||||||||||||||
Total | $ | 4,357 | $ | 1,306 | $ | 2,660 | $ | 10 | ||||||||
| (a) | Corporate debt includes $29 million and $34 million of non-agency mortgage-backed securities as of December 31, 2015 and 2014, respectively. |
| (b) | The benefit plans own commingled funds that invest in equity securities. The funds seek to mirror the benchmark of the S&P 500 Index, Morgan Stanley Capital International ACWI X US Index, Morgan Stanley Capital EAFE Index, Morgan Stanley Capital Emerging Markets Index and the NCREIF ODCE NOF Index with the exception of the BlackRock Index Fund. |
| (c) | The benefit plans own commingled funds that invest in equity and fixed income securities. The funds seek to mirror the performance of the S&P 500 Index, Russell 3000 Index, Morgan Stanley Capital International ACWI X US Index and the Dow Jones U.S. Select Real Estate Securities Index. The commingled fund that holds fixed income securities invests in domestic investment grade securities and seeks to mimic the performance of the Barclays Aggregate Bond Index. |
| (d) | In accordance with ASC 820-10, certain investments that are measured at fair value using the NAV per share (or its equivalent) practical expedient have not been classified in the fair value hierarchy. The fair value amounts presented in this table are intended to permit reconciliation of the fair value hierarchy to the amounts presented on the Consolidated Balance Sheet. |
The following summarizes changes in the fair value of the pension plan's Level 3 assets during 2015 and 2014.
Table 99: Rollforward of Pension Plan Level 3 Assets
| In millions | Corporate Debt | |||
January 1, 2015 | $ | 10 | ||
Net realized gain/(loss) on sale of investments | 1 | |||
Net unrealized gain/(loss) on assets held at end of year | ||||
Purchases | 4 | |||
Sales | (8 | ) | ||
December 31, 2015 | $ | 7 | ||
| In millions | Corporate Debt | |||
January 1, 2014 | $ | 13 | ||
Net realized gain/(loss) on sale of investments | 3 | |||
Net unrealized gain/(loss) on assets held at end of year | ||||
Purchases | ||||
Sales | (6 | ) | ||
December 31, 2014 | $ | 10 | ||
| 174 The PNC Financial Services Group, Inc. – Form 10-K |
The following table provides information regarding our estimated future cash flows related to our various plans.
Table 100: Estimated Cash Flows
| Pension Plans | Postretirement Benefits | |||||||||||||||
| In millions | Qualified Pension | Nonqualified Pension | Gross PNC Benefit Payments | Reduction in PNC Benefit Payments Due to Medicare Part D Subsidy | ||||||||||||
Estimated 2016 employer contributions | $ | 27 | $ | 2 | ||||||||||||
Estimated future benefit payments | ||||||||||||||||
2016 | $ | 273 | $ | 27 | $ | 25 | $ | 1 | ||||||||
2017 | 289 | 26 | 26 | 1 | ||||||||||||
2018 | 305 | 28 | 27 | 1 | ||||||||||||
2019 | 303 | 25 | 27 | 1 | ||||||||||||
2020 | 304 | 24 | 28 | 1 | ||||||||||||
2021-2025 | 1,560 | 105 | 133 | 5 | ||||||||||||
The qualified pension plan contributions are deposited into the Trust, and the qualified pension plan benefit payments are paid from the Trust. In February 2015, PNC made a $200 million voluntary contribution to the Trust. Notwithstanding the contribution, we do not expect to be required to make a contribution to the qualified plan for 2016 based on the funding calculations under the Pension Protection Act of 2006. For the other plans, total contributions and the benefit payments are the same and represent expected benefit amounts, which are paid from general assets. Postretirement benefits are net of participant contributions. Estimated cash flows reflect the partial funding of postretirement medical and life insurance obligations in the VEBA.
The components of net periodic benefit cost/(income) and other amounts recognized in Other comprehensive income (OCI) were as follows.
Table 101: Components of Net Periodic Benefit Cost
| Qualified Pension Plan | Nonqualified Pension Plan | Postretirement Benefits | ||||||||||||||||||||||||||||||||||
| Year ended December 31 – in millions | 2015 | 2014 | 2013 | 2015 | 2014 | 2013 | 2015 | 2014 | 2013 | |||||||||||||||||||||||||||
Net periodic cost consists of: | ||||||||||||||||||||||||||||||||||||
Service cost | $ | 107 | $ | 103 | $ | 113 | $ | 3 | $ | 3 | $ | 3 | $ | 5 | $ | 5 | $ | 6 | ||||||||||||||||||
Interest cost | 177 | 187 | 170 | 11 | 12 | 12 | 15 | 16 | 14 | |||||||||||||||||||||||||||
Expected return on plan assets | (297 | ) | (289 | ) | (288 | ) | ||||||||||||||||||||||||||||||
Amortization of prior service cost/(credit) | (9 | ) | (8 | ) | (8 | ) | (1 | ) | (2 | ) | (3 | ) | ||||||||||||||||||||||||
Amortization of actuarial (gain)/loss | 31 | 87 | 7 | 4 | 8 | |||||||||||||||||||||||||||||||
Settlement (gain)/loss | 7 | 1 | ||||||||||||||||||||||||||||||||||
Net periodic cost (benefit) | 9 | (7 | ) | 74 | 21 | 19 | 30 | 19 | 19 | 18 | ||||||||||||||||||||||||||
Other changes in plan assets and benefit obligations recognized in Other comprehensive income: | ||||||||||||||||||||||||||||||||||||
Current year prior service cost/(credit) | (7 | ) | ||||||||||||||||||||||||||||||||||
Amortization of prior service (cost)/credit | 9 | 8 | 8 | 1 | 2 | 3 | ||||||||||||||||||||||||||||||
Current year actuarial loss/(gain) | 152 | 434 | (784 | ) | (10 | ) | 40 | (26 | ) | (9 | ) | 4 | (9 | ) | ||||||||||||||||||||||
Amortization of actuarial gain/(loss) | (31 | ) | (87 | ) | (7 | ) | (4 | ) | (15 | ) | (1 | ) | ||||||||||||||||||||||||
Total recognized in OCI | 130 | 435 | (863 | ) | (17 | ) | 36 | (41 | ) | (8 | ) | 6 | (7 | ) | ||||||||||||||||||||||
Total amounts recognized in net periodic cost and OCI | $ | 139 | $ | 428 | $ | (789 | ) | $ | 4 | $ | 55 | $ | (11 | ) | $ | 11 | $ | 25 | $ | 11 | ||||||||||||||||
| The PNC Financial Services Group, Inc. – Form 10-K 175 |
The weighted-average assumptions used (as of the beginning of each year) to determine the net periodic costs shown above were as follows.
Table 102: Net Periodic Costs – Assumptions
| Net Periodic Cost Determination | ||||||||||||
| Year ended December 31 | 2015 | 2014 | 2013 | |||||||||
Discount rate | ||||||||||||
Qualified pension | 3.95 | % | 4.75 | % | 3.80 | % | ||||||
Nonqualified pension | 3.65 | % | 4.35 | % | 3.45 | % | ||||||
Postretirement benefits | 3.80 | % | 4.50 | % | 3.60 | % | ||||||
Rate of compensation increase (average) | 4.00 | % | 4.00 | % | 4.00 | % | ||||||
Assumed health care cost trend rate | ||||||||||||
Initial trend | 7.50 | % | 7.75 | % | 8.00 | % | ||||||
Ultimate trend | 5.00 | % | 5.00 | % | 5.00 | % | ||||||
Year ultimate reached | 2025 | 2025 | 2019 | |||||||||
Expected long-term return on plan assets | 6.75 | % | 7.00 | % | 7.50 | % | ||||||
The weighted-average assumptions used (as of the end of each year) to determine year end obligations for pension and postretirement benefits were as follows.
Table 103: Other Pension Assumptions
| Year ended December 31 | 2015 | 2014 | ||||||
Discount rate | ||||||||
Qualified pension | 4.25 | % | 3.95 | % | ||||
Nonqualified pension | 3.95 | % | 3.65 | % | ||||
Postretirement benefits | 4.15 | % | 3.80 | % | ||||
Rate of compensation increase (average) | 3.50 | % | 4.00 | % | ||||
Assumed health care cost trend rate | ||||||||
Initial trend | 7.25 | % | 7.50 | % | ||||
Ultimate trend | 5.00 | % | 5.00 | % | ||||
Year ultimate reached | 2025 | 2025 | ||||||
The discount rates are determined independently for each plan by comparing the expected future benefits that will be paid under each plan with yields available on high quality corporate bonds of similar duration. For this analysis, 10% of bonds with the highest yields and 40% with the lowest yields were removed from the bond universe.
The expected return on plan assets is a long-term assumption established by considering historical and anticipated returns of the asset classes invested in by the pension plan and the allocation strategy currently in place among those classes. We review this assumption at each measurement date and adjust it if warranted.
The health care cost trend rate assumptions shown in the preceding tables relate only to the postretirement benefit plans. A one-percentage-point change in assumed health care cost trend rates would have the following effects.
Table 104: Effect of One Percent Change in Assumed Health Care Cost
Year ended December 31, 2015 In millions | Increase | Decrease | ||||||
Effect on year end benefit obligation | $ | 10 | (9 | ) | ||||
Unamortized actuarial gains and losses and prior service costs and credits are recognized in AOCI each December 31, with amortization of these amounts through net periodic benefit cost. The estimated amounts that will be amortized in 2016 are as follows.
Table 105: Estimated Amortization of Unamortized Actuarial Gains and Losses – 2016
| 2016 Estimate | ||||||||||||
Year ended December 31 In millions | Qualified Pension | Nonqualified Pension | Postretirement Benefits | |||||||||
Prior service (credit) | $ | (7 | ) | $ | (1 | ) | ||||||
Net actuarial loss | 45 | $ | 4 | |||||||||
Total | $ | 38 | $ | 4 | $ | (1 | ) | |||||
Defined Contribution Plans
The PNC Incentive Savings Plan (ISP) is a qualified defined contribution plan that covers all eligible PNC employees. Effective January 1, 2015, newly-hired full time employees and part-time employees who became eligible to participate in the ISP after that date are automatically enrolled in the ISP with a deferral rate equal to 4% of eligible compensation in the absence of an affirmative election otherwise. Employee benefits expense related to the ISP was $126 million in 2015, $108 million in 2014 and $120 million in 2013, representing cash contributed to the ISP by PNC.
Under the ISP, employee contributions up to 4% of eligible compensation as defined by the ISP are matched 100% once an employee has reached match-eligibility, subject to IRS Code limitations. PNC will contribute a minimum matching contribution up to $2,000 annually for eligible employees who contribute at least 4% of eligible compensation every pay period he or she is eligible during the year. This amount is prorated for certain employees, including part-time employees and those who are eligible for the company match for less than a full year. Additionally, PNC makes an annual true-up matching contribution to ensure that eligible participants receive the full company match available. Effective January 1, 2012, in the case of both the minimum and true-up matching contributions, eligible employees must remain employed on the last day of the applicable plan year in order to receive the contribution. Employees hired prior to January 1, 2010, became 100% vested in employer matching contributions immediately, while employees hired on or after January 1, 2010, generally become 100% vested in employer matching contributions after three years of service. Minimum matching contributions made with respect to the 2014 and 2013 plan years are immediately 100% vested.
| 176 The PNC Financial Services Group, Inc. – Form 10-K |
The ISP is a 401(k) Plan and includes an employee stock ownership (ESOP) feature. Employee contributions are invested in a number of investment options, including pre mixed portfolios and individual core funds, available under the ISP at the direction of the employee. Although employees were also historically permitted to direct the investment of their contributions into the PNC common stock fund, this fund was frozen to future investments of such contributions effective January 1, 2010. All shares of PNC common stock held by the ISP are part of the ESOP. Effective January 1, 2011, employer matching contributions were made in cash.
We also maintain a nonqualified supplemental savings plan for certain employees, known as The PNC Financial Services Group, Inc. Supplemental Incentive Savings Plan. Effective January 1, 2012, the Supplemental Incentive Savings Plan was frozen to new participants and for any deferrals of amounts earned on or after such date. It was replaced by a new plan called The PNC Financial Services Group, Inc. Deferred Compensation and Incentive Plan.
N OTE 13 S TOCK B ASED C OMPENSATION P LANS
We have long-term incentive award plans (Incentive Plans) that provide for the granting of incentive stock options, nonqualified stock options, stock appreciation rights, incentive shares/performance units, restricted shares, restricted share units, other share-based awards and dollar-denominated awards to executives and, other than incentive stock options, to non-employee directors. Certain Incentive Plan awards may be paid in stock, cash or a combination of stock and cash. We typically grant a substantial portion of our stock-based compensation awards during the first quarter of the year. As of December 31, 2015, no stock appreciation rights were outstanding.
Total compensation expense recognized related to all share-based payment arrangements during 2015, 2014 and 2013 was approximately $173 million, $181 million and $154 million, respectively. The total tax benefit recognized related to compensation expense on all share-based payment arrangements during 2015, 2014 and 2013 was approximately $63 million, $66 million and $56 million, respectively. At December 31, 2015, there was $191 million of unamortized share-based compensation expense related to nonvested equity compensation arrangements granted under the Incentive Plans. This unamortized cost is expected to be recognized as expense over a period of no longer than five years.
Nonqualified Stock Options
Beginning in 2014, PNC discontinued the use of stock options as a standard element of our long-term equity incentive compensation programs under our Incentive Plans and did not grant any options in 2015 and 2014. Prior to 2014, options were granted at exercise prices not less than the market value of a share of common stock on the grant date. Generally, options become exercisable in installments after the grant date. No option can be exercised after 10 years from its grant date. Payment of the option exercise price may be in cash or by surrendering shares of common stock at market value on the exercise date. The exercise price may also be paid by using previously owned shares.
Option Pricing Assumptions
For purposes of computing stock option expense for grants made in 2013, we estimated the fair value of stock options at the grant date by using the Black-Scholes option pricing model. Option pricing models require the use of numerous assumptions, many of which are subjective.
We used the following assumptions in the Black-Scholes option pricing model to determine 2013 grant date fair value:
| • | The risk-free interest rate is based on the U.S. Treasury yield curve, |
| • | The dividend yield is indicative of our current dividend rate, |
| • | Volatility is measured using the fluctuation in month-end closing stock prices over a period which corresponds with the average expected option life, but in no case less than a five-year period, and |
| • | The expected life represents the period of time that options granted are expected to be outstanding and is based on a weighted-average of historical option activity. |
Table 106: Option Pricing Assumptions (a)
| Weighted-average for the year ended December 31 | 2013 | |||
Risk-free interest rate | .9 | % | ||
Dividend yield | 2.5 | |||
Volatility | 34.0 | |||
Expected life | 6.5yrs. | |||
Grant date fair value | $ | 16.35 | ||
| (a) | PNC did not grant any stock options in 2015 and 2014. |
| The PNC Financial Services Group, Inc. – Form 10-K 177 |
There were no options granted in 2013 where the grant date fair value exceeded the market value. The following table represents the stock option activity for 2015.
Table 107: Stock Option Rollforward
| PNC | PNC Options Converted From National City | Total | ||||||||||||||||||||||||||||||
Year ended December 31, 2015 In thousands, except weighted-average data | Shares | Weighted- Average Exercise Price | Shares | Weighted- Average Exercise Price | Shares | Weighted- Average Exercise Price | Weighted- Average Remaining Contractual Life | Aggregate Intrinsic Value | ||||||||||||||||||||||||
Outstanding, January 1 | 6,701 | $ | 56.41 | 343 | $ | 585.23 | 7,044 | $ | 82.17 | |||||||||||||||||||||||
Granted (a) | ||||||||||||||||||||||||||||||||
Exercised | (1,741 | ) | 59.18 | (1,741 | ) | 59.18 | ||||||||||||||||||||||||||
Cancelled | (29 | ) | 44.61 | (100 | ) | 738.18 | (129 | ) | 580.37 | |||||||||||||||||||||||
Outstanding, December 31 | 4,931 | $ | 55.50 | 243 | $ | 522.54 | 5,174 | $ | 77.47 | 3.2 years | $ | 196,292 | ||||||||||||||||||||
Vested and expected to vest, December 31 (b) | 4,931 | $ | 55.50 | 243 | $ | 522.54 | 5,174 | $ | 77.47 | 3.2 years | $ | 196,286 | ||||||||||||||||||||
Exercisable, December 31 | 4,883 | $ | 55.42 | 243 | $ | 522.54 | 5,126 | $ | 77.60 | 3.2 years | $ | 194,782 | ||||||||||||||||||||
| (a) | PNC did not grant any stock options in 2015 and 2014. |
| (b) | Adjusted for estimated forfeitures on unvested options. |
To determine stock-based compensation expense, the grant date fair value is applied to the options granted with a reduction for estimated forfeitures. We recognize compensation expense for stock options on a straight-line basis over the specified vesting period.
At December 31, 2014 and 2013, options for 6,810,000 and 10,204,000 shares of common stock were exercisable at a weighted-average price of $82.86 and $89.46, respectively. The total intrinsic value of options exercised during 2015, 2014 and 2013 was $62 million, $90 million and $86 million, respectively.
Cash received from option exercises under all Incentive Plans for 2015, 2014 and 2013 was approximately $103 million, $215 million and $208 million, respectively. The tax benefit realized from option exercises under all Incentive Plans for 2015, 2014 and 2013 was approximately $23 million, $33 million and $31 million, respectively.
Shares of common stock available during the next year for the granting of options and other awards under the Incentive Plans were approximately 14 million at December 31, 2015. Total shares of PNC common stock authorized for future issuance under equity compensation plans totaled approximately 15 million shares at December 31, 2015, which includes shares available for issuance under the Incentive Plans and the Employee Stock Purchase Plan (ESPP) as described below.
During 2015, we issued approximately 1.2 million common shares from treasury stock in connection with stock option exercise activity. As with past exercise activity, we currently intend to utilize primarily treasury stock for any future stock option exercises.
Awards granted to non-employee directors in 2015, 2014 and 2013 include 18,048, 21,490 and 27,076 deferred stock units, respectively, awarded under the Outside Directors Deferred Stock Unit Plan. A deferred stock unit is a phantom share of our common stock, which is accounted for as a liability until such awards are paid to the participants in cash. As there are no vesting or service requirements on these awards, total compensation expense is recognized in full for these awards on the date of grant.
Incentive/Performance Unit Awards and Restricted Share/Restricted Share Unit Awards
The fair value of nonvested incentive/performance unit awards and restricted share/restricted share unit awards is initially determined based on prices not less than the market value of our common stock on the date of grant. The value of certain incentive/performance unit awards is subsequently remeasured based on the achievement of one or more financial and other performance goals. The Personnel and Compensation Committee ("P&CC") of the Board of Directors approves the final award payout with respect to certain incentive/performance unit awards. These awards primarily have either a three-year or a four-year performance period and are payable in either stock or a combination of stock and cash. Restricted share/restricted share unit awards have various vesting periods generally ranging from 3 years to 5 years.
Beginning in 2013, we incorporated several enhanced risk-related performance changes to certain long-term incentive compensation programs. In addition to achieving certain financial performance metrics on both an absolute basis and relative to our peers, final payout amounts will be subject to reduction if PNC fails to meet certain risk-related performance metrics as specified in the award agreements. However, the P&CC has the discretion to waive any or all of this reduction under certain circumstances.
| 178 The PNC Financial Services Group, Inc. – Form 10-K |
The weighted-average grant date fair value of incentive/performance unit awards and restricted share/restricted share unit awards granted in 2015, 2014 and 2013 was $91.57, $80.79 and $64.77 per share, respectively. The total intrinsic value of incentive/performance unit and restricted share/restricted share unit awards vested during 2015, 2014 and 2013 was approximately $175 million, $119 million and $63 million, respectively. We recognize compensation expense for such awards ratably over the corresponding vesting and/or performance periods for each type of program.
Table 108: Nonvested Incentive/Performance Unit Awards and Restricted Share/Restricted Share Unit Awards – Rollforward
| Shares in thousands | Nonvested Incentive/ Performance Units | Weighted- Average Grant Date Fair Value | Nonvested Restricted Share/ Restricted Share Units | Weighted- Average Grant Date Fair Value | ||||||||||||
December 31, 2014 | 1,837 | $ | 69.84 | 3,652 | $ | 69.03 | ||||||||||
Granted (a) | 711 | 90.77 | 1,112 | 92.08 | ||||||||||||
Vested/Released (a) | (682 | ) | 66.17 | (1,259 | ) | 61.15 | ||||||||||
Forfeited | (36 | ) | 73.56 | (172 | ) | 79.25 | ||||||||||
December 31, 2015 | 1,830 | $ | 79.27 | 3,333 | $ | 79.26 | ||||||||||
| (a) | Includes adjustments for achieving specific performance goals for Incentive/Performance Unit Awards granted in prior periods. |
In the preceding table, the units and related weighted-average grant date fair value of the incentive/performance unit awards exclude the effect of dividends on the underlying shares, as those dividends will be paid in cash if and when the underlying shares are issued to the participants.
Liability Awards
A summary of all nonvested, cash-payable incentive/performance units and restricted share unit activity follows:
Table 109: Nonvested Cash-Payable Incentive/Performance Units and Restricted Share Units – Rollforward
| In thousands | Cash-Payable Incentive/ Performance Units | Cash-Payable Restricted Share Units | Total | |||||||||
Outstanding at December 31, 2014 | 177 | 658 | 835 | |||||||||
Granted (a) | 81 | 364 | 445 | |||||||||
Vested and Released (a) | (98 | ) | (350 | ) | (448 | ) | ||||||
Forfeited | (43 | ) | (8 | ) | (51 | ) | ||||||
Outstanding at December 31, 2015 | 117 | 664 | 781 | |||||||||
| (a) | Includes adjustments for achieving specific performance goals for Cash-Payable Incentive/Performance Units granted in prior periods. |
Included in the preceding table are cash-payable restricted share units granted to certain executives. These grants were made primarily as part of an annual bonus incentive deferral
plan. While there are time-based and other vesting criteria, there are generally no market or performance criteria associated with these awards. Prior to the 2015 grant, compensation expense recognized related to these awards was recorded in prior periods as part of the annual cash bonus process. Due to certain requisite service period changes in the award agreements starting with the 2015 grant (for the 2014 performance year), compensation expense is recognized ratably over a four year period commensurate with the performance year plus the three years of service-based vesting requirements. As of December 31, 2015, the aggregate intrinsic value of all outstanding nonvested cash-payable incentive/performance units and restricted share units was $74 million.
The total of all share-based liability awards paid out during 2015, 2014 and 2013 was approximately $41 million, $38 million and $29 million, respectively.
Employee Stock Purchase Plan
As of December 31, 2015, our ESPP had approximately 1 million shares available for issuance. Full-time employees with six months and part-time employees with 12 months of continuous employment with a participating PNC entity are eligible to participate in the ESPP at the commencement of the next six-month offering period. Eligible participants may purchase our common stock at 95% of the fair market value on the last day of each six-month offering period. No charge to earnings is recorded with respect to the ESPP.
Table 110: Employee Stock Purchase Plan – Summary
| Year ended December 31 | Shares Issued | Purchase Price Per Share | ||||||
2015 | 168,962 | $ | 90.87 and $90.55 | |||||
2014 | 157,856 | $ | 84.60 and $86.67 | |||||
2013 | 167,260 | $ | 69.27 and $73.70 | |||||
BlackRock LTIP and Exchange Agreements
BlackRock adopted the 2002 LTIP program to help attract and retain qualified professionals. At that time, PNC agreed to transfer up to 4 million shares of BlackRock common stock to fund a portion of the 2002 LTIP program and future LTIP programs approved by BlackRock's Board of Directors, subject to certain conditions and limitations. Approximately 1.1 million shares of BlackRock common stock were transferred by PNC and distributed to LTIP participants in connection with the 2002 LTIP program.
In 2009, PNC's obligation to deliver its BlackRock common shares to BlackRock under LTIP programs was replaced with an obligation to deliver shares of BlackRock's Series C Preferred Stock. This change was part of an Exchange Agreement with BlackRock whereby PNC acquired 2.9 million shares of Series C Preferred Stock from BlackRock in exchange for common shares.
| The PNC Financial Services Group, Inc. – Form 10-K 179 |
In 2011, we transferred approximately 1.3 million shares of BlackRock Series C Preferred Stock to BlackRock in connection with our obligation. In 2013, we transferred an additional .2 million shares to BlackRock. At December 31, 2015, we held approximately 1.3 million shares of BlackRock Series C Preferred Stock which were available to fund our obligation in connection with the BlackRock LTIP programs. See Note 24 Subsequent Events for information on our February 1, 2016 transfer of 0.5 million shares of the Series C Preferred Stock to BlackRock to satisfy a portion of our LTIP obligation.
PNC accounts for its BlackRock Series C Preferred Stock at fair value, which offsets the impact of marking-to-market the obligation to deliver these shares to BlackRock. The fair value of the BlackRock Series C Preferred Stock is included on our Consolidated Balance Sheet in the caption Other assets. Additional information regarding the valuation of the BlackRock Series C Preferred Stock is included in Note 7 Fair Value.
N OTE 14 F INANCIAL D ERIVATIVES
We use derivative financial instruments (derivatives) primarily to help manage exposure to interest rate, market and credit risk and reduce the effects that changes in interest rates may have on net income, the fair value of assets and liabilities, and cash flows. We also enter into derivatives with customers to facilitate their risk management activities. Derivatives represent contracts between parties that usually require little or no initial net investment and result in one party delivering cash or another type of asset to the other party based on a notional amount and an underlying as specified in the contract.
Derivative transactions are often measured in terms of notional amount, but this amount is generally not exchanged and it is not recorded on the balance sheet. The notional amount is the basis to which the underlying is applied to determine required payments under the derivative contract. The underlying is a referenced interest rate (commonly LIBOR), security price, credit spread or other index. Residential and commercial real estate loan commitments associated with loans to be sold also qualify as derivative instruments.
The following table presents the notional amounts and gross fair values of all derivative assets and liabilities held by PNC:
Table 111: Total Gross Derivatives
| December 31, 2015 | December 31, 2014 | |||||||||||||||||||||||
| In millions | Notional/ Contract Amount | Asset Fair Value (a) | Liability Fair Value (b) | Notional/ Contract Amount | Asset Fair Value (a) | Liability Fair Value (b) | ||||||||||||||||||
Derivatives designated as hedging instruments under GAAP | $ | 52,074 | $ | 1,159 | $ | 174 | $ | 49,061 | $ | 1,261 | $ | 186 | ||||||||||||
Derivatives not designated as hedging instruments under GAAP | 295,902 | 3,782 | 3,628 | 291,256 | 3,973 | 3,841 | ||||||||||||||||||
Total gross derivatives | $ | 347,976 | $ | 4,941 | $ | 3,802 | $ | 340,317 | $ | 5,234 | $ | 4,027 | ||||||||||||
| (a) | Included in Other assets on our Consolidated Balance Sheet. |
| (b) | Included in Other liabilities on our Consolidated Balance Sheet. |
All derivatives are carried on our Consolidated Balance Sheet at fair value. Derivative balances are presented on the Consolidated Balance Sheet on a net basis taking into consideration the effects of legally enforceable master netting agreements and, when appropriate, any related cash collateral exchanged with counterparties. Further discussion regarding the offsetting rights associated with these legally enforceable master netting agreements is included in the Offsetting, Counterparty Credit Risk, and Contingent Features section below. Any nonperformance risk, including credit risk, is included in the determination of the estimated net fair value of the derivatives.
Further discussion on how derivatives are accounted for is included in Note 1 Accounting Policies.
Derivatives Designated As Hedging Instruments under GAAP
Certain derivatives used to manage interest rate and foreign exchange risk as part of our asset and liability risk management activities are designated as accounting hedges under GAAP. Derivatives hedging the risks associated with changes in the fair value of assets or liabilities are considered fair value hedges, derivatives hedging the variability of expected future cash flows are considered cash flow hedges, and derivatives hedging a net investment in a foreign subsidiary are considered net investment hedges. Designating derivatives as accounting hedges allows for gains and losses on those derivatives, to the extent effective, to be recognized in the income statement in the same period the hedged items affect earnings.
| 180 The PNC Financial Services Group, Inc. – Form 10-K |
Further detail regarding the notional amounts and fair values related to derivatives designated in hedge relationships is presented in the following table:
Table 112: Derivatives Designated As Hedging Instruments under GAAP
| December 31, 2015 | December 31, 2014 | |||||||||||||||||||||||
| In millions | Notional/ Contract Amount | Asset Fair Value (a) | Liability Fair Value (b) | Notional/ Contract Amount | Asset Fair Value (a) | Liability Fair Value (b) | ||||||||||||||||||
Interest rate contracts: | ||||||||||||||||||||||||
Fair value hedges: | ||||||||||||||||||||||||
Receive-fixed swaps | $ | 25,756 | $ | 699 | $ | 18 | $ | 20,930 | $ | 827 | $ | 38 | ||||||||||||
Pay-fixed swaps (c) | 5,934 | 13 | 153 | 4,233 | 3 | 138 | ||||||||||||||||||
Subtotal | 31,690 | 712 | 171 | 25,163 | 830 | 176 | ||||||||||||||||||
Cash flow hedges: | ||||||||||||||||||||||||
Receive-fixed swaps | 17,879 | 412 | 2 | 19,991 | 400 | 10 | ||||||||||||||||||
Forward purchase commitments | 1,400 | 4 | 1 | 2,778 | 25 | |||||||||||||||||||
Subtotal | 19,279 | 416 | 3 | 22,769 | 425 | 10 | ||||||||||||||||||
Foreign exchange contracts: | ||||||||||||||||||||||||
Net investment hedges | 1,105 | 31 | 1,129 | 6 | ||||||||||||||||||||
Total derivatives designated as hedging instruments | $ | 52,074 | $ | 1,159 | $ | 174 | $ | 49,061 | $ | 1,261 | $ | 186 | ||||||||||||
| (a) | Included in Other assets on our Consolidated Balance Sheet. |
| (b) | Included in Other liabilities on our Consolidated Balance Sheet. |
| (c) | Includes zero-coupon swaps. |
Fair Value Hedges
We enter into receive-fixed, pay-variable interest rate swaps to hedge changes in the fair value of outstanding fixed-rate debt caused by fluctuations in market interest rates. We also enter into pay-fixed, receive-variable interest rate swaps and zero-coupon swaps to hedge changes in the fair value of fixed rate and zero-coupon investment securities caused by fluctuations in market interest rates. For these hedge relationships, we use statistical regression analysis to assess hedge effectiveness at both the inception of the hedge relationship and on an ongoing basis. There were no components of derivative gains or losses excluded from the assessment of hedge effectiveness.
Further detail regarding gains (losses) on fair value hedge derivatives and related hedged items is presented in the following table:
Table 113: Gains (Losses) on Derivatives and Related Hedged Items – Fair Value Hedges
| Year ended | ||||||||||||||||||||||||||||
| December 31, 2015 | December 31, 2014 | December 31, 2013 | ||||||||||||||||||||||||||
| Gain (Loss) on Derivatives Recognized in Income | Gain (Loss) on Related Hedged Items Recognized in Income | Gain (Loss) on Derivatives Recognized in Income | Gain (Loss) on Related Hedged Items Recognized in Income | Gain (Loss) on Derivatives Recognized in Income | Gain (Loss) on Related Hedged Items Recognized in Income | |||||||||||||||||||||||
| In millions | Hedged Items | Location | Amount | Amount | Amount | Amount | Amount | Amount | ||||||||||||||||||||
Interest rate contracts | U.S. Treasury and Government Agencies Securities and Other Debt Securities | Investment securities (interest income) | $ | (111 | ) | $ | 116 | $ | 111 | $ | (115 | ) | ||||||||||||||||
Interest rate contracts | Subordinated debt and Bank notes and senior debt | Borrowed funds (interest expense) | $ | (108 | ) | $ | 67 | 123 | (158 | ) | (744 | ) | 711 | |||||||||||||||
Total (a) | $ | (108 | ) | $ | 67 | $ | 12 | $ | (42 | ) | $ | (633 | ) | $ | 596 | |||||||||||||
| (a) | The ineffective portion of the change in value of our fair value hedge derivatives resulted in net losses of $41 million for 2015 compared with net losses of $30 million for 2014 and net losses of $37 million for 2013. |
| The PNC Financial Services Group, Inc. – Form 10-K 181 |
Cash Flow Hedges
We enter into receive-fixed, pay-variable interest rate swaps to modify the interest rate characteristics of designated commercial loans from variable to fixed in order to reduce the impact of changes in future cash flows due to market interest rate changes. For these cash flow hedges, any changes in the fair value of the derivatives that are effective in offsetting changes in the forecasted interest cash flows are recorded in Accumulated other comprehensive income and are reclassified to interest income in conjunction with the recognition of interest received on the loans. In the 12 months that follow December 31, 2015, we expect to reclassify from the amount currently reported in Accumulated other comprehensive income, net derivative gains of $190 million pretax, or $124 million after-tax, in association with interest received on the hedged loans. This amount could differ from amounts actually recognized due to changes in interest rates, hedge de-designations, and the addition of other hedges subsequent to December 31, 2015. The maximum length of time over which forecasted loan cash flows are hedged is 7 years. We use statistical regression analysis to assess the effectiveness of these hedge relationships at both the inception of the hedge relationship and on an ongoing basis.
We also periodically enter into forward purchase and sale contracts to hedge the variability of the consideration that will be paid or received related to the purchase or sale of investment securities. The forecasted purchase or sale is consummated upon gross settlement of the forward contract itself. As a result, hedge ineffectiveness, if any, is typically minimal. Gains and losses on these forward contracts are recorded in Accumulated other comprehensive income and are recognized in earnings when the hedged cash flows affect earnings. In the 12 months that follow December 31, 2015, we expect to reclassify from the amount currently reported in Accumulated other comprehensive income, net derivative gains of $24 million pretax, or $16 million after-tax, as adjustments of yield on investment securities. As of December 31, 2015, the maximum length of time over which forecasted purchase contracts are hedged is 2 months.
There were no components of derivative gains or losses excluded from the assessment of hedge effectiveness related to either cash flow hedge strategy.
During 2015, 2014 and 2013, there were no gains or losses from cash flow hedge derivatives reclassified to earnings because it became probable that the original forecasted transaction would not occur.
Further detail regarding gains (losses) on derivatives and related cash flows is presented in the following table:
Table 114: Gains (Losses) on Derivatives and Related Cash Flows – Cash Flow Hedges (a) (b)
| Year ended December 31 | ||||||||||||
| In millions | 2015 | 2014 | 2013 | |||||||||
Gains (losses) on derivatives recognized in OCI – (effective portion) | $ | 415 | $ | 431 | $ | (141 | ) | |||||
Less: Gains (losses) reclassified from accumulated OCI into income – (effective portion) | ||||||||||||
Interest income | 293 | 263 | 337 | |||||||||
Noninterest income | (5 | ) | 49 | |||||||||
Total gains (losses) reclassified from accumulated OCI into income – (effective portion) | $ | 288 | $ | 263 | $ | 386 | ||||||
Net unrealized gains (losses) on cash flow hedge derivatives | $ | 127 | $ | 168 | $ | (527 | ) | |||||
| (a) | All cash flow hedge derivatives are interest rate contracts as of December 31, 2015, December 31, 2014 and December 31, 2013. |
| (b) | The amount of cash flow hedge ineffectiveness recognized in income was not material for the periods presented. |
Net Investment Hedges
We enter into foreign currency forward contracts to hedge non-U.S. Dollar (USD) net investments in foreign subsidiaries against adverse changes in foreign exchange rates. We assess whether the hedging relationship is highly effective in achieving offsetting changes in the value of the hedge and hedged item by qualitatively verifying that the critical terms of the hedge and hedged item match at the inception of the hedging relationship and on an ongoing basis. Net investment hedge derivatives are classified as foreign exchange contracts. There were no components of derivative gains or losses excluded from the assessment of the hedge effectiveness. For 2015, 2014 and 2013, there was no net investment hedge ineffectiveness. Gains (losses) on net investment hedge derivatives recognized in OCI was net gains of $60 million as of December 31, 2015, net gains of $54 million at December 31, 2014 and net losses of $21 million at December 31, 2013.
Derivatives Not Designated As Hedging Instruments under GAAP
We also enter into derivatives that are not designated as accounting hedges under GAAP.
| 182 The PNC Financial Services Group, Inc. – Form 10-K |
Further detail regarding the notional amounts and fair values related to derivatives not designated in hedge relationships is presented in the following table:
Table 115: Derivatives Not Designated As Hedging Instruments under GAAP
| December 31, 2015 | December 31, 2014 | |||||||||||||||||||||||
| In millions | Notional / Contract Amount | Asset Fair Value (a) | Liability Fair Value (b) | Notional / Contract Amount | Asset Fair Value (a) | Liability Fair Value (b) | ||||||||||||||||||
Derivatives used for residential mortgage banking activities: | ||||||||||||||||||||||||
Residential mortgage servicing | ||||||||||||||||||||||||
Interest rate contracts: | ||||||||||||||||||||||||
Swaps | $ | 37,505 | $ | 758 | $ | 416 | $ | 32,459 | $ | 777 | $ | 394 | ||||||||||||
Swaptions | 650 | 27 | 14 | 1,498 | 29 | 22 | ||||||||||||||||||
Futures (c) | 17,653 | 22,084 | ||||||||||||||||||||||
Futures options | 6,000 | 1 | 12,225 | 4 | ||||||||||||||||||||
Mortgage-backed securities commitments | 3,920 | 4 | 8 | 710 | 4 | |||||||||||||||||||
Subtotal | 65,728 | 789 | 439 | 68,976 | 814 | 416 | ||||||||||||||||||
Loan sales | ||||||||||||||||||||||||
Interest rate contracts: | ||||||||||||||||||||||||
Futures (c) | 20 | 58 | ||||||||||||||||||||||
Bond options | 200 | 2 | 300 | |||||||||||||||||||||
Mortgage-backed securities commitments | 6,363 | 16 | 8 | 4,916 | 10 | 21 | ||||||||||||||||||
Residential mortgage loan commitments | 1,580 | 16 | 1,852 | 22 | ||||||||||||||||||||
Subtotal | 8,163 | 34 | 8 | 7,126 | 32 | 21 | ||||||||||||||||||
Subtotal | $ | 73,891 | $ | 823 | $ | 447 | $ | 76,102 | $ | 846 | $ | 437 | ||||||||||||
Derivatives used for commercial mortgage banking activities: | ||||||||||||||||||||||||
Interest rate contracts: | ||||||||||||||||||||||||
Swaps | $ | 3,945 | $ | 77 | $ | 46 | $ | 3,801 | $ | 67 | $ | 48 | ||||||||||||
Swaptions | 439 | 439 | 2 | 1 | ||||||||||||||||||||
Futures (c) | 18,454 | 19,913 | ||||||||||||||||||||||
Commercial mortgage loan commitments | 1,176 | 11 | 6 | 2,042 | 16 | 10 | ||||||||||||||||||
Subtotal | 24,014 | 88 | 52 | 26,195 | 85 | 59 | ||||||||||||||||||
Credit contracts | 77 | 95 | ||||||||||||||||||||||
Subtotal | $ | 24,091 | $ | 88 | $ | 52 | $ | 26,290 | $ | 85 | $ | 59 | ||||||||||||
Derivatives used for customer-related activities: | ||||||||||||||||||||||||
Interest rate contracts: | ||||||||||||||||||||||||
Swaps | $ | 157,041 | $ | 2,507 | $ | 2,433 | $ | 146,008 | $ | 2,632 | $ | 2,559 | ||||||||||||
Caps/floors – Sold | 5,337 | 11 | 4,846 | 16 | ||||||||||||||||||||
Caps/floors – Purchased | 6,383 | 18 | 6,339 | 34 | ||||||||||||||||||||
Swaptions | 4,363 | 86 | 13 | 3,361 | 62 | 12 | ||||||||||||||||||
Futures (c) | 1,673 | 3,112 | ||||||||||||||||||||||
Mortgage-backed securities commitments | 1,910 | 5 | 2 | 2,137 | 3 | 3 | ||||||||||||||||||
Subtotal | 176,707 | 2,616 | 2,459 | 165,803 | 2,731 | 2,590 | ||||||||||||||||||
Foreign exchange contracts | 10,888 | 194 | 198 | 12,547 | 223 | 240 | ||||||||||||||||||
Credit contracts | 5,026 | 2 | 4 | 5,124 | 2 | 4 | ||||||||||||||||||
Subtotal | $ | 192,621 | $ | 2,812 | $ | 2,661 | $ | 183,474 | $ | 2,956 | $ | 2,834 | ||||||||||||
Derivatives used for other risk management activities: | ||||||||||||||||||||||||
Interest rate contracts | $ | 833 | $ | 1 | ||||||||||||||||||||
Foreign exchange contracts | $ | 2,742 | $ | 59 | $ | 6 | 2,661 | 85 | $ | 1 | ||||||||||||||
Credit contracts | 15 | 15 | ||||||||||||||||||||||
Other contracts (d) | 2,542 | 462 | 1,881 | 510 | ||||||||||||||||||||
Subtotal | 5,299 | 59 | 468 | 5,390 | 86 | 511 | ||||||||||||||||||
Total derivatives not designated as hedging instruments | $ | 295,902 | $ | 3,782 | $ | 3,628 | $ | 291,256 | $ | 3,973 | $ | 3,841 | ||||||||||||
| (a) | Included in Other assets on our Consolidated Balance Sheet. |
| (b) | Included in Other liabilities on our Consolidated Balance Sheet. |
| (c) | Futures contracts settle in cash daily and, therefore, no derivative asset or derivative liability is recognized on our Consolidated Balance Sheet. |
| (d) | Includes PNC's obligation to fund a portion of certain BlackRock LTIP programs and the swaps entered into in connection with sales of a portion of Visa Class B common shares. |
| The PNC Financial Services Group, Inc. – Form 10-K 183 |
Our residential mortgage banking activities consist of originating, selling and servicing mortgage loans. Residential mortgage loans that will be sold in the secondary market, and the related loan commitments, which are considered derivatives, are accounted for at fair value. Changes in the fair value of the loans and commitments due to interest rate risk are hedged with forward contracts to sell mortgage-backed securities, as well as U.S. Treasury and Eurodollar futures and options. Gains and losses on the loans and commitments held for sale and the derivatives used to economically hedge them are included in Residential mortgage noninterest income on the Consolidated Income Statement.
We typically retain the servicing rights related to residential mortgage loans that we sell. Residential mortgage servicing rights are accounted for at fair value with changes in fair value influenced primarily by changes in interest rates. Derivatives used to hedge the fair value of residential mortgage servicing rights include interest rate futures, swaps, options, and forward contracts to purchase mortgage-backed securities. Gains and losses on residential mortgage servicing rights and the related derivatives used for hedging are included in Residential mortgage noninterest income.
Commercial mortgage loans held for sale and the related loan commitments, which are considered derivatives, are accounted for at fair value. Derivatives used to economically hedge these loans and commitments from changes in fair value due to interest rate risk and credit risk include forward loan sale contracts, interest rate swaps, and credit default swaps. Gains and losses on the commitments, loans and derivatives are
included in Other noninterest income. Derivatives used to economically hedge the change in value of commercial mortgage servicing rights include interest rate futures, swaps and options. Gains or losses on these derivatives are included in Corporate services noninterest income.
The residential and commercial mortgage loan commitments associated with loans to be sold which are accounted for as derivatives are valued based on the estimated fair value of the underlying loan and the probability that the loan will fund within the terms of the commitment. The fair value also takes into account the fair value of the embedded servicing right.
We offer derivatives to our customers in connection with their risk management needs. These derivatives primarily consist of interest rate swaps, interest rate caps and floors, swaptions and foreign exchange contracts. We primarily manage our market risk exposure from customer transactions by entering into a variety of hedging transactions with third-party dealers. Gains and losses on customer-related derivatives are included in Other noninterest income.
Included in the customer, mortgage banking risk management, and other risk management portfolios are written interest-rate caps and floors entered into with customers and for risk management purposes. We receive an upfront premium from the counterparty and are obligated to make payments to the counterparty if the underlying market interest rate rises above or falls below a certain level designated in the contract. Our ultimate obligation under written options is based on future market conditions.
| 184 The PNC Financial Services Group, Inc. – Form 10-K |
Further detail regarding the gains (losses) on derivatives not designated in hedging relationships is presented in the following table:
Table 116: Gains (Losses) on Derivatives Not Designated As Hedging Instruments under GAAP
| Year ended December 31 | ||||||||||||
| In millions | 2015 | 2014 | 2013 | |||||||||
Derivatives used for residential mortgage banking activities: | ||||||||||||
Residential mortgage servicing | ||||||||||||
Interest rate contracts | $ | 103 | $ | 240 | $ | (223 | ) | |||||
Loan sales | ||||||||||||
Interest rate contracts | 83 | (3 | ) | 286 | ||||||||
Gains (losses) included in residential mortgage banking activities (a) | $ | 186 | $ | 237 | $ | 63 | ||||||
Derivatives used for commercial mortgage banking activities: | ||||||||||||
Interest rate contracts (b) (c) | $ | 34 | $ | 82 | $ | 12 | ||||||
Credit contracts (c) | (1 | ) | (2 | ) | ||||||||
Gains (losses) from commercial mortgage banking activities | $ | 34 | $ | 81 | $ | 10 | ||||||
Derivatives used for customer-related activities: | ||||||||||||
Interest rate contracts | $ | 71 | $ | 41 | $ | 149 | ||||||
Foreign exchange contracts | 79 | 47 | 80 | |||||||||
Equity contracts | (3 | ) | ||||||||||
Credit contracts | (1 | ) | (1 | ) | (1 | ) | ||||||
Gains (losses) from customer-related activities (c) | $ | 149 | $ | 87 | $ | 225 | ||||||
Derivatives used for other risk management activities: | ||||||||||||
Interest rate contracts | $ | (19 | ) | $ | 3 | |||||||
Foreign exchange contracts | $ | 281 | 188 | 2 | ||||||||
Other contracts (d) | 1 | (134 | ) | (168 | ) | |||||||
Gains (losses) from other risk management activities (c) | $ | 282 | $ | 35 | $ | (163 | ) | |||||
Total gains (losses) from derivatives not designated as hedging instruments | $ | 651 | $ | 440 | $ | 135 | ||||||
| (a) | Included in Residential mortgage noninterest income. |
| (b) | Included in Corporate services noninterest income. |
| (c) | Included in Other noninterest income. |
| (d) | Includes BlackRock LTIP funding obligation and the swaps entered into in connection with sales of a portion of Visa Class B common shares. |
Credit Derivatives – Risk Participation Agreements
We have entered into risk participation agreements to share some of the credit exposure with other counterparties related to interest rate derivative contracts or to take on credit exposure to generate revenue. The notional amount of risk participation agreements sold was $2.5 billion at December 31, 2015 and 2.8 billion at December 31, 2014. Assuming all underlying third party customers referenced in the swap contracts defaulted at December 31, 2015, the exposure from these agreements would be $122 million based on the fair value of the underlying swaps, compared with $124 million at December 31, 2014.
Offsetting, Counterparty Credit Risk, and Contingent Features
We, generally, utilize a net presentation on the Consolidated Balance Sheet for those derivative financial instruments entered into with counterparties under legally enforceable master netting agreements. The master netting agreements reduce credit risk by permitting the closeout netting of all outstanding derivative instruments under the master netting agreement with the same counterparty upon the occurrence of an event of default. The master netting agreement also may
require the exchange of cash or marketable securities to collateralize either party's net position. In certain cases, minimum thresholds must be exceeded before any collateral is exchanged. Collateral is typically exchanged daily based on the net fair value of the positions with the counterparty as of the preceding day. Collateral representing initial margin, which is based on potential future exposure, is also required to be pledged by us in relation to derivative instruments with central clearing house counterparties. Any cash collateral exchanged with counterparties under these master netting agreements is also netted, when appropriate, against the applicable derivative fair values on the Consolidated Balance Sheet. However, the fair value of any securities held or pledged is not included in the net presentation on the balance sheet. In order for derivative instruments under a master netting agreement to be eligible for closeout netting under GAAP, we must conduct sufficient legal review to conclude with a well-founded basis that the offsetting rights included in the master netting agreement would be legally enforceable upon an event of default, including upon an event of bankruptcy, insolvency, or a similar proceeding of the counterparty. Enforceability is evidenced by a legal opinion that supports, with sufficient confidence, the enforceability of the master netting agreement in such circumstances.
| The PNC Financial Services Group, Inc. – Form 10-K 185 |
The following derivative Table 117 shows the impact legally enforceable master netting agreements had on our derivative assets and derivative liabilities as of December 31, 2015 and December 31, 2014. The table includes cash collateral held or pledged under legally enforceable master netting agreements. The table also includes the fair value of any securities collateral held or pledged under legally enforceable master netting agreements. Cash and securities collateral amounts are included in the table only to the extent of the related net derivative fair values.
Refer to Note 21 Commitments and Guarantees for additional information related to resale and repurchase agreements offsetting.
Table 117: Derivative Assets and Liabilities Offsetting
| Gross Fair Value | Amounts Offset on the Consolidated Balance Sheet | Net Fair Value | Securities Collateral Held/(Pledged) Under Master Netting Agreements | Net Amounts | ||||||||||||||||||||
December 31, 2015 In millions | Fair Value Offset Amount | Cash Collateral | ||||||||||||||||||||||
Derivative assets | ||||||||||||||||||||||||
Interest rate contracts: | ||||||||||||||||||||||||
Cleared | $ | 1,003 | $ | 779 | $ | 195 | $ | 29 | $ | 29 | ||||||||||||||
Over-the-counter | 3,652 | 1,645 | 342 | 1,665 | $ | 178 | 1,487 | |||||||||||||||||
Foreign exchange contracts | 284 | 129 | 13 | 142 | 2 | 140 | ||||||||||||||||||
Credit contracts | 2 | 1 | 1 | |||||||||||||||||||||
Total derivative assets | $ | 4,941 | $ | 2,554 | $ | 551 | $ | 1,836 | (a) | $ | 180 | $ | 1,656 | |||||||||||
Derivative liabilities | ||||||||||||||||||||||||
Interest rate contracts: | ||||||||||||||||||||||||
Cleared | $ | 855 | $ | 779 | $ | 57 | $ | 19 | $ | 19 | ||||||||||||||
Exchange-traded | 1 | 1 | 1 | |||||||||||||||||||||
Over-the-counter | 2,276 | 1,687 | 530 | 59 | 59 | |||||||||||||||||||
Foreign exchange contracts | 204 | 85 | 20 | 99 | 99 | |||||||||||||||||||
Credit contracts | 4 | 3 | 1 | |||||||||||||||||||||
Other contracts | 462 | 462 | 462 | |||||||||||||||||||||
Total derivative liabilities | $ | 3,802 | $ | 2,554 | $ | 608 | $ | 640 | (b) | $ | 640 | |||||||||||||
December 31, 2014 In millions | ||||||||||||||||||||||||
Derivative assets | ||||||||||||||||||||||||
Interest rate contracts | $ | 4,918 | $ | 1,981 | $ | 458 | $ | 2,479 | $ | 143 | $ | 2,336 | ||||||||||||
Foreign exchange contracts | 314 | 159 | 47 | 108 | 1 | 107 | ||||||||||||||||||
Credit contracts | 2 | 1 | 1 | |||||||||||||||||||||
Total derivative assets (c) | $ | 5,234 | $ | 2,141 | $ | 506 | $ | 2,587 | (a) | $ | 144 | $ | 2,443 | |||||||||||
Derivative liabilities | ||||||||||||||||||||||||
Interest rate contracts | $ | 3,272 | $ | 2,057 | $ | 483 | $ | 732 | $ | 732 | ||||||||||||||
Foreign exchange contracts | 241 | 80 | 20 | 141 | 141 | |||||||||||||||||||
Credit contracts | 4 | 4 | ||||||||||||||||||||||
Other contracts | 510 | 510 | 510 | |||||||||||||||||||||
Total derivative liabilities (c) | $ | 4,027 | $ | 2,141 | $ | 503 | $ | 1,383 | (b) | $ | 1,383 | |||||||||||||
| (a) | Represents the net amount of derivative assets included in Other assets on our Consolidated Balance Sheet. |
| (b) | Represents the net amount of derivative liabilities included in Other liabilities on our Consolidated Balance Sheet. |
| (c) | As of December 31, 2014, cleared derivatives were not subject to offsetting. Gross derivative assets and derivative liabilities for cleared derivatives totaled $807 million and $657 million, respectively, at December 31, 2014. Derivative assets and liabilities related to exchange-traded contracts were not material at December 31, 2014. |
| 186 The PNC Financial Services Group, Inc. – Form 10-K |
The table above includes over-the-counter (OTC) derivatives, cleared derivatives, and exchange-traded derivatives. OTC derivatives represent contracts executed bilaterally with counterparties that are not settled through an organized exchange or cleared through a central clearing house. Cleared derivatives represent contracts executed bilaterally with counterparties in the OTC market that are novated to a central clearing house who then becomes our counterparty. Exchange-traded derivatives represent standardized futures and options contracts executed directly on an organized exchange.
As of December 31, 2015, derivative fair values and related cash collateral for derivatives cleared through a central clearing house are, when appropriate, presented on a net basis.
The derivative fair values in the table not identified as cleared or exchange-traded represent OTC derivatives, the majority of which are governed by ISDA documentation or other legally enforceable industry standard master netting agreements and are subject to offsetting.
In addition to using master netting agreements and other collateral agreements to reduce credit risk associated with derivative instruments, we also seek to manage credit risk by evaluating credit ratings of counterparties and by using internal credit analysis, limits, and monitoring procedures.
At December 31, 2015, we held cash, U.S. government securities and mortgage-backed securities totaling $.9 billion under master netting agreements and other collateral agreements to collateralize net derivative assets due from counterparties, and we pledged cash totaling $.9 billion under these agreements to collateralize net derivative liabilities owed
to counterparties and to meet initial margin requirements. These totals may differ from the amounts presented in the preceding offsetting table because these totals may include collateral exchanged under an agreement that does not qualify as a master netting agreement or because the total amount of collateral held or pledged exceeds the net derivative fair values with the counterparty as of the balance sheet date due to timing or other factors, such as initial margin. To the extent not netted against the derivative fair values under a master netting agreement, the receivable for cash pledged is included in Other assets and the obligation for cash held is included in Other borrowed funds on our Consolidated Balance Sheet. Securities held from counterparties are not recognized on our balance sheet. Likewise securities we have pledged to counterparties remain on our balance sheet.
Certain derivative agreements contain various credit-risk related contingent provisions, such as those that require PNC's debt to maintain a specified credit rating from one or more of the major credit rating agencies. If PNC's debt ratings were to fall below such specified ratings, the counterparties to the derivative instruments could request immediate payment or demand immediate and ongoing full collateralization on derivative instruments in net liability positions. The aggregate fair value of all derivative instruments with credit-risk-related contingent features that were in a net liability position on December 31, 2015 was $.8 billion for which PNC had posted collateral of $.6 billion in the normal course of business. The maximum additional amount of collateral PNC would have been required to post if the credit-risk-related contingent features underlying these agreements had been triggered on December 31, 2015 would be $.2 billion.
| The PNC Financial Services Group, Inc. – Form 10-K 187 |
N OTE 15 E ARNINGS P ER S HARE
Table 118: Basic and Diluted Earnings per Common Share
| In millions, except per share data | 2015 | 2014 | 2013 | |||||||||
Basic | ||||||||||||
Net income | $ | 4,143 | $ | 4,207 | $ | 4,212 | ||||||
Less: | ||||||||||||
Net income (loss) attributable to noncontrolling interests | 37 | 23 | 11 | |||||||||
Preferred stock dividends and discount accretion and redemptions | 225 | 237 | 249 | |||||||||
Net income attributable to common shares | 3,881 | 3,947 | 3,952 | |||||||||
Less: | ||||||||||||
Dividends and undistributed earnings allocated to participating securities | 17 | 11 | 18 | |||||||||
Net income attributable to basic common shares | $ | 3,864 | $ | 3,936 | $ | 3,934 | ||||||
Basic weighted-average common shares outstanding | 514 | 529 | 528 | |||||||||
Basic earnings per common share (a) | $ | 7.52 | $ | 7.44 | $ | 7.45 | ||||||
Diluted | ||||||||||||
Net income attributable to basic common shares | $ | 3,864 | $ | 3,936 | $ | 3,934 | ||||||
Less: Impact of BlackRock earnings per share dilution | 18 | 18 | 18 | |||||||||
Net income attributable to diluted common shares | $ | 3,846 | $ | 3,918 | $ | 3,916 | ||||||
Basic weighted-average common shares outstanding | 514 | 529 | 528 | |||||||||
Dilutive potential common shares (b) | 7 | 8 | 4 | |||||||||
Diluted weighted-average common shares outstanding | 521 | 537 | 532 | |||||||||
Diluted earnings per common share (a) | $ | 7.39 | $ | 7.30 | $ | 7.36 | ||||||
| (a) | Basic and diluted earnings per share under the two-class method are determined on net income reported on the income statement less earnings allocated to nonvested restricted shares and restricted share units with nonforfeitable dividends and dividend rights (participating securities). |
| (b) | Excludes number of stock options considered to be anti-dilutive of 1 million for 2013. No warrants were considered to be anti-dilutive for 2013. No stock options or warrants were considered to be anti-dilutive for 2014 and 2015. |
N OTE 16 E QUITY
Preferred Stock
The following table provides the number of preferred shares issued and outstanding, the liquidation value per share and the number of authorized preferred shares that are available for future use.
Table 119: Preferred Stock – Authorized, Issued and Outstanding
| Preferred Shares | ||||||||||||
December 31 Shares in thousands | Liquidation share | 2015 | 2014 | |||||||||
Authorized | ||||||||||||
$1 par value | 16,588 | 16,588 | ||||||||||
Issued and outstanding | ||||||||||||
Series B | $ | 40 | 1 | 1 | ||||||||
Series K | $ | 10,000 | 50 | |||||||||
Series O | $ | 100,000 | 10 | 10 | ||||||||
Series P | $ | 100,000 | 15 | 15 | ||||||||
Series Q | $ | 100,000 | 5 | 5 | ||||||||
Series R | $ | 100,000 | 5 | 5 | ||||||||
Total issued and outstanding | 36 | 86 | ||||||||||
| 188 The PNC Financial Services Group, Inc. – Form 10-K |
The following table discloses information related to the preferred stock outstanding as of December 31, 2015.
Table 120: Terms of Outstanding Preferred Stock
| Preferred Stock | Issue Date | Number of Depositary Shares Issued | Fractional Interest in a share of preferred stock represented by each Depositary Share | Dividend Dates (a) | Annual Per Share Dividend Rate | Optional Redemption Date (b) | ||||||||||||
Series B (c) | (c) | N/A | N/A | Quarterly from March 10 th | $1.80 | None | ||||||||||||
Series O (d) | July 27, 2011 | 1 million | 1/100 th | Semi-annually beginning on February 1, 2012 until August 1, 2021
Quarterly beginning on November 1, 2021 | 6.75% until August 1, 2021 3 Mo. LIBOR plus 3.678% per annum beginning on August 1, 2021 | August 1, 2021 | ||||||||||||
Series P (d) | April 24, 2012 | 60 million | 1/4,000 th | Quarterly beginning on August 1, 2012 | 6.125% until May 1, 2022 3 Mo. LIBOR plus 4.0675% per annum beginning on May 1, 2022 | May 1, 2022 | ||||||||||||
Series Q (d) |
| September 21, 2012
October 9, 2012 |
|
| 18 million
1.2 million |
| 1/4,000 th | Quarterly beginning on December 1, 2012 | 5.375% | December 1, 2017 | ||||||||
Series R (d) | May 7, 2013 | 500,000 | 1/100 th | Semi-annually beginning on December 1, 2013 until June 1, 2023
Quarterly beginning on September 1, 2023 | 4.85% until June 1, 2023 3 Mo. LIBOR plus 3.04% per annum beginning June 1, 2023 | June 1, 2023 | ||||||||||||
| (a) | Dividends are payable when, as, and if declared by our Board of Directors or an authorized committee of our Board. |
| (b) | Redeemable at PNC's option on or after the date stated. With the exception of the Series B preferred stock, redeemable at PNC's option within 90 days of a regulatory capital treatment event as defined in the designations. |
| (c) | Cumulative preferred stock. Holders of Series B preferred stock are entitled to 8 votes per share, which is equal to the number of full shares of common stock into which the Series B preferred stock is convertible. The Series B preferred stock was issued in connection with the consolidation of Pittsburgh National Corporation and Provident National Corporation in 1983. |
| (d) | Non-Cumulative preferred stock. |
Our Series L preferred stock was issued in connection with the National City transaction in exchange for National City's Fixed-to-Floating Rate Non-Cumulative Preferred Stock, Series F. Dividends were paid at a rate of 9.875% prior to February 1, 2013 and at a rate of three-month LIBOR plus 633 basis points beginning February 1, 2013. On April 19, 2013, PNC redeemed all 6,000,000 depositary shares representing interests in PNC's Series L preferred stock and all 1,500 shares of Series L preferred stock underlying such depositary shares, resulting in a net outflow of $150 million.
Our Series K preferred stock was issued on May 21, 2008. Dividends were paid at a rate of 8.25% until May 21, 2013 and at a rate of three-month LIBOR plus 422 basis points beginning May 21, 2013. On May 4, 2015, PNC redeemed all 500,000 depositary shares representing interests in PNC's Series K preferred stock and all 50,000 shares of Series K preferred stock underlying such depositary shares, resulting in a net outflow of $500 million.
We have authorized but unissued Series H and Series I preferred stock. As described below in the Perpetual Trust Securities portion of the Noncontrolling Interests section of
this Note, the PNC Preferred Funding Trust II securities are automatically exchangeable into shares of PNC Series I preferred stock under certain conditions relating to the capitalization or the financial condition of PNC Bank and upon the direction of the Office of the Comptroller of the Currency. The Series A preferred stock of PNC REIT Corp. is also automatically exchangeable under similar conditions into shares of PNC Series H preferred stock.
Warrants
We had 13.4 million warrants outstanding as of December 31, 2015 compared to 16.9 million as of December 31, 2014. The reduction was due to 3.5 million warrants that were exercised during 2015. Each warrant entitles the holder to purchase one share of PNC common stock at an exercise price of $67.33 per share. In accordance with the terms of the warrants, the warrants are exercised on a non-cash net basis with the warrant holder receiving PNC common shares determined based on the excess of the market price of PNC common stock on the exercise date over the exercise price of the warrant. In 2015, we issued 1.1 million common shares resulting from the exercise of the warrants. The issuance of these shares resulted
| The PNC Financial Services Group, Inc. – Form 10-K 189 |
in a reclassification within Capital surplus – Common stock and other with no impact on PNC's Shareholders' equity. These warrants were sold by the U.S. Treasury in a secondary public offering that closed on May 5, 2010 after the U.S. Treasury exchanged its TARP Warrant (issued on December 31, 2008 under the TARP Capital Purchase Program) for 16.9 million warrants. These warrants expire December 31, 2018.
Other Shareholders' Equity Matters
We have a dividend reinvestment and stock purchase plan. Holders of preferred stock and PNC common stock may participate in the plan, which provides that additional shares of common stock may be purchased at market value with reinvested dividends and voluntary cash payments. Common shares issued pursuant to this plan were: 0.3 million shares in 2015, 0.3 million shares in 2014 and 0.4 million shares in 2013.
At December 31, 2015, we had reserved approximately 93 million common shares to be issued in connection with certain stock plans.
We repurchased 4.4 million shares in 2015 and 13.5 million shares in 2014 under the stock repurchase program that the Board of Directors approved effective October 4, 2007. Effective March 31, 2015, the Board of Directors terminated this share repurchase program and effective April 1, 2015 the Board of Directors replaced it with a new stock repurchase program authorization in the amount of up to 100 million shares of PNC common stock which may be purchased on the open market or in privately negotiated transactions. We repurchased 17.9 million shares under this program in 2015 . A maximum amount of 82.1 million shares remained available for repurchase under this program at December 31, 2015. This program will remain in effect until fully utilized or until modified, superseded or terminated.
Noncontrolling Interests
Perpetual Trust Securities
In December 2006, one of our indirect subsidiaries, PNC REIT Corp., sold $500 million of 6.517% Fixed-to-Floating Rate Non-Cumulative Exchangeable Perpetual Trust Securities (the "Trust Securities") of PNC Preferred Funding Trust I ("Trust I"), in a private placement. PNC REIT Corp. had previously acquired the Trust Securities from the trust in exchange for an equivalent amount of Fixed-to-Floating Rate Non-Cumulative Perpetual Preferred Securities (the "LLC Preferred Securities"), of PNC Preferred Funding LLC, (the "LLC"), held by PNC REIT Corp. The LLC's initial material assets consist of indirect interests in mortgages and mortgage-related assets previously owned by PNC REIT Corp. The rate on these securities at December 31, 2015 was 2.162%.
In March 2007, the LLC, sold $500 million of 6.113% Fixed-to-Floating Rate Non-Cumulative Exchangeable Perpetual Trust Securities (the "Trust II Securities") of PNC Preferred Funding Trust II ("Trust II") in a private placement. In connection with the private placement, Trust II acquired $500 million of LLC Preferred Securities, from the LLC. The rate on these securities at December 31, 2015 was 1.735%.
The Trust I Securities and Trust II Securities are redeemable in whole or in part at par ($100,000 per security), plus any declared and unpaid dividends to the redemption date, on the quarterly dividend payment date in March 2017 and on the March quarterly dividend payment date in each fifth succeeding year (each, a "Five Year Date").
The Trust I Securities and Trust II Securities are also redeemable in whole, but not in part, on any quarterly dividend payment date that is not a Five Year Date at a redemption price equal to the sum of: (i) the greater of (A) $100,000 per security or (B) the sum of present values of $100,000 per security and all undeclared dividends for the dividend periods from the redemption date to and including the next succeeding Five Year Date, discounted to the redemption date on a quarterly basis at the 3-month USD LIBOR rate applicable to the dividend period immediately preceding such redemption date plus (ii) any declared and unpaid dividends to the redemption date.
The Trust I Securities and Trust II Securities are also redeemable in whole, but not in part, on any quarterly dividend payment date that is not a Five Year Date in the case of certain tax, investment company or regulatory capital events at a redemption price of par plus declared and unpaid dividends to the redemption date.
Upon certain conditions relating to the capitalization or the financial condition of PNC Bank and upon the direction of the OCC, the Trust I Securities are automatically exchangeable into shares of Series F preferred stock of PNC Bank and the Trust II Securities are automatically exchangeable into shares of Series I preferred stock of PNC.
Any redemption is subject to compliance with the applicable Replacement Capital Covenant (see below) and approval of the OCC.
PNC REIT Corp. owns 100% of the LLC's common voting securities. As a result, the LLC is an indirect subsidiary of PNC and is consolidated on our Consolidated Balance Sheet. Trust I and Trust II's investment in the LLC Preferred Securities is characterized as a noncontrolling interest on our Consolidated Balance Sheet since we are not the primary beneficiary of Trust I and Trust II. This noncontrolling interest totaled approximately $981 million at December 31, 2015.
| 190 The PNC Financial Services Group, Inc. – Form 10-K |
Information related to the capital covenants and contractual commitments of the perpetual trust securities, including limitations potentially imposed on PNC and PNC Bank's payment of dividends on their respective equity capital securities, follows.
Table 121: Summary of Replacement Capital Covenants of Perpetual Trust Securities
| Replacement Capital Covenant (RCC) (a) | Trust | Description of Capital Covenants | ||
Trust I RCC | Trust I | Neither we nor our subsidiaries (other than PNC Bank and its subsidiaries) would purchase the Trust Securities, the LLC Preferred Securities or the PNC Bank Preferred Stock unless such repurchases or redemptions are made from proceeds of the issuance of certain qualified securities and pursuant to the other terms and conditions set forth in the Trust I RCC. | ||
Trust II RCC | Trust II | Until March 29, 2017, neither we nor our subsidiaries would purchase or redeem the Trust II Securities, the LLC Preferred Securities or the Series I Preferred Stock unless such repurchases or redemptions are made from proceeds of the issuance of certain qualified securities and pursuant to the other terms and conditions set forth in the Trust II RCC. |
| (a) | As of December 31, 2015, each of the Trust I RCC and the Trust II RCC are for the benefit of PNC Capital Trust C as the sole holder of $200 million of junior subordinated debentures issued in June 1998. See Note 11 Borrowed Funds for additional information regarding these debentures. |
Table 122: Summary of Contractual Commitments of Perpetual Trust Securities
| Trust | Description of Restrictions on Dividend Payments (c) | |
Trust I (a) | If full dividends are not paid in a dividend period, neither PNC Bank nor its subsidiaries will declare or pay dividends or other distributions with respect to, or redeem, purchase or acquire or make a liquidation payment with respect to, any of its equity capital securities during the next succeeding period (other than to holders of the LLC Preferred Securities and any parity equity securities issued by the LLC). (d) | |
Trust II (b) | If full dividends are not paid in a dividend period, PNC will not declare or pay dividends with respect to, or redeem, purchase or acquire, any of its equity capital securities during the next succeeding dividend period. (e) |
| (a) | Contractual commitments made by PNC Bank. |
| (b) | Contractual commitments made by PNC. |
| (c) | Applies to the applicable Trust Securities and the LLC Preferred Securities. |
| (d) | Except: (i) in the case of dividends payable to subsidiaries of PNC Bank, to PNC Bank or another wholly-owned subsidiary of PNC Bank or (ii) in the case of dividends payable to persons that are not subsidiaries of PNC Bank, to such persons only if, (A) in the case of a cash dividend, PNC has first irrevocably committed to contribute amounts at least equal to such cash dividend or (B) in the case of in-kind dividends payable by PNC REIT Corp., PNC has committed to purchase such in-kind dividend from the applicable PNC REIT Corp. holders in exchange for a cash payment representing the market value of such in-kind dividend, and PNC has committed to contribute such in-kind dividend to PNC Bank. |
| (e) | Except for: (i) purchases, redemptions or other acquisitions of shares of capital stock of PNC in connection with any employment contract, benefit plan or other similar arrangement with or for the benefit of employees, officers, directors or consultants, (ii) purchases of shares of common stock of PNC pursuant to a contractually binding requirement to buy stock existing prior to the commencement of the extension period, including under a contractually binding stock repurchase plan, (iii) any dividend in connection with the implementation of a shareholders' rights plan, or the redemption or repurchase of any rights under any such plan, (iv) as a result of any exchange or conversion of any class or series of PNC's capital stock for any other class or series of PNC's capital stock, (v) the purchase of fractional interests in shares of PNC capital stock pursuant to the conversion or exchange provisions of such stock or the security being converted or exchanged or (vi) any stock dividends paid by PNC where the dividend stock is the same stock as that on which the dividend is being paid. |
On March 15, 2013 we redeemed all $375 million of the PNC Preferred Funding Trust III securities with a distribution rate of 8.7%.
| The PNC Financial Services Group, Inc. – Form 10-K 191 |
N OTE 17 O THER C OMPREHENSIVE I NCOME
Details of other comprehensive income (loss) are as follows:
Table 123: Other Comprehensive Income
Year ended December 31 In millions | 2015 | 2014 | 2013 | |||||||||
Net unrealized gains (losses) on non-OTTI securities | ||||||||||||
Increase in net unrealized gains (losses) on non-OTTI securities | $ | (494 | ) | $ | 410 | $ | (1,122 | ) | ||||
Less: Net gains (losses) realized as a yield adjustment reclassified to investment securities interest income | 27 | 31 | 39 | |||||||||
Less: Net gains (losses) realized on sales of securities reclassified to noninterest income | 48 | 4 | 50 | |||||||||
Net increase (decrease), pre-tax | (569 | ) | 375 | (1,211 | ) | |||||||
Effect of income taxes | 208 | (137 | ) | 443 | ||||||||
Net increase (decrease), after-tax | (361 | ) | 238 | (768 | ) | |||||||
Net unrealized gains (losses) on OTTI securities | ||||||||||||
Increase in net unrealized gains (losses) on OTTI securities | (17 | ) | 68 | 215 | ||||||||
Less: OTTI losses realized on securities reclassified to noninterest income | (4 | ) | (11 | ) | (16 | ) | ||||||
Net increase (decrease), pre-tax | (13 | ) | 79 | 231 | ||||||||
Effect of income taxes | 5 | (29 | ) | (84 | ) | |||||||
Net increase (decrease), after-tax | (8 | ) | 50 | 147 | ||||||||
Net unrealized gains (losses) on cash flow hedge derivatives | ||||||||||||
Increase in net unrealized gains (losses) on cash flow hedge derivatives | 415 | 431 | (141 | ) | ||||||||
Less: Net gains (losses) realized as a yield adjustment reclassified to loan interest income | 270 | 251 | 284 | |||||||||
Less: Net gains (losses) realized as a yield adjustment reclassified to investment securities interest income | 23 | 12 | 53 | |||||||||
Less: Net gains (losses) realized on sales of securities reclassified to noninterest income | (5 | ) | 49 | |||||||||
Net increase (decrease), pre-tax | 127 | 168 | (527 | ) | ||||||||
Effect of income taxes | (47 | ) | (61 | ) | 192 | |||||||
Net increase (decrease), after-tax | 80 | 107 | (335 | ) | ||||||||
Pension and other postretirement benefit plan adjustments | ||||||||||||
Net pension and other postretirement benefit activity | (82 | ) | (440 | ) | 760 | |||||||
Amortization of actuarial loss (gain) reclassified to other noninterest expense | 38 | 4 | 103 | |||||||||
Amortization of prior service cost (credit) reclassified to other noninterest expense | (10 | ) | (10 | ) | (11 | ) | ||||||
Net increase (decrease), pre-tax | (54 | ) | (446 | ) | 852 | |||||||
Effect of income taxes | 20 | 163 | (312 | ) | ||||||||
Net increase (decrease), after-tax | (34 | ) | (283 | ) | 540 | |||||||
Other | ||||||||||||
PNC's portion of BlackRock's OCI | (39 | ) | (36 | ) | 15 | |||||||
Net investment hedge derivatives | 60 | 54 | (21 | ) | ||||||||
Foreign currency translation adjustments (a) | (63 | ) | (57 | ) | 27 | |||||||
Net increase (decrease), pre-tax | (42 | ) | (39 | ) | 21 | |||||||
Effect of income taxes (a) | (8 | ) | (6 | ) | (3 | ) | ||||||
Net increase (decrease), after-tax | (50 | ) | (45 | ) | 18 | |||||||
Total other comprehensive income, pre-tax | (551 | ) | 137 | (634 | ) | |||||||
Total other comprehensive income, tax effect | 178 | (70 | ) | 236 | ||||||||
Total other comprehensive income, after-tax | $ | (373 | ) | $ | 67 | $ | (398 | ) | ||||
| (a) | The earnings of PNC's Luxembourg-UK lending business have been indefinitely reinvested: therefore, no U.S. deferred income tax has been recorded on the foreign currency translation of the investment. |
| 192 The PNC Financial Services Group, Inc. – Form 10-K |
Table 124: Accumulated Other Comprehensive Income (Loss) Components
| In millions, after-tax | Net unrealized gains (losses) on non-OTTI securities | Net unrealized gains (losses) on OTTI securities | Net unrealized gains (losses) on cash flow hedge derivatives | Pension and other postretirement benefit plan adjustments | Other | Total | ||||||||||||||||||
Balance at December 31, 2012 | $ | 1,177 | $ | (123 | ) | $ | 578 | $ | (777 | ) | $ | (21 | ) | $ | 834 | |||||||||
Net activity | (768 | ) | 147 | (335 | ) | 540 | 18 | (398 | ) | |||||||||||||||
Balance at December 31, 2013 | $ | 409 | $ | 24 | $ | 243 | $ | (237 | ) | $ | (3 | ) | $ | 436 | ||||||||||
Net activity | 238 | 50 | 107 | (283 | ) | (45 | ) | 67 | ||||||||||||||||
Balance at December 31, 2014 | $ | 647 | $ | 74 | $ | 350 | $ | (520 | ) | $ | (48 | ) | $ | 503 | ||||||||||
Net Activity | (361 | ) | (8 | ) | 80 | (34 | ) | (50 | ) | (373 | ) | |||||||||||||
Balance at December 31, 2015 | $ | 286 | $ | 66 | $ | 430 | $ | (554 | ) | $ | (98 | ) | $ | 130 | ||||||||||
N OTE 18 I NCOME T AXES
The components of income tax expense are as follows:
Table 125: Components of Income Tax Expense
| Year ended December 31 In millions | 2015 | 2014 | 2013 | |||||||||
Current | ||||||||||||
Federal | $ | 927 | $ | 1,084 | $ | 263 | ||||||
State | 33 | 68 | 17 | |||||||||
Total current | 960 | 1,152 | 280 | |||||||||
Deferred | ||||||||||||
Federal | 320 | 220 | 1,119 | |||||||||
State | 84 | 35 | 77 | |||||||||
Total deferred | 404 | 255 | 1,196 | |||||||||
Total | $ | 1,364 | $ | 1,407 | $ | 1,476 | ||||||
Significant components of deferred tax assets and liabilities are as follows:
Table 126: Deferred Tax Assets and Liabilities
| December 31 – in millions | 2015 | 2014 | ||||||
Deferred tax assets | ||||||||
Allowance for loan and lease losses | $ | 1,032 | $ | 1,250 | ||||
Compensation and benefits | 654 | 822 | ||||||
Partnership investments | 295 | 247 | ||||||
Loss and credit carryforward | 502 | 545 | ||||||
Accrued expenses | 542 | 581 | ||||||
Other | 320 | 290 | ||||||
Total gross deferred tax assets | 3,345 | 3,735 | ||||||
Valuation allowance | (61 | ) | (65 | ) | ||||
Total deferred tax assets | 3,284 | 3,670 | ||||||
Deferred tax liabilities | ||||||||
Leasing | 1,413 | 1,494 | ||||||
Goodwill and intangibles | 320 | 328 | ||||||
Fixed assets | 391 | 381 | ||||||
Net unrealized gains on securities and financial instruments | 453 | 619 | ||||||
BlackRock basis difference | 2,327 | 2,166 | ||||||
Other | 542 | 619 | ||||||
Total deferred tax liabilities | 5,446 | 5,607 | ||||||
Net deferred tax liability | $ | 2,162 | $ | 1,937 | ||||
| The PNC Financial Services Group, Inc. – Form 10-K 193 |
A reconciliation between the statutory and effective tax rates follows:
Table 127: Reconciliation of Statutory and Effective Tax Rates
| Year ended December 31 | 2015 | 2014 | 2013 | |||||||||
Statutory tax rate | 35.0 | % | 35.0 | % | 35.0 | % | ||||||
Increases (decreases) resulting from | ||||||||||||
State taxes net of federal benefit | 1.4 | 1.2 | 1.1 | |||||||||
Tax-exempt interest | (2.3 | ) | (2.2 | ) | (1.9 | ) | ||||||
Life insurance | (1.7 | ) | (1.7 | ) | (1.7 | ) | ||||||
Dividend received deduction | (1.7 | ) | (1.5 | ) | (1.2 | ) | ||||||
Tax credits | (3.9 | ) | (4.4 | ) | (3.7 | ) | ||||||
Other | (2.0 | )(a) | (1.3 | ) | (1.7 | ) | ||||||
Effective tax rate | 24.8 | % | 25.1 | % | 25.9 | % | ||||||
| (a) | Includes tax benefits associated with settlement of acquired entity tax contingencies. |
The net operating loss carryforwards at December 31, 2015 and 2014 follow:
Table 128: Net Operating Loss Carryforwards and Tax Credit Carryforwards
| In millions | December 31 2015 | December 31 2014 | ||||||
Net Operating Loss Carryforwards: | ||||||||
Federal | $ | 878 | $ | 997 | ||||
State | $ | 2,272 | $ | 2,594 | ||||
Tax Credit Carryforwards: | ||||||||
Federal | $ | 64 | $ | 35 | ||||
State | $ | 3 | $ | 7 | ||||
The federal net operating loss carryforwards expire in 2032. The state net operating loss carryforwards will expire from 2016 to 2035. The majority of the tax credit carryforwards expire in 2032.
All federal and most state net operating loss and credit carryforwards are from acquired entities and utilization is subject to various statutory limitations. It is anticipated that the company will be able to fully utilize its carryforwards for federal tax purposes, but a valuation allowance of $61 million has been recorded against certain state tax carryforwards as of December 31, 2015. If select uncertain tax positions were successfully challenged by a state, the state net operating losses listed above could be reduced by $60 million.
As of December 31, 2015, PNC had approximately $110 million of earnings attributed to foreign subsidiaries that have been indefinitely reinvested for which no incremental U.S. income tax provision has been recorded. If a U.S. deferred tax liability were to be recorded, the estimated tax liability on those undistributed earnings would be approximately $34 million.
Retained earnings at both December 31, 2015 and December 31, 2014 included $117 million in allocations for bad debt deductions of former thrift subsidiaries for which no income tax has been provided. Under current law, if certain subsidiaries use these bad debt reserves for purposes other than to absorb bad debt losses, they will be subject to Federal income tax at the current corporate tax rate.
PNC had unrecognized tax benefits of $26 million at December 31, 2015 and $77 million at December 31, 2014. At December 31, 2015, these unrecognized tax benefits, if recognized, would favorably impact the effective income tax rate by $20 million.
A reconciliation of the beginning and ending balance of unrecognized tax benefits is as follows:
Table 129: Change in Unrecognized Tax Benefits
| In millions | 2015 | 2014 | 2013 | |||||||||
Balance of gross unrecognized tax benefits at January 1 | $ | 77 | $ | 110 | $ | 176 | ||||||
Increases: | ||||||||||||
Positions taken during a prior period | 17 | 11 | ||||||||||
Decreases: | ||||||||||||
Positions taken during a prior period | (9 | ) | (27 | ) | (22 | ) | ||||||
Settlements with taxing authorities | (52 | ) | (1 | ) | (48 | ) | ||||||
Reductions resulting from lapse of statute of limitations | (7 | ) | (5 | ) | (7 | ) | ||||||
Balance of gross unrecognized tax benefits at December 31 | $ | 26 | $ | 77 | $ | 110 | ||||||
It is reasonably possible that the balance of unrecognized tax benefits could increase or decrease in the next twelve months due to completion of tax authorities' exams or the expiration of statutes of limitations. Management estimates that the balance of unrecognized tax benefits could decrease by $4 million within the next twelve months.
PNC is subject to U.S. federal income tax as well as income tax in most states and some foreign jurisdictions. Examinations were completed for PNC's consolidated federal income tax returns for 2007 through 2010 and National City's consolidated federal income tax returns through 2008 and were settled with the IRS. The IRS is currently examining PNC's consolidated federal income tax returns for 2011 through 2013. In addition, we are under continuous examinations by various state taxing authorities. With few exceptions, we are no longer subject to state and local and foreign income tax examinations by taxing authorities for periods before 2010. For all open audits, any potential adjustments have been considered in establishing our unrecognized tax benefits as of December 31, 2015.
Our policy is to classify interest and penalties associated with income taxes as income tax expense. For 2015, we had a
| 194 The PNC Financial Services Group, Inc. – Form 10-K |
benefit of $46 million of gross interest and penalties, decreasing income tax expense. The total accrued interest and penalties at December 31, 2014 was $41 million. At December 31, 2015, the total accrued interest and penalties was not significant.
During 2015, we recognized $202 million of amortization, $224 million of tax credits and $74 million of other tax benefits associated with qualified investments in low income housing tax credits within Income taxes.
N OTE 19 R EGULATORY M ATTERS
We are subject to the regulations of certain federal, state, and foreign agencies and undergo periodic examinations by such regulatory authorities.
The ability to undertake new business initiatives (including acquisitions), the access to and cost of funding for new business initiatives, the ability to pay dividends, the ability to repurchase shares or other capital instruments, the level of deposit insurance costs, and the level and nature of regulatory oversight depend, in large part, on a financial institution's capital strength.
At December 31, 2015 and December 31, 2014, PNC and PNC Bank, our domestic banking subsidiary, were both considered "well capitalized," based on applicable U.S. regulatory capital ratio requirements. Beginning in 2015, to qualify as "well capitalized", PNC must have Transitional Basel III capital ratios of at least 6% for Tier 1 risk-based capital and 10% for Total risk-based capital, and PNC Bank must have Transitional Basel III capital ratios of at least 6.5% for Common equity Tier 1 risk-based capital, 8% for Tier 1 risk-based capital, 10% for Total risk-based capital, and a Leverage ratio of at least 5%. To qualify as "well capitalized" in 2014, regulators required insured depository institutions, such as PNC Bank, to maintain Transitional Basel III capital ratios of at least 6% for Tier 1 risk-based, 10% for Total risk-based and 5% for Leverage, and required bank holding companies, such as PNC, to maintain Transitional Basel III regulatory capital ratios of at least 6% Tier 1 risk-based and 10% for Total risk-based.
The following table sets forth the Transitional Basel III regulatory capital ratios at December 31, 2015 and December 31, 2014 for PNC and PNC Bank.
Table 130: Basel Regulatory Capital (a)
| Amount | Ratios | |||||||||||||||
December 31 Dollars in millions | 2015 | 2014 | 2015 | 2014 | ||||||||||||
Risk-based capital | ||||||||||||||||
Common equity Tier 1 (b) | ||||||||||||||||
PNC | $ | 31,493 | N/A | 10.6 | % | N/A | ||||||||||
PNC Bank | 27,484 | N/A | 9.7 | N/A | ||||||||||||
Tier 1 | ||||||||||||||||
PNC | 35,522 | $ | 35,687 | 12.0 | 12.6 | % | ||||||||||
PNC Bank | 29,425 | 29,328 | 10.4 | 10.7 | ||||||||||||
Total | ||||||||||||||||
PNC | 43,260 | 44,782 | 14.6 | 15.8 | ||||||||||||
PNC Bank | 36,482 | 37,559 | 12.9 | 13.7 | ||||||||||||
Leverage | ||||||||||||||||
PNC | 35,522 | 35,687 | 10.1 | 10.8 | ||||||||||||
PNC Bank | 29,425 | 29,328 | 8.7 | 9.2 | ||||||||||||
| (a) | Calculated using the Transitional Basel III regulatory capital methodology applicable to PNC during both 2015 and 2014. |
| (b) | For 2014, Common equity Tier 1 was not applicable to U.S. regulatory capital ratio requirements for "well capitalized." |
The principal source of parent company cash flow is the dividends it receives from its subsidiary bank, which may be impacted by the following:
| • | Capital needs, |
| • | Laws and regulations, |
| • | Corporate policies, |
| • | Contractual restrictions, and |
| • | Other factors. |
Also, there are statutory and regulatory limitations on the ability of national banks to pay dividends or make other capital distributions. The amount available for dividend payments to the parent company by PNC Bank without prior regulatory approval was approximately $1.7 billion at December 31, 2015.
Under federal law, a bank subsidiary generally may not extend credit to, or engage in other types of covered transactions (including the purchase of assets) with, the parent company or its non-bank subsidiaries on terms and under circumstances that are not substantially the same as comparable transactions with nonaffiliates. A bank subsidiary may not extend credit to, or engage in a covered transaction with, the parent company or a non-bank subsidiary if the aggregate amount of the bank's extensions of credit and other covered transactions with the parent company or non-bank subsidiary exceeds 10% of the capital stock and surplus of such bank subsidiary or the aggregate amount of the bank's extensions of credit and other covered transactions with the parent company and all non-bank subsidiaries exceeds 20% of the capital and surplus of such bank subsidiary. Such extensions of credit, with limited exceptions, must be at least fully collateralized in accordance with specified collateralization thresholds, with the thresholds
| The PNC Financial Services Group, Inc. – Form 10-K 195 |
varying based on the type of assets serving as collateral. In certain circumstances, federal regulatory authorities may impose more restrictive limitations.
Federal Reserve Board regulations require depository institutions to maintain cash reserves with a Federal Reserve Bank (FRB). At December 31, 2015, the balance outstanding at the FRB was $30.0 billion.
N OTE 20 L EGAL P ROCEEDINGS
We establish accruals for legal proceedings, including litigation and regulatory and governmental investigations and inquiries, when information related to the loss contingencies represented by those matters indicates both that a loss is probable and that the amount of loss can be reasonably estimated. Any such accruals are adjusted thereafter as appropriate to reflect changed circumstances. When we are able to do so, we also determine estimates of possible losses or ranges of possible losses, whether in excess of any related accrued liability or where there is no accrued liability, for disclosed legal proceedings ("Disclosed Matters," which are those matters disclosed in this Note 20). For Disclosed Matters where we are able to estimate such possible losses or ranges of possible losses, as of December 31, 2015, we estimate that it is reasonably possible that we could incur losses in excess of related accrued liabilities, if any, in an aggregate amount of up to approximately $550 million. The estimates included in this amount are based on our analysis of currently available information and are subject to significant judgment and a variety of assumptions and uncertainties. As new information is obtained we may change our estimates. Due to the inherent subjectivity of the assessments and unpredictability of outcomes of legal proceedings, any amounts accrued or included in this aggregate amount may not represent the ultimate loss to us from the legal proceedings in question. Thus, our exposure and ultimate losses may be higher, and possibly significantly so, than the amounts accrued or this aggregate amount.
In our experience, legal proceedings are inherently unpredictable. One or more of the following factors frequently contribute to this inherent unpredictability: the proceeding is in its early stages; the damages sought are unspecified, unsupported or uncertain; it is unclear whether a case brought as a class action will be allowed to proceed on that basis or, if permitted to proceed as a class action, how the class will be defined; the other party is seeking relief other than or in addition to compensatory damages (including, in the case of regulatory and governmental investigations and inquiries, the possibility of fines and penalties); the matter presents meaningful legal uncertainties, including novel issues of law; we have not engaged in meaningful settlement discussions; discovery has not started or is not complete; there are significant facts in dispute; the possible outcomes may not be amenable to the use of statistical or quantitative analytical tools; predicting possible outcomes depends on making
assumptions about future decisions of courts or regulatory bodies or the behavior of other parties; and there are a large number of parties named as defendants (including where it is uncertain how damages or liability, if any, will be shared among multiple defendants). Generally, the less progress that has been made in the proceedings or the broader the range of potential results, the harder it is for us to estimate losses or ranges of losses that it is reasonably possible we could incur.
As a result of these types of factors, we are unable, at this time, to estimate the losses that are reasonably possible to be incurred or ranges of such losses with respect to some of the matters disclosed, and the aggregate estimated amount provided above does not include an estimate for every Disclosed Matter. Therefore, as the estimated aggregate amount disclosed above does not include all of the Disclosed Matters, the amount disclosed above does not represent our maximum reasonably possible loss exposure for all of the Disclosed Matters. The estimated aggregate amount also does not reflect any of our exposure to matters not so disclosed, as discussed below under "Other."
We include in some of the descriptions of individual Disclosed Matters certain quantitative information related to the plaintiff's claim against us as alleged in the plaintiff's pleadings or other public filings or otherwise publicly available information. While information of this type may provide insight into the potential magnitude of a matter, it does not necessarily represent our estimate of reasonably possible loss or our judgment as to any currently appropriate accrual.
Some of our exposure in Disclosed Matters may be offset by applicable insurance coverage. We do not consider the possible availability of insurance coverage in determining the amounts of any accruals (although we record the amount of related insurance recoveries that are deemed probable up to the amount of the accrual) or in determining any estimates of possible losses or ranges of possible losses.
Interchange Litigation
Beginning in June 2005, a series of antitrust lawsuits were filed against Visa ® , MasterCard ® , and several major financial institutions, including cases naming National City (since merged into PNC) and its subsidiary, National City Bank of Kentucky (since merged into National City Bank which in turn was merged into PNC Bank, N.A.). The cases have been consolidated for pretrial proceedings in the U.S. District Court for the Eastern District of New York under the caption In re Payment Card Interchange Fee and Merchant-Discount Antitrust Litigation (Master File No. 1:05-md-1720-JG-JO). Those cases naming National City were brought as class actions on behalf of all persons or business entities who have accepted Visa ® or MasterCard ® . The plaintiffs, merchants operating commercial businesses throughout the U.S. and trade associations, allege, among other things, that the
| 196 The PNC Financial Services Group, Inc. – Form 10-K |
defendants conspired to fix the prices for general purpose card network services and otherwise imposed unreasonable restraints on trade, resulting in the payment of inflated interchange fees, in violation of the antitrust laws. In January 2009, the plaintiffs filed amended and supplemental complaints adding, among other things, allegations that the restructuring of Visa and MasterCard, each of which included an initial public offering, violated the antitrust laws. In their complaints, the plaintiffs seek, among other things, injunctive relief, unspecified damages (trebled under the antitrust laws) and attorneys' fees.
In July 2012, the parties entered into a memorandum of understanding with the class plaintiffs and an agreement in principle with certain individual plaintiffs with respect to a settlement of these cases, under which the defendants will collectively pay approximately $6.6 billion to the class and individual settling plaintiffs and have agreed to changes in the terms applicable to their respective card networks (including an eight-month reduction in default credit interchange rates). The parties entered into a definitive agreement with respect to this settlement in October 2012. The court granted final approval of the settlement in December 2013. Several objectors have appealed the order of approval to the U.S. Court of Appeals for the Second Circuit, which appeal was argued in September 2015 and remains pending. In addition, in July 2015 several objectors filed a motion with the district court to vacate the court's judgment, including the approval of the settlement, based on alleged misconduct by one of the counsel for MasterCard and one of the counsel for plaintiffs. This motion remains pending. As a result of the previously funded litigation escrow (described in Note 21 Commitments and Guarantees), which will cover substantially all of our share of the Visa portion of this settlement, we anticipate no material financial impact from the monetary amount of this settlement. Numerous merchants, including some large national merchants, have objected to or requested exclusion (opted out) from the proposed class settlements, and some of those opting out have lawsuits pending in federal and state courts against Visa, MasterCard and, in some instances, one or more of the other issuing banks. Visa has reached settlements, some of which remain subject to conditions, with some of these opting out merchants. Visa has reported that these settlements covered, as of November 2015, approximately 48% of the Visa-branded card sales volume of the merchants that opted out. These settlements have been or will be paid from the Visa litigation escrow account.
National City and National City Bank entered into judgment and loss sharing agreements with Visa and certain other banks with respect to all of the above referenced litigation. All of the litigation against Visa is also subject to the indemnification obligations described in Note 21 Commitments and Guarantees. PNC Bank, N.A. is not named a defendant in any of the Visa or MasterCard related antitrust litigation nor was it initially a party to the judgment or loss sharing agreements, but it has been subject to these indemnification obligations
and became responsible for National City Bank's position in the litigation and responsibilities under the agreements upon completion of the merger of National City Bank into PNC Bank, N.A. In March 2011, we entered into a MasterCard Settlement and Judgment Sharing Agreement with MasterCard and other financial institution defendants and an Omnibus Agreement Regarding Interchange Litigation Sharing and Settlement Sharing with Visa, MasterCard and other financial institution defendants. The Omnibus Agreement, in substance, apportions resolution of the claims in this litigation into a Visa portion and a MasterCard portion, with the Visa portion being two-thirds and the MasterCard portion being one-third. This apportionment only applies in the case of either a global settlement involving all defendants or an adverse judgment against the defendants, to the extent that damages either are related to the merchants' inter-network conspiracy claims or are otherwise not attributed to specific MasterCard or Visa conduct or damages. The MasterCard portion (or any MasterCard-related liability not subject to the Omnibus Agreement) will then be apportioned under the MasterCard Settlement and Judgment Sharing Agreement among MasterCard and PNC and the other financial institution defendants that are parties to this agreement. The responsibility for the Visa portion (or any Visa-related liability not subject to the Omnibus Agreement) will be apportioned under the pre-existing indemnification responsibilities and judgment and loss sharing agreements.
CBNV Mortgage Litigation
Between 2001 and 2003, on behalf of either individual plaintiffs or proposed classes of plaintiffs, several separate lawsuits were filed in state and federal courts against Community Bank of Northern Virginia (CBNV), a PNC Bank predecessor, and other defendants asserting claims arising from second mortgage loans made to the plaintiffs. The state lawsuits were removed to federal court and, with the lawsuits that had been filed in federal court, were consolidated for pre-trial proceedings in a multidistrict litigation (MDL) proceeding in the U.S. District Court for the Western District of Pennsylvania under the caption In re: Community Bank of Northern Virginia Lending Practices Litigation (No. 03-0425 (W.D. Pa.), MDL No. 1674). In January 2008, the Pennsylvania district court issued an order sending back to the General Court of Justice, Superior Court Division, for Wake County, North Carolina the claims of two proposed class members, which have subsequently been dismissed.
In October 2011, the plaintiffs in the MDL proceeding filed a joint consolidated amended class action complaint covering all of the class action lawsuits pending in this proceeding. The amended complaint names CBNV, another bank, and purchasers of loans originated by CBNV and the other bank (including Residential Funding Company, LLC (RFC)) as defendants. (In December 2013, the Chapter 11 bankruptcy proceeding involving RFC was completed with the company being liquidated and claims against the company being
| The PNC Financial Services Group, Inc. – Form 10-K 197 |
resolved, including, through a settlement between the plaintiffs and RFC approved in November 2013, the claims in these lawsuits.) The principal allegations in the amended complaint are that a group of persons and entities collectively characterized as the "Shumway/Bapst Organization" referred prospective second residential mortgage loan borrowers to CBNV and the other bank, that CBNV and the other bank charged these borrowers improper title and loan fees at loan closings, that the disclosures provided to the borrowers at loan closings were inaccurate, and that CBNV and the other bank paid some of the loan fees to the Shumway/Bapst Organization as purported "kickbacks" for the referrals. The amended complaint asserts claims for violations of the Real Estate Settlement Procedures Act (RESPA), the Truth in Lending Act (TILA), as amended by the Home Ownership and Equity Protection Act (HOEPA), and the Racketeer Influenced and Corrupt Organizations Act (RICO).
The amended complaint seeks to certify a class of all borrowers who obtained a second residential non-purchase money mortgage loan, secured by their principal dwelling, from either CBNV or the other defendant bank, the terms of which made the loan subject to HOEPA. The plaintiffs seek, among other things, unspecified damages (including treble damages under RICO and RESPA), rescission of loans, declaratory and injunctive relief, interest, and attorneys' fees. In November 2011, the defendants filed a motion to dismiss the amended complaint. In June 2013, the court granted in part and denied in part the motion, dismissing the claims of any plaintiff whose loan did not originate or was not assigned to CBNV, narrowing the scope of the RESPA claim, and dismissing several of the named plaintiffs for lack of standing. The court also dismissed the claims against the other lender defendant on jurisdictional grounds. The limitation of the potential class to CBNV borrowers reduces its size to approximately 26,500 from the 50,000 members alleged in the amended complaint. Also in June 2013, the plaintiffs filed a motion for class certification, which was granted in July 2013. In July 2015, the U.S. Court of Appeals for the Third Circuit affirmed the grant of class certification by the Pennsylvania district court. We moved for a rehearing of the appeal, which was denied in October 2015. In November 2015, we filed a petition for a writ of certiorari with the U.S. Supreme Court seeking review of the decision of the court of appeals, which remains pending.
Overdraft Litigation
Beginning in October 2009, PNC Bank, National City Bank and RBC Bank (USA) have been named in lawsuits brought as class actions relating to the manner in which they charged overdraft fees on ATM and debit transactions to customers and related matters. All but two of these lawsuits, both pending against RBC Bank (USA), have been settled. The following is a description of the remaining pending lawsuits.
The pending lawsuits naming RBC Bank (USA), along with similar lawsuits pending against other banks, have been consolidated for pre-trial proceedings in the U.S. District Court for the Southern District of Florida (the MDL Court) under the caption In re Checking Account Overdraft Litigation (MDL No. 2036, Case No. 1:09-MD-02036-JLK ). A consolidated amended complaint was filed in December 2010 that consolidated all of the claims in these MDL Court cases. The first case against RBC Bank (USA) pending in the MDL Court ( Dasher v. RBC Bank (10-cv-22190-JLK)) was filed in July 2010 in the U.S. District Court for the Southern District of Florida. The other case against RBC Bank (USA) ( Avery v. RBC Bank (Case No. 10-cv-329)) was originally filed in North Carolina state court in July 2010 and was removed to the U.S. District Court for the Eastern District of North Carolina before being transferred to the MDL Court. A consolidated amended complaint was filed in November 2014.
These cases seek to certify multi-state classes of customers for the common law claims described below (covering all states in which RBC Bank (USA) had retail branch operations during the class periods), and subclasses of RBC Bank (USA) customers with accounts in North Carolina branches, with each subclass being asserted for purposes of claims under those states' consumer protection statutes. No class periods are stated in any of the complaints, other than for the applicable statutes of limitations, which vary by state and claim.
The customer agreements with the plaintiffs in these two cases contain arbitration provisions. RBC Bank (USA)'s original motion in Dasher to compel arbitration under these provisions was denied by the MDL Court. This denial was appealed to the U.S. Court of Appeals for the Eleventh Circuit. While this appeal was pending, the U.S. Supreme Court issued its decision in AT&T Mobility v. Concepcion , following which the court of appeals vacated the MDL Court's denial of the arbitration motion and remanded to the MDL Court for further consideration in light of the Concepcion decision. RBC Bank (USA)'s motion to compel arbitration, now covering both Dasher and Avery , was denied in January 2013. We appealed the denial of the motion to the U.S. Court of Appeals for the Eleventh Circuit, which, in February 2014, affirmed the order of the district court denying arbitration. We filed a motion asking the court of appeals to reconsider its decision, which it denied in March 2014. In December 2014, we filed a motion to compel arbitration as to the claims of the plaintiff in Dasher based on an arbitration provision added to the PNC account agreement in 2013. In August 2015, the district court denied our motion. Later in August 2015, we appealed the denial of our arbitration motion to the court of appeals. The appeal is pending. In December 2014, we filed a motion to dismiss the complaint. In February 2016, the district court denied our motion.
| 198 The PNC Financial Services Group, Inc. – Form 10-K |
The consolidated amended complaint alleges that the banks engaged in unlawful practices in assessing overdraft fees arising from electronic point-of-sale and ATM debits. The principal practice challenged in these lawsuits is the banks' purportedly common policy of posting debit transactions on a daily basis from highest amount to lowest amount, thereby allegedly inflating the number of overdraft fees assessed. Other practices challenged include the failure to decline to honor debit card transactions where the account has insufficient funds to cover the transactions.
The plaintiffs assert claims for breach of contract and the covenant of good faith and fair dealing; unconscionability; conversion; unjust enrichment; and violation of the consumer protection statute of North Carolina. The plaintiffs seek, among other things, restitution of overdraft fees paid, unspecified actual and punitive damages (with actual damages, in some cases, trebled under state law), pre-judgment interest, attorneys' fees, and declaratory relief finding the overdraft policies to be unfair and unconscionable.
Fulton Financial
In 2009, Fulton Financial Advisors, N.A. filed lawsuits against PNC Capital Markets, LLC and NatCity Investments, Inc. in the Court of Common Pleas of Lancaster County, Pennsylvania arising out of Fulton's purchase of auction rate certificates (ARCs) through PNC and NatCity. Each of the lawsuits alleges violations of the Pennsylvania Securities Act, negligent misrepresentation, negligence, breach of fiduciary duty, common law fraud, and aiding and abetting common law fraud in connection with the purchase of the ARCs by Fulton. Specifically, Fulton alleges that, as a result of the decline of financial markets in 2007 and 2008, the market for ARCs became illiquid; that PNC and NatCity knew or should have known of the increasing threat of the ARC market becoming illiquid; and that PNC and NatCity did not inform Fulton of this increasing threat, but allowed Fulton to continue to purchase ARCs, to Fulton's detriment. In its complaints, Fulton alleges that it then held ARCs purchased through PNC for a price of more than $123 million and purchased through NatCity for a price of more than $175 million. In each complaint, Fulton seeks, among other things, unspecified actual and punitive damages, rescission, attorneys' fees and interest.
In the case against PNC ( Fulton Financial Advisors, N.A. v. PNC Capital Markets, LLC (CI 09-10838)), PNC filed preliminary objections to Fulton's complaint, which were denied. NatCity removed the case against it to the U.S. District Court for the Eastern District of Pennsylvania ( Fulton Financial Advisors, N.A. v. NatCity Investments, Inc . (No. 5:09-cv-04855)), and in November 2009 filed a motion to dismiss the complaint. In October 2013, the court granted the motion to dismiss with respect to claims under the Pennsylvania Securities Act and for negligent misrepresentation, common law fraud, and aiding and abetting
common law fraud and denied the motion with respect to claims for negligence and breach of fiduciary duty. Fulton filed an amended complaint in December 2013, reasserting its negligence and breach of fiduciary duty claims and adding a new claim under the Pennsylvania Securities Act. Fulton and NatCity filed motions for summary judgment in February 2015, which are pending.
Captive Mortgage Reinsurance Litigation
In December 2011, a lawsuit ( White, et al. v. The PNC Financial Services Group, Inc., et al. (Civil Action No. 11-7928)) was filed against PNC (as successor in interest to National City Corporation and several of its subsidiaries) and several mortgage insurance companies in the U.S. District Court for the Eastern District of Pennsylvania. This lawsuit, which was brought as a class action, alleges that National City structured its program of reinsurance of private mortgage insurance in such a way as to avoid a true transfer of risk from the mortgage insurers to National City's captive reinsurer. The plaintiffs allege that the payments from the mortgage insurers to the captive reinsurer constitute kickbacks, referral payments, or unearned fee splits prohibited under the Real Estate Settlement Procedures Act (RESPA), as well as common law unjust enrichment. The plaintiffs claim, among other things, that from the beginning of 2004 until the end of 2010 National City's captive reinsurer collected from the mortgage insurance company defendants at least $219 million as its share of borrowers' private mortgage insurance premiums and that its share of paid claims during this period was approximately $12 million. The plaintiffs seek to certify a nationwide class of all persons who obtained residential mortgage loans originated, funded or originated through correspondent lending by National City or any of its subsidiaries or affiliates between January 1, 2004 and the present and, in connection with these mortgage loans, purchased private mortgage insurance and whose residential mortgage loans were included within National City's captive mortgage reinsurance arrangements. Plaintiffs seek, among other things, statutory damages under RESPA (which include treble damages), restitution of reinsurance premiums collected, disgorgement of profits, and attorneys' fees. In August 2012, the district court directed the plaintiffs to file an amended complaint, which the plaintiffs filed in September 2012. In November 2012, we filed a motion to dismiss the amended complaint. The court dismissed, without prejudice, the amended complaint in June 2013 on statute of limitations grounds. A second amended complaint, in response to the court's dismissal order, was filed in July 2013. We filed a motion to dismiss the second amended complaint, also in July 2013. In August 2014, the court denied the motion to dismiss. We then filed an uncontested motion to stay all proceedings pending the outcome of another matter then on appeal before the U.S. Court of Appeals for the Third Circuit that involves overlapping issues. In September 2014, the district court granted the stay. In October 2014, the court of appeals decided that other matter, holding that the RESPA claims in that case
| The PNC Financial Services Group, Inc. – Form 10-K 199 |
were barred by the statute of limitations. We then filed a motion for reconsideration of the denial of our motion to dismiss in light of the court of appeals' decision. In January 2015, the district court denied our motion. In March 2015, the parties stipulated to, and the court ordered, a stay of all proceedings pending the outcome of a new other matter currently on appeal before the U.S. Court of Appeals for the Third Circuit that also involves overlapping issues. In February 2016, the court of appeals issued a decision favorable to our position.
Residential Mortgage-Backed Securities Indemnification Demands
We have received indemnification demands from several entities sponsoring residential mortgage-backed securities and their affiliates where purchasers of the securities have brought litigation against the sponsors and other parties involved in the securitization transactions. National City Mortgage had sold whole loans to the sponsors or their affiliates that were allegedly included in certain of these securitization transactions. According to the indemnification demands, the plaintiffs' claims in these lawsuits are based on alleged misstatements and omissions in the offering documents for these transactions. The indemnification demands assert that agreements governing the sale of these loans or the securitization transactions to which National City Mortgage was a party require us to indemnify the sponsors and their affiliates for losses suffered in connection with these lawsuits. The parties have settled several of these cases. There has not been any determination that the parties seeking indemnification have any liability to the plaintiffs in the other lawsuits and the amount, if any, for which we are responsible in the settled cases has not been determined.
Lender Placed Insurance Litigation
In June 2013, a lawsuit ( Lauren v. PNC Bank, N.A ., et al . (Case No. 2:14-cv-00230)) was filed in the U.S. District Court for the Western District of Pennsylvania, subsequently transferred to the U.S. District Court for the Southern District of Ohio, against PNC Bank and American Security Insurance Company (ASIC), a provider of property and casualty insurance to PNC for certain residential mortgages.
In February and March 2014, two additional class action lawsuits were filed. One of them ( Montoya, et al. v. PNC Bank, N.A., et al. (Case No. 1:14-cv-20474-JEM)) was filed in the U.S. District Court for the Southern District of Florida against PNC Bank, ASIC and its parent, Assurant, Inc. The other case ( Tighe v. PNC Bank, N.A., et al ., (Case No. 14-CV-2017)) was filed in the U.S. District Court for the Southern District of New York against these same parties as well as Alpine Indemnity Limited, a reinsurance subsidiary of PNC. The complaints in each of these lawsuits made similar allegations regarding the administration of PNC Bank's program for placement of insurance for borrowers who fail to obtain hazard insurance coverages required by the terms of
their mortgages. In May 2014, the Tighe lawsuit was transferred to the U.S. District Court for the Southern District of Ohio. In June 2014, the Tighe plaintiff filed a notice of voluntary dismissal without prejudice, thereby terminating that action. In September 2014, the Lauren lawsuit was voluntarily dismissed and, as described below, Lauren was added to the Montoya lawsuit as a plaintiff.
In their complaint, the plaintiffs in Montoya assert breach of contract by PNC, breach of its duty of good faith and fair dealing, unjust enrichment, breach of a fiduciary duty, and violations of Florida and New Jersey statutes pertaining to deceptive and unfair trade practices. These plaintiffs also assert claims under the federal TILA and RICO statutes. The plaintiffs seek a nationwide class on all claims except the state law statutory claims, for which they seek to certify subclasses of Florida and New Jersey residents, respectively. The plaintiffs seek, among other things, damages (including treble damages), disgorgement of "unjust benefits," injunctive relief, interest and attorneys' fees. PNC filed a motion to dismiss the complaint in Montoya in May 2014. In August 2014, the court in Montoya granted in part and denied in part PNC's motion to dismiss. Specifically, the court dismissed the breach of contract, Florida deceptive and unfair trade practices, and federal TILA and RICO claims, although it allowed the RICO claims to be re-pled. The remaining claims are state claims for breach of the covenant of good faith, unjust enrichment, the New Jersey Consumer Fraud Act, and breach of fiduciary duty. Thereafter, in September 2014, a third amended complaint in Montoya was filed adding Lauren as a plaintiff there. In October 2014, PNC moved to partially dismiss the third amended complaint. The motion to dismiss sought dismissal of the re-pleaded RICO claims and plaintiff Lauren's state law claims for breach of the covenant of good faith and fair dealing and breach of fiduciary duty. At the same time, PNC also moved to strike nationwide class allegations with respect to the state law claims. Shortly thereafter, the plaintiffs stipulated to this relief, as a result of which the plaintiffs' state law claims are now being brought solely as statewide class action claims in the three states in which the plaintiffs reside. In January 2015, the plaintiffs filed a motion for class certification. In March 2015, the Montoya court denied PNC's motion to dismiss, except that it granted the motion as to the Ohio good faith and fair dealing claim.
In May 2015, the parties reached an agreement to settle Montoya on a nationwide settlement class basis. The agreement is subject to, among other things, notice to the class members and final approval by the court. In connection with the settlement agreement, the plaintiffs also filed a fourth amended complaint, which, among other things, adds claims regarding wind and flood insurance. The proposed settlement provides for certification of a class of borrowers who were charged by PNC under a hazard, flood, flood gap or wind only lender placed insurance policy for residential property during the period January 1, 2008 through the date of preliminary approval of the settlement. The overall cost of the settlement
| 200 The PNC Financial Services Group, Inc. – Form 10-K |
is not expected to be material to PNC. The court granted preliminary approval of the settlement in September 2015 and has scheduled a hearing with respect to final approval of the settlement for March 2016.
Patent Infringement Litigation
In June 2013, a lawsuit ( Intellectual Ventures I LLC and Intellectual Ventures II LLC vs. PNC Financial Services Group, Inc., and PNC Bank, NA , (Case No. 2:13-cv-00740-AJS)( IV 1 )) was filed in the U.S. District Court for the Western District of Pennsylvania against PNC and PNC Bank for patent infringement. The plaintiffs allege that multiple systems by which PNC and PNC Bank provide online banking services and other services via electronic means infringe five patents owned by the plaintiffs. The plaintiffs seek, among other things, a declaration that PNC and PNC Bank are infringing each of the patents, damages for past and future infringement, and attorneys' fees. In July 2013, we filed an answer with counterclaims, denying liability and seeking declarations that the asserted patents are invalid and that PNC has not infringed them. In November 2013, PNC filed Covered Business Method/Post Grant Review petitions in the U.S. Patent & Trademark Office (PTO) seeking to invalidate all five of the patents. In December 2013, the court dismissed the plaintiffs' claims as to two of the patents and entered a stay of the lawsuit pending the PTO's consideration of PNC's review petitions, including any appeals from decisions of the PTO. The PTO instituted review proceedings in May 2014 on four of the five patents at issue, finding that the subject matter of those patents was "more likely than not" unpatentable. The court had previously dismissed the plaintiffs' claims with respect to the one patent not selected for review by the PTO. In separate decisions issued in April and May 2015, the PTO invalidated all claims with respect to the patents that were still at issue in IV 1 . In July 2015, in an appeal arising out of proceedings against a different defendant relating to some of the same patents, the U.S. Court of Appeals for the Federal Circuit affirmed the invalidity of the two patents at issue in both IV 1 and the Federal Circuit appeal. As a result, all of the patents at issue in IV 1 not subject to the prior dismissal have been invalidated. In October 2015, the plaintiffs moved to dismiss with prejudice their claims arising from the patents that had not been subject to prior dismissal in IV 1 , which the court granted.
In June 2014, Intellectual Ventures filed a second lawsuit ( Intellectual Ventures I LLC and Intellectual Ventures II LLC v. PNC Bank Financial Services Group, Inc., PNC Bank NA, and PNC Merchant Services Company, LP (Case No. 2:14-cv-00832-AKS)( IV 2 )) in the same court as IV 1 . This lawsuit alleges that PNC defendants infringed five patents, including the patent dismissed in IV 1 that is not subject to PTO review, and relates generally to the same technology and subject matter as the first lawsuit. The court has stayed this case, which was consolidated with IV 1 in August 2014, pending the PTO's consideration of various review petitions of the patents
at issue in this case, as well as the review of the patents at issue in IV 1 and the appeals from any PTO decisions. In April 2015, the PTO, in a proceeding brought by another defendant, upheld the patentability of one of the patents at issue in IV 2 . That decision was appealed to the Federal Circuit, which, in February 2016, affirmed it. After decisions adverse to the patent holder in the PTO and several U.S. District Courts on three of the remaining patents, in October 2015, the plaintiffs voluntarily dismissed without prejudice their claims with respect to those three patents, leaving two patents at issue in this lawsuit. The plaintiffs moved to deconsolidate IV 1 and IV 2 and to lift the stay. The court denied this motion in October 2015, continuing the stay until certain court proceedings against other defendants related to the same patents are resolved.
Mortgage Repurchase Litigation
In December 2013, Residential Funding Company, LLC (RFC) filed a lawsuit in the U.S. District Court for the District of Minnesota against PNC Bank, N.A., as alleged successor in interest to National City Mortgage Co., NCMC Newco, Inc., and North Central Financial Corporation ( Residential Funding Company, LLC v. PNC Bank, N.A., et al. (Civil No. 13-3498- JRT-JSM)). In its complaint, RFC alleges that PNC Bank (through predecessors) sold $6.5 billion worth of residential mortgage loans to RFC during the timeframe at issue (approximately May 2006 through September 2008), a portion of which were allegedly materially defective, resulting in damages and losses to RFC. RFC alleges that PNC Bank breached representations and warranties made under seller contracts in connection with these sales. The complaint asserts claims for breach of contract and indemnification. RFC seeks, among other things, monetary damages, costs, and attorney's fees. In March 2014, we filed a motion to dismiss the complaint. RFC then filed an amended complaint, as well as a motion to transfer the lawsuit to the U.S. Bankruptcy Court for the Southern District of New York. In April 2014, we moved to dismiss the amended complaint. In June 2014, RFC withdrew its motion to transfer the lawsuit. In October 2014, the court granted our motion to dismiss with prejudice the breach of contract claims in the complaint with respect to loans sold before May 14, 2006 and otherwise denied our motion to dismiss. In January 2015, the lawsuit was consolidated for pre-trial purposes with other lawsuits pending in the District of Minnesota filed by RFC against other originators of mortgage loans that it had purchased. The consolidated action is captioned In Re: RFC and RESCAP Liquidating Trust Litigation , (Civil File No. 13-cv-3451 (SRN/JJK/HB)). In September 2015, RFC filed a motion for leave to file a second amended complaint to add claims based on an asserted principle that loan sellers had a continuing contractual obligation to provide notice of loan defects, which RFC claims should allow it to assert contract claims as to pre-May 14, 2006 loans notwithstanding the prior dismissal of those claims with prejudice. In November 2015, the court granted RFC's motion, and RFC filed its second amended complaint thereafter.
| The PNC Financial Services Group, Inc. – Form 10-K 201 |
Pre-need Funeral Arrangements
National City Bank and PNC Bank are defendants in a lawsuit pending in the U.S. District Court for the Eastern District of Missouri under the caption Jo Ann Howard, P.C., et al. v. Cassity, et al. (No. 4:09-CV-1252-ERW) arising out of trustee services provided by Allegiant Bank, a National City Bank and PNC Bank predecessor, with respect to Missouri trusts that held pre-need funeral contract assets. Under a pre-need funeral contract, a customer pays an amount up front in exchange for payment of funeral expenses following the customer's death. In a number of states, including Missouri, pre-need funeral contract sellers are required to deposit a portion of the proceeds of the sale of pre-need funeral contracts in a trust account.
The lawsuit was filed in August 2009 by the Special Deputy Receiver for three insolvent affiliated companies, National Prearranged Services, Inc. a seller of pre-need funeral contracts (NPS), Lincoln Memorial Life Insurance Company (Lincoln), and Memorial Service Life Insurance Company (Memorial). Seven individual state life and health insurance guaranty associations, who claim they are liable under state law for payment of certain benefits under life insurance policies sold by Lincoln and Memorial, and the National Organization of Life & Health Guaranty Associations have also joined the action as plaintiffs. In addition to National City Bank and PNC Bank (added following filing of the lawsuit as successor-in-interest to National City Bank) (the PNC defendants), other defendants included members of the Cassity family, who controlled NPS, Lincoln, and Memorial; officers and directors of NPS, Lincoln, and Memorial; auditors and attorneys for NPS, Lincoln, and Memorial; the trustees of each of the trusts that held pre-need funeral contract assets; and the investment advisor to the Pre-need Trusts. NPS retained several banks to act as trustees for the trusts holding NPS pre-need funeral contract assets (the NPS Trusts), with Allegiant Bank acting as one of these trustees with respect to seven Missouri NPS Trusts. All of the other defendants have settled with the plaintiffs, are otherwise no longer a party to the lawsuit, or are insolvent.
In their Third Amended Complaint, filed in 2012 following the granting by the court in part of motions to dismiss made by the PNC defendants and the other NPS Trust trustees, the plaintiffs allege that Allegiant Bank breached its fiduciary duties and acted negligently as the trustee for the Missouri NPS Trusts. In part as a result of these breaches, the plaintiffs allege, members of the Cassity family, acting in concert with other defendants, were able to improperly remove millions of dollars from the NPS Trusts, which in turn caused NPS, Lincoln, and Memorial to become insolvent. The complaint alleges $600 million in present and future losses to the plaintiffs due to the insolvency of NPS, Lincoln, and Memorial. The lawsuit seeks, among other things, unspecified actual and punitive damages, various equitable remedies including restitution, attorneys' fees, costs of suit and interest.
In July 2013, five of the six defendants in a parallel federal criminal action, including two members of the Cassity family, entered into plea agreements with the U.S. to resolve criminal charges arising out of their conduct at NPS, Lincoln and Memorial. In August 2013, after a jury trial, the sixth defendant, the investment advisor to the NPS Trusts, was convicted on all criminal counts against him. The criminal charges against the defendants alleged, among other thing, a scheme to defraud Allegiant Bank and the other trustees of the NPS Trusts.
In May 2014, the court granted the plaintiffs' motion to disallow the PNC defendants' affirmative defense relating to the plaintiffs' alleged failure to mitigate damages. In July 2014, the PNC defendants' motion for reconsideration was denied. In September 2014, the plaintiffs filed a motion seeking leave to amend their complaint to reassert aiding and abetting claims, previously dismissed by the court in 2012. The court denied this motion in December 2014. Also in December 2014, the court granted in part and denied in part the PNC defendants' motion for summary judgment.
In March 2015, following a jury trial, the court entered a judgment against the PNC defendants in the amount of $356 million in compensatory damages and $36 million in punitive damages. In April 2015, the plaintiffs filed motions with the court seeking $179 million in pre-judgment interest. Also, in April 2015, the PNC defendants filed motions with the court to reduce the compensatory damages by the amounts paid in settlement by other defendants, to strike the punitive damages award, for judgment as a matter of law, and for a new trial. In November 2015, the court granted the motion to reduce the compensatory damages by amounts paid in settlement by other defendants and denied the other motions by the PNC defendants, with the judgment being reduced as a result to a total of $289 million, and also denied the plaintiffs' motion for pre-judgment interest. In December 2015, the PNC defendants appealed the judgment to the U.S. Court of Appeals for the Eighth Circuit.
DD Growth Premium Master Fund
In June 2014, the liquidators of the DD Growth Premium Master Fund (DD Growth) issued a Plenary Summons in the High Court, Dublin, Ireland, in connection with the provision of administration services to DD Growth by a European subsidiary (GIS Europe) of PNC Global Investment Servicing (PNC GIS), a former subsidiary of PNC. The Plenary Summons was served on GIS Europe in June 2015.
In July 2010, PNC completed the sale of PNC GIS to The Bank of New York Mellon Corporation (BNY Mellon). Beginning in February 2014, BNY Mellon has provided notice to PNC of three indemnification claims pursuant to the stock purchase agreement related to DD Growth. PNC's responsibility for this litigation is subject to the terms and limitations included in the indemnification provisions of the stock purchase agreement.
| 202 The PNC Financial Services Group, Inc. – Form 10-K |
In its Statement of Claim, which the liquidator served in July 2015, the liquidator alleges, among other things, that GIS Europe breached its contractual duties to DD Growth as well as an alleged duty of care to DD Growth, and to investors in DD Growth, and makes claims of breach of the administration and accounting services agreement, breach of the middle office agreement, negligence, gross negligence, and breach of duty. The statement of claim further alleges claims for loss in the net asset value of the fund and loss of certain subscriptions paid into the fund in the amounts of $283 million and $134 million, respectively. The statement of claim seeks, among other things, damages, costs, and interest.
Other Regulatory and Governmental Inquiries
PNC is the subject of investigations, audits and other forms of regulatory and governmental inquiry covering a broad range of issues in our banking, securities and other financial services businesses, in some cases as part of reviews of specified activities at multiple industry participants. Over the last few years, we have experienced an increase in regulatory and governmental investigations, audits and other inquiries. Areas of current regulatory or governmental inquiry with respect to PNC include consumer protection, fair lending, mortgage origination and servicing, mortgage and non mortgage-related insurance and reinsurance, municipal finance activities, conduct by broker-dealers, automobile lending practices, and participation in government insurance or guarantee programs, some of which are described below. These inquiries, including those described below, may lead to administrative, civil or criminal proceedings, and possibly result in remedies including fines, penalties, restitution, or alterations in our business practices, and in additional expenses and collateral costs.
| • | One area of significant regulatory and governmental focus has been mortgage lending and servicing. Numerous federal and state governmental, legislative and regulatory authorities are investigating practices in this area. PNC has received inquiries from, or is the subject of investigations by, a broad range of governmental, legislative and regulatory authorities relating to our activities in this area and is cooperating with these investigations and inquiries. As a result of the number and range of authorities conducting the investigations and inquiries, as well as the nature of these types of investigations and inquiries, among other factors, PNC cannot at this time predict the ultimate overall cost to or effect on PNC from potential governmental, legislative or regulatory actions arising out of these investigations and inquiries. |
| • | In April 2011, as a result of a publicly-disclosed interagency horizontal review of residential mortgage servicing operations at fourteen federally regulated mortgage servicers, PNC entered into a consent order with the Board of Governors of the Federal Reserve System and PNC Bank entered into a consent order with the Office of the Comptroller of the Currency. |
Collectively, these consent orders describe certain foreclosure-related practices and controls that the regulators found to be deficient and require PNC and PNC Bank to, among other things, develop and implement plans and programs to enhance PNC's residential mortgage servicing and foreclosure processes, retain an independent consultant to review certain residential mortgage foreclosure actions, take certain remedial actions, and oversee compliance with the orders and the new plans and programs. |
In connection with these orders, PNC established a Compliance Committee of the Boards of PNC and PNC Bank to monitor and coordinate PNC's and PNC Bank's implementation of the commitments under the orders. PNC and PNC Bank are executing Action Plans designed to meet the requirements of the orders. Consistent with the orders, PNC also engaged an independent consultant to conduct a review of certain residential foreclosure actions, including those identified through borrower complaints, and identify whether any remedial actions for borrowers are necessary.
In early 2013, PNC and PNC Bank, along with twelve other residential mortgage servicers, reached agreements with the OCC and the Federal Reserve to amend these consent orders. Pursuant to the amended consent orders, in order to accelerate the remediation process, PNC agreed to make a payment of approximately $70 million for distribution to potentially affected borrowers in the review population and to provide approximately $111 million in additional loss mitigation or other foreclosure prevention relief, which could be satisfied pursuant to the amended consent orders by a variety of borrower relief actions or by additional cash payments or resource commitments to borrower counseling or education.
In June 2015, the OCC issued an order finding that PNC Bank had satisfied all of its obligations under the OCC's 2013 amended consent order and terminating PNC Bank's 2011 consent order and 2013 amended consent order. The OCC retained jurisdiction over the distribution of remaining funds contributed by PNC Bank under its 2013 amended consent order. PNC's consent order with the Federal Reserve, as amended, remains open and does not foreclose the potential for civil money penalties from the Federal Reserve. The range of potential penalties communicated to PNC from the Federal Reserve in connection with the consent orders is not material and we do not otherwise expect any additional financial charges from the Federal Reserve consent orders to be material.
| The PNC Financial Services Group, Inc. – Form 10-K 203 |
| • | In February 2012, the Department of Justice, other federal regulators and 49 state attorneys general announced agreements with the five largest mortgage servicers. Written agreements were filed with the U.S. District Court for the Southern District of New York in March 2012. Under these agreements, the mortgage servicers will make cash payments to federal and state governments, provide various forms of financial relief to borrowers, and implement new mortgage servicing standards. These governmental authorities are continuing their review of, and have engaged in discussions with, other mortgage servicers, including PNC, that were subject to the interagency horizontal review, which could result in the imposition of substantial payments and other forms of relief (similar to that agreed to by the five largest servicers) on some or all of these mortgage servicers, including PNC. Whether and to what extent any such relief may be imposed on PNC is not yet known. |
| • | PNC received subpoenas from the U.S. Attorney's Office for the Southern District of New York. The first two subpoenas, served in 2011, concern National City Bank's lending practices in connection with loans insured by the Federal Housing Administration (FHA) as well as certain non-FHA-insured loan origination, sale and securitization practices. A third, served in 2013, seeks information regarding claims for costs that are incurred by foreclosure counsel in connection with the foreclosure of loans insured or guaranteed by FHA, FNMA or FHLMC. PNC is cooperating with the investigations. |
| • | Through the U.S. Attorney's Office for the District of Maryland, the office of the Inspector General for the Small Business Administration (SBA) served a subpoena on PNC in 2012 requesting documents concerning PNC's relationship with, including SBA-guaranteed loans made through, a broker named Jade Capital Investments, LLC (Jade), as well as information regarding other PNC-originated SBA guaranteed loans made to businesses located in the State of Maryland, the Commonwealth of Virginia, and Washington, DC. Certain of the Jade loans have been identified in an indictment and subsequent superseding indictment charging persons associated with Jade with conspiracy to commit bank fraud, substantive violations of the federal bank fraud statute, and money laundering. PNC and the U.S. Attorney's Office are in discussions regarding a possible resolution of the investigation. |
Our practice is to cooperate fully with regulatory and governmental investigations, audits and other inquiries, including those described in this Note 20.
Other
In addition to the proceedings or other matters described above, PNC and persons to whom we may have indemnification obligations, in the normal course of business, are subject to various other pending and threatened legal proceedings in which claims for monetary damages and other relief are asserted. We do not anticipate, at the present time, that the ultimate aggregate liability, if any, arising out of such other legal proceedings will have a material adverse effect on our financial position. However, we cannot now determine whether or not any claims asserted against us or others to whom we may have indemnification obligations, whether in the proceedings or other matters described above or otherwise, will have a material adverse effect on our results of operations in any future reporting period, which will depend on, among other things, the amount of the loss resulting from the claim and the amount of income otherwise reported for the reporting period.
See Note 21 Commitments and Guarantees for additional information regarding the Visa indemnification and our other obligations to provide indemnification, including to current and former officers, directors, employees and agents of PNC and companies we have acquired.
| 204 The PNC Financial Services Group, Inc. – Form 10-K |
N OTE 21 C OMMITMENTS AND G UARANTEES
Commitments
In the normal course of business, we have various commitments outstanding, certain of which are not included on our Consolidated Balance Sheet. The following table presents our outstanding commitments to extend credit along with significant other commitments as of December 31, 2015 and December 31, 2014, respectively.
Table 131: Commitments to Extend Credit and Other Commitments
| In millions | December 31 2015 | December 31 2014 | ||||||
Commitments to extend credit | ||||||||
Total commercial lending | $ | 101,252 | $ | 98,742 | ||||
Home equity lines of credit | 17,268 | 17,839 | ||||||
Credit card | 19,937 | 17,833 | ||||||
Other | 4,032 | 4,178 | ||||||
Total commitments to extend credit | 142,489 | 138,592 | ||||||
Net outstanding standby letters of credit (a) | 8,765 | 9,991 | ||||||
Reinsurance agreements (b) | 2,010 | 4,297 | ||||||
Standby bond purchase agreements (c) | 911 | 1,095 | ||||||
Other commitments (d) | 966 | 962 | ||||||
Total commitments to extend credit and other commitments | $ | 155,141 | $ | 154,937 | ||||
| (a) | Net outstanding standby letters of credit include $4.7 billion and $5.2 billion which support remarketing programs at December 31, 2015 and December 31, 2014, respectively. |
| (b) | Represents aggregate maximum exposure up to the specified limits of the reinsurance contracts, and reflects estimates based on availability of financial information from insurance carriers. As of December 31, 2015 the aggregate maximum exposure amount comprised $1.6 billion for accidental death & dismemberment contracts and $.4 billion for credit life, accident & health contracts. The comparative amount as of December 31, 2014 included $1.8 billion for accidental death & dismemberment, $.5 billion for credit life, accident & health and $2.0 billion related to lender placed hazard contracts. |
| (c) | We enter into standby bond purchase agreements to support municipal bond obligations. |
| (d) | Includes $.5 billion and $.4 billion related to investments in qualified affordable housing projects at December 31, 2015 and December 31, 2014, respectively. |
Commitments to Extend Credit
Commitments to extend credit, or net unfunded loan commitments, represent arrangements to lend funds or provide liquidity subject to specified contractual conditions. These commitments generally have fixed expiration dates, may require payment of a fee, and contain termination clauses in the event the customer's credit quality deteriorates. Based on our historical experience, some commitments expire unfunded, and therefore cash requirements are substantially less than the total commitment.
Net Outstanding Standby Letters of Credit
We issue standby letters of credit and share in the risk of standby letters of credit issued by other financial institutions, in each case to support obligations of our customers to third parties, such as insurance requirements and the facilitation of transactions involving capital markets product execution. Internal credit ratings related to our net outstanding standby letters of credit were as follows:
Table 132: Internal Credit Ratings Related to Net Outstanding Standby Letters of Credit
| December 31 2015 | December 31 2014 | |||||||
Internal credit ratings (as a percentage of portfolio): | ||||||||
Pass (a) | 93 | % | 95 | % | ||||
Below pass (b) | 7 | % | 5 | % | ||||
| (a) | Indicates that expected risk of loss is currently low. |
| (b) | Indicates a higher degree of risk of default. |
If the customer fails to meet its financial or performance obligation to the third party under the terms of the contract or there is a need to support a remarketing program, then upon a draw by a beneficiary, subject to the terms of the letter of credit, we would be obligated to make payment to them. The standby letters of credit outstanding on December 31, 2015 had terms ranging from less than 1 year to 7 years.
As of December 31, 2015, assets of $1.0 billion secured certain specifically identified standby letters of credit. In addition, a portion of the remaining standby letters of credit issued on behalf of specific customers is also secured by collateral or guarantees that secure the customers' other obligations to us. The carrying amount of the liability for our obligations related to standby letters of credit and participations in standby letters of credit was $.2 billion at December 31, 2015 and is included in Other liabilities on our Consolidated Balance Sheet.
Reinsurance Agreements
We have a wholly-owned captive insurance subsidiary which provides reinsurance for accidental death & dismemberment, credit life, accident & health and lender placed hazard, all of which are in run-off. This subsidiary previously entered into these various types of reinsurance agreements with third-party insurers where the subsidiary assumed the risk of loss through quota share agreements up to 100% reinsurance. In quota share agreements, the subsidiary and the third-party insurers share the responsibility for payment of all claims.
We maintain a reserve for probable losses on these agreements, which totaled $8 million and $13 million as of December 31, 2015 and December 31, 2014, respectively, and are included in Other Liabilities on the Consolidated Balance Sheet. There is a reasonable possibility that losses could be more than or less than the amount reserved due to ongoing uncertainty in various economic, social and other factors that
| The PNC Financial Services Group, Inc. – Form 10-K 205 |
could impact the frequency and severity of claims covered by these reinsurance agreements. At December 31, 2015, the reasonably possible loss above our accrual was not material.
Indemnifications
We are a party to numerous acquisition or divestiture agreements under which we have purchased or sold, or agreed to purchase or sell, various types of assets. These agreements can cover the purchase or sale of entire businesses, loan portfolios, branch banks, partial interests in companies, or other types of assets.
These agreements generally include indemnification provisions under which we indemnify the third parties to these agreements against a variety of risks to the indemnified parties as a result of the transaction in question. When PNC is the seller, the indemnification provisions will generally also provide the buyer with protection relating to the quality of the assets we are selling and the extent of any liabilities being assumed by the buyer. Due to the nature of these indemnification provisions, we cannot quantify the total potential exposure to us resulting from them.
We provide indemnification in connection with securities offering transactions in which we are involved. When we are the issuer of the securities, we provide indemnification to the underwriters or placement agents analogous to the indemnification provided to the purchasers of businesses from us, as described above. When we are an underwriter or placement agent, we provide a limited indemnification to the issuer related to our actions in connection with the offering and, if there are other underwriters, indemnification to the other underwriters intended to result in an appropriate sharing of the risk of participating in the offering. Due to the nature of these indemnification provisions, we cannot quantify the total potential exposure to us resulting from them.
In the ordinary course of business, we enter into certain types of agreements that include provisions for indemnifying third parties. We also enter into certain types of agreements, including leases, assignments of leases, and subleases, in which we agree to indemnify third parties for acts by our agents, assignees and/or sublessees, and employees. We also enter into contracts for the delivery of technology service in which we indemnify the other party against claims of patent and copyright infringement by third parties. Due to the nature of these indemnification provisions, we cannot calculate our aggregate potential exposure under them.
In the ordinary course of business, we enter into contracts with third parties under which the third parties provide services on behalf of PNC. In many of these contracts, we agree to indemnify the third party service provider under certain circumstances. The terms of the indemnity vary from contract to contract and the amount of the indemnification liability, if any, cannot be determined.
We are a general or limited partner in certain asset management and investment limited partnerships, many of which contain indemnification provisions that would require us to make payments in excess of our remaining unfunded commitments. While in certain of these partnerships the maximum liability to us is limited to the sum of our unfunded commitments and partnership distributions received by us, in the others the indemnification liability is unlimited. As a result, we cannot determine our aggregate potential exposure for these indemnifications.
In some cases, indemnification obligations of the types described above arise under arrangements entered into by predecessor companies for which we become responsible as a result of the acquisition.
Pursuant to their bylaws, PNC and its subsidiaries provide indemnification to directors, officers and, in some cases, employees and agents against certain liabilities incurred as a result of their service on behalf of or at the request of PNC and its subsidiaries. PNC and its subsidiaries also advance on behalf of covered individuals costs incurred in connection with certain claims or proceedings, subject to written undertakings by each such individual to repay all amounts advanced if it is ultimately determined that the individual is not entitled to indemnification. We generally are responsible for similar indemnifications and advancement obligations that companies we acquire had to their officers, directors and sometimes employees and agents at the time of acquisition. We advanced such costs on behalf of several such individuals with respect to pending litigation or investigations during 2015. It is not possible for us to determine the aggregate potential exposure resulting from the obligation to provide this indemnity or to advance such costs.
Visa Indemnification
Our payment services business issues and acquires credit and debit card transactions through Visa U.S.A. Inc. card association or its affiliates (Visa).
In October 2007, Visa completed a restructuring and issued shares of Visa Inc. common stock to its financial institution members (Visa Reorganization) in contemplation of its initial public offering (IPO). As part of the Visa Reorganization, we received our proportionate share of Class B Visa Inc. common stock allocated to the U.S. members. Prior to the IPO, the U.S. members, which included PNC, were obligated to indemnify Visa for judgments and settlements related to certain specified litigation.
As a result of the acquisition of National City, we became party to judgment and loss sharing agreements with Visa and certain other banks. The judgment and loss sharing agreements were designed to apportion financial responsibilities arising from any potential adverse judgment or negotiated settlements related to the specified litigation. We continue to have an obligation to indemnify Visa for judgments and settlements for the remaining specified litigation.
| 206 The PNC Financial Services Group, Inc. – Form 10-K |
Recourse and Repurchase Obligations
As discussed in Note 2 Loan Sale and Servicing Activities and Variable Interest Entities, PNC has sold commercial mortgage, residential mortgage and home equity loans/lines of credit directly or indirectly through securitization and loan sale transactions in which we have continuing involvement. One form of continuing involvement includes certain recourse and loan repurchase obligations associated with the transferred assets.
Commercial Mortgage Loan Recourse Obligations
We originate and service certain multi-family commercial mortgage loans which are sold to FNMA under FNMA's Delegated Underwriting and Servicing (DUS) program. We participated in a similar program with the FHLMC.
Under these programs, we generally assume up to a one-third pari passu risk of loss on unpaid principal balances through a loss share arrangement. At December 31, 2015 and December 31, 2014, the unpaid principal balance outstanding of loans sold as a participant in these programs was $12.9 billion and $12.3 billion, respectively. The potential maximum exposure under the loss share arrangements was $3.8 billion at December 31, 2015 and $3.7 billion at December 31, 2014.
If payment is required under these programs, we would not have a contractual interest in the collateral underlying the mortgage loans on which losses occurred, although the value of the collateral is taken into account in determining our share of such losses. Our exposure and activity associated with these recourse obligations are reported in the Corporate & Institutional Banking segment.
We maintain a reserve for estimated losses based upon our exposure. The reserve for losses under these programs totaled $27 million and $35 million at December 31, 2015 and December 31, 2014, respectively, and was included in Other liabilities on the Consolidated Balance Sheet.
Residential Mortgage Loan Repurchase Obligations
While residential mortgage loans are sold on a non-recourse basis, we assume certain loan repurchase obligations associated with mortgage loans we have sold to investors. These loan repurchase obligations primarily relate to situations where PNC is alleged to have breached certain origination covenants and representations and warranties made to purchasers of the loans in the respective purchase and sale agreements. Repurchase obligation activity associated with residential mortgages is reported in the Residential Mortgage Banking segment.
Indemnifications and repurchase liabilities are initially recognized when loans are sold to investors and are subsequently evaluated by management. Initial recognition and subsequent adjustments to the indemnification and repurchase liability for the sold residential mortgage portfolio are recognized in Residential mortgage revenue on the Consolidated Income Statement.
Management's subsequent evaluation of indemnification and repurchase liabilities is based upon trends in indemnification and repurchase requests, actual loss experience, risks in the underlying serviced loan portfolios, and current economic conditions. As part of its evaluation, management considers estimated loss projections over the life of the subject loan portfolio.
At December 31, 2015 and December 31, 2014, the residential mortgage indemnification and repurchase liability for estimated losses on indemnification and repurchase claims totaled $94 million and $107 million, respectively, and was included in Other liabilities on the Consolidated Balance Sheet. The unpaid principal balance of loans associated with our exposure to this repurchase obligation totaled $65.3 billion and $68.3 billion at December 31, 2015 and December 31, 2014, respectively.
Management believes the indemnification and repurchase liabilities appropriately reflect the estimated probable losses on indemnification and repurchase claims for all loans sold and outstanding as of December 31, 2015. In making these estimates, we consider the losses that we expect to incur over the life of the sold loans. While management seeks to obtain all relevant information in estimating the indemnification and repurchase liability, the estimation process is inherently uncertain and imprecise and, accordingly, it is reasonably possible that future indemnification and repurchase losses could be more or less than our established liability. Factors that could affect our estimate include the volume of valid claims driven by investor strategies and behavior, our ability to successfully negotiate claims with investors, housing prices and other economic conditions. At December 31, 2015, we estimate that it is reasonably possible that we could incur additional losses in excess of our accrued indemnification and repurchase liability of up to approximately $77 million for our portfolio of residential mortgage loans sold. This estimate of potential additional losses in excess of our liability is based on assumed higher repurchase claims and lower claim rescissions than our current assumptions.
Home Equity Loan/Line of Credit Repurchase Obligations
PNC's repurchase obligations also include certain brokered home equity loans/lines of credit that were sold to a limited number of private investors in the financial services industry by National City prior to our acquisition of National City. PNC is no longer engaged in the brokered home equity lending business, and our exposure under these loan repurchase obligations is limited to repurchases of loans sold in these transactions. Repurchase activity associated with brokered home equity loans/lines of credit is reported in the Non-Strategic Assets Portfolio segment.
Since PNC is no longer engaged in the brokered home equity lending business, only subsequent adjustments are recognized to the home equity loans/lines indemnification and repurchase liability based on management evaluation. These adjustments are recognized in Other noninterest income on the Consolidated Income Statement.
| The PNC Financial Services Group, Inc. – Form 10-K 207 |
At December 31, 2015 and December 31, 2014, the home equity indemnification and repurchase liability for estimated losses on indemnification and repurchase claims totaled $20 million and $29 million, respectively, and was included in Other liabilities on the Consolidated Balance Sheet. The unpaid principal balance of the sold loan portfolio associated with this repurchase obligation totaled $2.1 billion and $2.5 billion at December 31, 2015 and December 31, 2014, respectively. At December 31, 2015 the reasonably possible loss above our accrual for our portfolio of home equity loans/lines of credit sold was not material.
Resale and Repurchase Agreements
We enter into repurchase and resale agreements where we transfer investment securities to/from a third party with the agreement to repurchase/resell those investment securities at a future date for a specified price. These agreements are entered into primarily to provide short-term financing for securities inventory positions, acquire securities to cover short positions and accommodate customers' investing and financing needs. Repurchase and resale agreements are treated as collateralized financing transactions for accounting purposes and are
generally carried at the amounts at which the securities will be subsequently reacquired or resold, including accrued interest. Our policy is to take possession of securities purchased under agreements to resell. We monitor the market value of securities to be repurchased and resold and additional collateral may be obtained where considered appropriate to protect against credit exposure.
Repurchase and resale agreements are typically entered into with counterparties under industry standard master netting agreements which provide for the right to offset amounts owed to one another with respect to multiple repurchase and resale agreements under such master netting agreement (referred to as netting arrangements) and liquidate the purchased or borrowed securities in the event of counterparty default. In order for an arrangement to be eligible for netting under GAAP, we must obtain the requisite assurance that the offsetting rights included in the master netting agreement would be legally enforceable in the event of bankruptcy, insolvency, or a similar proceeding of such third party. Enforceability is evidenced by obtaining a legal opinion that supports, with sufficient confidence, the enforceability of the master netting agreement in bankruptcy.
Table 133 shows the amounts owed under resale and repurchase agreements and the securities collateral associated with those agreements where a legal opinion supporting the enforceability of the offsetting rights has been obtained. We do not present resale and repurchase agreements entered into with the same counterparty under a legally enforceable master netting agreement on a net basis on our Consolidated Balance Sheet or within Table 133.
Refer to Note 14 Financial Derivatives for additional information related to offsetting of financial derivatives.
Table 133: Resale and Repurchase Agreements Offsetting
| In millions | Gross Resale Agreements | Amounts on the | Net Resale | Securities Held Under | Net Amounts (c) | |||||||||||||
Resale Agreements | ||||||||||||||||||
December 31, 2015 | $ | 1,082 | $ | 1,082 | $ | 1,008 | $ | 74 | ||||||||||
December 31, 2014 | $ | 1,646 | $ | 1,646 | $ | 1,569 | $ | 77 | ||||||||||
| In millions | Gross Repurchase Agreements | Amounts on the | Net Repurchase Agreements (a) | Securities Collateral Pledged Under Master Netting Agreements (b) | Net Amounts (d) | |||||||||||||
Repurchase Agreements | ||||||||||||||||||
December 31, 2015 | $ | 1,767 | (e) | $ | 1,767 | $ | 1,014 | $ | 753 | |||||||||
December 31, 2014 | $ | 3,406 | $ | 3,406 | $ | 2,580 | $ | 826 | ||||||||||
| (a) | Resale agreements are included on the Consolidated Balance Sheet in Federal funds sold and resale agreements. Amounts in the table above exclude fair value adjustments of $4 million and $7 million at December 31, 2015 and December 31, 2014, respectively, related to structured resale agreements that we have elected to account for at fair value. See Note 7 Fair Value for additional information. Repurchase agreements are included on the Consolidated Balance Sheet in Federal funds purchased and repurchase agreements. |
| (b) | Represents the fair value of securities collateral purchased or sold, up to the amount owed under the agreement, for agreements supported by a legally enforceable master netting agreement. |
| (c) | Represents certain long term resale agreements which are fully collateralized but do not have the benefits of a netting opinion and, therefore, might be subject to a stay in insolvency proceedings and therefore are not eligible under ASC 210-20 for netting. |
| (d) | Represents overnight repurchase agreements entered into with municipalities, pension plans, and certain trusts and insurance companies which are fully collateralized but do not have the benefits of a netting opinion and, therefore, might be subject to a stay in insolvency proceedings and therefore are not eligible under ASC 210-20 for netting. There were no long term repurchase agreements as of December 31, 2015 and December 31, 2014. |
| (e) | Repurchase agreements have remaining contractual maturities that are classified as overnight or continuous. As of December 31, 2015, the collateral pledged under these agreements consisted primarily of residential mortgage -backed agency securities. |
| 208 The PNC Financial Services Group, Inc. – Form 10-K |
N OTE 22 P ARENT C OMPANY
Summarized financial information of the parent company is as follows:
Table 134: Parent Company – Income Statement
| Year ended December 31 – in millions | 2015 | 2014 | 2013 | |||||||||
Operating Revenue | ||||||||||||
Dividends from: | ||||||||||||
Bank subsidiaries and bank holding company | $ | 3,110 | $ | 3,115 | $ | 3,105 | ||||||
Non-bank subsidiaries | 49 | 115 | 205 | |||||||||
Interest income | 5 | 4 | ||||||||||
Noninterest income | 14 | 30 | 28 | |||||||||
Total operating revenue | 3,178 | 3,264 | 3,338 | |||||||||
Operating Expense | ||||||||||||
Interest expense | 78 | 97 | 107 | |||||||||
Other expense | 88 | 127 | 93 | |||||||||
Total operating expense | 166 | 224 | 200 | |||||||||
Income before income taxes and equity in undistributed net income of subsidiaries | 3,012 | 3,040 | 3,138 | |||||||||
Income tax benefits | (99 | ) | (61 | ) | (89 | ) | ||||||
Income before equity in undistributed net income of subsidiaries | 3,111 | 3,101 | 3,227 | |||||||||
Equity in undistributed net income of subsidiaries: | ||||||||||||
Bank subsidiaries and bank holding company | 736 | 854 | 845 | |||||||||
Non-bank subsidiaries | 259 | 229 | 129 | |||||||||
Net income | $ | 4,106 | $ | 4,184 | $ | 4,201 | ||||||
Other comprehensive income, net of tax: | ||||||||||||
Net pension and other postretirement benefit plan activity arising during the period | (3 | ) | (17 | ) | 34 | |||||||
Other comprehensive income (loss) | (3 | ) | (17 | ) | 34 | |||||||
Comprehensive income | $ | 4,103 | $ | 4,167 | $ | 4,235 | ||||||
Table 135: Parent Company – Balance Sheet
| December 31 – in millions | 2015 | 2014 | ||||||
Assets | ||||||||
Cash held at banking subsidiary | $ | 1 | $ | 1 | ||||
Restricted deposits with banking subsidiary | 400 | |||||||
Nonrestricted interest-earning deposits | 1,147 | 2,013 | ||||||
Restricted interest-earning deposits | 300 | |||||||
Investments in: | ||||||||
Bank subsidiaries and bank holding company | 41,919 | 41,537 | ||||||
Non-bank subsidiaries | 2,742 | 2,480 | ||||||
Other assets | 1,460 | 1,399 | ||||||
Total assets | $ | 47,569 | $ | 47,830 | ||||
Liabilities | ||||||||
Subordinated debt (a) | $ | 1,639 | $ | 1,618 | ||||
Senior debt | 497 | 889 | ||||||
Bank affiliate borrowings | 95 | 102 | ||||||
Accrued expenses and other liabilities | 628 | 670 | ||||||
Total liabilities | 2,859 | 3,279 | ||||||
Equity | ||||||||
Shareholders' equity | 44,710 | 44,551 | ||||||
Total liabilities and equity | $ | 47,569 | $ | 47,830 | ||||
| (a) | At December 31, 2015, debt that contractually matures in 2016 through 2020 totaled zero, zero, zero, $700 million (subordinated debt) and zero. |
Debt issued by PNC Funding Corp, a wholly-owned finance subsidiary, is fully and unconditionally guaranteed by the parent company. In addition, in connection with certain affiliates' commercial and residential mortgage servicing operations, the parent company has committed to maintain such affiliates' net worth above minimum requirements.
Table 136: Parent Company – Interest Paid and Income Tax Refunds (Payments)
| Year ended December 31 – in millions | Interest Paid | Income Tax Refunds / (Payments) | ||||||
2015 | $ | 106 | $ | 72 | ||||
2014 | $ | 103 | $ | (13 | ) | |||
2013 | $ | 117 | $ | 91 | ||||
| The PNC Financial Services Group, Inc. – Form 10-K 209 |
Table 137: Parent Company – Statement of Cash Flows
| Year ended December 31 – in millions | 2015 | 2014 | 2013 | |||||||||
Operating Activities | ||||||||||||
Net income | $ | 4,106 | $ | 4,184 | $ | 4,201 | ||||||
Adjustments to reconcile net income to net cash provided by operating activities: | ||||||||||||
Equity in undistributed net earnings of subsidiaries | (995 | ) | (1,083 | ) | (974 | ) | ||||||
Other | 163 | 118 | 152 | |||||||||
Net cash provided (used) by operating activities | 3,274 | 3,219 | 3,379 | |||||||||
Investing Activities | ||||||||||||
Net capital returned from (contributed to) subsidiaries | 87 | |||||||||||
Net change in Restricted deposits with banking subsidiary | 400 | |||||||||||
Net change in nonrestricted interest-earning deposits | 866 | (1,792 | ) | (214 | ) | |||||||
Net change in restricted interest-earning deposits | (300 | ) | ||||||||||
Other | (81 | ) | (79 | ) | (60 | ) | ||||||
Net cash provided (used) by investing activities | 885 | (1,871 | ) | (187 | ) | |||||||
Financing Activities | ||||||||||||
Borrowings from subsidiaries | 1,593 | 2,430 | 3,624 | |||||||||
Repayments on borrowings from subsidiaries | (1,599 | ) | (2,392 | ) | (5,767 | ) | ||||||
Other borrowed funds | (382 | ) | 770 | (467 | ) | |||||||
Preferred stock – Other issuances | 495 | |||||||||||
Preferred stock – Other redemptions | (500 | ) | (150 | ) | ||||||||
Common and treasury stock issuances | 139 | 252 | 244 | |||||||||
Acquisition of treasury stock | (2,152 | ) | (1,176 | ) | (24 | ) | ||||||
Preferred stock cash dividends paid | (219 | ) | (232 | ) | (237 | ) | ||||||
Common stock cash dividends paid | (1,039 | ) | (1,000 | ) | (911 | ) | ||||||
Net cash provided (used) by financing activities | (4,159 | ) | (1,348 | ) | (3,193 | ) | ||||||
Increase (decrease) in cash and due from banks | (1 | ) | ||||||||||
Cash held at banking subsidiary at beginning of year | 1 | 1 | 2 | |||||||||
Cash held at banking subsidiary at end of year | $ | 1 | $ | 1 | $ | 1 | ||||||
N OTE 23 S EGMENT R EPORTING
We have six reportable business segments:
| • | Retail Banking |
| • | Corporate & Institutional Banking |
| • | Asset Management Group |
| • | Residential Mortgage Banking |
| • | BlackRock |
| • | Non-Strategic Assets Portfolio |
Results of individual businesses are presented based on our internal management reporting practices. There is no comprehensive, authoritative body of guidance for management accounting equivalent to GAAP; therefore, the financial results of our individual businesses are not necessarily comparable with similar information for any other company. We periodically refine our internal methodologies as management reporting practices are enhanced. To the extent significant and practicable, retrospective application of new methodologies is made to prior period reportable business segment results and disclosures to create comparability with the current period.
Financial results are presented, to the extent practicable, as if each business operated on a stand-alone basis. Additionally, we have aggregated the results for corporate support functions within "Other" for financial reporting purposes.
Net interest income in business segment results reflects PNC's internal funds transfer pricing methodology. Assets receive a funding charge and liabilities and capital receive a funding credit based on a transfer pricing methodology that incorporates product repricing characteristics, tenor and other factors. In the first quarter of 2015, enhancements were made to PNC's funds transfer pricing methodology primarily for costs related to the new regulatory short-term liquidity standards. The enhancements incorporate an additional charge assigned to assets, including for unfunded loan commitments. Conversely, a higher transfer pricing credit has been assigned to those deposits that are accorded higher value under Liquidity Coverage Ratio (LCR) rules for liquidity purposes. Please see the Supervision and Regulation section in Item 1 and the Liquidity Risk Management section in Item 7 of this Report for more information about the LCR. These adjustments apply to business segment results, primarily favorably impacting Retail Banking and adversely impacting Corporate & Institutional Banking, prospectively beginning with the first quarter of 2015. Prior periods have not been adjusted due to the impracticability of estimating the impact of the change for prior periods.
A portion of capital is intended to cover unexpected losses and is assigned to our business segments using our risk-based economic capital model, including consideration of the goodwill at those business segments, as well as the diversification of risk among the business segments, ultimately reflecting PNC's portfolio risk adjusted capital allocation.
| 210 The PNC Financial Services Group, Inc. – Form 10-K |
We have allocated the allowances for loan and lease losses and for unfunded loan commitments and letters of credit based on the loan exposures within each business segment's portfolio. Key reserve assumptions and estimation processes react to and are influenced by observed changes in loan portfolio performance experience, the financial strength of the borrower, and economic conditions. Key reserve assumptions are periodically updated.
Our allocation of the costs incurred by operations and other shared support areas not directly aligned with the businesses is primarily based on the use of services.
Total business segment financial results differ from total consolidated net income. The impact of these differences is reflected in the "Other" category in the business segment tables. "Other" includes residual activities that do not meet the criteria for disclosure as a separate reportable business, such as gains or losses related to BlackRock transactions, integration costs, asset and liability management activities including net securities gains or losses, other-than-temporary impairment of investment securities and certain trading activities, exited businesses, private equity investments, intercompany eliminations, most corporate overhead, tax adjustments that are not allocated to business segments, and differences between business segment performance reporting and financial statement reporting (GAAP), including the presentation of net income attributable to noncontrolling interests as the segments' results exclude their portion of net income attributable to noncontrolling interests. Assets, revenue and earnings attributable to foreign activities were not material in the periods presented for comparative purposes.
Business Segment Products and Services
Retail Banking provides deposit, lending, brokerage, investment management and cash management services to consumer and small business customers within our primary geographic markets. Our customers are serviced through our branch network, ATMs, call centers, online banking and mobile channels. The branch network is located primarily in Pennsylvania, Ohio, New Jersey, Michigan, Illinois, Maryland, Indiana, Florida, North Carolina, Kentucky, Washington, D.C., Delaware, Virginia, Alabama, Georgia, Missouri, Wisconsin and South Carolina.
Corporate & Institutional Banking provides lending, treasury management, and capital markets-related products and services to mid-sized and large corporations, government and not-for-profit entities. Lending products include secured and unsecured loans, letters of credit and equipment leases. Treasury management services include cash and investment management, receivables management, disbursement services, funds transfer services, information reporting and global trade services. Capital markets-related products and services include foreign exchange, derivatives, securities, loan syndications, mergers and acquisitions advisory, equity capital markets advisory and related services. We also provide commercial loan servicing and real estate advisory and technology
solutions for the commercial real estate finance industry. Products and services are generally provided within our primary geographic markets, with certain products and services offered nationally and internationally.
Asset Management Group includes personal wealth management for high net worth and ultra high net worth clients and institutional asset management. Wealth management products and services include investment and retirement planning, customized investment management, private banking, tailored credit solutions, and trust management and administration for individuals and their families. Hawthorn provides multi-generational family planning including wealth strategy, investment management, private banking, tax and estate planning guidance, performance reporting and personal administration services to ultra high net worth families. Institutional asset management provides investment management, custody administration and retirement administration services. The business also offers PNC proprietary mutual funds. Institutional clients include corporations, unions, municipalities, non-profits, foundations and endowments, primarily located in our geographic footprint.
Residential Mortgage Banking directly originates first lien residential mortgage loans on a nationwide basis with a significant presence within the retail banking footprint. Mortgage loans represent loans collateralized by one-to-four family residential real estate. These loans are typically underwritten to government agency and/or third-party standards, and either sold, servicing retained, or held on PNC's balance sheet. Loan sales are primarily to secondary mortgage conduits of FNMA, FHLMC, Federal Home Loan Banks and third-party investors, or are securitized and issued under the GNMA program. The mortgage servicing operation performs all functions related to servicing mortgage loans, primarily those in first lien position, for various investors and for loans owned by PNC.
BlackRock is a leading publicly traded investment management firm providing a broad range of investment and risk management services to institutional and retail clients worldwide. Using a diverse platform of active and index investment strategies across asset classes, BlackRock develops investment outcomes and asset allocation solutions for clients. Product offerings include single- and multi-asset class portfolios investing in equities, fixed income, alternatives and money market instruments. BlackRock also offers an investment and risk management technology platform, risk analytics and advisory services and solutions to a broad base of institutional investors.
We hold an equity investment in BlackRock, which provides us with an additional source of noninterest income and increases our overall revenue diversification. BlackRock is a publicly traded company, and additional information regarding its business is available in its filings with the Securities and Exchange Commission (SEC). At December 31, 2015, our economic interest in BlackRock was 22%.
| The PNC Financial Services Group, Inc. – Form 10-K 211 |
PNC received cash dividends from BlackRock of $320 million, $285 million, and $249 million during 2015, 2014, and 2013, respectively.
Non-Strategic Assets Portfolio includes a consumer portfolio of mainly residential mortgage and brokered home equity loans and lines of credit and a small commercial/commercial real estate loan and lease portfolio. We obtained a significant portion of these non-strategic assets through acquisitions of other companies.
Table 138: Results Of Businesses
| Year ended December 31 In millions | Retail Banking | Corporate & Institutional Banking | Asset Management Group | Residential Mortgage Banking | BlackRock | Non-Strategic Assets Portfolio | Other | Consolidated | ||||||||||||||||||||||||
2015 | ||||||||||||||||||||||||||||||||
Income Statement | ||||||||||||||||||||||||||||||||
Net interest income | $ | 4,224 | $ | 3,365 | $ | 292 | $ | 121 | $ | 392 | $ | (116 | ) | $ | 8,278 | |||||||||||||||||
Noninterest income | 2,223 | 1,935 | 869 | 613 | $ | 717 | 53 | 537 | 6,947 | |||||||||||||||||||||||
Total revenue | 6,447 | 5,300 | 1,161 | 734 | 717 | 445 | 421 | 15,225 | ||||||||||||||||||||||||
Provision for credit losses (benefit) | 259 | 106 | 9 | 2 | (114 | ) | (7 | ) | 255 | |||||||||||||||||||||||
Depreciation and amortization | 169 | 145 | 44 | 15 | 436 | 809 | ||||||||||||||||||||||||||
Other noninterest expense | 4,592 | 2,003 | 802 | 676 | 83 | 498 | 8,654 | |||||||||||||||||||||||||
Income (loss) before income taxes and noncontrolling interests | 1,427 | 3,046 | 306 | 41 | 717 | 476 | (506 | ) | 5,507 | |||||||||||||||||||||||
Income taxes (benefit) | 520 | 1,015 | 112 | 15 | 169 | 175 | (642 | ) | 1,364 | |||||||||||||||||||||||
Net income | $ | 907 | $ | 2,031 | $ | 194 | $ | 26 | $ | 548 | $ | 301 | $ | 136 | $ | 4,143 | ||||||||||||||||
Inter-segment revenue | $ | 1 | $ | 24 | $ | 9 | $ | 20 | $ | 15 | $ | (8 | ) | $ | (61 | ) | ||||||||||||||||
Average Assets (a) | $ | 73,240 | $ | 132,032 | $ | 7,920 | $ | 6,840 | $ | 6,983 | $ | 6,706 | $ | 121,243 | $ | 354,964 | ||||||||||||||||
2014 | ||||||||||||||||||||||||||||||||
Income Statement | ||||||||||||||||||||||||||||||||
Net interest income | $ | 3,923 | $ | 3,605 | $ | 289 | $ | 149 | $ | 547 | $ | 12 | $ | 8,525 | ||||||||||||||||||
Noninterest income | 2,125 | 1,743 | 818 | 651 | $ | 703 | 40 | 770 | 6,850 | |||||||||||||||||||||||
Total revenue | 6,048 | 5,348 | 1,107 | 800 | 703 | 587 | 782 | 15,375 | ||||||||||||||||||||||||
Provision for credit losses (benefit) | 277 | 107 | (1 | ) | (2 | ) | (119 | ) | 11 | 273 | ||||||||||||||||||||||
Depreciation and amortization | 176 | 135 | 42 | 12 | 411 | 776 | ||||||||||||||||||||||||||
Other noninterest expense | 4,449 | 1,929 | 779 | 734 | 125 | 696 | 8,712 | |||||||||||||||||||||||||
Income (loss) before income taxes and noncontrolling interests | 1,146 | 3,177 | 287 | 56 | 703 | 581 | (336 | ) | 5,614 | |||||||||||||||||||||||
Income taxes (benefit) | 418 | 1,071 | 106 | 21 | 173 | 214 | (596 | ) | 1,407 | |||||||||||||||||||||||
Net income | $ | 728 | $ | 2,106 | $ | 181 | $ | 35 | $ | 530 | $ | 367 | $ | 260 | $ | 4,207 | ||||||||||||||||
Inter-segment revenue | $ | 2 | $ | 23 | $ | 11 | $ | 17 | $ | 16 | $ | (10 | ) | $ | (59 | ) | ||||||||||||||||
Average Assets (a) | $ | 75,046 | $ | 122,927 | $ | 7,745 | $ | 7,857 | $ | 6,640 | $ | 8,338 | $ | 99,300 | $ | 327,853 | ||||||||||||||||
2013 | ||||||||||||||||||||||||||||||||
Income Statement | ||||||||||||||||||||||||||||||||
Net interest income | $ | 4,077 | $ | 3,680 | $ | 288 | $ | 194 | $ | 689 | $ | 219 | $ | 9,147 | ||||||||||||||||||
Noninterest income | 2,021 | 1,702 | 752 | 906 | $ | 621 | 53 | 810 | 6,865 | |||||||||||||||||||||||
Total revenue | 6,098 | 5,382 | 1,040 | 1,100 | 621 | 742 | 1,029 | 16,012 | ||||||||||||||||||||||||
Provision for credit losses (benefit) | 657 | (25 | ) | 10 | 21 | (21 | ) | 1 | 643 | |||||||||||||||||||||||
Depreciation and amortization | 186 | 128 | 42 | 11 | 348 | 715 | ||||||||||||||||||||||||||
Other noninterest expense | 4,390 | 1,871 | 732 | 834 | 163 | 976 | 8,966 | |||||||||||||||||||||||||
Income (loss) before income taxes and noncontrolling interests | 865 | 3,408 | 256 | 234 | 621 | 600 | (296 | ) | 5,688 | |||||||||||||||||||||||
Income taxes (benefit) | 315 | 1,144 | 94 | 86 | 152 | 221 | (536 | ) | 1,476 | |||||||||||||||||||||||
Net income | $ | 550 | $ | 2,264 | $ | 162 | $ | 148 | $ | 469 | $ | 379 | $ | 240 | $ | 4,212 | ||||||||||||||||
Inter-segment revenue | $ | 3 | $ | 28 | $ | 12 | $ | 8 | $ | 17 | $ | (10 | ) | $ | (58 | ) | ||||||||||||||||
Average Assets (a) | $ | 74,971 | $ | 112,970 | $ | 7,366 | $ | 9,896 | $ | 6,272 | $ | 9,987 | $ | 84,202 | $ | 305,664 | ||||||||||||||||
| (a) | Period-end balances for BlackRock. |
N OTE 24 S UBSEQUENT E VENTS
On February 1, 2016, PNC transferred 0.5 million shares of BlackRock Series C Preferred Stock to BlackRock to satisfy a portion of our LTIP obligation. Upon transfer, Other assets and Other liabilities on our Consolidated Balance Sheet were each reduced by $138 million, representing the fair value of the shares transferred. After this transfer, we hold 0.8 million shares of BlackRock Series C Preferred Stock which are available to fund our remaining obligation in connection with the BlackRock LTIP programs.
| 212 The PNC Financial Services Group, Inc. – Form 10-K |
STATISTICAL INFORMATION (UNAUDITED)
THE PNC FINANCIAL SERVICES GROUP, INC.
SELECTED QUARTERLY FINANCIAL DATA
Dollars in millions, except per share data | 2015 | 2014 | ||||||||||||||||||||||||||||||
| Fourth | Third | Second | First | Fourth | Third | Second | First | |||||||||||||||||||||||||
Summary Of Operations |
| |||||||||||||||||||||||||||||||
Interest income | $ | 2,358 | $ | 2,341 | $ | 2,305 | $ | 2,319 | $ | 2,337 | $ | 2,328 | $ | 2,356 | $ | 2,410 | ||||||||||||||||
Interest expense | 266 | 279 | 253 | 247 | 240 | 224 | 227 | 215 | ||||||||||||||||||||||||
Net interest income | 2,092 | 2,062 | 2,052 | 2,072 | 2,097 | 2,104 | 2,129 | 2,195 | ||||||||||||||||||||||||
Noninterest income (a) | 1,761 | 1,713 | 1,814 | 1,659 | 1,850 | 1,737 | 1,681 | 1,582 | ||||||||||||||||||||||||
Total revenue | 3,853 | 3,775 | 3,866 | 3,731 | 3,947 | 3,841 | 3,810 | 3,777 | ||||||||||||||||||||||||
Provision for credit losses | 74 | 81 | 46 | 54 | 52 | 55 | 72 | 94 | ||||||||||||||||||||||||
Noninterest expense | 2,396 | 2,352 | 2,366 | 2,349 | 2,539 | 2,357 | 2,328 | 2,264 | ||||||||||||||||||||||||
Income before income taxes and noncontrolling interests | 1,383 | 1,342 | 1,454 | 1,328 | 1,356 | 1,429 | 1,410 | 1,419 | ||||||||||||||||||||||||
Income taxes | 361 | 269 | 410 | 324 | 299 | 391 | 358 | 359 | ||||||||||||||||||||||||
Net income | 1,022 | 1,073 | 1,044 | 1,004 | 1,057 | 1,038 | 1,052 | 1,060 | ||||||||||||||||||||||||
Less: Net income (loss) attributable to noncontrolling interests | 14 | 18 | 4 | 1 | 21 | 1 | 3 | (2 | ) | |||||||||||||||||||||||
Preferred stock dividends and discount accretion and redemptions | 43 | 64 | 48 | 70 | 48 | 71 | 48 | 70 | ||||||||||||||||||||||||
Net income attributable to common shareholders | $ | 965 | $ | 991 | $ | 992 | $ | 933 | $ | 988 | $ | 966 | $ | 1,001 | $ | 992 | ||||||||||||||||
Per Common Share Data | ||||||||||||||||||||||||||||||||
Book value | $ | 81.84 | $ | 81.42 | $ | 79.64 | $ | 78.99 | $ | 77.61 | $ | 76.71 | $ | 75.62 | $ | 73.73 | ||||||||||||||||
Basic earnings from net income (b) | 1.90 | 1.93 | 1.92 | 1.79 | 1.88 | 1.82 | 1.88 | 1.86 | ||||||||||||||||||||||||
Diluted earnings from net income (b) | 1.87 | 1.90 | 1.88 | 1.75 | 1.84 | 1.79 | 1.85 | 1.82 | ||||||||||||||||||||||||
| (a) | Noninterest income included private equity gains/(losses) and net gains on sales of securities in each quarter as follows: |
| 2015 | 2014 | |||||||||||||||||||||||||||||||
| in millions | Fourth | Third | Second | First | Fourth | Third | Second | First | ||||||||||||||||||||||||
Private equity gains/(losses) | $ | 21 | $ | 59 | $ | 43 | $ | 41 | $ | 61 | $ | 70 | $ | 35 | $ | 42 | ||||||||||||||||
Net gains on sales of securities | 2 | (9 | ) | 8 | 42 | – | – | (6 | ) | 10 | ||||||||||||||||||||||
| (b) | The sum of the quarterly amounts for 2015 and 2014 does not equal the respective year's amount because the quarterly calculations are based on a changing number of average shares. |
| The PNC Financial Services Group, Inc. – Form 10-K 213 |
AVERAGE CONSOLIDATED BALANCE SHEET AND NET INTEREST ANALYSIS (a) (b) (c)
| 2015 | 2014 | 2013 | ||||||||||||||||||||||||||||||||||
Taxable-equivalent basis Dollars in millions | Average Balances | Interest Income/ Expense | Average Yields/ Rates | Average Balances | Interest Income/ Expense | Average Yields/ Rates | Average Balances | Interest Income/ Expense | Average Yields/ Rates | |||||||||||||||||||||||||||
Assets | ||||||||||||||||||||||||||||||||||||
Interest-earning assets: | ||||||||||||||||||||||||||||||||||||
Investment securities | ||||||||||||||||||||||||||||||||||||
Securities available for sale | ||||||||||||||||||||||||||||||||||||
Residential mortgage-backed | ||||||||||||||||||||||||||||||||||||
Agency | $ | 21,371 | $ | 540 | 2.53 | % | $ | 18,935 | $ | 503 | 2.66 | % | $ | 22,746 | $ | 562 | 2.47 | % | ||||||||||||||||||
Non-agency | 4,374 | 207 | 4.73 | 5,106 | 244 | 4.78 | 5,828 | 317 | 5.44 | |||||||||||||||||||||||||||
Commercial mortgage-backed | 6,372 | 195 | 3.06 | 5,461 | 192 | 3.52 | 5,228 | 222 | 4.25 | |||||||||||||||||||||||||||
Asset-backed | 5,234 | 111 | 2.12 | 5,321 | 105 | 1.97 | 5,857 | 110 | 1.88 | |||||||||||||||||||||||||||
U.S. Treasury and government agencies | 6,486 | 79 | 1.22 | 4,837 | 57 | 1.18 | 2,326 | 37 | 1.59 | |||||||||||||||||||||||||||
State and municipal | 1,982 | 93 | 4.69 | 2,148 | 96 | 4.47 | 2,250 | 97 | 4.31 | |||||||||||||||||||||||||||
Other debt | 1,844 | 52 | 2.82 | 2,016 | 52 | 2.58 | 2,632 | 64 | 2.43 | |||||||||||||||||||||||||||
Corporate stocks and other | 518 | 1 | .19 | 402 | – | – | 342 | – | – | |||||||||||||||||||||||||||
Total securities available for sale | 48,181 | 1,278 | 2.65 | 44,226 | 1,249 | 2.82 | 47,209 | 1,409 | 2.98 | |||||||||||||||||||||||||||
Securities held to maturity | ||||||||||||||||||||||||||||||||||||
Residential mortgage-backed | 8,238 | 251 | 3.05 | 5,885 | 207 | 3.52 | 4,374 | 153 | 3.50 | |||||||||||||||||||||||||||
Commercial mortgage-backed | 1,976 | 75 | 3.80 | 2,502 | 99 | 3.96 | 3,422 | 151 | 4.41 | |||||||||||||||||||||||||||
Asset-backed | 738 | 11 | 1.49 | 908 | 14 | 1.54 | 983 | 16 | 1.63 | |||||||||||||||||||||||||||
U.S. Treasury and government agencies | 253 | 10 | 3.95 | 243 | 9 | 3.70 | 235 | 9 | 3.83 | |||||||||||||||||||||||||||
State and municipal | 1,992 | 110 | 5.52 | 1,727 | 95 | 5.50 | 749 | 42 | 5.61 | |||||||||||||||||||||||||||
Other | 287 | 9 | 3.14 | 329 | 10 | 3.04 | 347 | 11 | 3.17 | |||||||||||||||||||||||||||
Total securities held to maturity | 13,484 | 466 | 3.46 | 11,594 | 434 | 3.74 | 10,110 | 382 | 3.78 | |||||||||||||||||||||||||||
Total investment securities | 61,665 | 1,744 | 2.83 | 55,820 | 1,683 | 3.02 | 57,319 | 1,791 | 3.12 | |||||||||||||||||||||||||||
Loans | ||||||||||||||||||||||||||||||||||||
Commercial | 98,093 | 2,975 | 3.03 | 92,411 | 3,029 | 3.28 | 86,047 | 3,243 | 3.77 | |||||||||||||||||||||||||||
Commercial real estate | 25,177 | 896 | 3.56 | 22,646 | 919 | 4.06 | 19,469 | 937 | 4.81 | |||||||||||||||||||||||||||
Equipment lease financing | 7,570 | 260 | 3.43 | 7,567 | 278 | 3.67 | 7,329 | 292 | 3.98 | |||||||||||||||||||||||||||
Consumer | 60,094 | 2,505 | 4.17 | 62,529 | 2,609 | 4.17 | 62,125 | 2,744 | 4.42 | |||||||||||||||||||||||||||
Residential real estate | 14,415 | 697 | 4.84 | 14,495 | 721 | 4.97 | 15,003 | 773 | 5.15 | |||||||||||||||||||||||||||
Total loans | 205,349 | 7,333 | 3.57 | 199,648 | 7,556 | 3.78 | 189,973 | 7,989 | 4.21 | |||||||||||||||||||||||||||
Interest-earning deposits with banks | 32,908 | 86 | .26 | 19,204 | 49 | .26 | 4,910 | 12 | .24 | |||||||||||||||||||||||||||
Loans held for sale | 2,070 | 90 | 4.35 | 2,123 | 99 | 4.66 | 2,909 | 157 | 5.40 | |||||||||||||||||||||||||||
Federal funds sold and resale agreements | 1,669 | 4 | .24 | 1,446 | 5 | .35 | 960 | 8 | .83 | |||||||||||||||||||||||||||
Other | 5,164 | 262 | 5.07 | 5,064 | 228 | 4.50 | 4,574 | 218 | 4.77 | |||||||||||||||||||||||||||
Total interest-earning assets/interest income | 308,825 | 9,519 | 3.08 | 283,305 | 9,620 | 3.40 | 260,645 | 10,175 | 3.90 | |||||||||||||||||||||||||||
Noninterest-earning assets: | ||||||||||||||||||||||||||||||||||||
Allowance for loan and lease losses | (3,273 | ) | (3,482 | ) | (3,796 | ) | ||||||||||||||||||||||||||||||
Cash and due from banks | 4,006 | 3,945 | 3,953 | |||||||||||||||||||||||||||||||||
Other | 45,406 | 44,085 | 44,862 | |||||||||||||||||||||||||||||||||
Total assets | $ | 354,964 | $ | 327,853 | $ | 305,664 | ||||||||||||||||||||||||||||||
Liabilities and Equity | ||||||||||||||||||||||||||||||||||||
Interest-bearing liabilities: | ||||||||||||||||||||||||||||||||||||
Interest-bearing deposits | ||||||||||||||||||||||||||||||||||||
Money market | $ | 81,911 | $ | 214 | .26 | % | $ | 75,513 | $ | 140 | .19 | % | $ | 70,567 | $ | 128 | .18 | % | ||||||||||||||||||
Demand | 46,649 | 26 | .06 | 43,367 | 22 | .05 | 40,144 | 18 | .04 | |||||||||||||||||||||||||||
Savings | 14,719 | 32 | .22 | 11,990 | 14 | .12 | 10,954 | 10 | .09 | |||||||||||||||||||||||||||
Retail certificates of deposit | 18,294 | 127 | .69 | 19,636 | 145 | .74 | 22,274 | 180 | .81 | |||||||||||||||||||||||||||
Time deposits in foreign offices and other time | 2,392 | 4 | .17 | 2,308 | 4 | .17 | 2,061 | 8 | .39 | |||||||||||||||||||||||||||
Total interest-bearing deposits | 163,965 | 403 | .25 | 152,814 | 325 | .21 | 146,000 | 344 | .24 | |||||||||||||||||||||||||||
Borrowed funds | ||||||||||||||||||||||||||||||||||||
Federal funds purchased and repurchase agreements | 2,510 | 3 | .12 | 3,560 | 3 | .08 | 3,884 | 6 | .15 | |||||||||||||||||||||||||||
Federal Home Loan Bank borrowings | 21,365 | 104 | .49 | 14,863 | 73 | .49 | 8,617 | 45 | .52 | |||||||||||||||||||||||||||
Bank notes and senior debt | 17,937 | 223 | 1.24 | 14,114 | 202 | 1.43 | 11,221 | 191 | 1.70 | |||||||||||||||||||||||||||
Subordinated debt | 8,796 | 236 | 2.68 | 8,559 | 219 | 2.56 | 7,373 | 205 | 2.78 | |||||||||||||||||||||||||||
Commercial paper | 2,684 | 10 | .37 | 4,861 | 14 | .29 | 6,902 | 16 | .23 | |||||||||||||||||||||||||||
Other | 3,221 | 66 | 2.05 | 2,860 | 70 | 2.45 | 2,025 | 53 | 2.62 | |||||||||||||||||||||||||||
Total borrowed funds | 56,513 | 642 | 1.14 | 48,817 | 581 | 1.19 | 40,022 | 516 | 1.29 | |||||||||||||||||||||||||||
Total interest-bearing liabilities/interest expense | 220,478 | 1,045 | .47 | 201,631 | 906 | .45 | 186,022 | 860 | .46 | |||||||||||||||||||||||||||
Noninterest-bearing liabilities and equity: | ||||||||||||||||||||||||||||||||||||
Noninterest-bearing deposits | 76,398 | 70,108 | 66,168 | |||||||||||||||||||||||||||||||||
Allowance for unfunded loan commitments and letters of credit | 251 | 238 | 241 | |||||||||||||||||||||||||||||||||
Accrued expenses and other liabilities | 11,959 | 10,530 | 10,918 | |||||||||||||||||||||||||||||||||
Equity | 45,878 | 45,346 | 42,315 | |||||||||||||||||||||||||||||||||
Total liabilities and equity | $ | 354,964 | $ | 327,853 | $ | 305,664 | ||||||||||||||||||||||||||||||
Interest rate spread | 2.61 | 2.95 | 3.44 | |||||||||||||||||||||||||||||||||
Impact of noninterest-bearing sources | .13 | .13 | .13 | |||||||||||||||||||||||||||||||||
Net interest income/margin | $ | 8,474 | 2.74 | % | $ | 8,714 | 3.08 | % | $ | 9,315 | 3.57 | % | ||||||||||||||||||||||||
| 214 The PNC Financial Services Group, Inc. – Form 10-K |
| (a) | Nonaccrual loans are included in loans, net of unearned income. The impact of financial derivatives used in interest rate risk management is included in the interest income/expense and average yields/rates of the related assets and liabilities. Basis adjustments related to hedged items are included in noninterest-earning assets and noninterest-bearing liabilities. Average balances of securities are based on amortized historical cost (excluding adjustments to fair value, which are included in other assets). Average balances for certain loans and borrowed funds accounted for at fair value, with changes in fair value recorded in trading noninterest income, are included in noninterest-earning assets and noninterest-bearing liabilities. |
| (b) | Loan fees for the years ended December 31, 2015, 2014 and 2013 were $106 million, $162 million and $230 million, respectively. |
| (c) | Interest income includes the effects of taxable-equivalent adjustments using a statutory federal income tax rate of 35% to increase tax-exempt interest income to a taxable-equivalent basis. The taxable-equivalent adjustments to interest income for the years ended December 31, 2015, 2014 and 2013 were $196 million, $189 million and $168 million, respectively. |
| The PNC Financial Services Group, Inc. – Form 10-K 215 |
ANALYSIS OF YEAR-TO-YEAR CHANGES IN NET INTEREST INCOME (a) (b)
| 2015/2014 | 2014/2013 | |||||||||||||||||||||||
Increase/(Decrease) in Income/ Expense Due to Changes in: | Increase/(Decrease) in Income/ Expense Due to Changes in: | |||||||||||||||||||||||
| Taxable-equivalent basis – in millions | Volume | Rate | Total | Volume | Rate | Total | ||||||||||||||||||
Interest-Earning Assets | ||||||||||||||||||||||||
Investment securities | ||||||||||||||||||||||||
Securities available for sale | ||||||||||||||||||||||||
Residential mortgage-backed | ||||||||||||||||||||||||
Agency | $ | 63 | $ | (26 | ) | $ | 37 | $ | (99 | ) | $ | 40 | $ | (59 | ) | |||||||||
Non-agency | (34 | ) | (3 | ) | (37 | ) | (37 | ) | (36 | ) | (73 | ) | ||||||||||||
Commercial mortgage-backed | 30 | (27 | ) | 3 | 10 | (40 | ) | (30 | ) | |||||||||||||||
Asset-backed | (2 | ) | 8 | 6 | (10 | ) | 5 | (5 | ) | |||||||||||||||
U.S. Treasury and government agencies | 20 | 2 | 22 | 32 | (12 | ) | 20 | |||||||||||||||||
State and municipal | (8 | ) | 5 | (3 | ) | (5 | ) | 4 | (1 | ) | ||||||||||||||
Other debt | (4 | ) | 4 | (16 | ) | 4 | (12 | ) | ||||||||||||||||
Corporate stocks and other | 1 | 1 | ||||||||||||||||||||||
Total securities available for sale | 107 | (78 | ) | 29 | (86 | ) | (74 | ) | (160 | ) | ||||||||||||||
Securities held to maturity | ||||||||||||||||||||||||
Residential mortgage-backed | 75 | (31 | ) | 44 | 53 | 1 | 54 | |||||||||||||||||
Commercial mortgage-backed | (20 | ) | (4 | ) | (24 | ) | (38 | ) | (14 | ) | (52 | ) | ||||||||||||
Asset-backed | (3 | ) | (3 | ) | (1 | ) | (1 | ) | (2 | ) | ||||||||||||||
U.S. Treasury and government agencies | 1 | 1 | ||||||||||||||||||||||
State and municipal | 15 | 15 | 54 | (1 | ) | 53 | ||||||||||||||||||
Other | (1 | ) | (1 | ) | (1 | ) | (1 | ) | ||||||||||||||||
Total securities held to maturity | 66 | (34 | ) | 32 | 56 | (4 | ) | 52 | ||||||||||||||||
Total investment securities | 171 | (110 | ) | 61 | (49 | ) | (59 | ) | (108 | ) | ||||||||||||||
Loans | ||||||||||||||||||||||||
Commercial | 182 | (236 | ) | (54 | ) | 228 | (442 | ) | (214 | ) | ||||||||||||||
Commercial real estate | 97 | (120 | ) | (23 | ) | 140 | (158 | ) | (18 | ) | ||||||||||||||
Equipment lease financing | (18 | ) | (18 | ) | 9 | (23 | ) | (14 | ) | |||||||||||||||
Consumer | (104 | ) | (104 | ) | 18 | (153 | ) | (135 | ) | |||||||||||||||
Residential real estate | (4 | ) | (20 | ) | (24 | ) | (26 | ) | (26 | ) | (52 | ) | ||||||||||||
Total loans | 209 | (432 | ) | (223 | ) | 399 | (832 | ) | (433 | ) | ||||||||||||||
Interest-earning deposits with banks | 37 | 37 | 36 | 1 | 37 | |||||||||||||||||||
Loans held for sale | (2 | ) | (7 | ) | (9 | ) | (38 | ) | (20 | ) | (58 | ) | ||||||||||||
Federal funds sold and resale agreements | 1 | (2 | ) | (1 | ) | 3 | (6 | ) | (3 | ) | ||||||||||||||
Other | 5 | 29 | 34 | 22 | (12 | ) | 10 | |||||||||||||||||
Total interest-earning assets | $ | 838 | $ | (939 | ) | $ | (101 | ) | $ | 829 | $ | (1,384 | ) | $ | (555 | ) | ||||||||
Interest-Bearing Liabilities | ||||||||||||||||||||||||
Interest-bearing deposits | ||||||||||||||||||||||||
Money market | $ | 14 | $ | 60 | $ | 74 | $ | 7 | $ | 5 | $ | 12 | ||||||||||||
Demand | 1 | 3 | 4 | 1 | 3 | 4 | ||||||||||||||||||
Savings | 4 | 14 | 18 | 1 | 3 | 4 | ||||||||||||||||||
Retail certificates of deposit | (9 | ) | (9 | ) | (18 | ) | (20 | ) | (15 | ) | (35 | ) | ||||||||||||
Time deposits in foreign offices and other time | 1 | (5 | ) | (4 | ) | |||||||||||||||||||
Total interest-bearing deposits | 21 | 57 | 78 | 18 | (37 | ) | (19 | ) | ||||||||||||||||
Borrowed funds | ||||||||||||||||||||||||
Federal funds purchased and repurchase agreements | (1 | ) | 1 | (3 | ) | (3 | ) | |||||||||||||||||
Federal Home Loan Bank borrowings | 31 | 31 | 31 | (3 | ) | 28 | ||||||||||||||||||
Bank notes and senior debt | 50 | (29 | ) | 21 | 44 | (33 | ) | 11 | ||||||||||||||||
Subordinated debt | 6 | 11 | 17 | 31 | (17 | ) | 14 | |||||||||||||||||
Commercial paper | (7 | ) | 3 | (4 | ) | (6 | ) | 4 | (2 | ) | ||||||||||||||
Other | 8 | (12 | ) | (4 | ) | 20 | (3 | ) | 17 | |||||||||||||||
Total borrowed funds | 86 | (25 | ) | 61 | 107 | (42 | ) | 65 | ||||||||||||||||
Total interest-bearing liabilities | 95 | 44 | 139 | 66 | (20 | ) | 46 | |||||||||||||||||
Change in net interest income | $ | 746 | $ | (986 | ) | $ | (240 | ) | $ | 767 | $ | (1,368 | ) | $ | (601 | ) | ||||||||
| (a) | Changes attributable to rate/volume are prorated into rate and volume components. |
| (b) | Interest income includes the effects of taxable-equivalent adjustments using a statutory federal income tax rate of 35% to increase tax-exempt interest income to a |
| taxable-equivalent | basis. The taxable-equivalent adjustments to interest income for the years ended December 31, 2015, 2014 and 2013 were $196 million, $189 million and $168 million, respectively. |
| 216 The PNC Financial Services Group, Inc. – Form 10-K |
LOANS SUMMARY
| December 31 – in millions | 2015 | 2014 | 2013 | 2012 (a) | 2011 | |||||||||||||||
Commercial lending | ||||||||||||||||||||
Commercial | $ | 98,608 | $ | 97,420 | $ | 88,378 | $ | 83,040 | $ | 65,694 | ||||||||||
Commercial real estate | 27,468 | 23,262 | 21,191 | 18,655 | 16,204 | |||||||||||||||
Equipment lease financing | 7,468 | 7,686 | 7,576 | 7,247 | 6,416 | |||||||||||||||
Total commercial lending | 133,544 | 128,368 | 117,145 | 108,942 | 88,314 | |||||||||||||||
Consumer lending | ||||||||||||||||||||
Home equity | 32,133 | 34,677 | 36,447 | 35,920 | 33,089 | |||||||||||||||
Residential real estate | 14,411 | 14,407 | 15,065 | 15,240 | 14,469 | |||||||||||||||
Credit card | 4,862 | 4,612 | 4,425 | 4,303 | 3,976 | |||||||||||||||
Other consumer | 21,746 | 22,753 | 22,531 | 21,451 | 19,166 | |||||||||||||||
Total consumer lending | 73,152 | 76,449 | 78,468 | 76,914 | 70,700 | |||||||||||||||
Total loans | $ | 206,696 | $ | 204,817 | $ | 195,613 | $ | 185,856 | $ | 159,014 | ||||||||||
| (a) | Includes the impact of the RBC Bank (USA) acquisition, which we acquired on March 2, 2012. |
TANGIBLE BOOK VALUE PER COMMON SHARE RATIO (NON-GAAP)
| December 31 – dollars in millions, except per share data | 2015 | 2014 | 2013 | 2012 | 2011 | |||||||||||||||
Book value per common share | $ | 81.84 | $ | 77.61 | $ | 72.07 | $ | 66.95 | $ | 61.44 | ||||||||||
Tangible book value per common share | ||||||||||||||||||||
Common shareholders' equity | $ | 41,258 | $ | 40,605 | $ | 38,392 | $ | 35,358 | $ | 32,374 | ||||||||||
Goodwill and Other Intangible Assets (a) | (9,482 | ) | (9,595 | ) | (9,654 | ) | (9,798 | ) | (9,027 | ) | ||||||||||
Deferred tax liabilities on Goodwill and Other | ||||||||||||||||||||
Intangible Assets (a) | 310 | 320 | 333 | 354 | 431 | |||||||||||||||
Tangible common shareholders' equity | $ | 32,086 | $ | 31,330 | $ | 29,071 | $ | 25,914 | $ | 23,778 | ||||||||||
Period-end common shares outstanding (in millions) | 504 | 523 | 533 | 528 | 527 | |||||||||||||||
Tangible book value per common share (Non-GAAP) (b) | $ | 63.65 | $ | 59.88 | $ | 54.57 | $ | 49.07 | $ | 45.13 | ||||||||||
| (a) | Excludes the impact from mortgage servicing rights of $1.6 billion, $1.4 billion, $1.6 billion, $1.1 billion, and $1.1 billion at December 31, 2015, 2014, 2013, 2012, and 2011, respectively. |
| (b) | We believe this non-GAAP financial measure serves as a useful tool to help evaluate the strength and discipline of a company's capital management strategies and as an additional conservative measure of total company value. |
FEE INCOME RECONCILIATION (NON-GAAP)
Year ended December 31 Dollars in millions | 2015 | 2014 | 2013 | |||||||||
Noninterest income | ||||||||||||
Asset management | $ | 1,567 | $ | 1,513 | $ | 1,342 | ||||||
Consumer services | 1,335 | 1,254 | 1,253 | |||||||||
Corporate services | 1,491 | 1,415 | 1,210 | |||||||||
Residential mortgage | 566 | 618 | 871 | |||||||||
Service charges on deposits | 651 | 662 | 597 | |||||||||
Total fee income | 5,610 | 5,462 | 5,273 | |||||||||
Net gains on sales of securities | 43 | 4 | 99 | |||||||||
Other | 1,294 | 1,384 | 1,493 | |||||||||
Total noninterest income | $ | 6,947 | $ | 6,850 | $ | 6,865 | ||||||
| The PNC Financial Services Group, Inc. – Form 10-K 217 |
NONPERFORMING ASSETS AND RELATED INFORMATION
| December 31 – dollars in millions | 2015 | 2014 | 2013 | 2012 | 2011 | |||||||||||||||
Nonperforming loans | ||||||||||||||||||||
Commercial | $ | 351 | $ | 290 | $ | 457 | $ | 590 | $ | 899 | ||||||||||
Commercial real estate | 187 | 334 | 518 | 807 | 1,345 | |||||||||||||||
Equipment lease financing | 7 | 2 | 5 | 13 | 22 | |||||||||||||||
Total commercial lending | 545 | 626 | 980 | 1,410 | 2,266 | |||||||||||||||
Consumer lending (a) | ||||||||||||||||||||
Home equity (b) (c) | 977 | 1,112 | 1,139 | 951 | 529 | |||||||||||||||
Residential real estate (b) | 549 | 706 | 904 | 845 | 726 | |||||||||||||||
Credit card (d) | 3 | 3 | 4 | 5 | 8 | |||||||||||||||
Other consumer (b) | 52 | 63 | 61 | 43 | 31 | |||||||||||||||
Total consumer lending (e) | 1,581 | 1,884 | 2,108 | 1,844 | 1,294 | |||||||||||||||
Total nonperforming loans (f) | 2,126 | 2,510 | 3,088 | 3,254 | 3,560 | |||||||||||||||
OREO and foreclosed assets | ||||||||||||||||||||
Other real estate owned (OREO) | 279 | 351 | 360 | 507 | 561 | |||||||||||||||
Foreclosed and other assets | 20 | 19 | 9 | 33 | 35 | |||||||||||||||
Total OREO and foreclosed assets | 299 | 370 | 369 | 540 | 596 | |||||||||||||||
Total nonperforming assets | $ | 2,425 | $ | 2,880 | $ | 3,457 | $ | 3,794 | $ | 4,156 | ||||||||||
Nonperforming loans to total loans | 1.03 | % | 1.23 | % | 1.58 | % | 1.75 | % | 2.24 | % | ||||||||||
Nonperforming assets to total loans, OREO and foreclosed assets | 1.17 | 1.40 | 1.76 | 2.04 | 2.60 | |||||||||||||||
Nonperforming assets to total assets | .68 | .83 | 1.08 | 1.24 | 1.53 | |||||||||||||||
Interest on nonperforming loans | ||||||||||||||||||||
Computed on original terms | $ | 115 | $ | 125 | $ | 163 | $ | 212 | $ | 278 | ||||||||||
Recognized prior to nonperforming status | 22 | 25 | 30 | 30 | 47 | |||||||||||||||
Troubled Debt Restructurings | ||||||||||||||||||||
Nonperforming | $ | 1,119 | $ | 1,370 | $ | 1,511 | $ | 1,589 | $ | 1,141 | ||||||||||
Performing | 1,232 | 1,213 | 1,228 | 1,270 | 1,062 | |||||||||||||||
Past due loans | ||||||||||||||||||||
Accruing loans past due 90 days or more (g) | $ | 881 | $ | 1,105 | $ | 1,491 | $ | 2,351 | $ | 2,973 | ||||||||||
As a percentage of total loans | .43 | % | .54 | % | .76 | % | 1.26 | % | 1.87 | % | ||||||||||
Past due loans held for sale | ||||||||||||||||||||
Accruing loans held for sale past due 90 days or more (h) | $ | 4 | $ | 9 | $ | 4 | $ | 38 | $ | 49 | ||||||||||
As a percentage of total loans held for sale | .29 | % | .40 | % | .18 | % | 1.03 | % | 1.67 | % | ||||||||||
| (a) | Excludes most consumer loans and lines of credit, not secured by residential real estate, which are charged off after 120 to 180 days past due and are not placed on nonperforming status. |
| (b) | Pursuant to alignment with interagency supervisory guidance on practices for loans and lines of credit related to consumer lending in the first quarter of 2013, nonperforming home equity loans increased $214 million, nonperforming residential mortgage loans increased $187 million and nonperforming other consumer loans increased $25 million. Charge-offs were taken on these loans where the fair value less costs to sell the collateral was less than the recorded investment of the loan and were $134 million. |
| (c) | In the first quarter of 2012, we adopted a policy stating that Home equity loans past due 90 days or more would be placed on nonaccrual status. Prior policy required that these loans be past due 180 days before being placed on nonaccrual status. |
| (d) | Effective in the second quarter 2011, the commercial nonaccrual policy was applied to certain small business credit card balances. This change resulted in loans being placed on nonaccrual status when they become 90 days or more past due. We continue to charge off these loans at 180 days past due. |
| (e) | Pursuant to regulatory guidance, issued in the third quarter of 2012, nonperforming consumer loans, primarily home equity and residential mortgage, increased $288 million in 2012 related to changes in treatment of certain loans classified as TDRs, net of charge-offs, resulting from bankruptcy where no formal reaffirmation was provided by the borrower and therefore a concession has been granted based upon discharge from personal liability. Charge-offs have been taken where the fair value less costs to sell the collateral was less than the recorded investment of the loan and were $128 million. |
| (f) | Nonperforming loans exclude certain government insured or guaranteed loans, loans held for sale, loans accounted for under the fair value option and purchased impaired loans. |
| (g) | Amounts include certain government insured or guaranteed consumer loans totaling $765 million, $996 million, $995 million, $2,236 million and $2,474 million at December 31, 2015, December 31, 2014, December 31, 2013, December 31, 2012 and December 31, 2011, respectively. Past due loan amounts exclude purchased impaired loans as they are considered current loans due to the accretion of interest income. |
| (h) | Amounts include certain government insured or guaranteed consumer loans held for sale totaling $4 million, $9 million, $4 million, zero, and $15 million at December 31, 2015, December 31, 2014, December 31, 2013, December 31, 2012 and December 31, 2011, respectively. |
| 218 The PNC Financial Services Group, Inc. – Form 10-K |
SUMMARY OF LOAN LOSS EXPERIENCE
| Year ended December 31 – dollars in millions | 2015 | 2014 | 2013 | 2012 | 2011 | |||||||||||||||
Allowance for loan and lease losses – January 1 | $ | 3,331 | $ | 3,609 | $ | 4,036 | $ | 4,347 | $ | 4,887 | ||||||||||
Charge-offs | ||||||||||||||||||||
Commercial | (206 | ) | (276 | ) | (395 | ) | (474 | ) | (700 | ) | ||||||||||
Commercial real estate | (44 | ) | (70 | ) | (203 | ) | (314 | ) | (464 | ) | ||||||||||
Equipment lease financing | (5 | ) | (14 | ) | (8 | ) | (16 | ) | (35 | ) | ||||||||||
Home equity | (181 | ) | (275 | ) | (486 | ) | (560 | ) | (484 | ) | ||||||||||
Residential real estate | (24 | ) | (40 | ) | (133 | ) | (110 | ) | (153 | ) | ||||||||||
Credit card | (160 | ) | (163 | ) | (178 | ) | (200 | ) | (235 | ) | ||||||||||
Other consumer | (185 | ) | (183 | ) | (185 | ) | (196 | ) | (193 | ) | ||||||||||
Total charge-offs | (805 | ) | (1,021 | ) | (1,588 | ) | (1,870 | ) | (2,264 | ) | ||||||||||
Recoveries | ||||||||||||||||||||
Commercial | 170 | 207 | 248 | 300 | 332 | |||||||||||||||
Commercial real estate | 66 | 84 | 93 | 115 | 105 | |||||||||||||||
Equipment lease financing | 4 | 14 | 16 | 30 | 50 | |||||||||||||||
Home equity | 93 | 78 | 73 | 61 | 48 | |||||||||||||||
Residential real estate | 13 | 26 | 4 | (1 | ) | 11 | ||||||||||||||
Credit card | 21 | 21 | 22 | 26 | 23 | |||||||||||||||
Other consumer | 52 | 60 | 55 | 50 | 56 | |||||||||||||||
Total recoveries | 419 | 490 | 511 | 581 | 625 | |||||||||||||||
Net charge-offs | (386 | ) | (531 | ) | (1,077 | ) | (1,289 | ) | (1,639 | ) | ||||||||||
Provision for credit losses | 255 | 273 | 643 | 987 | 1,152 | |||||||||||||||
Net change in allowance for unfunded loan commitments and letters of credit | (2 | ) | (17 | ) | 8 | (10 | ) | (52 | ) | |||||||||||
Write-off of purchased impaired loans (a) | (468 | ) | ||||||||||||||||||
Other | (3 | ) | (3 | ) | (1 | ) | 1 | (1 | ) | |||||||||||
Allowance for loan and lease losses – December 31 | $ | 2,727 | $ | 3,331 | $ | 3,609 | $ | 4,036 | $ | 4,347 | ||||||||||
Allowance as a percentage of December 31: | ||||||||||||||||||||
Loans (a) | 1.32 | % | 1.63 | % | 1.84 | % | 2.17 | % | 2.73 | % | ||||||||||
Nonperforming loans | 128 | 133 | 117 | 124 | 122 | |||||||||||||||
As a percentage of average loans | ||||||||||||||||||||
Net charge-offs | .19 | .27 | .57 | .73 | 1.08 | |||||||||||||||
Provision for credit losses | .12 | .14 | .34 | .56 | .76 | |||||||||||||||
Allowance for loan and lease losses (a) | 1.33 | 1.67 | 1.90 | 2.28 | 2.86 | |||||||||||||||
Allowance as a multiple of net charge-offs | 7.06x | 6.27x | 3.35x | 3.13x | 2.65x | |||||||||||||||
| (a) | A portion of the ALLL associated with purchased impaired pooled consumer and residential real estate loans was derecognized on December 31, 2015 due to the change in the derecognition policy for these loans. The December 31, 2015 ratio of ALLL to total loans was impacted by the derecognition. See Note 4 Purchased Loans for additional information. |
| The PNC Financial Services Group, Inc. – Form 10-K 219 |
The following table presents the assignment of the allowance for loan and lease losses and the categories of loans as a percentage of total loans. Changes in the allocation over time reflect the changes in loan portfolio composition, risk profile and refinements to reserve methodologies.
ALLOCATION OF ALLOWANCE FOR LOAN AND LEASE LOSSES
| 2015 | 2014 | 2013 | 2012 | 2011 | ||||||||||||||||||||||||||||||||||||||||||||
December 31 Dollars in millions | Allowance | Loans to Total Loans | Allowance | Loans to Total Loans | Allowance | Loans to Total Loans | Allowance | Loans to Total Loans | Allowance | Loans to Total Loans | ||||||||||||||||||||||||||||||||||||||
Commercial | $ | 1,286 | 47.7 | % | $ | 1,209 | 47.6 | % | $ | 1,100 | 45.2 | % | $ | 1,131 | 44.7 | % | $ | 1,180 | 41.3 | % | ||||||||||||||||||||||||||||
Commercial real estate | 281 | 13.3 | 318 | 11.4 | 400 | 10.8 | 589 | 10.0 | 753 | 10.2 | ||||||||||||||||||||||||||||||||||||||
Equipment lease financing | 38 | 3.6 | 44 | 3.7 | 47 | 3.9 | 54 | 3.9 | 62 | 4.0 | ||||||||||||||||||||||||||||||||||||||
Home equity | 484 | 15.5 | 872 | 16.9 | 1,051 | 18.6 | 1,044 | 19.3 | 1,095 | 20.8 | ||||||||||||||||||||||||||||||||||||||
Residential real estate | 307 | 7.0 | 561 | 7.0 | 642 | 7.7 | 847 | 8.2 | 894 | 9.1 | ||||||||||||||||||||||||||||||||||||||
Credit card | 167 | 2.4 | 173 | 2.3 | 169 | 2.3 | 199 | 2.3 | 202 | 2.5 | ||||||||||||||||||||||||||||||||||||||
Other consumer | 164 | 10.5 | 154 | 11.1 | 200 | 11.5 | 172 | 11.6 | 161 | 12.1 | ||||||||||||||||||||||||||||||||||||||
Total | $ | 2,727 | 100.0 | % | $ | 3,331 | 100.0 | % | $ | 3,609 | 100.0 | % | $ | 4,036 | 100.0 | % | $ | 4,347 | 100.0 | % | ||||||||||||||||||||||||||||
SELECTED LOAN MATURITIES AND INTEREST SENSITIVITY
December 31, 2015 In millions | 1 Year or Less | 1 Through 5 Years | After 5 Years | Gross Loans | ||||||||||||
Commercial | $ | 27,251 | $ | 61,342 | $ | 10,015 | $ | 98,608 | ||||||||
Commercial real estate – Real estate projects | 7,868 | 14,319 | 5,281 | 27,468 | ||||||||||||
Total | $ | 35,119 | $ | 75,661 | $ | 15,296 | $ | 126,076 | ||||||||
Loans with: | ||||||||||||||||
Predetermined rate | $ | 5,582 | $ | 10,866 | $ | 6,526 | $ | 22,974 | ||||||||
Floating or adjustable rate | 29,537 | 64,795 | 8,770 | 103,102 | ||||||||||||
Total | $ | 35,119 | $ | 75,661 | $ | 15,296 | $ | 126,076 | ||||||||
At December 31, 2015, we had no pay-fixed interest rate swaps designated to commercial loans as part of fair value hedge strategies. At December 31, 2015, $17.9 billion notional amount of receive-fixed interest rate swaps were designated as part of cash flow hedging strategies that converted the floating rate (1 month and 3 month LIBOR) on the underlying commercial loans to a fixed rate as part of risk management strategies.
TIME DEPOSITS
The aggregate amount of time deposits with a denomination of $100,000 or more was $9.4 billion at December 31, 2015 and $8.8 billion at December 31, 2014. Time deposits of $100,000 or more included time deposits in foreign offices of $2.9 billion at December 31, 2015. Domestic time deposits of $100,000 or more were $6.5 billion at December 31, 2015 with the following maturities:
| December 31, 2015 – in millions | Domestic Certificates of Deposit | |||
|
| |||
Three months or less | $ | 1,706 | ||
Over three through six months | 1,089 | |||
Over six through twelve months | 1,948 | |||
Over twelve months | 1,793 | |||
Total | $ | 6,536 | ||
COMMON STOCK PRICES/DIVIDENDS DECLARED
The table below sets forth by quarter the range of high and low sale and quarter-end closing prices for The PNC Financial Services Group, Inc. common stock and the cash dividends declared per common share.
| High | Low | Close | Cash Dividends Declared (a) | |||||||||||||
2015 Quarter | ||||||||||||||||
First | $ | 96.71 | $ | 81.84 | $ | 93.24 | $ | .48 | ||||||||
Second | 99.61 | 90.42 | 95.65 | .51 | ||||||||||||
Third | 100.52 | 82.77 | 89.20 | .51 | ||||||||||||
Fourth | 97.50 | 84.93 | 95.31 | .51 | ||||||||||||
Total | $ | 2.01 | ||||||||||||||
2014 Quarter | ||||||||||||||||
First | $ | 87.80 | $ | 76.06 | $ | 87.00 | $ | .44 | ||||||||
Second | 89.85 | 79.80 | 89.05 | .48 | ||||||||||||
Third | 90.00 | 80.43 | 85.58 | .48 | ||||||||||||
Fourth | 93.45 | 76.69 | 91.23 | .48 | ||||||||||||
Total | $ | 1.88 | ||||||||||||||
| (a) | Our Board approved a first quarter 2016 cash dividend of $.51 per common share, which was payable on February 5, 2016. |
| 220 The PNC Financial Services Group, Inc. – Form 10-K |
TRANSITIONAL BASEL III AND PRO FORMA FULLY PHASED-IN BASEL III COMMON EQUITY TIER 1 CAPITAL RATIOS – 2012-2014 PERIODS
PNC's regulatory risk-based capital ratios in 2014 were based on the definitions of, and deductions from, regulatory capital under the Basel III rules (as such definitions and deductions were phased-in for 2014) and Basel I risk-weighted assets (but subject to certain adjustments as defined by the Basel III rules). We refer to the 2014 capital ratios calculated using these phased-in Basel III provisions and Basel I risk-weighted assets as the 2014 Transitional Basel III ratios.
| 2014 Transitional Basel III | Pro forma Fully Phased-In Basel III (a) (b) | |||||||||||||||
| Dollars in millions | December 31 2014 | December 31 2014 | December 31 2013 | December 31 2012 | ||||||||||||
Common stock, related surplus and retained earnings, net of treasury stock | $ | 40,103 | $ | 40,103 | $ | 38,031 | $ | 34,579 | ||||||||
Less regulatory capital adjustments: | ||||||||||||||||
Goodwill and disallowed intangibles, net of deferred tax liabilities | (8,939 | ) | (9,276 | ) | (9,321 | ) | (9,445 | ) | ||||||||
Basel III total threshold deductions | (212 | ) | (1,081 | ) | (1,386 | ) | (2,330 | ) | ||||||||
Accumulated other comprehensive income (c) | 40 | 201 | 196 | 276 | ||||||||||||
All other adjustments | (63 | ) | (121 | ) | (64 | ) | (579 | ) | ||||||||
Estimated Basel III Common equity Tier 1 capital | $ | 30,929 | $ | 29,826 | $ | 27,456 | $ | 22,501 | ||||||||
Estimated Basel I risk-weighted assets calculated in accordance with transition rules (d) | $ | 284,018 | N/A | N/A | N/A | |||||||||||
Estimated Basel III standardized approach risk-weighted assets (e) | N/A | $ | 298,786 | $ | 291,977 | $ | N/A | |||||||||
Estimated Basel III advanced approaches risk-weighted assets (f) | N/A | $ | 285,870 | $ | 290,080 | $ | 301,006 | |||||||||
Estimated Basel III Common equity Tier 1 capital ratio | 10.9 | % | 10.0 | % | 9.4 | % | 7.5 | % | ||||||||
Risk weight and associated rules utilized | | Basel I (with 2014 transition | | Standardized | Advanced | |||||||||||
| (a) | PNC utilizes the pro forma fully phased-in Basel III capital ratios to assess its capital position (without the benefit of phase-ins), including comparison to similar estimates made by other financial institutions. |
| (b) | Basel III capital ratios and estimates may be impacted by additional regulatory guidance and, in the case of those ratios calculated using the advanced approaches, may be subject to variability based on the ongoing evolution, validation and regulatory approval of PNC's models that are integral to the calculation of advanced approaches risk-weighted assets as PNC moves through the parallel run process. |
| (c) | Represents net adjustments related to accumulated other comprehensive income for securities currently and previously held as available for sale, as well as pension and other postretirement plans. |
| (d) | Includes credit and market risk-weighted assets. |
| (e) | Basel III standardized approach risk-weighted assets were estimated based on the Basel III standardized approach rules and include credit and market risk-weighted assets. |
| (f) | Basel III advanced approaches risk-weighted assets were estimated based on the Basel III advanced approaches rules, and include credit, market and operational risk-weighted assets. |
BASEL I TIER 1 COMMON CAPITAL RATIO (a) (b)
| Dollars in millions | December 31 2013 | December 31 2012 | December 31 2011 | |||||||||
Basel I Tier 1 common capital | $ | 28,484 | $ | 24,951 | $ | 23,732 | ||||||
Basel I risk-weighted assets | 272,169 | 260,847 | 230,705 | |||||||||
Basel I Tier 1 common capital ratio | 10.5 | % | 9.6 | % | 10.3 | % | ||||||
| (a) | Effective January 1, 2014, the Basel I Tier 1 common capital ratio no longer applies to PNC (except for stress testing purposes). Our 2013 Form 10-K included additional information regarding our Basel I capital ratios. |
| (b) | Amounts have not been updated to reflect the first quarter 2014 adoption of ASU 2014-01 related to investments in low income housing tax credits. |
| The PNC Financial Services Group, Inc. – Form 10-K 221 |
ITEM 9 – CHANGES IN AND DISAGREEMENTS WITH ACCOUNTANTS ON ACCOUNTING AND FINANCIAL DISCLOSURE
None.
ITEM 9A – CONTROLS AND PROCEDURES
M ANAGEMENT ' S R EPORT ON I NTERNAL C ONTROL OVER F INANCIAL R EPORTING
The management of The PNC Financial Services Group, Inc. and subsidiaries (PNC) is responsible for establishing and maintaining adequate internal control over financial reporting, as such term is defined in the Exchange Act Rule 13a-15(f).
Because of inherent limitations, internal control over financial reporting may not prevent or detect misstatements. Also, projections of any evaluation of effectiveness to future periods are subject to the risk that controls may become inadequate because of changes in conditions, or that the degree of compliance with the policies or procedures may deteriorate.
We performed an evaluation under the supervision and with the participation of our management, including the Chairman, President and Chief Executive Officer and the Executive Vice President and Chief Financial Officer, of the effectiveness of PNC's internal control over financial reporting as of December 31, 2015. This assessment was based on criteria for effective internal control over financial reporting described in Internal Control-Integrated Framework (2013) issued by the Committee of Sponsoring Organizations of the Treadway Commission. Based on this assessment, management concluded that PNC maintained effective internal control over financial reporting as of December 31, 2015.
PricewaterhouseCoopers LLP, the independent registered public accounting firm that audited our consolidated financial statements as of and for the year ended December 31, 2015 included in this Report, has also audited the effectiveness of PNC's internal control over financial reporting as of December 31, 2015. The report of PricewaterhouseCoopers LLP is included under Item 8 of this Report.
D ISCLOSURE C ONTROLS AND P ROCEDURES AND C HANGES IN I NTERNAL C ONTROL OVER F INANCIAL R EPORTING
As of December 31, 2015, we performed an evaluation under the supervision and with the participation of our management, including the Chairman, President and Chief Executive Officer and the Executive Vice President and Chief Financial Officer, of the effectiveness of the design and operation of our disclosure controls and procedures and of changes in our internal control over financial reporting.
Based on that evaluation, our Chairman, President and Chief Executive Officer and our Executive Vice President and Chief Financial Officer concluded that our disclosure controls and procedures (as defined in Rule 13a-15(e) under the Securities and Exchange Act of 1934, as amended) were effective as of December 31, 2015, and that there has been no change in PNC's internal control over financial reporting that occurred during the fourth quarter of 2015 that has materially affected, or is reasonably likely to materially affect, our internal control over financial reporting.
ITEM 9B – OTHER INFORMATION
None.
PART III
ITEM 10 – DIRECTORS, EXECUTIVE OFFICERS AND CORPORATE GOVERNANCE
Certain of the information regarding our directors (or nominees for director), executive officers and Audit Committee (and Audit Committee financial experts), required by this item is included under the captions "Election of Directors (Item 1)," and "Corporate Governance – Board committees – Audit Committee," in our Proxy Statement to be filed for the 2016 annual meeting of shareholders and is incorporated herein by reference.
Additional information regarding our executive officers and our directors is included in Part I of this Report under the captions "Executive Officers of the Registrant" and "Directors of the Registrant."
Information regarding our compliance with Section 16(a) of the Securities Exchange Act of 1934 is included under the caption "Section 16(a) Beneficial Ownership Reporting Compliance" in our Proxy Statement to be filed for the 2016 annual meeting of shareholders and is incorporated herein by reference.
Certain information regarding our PNC Code of Business Conduct and Ethics required by this item is included under the caption "Corporate Governance–Our code of ethics" in our Proxy Statement to be filed for the 2016 annual meeting of shareholders and is incorporated herein by reference. Our PNC Code of Business Conduct and Ethics is available on our corporate website at www.pnc.com/corporategovernance. In addition, any future amendments to, or waivers from, a provision of the PNC Code of Business Conduct and Ethics that applies to our directors or executive officers (including our principal executive officer, principal financial officer, and principal accounting officer or controller) will be posted at this internet address.
| 222 The PNC Financial Services Group, Inc. – Form 10-K |
ITEM 11 – EXECUTIVE COMPENSATION
The information required by this item is included under the captions "Corporate Governance – Board committees – Personnel and Compensation Committee – Compensation committee interlocks and insider participation," "Director Compensation," "Compensation Discussion and Analysis," "Compensation Committee Report," "Compensation and Risk," "Compensation Tables," and "Change in Control and Termination of Employment" in our Proxy Statement to be filed for the 2016 annual meeting of shareholders and is incorporated herein by reference. In accordance with Item 407(e)(5) of Regulation S-K, the information set forth under the caption "Compensation Committee Report" in such Proxy Statement will be deemed to be furnished in this Report and will not be deemed to be incorporated by reference into any filing under the Securities Act or the Exchange Act as a result of furnishing the disclosure in this manner.
ITEM 12 – SECURITY OWNERSHIP OF CERTAIN BENEFICIAL OWNERS AND MANAGEMENT AND RELATED STOCKHOLDER MATTERS
The information required by this item regarding security ownership of certain beneficial owners and management is included under the caption "Security Ownership of Directors and Executive Officers" in our Proxy Statement to be filed for the 2016 annual meeting of shareholders and is incorporated herein by reference.
Information regarding our compensation plans under which PNC equity securities are authorized for issuance as of December 31, 2015 is included in a table (with introductory paragraph and notes) under the caption "Approval of 2016 Incentive Award Plan (Item 3)" in our Proxy Statement to be filed for the 2016 annual meeting of shareholders and is incorporated herein by reference. Included in the notes to that table, and incorporated herein by reference, is information regarding awards or portions of awards under our 2006 Incentive Award Plan that, by their terms, are payable only in cash. Additional information regarding these plans is included in Note 13 Stock Based Compensation Plans in the Notes To the Consolidated Financial Statements in Item 8 of this Report.
ITEM 13 – CERTAIN RELATIONSHIPS AND RELATED TRANSACTIONS, AND DIRECTOR INDEPENDENCE
The information required by this item is included under the captions "Director and Executive Officer Relationships – Director independence, – Transactions with directors, – Family relationships, and – Indemnification and advancement of costs" and "Related Person Transactions" in our Proxy Statement to be filed for the 2016 annual meeting of shareholders and is incorporated herein by reference.
ITEM 14 – PRINCIPAL ACCOUNTING FEES AND SERVICES
The information required by this item is included under the caption "Ratification of Independent Registered Public Accounting Firm (Item 2) – Audit, audit-related and permitted non-audit fees, – Procedures for pre-approving audit services, audit-related services and permitted non-audit services" in our Proxy Statement to be filed for the 2016 annual meeting of shareholders and is incorporated herein by reference.
PART IV
ITEM 15 – EXHIBITS, FINANCIAL STATEMENT SCHEDULES
F INANCIAL S TATEMENTS , F INANCIAL S TATEMENT S CHEDULES
Our consolidated financial statements required in response to this Item are incorporated by reference from Item 8 of this Report.
Audited consolidated financial statements of BlackRock, Inc. as of December 31, 2015 and 2014 and for each of the three years in the period ended December 31, 2015 are filed with this Report as Exhibit 99.1 and incorporated herein by reference.
E XHIBITS
Our exhibits listed on the Exhibit Index on pages E-1 through E-8 of this Form 10-K are filed with this Report or are incorporated herein by reference.
| The PNC Financial Services Group, Inc. – Form 10-K 223 |
SIGNATURES
Pursuant to the requirements of Section 13 or 15(d) of the Securities Exchange Act of 1934, the registrant has duly caused this report to be signed on its behalf by the undersigned, thereunto duly authorized.
The PNC Financial Services Group, Inc.
(Registrant)
By: | /s/ Robert Q. Reilly | |
| Robert Q. Reilly | ||
| Executive Vice President and Chief Financial Officer | ||
| February 26, 2016 |
Pursuant to the requirements of the Securities Exchange Act of 1934, this report has been signed below by the following persons on behalf of The PNC Financial Services Group, Inc. and in the capacities indicated on February 26, 2016.
Signature | Capacities | |
/s/ William S. Demchak William S. Demchak | Chairman, President, Chief Executive Officer and Director (Principal Executive Officer) | |
/s/ Robert Q. Reilly Robert Q. Reilly | Executive Vice President and Chief Financial Officer (Principal Financial Officer) | |
/s/ Gregory H. Kozich Gregory H. Kozich | Senior Vice President and Controller | |
| * Charles E. Bunch; Paul W. Chellgren; Marjorie Rodgers Cheshire; Andrew T. Feldstein; Daniel R. Hesse; Kay Coles James; Richard B. Kelson; Anthony A. Massaro; Jane G. Pepper; Donald J. Shepard; Lorene K. Steffes; Dennis F. Strigl; Thomas J. Usher; Michael J. Ward; Gregory D. Wasson | Directors | |
*By: | /s/ Christi Davis | |
Christi Davis, Attorney-in-Fact, |
| 224 The PNC Financial Services Group, Inc. – Form 10-K |
E XHIBIT I NDEX
Exhibit No. | Description | Method of Filing + | ||
| 3.1.1 | Amended and Restated Articles of Incorporation of the Corporation, effective January 2, 2009 | Incorporated herein by reference to Exhibit 3.1 to the Corporation's Annual Report on Form 10-K for the year ended December 31, 2008 (2008 Form 10-K) | ||
| 3.1.2 | Statement with Respect to Shares of Fixed-to-Floating Rate Non-Cumulative Perpetual Preferred Stock, Series O dated July 21, 2011 | Incorporated herein by reference to Exhibit 3.1 of the Corporation's Current Report on Form 8-K filed July 27, 2011 | ||
| 3.1.3 | Statement with Respect to Shares of Fixed-to-Floating Rate Non-Cumulative Perpetual Preferred Stock, Series P dated April 19, 2012 | Incorporated herein by reference to Exhibit 3.1 of the Corporation's Current Report on Form 8-K filed April 24, 2012 | ||
| 3.1.4 | Statement with Respect to Shares of 5.375% Non-Cumulative Perpetual Preferred Stock, Series Q dated September 14, 2012 | Incorporated herein by reference to Exhibit 3.1 of the Corporation's Current Report on Form 8-K filed September 21, 2012 | ||
| 3.1.5 | Statement with Respect to Shares of Fixed-to-Floating Rate Non-Cumulative Perpetual Preferred Stock, Series R dated May 2, 2013 | Incorporated herein by reference to Exhibit 3.1 of the Corporation's Current Report on Form 8-K filed May 7, 2013 | ||
| 3.1.6 | Amendment to Amended and Restated Articles of Incorporation of the Corporation, effective November 19, 2015 | Incorporated herein by reference to Exhibit 3.1.6 of the Corporation's Current Report on Form 8-K filed November 20, 2015 | ||
| 3.2 | By-Laws of the Corporation, as amended and restated, effective November 19, 2015 | Incorporated herein by reference to Exhibit 3.3 of the Corporation's Current Report on Form 8-K filed November 20, 2015 | ||
| 4.1 | There are no instruments with respect to long-term debt of the Corporation and its subsidiaries that involve a total amount of securities authorized thereunder that exceed 10 percent of the total assets of the Corporation and its subsidiaries on a consolidated basis. The Corporation agrees to provide the SEC with a copy of instruments defining the rights of holders of long-term debt of the Corporation and its subsidiaries on request. | |||
| 4.2 | Terms of $1.80 Cumulative Convertible Preferred Stock, Series B | Incorporated herein by reference to Exhibit 3.1 the Corporation's 2008 Form 10-K | ||
| 4.3 | Terms of 7.00% Non-Cumulative Preferred Stock, Series H | Incorporated herein by reference to Exhibit 3.1 the Corporation's 2008 Form 10-K | ||
| 4.4 | Terms of Fixed-to-Floating Rate Non-Cumulative Perpetual Preferred Stock, Series I | Incorporated herein by reference to Exhibit 3.1 the Corporation's 2008 Form 10-K | ||
| 4.5 | Terms of Fixed-to-Floating Non-Cumulative Perpetual Preferred Stock, Series K | Incorporated herein by reference to Exhibit 3.1 the Corporation's 2008 Form 10-K | ||
| 4.6 | Terms of Fixed-to-Floating Rate Non-Cumulative Perpetual Preferred Stock, Series O | Incorporated herein by reference to Exhibit 3.1 of the Corporation's Current Report on Form 8-K filed July 27, 2011 | ||
| 4.7 | Statement with Respect to Shares of Fixed-to-Floating Rate Non-Cumulative Perpetual Preferred Stock, Series P dated April 19, 2012 | Incorporated herein by reference to Exhibit 3.1 of the Corporation's Current Report on Form 8-K filed April 24, 2012 | ||
| 4.8 | Statement with Respect to Shares of 5.375% Non-Cumulative Perpetual Preferred Stock, Series Q dated September 14, 2012 | Incorporated herein by reference to Exhibit 3.1 of the Corporation's Current Report on Form 8-K filed September 21, 2012 | ||
The PNC Financial Services Group, Inc. – Form 10-K E-1
| 4.9 | Statement with Respect to Shares of Fixed-to-Floating Rate Non-Cumulative Perpetual Preferred Stock, Series R dated May 2, 2013 | Incorporated herein by reference to Exhibit 3.1 of the Corporation's Current Report on Form 8-K filed May 7, 2013 | ||
| 4.10 | Warrants for Purchase of Shares of PNC Common Stock | Incorporated herein by reference to Exhibit 4.2 (included as part of Exhibit 4.1) of the Corporation's Form 8-A filed April 30, 2010 | ||
| 4.11 | Deposit Agreement dated May 21, 2008, between the Corporation, PNC Bank, National Association, and the holders from time to time of the Depositary Receipts representing interests in the Series K preferred stock | Incorporated herein by reference to Exhibit 4.3 of the Corporation's Current Report on Form 8-K filed May 27, 2008 | ||
| 4.12 | Deposit Agreement dated July 27, 2011, between the Corporation, Computershare Trust Company, N.A., Computershare Inc. and the holders from time to time of the Depositary Receipts representing interests in the Series O preferred stock | Incorporated herein by reference to Exhibit 4.2 of the Corporation's Current Report on Form 8-K filed July 27, 2011 | ||
| 4.13 | Deposit Agreement, dated April 24, 2012, between the Corporation, Computershare Trust Company, N.A., Computershare Inc. and the holders from time to time of the Depositary Receipts representing interests in the Series P preferred stock | Incorporated herein by reference to Exhibit 4.2 of the Corporation's Current Report on Form 8-K filed April 24, 2012 | ||
| 4.14 | Deposit Agreement, dated September 21, 2012, between the Corporation, Computershare Trust Company, N.A., Computershare Inc. and the holders from time to time of the Depositary Receipts representing interests in the Series Q preferred stock | Incorporated by reference to Exhibit 4.2 of the Corporation's Current Report on Form 8-K filed September 21, 2012 | ||
| 4.15 | Deposit Agreement, dated May 7, 2013, between the Corporation, Computershare Trust Company, N.A., Computershare Inc. and the holders from time to time of the Depositary Receipts representing interests in the Series R preferred stock | Incorporated herein by reference to Exhibit 4.2 of the Corporation's Current Report on Form 8-K filed May 7, 2013 | ||
| 4.16 | Form of PNC Bank, National Association Global Bank Note for Fixed Rate Global Senior Bank Note issued prior to January 16, 2014 with Maturity of more than Nine Months from Date of Issuance | Incorporated herein by reference to Exhibit 4.9 of the Corporation's Quarterly Report on Form 10-Q for the quarter ended September 30, 2004 (3rd Quarter 2004 Form 10-Q) | ||
| 4.17 | Form of PNC Bank, National Association Global Bank Note for Floating Rate Global Senior Bank Note issued prior to January 16, 2014 with Maturity of more than Nine Months from Date of Issuance | Incorporated herein by reference to Exhibit 4.10 of the Corporation's 3rd Quarter 2004 Form 10-Q | ||
| 4.18 | Form of PNC Bank, National Association Global Bank Note for Fixed Rate Global Subordinated Bank Note issued prior to January 16, 2014 with Maturity of more than Nine Months from Date of Issuance | Incorporated herein by reference to Exhibit 4.11 of the Corporation's 3rd Quarter 2004 Form 10-Q | ||
| 4.19 | Form of PNC Bank, National Association Global Bank Note for Floating Rate Global Subordinated Bank Note issued prior to January 16, 2014 with Maturity of more than Nine Months from Date of Issuance | Incorporated herein by reference to Exhibit 4.12 of the Corporation's 3rd Quarter 2004 Form 10-Q | ||
| 4.20.1 | Issuing and Paying Agency Agreement, dated January 16, 2014, between PNC Bank, National Association and PNC Bank, National Association, relating to the $25 billion Global Bank Note Program for the Issue of Senior and Subordinated Bank Notes | Incorporated by reference to Exhibit 4.25 of the Corporation's Annual Report on Form 10-K for the year ended December 31, 2013 (2013 Form 10-K) | ||
E-2 The PNC Financial Services Group, Inc. – Form 10-K
| 4.20.2 | Amendment No. 1 to Issuing and Paying Agency Agreement, dated May 22, 2015, between PNC Bank, National Association and PNC Bank, National Association, relating to the $30 billion Global Bank Note Program for the Issue of Senior and Subordinated Bank Notes | Incorporated by reference to Exhibit 4.21.2 of the Corporation's Quarterly Report on Form 10-Q for the quarter ended June 30, 2015 (2nd Quarter 2015 Form 10-Q) | ||
| 4.21 | Form of PNC Bank, National Association Global Bank Note for Fixed Rate Global Senior Bank Note issued after January 16, 2014 with Maturity of more than Nine Months from Date of Issuance (included in Exhibit 4.20.1) | Incorporated by reference to Exhibit 4.25 of the Corporation's 2013 Form 10-K | ||
| 4.22 | Form of PNC Bank, National Association Global Bank Note for Floating Rate Global Senior Bank Note issued after January 16, 2014 with Maturity of more than Nine Months from Date of Issuance (included in Exhibit 4.20.1) | Incorporated by reference to Exhibit 4.25 of the Corporation's 2013 Form 10-K | ||
| 4.23 | Form of PNC Bank, National Association Global Bank Note for Extendible Floating Rate Global Senior Bank Note issued after January 16, 2014 with Maturity of more than Nine Months from Date of Issuance | Incorporated by reference to Exhibit 4.28 of the Corporation's 2013 Form 10-K | ||
| 4.24 | Form of PNC Bank, National Association Global Bank Note for Fixed Rate Global Subordinated Bank Note issued after January 16, 2014 but before May 22, 2015 with Maturity of five years or more from Date of Issuance (included in Exhibit 4.20.1) | Incorporated by reference to Exhibit 4.25 of the Corporation's 2013 Form 10-K | ||
| 4.25 | Form of PNC Bank, National Association Global Bank Note for Fixed Rate Global Subordinated Bank Note issued on or after May 22, 2015 with Maturity of five years or more from Date of Issuance (included in Exhibit 4.20.2) | Incorporated by reference to Exhibit 4.21.2 of the Corporation's 2nd Quarter 2015 Form 10-Q | ||
| 4.26 | Form of PNC Bank, National Association Global Bank Note for Floating Rate Global Subordinated Bank Note issued after January 16, 2014 but before May 22, 2015 with Maturity of five years or more from Date of Issuance (included in Exhibit 4.20.1) | Incorporated by reference to Exhibit 4.25 of the Corporation's 2013 Form 10-K | ||
| 4.27 | Form of PNC Bank, National Association Global Bank Note for Floating Rate Global Subordinated Bank Note issued on or after May 22, 2015 with Maturity of five years or more from Date of Issuance (included in Exhibit 4.20.2) | Incorporated herein by reference to Exhibit 4.21.2 of the Corporation's 2nd Quarter 2015 Form 10-Q | ||
| 4.28 | Exchange Agreement, dated as of March 29, 2007, by and among the Corporation, PNC Bank, National Association, and PNC Preferred Funding Trust II | Incorporated herein by reference to Exhibit 4.16 of the Corporation's Current Report on Form 8-K filed March 30, 2007 | ||
| 10.1.1 | The Corporation's Supplemental Executive Retirement Plan, as amended and restated effective January 1, 2009 | Incorporated herein by reference to Exhibit 10.2 to the Corporation's 2008 Form 10-K* | ||
| 10.1.2 | Amendment 2009-1 to the Corporation's Supplemental Executive Retirement Plan as amended and restated as of January 1, 2009 | Incorporated herein by reference to Exhibit 10.3 to the Corporation's Annual Report on Form 10-K for the year ended December 31, 2009 (2009 Form 10-K)* | ||
| 10.1.3 | Amendment 2013-1 to the Corporation's Supplemental Executive Retirement Plan as amended and restated as of January 1, 2009 | Incorporated by reference to Exhibit 10.1.3 of the Corporation's 2013 Form 10-K* | ||
The PNC Financial Services Group, Inc. – Form 10-K E-3
| 10.2.1 | The Corporation's ERISA Excess Pension Plan, as amended and restated effective January 1, 2009 | Incorporated herein by reference to Exhibit 10.4 to the Corporation's 2008 Form 10-K* | ||
| 10.2.2 | Amendment 2009-1 to the Corporation's ERISA Excess Plan as amended and restated effective January 1, 2009 | Incorporated herein by reference to Exhibit 10.6 to the Corporation's 2009 Form 10-K* | ||
| 10.2.3 | Amendment 2011-1 to the Corporation's ERISA Excess Pension Plan, as amended and restated effective January 1, 2009 | Incorporated herein by reference to Exhibit 10.8 to the Corporation's Annual Report on Form 10-K for the year ended December 31, 2011 (2011 Form 10-K)* | ||
| 10.2.4 | Amendment 2013-1 to the Corporation's ERISA Excess Pension Plan, as amended and restated effective January 1, 2009 | Incorporated by reference to Exhibit 10.2.4 of the Corporation's 2013 Form 10-K* | ||
| 10.3.1 | The Corporation's Key Executive Equity Program, as amended and restated effective January 1, 2009 | Incorporated herein by reference to Exhibit 10.6 to the Corporation's 2008 Form 10-K* | ||
| 10.3.2 | Amendment 2009-1 to the Corporation's Key Executive Equity Program as amended and restated as of January 1, 2009 | Incorporated herein by reference to Exhibit 10.9 to the Corporation's 2009 Form 10-K* | ||
| 10.4.1 | The Corporation's Supplemental Incentive Savings Plan, as amended and restated effective January 1, 2010 | Incorporated herein by reference to Exhibit 10.17 of the Corporation's 2011 Form 10-K* | ||
| 10.4.2 | Amendment 2013-1 to the Corporation's Supplemental Incentive Savings Plan, as amended and restated effective January 1, 2010 | Incorporated by reference to Exhibit 10.4.2 of the Corporation's 2013 Form 10-K* | ||
| 10.5.1 | The Corporation and Affiliates Deferred Compensation Plan, as amended and restated May 5, 2009 | Incorporated herein by reference to Exhibit 10.62 to the Corporation's 2nd Quarter 2009 Form 10-Q* | ||
| 10.5.2 | Amendment 2009-1 to the Corporation and Affiliates Deferred Compensation Plan, as amended and restated May 5, 2009 | Incorporated herein by reference to Exhibit 10.17 to the Corporation's 2009 Form 10-K* | ||
| 10.5.3 | Amendment 2010-1 to the Corporation and Affiliates Deferred Compensation Plan, as amended and restated May 5, 2009 | Incorporated herein by reference to Exhibit 10.20 of the Corporation's 2010 Form 10-K* | ||
| 10.5.4 | Amendment 2011-1 to the Corporation and Affiliates Deferred Compensation Plan, as amended and restated May 5, 2009 | Incorporated herein by reference to Exhibit 10.23 of the Corporation's 2011 Form 10-K* | ||
| 10.5.5 | Amendment 2012-1 to the Corporation and Affiliates Deferred Compensation Plan, as amended and restated May 5, 2009 | Incorporated herein by reference to Exhibit 10.24 to the Corporation's Annual Report on Form 10-K for the year ended December 31, 2012 (2012 Form 10-K)* | ||
| 10.5.6 | Amendment 2013-1 to the Corporation and Affiliates Deferred Compensation Plan, as amended and restated May 5, 2009 | Incorporated by reference to Exhibit 10.5.6 of the Corporation's 2013 Form 10-K* | ||
| 10.6.1 | The Corporation and Affiliates Deferred Compensation and Incentive Plan, effective as of January 1, 2012 | Incorporated herein by reference to Exhibit 4.4 of the Corporation's Registration Statement on Form S-8 No. 333-177896 filed November 10, 2011* | ||
| 10.6.2 | Amendment 2013-1 to the Corporation and Affiliates Deferred Compensation and Incentive Plan, effective as of January 1, 2012 | Incorporated by reference to Exhibit 10.6.2 of the Corporation's 2013 Form 10-K* | ||
| 10.7.1 | The Corporation's 2006 Incentive Award Plan, as amended and restated effective as of March 11, 2011 | Incorporated herein by reference to Exhibit 10.70 of the Corporation's Quarterly Report on Form 1O-Q for the quarter ended March 31, 2011 (1st Quarter 2011 Form 10-Q)* | ||
| 10.7.2 | Addendum to the Corporation's 2006 Incentive Award Plan, effective as of January 26, 2012 | Incorporated herein by reference to Exhibit 10.28 of the Corporation's 2011 Form 10-K* | ||
E-4 The PNC Financial Services Group, Inc. – Form 10-K
| 10.8 | The Corporation's 1997 Long-Term Incentive Award Plan, as amended and restated | Incorporated herein by reference to Exhibit 10.5 of the Corporation's 2nd Quarter 2004 Form 10-Q* | ||
| 10.9 | The Corporation's 1996 Executive Incentive Award Plan, as amended and restated effective as of January 1, 2007 | Incorporated herein by reference to Exhibit 10.10 of the Corporation's Annual Report on Form 10-K for the year ended December 31, 2007 (2007 Form 10-K)* | ||
| 10.10 | The Corporation's Directors Deferred Compensation Plan, as amended and restated effective January 1, 2012 | Incorporated herein by reference to Exhibit 10.32 of the Corporation's 2011 Form 10-K* | ||
| 10.11 | The Corporation's Directors Deferred Compensation Plan, as amended and restated effective January 1, 2015 | Incorporated herein by reference to Exhibit 10.52 of the Corporation's Quarterly Report on Form 10-Q for the quarter ended September 30, 2014 (3rd Quarter 2014 10-Q)* | ||
| 10.12 | The Corporation's Outside Directors Deferred Stock Unit Plan, as amended and restated effective January 1, 2012 | Incorporated herein by reference to Exhibit 10.34 of the Corporation's 2011 Form 10-K* | ||
| 10.13 | The Corporation's Outside Directors Deferred Stock Unit Plan, as amended and restated effective January 1, 2015 | Incorporated herein by reference to Exhibit 10.53 of the Corporation's 3rd Quarter 2014 10-Q* | ||
| 10.14 | Amended and Restated Trust Agreement between PNC Investment Corp., as settlor, and Hershey Trust Company, as trustee | Incorporated herein by reference to Exhibit 10.35 of the Corporation's Quarterly Report on Form 10-Q for the quarter ended September 30, 2005 (3rd Quarter 2005 Form 10-Q)* | ||
| 10.15 | Trust Agreement between PNC Investment Corp., as settlor, and PNC Bank, National Association, as trustee | Incorporated herein by reference to Exhibit 10.34 of the Corporation's 3rd Quarter 2005 Form 10-Q* | ||
| 10.16 | Certificate of Corporate Action for Grantor Trusts effective January 1, 2012 | Incorporated herein by reference to Exhibit 10.37 of the Corporation's 2011 Form 10-K* | ||
| 10.17 | The Corporation's Employee Stock Purchase Plan, as amended and restated as of January 1, 2014 | Incorporated by reference to Exhibit 10.16 of the Corporation's 2013 Form 10-K | ||
| 10.18 | 2006 forms of restricted deferral agreements | Incorporated herein by reference to the restricted deferral agreements portions of Exhibit 10.17 of the Corporation's 2005 Form 10-K* | ||
| 10.19 | Forms of employee stock option agreements under 2006 Incentive Award Plan | Incorporated by reference to the employee stock option agreements portion of Exhibit 10.40 of the Corporation's Quarterly Report on Form 10-Q for the quarter ended June 30, 2006* | ||
| 10.20 | 2006 forms of senior officer change in control severance agreements | Incorporated herein by reference to the senior officer change in control severance agreements portion of Exhibit 10.20 of the Corporation's Annual Report on Form 10-K for the year ended December 31, 2006 as filed on March 1, 2007 (2006 Form 10-K)* | ||
| 10.21 | 2007 forms of employee stock option agreements | Incorporated herein by reference to the employee stock option agreements portion of Exhibit 10.21 of the Corporation's 2006 Form 10-K* | ||
| 10.22 | 2008 forms of employee stock option and restricted share unit agreements | Incorporated herein by reference to the employee stock option and restricted share units agreements portions of Exhibit 10.26 of the Corporation's 2007 Form 10-K* | ||
| 10.23 | Form of employee stock option agreement with varied vesting schedule or circumstances | Incorporated herein by reference to Exhibit 10.50 of the Corporation's Current Report on Form 8-K filed April 18, 2008* | ||
The PNC Financial Services Group, Inc. – Form 10-K E-5
| 10.24 | Form of employee restricted stock agreement with varied vesting schedule or circumstances | Incorporated herein by reference to Exhibit 10.51 of the Corporation's Current Report on Form 8-K filed April 18, 2008* | ||
| 10.25 | Form of employee stock option agreement with performance vesting schedule | Incorporated herein by reference to Exhibit 10.54 of the Corporation's Quarterly Report on Form 10-Q for the quarter ended June 30, 2008* | ||
| 10.26 | 2009 forms of employee stock option, restricted stock and restricted share unit agreements | Incorporated by reference to the employee stock option, restricted stock and restricted share unit agreements portions of Exhibit 10.61 to the Corporation's Quarterly Report on Form 10-Q for the quarter ended March 31, 2009* | ||
| 10.27 | 2010 forms of employee stock option, restricted stock, and restricted share unit agreements | Incorporated herein by reference to Exhibit 10.48 to the Corporation's 2009 Form 10-K* | ||
| 10.28 | 2011 forms of employee stock option, restricted stock, restricted share unit and performance unit agreements | Incorporated herein by reference to Exhibit 10.71 of the Corporation's 1st Quarter 2011 Form 10-Q* | ||
| 10.29 | 2012 forms of employee stock option, restricted stock and restricted share unit agreements | Incorporated herein by reference to Exhibit 10.77 of the Corporation's Quarterly Report on Form 10-Q for the quarter ended March 31, 2012 (1st Quarter 2012 Form 10-Q)* | ||
| 10.30 | Forms of employee stock option, restricted stock and restricted share unit agreements with varied vesting, payment and other circumstances | Incorporated herein by reference to Exhibit 10.78 of the Corporation's 1st Quarter 2012 Form 10-Q* | ||
| 10.31 | Additional 2012 forms of employee performance unit, restricted stock and restricted share unit agreements | Incorporated herein by reference to Exhibit 10.79 of the Corporation's Quarterly Report on Form 10-Q for the quarter ended June 30, 2012 (2nd Quarter 2012 Form 10-Q)* | ||
| 10.32 | 2013 forms of employee stock option and restricted share unit agreements | Incorporated herein by reference to Exhibit 10.64 of the Corporation's 2012 Form 10-K* | ||
| 10.33 | Additional 2013 forms of employee stock option, performance unit, restricted stock and restricted share unit agreements | Incorporated herein by reference to Exhibit 10.82 of the Corporation's Quarterly Report on Form 10-Q for the quarter ended June 30, 2013* | ||
| 10.34 | Additional 2013 forms of employee restricted share unit agreements | Incorporated by reference to Exhibit 10.83 of the Corporation's Quarterly Report on Form 10-Q for the quarter ended September 30, 2013* | ||
| 10.35 | Additional 2013 and 2014 forms of employee restricted share unit and performance unit agreements | Incorporated by reference to Exhibit 10.36 of the Corporation's 2013 Form 10-K* | ||
| 10.36 | Additional 2014 Forms of Employee Performance Unit and Restricted Share Unit Agreements | Incorporated herein by reference to Exhibit 10.50 of the Corporation's Quarterly Report on Form 10-Q for the quarter ended June 30, 2014* | ||
| 10.37 | Additional 2014 Forms of Employee Restricted Share Unit Agreements | Incorporated herein by reference to Exhibit 10.51 of the Corporation's 3rd Quarter 2014 10-Q* | ||
| 10.38 | 2015 Forms of Performance Restricted Share Unit Award Agreements | Incorporated herein by reference to Exhibit 10.50 of the Corporation's 2nd Quarter 2015 Form 10-Q | ||
| 10.39 | 2015 Forms of Incentive Performance Unit Award Agreements | Incorporated herein by reference to Exhibit 10.51 of the Corporation's 2nd Quarter 2015 Form 10-Q | ||
| 10.40 | 2015 Forms of Restricted Share Unit Award Agreements | Incorporated herein by reference to Exhibit 10.52 of the Corporation's 2nd Quarter 2015 Form 10-Q | ||
| 10.41 | Form of time sharing agreements between the Corporation and certain executives | Incorporated herein by reference to Exhibit 10.39 to the Corporation's 2008 Form 10-K* | ||
E-6 The PNC Financial Services Group, Inc. – Form 10-K
| 10.42 | Form of Time-Sharing Agreement between the Corporation and certain executives | Incorporated by reference to Exhibit 10.49 of the Corporation's Current Report on Form 8-K filed April 4, 2014* | ||
| 10.43 | Form of change of control employment agreements | Incorporated herein by reference to Exhibit 10.72 of the Corporation's 1st Quarter 2011 Form 10-Q* | ||
| 10.44.1 | The National City Corporation 2004 Deferred Compensation Plan, as amended and restated effective January 1, 2005 | Incorporated herein by reference to Exhibit 10.35 to National City Corporation's Quarterly Report on Form 10-Q for the quarter ended March 31, 2006 | ||
| 10.44.2 | Amendment to The National City Corporation 2004 Deferred Compensation Plan, as amended and restated effective January 1, 2005 | Incorporated herein by reference to Exhibit 10.56 of the Corporation's 2010 Form 10-K | ||
| 10.45.1 | Share Surrender Agreement, dated October 10, 2002, among Old BlackRock, PNC Asset Management, Inc., and the Corporation | Incorporated herein by reference to the Quarterly Report on Form 10-Q of BlackRock Holdco 2, Inc. (Commission File No. 001-15305) (referred to herein as Old BlackRock) for the quarter ended September 30, 2002 (Old BlackRock 3rd Quarter 2002 Form 10-Q) | ||
| 10.45.2 | First Amendment, dated as of February 15, 2006, to the Share Surrender Agreement among Old BlackRock, PNC Bancorp, Inc. and the Corporation | Incorporated herein by reference to the Current Report on Form 8-K of Old BlackRock (Commission File No. 001-15305) filed February 22, 2006 (Old BlackRock February 22, 2006 Form 8-K) | ||
| 10.45.3 | Second Amendment to Share Surrender Agreement made and entered into as of June 11, 2007 by and between the Corporation, BlackRock, Inc., and PNC Bancorp, Inc. | Incorporated herein by reference to Exhibit 10.50 of the Corporation's Current Report on Form 8-K filed June 14, 2007 | ||
| 10.45.4 | Third Amendment to Share Surrender Agreement, dated as of February 27, 2009, between the Corporation and BlackRock, Inc. | Incorporated herein by reference to Exhibit 10.3 of BlackRock, Inc.'s Current Report on Form 8-K filed February 27, 2009 | ||
| 10.45.5 | Fourth Amendment to Share Surrender Agreement, dated as of August 7, 2012, among BlackRock, Inc., the Corporation and PNC Bancorp, Inc. | Incorporated herein by reference to Exhibit 10.1 of BlackRock, Inc.'s Form 10-Q for the quarter ended June 30, 2012 | ||
| 10.46.1 | Amended and Restated Implementation and Stockholder Agreement, dated as of February 27, 2009, between the Corporation and BlackRock, Inc. | Incorporated herein by reference to Exhibit 10.2 of BlackRock, Inc.'s Current Report on Form 8-K filed February 27, 2009 | ||
| 10.46.2 | Amendment No. 1, dated as of June 11, 2009, to the Amended and Restated Implementation and Stockholder Agreement between the Corporation and BlackRock, Inc. | Incorporated herein by reference to Exhibit 10.2 of BlackRock, Inc.'s Current Report on Form 8-K filed June 17, 2009 | ||
| 10.47 | Exchange Agreement dated as of May 21, 2012 by and among PNC Bancorp, Inc., the Corporation and BlackRock, Inc. | Incorporated herein by reference to Exhibit 10.3 of BlackRock, Inc.'s Current Report on Form 8-K filed May 23, 2012 | ||
| 10.48.1 | Distribution Agreement, dated January 16, 2014, between PNC Bank, National Association and the Dealers named therein, relating to the $25 billion Global Bank Note Program for the Issue of Senior and Subordinated Bank Notes | Incorporated by reference to Exhibit 10.47 of the Corporation's Annual Report on Form 10-K for the year ended December 31, 2014 | ||
| 10.48.2 | Amendment No. 1 to Distribution Agreement, dated May 22, 2015, between PNC Bank, National Association and the Dealers named therein, relating to the $30 billion Global Bank Note Program for the Issue of Senior and Subordinated Bank Notes | Incorporated herein by reference to Exhibit 10.47.2 of the Corporation's 2nd Quarter 2015 Form 10-Q | ||
The PNC Financial Services Group, Inc. – Form 10-K E-7
| 10.49 | Stock Purchase Agreement, dated as of February 1, 2010, by and between the Corporation and The Bank of New York Mellon Corporation | Incorporated herein by reference to Exhibit 2.1 to the Corporation's Current Report on Form 8-K filed February 3, 2010 | ||
| 12.1 | Computation of Ratio of Earnings to Fixed Charges | Filed herewith | ||
| 12.2 | Computation of Ratio of Earnings to Fixed Charges and Preferred Dividends | Filed herewith | ||
| 21 | Schedule of Certain Subsidiaries of the Corporation | Filed herewith | ||
| 23.1 | Consent of PricewaterhouseCoopers LLP, the Corporation's Independent Registered Public Accounting Firm | Filed herewith | ||
| 23.2 | Consent of Deloitte & Touche LLP, Independent Registered Public Accounting Firm of BlackRock, Inc. | Filed herewith | ||
| 24 | Powers of Attorney | Filed herewith | ||
| 31.1 | Certification of Chief Executive Officer pursuant to Section 302 of the Sarbanes-Oxley Act of 2002 | Filed herewith | ||
| 31.2 | Certification of Chief Financial Officer pursuant to Section 302 of the Sarbanes-Oxley Act of 2002 | Filed herewith | ||
| 32.1 | Certification of Chief Executive Officer pursuant to 18 U.S.C. Section 1350 | Filed herewith | ||
| 32.2 | Certification of Chief Financial Officer pursuant to 18 U.S.C. Section 1350 | Filed herewith | ||
| 99.1 | Audited consolidated financial statements of BlackRock, Inc. as of December 31, 2015 and 2014 and for each of the three years ended December 31, 2015 | Filed herewith | ||
| 99.2 | Consent order between The PNC Financial Services Group, Inc. and the Board of Governors of the Federal Reserve System | Incorporated herein by reference to Exhibit 99.1 of the Corporation's Current Report on Form 8-K filed April 14, 2011 | ||
| 101 | Interactive Data File (XBRL) | Filed herewith | ||
| + | Incorporated document references to filings by the Corporation are to SEC File No. 001-09718, to filings by National City Corporation are to SEC File No. 001-10074, to filings by BlackRock through its second quarter 2006 Form 10-Q (referred to herein as Old BlackRock) are to BlackRock Holdco 2, Inc. SEC File No. 001-15305, and to filings by BlackRock, Inc. are to SEC File No. 001-33099. |
| * | Denotes management contract or compensatory plan. |
You can obtain copies of these Exhibits electronically at the SEC's website at www.sec.gov or by mail from the Public Reference Section of the SEC at 100 F Street, N.E., Washington, D.C. 20549 at prescribed rates. The Exhibits are also available as part of this Form 10-K on PNC's corporate website at www.pnc.com/secfilings. Shareholders and bondholders may also obtain copies of Exhibits without charge by contacting Shareholder Relations at (800) 843-2206 or via e-mail at [email protected]. The Interactive Data File (XBRL) exhibit is only available electronically.
E-8 The PNC Financial Services Group, Inc. – Form 10-K