Table of Contents
UNITED STATES
SECURITIES AND EXCHANGE COMMISSION
Washington, D.C. 20549
FORM 10‑K
(Mark One)
x | ANNUAL REPORT PURSUANT TO SECTION 13 OR 15(d) OF THE SECURITIES EXCHANGE ACT OF 1934 |
For the fifty-two weeks ended January 31, 2015 | |
o | TRANSITION REPORT PURSUANT TO SECTION 13 OR 15(d) OF THE SECURITIES EXCHANGE ACT OF 1934 |
For the transition period from to
Commission file number 0‑23071
THE CHILDREN'S PLACE, INC.
(Exact name of registrant as specified in its charter)
Delaware |
| 31‑1241495 |
(State or other jurisdiction of |
| (I.R.S. employer |
incorporation or organization) |
| identification number) |
500 Plaza Drive |
|
|
Secaucus, New Jersey |
| 07094 |
(Address of Principal Executive Offices) |
| (Zip Code) |
(201) 558‑2400
(Registrant's Telephone Number, Including Area Code)
Securities registered pursuant to Section 12(b) of the Act: Common Stock, $0.10 par value
Name of each exchange on which registered : Nasdaq Global Select Market
Securities registered pursuant to Section 12(g) of the Act: None.
___________________________________________
Indicate by check mark if the registrant is a well-known seasoned issuer, as defined in Rule 405 of the Securities Act. Yes o No x
Indicate by check mark if the registrant is not required to file reports pursuant to Section 13 or Section 15(d) of the Act. Yes o No x
Indicate by check mark whether the registrant (1) has filed all reports required to be filed by Section 13 or 15(d) of the Securities Exchange Act of 1934 during the preceding 12 months (or for such shorter period that the registrant was required to file such reports), and (2) has been subject to such filing requirements for the past 90 days. Yes x No o
Indicate by check mark whether the registrant has submitted electronically and posted on its corporate Web site, if any, every Interactive Data File required to be submitted and posted pursuant to Rule 405 of Regulation S-T (Section 232.405 of this chapter) during the preceding 12 months (or for such shorter period that the registrant was required to submit and post such files). Yes x No o
Indicate by check mark if disclosure of delinquent filers pursuant to Item 405 of Regulation S-K is not contained herein and will not be contained, to the best of the registrant's knowledge, in definitive proxy or information statements incorporated by reference in Part III of this Form 10‑K or any amendment to this Form 10‑K. o
Indicate by check mark whether the registrant is a large accelerated filer, an accelerated filer, a non-accelerated filer or a smaller reporting company. See the definitions of "large accelerated filer," "accelerated filer," and "smaller reporting company" in Rule 12b‑2 of the Exchange Act. (Check one):
Large accelerated filer | x | Accelerated filer | o | Non-accelerated filer (Do not check if smaller reporting Company) | o | Smaller reporting company | o |
Indicate by check mark whether the registrant is a shell company (as defined in Rule 12b-2 of the Exchange Act). Yes o No x
The aggregate market value of common stock held by non-affiliates was $901,938,730 at the close of business on August 2, 2014 (the last business day of the registrant's fiscal 2014 second fiscal quarter) based on the closing price of the common stock as reported on the Nasdaq Global Select Market. For purposes of this disclosure, shares of common stock held by persons who hold more than 10% of the outstanding shares of common stock and shares held by executive officers and directors of the registrant have been excluded because such persons may be deemed affiliates. This determination of executive officer or affiliate status is not necessarily a conclusive determination for other purposes.
Indicate the number of shares outstanding of each of the registrant's classes of common stock, as of the latest practicable date: Common Stock, par value $0.10 per share, outstanding at March 24, 2015: 20,847,863 .
Documents Incorporated by Reference: Portions of The Children's Place, Inc. Definitive Proxy Statement for its Annual Meeting of Stockholders to be held on May 22, 2015 are incorporated by reference into Part III.
Table of Contents
THE CHILDREN'S PLACE, INC. AND SUBSIDIARIES
ANNUAL REPORT ON FORM 10-K
FOR THE FIFTY-TWO WEEKS ENDED JANUARY 31, 2015
TABLE OF CONTENTS
|
| PAGE |
PART I |
| |
|
|
|
Item 1. | Business | 3 |
Item 1A. | Risk Factors | 12 |
Item 1B. | Unresolved Staff Comments | 21 |
Item 2. | Properties | 21 |
Item 3. | Legal Proceedings | 22 |
Item 4. | Mine Safety Disclosure | 22 |
|
|
|
PART II |
| |
|
|
|
Item 5. | Market for Registrant's Common Equity and Related Stockholder Matters and Issuer Purchases of Equity Securities | 22 |
Item 6. | Selected Financial Data | 26 |
Item 7. | Management's Discussion and Analysis of Financial Condition and Results of Operations | 28 |
Item 7A. | Quantitative and Qualitative Disclosures about Market Risk | 40 |
Item 8. | Financial Statements and Supplementary Data | 41 |
Item 9. | Changes in and Disagreements with Accountants on Accounting and Financial Disclosure | 41 |
Item 9A. | Controls and Procedures | 41 |
Item 9B. | Other Information | 44 |
|
|
|
PART III |
|
|
|
|
|
Item 10. | Directors and Executive Officers of the Registrant and Corporate Governance | 44 |
Item 11. | Executive Compensation | 44 |
Item 12. | Security Ownership of Certain Beneficial Owners and Management and Related Stockholder Matters | 44 |
Item 13. | Certain Relationships and Related Transactions and Director Independence | 44 |
Item 14. | Principal Accountant Fees and Services | 44 |
|
|
|
PART IV |
| |
|
|
|
Item 15. | Exhibits and Financial Statement Schedules | 45 |
Table of Contents
SPECIAL NOTE REGARDING FORWARD LOOKING STATEMENTS
The Business section and other parts of this Annual Report on Form 10-K may contain certain forward-looking statements regarding future circumstances. Forward-looking statements provide current expectations of future events based on certain assumptions and include any statement that does not directly relate to any historical or current fact. Forward-looking statements can also be identified by words such as "anticipates," "believes," "estimates," "expects," "intends," "plans," "predicts," and similar terms. These forward-looking statements are based upon current expectations and assumptions of The Children's Place, Inc. (the "Company") and are subject to various risks and uncertainties that could cause actual results to differ materially from those contemplated in such forward-looking statements including, but not limited to, those discussed in the subsection entitled "Risk Factors" under Part I, Item 1A of this Annual Report on Form 10-K. Actual results, events, and performance may differ significantly from the results discussed in the forward-looking statements. Readers of this Annual Report on Form 10-K are cautioned not to place undue reliance on these forward-looking statements, which speak only as of the date hereof. The Company undertakes no obligation to release publicly any revisions to these forward-looking statements that may be made to reflect events or circumstances after the date hereof or to reflect the occurrence of unanticipated events. The inclusion of any statement in this Annual Report on Form 10-K does not constitute an admission by the Company or any other person that the events or circumstances described in such statement are material.
The following discussion should be read in conjunction with the Company's audited financial statements and notes thereto included elsewhere in this Annual Report on Form 10‑K.
PART I
ITEM 1.-BUSINESS
As used in this Annual Report on Form 10-K, references to the "Company", "The Children's Place", "we", "us", "our" and similar terms refer to The Children's Place, Inc. and its subsidiaries. Our fiscal year ends on the Saturday on or nearest to January 31. Other terms that are commonly used in this Annual Report on Form 10-K are defined as follows:
• | Fiscal 2014 - The fifty-two weeks ended January 31, 2015 |
• | Fiscal 2013 - The fifty-two weeks ended February 1, 2014 |
• | Fiscal 2012 - The fifty-three weeks ended February 2, 2013 |
• | Fiscal 2015 - Our next fiscal year representing the fifty-two weeks ending January 30, 2016 |
• | GAAP - Generally Accepted Accounting Principles |
• | Comparable Retail Sales - Net sales, in constant currency, from stores that have been open for at least 14 consecutive months and from our e-commerce store, excluding postage and handling fees. Store closures in the current fiscal year will be excluded from comparable retail sales beginning in the fiscal quarter in which management commits to closure. Stores that temporarily close for non- substantial remodeling will be excluded from comparable retail sales for only the period that they were closed. A store is considered substantially remodeled if it has been relocated or materially changed in size and will be excluded from comparable retail sales for at least 14 months beginning in the period in which the relocation occurred. |
• | SEC - U.S. Securities and Exchange Commission |
• | FASB- Financial Accounting Standards Board |
• | FASB ASC - FASB Accounting Standards Codification, which serves as the source for authoritative U.S. GAAP, except that rules and interpretive releases by the SEC are also sources of authoritative U.S. GAAP for SEC registrants |
• | CCPSA - Canadian Consumer Product Safety Commission |
• | CPSA - U.S. Consumer Product Safety Act |
• | CPSC - U.S. Consumer Products Safety Commission |
• | CPSIA - U.S. Consumer Product Safety Improvement Act of 2008 |
General
The Children's Place, Inc. is the largest pure-play children's specialty apparel retailer in North America. We sell apparel, accessories, footwear and other items for children in sizes 0-14. We design, contract to manufacture, and license to sell fashionable, high-quality, value-priced merchandise, the substantial majority of which is under the proprietary "The Children's Place", "Place" and "Baby Place" brand names. Our stores offer a friendly and convenient shopping environment. The Children's Place has differentiated departments and serves the wardrobe needs of Girls and Boys (sizes 4-14), Baby Girls and Boys (sizes 12 mos.-5T) and Newborn (sizes 0-18 mos.). Stores are visually merchandised to appeal to each age and gender
3
Table of Contents
segment. Our merchandise is also available online at www.childrensplace.com . Our customers are able to shop online, at their convenience, including from their mobile devices, and receive the same high quality, value-priced merchandise and customer service that are available in our physical stores.
The Children's Place was founded in 1969. The Company became publicly traded on the Nasdaq Global Select Market in 1997. As of January 31, 2015, we operated 1,097 stores throughout North America as well as our online store. During Fiscal 2014, we opened 25 stores compared to 53 in Fiscal 2013, and we closed 35 stores in Fiscal 2014, compared to 41 in Fiscal 2013. Also in Fiscal 2014, we continued to expand into international markets through territorial agreements with franchisees, and in our wholesale business, we added five new accounts and will continue to add accounts and expand categories and distribution to our customers.
Jane Elfers, our President and Chief Executive Officer, has established four key strategic initiatives that we are executing to improve sales and margin, as follows:
1. | Product - Product will always be our number one priority. We continue to significantly differentiate and upgrade the look of our merchandise, which has resonated well with our customers. In addition to apparel, we offer a full line of accessories and footwear and other items so busy moms can quickly and easily put together head-to-toe outfits that look great and are affordable. |
2. | Transforming the Business through Technology - Through developing our Business Transformation Office and identifying other dedicated resources, we are committed to transforming our systems. During Fiscal 2014, we launched our core merchandising and pricing modules for our ERP system, successfully implemented a global sourcing portal, implemented a sophisticated assortment planning tool and began the implementation of a sophisticated inventory allocation and replenishment tool, implemented an upgrade to our e-commerce website permitting advanced functionality and capabilities, and enhancement of customer relationship management capabilities with a focus on customer segmentation. These implementations will set the foundation to enable us to significantly enhance our global sourcing and inventory allocation and management and omni-channel capabilities. |
3. | Channel Expansion - We are pursuing new channels of distribution, including international expansion and wholesale distribution. We continued our international store expansion program with our franchise partners opening 37 additional stores during Fiscal 2014, including 25 in Israel and one store in Panama, bringing our total international franchise store count to 72. During Fiscal 2014, we announced a new franchise agreement with Grupo David to expand into Latin America and the Caribbean and opened our first store in the third quarter of Fiscal 2014. We also announced a new franchise agreement with Arvind Lifestyle Brand Limited to open stores in India, with the first store opening slated for mid-2015. In our wholesale business, we added five accounts and expanded categories of merchandise available for distribution to our customers during Fiscal 2014. |
4. | Fleet Optimization - As part of our store fleet optimization initiative, we now plan to close approximately 200 underperforming stores through fiscal 2017, which includes the 41 stores we closed in 2013 along with the 35 stores we closed in 2014. Our recently completed customer segmentation analysis helps us to better understand customer shopping habits at the store level in order to draw further insights into what an ideal store portfolio should be in the long-term for the Company. The fleet optimization initiative aims to improve store productivity and focus on sales transfers to nearby stores or to our e-commerce business. |
Underlying these growth initiatives is a commitment to operational excellence. The Company is in the process of optimizing our global supply chain to ensure we are able to source high quality value merchandise, and distribute it quickly and efficiently to each channel. These key supply chain initiatives, coupled with disciplined expense management, improving store operations, and our Finance, Compliance, Legal and Human Resources areas, form the strong base necessary to support our long-term growth initiatives.
Segment Reporting
In accordance with the " Segment Reporting " topic of the FASB ASC, we report segment data based on geography: The Children's Place U.S. and The Children's Place International. Each segment includes an e-commerce business located at www.childrensplace.com . Included in The Children's Place U.S. segment are our U.S. and Puerto Rico based stores and revenue from our U.S. wholesale partners. Included in The Children's Place International segment are our Canadian based stores, revenue from the Company's Canada wholesale partner, as well as revenue from international franchisees. We measure our segment profitability based on operating income, defined as income before interest and taxes. Net sales and direct costs are recorded by each segment. Certain inventory procurement functions such as production and design as well as corporate overhead, including executive management, finance, real estate, human resources, legal, and information technology services are managed by The Children's Place U.S. segment. Expenses related to these functions, including depreciation and amortization, are allocated to The Children's Place International segment based primarily on net sales. The assets related to
4
Table of Contents
these functions are not allocated. We periodically review these allocations and adjust them based upon changes in business circumstances. Net sales to external customers are derived from merchandise sales and we have no major customers that account for more than 10% of our net sales. The following tables show by segment our net sales and operating income for the past three fiscal years, and total assets as of January 31, 2015 and February 1, 2014 (in thousands):
|
| Fiscal Year Ended | ||||||||||
|
| January 31, 2015 |
| February 1, 2014 |
| February 2, 2013 | ||||||
Net sales: |
|
|
|
|
|
| ||||||
The Children's Place U.S. |
| $ | 1,528,762 | |
| $ | 1,528,276 | |
| $ | 1,557,549 | |
The Children's Place International (1) |
| 232,562 | |
| 237,513 | |
| 251,937 | | |||
Total net sales |
| $ | 1,761,324 | |
| $ | 1,765,789 | |
| $ | 1,809,486 | |
(1) | Net sales from The Children's Place International are primarily derived from revenues from Canadian operations. |
|
| Fiscal Year Ended | ||||||||||
|
| January 31, 2015 |
| February 1, 2014 |
| February 2, 2013 | ||||||
Operating income: |
|
|
|
|
|
| ||||||
The Children's Place U.S. |
| $ | 63,586 | |
| $ | 60,267 | |
| $ | 68,346 | |
The Children's Place International |
| 16,457 | |
| 16,016 | |
| 21,369 | | |||
Total operating income |
| $ | 80,043 | |
| $ | 76,283 | |
| $ | 89,715 | |
|
|
|
|
|
|
| ||||||
Operating income as a percent of net sales: |
|
|
|
|
|
| ||||||
The Children's Place U.S. |
| 4.2 | % |
| 3.9 | % |
| 4.4 | % | |||
The Children's Place International |
| 7.1 | % |
| 6.7 | % |
| 8.5 | % | |||
Total operating income as a percent of net sales |
| 4.5 | % |
| 4.3 | % |
| 5.0 | % | |||
|
| January 31, 2015 |
| February 1, 2014 | ||||
Total assets: |
|
|
|
| ||||
The Children's Place U.S. |
| $ | 805,462 | |
| $ | 824,893 | |
The Children's Place International |
| 153,156 | |
| 165,737 | | ||
Total assets |
| $ | 958,618 | |
| $ | 990,630 | |
See Note 13 of the Notes to our Consolidated Financial Statements for further segment financial data.
All foreign net sales are in The Children's Place International segment while certain foreign expenses related to our buying operations are allocated between the two segments. Our foreign subsidiaries, primarily in Canada, have operating results based in foreign currencies and are thus subject to the fluctuations of the corresponding translation rates into U.S. dollars.
Key Capabilities
Our objective is to deliver high-quality, value-priced, trend-right assortments for children sizes 0-14. Our assortment offers one stop shopping across apparel, footwear, accessories and other items for children. Our strategies to achieve this objective are as follows:
Merchandising Strategy
Our merchandising strategy is to offer a compelling assortment of apparel, footwear, accessories and other items for children that enable our customer to outfit their child. We strive to ensure that our assortments are modern and colorful, are balanced by category and lifestyle, and are fun and easy to put together. We build our deliveries by season and flow new product to our stores monthly. Each delivery includes fashion merchandise, key items and basics.
5
Table of Contents
High Quality/Value Pricing
We believe that offering high-quality, trend-right, age-appropriate merchandise under "The Children's Place", "Place" and "Baby Place" brand names at value prices is our competitive advantage. We design and merchandise our branded apparel, footwear, accessories and other items to offer a compelling value to our customers.
Brand Image
We focus on strengthening our brand image and customer loyalty for "The Children's Place" by:
• | Consistently offering high-quality and age-appropriate products and trend-right fashion at value prices in a friendly and convenient shopping environment; |
• | Providing coordinated outfits and accessories for our customers' lifestyle needs; |
• | Creating strong merchandising and visual presentations to create a compelling in-store experience; |
• | Emphasizing our great value and fashion in marketing visuals to convey a consistent brand message across all channels; |
• | Segmenting and leveraging our customer database to frequently communicate with our customers and tailor promotions to maximize customer satisfaction; |
• | Using our Loyalty Rewards Program to drive customer engagement; and |
• | Providing exclusive assortments in our e-commerce and outlet channels to further expand the breadth of our offerings and brand recognition. |
Low-Cost Global Sourcing
We control the substantial majority of the design, sourcing and production of The Children's Place branded products. We believe that this control is essential to assuring the consistency and quality of our merchandise, as well as our ability to deliver value to our customers. We are strengthening relationships with our most important vendors. Through these relationships and our extensive knowledge of low cost sourcing on a global scale, we are able to offer our customers high-quality products at value prices. We maintain a network of sourcing offices globally in order to communicate with our vendors efficiently and respond to changing business needs effectively. Our sourcing offices in Hong Kong and Shanghai have allowed us substantial access to the Chinese market, giving us access to a wide range of vendors. Our sourcing offices in India, Bangladesh and Vietnam allow us to maintain and/or reduce our current merchandise costs by capitalizing on new sourcing opportunities while maintaining our control over product quality and social responsibility.
Merchandising Process
The strong collaboration between our cross functional teams in design, merchandising, sourcing and planning and allocation departments have enabled us to build and grow our brand. Cross functional teams are aligned by department.
Design
The Design team gathers information from trends, color services, international and domestic shopping trips, and trade shows. Findings and concepts are presented to the Merchandising team to initiate the cross functional building of a seasonal assortment.
Merchandising
Each quarter we develop seasonal strategies for each department and for each category within the department. The cross functional teams review prior season results and set the strategies in place for the future season. Merchandising builds a roadmap of our style needs based on historical information with the Design team's input. The Design and Merchandising teams work collaboratively throughout the sketch and sample reviews to ensure we are developing the appropriate balance of fashion and key items within the line.
Planning and Allocation
The Planning and Allocation organization works collaboratively with the Merchandising, Finance and Sourcing teams to develop annual and seasonal sales and margin plans to support our financial objectives and merchandising strategies. These plans are developed with consideration of our channels to ensure that we are maximizing key programs each season. Further, this team plans the flow of inventory to ensure that we are adequately supporting floor sets and key promotional periods. Special attention is paid to our store types, as they differ in capacity and layout. All allocation methods incorporate visual presentations as well as inventory levels and sales trends.
6
Table of Contents
Production, Quality Assurance and Social Compliance
During Fiscal 2014, we engaged approximately 105 independent vendors located primarily in Greater Asia. Raw materials used by these vendors are subject to price fluctuations due to global market factors. We continue to pursue global sourcing opportunities to support our inventory needs and to seek to control merchandise costs.
We do not own or operate any manufacturing facilities and depend on independent third parties to manufacture all of our merchandise. Increases in manufacturing costs negatively impact our business, and we seek to carefully manage the risks of operational difficulties posed by contract manufacturers, including the availability of adequate manufacturing capacity, errors in complying with our product specifications, insufficient quality control processes, failures to meet production deadlines, worker and environmental safety concerns, and political and social instability in certain regions.
During Fiscal 2014, we purchased approximately 88% of our total merchandise directly without the aid of third party commissioned buying agents. We do maintain agency agreements with commissioned independent agents who assist in sourcing and pre-production approval, oversee production, provide quality inspection and ensure timely delivery of merchandise. We will continue to evaluate our use of commissioned buying agents, and only use these commissioned agents for the sourcing of select product categories where we lack either technical competency in our own sourcing offices or when product volume is not sufficient to justify expanding our capabilities. The large majority of our sourcing volume will continue to be managed through our own independent sourcing offices in China, Hong Kong, India, Bangladesh and Vietnam.
During Fiscal 2014, we sourced approximately 34% of our total goods from China, approximately 20% from Bangladesh, approximately 15% from Vietnam and approximately 8% from Indonesia. We did not source more than 6% from any other country or region.
We do not accept finished goods until each purchase order receives formal certification of compliance from our own quality assurance associates, agents or appointed third party inspectors. Our product testing programs meet the testing protocols adopted under the CPSIA.
In addition to our quality control procedures, we administer a social compliance program designed to promote compliance with local legal regulations, as well as industry-standard ethical and socially responsible business practices. This program is comprised of four components as follows:
• | Vendor Code of Conduct - By formally acknowledging and agreeing to our code of conduct, our vendors affirm their commitment to integrate our compliance standards into their manufacturing and sourcing practices. These standards cover the areas of child labor, involuntary or forced labor, slavery and human-trafficking, coercion/harassment, discrimination, health and safety, compensation, working hours, freedom of association, environment, subcontracting, security practices and undue influence of independent testing laboratories. |
• | Ongoing Monitoring Program - We administer a corporate monitoring program staffed by our internal social compliance team and/or professional third party auditors who visit factory locations at least once a year on average to assess the working conditions and other production characteristics in all factories that manufacture The Children's Place products. All factories that are approved for The Children's Place production must undergo a social compliance audit prior to any orders being placed and at least once annually thereafter. |
• | Corrective Action Plans - Following each social compliance audit, a corrective action plan outlines findings from the factory visit for each of the areas covered by our standards, a remediation plan for any violations found (if applicable), as well as a follow-up audit timeframe. If violations are not remediated in accordance with the remediation plan, we reserve the right to cease using that factory or vendor. |
• | Ongoing Training and Seminars - We continually conduct training programs and seminars to communicate with our internal and external partners regarding the requirements of our program. Additionally, our social compliance team attends third party seminars, industry courses and training in the Corporate Social Responsibility area. |
We require all entities that produce or manufacture The Children's Place merchandise to undergo a social compliance audit and demonstrate compliance with the requirements of our Vendor Code of Conduct. By requiring our manufacturers and suppliers to participate in our social compliance program, we seek to monitor factories to ensure that they operate using safe and humane working conditions. Additionally, under our social compliance program we monitor changes in local laws and other conditions (e.g., worker safety, workers' right to association and political instability) in the countries from which we source in order to identify and assess potential risks to our sourcing capabilities prior to placing orders.
Company Stores
The following section highlights various store information for The Children's Place operated stores as of January 31, 2015.
7
Table of Contents
Existing Stores
As of January 31, 2015, we operated a total of 1,097 The Children's Place stores in the United States, Canada and Puerto Rico, most of which are clustered in and around major metropolitan areas, and our internet store at www.childrensplace.com . We have 674 stores located in malls, 244 in strip centers, 135 in outlet centers and 44 street stores. The following table sets forth the number of stores in each U.S. state, Puerto Rico and each Canadian province as of the current and prior fiscal year end:
|
| Number of Stores |
|
|
| Number of Stores | |||||
Location |
| January 31, 2015 |
| February 1, 2014 |
|
|
| January 31, 2015 |
| February 1, 2014 | |
United States & Puerto Rico |
|
|
|
|
| United States & Puerto Rico (continued) |
|
|
|
| |
Alabama |
| 15 |
| 17 |
| North Carolina |
| 28 |
| 25 | |
Arizona |
| 19 |
| 21 |
| North Dakota |
| 4 |
| 4 | |
Arkansas |
| 8 |
| 8 |
| Ohio |
| 33 |
| 33 | |
California |
| 93 |
| 93 |
| Oklahoma |
| 8 |
| 8 | |
Colorado |
| 14 |
| 14 |
| Oregon |
| 8 |
| 9 | |
Connecticut |
| 13 |
| 16 |
| Pennsylvania |
| 43 |
| 45 | |
Delaware |
| 3 |
| 3 |
| Rhode Island |
| 3 |
| 3 | |
District of Columbia |
| 1 |
| 1 |
| South Carolina |
| 16 |
| 15 | |
Florida |
| 39 |
| 40 |
| South Dakota |
| 2 |
| 2 | |
Georgia |
| 31 |
| 31 |
| Tennessee |
| 21 |
| 20 | |
Hawaii |
| 2 |
| 4 |
| Texas |
| 91 |
| 91 | |
Idaho |
| 4 |
| 4 |
| Utah |
| 13 |
| 13 | |
Illinois |
| 39 |
| 41 |
| Vermont |
| 1 |
| 1 | |
Indiana |
| 19 |
| 20 |
| Virginia |
| 24 |
| 23 | |
Iowa |
| 10 |
| 10 |
| Washington |
| 13 |
| 15 | |
Kansas |
| 6 |
| 6 |
| West Virginia |
| 6 |
| 6 | |
Kentucky |
| 15 |
| 13 |
| Wisconsin |
| 13 |
| 13 | |
Louisiana |
| 16 |
| 17 |
| Wyoming |
| 2 |
| 1 | |
Maine |
| 5 |
| 5 |
| Puerto Rico |
| 13 |
| 15 | |
Maryland |
| 23 |
| 24 |
| Total United States & Puerto Rico |
| 963 |
| 974 | |
Massachusetts |
| 24 |
| 26 |
|
|
|
|
|
| |
Michigan |
| 19 |
| 18 |
| Canada |
|
|
|
| |
Minnesota |
| 13 |
| 13 |
| Alberta |
| 19 |
| 19 | |
Mississippi |
| 14 |
| 14 |
| British Columbia |
| 17 |
| 17 | |
Missouri |
| 18 |
| 18 |
| Manitoba |
| 4 |
| 4 | |
Montana |
| 2 |
| 3 |
| New Brunswick |
| 3 |
| 3 | |
Nebraska |
| 5 |
| 4 |
| Nova Scotia |
| 4 |
| 4 | |
New Hampshire |
| 6 |
| 7 |
| Ontario |
| 56 |
| 55 | |
New Jersey |
| 46 |
| 48 |
| Prince Edward Island |
| 1 |
| 1 | |
New Mexico |
| 6 |
| 5 |
| Quebec |
| 26 |
| 26 | |
New York |
| 85 |
| 81 |
| Saskatchewan |
| 3 |
| 3 | |
Nevada |
| 8 |
| 7 |
| Newfoundland and Labrador |
| 1 |
| 1 | |
|
|
|
|
|
| Total Canada |
| 134 |
| 133 | |
|
|
|
|
|
|
|
|
|
|
| |
|
|
|
|
|
| Total Stores |
| 1,097 |
| 1,107 | |
Store Concepts
At The Children's Place, our store concepts consist of "Tech 2 ", "Apple-Maple", "Technicolor" and "Outlet" formats, as follows:
Tech 2 - This store format has the brand aesthetics of a Technicolor store format with the functionality of an Apple-Maple store format. Our Tech 2 store format creates an open, brightly lit environment for customers. Tech 2 features crisp white floor-wall fixtures to ensure the product is the focal point, using color to brand and create shop identifiers. Stores using our Tech 2 store format cost us approximately 35% less to build than our Technicolor store format. The average store is
8
Table of Contents
approximately 4,100 square feet and as of January 31, 2015, approximately 44% of our stores used this concept. We intend to use this format for new stores for the foreseeable future.
Technicolor - This store format uses color to brand and create shop identity, but is more expensive to design, build, maintain and staff than stores using the Tech 2 format. The average store using the Technicolor format is approximately 4,900 square feet and as of January 31, 2015, approximately 21% of our stores were of this concept.
Apple-Maple - This store format features light wood floors, fixtures and trim, and is brightly lit, featuring floor-to-ceiling glass windows that are open and inviting. A customized grid system throughout the store formats perimeter displays featured merchandise, marketing photographs and promotions. The average store size using this format is approximately 4,200 square feet and as of January 31, 2015, approximately 23% of our stores were of this concept.
Outlet - The average outlet store size using this format is approximately 7,100 square feet. As of January 31, 2015, approximately 12% of our stores were in this format. Our outlet stores are strategically placed within each market to provide a discount value alternative, including an assortment of "made for outlet" merchandise.
Fleet Optimization
As part of our store fleet optimization initiative, we now plan to close approximately 200 underperforming stores through fiscal 2017, which includes the 35 stores closed during Fiscal 2014 and the 41 stores closed during Fiscal 2013. The stores selected for closure underperformed the fleet average and do not meet our hurdle rates and other criteria. Our recently completed customer segmentation analysis helps us to better understand customer shopping habits at the store level in order to draw further insights into what an ideal store portfolio should be in the long-term for our Company. The fleet optimization initiative aims to improve store productivity and focus on sales transfers to nearby stores or to our e-commerce business.
We continuously review the performance of our store fleet. We base our decisions to open, close or remodel stores on a variety of factors, including lease terms, landlord negotiations, market dynamics and projected financial performance. When assessing whether to close a store, we also consider remaining lease life and current financial performance.
Internet Sales ("e-commerce")
Our U.S. and International segments each include an e-commerce business located at www.childrensplace.com and e-commerce growth remains one of our top strategic priorities. Over the past five years, e-commerce net sales have grown over 85%, from approximately $151.2 million in the fiscal year ended January 29, 2011 to approximately $279.8 million in Fiscal 2014, and now accounts for approximately 16% of our total net sales. We expect our e-commerce business to continue to grow in Fiscal 2015.
We are committed to delivering a world class, end-to-end user experience to our customers from product assortment and website design to operations, fulfillment and customer service. We are further committed to delivering these experiences to our customers when, where and how they are looking to access the brand, accounting for cross-channel behavior, growth of mobile devices, and the growing interest in our brand from international audiences. As such, we will continue to make required investments in back-end infrastructure, as well as front-end technology to deliver on this commitment. We believe that the critical investments made over the past year in areas such as e-commerce infrastructure and mobile optimization as well as additional front-end website features have improved our customers' experience.
International Franchises and Wholesale
We continued our international store expansion program with our franchise partners opening 37 additional stores during Fiscal 2014, including 25 in Israel and one store in Panama, bringing our total international franchise store count to 72. During Fiscal 2014, we announced a new franchise agreement with Grupo David to expand into Latin America and the Caribbean and opened our first store in the third quarter of Fiscal 2014. We also announced a new franchise agreement with Arvind Lifestyle Brand Limited to open stores in India, with the first store opening slated for mid-2015. We generate revenues from our franchisees from the sale of products, sales royalties and/or territory fees. In our wholesale business, we added five accounts and expanded categories of merchandise available for distribution to our customers during Fiscal 2014.
Store Operations
The Children's Place U.S. store operations are organized into eight regions. We employ two U.S. Zone Vice Presidents, one U.S. Outlet Vice President and one Canadian Vice President who oversee our operations and to whom regional managers report. A regional manager oversees a region and has between seven and 10 district managers reporting to them. Each district manager is responsible for nine to 16 stores. Our stores are staffed by a store management team and sales associates, with additional part-time associates hired to support seasonal needs. Our store management teams spend a high percentage of their time on the store's selling floor providing direction, motivation, and development to store personnel. To maximize selling productivity, our teams emphasize greeting, replenishment, presentation standards, procedures and controls. In order to
9
Table of Contents
motivate our store management, we offer a monthly incentive compensation plan that awards bonuses for achieving certain financial goals.
Seasonality
Our business is subject to seasonal influences, with heavier concentrations of sales during the back-to-school and holiday seasons. Our first fiscal quarter results are dependent upon sales during the period leading up to the Easter holiday, third fiscal quarter results are dependent upon back-to-school sales, and our fourth fiscal quarter results are dependent upon sales during the holiday season. The business is also subject to seasonal shifts due to unseasonable weather conditions. The following table shows the quarterly distribution, as a percentage of the full year, of net sales and operating income (loss):
|
| First Quarter |
| Second Quarter |
| Third Quarter |
| Fourth Quarter | ||||
Quarterly net sales as a percentage of full year |
|
|
|
|
|
|
|
| ||||
Fiscal 2014 |
| 23.3 | % | | 21.8 | % | | 27.7 | % | | 27.2 | % |
Fiscal 2013 |
| 24.0 | % | | 21.7 | % | | 27.9 | % | | 26.5 | % |
|
|
|
|
|
|
|
|
| ||||
Quarterly operating income (loss) as a percentage of full year |
|
|
|
|
|
|
|
| ||||
Fiscal 2014 |
| 25.1 | % | | (20.6 | )% | | 69.8 | % | | 25.8 | % |
Fiscal 2013 |
| 37.2 | % | | (46.7 | )% | | 80.7 | % | | 28.7 | % |
____________________________________________
Table may not add due to rounding.
For more information regarding the seasonality of our business, refer to Item 7.-Management's Discussion and Analysis of Financial Condition and Results of Operations-Quarterly Results and Seasonality.
Marketing
The Children's Place is a well recognized brand, with the number one unaided awareness of any children's specialty brand, a strong fashion offering and a compelling value proposition. We attempt to build on our brand recognition through a multi-channel marketing campaign that aligns store front windows, in-store marketing, internet marketing, and our customer loyalty program. Our direct marketing program utilizes both off and on-line channels.
We promote customer loyalty through a loyalty rewards program called MyPLACE Rewards. At the end of Fiscal 2014, our MyPLACE Rewards loyalty program had 7.3 million members who accounted for approximately 72% of sales. We also promote customer loyalty through our private label credit card. Our card is issued to our customers for use exclusively at The Children's Place stores and online at www.childrensplace.com, and credit is extended to such customers through a third-party financial institution on a non-recourse basis to us. Approximately 10% of our net sales during Fiscal 2014 were paid for with our private label credit card.
Our marketing programs are aligned with one another and planned by geography and channel to ensure consistency and relevance. We promote affinity and loyalty through our marketing programs by utilizing specialized incentive programs. We also use our marketing programs to facilitate communications with our customers by delivering coupons and promotional materials.
Distribution
In the United States we own and operate a 700,000 square foot distribution center in Alabama which supports both U.S. retail store operations and U.S. e-commerce operations. In Canada we operate a 95,000 square foot distribution center in Ontario for our Canadian retail store operations. We also use a third-party provider to support our Canadian e-commerce operations. On occasion, we may utilize additional facilities to support seasonal warehousing needs. We also use a third-party provider in Malaysia to support our international franchise business.
Previously we operated distribution centers in Ontario, California (the "West Coast DC") and in Dayton, New Jersey ("Northeast DC"). During Fiscal 2012, our management approved a plan to exit the West Coast DC and move the operations to our distribution center in Fort Payne, Alabama (the "Southeast DC"). We ceased operations at the West Coast DC in the second quarter Fiscal 2012. The lease of the West Coast DC expires in March 2016 and we have subleased this facility through March 2016.
10
Table of Contents
During Fiscal 2012, our management approved a plan to close our Northeast DC and move the operations to our Southeast DC. We ceased operations in the Northeast DC during the fourth quarter of Fiscal 2012. The lease of our Northeast DC expires in January 2021 and we have subleased this facility through January 2021.
See Note 1 of the Notes to our Consolidated Financial Statements for further detail on exit costs related to our West Coast DC and Northeast DC.
Competition
The children's apparel, footwear and accessories retail markets are highly competitive. Our primary competitors are specialty stores and mass merchandisers including Target Corporation, GapKids, babyGap and Old Navy (each of which is a division of The Gap, Inc.), The Gymboree Corporation, Justice (a division of The Ascena Retail Group, Inc.), Carter's, Inc., J.C. Penney Company, Inc., Kohl's Corporation and other department stores, as well as other discount stores such as Walmart Stores, Inc. We also compete with regional retail chains, catalog companies and Internet retailers. One or more of our competitors are present in substantially all of the areas in which we have stores.
Trademarks and Service Marks
"The Children's Place," "babyPLACE," "Place," "The Place" and certain other marks have been registered as trademarks and/or service marks with the United States Patent and Trademark Office and in Canada. The registration of the trademarks and the service marks may be renewed to extend the original registration period indefinitely, provided the marks are still in use. We intend to continue to use and protect our trademarks and service marks and maintain their registrations. We have also registered our trademarks in other countries where we source our products and where we have established and anticipate establishing franchising operations. We believe our trademarks and service marks have received broad recognition and are of significant value to our business.
Government Regulation
We are subject to extensive federal, state, provincial and local laws and regulations affecting our business, including product safety, consumer protection, privacy, truth-in-advertising, accessibility, customs, wage and hour laws and regulations, and zoning and occupancy ordinances that regulate retailers generally and/or govern the promotion and sale of merchandise and the operation of retail stores and e-commerce. We also are subject to similar international laws and regulations affecting our business. We believe that we are in material compliance with these laws and regulations.
We are committed to product quality and safety. We focus our efforts to adhere to all applicable laws and regulations affecting our business, including the provisions of the CPSIA, the Federal Hazardous Substances Act, the Flammable Fabrics Act and the Textile Fiber Product Identification Act, the Canada Consumer Product Safety Act, the Canadian Textile Labelling Act, the Canadian Care Labelling Program, and various environmental laws and regulations. Each of our product styles currently covered by the CPSIA and the CCPSA are appropriately tested to meet current standards.
Virtually all of our merchandise is manufactured by factories located outside of the United States. These products are imported and are subject to U.S. and Canadian customs laws, which impose tariffs, anti-dumping and countervailing duties on certain imported products, including textiles, apparel, footwear and accessories. We currently are not restricted by any such duties in the operation of our business. In addition, custom duties and tariffs do not comprise a material portion of the cost of our products.
Employees
As of January 31, 2015, we had approximately 16,000 employees, approximately 1,500 of whom were based at our corporate offices and distribution centers, approximately 2,400 of whom were full-time store employees and approximately 12,100 of whom were part-time and seasonal store employees. None of our employees are covered by a collective bargaining agreement. We believe we maintain good employee relations.
Internet Access to Reports
We are a public company and are subject to the disclosure requirements of the Securities Exchange Act of 1934, as amended (the "Exchange Act"). Accordingly, we file periodic reports, proxy statements and other information with the SEC. Such reports, proxy statements and other information may be obtained by visiting the Public Reference Room of the SEC at 100 F Street, NE, Room 1580, Washington, D.C. 20549 or by calling the SEC at 1-800-SEC-0330. In addition, the SEC maintains a website (http://www.sec.gov) that contains reports, proxy and information statements and other information regarding us and other issuers that file electronically.
Our website address is www.childrensplace.com . We make available without charge, through our website, copies of our Proxy Statement, Annual Report on Form 10-K, Quarterly Reports on Form 10-Q, Current Reports on Form 8-K and
11
Table of Contents
amendments to those reports filed or furnished pursuant to Section 13(a) or 15(d) of the Exchange Act as soon as reasonably practicable after such reports are filed with or furnished to the SEC. References in this document to our website are not and should not be considered part of this Annual Report on Form 10-K, and the information on our website is not incorporated by reference into this Annual Report on Form 10-K.
We also make available our corporate governance materials, including our corporate governance guidelines and our code of business conduct, on our website. If we make any substantive amendments to our code of business conduct or grant any waiver, including any implicit waiver, from a provision of the code for the benefit of our Chief Executive Officer and President, our Chief Operating Officer and our Chief Financial Officer we will disclose the nature of such amendment or waiver on that website or in a Current Report on Form 8-K.
Item 1A. | RISK FACTORS |
Investors in the Company should consider the following risk factors as well as the other information contained herein:
We may suffer adverse business consequences if we are unable to anticipate and respond to merchandise trends, marketing and promotional trends or customer shopping patterns.
The apparel industry is subject to rapidly changing fashion trends and shifting consumer preferences. Our success depends in part on the ability of our design and merchandising team to anticipate and respond to these changes. Our design, manufacturing and distribution process generally takes up to one year, during which time fashion trends and consumer preferences may further change.
In addition, marketing technology is evolving rapidly. We market our brand through various means, including customer research, email, direct mailings, advertising, promotional events, and in-store signage. Our ability to deliver a high customer experience that retains our current customer base and acquires new customers is dependent on our being able to anticipate new innovations in technology and our ability to use them to increase our brand value.
New technological innovations are also expanding ways that retail customers shop, including in-store, online, using tablets, mobile devices and other means. Our success depends in part on the ability of our merchandising and marketing teams to anticipate and respond to these innovations. Our failure to anticipate, identify or respond to these innovations could adversely affect customer acceptance of our products resulting in lower sales, increased inventory levels and/or lower margins, which could have a material adverse effect on our financial position, results of operations and cash flows.
Changes in our Comparable Retail Sales and/or quarterly results of operations could have a material adverse effect on the market price of our common stock.
Numerous factors affect our Comparable Retail Sales and quarterly results including, among others, unseasonable weather conditions, merchandise assortment, retail prices, fashion trends, mall traffic, number of visits to our e-commerce site, the retail sales environment, calendar shifts of holidays or seasonal periods, birth rate fluctuations, timing of promotional events, macro-economic conditions and our success in executing our business strategies.
Unseasonably cold weather over a prolonged period of time and the occurrence of frequent or severe storms adversely affect our sales and therefore our Comparable Retail Sales. The nature of our target customer heightens the effects of bad weather on our sales. Our target customer is a value conscious, lower to middle income mother buying for infants and children based on need rather than based on fashion, trend or impulse. Therefore, for example, our target customer will not purchase warm weather spring clothing during an extended period of unseasonably cold weather occurring in what otherwise should be warmer weather months.
Our Comparable Retail Sales and quarterly results have fluctuated significantly in the past due to the factors cited above, and we anticipate that they will continue to fluctuate in the future, particularly in the current difficult and highly competitive retail environment and continued weak economic conditions affecting our target customer, which may result in declines in consumer spending. The investment community follows Comparable Retail Sales and quarterly results closely and fluctuations in these results, or the failure of our results to meet investor expectations, may have a significant adverse effect on the price of our common stock.
We may not be able to successfully execute our business strategies.
We are continuously seeking new ways to further our brand recognition, develop and implement digital and omni-channel initiatives, expand our channels of distribution and geographical coverage, optimize our North American retail store fleet, and
12
Table of Contents
improve our operational processes. Our failure to properly execute our plans, or identify alternative strategies, could have a material adverse effect on our financial position, results of operations and cash flows.
During Fiscal 2015, we plan to drive additional growth and profitability through our international and wholesale distribution channels. Consumer demand, behavior, taste and purchasing trends may differ in international markets and/or in the distribution channels through which our wholesale customers sell products and, as a result, sales of our products may not be successful or meet our expectations, or the margins on those sales may not be in line with those we currently anticipate. We may also face difficulties integrating foreign business operations and/or wholesaling operations with our current sourcing, distribution, information technology systems and other operations. Any of these challenges could hinder our success in new markets or new distribution channels. There can be no assurance that we will successfully complete any planned expansion or that any new business will be profitable or meet our expectations.
During Fiscal 2015, we will continue our store fleet optimization program, which is intended to increase profitability and return on our existing retail store fleet. Currently, it is planned that this program will close approximately 200 underperforming retail stores through fiscal 2017, which include 35 retail stores we closed in Fiscal 2014 and 41 retail stores we closed in Fiscal 2013. Failure to properly identify or measure underperforming retail stores, failure to achieve anticipated sales transfer rates among closed and remaining retail stores in a geographic region, and failure to properly identify and analyze customer segmentation and spending patterns could have a material adverse effect on our financial position, results of operations and cash flows. In addition, pursuant to generally accepted accounting principles, we are required to recognize an impairment charge when circumstances indicate that the carrying value of long-lived assets may not be recoverable. If a determination is made that the asset's carrying value of a long-lived asset is not recoverable over its estimated useful life, the asset is written down to its estimated fair value. We have recognized impairment charges of $11.1 million in Fiscal 2014 and $29.6 million in Fiscal 2013.
Any of the above risks, individually or in aggregation, could negatively impact our financial position, results of operations and cash flows.
A material disruption in, failure of, or inability to upgrade, our information technology systems could materially adversely affect our business, financial position or results of operations and cash flows.
We rely heavily on various information systems to manage our complex operations, including our online business, management of our supply chain, inventory, point-of-sale processing in our stores, gift cards, our private label credit card, and various other processes and transactions. We continue to evaluate and implement upgrades and changes to our IT systems. We are in the process of transforming our business by implementing new computer systems that will enhance our core merchandising, planning and allocation, sourcing, omni-channel capabilities, e-commerce platform and financial and accounting processes, including our implementation of certain planning and allocation, inventory management and pricing business management software which is expected to be completed in Fiscal 2015. Implementing new systems carries substantial risk, including failure to operate as designed, failure to properly integrate with other systems, potential loss of data or information, cost overruns, implementation delays, disruption of operations, failure to implement appropriate security measures, lower customer satisfaction resulting in lost customers or sales, inability to deliver merchandise to our stores, inventory shortages, inventory levels in excess of customer demand, inability to meet the demands of our international franchise partners or our wholesale and retail customers, and the potential inability to meet reporting requirements. In addition, any disruptions or malfunctions affecting our current or new information systems could cause critical information upon which we rely to be delayed, unreliable, corrupted, insufficient or inaccessible. Further, there is no assurance that a successfully implemented system will deliver any anticipated sales or margin improvements or other benefits to us. Risks associated with our information technology systems include:
• | risks associated with the failure of our information technology systems due to inadequate system capacity, security breaches, computer viruses, human error, changes in programming, system upgrades or migration of these services to new systems; |
• | natural disasters or adverse weather conditions; |
• | disruptions in telephone service or power outages; |
• | reliance on third parties for computer hardware and software, as well as delivery of merchandise to our customers; |
• | rapid technology changes; and |
• | consumer privacy concerns and regulation. |
Any of these potential issues, individually or in aggregation, could have a material adverse effect on our business, financial position, results of operations and cash flows.
13
Table of Contents
We also rely on third-party vendors and outsourcing partners to design, program, implement, maintain and service our existing and planned information systems. Any failures of these vendors to properly deliver their services in a timely fashion or any failure of these vendors to protect our personal or competitively sensitive data or to prevent the authorized access to such data, whether in their possession or through our information systems, could have a material adverse effect on our business, financial position, results of operations and cash flows.
A privacy breach, through a cybersecurity incident or otherwise, or failure to comply with privacy laws could adversely affect our business.
Despite our efforts and technology to secure our computer network, a targeted or random cyber-attack, acts of vandalism, hacking, rogue employees or infection by computer viruses or other malware may bypass our technology and breach our computer network resulting in a material disruption of our computer network and/or a loss of information valuable to our business, including without limitation customer or employee personal information. Any of the above cyber incidents may go undetected for a period of time which could result in materially adverse consequences. Despite our due diligence in selecting and monitoring third party vendors and partners, a similar breach to their computer networks may occur, leading to a material disruption of our computer network and/or a decrease in e-commerce sales and a loss of information valuable to our business, including but not limited to customer or employee personal information. Such a cyber-attack could result in any of the following:
• | theft, destruction, loss, misappropriation or release of confidential data, intellectual property or customer information, including personally identifiable information such as credit card information, email addresses, social security numbers, home addresses or health information; |
• | operational or business delays resulting from the disruption of our computer network and subsequent material clean-up and mitigation costs and activities; |
• | negative publicity resulting in substantial reputation or brand damage with our customers, partners or industry peers; and |
• | loss of sales generated through our e-commerce website. |
Our systems and procedures are required to meet the Payment Card Industry ("PCI") data security standards, which require periodic audits by independent third parties to assess compliance. Failure to comply with the security requirements or rectify a security issue may result in substantial fines and the imposition of material restrictions on our ability to accept payment by credit or debit cards. There can be no assurance that we will be able to satisfy PCI security standards or to identify security issues in a timely fashion. In addition, PCI is controlled by a limited number of vendors who have the ability to impose changes in PCI's fee structure and operational requirements on us without negotiation. Such changes in fees and operational requirements may result in our failure to comply with PCI security standards, as well as significant unanticipated expenses.
Any of the above risks, individually or in aggregation, could substantially damage our reputation and result in lost sales, fines, and/or lawsuits, which in turn could have a material adverse effect on our financial position, results of operations and cash flows. Although we carry cybersecurity insurance, in the event of a cyber incident, that insurance may not be extensive enough or adequate in amount to cover damages we may incur. Further, a significant breach of federal, state, provincial, local or international privacy laws could have a material adverse effect on our reputation, financial position, results of operations and cash flows.
We regard the protection of our customer, employee, and company data as critical. The regulatory environment surrounding information security and privacy is demanding, with the frequent imposition of new and changing requirements. In addition, customers have a high expectation that we will adequately protect their personal information. Any breach involving this data could cause material harm to our reputation or result in substantial liability, either of which could have a material adverse effect on our financial position, results of operations and cash flows.
Our business could be negatively affected as a result of actions of activist shareholders, and such activism could cause us to incur substantial costs, divert management's attention and resources.
Certain activist shareholders have made, or indicated they will in the future make, strategic proposals, suggestions or requested changes concerning the Company's operations, strategy, management, businesses or other matters. Responding to actions by activist shareholders can be costly and time-consuming, disrupting our operations and diverting the attention of management and our employees. Such activities could interfere with our ability to execute our strategic plan. The perceived uncertainties as to our future direction also could affect the market price and volatility of our common stock. We cannot predict, and no assurances can be given, as to the outcome or timing of any matters relating to the foregoing, and any such
14
Table of Contents
matters may impact the value of the Company's common stock could have a material adverse effect on our financial position, results of operations and cash flows.
We depend on our relationships with unaffiliated manufacturers, transportation companies, and independent agents. Our inability to maintain relationships with any of these entities, or the failure of any of their businesses, could adversely affect our business and results of operations.
We do not own or operate any manufacturing facilities, and therefore, are dependent upon independent third parties for the manufacture of all of our products. Most of our products are currently manufactured to our specifications, pursuant to purchase orders, by approximately 105 independent manufacturers located primarily in Greater Asia. In Fiscal 2014, we sourced approximately 34% of our total goods from China, approximately 20% from Bangladesh, approximately 15% from Vietnam and approximately 8% from Indonesia. We did not source more than 6% of our total goods from any other country or region. We have no exclusive or long-term contracts with our manufacturers and compete with other companies for manufacturing facilities. We have reduced our reliance on the use of commissioned buying agents, and only use these commissioned agents for the sourcing of select product categories where we lack either technical competency in our own sourcing offices or when product volume is not sufficient to justify expanding our capabilities. Although we believe that we have the in-house capability to more efficiently source certain of our purchases, our inability to do so, or our inability to find adequate sources to support our current needs for merchandise and future growth, could have a material adverse effect on our business, financial position, results of operations and cash flows.
The failure of our third-party manufacturers to adhere to local law in the areas of worker safety (e.g. fire safety and building codes), worker rights of association, and social compliance and health and welfare requirements could result in accidents and practices that cause disruptions or delays in production and/or substantial harm to our reputation, either of which could have a material adverse effect on our business, financial position, results of operations and cash flows.
Our merchandise is shipped directly from manufacturers through third parties to our distribution and fulfillment centers, our stores, our e-commerce customers and our international franchise partners and wholesale customers. Our operating results depend in large part on the orderly, timely and accurate operation of our receiving and distribution process, which depends, in part, on our manufacturers' adherence to shipping schedules and our third party providers' effective management of our domestic and international distribution facilities and capacity. Furthermore, it is possible that events beyond our control, such as political unrest, a terrorist or similar act, military action, strike, weather patterns, natural disaster, continuing government spending cuts or other disruption impacting the countries that we source from, could result in delays in delivery of merchandise to our distribution centers or our stores, international franchise partners and wholesale customers, or the fulfillment of e-commerce orders to our customer, or require us to incur additional costs in air freight to ensure timely delivery. Any such event could have a material adverse effect on our business, financial position, results of operations and cash flows.
If our internal agents, independent agents, principal manufacturers or freight operators experience negative financial consequences, our inability to use or find substitute providers to support our manufacturing and distribution needs in a timely manner could have a material adverse effect on our business, financial position, results of operations and cash flows.
Because we purchase our products internationally, our business is sensitive to risks associated with international business.
Virtually all of our merchandise is purchased from foreign suppliers, including approximately 34% from China, approximately 20% from Bangladesh, approximately 15% from Vietnam and approximately 8% from Indonesia. As a result, we are subject to various risks of doing business in foreign markets and importing merchandise from abroad, such as:
• | foreign governmental regulations, including but not limited to changing requirements with regard to product safety, product testing, employment, taxation and language preference in course of dealing; |
• | the failure of an unaffiliated manufacturer to comply with local laws, including labor laws, health and safety laws or ethical labor practices; |
• | financial or political instability; |
• | the rising cost of doing business in particular countries, including China; |
• | fluctuation of the U.S. dollar against foreign currencies; |
• | pressure from non-governmental organizations; |
• | customer acceptance of foreign produced merchandise; |
• | developing countries with less infrastructure; |
• | new legislation relating to import quotas or other restrictions that may limit the import of our merchandise; |
• | imposition of duties, taxes, and other charges on imports; |
• | significant delays in the delivery of cargo due to port security considerations, political unrest or weather conditions; |
• | disruption of imports by labor disputes (e.g., including at ports in the U.S.) and local business practices; |
• | regulations under the United States Foreign Corrupt Practices Act; and |
15
Table of Contents
• | increased cost of transportation. |
In an attempt to mitigate the above risks within any one country, we maintain relationships with many manufacturers in various countries. In order to maintain and/or reduce the cost of our merchandise, we have reduced and will continue to reduce production in China and have moved and will continue to move production into other developing countries. We cannot predict the effect that this, or the other factors noted above, in another country from which we import products could have on our business. If any of these factors rendered the conduct of business in a particular country undesirable or impractical, or if our current foreign manufacturing sources ceased doing business with us or we cease doing business with them for any reason and we were unable to find alternative sources of supply, we could experience a material adverse effect on our business, negatively impacting our financial position, results of operations and cash flows.
We require our independent manufacturers to operate in compliance with applicable laws and our internal requirements. Our vendor code of conduct promotes ethical business practices and we monitor compliance with them; however we do not control these manufacturers, their labor practices, their health and safety practices, or from where they buy their raw materials. Any violation of labor, health, environmental, safety (eg. fire or building codes) or other laws by any of the independent manufacturers we use or any divergence of an independent manufacturer's labor practices from standards generally accepted as ethical in the United States and Canada could damage our reputation and could have a material adverse effect on our business, negatively impacting our financial position, results of operations and cash flows.
Fluctuations in the prices of raw materials, labor and energy could result in increased product and/or delivery costs.
Increases in the price of raw materials, including cotton, wool and other materials used in the production of fabric and accessories, as well as volatility and increases in labor and energy costs, could result in significant cost increases for our products as well as their distribution to our distribution centers, retail locations, international franchise partners and wholesale and retail customers. To the extent we are unable to offset any such increased costs through value engineering or price increases, such increased costs could have a material adverse effect on our net sales, financial position, results of operations and cash flows.
Our success depends upon the service and capabilities of our management team. Changes in management or in our organizational structure, or inadequate management, could have a material adverse effect on our business.
Over the past few years, we had substantial changes in our management team, including key members of our senior management. While we believe our CEO and President has assembled a strong, experienced senior leadership team that will drive our strategic initiatives, our success is dependent on retaining key individuals within the organization to execute the Company's strategic plans. Leadership changes can be inherently difficult to manage and may cause disruption to our business or further turnover in our workforce or management team. Senior level management establishes the "tone at the top" by which an environment of ethical values, operating style and management philosophy is fostered. Changes in management, or inadequate management, could lead to an environment that lacks inspiration and/or a lack of commitment by our employees. The inability of our senior management team to maintain an adequate organizational structure and a proper "tone at the top", or the inability to attract additional qualified managers or other personnel, could have a material adverse effect on our business.
Product liability costs, related claims, and the cost of compliance with consumer product safety laws such as the CPSIA in the U.S. or the CCPSA in Canada or our inability to comply with such laws could have a material adverse effect on our business and reputation.
We are subject to regulation by the CPSC in the U.S., Health Canada in Canada, and similar state, provincial and international regulatory authorities. Although we test the products sold in our stores, on our website, and to our international franchise partners and our wholesale customers, concerns about product safety, including but not limited to concerns about those manufactured in developing countries, may lead us to recall selected products, either voluntarily, or at the direction of a governmental authority, or may lead to a lack of consumer acceptance or loss of consumer trust. Product safety concerns, recalls, defects or errors could result in the rejection of our products by customers, damage to our reputation, lost sales, product liability litigation and increased costs, any or all of which could harm our business and have a material adverse effect on our financial position, results of operations and cash flows.
The cost of compliance with current requirements and any future requirements of the CPSC, Health Canada or other state or international regulatory authorities, consumer product safety laws, including initiatives labeled as "green chemistry" and regulatory testing, certification, packaging, labeling and advertising and reporting requirements, or changes to existing laws could have a material adverse effect on our financial position, results of operations and cash flows. In addition, any failure to comply with such requirements could result in significant penalties, require us to recall products and harm our reputation, any or all of which could have a material adverse effect on our business, reputation, and financial position, results of operations and cash flows.
16
Table of Contents
Our failure to successfully manage our e-commerce business could have a negative impact on our business.
The successful operation of our e-commerce business depends on our ability to maintain the efficient and uninterrupted operation of our online order-taking and our fulfillment operations, and on our ability to provide a shopping experience that will generate orders and return visits to our site. Risks associated with our e-commerce business include:
• | risks associated with the failure of the computer systems that operate our website including, among others, inadequate system capacity, security breaches, computer viruses, human error, changes in programming, system upgrades or migration of these services to new systems; |
• | disruptions in telephone service or power outages; |
• | reliance on third parties for computer hardware and software, as well as delivery of merchandise to our customers; |
• | rapid technology changes; |
• | credit card fraud; |
• | the diversion of sales from our physical stores; |
• | natural disasters or adverse weather conditions; |
• | changes in applicable federal and state regulations; |
• | negative reviews on social media; |
• | liability for online content; and |
• | consumer privacy concerns and regulation. |
Problems in any one or more of these areas could have a material adverse effect on our financial position, results of operations and cash flows, and could damage our reputation and brand.
We have a single distribution center serving the U.S., a single distribution center serving Canada and a single third-party warehouse provider serving the majority of shipments for our international franchise partners. Damage to, or a prolonged interruption of operations at, any of these facilities could have a material adverse effect on our business .
Our U.S. distribution center is located in Fort Payne, Alabama. This facility handles all of our warehousing and store fulfillment activities in the U.S., as well as the fulfillment of all of our e-commerce orders in the U.S. Our Canadian distribution center is located in Mississauga, Ontario, Canada. We also use a third-party provider, also located in Mississauga, to support our Canadian e-commerce operations. These Ontario facilities handle all of our warehousing and store fulfillment activities in Canada. Our international franchise partners receive the majority of shipments of merchandise from our third-party warehouse provider located in Greater Asia. On occasion, we may utilize additional facilities to support our seasonal warehousing needs. Damage to, or prolonged interruption of operations at, any of these facilities due to a work stoppage, weather conditions such as a tornado, hurricane or flood, other natural disaster, or other event could have a material adverse effect on our financial condition, results of operations and cash flows.
We face significant competition in the retail industry, which could impact our ability to compete successfully against existing or future competition.
The children's apparel retail market is highly competitive and we face heightened price and promotional competition. We compete in substantially all of our markets with Target Corporation, GapKids, babyGap and Old Navy (each of which is a division of The Gap, Inc.), The Gymboree Corporation, Justice (a division of The Ascena Retail Group, Inc.), Carter's, Inc., J.C. Penney Company, Inc., Kohl's Corporation and other department stores, as well as other discount stores such as Walmart Stores, Inc. We also compete with a wide variety of specialty stores, other national and regional retail chains, catalog companies and Internet retailers. One or more of our competitors are present in virtually all of the areas in which we have stores. We have observed that Internet retailers operate at a lower cost and do not incur the geographical limitations suffered by traditional brick and mortar stores, giving Internet retailers a competitive advantage to and imposing significant pricing pressure on brick and mortar stores. In addition, our e-commerce store may divert sales from our brick and mortar stores, cannibalizing sales results at our brick and mortar stores. Many of our competitors are larger than us and have access to significantly greater financial, marketing and other resources than we have. Increased competition, declining birth rates, increased promotional activity and continuing economic pressure on value seeking consumers could also impact our ability to compete successfully. We may not be able to continue to compete successfully against existing or future competition.
We may be unable to protect our trademarks and other intellectual property rights.
We believe that our trademarks and service marks are important to our success and our competitive position due to their name recognition with our customers. We devote substantial resources to the establishment and protection of our trademarks and service marks on a worldwide basis, including in the countries in which we have business operations or plan to have
17
Table of Contents
business operations, including through foreign franchise partners. We are not aware of any material claims of infringement or material challenges to our right to use any of our trademarks in the United States or Canada. Nevertheless, the actions we have taken, including to establish and protect our trademarks and service marks, may not be adequate to prevent others from imitating our products or to prevent others from seeking to block sales of our products. Also, others may assert proprietary rights in our intellectual property and we may not be able to successfully resolve these types of conflicts to our satisfaction. In addition, the laws of certain foreign countries may not protect our proprietary rights to the same extent as do the laws of the United States and we may not be successful in attaining our trademarks in foreign countries where we plan to conduct business.
Because certain of our subsidiaries operate outside of the United States, some of our revenues, product costs and other expenses are subject to foreign economic and currency risks.
We have store operations in Canada and buying operations in various locations in Greater Asia, primarily Hong Kong, and we have plans to continue to expand our store operations internationally primarily through franchises.
The currency market has seen significant volatility in the value of the U.S. dollar against other foreign currencies. While our business is primarily conducted in U.S. dollars, we purchase virtually all of our products overseas, and we generate significant revenues in Canada in Canadian dollars. Cost increases caused by currency exchange rate fluctuations could make our products less competitive or have a material adverse effect on our profitability. Currency exchange rate fluctuations could also disrupt the business of the third party manufacturers that produce our products, or franchisees that purchase our products, by making their purchases of raw materials or products more expensive and more difficult to finance.
Approximately 12% of our consolidated net sales and approximately 13% of our total operating expenses are transacted in foreign currencies. Changes in currency exchange rates affect the U.S. dollar value of the Canadian dollar denominated prices at which our Canadian business sells product. As a result, fluctuations in exchange rates impact the amount of our reported sales and expenses, which could have a material adverse effect on our financial position, results of operations and cash flows. Additionally, we have foreign currency denominated receivables and payables that are not hedged against foreign currency fluctuations. When settled, these receivables and payables could result in significant transaction gains or losses.
We depend on generating sufficient cash flows, together with our existing cash balances and availability under our credit facility, to fund our ongoing operations, capital expenditures, debt service requirements and share repurchase program or payment of dividends.
Our ability to fund our ongoing operations, planned capital expenditures, share repurchase programs, payment of dividends and debt service requirements will depend on our ability to generate cash flows. Our cash flows are dependent on many factors, including:
• | seasonal fluctuations in our net sales and net income, which typically are lowest in the second fiscal quarter; |
• | the timing of inventory purchases for upcoming seasons, particularly in the second fiscal quarter as our sales are lowest and we are purchasing merchandise for the back-to-school season; |
• | vendor, other supplier and agent terms and related conditions, which may be less favorable to us as a smaller company in comparison to larger companies; and |
• | general business conditions, economic uncertainty or slowdown, including the continuing weakness in the overall economy. |
Most of these factors are beyond our control. It is difficult to predict the impact that general economic conditions will continue to have on consumer spending and our financial results. However, we believe that they will continue to result in reduced spending by our target customer, which would reduce our revenues and our cash flows from operating activities from those that otherwise would have been generated. In addition, steps that we may take to limit cash outlays, such as delaying the purchase of inventory, may not be successful or could delay the arrival of merchandise for future selling seasons, which could reduce our net sales or profitability. If we are unable to generate sufficient cash flows, we may not be able to fund our ongoing operations, planned capital expenditures, share repurchase programs, payment of dividends or potential debt service requirements and we may be required to seek additional sources of liquidity.
In addition, at January 31, 2015, approximately $154.7 million, or 89%, of our cash was held in foreign subsidiaries. Because our investments in these foreign subsidiaries are considered permanently reinvested, any repatriation of cash from them would require the accrual and payment of U.S. federal and certain state taxes, which would negatively impact our results of operations and/or the amount of available funds. While we currently have no intention to repatriate cash from these subsidiaries, should the need arise domestically, there is no guarantee that we could do so without material adverse tax consequences. In addition, these funds are subject to foreign currency exchange rate fluctuations, which if these rates should move unfavorably, could cause a material decrease in available funds.
18
Table of Contents
Negative changes in the economy, such as deterioration in the U.S. and/or global economic environment, and resulting declines in consumer confidence and spending, could continue to have an adverse effect on the apparel industry and on our operating results.
The apparel industry is cyclical in nature and is particularly affected by adverse trends in the general economy. Purchases of apparel and related merchandise are generally discretionary and therefore tend to decline during recessionary and weak economic periods and also may decline at other times. This is particularly true with our target customer who is a value conscious, lower to middle income mother buying for infants and children based on need rather than based on fashion, trend or impulse. Increases in tax rates, declines in real estate values, reduced credit lending by banks, high unemployment levels, increased pressure on value seeking consumers and significant volatility in the global financial markets have negatively impacted the level of consumer spending for discretionary items. This has and continues to adversely affect our business as it is dependent on consumer demand for our products. In North America, we have experienced a decrease in customer traffic, including at shopping malls, and a highly promotional environment. If the global macroeconomic environment continues to be weak or deteriorates further, there will likely be a negative effect on our revenues, operating margins and earnings which could materially adversely affect our financial position, results of operations and cash flows.
In addition to the factors contributing to the current economic environment, there are a number of other factors that could contribute to reduced levels of consumer spending, such as increases in interest rates, fluctuating food, fuel and other energy costs, and increases in tax rates. Similarly, natural disasters, political unrest, actual or potential terrorist acts and other conflicts can also create significant instability and uncertainty in the world, causing consumers to defer purchases or preventing our suppliers and service providers from providing required services or materials to us. These or other factors could materially and adversely affect our financial position, results of operations and cash flows.
Changes in federal, state or local law, or our failure to comply with such laws, could increase our expenses and expose us to legal risks.
Changes in regulatory areas, such as privacy and information security, product safety, consumer credit, healthcare or environmental protection, among others, could cause our expenses to increase. In addition, if we fail to comply with applicable laws and regulations, particularly wage and hour laws, privacy laws or data collection and security laws, we could be subject to legal and reputational risk, including government enforcement action and class action civil litigation, which could have a material adverse effect on our financial position, results of operations and cash flows. Changes in tax laws, the interpretation of existing laws, or our failure to sustain our reporting positions on examination could adversely affect our effective tax rate and/or subject us to significant penalties and interest.
Our business is subject to a wide array of laws and regulations. Significant legislative or regulatory changes that impact our relationship with our workforce or our customers could increase our expenses and adversely affect our operations. None of our employees are currently represented by a collective bargaining agreement. However, from time to time there have been efforts to organize our employees at various locations. There is no assurance that our employees will not unionize in the future.
If our landlords should suffer financial difficulty or if we are unable to successfully negotiate acceptable lease terms, it could have an adverse effect on our business and results of operations and cash flows.
Currently, approximately 62% of our stores are located in malls, approximately 22% are located in strip centers, approximately 12% are located in outlet centers and approximately 4% are located in street stores. If any of our landlords should suffer financial difficulty, it could render them unable to fulfill their duties under our lease agreements. Such duties include providing a sufficient number of mall co-tenants, common area maintenance, utilities, and payment of real estate taxes. While we have certain remedies under our lease agreements, the loss of business that could result if a shopping center should close or if customer traffic were to significantly decline as a result of lost tenants or improper care of the facilities could have a material adverse effect on our financial position, results of operations and cash flows.
The leases for most of our existing stores are for initial terms of 10 years. If we are unable to continue to negotiate acceptable lease and renewal terms, it could have a material adverse effect on our financial position, results of operations and cash flows.
Tax matters could impact our results of operations and financial condition.
We are subject to income taxes in the United States and foreign jurisdictions, including Canada and Hong Kong. Our provision for income taxes and cash tax liability in the future could be adversely affected by numerous factors including, but not limited to, income before taxes being lower than anticipated in countries with lower statutory tax rates and higher than anticipated in countries with higher statutory tax rates, changes in the valuation of deferred tax assets and liabilities, and
19
Table of Contents
changes in tax laws, regulations, accounting principles or interpretations thereof, which could adversely impact our results of operations, financial condition and cash flows in future periods. In addition, we are subject to the examination of our income tax returns by the Internal Revenue Service, Revenue Canada and other tax authorities. We regularly assess the likelihood of adverse outcomes resulting from these examinations to determine the adequacy of our provision for income taxes. There can be no assurance that the outcomes from these continuous examinations will not have an adverse effect on our financial position, results of operations and cash flows.
Any disruption in, or changes to, our consumer credit arrangements, including our private label credit card agreement, may adversely affect the ability of our customers to obtain consumer credit.
Credit card operations are subject to numerous federal and state laws that impose disclosure and other requirements upon the origination, servicing and enforcement of credit accounts and limitations on the maximum amount of finance charges that may be charged by a credit provider. Additionally, during periods of increasing consumer credit delinquencies, financial institutions may reexamine their lending practices and procedures. There can be no assurance that the delinquencies being experienced by providers of consumer credit generally would not cause providers of third party credit offered by us to decrease the availability of, or increase the cost of such credit.
Any of the above risks, individually or in aggregation, could have a material adverse effect on the way we conduct business and could negatively impact our financial position, results of operations and cash flows.
Pending legal and regulatory actions are inherent in our business and could adversely affect our results of operations or financial position or harm our businesses or reputation.
We are, and in the future may be, subject to legal and regulatory actions in the ordinary course of our business. Some of these proceedings have been brought on behalf of various alleged classes of complainants. In certain of these matters, the plaintiffs are seeking large and/or indeterminate amounts, including treble, punitive or exemplary damages. Substantial legal liability in these or future legal or regulatory actions could have a material adverse effect on us or cause us reputational harm, which in turn could harm our business prospects.
Our litigation and regulatory matters are subject to many uncertainties, and given their complexity and scope, their outcome cannot be predicted. Our reserves for litigation and regulatory matters may prove to be inadequate. Litigation and regulatory matters could materially adversely affect our results of operations or cash flows. In light of the unpredictability of our litigation and regulatory matters, it is also possible that in certain cases an ultimately unfavorable resolution of one or more pending litigation or regulatory matters could have a material adverse effect on our financial position, results of operations and cash flows.
Legislative actions and new accounting pronouncements could result in us having to increase our administrative expenses to remain compliant.
In order to comply with the Sarbanes-Oxley Act of 2002, the Dodd-Frank Wall Street Reform and Consumer Protection Act of 2010, future accounting guidance or disclosure requirements by the SEC, future guidance that may come from the Public Company Accounting Oversight Board ("PCAOB"), or future changes in listing standards by the Nasdaq Global Select Market, we may be required to enhance our internal controls, hire additional personnel and utilize additional outside legal, accounting and advisory services, all of which could cause our general and administrative expenses to increase.
Changes to existing authoritative guidance and regulations may materially impact our financial statements. The FASB is continuing its convergence efforts with its international counterpart, the International Accounting Standards Board, to converge U.S. and International GAAP into one uniform set of accounting rules. The effect of changing accounting rules on our financial statements could be significant. Changes to our financial position, results of operations or cash flows could impact our debt covenant ratios or a lender's perception of our financial statements causing an adverse impact on our ability to obtain credit, or could impact investor analyses and perceptions of our business causing the market value of our stock to decrease. In addition, any changes in the current accounting rules, including legislative and other proposals, could increase the expenses we report under U.S. GAAP and have a material adverse effect on our financial position, results of operations and cash flows.
Our share price may be volatile.
Our common stock is quoted on the Nasdaq Global Select Market. Stock markets in general have experienced, and are likely to continue to experience, price and volume fluctuations, which could have a material adverse effect on the market price of our common stock without regard to our operating performance. In addition, we believe that factors such as quarterly fluctuations in our financial results, our Comparable Retail Sales results, other risk factors identified here, announcements by other retailers, the overall economy and the geopolitical environment could individually or in aggregation cause the price of our common stock to fluctuate substantially.
20
Table of Contents
We initiated the payment of a quarterly cash dividend in Fiscal 2014. Future declarations of quarterly cash dividends, and the establishment of future record and payment dates, are at the discretion of our Board of Directors based on a number of factors, including future financial performance, general business and market conditions, and other investment priorities. Any reduction or discontinuance by us of the payment of quarterly cash dividends could cause the market price of our common stock to decline.
Acts of terrorism, effects of war, natural disasters, other catastrophes or political unrest could have a material adverse effect on our business.
The threat or actual acts of terrorism continue to be a risk to the global economy. Terrorism and potential military responses, political unrest, natural disasters, pandemics or other health issues have disrupted and could disrupt commerce, impact our ability to operate our stores in affected areas, impact our ability to import our products from foreign countries or impact our ability to provide critical functions necessary to the operation of our business. A disruption of commerce, or an inability to recover critical functions from such a disruption, could interfere with the production, shipment or receipt of our merchandise in a timely manner or increase our costs to do so, which could have a material adverse impact on our financial position, results of operations and cash flows. In addition, any of the above disruptions could undermine consumer confidence, which could negatively impact consumer spending patterns or customer traffic, and thus have a material adverse impact on our financial position, results of operations and cash flows.
ITEM 1B.-UNRESOLVED STAFF COMMENTS
None.
ITEM 2.-PROPERTIES
We lease all of our existing store locations in the United States, Puerto Rico and Canada, with lease terms expiring through 2025. The average unexpired lease term for our stores is approximately 4.4 years in the United States (including Puerto Rico) and approximately 5.0 years in Canada. The leases for most of our existing stores are for initial terms of 10 years and provide for contingent rent based upon a percentage of sales in excess of specific minimums. We anticipate that we will be able to extend those leases which we wish to extend on satisfactory terms as they expire, or relocate to desirable locations.
The following table sets forth information with respect to our non-store locations as of January 31, 2015:
Location |
| Use |
| Approximate Sq. Footage |
| Current Lease Term Expiration | |
Fort Payne, AL (1) |
| Warehouse Distribution Center |
| 700,000 | |
| Owned |
Ontario, Canada (2) |
| Warehouse Distribution Center |
| 95,000 | |
| 4/30/2019 |
500 Plaza Drive, Secaucus, NJ (3) |
| Corporate Offices |
| 200,000 | |
| 5/31/2029 |
Hong Kong, China (3) |
| Product Support |
| 28,000 | |
| 4/30/2015 |
Shanghai, China (3) |
| Product Support |
| 2,200 | |
| 8/10/2016 |
Gurgaon, India (3) |
| Product Support |
| 11,000 | |
| 5/14/2015 |
Dhaka, Bangladesh (3) |
| Product Support |
| 5,600 | |
| 11/30/2015 |
Ho Chi Minh City, Vietnam (3) |
| Product Support |
| 2,000 | |
| 12/31/2016 |
(1) | Supports The Children's Place U.S. stores and e-commerce business. |
(2) | Supports The Children's Place Canadian stores. |
(3) | Supports both The Children's Place U.S. stores, our e-commerce business, The Children's Place Canadian stores and our international franchisees. |
During the first quarter of Fiscal 2012, our management approved a plan to exit our West Coast DC and move the operations to our Southeast DC. We ceased operations at our West Coast DC in May 2012. The lease of our West Coast DC expires in March 2016 and we have subleased this facility through March 2016.
During the third quarter of Fiscal 2012, our management approved a plan to close our Northeast DC and move the operations to the Company's Southeast DC. We ceased operations in our Northeast DC during the fourth quarter of Fiscal 2012. The lease of our Northeast DC expires in January 2021 and we have subleased this facility through January 2021.
On occasion, we may utilize additional facilities to support seasonal warehousing needs.
21
Table of Contents
ITEM 3.-LEGAL PROCEEDINGS
We are involved in various legal proceedings arising in the normal course of business. In the opinion of management, any ultimate liability arising out of these proceedings will not have a material effect on our financial position , results of operations or cash flows.
ITEM 4.-MINE SAFETY DISCLOSURES
Not applicable.
PART II
ITEM 5.-MARKET FOR REGISTRANT'S COMMON EQUITY AND RELATED STOCKHOLDER MATTERS AND ISSUER PURCHASES OF EQUITY SECURITIES
Our common stock is listed on the Nasdaq Global Select Market, or Nasdaq, under the symbol "PLCE." The following table sets forth the range of high and low sales prices on Nasdaq of our common stock for the fiscal periods indicated.
|
| High |
| Low | ||||
2014 |
|
|
|
| ||||
First Quarter |
| | $55.10 | |
| | $47.25 | |
Second Quarter |
| 51.30 | |
| 45.49 | | ||
Third Quarter |
| 54.38 | |
| 47.07 | | ||
Fourth Quarter |
| 63.65 | |
| 47.75 | | ||
|
|
|
|
| ||||
2013 |
|
|
|
| ||||
First Quarter |
| | $51.61 | |
| | $44.51 | |
Second Quarter |
| 57.06 | |
| 49.29 | | ||
Third Quarter |
| 58.02 | |
| 51.40 | | ||
Fourth Quarter |
| 57.42 | |
| 51.88 | | ||
On March 24, 2015, the last reported sale price of our common stock was $63.83 per share, the number of holders of record of our common stock was approximately 60 and the number of beneficial holders of our common stock was approximately 8,200.
The Company's Board of Directors has authorized the following share repurchase programs: (1) $100.0 million on November 26, 2012 (the "2012 Share Repurchase Program"); and (2) $100.0 million on March 3, 2014 (the "2014 Share Repurchase Program"). At January 31, 2015, the 2012 Share Repurchase Program had been completed, and there was approximately $39.8 million remaining on the 2014 Share Repurchase Program. On January 7, 2015, the Board of Directors authorized a $100 million share repurchase program (the "2015 Share Repurchase Program"). Under the 2014 Share Repurchase Program and the 2015 Share Repurchase Program, the Company may repurchase shares in the open market at current market prices at the time of purchase or in privately negotiated transactions. The timing and actual number of shares repurchased under the program will depend on a variety of factors including price, corporate and regulatory requirements, and other market and business conditions. We may suspend or discontinue the program at any time, and may thereafter reinstitute purchases, all without prior announcement.
Additionally, in March 2014, our Board of Directors instituted the payment of a quarterly cash dividend and during Fiscal 2014 we paid cash dividends of $11.5 million. The Board of Directors authorized a quarterly cash dividend of $0.15 per share to be paid on April 30, 2015 to shareholders of record on the close of business on April 9, 2015. Future declarations of quarterly dividends and the establishment of future record and payment dates are subject to approval by the Company's Board of Directors based on a number of factors, including business and market conditions, the Company's future financial performance and other investment priorities.
22
Table of Contents
|
| Fiscal Year Ended January 31, 2015 | ||||||||||||||||||
|
| First Quarter |
| Second Quarter |
| Third Quarter |
| Fourth Quarter |
| Fiscal 2014 | ||||||||||
Cash dividends declared and paid per common share |
| $ | 0.1325 | |
| $ | 0.1325 | |
| $ | 0.1325 | |
| $ | 0.1325 | |
| $ | 0.53 | |
|
|
|
|
|
|
|
|
|
|
| ||||||||||
Cash dividends paid (in thousands) |
| $ | 2,938 | |
| $ | 2,892 | |
| $ | 2,854 | |
| $ | 2,807 | |
| $ | 11,491 | |
Pursuant to restrictions imposed by our equity plan during black-out periods, we withhold and retire shares of vesting stock awards in exchange for payments to satisfy minimum withholding tax requirements. Our payment of the withholding taxes in exchange for the shares constitutes a purchase of our common stock. Also, we acquire shares of our common stock in conjunction with liabilities owed under a deferred compensation plan, which are held in treasury. The following table summarizes our share repurchases (in thousands):
|
| Fiscal Year Ended | ||||||||
|
| January 31, 2015 |
| February 1, 2014 | ||||||
|
| Shares | Value |
| Shares | Value | ||||
Share repurchases related to: |
|
|
|
|
|
| ||||
2012 Share buyback program |
| 282 | | 14,671 | |
| 1,296 | | 65,691 | |
2014 Share buyback program (1) |
| 1,189 | | 60,209 | |
| - | | - | |
Withholding taxes |
| 22 | | 1,249 | |
| 2 | | 139 | |
Shares acquired and held in treasury |
| 2 | | 107 | |
| 9 | | 456 | |
(1) | Subsequent to January 31, 2015 and through March 24, 2015, we repurchased an additional 0.2 million shares for approximately $13.3 million . |
The following table provides a month-to-month summary of our share repurchase activity during the 13 weeks ended January 31, 2015:
Period |
| Total Number of Shares Purchased |
| Average Price Paid per Share |
| Total Number of Shares Purchased as Part of Publicly Announced Plans or Programs |
| Approximate Dollar Value (in thousands) of Shares that May Yet Be Purchased Under the Plans or Programs | ||||
11/2/14-11/29/14 (1) |
| 108,436 |
| | $51.20 | |
| 106,313 |
| | $50,514 | |
11/30/14-1/3/15 (2) |
| 130,239 |
| 55.63 | |
| 130,100 |
| 43,277 | |||
1/4/14-1/31/15 (3) |
| 56,730 |
| 60.68 | |
| 56,600 |
| 39,841 | |||
Total |
| 295,405 |
| | $54.98 | |
| 293,013 |
| | $39,841 | |
(1) | Includes 1,345 shares acquired as treasury stock as directed by participants in the Company's deferred compensation plan and 778 shares withheld to cover taxes in conjunction with the vesting of a stock award. |
(2) Includes 139 shares withheld to cover taxes in conjunction with the vesting of a stock award.
(3) | Includes 130 shares withheld to cover taxes in conjunction with the vesting of a stock award. |
23
Table of Contents
Equity Plan Compensation Information
On May 20, 2011, our shareholders approved the 2011 Equity Incentive Plan (the "2011 Equity Plan"). Upon adoption of the 2011 Equity Plan, we ceased issuing awards under the 2005 Equity Incentive Plan (together with the 1997 Stock Option Plan, the "Prior Plans"). The following table provides information as of January 31, 2015, about the shares of our Common Stock that may be issued under our equity compensation plans.
|
| COLUMN (A) |
| COLUMN (B) |
| COLUMN (C) | ||
Plan Category |
| Securities to be issued upon exercise of outstanding options (1) |
| Weighted average exercise price of outstanding options |
| Securities remaining available for future issuances under equity compensation plans (excluding securities reflected in Column (A)) (2) | ||
Equity Compensation Plans |
| 30,000 |
| | $29.05 | |
| 904,283 |
Equity Compensation Plans Not |
| N/A |
| N/A |
| N/A | ||
Total |
| 30,000 |
| | $29.05 | |
| 904,283 |
____________________________________________
(1) | Amount consists of 30,000 shares issuable under our 2005 Equity Incentive Plan. |
(2) | Includes shares forfeited or withheld to cover taxes related to awards granted under the Prior Plans, which are available for future issuances under the 2011 Equity Plan. |
24
Table of Contents
Performance Graph
The following graph compares the cumulative stockholder return on our common stock with the return on the CRSP Total Return Index for the NASDAQ Stock Market (US Companies) and CRSP Total Return Index for the NASDAQ Retail Trade. The graph assumes that $100 was invested on January 30, 2010 in each of our common stock, the CRSP Total Return Index for the NASDAQ Stock Market (US Companies) and the CRSP Total Return Index for the NASDAQ Retail Trade.
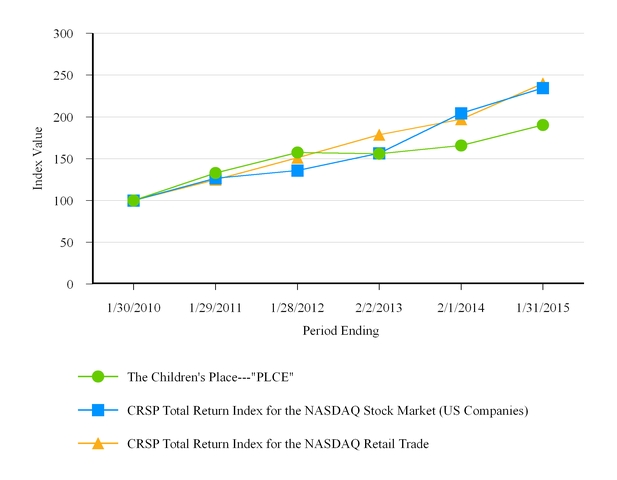
The table below sets forth the closing price of our Common Stock and the closing indices for the CRSP Total Return Index for the NASDAQ Stock Market (US Companies) and CRSP Total Return Index for the NASDAQ Retail Trade on the last day of each of our last six fiscal years.
|
| 2009 |
| 2010 |
| 2011 |
| 2012 |
| 2013 |
| 2014 | ||||||
The Children's Place---"PLCE" |
| 31.800 | |
| 42.270 | |
| 50.050 | |
| 49.530 | |
| 52.670 | |
| 59.950 | |
CRSP Total Return Index for the NASDAQ Stock Market (US Companies) |
| 579.464 | |
| 742.933 | |
| 1,011.628 | |
| 1,163.278 | |
| 1,518.350 | |
| 1,736.188 | |
CRSP Total Return Index for the NASDAQ Retail Trade |
| 463.164 | |
| 577.479 | |
| 699.415 | |
| 827.442 | |
| 912.911 | |
| 1,111.523 | |
The table below assumes that $100 was invested on January 30, 2010 in each of our common stock, CRSP Total Return Index for the NASDAQ Stock Market (US Companies) and CRSP Total Return Index for the NASDAQ Retail Trade.
25
Table of Contents
|
| 2009 |
| 2010 |
| 2011 |
| 2012 |
| 2013 |
| 2014 | |||
The Children's Place---"PLCE" |
| 100.000 | |
| 132.920 | |
| 157.390 | |
| 155.75 |
| 165.63 |
| 190.42 |
CRSP Total Return Index for the NASDAQ Stock Market (US Companies) |
| 100.000 | |
| 126.710 | |
| 135.890 | |
| 156.53 |
| 204.44 |
| 234.68 |
CRSP Total Return Index for the NASDAQ Retail Trade |
| 100.000 | |
| 124.670 | |
| 151.010 | |
| 178.64 |
| 197.07 |
| 239.97 |
ITEM 6.-SELECTED FINANCIAL DATA
We are the largest pure-play children's specialty apparel retailer in North America. As of January 31, 2015, we operated 1,097 The Children's Place stores across North America and an online store at www.childrensplace.com. The following table sets forth certain historical financial and operating data for the Company. The selected consolidated financial information presented below is derived from our audited Consolidated Financial Statements for each of the five years in the period ended January 31, 2015. The information contained in this table should be read in conjunction with Management's Discussion and Analysis of Financial Condition and Results of Operations, and the audited consolidated financial statements and notes thereto included elsewhere herein.
26
Table of Contents
|
| Fiscal Year Ended (1) | ||||||||||||||||||
Statement of Operations Data (in thousands, except per share and square footage data): |
| January 31, 2015 |
| February 1, 2014 |
| February 2, 2013 |
| January 28, 2012 |
| January 29, 2011 | ||||||||||
Net sales |
| | $1,761,324 | |
| | $1,765,789 | |
| | $1,809,486 | |
| | $1,715,862 | |
| | $1,673,999 | |
Cost of sales |
| 1,139,024 | |
| 1,110,268 | |
| 1,118,046 | |
| 1,056,213 | |
| 1,013,878 | | |||||
Gross profit |
| 622,300 | |
| 655,521 | |
| 691,440 | |
| 659,649 | |
| 660,121 | | |||||
Selling, general and administrative expenses |
| 470,686 | |
| 485,653 | |
| 510,918 | |
| 477,425 | |
| 456,558 | | |||||
Asset impairment charges (2) |
| 11,145 | |
| 29,633 | |
| 2,284 | |
| 2,208 | |
| 2,713 | | |||||
Other costs (income) (3) |
| (68 | ) |
| (906 | ) |
| 11,088 | |
| - | |
| - | | |||||
Depreciation and amortization |
| 60,494 | |
| 64,858 | |
| 77,435 | |
| 74,573 | |
| 71,640 | | |||||
Operating income |
| 80,043 | |
| 76,283 | |
| 89,715 | |
| 105,443 | |
| 129,210 | | |||||
Interest income (expense), net |
| (168 | ) |
| 265 | |
| (20 | ) |
| (690 | ) |
| (1,530 | ) | |||||
Income before income taxes |
| 79,875 | |
| 76,548 | |
| 89,695 | |
| 104,753 | |
| 127,680 | | |||||
Provision for income taxes |
| 22,987 | |
| 23,522 | |
| 26,452 | |
| 30,408 | |
| 47,920 | | |||||
Net income |
| 56,888 | |
| 53,026 | |
| 63,243 | |
| 74,345 | |
| 79,760 | | |||||
|
|
|
|
|
|
|
|
|
|
| ||||||||||
Diluted income per common share |
| $ | 2.59 | |
| $ | 2.32 | |
| $ | 2.61 | |
| $ | 2.90 | |
| $ | 2.91 | |
|
|
|
|
|
|
|
|
|
|
| ||||||||||
Cash dividends declared and paid per common share (4) |
| $ | 0.53 | |
| - | |
| - | |
| - | |
| - | | ||||
|
|
|
|
|
|
|
|
|
|
| ||||||||||
Selected Operating Data for Continuing Operations: |
|
|
|
|
|
|
|
|
|
| ||||||||||
Number of Company operated stores open at end of period |
| 1,097 | |
| 1,107 | |
| 1,095 | |
| 1,049 | |
| 995 | | |||||
Comparable retail sales increase (decrease) |
| 0.4 | % |
| (2.8 | )% |
| 2.0 | % |
| (2.5 | )% |
| (2.5 | )% | |||||
Average net sales per store (5) |
| $ | 1,316 | |
| $ | 1,354 | |
| $ | 1,393 | |
| $ | 1,492 | |
| $ | 1,587 | |
Average square footage per store (6) |
| 4,675 | |
| 4,704 | |
| 4,791 | |
| 4,903 | |
| 4,943 | | |||||
Average net sales per square foot (7) |
| $ | 280 | |
| $ | 285 | |
| $ | 300 | |
| $ | 299 | |
| $ | 318 | |
|
|
|
|
|
|
|
|
|
|
| ||||||||||
Balance Sheet Data (in thousands): |
|
|
|
|
|
|
|
|
|
| ||||||||||
Working capital (8) |
| $ | 334,812 | |
| $ | 357,971 | |
| $ | 353,729 | |
| $ | 357,373 | |
| $ | 365,736 | |
Total assets |
| 958,618 | |
| 990,630 | |
| 923,410 | |
| 866,252 | |
| 872,762 | | |||||
Long-term debt |
| - | |
| - | |
| - | |
| - | |
| - | | |||||
Stockholders' equity |
| 589,118 | |
| 616,778 | |
| 620,949 | |
| 624,969 | |
| 626,157 | | |||||
____________________________________________
(1) | The period ending February 2, 2013 was a 53-week year. All other periods presented were 52-week years. |
(2) | Asset impairment charges generally relate to the write-off of fixed assets related to underperforming stores. In Fiscal 2013, asset impairment charges also included the write-off of obsolete systems. |
(3) | Other costs include exit costs associated with the closures of the West Coast DC and Northeast DC in Fiscal 2012 and additional sublease agreements executed in Fiscal 2013. |
(4) | The Company instituted its quarterly dividend program and paid its first dividend during the first quarter of Fiscal 2014. |
(5) | Average net sales per store represents net sales from stores open throughout the full period divided by the number of such stores. |
(6) | Average square footage per store represents the square footage of stores operated on the last day of the period divided by the number of such stores. |
(7) | Average net sales per square foot represent net sales from stores open throughout the full period divided by the square footage of such stores. |
(8) | Working capital is calculated by subtracting our current liabilities from our current assets. |
27
Table of Contents
ITEM 7.-MANAGEMENT'S DISCUSSION AND ANALYSIS OF FINANCIAL CONDITION
AND RESULTS OF OPERATIONS
The following discussion should be read in conjunction with our audited financial statements and notes thereto included in Item 15.-Exhibits and Financial Statement Schedules. The following discussion contains forward-looking statements that reflect our plans, estimates and beliefs. Our actual results could differ materially from those discussed in the forward-looking statements. Factors that could cause or contribute to such differences include, but are not limited to, those discussed below and elsewhere in this Annual Report on Form 10-K, particularly in Item 1A-Risk Factors.
As used in this Annual Report on Form 10-K, references to the "Company", "The Children's Place", "we", "us", "our" and similar terms refer to The Children's Place, Inc. and its subsidiaries. Our fiscal year ends on the Saturday on or nearest to January 31. Other terms that are commonly used in our management's discussion and analysis of financial condition and results of operations are defined as follows:
• | Fiscal 2014 - The fifty-two weeks ended January 31, 2015 |
• | Fiscal 2013 - The fifty-two weeks ended February 1, 2014 |
• | Fiscal 2012 - The fifty-three weeks ended February 2, 2013 |
• | Fiscal 2015 - Our next fiscal year representing the fifty-two weeks ending January 30, 2016 |
• | FASB- Financial Accounting Standards Board |
• | FASB ASC - FASB Accounting Standards Codification, which serves as the source for authoritative U.S. GAAP, except that rules and interpretive releases by the SEC are also sources of authoritative U.S. GAAP for SEC registrants |
• | GAAP - U.S. Generally Accepted Accounting Principles |
• | SEC- The U.S. Securities and Exchange Commission |
• | Comparable Retail Sales - Net sales, in constant currency, from stores that have been open for at least 14 consecutive months and from our e-commerce store, excluding postage and handling fees. Store closures in the current fiscal year will be excluded from comparable retail sales beginning in the fiscal quarter in which management commits to closure. Stores that temporarily close for non- substantial remodeling will be excluded from comparable retail sales for only the period that they were closed. A store is considered substantially remodeled if it has been relocated or materially changed in size and will be excluded from comparable retail sales for at least 14 months beginning in the period in which the relocation occurred. |
• | Gross Margin - Gross profit expressed as a percentage of net sales |
• | SG&A - Selling, general and administrative expenses |
OVERVIEW
Our Business
We are the largest pure-play children's specialty apparel retailer in North America. We design, contract to manufacture, sell and license to sell fashionable, high-quality, value‑priced merchandise, the substantial majority of which is under our proprietary "The Children's Place", "Place" and "Baby Place" brand names. As of January 31, 2015, we operated 1,097 stores across North America and an online store at www.childrensplace.com.
Segment Reporting
In accordance with the " Segment Reporting " topic of the FASB ASC, we report segment data based on geography: The Children's Place U.S. and The Children's Place International. Each segment includes an e-commerce business located at www.childrensplace.com . Included in The Children's Place U.S. segment are our U.S. and Puerto Rico based stores and revenue from our U.S. wholesale partners. Included in The Children's Place International segment are our Canadian based stores, revenue from the Company's Canada wholesale partner, as well as revenue from international franchisees. We measure our segment profitability based on operating income, defined as income before interest and taxes. Net sales and direct costs are recorded by each segment. Certain inventory procurement functions such as production and design as well as corporate overhead, including executive management, finance, real estate, human resources, legal, and information technology services are managed by The Children's Place U.S. segment. Expenses related to these functions, including depreciation and amortization, are allocated to The Children's Place International segment based primarily on net sales. The assets related to these functions are not allocated. We periodically review these allocations and adjust them based upon changes in business circumstances. Net sales from external customers are derived from merchandise sales and we have no major customers that account for more than 10% of our net sales.
28
Table of Contents
Operating Highlights
Net sales in Fiscal 2014 decreased $4.5 million, or 0.3%, to $1,761.3 million, compared to $1,765.8 million reported in Fiscal 2013. During Fiscal 2014, our Comparable Retail Sales increased 0.4% compared to a decrease of 2.8% during Fiscal 2013. In Fiscal 2014, we opened 25 stores, remodeled 43 stores and closed 35 stores.
Gross Margin decreased 180 basis points to 35.3% during Fiscal 2014 from 37.1% during Fiscal 2013. The decrease in Gross Margin was attributable to an elevated promotional environment, higher supply chain costs and the accelerated sale of inventory in preparation for the planned Fiscal 2015 implementation of our new assortment planning tool.
We continued our international store expansion program with our franchise partners opening 37 additional stores during Fiscal 2014, including 25 in Israel and one store in Panama, bringing our total international franchise store count to 72. During Fiscal 2014 we announced a new franchise agreement with Grupo David to expand into Latin America and the Caribbean and opened our first store in the third quarter of Fiscal 2014, and announced a new franchise agreement with Arvind Lifestyle Brand Limited to open stores in India, with the first store opening slated for mid-2015. In our wholesale business, we added five new accounts and will continue to add accounts and expand categories and distribution to our customers.
We continue to be focused on our business transformation initiatives in an effort to improve sales and margin. During Fiscal 2014 we successfully implemented SAP and upgraded our website platform for our e-commerce business. With the foundation of SAP behind us, we are now focused on deploying our inventory management tools, such as our assortment planning tool, which leverages historical data by store to optimize our buys and better match breadth of assortment with depth of inventory. We are also deploying a new allocation module that uses data and algorithms to forecast demand by store. We expect to begin working with this module for the back-to-school Fiscal 2015 season.
The continued development of our digital capabilities will be critical to our success. In addition to the upgrade of our web platform and the launch of new mobile assets in Fiscal 2014, we have recently completed work on the strategic segmentation of our customers. We now have clear insights into who she is and how she behaves. This enables us to specifically and more efficiently target our communications to the appropriate customer segment. The development of our digital capabilities will also include implementing new tools to accelerate customer acquisition in the second half of Fiscal 2015.
We continue to evaluate our store fleet and now plan to close approximately 200 underperforming stores through fiscal 2017, which includes the 35 stores we closed in Fiscal 2014 and the 41 stores we closed during Fiscal 2013. Our recently completed customer segmentation analysis helps us to better understand customer shopping habits at the store level in order to draw further insights into what an ideal store portfolio should be in the long-term for The Children's Place. The fleet optimization initiative aims to improve store productivity and focus on sales transfers to nearby stores or to our e-commerce business.
As a percentage of net sales, SG&A decreased 80 basis points to 26.7% during Fiscal 2014 from 27.5% during Fiscal 2013. Managing company-wide expenses has been, and will continue to be, a key focus for the entire Company.
During Fiscal 2014, we reported net income of $56.9 million, or $2.59 per diluted share, compared to $53.0 million, or $2.32 per diluted share, in Fiscal 2013.
We continue to be committed to returning capital to shareholders. During Fiscal 2014 we paid cash dividends of $11.5 million and repurchased $74.9 million in stock. Our first quarter 2015 dividend of $0.15 per share, which reflects a 13% increase per share, will be paid on April 30, 2015 to shareholders of record on the close of business on April 9, 2015.
29
Table of Contents
We have subsidiaries whose operating results are based in foreign currencies and are thus subject to the fluctuations of the corresponding translation rates into U.S. dollars. The below table summarizes the average translation rates most impacting our operating results:
|
| Fiscal 2014 |
| Fiscal 2013 |
| Fiscal 2012 |
Average Translation Rates (1) |
|
|
|
|
|
|
Canadian Dollar |
| 0.8980 |
| 0.9647 |
| 1.0024 |
Hong Kong Dollar |
| 0.1290 |
| 0.1289 |
| 0.1289 |
China Yuan Renminbi |
| 0.1617 |
| 0.1630 |
| 0.1586 |
____________________________________________
(1) | The average translation rates are the average of the monthly translation rates used during each fiscal year to translate the respective income statements. The rates represent the U.S. dollar equivalent of each foreign currency. |
For Fiscal 2014, the effects of these translation rate changes on net sales, gross profit and income before income taxes were decreases of $14.7 million, $5.9 million and $1.1 million, respectively. Net sales are affected only by the Canadian dollar translation rates. In addition to the translation rate changes, the gross profit of our Canadian subsidiary is also impacted by its inventory purchases which are priced in U.S. dollars. The effect of the exchange rate on these purchases was a decrease to our gross profit of approximately $1.1 million in Fiscal 2014.
CRITICAL ACCOUNTING POLICIES
The preparation of consolidated financial statements in conformity with U.S. GAAP requires us to make estimates and assumptions that affect the reported amounts of assets and liabilities and the disclosure of contingent assets and liabilities at the date of the financial statements, as well as the reported revenues and expenses during the reported period. In many cases, there are alternative policies or estimation techniques that could be used. We continuously review the application of our accounting policies and evaluate the appropriateness of the estimates used in preparing our financial statements; however, estimates routinely require adjustment based on changing circumstances and the receipt of new or better information. Consequently, actual results could differ from our estimates.
The accounting policies and estimates discussed below include those that we believe are the most critical to aid in fully understanding and evaluating our financial results. Senior management has discussed the development and selection of our critical accounting policies and estimates with the Audit Committee of our Board of Directors, which has reviewed our related disclosures herein.
Inventory Valuation - We value inventory at the lower of cost or market ("LCM"), with cost determined using an average cost method. We capitalize supply chain costs in inventory and these costs are reflected in cost of sales as the inventories are sold. We review our inventory levels in order to identify slow-moving merchandise and use markdowns to clear merchandise. We record an adjustment when future estimated selling price is less than cost. Our LCM adjustment calculation requires management to make assumptions to estimate the selling price and amount of slow-moving merchandise subject to markdowns, which is dependent upon factors such as historical trends with similar merchandise, inventory aging, forecasted consumer demand, and the promotional environment. In the LCM calculation any inability to provide the proper quantity of appropriate merchandise in a timely manner, or to correctly estimate the sell-through rate, could have a material impact on our consolidated financial statements. Our historical estimates have not differed materially from actual results and a 10% difference in our LCM reserve as of January 31, 2015 would have impacted net income by approximately $0.1 million. Our reserve balance at January 31, 2015 was approximately $1.9 million compared to $4.3 million at February 1, 2014, as a result of a decline in carryover inventory.
Additionally, we adjust our inventory based upon an annual physical inventory, which is taken during the last quarter of the fiscal year. Based on the results of our historical physical inventories, an estimated shrink rate is used for each successive quarter until the next annual physical inventory, or sooner if facts or circumstances should indicate differently. A 0.5% difference in our shrinkage rate as a percentage of cost of goods sold could impact each quarter's net income by approximately $0.6 million.
Stock-Based Compensation - We account for stock-based compensation according to the provisions of the " Compensation-Stock Compensation " topic of the FASB ASC.
Time Vesting and Performance-Based Awards
We generally grant time vesting and performance-based stock awards to employees at management levels and above. We also grant time vesting stock awards to our non-employee directors. Time vesting awards are granted in the form of restricted
30
Table of Contents
stock units that require each recipient to complete a service period ("Deferred Awards"). Deferred Awards granted to employees generally vest ratably over three years. Deferred Awards granted to non-employee directors generally vest after one year. Performance-based stock awards are granted in the form of restricted stock units which have a performance criteria that must be achieved for the awards to be earned in addition to a service period requirement ("Performance Awards"). For Performance Awards issued during fiscal 2013 and to our CEO in fiscal 2014, each award has a defined number of shares that an employee can earn (the "Target Shares"), and based on the adjusted operating income level achieved for the three-fiscal year period (one-fiscal year in the case of the CEO's Performance Award), the employee can earn from 0% to 200% of their Target Shares. The fair value of all awards granted is based on the closing price of our common stock on the grant date. For non-CEO Performance Awards issued during fiscal 2014 ("2014 Performance Awards"), the Target Shares earned can range from 0% to 300% and depend on the achievement of adjusted earnings per share for the three-fiscal year performance period and our total shareholder return ("TSR") relative to that of companies in our peer group for the same period. 2014 Performance Awards generally cliff vest, if earned, after a three year service period. The 2014 Performance Awards grant date fair value was estimated using a Monte Carlo simulation covering the period from the valuation date through the end of the performance period using our simulated stock price as well as the TSR of companies in our peer group. Compensation expense is recognized ratably over the related service period reduced for estimated forfeitures of those awards not expected to vest due to employee turnover. While actual forfeitures could vary significantly from those estimated, a 10% change in our estimated forfeiture rate would impact our Fiscal 2014 net income by approximately $0.5 million.
The expense for Performance Awards is based on the number of shares we estimate will vest as a result of our earnings-to-date plus our estimate of future earnings for the performance periods. To the extent that actual operating results for fiscal years 2014, 2015 and 2016 differ from our estimates, future performance share compensation expense could be significantly different. For Performance Awards issued during Fiscal 2013 for which the performance period has not yet concluded a 25% increase or decrease in our annual projected adjusted operating income would have caused an approximate $0.5 million increase or decrease, respectively, to stock-based compensation expense for Fiscal 2014. For 2014 Performance Awards for which the performance period has not yet concluded a 10% increase or decrease in our cumulative projected adjusted earnings per share would have caused an approximate $0.8 million increase or a $0.5 million decrease, respectively, to stock-based compensation expense for Fiscal 2014 .
Stock Options
We have not issued stock options since fiscal 2008; however, certain issued stock options remain outstanding. The fair value of all outstanding stock options was estimated using the Black-Scholes option pricing model based on a Monte Carlo simulation, which requires extensive use of accounting judgment and financial estimates, including estimates of how long employees will hold their vested stock options before exercise, the estimated volatility of our common stock over the expected term, and the number of options that will be forfeited prior to the completion of vesting requirements. All exercise prices were based on the average of the high and low of the selling price of our common stock on the grant date. There is no unamortized stock compensation at January 31, 2015.
Insurance and Self-Insurance Liabilities -Based on our assessment of risk and cost efficiency, we self-insure as well as purchase insurance policies to provide for workers' compensation, general liability, and property losses, cyber-security coverage, as well as directors' and officers' liability, vehicle liability and employee medical benefits. We estimate risks and record a liability based upon historical claim experience, insurance deductibles, severity factors and other actuarial assumptions. These estimates include inherent uncertainties due to the variability of the factors involved, including type of injury or claim, required services by the providers, healing time, age of claimant, case management costs, location of the claimant, and governmental regulations. While we believe that our risk assessments are appropriate, these uncertainties or a deviation in future claims trends from recent historical patterns could result in our recording additional or reduced expenses, which may be material to our results of operations. Our historical estimates have not differed materially from actual results and a 10% difference in our insurance reserves as of January 31, 2015 would have impacted net income by approximately $0.7 million.
Impairment of Long-Lived Assets -We periodically review our long-lived assets when events indicate that their carrying value may not be recoverable. Such events include a historical or projected trend of cash flow losses or a future expectation that we will sell or dispose of an asset significantly before the end of its previously estimated useful life. In reviewing for impairment, we group our long-lived assets at the lowest possible level for which identifiable cash flows are largely independent of the cash flows of other assets and liabilities. In that regard, we group our assets into two categories: corporate-related and store-related. Corporate-related assets consist of those associated with our corporate offices, distribution centers and our information technology systems. Store-related assets consist of leasehold improvements, furniture and fixtures, certain computer equipment and lease related assets associated with individual stores.
For store-related assets, we review all stores that have been open for at least two years, or sooner if circumstances should dictate, on at least an annual basis. We believe waiting two years allows a store to reach a maturity level where a more
31
Table of Contents
comprehensive analysis of financial performance can be performed. For each store that shows indications of operating losses, we project future cash flows over the remaining life of the lease and compare the total undiscounted cash flows to the net book value of the related long-lived assets. If the undiscounted cash flows are less than the related net book value of the long-lived assets, they are written down to their fair market value. We primarily determine fair market value to be the discounted future cash flows associated with those assets. In evaluating future cash flows, we consider external and internal factors. External factors comprise the local environment in which the store resides, including mall traffic, competition, and their effect on sales trends. Internal factors include our ability to gauge the fashion taste of our customers, control variable costs such as cost of sales and payroll, and in certain cases, our ability to renegotiate lease costs. With the exception of the current fleet optimization program, historically, less than 2% of our stores required impairment charges in any one year. If external factors should change unfavorably, if actual sales should differ from our projections, or if our ability to control costs is insufficient to sustain the necessary cash flows, future impairment charges could be material. At January 31, 2015, the average net book value per store was approximately $0.2 million.
Income Taxes -We utilize the liability method of accounting for income taxes as set forth in the " Income Taxes" topic of the FASB ASC . Under the liability method, deferred taxes are determined based on the temporary differences between the financial statement and tax basis of assets and liabilities, as well as for net operating losses and tax credit carryforwards. Deferred tax assets and liabilities are measured using currently enacted tax rates that apply to taxable income in effect for the years in which the basis differences and tax assets are expected to be realized. A valuation allowance is recorded when it is more likely than not that some of the deferred tax assets will not be realized. In determining the need for valuation allowances we consider projected future taxable income and the availability of tax planning strategies. If, in the future we determine that we would not be able to realize our recorded deferred tax assets, an increase in the valuation allowance would decrease earnings in the period in which such determination is made.
We assess our income tax positions and record tax benefits for all years subject to examination based upon our evaluation of the facts, circumstances and information available at the reporting date. For those tax positions where it is more likely than not that a tax benefit will be sustained, we have recorded the largest amount of tax benefit with a greater than 50% likelihood of being realized upon ultimate settlement with a taxing authority that has full knowledge of all relevant information. For those income tax positions where it is not more likely than not that a tax benefit will be sustained, no tax benefit has been recognized in the financial statements.
Fair Value Measurement and Financial Instruments- The " Fair Value Measurements and Disclosure " topic of the FASB ASC provides a single definition of fair value, together with a framework for measuring it, and requires additional disclosure about the use of fair value to measure assets and liabilities.
This topic defines fair value as the price that would be received to sell an asset or paid to transfer a liability in an orderly transaction between market participants at the measurement date and establishes a three-level hierarchy, which encourages an entity to maximize the use of observable inputs and minimize the use of unobservable inputs when measuring fair value. The three levels of the hierarchy are defined as follows:
• | Level 1 - inputs to the valuation techniques that are quoted prices in active markets for identical assets or liabilities |
• | Level 2 - inputs to the valuation techniques that are other than quoted prices but are observable for the assets or liabilities, either directly or indirectly |
• | Level 3 - inputs to the valuation techniques that are unobservable for the assets or liabilities |
Our cash and cash equivalents, short-term investments, accounts receivable, accounts payable and credit facility are all short-term in nature. As such, their carrying amounts approximate fair value and fall within Level 1 of the fair value hierarchy. The underlying assets of our Deferred Compensation Plan fall within Level 2 of the fair value hierarchy. The Company stock included in the Deferred Compensation Plan is not subject to fair value measurement.
Our assets measured at fair value on a nonrecurring basis include long-lived assets. We review the carrying amounts of such assets when events indicate that their carrying amounts may not be recoverable. Any resulting asset impairment would require that the asset be recorded at its fair value. The resulting fair value measurements of the assets are considered to be Level 3 inputs.
Recently Adopted Accounting Standards
In May 2014, the FASB issued guidance relating to revenue recognition from contracts with customers. This guidance requires entities to recognize revenue in a way that depicts the transfer of promised goods or services to customers in an amount that reflects the consideration to which the entity expects to be entitled to in exchange for those goods or services. This standard is effective for fiscal years, and interim periods within those years, beginning after December 15, 2016, and is to be applied retrospectively, with early application not permitted. We are currently reviewing the potential impact of this standard.
32
Table of Contents
RESULTS OF OPERATIONS
The following table sets forth, for the periods indicated, selected income statement data expressed as a percentage of net sales. We primarily evaluate the results of our operations as a percentage of net sales rather than in terms of absolute dollar increases or decreases by analyzing the year over year change in our business expressed as a percentage of net sales (i.e. "basis points"). For example, our SG&A expenses decreased approximately 80 basis points to 26.7% of net sales during Fiscal 2014 from 27.5% during Fiscal 2013. Accordingly, to the extent that our sales have increased at a faster rate than our costs (i.e. "leveraging"), the more efficiently we have utilized the investments we have made in our business. Conversely, if our sales decrease or if our costs grow at a faster pace than our sales (i.e. "de-leveraging"), we have less efficiently utilized the investments we have made in our business.
| Fiscal Year Ended | |||||||
| January 31, |
| February 1, |
| February 2, | |||
Net sales | 100.0 | % |
| 100.0 | % |
| 100.0 | % |
Cost of sales (exclusive of depreciation and amortization) | 64.7 | |
| 62.9 | |
| 61.8 | |
Gross profit | 35.3 | |
| 37.1 | |
| 38.2 | |
Selling, general and administrative expenses | 26.7 | |
| 27.5 | |
| 28.2 | |
Asset impairment charge | 0.6 | |
| 1.7 | |
| 0.1 | |
Other (income) costs | - | |
| (0.1 | ) |
| 0.6 | |
Depreciation and amortization | 3.4 | |
| 3.7 | |
| 4.3 | |
Operating income | 4.5 | |
| 4.3 | |
| 5.0 | |
Interest (expense), net | - | |
| - | |
| - | |
Income before income taxes | 4.5 | |
| 4.3 | |
| 5.0 | |
Provision for income taxes | 1.3 | |
| 1.3 | |
| 1.5 | |
Net income | 3.2 | % |
| 3.0 | % |
| 3.5 | % |
Number of stores operated by the Company, end of period | 1,097 | |
| 1,107 | |
| 1,095 | |
____________________________________________
Table may not add due to rounding.
| Fiscal Year Ended | ||||||||||
| January 31, |
| February 1, |
| February 2, | ||||||
Net sales: |
| |
|
| |
|
| | |||
The Children's Place U.S. | $ | 1,528,762 | |
| $ | 1,528,276 | |
| $ | 1,557,549 | |
The Children's Place International (1) | 232,562 | |
| 237,513 | |
| 251,937 | | |||
Total net sales | $ | 1,761,324 | |
| $ | 1,765,789 | |
| $ | 1,809,486 | |
(1) | Net sales from The Children's Place International are primarily derived from revenues from Canadian operations. |
| Fiscal Year Ended | ||||||||||
| January 31, |
| February 1, |
| February 2, | ||||||
Gross profit: |
| |
|
| |
|
| | |||
The Children's Place U.S. | $ | 535,226 | |
| $ | 558,156 | |
| $ | 584,081 | |
The Children's Place International | 87,074 | |
| 97,365 | |
| 107,359 | | |||
Total gross profit | $ | 622,300 | |
| $ | 655,521 | |
| $ | 691,440 | |
Gross Margin: |
|
|
| |
|
| | ||||
The Children's Place U.S. | 35.0 | % |
| 36.5 | % |
| 37.5 | % | |||
The Children's Place International | 37.4 | % |
| 41.0 | % |
| 42.6 | % | |||
Total gross margin | 35.3 | % |
| 37.1 | % |
| 38.2 | % | |||
33
Table of Contents
Fiscal 2014 Compared to Fiscal 2013
Net sales decreased by $4.5 million to $1,761.3 million during Fiscal 2014 from $1,765.8 million during Fiscal 2013. Our net sales decrease resulted from $14.7 million from unfavorable changes in the Canadian exchange rate, partially offset by a Comparable Retail Sales increase of 0.4%, or $5.8 million and a $4.4 million increase in sales from new stores, as well as other sales that did not qualify as comparable sales. Our 0.4% increase in Comparable Retail Sales was primarily the result of a 0.7% increase in the average dollar transaction size, partially offset by a 0.3% decrease in the number of transactions. Total e-commerce sales, which include postage and handling, increased to 15.9% of net sales during Fiscal 2014 from 13.9% during Fiscal 2013.
The Children's Place U.S. net sales increased $0.5 million to $1,528.8 million during Fiscal 2014 compared to $1,528.3 million during Fiscal 2013. Our net sales increase resulted from a U.S. Comparable Retail Sales increase of 0.6%, partially offset by a decrease in sales that did not qualify as comparable sales. Our 0.6% increase in U.S. Comparable Retail Sales was primarily the result of a 0.9% increase in the average dollar transaction size, partially offset by a 0.3% decrease in the number of transactions. Total U.S. e-commerce sales, which include postage and handling, increased to 16.5% of The Children's Place U.S. net sales during Fiscal 2014 from 14.8% during Fiscal 2013.
The Children's Place International net sales decreased $4.9 million, or 2.1%, to $232.6 million during Fiscal 2014 compared to $237.5 million during Fiscal 2013. Our net sales decrease resulted from unfavorable changes in the Canadian exchange rate and a Canadian Comparable Retail Sales decrease of 1.0%, partially offset by an increase in sales from new stores, as well as other sales that did not qualify as comparable sales. Our 1.0% decrease in Canadian Comparable Retail Sales was the result of a 0.7% decrease in the average dollar transaction size and a 0.3% decrease in the number of transactions. Total Canadian e-commerce sales, which include postage and handling, increased to 11.4% of The Children's Place International net sales during Fiscal 2014 from 8.2% during Fiscal 2013.
During Fiscal 2014, we opened 25 stores, consisting of 23 in the United States and two in Canada. We closed 35 stores in Fiscal 2014, 34 in the United States and one in Canada.
Gross profit decreased by $33.2 million to $622.3 million during Fiscal 2014 from $655.5 million during Fiscal 2013. Consolidated Gross Margin decreased approximately 180 basis points to 35.3% during Fiscal 2014 from 37.1% during Fiscal 2013. The decrease in consolidated Gross Margin resulted primarily from an elevated promotional environment, higher supply chain costs and the accelerated sale of inventory in preparation for the planned Fiscal 2015 implementation of our new assortment planning tool.
Gross Margin at The Children's Place U.S. decreased approximately 150 basis points from 36.5% in Fiscal 2013 to 35.0% in Fiscal 2014. The decrease in U.S. Gross Margin resulted primarily from an elevated promotional environment, higher supply chain costs and the accelerated sale of inventory in preparation for the planned Fiscal 2015 implementation of our new assortment planning tool.
Gross Margin at The Children's Place International decreased approximately 260 basis points from 41.0% in Fiscal 2013 to 37.4% in Fiscal 2014. The decrease in International Gross Margin resulted primarily from a de-leverage of fixed costs due to negative Comparable Retail Sales and higher supply chain costs.
Selling, general and administrative expenses decreased $15.0 million to $470.7 million during Fiscal 2014 from $485.7 million during Fiscal 2013. As a percentage of net sales SG&A decreased approximately 80 basis points to 26.7% during Fiscal 2014 from 27.5% during Fiscal 2013 and primarily included the following variances:
• | store expenses decreased approximately $13.6 million, or 70 basis points, primarily due to expense reduction initiatives in payroll, supplies and maintenance costs; and |
• | a decrease in administrative expenses of approximately $1.1 million, or 10 basis points, primarily related to expense reduction initiatives in payroll, corporate expenses and marketing expenses, which resulted primarily from fewer direct mailings, partially offset by increased training costs associated with our ongoing transformation initiatives. |
Asset impairment charges were $11.1 million during Fiscal 2014, related to 74 stores, 44 of which were fully impaired and 30 of which were partially impaired, compared to $29.6 million during Fiscal 2013, $20.5 million of which related to 127 stores, 106 of which were fully impaired and 21 of which were partially impaired. These store impairment charges were recorded as a result of reduced cash flows from revenue and/or gross margins not meeting targeted levels and accelerated store lease termination dates. Additionally, we recorded asset impairment charges of $9.1 million during Fiscal 2013 related to a determination that certain information technology development costs previously incurred were no longer relevant and that certain information technology systems were obsolete.
Depreciation and amortization was $60.5 million during Fiscal 2014 compared to $64.9 million during Fiscal 2013.
34
Table of Contents
Provision for income taxes was $23.0 million during Fiscal 2014 compared to $23.5 million during Fiscal 2013. Our effective tax rate was 28.8% and 30.7% during Fiscal 2014 and Fiscal 2013, respectively. The decrease in rate for Fiscal 2014 compared to Fiscal 2013 primarily relates to the implementation of international tax planning strategies, partially offset by the mix of income between high taxed jurisdictions (primarily U.S.) and lower taxed jurisdictions (primarily Hong Kong and Canada) as well as an increase to the unrecognized tax benefits in Fiscal 2014 compared to a reversal of unrecognized tax benefits in Fiscal 2013. The Company's foreign effective tax rates for Fiscal 2014 and Fiscal 2013 were 13.7% and 20.4%, respectively,
Net income was $56.9 million during Fiscal 2014 compared to $53.0 million during Fiscal 2013, due to the factors discussed above. Diluted earnings per share was $2.59 in Fiscal 2014 compared to $2.32 in Fiscal 2013. This increase in earnings per diluted share is due to a lower diluted weighted average number of common shares outstanding of approximately 0.9 million shares, virtually all of which is related to our share repurchase programs, and higher net income.
Fiscal 2013 Compared to Fiscal 2012
Net sales decreased by $43.7 million to $1,765.8 million during Fiscal 2013 from $1,809.5 million during Fiscal 2012, which was a 53 week year. Net sales for the comparable 52 weeks in Fiscal 2012 were $1,783.4 million. Our comparable 52 week net sales decrease of $17.6 million resulted from a Comparable Retail Sales decrease of 2.8%, or $20.0 million and $8.9 million from unfavorable changes in the Canadian exchange rate, partially offset by an $11.3 million increase in sales from new stores, as well as other sales that did not qualify as comparable sales. Our 2.8% decrease in Comparable Retail Sales was primarily the result of a 2% decrease in the number of transactions and a 1% decrease in the average dollar transaction size. Total e-commerce sales, which include postage and handling, increased to 13.9% of net sales during Fiscal 2013 from 11.9% during Fiscal 2012.
The Children's Place U.S. net sales decreased $29.2 million, or 1.9%, to $1,528.3 million during Fiscal 2013 compared to $1,557.5 million during Fiscal 2012, which was a 53 week year. Net sales for the comparable 52 weeks in Fiscal 2012 were $1,535.9 million. Our comparable 52 week net sales decrease of $7.6 million resulted from a U.S. Comparable Retail Sales decrease of 2.3%, or $10.6 million, partially offset by a $3.0 million increase in sales from new stores, as well as other sales that did not qualify as comparable sales. Our 2.3% decrease in U.S. Comparable Retail Sales was primarily the result of a 1% decrease in the number of transactions and a 1% decrease in the average dollar transaction size. Total U.S. e-commerce sales, which include postage and handling, increased to 14.8% of The Children's Place U.S. net sales during Fiscal 2013 from 12.9% during Fiscal 2012.
The Children's Place International net sales decreased $14.4 million, or 5.7%, to $237.5 million during Fiscal 2013 compared to $251.9 million during Fiscal 2012, which was a 53 week year. Net sales for the comparable 52 weeks in Fiscal 2012 were $247.5 million. Our comparable 52 week net sales decrease of $10.0 million resulted from a Canadian Comparable Retail Sales decrease of 6.8%, or $9.4 million and $8.9 million from unfavorable changes in the Canadian exchange rate, partially offset by an $8.3 million increase in sales from new stores, as well as other sales that did not qualify as comparable sales. Our 6.8% decrease in Canadian Comparable Retail Sales was the result of a 6% decrease in the number of transactions and a 1% decrease in the average dollar transaction size. Total Canadian e-commerce sales, which include postage and handling, increased to 8.2% of The Children's Place International net sales during Fiscal 2013 from 5.2% during Fiscal 2012.
During Fiscal 2013, we opened 53 stores, consisting of 48 in the United States and five in Canada. We closed 41 stores in Fiscal 2013, 40 in the United States and one in Canada.
Gross profit decreased by $35.9 million to $655.5 million during Fiscal 2013 from $691.4 million during Fiscal 2012. Consolidated Gross Margin decreased approximately 110 basis points to 37.1% during Fiscal 2013 from 38.2% during Fiscal 2012. The decrease in consolidated Gross Margin resulted primarily from a de-leverage of fixed costs due to negative Comparable Retail Sales and higher supply chain costs partially offset by lower cost of goods sold as a percentage of net sales.
Gross Margin at The Children's Place U.S. decreased approximately 100 basis points from 37.5% in Fiscal 2012 to 36.5% in Fiscal 2013. This decrease resulted primarily from a de-leverage of fixed costs due to negative U.S. Comparable Retail Sales and higher supply chain costs partially offset by lower cost of goods sold as a percentage of net sales.
Gross Margin at The Children's Place International decreased approximately 160 basis points from 42.6% in Fiscal 2012 to 41.0% in Fiscal 2013. This decrease resulted primarily from a de-leverage of fixed costs due to negative Comparable Retail Sales and higher supply chain costs partially offset by lower cost of goods sold as a percentage of net sales.
Selling, general and administrative expenses decreased $25.2 million to $485.7 million during Fiscal 2013 from $510.9 million during Fiscal 2012. As a percentage of net sales SG&A decreased approximately 70 basis points to 27.5% during Fiscal 2013 from 28.2% during Fiscal 2012 and primarily included the following variances:
• | store expenses decreased approximately $20.8 million, or 80 basis points, primarily related to expense reduction initiatives in payroll, particularly during the slow traffic weeks in the stores, supplies and maintenance costs; |
35
Table of Contents
• | marketing expenses decreased approximately $3.3 million, or 20 basis points, resulting from decreased direct mailings, signage advertising and radio advertising due to lower costs from moving more towards digital platforms; partially offset by |
• | an increase in performance-based compensation of approximately $7.9 million, or 50 basis points. |
Asset impairment charges were $29.6 million during Fiscal 2013, $20.5 million of which related to 127 stores, 106 of which were fully impaired and 21 of which were partially impaired. These store impairment charges were recorded as a result of reduced cash flows from revenue and/or gross margins not meeting targeted levels and accelerated store lease termination dates. Additionally, we recorded asset impairment charges of $9.1 million related to a determination that certain information technology development costs previously incurred were no longer relevant and that certain information technology systems were obsolete. Asset impairment charges were $2.3 million related to six underperforming stores during Fiscal 2012.
Other (income) costs were $(0.9) million and $11.1 million during Fiscal 2013 and Fiscal 2012, respectively and consist of exit activities related to management's decision to close our West Coast DC and Northeast DC.
Depreciation and amortization was $64.9 million during Fiscal 2013 compared to $77.4 million during Fiscal 2012. Depreciation and amortization in Fiscal 2012 was impacted by $7.7 million of accelerated depreciation associated with the closing of the Northeast DC and $1.6 million of accelerated depreciation associated with early remodels of certain Canadian stores. Excluding the effect of these items, depreciation and amortization was $68.1 million, or 3.8% of net sales in Fiscal 2012 compared to 3.7% of net sales in Fiscal 2013.
Provision for income taxes was $23.5 million during Fiscal 2013 compared to $26.5 million during Fiscal 2012. Our effective tax rate was 30.7% and 29.5% during Fiscal 2013 and Fiscal 2012, respectively. The increase in rate for Fiscal 2013 compared to Fiscal 2012 primarily relates to the mix of income between high tax jurisdictions, predominately in the U.S., and low taxed jurisdictions, predominately in Hong Kong and Canada, in 2013 compared to 2012 partially offset by a larger reversal of unrecognized tax benefits during 2013 as compared to 2012. The Company's foreign effective tax rates for Fiscal 2013 and Fiscal 2012 were 20.4% and 21.5%, respectively, compared to a U.S. federal statutory rate of 35% in both years.
Net income was $53.0 million during Fiscal 2013 compared to $63.2 million during Fiscal 2012, due to the factors discussed above. Diluted earnings per share was $2.32 in Fiscal 2013 compared to $2.61 in Fiscal 2012. This decrease in earnings per diluted share is due to lower net income partially offset by a lower diluted weighted average number of common shares outstanding of approximately 1.4 million shares, virtually all of which is related to our share repurchase programs.
LIQUIDITY AND CAPITAL RESOURCES
Liquidity
Our working capital needs follow a seasonal pattern, peaking during the third fiscal quarter when inventory is purchased for the back-to-school and holiday selling seasons. Our primary uses of cash are working capital requirements, which are principally inventory purchases, and the financing of capital projects, including investments in new systems, the repurchases of our common stock, and the financing of new store openings and remodels. In March 2014, our Board of Directors instituted the payment of a quarterly cash dividend.
Our working capital decreased $23.2 million to $334.8 million at January 31, 2015 compared to $358.0 million at February 1, 2014. This decrease is primarily due to an increase in capital returned to our shareholders through dividends and higher share repurchases and a decrease in cash from operations. During Fiscal 2014, we repurchased approximately 1.5 million shares for approximately $74.9 million under our share repurchase programs and paid cash dividends of $11.5 million. Subsequent to January 31, 2015 and through March 24, 2015, we repurchased an additional 0.2 million shares for approximately $13.3 million and announced that our Board of Directors declared a quarterly cash dividend of $0.15 per share to be paid on April 30, 2015 to shareholders of record on the close of business on April 9, 2015.
At January 31, 2015, our credit facility provided for borrowings up to the lesser of $200.0 million or our borrowing base, as defined by the credit facility agreement (see "Credit Facility" below). At January 31, 2015, we had no outstanding borrowings with our borrowing base at $183.2 million, and $174.1 million available for borrowing. In addition, at January 31, 2015, we had $9.1 million of outstanding letters of credit with an additional $40.9 million available for issuing letters of credit.
As of January 31, 2015, we had approximately $173.3 million of cash and cash equivalents, of which $154.7 million of cash and cash equivalents was held in foreign subsidiaries, of which approximately $87.5 million was in our Canadian subsidiaries, $54.9 million was in our Hong Kong subsidiaries and $12.3 million was in our other foreign subsidiaries. As of January 31, 2015 we also had short-term investments of $52.0 million in Hong Kong. Because all of our cash, cash equivalents and short-term investments in our foreign subsidiaries are considered permanently and fully reinvested offshore, any repatriation to the U.S. would require the accrual and payment of U.S. federal and certain state taxes. Due to the complexities associated with the hypothetical calculation, including the availability of foreign tax credits, we have concluded that it is not
36
Table of Contents
practicable to determine the unrecognized deferred tax liability related to the undistributed earnings. We currently do not intend to repatriate cash from any of these foreign subsidiaries.
We expect to be able to meet our working capital and capital expenditure requirements by using our cash on hand, cash flows from operations and availability under our credit facility.
Credit Facility
We and certain of our domestic subsidiaries maintain a credit agreement with Wells Fargo Bank, National Association ("Wells Fargo"), Bank of America, N.A., HSBC Business Credit (USA) Inc., and JPMorgan Chase Bank, N.A. as lenders (collectively, the "Lenders"), and Wells Fargo, as Administrative Agent, Collateral Agent and Swing Line Lender (the "Credit Agreement"). The Credit Agreement was amended and restated on March 4, 2014 to incorporate all prior amendments, and the provisions below reflect the amended and restated Credit Agreement.
The Credit Agreement, which expires in August 2018, consists of a $200 million asset based revolving credit facility, with a $50 million sublimit for standby and documentary letters of credit and an uncommitted accordion feature that could provide up to $25 million of additional availability. Revolving credit loans outstanding under the Credit Agreement bear interest, at our option, at:
(i) | the prime rate plus a margin of 0.50% to 0.75% based on the amount of our average excess availability under the facility; or |
(ii) | the London InterBank Offered Rate, or "LIBOR", for an interest period of one, two, three or six months, as selected by us, plus a margin of 1.50% to 1.75% based on the amount of our average excess availability under the facility. |
We are charged an unused line fee of 0.25% on the unused portion of the commitments. Letter of credit fees range from 0.75% to 0.875% for commercial letters of credit and range from 1.00% to 1.25% for standby letters of credit. Letter of credit fees are determined based on the amount of our average excess availability under the facility. The amount available for loans and letters of credit under the Credit Agreement is determined by a borrowing base consisting of certain credit card receivables, certain inventory and the fair market value of certain real estate, subject to certain reserves.
The outstanding obligations under the Credit Agreement may be accelerated upon the occurrence of certain events, including, among others, non-payment, breach of covenants, the institution of insolvency proceedings, defaults under other material indebtedness and a change of control, subject, in the case of certain defaults, to the expiration of applicable grace periods. We are not subject to any early termination fees.
The Credit Agreement contains covenants, which include conditions on stock buybacks and the payment of cash dividends or similar payments. Credit extended under the Credit Agreement is secured by a first priority security interest in substantially all of our U.S. assets excluding intellectual property, software, equipment and fixtures.
On March 4, 2014, the Credit Agreement was amended to permit the payment of dividends, subject to certain conditions, to increase the revolving credit limit from $150 million to its current $200 million and to extend the term from August 2017 to August 2018, and was restated to incorporate all prior amendments. In conjunction with this amendment and restatement, we paid approximately $0.3 million in additional deferred financing costs.
As of January 31, 2015, we have capitalized an aggregate of approximately $4.0 million in deferred financing costs related to the Credit Agreement. The unamortized balance of deferred financing costs at January 31, 2015 was approximately $1.2 million . Unamortized deferred financing costs are amortized over the remaining term of the Credit Agreement.
37
Table of Contents
The table below presents the components (in millions) of our credit facility:
| January 31, |
| February 1, | ||||
Credit facility maximum | $ | 200.0 | |
| $ | 150.0 | |
Borrowing base | 183.2 | |
| 150.0 | | ||
|
|
|
| ||||
Outstanding borrowings | - | |
| - | | ||
Letters of credit outstanding-merchandise | - | |
| 1.2 | | ||
Letters of credit outstanding-standby | 9.1 | |
| 9.9 | | ||
Utilization of credit facility at end of period | 9.1 | |
| 11.1 | | ||
|
|
|
| ||||
Availability (1) | $ | 174.1 | |
| $ | 138.9 | |
|
|
|
| ||||
Interest rate at end of period | 3.8 | % |
| 3.8 | % | ||
| Fiscal 2014 |
| Fiscal 2013 | ||||
Average end of day loan balance during the period | $ | 9.4 | |
| $ | - | |
Highest end of day loan balance during the period | 40.9 | |
| 10.4 | | ||
Average interest rate | 3.2 | % |
| 3.8 | % | ||
(1) | The sublimit availability for letters of credit was $40.9 million and $113.9 million at January 31, 2015 and February 1, 2014, respectively. |
Cash Flows/Capital Expenditures
During Fiscal 2014, cash flows provided by operating activities were $161.4 million compared to $173.5 million during Fiscal 2013. The net decrease of $12.1 million in cash from operating activities resulted primarily from operating performance. During Fiscal 2013, cash flows provided by operating activities were $173.5 million compared to $205.0 million during Fiscal 2012. The net decrease of $31.5 million in cash from operating activities resulted primarily from higher inventories, primarily due to the timing of inventory receipts and lower net income.
Cash flows used in investing activities were $61.7 million during Fiscal 2014 compared to $119.7 million during Fiscal 2013. This net decrease of $58.0 million was due to a net redemption of short-term investments in Fiscal 2014 compared to a net purchase in Fiscal 2013. Cash flows used in investing activities were $119.7 million during Fiscal 2013 compared to $105.2 million during Fiscal 2012. This net increase of $14.5 million primarily resulted from the purchase of short-term investments of $47.5 million in Fiscal 2013 compared to $15.0 million in Fiscal 2012 partially offset by an approximate $17.6 million decrease in purchases of property and equipment.
During Fiscal 2014, cash flows used in financing activities were $87.6 million compared to $64.1 million during Fiscal 2013. The increase primarily resulted from a $10.3 million increase in purchases of our common stock, pursuant to our share repurchase programs during Fiscal 2014 compared to Fiscal 2013, the payment of $11.5 million in cash dividends and a $1.4 million decrease in proceeds from the exercise of stock options. During Fiscal 2013, cash flows used in financing activities were $64.1 million compared to $82.3 million during Fiscal 2012. This net decrease of $18.2 million primarily resulted from a decrease of $23.2 million in purchases of our common stock during Fiscal 2013, virtually all related to our share repurchase programs.
For Fiscal 2015, we estimate that total capital expenditures will be in the range of $75 to $80 million. Our ability to meet our capital requirements in Fiscal 2015 depends on our ability to generate cash flows from operations and our available borrowings under our credit facility. Cash flow generated from operations depends on our ability to achieve our financial plans. We believe that cash on hand, cash generated from operations and funds available to us through our credit facility will be sufficient to fund our capital and other cash flow requirements over the next 12 months.
38
Table of Contents
CONTRACTUAL OBLIGATIONS AND COMMERCIAL COMMITMENTS
The following tables summarize our contractual and commercial obligations as of January 31, 2015:
|
| Payment Due By Period | ||||||||||||||||||
Contractual Obligations (dollars in thousands) |
| Total |
| 1 year or less |
| 1-3 years |
| 3-5 years |
| More than 5 years | ||||||||||
Operating leases(1) |
| $ | 877,391 | |
| $ | 156,208 | |
| $ | 269,767 | |
| $ | 205,435 | |
| $ | 245,981 | |
Total---Contractual Obligations |
| $ | 877,391 | |
| $ | 156,208 | |
| $ | 269,767 | |
| $ | 205,435 | |
| $ | 245,981 | |
|
|
|
|
|
|
|
|
|
|
| ||||||||||
|
| Amounts of Commitment Expiration Per Period | ||||||||||||||||||
Other Commercial Commitments (dollars in thousands) |
| Total |
| 1 year or less |
| 1-3 years |
| 3-5 years |
| More than 5 years | ||||||||||
Credit facilities |
| $ | - | |
| $ | - | |
| $ | - | |
| $ | - | |
| $ | - | |
Purchase commitments(2) |
| 298,054 | |
| 298,054 | |
| - | |
| - | |
| - | | |||||
Standby letters of credit(3) |
| 9,100 | |
| 9,100 | |
| - | |
| - | |
| - | | |||||
Total---Other Commercial Commitments |
| $ | 307,154 | |
| $ | 307,154 | |
| $ | - | |
| $ | - | |
| $ | - | |
|
|
|
|
|
|
|
|
|
|
| ||||||||||
Total---Contractual Obligations and Other Commercial Commitments |
| $ | 1,184,545 | |
| $ | 463,362 | |
| $ | 269,767 | |
| $ | 205,435 | |
| $ | 245,981 | |
____________________________________________
(1) | Certain of our operating leases include common area maintenance and other charges in our monthly rental expense. For other leases which do not include these charges in the minimum lease payments, we incur monthly charges, which are billed and recorded separately. These additional charges approximated 54% of our minimum lease payments over the last three fiscal years. Additionally, our minimum lease obligation does not include contingent rent based upon sales volume, which represented approximately 0.6% of our minimum lease payments over the last three fiscal years. |
(2) | Represents purchase orders for merchandise for re-sale of approximately $288.7 million and equipment, construction and other non-merchandise commitments of approximately $9.4 million. |
(3) | Represents letters of credit issued to landlords, banks and insurance companies. |
We self-insure and purchase insurance policies to provide for workers' compensation, general liability, and property losses, as well as directors' and officers' liability, vehicle liability and employee medical benefits, as described in Note 1 of the Notes to our Consolidated Financial Statements. Insurance reserves of approximately $6.5 million are included in other long term liabilities as of January 31, 2015. The long-term portion represents the total amount estimated to be paid beyond one year. We are not able to further estimate in which periods the long-term portion will be paid.
As discussed more fully in Note 11 of the Notes to our Consolidated Financial Statements, our long-term liabilities include unrecognized tax benefits of approximately $6.4 million, which includes $1.0 million of accrued interest and penalties, at January 31, 2015. We cannot make a reasonable estimate of the amount and period of related future payments for any of this amount.
We have an employment agreement with our Chief Executive Officer, which provides for cash severance of two times the sum of base salary plus bonus, and certain other payments and benefits following any termination without cause or for "good reason". As of January 31, 2015, these cash severance benefits approximated $6.1 million. In the event of a change in control of the Company, certain executives will receive, in the aggregate, approximately $23.2 million of cash severance benefits should they either be terminated or voluntarily terminate their employment due to a degradation of duties as defined in their agreement.
Off-Balance Sheet Arrangements
None.
QUARTERLY RESULTS AND SEASONALITY
Our quarterly results of operations have fluctuated and are expected to continue to fluctuate materially depending on a variety of factors, including overall economic conditions, the timing and number of new store openings and related pre-opening and other startup costs, the timing and number of store closures, net sales contributed by new stores, increases or decreases in Comparable Retail Sales, weather conditions (such as unseasonable temperatures or storms), shifts in timing of certain
39
Table of Contents
holidays, and changes in our merchandise mix and pricing strategy, including changes to address competitive factors. The combination and severity of one or more of these factors could result in material fluctuations.
The following table sets forth certain statement of operations data and selected operating data for each of our last four fiscal quarters. Quarterly information for Fiscal 2013 is included in Note 14 of the Notes to our Consolidated Financial Statements. The quarterly statement of operations data and selected operating data set forth below were derived from our unaudited consolidated financial statements and reflect, in our opinion, all adjustments (consisting only of normal recurring adjustments) necessary to fairly present the results of operations for these fiscal quarters (in thousands, except per share data) (unaudited):
|
| Fiscal Year Ended January 31, 2015 | ||||||||||||||
|
| First Quarter |
| Second Quarter |
| Third Quarter |
| Fourth Quarter | ||||||||
Net sales |
| $ | 410,149 | |
| $ | 384,628 | |
| $ | 487,304 | |
| $ | 479,243 | |
Gross profit |
| 148,261 | |
| 119,118 | |
| 190,111 | |
| 164,810 | | ||||
Selling, general and administrative expenses |
| 113,720 | |
| 117,111 | |
| 116,120 | |
| 123,735 | | ||||
Asset impairment charges |
| - | |
| 3,045 | |
| 3,306 | |
| 4,794 | | ||||
Other (income) costs |
| 231 | |
| (98 | ) |
| (286 | ) |
| 85 | | ||||
Depreciation and amortization |
| 14,227 | |
| 15,557 | |
| 15,168 | |
| 15,542 | | ||||
Operating income (loss) |
| 20,083 | |
| (16,497 | ) |
| 55,803 | |
| 20,654 | | ||||
Income (loss) before income taxes |
| 20,102 | |
| (16,557 | ) |
| 55,721 | |
| 20,609 | | ||||
Provision (benefit) for income taxes |
| 6,506 | |
| (5,870 | ) |
| 18,779 | |
| 3,572 | | ||||
Net income (loss) |
| 13,596 | |
| (10,687 | ) |
| 36,942 | |
| 17,037 | | ||||
|
|
|
|
|
|
|
|
| ||||||||
Diluted earnings (loss) per share |
| $ | 0.61 | |
| $ | (0.49 | ) |
| $ | 1.70 | |
| $ | 0.79 | |
Diluted weighted average common shares outstanding |
| 22,419 | |
| 21,837 | |
| 21,756 | |
| 21,512 | | ||||
|
|
|
|
|
|
|
|
| ||||||||
Cash dividends declared and paid per common share |
| $ | 0.1325 | |
| $ | 0.1325 | |
| $ | 0.1325 | |
| $ | 0.1325 | |
ITEM 7A--QUANTITATIVE AND QUALITATIVE DISCLOSURES ABOUT MARKET RISK.
In the normal course of business, our financial position and results of operations are routinely subject to market risk associated with interest rate movements on borrowings and investments and currency rate movements on non-U.S. dollar denominated assets, liabilities, income and expenses. We utilize cash from operations and short-term borrowings to fund our working capital and investment needs.
Cash and Cash Equivalents
Cash and cash equivalents are normally invested in short-term financial instruments that will be used in operations within 90 days of the balance sheet date. Because of the short-term nature of these instruments, changes in interest rates would not materially affect the fair value of these financial instruments.
Short-term Investments
Short-term investments consist of investments which we expect to convert into cash within one year, including time deposits, which have original maturities greater than 90 days. Because of the short-term nature of these instruments, changes in interest rates would not materially affect the fair value of these financial instruments.
Interest Rates
Our credit facility bears interest at a floating rate equal to the prime rate or LIBOR, plus a calculated spread based on our average excess availability. As of January 31, 2015, we had no borrowings under the credit facility. A 10% change in the prime rate or LIBOR interest rates would not have had a material impact on our interest expense.
40
Table of Contents
Foreign Assets and Liabilities
Assets and liabilities outside the United States are primarily located in Canada and Hong Kong. We do not hedge these net investments nor are we party to any derivative financial instruments. Our investments in our Canadian and Asian subsidiaries are considered to be long-term. As of January 31, 2015, net assets in our Canadian and Hong Kong subsidiaries were $105.6 million and $88.8 million, respectively. A 10% increase or decrease in the Canadian and Hong Kong Dollars would increase or decrease the corresponding net investment by $10.6 million and $8.9 million, respectively. All changes in the net investment of our foreign subsidiaries are recorded in other comprehensive income as unrealized gains or losses.
As of January 31, 2015, we had approximately $154.7 million of our cash and cash equivalents held in foreign countries, of which approximately $87.5 million was in Canada, approximately $54.9 million was in Hong Kong and approximately $12.3 million was in other foreign countries. As of January 31, 2015, we held $52.0 million of short-term investments in Hong Kong.
Foreign Operations
Approximately 12% of our consolidated net sales and approximately 13% of our total operating expenses are transacted in foreign currencies. As a result, fluctuations in exchange rates impact the amount of our reported sales and expenses. Assuming a 10% change in foreign exchange rates, Fiscal 2014 net sales could have decreased or increased by approximately $20.6 million and total costs and expenses could have decreased or increased by approximately $24.5 million. Additionally, we have foreign currency denominated receivables and payables that when settled, result in transaction gains or losses. At January 31, 2015, we had foreign currency denominated receivables and payables, including inter-company balances, of $8.8 million and $10.4 million, respectively. To date, we have not used derivatives to manage foreign currency exchange risk.
We import a vast majority of our merchandise from foreign countries, primarily China and Bangladesh. Consequently, any significant or sudden change in these countries' political, foreign trade, financial, banking or currency policies and practices, or the occurrence of significant labor unrest, could have a material adverse impact on our financial position, results of operations and cash flows.
ITEM 8.-FINANCIAL STATEMENTS AND SUPPLEMENTARY DATA
The information required by this Item is incorporated herein by reference to the consolidated financial statements and supplementary data set forth in "Item 15-Exhibits and Financial Statement Schedules" of Part IV of this Annual Report on Form 10-K.
ITEM 9.-CHANGES IN AND DISAGREEMENTS WITH ACCOUNTANTS ON ACCOUNTING AND FINANCIAL DISCLOSURE
Not applicable.
Item 9A. CONTROLS AND PROCEDURES.
Evaluation of Disclosure Controls and Procedures
Disclosure controls and procedures are designed only to provide "reasonable assurance" that the controls and procedures will meet their objectives. A control system, no matter how well designed and operated, can provide only reasonable, not absolute, assurance that the objectives of the control system are met. Further, the design of a control system must reflect the fact that there are resource constraints, and the benefits of controls must be considered relative to their costs. Because of the inherent limitations in all control systems, no evaluation of controls can provide absolute assurance that all control issues and instances of fraud, if any, within our company have been detected.
Management, including our Chief Executive Officer and President, our Chief Operating Officer, and our Chief Financial Officer, evaluated the effectiveness of our disclosure controls and procedures as defined in Rule 13a-15(e) of the Securities Exchange Act of 1934, as amended (the "Exchange Act"), as of January 31, 2015. Based on that evaluation, our Chief Executive Officer and President, our Chief Operating Officer and our Chief Financial Officer, concluded that our disclosure controls and procedures were effective at the reasonable assurance level, as of January 31, 2015, to ensure that all information required to be disclosed in the reports that we file or submit under the Exchange Act is recorded, processed, summarized and reported within the time periods specified in SEC rules and forms and is accumulated and communicated to our management, including our principal executive, principal accounting and principal financial officers, or persons performing similar functions, as appropriate to allow timely decisions regarding required disclosure.
41
Table of Contents
Management's Report on Internal Control Over Financial Reporting
Our management is responsible for establishing and maintaining adequate internal control over financial reporting, as defined in Securities Exchange Act Rule 13a-15(f). Internal control over financial reporting is a process to provide reasonable assurance regarding the reliability of our financial reporting for external purposes in accordance with accounting principles generally accepted in the United States of America. Because of its inherent limitations, internal control over financial reporting is not intended to provide absolute assurance that a misstatement of our financial statements would be prevented or detected.
Under the supervision and with the participation of our management, including our Chief Executive Officer and President, our Chief Operating Officer, and our Chief Financial Officer, we conducted an evaluation of the design and effectiveness of our internal control over financial reporting based on the criteria set forth in Internal Control-Integrated Framework (2013) issued by the Committee of Sponsoring Organizations of the Treadway Commission ("COSO"). Based on our evaluation under the framework in Internal Control - Integrated Framework, our management concluded that our internal control over financial reporting was effective as of January 31, 2015. Our independent registered public accounting firm that audited the consolidated financial statements included in this annual report has issued an attestation report on our internal control over financial reporting, which is included herein.
Changes in Internal Control over Financial Reporting
There have been no changes in our internal control over financial reporting that occurred during our most recently completed fiscal quarter to which this report relates that have materially affected, or are reasonably likely to materially affect, our internal control over financial reporting.
42
Table of Contents
Report of Independent Registered Public Accounting Firm
To the Stockholders and Board of Directors of
The Children's Place, Inc.
Secaucus, New Jersey:
We have audited The Children's Place, Inc. and subsidiaries' (the "Company") internal control over financial reporting as of January 31, 2015, based on criteria established in Internal Control - Integrated Framework (2013) issued by the Committee of Sponsoring Organizations of the Treadway Commission (the COSO criteria). The Company's management is responsible for maintaining effective internal control over financial reporting and for its assessment of the effectiveness of internal control over financial reporting, included in the accompanying "Item 9A, Management's Report on Internal Control Over Financial Reporting". Our responsibility is to express an opinion on the company's internal control over financial reporting based on our audit.
We conducted our audit in accordance with the standards of the Public Company Accounting Oversight Board (United States). Those standards require that we plan and perform the audit to obtain reasonable assurance about whether effective internal control over financial reporting was maintained in all material respects. Our audit included obtaining an understanding of internal control over financial reporting, assessing the risk that a material weakness exists, and testing and evaluating the design and operating effectiveness of internal control based on the assessed risk. Our audit also included performing such other procedures as we considered necessary in the circumstances. We believe that our audit provides a reasonable basis for our opinion.
A company's internal control over financial reporting is a process designed to provide reasonable assurance regarding the reliability of financial reporting and the preparation of financial statements for external purposes in accordance with generally accepted accounting principles. A company's internal control over financial reporting includes those policies and procedures that (1) pertain to the maintenance of records that, in reasonable detail, accurately and fairly reflect the transactions and dispositions of the assets of the company; (2) provide reasonable assurance that transactions are recorded as necessary to permit preparation of financial statements in accordance with generally accepted accounting principles, and that receipts and expenditures of the company are being made only in accordance with authorizations of management and directors of the company; and (3) provide reasonable assurance regarding prevention or timely detection of unauthorized acquisition, use, or disposition of the company's assets that could have a material effect on the financial statements.
Because of its inherent limitations, internal control over financial reporting may not prevent or detect misstatements. Also, projections of any evaluation of effectiveness to future periods are subject to the risk that controls may become inadequate because of changes in conditions, or that the degree of compliance with the policies or procedures may deteriorate.
In our opinion, The Children's Place, Inc. and subsidiaries maintained, in all material respects, effective internal control over financial reporting as of January 31, 2015, based on the COSO criteria .
We also have audited, in accordance with the standards of the Public Company Accounting Oversight Board (United States), the consolidated balance sheets of The Children's Place, Inc. and subsidiaries as of January 31, 2015 and February 1, 2014, and the related consolidated statements of operations, comprehensive income, changes in stockholders' equity, and cash flows for each of the three years in the period ended January 31, 2015 and our report dated March 26, 2015 expressed an unqualified opinion thereon.
/S/ BDO USA, LLP
New York, NY
March 26, 2015
43
Table of Contents
ITEM 9B.-OTHER INFORMATION
None.
PART III
ITEM 10. DIRECTORS, EXECUTIVE OFFICERS AND CORPORATE GOVERNANCE
The information required to be included by Item 10 of Form 10-K will be set forth in the Company's proxy statement for its 2015 annual meeting of stockholders to be filed within 120 days after January 31, 2015 (the "Proxy Statement") and is incorporated by reference herein.
ITEM 11. EXECUTIVE COMPENSATION
The information required to be included by Item 11 of Form 10-K will be set forth in the Proxy Statement and is incorporated by reference herein.
ITEM 12. SECURITY OWNERSHIP OF CERTAIN BENEFICIAL OWNERS AND MANAGEMENT AND RELATED STOCKHOLDER MATTERS
The information required to be included by Item 12 of Form 10-K will be set forth in the Proxy Statement and is incorporated by reference herein.
ITEM 13. CERTAIN RELATIONSHIPS AND RELATED TRANSACTIONS, AND DIRECTOR INDEPENDENCE
The information required to be included by Item 13 of Form 10-K will be set forth in the Proxy Statement and is incorporated by reference herein.
ITEM 14. PRINCIPAL ACCOUNTANT FEES AND SERVICES
The information required to be included by Item 14 of Form 10-K will be set forth in the Proxy Statement and is incorporated by reference herein.
44
Table of Contents
PART IV
ITEM 15.-EXHIBITS AND FINANCIAL STATEMENT SCHEDULES
(a)(1) Financial Statements
The following documents are filed as part of this report:
|
|
Report of Independent Registered Public Accounting Firm | 46 |
|
|
Consolidated Balance Sheets as of January 31, 2015 and February 1, 2014 | 47 |
|
|
Consolidated Statements of Operations for the fiscal years ended January 31, 2015, February 1, 2014 | 48 |
|
|
Consolidated Statements of Comprehensive Income for the fiscal years ended January 31, 2015, February 1, 2014 and February 2, 2013 | 49 |
|
|
Consolidated Statements of Changes in Stockholders' Equity for the fiscal years ended January 31, 2015, February 1, 2014 and February 2, 2013 | 50 |
|
|
Consolidated Statements of Cash Flows for the fiscal years ended January 31, 2015, February 1, 2014 and February 2, 2013 | 51 |
|
|
Notes to Consolidated Financial Statements | 53 |
|
|
Schedule II- Valuation and Qualifying Accounts | 78 |
45
Table of Contents
Report of Independent Registered Public Accounting Firm
To the Stockholders and Board of Directors of
The Children's Place, Inc.
Secaucus, New Jersey:
We have audited the accompanying consolidated balance sheets of The Children's Place, Inc. and subsidiaries (the "Company") as of January 31, 2015 and February 1, 2014 and the related consolidated statements of operations, comprehensive income, changes in stockholders' equity, and cash flows for each of the three years in the period ended January 31, 2015. In connection with our audits of the financial statements, we have also audited the financial statement schedule listed in the accompanying index. These financial statements and schedule are the responsibility of the Company's management. Our responsibility is to express an opinion on these financial statements and schedule based on our audits.
We conducted our audits in accordance with the standards of the Public Company Accounting Oversight Board (United States). Those standards require that we plan and perform the audit to obtain reasonable assurance about whether the financial statements are free of material misstatement. An audit includes examining, on a test basis, evidence supporting the amounts and disclosures in the financial statements, assessing the accounting principles used and significant estimates made by management, as well as evaluating the overall presentation of the financial statements and schedule. We believe that our audits provide a reasonable basis for our opinion.
In our opinion, the consolidated financial statements referred to above present fairly, in all material respects, the financial position of The Children's Place, Inc. and subsidiaries at January 31, 2015 and February 1, 2014, and the results of its operations and its cash flows for each of the three years in the period ended January 31, 2015 , in conformity with accounting principles generally accepted in the United States of America.
Also, in our opinion, the financial statement schedule, when considered in relation to the basic consolidated financial statements taken as a whole, presents fairly, in all material respects, the information set forth therein.
We also have audited, in accordance with the standards of the Public Company Accounting Oversight Board (United States), The Children's Place, Inc. and subsidiaries' internal control over financial reporting as of January 31, 2015, based on criteria established in Internal Control - Integrated Framework (2013) issued by the Committee of Sponsoring Organizations of the Treadway Commission (COSO) and our report dated March 26, 2015 expressed an unqualified opinion thereon.
/S/ BDO USA, LLP
New York, NY
March 26, 2015
46
Table of Contents
THE CHILDREN'S PLACE, INC. AND SUBSIDIARIES
CONSOLIDATED BALANCE SHEETS
(In thousands, except par value)
| January 31, |
| February 1, | ||||
|
|
|
| ||||
ASSETS |
| |
|
| | ||
Current assets: |
| |
|
| | ||
Cash and cash equivalents | $ | 173,291 | |
| $ | 173,997 | |
Short-term investments | 52,000 | |
| 62,500 | | ||
Accounts receivable | 31,928 | |
| 25,960 | | ||
Inventories | 297,631 | |
| 322,422 | | ||
Prepaid expenses and other current assets | 39,349 | |
| 33,582 | | ||
Deferred income taxes | 15,080 | |
| 10,859 | | ||
Total current assets | 609,279 | |
| 629,320 | | ||
Long-term assets: |
|
|
| | |||
Property and equipment, net | 310,301 | |
| 312,149 | | ||
Deferred income taxes | 35,580 | |
| 45,806 | | ||
Other assets | 3,458 | |
| 3,355 | | ||
Total assets | $ | 958,618 | |
| $ | 990,630 | |
|
|
|
| ||||
LIABILITIES AND STOCKHOLDERS' EQUITY |
|
|
| | |||
LIABILITIES: |
|
|
| | |||
Current liabilities: |
|
|
| | |||
Accounts payable | $ | 155,323 | |
| $ | 150,652 | |
Income taxes payable | 420 | |
| 1,039 | | ||
Accrued expenses and other current liabilities | 118,724 | |
| 119,658 | | ||
Total current liabilities | 274,467 | |
| 271,349 | | ||
Long-term liabilities: |
|
|
| | |||
Deferred rent liabilities | 80,214 | |
| 88,563 | | ||
Other tax liabilities | 6,446 | |
| 5,755 | | ||
Other long-term liabilities | 8,373 | |
| 8,185 | | ||
Total liabilities | 369,500 | |
| 373,852 | | ||
COMMITMENTS AND CONTINGENCIES |
|
|
| | |||
STOCKHOLDERS' EQUITY: |
|
|
| | |||
Preferred stock, $1.00 par value, 1,000 shares authorized, 0 shares issued and outstanding | - | |
| - | | ||
Common stock, $0.10 par value, 100,000 shares authorized; 21,075 and 22,230 issued; 21,040 and 22,197 outstanding | 2,108 | |
| 2,223 | | ||
Additional paid-in capital | 230,429 | |
| 226,521 | | ||
Treasury stock, at cost (35 and 33 shares) | (1,682 | ) |
| (1,575 | ) | ||
Deferred compensation | 1,682 | |
| 1,575 | | ||
Accumulated other comprehensive loss | (17,493 | ) |
| (1,529 | ) | ||
Retained earnings | 374,074 | |
| 389,563 | | ||
Total stockholders' equity | 589,118 | |
| 616,778 | | ||
Total liabilities and stockholders' equity | $ | 958,618 | |
| $ | 990,630 | |
See accompanying notes to these consolidated financial statements.
47
Table of Contents
THE CHILDREN'S PLACE, INC. AND SUBSIDIARIES
CONSOLIDATED STATEMENTS OF OPERATIONS
(In thousands, except per share amounts)
| Fiscal Year Ended | ||||||||||
| January 31, |
| February 1, |
| February 2, | ||||||
|
|
|
|
|
| ||||||
Net sales | $ | 1,761,324 | |
| $ | 1,765,789 | |
| $ | 1,809,486 | |
Cost of sales (exclusive of depreciation and amortization) | 1,139,024 | |
| 1,110,268 | |
| 1,118,046 | | |||
|
|
|
|
|
| ||||||
Gross profit | 622,300 | |
| 655,521 | |
| 691,440 | | |||
|
|
|
|
|
| ||||||
Selling, general and administrative expenses | 470,686 | |
| 485,653 | |
| 510,918 | | |||
Asset impairment charges | 11,145 | |
| 29,633 | |
| 2,284 | | |||
Other (income) costs | (68 | ) |
| (906 | ) |
| 11,088 | | |||
Depreciation and amortization | 60,494 | |
| 64,858 | |
| 77,435 | | |||
|
|
|
|
|
| ||||||
Operating income | 80,043 | |
| 76,283 | |
| 89,715 | | |||
Interest expense (income), net | (168 | ) |
| 265 | |
| (20 | ) | |||
|
|
|
|
|
| ||||||
Income before income taxes | 79,875 | |
| 76,548 | |
| 89,695 | | |||
Provision for income taxes | 22,987 | |
| 23,522 | |
| 26,452 | | |||
|
|
|
|
|
| ||||||
Net income | $ | 56,888 | |
| $ | 53,026 | |
| $ | 63,243 | |
|
|
|
|
|
| ||||||
Earnings per common share |
|
|
| |
|
| | ||||
Basic | $ | 2.62 | |
| $ | 2.35 | |
| $ | 2.63 | |
Diluted | $ | 2.59 | |
| $ | 2.32 | |
| $ | 2.61 | |
|
|
|
|
|
| ||||||
Weighted average common shares outstanding |
|
|
|
|
| ||||||
Basic | 21,681 | |
| 22,537 | |
| 24,092 | | |||
Diluted | 21,924 | |
| 22,835 | |
| 24,276 | | |||
See accompanying notes to these consolidated financial statements.
48
Table of Contents
THE CHILDREN'S PLACE, INC. AND SUBSIDIARIES
CONSOLIDATED STATEMENTS OF COMPREHENSIVE INCOME
(In thousands)
| Fiscal Year Ended | ||||||||||
| January 31, |
| February 1, 2014 |
| February 2, 2013 | ||||||
|
|
|
|
|
| ||||||
Net income | $ | 56,888 | |
| $ | 53,026 | |
| $ | 63,243 | |
Other Comprehensive Income: |
|
|
|
|
| ||||||
Foreign currency translation adjustment | (15,964 | ) |
| (14,787 | ) |
| 378 | | |||
Comprehensive income | $ | 40,924 | |
| $ | 38,239 | |
| $ | 63,621 | |
See accompanying notes to these consolidated financial statements.
49
Table of Contents
THE CHILDREN'S PLACE, INC. AND SUBSIDIARIES
CONSOLIDATED STATEMENTS OF CHANGES IN STOCKHOLDERS' EQUITY
(In thousands)
|
|
|
|
|
|
|
|
|
|
|
| Accumulated |
|
|
|
|
|
| ||||||||||||||||
|
|
|
|
|
| Additional |
|
|
|
|
| Other |
|
|
|
|
| Total | ||||||||||||||||
|
| Common Stock |
| Paid-In |
| Deferred |
| Retained |
| Comprehensive |
| Treasury Stock |
| Stockholders' | ||||||||||||||||||||
|
| Shares |
| Amount |
| Capital |
| Compensation |
| Earnings |
| Income |
| Shares |
| Value |
| Equity | ||||||||||||||||
BALANCE, January 28, 2012 |
| 24,711 | |
| $ | 2,471 | |
| $ | 210,159 | |
| $ | 598 | |
| $ | 399,459 | |
| $ | 12,880 | |
| (14 | ) |
| $ | (598 | ) |
| $ | 624,969 | |
Exercise of stock options |
| 68 | |
| 6 | |
| 2,179 | |
| |
| |
| |
| |
| |
| 2,185 | | ||||||||||||
Excess tax benefits from stock-based compensation |
| | |
| |
| 4,941 | |
| |
| |
| |
| |
| |
| 4,941 | | |||||||||||||
Vesting of stock awards |
| 200 | |
| 20 | |
| (20 | ) |
| |
| |
| |
| |
| |
| - | | ||||||||||||
Stock-based compensation expense |
| | |
| |
| 14,253 | |
| |
| |
| |
| |
| |
| 14,253 | | |||||||||||||
Purchase and retirement of shares |
| (1,800 | ) |
| (179 | ) |
| (15,821 | ) |
| |
| (73,020 | ) |
| |
| |
| |
| (89,020 | ) | |||||||||||
Change in cumulative translation adjustment |
|
|
|
|
|
|
| |
| |
| 378 | |
| |
|
|
| 378 | | ||||||||||||||
Deferral of common stock into deferred compensation plan |
|
|
|
|
|
|
| 521 | |
| |
|
|
| (10 | ) |
| (521 | ) |
| - | | ||||||||||||
Net income |
|
|
|
|
|
|
| |
| 63,243 | |
| |
| |
| |
| 63,243 | | ||||||||||||||
BALANCE, February 2, 2013 |
| 23,179 | |
| 2,318 | |
| 215,691 | |
| 1,119 | |
| 389,682 | |
| 13,258 | |
| (24 | ) |
| (1,119 | ) |
| 620,949 | | |||||||
Exercise of stock options |
| 49 | |
| 5 | |
| 1,474 | |
|
|
|
|
|
|
|
|
|
|
| 1,479 | | ||||||||||||
Excess tax benefits from stock-based compensation |
|
|
|
|
| 211 | |
|
|
|
|
|
|
|
|
|
|
| 211 | | ||||||||||||||
Vesting of stock awards |
| 300 | |
| 30 | |
| (30 | ) |
|
|
|
|
|
|
|
|
|
|
| - | | ||||||||||||
Stock-based compensation expense |
|
|
|
|
| 21,210 | |
|
|
|
|
|
|
|
|
|
|
| 21,210 | | ||||||||||||||
Capitalized stock-based compensation |
|
|
|
|
| 520 | |
|
|
|
|
|
|
|
|
|
|
| 520 | | ||||||||||||||
Purchase and retirement of shares |
| (1,298 | ) |
| (130 | ) |
| (12,555 | ) |
|
|
| (53,145 | ) |
|
|
|
|
|
|
| (65,830 | ) | |||||||||||
Change in cumulative translation adjustment |
|
|
|
|
|
|
|
|
|
|
| (14,787 | ) |
|
|
|
|
| (14,787 | ) | ||||||||||||||
Deferral of common stock into deferred compensation plan |
|
|
|
|
|
|
| 456 | |
|
|
|
|
| (9 | ) |
| (456 | ) |
| - | | ||||||||||||
Net income |
|
|
|
|
|
|
|
|
| 53,026 | |
|
|
|
|
|
|
| 53,026 | | ||||||||||||||
BALANCE, February 1, 2014 |
| 22,230 | |
| 2,223 | |
| 226,521 | |
| 1,575 | |
| 389,563 | |
| (1,529 | ) |
| (33 | ) |
| (1,575 | ) |
| 616,778 | | |||||||
Exercise of stock options |
| 2 | |
| - | |
| 55 | |
|
|
|
|
|
|
|
|
|
|
| 55 | | ||||||||||||
Excess tax benefits from stock-based compensation |
|
|
|
|
| 268 | |
|
|
|
|
|
|
|
|
|
|
| 268 | | ||||||||||||||
Vesting of stock awards |
| 336 | |
| 34 | |
| (34 | ) |
|
|
|
|
|
|
|
|
|
|
| - | | ||||||||||||
Stock-based compensation expense |
|
|
|
|
| 17,783 | |
|
|
|
|
|
|
|
|
|
|
| 17,783 | | ||||||||||||||
Capitalized stock-based compensation |
|
|
|
|
| 930 | |
|
|
|
|
|
|
|
|
|
|
| 930 | | ||||||||||||||
Purchase and retirement of shares |
| (1,493 | ) |
| (149 | ) |
| (15,600 | ) |
|
|
| (60,380 | ) |
|
|
|
|
|
|
| (76,129 | ) | |||||||||||
Dividends ($0.53 per share) |
|
|
|
|
|
|
|
|
| (11,491 | ) |
|
|
|
|
|
|
| (11,491 | ) | ||||||||||||||
Unvested dividends |
|
|
|
|
| 506 | |
|
|
| (506 | ) |
|
|
|
|
|
|
| - | | |||||||||||||
Change in cumulative translation adjustment |
|
|
|
|
|
|
|
|
|
|
| (15,964 | ) |
|
|
|
|
| (15,964 | ) | ||||||||||||||
Deferral of common stock into deferred compensation plan |
|
|
|
|
|
|
| 107 | |
|
|
|
|
| (2 | ) |
| (107 | ) |
| - | | ||||||||||||
Net income |
|
|
|
|
|
|
|
|
| 56,888 | |
|
|
|
|
|
|
| 56,888 | | ||||||||||||||
BALANCE, January 31, 2015 |
| 21,075 | |
| $ | 2,108 | |
| $ | 230,429 | |
| $ | 1,682 | |
| $ | 374,074 | |
| $ | (17,493 | ) |
| (35 | ) |
| | ($1,682 | ) |
| $ | 589,118 | |
See accompanying notes to these consolidated financial statements.
50
Table of Contents
THE CHILDREN'S PLACE, INC. AND SUBSIDIARIES
CONSOLIDATED STATEMENTS OF CASH FLOWS
(In thousands)
| Fiscal Year Ended | ||||||||||
| January 31, |
| February 1, 2014 |
| February 2, 2013 | ||||||
|
|
|
|
|
| ||||||
CASH FLOWS FROM OPERATING ACTIVITIES: |
| |
|
| |
|
| ||||
Net income | $ | 56,888 | |
| $ | 53,026 | |
| $ | 63,243 | |
Reconciliation of net income to net cash provided by operating activities: |
|
|
|
|
| | |||||
Depreciation and amortization | 60,494 | |
| 64,858 | |
| 77,435 | | |||
Stock-based compensation | 17,783 | |
| 21,210 | |
| 14,253 | | |||
Excess tax benefits from stock-based compensation | (268 | ) |
| (211 | ) |
| (4,941 | ) | |||
Asset impairment charges | 11,145 | |
| 29,633 | |
| 2,284 | | |||
Deferred taxes | 5,627 | |
| (3,552 | ) |
| 1,973 | | |||
Deferred rent expense and lease incentives | (8,889 | ) |
| (11,999 | ) |
| (5,347 | ) | |||
Other | 2,208 | |
| 6,891 | |
| (597 | ) | |||
Changes in operating assets and liabilities: | | |
|
|
|
| |||||
Inventories | 21,022 | |
| (58,941 | ) |
| (28,828 | ) | |||
Accounts receivable and other assets | (6,268 | ) |
| (6,039 | ) |
| (1,131 | ) | |||
Income taxes payable, net of prepayments | (7,341 | ) |
| 3,441 | |
| 15,639 | | |||
Accounts payable and other current liabilities | 6,049 | |
| 73,609 | |
| 63,277 | | |||
Deferred rent and other liabilities | 2,960 | |
| 1,544 | |
| 7,782 | | |||
Total adjustments | 104,522 | |
| 120,444 | |
| 141,799 | | |||
Net cash provided by operating activities | 161,410 | |
| 173,470 | |
| 205,042 | | |||
CASH FLOWS FROM INVESTING ACTIVITIES: |
| |
|
| |
|
| | |||
Property and equipment purchases, lease acquisition and software costs | (72,212 | ) |
| (72,606 | ) |
| (90,182 | ) | |||
Purchase of short-term investments | (81,000 | ) |
| (97,500 | ) |
| (15,000 | ) | |||
Redemption of short-term investments | 91,500 | |
| 50,000 | |
| - | | |||
Change in company-owned life insurance policies | 5 | |
| 406 | |
| (38 | ) | |||
Net cash used in investing activities | (61,707 | ) |
| (119,700 | ) |
| (105,220 | ) | |||
CASH FLOWS FROM FINANCING ACTIVITIES: |
| |
|
| |
|
| | |||
Borrowings under revolving credit facility | 320,230 | |
| 124,289 | |
| 134,865 | | |||
Repayments under revolving credit facility | (320,230 | ) |
| (124,289 | ) |
| (134,865 | ) | |||
Purchase and retirement of common stock, including transaction costs | (76,129 | ) |
| (65,830 | ) |
| (89,020 | ) | |||
Cash dividends paid | (11,491 | ) |
| - | |
| - | | |||
Exercise of stock options | 55 | |
| 1,479 | |
| 2,185 | | |||
Excess tax benefits from stock-based compensation | 268 | |
| 211 | |
| 4,941 | | |||
Deferred financing costs | (306 | ) |
| - | |
| (363 | ) | |||
Net cash used in financing activities | (87,603 | ) |
| (64,140 | ) |
| (82,257 | ) | |||
Effect of exchange rate changes on cash | (12,806 | ) |
| (9,761 | ) |
| (92 | ) | |||
Net (decrease) increase in cash and cash equivalents | (706 | ) |
| (20,131 | ) |
| 17,473 | | |||
Cash and cash equivalents, beginning of period | 173,997 | |
| 194,128 | |
| 176,655 | | |||
Cash and cash equivalents, end of period | $ | 173,291 | |
| $ | 173,997 | |
| $ | 194,128 | |
See accompanying notes to these consolidated financial statements.
51
Table of Contents
THE CHILDREN'S PLACE, INC. AND SUBSIDIARIES
CONSOLIDATED STATEMENTS OF CASH FLOWS
(In thousands)
| Fiscal Year Ended | ||||||||||
| January 31, |
| February 1, 2014 |
| February 2, 2013 | ||||||
OTHER CASH FLOW INFORMATION: |
| |
|
| |
|
| ||||
Net cash paid during the year for income taxes | $ | 23,598 | |
| $ | 24,826 | |
| $ | 10,030 | |
Cash paid during the year for interest | 936 | |
| 499 | |
| 704 | | |||
Increase (decrease) in accrued purchases of property and equipment | 3,611 | |
| (5,924 | ) |
| (1,824 | ) | |||
See accompanying notes to these consolidated financial statements.
52
Table of Contents
THE CHILDREN'S PLACE, INC. AND SUBSIDIARIES
NOTES TO CONSOLIDATED FINANCIAL STATEMENTS
1. | BASIS OF PRESENTATION AND SUMMARY OF SIGNIFICANT ACCOUNTING POLICIES |
Description of Business
The Children's Place, Inc. and subsidiaries (the "Company") is the largest pure-play children's specialty apparel retailer in North America. The Company provides apparel, accessories, footwear and other items for children sizes 0-14. The Company designs, contracts to manufacture and sells and licenses to sell high-quality, value-priced merchandise, a substantial majority of which is under the proprietary "The Children's Place", "Place" and "Baby Place" brand names. As of January 31, 2015, the Company operated 1,097 The Children's Place stores throughout North America and an Internet store at www.childrensplace.com . As part of its merchandise procurement process, the Company maintains business operations in Asia. The Company's corporate offices are in New Jersey and it has one distribution facility in the United States and one in Canada.
The Company classifies its business into two segments: The Children's Place U.S. and The Children's Place International. Included in The Children's Place U.S. segment are the Company's U.S. and Puerto Rico based stores and U.S. revenue from the Company's wholesale partners. Included in The Children's Place International segment are the Company's Canadian based stores, revenue from the Company's Canada wholesale partner and revenue from international franchisees. Each segment includes an e-commerce business located at www.childrensplace.com . As of January 31, 2015, The Children's Place U.S. operated 963 stores and The Children's Place International operated 134 stores.
Certain reclassifications have been made to prior period financial statements to conform to the current period presentation.
Terms that are commonly used in the Company's notes to consolidated financial statements are defined as follows:
• | Fiscal 2014 - The fifty-two weeks ended January 31, 2015 |
• | Fiscal 2013 - The fifty-two weeks ended February 1, 2014 |
• | Fiscal 2012 - The fifty-three weeks ended February 2, 2013 |
• | Fiscal 2015 - The Company's next fiscal year representing the fifty-two weeks ending January 30, 2016 |
• | SEC- The U.S. Securities and Exchange Commission |
• | GAAP - Generally Accepted Accounting Principles |
• | FASB- Financial Accounting Standards Board |
• | FASB ASC - FASB Accounting Standards Codification, which serves as the source for authoritative U.S. GAAP, except that rules and interpretive releases by the SEC are also sources of authoritative U.S. GAAP for SEC registrants |
Fiscal Year
The Company's fiscal year is a 52-week or 53-week period ending on the Saturday on or nearest to January 31. Fiscal 2012 was a 53-week year. All other years presented were 52-week years.
Use of Estimates
The preparation of financial statements in conformity with U.S. GAAP requires management to make estimates and assumptions that affect the reported amounts of assets and liabilities, disclosure of contingent assets and liabilities at the date of the financial statements, and amounts of revenues and expenses reported during the period. Actual results could differ from the assumptions used and estimates made by management, which could have a material impact on the Company's financial position or results of operations.
Consolidation
The consolidated financial statements include the accounts of the Company and its wholly‑owned subsidiaries. Intercompany balances and transactions have been eliminated. As of January 31, 2015 , the Company does not have any investments in unconsolidated affiliates. The " Consolidation " topic of the FASB ASC is considered when determining whether an entity is subject to consolidation.
Cash and Cash Equivalents
The Company considers all highly liquid investments with an original maturity of three months or less to be cash equivalents.
53
Table of Contents
THE CHILDREN'S PLACE, INC. AND SUBSIDIARIES
NOTES TO CONSOLIDATED FINANCIAL STATEMENTS (Continued)
1. | BASIS OF PRESENTATION AND SUMMARY OF SIGNIFICANT ACCOUNTING POLICIES (Continued) |
Short-term Investments
Short-term investments consist of investments which the Company expects to convert into cash within one year, including time deposits, which have original maturities greater than 90 days. The Company classifies its investments in securities at the time of purchase as held-to-maturity and reevaluates such classifications on a quarterly basis. Held-to-maturity investments consist of securities that the Company has the intent and ability to retain until maturity. These securities are recorded at cost and adjusted for the amortization of premiums and discounts, which approximates fair value. Cash inflows and outflows related to the sale and purchase of investments are classified as investing activities in the Company's consolidated statements of cash flows. All of the Company's short-term investments are U.S. dollar denominated time deposits with banking institutions in Hong Kong that have six month maturity dates.
Revenue Recognition
The Company recognizes revenue, including shipping and handling fees billed to customers, upon purchase at the Company's retail stores or when received by the customer if the product was purchased via the Internet, net of coupon redemptions and anticipated sales returns. The Company deferred approximately $0.3 million and $1.8 million as of January 31, 2015 and February 1, 2014, respectively, for Internet sales shipped but not yet received by the customer. Sales tax collected from customers is excluded from revenue.
An allowance for estimated sales returns is calculated based upon the Company's sales return experience and is recorded in accrued expenses and other current liabilities. The allowance for estimated sales returns was approximately $1.9 million and $1.8 million as of January 31, 2015 and February 1, 2014, respectively.
The Company's policy with respect to gift cards is to record revenue as the gift cards are redeemed for merchandise. Prior to their redemption, gift cards are recorded as a liability, included in accrued expenses and other current liabilities. After two years, the Company recognizes breakage income for the estimated portion of unredeemed gift cards that is unlikely to be redeemed. The Company recognized gift card breakage income of approximately $1.6 million , $1.5 million and $1.5 million during Fiscal 2014, Fiscal 2013 and Fiscal 2012, respectively, and is recorded in selling, general and administrative expenses.
In October 2012, the Company launched a new points based customer loyalty program to replace the old program that was restricted to the Company's private label credit card customers. In this program, customers earn points based on purchases and other promotional activities. These points can be redeemed for coupons to discount future purchases. The Company has developed an estimated value of each point earned based on the awards customers can attain less a reasonable breakage rate. The value of each point earned is recorded as deferred revenue. Deferred revenue for loyalty points as of January 31, 2015 and February 1, 2014 was $9.0 million and $5.4 million , respectively.
During Fiscal 2012, the Company began an international store expansion program through territorial agreements with franchisees. At January 31, 2015, the Company's franchisees had a total of 72 stores open. The Company generates revenues from the franchisees from the sale of product, sales royalties and territory fees. The Company records gross sales and cost of goods sold on the sale of product to franchisees when the franchisor takes ownership of the product. The Company records gross sales for royalties when the franchisee sells the product to their customers. Under certain agreements the Company receives a fee from each franchisee for exclusive territorial rights. The Company records this territorial fee as deferred revenue and amortizes the fee into gross sales over the life of the territorial agreement. Deferred revenue for franchisees as of January 31, 2015 and February 1, 2014 was $0.8 million and $0.9 million , respectively.
Inventories
Inventories, which consist primarily of finished goods, are stated at the lower of cost or market, with cost determined on an average cost basis. The Company capitalizes supply chain costs in inventory and these costs are reflected in cost of sales as the inventories are sold. Inventory includes items that have been marked down to the Company's best estimate of their lower of cost or market value and an estimate for inventory shrinkage. The Company bases its decision to mark down merchandise upon its current rate of sale, the season and the sell-through of the item. The Company adjusts its inventory based upon an annual physical inventory and shrinkage is estimated in interim periods based upon the historical results of physical inventories in the context of current year facts and circumstances.
54
Table of Contents
THE CHILDREN'S PLACE, INC. AND SUBSIDIARIES
NOTES TO CONSOLIDATED FINANCIAL STATEMENTS (Continued)
1. | BASIS OF PRESENTATION AND SUMMARY OF SIGNIFICANT ACCOUNTING POLICIES (Continued) |
Cost of Sales (exclusive of depreciation and amortization)
In addition to the cost of inventory sold, the Company includes buying, design and distribution expenses, shipping and handling costs on merchandise sold directly to customers, and letter of credit fees in its cost of sales. The Company records all occupancy costs in its cost of sales, except administrative office buildings, which are recorded in selling, general and administrative expenses. All depreciation is reported on a separate line on the Company's consolidated statements of operations.
Stock-based Compensation
The Company's stock-based compensation plans are administered by the Compensation Committee of the Board of Directors (the "Compensation Committee"). The Compensation Committee is comprised of independent members of the Board of Directors (the "Board"). Effective May 20, 2011, the shareholders approved the 2011 Equity Incentive Plan (the "Equity Plan"). Upon adoption of the Equity Plan, the Company ceased granting awards under its 2005 Equity Incentive Plan. The Equity Plan allows the Compensation Committee to grant multiple forms of stock‑based compensation such as stock options, stock appreciation rights, restricted stock awards, deferred stock awards and performance stock awards.
The Company accounts for its stock‑based compensation in accordance with the provisions of the "Compensation-Stock Compensation" topic of the FASB ASC. These provisions require, among other things: (a) the fair value of all stock awards be expensed over their respective vesting periods; (b) the amount of cumulative compensation cost recognized at any date must at least be equal to the portion of the grant-date value of the award that is vested at that date and (c) that compensation expense include a forfeiture estimate for those shares not expected to vest. Also in accordance with these provisions, for those awards with multiple vest dates, the Company recognizes compensation cost on a straight-line basis over the requisite service period for the entire award.
Earnings per Common Share
The Company reports its earnings (loss) per share in accordance with the " Earnings Per Share " topic of the FASB ASC, which requires the presentation of both basic and diluted earnings (loss) per share on the statements of operations. The diluted weighted average common shares includes adjustments for the potential effects of outstanding stock options, Deferred Awards and Performance Awards, but only in the periods in which such effect is dilutive under the treasury stock method. Included in our basic and diluted weighted average common shares are those shares due to participants in the deferred compensation plan, which are held in treasury stock. Antidilutive stock awards are comprised of stock options and unvested deferred, restricted and performance shares which would have been antidilutive in the application of the treasury stock method in accordance with "Earnings Per Share" topic of FASB ASC.
In accordance with this topic, the following table reconciles income and share amounts utilized to calculate basic and diluted net income per common share (in thousands):
| Fiscal Year Ended | ||||||||||
| January 31, |
| February 1, 2014 |
| February 2, 2013 | ||||||
Net income | $ | 56,888 | |
| $ | 53,026 | |
| $ | 63,243 | |
| | |
| | |
| | | |||
Basic weighted average common shares | 21,681 | |
| 22,537 | |
| 24,092 | | |||
Dilutive effect of stock awards | 243 | |
| 298 | |
| 184 | | |||
Diluted weighted average common shares | 21,924 | |
| 22,835 | |
| 24,276 | | |||
Antidilutive stock awards | - | |
| 32 | |
| 10 | | |||
Accounts Receivable
Accounts receivable consists of credit and debit card receivables, franchisee and wholesale receivables, landlord construction allowance receivables and other miscellaneous items. Credit and debit card receivables represent credit and debit card sales for which the respective third party service company has yet to remit the cash. The unremitted balance approximates
55
Table of Contents
THE CHILDREN'S PLACE, INC. AND SUBSIDIARIES
NOTES TO CONSOLIDATED FINANCIAL STATEMENTS (Continued)
1. | BASIS OF PRESENTATION AND SUMMARY OF SIGNIFICANT ACCOUNTING POLICIES (Continued) |
the last few days of related sales for each reporting period. Bad debt associated with these sales is not material. Landlord construction allowance receivables represent landlord contributions to our construction costs of building out the related real estate, primarily new and remodeled stores. Total construction costs are capitalized as property and equipment and the landlord construction allowances are recorded as a lease incentive, a component of deferred rent, which is amortized as a reduction of rent expense over the lease term.
Insurance and Self-Insurance Reserves
The Company self-insures and purchases insurance policies to provide for workers' compensation, general liability and property losses, as well as director and officer's liability, vehicle liability and employee medical benefits. The Company estimates risks and records a liability based on historical claim experience, insurance deductibles, severity factors and other actuarial assumptions. The Company records the current portions of employee medical benefits, workers compensation and general liability reserves in accrued expenses and other current liabilities. As of January 31, 2015 and February 1, 2014 , the current portions of these reserves were approximately $6.5 million and $7.1 million , respectively. The Company records the long-term portions of employee medical benefits, workers' compensation and general liability reserves in other long-term liabilities. As of January 31, 2015 and February 1, 2014 , the long-term portions of these reserves were approximately $6.5 million and $5.5 million , respectively.
Property and Equipment
Property and equipment are stated at cost. Leasehold improvements are depreciated on a straight-line basis over the shorter of the life of the lease or the estimated useful life of the asset. All other property and equipment is depreciated on a straight-line basis based upon their estimated useful lives, which generally range from three to twenty-five years. Repairs and maintenance are expensed as incurred.
The Company accounts for internally developed software intended for internal use in accordance with provisions of the " Intangibles-Goodwill and Other " topic of the FASB ASC. The Company capitalizes development‑stage costs such as direct external costs and direct payroll related costs. When development is substantially complete, the Company amortizes the cost of the software on a straight-line basis over the expected life of the software. Preliminary project costs and post-implementation costs such as training, maintenance and support are expensed as incurred.
Accounting for Impairment of Long-Lived Assets
The Company periodically reviews its long-lived assets when events indicate that their carrying value may not be recoverable. Such events include a history trend or projected trend of cash flow losses or a future expectation that the Company will sell or dispose of an asset significantly before the end of its previously estimated useful life. In reviewing for impairment the Company groups its long-lived assets at the lowest possible level for which identifiable cash flows are largely independent of the cash flows of other assets and liabilities. In that regard, the Company groups its assets into two categories: corporate-related and store-related. Corporate-related assets consist of those associated with the Company's corporate offices, distribution centers and its information technology systems. Store-related assets consist of leasehold improvements, furniture and fixtures, certain computer equipment and lease related assets associated with individual stores.
For store-related assets, the Company reviews all stores that have been open or not remodeled for at least two years, or sooner if circumstances should dictate, on at least an annual basis. The Company believes waiting two years allows a store to reach a maturity level where a more comprehensive analysis of financial performance can be performed. For each store that shows indications of operating losses, the Company projects future cash flows over the remaining life of the lease and compares the total undiscounted cash flows to the net book value of the related long-lived assets. If the undiscounted cash flows are less than the related net book value of the long-lived assets, they are written down to their fair market value. The Company primarily determines fair market value to be the discounted future cash flows associated with those assets. In evaluating future cash flows, the Company considers external and internal factors. External factors comprise the local environment in which the store resides, including mall traffic, competition, and their effect on sales trends. Internal factors include the Company's ability to gauge the fashion taste of its customers, control variable costs such as cost of sales and payroll, and in certain cases, its ability to renegotiate lease costs.
56
Table of Contents
THE CHILDREN'S PLACE, INC. AND SUBSIDIARIES
NOTES TO CONSOLIDATED FINANCIAL STATEMENTS (Continued)
1. | BASIS OF PRESENTATION AND SUMMARY OF SIGNIFICANT ACCOUNTING POLICIES (Continued) |
Exit or Disposal Cost Obligations
In accordance with the " Exit or Disposal Cost Obligations " topic of the FASB ASC, the Company records its exit and disposal costs at fair value to terminate an operating lease or contract when termination occurs before the end of its term, or when costs will be incurred without future economic benefit to the Company, on the date the Company ceased using the leased property. In cases of employee termination benefits, the Company recognizes an obligation only when all of the following criteria are met:
• | management, having the authority to approve the action, commits to a plan of termination; |
• | the plan identifies the number of employees to be terminated, their job classifications or functions and their locations, and the expected completion date; |
• | the plan establishes the terms of the benefit arrangement, including the benefits that employees will receive upon termination (including but not limited to cash payments), in sufficient detail to enable employees to determine the type and amount of benefits they will receive if they are involuntarily terminated; and |
• | actions required to complete the plan indicate that it is unlikely that significant changes to the plan will be made or that the plan will be withdrawn. |
During the first quarter of Fiscal 2012, management approved a plan to exit its distribution center in Ontario, California (the "West Coast DC") and move the operations to its distribution center in Fort Payne, Alabama (the "Southeast DC"). The Company ceased operations at the West Coast DC in May 2012. The lease of the West Coast DC expires in March 2016 and the Company has subleased this facility through March 2016.
During the third quarter of Fiscal 2012, management approved a plan to close the Company's distribution center in Dayton, New Jersey ("Northeast DC") and move the operations to its Southeast DC. The Company ceased operations in the Northeast DC during the fourth quarter of fiscal 2012. The lease of its Northeast DC expires in January 2021 and the Company has subleased this facility through January 2021.
The following table provides details of the remaining accruals for the West Coast DC and Northeast DC, of which approximately $0.8 million was included in accrued expenses and other current liabilities and approximately $0.7 million was included in other long-term liabilities (dollars in thousands):
|
| Lease Termination Costs |
| Other Associated Costs |
| Total | ||||||
Balance at February 2, 2013 |
| $ | 8,376 | |
| $ | - | |
| $ | 8,376 | |
Restructuring costs |
| (1,413 | ) |
| 507 | |
| (906 | ) | |||
Payments and other adjustments |
| (4,284 | ) |
| (507 | ) |
| (4,791 | ) | |||
Balance at February 1, 2014 |
| 2,679 | |
| - | |
| 2,679 | | |||
Restructuring costs |
| (222 | ) |
| 154 | |
| (68 | ) | |||
Payments and other adjustments |
| (949 | ) |
| (154 | ) |
| (1,103 | ) | |||
Balance at January 31, 2015 |
| $ | 1,508 | |
| $ | - | |
| $ | 1,508 | |
Deferred Financing Costs
The Company capitalizes costs directly associated with acquiring third party financing. Deferred financing costs are included in other assets and are amortized as interest expense over the term of the related indebtedness. At January 31, 2015, deferred financing costs, net of accumulated amortization of $2.7 million , were approximately $1.2 million . At February 1, 2014, deferred financing costs, net of accumulated amortization of $2.4 million , were approximately $1.3 million .
Treasury Stock
Treasury stock is recorded at acquisition cost. Gains and losses on disposition are recorded as increases or decreases to additional paid-in capital with losses in excess of previously recorded gains charged directly to retained earnings. When treasury shares are retired and returned to authorized but unissued status, the carrying value in excess of par is allocated to additional paid-in capital and retained earnings on a pro rata basis.
57
Table of Contents
THE CHILDREN'S PLACE, INC. AND SUBSIDIARIES
NOTES TO CONSOLIDATED FINANCIAL STATEMENTS (Continued)
1. | BASIS OF PRESENTATION AND SUMMARY OF SIGNIFICANT ACCOUNTING POLICIES (Continued) |
Pre-opening Costs
Store pre-opening costs consist primarily of occupancy costs, payroll, supply, and marketing expenses, and are expensed as incurred in selling, general and administrative expenses. Pre-opening costs were $1.4 million , $3.3 million and $4.0 million for Fiscal 2014, Fiscal 2013 and Fiscal 2012, respectively.
Advertising and Marketing Costs
The Company expenses the cost of advertising over the period the advertising is run or displayed. Included in selling, general and administrative expenses for Fiscal 2014, Fiscal 2013 and Fiscal 2012 are advertising and other marketing costs of approximately $30.9 million , $33.8 million and $37.1 million , respectively.
Rent Expense and Deferred Rent
Rent expense and lease incentives, including landlord construction allowances, are recognized on a straight-line basis over the lease term, commencing generally on the date the Company takes possession of the leased property. The Company records rent expense and the impact of lease incentives for its stores and distribution centers as a component of cost of sales. The unamortized portion of deferred rent is included in deferred rent liabilities.
Income Taxes
We utilize the liability method of accounting for income taxes as set forth in the "Income Taxes" topic of the FASB ASC. Under the liability method, deferred taxes are determined based on the temporary differences between the financial statement and tax basis of assets and liabilities, as well as for net operating losses and tax credit carryforwards. Deferred tax assets and liabilities are measured using currently enacted tax rates that apply to taxable income in effect for the years in which the basis differences and tax assets are expected to be realized. A valuation allowance is recorded when it is more likely than not that any of the deferred tax assets will not be realized. In determining the need for valuation allowances we consider projected future taxable income and the availability of tax planning strategies. If in the future we determine that we would not be able to realize our recorded deferred tax assets, an increase in the valuation allowance would decrease earnings in the period in which such determination is made.
We assess our income tax positions and record tax benefits for all years subject to examination based upon our evaluation of the facts, circumstances and information available at the reporting date. For those tax positions where it is more likely than not that a tax benefit will be sustained, we have recorded the largest amount of tax benefit with a greater than 50% likelihood of being realized upon ultimate settlement with a taxing authority that has full knowledge of all relevant information. For those income tax positions where it is not more likely than not that a tax benefit will be sustained, no tax benefit has been recognized in the financial statements.
Accumulated Other Comprehensive Income
Accumulated other comprehensive income consists of cumulative translation adjustments.
Foreign Currency Translation
The Company has determined that the local currencies of its Canadian and Asian subsidiaries are their functional currencies. In accordance with the " Foreign Currency Matters " topic of the FASB ASC, the assets and liabilities denominated in foreign currency are translated into U.S. dollars at the current rate of exchange existing at period-end and revenues and expenses are translated at average monthly exchange rates. Related translation adjustments are reported as a separate component of stockholders' equity. The Company also transacts certain business in foreign denominated currencies, primarily its Canadian subsidiary purchases inventory in U.S. Dollars, and there are intercompany charges between various subsidiaries. In Fiscal 2014, Fiscal 2013 and Fiscal 2012, the Company recorded realized and unrealized gains (losses) on such transactions of approximately $(0.5) million , $0.5 million and $0.1 million , respectively.
58
Table of Contents
THE CHILDREN'S PLACE, INC. AND SUBSIDIARIES
NOTES TO CONSOLIDATED FINANCIAL STATEMENTS (Continued)
1. | BASIS OF PRESENTATION AND SUMMARY OF SIGNIFICANT ACCOUNTING POLICIES (Continued) |
Legal Contingencies
The Company reserves for the outcome of litigation and contingencies when it determines an adverse outcome is probable and can estimate losses. Estimates are adjusted as facts and circumstances require. The Company expenses the costs to resolve litigation as incurred, net of amounts, if any, recovered through our insurance coverage.
Retained Earnings
There are no restrictions on the Company's retained earnings.
Fair Value Measurement and Financial Instruments
The "Fair Value Measurements and Disclosure" topic of the FASB ASC provides a single definition of fair value, together with a framework for measuring it, and requires additional disclosure about the use of fair value to measure assets and liabilities.
This topic defines fair value as the price that would be received to sell an asset or paid to transfer a liability in an orderly transaction between market participants at the measurement date and establishes a three-level hierarchy, which encourages an entity to maximize the use of observable inputs and minimize the use of unobservable inputs when measuring fair value. The three levels of the hierarchy are defined as follows:
• | Level 1 - inputs to the valuation techniques that are quoted prices in active markets for identical assets or liabilities |
• | Level 2 - inputs to the valuation techniques that are other than quoted prices but are observable for the assets or liabilities, either directly or indirectly |
• | Level 3 - inputs to the valuation techniques that are unobservable for the assets or liabilities |
The Company's cash and cash equivalents, short-term investments, accounts receivable, accounts payable and credit facility are all short-term in nature. As such, their carrying amounts approximate fair value and fall within Level 1 of the fair value hierarchy. The underlying assets of the Company's Deferred Compensation Plan, excluding Company stock, fall within Level 2 of the fair value hierarchy. The Company stock included in the Deferred Compensation Plan is not subject to fair value measurement.
The Company's assets measured at fair value on a nonrecurring basis include long-lived assets. The Company reviews the carrying amounts of such assets when events indicate that their carrying amounts may not be recoverable. Any resulting asset impairment would require that the asset be recorded at its fair value. The resulting fair value measurements of the assets are considered to be Level 3 inputs. Long-lived assets, primarily comprised of property and equipment, held and used with a carrying amount of $15.9 million were written down to their fair value, resulting in an impairment charge of $11.1 million , which was included in earnings for Fiscal 2014. For Fiscal 2013, long-lived assets held and used with a carrying amount of $44.4 million were written down to their fair value, resulting in an impairment charge of $29.6 million , which was included in earnings for Fiscal 2013. For Fiscal 2012, long-lived assets held and used with a carrying amount of $3.1 million were written down to their fair value, resulting in an impairment charge of $2.3 million , which was included in earnings for Fiscal 2012.
Recently Issued Accounting Updates
In May 2014, the FASB issued guidance relating to revenue recognition from contracts with customers. This guidance requires entities to recognize revenue in a way that depicts the transfer of promised goods or services to customers in an amount that reflects the consideration to which the entity expects to be entitled to in exchange for those goods or services. This standard is effective for fiscal years, and interim periods within those years, beginning after December 15, 2016, and is to be applied retrospectively, with early application not permitted. The Company is currently reviewing the potential impact of this standard.
2. STOCKHOLDERS' EQUITY
The Company's Board of Directors has authorized the following share repurchase programs: (1) $100.0 million on March 3, 2011 (the "2011 Share Repurchase Program"); (2) $50.0 million on March 7, 2012 (the "2012 $50 Million Share Repurchase Program"); (3) $100.0 million on November 26, 2012 (the "2012 Share Repurchase Program"); and (4) $100.0 million on March 3, 2014 (the "2014 Share Repurchase Program"). At January 31, 2015, the 2011 Share Repurchase Program, the 2012
59
Table of Contents
$50 Million Share Repurchase Program and the 2012 Share Repurchase Program had been completed, and there was approximately $39.8 million remaining on the 2014 Share Repurchase Program. On January 7, 2015, the Board of Directors authorized a $100 million share repurchase program (the "2015 Share Repurchase Program"). Under the 2014 Share Repurchase Program and the 2015 Share Repurchase Program, the Company may repurchase shares in the open market at current market prices at the time of purchase or in privately negotiated transactions. The timing and actual number of shares repurchased under the program will depend on a variety of factors including price, corporate and regulatory requirements, and other market and business conditions. We may suspend or discontinue the program at any time, and may thereafter reinstitute purchases, all without prior announcement.
Pursuant to restrictions imposed by the Company's equity plan during black-out periods, the Company withholds and retires shares of vesting stock awards in exchange for payments to satisfy minimum withholding tax requirements. The Company's payment of the withholding taxes in exchange for the shares constitutes a purchase of its common stock.
The Company acquires shares of its common stock in conjunction with liabilities owed under a deferred compensation plan, which are held in treasury. The following table summarizes the Company's share repurchases (in thousands):
|
| Fiscal Year Ended | |||||||||||||
|
| January 31, 2015 |
| February 1, 2014 |
| February 2, 2013 | |||||||||
|
| Shares | Value |
| Shares | Value |
| Shares | Value | ||||||
Share repurchases related to: |
|
|
|
|
|
|
|
|
| ||||||
2011 Share buyback program |
| - | | - | |
| - | | - | |
| 377 | | 19,236 | |
2012 $50 Million Share buyback program |
| - | | - | |
| - | | - | |
| 1,001 | | 50,000 | |
2012 Share buyback program |
| 282 | | 14,671 | |
| 1,296 | | 65,691 | |
| 420 | | 19,638 | |
2014 Share buyback program (1) |
| 1,189 | | 60,209 | |
| - | | - | |
| - | | - | |
Withholding taxes |
| 22 | | 1,249 | |
| 2 | | 139 | |
| 2 | | 146 | |
Shares acquired and held in treasury |
| 2 | | 107 | |
| 9 | | 456 | |
| 10 | | 521 | |
(1) | Subsequent to January 31, 2015 and through March 24, 2015, the Company repurchased an additional 0.2 million shares for approximately $13.3 million . |
In accordance with the "Equity" topic of the FASB ASC, the par value of the shares retired is charged against common stock and the remaining purchase price is allocated between additional paid-in capital and retained earnings. The portion charged against additional paid-in capital is done using a pro rata allocation based on total shares outstanding. Related to all shares retired for Fiscal 2014, Fiscal 2013 and Fiscal 2012, approximately $60.4 million , $53.1 million and $73.0 million was charged to retained earnings, respectively.
Related to Fiscal 2014 dividends, $12.0 million was charged to retained earnings, of which $11.5 million related to cash dividends paid and $0.5 million related to dividend share equivalents on unvested Deferred Awards and Performance Awards. On February 13, 2015, the Board of Directors authorized a quarterly cash dividend of $0.15 per share to be paid on April 30, 2015 to shareholders of record on the close of business on April 9, 2015. Future declarations of quarterly dividends and the establishment of future record and payment dates are subject to approval by the Company's Board of Directors based on a number of factors, including business and market conditions, the Company's future financial performance and other investment priorities.
3. STOCK-BASED COMPENSATION
The following table summarizes the Company's stock-based compensation expense (in thousands):
| Fiscal Year Ended | ||||||||||
| January 31, |
| February 1, |
| February 2, | ||||||
Deferred Awards | $ | 10,529 | |
| $ | 12,873 | |
| $ | 11,109 | |
Performance Awards | 7,254 | |
| 8,337 | |
| 3,144 | | |||
Total stock-based compensation expense (1) | $ | 17,783 | |
| $ | 21,210 | |
| $ | 14,253 | |
60
Table of Contents
THE CHILDREN'S PLACE, INC. AND SUBSIDIARIES
NOTES TO CONSOLIDATED FINANCIAL STATEMENTS (Continued)
(1) A portion of stock-based compensation is included in cost of sales. Approximately $1.6 million , $2.8 million and $1.7 million in Fiscal 2014, Fiscal 2013 and Fiscal 2012, respectively, were included in cost of sales. All other stock-based compensation is included in selling, general & administrative expense.
The Company recognized a tax benefit related to stock-based compensation expense of $7.0 million , $8.5 million and $5.6 million for Fiscal 2014, Fiscal 2013 and Fiscal 2012, respectively.
The Company generally grants time vesting stock awards ("Deferred Awards") and performance-based stock awards ("Performance Awards") to employees at management levels. The Company also grants Deferred Awards to its non-employee directors. Deferred Awards are granted in the form of restricted stock units that require each recipient to complete a service period. Deferred Awards generally vest ratably over three years, except for those granted to non-employee directors, which
generally vest over one year. Performance Awards are granted in the form of restricted stock units which have performance criteria that must be achieved for the awards to vest in addition to a service period requirement.
For Performance Awards issued during Fiscal 2013 and to our CEO in Fiscal 2014, each award has a defined number of shares that an employee can earn (the "Target Shares"), and based on the adjusted operating income level achieved for the three-fiscal year period (one-fiscal year period in the case of the CEO's Performance Award), the employee can earn from 0% to 200% of their Target Shares. The fair value of these Performance Awards and all Deferred Awards granted is based on the closing price of our common stock on the grant date. For non-CEO Performance Awards issued during Fiscal 2014 (the "2014 Performance Awards"), the Target Shares earned can range from 0% to 300% and depend on the achievement of adjusted earnings per share for the three-fiscal year performance period and our total shareholder return ("TSR") relative to that of companies in our peer group for the same period. The 2014 Performance Awards cliff vest, if earned, after a three year service period. The 2014 Performance Awards grant date fair value was estimated using a Monte Carlo simulation covering the period from the valuation date through the end of the performance period using our simulated stock price as well as the TSR of companies in our peer group. Stock-based compensation expense is recognized ratably over the related service period reduced for estimated forfeitures of those awards not expected to vest due to employee turnover. Stock-based compensation expense, as it relates to Performance Awards, is also adjusted based on the Company's estimate of the percentage of the aggregate Target Shares expected to be earned.
At January 31, 2015, the Company had 904,283 shares available for grant under the Equity Plan.
61
Table of Contents
THE CHILDREN'S PLACE, INC. AND SUBSIDIARIES
NOTES TO CONSOLIDATED FINANCIAL STATEMENTS (Continued)
3. STOCK-BASED COMPENSATION (Continued)
Changes in the Company's Unvested Stock Awards during Fiscal 2014, Fiscal 2013 and Fiscal 2012
Deferred Awards
| Fiscal Year Ended | |||||||||||||||||||
| January 31, 2015 |
| February 1, 2014 |
| February 2, 2013 | |||||||||||||||
| Number of Shares |
| Weighted Average Grant Date Fair Value |
| Number of Shares |
| Weighted Average Grant Date Fair Value |
| Number of Shares |
| Weighted Average Grant Date Fair Value | |||||||||
| (in thousands) |
|
|
| (in thousands) |
|
|
| (in thousands) |
|
| |||||||||
Unvested Deferred Awards at beginning of year | 691 | |
| $ | 49.27 | |
| 560 | |
| $ | 49.53 | |
| 406 | |
| $ | 47.96 | |
Granted | 273 | |
| 48.50 | |
| 395 | |
| 48.93 | |
| 518 | |
| 49.06 | | |||
Vested (1) | (229 | ) |
| 48.97 | |
| (205 | ) |
| 49.46 | |
| (198 | ) |
| 45.33 | | |||
Forfeited | (143 | ) |
| 49.31 | |
| (59 | ) |
| 48.82 | |
| (166 | ) |
| 49.22 | | |||
Unvested Deferred Awards at end of year | 592 | |
| $ | 49.02 | |
| 691 | |
| $ | 49.27 | |
| 560 | |
| $ | 49.53 | |
____________________________________________
(1) | In Fiscal 2014, Fiscal 2013 and Fiscal 2012, the Company withheld shares of 21,788 , 2,089 and 2,200 , respectively, to satisfy minimum withholding tax requirements. These shares were immediately retired. |
Total unrecognized stock-based compensation expense related to unvested Deferred Awards approximated $16.1 million as of January 31, 2015, which will be recognized over a weighted average period of approximately 2.1 years.
The fair value of Deferred Awards held by the Company's employees that vested during Fiscal 2014, Fiscal 2013 and Fiscal 2012 was approximately $11.4 million , $9.8 million and $10.0 million , respectively.
Performance Awards
| Fiscal Year Ended | |||||||||||||||||||
| January 31, 2015 |
| February 1, 2014 |
| February 2, 2013 | |||||||||||||||
| Number of Performance Shares (1) |
| Weighted Average Grant Date Fair Value |
| Number of Performance Shares (1) |
| Weighted Average Grant Date Fair Value |
| Number of Performance Shares (1) |
| Weighted Average Grant Date Fair Value | |||||||||
| (in thousands) |
|
|
| (in thousands) |
|
|
| (in thousands) |
|
| |||||||||
Unvested Performance Awards at beginning of year | 267 | |
| $ | 47.67 | |
| 172 | |
| $ | 48.59 | |
| 6 | |
| $ | 46.08 | |
Granted | 245 | |
| 50.91 | |
| 204 | |
| 47.89 | |
| 230 | |
| 48.51 | | |||
Vested shares | (107 | ) |
| 46.34 | |
| (95 | ) |
| 49.84 | |
| (2 | ) |
| 45.79 | | |||
Net shares in excess of (less than) target | - | |
| - | |
| - | |
| - | |
| (13 | ) |
| 51.40 | | |||
Forfeited | (60 | ) |
| 48.87 | |
| (14 | ) |
| 47.55 | |
| (49 | ) |
| 47.37 | | |||
Unvested Performance Awards at end of year | 345 | |
| $ | 50.18 | |
| 267 | |
| $ | 47.67 | |
| 172 | |
| $ | 48.59 | |
____________________________________________
(1) | For those awards in which the performance period is complete, the number of unvested shares is based on actual shares that will vest upon completion of the service period. |
Based on the current number of Performance Awards expected to be earned, the total unrecognized stock-based compensation expense related to unvested Performance Awards approximated $6.1 million as of January 31, 2015, which will be recognized over a weighted average period of approximately 2.2 years.
The fair value of Performance Awards held by the Company's employees that vested during Fiscal 2014, Fiscal 2013 and Fiscal 2012 was approximately $5.5 million , $5.0 million and $0.1 million , respectively.
62
Table of Contents
THE CHILDREN'S PLACE, INC. AND SUBSIDIARIES
NOTES TO CONSOLIDATED FINANCIAL STATEMENTS (Continued)
3. STOCK-BASED COMPENSATION (Continued)
Stock Options
No stock options were issued during Fiscal 2014, Fiscal 2013 and Fiscal 2012 and at January 31, 2015, there were no unvested stock options.
Outstanding Stock Options
Changes in the Company's outstanding stock options for Fiscal 2014 were as follows:
|
| Fiscal Year Ended | |||||||||||||||||||
|
| January 31, 2015 |
| February 1, 2014 |
| February 2, 2013 | |||||||||||||||
|
| Number of Options |
| Weighted Average Exercise Price |
| Number of Options |
| Weighted Average Exercise Price |
| Number of Options |
| Weighted Average Exercise Price | |||||||||
|
| (in thousands) |
|
|
| (in thousands) |
|
|
| (in thousands) |
|
| |||||||||
Options outstanding at beginning of year |
| 34 | |
| $ | 28.77 | |
| 84 | |
| $ | 30.08 | |
| 154 | |
| $ | 30.98 | |
Granted |
| - | |
| - | |
| - | |
| - | |
| - | |
| - | | |||
Exercised (1) |
| (2 | ) |
| 24.54 | |
| (49 | ) |
| 31.06 | |
| (68 | ) |
| 32.03 | | |||
Forfeited |
| (2 | ) |
| 29.54 | |
| (1 | ) |
| 27.11 | |
| (2 | ) |
| 12.07 | | |||
Options outstanding at end of year (2) |
| 30 | |
| $ | 29.05 | |
| 34 | |
| $ | 28.77 | |
| 84 | |
| $ | 30.08 | |
Options exercisable at end of year (2) |
| 30 | |
| $ | 29.05 | |
| 34 | |
| $ | 28.77 | |
| 84 | |
| $ | 30.08 | |
____________________________________________
(1) | The aggregate intrinsic value of options exercised was approximately $0.1 million , $0.9 million and $1.3 million for Fiscal 2014, Fiscal 2013 and Fiscal 2012, respectively. |
(2) | The aggregate intrinsic value of options outstanding and exercisable at the end of Fiscal 2014, Fiscal 2013 and Fiscal 2012 was approximately $0.9 million , $0.8 million and $1.6 million , respectively. |
The following table summarizes information regarding options outstanding at January 31, 2015:
|
|
|
| Options Outstanding and Exercisable | ||||||
Range of Exercise Prices |
|
| Options (in thousands) |
| Weighted Average Exercise Price |
| Weighted Average Remaining Contractual Life | |||
$22.02 | $31.63 |
|
| 30 | |
| 29.05 | |
| 3.3 |
63
Table of Contents
THE CHILDREN'S PLACE, INC. AND SUBSIDIARIES
NOTES TO CONSOLIDATED FINANCIAL STATEMENTS (Continued)
4. PROPERTY AND EQUIPMENT
Property and equipment consist of the following (in thousands):
| Asset Life |
| January 31, 2015 |
| February 1, 2014 | ||||
Property and equipment: |
|
|
| |
|
| | ||
Land and land improvements | - |
| $ | 3,403 | |
| $ | 3,403 | |
Building and improvements | 20-25 yrs |
| 35,548 | |
| 35,548 | | ||
Material handling equipment | 10-15 yrs |
| 48,479 | |
| 48,345 | | ||
Leasehold improvements | 3-15 yrs |
| 339,474 | |
| 350,451 | | ||
Store fixtures and equipment | 3-10 yrs |
| 231,797 | |
| 234,151 | | ||
Capitalized software | 3-10 yrs |
| 120,054 | |
| 63,874 | | ||
Construction in progress | - |
| 24,644 | |
| 43,213 | | ||
|
|
| 803,399 | |
| 778,985 | | ||
Less accumulated depreciation and amortization |
|
| (493,098 | ) |
| (466,836 | ) | ||
Property and equipment, net |
|
| $ | 310,301 | |
| $ | 312,149 | |
The Company conducted a review of its store portfolio using business hurdles management designed to enhance profitability and improve overall operating results. Based on this review, the Company compiled a list of underperforming stores targeted for closure (the "Disposition List"). As a result of this review the Company closed 35 stores in Fiscal 2014 and 41 stores in Fiscal 2013. The Company also identified additional underperforming stores for which the Company will review its options for improving their financial performance, including but not limited to negotiating occupancy relief, in order to achieve the business hurdles. If these stores are unable to do so, then the Company will move them to the Disposition List.
At January 31, 2015, the Company performed impairment testing on 1,063 stores with a total net book value of $138.9 million . During Fiscal 2014, the Company recorded $11.1 million of impairment charges primarily related to 74 underperforming stores, of which 44 were fully impaired and 30 were partially impaired. Of the 74 underperforming stores 69 were in the U.S. and five were in Canada. As of January 31, 2015, the aggregate net book value of the stores that were partially impaired was approximately $3.6 million , which the Company determined to be recoverable based on an estimate of discounted future cash flows. Consistent with its impairment policy, the Company concluded that changes in circumstances affecting the carrying value of stores included on the Disposition List required the Company to review all stores included on the Disposition List regardless of whether the store had been open for at least two years. Impairment charges for all stores were recorded as a result of revenue and/or gross margins not meeting targeted levels and accelerated store lease termination dates.
At February 1, 2014, the Company performed impairment testing on 1,066 stores with a total net book value of $156.9 million . During Fiscal 2013, the Company recorded $20.5 million of store impairment charges primarily related to 127 underperforming stores, of which 106 were fully impaired and 21 were partially impaired. Of the 127 underperforming stores 109 were in the U.S. and 18 were in Canada.
Company management continues to believe that making progress on its systems implementations will be one of the key drivers to improve its operations and strengthen its financial performance. During the second quarter of Fiscal 2013 the Company established a strategic long term systems plan. As part of this plan, the Company concluded that certain development costs previously incurred were no longer relevant and deemed certain systems to be obsolete and needed to be replaced by enhanced capabilities in order to incorporate industry best practices as well as service our international franchisees and wholesale business partners. Accordingly, the Company recorded asset impairment charges of $9.1 million and incurred $1.2 million of selling, general and administrative expenses related to the write-down of some previously capitalized development costs and obsolete systems.
At February 2, 2013, the Company performed impairment testing on 1,045 stores with a total net book value of $175.3 million . During Fiscal 2012, the Company recorded $2.3 million of impairment charges primarily related to six underperforming stores, of which two were fully impaired and four were partially impaired. All underperforming stores were in the U.S.
64
Table of Contents
THE CHILDREN'S PLACE, INC. AND SUBSIDIARIES
NOTES TO CONSOLIDATED FINANCIAL STATEMENTS (Continued)
4. PROPERTY AND EQUIPMENT (Continued)
During Fiscal 2014, the Company capitalized approximately $42.4 million of external software costs and approximately $11.6 million of internal programming and development costs, of which $0.9 million was related to stock-based compensation. During Fiscal 2013, the Company capitalized approximately $19.5 million of external software costs and approximately $8.7 million of internal programming and development costs, of which $0.5 million was related to stock-based compensation. During Fiscal 2012, the Company capitalized approximately $12.9 million of external software costs and approximately $3.8 million of internal programming and development costs. Amortization expense of capitalized software was approximately $11.1 million , $7.0 million and $7.4 million in Fiscal 2014, Fiscal 2013 and Fiscal 2012, respectively.
As of January 31, 2015, the Company had approximately $6.6 million in property and equipment for which payment had not been made, which was included in accrued expenses and other current liabilities.
5. CREDIT FACILITY
The Company and certain of its domestic subsidiaries maintain a credit agreement with Wells Fargo Bank, National Association ("Wells Fargo"), Bank of America, N.A., HSBC Business Credit (USA) Inc., and JPMorgan Chase Bank, N.A. as lenders (collectively, the "Lenders"), and Wells Fargo, as Administrative Agent, Collateral Agent and Swing Line Lender (the "Credit Agreement"). The Credit Agreement was amended and restated on March 4, 2014 to incorporate all prior amendments, and the provisions below reflect the amended and restated Credit Agreement.
The Credit Agreement, which expires in August 2018, consists of a $200 million asset based revolving credit facility, with a $50 million sublimit for standby and documentary letters of credit and an uncommitted accordion feature that could provide up to $25 million of additional availability. Revolving credit loans outstanding under the Credit Agreement bear interest, at the Company's option, at:
(i) | the prime rate plus a margin of 0.50% to 0.75% based on the amount of the Company's average excess availability under the facility; or |
(ii) | the London InterBank Offered Rate, or "LIBOR", for an interest period of one, two, three or six months, as selected by the Company, plus a margin of 1.50% to 1.75% based on the amount of the Company's average excess availability under the facility. |
The Company is charged an unused line fee of 0.25% on the unused portion of the commitments. Letter of credit fees range from 0.75% to 0.875% for commercial letters of credit and range from 1.00% to 1.25% for standby letters of credit. Letter of credit fees are determined based on the amount of the Company's average excess availability under the facility. The amount available for loans and letters of credit under the Credit Agreement is determined by a borrowing base consisting of certain credit card receivables, certain inventory and the fair market value of certain real estate, subject to certain reserves.
The outstanding obligations under the Credit Agreement may be accelerated upon the occurrence of certain events, including, among others, non-payment, breach of covenants, the institution of insolvency proceedings, defaults under other material indebtedness and a change of control, subject, in the case of certain defaults, to the expiration of applicable grace periods. The Company is not subject to any early termination fees.
The Credit Agreement contains covenants, which include conditions on stock buybacks and the payment of cash dividends or similar payments. Credit extended under the Credit Agreement is secured by a first priority security interest in substantially all of the Company's U.S. assets excluding intellectual property, software, equipment and fixtures.
On March 4, 2014, the Credit Agreement was amended to permit the payment of dividends, subject to certain conditions, to increase the revolving credit limit from $150 million to its current $200 million and to extend the term from August 2017 to August 2018, and was restated to incorporate all prior amendments. In conjunction with this amendment and restatement, the Company paid approximately $0.3 million in additional deferred financing costs.
As of January 31, 2015, the Company has capitalized an aggregate of approximately $4.0 million in deferred financing costs related to the Credit Agreement. The unamortized balance of deferred financing costs at January 31, 2015 was approximately $1.2 million . Unamortized deferred financing costs are amortized over the remaining term of the Credit Agreement.
65
Table of Contents
THE CHILDREN'S PLACE, INC. AND SUBSIDIARIES
NOTES TO CONSOLIDATED FINANCIAL STATEMENTS (Continued)
The table below presents the components (in millions) of the Company's credit facility:
| January 31, |
| February 1, | ||||
Credit facility maximum | $ | 200.0 | |
| $ | 150.0 | |
Borrowing base | 183.2 | |
| 150.0 | | ||
|
|
|
| ||||
Outstanding borrowings | - | |
| - | | ||
Letters of credit outstanding-merchandise | - | |
| 1.2 | | ||
Letters of credit outstanding-standby | 9.1 | |
| 9.9 | | ||
Utilization of credit facility at end of period | 9.1 | |
| 11.1 | | ||
|
|
|
| ||||
Availability (1) | $ | 174.1 | |
| $ | 138.9 | |
|
|
|
| ||||
Interest rate at end of period | 3.8 | % |
| 3.8 | % | ||
| Fiscal 2014 |
| Fiscal 2013 | ||||
Average end of day loan balance during the period | $ | 9.4 | |
| $ | - | |
Highest end of day loan balance during the period | 40.9 | |
| 10.4 | | ||
Average interest rate | 3.2 | % |
| 3.8 | % | ||
(1) | The sublimit availability for letters of credit was $40.9 million and $113.9 million at January 31, 2015 and February 1, 2014, respectively. |
Letter of credit fees were immaterial in Fiscal 2014 and approximated $0.2 million in each of Fiscal 2013 and Fiscal 2012, respectively, and are included in cost of sales.
66
Table of Contents
THE CHILDREN'S PLACE, INC. AND SUBSIDIARIES
NOTES TO CONSOLIDATED FINANCIAL STATEMENTS (Continued)
6. | INTEREST EXPENSE (INCOME), NET |
The following table presents the components of the Company's interest expense, net (in thousands):
| Fiscal Year Ended | ||||||||||
| January 31, 2015 |
| February 1, |
| February 2, | ||||||
Interest income | $ | 1,120 | |
| $ | 1,123 | |
| $ | 988 | |
|
|
|
|
|
| ||||||
Less: |
| |
|
| |
|
| | |||
Interest expense – revolver | 313 | |
| - | |
| - | | |||
Interest expense – credit facilities | 92 | |
| 120 | |
| 146 | | |||
Unused line fee | 447 | |
| 305 | |
| 422 | | |||
Amortization of deferred financing fees | 352 | |
| 364 | |
| 364 | | |||
Other interest and fees | 84 | |
| 69 | |
| 76 | | |||
Total interest expense | 1,288 | |
| 858 | |
| 1,008 | | |||
Interest expense (income), net | $ | (168 | ) |
| $ | 265 | |
| $ | (20 | ) |
7. | PREPAID EXPENSES AND OTHER CURRENT ASSETS |
Prepaid expenses and other current assets are comprised of the following (in thousands):
|
| January 31, 2015 |
| February 1, 2014 | ||||
Prepaid property expense |
| $ | 20,781 | |
| $ | 20,933 | |
Prepaid income taxes |
| 10,289 | |
| 3,930 | | ||
Prepaid maintenance contracts |
| 3,664 | |
| 3,124 | | ||
Prepaid insurance |
| 2,393 | |
| 2,582 | | ||
Other |
| 2,222 | |
| 3,013 | | ||
Prepaid expenses and other current assets |
| $ | 39,349 | |
| $ | 33,582 | |
67
Table of Contents
THE CHILDREN'S PLACE, INC. AND SUBSIDIARIES
NOTES TO CONSOLIDATED FINANCIAL STATEMENTS (Continued)
8. | ACCRUED EXPENSES AND OTHER CURRENT LIABILITIES |
Accrued expenses and other current liabilities are comprised of the following (in thousands):
|
| January 31, 2015 |
| February 1, 2014 | ||||
Accrued salaries and benefits |
| $ | 33,633 | |
| $ | 27,597 | |
Customer liabilities |
| 32,794 | |
| 31,247 | | ||
Accrued freight |
| 6,622 | |
| 5,267 | | ||
Sales taxes and other taxes payable |
| 6,369 | |
| 6,689 | | ||
Accrued marketing |
| 5,794 | |
| 5,075 | | ||
Accrued store expenses |
| 4,573 | |
| 8,410 | | ||
Accrued insurance |
| 3,759 | |
| 4,676 | | ||
Accrued real estate expenses |
| 3,717 | |
| 7,172 | | ||
Accrued construction-in-progress |
| 3,631 | |
| 8,277 | | ||
Accrued professional fees |
| 2,633 | |
| 2,369 | | ||
Accrued short-term restructuring costs |
| 798 | |
| 941 | | ||
Other |
| 14,401 | |
| 11,938 | | ||
Accrued expenses and other current liabilities |
| $ | 118,724 | |
| $ | 119,658 | |
9. | COMMITMENTS AND CONTINGENCIES |
Operating Lease Commitments
The Company leases all of its stores, offices and distribution facilities (except the Ft. Payne, Alabama distribution center which the Company owns), and certain office equipment, store fixtures and automobiles, under operating leases expiring through 2025. The leases require fixed minimum annual rental payments plus, under the terms of certain leases, additional payments for taxes, other expenses and additional rent based upon sales.
Store, office and distribution facilities minimum rent, contingent rent and sublease income are as follows (in thousands):
|
| Fiscal Year Ended | |||||||
|
| January 31, |
| February 1, 2014 |
| February 2, 2013 | |||
Minimum rentals |
| 164,510 | |
| 168,112 | |
| 166,022 | |
Additional rent based upon sales |
| 797 | |
| 943 | |
| 1,270 | |
Sublease income |
| (2,967 | ) |
| (1,138 | ) |
| (369 | ) |
68
Table of Contents
THE CHILDREN'S PLACE, INC. AND SUBSIDIARIES
NOTES TO CONSOLIDATED FINANCIAL STATEMENTS (Continued)
9. | COMMITMENTS AND CONTINGENCIES (Continued) |
Future minimum annual lease payments under the Company's operating leases at January 31, 2015 were as follows (in thousands):
|
| Minimum Operating Lease Payments | ||
2015 |
| $ | 156,208 | |
2016 |
| 143,318 | | |
2017 |
| 126,449 | | |
2018 |
| 108,901 | | |
2019 |
| 96,534 | | |
Thereafter |
| 245,981 | | |
Total minimum lease payments |
| $ | 877,391 | |
Purchase Commitments
As of January 31, 2015, the Company has entered into various purchase commitments for merchandise for re-sale of approximately $288.7 million and approximately $9.4 million for equipment, construction and other non-merchandise commitments.
Employment Agreements
The Company has an employment agreement with its President and Chief Executive Officer, which provides for severance of two times the sum of base salary plus bonus, and certain other payments and benefits following any termination without cause or for "good reason". As of January 31, 2015, these cash severance benefits approximated $6.1 million . In the event of a change in control of the Company, certain executives will receive, in the aggregate, approximately $23.2 million of cash severance benefits should they either be terminated or voluntarily terminate their employment due to a degradation of duties as defined in their agreement.
10. LEGAL AND REGULATORY MATTERS
The Company is involved in various legal proceedings arising in the normal course of business. In the opinion of management, any ultimate liability arising out of these proceedings will not have a material effect on the Company's financial position , results of operations or cash flows.
11. | INCOME TAXES |
The components of income before taxes are as follows (in thousands):
|
| Fiscal Year Ended | ||||||||||
|
| January 31, |
| February 1, 2014 |
| February 2, 2013 | ||||||
U.S. |
| $ | 47,888 | |
| $ | 36,487 | |
| $ | 36,948 | |
Foreign |
| 31,987 | |
| 40,061 | |
| 52,747 | | |||
Total |
| $ | 79,875 | |
| $ | 76,548 | |
| $ | 89,695 | |
69
Table of Contents
THE CHILDREN'S PLACE, INC. AND SUBSIDIARIES
NOTES TO CONSOLIDATED FINANCIAL STATEMENTS (Continued)
11. | INCOME TAXES (Continued) |
The components of the Company's provision for income taxes consisted of the following (in thousands):
|
| Fiscal Year Ended | ||||||||||
|
| January 31, |
| February 1, 2014 |
| February 2, 2013 | ||||||
Current - |
|
|
|
|
|
| ||||||
Federal |
| $ | 8,212 | |
| $ | 13,240 | |
| $ | 7,575 | |
State |
| 3,691 | |
| 4,371 | |
| 5,230 | | |||
Foreign |
| 5,457 | |
| 9,463 | |
| 11,674 | | |||
Total current |
| 17,360 | |
| 27,074 | |
| 24,479 | | |||
Deferred - |
|
|
|
|
|
| ||||||
Federal |
| 5,260 | |
| (1,513 | ) |
| 3,045 | | |||
State |
| 1,426 | |
| (731 | ) |
| (762 | ) | |||
Foreign |
| (1,059 | ) |
| (1,308 | ) |
| (310 | ) | |||
Total deferred |
| 5,627 | |
| (3,552 | ) |
| 1,973 | | |||
Tax provision as shown on the consolidated statements of operations |
| $ | 22,987 | |
| $ | 23,522 | |
| $ | 26,452 | |
Effective tax rate |
| 28.8 | % |
| 30.7 | % |
| 29.5 | % | |||
A reconciliation between the calculated tax provision on income based on statutory rates in effect and the effective tax rate for is as follows (in thousands):
|
| Fiscal Year Ended | ||||||||||
|
| January 31, |
| February 1, 2014 |
| February 2, 2013 | ||||||
Calculated income tax provision at federal statutory rate |
| $ | 27,956 | |
| $ | 26,792 | |
| $ | 31,393 | |
State income taxes, net of federal benefit |
| 3,326 | |
| 2,366 | |
| 2,904 | | |||
Foreign tax rate differential (1) |
| (8,849 | ) |
| (7,224 | ) |
| (9,044 | ) | |||
Nondeductible expenses |
| 1,685 | |
| 1,792 | |
| 1,611 | | |||
Unrecognized tax benefit |
| 807 | |
| (1,347 | ) |
| (743 | ) | |||
Change in valuation allowance |
| (1,472 | ) |
| 447 | |
| 1,395 | | |||
Other |
| (466 | ) |
| 696 | |
| (1,064 | ) | |||
Total tax provision |
| $ | 22,987 | |
| $ | 23,522 | |
| $ | 26,452 | |
(1) The foreign tax rate differential is due to the Company having a lower effective tax rate as compared to its U.S. federal statutory tax rate of 35%. The Company has substantial operations in both Hong Kong and Canada which has lower statutory income tax rates as compared to the U.S. The Company's foreign effective tax rates for Fiscal 2014, Fiscal 2013 and Fiscal 2012 were 13.7%, 20.4% and 21.5%, respectively. This rate will fluctuate from year to year in response to changes in the mix of pre-tax earnings by country as well as changes in foreign jurisdiction tax laws.
70
Table of Contents
THE CHILDREN'S PLACE, INC. AND SUBSIDIARIES
NOTES TO CONSOLIDATED FINANCIAL STATEMENTS (Continued)
11. | INCOME TAXES (Continued) |
The tax effects of temporary differences which give rise to deferred tax assets and liabilities are as follows (in thousands):
|
| January 31, |
| February 1, 2014 | ||||
Current – |
|
|
|
| ||||
Assets |
|
|
|
| ||||
Inventory |
| 4,128 | |
| 1,067 | | ||
Reserves |
| 15,169 | |
| 13,256 | | ||
Total current assets |
| 19,297 | |
| 14,323 | | ||
Liabilities-prepaid expenses |
| (4,217 | ) |
| (3,464 | ) | ||
Total current, net |
| 15,080 | |
| 10,859 | | ||
Noncurrent – |
|
|
|
| ||||
Property and equipment |
| 7,654 | |
| 18,446 | | ||
Deferred rent |
| 14,830 | |
| 14,325 | | ||
Equity compensation |
| 7,101 | |
| 6,792 | | ||
Reserves and other |
| 5,995 | |
| 6,243 | | ||
Net operating loss carryover and other tax credits |
| 1,930 | |
| 1,842 | | ||
Capital loss carryover |
| - | |
| 1,560 | | ||
Total noncurrent, gross |
| 37,510 | |
| 49,208 | | ||
Valuation allowance |
| (1,930 | ) |
| (3,402 | ) | ||
Net noncurrent |
| 35,580 | |
| 45,806 | | ||
Total deferred tax asset, net |
| $ | 50,660 | |
| $ | 56,665 | |
As of January 31, 2015, the Company has not provided Federal taxes on approximately $231.2 million of unremitted earnings of its foreign subsidiaries. The Company intends to reinvest these earnings to fund expansion in these and other markets outside the U.S. Accordingly, the Company has not provided any provision for income tax expense in excess of foreign jurisdiction income tax requirements relative to such unremitted earnings in the accompanying financial statements. Due to the complexities associated with the hypothetical calculation, including the availability of foreign tax credits, the Company has concluded it is not practicable to determine the unrecognized deferred tax liability related to the undistributed earnings.
The Company has foreign net operating loss carryforwards of approximately $4.1 million which do not expire. The Company also has an Alternative Minimum Tax credit ("AMT") in Puerto Rico of approximately $0.8 million which does not expire. During Fiscal 2014 the Company's U.S. capital loss carryover expired unused. This resulted in a reduction of the deferred tax asset as well as a reduction of the valuation allowance of approximately $1.6 million.
Management considers the scheduled reversal of deferred tax liabilities, projected future taxable income, and tax planning strategies in making this assessment. The Company has concluded that it is more likely than not that certain deferred tax assets cannot be used in the foreseeable future, principally the foreign net operating loss carryforwards and the AMT credit in Puerto Rico. Accordingly, a valuation allowance has been established for these tax benefits. However, to the extent that tax benefits related to these are realized in the future, the reduction of the valuation allowance will reduce income tax expense accordingly.
In assessing the realizability of deferred tax assets, management considers whether it is more likely than not that some portion or all of the deferred tax assets will not be realized. The ultimate realization of deferred tax assets is dependent upon the generation of future taxable income during the periods in which those temporary differences become realizable.
The Company's income taxes payable have been reduced by the tax benefits from employee stock plan awards. For stock options, the Company receives an income tax benefit calculated as the tax effect of the difference between the fair market value of the stock issued at the time of the exercise and the exercise price. For Deferred Awards and Performance Awards, the
71
Table of Contents
THE CHILDREN'S PLACE, INC. AND SUBSIDIARIES
NOTES TO CONSOLIDATED FINANCIAL STATEMENTS (Continued)
11. | INCOME TAXES (Continued) |
Company receives an income tax benefit upon the award's vesting equal to the tax effect of the underlying stock's fair market value.
Uncertain Tax Positions
Tax positions are evaluated in a two step process. The Company first determines whether it is more-likely-than-not that a tax position will be sustained upon examination. If a tax position meets the more-likely-than-not recognition threshold it is measured to determine the amount of benefit to recognize in the financial statements. The tax position is measured as the largest amount of benefit that is greater than 50% likely to be realized upon ultimate settlement.
A reconciliation of the gross amounts of unrecognized tax benefits, excluding accrued interest and penalties, is as follows (in thousands):
|
| January 31, |
| February 1, 2014 | ||||
Beginning Balance |
| $ | 4,412 | |
| $ | 5,919 | |
Additions for current year tax positions |
| 833 | |
| 490 | | ||
Additions for prior year tax positions |
| 1,070 | |
| 349 | | ||
Reductions for prior year tax positions |
| (156 | ) |
| (54 | ) | ||
Settlements |
| (43 | ) |
| (851 | ) | ||
Reductions due to a lapse of the applicable statute of limitations |
| (637 | ) |
| (1,441 | ) | ||
|
| $ | 5,479 | |
| $ | 4,412 | |
Approximately $5.3 million of unrecognized tax benefits at January 31, 2015 would affect the Company's effective tax rate if recognized. The Company believes it is reasonably possible that there may be a reduction of approximately $3.6 million of unrecognized tax benefits in the next 12 months as a result of settlements with taxing authorities and statute of limitations expirations.
The Company accrued interest and penalties related to unrecognized tax benefits as part of the provision for income taxes. At January 31, 2015 and February 1, 2014 accrued interest and penalties included in unrecognized tax benefits were approximately $1.0 million and $1.4 million , respectively. Interest, penalties and reversals, thereof, net of taxes, was a benefit of $0.4 million , $0.4 million and $0.2 million for Fiscal 2014, Fiscal 2013 and Fiscal 2012, respectively.
The Company is subject to tax in the United States and foreign jurisdictions, including Canada and Hong Kong. The Company, joined by its domestic subsidiaries, files a consolidated income tax return for Federal income tax purposes. The Company, with certain exceptions, is no longer subject to income tax examinations by U.S. Federal, state and local or foreign tax authorities for tax years fiscal 2010 and prior.
72
Table of Contents
THE CHILDREN'S PLACE, INC. AND SUBSIDIARIES
NOTES TO CONSOLIDATED FINANCIAL STATEMENTS (Continued)
12. | RETIREMENT AND SAVINGS PLANS |
401(k) Plan
The Company has adopted The Children's Place 401(k) Savings Plan (the "401(k) Plan"), which qualifies under Section 401(k) of the Internal Revenue Code of 1986, as amended (the "Code"). The 401(k) Plan is a defined contribution plan established to provide retirement benefits for employees. The 401(k) Plan is employee funded up to an elective annual deferral and also provides for Company matching contributions up to a certain percentage amount of the employee's salary.
The 401(k) Plan is available for all U.S. employees who have completed 90 days of service with the Company. Following guidance in IRS Notice 98-52 related to the design‑based alternative, or "safe harbor," 401(k) plan method, the Company modified its 401(k) Plan for Company match contributions for non-highly compensated associates, as defined in the Code. For non-highly compensated associates, the Company matches the first 3% of the participant's contribution and 50% of the next 2% of the participant's contribution and the Company match contribution vests immediately. For highly compensated associates, the Company matches the lesser of 50% of the participant's contribution or 2.5% of the participant's covered compensation and the Company match contribution vests over 5 years. The Company's matching contributions were approximately $2.2 million , $2.2 million , and $2.0 million in Fiscal 2014, Fiscal 2013 and Fiscal 2012, respectively.
Deferred Compensation Plan
The Company has a deferred compensation plan (the "Deferred Compensation Plan"), which is a nonqualified, unfunded plan, for eligible senior level employees. Under the plan, participants may elect to defer up to 80% of his or her base salary and/or up to 100% of his or her bonus to be earned for the year following the year in which the deferral election is made. The Deferred Compensation Plan also permits members of the Board of Directors to elect to defer payment of all or a portion of their retainer and other fees to be earned for the year following the year in which a deferral election is made. In addition, eligible employees and directors of the Company may also elect to defer payment of any shares of Company stock that is earned with respect to deferred stock awards. The Company may, but is not required to, credit participants with additional Company contribution amounts. Deferred amounts are not subject to forfeiture and are deemed invested among investment funds offered under the Deferred Compensation Plan, as directed by each participant. Payments of deferred amounts (as adjusted for earnings and losses) are payable following separation from service or at a date or dates elected by the participant at the time the deferral is elected. Payments of deferred amounts are generally made in either a lump sum or in annual installments over a period not exceeding 15.0 years. During fiscal 2010, the Deferred Compensation Plan was amended to allow for cash deferrals made by members of the Board of Directors to be invested in shares of the Company's common stock. Such elections are irrevocable and will be settled in shares of common stock. All other deferred amounts are payable in the form in which they were made; cash deferrals are payable in cash and stock deferrals are payable in stock. Earlier distributions are not permitted except in the case of an unforeseen hardship.
The Company has established a rabbi trust that serves as an investment to shadow the Deferred Compensation Plan liability; however, the assets of the rabbi trust are general assets of the Company and as such, would be subject to the claims of creditors in the event of bankruptcy or insolvency. The investments of the rabbi trust consist of company-owned life insurance policies ("COLIs") and Company stock. The Deferred Compensation Plan liability, excluding Company stock, is included in other long-term liabilities and changes in the balance are recognized as compensation expense. The cash surrender values of the COLIs are included in other assets and related earnings and losses are recognized as investment income or loss, which is included in selling, general and administrative expenses. Company stock deferrals are included in the equity section of the Company's consolidated balance sheet as treasury stock and as a deferred compensation liability. Deferred stock is recorded at fair market value at the time of deferral and any subsequent changes in fair market value are not recognized.
The Deferred Compensation Plan liability, excluding Company stock, at fair value, was approximately $0.5 million and $0.3 million at January 31, 2015 and February 1, 2014, respectively. The cash surrender value of the COLIs, which reflects the underlying assets at fair value, was approximately $0.3 million and $0.3 million at January 31, 2015 and February 1, 2014, respectively. Company stock was $1.7 million and $1.6 million at January 31, 2015 and February 1, 2014, respectively.
Other Plans
Under statutory requirements, the Company contributes to retirement plans for its Canadian, Puerto Rican and Asian operations. Contributions under these plans were approximately $0.3 million in each of Fiscal 2014 and Fiscal 2013 and $0.2 million in Fiscal 2012.
73
Table of Contents
THE CHILDREN'S PLACE, INC. AND SUBSIDIARIES
NOTES TO CONSOLIDATED FINANCIAL STATEMENTS (Continued)
13. | SEGMENT INFORMATION |
In accordance with the " Segment Reporting " topic of the FASB ASC, the Company reports segment data based on geography: The Children's Place U.S. and The Children's Place International. Each segment includes an e-commerce business located at www.childrensplace.com . Included in The Children's Place U.S. segment are the Company's U.S. and Puerto Rico based stores and U.S. revenue from the Company's wholesale partners. Included in The Children's Place International segment are the Company's Canadian based stores, revenue from the Company's Canada wholesale partner and revenue from international franchisees. The Company measures its segment profitability based on operating income, defined as income before interest and taxes. Net sales and direct costs are recorded by each segment. Certain inventory procurement functions such as production and design as well as corporate overhead, including executive management, finance, real estate, human resources, legal, and information technology services are managed by The Children's Place U.S. segment. Expenses related to these functions, including depreciation and amortization, are allocated to The Children's Place International segment based primarily on net sales. The assets related to these functions are not allocated. The Company periodically reviews these allocations and adjusts them based upon changes in business circumstances. Net sales from external customers are derived from merchandise sales and the Company has no major customers that account for more than 10% of its net sales. As of January 31, 2015, The Children's Place U.S. operated 963 stores and The Children's Place International operated 134 stores. As of February 1, 2014, The Children's Place U.S. operated 974 stores and The Children's Place International operated 133 stores.
The following tables provide segment level financial information for Fiscal 2014, Fiscal 2013 and Fiscal 2012 (dollars in thousands):
| Fiscal Year Ended | ||||||||||
| January 31, |
| February 1, |
| February 2, | ||||||
Net sales: |
| |
|
| |
|
| | |||
The Children's Place U.S. | $ | 1,528,762 | |
| $ | 1,528,276 | |
| $ | 1,557,549 | |
The Children's Place International (1) | 232,562 | |
| 237,513 | |
| 251,937 | | |||
Total net sales | $ | 1,761,324 | |
| $ | 1,765,789 | |
| $ | 1,809,486 | |
Gross profit: |
|
|
|
|
| ||||||
The Children's Place U.S. | $ | 535,226 | |
| $ | 558,156 | |
| $ | 584,081 | |
The Children's Place International | 87,074 | |
| 97,365 | |
| 107,359 | | |||
Total gross profit | $ | 622,300 | |
| $ | 655,521 | |
| $ | 691,440 | |
Gross Margin: |
|
|
|
|
| ||||||
The Children's Place U.S. | 35.0 | % |
| 36.5 | % |
| 37.5 | % | |||
The Children's Place International | 37.4 | % |
| 41.0 | % |
| 42.6 | % | |||
Total gross margin | 35.3 | % |
| 37.1 | % |
| 38.2 | % | |||
Operating income: | | |
|
|
|
| |||||
The Children's Place U.S. (2) | $ | 63,586 | |
| $ | 60,267 | |
| $ | 68,346 | |
The Children's Place International (3) | 16,457 | |
| 16,016 | |
| 21,369 | | |||
Total operating income | $ | 80,043 | |
| $ | 76,283 | |
| $ | 89,715 | |
Operating income as a percent of net sales: |
|
|
|
|
| ||||||
The Children's Place U.S. | 4.2 | % |
| 3.9 | % |
| 4.4 | % | |||
The Children's Place International | 7.1 | % |
| 6.7 | % |
| 8.5 | % | |||
Total operating income | 4.5 | % |
| 4.3 | % |
| 5.0 | % | |||
Depreciation and amortization: |
|
|
|
|
| ||||||
The Children's Place U.S. | $ | 52,565 | |
| $ | 55,595 | |
| $ | 65,066 | |
The Children's Place International | 7,929 | |
| 9,263 | |
| 12,369 | | |||
Total depreciation and amortization | $ | 60,494 | |
| $ | 64,858 | |
| $ | 77,435 | |
Capital expenditures: |
|
|
|
|
| ||||||
The Children's Place U.S. | $ | 68,847 | |
| $ | 64,486 | |
| $ | 75,945 | |
The Children's Place International | 3,365 | |
| 8,120 | |
| 14,237 | | |||
Total capital expenditures | $ | 72,212 | |
| $ | 72,606 | |
| $ | 90,182 | |
74
Table of Contents
THE CHILDREN'S PLACE, INC. AND SUBSIDIARIES
NOTES TO CONSOLIDATED FINANCIAL STATEMENTS (Continued)
13. | SEGMENT INFORMATION (Continued) |
(1) | Net sales from The Children's Place International are primarily derived from revenues from Canadian operations. |
(2) | Includes exit costs (income) associated with the closures of the West Coast DC and Northeast DC of approximately $(0.1) million and $(0.9) million for Fiscal 2014 and Fiscal 2013, respectively. Also includes a $10.5 million impairment charge for Fiscal 2014 and a $25.4 million impairment charge for Fiscal 2013. Also includes additional costs incurred related to corporate severance and reorganizations of approximately $7.1 million and $4.2 million for Fiscal 2014 and Fiscal 2013, respectively. |
(3) | Includes a $0.6 million and $4.2 million impairment charge for Fiscal 2014 and Fiscal 2013, respectively. |
| January 31, |
| February 1, 2014 | ||||
Total assets: |
| |
|
| | ||
The Children's Place U.S. | $ | 805,462 | |
| $ | 824,893 | |
The Children's Place International | 153,156 | |
| 165,737 | | ||
Total assets | $ | 958,618 | |
| $ | 990,630 | |
Geographic Information
|
| January 31, |
| February 1, 2014 | ||||
Long-lived assets (1): |
|
|
|
| ||||
United States |
| $ | 289,820 | |
| $ | 283,059 | |
Canada |
| 22,697 | |
| 31,046 | | ||
Asia |
| 1,242 | |
| 1,399 | | ||
Total long-lived assets |
| $ | 313,759 | |
| $ | 315,504 | |
____________________________________________
(1) | The Company's long-lived assets are comprised of net property and equipment and other assets. |
14. | QUARTERLY FINANCIAL DATA (UNAUDITED) |
In the opinion of management, the unaudited consolidated financial statements presented below contain all material adjustments, consisting of normal recurring accruals, necessary to present fairly the Company's financial position and results of operations and have been prepared in a manner consistent with the audited financial statements contained herein. Due to the seasonal nature of the Company's business, the results of operations in any given interim period are not indicative of operating results for a full fiscal year.
75
Table of Contents
THE CHILDREN'S PLACE, INC. AND SUBSIDIARIES
NOTES TO CONSOLIDATED FINANCIAL STATEMENTS (Continued)
14. | QUARTERLY FINANCIAL DATA (UNAUDITED) (Continued) |
The following tables reflect quarterly consolidated statements of income for the periods indicated (unaudited):
|
| Fiscal Year Ended January 31, 2015 | ||||||||||||||
|
| First Quarter |
| Second Quarter |
| Third Quarter |
| Fourth Quarter (1) | ||||||||
Net sales |
| $ | 410,149 | |
| $ | 384,628 | |
| $ | 487,304 | |
| $ | 479,243 | |
Gross profit |
| 148,261 | |
| 119,118 | |
| 190,111 | |
| 164,810 | | ||||
Selling, general and administrative expenses |
| 113,720 | |
| 117,111 | |
| 116,120 | |
| 123,735 | | ||||
Asset impairment charges |
| - | |
| 3,045 | |
| 3,306 | |
| 4,794 | | ||||
Other costs (income) |
| 231 | |
| (98 | ) |
| (286 | ) |
| 85 | | ||||
Depreciation and amortization |
| 14,227 | |
| 15,557 | |
| 15,168 | |
| 15,542 | | ||||
Operating income (loss) |
| 20,083 | |
| (16,497 | ) |
| 55,803 | |
| 20,654 | | ||||
Income (loss) before income taxes |
| 20,102 | |
| (16,557 | ) |
| 55,721 | |
| 20,609 | | ||||
Provision (benefit) for income taxes |
| 6,506 | |
| (5,870 | ) |
| 18,779 | |
| 3,572 | | ||||
Net income (loss) |
| 13,596 | |
| (10,687 | ) |
| 36,942 | |
| 17,037 | | ||||
|
|
|
|
|
|
|
|
| ||||||||
Diluted earnings (loss) per share |
| $ | 0.61 | |
| $ | (0.49 | ) |
| $ | 1.70 | |
| $ | 0.79 | |
Diluted weighted average common shares outstanding |
| 22,419 | |
| 21,837 | |
| 21,756 | |
| 21,512 | | ||||
|
|
|
|
|
|
|
|
| ||||||||
Cash dividends declared and paid per common share |
| $ | 0.1325 | |
| $ | 0.1325 | |
| $ | 0.1325 | |
| $ | 0.1325 | |
____________________________________________
|
| Fiscal Year Ended February 1, 2014 | ||||||||||||||
|
| First Quarter |
| Second Quarter |
| Third Quarter |
| Fourth Quarter (1) | ||||||||
Net sales |
| $ | 423,164 | |
| $ | 382,448 | |
| $ | 492,680 | |
| $ | 467,497 | |
Gross profit |
| 163,268 | |
| 126,182 | |
| 201,761 | |
| 164,310 | | ||||
Selling, general and administrative expenses |
| 119,008 | |
| 124,408 | |
| 123,521 | |
| 118,716 | | ||||
Asset impairment charges |
| - | |
| 21,766 | |
| - | |
| 7,867 | | ||||
Other costs (income) |
| (1,023 | ) |
| 61 | |
| 200 | |
| (144 | ) | ||||
Depreciation and amortization |
| 16,824 | |
| 15,593 | |
| 16,473 | |
| 15,968 | | ||||
Operating income (loss) |
| 28,459 | |
| (35,646 | ) |
| 61,567 | |
| 21,903 | | ||||
Income (loss) before income taxes |
| 28,519 | |
| (35,646 | ) |
| 61,649 | |
| 22,026 | | ||||
Provision (benefit) for income taxes |
| 9,247 | |
| (12,010 | ) |
| 19,910 | |
| 6,375 | | ||||
Net income (loss) |
| 19,272 | |
| (23,636 | ) |
| 41,739 | |
| 15,651 | | ||||
|
|
|
|
|
|
|
|
| ||||||||
Diluted earnings (loss) per share |
| $ | 0.83 | |
| $ | (1.05 | ) |
| $ | 1.84 | |
| $ | 0.69 | |
Diluted weighted average common shares outstanding |
| 23,289 | |
| 22,514 | |
| 22,628 | |
| 22,652 | | ||||
____________________________________________
76
Table of Contents
THE CHILDREN'S PLACE, INC. AND SUBSIDIARIES
NOTES TO CONSOLIDATED FINANCIAL STATEMENTS (Continued)
14. | QUARTERLY FINANCIAL DATA (UNAUDITED) (Continued) |
(1) | Significant items impacting the fourth quarter of Fiscal 2013 include approximately $7.9 million of asset impairment charges and $2.0 million of additional costs related to store dispositions. |
15. | SUBSEQUENT EVENTS |
Subsequent to January 31, 2015 and through March 24, 2015, the Company repurchased an additional 0.2 million shares for approximately $13.3 million , which brought the total under the 2014 Share Repurchase Program to approximately $73.5 million .
The Company's Board of Directors authorized a quarterly cash dividend of $0.15 per share to be paid April 30, 2015 for shareholders of record on the close of business on April 9, 2015. Future declarations of quarterly dividends and the establishment of future record and payment dates are subject to approval by the Company's Board of Directors based on a number of factors, including business and market conditions, the Company's future financial performance and other investment priorities.
On January 7, 2015, the Board approved an additional $100 million share repurchase authorization as part of the Company's strategy to return excess capital to shareholders. This share repurchase authorization permits the Company to repurchase shares in the open market at current market prices at the time of purchase or in privately negotiated transactions. The timing and actual number of shares repurchased under the program will depend on a variety of factors including price, corporate and regulatory requirements, and other market and business conditions, and the Company may suspend or discontinue the program at any time, and may thereafter reinstitute purchases, all without prior announcement.
77
Table of Contents
THE CHILDREN'S PLACE, INC. AND SUBSIDIARIES
SCHEDULE II
VALUATION AND QUALIFYING ACCOUNTS
(in thousands)
Column A |
| Column B |
| Column C |
| Column D |
| Column E | ||||||||
|
| Balance at beginning of year |
| Charged to expense |
| Deductions |
| Balance at end of year | ||||||||
Lower of cost or market reserve (1) |
|
|
|
|
|
|
|
| ||||||||
Fiscal year ended January 31, 2015 |
| $ | 4,268 | |
| $ | - | |
| $ | (2,343 | ) |
| $ | 1,925 | |
Fiscal year ended February 1, 2014 |
| $ | 2,413 | |
| $ | 1,881 | |
| $ | (26 | ) |
| $ | 4,268 | |
Fiscal year ended February 2, 2013 |
| $ | 2,746 | |
| $ | 1,804 | |
| $ | (2,137 | ) |
| $ | 2,413 | |
(1) | Reflects adjustment of out-of-season merchandise inventories to realizable value. Column C represents increases to the reserve and Column D represents decreases to the reserve based on quarterly assessments of the reserve. |
78
Table of Contents
(a)(3) Exhibits.
Exhibit |
| Description |
|
|
|
3.1 |
| Amended and Restated Certificate of Incorporation of the Company dated June 14, 2014 filed as Exhibit 3.1 to the registrant's Current Report on Form 8-K filed on June 12, 2014 is incorporated by reference herein. |
3.2 |
| Fourth Amended and Restated By-Laws of the Company filed as Exhibit 3.1 to the registrant's Form 8-K filed on June 9, 2009, is incorporated by reference herein. |
3.3 |
| First Amendment to the Fourth Amended and Restated Bylaws of the Company filed as Exhibit 3.2 to the registrant's Current Report on Form 8-K filed on June 12, 2014, is incorporated by reference herein. |
4.1 (1) |
| Form of Certificate for Common Stock of the Company filed as an exhibit to the registrant's Registration Statement No. 333‑31535 on Form S-1, is incorporated by reference herein. |
10.1 (1)(*) |
| 1997 Stock Option Plan of the Company filed as an exhibit to the registrant's Registration Statement No. 333‑31535 on Form S-1, is incorporated by reference herein. |
10.2 (*) |
| Amended and Restated 2005 Equity Incentive Plan of the Company, filed as Exhibit 10.3 to the registrant's Annual Report on Form 10-K for the period ended January 31, 2009, is incorporated by reference herein. |
10.3 (*) |
| 2011 Equity Incentive Plan, filed as Exhibit 10.1 to the registrant's Current Report on Form 8-K filed on May 23, 2011, is incorporated by reference herein. |
10.4 (*) |
| The Company 401(k) Plan, as amended filed as Exhibit 10.5 to the registrant's Annual Report on Form 10-K for the period ended February 3, 2007, is incorporated by reference herein. |
10.5 |
| Lease Agreement as of August 12, 2003 between Orlando Corporation and The Children's Place (Canada), LP, together with Indemnity Agreement as of August 12, 2003 between the Company and Orlando Corporation, together with Surrender of Lease as of August 12, 2003 between the Company and Orlando Corporation and Orion Properties Ltd. (Canadian Distribution Center) filed as Exhibit 10.2 to the registrant's Quarterly Report on Form 10‑Q for the period ended November 1, 2003, is incorporated by reference herein. |
10.6 |
| Lease Agreement between the Company and Turnpike Crossing I, LLC (Dayton New Jersey Distribution Center), dated as of July 14, 2004 filed as Exhibit 10.2 to registrant's Quarterly Report on Form 10‑Q for the period ended July 31, 2004, is incorporated by reference herein. |
10.7 |
| Form of Indemnity Agreement between the Company and certain members of management and the Board of Directors filed as Exhibit 10.7 to registrant's Quarterly Report on Form 10-Q for the period ended August 2, 2008, is incorporated by reference herein. |
10.8 |
| Lease Agreement between The Children's Place Services Company, LLC and 500 Plaza Drive Corp. effective as of March 12, 2009 (500 Plaza Drive), Secaucus, New Jersey filed as Exhibit 10.67 to the registrant's Annual Report on Form 10-K for the period ended January 31, 2009, is incorporated by reference herein. |
10.9 |
| Guaranty between the Company and 500 Plaza Drive Corp. effective as of March 12, 2009 filed as Exhibit 10.68 to the registrant's Annual Report on Form 10-K for the period ended January 31, 2009, is incorporated by reference herein. |
10.10 |
| The First Lease Modification Agreement, dated as of August 27, 2009, between The Children's Place Services Company, LLC and 500 Plaza Drive Corp. filed as Exhibit 10.3 to the Registrant's Quarterly Report on Form 10-Q for the period ended August 1, 2009, is incorporated by reference herein. |
10.11 |
| The Company Nonqualified Deferred Compensation Plan effective January 1, 2010 filed as Exhibit 10.82 to the registrant's Annual Report on Form 10-K for the period ended January 30, 2010, is incorporated by reference herein. |
10.12 (*) |
| Amended and Restated Employment Agreement, dated as of March 28, 2011, by and between the Company and Jane T. Elfers filed as Exhibit 10.1 to the registrant's Quarterly Report on Form 10-Q for the quarterly period ended April 30, 2011, is incorporated by reference herein. |
10.13 (*) |
| Amendment No. 1 as of March 23, 2012 to Amended and Restated Employment Agreement dated as of March 28, 2011, by and between the Company and Jane T. Elfers filed as Exhibit 10.31 to the Registrant's Annual Report on Form 10-K for the period ended January 28, 2012, is incorporated by reference herein. |
10.14 (*) |
| Deferred Stock Award Agreement, dated as of January 4, 2010, by and between the Company and Jane T. Elfers filed as Exhibit 10.84 to the registrant's Annual Report on Form 10-K for the period ended January 30, 2010, is incorporated by reference herein. |
79
Table of Contents
Exhibit |
| Description |
10.15 (*) |
| Form of Time-Based Restricted Stock Unit Award Agreement under the 2011 Equity Incentive Plan, filed as Exhibit 10.2 to the registrant's Current Report on Form 8-K filed on May 23, 2011, is incorporated by reference herein. |
10.16 (*) |
| Form of Performance-Based Restricted Stock Unit Award Agreement under the 2011 Equity Incentive Plan, filed as Exhibit 10.3 to the registrant's Current Report on Form 8-K filed on May 23, 2011, is incorporated by reference herein. |
10.17 (*) |
| Form of Deferred Stock Award Agreement under the Company's Amended and Restated 2005 Equity Incentive Plan, filed as Exhibit 10.4 to the registrant's Current Report on Form 8-K filed on May 23, 2011, is incorporated by reference herein. |
10.18 (*) |
| Form of Performance Stock Award Agreement under the Company's Amended and Restated 2005 Equity Incentive Plan, filed as Exhibit 10.5 to the registrant's Current Report on Form 8-K filed on May 23, 2011, is incorporated by reference herein. |
10.19 |
| Form of Amended and Restated Change in Control Agreement filed as Exhibit 10.41 to the registrant's Annual Report on Form 10-K for the period ended January 29, 2011, is incorporated by reference herein. |
10.20 (*) |
| Employment Offer Letter, dated as of November 26, 2012, by and between the Company and Michael Scarpa filed as Exhibit 10.40 to the registrant's Annual Report on Form 10-K for the period ended February 2, 2013, is incorporated by reference herein. |
10.21 |
| Eleventh Amendment to the Credit Agreement, dated March 4, 2014, by and among the Company and The Children's Place Services Company, LLC, as borrowers, The Children's Place (International), LLC, The Children's Place Canada Holdings, Inc., the childrensplace.com, inc., TCP IH II, LLC, TCP International IP Holdings, LLC and TCP International Product Holdings, LLC, as guarantors, and Wells Fargo Bank, National Association (successor by merger to Wells Fargo Retail Finance, LLC), as Administrative Agent and Collateral Agent, L/C Issuer, SwingLine Lender and as a Lender, Bank of America, N.A., HSBC Bank USA, N.A.and JPMorgan Chase Bank, N.A. filed as Exhibit 10.33 to the registrant's Annual Report on Form 10-K for the period ended February 1, 2014, is incorporated by reference herein. |
10.22 (+)(*) |
| Letter Agreement dated October 3, 2014 between The Children's Place Services Company, LLC and Anurup Pruthi. |
10.23 (+)(*) |
| Agreement and General Release dated as of January 30, 2015 between Natalie Levy and The Children's Place Services Company, LLC. |
18.1 |
| Preferability Letter dated March 28, 2013 from BDO USA, LLP, The Children's Place Retail Stores, Inc.'s registered independent accounting firm, regarding change in accounting principle filed as Exhibit 18.1 to the registrant's Annual Report on Form 10-K for the period ended February 2, 2013, is incorporated by reference herein. |
21.1 (+) |
| Subsidiaries of the Company. |
23.1 (+) |
| Consent of Independent Registered Public Accounting Firm. |
31.1 (+) |
| Certificate of Principal Executive Officer pursuant to Section 302 of the Sarbanes Oxley Act of 2002. |
31.2 (+) |
| Certificate of Principal Financial Officer pursuant to Section 302 of the Sarbanes Oxley Act of 2002. |
32 (+) |
| Certification pursuant to 18 U.S.C. Section 1350, as adopted pursuant to Section 906 of the Sarbanes-Oxley Act of 2002. |
101.INS* |
| XBRL Instance Document. |
101.SCH* |
| XBRL Taxonomy Extension Schema. |
101.CAL* |
| XBRL Taxonomy Extension Calculation Linkbase. |
101.DEF* |
| XBRL Taxonomy Extension Definition Linkbase. |
101.LAB* |
| XBRL Taxonomy Extension Label Linkbase. |
101.PRE* |
| XBRL Taxonomy Extension Presentation Linkbase. |
________________________________________
(1) Exhibit numbers are identical to the exhibit numbers incorporated by reference to such registration statement.
(*) Compensation Arrangement.
(+) Filed herewith.
* Pursuant to Rule 406T of Regulation S-T, these interactive data files are deemed not filed or part of a registration statement or prospectus for purposes of Sections 11 or 12 of the Securities Act of 1933 or Section 18 of the Securities Exchange Act of 1934 and otherwise are not subject to liability.
80
Table of Contents
(b) Exhibits . The exhibits required by Item 601 of Regulation S-K are filed herewith or incorporated by reference.
(c) Financial Statement Schedules and Other Financial Statements .
Schedule II - Valuation and Qualifying Accounts
All other financial statement schedules are omitted from this Annual Report on Form 10-K, as they are not required or applicable or the required information is included in the financial statements or notes thereto.
81
Table of Contents
SIGNATURES
Pursuant to the requirements of Section 13 or 15(d) of the Securities Exchange Act of 1934, the Registrant has duly caused this Report to be signed on its behalf by the undersigned, thereunto duly authorized.
|
| THE CHILDREN'S PLACE, INC. | |
|
|
|
|
|
|
|
|
|
| By: | /S/ Jane T. Elfers |
|
|
| Jane T. Elfers |
|
|
| Chief Executive Officer and President |
|
|
| March 26, 2015 |
Pursuant to the requirements of the Securities Exchange Act of 1934, this Report has been signed below by the following persons on behalf of the Registrant and in the capacities and on the dates indicated.
82
Table of Contents
Signature |
| Title |
| Date |
|
|
|
|
|
/S/ Norman Matthews |
| Chairman of the Board |
| March 26, 2015 |
Norman Matthews |
|
|
|
|
|
|
|
|
|
/S/ Jane T. Elfers |
| Director, Chief Executive Officer and President |
| March 26, 2015 |
Jane T. Elfers |
| (Principal Executive Officer) |
|
|
|
|
|
|
|
/S/ Anurup Pruthi |
| Chief Financial Officer |
| March 26, 2015 |
Anurup Pruthi |
| (Principal Financial and Accounting Officer) |
|
|
|
|
|
|
|
/S/ Michael Scarpa |
| Chief Operating Officer |
| March 26, 2015 |
Michael Scarpa |
|
|
|
|
|
|
|
|
|
/S/ Joseph Alutto |
| Director |
| March 26, 2015 |
Joseph Alutto |
|
|
|
|
|
|
|
|
|
/S/ Susan Patricia Griffith |
| Director |
| March 26, 2015 |
Susan Patricia Griffith |
|
|
|
|
|
|
|
|
|
/S/ Joseph Gromek |
| Director |
| March 26, 2015 |
Joseph Gromek |
|
|
|
|
|
|
|
|
|
/S/ Kenneth Reiss |
| Director |
| March 26, 2015 |
Kenneth Reiss |
|
|
|
|
|
|
|
|
|
/S/ Stanley Reynolds |
| Director |
| March 26, 2015 |
Stanley Reynolds |
|
|
|
|
|
|
|
|
|
/S/ Susan Sobbott |
| Director |
| March 26, 2015 |
Susan Sobbott |
|
|
|
|
83