I went into the
UNITED STATES
SECURITIES AND EXCHANGE COMMISSION
WASHINGTON, D.C. 20549
FORM 10-K
☒ | ANNUAL REPORT PURSUANT TO SECTION 13 OR 15(d) OF THE SECURITIES EXCHANGE ACT OF 1934 |
For the fiscal year ended December 31, 2016
or
☐ | TRANSITION REPORT PURSUANT TO SECTION 13 OR 15 (d) OF THE SECURITIES EXCHANGE ACT OF 1934 |
For the transition period from ______ to _____.
Commission File number 0-15886
The Navigators Group, Inc.
(Exact name of registrant as specified in its charter)
Delaware | 13-3138397 |
(State or other jurisdiction of incorporation or organization) | (I.R.S. Employer Identification No.) |
|
|
400 Atlantic Street, Stamford, Connecticut | 06901 |
(Address of principal executive offices) | (Zip Code) |
Registrant's telephone number, including area code: (203) 905-6090
Securities registered pursuant to section 12(b) of the Act:
Title of each class: |
| Name of each exchange on which registered: |
Common Stock, $.10 Par Value |
| The NASDAQ Global Select Market |
Securities registered pursuant to Section 12(g) of the Act: None
Indicate by check mark if the registrant is a well-known seasoned issuer, as defined in Rule 405 of the Securities Act. Yes ☐ No ☒
Indicate by check mark if the registrant is not required to file reports pursuant to Section 13 or 15(d) of the Act. Yes ☐ No ☒
Indicate by check mark whether the registrant (1) has filed all reports required to be filed by Section 13 or 15(d) of the Securities Exchange Act of 1934 during the preceding 12 months (or for such shorter period that the registrant was required to file such reports), and (2) has been subject to such filing requirements for the past 90 days. Yes ☒ No ☐
Indicate by check mark whether the registrant has submitted electronically and posted on its corporate Web site, if any, every Interactive Data File required to be submitted and posted pursuant to Rule 405 of Regulation S-T (§232.405 of this chapter) during the preceding 12 months (or for such shorter period that the registrant was required to submit and post such files). Yes ☒ No ☐
Indicate by check mark if disclosure of delinquent filers pursuant to Item 405 of Regulation S-K (§229.405 of this chapter) is not contained herein, and will not be contained, to the best of the registrant's knowledge, in definitive proxy or information statements incorporated by reference in Part III of this Form 10-K or any amendment to this Form 10-K. ☒
Indicate by check mark whether the registrant is a large accelerated filer, an accelerated filer, a non-accelerated filer, or a smaller reporting company. See the definition of "large accelerated filer," "accelerated filer" and "smaller reporting company" in Rule 12b-2 of the Exchange Act. (Check One):
Large accelerated filer | ☒ |
| Non-accelerated filer | ☐ |
|
|
|
|
|
Accelerated filer | ☐ |
| Smaller reporting company | ☐ |
Indicate by check mark whether the registrant is a shell company (as defined in Rule 12b-2 of the Exchange Act). Yes ☐ No ☒
The aggregate market value of voting stock held by non-affiliates as of June 30, 2016 was $1,014,101,687 (Last business day of The Company's most recently completed second fiscal quarter).
The number of common shares outstanding as of January 27, 2017 was 29,155,547 (Last practical business day for the count of shares outstanding).
DOCUMENTS INCORPORATED BY REFERENCE
Portions of the Company's definitive Proxy Statement for the Annual Meeting of Stockholders to be held on May 25, 2017 are incorporated by reference in Part III, Items 10, 11, 12, 13 and 14 of this Form 10‑K.
TABLE OF CONTENTS
Description | Page Number | ||
Note on Forward-Looking Statements | 3 | ||
|
| ||
PART I |
| ||
Item 1. | Business | 3 | |
| Overview | 3 | |
| Segment Information | 3 | |
| Products and Distribution | 4 | |
| Competitive Environment | 6 | |
| Employees | 6 | |
| Loss Reserves | 6 | |
| Investments | 9 | |
| Regulation | 9 | |
| Available Information | 11 | |
Item 1A. | Risk Factors | 11 | |
Item 1B. | Unresolved Staff Comments | 20 | |
Item 2. | Properties | 20 | |
Item 3. | Legal Proceedings | 21 | |
Item 4. | Mine Safety Disclosures | 21 | |
|
| ||
PART II |
| ||
Item 5. | Market for Registrant's Common Equity, Related Stockholder Matters and Issuer Purchases of Equity Securities | 21 | |
Item 6. | Selected Financial Data | 24 | |
Item 7. | Management's Discussion and Analysis of Financial Condition and Results of Operations | 25 | |
| U.S. GAAP and Non GAAP Financial Performance Metrics | 25 | |
| Overview | 25 | |
| Results of Operations | 27 | |
| Segment Results | 31 | |
| U.S. Insurance | 32 | |
| Int'l Insurance | 37 | |
| GlobalRe | 41 | |
| Capital Resources and Liquidity | 43 | |
| Investments | 46 | |
| Reserves for Losses and LAE for Loss Events | 49 | |
| Reinsurance Recoverables | 52 | |
| Critical Accounting Estimates | 53 | |
Item 7A. | Quantitative and Qualitative Disclosures about Market Risk | 57 | |
Item 8. | Financial Statements and Supplementary Data | 58 | |
Item 9. | Changes in and Disagreements with Accountants on Accounting and Financial Disclosure | 59 | |
Item 9A. | Controls and Procedures | 59 | |
Item 9B. | Other Information | 62 | |
|
| ||
PART III |
| ||
Item 10. | Directors, Executive Officers and Corporate Governance | 62 | |
Item 11. | Executive Compensation | 62 | |
Item 12. | Security Ownership of Certain Beneficial Owners and Management and Related Stockholder Matters | 62 | |
Item 13. | Certain Relationships and Related Transactions, and Director Independence | 62 | |
Item 14. | Principal Accountant Fees and Services | 62 | |
|
| ||
PART IV |
| ||
Item 15. | Exhibits and Financial Statement Schedules | 62 | |
Signatures | 64 | ||
Index to Consolidated Financial Statements and Schedules | F-1 | ||
2
FORWARD-LOOKI NG STATEMENTS
Some of the statements in this Annual Report on Form 10-K are "forward-looking statements" as defined in the Private Securities Litigation Reform Act of 1995. All statements other than statements of historical fact included in or incorporated by reference in this Annual Report are forward-looking statements. Whenever used in this report, the words "estimate," "expect," "believe," "may," "will," "intend," "continue" or similar expressions or their negative are intended to identify such forward-looking statements. Forward-looking statements are derived from information that we currently have and assumptions that we make. Factors that could cause actual results to differ materially from our forward-looking statements include, but are not limited to, the factors described in Part I, Item 1A, Risk Factors of this report. Due to these known risks, any unknown risks, uncertainties and assumptions, forward-looking statements discussed in this report may not occur and actual results may differ materially, you are therefore cautioned not to place undue reliance on them. We undertake no obligation to publicly update or revise any forward-looking statement, whether as a result of new information, future events or otherwise.
PART I
ITEM 1. BUSINESS
Overview
Unless the context requires otherwise, the terms "we," "us," "our," or "our Company" are used to mean The Navigators Group, Inc., a Delaware holding company established in 1982, and its subsidiaries. The term "Parent Company" is used to mean The Navigators Group, Inc. without its subsidiaries.
We are an international insurance company with a long-standing area of specialization in Marine insurance. Our Property and Casualty ("P&C") insurance business primarily offers general liability coverage and umbrella & excess liability coverage to commercial enterprises through our Primary and Excess Casualty divisions. We have also developed niches in Professional Liability insurance, through our Directors & Officers ("D&O") and Errors & Omissions ("E&O") divisions. Beginning in 2010, we added reinsurance products through our Global Reinsurance ("GlobalRe") business .
We operate through various wholly-owned subsidiaries, including Navigators Insurance Company ("NIC"), inclusive of our United Kingdom Branch ("U.K. Branch"), and Navigators Specialty Insurance Company ("NSIC"), both of which are U.S. insurance companies, and Navigators Underwriting Agency Ltd., a Lloyd's of London ("Lloyd's") managing agency that manages Lloyd's Syndicate 1221 ("the Syndicate") in the United Kingdom ("U.K."). Our Company controls 100% of the Syndicate's stamp capacity.
In May 2016, our Company received authorization from the U.K. Prudential Regulation Authority ("PRA") and the U.K. Financial Conduct Authority ("FCA") for a new U.K. based insurance company, Navigators International Insurance Company Ltd ("NIIC"), which is a wholly-owned direct subsidiary of our Parent Company, and has been fully capitalized in compliance with the terms of the authorization from the PRA and FCA.
Segment Information
We report our results of operations consistent with the manner in which our Chief Operating Decision Maker reviews the business to assess performance of our four reporting segments: U.S. Insurance, International Insurance ("Int'l Insurance"), GlobalRe and Corporate. The U.S. Insurance and Int'l Insurance reporting segments are each comprised of three operating segments: Marine, P&C and Professional Liability.
For additional information on our segment presentation and for financial information concerning our operations by segment, see Segment Results included in Item 7, Management's Discussion and Analysis of Financial Condition and Results of Operations and Note 2, Segment Information , in the Notes to the Consolidated Financial Statements.
The following table presents Net earned premiums by segment:
Years Ended December 31, |
| 2016 Net Premiums |
|
| % of |
|
| 2015 Net Premiums |
|
| % of |
|
| 2014 Net Premiums |
|
| % of |
| ||||||
amounts in millions |
| Earned |
|
| Total |
|
| Earned |
|
| Total |
|
| Earned |
|
| Total |
| ||||||
U.S. Insurance |
| $ | 629 |
|
|
| 57.2 | % |
| $ | 556 |
|
|
| 56.5 | % |
| $ | 504 |
|
|
| 53.8 | % |
Int'l Insurance |
|
| 307 |
|
|
| 27.9 | % |
|
| 260 |
|
|
| 26.4 | % |
|
| 244 |
|
|
| 26.1 | % |
GlobalRe |
|
| 164 |
|
|
| 14.9 | % |
|
| 168 |
|
|
| 17.1 | % |
|
| 188 |
|
|
| 20.1 | % |
Total |
| $ | 1,100 |
|
|
| 100.0 | % |
| $ | 984 |
|
|
| 100.0 | % |
| $ | 936 |
|
|
| 100.0 | % |
3
Products and Distribution
Our Company distributes insurance related products through international, national, regional and retail insurance brokers. Our on-going operations are organized into distinct divisions, each offering specialized products and services targeted at a specific niche customer segment.
Our U.S. Insurance, Int'l Insurance and GlobalRe reporting segments are considered our three underwriting segments. The U.S. Insurance and Int'l Insurance reporting segments are further comprised of three operating segments:
| • | Marine – Our Company has been providing insurance protection for global marine clients since 1974. We offer insurance for companies engaged in diverse aspects of shipping, global trade and worldwide transportation. |
| • | P&C – Our P&C operating segment brings a unique, specialist orientation to both Excess & Surplus products and to the standard commercial middle market for targeted industries and exposures. |
| • | Professional Liability – Our Professional Liability operating segment provides niche insurance solutions for numerous Professional Liability and Management Liability risks. |
Our underwriting segments and operating segments noted above are further comprised of business divisions and/or products.
A summary of our U.S. Insurance – U.S. Marine operating segment by product is as follows:
U.S. Marine Products |
Cargo – We offer all-risk coverage for manufacturing, importers, exporters and freight forwarders with available coverage enhancements including but not limited to: domestic and international inland transit, warehouse storage and exhibition coverage. |
Craft – We offer coverage for physical damage and third party liability coverage for tugs, barges, port/harbor vessels and other miscellaneous commercial watercraft. |
Hull – We offer physical damage coverage for owner/operators of ocean-going commercial vessels including: bulk, dry, tank, passenger and other various vessel types. |
Inland Marine – Products include builders risk including renovation and repair, installation floaters, contractors' equipment and numerous other inland marine coverages. Tailored products and services for truckers, warehousing and inland shippers, including coverage for commercial transit and legal liability may also be offered. |
Marine Liability – Products include coverage for liability to third parties for bodily injury or property damage stemming from marine-related operations, including but not limited to terminals, marinas and stevedoring. We focus on the associated marine liability exposures of multi-national corporations as well as small to medium sized marine operations. |
Other products offered: Customs Bonds, Fishing Vessels, Transport, War and Other Marine. |
A summary of our U.S. Insurance – U.S. P&C operating segment by business division and primary products within these divisions are as follows:
U.S. P&C Products by Division |
Excess Casualty – We provide Commercial Retail Excess Casualty and Specialty Wholesale Excess Casualty products for specialties such as manufacturing and wholesale distribution, commercial and residential construction and construction projects. |
Primary Casualty – Our Company's Primary Casualty division provides general liability coverage solutions on a non-admitted basis through selected wholesale brokers. |
Environmental – We underwrite on a primary or excess basis coverage in three main sectors: contractors pollution liability for a wide range of general and trade contractors; site pollution liability for environmental exposures associated with real estate ownership, operation and ownership transfer; and integrated casualty which is a combination of general liability and pollution liability for product manufacturers and distributors, coupled with professional liability, for environmental consultants and contractors. |
Other P&C – Products offered in this division include but are not limited to: Auto, Life Sciences, Property, Energy & Engineering, and Other P&C which includes run-off lines of business. |
4
A summary of our U.S. Insurance – U.S. Professional Liability operating segment by business division and primary products within these divisions is as follows:
U.S. Professional Liability Products by Division |
D&O – We provide D&O insurance to companies for losses resulting from claims alleging breaches of fiduciary duty including stockholder claims, employment related matters and other claims alleging various wrongful acts. |
E&O – We underwrite Professional Liability insurance for the following risk types within our E&O division: Architects & Engineers ("A&E"), Accountants, Miscellaneous Professional Liability, Real Estate E&O and Other E&O . |
Other Professional Liability – includes run-off lines of business. |
A summary of our Int'l Insurance – Int'l Marine operating segment by product is as follows:
Int'l Marine Products |
Cargo - We offer all-risk coverage for manufacturing, importers, exporters and freight forwarders with available coverage enhancements including but not limited to domestic and international inland transit, warehouse storage and exhibition coverage. Marine Liability – Products include coverage for liability to third parties for bodily injury or property damage stemming from marine-related operations. We focus on the associated marine liability exposures of multi-national corporations as well as small to medium sized marine operations. |
Protection & Indemnity ("P&I") – We offer fixed-cost P&I coverage for small to medium sized vessels. We protect shipowners, managers and time charterers against liabilities arising out of and/or in connection with the operation of their vessels. |
Specie – We offer specie and fine art insurance coverage as well as writing banks and cash in transit risks. |
Transport – We provide comprehensive insurance for a full range of operations in the global ports, terminal operators and logistics sector. |
Other products offered: Craft, Energy Liability, Hull, War and Other Marine. |
A summary of our Int'l Insurance – Int'l P&C operating segment by business division and primary products within these divisions is as follows:
Int'l P&C Products by Division |
Energy & Engineering Onshore Energy – Our insurance offerings include coverage for physical loss or damage to refineries and process plants in the oil, gas and petrochemical industries, with coverage for principal perils including fire, explosion, machinery breakdown and, in some cases, natural perils such as earthquakes and/or flooding. We focus on owners and investors in refineries, gas processing, and other hydrocarbon processing industries, typically those with mid-sized asset schedules.
Offshore Energy – Policies can cover physical damage to fixed and mobile rigs, land rigs and associated equipment and pipelines plus the risks encountered during the drilling and production phases of wells (both on and offshore) and any subsequent re-drill required, along with any consequential seepage and pollution from these incidents. We focus on small to very large companies involved in the exploration and production of hydrocarbons in all areas of the world and those investing in windfarms.
Other products offered: Other Energy & Engineering, which includes power station insurance. |
Environmental – We underwrite monoline environmental impairment liability on primary and excess follow form policies. This includes coverage for site-based exposures and contractor's pollution on an annual and single project basis. The same core coverage can also be embedded into other products, including general liability and E&O. |
General Liability – We offer primary and excess public, products and pollution liability coverage for a range of industries, including manufacturing, construction, mining, utilities and services. |
Property – We provide property insurance coverage for commercial businesses with a focus on standard middle market for targeted industries and exposures for both North American and International risks. |
5
Other P&C – Products offered in this division include: Life Sciences, Political Violence & Terrorism ("PV&T") and Other P&C which includes run-off lines of business. |
A summary of our Int'l Insurance – Int'l Professional Liability operating segment by business division and primary products within these divisions is as follows:
Int'l Professional Liability Products by Division |
D&O – We underwrite D&O insurance for public and private companies for losses resulting from alleged breaches of fiduciary duty including stockholder claims, employment related matters and other claims alleging various wrongful acts. |
E&O – We underwrite Professional Liability insurance for the following risk types within our E&O division: A&E, Accountants, Miscellaneous Professional Liability, and Other E&O which includes professional liability insurance for lawyers. |
Other Professional Liability – We offer a Warranties and Indemnity coverage product which provides coverage for a breach of a warranty or indemnity in a purchase agreement in a merger or acquisition. |
A summary of our GlobalRe reporting segment by business products is as follows:
GlobalRe Products |
Accident & Health ("A&H") – We underwrite quota share and excess of loss reinsurance covering healthcare benefits, including employer stop loss, fully insured, limited medical benefits, dental benefits, and prescription drug benefits. |
Marine – We underwrite international ocean marine quota share and excess of loss reinsurance covering Cargo, Hull, Specie and Liability portfolios. |
P&C – We underwrite quota share, excess of loss and facultative property and casualty reinsurance in Latin America and the Caribbean ("LatAm") as well as international property reinsurance ("property treaty") to selected insurance companies. |
Professional Liability – We underwrite quota share and excess of loss reinsurance covering professional and management liability portfolios. |
Other products include: Agriculture (global), Surety (focused in Latin America) and Other Reinsurance . |
Competitive Environment
Our Company faces competition from both domestic and foreign insurers, many of whom have longer operating histories and greater financial, marketing and management resources. Competition in the types of insurance in which our Company is engaged is based on many factors, including the perceived overall financial strength ratings as assigned by independent rating agencies, pricing, other terms and conditions of products and services offered, business experience, business infrastructure, global presence, marketing and distribution arrangements, agency and broker relationships, quality of customer service (including speed of claims payments), product differentiation and quality, operating efficiencies and underwriting. Furthermore, insureds tend to favor large, financially strong insurers, and our Company faces the risk that we will lose market share to these larger insurers. Another competitive factor in the industry is the entrance of underwriting organizations and other financial services providers, such as banks and brokerage firms, into the insurance business. These efforts pose new challenges to insurance companies and agents from financial services companies traditionally not involved in the insurance business. We strive to offer superior service, which we believe has differentiated us from our competitors. Our Company pursues a specialist strategy and focuses on market opportunities where we can compete effectively based on service levels and product design, while still achieving an adequate level of profitability. Our Company has grown, in part, from the leveraging of cross-marketing opportunities with our other operations to take advantage of our organization's global presence.
Employees
As of December 31, 2016, we had 683 full-time employees of which 510 were located in the United States, 151 in the United Kingdom, 6 in The Netherlands, 5 in Italy, 4 in Sweden, 3 in France, 2 in Belgium and 2 in Denmark.
Loss Reserves
Loss reserves are estimates of what the insurer or reinsurer expects to pay on claims, based on facts and circumstances then known. It is possible that the ultimate liability may exceed or be less than such estimates. In setting the loss reserve estimates, our Company reviews statistical data covering several years, analyzes patterns by line of business and considers several factors including trends in claims frequency and severity, changes in operations, emerging economic and social trends, inflation and changes in the regulatory
6
and litigation environment. We also consult with experienced c laims professionals. Based on our analysis, we make a best estimate of our ultimate liability. During the loss settlement period, which, in some cases, may last several years, additional facts regarding individual claims may become known and, accordingly, it often becomes necessary to refine and adjust the estimates of liability on a claim upward or downward. Such estimates are regularly reviewed and updated and any resulting adjustments are included in our current period's earnings. Even then, the ultimat e liability may exceed or be less than our revised estimates. Our reserving process is intended to provide implicit recognition of the impact of inflation and other factors affecting loss payments by taking into account changes in historical payment patter ns and perceived probable trends. There is generally no precise method for the subsequent evaluation of the adequacy of the consideration given to inflation, or to any other specific factor, because the eventual strengthening or release of reserves is affe cted by many factors, some of which are interdependent.
Our Company maintains reserves for unpaid losses and unpaid loss adjustment expenses ("LAE") for all lines of business. Loss reserves consist of both reserves for reported claims, known as case reserves, and reserves for losses that have occurred but have not yet been reported, known as incurred but not reported ("IBNR") losses. In the normal course of business, our Company cedes a portion of our premium to reinsurers through treaty and facultative reinsurance agreements. Although reinsurance does not discharge our Company from liability to our policyholders, our Company participates in reinsurance agreements to limit our loss exposure and to protect us against catastrophic losses.
There is a lag between the time premiums are written and related losses and LAE are incurred, and the time such events are reported to us. The loss reserves include amounts related to short tail and long tail classes of business. Short tail business refers to claims that are generally reported quickly upon occurrence of an event and involve little or no litigation, making estimation of loss reserves less complex. The long tail business includes our Marine Liability product as well as various other insurance products in our P&C and Professional Liability operating segments. For the long tail lines, significant periods of time, ranging up to several years or more, may elapse between the occurrence of the loss, the reporting of the loss and the settlement of the claim. Generally, the longer the time span between the incidence of a loss and the settlement of the claim, the more likely the ultimate settlement amount will vary from the original estimate.
The following table presents the development of our loss and LAE reserves for 2006 through 2016. Net reserves for losses and LAE reflects our net reserves at the balance sheet date for each of the indicated years and represents our estimated amount of losses and LAE arising in all prior years that are unpaid at the balance sheet date. Reserves for losses and LAE re-estimated in the table reflect our re-estimated amount of our previously recorded reserves based on experience as of the end of each succeeding year. Our reserve estimates may change as more information becomes known about the frequency and severity of claims for individual years. Our net and gross cumulative redundancy (deficiency) in the table reflects our cumulative amounts developed as of successive years with respect to the aforementioned reserve liability. Our cumulative redundancy (deficiency) represents the aggregate change in the estimates over all prior years.
The table calculates losses and LAE reported and recorded for all prior years starting with the year in which the loss was incurred. For example, assuming that a loss occurred in 2006 but was not reported until 2007, the amount of such loss will appear as a deficiency in both 2006 and 2007. Conditions and trends that have affected development of the liability in the past may not necessarily occur in the future. Accordingly, it may not be appropriate to extrapolate future strengthening or releases based on the table.
A significant portion of our favorable or adverse development on the gross reserves has been ceded to the excess-of-loss reinsurance treaties. As a result of these reinsurance arrangements, our gross losses and related reserve strengthening and releases tend to be more sensitive to favorable or adverse developments such as those described above than our net losses and related reserve strengthening and releases.
7
|
| Years Ended December 31, |
| |||||||||||||||||||||||||||||||||||||||||
amounts in thousands |
| 2006 |
|
| 2007 |
|
| 2008 |
|
| 2009 |
|
| 2010 |
|
| 2011 |
|
| 2012 |
|
| 2013 |
|
| 2014 |
|
| 2015 |
|
| 2016 |
| |||||||||||
Net reserves for losses and LAE |
| $ | 696,116 |
|
| $ | 847,303 |
|
| $ | 999,871 |
|
| $ | 1,112,934 |
|
| $ | 1,142,542 |
|
| $ | 1,237,234 |
|
| $ | 1,216,909 |
|
| $ | 1,222,633 |
|
| $ | 1,308,136 |
|
| $ | 1,393,126 |
|
| $ | 1,510,451 |
|
Reserves for losses and LAE re-estimated as of: |
|
|
|
|
|
|
|
|
|
|
|
|
|
|
|
|
|
|
|
|
|
|
|
|
|
|
|
|
|
|
|
|
|
|
|
|
|
|
|
|
|
|
|
|
One year later |
|
| 649,107 |
|
|
| 796,557 |
|
|
| 990,930 |
|
|
| 1,099,132 |
|
|
| 1,144,687 |
|
|
| 1,191,943 |
|
|
| 1,215,643 |
|
|
| 1,166,821 |
|
|
| 1,243,467 |
|
|
| 1,364,598 |
|
|
|
|
|
Two years later |
|
| 589,044 |
|
|
| 776,845 |
|
|
| 971,048 |
|
|
| 1,065,382 |
|
|
| 1,068,344 |
|
|
| 1,189,651 |
|
|
| 1,142,545 |
|
|
| 1,144,854 |
|
|
| 1,262,367 |
|
|
|
|
|
|
|
|
|
Three years later |
|
| 555,448 |
|
|
| 767,600 |
|
|
| 943,231 |
|
|
| 1,037,233 |
|
|
| 1,084,728 |
|
|
| 1,167,745 |
|
|
| 1,165,959 |
|
|
| 1,196,219 |
|
|
|
|
|
|
|
|
|
|
|
|
|
Four years later |
|
| 559,368 |
|
|
| 749,905 |
|
|
| 925,756 |
|
|
| 1,027,551 |
|
|
| 1,072,849 |
|
|
| 1,193,950 |
|
|
| 1,196,157 |
|
|
|
|
|
|
|
|
|
|
|
|
|
|
|
|
|
Five years later |
|
| 539,327 |
|
|
| 745,489 |
|
|
| 921,597 |
|
|
| 1,029,215 |
|
|
| 1,097,862 |
|
|
| 1,192,188 |
|
|
|
|
|
|
|
|
|
|
|
|
|
|
|
|
|
|
|
|
|
Six years later |
|
| 538,086 |
|
|
| 736,776 |
|
|
| 925,518 |
|
|
| 1,041,778 |
|
|
| 1,098,545 |
|
|
|
|
|
|
|
|
|
|
|
|
|
|
|
|
|
|
|
|
|
|
|
|
|
Seven years later |
|
| 530,856 |
|
|
| 737,514 |
|
|
| 935,511 |
|
|
| 1,046,653 |
|
|
|
|
|
|
|
|
|
|
|
|
|
|
|
|
|
|
|
|
|
|
|
|
|
|
|
|
|
Eight years later |
|
| 526,515 |
|
|
| 742,079 |
|
|
| 943,450 |
|
|
|
|
|
|
|
|
|
|
|
|
|
|
|
|
|
|
|
|
|
|
|
|
|
|
|
|
|
|
|
|
|
Nine years later |
|
| 526,457 |
|
|
| 741,590 |
|
|
|
|
|
|
|
|
|
|
|
|
|
|
|
|
|
|
|
|
|
|
|
|
|
|
|
|
|
|
|
|
|
|
|
|
|
Ten years later |
|
| 523,510 |
|
|
|
|
|
|
|
|
|
|
|
|
|
|
|
|
|
|
|
|
|
|
|
|
|
|
|
|
|
|
|
|
|
|
|
|
|
|
|
|
|
|
|
|
|
|
|
|
|
|
|
|
|
|
|
|
|
|
|
|
|
|
|
|
|
|
|
|
|
|
|
|
|
|
|
|
|
|
|
|
|
|
|
|
|
|
Net cumulative redundancy (deficiency) |
| $ | 172,606 |
|
| $ | 105,713 |
|
| $ | 56,421 |
|
| $ | 66,281 |
|
| $ | 43,997 |
|
| $ | 45,046 |
|
| $ | 20,752 |
|
| $ | 26,414 |
|
| $ | 45,769 |
|
| $ | 28,528 |
|
|
|
|
|
Net cumulative paid as of: |
|
|
|
|
|
|
|
|
|
|
|
|
|
|
|
|
|
|
|
|
|
|
|
|
|
|
|
|
|
|
|
|
|
|
|
|
|
|
|
|
|
|
|
|
One year later |
|
| 142,938 |
|
|
| 180,459 |
|
|
| 263,523 |
|
|
| 314,565 |
|
|
| 309,063 |
|
|
| 407,385 |
|
|
| 365,479 |
|
|
| 295,527 |
|
|
| 320,863 |
|
|
| 412,544 |
|
|
|
|
|
Two years later |
|
| 233,211 |
|
|
| 322,892 |
|
|
| 460,058 |
|
|
| 517,125 |
|
|
| 552,881 |
|
|
| 620,955 |
|
|
| 550,747 |
|
|
| 512,709 |
|
|
| 620,514 |
|
|
|
|
|
|
|
|
|
Three years later |
|
| 300,328 |
|
|
| 441,267 |
|
|
| 591,226 |
|
|
| 682,051 |
|
|
| 695,054 |
|
|
| 752,315 |
|
|
| 703,511 |
|
|
| 736,360 |
|
|
|
|
|
|
|
|
|
|
|
|
|
Four years later |
|
| 359,592 |
|
|
| 526,226 |
|
|
| 688,452 |
|
|
| 773,261 |
|
|
| 785,046 |
|
|
| 862,722 |
|
|
| 856,240 |
|
|
|
|
|
|
|
|
|
|
|
|
|
|
|
|
|
Five years later |
|
| 401,102 |
|
|
| 583,434 |
|
|
| 745,765 |
|
|
| 828,269 |
|
|
| 868,850 |
|
|
| 949,784 |
|
|
|
|
|
|
|
|
|
|
|
|
|
|
|
|
|
|
|
|
|
Six years later |
|
| 427,282 |
|
|
| 620,507 |
|
|
| 785,211 |
|
|
| 872,685 |
|
|
| 930,327 |
|
|
|
|
|
|
|
|
|
|
|
|
|
|
|
|
|
|
|
|
|
|
|
|
|
Seven years later |
|
| 451,118 |
|
|
| 645,951 |
|
|
| 819,146 |
|
|
| 920,319 |
|
|
|
|
|
|
|
|
|
|
|
|
|
|
|
|
|
|
|
|
|
|
|
|
|
|
|
|
|
Eight years later |
|
| 462,648 |
|
|
| 663,914 |
|
|
| 855,320 |
|
|
|
|
|
|
|
|
|
|
|
|
|
|
|
|
|
|
|
|
|
|
|
|
|
|
|
|
|
|
|
|
|
Nine years later |
|
| 471,597 |
|
|
| 679,529 |
|
|
|
|
|
|
|
|
|
|
|
|
|
|
|
|
|
|
|
|
|
|
|
|
|
|
|
|
|
|
|
|
|
|
|
|
|
Ten years later |
|
| 479,803 |
|
|
|
|
|
|
|
|
|
|
|
|
|
|
|
|
|
|
|
|
|
|
|
|
|
|
|
|
|
|
|
|
|
|
|
|
|
|
|
|
|
|
|
|
|
|
|
|
|
|
|
|
|
|
|
|
|
|
|
|
|
|
|
|
|
|
|
|
|
|
|
|
|
|
|
|
|
|
|
|
|
|
|
|
|
|
Gross liability-end of year |
|
| 1,607,555 |
|
|
| 1,648,764 |
|
|
| 1,853,664 |
|
|
| 1,920,286 |
|
|
| 1,985,838 |
|
|
| 2,082,679 |
|
|
| 2,097,048 |
|
|
| 2,045,071 |
|
|
| 2,159,634 |
|
|
| 2,202,644 |
|
|
| 2,289,727 |
|
Reinsurance recoverable |
|
| 911,439 |
|
|
| 801,461 |
|
|
| 853,793 |
|
|
| 807,352 |
|
|
| 843,296 |
|
|
| 845,445 |
|
|
| 880,139 |
|
|
| 822,438 |
|
|
| 851,498 |
|
|
| 809,518 |
|
|
| 779,276 |
|
Net liability-end of year |
| $ | 696,116 |
|
| $ | 847,303 |
|
| $ | 999,871 |
|
| $ | 1,112,934 |
|
| $ | 1,142,542 |
|
| $ | 1,237,234 |
|
| $ | 1,216,909 |
|
| $ | 1,222,633 |
|
| $ | 1,308,136 |
|
| $ | 1,393,126 |
|
| $ | 1,510,451 |
|
|
|
|
|
|
|
|
|
|
|
|
|
|
|
|
|
|
|
|
|
|
|
|
|
|
|
|
|
|
|
|
|
|
|
|
|
|
|
|
|
|
|
|
|
|
Gross re-estimated latest |
|
| 1,309,542 |
|
|
| 1,483,286 |
|
|
| 1,723,600 |
|
|
| 1,785,871 |
|
|
| 1,873,118 |
|
|
| 2,014,643 |
|
|
| 2,026,929 |
|
|
| 1,997,842 |
|
|
| 2,062,431 |
|
|
| 2,148,128 |
|
|
|
|
|
Re-estimated recoverable latest |
|
| 786,032 |
|
|
| 741,696 |
|
|
| 780,150 |
|
|
| 739,218 |
|
|
| 774,573 |
|
|
| 822,455 |
|
|
| 830,772 |
|
|
| 801,623 |
|
|
| 800,064 |
|
|
| 783,530 |
|
|
|
|
|
Net re-estimated latest |
| $ | 523,510 |
|
| $ | 741,590 |
|
| $ | 943,450 |
|
| $ | 1,046,653 |
|
| $ | 1,098,545 |
|
| $ | 1,192,188 |
|
| $ | 1,196,157 |
|
| $ | 1,196,219 |
|
| $ | 1,262,367 |
|
| $ | 1,364,598 |
|
|
|
|
|
|
|
|
|
|
|
|
|
|
|
|
|
|
|
|
|
|
|
|
|
|
|
|
|
|
|
|
|
|
|
|
|
|
|
|
|
|
|
|
|
|
|
|
|
|
Gross cumulative redundancy (deficiency) |
| $ | 298,013 |
|
| $ | 165,478 |
|
| $ | 130,064 |
|
| $ | 134,415 |
|
| $ | 112,720 |
|
| $ | 68,036 |
|
| $ | 70,119 |
|
| $ | 47,229 |
|
| $ | 97,203 |
|
| $ | 54,516 |
|
|
|
|
|
8
Investm ents
The objective of our investment policy, guidelines and strategy is to maximize total investment return in the context of preserving and enhancing stockholder value and the statutory surplus of our regulated insurance companies. As part of our overall investment strategy, we seek to build a tax efficient investment portfolio.
Our investments are managed by outside professional fixed-income and equity portfolio managers. We seek to achieve our investment objectives by investing in cash equivalents and money market funds, municipal bonds, sovereign bonds, government agency guaranteed and non-guaranteed securities, corporate bonds, mortgage-backed and asset-backed securities, common and preferred stocks, and exchange traded funds. The Finance Committee of our Board of Directors approves our overall group asset allocation targets and investment policy to ensure that they are consistent with our overall goals, strategies and objectives.
Our regulated insurance companies' investments are subject to the oversight of their respective Boards of Directors and the Finance Committee of our Parent Company's Board of Directors. Our investment portfolio and the performance of the investment managers are reviewed quarterly. Our investments within NIC and NSIC must comply with the insurance laws of New York State, the domiciliary state of NIC and NSIC. These laws prescribe the type, quality and concentration of investments which may be made by insurance companies. In general, these laws permit investments, within specified limits and subject to certain qualifications, in federal, state and municipal obligations, corporate bonds, structured securities, preferred stocks, common stocks, real estate mortgages and real estate.
Our investments supporting our Int'l Insurance business must also comply with the regulations set forth by the PRA in the U.K. Our investments supporting business at Lloyd's and NIIC are subject to the direction and control of the Boards of Directors and the Investment Committees of Navigators Underwriting Agency Ltd. ("NUAL") and NIIC, as well as our Parent Company's Board of Directors and Finance Committee.
Refer to Management's Discussion of Financial Condition and Results of Operations - Investments and Note 3, Investments, in the Notes to Consolidated Financial Statements, both of which are included herein, for additional information regarding investments.
Regulation
United States
Our Company is subject to regulation under various insurance statutes, including holding company statutes of various states and applicable regulatory authorities in the United States. These regulations vary but generally require insurance holding companies, and insurers that are subsidiaries of holding companies, to register and file reports concerning their capital structure, ownership, financial condition and general business operations. Such regulations also generally require prior regulatory agency approval of changes in control of an insurer and of certain transactions within the holding company structure. The regulatory agencies have statutory authorization to enforce their laws and regulations through various administrative orders and enforcement proceedings.
State insurance regulations are intended primarily for the protection of policyholders rather than stockholders. The state insurance departments monitor compliance with regulations through periodic reporting procedures and examinations. The quarterly and annual financial reports to the state insurance regulators utilize statutory accounting principles, which are different from generally accepted accounting principles ("GAAP") that we use in our reports to stockholders. Statutory accounting principles, in keeping with the intent to assure the protection of policyholders, are generally based on a solvency concept, while GAAP is based on a going-concern concept.
The state insurance regulators utilize risk-based capital measurements, developed by the National Association of Insurance Commissioners ("NAIC"), to identify insurance companies that potentially are inadequately capitalized. The NAIC's risk-based capital model is intended to establish minimum capital thresholds that vary with the size and mix of an insurance company's business and assets. It is designed to identify companies with capital levels that may require regulatory attention. At December 31, 2016, each of our domestic insurance companies' total adjusted capital was significantly in excess of the authorized control level risk-based capital.
The NAIC has developed a set of financial relationships or tests known as the Insurance Regulatory Information System ("IRIS") to assist state regulators in monitoring the financial condition of U.S. insurance companies and identifying companies that require special attention or action by insurance regulatory authorities. Generally, regulators will begin to investigate or monitor an insurance company if its IRIS ratios fall outside usual ranges for four or more of the ratios. If an insurance company has insufficient capital, regulators may act to reduce the amount of insurance it can issue. Based on our most recent statutory filings (calculated as of December 31, 2016), none of our U.S. insurance companies are subject to regulatory scrutiny based on these ratios.
9
In 2012, the NAIC adopted the Risk Management and Own Risk and Solvency Assessment ("ORSA") Model Act, which, following enactment at the state level became effective in 2015. ORSA requires U.S. insurance companies and their groups to regularly, but no less than annually: 1) conduct an assessment of the adequacy of its risk management framework and current and estimated future solven cy position, 2) internally document the process and results of such assessment and 3) provide a confidential, high level summary of such assessment to certain state regulatory authorities. This year we filed our ORSA report with the New York State Departme nt of Financial Services on December 1, 2016, and we believe we have a robust Enterprise Risk Management framework in place that is effective in meeting the ORSA requirements.
The U.S. state insurance regulations also regulate the payment of dividends and other distributions by insurance companies to their stockholders. Generally, insurance companies are limited by these regulations in the payment of dividends above a specified level. Dividends in excess of those thresholds are "extraordinary dividends" and are subject to prior regulatory approval. While New York only requires approval of extraordinary dividends, some states require prior regulatory approval for all dividends.
Because we are an insurance holding company, we are subject to the insurance holding company system regulatory requirements of a number of states. Under these regulations, we are required to report information regarding our capital structure, financial condition and management. We are also required to provide prior notice to, or seek the prior approval of, the Department of Financial Services of certain agreements and transactions between our affiliated companies. These agreements and transactions must satisfy certain regulatory requirements.
Government intervention has also occurred in the insurance and reinsurance markets in relation to terrorism coverage in the U.S. (and through industry initiatives in other countries). The U.S. Terrorism Risk Insurance Act (TRIA), which was enacted in 2002 to ensure the availability of insurance coverage for certain terrorist acts in the U.S., was extended in 2015 for six years, through December 31, 2020, and applies to certain of our product offerings.
United Kingdom
Our U.K. branch, NIIC and the Syndicate are all subject to regulation by the PRA (for prudential issues) and the FCA (for conduct of business issues). The Syndicate is also subject to supervision by the Council of Lloyd's. The PRA and FCA have been granted broad authorization and intervention powers as they relate to the operations of all insurers, including Lloyd's syndicates, operating in the U.K. Lloyd's is regulated by the PRA and FCA and is required to implement certain rules prescribed by them, which it does by the powers it has under the Lloyd's Act 1982 relating to the operation of the Lloyd's market. Lloyd's prescribes, in respect of its managing agents and corporate members, certain minimum standards relating to their management and control, solvency and various other requirements. The PRA and FCA also monitor Lloyd's managing agents' compliance with those systems and controls. If it appears to the PRA and/or the FCA that either Lloyd's is not fulfilling its regulatory responsibilities, or that managing agents are not complying with the applicable regulatory rules and guidance, the PRA and/or FCA may intervene at their discretion.
The Council of Lloyd's has wide discretionary powers to regulate members' underwriting at Lloyd's. It may, for instance, change the basis on which syndicate expenses are allocated or vary the required amount of capital to be held by a corporate member of Lloyd's in support of its business ("Funds at Lloyd's") ratio or the investment criteria applicable to the provision of Funds at Lloyd's. Exercising any of these powers might affect the return on an investment of the corporate member in a given underwriting year ("UWY"). Further, it should be noted that the annual business plans of a syndicate are subject to the review and approval of the Lloyd's Franchise Board. The Lloyd's Franchise Board is responsible for setting risk management and profitability targets for the Lloyd's market and operates a business planning and monitoring process for all syndicates. The Council of Lloyd's also has discretion to call or assess up to 3% of a member's underwriting capacity in any one year as a Central Fund contribution in the event a member of Lloyd's is unable to pay its debts to policyholders.
The U.K. branch, NIIC and the Syndicate are required to meet the requirements of the European Union's ("the E.U.") new financial services regulatory regime known as "Solvency II," which is built on a risk-based approach to setting capital requirements for insurers. Solvency II established a revised set of the E.U.-wide capital requirements and risk management standards, which became effective on January 1, 2016. Over the last few years, our Company has undertaken a significant amount of work to ensure that it meets the requirements of Solvency II for all of its affected entities. However, there are some aspects of Solvency II concerning compliance with supervisory reporting and disclosure requirements that have yet to be finalized, where obligations come into effect in 2017. Our Company will continue its efforts to ensure that it meets such requirements.
10
Available I nformation
Our corporate website is http://www.navg.com. We make available free of charge, through the Investor Relations section of our corporate website, the following reports (and related amendments as filed with the SEC) as soon as reasonably practicable after such materials are electronically filed with, or furnished to, the SEC:
| • | Annual Reports on Form 10-K |
| • | Quarterly Reports on Form 10-Q |
| • | Current Reports on Form 8-K |
| • | Proxy Statements on Schedule 14A, as well as other filings with the SEC |
Also available through our website are our corporate governance guidelines, corporate code of ethics and conduct, and charters for the committees of our Board of Directors. The information found on our website is not part of this or any other report filed with or furnished to the SEC.
ITEM 1A. RISK FACTORS
Factors that could have a material impact on our results of operations or financial condition are outlined below. Additional risks not presently known to us or which we currently deem insignificant may also impair our business or results of operations as they become known facts or as facts and circumstances change. Any of the risks described below could result in a material adverse effect on our results of operations or financial condition.
The continuing volatility in the financial markets and the risk of another recession could have a material adverse effect on our results of operations and financial condition.
Although our Company continues to monitor market conditions, we cannot predict future market conditions or their impact on our stock price or investment portfolio. Depending on market conditions, our Company could incur future realized and unrealized losses, which could have a material adverse effect on our results of operations and financial condition of our Company. These economic conditions have had an adverse impact on the availability and cost of credit resources generally, which could negatively affect the ability to obtain letters of credit utilized by us to support business written through Lloyd's.
In addition, financial market volatility or an economic downturn could have a material adverse effect on the insureds, agents, claimants, reinsurers, vendors and competitors. Certain of the actions of the U.S., European and other foreign governments have taken or may take in response to the financial market volatility have impacted, or may impact, certain insurance carriers. The U.S., European and other foreign governments continue to take active steps to implement measures to stabilize the financial markets and stimulate the economy, and it is possible that any measures taken by U.S. or foreign governments to stimulate or stabilize the economy could affect the insurance industry and its competitive landscape.
Our Company's business is concentrated in Marine, P&C and Professional Liability insurance as well as reinsurance, and if market conditions change adversely, or our Company experiences large losses in these lines, it could have a material adverse effect on our business.
As a result of our strategy to focus on specialty products in niches where our Company has underwriting and claims handling expertise and to decrease our business in areas where pricing does not afford what it considers to be acceptable returns, our business is concentrated in the Marine, P&C and Professional Liability lines of business, as well as reinsurance. If our results of operations from any of these lines are less favorable for any reason, including lower demand for our products on terms and conditions that our Company finds appropriate, flat or decreased rates for our products or increased competition, the impact of a reduction could have a material adverse effect on our business.
11
Our Company's efforts to expand in targeted international markets, may not be successful and may expose us to additi onal risks which could cause a material adverse effect on our business, financial position and results of operations.
A number of our Company's planned business initiatives involve expanding existing products in targeted international markets. To develop new markets, our Company may need to make substantial capital and operating expenditures, which may negatively impact our results in the near term. In addition, the demand in new markets may not meet our Company's expectations. This, in turn, could lead to losses in excess of expectations. Moreover, to the extent our Company is able to expand in new international markets, our Company may be exposed to certain additional risks including but not limited to:
| • | Difficulties in staffing and managing foreign operations; |
| • | Burdens of complying with additional foreign laws and regulations; |
| • | Political and economic instability; |
| • | Differing employment practices and laws and labor disruptions; |
| • | The imposition of government controls; |
| • | A legal system subject to undue influence or corruption; and |
| • | A business culture in which illegal sales practices may be prevalent. |
The occurrence of any of these risks could negatively affect our Company's international business and consequently our financial position and results of operations.
Our Company is exposed to cyclicality in our business that may cause material fluctuations in our results.
The P&C insurance business generally, and the marine insurance business specifically, have historically been characterized by periods of intense price competition due to excess underwriting capacity as well as periods when shortages of underwriting capacity have allowed for attractive premium levels. Our Company has reduced business during periods of severe competition and price declines and has grown when pricing allowed an acceptable return. The cyclical trends in the P&C insurance and reinsurance industries and the profitability of these industries can also be significantly affected by volatile and unpredictable developments, including natural and man-made disasters, fluctuations in interest rates, changes in the investment environment that affect market prices of investments and inflationary pressures that may tend to affect the size of losses experienced by insureds. Our Company cannot predict with accuracy whether market conditions will remain constant, improve or deteriorate. Our Company expects that the business will continue to experience the effects of this cyclicality, which, over the course of time, could result in material fluctuations in premium volume, revenues or expenses.
Catastrophe losses could materially reduce our profitability.
Our Company is exposed to claims arising out of catastrophes, particularly in our U.S. and Int'l Marine operating segments, our Energy and Engineering division within our U.S. and Int'l P&C operating segments and our GlobalRe reporting segment. Our Company has experienced, and will experience in the future, catastrophe losses, which may materially reduce profitability or harm the financial condition of our Company. Catastrophes can be caused by various natural events, including, but not limited to, hurricanes, windstorms, earthquakes, tornadoes, floods, hail, severe winter weather and fires. Catastrophes can also be man-made, such as war, explosions or terrorism, or caused by unfortunate events such as an oil rig disaster or the grounding of a cruise ship. In addition, changing climate conditions could result in an increase in the frequency or severity of natural catastrophes, which could increase exposure to such losses. The incidence and severity of catastrophes are inherently unpredictable. Although our Company will attempt to manage exposure to such events, the frequency and severity of catastrophic events could exceed estimates, which could have a material adverse effect on the financial condition of our Company.
Intense competition for products could harm the ability of our Company to maintain or increase profitability and premium volume.
The P&C insurance industry is highly competitive. Our Company faces competition from both domestic and foreign insurers, many of whom have longer operating histories and greater financial, marketing and management resources. Competition in the types of insurance in which our Company is engaged is based on many factors, including the perceived overall financial strength, pricing and other terms and conditions of products and services offered, business experience, marketing and distribution arrangements, agency and broker relationships, levels of customer service (including speed of claims payments), product differentiation and quality, operating efficiencies and underwriting. In addition, insurance industry participants may seek to consolidate through mergers and acquisitions. Continued consolidation within the insurance industry will increase the already competitive underwriting environment, as our
12
Company would likely experience more robust competition from larger competitors. Furthermore, insureds tend to favor large, financially strong insurers, and our Company face s the risk that it will lose market share to larger or higher rated insurers. Our Company may have difficulty in continuing to compete successfully on any of these bases in the future. If competition limits the ability to write new business at adequate ra tes, the ability to transact business would be materially and adversely affected and our results of operations would be adversely affected.
Our Company may incur additional losses if our losses and LAE reserves are insufficient.
Our Company maintains loss reserves representing our estimated ultimate unpaid liability for losses and LAE with respect to reported and unreported claims incurred as of the end of each accounting period. Our Company utilizes actuarial projection techniques and judgment in determining our estimated reserves. Our estimates require analysis of facts and circumstances then known, historical settlement patterns, trends in claims severity, frequency, legal theories of liability and other factors. Both internal and external events, including changes in claims handling procedures, economic inflation, legal trends and legislative changes, may affect our reserve estimation process. Many of these items are not directly quantifiable, particularly on a prospective basis. Our Company continually refines our reserve estimates in a regular ongoing process as historical loss experience develops and additional claims are reported and settled. Adjustments to reserves are reflected in the results of the periods in which the estimates are changed. Because establishment of reserves is an inherently uncertain process involving estimates, our currently established reserves may not be sufficient. If our estimated reserves are insufficient, our Company will incur additional charges to earnings, which could have a material adverse effect on our future results of operations, financial position or cash flows.
Our loss reserves include amounts related to short tail and long tail classes of business. Short tail business means that claims are generally reported quickly upon occurrence of an event, making estimation of loss reserves less complex. For the long tail lines, significant periods of time, ranging up to several years or more, may elapse between the occurrence of the loss, the reporting of the loss and the settlement of the claim. The longer the time span between the incidence of a loss and the settlement of the claim, the more likely the ultimate settlement amount will vary. There can be no assurance that our Company will not suffer substantial adverse prior period development in the business in the future.
The effects of emerging claim and coverage issues on our business are uncertain.
As industry practices and legislative, regulatory, judicial, social, financial, and other environmental conditions change, unexpected and unintended issues related to claims and coverage may emerge. These issues may adversely affect the business by either extending coverage beyond the underwriting intent or by increasing the frequency and severity of claims. In some instances, these changes may not become apparent until after our Company has issued insurance or reinsurance contracts impacted. As a result, the full extent of liability under the insurance or reinsurance contracts may not be known for many years after a contract is issued.
In addition to losses and LAE reserves, preparation of our financial statements requires our Company to make estimates and judgments.
In addition to loss reserves discussed above, our consolidated financial statements contain accounting estimates and judgments that affect the reported amounts of assets, liabilities, revenues and expenses, and related disclosures. On an ongoing basis, our Company evaluates our estimates based on historical experience and other assumptions that our Company believes to be reasonable. Any significant change in our estimates could adversely affect our results of operations and/or financial condition. Our accounting estimates that are viewed by our management as critical are those in connection with reserves for losses and LAE, reinsurance recoverables, written and unearned premiums, the recoverability of deferred tax assets and impairment of invested assets.
Our Company may not have access to adequate reinsurance to protect us against losses.
Our Company purchases reinsurance by transferring part of our risk to a reinsurance company in exchange for part of the premium it receives in connection with the risk. The availability and cost of reinsurance are subject to prevailing market conditions which can affect our business volume and profitability. Reinsurance programs are generally subject to renewal on an annual basis. If our Company were unable to renew the expiring facilities or to obtain new reinsurance facilities, our net exposures would increase. If our Company was unwilling to bear an increase in net exposures, we would have to reduce the level of our underwriting commitments, especially catastrophe exposed risks, which would reduce revenues and possibly net income.
Our reinsurance operations are largely dependent upon ceding companies' evaluation of risk.
Our Company, like other companies that write reinsurance, generally does not evaluate separately individual insurance risks assumed under our reinsurance contracts. As such, our Company is largely dependent upon the ceding companies' original underwriting decisions. Our Company is subject to the risk that the ceding companies may not have adequately or accurately evaluated risks that
13
they have insured, and it has reinsured, and that the premiums c eded may not adequately compensate it for the risks it assumes. If the reserves are insufficient to cover the unpaid losses and LAE arising from the reinsurance business, our Company would have to strengthen the reserves and incur charges to our earnings, which could adversely affect future results of operations, financial position or cash flows.
Reinsurers may not pay on losses in a timely fashion, or at all, which may increase costs.
Although reinsurance makes the reinsurer liable to our Company to the extent the risk is transferred or ceded to the reinsurer, ceded reinsurance arrangements do not eliminate our Company's obligation to pay claims to our policyholders. Accordingly, our Company bears credit risk with respect to our reinsurers. Specifically, the reinsurers may not pay claims made by our Company on a timely basis, or they may not pay some or all of these claims. Either of these events would increase our Company's costs and could have a material adverse effect on our business.
Increases in interest rates may cause our Company to experience losses.
Because of the unpredictable nature of losses that may arise under insurance policies, our Company may require substantial liquidity at any time. The investment portfolio, which consists largely of fixed maturities, is our Company's principal source of liquidity. The market value of the fixed maturities is subject to fluctuation depending on changes in prevailing interest rates and various other factors. Our Company does not hedge the investment portfolio against interest rate risk. Interest rates are at or are close to historic lows. Increases in interest rates during periods when our Company must sell fixed maturities securities to satisfy liquidity needs may result in substantial realized investment losses.
Our investment portfolio is subject to certain risks that could adversely affect the results of operations, financial condition or cash flows.
Although our investment policy guidelines emphasize total investment return in the context of preserving and enhancing stockholder value and statutory surplus of the insurance subsidiaries, our investments are subject to market-wide risks and fluctuations, as well as to risks inherent in particular types of securities. Due to these risks, our Company may not be able to realize our investment objectives. In addition, our Company may be forced to liquidate investments at times and prices that are not optimal, which could have an adverse effect on our results of operations. Investment losses could significantly decrease our asset base, thereby adversely affecting our ability to conduct business and pay claims.
Our Company is exposed to significant capital market risks related to changes in interest rates, credit spreads, equity prices and foreign exchange rates, which may adversely affect our results of operations, financial condition or cash flows.
Declines in equity prices, changes in interest rates, changes in credit spreads and the strengthening or weakening of foreign currencies against the U.S. dollar, individually or together, could have a material adverse effect on our consolidated results of operations, financial condition or cash flows.
Our exposure to interest rate risk relates primarily to the market price and cash flow variability associated with changes in interest rates. Our investment portfolio contains interest rate sensitive instruments, such as fixed maturities and certain preferred stock classified as equity for financial reporting purposes, which may be adversely affected by changes in interest rates from governmental monetary policies, domestic and international economic and political conditions and other factors beyond the control of our Company. A rise in interest rates would reduce the fair value of our investment portfolio. It would also provide us the opportunity to earn higher rates of return on funds reinvested. Conversely, a decline in interest rates would increase the fair value of our investment portfolio. Our Company would then presumably earn lower rates of return on assets reinvested. Our Company may be forced to liquidate investments prior to maturity at a loss in order to cover liabilities. Although our Company takes measures to manage the economic risks of investing in a changing interest rate environment, we may not be able to mitigate the interest rate risk of our assets relative to our liabilities.
Included in the fixed maturities are asset-backed and mortgage-backed securities. Changes in interest rates can expose our Company to changes in the timing of expected cash flows. In periods of declining interest rates, mortgage prepayments generally increase and mortgage-backed securities are prepaid more quickly, requiring our Company to reinvest the proceeds at the then current rates. In periods of rising interest rates, the likelihood of mortgage prepayment decreases and mortgage-backed securities are prepaid at a slower rate, limiting our Company's ability to capitalize on the higher interest rates because its investments remain invested in mortgage-backed securities for a longer period of time.
The fixed maturities portfolio is invested in high quality, investment-grade securities. Our Company has limits on the amount of below investment-grade, high yield fixed income securities that it can hold in its investment portfolio. These securities may pay a
14
higher rate of interest, and also may have a higher degree of credit or default risk. These securities may also be less liquid in times of economic weakn ess or market disruptions. While our Company has put in place procedures to monitor the credit risk and liquidity of our invested assets, it is possible that, in periods of economic weakness, our Company may experience default losses in the portfolio. Thi s may result in a reduction of net income, capital and cash flows.
Our Company invests a portion of our portfolio in common stock. The value of these assets fluctuates with the equity markets. In times of economic weakness, the market value and liquidity of these assets may decline, and may impact our net income, capital and cash flows.
The functional currency of our Company's principal insurance and reinsurance subsidiaries is the U.S. dollar. Exchange rate fluctuations relative to the functional currency may materially impact our financial position, as our Company conducts business in several non-U.S. currencies. The principal currencies creating foreign currency exchange risk for our operations are the GBP and the CAD. In addition, locally-required capital levels are invested in local currencies in order to satisfy regulatory requirements and to support local insurance operations regardless of currency fluctuations.
Despite mitigation efforts, an increase in interest rates or a change in foreign exchange rates could have a material adverse effect on our results of operations, financial position and cash flows.
Capital may not be available to our Company in the future or may only be available on unfavorable terms.
The capital needs of our business are dependent on several factors, including the ability to write new business successfully and to establish premium rates and reserves at levels sufficient to cover our losses. If the current capital becomes insufficient for our future plans, our Company may need to raise additional capital through the issuance of stock or debt. Otherwise, in the case of insufficient capital, our Company may need to limit our growth. The terms of equity or debt offering could be unfavorable, for example, causing dilution to the current stockholders or such securities may have rights, preferences and privileges that are senior to existing securities. If our Company was in a situation of having inadequate capital and if we were not able to obtain additional capital, our business, results of operations and financial condition could be adversely affected to a material extent.
A downgrade in our ratings could adversely impact the competitive positions of our operating businesses or negatively affect the ability to implement our business strategy successfully.
Ratings are a critical factor in establishing the competitive position of insurance companies. NIC and NSIC are rated by A.M. Best and S&P, and NIIC is rated by S&P. A.M. Best's and S&P's ratings reflect their opinions of an insurance company's financial strength, operating performance, strategic position and ability to meet our obligations to policyholders, and are not evaluations directed to investors. The ratings are subject to periodic review by A.M. Best and S&P. Because these ratings have become an increasingly important factor in establishing the competitive position of insurance companies, if these ratings are reduced, our competitive position in the industry, and therefore the business, could be adversely affected in a material manner. A significant downgrade could result in a substantial loss of business as policyholders might move to other companies with higher ratings. In addition, a significant downgrade could subject our Company to higher borrowing costs and our ability to access the capital markets could be negatively impacted. If our Company were to be downgraded below an "A-", we would be required to provide additional collateral under the letter of credit facility with ING Bank, N.V., London Branch, as Administrative Agent and Letter of Credit Agent. Further, a downgrade below BBB- by S&P would subject our Company to higher interest rates payable on the 5.75% Senior Notes due October 15, 2023. Refer to Note 7, Debt , in the Notes to Consolidated Financial Statements for additional information regarding such credit facility and 5.75% Senior Notes due October 15, 2023, respectively.
There can be no assurance that our current ratings will continue for any given period of time. For a further discussion of our ratings, refer to Management's Discussion and Analysis of Financial Condition and Results of Operations – Ratings included herein.
Continued or increased premium levies by Lloyd's for the Lloyd's Central Fund and cash calls for trust fund deposits or a significant downgrade of Lloyd's A.M. Best rating could materially and adversely affect our Company.
The Lloyd's Central Fund protects Lloyd's policyholders against the failure of a member of Lloyd's to meet its obligations. The Lloyd's Central Fund is a mechanism which in effect mutualizes unpaid liabilities among all members, whether individual or corporate. The Lloyd's Central Fund is available to back Lloyd's policies issued after 1992. Lloyd's requires members to contribute to the Lloyd's Central Fund, normally in the form of an annual contribution, although a special contribution may be levied. The Council of Lloyd's has discretion to call up to 3% of underwriting capacity in any one year.
Policies issued before 1993 have been reinsured by Equitas Insurance Limited ("Equitas"), an independent insurance company authorized by the Financial Services Authority, the predecessor to the PRA and the FCA. However, if Equitas were to fail or otherwise
15
be unable to meet all of its obligations, Lloyd's may take the v iew that it is appropriate to apply the Lloyd's Central Fund to discharge those liabilities Equitas failed to meet. In that case, the Council of Lloyd's may resolve to impose a special or additional levy on the existing members, including Lloyd's corporat e members, to satisfy those liabilities.
Additionally, Lloyd's insurance and reinsurance business is subject to local regulation, and regulators in the United States require Lloyd's to maintain certain minimum deposits in trust funds as protection for policyholders in the United States. These deposits may be used to cover liabilities in the event of a major claim arising in the United States and Lloyd's may require our Company to satisfy cash calls to meet claims payment obligations and maintain minimum trust fund amounts.
Any premium levy or cash call would increase the expenses of Navigators Corporate Underwriters, Ltd. ("NCUL"), the corporate member, without providing compensating revenues, and could have a material adverse effect on our results.
Our Company believes that in the event that Lloyd's rating is downgraded, the downgrade could have a material adverse effect on our ability to underwrite business through Lloyd's and on our financial condition or results of operations.
The market price of our Parent Company common stock may be volatile.
There has been significant volatility in the market for equity securities. The price of our Parent Company common stock may not remain at or exceed current levels. In addition to the other risk factors detailed herein, the following factors may have an adverse impact on the market price of our Parent Company common stock:
| • | Actual or anticipated variations in the quarterly results of operations, including the result of catastrophes; |
| • | Changes in market valuations of companies in the insurance and reinsurance industry; |
| • | Changes in expectations of future financial performance or changes in estimates of securities analysts; |
| • | Issuances of common shares or other securities in the future; |
| • | A downgrade in the credit ratings; |
| • | The addition or departure of key personnel; and |
| • | Announcements by our Company or our competitors of acquisitions, investments or strategic alliances. |
Stock markets in the United States often experience price and volume fluctuations. Market fluctuations, as well as general political and economic conditions such as a recession or interest rate or currency rate fluctuations, could adversely affect the market price of our Parent Company common stock.
There is a risk that our Company may be directly or indirectly exposed to recent uncertainties with regard to European sovereign debt holdings.
Our Company is protected by various treaty and facultative reinsurance agreements. Our exposure to credit risk from any one reinsurer is managed through diversification by reinsuring with a number of different reinsurers, principally in the United States and European reinsurance markets. Consequently, our Company may be indirectly exposed to recent uncertainties with regard to European sovereign debt holdings through certain of our reinsurers. Refer to Note 6, Ceded Reinsurance, in the Notes to Consolidated Financial Statements for a table of the 10 largest reinsurers by the amount of reinsurance recoverable for ceded losses and LAE and ceded unearned premium along with their rating from two rating agencies.
In addition, our Company invests in non-sovereign fixed maturities where the issuer is located in the Euro Area, an economic and monetary union of certain member states within the European Union that have adopted the Euro as their common currency. As of December 31, 2016, the fair value of such securities was $106.6 million, with an amortized cost of $106.8 million, representing 3.6% of our total fixed maturities and equity portfolio. Of this amount, approximately 26.3% represent securities issued by financial institutions domiciled or operating in the Euro area. Our largest exposure is the Netherlands with a total of $39.1 million followed by France with a total of $31.3 million. Globally our Company has no direct exposure to Greece, Portugal, Italy or Spain within the Euro area as of December 31, 2016.
Nonetheless, the failure of the European Union member states to successfully resolve a fiscal or political crisis could result in the devaluation of the Euro, the abandonment of the Euro by one or more members of the European Union or the dissolution of the European Union and it is impossible to predict all of the consequences that this could have on the global economy in general or more
16
specifically on our business. Any or all of these events could have a material adverse ef fect on the results of operations, liquidity and financial condition of our Company.
Our businesses are heavily regulated, and changes in regulation may reduce our profitability and limit growth.
NIC and NSIC are subject to extensive regulation and supervision in the jurisdictions in which we conduct business. This regulation is generally designed to protect the interests of policyholders, as opposed to insurers and their stockholders and other investors, and relates to authorization for lines of business, capital and surplus requirements, investment limitations, underwriting limitations, transactions with affiliates, dividend limitations, changes in control, premium rates and a variety of other financial and non-financial components of an insurance company's business.
Virtually all states require insurers licensed to do business in that state to bear a portion of the loss suffered by some insureds as the result of impaired or insolvent insurance companies through the operation of guaranty funds. The effect of these arrangements could reduce our profitability in any given period or limit our ability to grow our business.
In recent years, the state insurance regulatory framework has come under increased federal scrutiny, and some state legislatures have considered or enacted laws that may alter or increase state authority to regulate insurance companies and insurance holding companies. Further, the NAIC and state insurance regulators are re-examining existing laws and regulations, specifically focusing on modifications to holding company regulations, interpretations of existing laws and the development of new laws. Additionally, the Dodd-Frank Wall Street Reform and Consumer Protection Act, which became effective on July 21, 2010, established a Federal Insurance Office to, among other responsibilities; identify issues or gaps in the regulation of insurers that could contribute to a systemic crisis in the insurance industry or the United States financial system. Any proposed or future legislation or NAIC initiatives may be more restrictive than current regulatory requirements or may result in higher costs.
In response to the September 11, 2001 terrorist attacks, the United States Congress has enacted legislation designed to ensure, among other things, the availability of insurance coverage for terrorist acts, including the requirement that insurers provide such coverage in certain circumstances. Refer to Business – Regulation – United States included herein for a discussion of the TRIA, TRIEA and TRIPRA legislation.
In addition, as a result of the 2016 U.S. presidential election, a number of new legislative and fiscal initiatives may be introduced. Any of those initiatives could cause changes in U.S. social, political, regulatory and economic conditions or in laws and policies governing foreign trade, development and investment in the countries where the Company currently operates, which could adversely affect our business.
Our subsidiaries are subject to the laws and regulations of each country in which they operate, with some jurisdictions imposing comprehensive regulatory requirements and others imposing fewer requirements. Our business in the U.K. is also heavily regulated and must comply with the requirements of the PRA, FCA, Lloyd's and those imposed upon the Lloyd's market by overseas regulators where the Syndicate conducts business. Refer to Business – Regulation – United Kingdom included herein for a discussion of regulations in that jurisdiction.
The E.U. Directive on Solvency II may affect how our Company manages our business, subject our Company to higher capital requirements and cause us to incur additional costs to conduct our business in the E.U. (including the U.K.).
An E.U. directive covering the capital adequacy, risk management and regulatory reporting for insurers, known as Solvency II, was adopted by the European Parliament in April 2009 and became effective on January 1, 2016. Solvency II has introduced a new system of regulation for insurers operating in the E.U. (including the United Kingdom) and presented a number of risks to us. Over the last few years, our Company has undertaken a significant amount of work to ensure that it meets the requirements for all of the affected entities. There is a risk that if the Solvency II requirements are not met and maintained on an on-going basis, the regulator may increase the capital requirements for the U.K. Branch of NIC, NIIC and the Syndicate. These new regulations have the potential to adversely affect the profitability of NIC, NIIC, NUAL and the Syndicate, and restrict their ability to carry on their businesses as currently conducted.
The inability of our subsidiaries to pay dividends to our Parent Company in sufficient amounts would harm our ability to meet obligations.
Our Parent Company is a holding company and relies primarily on dividends from our subsidiaries to meet our obligations for payment of interest and principal on outstanding debt obligations and corporate expenses. The ability of our insurance subsidiaries to pay dividends to our Parent Company in the future will depend on their statutory surplus, on earnings and on regulatory restrictions. For a discussion of our insurance subsidiaries' current dividend-paying ability, please refer to Management's Discussion and Analysis
17
of Finan cial Condition and Results of Operations – Capital Resources , included herein. Our Parent Company, as an insurance holding company, and our insurance subsidiaries are subject to regulation by some states. Such regulation generally provides that transacti ons between companies within the consolidated group must be fair and equitable. Transfers of assets among affiliated companies, certain dividend payments from underwriting subsidiaries and certain material transactions between companies within the consoli dated group may be subject to prior notice to, or prior approval by, state regulatory authorities. Our insurance subsidiaries are also subject to licensing and supervision by government regulatory agencies in the jurisdictions in which we do business. Th ese regulations may set standards of solvency that must be met and maintained, such as the nature of and limitations on investments, the nature of and limitations on dividends to policyholders and stockholders and the nature and extent of required particip ation in insurance guaranty funds. These regulations may affect our subsidiaries' ability to provide our Parent Company with dividends.
The determination of the impairments taken on our investments is subjective and could materially impact our financial position or results of operations.
The determination of the impairments taken on our investments varies by investment type and is based upon the periodic evaluation and assessment of known and inherent risks associated with the respective asset class. Such evaluations and assessments are revised as conditions change and new information becomes available. Management updates our evaluations regularly and reflects impairments in operations as such evaluations are revised. Our Company cannot be certain that we have accurately assessed the level of impairments taken in our financial statements. Furthermore, additional impairments may need to be taken in the future, which could materially impact our financial position or results of operations. Historical trends may not be indicative of future impairments.
Compliance with the legal and regulatory requirements to which we are subject is evolving and unpredictable. In addition, compliance with new sanctions and embargo laws could have a material adverse effect on our business.
All of our business written is required to comply with a wide variety of laws and regulations, including economic sanctions and embargo laws and regulations, applicable to insurance or reinsurance companies, both in the jurisdictions in which the business is organized and where the business sells their insurance and reinsurance products, and that implicate the conduct of insureds. The insurance industry, in particular as it relates to international insurance and reinsurance companies, has become subject to increased scrutiny in many jurisdictions, including the United States, various states within the United States, the E.U., and various countries within the E.U., and the United Kingdom.
Increased regulatory focus on our Company may result in costly compliance burdens and/or may otherwise increase costs, which could materially and adversely impact our financial performance. The introduction of new or expanded economic sanctions applicable to marine insurance could also force our Company to exit certain geographic areas or product lines, which could have an adverse impact on our profitability.
Although our Company intends to maintain compliance with all applicable sanctions and embargo laws and regulations, and have established protocols, policies and procedures reasonably tailored to ensure compliance with all applicable embargo laws and regulations, there can be no assurance that our Company will be in compliance in the future, particularly as the scope of certain laws may be unclear and may be subject to changing interpretations. Any such violation could result in fines, penalties or other sanctions that could severely impact our ability to access U.S. capital markets and conduct our business, and could result in some investors deciding, or being required, to divest their interest, or not to invest, in our Company. In addition, certain institutional investors may have investment policies or restrictions that prevent them from holding securities of companies that have contracts with countries identified by the U.S. government as state sponsors of terrorism. The determination by these investors not to invest in, or to divest from, investing in the common stock of our Company may adversely affect the price at which our common stock trades.
Moreover, our non-U.S. subsidiaries, such as NUAL and NIIC, may be subject to different sanctions and embargo laws and regulations. The reputation and the market for the securities of our Company may be adversely affected if any such subsidiary engages in certain activities, even though such activities are lawful under applicable sanctions and embargo laws and regulations.
Our Company could be adversely affected if we do not maintain effective operating procedures and controls.
Our Company engages in a large number of complex insurance and investment activities on a daily basis. We continually work to enhance our operating procedures and internal controls to effectively support our business and ensure that we are able to assess and monitor operational risks that can result from, among other things, errors, failure to document transactions properly or to obtain proper internal authorization, failure to comply with regulatory requirements, information technology failures, external events or fraud. However, a control system , no matter how well designed and operated, has inherent limitations and can provide only reasonable assurance that the control system's objectives will be met. If our operating procedures and controls are not effective or if we
18
experience difficulties in their implementation, it could lead to financial loss, unanticipated risk exposure (including underwriting, credit and investment risk) or damage to our Company's reputation.
Our Company may be unable to attract and retain qualified employees.
Our Company depends on the ability to attract and retain qualified executive officers, experienced underwriters, claims professionals and other skilled employees who are knowledgeable about our Company's lines of business. If the quality of our executive officers, underwriting or claims team and other personnel decreases, our Company may be unable to maintain the current competitive position in the specialty markets in which our Company operates and be unable to expand our operations into new specialty markets.
If our Company experiences difficulties with the efficient functioning of information technology and telecommunications systems, the ability to conduct our business might be adversely affected.
Our Company relies heavily on the successful, uninterrupted functioning of our information technology ("IT") and telecommunications systems. Our business and continued expansion is highly dependent upon the ability to perform, in an efficient and uninterrupted fashion, necessary business functions, such as pricing, quoting and processing policies, paying claims, performing actuarial and other modeling functions. A failure of our IT and telecommunication systems or the termination of third-party software licenses our Company relies on in order to maintain such systems could materially impact our ability to write and process business, provide customer service, pay claims in a timely manner or perform other necessary actuarial, legal, financial and other business functions. If our Company does not maintain adequate IT and telecommunications systems, we could experience adverse consequences, including inadequate information on which to base critical decisions, the loss of existing customers, difficulty in attracting new customers, litigation exposures, damage to business reputation and increased administrative expenses. As a result, our Company could experience financial losses and the ability of our Company to conduct business might be adversely affected.
Our Company is dependent upon the security of our information technology systems, and a breach of the security of such systems could result in an impairment of our ability to conduct business effectively.
Our Company retains confidential and proprietary information on our IT systems and relies on sophisticated technologies to maintain the security of that information. While, to date, our Company has not experienced a material breach of cybersecurity, any administrative and technical controls and other preventive actions we take to reduce the risk of cyber-incidents and protect our IT systems may be insufficient to prevent physical and electronic break-ins, cyber-attacks or other security breaches to our IT systems. The failure to maintain the security, confidentiality or privacy of sensitive data could harm our Company's reputation, subject us to legal claims, lead to a loss of customers and revenues and otherwise adversely affect our business and financial results. While our Company maintains cyber liability insurance that provides both third-party liability and first party liability coverages, our insurance may not be sufficient to protect us against all losses.
The withdrawal of the U.K. from the E.U. could have a material adverse effect on our business, business opportunities, results of operations, financial condition and cash flows.
Following the referendum vote that took place in June 2016 in favor of leaving the European Union, the U.K. government is expected to trigger the relevant withdrawal provision of the E.U. Treaty as early as the end of the first quarter of 2017 with formal negotiations on the terms of the U.K.'s withdrawal from the E.U. commencing shortly thereafter. Our international operations are based in the U.K., and we have offices in the E.U. Our U.K. operations are able to conduct business throughout the E.U. as a result of the U.K.'s membership in the E.U. Continuing access to the E.U. market will depend on general trade and services agreements made by the U.K. with the E.U. either during a transitional period or permanently or on specific arrangements made by our U.K. entities and Lloyd's itself to retain access to the E.U. market. The consequence of making such specific arrangements may include an increase in our cost of doing business. In addition, the overall U.K. withdrawal could, among other outcomes, cause significant volatility in global stock markets, currency exchange rate fluctuations and asset valuations, and disrupt the U.K. market and the E.U. markets in which we operate, by increasing restrictions on the trade and free movement of goods, services and people between the U.K. and the E.U. The withdrawal could also lead to legal uncertainty and potentially divergent national laws and regulations as the U.K. determines which E.U. laws to replace or replicate. The consequences of a withdrawal in the long term are unknown and not quantifiable at this time. However, given the lack of comparable precedent, any of these effects of a withdrawal, among others, could materially adversely affect our business, business opportunities, results of operations, financial condition and cash flows.
19
The payment of dividends is at the discretion of our Board of Directors, and the reduction or elimination of dividends could cause a decline in the price of our common stock.
We are not obligated to pay dividends on our Common stock. Any determinations by the Board of Directors to declare and pay cash dividends on our Company's Common stock will be based primarily upon our Company's financial condition, results of operations, business requirements, regulatory and legal constraints and any other factors the Board of Directors deems relevant. Several of these factors will be subject to general economic, financial, competitive, legislative and regulatory factors beyond our Company's control. Any reduction or elimination of dividends could cause our Company's stock price to decline.
Investment in new insurance ventures or acquisitions may not be successful and presents risks not originally contemplated.
Our Company has invested, and in the future may invest, in new insurance ventures or acquisitions. We cannot assure you that we will be able to identify suitable insurance ventures or acquisition targets, that such transactions will be financed and completed on acceptable terms or that our future insurance ventures or acquisitions will be successful. Even if we do find suitable targets, such endeavors may involve significant risks and uncertainties, including distraction of management from current operations, greater than expected liabilities and expenses, inadequate return of capital, failure to properly integrate operations and retain employees and unidentified issues not discovered in our Company's due diligence.
ITEM 1B. UNRESOLVED STAFF COMMENTS
None
ITEM 2. PROPERTIES
Our executive and administrative office is located at 400 Atlantic Street, Stamford, CT. The lease for this space expires in October 2023. We operate in various locations with non-cancelable operating leases including:
| • | U.S. |
| • | Alpharetta, GA, |
| • | Boston, MA, |
| • | Chicago, IL, |
| • | Coral Gables, FL, |
| • | Danbury, CT, |
| • | Ellicott City, MD, |
| • | Farmington, CT, |
| • | Houston, TX, |
| • | Irvine, CA, |
| • | Iselin, NJ, |
| • | Los Angeles, CA, |
| • | Minneapolis, MN, |
| • | New York City, NY, |
| • | Philadelphia, PA, |
| • | Pittsburgh, PA, |
| • | San Francisco, CA, |
| • | Schaumburg, IL, |
20
| • | Seattle, WA, |
| • | Stamford, CT and |
| • | Tampa, FL. |
| • | International |
| • | Antwerp, Belgium, |
| • | Copenhagen, Denmark, |
| • | Hong Kong (1) |
| • | London, England, |
| • | Milan, Italy, |
| • | Paris, France, |
| • | Rotterdam, The Netherlands, |
| • | Stockholm, Sweden and |
| • | Zurich, Switzerland (1) . |
(1) - Office leases are in force at December 21, 2016, however, service operations will not commence until 2017.
ITEM 3. LEGAL PROCEEDINGS
In the ordinary course of conducting business, our subsidiaries are involved in various legal proceedings, either indirectly as insurers for parties or directly as defendants. Most of the these proceedings consist of claims litigation involving our subsidiaries as either (a) liability insurers defending or providing indemnity for third party claims brought against insureds or (b) insurers defending first party coverage claims brought against us. Our Company accounts for such activity through the establishment of unpaid losses and LAE reserves. Our Company's management believes that our ultimate liability, if any, with respect to such ordinary-course claims litigation, after consideration of provisions made for potential losses and cost of defense, will not be material to the consolidated financial condition, results of operations, or cash flows of our Company.
Our subsidiaries are also occasionally involved with other legal actions, some of which assert claims for substantial amounts. These actions include claims asserting extra contractual obligations, such as claims involving allegations of bad faith in the handling of claims or the underwriting of policies. In general, our Company believes we have valid defenses to these cases. Our Company's management expects that the ultimate liability, if any, with respect to such extra-contractual matters will not be material to our consolidated financial position. Nonetheless, given the large or indeterminate amounts sought in certain of these matters, and the inherent unpredictability of litigation, an adverse outcome in such matters could, from time to time, have a material adverse outcome on our consolidated results of operations or cash flows in a particular fiscal quarter or year.
ITEM 4. MINE SAFETY DISCLOSURES
Not applicable
PART II
ITEM 5. MARKET FOR REGISTRANT'S COMMON EQUITY, RELATED STOCKHOLDER MATTERS AND ISSUE PURCHASES OF EQUITY SECURITIES
Market Information
Our Parent Company's common stock is traded over-the-counter on NASDAQ under the symbol NAVG. Over-the-counter market quotations reflect inter-dealer prices, without retail mark-up, mark-down or commissions and may not necessarily represent actual transactions.
The following table reflects the high, low and closing trade prices as reported during the four quarters of 2016 and 2015, without retroactive effect of the stock split:
21
|
| 2016 |
|
| 2015 |
| ||||||||||||||||||
|
| High |
|
| Low |
|
| Close |
|
| High |
|
| Low |
|
| Close |
| ||||||
First Quarter |
| $ | 87.61 |
|
| $ | 79.56 |
|
| $ | 83.87 |
|
| $ | 79.06 |
|
| $ | 68.39 |
|
| $ | 77.84 |
|
Second Quarter |
|
| 94.91 |
|
|
| 81.07 |
|
|
| 91.97 |
|
|
| 79.61 |
|
|
| 76.69 |
|
|
| 77.56 |
|
Third Quarter |
|
| 97.63 |
|
|
| 87.97 |
|
|
| 96.92 |
|
|
| 79.60 |
|
|
| 74.00 |
|
|
| 77.98 |
|
Fourth Quarter |
|
| 118.20 |
|
|
| 91.65 |
|
|
| 117.75 |
|
|
| 88.28 |
|
|
| 77.72 |
|
|
| 85.79 |
|
On December 6, 2016, our Board of Directors declared a two-for-one stock split of The Navigators Group, Inc. Common stock, to be effected in the form of a stock dividend. Stockholders of record at the close of business on December 30, 2016 received one additional share of Common stock for every share of Common stock held. The additional shares of Common stock were issued on January 20, 2017.
The following table reflects the high, low and closing trade prices with retroactive effect of the stock split for the four quarters of 2016 and 2015:
|
| 2016 |
|
| 2015 |
| ||||||||||||||||||
|
| High |
|
| Low |
|
| Close |
|
| High |
|
| Low |
|
| Close |
| ||||||
First Quarter |
| $ | 43.81 |
|
| $ | 39.78 |
|
| $ | 41.94 |
|
| $ | 39.53 |
|
| $ | 34.20 |
|
| $ | 38.92 |
|
Second Quarter |
|
| 47.46 |
|
|
| 40.54 |
|
|
| 45.99 |
|
|
| 39.81 |
|
|
| 38.35 |
|
|
| 38.78 |
|
Third Quarter |
|
| 48.82 |
|
|
| 43.99 |
|
|
| 48.46 |
|
|
| 39.80 |
|
|
| 37.00 |
|
|
| 38.99 |
|
Fourth Quarter |
|
| 59.10 |
|
|
| 45.83 |
|
|
| 58.88 |
|
|
| 44.14 |
|
|
| 38.86 |
|
|
| 42.90 |
|
Information provided to our Company by the transfer agent and proxy solicitor indicates that there are approximately 377 holders of record as of January 20, 2017 and 4,989 beneficial holders of our common stock, as of February 1, 2017.
Five Year Stock Performance Graph
The Five Year Stock Performance Graph and related Cumulative Indexed Returns table, as presented below, reflects the cumulative return on our Company's common stock, the Standard & Poor's 500 Index ("S&P 500 Index") and the S&P Property and Casualty Insurance Index (the "Insurance Index") assuming an original investment in each of $100 on December 31, 2011 (the "Base Period") and reinvestment of dividends to the extent declared. Cumulative returns for each year subsequent to 2011 are measured as a change from this Base Period.
22
The comparison of five year cumulative returns among our Company, the companies listed in the S&P 500 Index and t he Insurance Index are as follows:
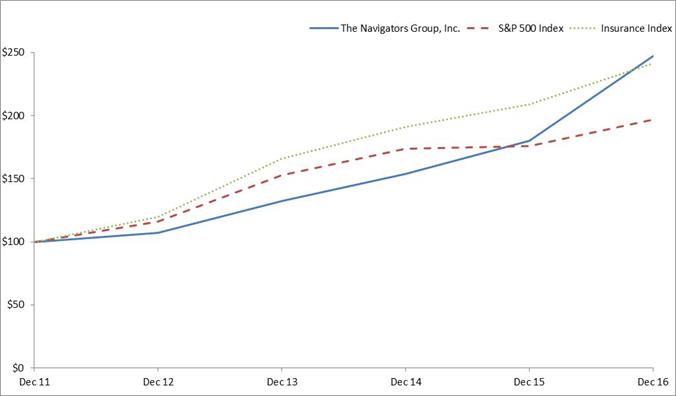
|
| Cumulative Indexed Returns |
| ||||||||||||||||
|
| Years Ended December 31, |
| ||||||||||||||||
|
| Base Period |
|
|
|
|
|
|
|
|
|
|
|
|
|
|
|
| |
Company / Index |
| 2011 |
| 2012 |
| 2013 |
| 2014 |
| 2015 |
| 2016 |
| ||||||
The Navigators Group, Inc. |
|
| 100.00 |
|
| 107.11 |
|
| 132.47 |
|
| 153.82 |
|
| 179.93 |
|
| 247.53 |
|
S&P 500 Index |
|
| 100.00 |
|
| 115.88 |
|
| 153.01 |
|
| 173.69 |
|
| 176.07 |
|
| 196.78 |
|
Insurance Index |
|
| 100.00 |
|
| 120.00 |
|
| 165.76 |
|
| 191.30 |
|
| 209.15 |
|
| 241.56 |
|
Dividends
On July 15, September 30, and December 29, 2016, our Company paid dividends of $0.09 per share to stockholders of record of our Company's common stock as of June 20, August 19, and November 18, 2016, respectively.
The declaration and amount of any future dividend will be at the discretion of the Board of Directors, and will depend upon many factors, including financial condition, results of operations, business requirements, regulatory and legal constraints and any other factors the Board of Directors deems relevant.
Refer to Note 10, Stockholders' Equity, in the Notes to Consolidated Financial Statements for additional information regarding dividends, including dividend restrictions and net assets available for dividend distribution.
Recent Sales of Unregistered Securities
None
Use of Proceeds from Public Offering of Debt Securities
None
23
Purchases of Equity Securities by the Issuer
None
ITEM 6. SELECTED FINANCIAL DATA
The following table sets forth selected consolidated financial data including consolidated financial information of our Company for each of the last five calendar years, derived from our Company's audited Consolidated Financial Statements. The table should be read in conjunction with Item 7, Management's Discussion and Analysis of Financial Condition and Results of Operations, and Item 8, Financial Statements and Supplementary Data, included herein.
|
| Years Ended December 31, |
| |||||||||||||||||
in thousands, except share and per share amounts |
| 2016 |
|
| 2015 |
|
| 2014 |
|
| 2013 |
|
| 2012 |
| |||||
Operating information: |
|
|
|
|
|
|
|
|
|
|
|
|
|
|
|
|
|
|
|
|
Gross written premiums |
| $ | 1,568,911 |
|
| $ | 1,453,502 |
|
| $ | 1,432,353 |
|
| $ | 1,370,517 |
|
| $ | 1,286,465 |
|
Revenues: |
|
|
|
|
|
|
|
|
|
|
|
|
|
|
|
|
|
|
|
|
Net earned premiums |
| $ | 1,100,345 |
|
| $ | 984,087 |
|
| $ | 935,895 |
|
| $ | 841,939 |
|
| $ | 781,964 |
|
Net investment income |
|
| 79,451 |
|
|
| 68,718 |
|
|
| 64,168 |
|
|
| 56,251 |
|
|
| 54,248 |
|
Net other-than-temporary impairment losses recognized in earnings |
|
| (150 | ) |
|
| (1,698 | ) |
|
| - |
|
|
| (2,393 | ) |
|
| (858 | ) |
Net realized gains (losses) |
|
| 9,186 |
|
|
| 8,373 |
|
|
| 12,812 |
|
|
| 22,939 |
|
|
| 41,074 |
|
Other income (loss) |
|
| 8,701 |
|
|
| (491 | ) |
|
| 10,656 |
|
|
| (1,172 | ) |
|
| 1,488 |
|
Total revenues |
| $ | 1,197,533 |
|
| $ | 1,058,989 |
|
| $ | 1,023,531 |
|
| $ | 917,564 |
|
| $ | 877,916 |
|
Expenses: |
|
|
|
|
|
|
|
|
|
|
|
|
|
|
|
|
|
|
|
|
Net losses and loss adjustment expenses |
| $ | 665,448 |
|
| $ | 572,598 |
|
| $ | 545,229 |
|
| $ | 518,961 |
|
| $ | 497,433 |
|
Commission expenses |
|
| 165,045 |
|
|
| 129,977 |
|
|
| 125,528 |
|
|
| 113,494 |
|
|
| 121,470 |
|
Other operating expenses |
|
| 234,096 |
|
|
| 223,516 |
|
|
| 196,825 |
|
|
| 164,434 |
|
|
| 159,079 |
|
Call premium on Senior notes |
|
| - |
|
|
| - |
|
|
| - |
|
|
| 17,895 |
|
|
| - |
|
Interest expense |
|
| 15,435 |
|
|
| 15,424 |
|
|
| 15,413 |
|
|
| 10,507 |
|
|
| 8,198 |
|
Total expenses |
| $ | 1,080,024 |
|
| $ | 941,515 |
|
| $ | 882,995 |
|
| $ | 825,291 |
|
| $ | 786,180 |
|
Income (loss) before income taxes |
|
| 117,509 |
|
|
| 117,474 |
|
|
| 140,536 |
|
|
| 92,273 |
|
|
| 91,736 |
|
Income tax expense (benefit) |
|
| 34,783 |
|
|
| 36,417 |
|
|
| 45,207 |
|
|
| 28,807 |
|
|
| 27,974 |
|
Net income (loss) |
| $ | 82,726 |
|
| $ | 81,057 |
|
| $ | 95,329 |
|
| $ | 63,466 |
|
| $ | 63,762 |
|
Net income per share: (1) |
|
|
|
|
|
|
|
|
|
|
|
|
|
|
|
|
|
|
|
|
Basic |
| $ | 2.85 |
|
| $ | 2.82 |
|
| $ | 3.34 |
|
| $ | 2.25 |
|
| $ | 2.27 |
|
Diluted |
| $ | 2.75 |
|
| $ | 2.73 |
|
| $ | 3.25 |
|
| $ | 2.21 |
|
| $ | 2.23 |
|
Average common shares outstanding: |
|
|
|
|
|
|
|
|
|
|
|
|
|
|
|
|
|
|
|
|
Basic |
|
| 29,073,803 |
|
|
| 28,785,044 |
|
|
| 28,519,536 |
|
|
| 28,267,851 |
|
|
| 28,104,623 |
|
Diluted |
|
| 30,031,609 |
|
|
| 29,651,490 |
|
|
| 29,292,738 |
|
|
| 28,691,106 |
|
|
| 28,655,640 |
|
Combined loss and expense ratio (2) : |
|
|
|
|
|
|
|
|
|
|
|
|
|
|
|
|
|
|
|
|
Loss ratio |
|
| 60.5 | % |
|
| 58.2 | % |
|
| 58.3 | % |
|
| 61.6 | % |
|
| 63.6 | % |
Expense ratio |
|
| 36.2 | % |
|
| 35.9 | % |
|
| 34.3 | % |
|
| 33.2 | % |
|
| 35.7 | % |
Total |
|
| 96.7 | % |
|
| 94.1 | % |
|
| 92.6 | % |
|
| 94.8 | % |
|
| 99.3 | % |
|
|
|
|
|
|
|
|
|
|
|
|
|
|
|
|
|
|
|
|
|
Balance sheet information: |
|
|
|
|
|
|
|
|
|
|
|
|
|
|
|
|
|
|
|
|
Total investments |
| $ | 3,130,523 |
|
| $ | 2,937,226 |
|
| $ | 2,729,735 |
|
| $ | 2,488,077 |
|
| $ | 2,376,918 |
|
Total assets |
|
| 4,814,037 |
|
|
| 4,584,012 |
|
|
| 4,476,185 |
|
|
| 4,169,452 |
|
|
| 4,007,670 |
|
Gross losses and LAE reserves |
|
| 2,289,727 |
|
|
| 2,202,644 |
|
|
| 2,159,634 |
|
|
| 2,045,071 |
|
|
| 2,097,048 |
|
Net losses and LAE reserves |
|
| 1,510,451 |
|
|
| 1,393,126 |
|
|
| 1,308,136 |
|
|
| 1,222,633 |
|
|
| 1,216,909 |
|
Senior notes |
|
| 263,728 |
|
|
| 263,580 |
|
|
| 263,440 |
|
|
| 263,308 |
|
|
| 114,424 |
|
Stockholders' equity |
|
| 1,178,188 |
|
|
| 1,096,148 |
|
|
| 1,027,224 |
|
|
| 902,212 |
|
|
| 879,485 |
|
Common shares outstanding |
|
| 29,124,139 |
|
|
| 28,861,778 |
|
|
| 28,562,932 |
|
|
| 28,396,992 |
|
|
| 28,093,332 |
|
Book value per share (3) |
| $ | 40.45 |
|
| $ | 37.98 |
|
| $ | 35.96 |
|
| $ | 31.77 |
|
| $ | 31.31 |
|
(1) - We completed a two-for-one stock split on January 20, 2017. All share and per share data has been retroactively restated on a post-split basis.
(2) - Calculated based on earned premiums.
(3) - Calculated as stockholders' equity divided by actual shares outstanding as of the date indicated .
24
Item 7. MANAGEMENT'S DISCUSSION AND ANALYSIS OF FINANCIAL CONDITION AND RESULTS OF OPERATIONS
U.S. GAAP and Non-GAAP Financial Performance Metrics
Throughout this Annual Report, we present our operations in the way we believe will be most meaningful, useful and transparent to anyone using this financial information to evaluate our performance. In addition to the GAAP presentation of Net income, we show certain non-GAAP financial measures that we believe are valuable in managing our business and drawing comparisons to our peers. These measures are Underwriting profit (loss), Combined ratio, Net operating earnings, Net losses and LAE reserves and Book value and Book value per share.
The following is a list of GAAP and non-GAAP measures found throughout this report with their definitions, relationships to GAAP measures and explanations of their importance to our operations:
Underwriting Profit (Loss)
Underwriting profit (loss) represents one measure of the pretax profitability of our insurance operations and is derived by subtracting Net losses and LAE, Commission expenses, Other operating expenses and Other underwriting income (expense) from Net earned premiums. This information is available in total and by segment in Note 2 – Segment Information in the Notes to Consolidated Financial Statements. The nearest comparable GAAP measure is Income before income taxes which, in addition to Underwriting profit (loss), includes Net investment income, Other than temporary impairment ("OTTI") loss, Net realized gains (losses) on investments, Interest expense and Other income (loss).
Combined Ratio
The Combined ratio is a common insurance industry measure of profitability for any underwriting operation and is calculated in two components. First, the loss ratio is Net losses and LAE divided by Net earned premiums. The second component, the expense ratio, reflects the sum of Commission expenses, insurance operating expenses and Other underwriting income (expense), divided by Net earned premiums. All items included in these components of the Combined ratio are presented in our GAAP Consolidated Financial Statements. The sum of the loss and expense ratios is the Combined ratio. The difference between the Combined ratio and 100 percent reflects the rate of Underwriting profit (loss). For example, a Combined ratio of 85 percent implies that for every $100 of premium we earn, we record $15 of Underwriting profit.
Net Operating Earnings
Net operating earnings is calculated as Net income before after-tax Net realized gains (losses), after-tax OTTI losses recognized in earnings, and after-tax net realized and unrealized foreign exchange gains (losses) resulting from foreign currency transactions (transactions denominated in a currency other than the entity's functional currency) and translation adjustments (translation of foreign currency denominated assets and liabilities into U.S. Dollars ("USD").
Reserve for losses and LAE
Reserve for losses and LAE, as shown in the liabilities section of our Consolidated Balance Sheets, represents the total obligations to claimants for both estimates of known claims and estimates for IBNR claims. The related asset item, Reinsurance balances recoverable on unpaid losses and LAE, is the estimate of both known claims and IBNR that we expect to recover from reinsurers. The net of these two items is generally referred to as Net losses and LAE reserves and is commonly used in our disclosures regarding the process of establishing these various estimated amounts.
Book Value and Book Value Per Share
Book value is equivalent to Stockholders' equity and book value per share is calculated by dividing Stockholders' equity by the number of outstanding shares at the end of the interim period.
Overview
The discussion and analysis of our financial condition and results of operations contained herein should be read in conjunction with our consolidated financial statements and accompanying notes which appear elsewhere in this Form 10-K. It contains forward-
25
looking statements that involve risks and uncertainties. Please refer to Forward-Looking Statements and Risk Factors for more information. Our results could differ materially from thos e anticipated in these forward-looking statements as a result of various factors, including those described below and elsewhere in this Form 10-K.
Unless the context requires otherwise, the terms "we," "us," "our," or "our Company" are used to mean The Navigators Group, Inc., a Delaware holding company established in 1982, and its subsidiaries. The term "Parent Company" is used to mean The Navigators Group, Inc. without our subsidiaries.
On December 6, 2016, our Board of Directors declared a two-for-one stock split of The Navigators Group, Inc. Common stock, to be effected in the form of a stock dividend. Stockholders of record at the close of business on December 30, 2016 received one additional share of Common stock for every share of Common stock held. The additional shares of Common stock were issued on January 20, 2017. All disclosures of shares and per share data have been retroactively adjusted to reflect the stock split for all periods presented .
We are an international insurance company with a long-standing area of specialization in Marine insurance. Our P&C insurance business primarily offers General Liability coverage and Umbrella & Excess Liability coverage to commercial enterprises through our Primary and Excess Casualty divisions. We have also developed niches in Professional Liability insurance, through our D&O and E&O divisions. Beginning in 2010, we added reinsurance products through our GlobalRe reporting segment.
In May 2016, our Company received authorization from the PRA and the FCA for a new U.K. based insurance company, NIIC, which is a wholly-owned direct subsidiary of our Parent Company. Our Company has been fully capitalized in compliance with the terms of the authorization from the PRA and has been granted a financial strength rating of "A" by Standard & Poor's. In light of the result of the U.K. referendum held on June 23, 2016 in favor of the U.K. leaving the E.U., the operational and start up plans for NIIC were re-evaluated. It is now anticipated that NIIC will begin writing business in the first quarter of 2017 and through the course of 2017 will write business both in the U.K. and through our European branches. While the precise timing and nature of the U.K's exit from membership of the E.U. remains uncertain, we have developed contingency plans in order to maintain the required regulatory approvals and licenses in the countries of the E.U. in which we wish to do business.
As a result of the U.K. referendum vote in favor of exiting the E.U., for the twelve months ended December 31, 2016, the Great British pound ("GBP") exchange rate experienced a significant decline in value against the USD. As a result, we have recorded realized and unrealized foreign exchange gains in Other income primarily due to a net GBP monetary liability in our foreign, U.S. functional currency subsidiaries. Additionally, we recorded a foreign currency translation loss in accumulated other comprehensive income ("AOCI"), primarily due to our GBP portfolio investments in NIIC, a GBP functional currency subsidiary. These assets are also the principal driver of the foreign exchange effect in our cash accounts.
Financial Highlights - Selected Indicators
|
| Years Ended December 31, |
| |||||||||
amounts in thousands, except per share amounts |
| 2016 |
|
| 2015 |
|
| 2014 |
| |||
Results of operations data: |
|
|
|
|
|
|
|
|
|
|
|
|
Net earned premiums |
| $ | 1,100,345 |
|
| $ | 984,087 |
|
| $ | 935,895 |
|
Net investment income |
|
| 79,451 |
|
|
| 68,718 |
|
|
| 64,168 |
|
Underwriting profit (loss) |
|
| 35,892 |
|
|
| 58,118 |
|
|
| 68,908 |
|
Net income |
|
| 82,726 |
|
|
| 81,057 |
|
|
| 95,329 |
|
Net income per diluted share (1) |
| $ | 2.75 |
|
| $ | 2.73 |
|
| $ | 3.25 |
|
|
| December 31, |
| |||||
amounts in thousands, except per share amounts |
| 2016 |
|
| 2015 |
| ||
Balance sheet data: |
|
|
|
|
|
|
|
|
Total assets |
| $ | 4,814,037 |
|
| $ | 4,584,012 |
|
Total stockholders' equity |
|
| 1,178,188 |
|
|
| 1,096,148 |
|
Book value per share (1) |
| $ | 40.45 |
|
| $ | 37.98 |
|
(1) - We completed a two-for-one stock split on January 20, 2017. All per share data has been retroactively restated on a post-split basis.
Our revenue is primarily comprised of premiums and investment income. Cash flow is generated from premiums collected and investment income received less paid losses and loss expenses, Commission expenses and administrative expenses as well as the timing of reinsurance receipts and payments. Our products are distributed through multiple channels, utilizing global, national and regional retail and wholesale insurance brokers.
26
We report our results of operations consistent with the manner in which our Chief Operating Decision Maker reviews the business to assess performance by our four reportable segments: U.S. Insurance, Int'l Insurance, GlobalRe and Corporate.
Results of Operations
The following table presents a summary of our consolidated financial results for the years ended December 31, 2016, 2015 and 2014:
|
| Years Ended December 31, |
|
| Percentage Change |
| ||||||||||||||
|
|
|
|
|
|
|
|
|
|
|
|
|
| 2016 vs. |
|
| 2015 vs. |
| ||
amounts in thousands, except per share amounts |
| 2016 |
|
| 2015 |
|
| 2014 |
|
| 2015 |
|
| 2014 |
| |||||
Gross written premiums |
| $ | 1,568,911 |
|
| $ | 1,453,502 |
|
| $ | 1,432,353 |
|
|
| 7.9 | % |
|
| 1.5 | % |
Ceded written premiums |
|
| (382,687 | ) |
|
| (409,642 | ) |
|
| (432,215 | ) |
|
| (6.6 | %) |
|
| (5.2 | %) |
Net written premiums |
|
| 1,186,224 |
|
|
| 1,043,860 |
|
|
| 1,000,138 |
|
|
| 13.6 | % |
|
| 4.4 | % |
Net earned premiums |
| $ | 1,100,345 |
|
| $ | 984,087 |
|
| $ | 935,895 |
|
|
| 11.8 | % |
|
| 5.1 | % |
Net losses and LAE |
|
| (665,448 | ) |
|
| (572,598 | ) |
|
| (545,229 | ) |
|
| 16.2 | % |
|
| 5.0 | % |
Commission expenses |
|
| (165,045 | ) |
|
| (129,977 | ) |
|
| (125,528 | ) |
|
| 27.0 | % |
|
| 3.5 | % |
Other operating expenses |
|
| (234,096 | ) |
|
| (223,516 | ) |
|
| (196,825 | ) |
|
| 4.7 | % |
|
| 13.6 | % |
Other underwriting income (expense) |
|
| 136 |
|
|
| 122 |
|
|
| 595 |
|
|
| 11.5 | % |
|
| (79.5 | %) |
Underwriting profit (loss) |
| $ | 35,892 |
|
| $ | 58,118 |
|
| $ | 68,908 |
|
|
| (38.2 | %) |
|
| (15.7 | %) |
Net investment income |
|
| 79,451 |
|
|
| 68,718 |
|
|
| 64,168 |
|
|
| 15.6 | % |
|
| 7.1 | % |
Net realized gains (losses) |
|
| 9,036 |
|
|
| 6,675 |
|
|
| 12,812 |
|
|
| 35.4 | % |
|
| (47.9 | %) |
Interest expense |
|
| (15,435 | ) |
|
| (15,424 | ) |
|
| (15,413 | ) |
|
| 0.1 | % |
|
| 0.1 | % |
Other income (loss) |
|
| 8,565 |
|
|
| (613 | ) |
|
| 10,061 |
|
| NM |
|
| NM |
| ||
Income (loss) before income taxes |
| $ | 117,509 |
|
| $ | 117,474 |
|
| $ | 140,536 |
|
|
| 0.0 | % |
|
| (16.4 | %) |
Income tax (expense) benefit |
|
| (34,783 | ) |
|
| (36,417 | ) |
|
| (45,207 | ) |
|
| (4.5 | %) |
|
| (19.4 | %) |
Net income (loss) |
| $ | 82,726 |
|
| $ | 81,057 |
|
| $ | 95,329 |
|
|
| 2.1 | % |
|
| (15.0 | %) |
|
|
|
|
|
|
|
|
|
|
|
|
|
|
|
|
|
|
|
|
|
Net income per diluted share (1) |
| $ | 2.75 |
|
| $ | 2.73 |
|
| $ | 3.25 |
|
|
|
|
|
|
|
|
|
|
|
|
|
|
|
|
|
|
|
|
|
|
|
|
|
|
|
|
|
|
Effective tax rate |
|
| 29.6 | % |
|
| 31.0 | % |
|
| 32.2 | % |
|
|
|
|
|
|
|
|
|
|
|
|
|
|
|
|
|
|
|
|
|
|
|
|
|
|
|
|
|
Losses and LAE ratio |
|
| 60.5 | % |
|
| 58.2 | % |
|
| 58.3 | % |
|
|
|
|
|
|
|
|
Commission expense ratio |
|
| 15.0 | % |
|
| 13.2 | % |
|
| 13.4 | % |
|
|
|
|
|
|
|
|
Other operating expense ratio (2) |
|
| 21.2 | % |
|
| 22.7 | % |
|
| 20.9 | % |
|
|
|
|
|
|
|
|
Combined ratio |
|
| 96.7 | % |
|
| 94.1 | % |
|
| 92.6 | % |
|
|
|
|
|
|
|
|
(1) - We completed a two-for-one stock split on January 20, 2017. All per share data has been retroactively restated on a post-split basis.
(2) - Includes Other operating expenses and Other underwriting income (expense).
NM - Percentage change not meaningful
27
The following table calculates our net operating earnings for the years ended December 31, 2016, 2015 and 2014:
|
| Years Ended December 31, |
|
|
|
|
|
|
|
|
| |||||||||||||||||||||||||||||||||
|
| 2016 |
|
| 2015 |
|
| 2014 |
|
| Percentage Change |
| ||||||||||||||||||||||||||||||||
amounts in thousands, except per share amounts |
| Pre-Tax |
|
| Tax |
|
| After-Tax |
|
| Pre-Tax |
|
| Tax |
|
| After-Tax |
|
| Pre-Tax |
|
| Tax |
|
| After-Tax |
|
| 2016 vs. 2015 |
|
| 2015 vs. 2014 |
| |||||||||||
Net income |
| $ | 117,509 |
|
| $ | (34,783 | ) |
| $ | 82,726 |
|
| $ | 117,474 |
|
| $ | (36,417 | ) |
| $ | 81,057 |
|
| $ | 140,536 |
|
| $ | (45,207 | ) |
| $ | 95,329 |
|
|
| 2.1 | % |
|
| (15.0 | %) |
Adjustments to Net income: |
|
|
|
|
|
|
|
|
|
|
|
|
|
|
|
|
|
|
|
|
|
|
|
|
|
|
|
|
|
|
|
|
|
|
|
|
|
|
|
|
|
|
|
|
Realized losses (gains) |
|
| (9,036 | ) |
|
| 3,163 |
|
|
| (5,873 | ) |
|
| (6,675 | ) |
|
| 2,336 |
|
|
| (4,339 | ) |
|
| (12,812 | ) |
|
| 4,485 |
|
|
| (8,327 | ) |
|
| 35.4 | % |
|
| (47.9 | %) |
FX losses (gains) |
|
| (8,626 | ) |
|
| 3,019 |
|
|
| (5,607 | ) |
|
| 622 |
|
|
| (218 | ) |
|
| 404 |
|
|
| (10,061 | ) |
|
| 3,527 |
|
|
| (6,534 | ) |
| NM |
|
| NM |
| ||
Net operating earnings |
| $ | 99,847 |
|
| $ | (28,601 | ) |
| $ | 71,246 |
|
| $ | 111,421 |
|
| $ | (34,299 | ) |
| $ | 77,122 |
|
| $ | 117,663 |
|
| $ | (37,195 | ) |
| $ | 80,468 |
|
|
| (7.6 | %) |
|
| (4.2 | %) |
|
|
|
|
|
|
|
|
|
|
|
|
|
|
|
|
|
|
|
|
|
|
|
|
|
|
|
|
|
|
|
|
|
|
|
|
|
|
|
|
|
|
|
|
|
Net operating earnings per common share: (1) |
|
|
|
|
|
|
|
|
|
|
|
|
|
|
|
|
|
|
|
|
|
|
|
|
|
|
|
|
|
|
|
|
|
|
|
|
|
|
|
|
|
|
|
|
Basic |
|
|
|
|
|
|
|
|
| $ | 2.45 |
|
|
|
|
|
|
|
|
|
| $ | 2.68 |
|
|
|
|
|
|
|
|
|
| $ | 2.82 |
|
|
|
|
|
|
|
|
|
Diluted |
|
|
|
|
|
|
|
|
| $ | 2.37 |
|
|
|
|
|
|
|
|
|
| $ | 2.60 |
|
|
|
|
|
|
|
|
|
| $ | 2.75 |
|
|
|
|
|
|
|
|
|
|
|
|
|
|
|
|
|
|
|
|
|
|
|
|
|
|
|
|
|
|
|
|
|
|
|
|
|
|
|
|
|
|
|
|
|
|
|
|
|
|
|
|
|
|
(1) - We completed a two-for-one stock split on January 20, 2017. All per share data has been retroactively restated on a post-split basis
NM - Percentage change not meaningful
Underwriting Profit (Loss)
Underwriting profit was $35.9 million for the year ended December 31, 2016, which decreased by $22.2 million from the same period in 2015, driven by $26.8 million of catastrophic events ("CAT") plus related reinsurance reinstatement premiums ("RRPs") of $1.8 million, $35.7 million of net additional current accident year ("AY") reserve development due to large loss activity in our Int'l Insurance segment, and an increase in Other operating expense as we continue to invest in our European expansion and GlobalRe reporting segment. These items were partially offset by $28.5 million of favorable loss emergence on prior AY's and increased production.
Underwriting profit was $58.1 million for the year ended December 31, 2015, which decreased by $10.8 million from the same period in 2014, mostly driven by Hurricane Joaquin CAT losses, which resulted in a $10.0 million net loss and $4.0 million of related RRPs, partially offset by increased production and favorable loss emergence on prior accident years ("AY"). Additionally, operating expenses increased due to our European expansion.
For additional information on the drivers of Underwriting profit see the U.S. Insurance , Int'l Insurance and GlobalRe reporting segment results sections included herein.
A major component of our Underwriting profit (loss) is due to Net losses and LAE. The following table presents the impact of changes in reserves and RRPs on our Net losses and LAE ratio for the years ended December 31, 2016, 2015, and 2014:
|
| Years Ended December 31, |
| |||||||||
|
| 2016 |
|
| 2015 |
|
| 2014 |
| |||
Net losses and LAE ratio, reported |
|
| 60.5 | % |
|
| 58.2 | % |
|
| 58.3 | % |
RRPs |
|
| -0.1 | % |
|
| 0.0 | % |
|
| -0.3 | % |
Additional net current AY release/(development) |
|
| -5.7 | % |
|
| -4.9 | % |
|
| -2.7 | % |
Net prior AY reserve release/(strengthening) |
|
| 2.6 | % |
|
| 6.6 | % |
|
| 5.9 | % |
Net losses and LAE ratio, adjusted |
|
| 57.3 | % |
|
| 59.9 | % |
|
| 61.2 | % |
For the year ended December 31, 2016, we recorded $28.5 million of net prior AY reserve releases including $25.0 million, $2.2 million and $1.3 million of reserve releases from our Int'l Insurance, GlobalRe and U.S. Insurance reporting segments, respectively, all due to favorable loss emergence. This was offset by $62.5 million of additional net current AY reserve development, of which $26.8 million was due to CAT losses, including $11.7 million related to the Alberta Wildfires, $7.1 million due to Hurricane Matthew, $3.8 million due to the Ecuador earthquake and $3.3 million due to the Taiwan earthquake. Additionally, we incurred $35.7 million of non-CAT net current AY development, mostly due to large losses in our Int'l Insurance Marine and Int'l Insurance P&C operating segments, and $2.0 million of net RRPs primarily related to the CATs noted above.
28
For the year ended December 31, 2015, we recorded $64.7 million of net prior AY reserve releases including $29.3 million, $26. 2 million and $9.1 million of reserve releases from our U.S. Insurance, Int'l Insurance and GlobalRe reporting segments, respectively, all due to favorable loss emergence. This was partially offset by $48.5 million of additional net current AY reserve dev elopment related to large loss activity and $0.6 million of RRPs.
For the year ended December 31, 2014, we recorded $55.8 million of net prior AY reserve releases primarily driven by $38.3 million, $15.4 million and $2.1 million of reserve releases from our Int'l Insurance, U.S. Insurance and GlobalRe reporting segments, respectively, all due to favorable loss emergence. This was partially offset by $16.8 million of additional net current AY reserve development related to large loss activity and $4.4 million of RRPs.
Net Investment Income
Our Net investment income was derived from the following sources:
|
| Years Ended December 31, |
|
| Percentage Change |
| ||||||||||||||
|
|
|
|
|
|
|
|
|
|
|
|
|
| 2016 vs. |
|
| 2015 vs. |
| ||
amounts in thousands |
| 2016 |
|
| 2015 |
|
| 2014 |
|
| 2015 |
|
| 2014 |
| |||||
Fixed maturities |
| $ | 67,772 |
|
| $ | 61,572 |
|
| $ | 57,219 |
|
|
| 10.1 | % |
|
| 7.6 | % |
Equity securities |
|
| 14,271 |
|
|
| 9,813 |
|
|
| 9,036 |
|
|
| 45.4 | % |
|
| 8.6 | % |
Short-term investments |
|
| 727 |
|
|
| 683 |
|
|
| 911 |
|
|
| 6.4 | % |
|
| (25.0 | %) |
Total investment income |
| $ | 82,770 |
|
| $ | 72,068 |
|
| $ | 67,166 |
|
|
| 14.8 | % |
|
| 7.3 | % |
Investment expenses |
|
| (3,319 | ) |
|
| (3,350 | ) |
|
| (2,998 | ) |
|
| (0.9 | %) |
|
| 11.7 | % |
Net investment income |
| $ | 79,451 |
|
| $ | 68,718 |
|
| $ | 64,168 |
|
|
| 15.6 | % |
|
| 7.1 | % |
The increase in total Net investment income for all years presented as compared to the prior years was primarily due to growth of invested assets coupled with an increase in pretax yields, which was driven in part by an increased allocation to higher yielding preferred stocks. The annualized pre-tax yields, excluding Net realized gains and losses and OTTI losses recognized in earnings, on a consolidated basis were 2.6%, 2.4% and 2.3%, respectively, for the years ended December 31, 2016, 2015 and 2014.
As part of our overall investment strategy, we seek to build a tax efficient investment portfolio by maintaining an allocation to tax exempt municipal bonds. The tax-exempt portion of our investment portfolio was approximately 17.1% of the fixed maturities investment portfolio as of December 31, 2016. Additionally, substantially all of our equity portfolio is invested in tax efficient securities which qualify for the dividends received deduction. The tax equivalent yields for the years ended December 31, 2016, 2015 and 2014 on a consolidated basis were 2.9%, 2.7% and 2.5%, respectively.
OTTI Losses Recognized in Earnings
Our Company had one credit related OTTI loss of $0.2 million from our Fixed maturities portfolio during the year ended December 31, 2016. Our Company had three credit related OTTI losses totaling $1.7 million from our equity portfolio during the year ended December 31, 2015, which were for certain common stocks in the energy sector and aerospace industry that were impacted by global economic events. Our Company did not have any credit related OTTI losses for the year ended December 31, 2014.
29
Net Realized Gains and Losses
Net realized gains and losses, excluding OTTI losses recognized in earnings, for the periods indicated were as follows:
|
| Years Ended December 31, |
|
| Percentage Change |
| ||||||||||||||
|
|
|
|
|
|
|
|
|
|
|
|
|
| 2016 vs. |
|
| 2015 vs. |
| ||
amounts in thousands |
| 2016 |
|
| 2015 |
|
| 2014 |
|
| 2015 |
|
| 2014 |
| |||||
Fixed maturities: |
|
|
|
|
|
|
|
|
|
|
|
|
|
|
|
|
|
|
|
|
Gains |
| $ | 5,681 |
|
| $ | 4,756 |
|
| $ | 8,326 |
|
|
| 19.4 | % |
|
| (42.9 | %) |
Losses |
|
| (4,271 | ) |
|
| (5,926 | ) |
|
| (2,610 | ) |
|
| (27.9 | %) |
|
| 127.0 | % |
Fixed maturities, net |
| $ | 1,410 |
|
| $ | (1,170 | ) |
| $ | 5,716 |
|
| NM |
|
| NM |
| ||
Short-term: |
|
|
|
|
|
|
|
|
|
|
|
|
|
|
|
|
|
|
|
|
Gains |
| $ | 890 |
|
| $ | 130 |
|
| $ | - |
|
| NM |
|
| NM |
| ||
Losses |
|
| (1,552 | ) |
|
| (383 | ) |
|
| - |
|
| NM |
|
| NM |
| ||
Short-term, net |
| $ | (662 | ) |
|
| (253 | ) |
| $ | - |
|
| NM |
|
| NM |
| ||
Equity securities: |
|
|
|
|
|
|
|
|
|
|
|
|
|
|
|
|
|
|
|
|
Gains |
| $ | 9,096 |
|
| $ | 14,331 |
|
| $ | 9,447 |
|
|
| (36.5 | %) |
|
| 51.7 | % |
Losses |
|
| (658 | ) |
|
| (4,535 | ) |
|
| (2,351 | ) |
|
| (85.5 | %) |
|
| 92.9 | % |
Equity securities, net |
| $ | 8,438 |
|
| $ | 9,796 |
|
| $ | 7,096 |
|
|
| (13.9 | %) |
|
| 38.0 | % |
Net realized gains |
| $ | 9,186 |
|
| $ | 8,373 |
|
| $ | 12,812 |
|
|
| 9.7 | % |
|
| (34.6 | %) |
NM - Percentage change not meaningful
Net realized gains and losses are generated as part of the normal ongoing management of our investment portfolio. Net realized gains of $9.2 million for the year ended December 31, 2016 are primarily due to the sale of equity securities. Realized losses of $4.3 million and $1.6 million for the year ended December 31, 2016 in the fixed maturities and short term portfolios, respectively, are primarily due to the foreign exchange losses in our Canadian Dollar ("CAD") and GBP portfolios. Net realized gains of $8.4 million for the year ended December 31, 2015 are primarily due to the sale of equity securities. Realized losses of $5.9 million in fixed maturities are primarily due to foreign exchange loss on the sale and maturity of fixed maturities in our Canadian portfolio. Net realized gains of $12.8 million for the year ended December 31, 2014 are primarily due to the sale of corporate bonds and equity securities.
Other Income (Loss)
Other income (loss) for the years ended December 31, 2016, 2015 and 2014 was $8.6 million, ($0.6) million and $10.1 million, respectively. Other income (loss) primarily consists of realized and unrealized foreign exchange gains and losses mostly driven by the strengthening of the USD against the GBP and CAD. 2016 included $10.2 million of unrealized foreign exchange gain and ($1.6) million of realized foreign exchange loss. 2015 included $0.3 million of realized foreign exchange gain and ($0.9) million of unrealized foreign exchange loss. 2014 was impacted by a $10.0 million foreign currency translation gain in connection with a change in the functional currency of the Syndicate that took place in the first quarter of 2014. See Note 1 – Organizations & Summary of Significant Accounting Policies, in the Notes to Consolidated Financial Statements, included herein for additional information regarding the foreign currency adjustment.
Income Taxes
We recorded an effective tax rate of 29.6%, 31.0% and 32.2% for December 31, 2016, 2015 and 2014, respectively. Our effective tax rate for each of the years differs from the federal tax rate of 35.0% principally due to tax-exempt investment income and dividends received deduction.
30
Segment Results
The following tables summarize our Consolidated Financial Results by reporting segment for the years ended December 31, 2016, 2015 and 2014:
|
| Year Ended December 31, 2016 |
| |||||||||||||||||||
|
| U.S. |
|
| Int'l |
|
|
|
|
|
|
|
|
|
|
|
|
|
|
| ||
amounts in thousands |
| Insurance |
|
| Insurance |
|
| GlobalRe |
|
| Corporate (1) |
|
|
|
| Total |
| |||||
Net earned premiums |
| $ | 629,308 |
|
| $ | 307,416 |
|
| $ | 163,621 |
|
| $ | - |
|
|
|
| $ | 1,100,345 |
|
Net losses and LAE |
|
| (397,860 | ) |
|
| (178,284 | ) |
|
| (89,304 | ) |
|
| - |
|
|
|
|
| (665,448 | ) |
Commission expenses |
|
| (70,812 | ) |
|
| (61,703 | ) |
|
| (34,008 | ) |
|
| 1,478 |
|
|
|
|
| (165,045 | ) |
Other operating expenses |
|
| (128,108 | ) |
|
| (86,395 | ) |
|
| (19,593 | ) |
|
| - |
|
|
|
|
| (234,096 | ) |
Other underwriting income (expense) |
|
| 1,092 |
|
|
| - |
|
|
| 522 |
|
|
| (1,478 | ) |
|
|
|
| 136 |
|
|
|
|
|
|
|
|
|
|
|
|
|
|
|
|
|
|
|
|
|
|
|
|
Underwriting profit (loss) |
| $ | 33,620 |
|
| $ | (18,966 | ) |
| $ | 21,238 |
|
| $ | - |
|
|
|
| $ | 35,892 |
|
|
|
|
|
|
|
|
|
|
|
|
|
|
|
|
|
|
|
|
|
|
|
|
Net investment income |
|
|
|
|
|
|
|
|
|
|
|
|
|
| 79,451 |
|
|
|
|
| 79,451 |
|
Net realized gains (losses) |
|
|
|
|
|
|
|
|
|
|
|
|
|
| 9,036 |
|
|
|
|
| 9,036 |
|
Interest expense |
|
|
|
|
|
|
|
|
|
|
|
|
|
| (15,435 | ) |
|
|
|
| (15,435 | ) |
Other income (loss) |
|
|
|
|
|
|
|
|
|
|
|
|
|
| 8,565 |
|
|
|
|
| 8,565 |
|
|
|
|
|
|
|
|
|
|
|
|
|
|
|
|
|
|
|
|
|
|
|
|
Income before income taxes |
| $ | 33,620 |
|
| $ | (18,966 | ) |
| $ | 21,238 |
|
| $ | 81,617 |
|
|
|
| $ | 117,509 |
|
Income tax (expense) benefit |
|
|
|
|
|
|
|
|
|
|
|
|
|
| (34,783 | ) |
|
|
|
| (34,783 | ) |
Net income (loss) |
|
|
|
|
|
|
|
|
|
|
|
|
|
|
|
|
|
|
| $ | 82,726 |
|
|
|
|
|
|
|
|
|
|
|
|
|
|
|
|
|
|
|
|
|
|
|
|
Losses and LAE ratio |
|
| 63.2 | % |
|
| 58.0 | % |
|
| 54.6 | % |
|
|
|
|
|
|
|
| 60.5 | % |
Commission expense ratio |
|
| 11.3 | % |
|
| 20.1 | % |
|
| 20.8 | % |
|
|
|
|
|
|
|
| 15.0 | % |
Other operating expense ratio (2) |
|
| 20.2 | % |
|
| 28.1 | % |
|
| 11.6 | % |
|
|
|
|
|
|
|
| 21.2 | % |
Combined ratio |
|
| 94.7 | % |
|
| 106.2 | % |
|
| 87.0 | % |
|
|
|
|
|
|
|
| 96.7 | % |
(1) - Includes Corporate segment intercompany eliminations.
(2) - Includes Other operating expenses and Other underwriting income (expense).
|
| Year Ended December 31, 2015 |
| |||||||||||||||||
|
| U.S. |
|
| Int'l |
|
|
|
|
|
|
|
|
|
|
|
|
| ||
amounts in thousands |
| Insurance |
|
| Insurance |
|
| GlobalRe |
|
| Corporate (1) |
|
| Total |
| |||||
Net earned premiums |
| $ | 555,836 |
|
| $ | 259,960 |
|
| $ | 168,291 |
|
| $ | - |
|
| $ | 984,087 |
|
Net losses and LAE |
|
| (343,497 | ) |
|
| (134,702 | ) |
|
| (94,399 | ) |
|
| - |
|
|
| (572,598 | ) |
Commission expenses |
|
| (56,319 | ) |
|
| (43,676 | ) |
|
| (32,240 | ) |
|
| 2,258 |
|
|
| (129,977 | ) |
Other operating expenses |
|
| (131,407 | ) |
|
| (75,867 | ) |
|
| (16,242 | ) |
|
| - |
|
|
| (223,516 | ) |
Other underwriting income (expense) |
|
| 1,690 |
|
|
| - |
|
|
| 690 |
|
|
| (2,258 | ) |
|
| 122 |
|
|
|
|
|
|
|
|
|
|
|
|
|
|
|
|
|
|
|
|
|
|
Underwriting profit (loss) |
| $ | 26,303 |
|
| $ | 5,715 |
|
| $ | 26,100 |
|
| $ | - |
|
| $ | 58,118 |
|
|
|
|
|
|
|
|
|
|
|
|
|
|
|
|
|
|
|
|
|
|
Net investment income |
|
|
|
|
|
|
|
|
|
|
|
|
|
| 68,718 |
|
|
| 68,718 |
|
Net realized gains (losses) |
|
|
|
|
|
|
|
|
|
|
|
|
|
| 6,675 |
|
|
| 6,675 |
|
Interest expense |
|
|
|
|
|
|
|
|
|
|
|
|
|
| (15,424 | ) |
|
| (15,424 | ) |
Other income (loss) |
|
|
|
|
|
|
|
|
|
|
|
|
|
| (613 | ) |
|
| (613 | ) |
|
|
|
|
|
|
|
|
|
|
|
|
|
|
|
|
|
|
|
|
|
Income before income taxes |
| $ | 26,303 |
|
| $ | 5,715 |
|
| $ | 26,100 |
|
| $ | 59,356 |
|
| $ | 117,474 |
|
Income tax (expense) benefit |
|
|
|
|
|
|
|
|
|
|
|
|
|
| (36,417 | ) |
|
| (36,417 | ) |
Net income (loss) |
|
|
|
|
|
|
|
|
|
|
|
|
|
|
|
|
| $ | 81,057 |
|
|
|
|
|
|
|
|
|
|
|
|
|
|
|
|
|
|
|
|
|
|
Losses and LAE ratio |
|
| 61.8 | % |
|
| 51.8 | % |
|
| 56.1 | % |
|
|
|
|
|
| 58.2 | % |
Commission expense ratio |
|
| 10.1 | % |
|
| 16.8 | % |
|
| 19.2 | % |
|
|
|
|
|
| 13.2 | % |
Other operating expense ratio (2) |
|
| 23.4 | % |
|
| 29.2 | % |
|
| 9.2 | % |
|
|
|
|
|
| 22.7 | % |
Combined ratio |
|
| 95.3 | % |
|
| 97.8 | % |
|
| 84.5 | % |
|
|
|
|
|
| 94.1 | % |
(1) - Includes Corporate segment intercompany eliminations.
(2) - Includes Other operating expenses and Other underwriting income (expense).
31
|
| Year Ended December 31, 2014 |
| |||||||||||||||||
|
| U.S. |
|
| Int'l |
|
|
|
|
|
|
|
|
|
|
|
|
| ||
amounts in thousands |
| Insurance |
|
| Insurance |
|
| GlobalRe |
|
| Corporate (1) |
|
| Total |
| |||||
Net earned premiums |
| $ | 504,289 |
|
| $ | 243,485 |
|
| $ | 188,121 |
|
| $ | - |
|
| $ | 935,895 |
|
Net losses and LAE |
|
| (311,839 | ) |
|
| (115,079 | ) |
|
| (118,311 | ) |
|
| - |
|
|
| (545,229 | ) |
Commission expenses |
|
| (49,840 | ) |
|
| (44,426 | ) |
|
| (33,429 | ) |
|
| 2,167 |
|
|
| (125,528 | ) |
Other operating expenses |
|
| (115,817 | ) |
|
| (65,275 | ) |
|
| (15,733 | ) |
|
| - |
|
|
| (196,825 | ) |
Other underwriting income (expense) |
|
| 2,241 |
|
|
| 32 |
|
|
| 489 |
|
|
| (2,167 | ) |
|
| 595 |
|
|
|
|
|
|
|
|
|
|
|
|
|
|
|
|
|
|
|
|
|
|
Underwriting profit (loss) |
| $ | 29,034 |
|
| $ | 18,737 |
|
| $ | 21,137 |
|
| $ | - |
|
| $ | 68,908 |
|
|
|
|
|
|
|
|
|
|
|
|
|
|
|
|
|
|
|
|
|
|
Net investment income |
|
|
|
|
|
|
|
|
|
|
|
|
|
| 64,168 |
|
|
| 64,168 |
|
Net realized gains (losses) |
|
|
|
|
|
|
|
|
|
|
|
|
|
| 12,812 |
|
|
| 12,812 |
|
Interest expense |
|
|
|
|
|
|
|
|
|
|
|
|
|
| (15,413 | ) |
|
| (15,413 | ) |
Other income (loss) |
|
|
|
|
|
|
|
|
|
|
|
|
|
| 10,061 |
|
|
| 10,061 |
|
|
|
|
|
|
|
|
|
|
|
|
|
|
|
|
|
|
|
|
|
|
Income (loss) before income taxes |
| $ | 29,034 |
|
| $ | 18,737 |
|
| $ | 21,137 |
|
| $ | 71,628 |
|
| $ | 140,536 |
|
Income tax (expense) benefit |
|
|
|
|
|
|
|
|
|
|
|
|
|
| (45,207 | ) |
|
| (45,207 | ) |
Net income (loss) |
|
|
|
|
|
|
|
|
|
|
|
|
|
|
|
|
| $ | 95,329 |
|
|
|
|
|
|
|
|
|
|
|
|
|
|
|
|
|
|
|
|
|
|
Losses and LAE ratio |
|
| 61.8 | % |
|
| 47.3 | % |
|
| 62.9 | % |
|
|
|
|
|
| 58.3 | % |
Commission expense ratio |
|
| 9.9 | % |
|
| 18.2 | % |
|
| 17.8 | % |
|
|
|
|
|
| 13.4 | % |
Other operating expense ratio (2) |
|
| 22.5 | % |
|
| 26.8 | % |
|
| 8.1 | % |
|
|
|
|
|
| 20.9 | % |
Combined ratio |
|
| 94.2 | % |
|
| 92.3 | % |
|
| 88.8 | % |
|
|
|
|
|
| 92.6 | % |
(1) - Includes Corporate segment intercompany eliminations.
(2) - Includes Other operating expenses and Other underwriting income (expense).
U.S. Insurance
The following tables summarize our financial results by operating segment for our U.S. Insurance reporting segment for the years ended December 31, 2016, 2015 and 2014:
U.S. Insurance |
| ||||||||||||||||
|
| Year Ended December 31, 2016 |
|
|
|
|
| ||||||||||
amounts in thousands |
| Marine |
| P&C |
| Professional Liability |
| Total |
|
| % Change 2016 vs. 2015 |
| |||||
Gross written premiums |
| $ | 169,405 |
| $ | 631,562 |
| $ | 118,428 |
| $ | 919,395 |
|
|
| 6.2 | % |
Ceded written premiums |
|
| (70,858 | ) |
| (135,888 | ) |
| (29,081 | ) |
| (235,827 | ) |
|
| (12.3 | %) |
Net written premiums |
|
| 98,547 |
|
| 495,674 |
|
| 89,347 |
|
| 683,568 |
|
|
| 14.5 | % |
|
|
|
|
|
|
|
|
|
|
|
|
|
|
|
|
|
|
Net earned premiums |
| $ | 100,132 |
| $ | 453,673 |
| $ | 75,503 |
| $ | 629,308 |
|
|
| 13.2 | % |
Net losses and LAE |
|
| (50,087 | ) |
| (295,877 | ) |
| (51,896 | ) |
| (397,860 | ) |
|
| 15.8 | % |
Commission expenses |
|
| (8,469 | ) |
| (52,483 | ) |
| (9,860 | ) |
| (70,812 | ) |
|
| 25.7 | % |
Other operating expenses |
|
| (27,559 | ) |
| (81,469 | ) |
| (19,080 | ) |
| (128,108 | ) |
|
| (2.5 | %) |
Other underwriting income (expense) |
|
| 465 |
|
| 582 |
|
| 45 |
|
| 1,092 |
|
|
| (35.4 | %) |
|
|
|
|
|
|
|
|
|
|
|
|
|
|
|
|
|
|
Underwriting profit (loss) |
| $ | 14,482 |
| $ | 24,426 |
| $ | (5,288 | ) | $ | 33,620 |
|
|
| 27.8 | % |
|
|
|
|
|
|
|
|
|
|
|
|
|
|
|
|
|
|
Losses and LAE ratio |
|
| 50.0 | % |
| 65.2 | % |
| 68.7 | % |
| 63.2 | % |
|
|
|
|
Commission expense ratio |
|
| 8.5 | % |
| 11.6 | % |
| 13.1 | % |
| 11.3 | % |
|
|
|
|
Other operating expense ratio (1) |
|
| 27.0 | % |
| 17.8 | % |
| 25.2 | % |
| 20.2 | % |
|
|
|
|
Combined ratio |
|
| 85.5 | % |
| 94.6 | % |
| 107.0 | % |
| 94.7 | % |
|
|
|
|
(1) - Includes Other operating expenses and Other underwriting income (expense).
32
U.S. Insurance |
| ||||||||||||||||
|
| Year Ended December 31, 2015 |
|
|
|
|
| ||||||||||
amounts in thousands |
| Marine |
| P&C |
| Professional Liability |
| Total |
|
| % Change 2015 vs. 2014 |
| |||||
Gross written premiums |
| $ | 158,124 |
| $ | 596,673 |
| $ | 110,984 |
| $ | 865,781 |
|
|
| 7.3 | % |
Ceded written premiums |
|
| (61,916 | ) |
| (152,168 | ) |
| (54,691 | ) |
| (268,775 | ) |
|
| 5.4 | % |
Net written premiums |
|
| 96,208 |
|
| 444,505 |
|
| 56,293 |
|
| 597,006 |
|
|
| 8.1 | % |
|
|
|
|
|
|
|
|
|
|
|
|
|
|
|
|
|
|
Net earned premiums |
| $ | 96,082 |
| $ | 401,408 |
| $ | 58,346 |
| $ | 555,836 |
|
|
| 10.2 | % |
Net losses and LAE |
|
| (43,553 | ) |
| (266,806 | ) |
| (33,138 | ) |
| (343,497 | ) |
|
| 10.2 | % |
Commission expenses |
|
| (11,606 | ) |
| (39,931 | ) |
| (4,782 | ) |
| (56,319 | ) |
|
| 13.0 | % |
Other operating expenses |
|
| (27,082 | ) |
| (81,866 | ) |
| (22,459 | ) |
| (131,407 | ) |
|
| 13.5 | % |
Other underwriting income (expense) |
|
| 489 |
|
| 1,122 |
|
| 79 |
|
| 1,690 |
|
|
| (24.6 | %) |
|
|
|
|
|
|
|
|
|
|
|
|
|
|
|
|
|
|
Underwriting profit (loss) |
| $ | 14,330 |
| $ | 13,927 |
| $ | (1,954 | ) | $ | 26,303 |
|
|
| (9.4 | %) |
|
|
|
|
|
|
|
|
|
|
|
|
|
|
|
|
|
|
Losses and LAE ratio |
|
| 45.3 | % |
| 66.5 | % |
| 56.8 | % |
| 61.8 | % |
|
|
|
|
Commission expense ratio |
|
| 12.1 | % |
| 9.9 | % |
| 8.2 | % |
| 10.1 | % |
|
|
|
|
Other operating expense ratio (1) |
|
| 27.7 | % |
| 20.1 | % |
| 38.3 | % |
| 23.4 | % |
|
|
|
|
Combined ratio |
|
| 85.1 | % |
| 96.5 | % |
| 103.3 | % |
| 95.3 | % |
|
|
|
|
(1) - Includes Other operating expenses and Other underwriting income (expense).
U.S. Insurance |
| ||||||||||||
|
| Year Ended December 31, 2014 |
| ||||||||||
amounts in thousands |
| Marine |
| P&C |
| Professional Liability |
| Total |
| ||||
Gross written premiums |
| $ | 154,233 |
| $ | 543,045 |
| $ | 109,830 |
| $ | 807,108 |
|
Ceded written premiums |
|
| (46,685 | ) |
| (169,953 | ) |
| (38,345 | ) |
| (254,983 | ) |
Net written premiums |
|
| 107,548 |
|
| 373,092 |
|
| 71,485 |
|
| 552,125 |
|
|
|
|
|
|
|
|
|
|
|
|
|
|
|
Net earned premiums |
| $ | 105,650 |
| $ | 314,833 |
| $ | 83,806 |
| $ | 504,289 |
|
Net losses and LAE |
|
| (42,057 | ) |
| (220,263 | ) |
| (49,519 | ) |
| (311,839 | ) |
Commission expenses |
|
| (13,025 | ) |
| (25,497 | ) |
| (11,318 | ) |
| (49,840 | ) |
Other operating expenses |
|
| (24,205 | ) |
| (70,903 | ) |
| (20,709 | ) |
| (115,817 | ) |
Other underwriting income (expense) |
|
| 839 |
|
| 1,263 |
|
| 139 |
|
| 2,241 |
|
|
|
|
|
|
|
|
|
|
|
|
|
|
|
Underwriting profit (loss) |
| $ | 27,202 |
| $ | (567 | ) | $ | 2,399 |
| $ | 29,034 |
|
|
|
|
|
|
|
|
|
|
|
|
|
|
|
Losses and LAE ratio |
|
| 39.8 | % |
| 70.0 | % |
| 59.1 | % |
| 61.8 | % |
Commission expense ratio |
|
| 12.3 | % |
| 8.1 | % |
| 13.5 | % |
| 9.9 | % |
Other operating expense ratio (1) |
|
| 22.2 | % |
| 22.1 | % |
| 24.5 | % |
| 22.5 | % |
Combined ratio |
|
| 74.3 | % |
| 100.2 | % |
| 97.1 | % |
| 94.2 | % |
(1) - Includes Other operating expenses and Other underwriting income (expense).
Gross Written Premiums
Gross written premiums increased $53.6 million for the year ended December 31, 2016 compared to the same period in 2015 due to strong growth across all of our operating segments. Our P&C operating segment increased $34.9 million driven by new business production from our Auto and Property products of $20.9 million and $13.3 million, respectively. In addition, our Marine and Professional Liability operating segments increased $11.3 million and $7.4 million, respectively, as compared to the same period in 2015, driven by new business production in our Craft, Cargo and Fishing Vessel products, as well as increased renewal premiums in our E&O and D&O divisions despite a difficult rate environment.
For the year ended December 31, 2016, average renewal rates decreased 0.1% as compared to the same period in 2015, driven by a 0.5% decrease from our Marine operating segment.
Gross written premiums increased $58.7 million for the year ended December 31, 2015 compared to the same period in 2014 due to strong new business production and improving market conditions in our P&C operating segment, which increased $53.6 million. Our
33
Excess Casualty and Primary Casualty divisions increased $23.5 million and $15.9 million, respectively, as a result of continued improvement within the construction market. In addition, our Environmental division increased $8.5 million due to strong new business production.
For the year ended December 31, 2015, average renewal rates decreased 1.3% as compared to the same period in 2014, with decreases in our Marine, P&C and Professional Liability operating segments of 0.7%, 1.5% and 1.4%, respectively. This was offset by new business production achieved through our continued investment in our underwriting teams in addition to improved market conditions across key businesses.
Ceded Written Premiums
Ceded written premiums decreased $32.9 million for the year ended December 31, 2016 compared to the same period in 2015, mostly due to the reduction in proportional reinsurance coverage that supports our Excess Casualty and Environmental risks within our P&C operating segment, the nonrenewal of our E&O proportional reinsurance treaty in the fourth quarter of 2015 within our Professional Liability segment, and the year over year effect of RRPs. For the year ended December 31, 2016, RRPs decreased $4.6 million to $0.8 million as compared to $5.4 million in the prior year, primarily due to the reduction in large loss activity within our Marine operating segment. These items were partially offset by increases in our proportional reinsurance coverage within our Marine operating segment.
Ceded written premiums increased $13.8 million for the year ended December 31, 2015 compared to the same period in 2014, mostly due to growth in Gross written premiums. The impact of the implementation of additional proportional reinsurance programs in Marine and Professional Liability operating segments, during the second half of 2014 and the first quarter of 2015, were almost completely offset by a reduction in proportional reinsurance, in the second half of 2015, that primarily supports Excess Casualty and Environmental casualty risks within our P&C operating segment.
For the year ended December 31, 2015, RRPs of $5.4 million increased $3.6 million as compared to prior year of $1.8 million, primarily due to large loss activity within our Marine operating segment.
Net Earned Premiums
Net earned premiums increased $73.5 million for the year ended December 31, 2016 compared to the same period in 2015, due to growth in Gross written premiums, a reduced level of proportional reinsurance within our P&C and Professional Liability operating segments, and a $4.6 million decrease in RRPs from 2015.
Net earned premiums increased $51.5 million for the year ended December 31, 2015 compared to the same period in 2014, primarily due to growth in Gross written premiums and a reduced level of proportional reinsurance that supports certain casualty risks in the second half of 2015 within our P&C operating segment. This was partially offset by decreases in Net earned premium in both our Marine and Professional Liability operating segments, which were impacted by the implementation of additional reinsurance programs in the second half of 2014 and first quarter of 2015, as well as, a $3.6 million increase in RRPs from 2014.
34
Net Losses and LAE
The Net losses and LAE reserves as of December 31, 2016, 2015 and 2014 are as follows:
|
| U.S. Insurance |
| ||||||||||
|
| Year Ended December 31, 2016 |
| ||||||||||
amounts in thousands |
| Marine |
| P&C |
| Professional Liability |
| Total |
| ||||
Case reserves |
| $ | 56,701 |
| $ | 201,368 |
| $ | 24,555 |
| $ | 282,624 |
|
IBNR reserves |
|
| 54,259 |
|
| 603,509 |
|
| 70,559 |
|
| 728,327 |
|
Total |
| $ | 110,960 |
| $ | 804,877 |
| $ | 95,114 |
| $ | 1,010,951 |
|
|
|
|
|
|
|
|
|
|
|
|
|
|
|
|
| U.S. Insurance |
| ||||||||||
|
| Year Ended December 31, 2015 |
| ||||||||||
amounts in thousands |
| Marine |
| P&C |
| Professional Liability |
| Total |
| ||||
Case reserves |
| $ | 68,677 |
| $ | 170,988 |
| $ | 42,546 |
| $ | 282,211 |
|
IBNR reserves |
|
| 55,408 |
|
| 514,777 |
|
| 60,528 |
|
| 630,713 |
|
Total |
| $ | 124,085 |
| $ | 685,765 |
| $ | 103,074 |
| $ | 912,924 |
|
|
|
|
|
|
|
|
|
|
|
|
|
|
|
|
| U.S. Insurance |
| ||||||||||
|
| Year Ended December 31, 2014 |
| ||||||||||
amounts in thousands |
| Marine |
| P&C |
| Professional Liability |
| Total |
| ||||
Case reserves |
| $ | 74,699 |
| $ | 144,334 |
| $ | 56,501 |
| $ | 275,534 |
|
IBNR reserves |
|
| 64,390 |
|
| 391,643 |
|
| 85,369 |
|
| 541,402 |
|
Total |
| $ | 139,089 |
| $ | 535,977 |
| $ | 141,870 |
| $ | 816,936 |
|
The following tables present the impact of reserve development and RRPs on our Net losses and LAE ratio for the years ended December 31, 2016, 2015 and 2014:
|
| U.S. Insurance |
| |||||||||||||
|
| Year Ended December 31, 2016 |
| |||||||||||||
|
|
|
|
|
|
|
|
|
| Professional |
|
|
|
|
| |
|
| Marine |
|
| P&C |
|
| Liability |
|
| Total |
| ||||
Net losses and LAE ratio, reported |
|
| 50.0 | % |
|
| 65.2 | % |
|
| 68.7 | % |
|
| 63.2 | % |
RRPs |
|
| -0.4 | % |
|
| 0.0 | % |
|
| 0.0 | % |
|
| -0.1 | % |
Additional net current AY release/(development) |
|
| -1.1 | % |
|
| -0.4 | % |
|
| 0.0 | % |
|
| -0.5 | % |
Net prior AY reserve release/(strengthening) |
|
| 10.0 | % |
|
| -0.6 | % |
|
| -7.9 | % |
|
| 0.2 | % |
Net losses and LAE ratio, adjusted |
|
| 58.5 | % |
|
| 64.2 | % |
|
| 60.8 | % |
|
| 62.8 | % |
|
| U.S. Insurance |
| |||||||||||||
|
| Year Ended December 31, 2015 |
| |||||||||||||
|
|
|
|
|
|
|
|
|
| Professional |
|
|
|
|
| |
|
| Marine |
|
| P&C |
|
| Liability |
|
| Total |
| ||||
Net losses and LAE ratio, reported |
|
| 45.3 | % |
|
| 66.5 | % |
|
| 56.8 | % |
|
| 61.8 | % |
RRPs |
|
| -1.9 | % |
|
| -0.2 | % |
|
| 0.0 | % |
|
| -0.6 | % |
Additional net current AY release/(development) |
|
| -10.0 | % |
|
| -1.2 | % |
|
| 0.0 | % |
|
| -2.7 | % |
Net prior AY reserve release/(strengthening) |
|
| 24.8 | % |
|
| 0.2 | % |
|
| 6.5 | % |
|
| 5.2 | % |
Net losses and LAE ratio, adjusted |
|
| 58.2 | % |
|
| 65.3 | % |
|
| 63.3 | % |
|
| 63.7 | % |
|
| U.S. Insurance |
| |||||||||||||
|
| Year Ended December 31, 2014 |
| |||||||||||||
|
|
|
|
|
|
|
|
|
| Professional |
|
|
|
|
| |
|
| Marine |
|
| P&C |
|
| Liability |
|
| Total |
| ||||
Net losses and LAE ratio, reported |
|
| 39.8 | % |
|
| 70.0 | % |
|
| 59.1 | % |
|
| 61.8 | % |
RRPs |
|
| -0.9 | % |
|
| 0.1 | % |
|
| 0.0 | % |
|
| -0.2 | % |
Additional net current AY release/(development) |
|
| -5.5 | % |
|
| -0.1 | % |
|
| 0.0 | % |
|
| -1.2 | % |
Net prior AY reserve release/(strengthening) |
|
| 26.9 | % |
|
| -5.4 | % |
|
| 4.1 | % |
|
| 3.0 | % |
Net losses and LAE ratio, adjusted |
|
| 60.3 | % |
|
| 64.6 | % |
|
| 63.2 | % |
|
| 63.4 | % |
|
|
|
|
|
|
|
|
|
|
|
|
|
|
|
|
|
For the year ended December 31, 2016, our U.S. Insurance reporting segment recorded $1.3 million of net prior AY reserve releases driven by $10.1 million of reserve releases in our Marine operating segment, mostly due to a decline in large loss activity, partially offset by $2.8 million and $6.0 million of net prior AY reserve strengthening in our P&C and Professional Liability operating segments, mostly due to unfavorable development on large claims within our Primary Casualty and D&O divisions, and a $1.2 million
35
increase in our Professional Liability reserve for uncollectible reinsurance. The loss ratio was also unfavorably impacted by $2.9 million of net current AY loss from our Marine and P&C operating segments as well as $0.8 million of RRPs, which were primarily within our Marine operating segment.
For the year ended December 31, 2015, our U.S. Insurance reporting segment recorded $29.3 million of net prior AY reserve releases driven by $24.8 million, $3.8 million and $0.7 million of reserve releases from our Marine, Professional Liability and P&C operating segments, respectively, mostly due to a decline in large loss activity. The favorable prior AY reserve releases were partially offset by a $10.0 million current AY loss related to Hurricane Joaquin. The loss ratio was also unfavorably impacted by $5.4 million of RRPs, which were primarily within our Marine operating segment.
For the year ended December 31, 2014, our U.S. Insurance reporting segment recorded $15.4 million of net prior AY reserve releases primarily driven by $29.0 million and $3.5 million of reserve releases from our Marine and Professional Liability operating segments, respectively. Marine was favorably impacted by a decline in large loss activity and Professional Liability benefited from $4.5 million favorable loss emergence within D&O due to a cash settlement of a contract dispute with a former third party administrator, partially offset by unfavorable loss emergence from our E&O division. The aforementioned releases were partially offset by $17.1 million of prior AY reserve strengthening in our P&C operating segment, primarily related to unfavorable loss activity in our Primary Casualty division. The loss ratio was also unfavorably impacted by $1.8 million of RRPs, primarily within our Marine operating segment.
The changes in Net losses and LAE ratio, as adjusted, are primarily due to the mix of business earned.
Commission Expenses
The Commission expense ratio increased 1.2 percentage points for the year ended December 31, 2016 compared to the same period in 2015, primarily due to less ceded proportional reinsurance and related ceding commission benefit within our Professional Liability and P&C operating segments, partially offset by the implementation of new proportional reinsurance programs within our Marine operating segment.
The Commission expense ratio increased 0.2 percentage points for the year ended December 31, 2015 compared to the same period in 2014, primarily due to less ceded proportional reinsurance and related ceding commission benefit within our P&C operating segment as a result of the change in the proportional reinsurance program previously discussed partially offset by a decrease in commission expense ratio in the Professional Liability operating segment, and to a lesser extent, our Marine operating segment, due to the implementation of new proportional reinsurance programs.
For additional information, refer to Ceded written premiums discussion above.
Other Operating Expenses
Other operating expenses decreased $3.3 million for the year ended December 31, 2016 compared to the same period in 2015 due to decreases in non-recurring project specific information technology and professional fee expenditures.
Other operating expenses increased $15.6 million for the year ended December 31, 2015 compared to the same period in 2014, primarily driven by continued investment in our underwriting teams, support staff and infrastructure as well as an increase in our professional service fees and information technology expenses to support business growth and initiatives.
36
Int'l Insurance
The following tables summarize our financial results by operating segment for our Int'l Insurance reporting segment for the years ended December 31, 2016, 2015 and 2014:
Int'l Insurance |
| ||||||||||||||||
|
| Year Ended December 31, 2016 |
|
|
|
|
| ||||||||||
amounts in thousands |
| Marine |
| P&C |
| Professional Liability |
| Total |
|
| % Change 2016 vs. 2015 |
| |||||
Gross written premiums |
| $ | 183,228 |
| $ | 181,094 |
| $ | 120,149 |
| $ | 484,471 |
|
|
| 17.6 | % |
Ceded written premiums |
|
| (40,092 | ) |
| (69,606 | ) |
| (28,806 | ) |
| (138,504 | ) |
|
| 3.4 | % |
Net written premiums |
|
| 143,136 |
|
| 111,488 |
|
| 91,343 |
|
| 345,967 |
|
|
| 24.5 | % |
|
|
|
|
|
|
|
|
|
|
|
|
|
|
|
|
|
|
Net earned premiums |
| $ | 141,593 |
| $ | 89,455 |
| $ | 76,368 |
| $ | 307,416 |
|
|
| 18.3 | % |
Net losses and LAE |
|
| (67,051 | ) |
| (68,995 | ) |
| (42,238 | ) |
| (178,284 | ) |
|
| 32.4 | % |
Commission expenses |
|
| (34,018 | ) |
| (14,529 | ) |
| (13,156 | ) |
| (61,703 | ) |
|
| 41.3 | % |
Other operating expenses |
|
| (33,170 | ) |
| (34,075 | ) |
| (19,150 | ) |
| (86,395 | ) |
|
| 13.9 | % |
Other underwriting income (expense) |
|
| - |
|
| - |
|
| - |
|
| - |
|
| NM |
| |
|
|
|
|
|
|
|
|
|
|
|
|
|
|
|
|
|
|
Underwriting profit (loss) |
| $ | 7,354 |
| $ | (28,144 | ) | $ | 1,824 |
| $ | (18,966 | ) |
| NM |
| |
|
|
|
|
|
|
|
|
|
|
|
|
|
|
|
|
|
|
Losses and LAE ratio |
|
| 47.4 | % |
| 77.1 | % |
| 55.3 | % |
| 58.0 | % |
|
|
|
|
Commission expense ratio |
|
| 24.0 | % |
| 16.2 | % |
| 17.2 | % |
| 20.1 | % |
|
|
|
|
Other operating expense ratio (1) |
|
| 23.4 | % |
| 38.2 | % |
| 25.1 | % |
| 28.1 | % |
|
|
|
|
Combined ratio |
|
| 94.8 | % |
| 131.5 | % |
| 97.6 | % |
| 106.2 | % |
|
|
|
|
NM - Percentage change not meaningful
(1) - Includes Other operating expenses and Other underwriting income (expense).
Int'l Insurance |
| ||||||||||||||||
|
| Year Ended December 31, 2015 |
|
|
|
|
| ||||||||||
amounts in thousands |
| Marine |
| P&C |
| Professional Liability |
| Total |
|
| % Change 2015 vs. 2014 |
| |||||
Gross written premiums |
| $ | 183,707 |
| $ | 130,729 |
| $ | 97,511 |
| $ | 411,947 |
|
|
| (3.0 | %) |
Ceded written premiums |
|
| (36,515 | ) |
| (67,722 | ) |
| (29,768 | ) |
| (134,005 | ) |
|
| (22.1 | %) |
Net written premiums |
|
| 147,192 |
|
| 63,007 |
|
| 67,743 |
|
| 277,942 |
|
|
| 9.9 | % |
|
|
|
|
|
|
|
|
|
|
|
|
|
|
|
|
|
|
Net earned premiums |
| $ | 149,256 |
| $ | 55,320 |
| $ | 55,384 |
| $ | 259,960 |
|
|
| 6.8 | % |
Net losses and LAE |
|
| (79,737 | ) |
| (20,478 | ) |
| (34,487 | ) |
| (134,702 | ) |
|
| 17.1 | % |
Commission expenses |
|
| (32,187 | ) |
| (4,999 | ) |
| (6,490 | ) |
| (43,676 | ) |
|
| (1.7 | %) |
Other operating expenses |
|
| (30,419 | ) |
| (26,294 | ) |
| (19,154 | ) |
| (75,867 | ) |
|
| 16.2 | % |
Other underwriting income (expense) |
|
| - |
|
| - |
|
| - |
|
| - |
|
| NM |
| |
|
|
|
|
|
|
|
|
|
|
|
|
|
|
|
|
|
|
Underwriting profit (loss) |
| $ | 6,913 |
| $ | 3,549 |
| $ | (4,747 | ) | $ | 5,715 |
|
|
| (69.5 | %) |
|
|
|
|
|
|
|
|
|
|
|
|
|
|
|
|
|
|
Losses and LAE ratio |
|
| 53.4 | % |
| 37.0 | % |
| 62.3 | % |
| 51.8 | % |
|
|
|
|
Commission expense ratio |
|
| 21.6 | % |
| 9.0 | % |
| 11.7 | % |
| 16.8 | % |
|
|
|
|
Other operating expense ratio (1) |
|
| 20.4 | % |
| 47.6 | % |
| 34.6 | % |
| 29.2 | % |
|
|
|
|
Combined ratio |
|
| 95.4 | % |
| 93.6 | % |
| 108.6 | % |
| 97.8 | % |
|
|
|
|
NM - Percentage change not meaningful
(1) - Includes Other operating expenses and Other underwriting income (expense).
37
Int'l Insurance |
| ||||||||||||
|
| Year Ended December 31, 2014 |
| ||||||||||
amounts in thousands |
| Marine |
| P&C |
| Professional Liability |
| Total |
| ||||
Gross written premiums |
| $ | 190,787 |
| $ | 158,139 |
| $ | 75,978 |
| $ | 424,904 |
|
Ceded written premiums |
|
| (47,805 | ) |
| (98,087 | ) |
| (26,029 | ) |
| (171,921 | ) |
Net written premiums |
|
| 142,982 |
|
| 60,052 |
|
| 49,949 |
|
| 252,983 |
|
|
|
|
|
|
|
|
|
|
|
|
|
|
|
Net earned premiums |
| $ | 141,097 |
| $ | 62,520 |
| $ | 39,868 |
| $ | 243,485 |
|
Net losses and LAE |
|
| (71,986 | ) |
| (23,317 | ) |
| (19,776 | ) |
| (115,079 | ) |
Commission expenses |
|
| (37,660 | ) |
| (5,295 | ) |
| (1,471 | ) |
| (44,426 | ) |
Other operating expenses |
|
| (28,222 | ) |
| (22,156 | ) |
| (14,897 | ) |
| (65,275 | ) |
Other underwriting income (expense) |
|
| 16 |
|
| 9 |
|
| 7 |
|
| 32 |
|
|
|
|
|
|
|
|
|
|
|
|
|
|
|
Underwriting profit (loss) |
| $ | 3,245 |
| $ | 11,761 |
| $ | 3,731 |
| $ | 18,737 |
|
|
|
|
|
|
|
|
|
|
|
|
|
|
|
Losses and LAE ratio |
|
| 51.0 | % |
| 37.3 | % |
| 49.6 | % |
| 47.3 | % |
Commission expense ratio |
|
| 26.8 | % |
| 8.5 | % |
| 3.7 | % |
| 18.2 | % |
Other operating expense ratio (1) |
|
| 20.0 | % |
| 35.4 | % |
| 37.4 | % |
| 26.8 | % |
|
|
| 97.8 | % |
| 81.2 | % |
| 90.7 | % |
| 92.3 | % |
(1) - Includes Other operating expenses and Other underwriting income (expense).
Gross Written Premiums
Gross written premiums increased $72.5 million for the year ended December 31, 2016 compared to the same period in 2015, primarily due to increases in our P&C and Professional Liability operating segments of $50.4 million and $22.6 million, respectively. Our P&C operating segment benefitted from $24.6 million growth in our Property division, mostly driven by our expanded coverage for international exposures, as well as growth of $10.9 million and $6.9 million from our Energy & Engineering and Casualty divisions, and the commencement of the PV&T product in 2016. The increase in our Professional Liability operating segment was due to new business production across all divisions.
For the year ended December 31, 2016 average renewal premium rates decreased 4.1%, due to decreases of 1.6%, 8.0%, and 3.5% in our Marine, P&C and Professional Liability operating segments, respectively. The impact of this has been offset by new business production and the commencement of the PV&T product.
Gross written premiums decreased $13.0 million for the year ended December 31, 2015 compared to the same period in 2014, primarily due to decreases in our P&C and Marine operating segments of $27.6 million and $6.9 million, respectively. Our P&C operating segment was impacted by severe market conditions in our Energy & Engineering division and decreased $54.7 million as compared to the same period in 2014, partially offset by growth in our Property division of $21.7 million from new business production. The decrease in our Marine operating segment is due to declines in rates coupled with lower renewal activity. The decline in Gross written premiums was partially offset by an increase of $21.3 million in our Professional Liability operating segment, driven by new business production in our E&O division.
For the year ended December 31, 2015 average renewal premium rates decreased 5.4%, due to decreases of 2.3%, 9.9%, and 4.6% in our Marine, P&C and Professional Liability operating segments, respectively.
Ceded Written Premiums
Ceded written premiums increased $4.5 million for the year ended December 31, 2016 compared to the same period in 2015, driven by our Marine and P&C operating segments of $3.6 million and $1.9 million, respectively, mostly due to the year on year effect of RRPs. For the year ended December 31, 2016, RRPs of $2.9 million were incurred, compared to a release of $4.0 million in RRPs in 2015 resulting in a $6.9 million increase. This was partially offset by decreases in proportional reinsurance coverages in our P&C and Professional Liability operating segments.
Ceded written premiums decreased $37.9 million for the year ended December 31, 2015 compared to the same period in 2014, driven by decreases in our P&C and Marine operating segments of $30.4 million and $11.3 million, respectively. The decrease in both operating segments is primarily driven by an overall decline in Gross written premiums which attract proportional reinsurance as well as a reduction in proportional reinsurance programs. The decrease was partially offset by an increase of $3.7 million in our Professional Liability operating segment due to higher Gross written premiums with attached proportional reinsurance.
38
For the year ended December 31, 2015, RRPs releases of $4.0 million decreased by $ 10.6 million as compared to the same period in 2014 when RRPs of $6.6 million were incurred. 2015 benefited from RRP releases of $4.0 million, which included releases due to reductions in Superstorm Sandy related losses.
Net Earned Premiums
Net earned premiums increased $47.5 million for the year ended December 31, 2016 as compared to the same period in 2015. This was driven by growth in our P&C operating segment of $34.1 million, mostly due to increased production from our Property division related to expanded coverage for international exposures, and the newly formed PV&T product. In addition our Professional Liability operating segment increased $21.0 million, mostly in our Financial Institutions product. These increases were partially offset by a decrease in our Marine operating segment and increased RRPs expense of $2.9 million in 2016 compared to a release of $4.0 million in 2015, which are fully earned when written.
Net earned premiums increased $16.5 million for the year ended December 31, 2015 as compared to the same period in 2014. This was driven by increases in our Professional Liability operating segment of $15.5 million due to growth in new business in our E&O division and increases in our Marine operating segment of $8.2 million, due to a $9.7 million decrease in RRPs. These increases were partially offset by a decrease in our P&C operating segment due to the decreases in Gross written premiums.
Net Losses and LAE
The Net losses and LAE reserves as of December 31, 2016, 2015 and 2014 are as follows:
|
| Int'l Insurance |
|
| ||||||||||
|
| Year Ended December 31, 2016 |
|
| ||||||||||
amounts in thousands |
| Marine |
| P&C |
| Professional Liability |
| Total |
|
| ||||
Case reserves |
| $ | 163,124 |
| $ | 66,496 |
| $ | 30,106 |
| $ | 259,726 |
|
|
IBNR reserves |
|
| 36,118 |
|
| 18,192 |
|
| 70,103 |
|
| 124,413 |
|
|
Total |
| $ | 199,242 |
| $ | 84,688 |
| $ | 100,209 |
| $ | 384,139 |
|
|
|
|
|
|
|
|
|
|
|
|
|
|
|
|
|
|
| Int'l Insurance |
|
| ||||||||||
|
| Year Ended December 31, 2015 |
|
| ||||||||||
amounts in thousands |
| Marine |
| P&C |
| Professional Liability |
| Total |
|
| ||||
Case reserves |
| $ | 167,157 |
| $ | 40,313 |
| $ | 19,583 |
| $ | 227,053 |
|
|
IBNR reserves |
|
| 61,409 |
|
| 19,735 |
|
| 63,229 |
|
| 144,373 |
|
|
Total |
| $ | 228,566 |
| $ | 60,048 |
| $ | 82,812 |
| $ | 371,426 |
|
|
|
|
|
|
|
|
|
|
|
|
|
|
|
|
|
|
| Int'l Insurance |
|
| ||||||||||
|
| Year Ended December 31, 2014 |
|
| ||||||||||
amounts in thousands |
| Marine |
| P&C |
| Professional Liability |
| Total |
|
| ||||
Case reserves |
| $ | 168,575 |
| $ | 41,695 |
| $ | 12,466 |
| $ | 222,736 |
|
|
IBNR reserves |
|
| 75,673 |
|
| 21,391 |
|
| 49,712 |
|
| 146,776 |
|
|
Total |
| $ | 244,248 |
| $ | 63,086 |
| $ | 62,178 |
| $ | 369,512 |
|
|
|
|
|
|
|
|
|
|
|
|
|
|
|
|
|
The following tables present the impact of changes in reserves and RRPs on our Net losses and LAE ratio for the years ended December 31, 2016, 2015 and 2014:
|
| Int'l Insurance |
| |||||||||||||
|
| Year Ended December 31, 2016 |
| |||||||||||||
|
|
|
|
|
|
|
|
|
| Professional |
|
|
|
|
| |
|
| Marine |
|
| P&C |
|
| Liability |
|
| Total |
| ||||
Net losses and LAE ratio, reported |
|
| 47.4 | % |
|
| 77.1 | % |
|
| 55.3 | % |
|
| 58.0 | % |
RRPs |
|
| -0.2 | % |
|
| -2.0 | % |
|
| 0.0 | % |
|
| -0.5 | % |
Additional net current AY release/(development) |
|
| -13.2 | % |
|
| -40.3 | % |
|
| 0.3 | % |
|
| -17.9 | % |
Net prior AY reserve release/(strengthening) |
|
| 15.5 | % |
|
| 7.7 | % |
|
| -5.4 | % |
|
| 8.1 | % |
Net losses and LAE ratio, adjusted |
|
| 49.5 | % |
|
| 42.5 | % |
|
| 50.2 | % |
|
| 47.7 | % |
39
|
| Int'l Insurance |
| |||||||||||||
|
| Year Ended December 31, 2015 |
| |||||||||||||
|
|
|
|
|
|
|
|
|
| Professional |
|
|
|
|
| |
|
| Marine |
|
| P&C |
|
| Liability |
|
| Total |
| ||||
Net losses and LAE ratio, reported |
|
| 53.4 | % |
|
| 37.0 | % |
|
| 62.3 | % |
|
| 51.8 | % |
RRPs |
|
| 1.3 | % |
|
| 0.3 | % |
|
| 0.0 | % |
|
| 0.8 | % |
Additional net current AY release/(development) |
|
| -16.0 | % |
|
| -12.6 | % |
|
| 0.0 | % |
|
| -11.8 | % |
Net prior AY reserve release/(strengthening) |
|
| 15.0 | % |
|
| 15.4 | % |
|
| -7.5 | % |
|
| 10.2 | % |
Net losses and LAE ratio, adjusted |
|
| 53.7 | % |
|
| 40.1 | % |
|
| 54.8 | % |
|
| 51.0 | % |
|
| Int'l Insurance |
| |||||||||||||
|
| Year Ended December 31, 2014 |
| |||||||||||||
|
|
|
|
|
|
|
|
|
| Professional |
|
|
|
|
| |
|
| Marine |
|
| P&C |
|
| Liability |
|
| Total |
| ||||
Net losses and LAE ratio, reported |
|
| 51.0 | % |
|
| 37.3 | % |
|
| 49.6 | % |
|
| 47.3 | % |
RRPs |
|
| -2.1 | % |
|
| -0.3 | % |
|
| 0.0 | % |
|
| -1.2 | % |
Additional net current AY release/(development) |
|
| -13.6 | % |
|
| 1.2 | % |
|
| 0.0 | % |
|
| -7.7 | % |
Net prior AY reserve release/(strengthening) |
|
| 21.5 | % |
|
| 6.1 | % |
|
| 6.9 | % |
|
| 15.3 | % |
Net losses and LAE ratio, adjusted |
|
| 56.8 | % |
|
| 44.3 | % |
|
| 56.5 | % |
|
| 53.7 | % |
|
|
|
|
|
|
|
|
|
|
|
|
|
|
|
|
|
For the year ended December 31, 2016, our Int'l Insurance reporting segment recorded $25.0 million of net prior AY reserve releases, driven by our Marine and P&C operating segments of $22.1 million and $7.1 million, respectively, related to favorable loss emergence. These releases were partially offset by $4.1 million of net prior AY reserve strengthening within our Professional Liability operating segment due to an increase in our reserve for uncollectible reinsurance. Additional net current AY reserve development of $55.7 million was mostly comprised of unfavorable loss emergence driven by a large Cargo loss in our Marine operating segment and large Offshore Energy losses in our P&C operating segment, as well as $17.4 million of CAT losses including $7.1 million due to Hurricane Matthew, $6.9 million related to the Alberta Wildfires, and $2.3 million due to the Taiwan Earthquake, predominantly from our Property business.
For the year ended December 31, 2015, our Int'l Insurance reporting segment recorded $26.2 million of prior AY reserve releases, driven by our Marine and P&C operating segments of $21.9 million and $8.5 million, respectively, related to favorable loss emergence. These releases were partially offset by $4.2 million of prior AY reserve strengthening within our Professional Liability operating segment due to a large loss. Current AY reserve development of $30.2 million was driven by our Marine and P&C operating segments of $23.3 million and $6.9 million, respectively, arising from large loss activity.
For the year ended December 31, 2014, our Int'l Insurance reporting segment recorded $38.3 million of net prior AY reserve releases primarily driven by our Marine operating segment of $31.7 million, our P&C operating segment of $3.8 million and our Professional Liability operating segment of $2.7 million, due to favorable loss emergence from prior years. These releases were partially offset by $19.2 million of current AY reserve strengthening within our Marine operating segment due to large loss activity in the current AY.
The changes in Net losses and LAE ratio, as adjusted, are primarily due to the mix of business earned driven by the repositioning of certain Hull and Cargo products in our Marine operating segment and certain E&O products within our Professional Liability operating segment.
Commission Expenses
The commission expense ratio for the year ended December 31, 2016 increased 3.3 percentage points as compared to the same period in 2015, mostly due to the mix of business earned, driven by a greater proportion of Property and E&O products, which carry higher gross commission rates, less proportional reinsurance, and additional RRP's.
40
The commission expense ratio for the year ended December 31, 2015 decreased 1.4 percentage points as compared to the same period in 2014, primarily driven by a favorable reduction in profit commission accrual of $0.9 million in our Marine operating segment as well as a $9.7 million decrease in RRPs as compared to the same period in 2014. These decreases were partially offset by overall growth in our Professional Liability operating segment which carries proportional reinsurance coverage that does not attract commission over-riders, as well as mix of business within our P&C operating segment principally by growth in our Property division which does not carry a proportional reinsurance program.
Other Operating Expenses
For the year ended December 31, 2016, Other operating expenses increased $10.5 million as compared to the same period in 2015, due to the growth of our P&C business, specifically our International Property and PV&T businesses. We also incurred higher Lloyd's charges due to increased volumes of European business attracting higher foreign levies. Increased costs also arose relating to additional support staff, costs associated with authorization of NIIC and related startup of operations, offset by favorable foreign exchange rates applied to GBP expenses incurred.
For the year ended December 31, 2015, Other operating expenses increased $10.6 million as compared to the same period in 2014, due to continued investment in new underwriting initiatives in continental Europe including new underwriting teams and additional support staff. Higher temporary employment expenses and professional fees were also incurred due to increased regulatory requirements, offset by favorable foreign exchange rates applied to GBP expenses incurred.
GlobalRe
The following table summarizes our financial results for our GlobalRe reporting segment for the years ended December 31, 2016, 2015 and 2014:
|
| GlobalRe |
|
|
|
|
|
|
|
|
| |||||||
|
| Years Ended December 31, |
|
| % Change |
|
| % Change |
| |||||||||
amounts in thousands |
| 2016 |
| 2015 |
| 2014 |
|
| 2016 vs 2015 |
|
| 2015 vs.2014 |
| |||||
Gross written premiums |
| $ | 165,045 |
| $ | 175,774 |
| $ | 200,341 |
|
|
| (6.1 | %) |
|
| (12.3 | %) |
Ceded written premiums |
|
| (8,356 | ) |
| (6,862 | ) |
| (5,311 | ) |
|
| 21.8 | % |
|
| 29.2 | % |
Net written premiums |
|
| 156,689 |
|
| 168,912 |
|
| 195,030 |
|
|
| (7.2 | %) |
|
| (13.4 | %) |
|
|
|
|
|
|
|
|
|
|
|
|
|
|
|
|
|
|
|
Net earned premiums |
| $ | 163,621 |
| $ | 168,291 |
| $ | 188,121 |
|
|
| (2.8 | %) |
|
| (10.5 | %) |
Net losses and LAE |
|
| (89,304 | ) |
| (94,399 | ) |
| (118,311 | ) |
|
| (5.4 | %) |
|
| (20.2 | %) |
Commission expenses |
|
| (34,008 | ) |
| (32,240 | ) |
| (33,429 | ) |
|
| 5.5 | % |
|
| (3.6 | %) |
Other operating expenses |
|
| (19,593 | ) |
| (16,242 | ) |
| (15,733 | ) |
|
| 20.6 | % |
|
| 3.2 | % |
Other underwriting income (expense) |
|
| 522 |
|
| 690 |
|
| 489 |
|
|
| (24.4 | %) |
|
| 41.1 | % |
|
|
|
|
|
|
|
|
|
|
|
|
|
|
|
|
|
|
|
Underwriting profit (loss) |
| $ | 21,238 |
| $ | 26,100 |
| $ | 21,137 |
|
|
| (18.6 | %) |
|
| 23.5 | % |
|
|
|
|
|
|
|
|
|
|
|
|
|
|
|
|
|
|
|
Losses and LAE ratio |
|
| 54.6 | % |
| 56.1 | % |
| 62.9 | % |
|
|
|
|
|
|
|
|
Commission expense ratio |
|
| 20.8 | % |
| 19.2 | % |
| 17.8 | % |
|
|
|
|
|
|
|
|
Other operating expense ratio (1) |
|
| 11.6 | % |
| 9.2 | % |
| 8.1 | % |
|
|
|
|
|
|
|
|
Combined ratio |
|
| 87.0 | % |
| 84.5 | % |
| 88.8 | % |
|
|
|
|
|
|
|
|
(1) - Includes Other operating expenses and Other underwriting income (expense).
Gross Written Premiums
Gross written premiums decreased $10.7 million for the year ended December 31, 2016 compared to the same period in 2015, primarily due to the nonrenewal of a significant excess of loss treaty within our A&H product and to a lesser extent rate reductions in our Marine product. The decline in Gross written premiums was partially offset by new premiums in our P&C, Professional Liability and Agriculture products and to a lesser extent an increase in assumed RRPs in our P&C and Marine products.
Gross written premiums decreased $24.6 million for the year ended December 31, 2015 compared to the same period in 2014, primarily due to the nonrenewal of a significant multiple peril crop quota share treaty within our Agriculture product and to a lesser extent nonrenewals in our Marine product and lower assumed RRPs in our P&C and Marine products. The decline in Gross written premiums was partially offset by an increase in renewal premiums in our A&H and P&C products.
41
Ceded Written Premiums
Ceded written premiums increased $1.5 million for the year ended December 31, 2016 compared to the same period in 2015, primarily due to an increase in ceded RRPs in our Marine product and an increase in excess of loss costs in our P&C product.
Ceded written premiums increased $1.6 million for the year ended December 31, 2015 compared to the same period in 2014, primarily due to two additional retrocessional treaties written in 2015 for our Surety product, as well as increased renewal cost for a retrocessional treaty, which covers our P&C product.
Net Earned Premiums
Net earned premiums decreased $4.7 million for the year ended December 31, 2016 compared to the same period in 2015, primarily due to significant non-renewals in our A&H products, and to a lesser extent, rate reductions in our Marine product. This decline was partially offset by a change in estimated earnings in our Surety product, growth in our P&C, Agriculture and Professional Liability products, as well as an increase in assumed RRPs in our P&C product.
Net earned premiums decreased $19.8 million for the year ended December 31, 2015 compared to the same period in 2014, primarily due to the nonrenewal of business in our Agriculture and Marine products and less assumed RRPs than in prior year. The decline in Net earned premium was partially offset by growth in our A&H and P&C products.
Net Losses and LAE
The Net losses and LAE reserves as of December 31, 2016, 2015 and 2014 are as follows:
|
| GlobalRe |
| |||||||
|
| Years Ended December 31, |
| |||||||
amounts in thousands |
| 2016 |
| 2015 |
| 2014 |
| |||
Case reserves |
| $ | 47,505 |
| $ | 32,160 |
| $ | 31,108 |
|
IBNR reserves |
|
| 67,856 |
|
| 76,616 |
|
| 90,580 |
|
Total |
| $ | 115,361 |
| $ | 108,776 |
| $ | 121,688 |
|
The following table presents the changes in reserves and RRPs on our Net losses and LAE ratio for the years ended December 31, 2016, 2015 and 2014:
|
| GlobalRe |
| |||||||||
|
| Years Ended December 31, |
| |||||||||
|
| 2016 |
|
| 2015 |
|
| 2014 |
| |||
Net losses and LAE ratio, reported |
|
| 54.6 | % |
|
| 56.1 | % |
|
| 62.9 | % |
RRPs |
|
| 0.6 | % |
|
| 0.3 | % |
|
| 1.4 | % |
Additional net current AY release/(development) |
|
| -2.4 | % |
|
| -2.0 | % |
|
| 0.0 | % |
Net prior AY reserve release/(strengthening) |
|
| 1.3 | % |
|
| 5.5 | % |
|
| 1.2 | % |
Net losses and LAE ratio, adjusted |
|
| 54.1 | % |
|
| 59.9 | % |
|
| 65.5 | % |
For the year ended December 31, 2016, our GlobalRe reporting segment recorded additional net current AY reserve development of $3.9 million, of which $9.3 million was due to CAT losses including $5.1 million related to the Alberta Wildfires, $2.7 million due to the Ecuador Earthquake and $0.9 million due to the Taiwan Earthquake, partially offset by $5.4 million of favorable loss emergence on the current AY, mostly driven by our A&H product. In addition, we recorded $2.2 million of net prior AY reserve release driven by favorable loss emergence mostly from our A&H product and $1.6 million of net RRP benefit primarily from our P&C and Marine products.
For the year ended December 31, 2015, our GlobalRe reporting segment recorded $9.1 million of net prior AY reserve releases primarily driven by $5.2 million, $2.8 million and $2.0 million of reserve releases from our Marine, P&C and A&H products, respectively, due to lower than expected loss activity. In addition, $0.8 million of RRPs received reduced our Net losses and LAE ratio, primarily driven by our Marine product. The prior AY reserve releases were partially offset by $2.8 million current year strengthening in our Marine product, related to two large losses in 2015.
For the year ended December 31, 2014, our GlobalRe reporting segment recorded $2.1 million of net prior AY reserve releases primarily driven by $2.0 million of reserve releases from our Marine product, due to lower than expected loss activity. In addition, $4.0 million of RRPs received reduced our Net losses and LAE ratio, primarily driven by our Marine and P&C products. The prior AY reserve releases were partially offset by reserve prior AY strengthening in our A&H and Agriculture products.
42
The changes in Net lo sses and LAE ratio, as adjusted, are primarily due to mix of business earned, driven by less Net earned premium within our A&H product, which attracted higher ultimate loss ratios, partially offset by our P&C product.
Commission Expenses
The Commission expense ratio increased 1.6 percentage points for the year ended December 31, 2016 compared to the same period in 2015, resulting from an increase in earned premium for our P&C, Agriculture and Professional Liability products that attract higher commission rates, as well as additional profit commission expenses in our A&H and P&C products.
The Commission expense ratio increased 1.4 percentage points for the year ended December 31, 2015 compared to the same period in 2014, resulting from an increase in profit commission expenses in our A&H and P&C products.
Other Operating Expenses
Other operating expenses increased $3.4 million for the year ended December 31, 2016 compared to the same period in 2015, due to growth in our underwriting teams and support staff, as well as increases in the allocation of corporate overhead.
Other operating expenses increased $0.5 million for the year ended December 31, 2015, compared to the same period in 2014, due to continued investment in our underwriting teams and support staff, as well as an increase in our professional service fees and information technology expenses to support business growth and initiatives.
Capital Resources and Liquidity
Capital Resources
Our capital resources consist of funds deployed or available to be deployed to support our business operations. As of December 31, 2016 and 2015, our capital resources were as follows:
|
| Years Ended December 31, |
| |||||
amounts in thousands |
| 2016 |
|
| 2015 |
| ||
Senior notes |
| $ | 263,728 |
|
| $ | 263,580 |
|
Stockholders' equity |
|
| 1,178,188 |
|
|
| 1,096,148 |
|
Total capitalization |
| $ | 1,441,916 |
|
| $ | 1,359,728 |
|
|
|
|
|
|
|
|
|
|
Ratio of debt to total capitalization |
|
| 18.3 | % |
|
| 19.4 | % |
As part of our capital management program, we may seek to raise additional capital or may seek to return capital to our stockholders through share repurchases, cash dividends or other methods (or a combination of such methods). Any such determination will be at the discretion of our Parent Company's Board of Directors and will be dependent upon our profits, financial requirements and other factors, including legal restrictions, rating agency requirements, credit facility limitations and such other factors as our Board of Directors deems relevant.
We primarily rely upon dividends from our subsidiaries to meet our Parent Company's obligations. Our Parent Company's cash obligations primarily consist of semi-annual (April and October) interest payments of $7.6 million on the Senior notes.
Navigators Insurance Company may pay dividends to our Parent Company out of our statutory earned surplus pursuant to statutory restrictions imposed under the New York insurance law. As of December 31, 2016, the maximum amount available for the payment of dividends by Navigators Insurance Company in 2017 without prior regulatory approval is $102.7 million.
Navigators Corporate Underwriters, Ltd., our wholly-owned corporate member at Lloyd's, may pay dividends to our Parent Company up to the extent of available profits that have been distributed from the Syndicate. As of December 31, 2016, that amount was $3.0 million (£2.4 million).
Senior Notes and Credit Facility
On October 4, 2013, we completed a public debt offering for $265.0 million of 5.75% Senior notes and received net proceeds of $263.3 million. The effective interest rate related to the net proceeds received from the 5.75% Senior notes is approximately 5.86%. Interest is payable on the 5.75% Senior notes each April 15 and October 15.
43
On November 4, 2016, NUAL entered into a credit facility for 14.0 million Australian Dollars with Barclays Bank PLC. Interest is payable under this facility at a rate of 1.25% per annum. The facility may be cancelled by either party after providing written notice. This credit facility contains customary covenants for fa cilities of this type, including a restriction on future encumbrances that are outside the ordinary course of business, and a requirement to maintain at least £75.0 million of Funds at Lloyd's. As of December 31, 2016, letters of credit with an aggregate f ace amount of 14.0 million Australian Dollars were outstanding under the credit facility, and our Company was in compliance with all covenants.
On November 7, 2016, we entered into a credit facility agreement with ING Bank N.V., London Branch, individually and as Administrative Agent and a syndicate of lenders (the "Club Facility"), which is secured by all the common stock of NIC and requires us to maintain at least forty percent of the outstanding amounts under such facility as Funds at Lloyd's. The Club Facility has two tranches with one tranche extending a $140.0 million commitment and the other tranche extending a £60.0 million commitment. In addition, in order to support the increased underwriting capacity of the Syndicate for the 2017 UWY, we amended that certain $25.0 million credit facility with ING Bank N.V., London Branch dated November 20, 2015, on November 7, 2016 to extend the term for an additional two years (the "Bilateral Facility"). Both of these facilities, as well as the November 4, 2016 facility, are used to fund underwriting obligations at Lloyd's for the 2017 UWY, as well as open prior UWYs.
The Bilateral Facility is a non-committed facility which has an applicable fee rate ranging from 0.85% to 1.20% per annum based upon our Company's S&P rating. For the Club Facility the applicable fee rate payable ranges from 0.95% to 1.60% per annum based on a tiered schedule that is based on our then-current financial strength ratings issued by S&P and A.M. Best and the amount of our own collateral utilized to fund our participation in the Syndicate. If any letters of credit remain outstanding under these facilities after December 31, 2018, we would be required to post additional collateral to secure the remaining letters of credit. As of December 31, 2016, letters of credit with an aggregate face amount of $125.0 million and £60.0 million were outstanding under the Club Facility and we had an aggregate of $1.1 million of cash collateral posted. As of December 31, 2016 there were no letters of credit outstanding under the Bilateral Facility.
The Bilateral and Club Facilities contain customary covenants for facilities of this type, including restrictions on indebtedness and liens, limitations on mergers, dividends and the sale of assets, and requirements as to maintaining certain consolidated tangible net worth, statutory surplus and other financial ratios. These credit facilities also provide for customary events of default, including failure to pay principal, interest or fees when due, failure to comply with covenants, any representation or warranty made by our Company being false in any material respect, default under certain other indebtedness, certain insolvency or receivership events affecting our Company and our subsidiaries, the occurrence of certain material judgments, or a change in control of our Company. As of December 31, 2016, our Company was in compliance with all covenants.
Shelf Registration
We generally maintain the ability to issue certain classes of debt and equity securities via a universal shelf registration statement filed with the SEC, which is renewed every three years. The shelf registration provides us the means to access the debt and equity markets relatively quickly. Our current shelf registration was filed on April 14, 2015 with the SEC and expires in 2018. This report is not an offer to sell or the solicitation of an offer to buy nor shall there be any sale of these securities in any state in which such offer, solicitation or sale would be unlawful prior to registration or qualification under the securities laws of such state.
Consolidated Cash Flows
We believe that the cash flow generated by the operating activities of our subsidiaries will provide sufficient funds for us to meet our liquidity needs over the next twelve months. Beyond the next twelve months, our cash flow available may be influenced by a variety of factors, including general economic conditions and conditions in the insurance and reinsurance markets, as well as fluctuations from year to year in claims experience.
We believe that we have adequately managed our cash flow requirements related to reinsurance recoveries from their positive cash flows and the use of available short-term funds when applicable. However, there can be no assurances that we will be able to continue to adequately manage such recoveries in the future or that collection disputes or reinsurer insolvencies will not arise that could materially increase the collection time lags or result in recoverable write-offs causing additional incurred losses and liquidity constraints to our Company. The payment of gross claims and related collections from reinsurers with respect to large losses could significantly impact our liquidity needs. However, in general, we expect to collect our paid reinsurance recoverables under the terms described above.
44
Net cash provided by operating activities was $224.2 million for the year ended December 31, 2016 compared to $227.6 million for the same period in 2015. The decrease in cash flow from operations was due to increased claims and operating expense payments which marginally exceeded higher premium collections and investment income driven by overall growth in our business.
Net cash used in investing activities was $211.4 million for the year ended December 31, 2016 compared to $249.9 million for the comparable period in 2015. The decrease in cash used in investing activities reflects higher net investment purchases in 2015 as compared with 2016 as we deployed excess cash held at December 31, 2014 into our investment portfolio.
Net cash used in financing activities was $2.1 million for the year ended December 31, 2016 compared with net cash provided by financing activities of $1.4 million for the same period in 2015. The fluctuation in cash used in financing activities is the result of instituting a quarterly cash dividend paid on our Company's Common stock in the third quarter.
Ratings
Our ability to underwrite business is dependent upon the financial strength of NIC, NSIC and Lloyd's business. Financial strength ratings represent the opinions of the rating agencies on the financial strength of a company and its capacity to meet the obligations of insurance policies. Independent ratings are important to our competitive position in the insurance markets. The rating agencies consider many factors in determining the financial strength rating of an insurance company, including the relative level of statutory surplus necessary to support the business operations of our Company. These ratings are based upon factors relevant to policyholders, agents and intermediaries and are not directed toward the protection of investors. Such ratings are not recommendations to buy, sell or hold securities. We could be adversely impacted by a downgrade in our financial strength ratings, including a possible reduction in demand for our products, higher borrowing costs and our ability to access the capital markets.
U.S. insurance companies, NIC and NSIC, utilize the financial strength ratings from A.M. Best and S&P for underwriting purposes. NIC and NSIC are both rated "A" (Excellent – stable outlook) by A.M. Best and "A" (Strong - stable outlook) by S&P. The Syndicate utilizes the ratings from A.M. Best and S&P for underwriting purposes, which apply to all Lloyd's syndicates. Lloyd's is rated "A" (Excellent – positive outlook) by A.M. Best and A+ (Strong – stable outlook) by S&P.
In May 2016, our Company received authorization from the PRA and the FCA for a new U.K. based insurance company, NIIC, which we expect to begin writing business in the first quarter of 2017. NIIC utilizes the financial strength rating from S&P for underwriting purposes, and is rated "A" (Strong – stable outlook) by S&P.
Debt ratings apply to short-term and long-term debt as well as preferred stock. These ratings are assessments of the likelihood that we will make timely payments of the principal and interest for our senior debt. It is possible that, in the future, one or more of the rating agencies may reduce our existing debt ratings. If one or more of our debt ratings were downgraded, we could incur higher borrowing costs and our ability to access the capital markets could be impacted.
We utilize the senior debt ratings from S&P. Our senior debt is rated BBB (Adequate) by S&P.
Off –Balance Sheet Transactions
We have no material off-balance sheet transactions with the exception of our letter of credit facilities.
Contractual Obligations
The following table sets forth the best estimate of our known contractual obligations with respect to the items indicated as of December 31, 2016:
|
| Payments Due by Period |
| |||||||||||||||||
amounts in thousands |
| Total |
|
| Less than 1 Year |
|
| 1-3 Years |
|
| 3-5 Years |
|
| Thereafter |
| |||||
Reserves for losses and LAE (1) |
| $ | 2,289,727 |
|
| $ | 722,151 |
|
| $ | 834,649 |
|
| $ | 406,027 |
|
| $ | 326,900 |
|
5.75% Senior notes (2) |
|
| 368,489 |
|
|
| 15,238 |
|
|
| 30,475 |
|
|
| 30,475 |
|
|
| 292,301 |
|
Operating leases (3) |
|
| 88,870 |
|
|
| 13,024 |
|
|
| 20,950 |
|
|
| 16,629 |
|
|
| 38,267 |
|
Total |
| $ | 2,747,086 |
|
| $ | 750,413 |
|
| $ | 886,074 |
|
| $ | 453,131 |
|
| $ | 657,468 |
|
(1) | The amounts determined are estimates which are subject to a high degree of variation and uncertainty, and are not subject to any specific payment schedule since the timing of these obligations are not set contractually. The amounts in the above table exclude reinsurance recoveries of $779.3 million. See "Business – Loss Reserves" included herein. |
45
(2) | Includes interest payments. |
(3) | Obligation includes rent and rent items. Rent items are estimates based on the lease agreement due to uncontrollable fluctuations of actual costs. |
Investments
Our investment portfolio is invested primarily in publicly traded, investment grade, fixed income securities with an average credit quality of AA-/Aa3 as rated by S&P or Moody's Investors Service ("Moody's"). As of December 31, 2016, our portfolio had a duration of 3.7 years. Management periodically projects cash flow of the investment portfolio and other sources in order to maintain the appropriate levels of liquidity in an effort to ensure our ability to satisfy claims. As of December 31, 2016 and December 31, 2015, all fixed maturities and equity securities held by us were classified as available-for-sale.
Our portfolio is externally managed by independent, professional investment managers and is broadly diversified across geographies, sectors, and issuers. The primary objectives are to maximize total investment return in the context of preserving and enhancing stockholder value and the statutory surplus of our regulated insurance companies. As part of our overall investment strategy, we seek to build a tax efficient investment portfolio by maintaining an allocation to tax exempt municipal bonds. As of December 31, 2016, the tax-exempt portion of our fixed maturities portfolio was approximately 17.1%. Additionally, substantially all of our equity portfolio is invested in tax efficient securities which qualify for the dividends received deduction. Our investments are subject to the oversight of the respective insurance companies' Boards of Directors and the Finance Committee of the Parent Company's Board of Directors.
We are a specialty insurance company and periods of moderate economic recession or inflation tend not to have a significant direct effect on underwriting operations. They do, however, impact our investment portfolio. A decrease in interest rates will tend to decrease our yield and have a positive effect on the fair value of our invested assets. An increase in interest rates will tend to increase our yield and have a negative effect on the fair value of our invested assets.
The following table summarizes the composition of our available- for- sale investments at fair value:
|
| Fair Value as of December 31, |
|
|
|
|
| |||||
amounts in thousands |
| 2016 |
|
| 2015 |
|
| % Change |
| |||
Fixed maturities: |
|
|
|
|
|
|
|
|
|
|
|
|
U.S. Treasury bonds, agency bonds and foreign government bonds |
| $ | 273,776 |
|
| $ | 252,882 |
|
|
| 8.3 | % |
States, municipalities and political subdivisions |
|
| 547,415 |
|
|
| 576,859 |
|
|
| (5.1 | %) |
Mortgage-backed and asset-backed securities: |
|
|
|
|
|
|
|
|
|
|
|
|
Agency mortgage-backed securities |
|
| 487,364 |
|
|
| 379,269 |
|
|
| 28.5 | % |
Residential mortgage obligations |
|
| 20,530 |
|
|
| 30,465 |
|
|
| (32.6 | %) |
Asset-backed securities |
|
| 314,601 |
|
|
| 225,012 |
|
|
| 39.8 | % |
Commercial mortgage-backed securities |
|
| 154,139 |
|
|
| 189,713 |
|
|
| (18.8 | %) |
Subtotal |
| $ | 976,634 |
|
| $ | 824,459 |
|
|
| 18.5 | % |
Corporate bonds |
|
| 838,057 |
|
|
| 760,010 |
|
|
| 10.3 | % |
Total fixed maturities |
| $ | 2,635,882 |
|
| $ | 2,414,210 |
|
|
| 9.2 | % |
Equity securities |
|
| 349,142 |
|
|
| 305,271 |
|
|
| 14.4 | % |
Short-term investments |
|
| 143,539 |
|
|
| 217,745 |
|
|
| (34.1 | %) |
Total investments |
| $ | 3,128,563 |
|
| $ | 2,937,226 |
|
|
| 6.5 | % |
Invested assets increased from December 31, 2015 due to strong operating cash flows. Operating cash flows were primarily directed to Asset-backed securities and Agency mortgage-backed securities as we look to manage duration given the prospects for higher interest rates in the future. Additionally, a portion of our operating cash flows were invested in tax efficient common and preferred equity securities to compensate for lower yields in fixed maturities. The decrease in short term investments is due to the capitalization of NIIC and the subsequent redeployment of funds into our Fixed maturities portfolio.
46
The following table sets forth the amount of our Fixed maturities as of December 31, 2016 by S&P credit rating or, if an S &P rating is not available, the equivalent Moody's rating. The total rating is the weighted average quality rating for the fixed maturities portfolio as a whole.
|
|
|
| December 31, 2016 |
| |||||
amounts in thousands |
| Rating |
| Fair Value |
|
| Amortized Cost |
| ||
Rating description: |
|
|
|
|
|
|
|
|
|
|
Extremely strong |
| AAA |
| $ | 415,047 |
|
| $ | 415,872 |
|
Very strong |
| AA |
|
| 1,121,058 |
|
|
| 1,116,649 |
|
Strong |
| A |
|
| 697,713 |
|
|
| 697,418 |
|
Adequate |
| BBB |
|
| 323,334 |
|
|
| 320,316 |
|
Speculative |
| BB & Below |
|
| 78,730 |
|
|
| 77,970 |
|
Total |
| AA- |
| $ | 2,635,882 |
|
| $ | 2,628,225 |
|
The following table sets forth the composition of the non-government guaranteed fixed maturities categorized by asset class and generally equivalent S&P and Moody's ratings (not all securities in our portfolio are rated by both S&P and Moody's):
|
| As of December 31, 2016 |
| |||||||||||||||||||||||||
amounts in thousands |
| AAA |
|
| AA |
|
| A |
|
| BBB |
|
| BB and below |
|
| Fair Value |
|
| Amortized Cost |
| |||||||
Municipal bonds |
| $ | 41,218 |
|
| $ | 359,515 |
|
| $ | 129,726 |
|
| $ | 16,956 |
|
| $ | - |
|
| $ | 547,415 |
|
| $ | 539,909 |
|
Agency residential mortgage-backed |
|
| - |
|
|
| 487,364 |
|
|
| - |
|
|
| - |
|
|
| - |
|
|
| 487,364 |
|
|
| 489,933 |
|
Residential mortgage-backed |
|
| 13,538 |
|
|
| - |
|
|
| 81 |
|
|
| 1,243 |
|
|
| 5,668 |
|
|
| 20,530 |
|
|
| 20,132 |
|
Asset-backed |
|
| 149,375 |
|
|
| 29,798 |
|
|
| 115,217 |
|
|
| 20,211 |
|
|
| - |
|
|
| 314,601 |
|
|
| 314,955 |
|
Commercial mortgage-backed |
|
| 95,800 |
|
|
| 42,066 |
|
|
| 16,273 |
|
|
| - |
|
|
| - |
|
|
| 154,139 |
|
|
| 153,184 |
|
Corporate bonds |
|
| 10,308 |
|
|
| 65,263 |
|
|
| 404,500 |
|
|
| 284,924 |
|
|
| 73,062 |
|
|
| 838,057 |
|
|
| 833,400 |
|
Total |
| $ | 310,239 |
|
| $ | 984,006 |
|
| $ | 665,797 |
|
| $ | 323,334 |
|
| $ | 78,730 |
|
| $ | 2,362,106 |
|
| $ | 2,351,513 |
|
The following table sets forth our U.S. Treasury bonds, agency bonds and foreign government bonds, as well as our state, municipality and political subdivision bond holdings by type:
|
| As of December 31, 2016 |
| |||||
amounts in thousands |
| Fair Value |
|
| Amortized Cost |
| ||
U.S. Treasury bonds, agency bonds and foreign government bonds: |
|
|
|
|
|
|
|
|
U.S. Treasury bonds |
| $ | 47,704 |
|
| $ | 46,922 |
|
Agency bonds |
|
| 79,297 |
|
|
| 78,709 |
|
Foreign government bonds |
|
| 146,775 |
|
|
| 151,081 |
|
Total U.S. Treasury bonds, agency bonds and foreign government bonds |
| $ | 273,776 |
|
| $ | 276,712 |
|
|
|
|
|
|
|
|
|
|
States, municipalities and political subdivisions: |
|
|
|
|
|
|
|
|
General obligation |
| $ | 139,686 |
|
| $ | 138,642 |
|
Prerefunded |
|
| 25,822 |
|
|
| 25,050 |
|
Revenue |
|
| 284,889 |
|
|
| 279,068 |
|
Taxable |
|
| 97,018 |
|
|
| 97,149 |
|
Total States, municipalities and political subdivisions |
| $ | 547,415 |
|
| $ | 539,909 |
|
As of December 31, 2016, we own $48.2 million of municipal securities, which are credit enhanced by various financial guarantors which have an average underlying credit rating of AA-.
47
The following table sets forth our agency mortgage-backed securities ("AMBS") issued by the Government National Mortgage Association ("GNMA"), Federal National Mortgage Association ("FNMA") and Federal Home Loan Mortgage Corporation ("FHLMC") and the quality category (prime, Alternative A-paper ("Alt-A") and subprime) for resident ial mortgage -backed securities ("RMBS") as of December 31, 2016:
|
| As of December 31, 2016 |
| |||||
amounts in thousands |
| Fair Value |
|
| Amortized Cost |
| ||
AMBS: |
|
|
|
|
|
|
|
|
GNMA |
| $ | 55,331 |
|
| $ | 54,259 |
|
FNMA |
|
| 307,958 |
|
|
| 310,750 |
|
FHLMC |
|
| 124,075 |
|
|
| 124,924 |
|
Total agency mortgage-backed securities |
| $ | 487,364 |
|
| $ | 489,933 |
|
|
|
|
|
|
|
|
|
|
RMBS: |
|
|
|
|
|
|
|
|
Prime |
| $ | 5,852 |
|
| $ | 5,552 |
|
Alt-A and subprime |
|
| 1,140 |
|
|
| 1,064 |
|
Non-U.S. RMBS |
|
| 13,538 |
|
|
| 13,516 |
|
Total residential mortgage-backed securities |
| $ | 20,530 |
|
| $ | 20,132 |
|
We analyze our mortgage-backed securities by credit quality of the underlying collateral distinguishing between the securities issued by FNMA, FHLMC and GNMA, which are federal government sponsored entities, and non-FNMA and non-FHLMC securities broken out by prime, Alt-A and subprime collateral. The securities issued by FNMA and FHLMC are the obligations of each respective entity. The U.S. Department of the Treasury has agreed to provide support to FNMA and FHLMC under a Preferred Stock Purchase Agreement by committing to make quarterly payments to these enterprises, if needed, to maintain a zero net worth.
Prime collateral consists of mortgages or other collateral from the most creditworthy borrowers. Alt-A collateral consists of mortgages or other collateral from borrowers, which have a risk potential greater than prime but less than subprime. The subprime collateral consists of mortgages or other collateral from borrowers with low credit ratings. Such subprime and Alt-A categories are as defined by S&P.
Details of the collateral of our asset-backed securities portfolio as of December 31, 2016 are presented below:
|
| As of December 31, 2016 |
| |||||
amounts in thousands |
| Fair Value |
|
| Amortized Cost |
| ||
Auto loans |
| $ | 37,685 |
|
| $ | 37,772 |
|
Credit cards |
|
| 30,307 |
|
|
| 30,289 |
|
Collateralized loan obligations |
|
| 99,589 |
|
|
| 99,829 |
|
Time share |
|
| 48,565 |
|
|
| 48,983 |
|
Aircraft |
|
| 21,335 |
|
|
| 21,182 |
|
Consumer Loans |
|
| 35,634 |
|
|
| 35,542 |
|
Other |
|
| 41,486 |
|
|
| 41,358 |
|
Total |
| $ | 314,601 |
|
| $ | 314,955 |
|
We hold non-sovereign securities where the issuer is located in the Euro Area, an economic and monetary union of certain member states within the European Union that have adopted the Euro as their common currency. As of December 31, 2016, the fair value of such securities was $106.6 million, with an amortized cost of $106.8 million, representing 3.6% of our total fixed maturities and equity portfolio. Of this amount, approximately 26.3% represent securities issued by financial institutions domiciled or operating in the Euro Area. Our largest exposure is in the Netherlands with a total of $39.1 million followed by France with a total of $31.3 million. We have no direct exposure to Greece, Portugal, Italy or Spain within the Euro Area as of December 31, 2016.
48
The following table summarizes the gross unrealized investment losses as of December 31, 2016 by length of time where the fair value was less than 80.0% of amortized cost:
|
| As of December 31, 2016 |
| |||||||||
|
| Fixed |
|
| Equity |
|
|
|
|
| ||
amounts in thousands |
| Maturities |
|
| Securities |
|
| Total |
| |||
Less than twelve months |
| $ | - |
|
| $ | - |
|
| $ | - |
|
Twelve months or longer |
|
| 1,476 |
|
|
| - |
|
|
| 1,476 |
|
Total |
| $ | 1,476 |
|
| $ | - |
|
| $ | 1,476 |
|
The twelve months or longer unrealized loss of $1.5 million is due to unfavorable foreign exchange movement in our Canadian portfolio.
During the year ended December 31, 2016, we recognized one credit related OTTI loss of $0.2 million in our Fixed maturities portfolio. During the year ended December 31, 2015, we recognized three credit related OTTI losses of $1.7 million for certain common stocks in the energy sector and aerospace industry. Our Company did not have credit related OTTI losses for the year ended December 31, 2014.
The fair value of our investment portfolio may fluctuate significantly in response to various factors such as changes in interest rates, investment quality ratings, equity prices, foreign exchange rates and credit spreads. We do not have the intent to sell nor is it more likely than not that we will have to sell Fixed maturities in unrealized loss positions that are not other-than-temporarily impaired before recovery. For structured securities, default probability and severity assumptions differ based on property type, vintage and the stress of the collateral. We do not intend to sell any of these securities and it is more likely than not that, we will not be required to sell these securities before the recovery of the amortized cost basis. For Equity securities, we also consider our intent to hold securities as part of the process of evaluating whether a decline in fair value represents an other-than-temporary decline in value. We may realize investment losses to the extent our liquidity needs require the disposition of Fixed maturity securities in unfavorable interest rate, liquidity or credit spread environments. Significant changes in the factors we consider when evaluating investments for impairment losses could result in a significant change in impairment losses reported in the Consolidated Financial Statements.
Reserves for losses and LAE for loss events
Our Company monitors the development of paid and reported claims activities in relation to the estimate of ultimate losses established for loss events. Actual losses from such loss events may differ materially from the estimated losses generally due to the receipt of additional information from insureds or brokers, inflation in repair costs due to the limited availability of labor and materials or the attribution of losses to coverages, which our Company assumed we would not have exposure to.
Asbestos Liability
Our exposure to asbestos liability principally stems from our Marine Liability product insurance written on an occurrence basis during the mid-1980s. In general, our participation on such risks is in the excess layers, which requires the underlying coverage to be exhausted prior to coverage being triggered in our layer. In many instances, we are one of many insurers who participate in the defense and ultimate settlement of these claims, and we are generally a minor participant in the overall insurance coverage and settlement.
The reserves for asbestos exposures as of December 31, 2016 are for: (i) one large settled claim for excess insurance policy limits exposed to a class action suit against an insured involved in the manufacturing or distribution of asbestos products being paid over several years and (ii) attritional asbestos claims that could be expected to occur over time. Substantially all of our asbestos liability reserves are included in our U.S. Marine operating segment loss reserves.
There can be no assurances that material loss development may not arise in the future from existing asbestos claims or new claims given the evolving and complex legal environment that may directly affect the outcome of the asbestos exposures of our insureds.
The following tables set forth our gross and net losses and LAE reserves, incurred losses and LAE, and payments for our asbestos exposures for the periods indicated:
49
|
| Years Ended December 31, |
| |||||||||
amounts in thousands |
| 2016 |
|
| 2015 |
|
| 2014 |
| |||
Gross of Reinsurance |
|
|
|
|
|
|
|
|
|
|
|
|
Beginning gross reserves |
| $ | 15,256 |
|
| $ | 15,370 |
|
| $ | 15,519 |
|
Plus: Incurred losses & LAE |
|
| 90 |
|
|
| (43 | ) |
|
| 527 |
|
Less: Calendar year payments |
|
| 133 |
|
|
| 71 |
|
|
| 676 |
|
Ending gross reserves |
| $ | 15,213 |
|
| $ | 15,256 |
|
| $ | 15,370 |
|
|
|
|
|
|
|
|
|
|
|
|
|
|
Gross case loss reserves |
| $ | 12,948 |
|
| $ | 12,991 |
|
| $ | 13,105 |
|
Gross IBNR loss reserves |
|
| 2,265 |
|
|
| 2,265 |
|
|
| 2,265 |
|
Ending gross reserves |
| $ | 15,213 |
|
| $ | 15,256 |
|
| $ | 15,370 |
|
|
|
|
|
|
|
|
|
|
|
|
|
|
Net of Reinsurance |
|
|
|
|
|
|
|
|
|
|
|
|
Beginning net reserves |
| $ | 10,200 |
|
| $ | 10,291 |
|
| $ | 10,314 |
|
Plus: Incurred losses & LAE |
|
| 65 |
|
|
| (1,092 | ) |
|
| (2,068 | ) |
Less: Calendar year payments |
|
| 62 |
|
|
| (1,001 | ) |
|
| (2,045 | ) |
Ending net reserves |
| $ | 10,203 |
|
| $ | 10,200 |
|
| $ | 10,291 |
|
|
|
|
|
|
|
|
|
|
|
|
|
|
Net case loss reserves |
| $ | 8,143 |
|
| $ | 8,140 |
|
| $ | 8,231 |
|
Net IBNR loss reserves |
|
| 2,060 |
|
|
| 2,060 |
|
|
| 2,060 |
|
Ending net reserves |
| $ | 10,203 |
|
| $ | 10,200 |
|
| $ | 10,291 |
|
Catastrophe Risk Management
Our Company has exposure to losses caused by hurricanes, earthquakes, and other natural and man-made catastrophic events. The frequency and severity of catastrophic events is unpredictable. The extent of covered losses from a catastrophe is a function of both the total amount of insured exposure in an area affected by the event and the severity of the event. We continually assess the concentration of underwriting exposures in catastrophe-exposed areas globally and manage this exposure through individual risk selection and through the purchase of reinsurance. Our Company also uses modeling and concentration management tools that allow better monitoring and better control of the accumulations of potential losses from catastrophe events. Despite these efforts, there remains uncertainty about the characteristics, timing and extent of insured losses given the unpredictable nature of catastrophes. The occurrence of one or more catastrophic events could have a material adverse effect on our results of operations, financial condition and/or liquidity.
Our Company has significant natural catastrophe exposures throughout the world. We estimate that the largest exposure to loss from a single natural catastrophe event comes from a hurricane on the east coast of the U.S. As of December 31, 2016, our Company estimates that the probable maximum pre-tax gross and net loss exposure from such a hurricane event would be approximately $140.0 million and $46.1 million, respectively, including the cost of RRPs.
Like all catastrophe exposure estimates, the foregoing estimate of the probable maximum loss is inherently uncertain. This estimate is highly dependent upon numerous assumptions and subjective underwriting judgments. Examples of significant assumptions and judgments related to such an estimate include the intensity, depth and location of a hurricane, the various types of the insured risks exposed to the event at the time the event occurs and the estimated costs or damages incurred for each insured risk. The composition of the portfolio also makes such estimates challenging due to the non-static nature of the exposures covered under the policies in products such as Cargo and Hull. There can be no assurances that the gross and net loss amounts that our Company could incur in such an event or in any natural catastrophe event would not be materially higher than the estimates discussed above given the significant uncertainties with respect to such an estimate. Moreover, the portfolio of insured risks changes dynamically over time and there can be no assurance that the probable maximum loss will not change materially over time.
The occurrence of large loss events could reduce the reinsurance coverage that is available to our Company and could weaken the financial condition of the reinsurers, which could have a material adverse effect on our results of operations. Although the reinsurance agreements make the reinsurers liable to our Company to the extent the risk is transferred or ceded to the reinsurer, ceded reinsurance arrangements do not eliminate the obligation to pay claims to policyholders, as our Company is required to pay the losses if a reinsurer fails to meet its obligations under the reinsurance agreement.
Our Company utilizes reinsurance principally to reduce the exposure on individual risks, to protect against catastrophic losses and to stabilize loss ratios and underwriting results. Our Company is protected by various treaty and facultative reinsurance agreements. The
50
reinsurance is placed either directly by our Company or through reinsurance intermediaries. The reinsurance intermediaries are compensated by the reinsurers.
Alberta Wildfires, Hurricanes Joaquin, Gustav and Ike, and Superstorm Sandy
The following natural disasters generated substantial losses within our U.S. and Int'l Marine operating segments and our Energy & Engineering divisions within our U.S. and Int'l P&C operating segments: the Alberta Wildfires, which occurred in the second quarter of 2016, Hurricane Joaquin, which occurred in the fourth quarter of 2015, Superstorm Sandy, which occurred in the fourth quarter of 2012 and Hurricanes Gustav and Ike, which occurred in the third quarter of 2008. As of December 31, 2016, the net reserves for Hurricane Gustav and Ike and Superstorm Sandy are, in total, $64 thousand. Management believes that should any adverse loss development for gross claims occur from the aforementioned wildfires, hurricanes and Superstorm Sandy, it would be contained within the reinsurance program.
Alberta Wildfires
The following table sets forth our gross and net losses and LAE reserves, incurred losses and LAE, and payments for Alberta Wildfires for the year ended December 31, 2016 in USD equivalent:
|
| Year Ended December 31, |
| |
amounts in thousands |
| 2016 |
| |
Gross of Reinsurance |
|
|
|
|
Beginning gross reserves |
| $ | - |
|
Plus: Incurred losses & LAE |
|
| 19,347 |
|
Less: Calendar year payments |
|
| 5,109 |
|
Less: Foreign currency exchange impact |
|
| 577 |
|
Ending gross reserves |
| $ | 13,661 |
|
|
|
|
|
|
Gross case loss reserves |
| $ | 8,503 |
|
Gross IBNR loss reserves |
|
| 5,158 |
|
Ending gross reserves |
| $ | 13,661 |
|
|
|
|
|
|
Net of Reinsurance |
|
|
|
|
Beginning net reserves |
| $ | - |
|
Plus: Incurred losses & LAE |
|
| 11,682 |
|
Less: Calendar year payments |
|
| 4,119 |
|
Less: Foreign currency exchange impact |
|
| 300 |
|
Ending net reserves |
| $ | 7,263 |
|
|
|
|
|
|
Net case loss reserves |
| $ | 5,008 |
|
Net IBNR loss reserves |
|
| 2,255 |
|
Ending net reserves |
| $ | 7,263 |
|
The Alberta Wildfires impacted the second quarter of 2016 with a total estimated net loss for the year of $11.7 million and $1.8 million in additional RRPs.
51
Hurricane Joaquin
The following table sets forth our gross and net losses and LAE reserves, incurred losses and LAE, and payments for Hurricane Joaquin for the years ended December 31, 2016 and 2015:
|
| Years Ended December 31, |
| ||||
amounts in thousands |
| 2016 |
| 2015 |
| ||
Gross of Reinsurance |
|
|
|
|
|
|
|
Beginning gross reserves |
| $ | 22,735 |
| $ | - |
|
Plus: Incurred losses & LAE |
|
| - |
|
| 31,749 |
|
Less: Calendar year payments |
|
| 21,249 |
|
| 9,014 |
|
Ending gross reserves |
| $ | 1,486 |
| $ | 22,735 |
|
|
|
|
|
|
|
|
|
Gross case loss reserves |
| $ | 572 |
| $ | 3,113 |
|
Gross IBNR loss reserves |
|
| 914 |
|
| 19,622 |
|
Ending gross reserves |
| $ | 1,486 |
| $ | 22,735 |
|
|
|
|
|
|
|
|
|
Net of Reinsurance |
|
|
|
|
|
|
|
Beginning net reserves |
| $ | 1,933 |
| $ | - |
|
Plus: Incurred losses & LAE |
|
| - |
|
| 10,000 |
|
Less: Calendar year payments |
|
| 1,933 |
|
| 8,067 |
|
Ending net reserves |
| $ | - |
| $ | 1,933 |
|
|
|
|
|
|
|
|
|
Net case loss reserves |
| $ | - |
| $ | 1,933 |
|
Net IBNR loss reserves |
|
| - |
|
| - |
|
Ending net reserves |
| $ | - |
| $ | 1,933 |
|
Hurricane Joaquin impacted the fourth quarter of 2015 with a total estimated net loss of $10.0 million and $4.0 million in additional RRPs. At December 31, 2016 the RRP was reduced to $2.6 million.
Reinsurance Recoverables
Reinsurance recoverable includes the balances due to us from reinsurance companies for paid and unpaid losses and loss expenses, based on contracts in force, and are presented net of a reserve for uncollectible reinsurance which is determined based upon a review of the financial condition of the reinsurers and other factors. We determine the reinsurance recoverable on unpaid losses and loss expenses using actuarial estimates, as well as a determination of our ability to cede unpaid losses and loss expenses under existing reinsurance contracts. Although reinsurance makes the reinsurer liable to our Company to the extent the risk is transferred or ceded to the reinsurer, ceded reinsurance arrangements do not eliminate the obligation to pay claims to the policyholders. Accordingly, our Company bears credit risk with respect to the reinsurers. Specifically, the reinsurers may not pay claims made by our Company on a timely basis, or they may not pay some or all of these claims. Either of these events would increase the costs and could have a material adverse effect on our business.
The exposure to credit risk from any one reinsurer is actively managed through diversification by reinsuring with a number of different reinsurers, principally in the United States and European reinsurance markets. When reinsurance is placed, the standards of acceptability require a reinsurer rating from A.M. Best and/or S&P of "A" or better, or an equivalent financial strength if not rated, plus at least $500 million in policyholders' surplus. The Reinsurance Security Committee, which is included within the Enterprise Risk Management Finance and Credit Sub-Committee, monitors the financial strength of the reinsurers and the related reinsurance recoverables and periodically reviews the list of acceptable reinsurers.
Our Company has established a reserve for uncollectible reinsurance in the amount of $12.1 million and $6.9 million as of December 31, 2016 and 2015, respectively. Our reserve is determined by considering reinsurer specific default risk as indicated by their financial strength ratings, as well as additional default risk for asbestos and environmental related recoverables or an individual impairment assessment for certain reinsurers that exhibit additional default risk. Actual uncollectible reinsurance could potentially differ from the estimate. The increase in our reserves for uncollectible reinsurance as compared to 2015 is driven primarily by one of our reinsurers having been placed under supervision of a conservator by the State of California. We will continue to monitor the conservation process and assess our potential exposure.
Refer to Note 6, Ceded Reinsurance, in the Notes to Consolidated Financial Statements for additional information.
52
Critical Accounting Estimates
We prepare our financial statements in accordance with GAAP, which requires the use of estimates and assumptions. Our consolidated financial statements include amounts that, either by their nature or due to requirements of GAAP, are determined using best estimates and assumptions. Management has discussed and reviewed the development, selection, and disclosure of critical accounting estimates with our Company's Audit Committee. While we believe that the amounts included in our consolidated financial statements reflect our best judgment, actual amounts could ultimately materially differ from those currently presented.
We believe the items that require the most subjective and complex estimates involve the reporting of:
| • | Reserves for losses and LAE (including losses that have occurred but were not reported to us by the financial reporting date); |
| • | Reinsurance recoverables, including a provision for uncollectible reinsurance; |
| • | Written and unearned premium; |
| • | Recoverability of deferred tax assets; |
| • | Impairment of investment securities; and |
| • | Valuation of invested assets. |
Reserves for Losses and LAE
Reserves for losses and LAE represent an estimate of the expected cost of the ultimate settlement and administration of losses, based on facts and circumstances then known less the amount paid to date. Our actuaries calculate indicated IBNR loss reserves by UWY for major product groupings using standard actuarial methodologies, which are projection or extrapolation techniques, including: (a) the loss ratio method, (b) the loss development method, (c) the Bornhuetter-Ferguson method and (d) the frequency/severity method. Each of these methodologies is generally applicable to both long tail and short tail lines of business depending on a variety of circumstances. Informed subjective judgments as to our ultimate exposure to losses are an integral component of our loss reserving process due to numerous factors that contribute to the inherent uncertainty in the process of establishing loss reserves, including:
| • | Inflationary pressures (medical and economic) that affect the size of losses; |
| • | Judicial, regulatory, legislative, and legal decisions that affect insurers' liabilities; |
| • | Changes in the frequency and severity of losses; |
| • | Changes in the underlying loss exposures of our policies; and |
| • | Changes in our claims handling procedures. |
A review of the emergence of actual losses relative to expectations for each line of business generally derived from the quarterly and/or semi-annual in depth reserve analyses is conducted to determine whether the assumptions used in the reserving process continue to form a reasonable basis for the projection of liabilities for each product line. As time passes, estimated loss reserves for an UWY will be based more on historical loss activity and loss development patterns rather than on assumptions based on underwriters' input, pricing assumptions or industry experience. During the loss settlement period, it often becomes necessary to refine and adjust the estimates of liability on a claim either upward or downward. No assurance can be given that actual claims made and related payments will not be in excess of the amounts reserved.
A brief summary of each actuarial method discussed above follows:
Loss ratio method
This method is based on the assumption that ultimate losses vary proportionately with premiums. Pursuant to the loss ratio method, IBNR loss reserves are calculated by multiplying the earned premium by an expected ultimate loss ratio to estimate the ultimate losses for each UWY, then subtracting the reported losses, consisting of paid losses and case loss reserves, to determine the IBNR loss reserve amount. The ultimate loss ratios applied are our Company's best estimates for each UWY and are generally determined after evaluating a number of factors which include: information derived by underwriters and actuaries in the initial pricing of our business, the ultimate loss ratios established in the prior accounting period and the related judgments applied, the ultimate loss ratios of previous UWYs, premium rate changes, underwriting and coverage changes, changes in terms and conditions, legislative changes, exposure trends, loss development trends, claim frequency and severity trends, paid claims activity, remaining open case reserves and industry data where deemed appropriate. Such factors are also evaluated when selecting ultimate loss ratios and/or loss development factors in the methods described below.
53
Bornhuetter-Ferguson method
The Bornhuetter-Ferguson method calculates the IBNR loss reserves as the product of the earned premium, an expected ultimate loss ratio, and a loss development factor that represents the expected percentage of the ultimate losses that have been incurred but not yet reported. The loss development factor equals one hundred percent less the expected percentage of losses that have thus far been reported, which is generally calculated as an average of the percentage of losses reported for comparable reporting periods of prior UWYs. The expected ultimate loss ratio is generally determined in the same manner as in the loss ratio method.
Loss development method
The loss development method, also known as the chain ladder or the link-ratio method, develops the IBNR loss reserves by multiplying the paid or reported losses by a loss development factor to estimate the ultimate losses, then subtracting the reported losses, consisting of paid losses and case loss reserves, to determine the IBNR loss reserves. The loss development factor is the reciprocal of the expected percentage of losses that have thus far been reported, which is generally calculated as an average of the percentage of losses reported for comparable reporting periods of prior UWYs.
Frequency/severity method
The frequency/severity method calculates the IBNR loss reserves by separately projecting claim count and average cost per claim data on either a paid or incurred basis. It estimates the expected ultimate losses as the product of the ultimate number of claims that are expected to be reported and the expected average amount of these claims.
The period between the date of loss occurrence and the final payment date of the ensuing claim(s) is referred to as the "claim tail." Short tail business generally describes products for which losses are typically known and paid shortly after the loss actually occurs. For example, a personal accident where no other parties were involved tends to be a short process. The ambiguity associated with our estimate of ultimate losses for any particular accident period diminishes quickly as actual loss experience develops. Long tail business are lines of business for which specific losses may not be known or reported for a longer period and claims can take significant time to settle. For long tail lines such as general liability, the time lag for reporting claims is greater than it is in short tail lines. Facts and information are frequently not complete at the time case reserves are established, and because there is a higher risk for additional litigation, final settlement amounts are unknown. Each of our business lines is analyzed individually, with development characteristics for each short tail and long tail line of business identified and applied accordingly.
The following discusses the method used for calculating the IBNR for each line of business and key assumptions used in applying the actuarial methods described.
Application of Actuarial Methods
Reserves are established separately for each major product. Our actuaries generally assume that historical loss development patterns are reasonable predictors of future loss patterns and apply a variety of traditional actuarial techniques to develop a reasonable expectation of ultimate losses. However, there are a number of products for which our Company has insufficient experience so as to generate credible actuarial projections. In those instances, we typically evaluate overall industry experience, rely on the input of underwriting, and claims executives in setting assumptions for our IBNR reserves. We also attempt to make reasonable provisions for the impact of economic, legal and competitive trends in projecting future loss development.
Our actuarial IBNR estimation approach is based on the nature of the data generated by the lines of business being reviewed. Each business line can be characterized as either a long or short tailed line of business or, if it is a new business line, the length of the tail would not necessarily be immediately relevant and it would be treated only as a new business line.
Short tailed lines of business have the least uncertainty of the three groups. For short tailed lines of business there is typically a mature or close to mature dataset from which to select patterns and estimates. Thus, the actuaries would generally apply a combination of loss development method and Bornhuetter-Ferguson methods that rely on internal historical patterns and losses.
For long tailed lines of business the uncertainty is greater. Due to the amount of time it takes a long tailed segment to mature, there is uncertainty with regards to how any line of business or year will settle as well as uncertainty with regards to the path it will take to settle. Additionally, due to their long tailed nature, many of the lines of business that are not new but are long tailed may not have a mature historical dataset from which to derive credible estimates for reserving. For these segments, while standard actuarial reserving methods would usually be applied, the loss development method would generally only be applied in the more mature years where the expectation is that they are close to ultimate. Where internal data on long tailed lines lacks sufficient credibility, overall industry experience would be evaluated and the input of underwriting and claims executives in setting assumptions would be considered.
54
For new business the assumption is that internal historical data would not be available and the actuaries will typical ly evaluate based on overall industry experience, and rely on the input of underwriting, and claims executives in setting assumptions for IBNR reserves. Early on, unless there is a credible industry pattern or internal complementary line of business patte rn, the loss ratio method would be applied and patterns would only be applied as the business begins to mature. If there is a credible complementary or industry pattern Bornhuetter-Ferguson methods might be applied initially as well, particularly if it is a short tailed line of business.
The data distribution as of December 31, 2016 as measured by net case reserves outstanding is as follows:
| Short Tailed |
|
| Long Tailed |
|
| New Business |
|
| Total |
| ||||
U.S. Insurance: |
|
|
|
|
|
|
|
|
|
|
|
|
|
|
|
Marine |
| 63.7 | % |
|
| 36.3 | % |
|
| 0.0 | % |
|
| 100.0 | % |
P&C |
| 8.0 | % |
|
| 90.9 | % |
|
| 1.1 | % |
|
| 100.0 | % |
Professional Liability |
| 0.0 | % |
|
| 100.0 | % |
|
| 0.0 | % |
|
| 100.0 | % |
|
|
|
|
|
|
|
|
|
|
|
|
|
|
|
|
Int'l Insurance: |
|
|
|
|
|
|
|
|
|
|
|
|
|
|
|
Marine |
| 55.8 | % |
|
| 43.9 | % |
|
| 0.3 | % |
|
| 100.0 | % |
P&C |
| 72.5 | % |
|
| 5.5 | % |
|
| 22.0 | % |
|
| 100.0 | % |
Professional Liability |
| 0.0 | % |
|
| 96.1 | % |
|
| 3.9 | % |
|
| 100.0 | % |
|
|
|
|
|
|
|
|
|
|
|
|
|
|
|
|
GlobalRe |
| 81.4 | % |
|
| 2.9 | % |
|
| 15.7 | % |
|
| 100.0 | % |
Sensitivity Analysis
The following table provides a sensitivity analysis of our Net Reserves for Losses and LAE as of December 31, 2016:
|
|
|
|
|
| Reasonably Likely Range of Deviation |
| |||||||||||||
|
| Total Net |
|
| Strengthening |
|
|
|
|
|
| Release |
|
|
|
|
| |||
amounts in thousands, except per share amounts |
| Loss Reserve |
|
| Amount |
|
| % |
|
| Amount |
|
| % |
| |||||
U.S. Insurance |
|
|
|
|
|
|
|
|
|
|
|
|
|
|
|
|
|
|
|
|
Marine |
| $ | 110,960 |
|
| $ | 8,273 |
|
|
| 7.5 | % |
| $ | 7,699 |
|
|
| 6.9 | % |
P&C |
|
| 804,877 |
|
|
| 53,658 |
|
|
| 6.7 | % |
|
| 50,305 |
|
|
| 6.2 | % |
Professional Liability |
|
| 95,114 |
|
|
| 16,077 |
|
|
| 16.9 | % |
|
| 13,752 |
|
|
| 14.5 | % |
Portfolio Effect (1) |
|
|
|
|
|
| (16,345 | ) |
|
|
|
|
|
| (13,638 | ) |
|
|
|
|
Total U.S. Insurance |
| $ | 1,010,951 |
|
| $ | 61,663 |
|
|
| 6.1 | % |
| $ | 58,118 |
|
|
| 5.7 | % |
Int'l Insurance |
|
|
|
|
|
|
|
|
|
|
|
|
|
|
|
|
|
|
|
|
Marine |
| $ | 199,242 |
|
| $ | 22,277 |
|
|
| 11.2 | % |
|
| 20,037 |
|
|
| 10.1 | % |
P&C |
|
| 84,688 |
|
|
| 8,451 |
|
|
| 10.0 | % |
|
| 7,685 |
|
|
| 9.1 | % |
Professional Liability |
|
| 100,209 |
|
|
| 25,938 |
|
|
| 25.9 | % |
|
| 20,604 |
|
|
| 20.6 | % |
Portfolio Effect (1) |
|
|
|
|
|
| (21,638 | ) |
|
|
|
|
|
| (16,225 | ) |
|
|
|
|
Total Int'l Insurance |
| $ | 384,139 |
|
| $ | 35,028 |
|
|
| 9.1 | % |
| $ | 32,101 |
|
|
| 8.4 | % |
GlobalRe |
|
| 115,361 |
|
|
| 26,946 |
|
|
| 23.4 | % |
|
| 21,844 |
|
|
| 18.9 | % |
Subtotal |
| $ | 1,510,451 |
|
| $ | 123,637 |
|
|
|
|
|
| $ | 112,063 |
|
|
|
|
|
Portfolio Effect (1) |
|
| - |
|
|
| (49,239 | ) |
|
|
|
|
|
| (41,158 | ) |
|
|
|
|
Total |
| $ | 1,510,451 |
|
| $ | 74,398 |
|
|
| 4.9 | % |
| $ | 70,905 |
|
|
| 4.7 | % |
|
|
|
|
|
|
|
|
|
|
|
|
|
|
|
|
|
|
|
|
|
Increase (decrease) to net income |
|
|
|
|
|
|
|
|
|
|
|
|
|
|
|
|
|
|
|
|
Amount |
|
|
|
|
| $ | (48,359 | ) |
|
|
|
|
| $ | 46,088 |
|
|
|
|
|
Per Share (2) |
|
|
|
|
| $ | (1.61 | ) |
|
|
|
|
| $ | 1.53 |
|
|
|
|
|
(1) – The totals for each segment are adjusted for portfolio effect. The portfolio effect is the reduction in risk which arises out of diversification in the portfolio.
(2) - Calculated using average diluted shares of 30,031,609 for the year ended December 31, 2016. We completed a two-for-one stock split on January 20, 2017. All share and per share data has been retroactively restated on a post-split basis.
A range of reasonable estimates has been developed based on the historical volatility of held reserves versus current estimates for the purposes of this sensitivity analysis. The history indicates that our held reserves tend to be 6.6% redundant with a standard deviation of 7.1%. We have ignored the historical conservatism and built a range around the current held amounts. Our Company's lines of business, the market pricing adequacy and our Company's underwriting strategies have changed dynamically over the past ten years. The impact from the shift on ranges will be greater for lines with longer emergence patterns. The individual lines will also have
55
greater variance than the range for the entire book of business. The statistical variation is expected to hav e a somewhat higher range of deterioration than savings. The computation of each range represents the central 50.0% of outcomes. The movement within our reporting segments in an individual year may not fall within this range. There is a significant risk that the potential volatility of the current reserve estimates could differ in a material manner from the historical trends. The total reserve variability is not equal to the sum of the segment variability due to the benefit of diversification.
Reinsurance Recoverables
Reinsurance recoverables are established for the portion of the loss reserves that are ceded to reinsurers. Reinsurance recoverables are determined based upon the terms and conditions of reinsurance contracts, which could be subject to interpretations that differ from our own based on judicial theories of liability. We are required to pay losses even if a reinsurer fails to meet its obligations under the applicable reinsurance agreement. We bear credit risk with respect to our reinsurers, which can be significant considering that certain of the reserves remain outstanding for an extended period of time.
Written and Unearned Premium
Substantially all of our business is placed through agents and brokers. Written premium is recorded based on the insurance policies that have been reported to us and the policies that have been written by agents but not yet reported to us. We estimate the amount of written premium not yet reported based on judgments relative to current and historical trends of the business being written. An unearned premium reserve is established to reflect the unexpired portion of each policy at the financial reporting date. Assumed and ceded RRPs are written and fully earned in the period in which the loss event, which caused the reinstatement premium, occurred.
A portion of our premium is estimated for unreported premium, mostly for our Marine and Energy & Engineering products written by our Int'l Insurance reporting segment, as well as our A&H product and our LatAm business within our P&C and Surety products written by our GlobalRe reporting segment. Such premium estimates are based on submission data received from brokers and agents and recorded when the insurance policy or reinsurance contract is written or bound. The estimates are regularly reviewed and updated taking into account the premium received to date versus the estimate and the age of the estimate. To the extent that the actual premium varies from the estimates, the difference, along with the related loss reserves and underwriting expenses, is recorded in current operations.
We also record the ceded portion of the estimated gross written premium and related acquisition costs. The earned gross, ceded and net premiums are calculated based on our earning methodology, which is generally over the policy period. Losses are also recorded in relation to the earned premium. The estimate for losses incurred on the estimated premium is based on an actuarial calculation consistent with the methodology used to determine incurred but not reported loss reserves for reported premiums.
Recoverability of Deferred Tax Assets
We recognize deferred tax assets and liabilities, which primarily result from temporary differences between the amounts recorded in our Consolidated Financial Statements and the tax basis of our assets and liabilities. At each balance sheet date, we assess the need to establish a valuation allowance that reduces deferred tax assets when it is more likely than not that all, or some portion, of the deferred tax assets will not be realized. The valuation allowance is based on all available information including projections of future taxable income from each tax-paying component in each tax jurisdiction, principally derived from available tax planning strategies. Projections of future taxable income incorporate several assumptions of future business and operations that are apt to differ from actual experience. We regularly review our deferred tax assets for recoverability, taking into consideration our history of earnings, expectations for future earnings, taxable income in carryback years and the expected timing of the reversals of existing temporary differences. When we believe it is more likely than not that a deferred tax asset will not be realized, we establish a valuation allowance for that deferred tax asset. Our valuation allowance as of December 31, 2016 is $0.7 million.
Impairment of Investment Securities
Management regularly reviews our fixed maturity and equity securities portfolios to evaluate the necessity of recording impairment losses for other-than-temporary declines in the fair value of investments. Our investment portfolio is the largest component of consolidated assets and a multiple of stockholder's equity. OTTI could be material to our financial condition and results of operations. Refer to Note 3, Investments, in the Notes to Consolidated Financial Statements for additional information.
Valuation of Investments
Fair value is defined as the price in the principal market that would be received for an asset to facilitate an orderly transaction between market participants on the measurement date. We determine the fair value of certain financial instruments based on their underlying
56
characteristics and relevant transactions in the marketplace. GAA P guidance requires an entity to maximize the use of observable inputs and minimizes the use of unobservable inputs when measuring fair value. Refer to Note 4, Fair Value, in the Notes to Consolidated Financial Statements for additional information.
ITEM 7A. QUANTITATIVE AND QUALITATIVE DISCLOSURES ABOUT MARKET RISK
Market Sensitive Instruments and Risk Management
Market risk represents the potential for loss due to adverse changes in the fair value of financial instruments. We are exposed to potential loss to various market risks, including changes in interest rates, equity prices and foreign currency exchange rates. Market risk is directly influenced by the volatility and liquidity in the markets in which the related underlying assets are traded. The following is a discussion of our primary market risk exposures and how those exposures have been managed through December 31, 2016. Our market risk sensitive instruments are entered into for purposes other than trading and speculation.
The carrying value of our investment portfolio as of December 31, 2016 was $3.1 billion of which 84.3% was invested in fixed maturity securities. The primary market risk to our investment portfolio is interest rate risk associated with investments in fixed maturity securities. We do not make direct investments in commodities.
For fixed maturity securities, short-term liquidity needs and the potential liquidity needs of our business are key factors in managing our portfolio. Our portfolio duration relative to our liabilities' duration is primarily managed through investment transactions.
There were no significant changes regarding our investment portfolio in our primary market risk exposures or in how those exposures were managed for the year ended December 31, 2016. We do not currently anticipate significant changes in our primary market risk exposures or in how those exposures are managed in future reporting periods based upon what is known or expected to be in effect in future reporting periods.
Interest Rate Risk Sensitivity Analysis
Interest rate risk is defined as the measurement of potential loss in fair values of market sensitive instruments resulting from one or more selected hypothetical changes in interest rates. In our sensitivity model, a hypothetical change in interest rates is selected that is expected to reflect reasonably possible near-term changes in those rates. "Near-term" means a period of time going forward up to one year from the date of our Consolidated Financial Statements. Actual results may differ from the hypothetical change in interest rates assumed in this disclosure, especially since this sensitivity analysis does not reflect the results of any actions that would be taken by us to mitigate such hypothetical losses in fair value.
In this sensitivity model, we use fair values to measure our potential loss on Fixed maturities and interest rate sensitive preferred stocks, which are classified as equity securities for financial reporting purposes. The primary market risk to our market-sensitive instruments is interest rate risk. The sensitivity analysis model uses a 50 and 100 basis points change in interest rates to measure the hypothetical change in fair value of financial instruments included in the model. Changes in interest rates will have an immediate effect on our comprehensive income and stockholders' equity but will not ordinarily have an immediate effect on our net income. As interest rates rise, the market value of our interest rate sensitive securities will decrease. Conversely, as interest rates fall, the market value of our interest rate sensitive securities will increase.
For interest rate sensitive securities, modified duration modeling is used to calculate changes in fair values. Durations on interest rate sensitive securities are adjusted for call, put and interest rate reset features. Duration on tax-exempt securities is adjusted for the fact that the prices on such securities are less sensitive to changes in interest rates compared to treasury securities. Average duration is calculated on a market value weighted basis using holdings as of December 31, 2016.
57
The following table summarizes the effect that an immediate, parallel shift in the interest rate yield curve would have on our interest rate sensitive securities as of Decem ber 31, 2016 and 2015:
|
| Interest Rate Shift in Basis Points |
| |||||||||||||||||
amounts in thousands |
| -100 |
|
| -50 |
|
| 0 |
|
| +50 |
|
| +100 |
| |||||
December 31, 2016: |
|
|
|
|
|
|
|
|
|
|
|
|
|
|
|
|
|
|
|
|
Total market value |
| $ | 2,929,824 |
|
| $ | 2,877,919 |
|
| $ | 2,820,936 |
|
| $ | 2,763,389 |
|
| $ | 2,705,842 |
|
Market value change from base |
|
| 3.9 | % |
|
| 2.0 | % |
|
|
|
|
|
| -2.0 | % |
|
| -4.1 | % |
Change in unrealized value |
| $ | 108,888 |
|
| $ | 56,983 |
|
| $ | - |
|
| $ | (57,547 | ) |
| $ | (115,094 | ) |
|
|
|
|
|
|
|
|
|
|
|
|
|
|
|
|
|
|
|
|
|
December 31, 2015: |
|
|
|
|
|
|
|
|
|
|
|
|
|
|
|
|
|
|
|
|
Total market value |
| $ | 2,688,968 |
|
| $ | 2,644,887 |
|
| $ | 2,593,026 |
|
| $ | 2,538,572 |
|
| $ | 2,486,712 |
|
Market value change from base |
|
| 3.7 | % |
|
| 2.0 | % |
|
|
|
|
|
| -2.1 | % |
|
| -4.1 | % |
Change in unrealized value |
| $ | 95,942 |
|
| $ | 51,861 |
|
| $ | - |
|
| $ | (54,454 | ) |
| $ | (106,314 | ) |
Common Equity Price Risk
Our portfolio of common equity securities currently valued at $164.1 million, which we carry on our Balance Sheet at fair value, has exposure to price risk. This risk is defined as the potential loss in fair value resulting from adverse changes in stock prices. Our portfolio is benchmarked to the S&P 500 index and changes in that index may approximate the impact on our portfolio.
Foreign Currency Exchange Rate Risk
As a global company, we transact business in multiple currencies. Many of our non-U.S. subsidiaries maintain assets and liabilities in local currencies and write business in currencies that differ from their functional currency. Therefore, foreign currency exchange risk is generally limited to net assets denominated in foreign currencies. Foreign currency exchange rate gains and losses are recognized in our consolidated Statements of Income when net monetary assets or liabilities are denominated in foreign currencies that differ from the functional currency of those subsidiaries. Net monetary assets or liabilities include, but are not limited to, cash and cash equivalents, premiums receivable, reinsurance recoverable and claims payable. While unrealized foreign exchange gains and losses on net monetary balances are reported in earnings, the offsetting unrealized gains and losses on invested assets are recorded as a separate component of stockholders' equity, to the extent that the asset currency does not match that entity's functional currency. We manage our foreign currency exchange rate risk primarily through asset-liability matching. However, locally-required capital levels are invested in local currencies in order to satisfy regulatory requirements and to support local insurance operations and may not always be matched by related liabilities.
The principal currencies creating foreign currency exchange risk for our operations are the GBP and the CAD. The following table shows the foreign currency denominated net asset position, with elimination of intercompany balances, in USD equivalent at December 31, 2016 and 2015, and the expected dollar change in fair value that would occur if exchange rates changed 10% from exchange rates in effect at those times:
|
| At Years Ended December 31, |
| |||||||||||||
amounts in thousands |
| 2016 |
|
| 2015 |
|
| 2016 |
|
| 2015 (1) |
| ||||
Original Currency |
| Value of Net Assets in USD |
|
| 10% depreciation of all foreign currency exchange rates against the USD |
| ||||||||||
GBP |
| $ | (10,630 | ) |
| $ | (61,834 | ) |
| $ | (1,063 | ) |
| $ | (6,183 | ) |
CAD |
|
| 67,992 |
|
|
| 43,800 |
|
|
| 6,799 |
|
|
| 4,380 |
|
Total (1) |
| $ | 57,362 |
|
| $ | (18,034 | ) |
| $ | 5,736 |
|
| $ | (1,803 | ) |
|
(1) Amount excludes additional currencies where the value of net assets in USD equivalent is less than 1 % of total net assets of our Company |
ITEM 8. FINANCIAL STATEMENTS AND SUPPLEMENTARY DATA
Our Consolidated Financial Statements required in response to this section are submitted as part of Item 15(a) of this report.
58
ITEM 9. CHANGES IN AND DISAGREEMENTS WITH ACCO UNTANTS ON ACCOUNTING AND FINANCIAL D ISCLOSURE
None
ITEM 9A. CONTROLS AND PROCEDURES
Conclusion Regarding the Effectiveness of Disclosure Controls and Procedures
Under the supervision and with the participation of our management, including our Chief Executive Officer and Chief Financial Officer, we conducted an evaluation of our disclosure controls and procedures, as such, term is defined under Rule 13a-15(e) promulgated under the Exchange Act. Based on this evaluation, our Chief Executive Officer and our Chief Financial Officer concluded that our disclosure controls and procedures were effective as of the end of the period covered by this annual report.
Management's Report on Internal Control Over Financial Reporting
(a) | Management's report on internal control over financial reporting |
Our management is responsible for establishing and maintaining adequate internal control over financial reporting, as such term is defined in Exchange Act Rule 13a-15(f). Under the supervision and with the participation of our management, including our Chief Executive Officer and Chief Financial Officer, we conducted an evaluation of the effectiveness of our internal control over financial reporting based on the Internal Control – Integrated Framework (2013) issued by the Committee of Sponsoring Organizations of the Treadway Commission. Based on our evaluation under such framework, our management concluded that our internal control over financial reporting as of December 31, 2016 was effective.
Because of its inherent limitations, internal control over financial reporting may not prevent or detect misstatements. Also, projections of any evaluation of effectiveness to future periods are subject to the risk that controls may become inadequate because of changes in conditions, or that the degree of compliance with the policies or procedures may deteriorate.
Our Company's independent registered public accounting firm, KPMG LLP, has audited the effectiveness of our Company's internal control over financial reporting as of December 31, 2016, as stated in their report in item (b) below.
(b) | Attestation report of the registered public accounting firm |
59
Report of Independent Registered Public Accounting Firm
The Board of Directors and Stockholders
The Navigators Group, Inc.
We have audited The Navigators Group Inc.'s internal control over financial reporting as of December 31, 2016, based on criteria established in Internal Control – Integrated Framework (2013) issued by the Committee of Sponsoring Organizations of the Treadway Commission. The Navigators Group Inc.'s management is responsible for maintaining effective internal control over financial reporting and for its assessment of the effectiveness of internal control over financial reporting, included in the accompanying Management's Report on Internal Control Over Financial Reporting. Our responsibility is to express an opinion on the Company's internal control over financial reporting based on our audit.
We conducted our audit in accordance with the standards of the Public Company Accounting Oversight Board (United States). Those standards require that we plan and perform the audit to obtain reasonable assurance about whether effective internal control over financial reporting was maintained in all material respects. Our audit included obtaining an understanding of internal control over financial reporting, assessing the risk that a material weakness exists, and testing and evaluating the design and operating effectiveness of internal control based on the assessed risk. Our audit also included performing such other procedures as we considered necessary in the circumstances. We believe that our audit provides a reasonable basis for our opinion.
A company's internal control over financial reporting is a process designed to provide reasonable assurance regarding the reliability of financial reporting and the preparation of financial statements for external purposes in accordance with generally accepted accounting principles. A company's internal control over financial reporting includes those policies and procedures that (1) pertain to the maintenance of records that, in reasonable detail, accurately and fairly reflect the transactions and dispositions of the assets of the company; (2) provide reasonable assurance that transactions are recorded as necessary to permit preparation of financial statements in accordance with generally accepted accounting principles, and that receipts and expenditures of the company are being made only in accordance with authorizations of management and directors of the company; and (3) provide reasonable assurance regarding prevention or timely detection of unauthorized acquisition, use, or disposition of the company's assets that could have a material effect on the financial statements.
Because of its inherent limitations, internal control over financial reporting may not prevent or detect misstatements. Also, projections of any evaluation of effectiveness to future periods are subject to the risk that controls may become inadequate because of changes in conditions, or that the degree of compliance with the policies or procedures may deteriorate.
In our opinion, The Navigators Group, Inc. maintained, in all material respects, effective internal control over financial reporting as of December 31, 2016, based on criteria established in Internal Control – Integrated Framework (2013) issued by the Committee of Sponsoring Organizations of the Treadway Commission.
We also have audited, in accordance with the standards of the Public Company Accounting Oversight Board (United States), the consolidated balance sheets of The Navigators Group, Inc. and subsidiaries as of December 31, 2016 and 2015, and the related consolidated statements of income, comprehensive income, stockholders' equity, and cash flows for each of the years in the three-year period ended December 31, 2016, and our report dated February 17, 2017 expressed an unqualified opinion on those consolidated financial statements.
/s/ KPMG LLP
New York, New York
February 17, 2017
60
(c) | Changes in internal control over financial reporting |
(1) In 2016, to align with a more automated process, we implemented a new tax system which added automation to our tax provision and compliance processes. This implementation involved changes to our procedures and enhanced controls, which management believes are appropriate for the new system.
There have been no further changes during our fourth fiscal quarter in our internal control over financial reporting that have materially affected, or are reasonably likely to materially affect our internal control over financial reporting.
61
ITEM 9B. OTHER INFORMATION
None
PART III
ITEM 10. DIRECTORS, EXECUTIVE OFFICERS AND CORPORATE GOVERNANCE
Information concerning our directors and executive officers is contained under "Election of Directors" in our definitive Proxy Statement for the Annual Meeting of Stockholders to be held on May 25, 2017 (our "Proxy Statement") , which information is incorporated herein by reference. Information concerning the Audit Committee and the Audit Committee's financial expert of our Company is contained under "Board of Directors and Committees" in our Proxy Statement, which information is incorporated herein by reference. Information concerning compliance with Section 16(a) is contained under "Section 16(a) Beneficial Ownership Reporting Compliance" in our Proxy Statement.
We have adopted a Code of Ethics for our Chief Executive Officer and Senior Financial Officers, which is applicable to our Chief Executive Officer, Chief Financial Officer, Treasurer, Controller and all other persons performing similar functions. A copy of such Code is available on our website at www.navg.com under the Corporate Governance link. Any amendments to, or waivers of, such Code which apply to any of the financial professionals listed above will be disclosed on our website under the same link promptly following the date of such amendment or waiver.
Information concerning change to security holder procedures for recommending board of director nominees is contained under "Board Skills and Director Nominations" in our Proxy Statement.
ITEM 11. EXECUTIVE COMPENSATION
Information concerning executive compensation will be contained under "Compensation Discussion and Analysis" in our Proxy Statement, which information is incorporated herein by reference.
ITEM 12. SECURITY OWNERSHIP OF CERTAIN BENEFICIAL OWNERS AND MANAGEMENT AND RELATED STOCKHOLDER MATTERS
Information concerning the security ownership of the directors and officers of our Company is contained under "Election of Directors" and "Compensation Discussion and Analysis" in our Proxy Statement, which information is incorporated herein by reference. Information concerning securities that are available to be issued under our equity compensation plans is contained under "Equity Compensation Plan Information" in our Proxy Statement, which information is incorporated herein by reference.
ITEM 13. CERTAIN RELATIONSHIPS AND RELATED TRANSACTIONS, AND DIRECTOR INDEPENDENCE
Information concerning relationships and related transactions of our directors and officers is contained under "Related Party Transactions" in our Proxy Statement, which information is incorporated herein by reference. Information concerning director independence is contained under "Board of Directors and Committees" in our Proxy Statement, which information is incorporated herein by reference.
ITEM 14. PRINCIPAL ACCOUNTING FEES AND SERVICES
Information concerning the principal accountant's fees and services for our Company is contained under "Independent Registered Public Accounting Firm" in our Company's Proxy Statement, which information is incorporated herein by reference.
PART IV
ITEM 15. EXHIBITS, FINANCIAL STATEMENT SCHEDULES
The following documents are filed as part of this report:
a. | Financial Statements and Schedules : The financial statements and schedules that are listed in the accompanying Index to Consolidated Financial Statements and Schedules on page F-1. |
62
b. | Exhibits : The exhibits that are listed in the accompanying Index to Exhibits on the page, which immediately follows page S-8. The exhibits include the management contracts and compensatory plans or arrangements required to be filed as exhibits to this Form 10 ‑K by Item 601(a)(10)(iii) of Regulation S ‑K. |
63
SIGNAT URES
Pursuant to the requirements of Section 13 or 15(d) of the Securities Exchange Act of 1934, our Company has duly caused this report to be signed on its behalf by the undersigned, thereunto duly authorized.
|
| The Navigators Group, Inc. |
|
| (Company) |
|
|
|
Dated: February 17, 2017 | By: | /s/ Ciro M. DeFalco |
|
| Ciro M. DeFalco |
|
| Senior Vice President and Chief Financial Officer |
Pursuant to the requirements of the Securities Exchange Act of 1934, this report has been signed below by the following persons on behalf of our Company and in the capacities and on the dates indicated.
Name |
| Title |
| Date |
|
|
| ||
/s/ ROBERT V. MENDELSOHN |
| Chairman |
| February 17, 2017 |
Robert V. Mendelsohn |
|
|
| |
|
|
| ||
/s/ STANLEY A. GALANSKI |
| President and Chief Executive Officer (Principal Executive Officer) |
| February 17, 2017 |
Stanley A. Galanski |
|
|
| |
|
|
| ||
/s/ CIRO M. DEFALCO |
| Senior Vice President and Chief Financial Officer (Principal Financial Officer and Principal Accounting Officer) |
| February 17, 2017 |
Ciro M. DeFalco |
|
|
| |
|
|
| ||
/s/ SAUL L. BASCH |
| Director |
| February 17, 2017 |
Saul L. Basch |
|
|
| |
|
|
| ||
/s/ H.J. MERVYN BLAKENEY |
| Director |
| February 17, 2017 |
H.J. Mervyn Blakeney |
|
|
| |
|
|
| ||
/s/ TERENCE N. DEEKS |
| Director |
| February 17, 2017 |
Terence N. Deeks |
|
|
| |
|
|
|
|
|
/s/ MERYL HARTZBAND |
| Director |
| February 17, 2017 |
Meryl Hartzband |
|
|
|
|
|
|
|
|
|
|
|
| ||
/s/ GEOFFREY E. JOHNSON |
| Director |
| February 17, 2017 |
Geoffrey E. Johnson |
|
|
| |
|
|
| ||
/s/ DAVID M. PLATTER |
| Director |
| February 17, 2017 |
David M. Platter |
|
|
| |
|
|
| ||
/s/ PATRICIA H. ROBERTS |
| Director |
| February 17, 2017 |
Patricia H. Roberts |
|
|
| |
|
|
| ||
/s/ JANICE C. TOMLINSON |
| Director |
| February 17, 2017 |
Janice C. Tomlinson |
|
|
| |
|
|
| ||
/s/ MARC M. TRACT |
| Director |
| February 17, 2017 |
Marc M. Tract |
|
|
| |
64
INDEX TO CONSOLIDATED FINANC IAL STATEMENTS AND SCHEDULES
|
| Page | |
Report of Independent Registered Public Accounting Firm |
| F-2 | |
|
|
| |
Consolidated Balance Sheets as of December 31, 2016 and 201 5 |
| F-3 | |
|
|
| |
Consolidated Statements of Income for each of the years ended December 31, 2016, 2015 and 2014 |
| F-4 | |
|
|
| |
Consolidated Statements of Comprehensive Income for each of the years ended December 31, 2016, 2015 and 2014 |
| F-5 | |
|
|
| |
Consolidated Statements of Stockholders' Equity for each of the years ended December 31, 2016, 2015 and 2014 |
| F-6 | |
|
|
| |
Consolidated Statements of Cash Flows for each of the years ended December 31, 2016, 2015 and 2014 |
| F-7 | |
|
|
| |
Notes to Consolidated Financial Statements |
| F-8 | |
|
|
|
|
SCHEDULES: |
|
|
|
|
|
|
|
Schedule I | Summary of Consolidated Investments-Other Than Investment in Related Parties |
| S-1 |
|
|
|
|
Schedule II | Condensed Financial Information of Registrant |
| S-2 |
|
|
|
|
Schedule III | Supplementary Insurance Information |
| S-5 |
|
|
|
|
Schedule IV | Reinsurance - Written Premiums |
| S-6 |
|
|
|
|
Schedule V | Valuation and Qualifying Accounts |
| S-7 |
|
|
|
|
Schedule VI | Supplementary Information Concerning P&C Insurance Operations |
| S-8 |
|
|
|
|
Index to Exhibits |
|
| |
F-1
Report of Independent Regist ered Public Accounting Firm
The Board of Directors and Stockholders
The Navigators Group, Inc.
We have audited the accompanying consolidated balance sheets of The Navigators Group, Inc. and subsidiaries as of December 31, 2016 and 2015, and the related consolidated statements of income, comprehensive income, stockholders' equity, and cash flows for each of the years in the three‑year period ended December 31, 2016. In connection with our audits of the consolidated financial statements, we also have audited financial statement schedules I to VI. These consolidated financial statements and financial statement schedules are the responsibility of the Company's management. Our responsibility is to express an opinion on these consolidated financial statements and financial statement schedules based on our audits.
We conducted our audits in accordance with the standards of the Public Company Accounting Oversight Board (United States). Those standards require that we plan and perform the audit to obtain reasonable assurance about whether the financial statements are free of material misstatement. An audit includes examining, on a test basis, evidence supporting the amounts and disclosures in the financial statements. An audit also includes assessing the accounting principles used and significant estimates made by management, as well as evaluating the overall financial statement presentation. We believe that our audits provide a reasonable basis for our opinion.
In our opinion, the consolidated financial statements referred to above present fairly, in all material respects, the financial position of The Navigators Group, Inc. and subsidiaries as of December 31, 2016 and 2015, and the results of their operations and their cash flows for each of the years in the three year period ended December 31, 2016, in conformity with U.S. generally accepted accounting principles. Also in our opinion, the related financial statement schedules, when considered in relation to the basic consolidated financial statements taken as a whole, present fairly, in all material respects, the information set forth therein.
We also have audited, in accordance with the standards of the Public Company Accounting Oversight Board (United States), The Navigators Group, Inc.'s internal control over financial reporting as of December 31, 2016, based on criteria established in Internal Control – Integrated Framework (2013) issued by the Committee of Sponsoring Organizations of the Treadway Commission (COSO), and our report dated February 17, 2017 expressed an unqualified opinion on the effectiveness of the Company's internal control over financial reporting.
/s/KPMG LLP
New York, New York
February 17, 2017
F-2
THE NAVIGATORS GROUP, INC. AND SUBSIDIARIES
CONSOLIDATED BALANCE SHEETS
.
|
| December 31, |
| |||||
amounts in thousands, except share amounts |
| 2016 |
|
| 2015 |
| ||
ASSETS |
|
|
|
|
|
|
|
|
Investments: |
|
|
|
|
|
|
|
|
Fixed maturities, available-for-sale, at fair value (amortized cost: 2016: $2,628,225; 2015: $2,400,245) |
| $ | 2,635,882 |
|
| $ | 2,414,210 |
|
Equity securities, available-for-sale, at fair value (cost: 2016: $327,911; 2015: $281,943) |
|
| 349,142 |
|
|
| 305,271 |
|
Other invested assets |
|
| 1,960 |
|
|
| - |
|
Short-term investments, at fair value (amortized cost: 2016: $143,451; 2015: $217,743) |
|
| 143,539 |
|
|
| 217,745 |
|
Total investments |
| $ | 3,130,523 |
|
| $ | 2,937,226 |
|
Cash |
|
| 64,643 |
|
|
| 69,901 |
|
Premiums receivable |
|
| 306,686 |
|
|
| 276,616 |
|
Prepaid reinsurance premiums |
|
| 213,377 |
|
|
| 232,588 |
|
Reinsurance recoverable on paid losses |
|
| 82,582 |
|
|
| 49,506 |
|
Reinsurance recoverable on unpaid losses and loss adjustment expenses |
|
| 779,276 |
|
|
| 809,518 |
|
Deferred policy acquisition costs |
|
| 119,660 |
|
|
| 91,983 |
|
Accrued investment income |
|
| 17,315 |
|
|
| 16,001 |
|
Goodwill and other intangible assets |
|
| 6,451 |
|
|
| 6,807 |
|
Current income tax receivable, net |
|
| 20,556 |
|
|
| 22,323 |
|
Deferred income tax, net |
|
| 20,938 |
|
|
| 3,900 |
|
Other assets |
|
| 52,030 |
|
|
| 67,643 |
|
Total assets |
| $ | 4,814,037 |
|
| $ | 4,584,012 |
|
LIABILITIES AND STOCKHOLDERS' EQUITY |
|
|
|
|
|
|
|
|
Liabilities: |
|
|
|
|
|
|
|
|
Reserves for losses and loss adjustment expenses |
| $ | 2,289,727 |
|
| $ | 2,202,644 |
|
Unearned premiums |
|
| 887,344 |
|
|
| 820,676 |
|
Reinsurance balances payable |
|
| 108,980 |
|
|
| 107,411 |
|
Senior notes |
|
| 263,728 |
|
|
| 263,580 |
|
Accounts payable and other liabilities |
|
| 86,070 |
|
|
| 93,553 |
|
Total liabilities |
| $ | 3,635,849 |
|
| $ | 3,487,864 |
|
|
|
|
|
|
|
|
|
|
Stockholders' equity: (1) |
|
|
|
|
|
|
|
|
Preferred stock, $.10 par value, authorized 1,000,000 shares, none issued |
| $ | - |
|
| $ | - |
|
Common stock, $.10 par value, authorized 50,000,000 shares, issued 36,146,899 shares for 2016 and 35,884,538 shares for 2015 |
|
| 3,612 |
|
|
| 3,586 |
|
Additional paid-in capital |
|
| 373,983 |
|
|
| 356,036 |
|
Treasury stock, at cost (7,022,760 shares for 2016 and 2015) |
|
| (155,801 | ) |
|
| (155,801 | ) |
Retained earnings |
|
| 947,519 |
|
|
| 868,723 |
|
Accumulated other comprehensive income |
|
| 8,875 |
|
|
| 23,604 |
|
Total stockholders' equity |
| $ | 1,178,188 |
|
| $ | 1,096,148 |
|
Total liabilities and stockholders' equity |
| $ | 4,814,037 |
|
| $ | 4,584,012 |
|
(1) - We completed a two-for-one stock split on January 20, 2017. All per share data has been retroactively restated on a post-split basis.
The accompanying Notes to Consolidated Financial Statements are an integral part of these Financial Statements
F-3
THE NAVIGATORS GROUP, INC. AND SUBSIDIARIES
CONSOLIDATED STATEMENTS OF INCOME
|
| Years Ended December 31, |
| |||||||||
amounts in thousands, except share and per share amounts |
| 2016 |
|
| 2015 |
|
| 2014 |
| |||
Gross written premiums |
| $ | 1,568,911 |
|
| $ | 1,453,502 |
|
| $ | 1,432,353 |
|
Revenues: |
|
|
|
|
|
|
|
|
|
|
|
|
Net written premiums |
| $ | 1,186,224 |
|
| $ | 1,043,860 |
|
| $ | 1,000,138 |
|
Change in unearned premiums |
|
| (85,879 | ) |
|
| (59,773 | ) |
|
| (64,243 | ) |
Net earned premiums |
|
| 1,100,345 |
|
|
| 984,087 |
|
|
| 935,895 |
|
Net investment income |
|
| 79,451 |
|
|
| 68,718 |
|
|
| 64,168 |
|
Total other-than-temporary impairment losses |
|
| (227 | ) |
|
| (1,870 | ) |
|
| 137 |
|
Portion of loss recognized in other comprehensive income (before tax) |
|
| 77 |
|
|
| 172 |
|
|
| (137 | ) |
Net other-than-temporary impairment losses recognized in earnings |
|
| (150 | ) |
|
| (1,698 | ) |
|
| - |
|
Net realized gains (losses) |
|
| 9,186 |
|
|
| 8,373 |
|
|
| 12,812 |
|
Other income (expense) |
|
| 8,701 |
|
|
| (491 | ) |
|
| 10,656 |
|
Total revenues |
| $ | 1,197,533 |
|
| $ | 1,058,989 |
|
| $ | 1,023,531 |
|
|
|
|
|
|
|
|
|
|
|
|
|
|
Expenses: |
|
|
|
|
|
|
|
|
|
|
|
|
Net losses and loss adjustment expenses |
| $ | 665,448 |
|
| $ | 572,598 |
|
| $ | 545,229 |
|
Commission expenses |
|
| 165,045 |
|
|
| 129,977 |
|
|
| 125,528 |
|
Other operating expenses |
|
| 234,096 |
|
|
| 223,516 |
|
|
| 196,825 |
|
Interest expense |
|
| 15,435 |
|
|
| 15,424 |
|
|
| 15,413 |
|
Total expenses |
| $ | 1,080,024 |
|
| $ | 941,515 |
|
| $ | 882,995 |
|
|
|
|
|
|
|
|
|
|
|
|
|
|
Income before income taxes |
|
| 117,509 |
|
|
| 117,474 |
|
|
| 140,536 |
|
Income tax expense (benefit) |
|
| 34,783 |
|
|
| 36,417 |
|
|
| 45,207 |
|
|
|
|
|
|
|
|
|
|
|
|
|
|
Net income |
| $ | 82,726 |
|
| $ | 81,057 |
|
| $ | 95,329 |
|
|
|
|
|
|
|
|
|
|
|
|
|
|
Net income per common share: (1) |
|
|
|
|
|
|
|
|
|
|
|
|
Basic |
| $ | 2.85 |
|
| $ | 2.82 |
|
| $ | 3.34 |
|
Diluted |
| $ | 2.75 |
|
| $ | 2.73 |
|
| $ | 3.25 |
|
|
|
|
|
|
|
|
|
|
|
|
|
|
Average common shares outstanding: |
|
|
|
|
|
|
|
|
|
|
|
|
Basic |
|
| 29,073,803 |
|
|
| 28,785,044 |
|
|
| 28,519,536 |
|
Diluted |
|
| 30,031,609 |
|
|
| 29,651,490 |
|
|
| 29,292,738 |
|
(1) - We completed a two-for-one stock split on January 20, 2017. All share and per share data has been retroactively restated on a post-split basis.
The accompanying Notes to Consolidated Financial Statements are an integral part of these Financial Statements.
F-4
THE NAVIGATORS GROUP, INC. AND SUBSIDIARIES
CONSOLIDATED STATEMENTS OF COMPREHENSIVE INCOME
|
| Years Ended December 31, |
| |||||||||
amounts in thousands |
| 2016 |
|
| 2015 |
|
| 2014 |
| |||
Net income |
| $ | 82,726 |
|
| $ | 81,057 |
|
| $ | 95,329 |
|
Other comprehensive income (loss): |
|
|
|
|
|
|
|
|
|
|
|
|
Change in net unrealized gains (losses) on investments: |
|
|
|
|
|
|
|
|
|
|
|
|
Unrealized gains (losses) on investments arising during the period, net of deferred tax of $3,730, $2,624, and $(14,925) in 2016, 2015 and 2014 respectively |
| $ | (6,927 | ) |
| $ | (5,331 | ) |
| $ | 28,252 |
|
Reclassification adjustment for net realized (gains) losses included in net income net of deferred tax of $(846), $9,185, and $2,776 in 2016, 2015 and 2014 respectively |
|
| 1,572 |
|
|
| (17,058 | ) |
|
| (5,156 | ) |
Change in net unrealized gains (losses on investments) |
| $ | (5,355 | ) |
| $ | (22,389 | ) |
| $ | 23,096 |
|
Change in other-than-temporary impairments: |
|
|
|
|
|
|
|
|
|
|
|
|
Non credit other-than-temporary impairments arising during the period, net of deferred tax of $27, $60, and $(48) in 2016, 2015 and 2014 respectively |
| $ | (50 | ) |
| $ | (112 | ) |
| $ | 89 |
|
Reclassification adjustment for other-than-temporary impairment credit losses recognized in net income net of deferred tax of $0, $(90), and $0 in 2016, 2015 and 2014 respectively |
|
| - |
|
|
| 168 |
|
|
| - |
|
Change in other-than-temporary impairments |
| $ | (50 | ) |
| $ | 56 |
|
| $ | 89 |
|
Change in foreign currency translation gains (losses), net of deferred tax of $5,017, $351, and $2,800 in 2016, 2015 and 2014 respectively |
| $ | (9,324 | ) |
| $ | (622 | ) |
| $ | (4,986 | ) |
Other comprehensive income (loss) |
| $ | (14,729 | ) |
| $ | (22,955 | ) |
| $ | 18,199 |
|
Comprehensive income (loss) |
| $ | 67,997 |
|
| $ | 58,102 |
|
| $ | 113,528 |
|
The accompanying Notes to Consolidated Financial Statements are an integral part of these Financial Statements.
F-5
THE NAVIGATORS GROUP, INC. AND SUBSIDIARIES
CONSOLIDATED STATEMENTS OF STOCKHOLDERS' EQUITY
|
|
|
|
|
|
|
|
|
| Additional |
|
|
|
|
|
|
|
|
|
|
|
|
|
| Accumulated Other |
|
| Total |
| |||
|
| Common Stock |
|
| Paid-in |
|
| Treasury Stock |
|
| Retained |
|
| Comprehensive |
|
| Stockholders' |
| ||||||||||||||
amounts in thousands, except share amounts |
| Shares |
|
| Amount |
|
| Capital |
|
| Shares |
|
| Amount |
|
| Earnings |
|
| Income (Loss) |
|
| Equity |
| ||||||||
Balance, December 31, 2013 |
|
| 35,419,752 |
|
| $ | 3,540 |
|
| $ | 333,776 |
|
|
| 7,022,760 |
|
| $ | (155,801 | ) |
| $ | 692,337 |
|
| $ | 28,360 |
|
| $ | 902,212 |
|
Net income |
|
| - |
|
|
| - |
|
|
| - |
|
|
| - |
|
|
| - |
|
|
| 95,329 |
|
|
| - |
|
|
| 95,329 |
|
Changes in comprehensive income: |
|
|
|
|
|
|
|
|
|
|
|
|
|
|
|
|
|
|
|
|
|
|
|
|
|
|
|
|
|
|
|
|
Change in net unrealized gain (loss) on investments |
|
| - |
|
|
| - |
|
|
| - |
|
|
| - |
|
|
| - |
|
|
| - |
|
|
| 23,096 |
|
|
| 23,096 |
|
Change in net non-credit other-than-temporary impairment losses |
|
| - |
|
|
| - |
|
|
| - |
|
|
| - |
|
|
| - |
|
|
| - |
|
|
| 89 |
|
|
| 89 |
|
Change in foreign currency translation gain (loss) |
|
| - |
|
|
| - |
|
|
| - |
|
|
| - |
|
|
| - |
|
|
| - |
|
|
| (4,986 | ) |
|
| (4,986 | ) |
Total comprehensive income |
|
| - |
|
|
| - |
|
|
| - |
|
|
| - |
|
|
| - |
|
|
| - |
|
|
| 18,199 |
|
|
| 18,199 |
|
Shares issued (1) |
|
| 165,940 |
|
|
| 16 |
|
|
| (39 | ) |
|
| - |
|
|
| - |
|
|
|
|
|
|
| - |
|
|
| (23 | ) |
Share-based compensation |
|
| - |
|
|
| - |
|
|
| 11,507 |
|
|
| - |
|
|
| - |
|
|
| - |
|
|
| - |
|
|
| 11,507 |
|
Balance, December 31, 2014 |
|
| 35,585,692 |
|
| $ | 3,556 |
|
| $ | 345,244 |
|
|
| 7,022,760 |
|
| $ | (155,801 | ) |
| $ | 787,666 |
|
| $ | 46,559 |
|
| $ | 1,027,224 |
|
Net income |
|
| - |
|
|
| - |
|
|
| - |
|
|
| - |
|
|
| - |
|
|
| 81,057 |
|
|
| - |
|
|
| 81,057 |
|
Changes in comprehensive income: |
|
|
|
|
|
|
|
|
|
|
|
|
|
|
|
|
|
|
|
|
|
|
|
|
|
|
|
|
|
|
|
|
Change in net unrealized gain (loss) on investments |
|
| - |
|
|
| - |
|
|
| - |
|
|
| - |
|
|
| - |
|
|
| - |
|
|
| (22,389 | ) |
|
| (22,389 | ) |
Change in net non-credit other-than-temporary impairment losses |
|
| - |
|
|
| - |
|
|
| - |
|
|
| - |
|
|
| - |
|
|
| - |
|
|
| 56 |
|
|
| 56 |
|
Change in foreign currency translation gain (loss) |
|
| - |
|
|
| - |
|
|
| - |
|
|
| - |
|
|
| - |
|
|
| - |
|
|
| (622 | ) |
|
| (622 | ) |
Total comprehensive income |
|
| - |
|
|
| - |
|
|
| - |
|
|
| - |
|
|
| - |
|
|
| - |
|
|
| (22,955 | ) |
|
| (22,955 | ) |
Shares issued (1) |
|
| 298,846 |
|
|
| 30 |
|
|
| (4,205 | ) |
|
| - |
|
|
| - |
|
|
|
|
|
|
| - |
|
|
| (4,175 | ) |
Share-based compensation |
|
| - |
|
|
| - |
|
|
| 14,997 |
|
|
| - |
|
|
| - |
|
|
| - |
|
|
| - |
|
|
| 14,997 |
|
Balance, December 31, 2015 |
|
| 35,884,538 |
|
| $ | 3,586 |
|
| $ | 356,036 |
|
|
| 7,022,760 |
|
| $ | (155,801 | ) |
| $ | 868,723 |
|
| $ | 23,604 |
|
| $ | 1,096,148 |
|
Net income |
|
| - |
|
|
| - |
|
|
| - |
|
|
| - |
|
|
| - |
|
|
| 82,726 |
|
|
| - |
|
|
| 82,726 |
|
Dividends paid |
|
| - |
|
|
| - |
|
|
| - |
|
|
| - |
|
|
| - |
|
|
| (3,930 | ) |
|
| - |
|
|
| (3,930 | ) |
Changes in comprehensive income: |
|
|
|
|
|
|
|
|
|
|
|
|
|
|
|
|
|
|
|
|
|
|
|
|
|
|
|
|
|
| - |
|
Change in net unrealized gain (loss) on investments |
|
| - |
|
|
| - |
|
|
| - |
|
|
| - |
|
|
| - |
|
|
| - |
|
|
| (5,355 | ) |
|
| (5,355 | ) |
Change in net non-credit other-than-temporary impairment losses |
|
| - |
|
|
| - |
|
|
| - |
|
|
| - |
|
|
| - |
|
|
| - |
|
|
| (50 | ) |
|
| (50 | ) |
Change in foreign currency translation gain (loss) |
|
| - |
|
|
| - |
|
|
| - |
|
|
| - |
|
|
| - |
|
|
| - |
|
|
| (9,324 | ) |
|
| (9,324 | ) |
Total comprehensive income |
|
| - |
|
|
| - |
|
|
| - |
|
|
| - |
|
|
| - |
|
|
| - |
|
|
| (14,729 | ) |
|
| (14,729 | ) |
Shares issued (1) |
|
| 262,361 |
|
|
| 26 |
|
|
| 323 |
|
|
| - |
|
|
| - |
|
|
|
|
|
|
| - |
|
|
| 349 |
|
Share-based compensation |
|
| - |
|
|
| - |
|
|
| 17,624 |
|
|
| - |
|
|
| - |
|
|
| - |
|
|
| - |
|
|
| 17,624 |
|
Balance, December 31, 2016 |
|
| 36,146,899 |
|
| $ | 3,612 |
|
| $ | 373,983 |
|
|
| 7,022,760 |
|
| $ | (155,801 | ) |
| $ | 947,519 |
|
| $ | 8,875 |
|
| $ | 1,178,188 |
|
(1) Includes shares issued under the stock plan, to directors and ESPP
We completed a two-for-one stock split on January 20, 2017. All share data has been retroactively restated on a post-split basis .
The accompanying Notes to Consolidated Financial Statements are an integral part of these Financial Statements.
F-6
THE NAVIGATORS GROUP, INC. AND SUBSIDIARIES
CONSOLIDATED STATEMENTS OF CASH FLOWS
|
| Years Ended December 31, |
| |||||||||
amounts in thousands |
| 2016 |
|
| 2015 |
|
| 2014 |
| |||
Operating activities: |
|
|
|
|
|
|
|
|
|
|
|
|
Net income |
| $ | 82,726 |
|
| $ | 81,057 |
|
| $ | 95,329 |
|
Adjustments to reconcile net income to net cash provided by (used in) operating activities: |
|
|
|
|
|
|
|
|
|
|
|
|
Depreciation & amortization |
|
| 5,429 |
|
|
| 5,386 |
|
|
| 4,915 |
|
Share-based compensation |
|
| 17,624 |
|
|
| 14,997 |
|
|
| 11,507 |
|
Deferred income taxes |
|
| (5,755 | ) |
|
| 7,004 |
|
|
| 16,881 |
|
Net realized (gains) losses |
|
| (9,186 | ) |
|
| (8,373 | ) |
|
| (12,812 | ) |
Net other-than-temporary losses recognized in earnings |
|
| 150 |
|
|
| 1,698 |
|
|
| - |
|
Changes in assets and liabilities: |
|
|
|
|
|
|
|
|
|
|
|
|
Reinsurance recoverable on paid and unpaid losses and loss adjustment expenses |
|
| (2,835 | ) |
|
| 43,822 |
|
|
| (42,024 | ) |
Reserves for losses and loss adjustment expenses |
|
| 87,083 |
|
|
| 43,010 |
|
|
| 114,563 |
|
Prepaid reinsurance premiums |
|
| 19,211 |
|
|
| 5,264 |
|
|
| 10,344 |
|
Unearned premiums |
|
| 66,668 |
|
|
| 54,509 |
|
|
| 52,380 |
|
Premiums receivable |
|
| (30,070 | ) |
|
| 65,863 |
|
|
| (17,455 | ) |
Deferred policy acquisition costs |
|
| (27,677 | ) |
|
| (12,531 | ) |
|
| (12,445 | ) |
Accrued investment income |
|
| (1,314 | ) |
|
| (1,210 | ) |
|
| (925 | ) |
Reinsurance balances payable |
|
| 1,568 |
|
|
| (45,124 | ) |
|
| (14,716 | ) |
Current income taxes |
|
| (1,988 | ) |
|
| (8,072 | ) |
|
| (582 | ) |
Other |
|
| 22,593 |
|
|
| (19,676 | ) |
|
| 17,532 |
|
Net cash provided by (used in) operating activities |
| $ | 224,227 |
|
| $ | 227,624 |
|
| $ | 222,492 |
|
|
|
|
|
|
|
|
|
|
|
|
|
|
Investing activities: |
|
|
|
|
|
|
|
|
|
|
|
|
Fixed maturities |
|
|
|
|
|
|
|
|
|
|
|
|
Redemptions and maturities |
| $ | 275,706 |
|
| $ | 180,876 |
|
| $ | 210,674 |
|
Sales |
|
| 446,666 |
|
|
| 376,522 |
|
|
| 362,136 |
|
Purchases |
|
| (962,419 | ) |
|
| (648,059 | ) |
|
| (864,902 | ) |
Equity securities |
|
|
|
|
|
|
|
|
|
|
|
|
Sales |
|
| 54,798 |
|
|
| 96,405 |
|
|
| 54,900 |
|
Purchases |
|
| (92,329 | ) |
|
| (215,405 | ) |
|
| (83,845 | ) |
Change in payable for securities |
|
| (1,517 | ) |
|
| 1,851 |
|
|
| (7,814 | ) |
Purchase of other invested assets |
|
| (1,960 | ) |
|
| - |
|
|
| - |
|
Net change in short-term investments |
|
| 73,541 |
|
|
| (38,468 | ) |
|
| 117,740 |
|
Purchase of property and equipment |
|
| (3,918 | ) |
|
| (3,577 | ) |
|
| (8,359 | ) |
Net cash provided by (used in) investing activities |
| $ | (211,432 | ) |
| $ | (249,855 | ) |
| $ | (219,470 | ) |
|
|
|
|
|
|
|
|
|
|
|
|
|
Financing activities: |
|
|
|
|
|
|
|
|
|
|
|
|
Proceeds of stock issued from employee stock purchase plan |
|
| 1,840 |
|
|
| 1,352 |
|
|
| 1,067 |
|
Proceeds of stock issued from exercise of stock options |
|
| - |
|
|
| 29 |
|
|
| 153 |
|
Dividends paid |
|
| (3,930 | ) |
|
| - |
|
|
| - |
|
Net cash provided by (used in) financing activities |
| $ | (2,090 | ) |
| $ | 1,381 |
|
| $ | 1,220 |
|
|
|
|
|
|
|
|
|
|
|
|
|
|
Effect of exchange rate on cash |
|
| (15,963 | ) |
|
| - |
|
|
| - |
|
|
|
|
|
|
|
|
|
|
|
|
|
|
Change in cash |
| $ | (5,258 | ) |
| $ | (20,850 | ) |
| $ | 4,242 |
|
Cash at beginning of year |
|
| 69,901 |
|
|
| 90,751 |
|
|
| 86,509 |
|
Cash at end of period |
| $ | 64,643 |
|
| $ | 69,901 |
|
| $ | 90,751 |
|
|
|
|
|
|
|
|
|
|
|
|
|
|
Supplemental cash information: |
|
|
|
|
|
|
|
|
|
|
|
|
Income taxes paid, net |
| $ | 34,830 |
|
| $ | 35,447 |
|
| $ | 27,066 |
|
Interest paid |
| $ | 15,238 |
|
| $ | 15,238 |
|
| $ | 15,703 |
|
Issuance of stock to directors |
| $ | 633 |
|
| $ | 563 |
|
| $ | 438 |
|
The accompanying Notes to Consolidated Financial Statements are an integral part of these Financial Statements.
F-7
THE NAVIGATORS GROUP, INC. AND SUBSIDIARIES
NOTES TO CONSOLIDATED FINANCIAL STATEMENTS
NOTE 1. ORGANIZATION & SUMMARY OF SIGNIFICANT ACCOUNTING POLICIES
Basis of Presentation
The accompanying consolidated financial statements of The Navigators Group, Inc. and its subsidiaries have been prepared in conformity with accounting principles generally accepted in the United States of America ("GAAP" or "U.S. GAAP"). All significant intercompany transactions and balances have been eliminated in consolidation. The preparation of these financial statements requires management to make estimates and assumptions that affect the reported amounts of assets and liabilities, disclosure of contingent assets and liabilities at the date of the financial statements and the reported revenues and expenses during the reporting periods. Certain amounts for the prior year have been reclassified to conform with the current period presentation. Unless the context requires otherwise, the terms "we," "us," "our," or "our Company" are used to mean The Navigators Group, Inc., a Delaware holding company established in 1982, and its subsidiaries. The term "Parent Company" is used to mean The Navigators Group, Inc. without its subsidiaries.
Organization
We are an international insurance company with a long-standing area of specialization in Marine insurance. Our Property and Casualty ("P&C") insurance business primarily offers general liability coverage and umbrella & excess liability coverage to commercial enterprises through our U.S. and Int'l Insurance reporting segments. We have also developed niches in Professional Liability insurance, through our Directors & Officers ("D&O") and Errors & Omissions ("E&O") divisions. We also provide reinsurance products through our Global Reinsurance ("GlobalRe") business.
We operate through various wholly-owned subsidiaries, including Navigators Insurance Company ("NIC"), inclusive of its United Kingdom Branch ("U.K. Branch"), and Navigators Specialty Insurance Company ("NSIC"), both of which are U.S. insurance companies, and Navigators Underwriting Agency Ltd. ("NUAL"), a Lloyd's of London ("Lloyd's") underwriting agency that manages Lloyd's Syndicate 1221 ("the Syndicate") in the U.K. and is the underwriting company of Navigators Holdings (U.K.) Ltd. ("NHUK"). Our Company controls 100% of the Syndicate's stamp capacity.
In May 2016, our Company received authorization from the Prudential Regulation Authority ("PRA") and the Financial Conduct Authority ("FCA") for a new U.K. based insurance company, Navigators International Insurance Company Ltd ("NIIC"), which is a wholly-owned direct subsidiary of our Parent Company, and has been fully capitalized in compliance with the terms of the authorization from the PRA.
Significant Accounting Policies
Cash
Cash includes cash on hand and demand deposits with banks, excluding such amounts held by the Syndicate included as Funds at Lloyd's ("FAL"), which are classified as short term investments.
Investments
As of December 31, 2016 and 2015, all fixed maturity and equity securities held by our Company were carried at fair value and classified as available-for-sale. Available-for-sale securities are debt and equity securities not classified as either held-to-maturity securities or trading securities and are reported at fair value, with unrealized gains and losses excluded from earnings and reported in accumulated other comprehensive income ("AOCI") as a separate component of stockholders' equity. Fixed maturity securities include bonds, mortgage-backed and asset-backed securities. Equity securities consist of common stock, exchange traded funds and preferred stock.
Other invested assets consist of investments our Company made in certain strategic companies which are accounted for using the equity method of accounting. In applying the equity method, these investments are initially recorded at cost and are subsequently adjusted based on our Company's proportionate share of the net income or loss of the companies. Changes in the carrying value of such investments are recorded in Other income. In applying the equity method, we use the most recently available financial information provided by the companies which is generally three months prior to the end of the reporting period.
Short-term investments are carried at fair value. Short-term investments mature within one year from the purchase date.
F-8
All prices for our fixed maturities, equity securities and short-term investments are classified as Level 1, Level 2 or Level 3 under the fair value hierarchy, as defined in the Financial Accounting Standards Board ("FASB") Accounting Standards Codification 820 ("ASC 82 0").
Premiums and discounts on fixed maturity securities are amortized into interest income over the life of the security using the interest method. For mortgage-backed and asset-backed securities, anticipated prepayments and expected maturities are utilized in applying the interest rate method. An effective yield is calculated based on projected principal cash flows at the time of original purchase. The effective yield is used to amortize the purchase price of the security over the security's expected life. Book values are adjusted to reflect the amortization of premium or accretion of discount on a monthly basis. The projected principal cash flows are based on certain prepayment assumptions, which are generated using a prepayment model. The prepayment model uses a number of factors to estimate prepayment activity including the current levels of interest rates (refinancing incentive), time of year (seasonality), economic activity (including housing turnover) and term and age of the underlying collateral (burnout, seasoning). Prepayment assumptions associated with the mortgage-backed and asset-backed securities are reviewed on a periodic basis. When changes in prepayment assumptions are deemed necessary as the result of actual prepayments differing from anticipated prepayments, securities are revalued based upon the new prepayment assumptions utilizing the retrospective adjustment method, whereby the effective yield is recalculated to reflect actual payments to date and anticipated future payments. The investment in such securities is adjusted to the amount that would have existed had the new effective yield been applied since the acquisition of the security. Such adjustments, if any, are included in Net investment income for the current period.
Realized gains and losses on sales of investments are recognized when the related trades are executed and are determined on the basis of the specific identification method.
Impairment of Invested Assets
Management regularly reviews our fixed maturity and equity securities portfolios to evaluate the necessity of recording impairment losses for other-than-temporary declines in the fair value of securities.
Our Company reviews the magnitude of a security's unrealized loss compared to its cost/amortized cost and the length of time that the security has been impaired to determine if an unrealized loss is other-than-temporary. If warranted as a result of conditions relating to a particular security, our Company will also review securities with declines in fair value resulting from a headline news event involving the issuer, a headline news event involving the asset class, the advice of our external asset managers, or economic events that may impact the issuer to determine if an unrealized loss is other-than-temporary. The depth of analysis performed is dependent upon the nature and magnitude of the indicators of other-than-temporary impairment present in regards to each impaired security.
For Equity securities, our Company performs a fundamental analysis of the issuer, including an evaluation of the mean analysts' target price, to assess the likelihood of recovery of our cost basis in the security. Management also assesses the likelihood of future cash flows, dividends and increases to dividends, all of which affect the securities eligible for our equity strategy and therefore our intent to hold the security. If an equity security is deemed to be other-than temporarily-impaired, the cost is written down to fair value with the loss recognized in earnings.
For Fixed maturities, our Company assesses the underlying fundamentals of each issuer to determine if there is a change in the amount or timing of expected cash flows. Management compares the amortized cost basis to the present value of the revised cash flows using the historical book yield to determine the credit loss portion of impairment which is recognized in earnings. All non-credit losses where we have the intent and ability to hold the security until recovery are recognized as changes in OTTI losses within AOCI.
Specifically for structured Fixed maturities, our Company analyzes projections provided by our investment managers with respect to an expected principal loss under a range of scenarios and utilizes the most likely outcomes. The analysis relies on actual collateral performance measures such as default rate, prepayment rate and loss severity. These assumptions are applied throughout the remaining term of the deal, incorporating the transaction structure and priority of payments, to generate loss adjusted cash flows. Results of the analysis will indicate whether the security is expected ultimately to incur a loss or whether there is a material impact on yield due to either a projected loss or a change in cash flow timing. A break-even default rate is also calculated. A comparison of the break-even default rate to the actual default rate provides an indication of the level of cushion or coverage to the first dollar principal loss. For securities in which a tranche loss is present and the net present value of loss adjusted cash flows is less than book value, credit impairment is recognized in earnings. The output data also includes a number of additional metrics such as average life remaining, original and current credit support, over 60 day delinquency and security rating. The significant inputs used to measure the amount of credit loss recognized in earnings were actual delinquency rates, default probability, severity and prepayment assumptions. Projected losses are a function of both loss severity and probability of default, which differ based on property type, vintage and the stress of the collateral .
F-9
Foreign Currency Remeasurement and Translation
The functional currency of each of our operations is generally the currency of the local operating environment, except for our Lloyd's business which is United States Dollar ("USD"). Transactions in currencies other than an operation's functional currency are remeasured into the functional currency and the resulting foreign exchange gains and losses are reflected in net Other income (expense) in the Consolidated Statements of Income. Functional currency assets and liabilities of foreign operations are translated into USD using period end rates of exchange and the related translation adjustments are recorded as a separate component of AOCI. Consolidated Statements of Income amounts expressed in functional currencies are translated using average exchange rates.
During the first quarter of 2014, the Syndicate revised its foreign exchange accounting methodology from reporting its financial position and results using three functional currencies British Pound Sterling ("GBP"), U.S. Dollars ("USD") and Canadian Dollars ("CAD") to one functional currency, the USD. The USD was chosen as the single functional currency as the majority of the Syndicate's insurance business has been and continues to be transacted in USD. This cumulative change in remeasurement resulted in a 2014 immaterial correction of $10.0 million ($6.6 million after-tax) in AOCI, on the Consolidated Balance Sheets, offset by a gain in Other income in the Consolidated Statements of Income.
Premium Revenues
Written premium is based on the insurance policies that have been reported to us and the policies that have been written by agents but not yet reported to us. We estimate the amount of written premium not yet reported based on judgments relative to current and historical trends of the business being written. Such estimates are regularly reviewed and updated and any resulting adjustments are included in the current year's results. An Unearned premium reserve is established to reflect the unexpired portion of each policy at the financial reporting date.
Substantially all of our business is placed through agents and brokers. We record estimates for both unreported direct and assumed premiums. We also record the ceded portion of the estimated Gross written premiums and related acquisition costs. These estimates are mostly for our Marine and Energy & Engineering products written by our International Insurance ("Int'l Insurance") reporting segment as well as our Accident & Health ("A&H") and Latin American ("LatAm") business written by our GlobalRe reporting segment. Such premium estimates are generally based on submission data received from brokers and agents and recorded when the insurance policy or reinsurance contract is written or bound.
The earned gross, ceded and net premiums are calculated based on our earning methodology, which is generally pro-rata over the policy period or over the period of risk if the period of risk differs significantly from the contract period.
Reinsurance Ceded
In the normal course of business, we purchase reinsurance from insurers or reinsurers to reduce the amount of loss arising from claims. Management analyzes the reinsurance agreements to determine whether the reinsurance should be classified as prospective or retroactive based upon the terms of the reinsurance agreement and whether the reinsurer has assumed significant insurance risk to the extent that the reinsurer may realize a significant loss from the transaction.
Prospective reinsurance is reinsurance in which an assuming company agrees to reimburse the ceding company for losses that may be incurred as a result of future insurable events covered under contracts subject to the reinsurance. Retroactive reinsurance is reinsurance in which an assuming company agrees to reimburse a ceding company for liabilities incurred as a result of past insurable events covered under contracts subject to the reinsurance.
Ceded reinsurance premiums net of ceding commissions and ceded losses are reflected as reductions of the respective income or expense accounts over the terms of the reinsurance contracts. Prepaid reinsurance premiums represent the portion of premiums ceded to reinsurers applicable to the unexpired terms of the reinsurance contracts in force. Reinsurance reinstatement premiums ("RRPs") are recognized in the same period as the loss event that gave rise to the reinstatement premiums. Amounts recoverable from reinsurers are estimated in a manner consistent with the claim liability associated with the reinsured policy. Ceded Unearned premiums and estimates of amounts recoverable from reinsurers on paid and unpaid losses are reflected as assets. Provisions are made for estimated unrecoverable reinsurance.
Deferred Policy Acquisition Costs
Costs of acquiring business are deferred and amortized over the period that the related premiums are recognized as revenue. Such costs (e.g., Commission expenses, Other underwriting expenses and Premium taxes) are limited to the incremental direct costs related to the successful acquisition of new or renewal business. The method of computing deferred policy acquisition costs limits the
F-10
deferral to their estimated net realizable value based on the related Unearned premiums and takes into account anticipated losses, loss adjustment expense ("LAE"), Commission expenses and Operating expenses based on historical and current experience, as well as anticipated investment income.
Reserves for Losses and Loss Adjustment Expenses
Unpaid losses and LAE are determined on: (a) individual claims reported on direct business for insureds, (b) from reports received from ceding insurers for assumed business and (c) on estimates based on Company and industry experience for incurred but not reported ("IBNR") claims and LAE. Indicated IBNR reserves for losses and LAE are calculated by our actuaries using several standard actuarial methodologies, including the paid and incurred loss development and the paid and incurred Bornheutter-Ferguson loss methods. Frequency/severity analyses are performed for certain books of business. The Reserve for losses and LAE has been established to cover the estimated unpaid cost of claims incurred. Such estimates are regularly compared to indicated reserves and updated and any resulting adjustments are included in the current year's results. Management believes that the liability recognized for unpaid losses and LAE is a reasonable estimate of the ultimate unpaid claims incurred, however, no representation is made that the ultimate liability will not differ materially from the amounts recorded in the accompanying Consolidated Financial Statements. Losses and LAE are recorded on an undiscounted basis.
Earnings per Share
Basic earnings per share ("EPS") is computed by dividing Net income by the weighted average number of common shares outstanding for the period. Diluted EPS reflects the basic EPS adjusted for the potential dilution that would occur if all issued stock options were exercised and all stock grants were fully vested.
Depreciation and Amortization
Depreciation of furniture and fixtures, electronic data processing equipment and computer software is provided over the estimated useful lives of the respective assets, ranging from three to seven years, using the straight-line method. Amortization of leasehold improvements are provided over the shorter of the useful lives of those improvements or the contractual terms of the leases, ranging from five to ten years, using the straight-line method.
Goodwill and Other Intangible Assets
Goodwill represents the excess of the cost of acquiring a business enterprise over the fair value of the net assets acquired. Our Company's recorded indefinite lived intangible assets represent acquired stamp capacity in the Syndicate. Goodwill and indefinite lived intangible assets are reported at carrying value and are tested for impairment at least annually, and when permitted by the applicable accounting guidance, qualitative factors are assessed to determine whether it is necessary to calculate an asset's fair value when testing an asset with an indefinite life for impairment. Goodwill and indefinite lived intangible assets are considered impaired if the estimated fair value is less than its carrying value and any impairment loss is measured as the difference between the implied fair value and the carrying value. Our Company did not recognize an impairment of goodwill or the indefinite lived intangible assets for any of the years ended December 31, 2016, 2015 and 2014.
As of December 31, 2016, the carrying value of goodwill and indefinite lived intangible assets was $6.5 million, which is $0.3 million less than the carrying value as of December 31, 2015, $6.8 million. Changes in the carrying value of the goodwill and indefinite lived intangible assets are due to amortization and fluctuations in currency exchange rates between the USD and the GBP.
Income Taxes
We recognize deferred tax assets and liabilities based on the differences between the financial statement carrying amounts and the tax bases of assets and liabilities. Deferred tax assets are reduced by a valuation allowance if, based on the weight of available evidence, it is more likely than not that some portion or all of the deferred tax assets will not be realized. All available evidence, both positive and negative, is considered to determine whether, based on the weight of that evidence, a valuation allowance is needed. Future realization of the tax benefit of an existing deferred tax asset ultimately depends on the existence of sufficient taxable income of the appropriate character within the carryback/carryforward period available under the tax law. In determining whether a valuation allowance is needed, management considers the timing of the reversal of each deferred tax asset as well as expected future levels of taxable income, amounts of taxable income in carryback years, and tax planning strategies. Additional information regarding our deferred tax assets can be found in Note 9, Income Taxes.
F-11
Current and Pending Accounting Pronouncements
As of January 1, 2016, we adopted the following accounting pronouncements, which did not have a material effect, singly or in the aggregate, on our Consolidated Financial Statements:
| • | Accounting Standards Update 2015-03 – Interest – Imputation of Interest (Subtopic 835-30) – Simplifying the Presentation of Debt Issuance Costs, which is effective for fiscal years beginning after December 15, 2015. The new pronouncement was issued to simplify presentation of debt issuance costs. |
| • | Accounting Standards Update 2015-05 – Intangibles – Goodwill and Other – Internal Use Software (Subtopic 350-40) Customer's Accounting for Fees Paid in a Cloud Computing Arrangement, which is effective for fiscal years beginning after December 15, 2015. The new pronouncement was issued to provide guidance to customers about whether a cloud computing arrangement includes a software license. |
| • | Accounting Standards Update 2015-07 – Fair Value Measurement – (Topic 820) Disclosures for Investments in Certain Entities that Calculate Net Asset Value per Share (or its equivalent) (a consensus of the Emerging Issues Task Force), which is effective for fiscal years beginning after December 15, 2015. The new pronouncement was issued to ensure that all investments categorized in the fair value hierarchy are classified using a consistent approach. |
The Financial Accounting Standards Board has issued the following new pronouncements that may have an impact on our Company and we are assessing the future impact of these updates on our Consolidated Financial Statements:
| • | Accounting Standards Update 2016-01 – Financial Instruments (Subtopic 825-10) – Recognition and Measurement of Financial Assets and Financial Liabilities, which will be effective for fiscal years beginning after December 15, 2017. The new pronouncement was issued to make targeted improvements to the presentation of financial instruments. We expect the adoption of this pronouncement to have limited impact to our financial statements. |
| • | Accounting Standards Update 2016-02 – Leases (Topic 842) – Amends the recognition of a right-to-use asset and lease liability on the statement of financial position of those leases previously classified as operating leases under the previous guidance, which will be effective for fiscal years beginning after December 15, 2018. The new pronouncement was issued to improve transparency and comparability among organizations by recognizing lease assets and lease liabilities on the balance sheet and disclosing key information about leasing arrangements. We expect the adoption of this pronouncement to result in limited changes to our total assets and total liabilities. |
| • | Accounting Standards Update 2016-09 – Compensation – Stock Compensation – (Topic 718) – Improvements to Employee Share-Based Accounting, which will be effective for fiscal years beginning after December 15, 2016. The new pronouncement was issued to simplify employee share-based accounting. We expect the adoption of this pronouncement to simplify our reporting but not have a material effect to our financial statements. |
| • | Accounting Standards Update 2016-13 – Financial Instruments – Credit Losses (Topic 326) – amends the measurement of credit losses on financial instruments not accounted for at fair value including loans, debt securities, reinsurance receivables and any other financial assets, which will be effective for the fiscal years beginning after December 15, 2019, including interim periods within those fiscal years. We expect the adoption of this pronouncement to have limited impact to our financial statements. |
| • | Accounting Standards Update 2016-15 – Statements of Cash Flows (Topic 230) – Classification of Certain Cash Receipts and Cash Payments amends how certain cash receipts and cash payments are presented in the statement of cash flows to reduce existing diversity in practice. We expect that the adoption of this pronouncement will not have a material effect on our financial statements. |
| • | Accounting Standards Update 2016-16 - Income Taxes (Topic 740) - Amends current guidance by eliminating the exception for an intra-entity transfer of an asset other than inventory. Under the new standard, an entity should recognize the income tax consequences when the transfer occurs. The guidance prescribed is effective beginning fiscal year 2018, including interim periods. We expect that the adoption of this pronouncement will not have a material effect on our financial statements. |
| • | Accounting Standards Update 2016-17 - Consolidation (Topic 810) - Amends the consolidation guidance concerning the evaluation of interests in variable interest entities. The accounting standards update requires a reporting entity to include interests held by related parties under common control proportionally when assessing whether it holds a variable interest in a VIE. The prescribed guidance is effective beginning in fiscal year 2017, including interim periods. We expect that the adoption of this pronouncement will not have a material effect on our financial statements. |
| • | Accounting Standards Updated 2016-18 - Statement of Cash Flows (Topic 230) - Requires that amounts generally described as restricted cash and cash equivalents be included within total cash and cash equivalents in the Statement of |
F-12
| Cash Flows. The guidance prescribed is effective beginning in fiscal year 2018, including interim periods. We expect the adoption of this pronouncement to have limited impact to our financial statements. |
There were no additional accounting pronouncements that are expected to have an impact on the Consolidated Financial Statements upon adoption.
NOTE 2. SEGMENT INFORMATION
We report our results of operations consistent with the manner in which our Chief Operating Decision Maker reviews the business to assess performance through our reporting segments: U.S. Insurance, International Insurance ("Int'l Insurance"), GlobalRe and Corporate.
We classify our business into three underwriting segments: U.S. Insurance, Int'l Insurance and GlobalRe. Both the U.S. Insurance and Int'l Insurance reporting segments are each comprised of three operating segments: Marine, P&C and Professional Liability.
We evaluate the performance of each of the underwriting segments based on underwriting results. Underwriting results are measured based on Underwriting profit or loss and the related Combined ratio, which are both non-GAAP measures of underwriting profitability. Underwriting profit (loss) is calculated from Net earned premiums less the sum of Net losses and LAE, Commission expenses, Other operating expenses and Other underwriting income (expense). The Combined ratio is derived by dividing the sum of Net losses and LAE, Commission expenses, Other operating expenses and Other underwriting income (expense) by Net earned premiums. A Combined ratio of less than 100% indicates an underwriting profit and greater than 100% indicates an underwriting loss. Our underwriting performance is evaluated separately from the rest of our operations. The performance of our investment portfolios, our liquidity and capital resource needs, our foreign currency exposure and our tax planning strategies are evaluated on a consolidated basis within our Corporate segment.
The following tables set forth the financial data by segment for the years ended December 31, 2016, 2015 and 2014:
|
| Year Ended December 31, 2016 |
| |||||||||||||||||
|
| U.S. |
|
| Int'l |
|
|
|
|
|
|
|
|
|
|
|
|
| ||
amounts in thousands |
| Insurance |
|
| Insurance |
|
| GlobalRe |
|
| Corporate (1) |
|
| Total |
| |||||
Net earned premiums |
| $ | 629,308 |
|
| $ | 307,416 |
|
| $ | 163,621 |
|
| $ | - |
|
| $ | 1,100,345 |
|
Net losses and LAE |
|
| (397,860 | ) |
|
| (178,284 | ) |
|
| (89,304 | ) |
|
| - |
|
|
| (665,448 | ) |
Commission expenses |
|
| (70,812 | ) |
|
| (61,703 | ) |
|
| (34,008 | ) |
|
| 1,478 |
|
|
| (165,045 | ) |
Other operating expenses |
|
| (128,108 | ) |
|
| (86,395 | ) |
|
| (19,593 | ) |
|
| - |
|
|
| (234,096 | ) |
Other underwriting income (expense) |
|
| 1,092 |
|
|
| - |
|
|
| 522 |
|
|
| (1,478 | ) |
|
| 136 |
|
|
|
|
|
|
|
|
|
|
|
|
|
|
|
|
|
|
|
|
|
|
Underwriting profit (loss) |
| $ | 33,620 |
|
| $ | (18,966 | ) |
| $ | 21,238 |
|
| $ | - |
|
| $ | 35,892 |
|
|
|
|
|
|
|
|
|
|
|
|
|
|
|
|
|
|
|
|
|
|
Net investment income |
|
|
|
|
|
|
|
|
|
|
|
|
|
| 79,451 |
|
|
| 79,451 |
|
Net realized gains (losses) |
|
|
|
|
|
|
|
|
|
|
|
|
|
| 9,036 |
|
|
| 9,036 |
|
Interest expense |
|
|
|
|
|
|
|
|
|
|
|
|
|
| (15,435 | ) |
|
| (15,435 | ) |
Other income (loss) |
|
|
|
|
|
|
|
|
|
|
|
|
|
| 8,565 |
|
|
| 8,565 |
|
|
|
|
|
|
|
|
|
|
|
|
|
|
|
|
|
|
|
|
|
|
Income before income taxes |
| $ | 33,620 |
|
| $ | (18,966 | ) |
| $ | 21,238 |
|
| $ | 81,617 |
|
| $ | 117,509 |
|
Income tax (expense) benefit |
|
|
|
|
|
|
|
|
|
|
|
|
|
| (34,783 | ) |
|
| (34,783 | ) |
Net income (loss) |
|
|
|
|
|
|
|
|
|
|
|
|
|
|
|
|
| $ | 82,726 |
|
|
|
|
|
|
|
|
|
|
|
|
|
|
|
|
|
|
|
|
|
|
Losses and LAE ratio |
|
| 63.2 | % |
|
| 58.0 | % |
|
| 54.6 | % |
|
|
|
|
|
| 60.5 | % |
Commission expense ratio |
|
| 11.3 | % |
|
| 20.1 | % |
|
| 20.8 | % |
|
|
|
|
|
| 15.0 | % |
Other operating expense ratio (2) |
|
| 20.2 | % |
|
| 28.1 | % |
|
| 11.6 | % |
|
|
|
|
|
| 21.2 | % |
Combined ratio |
|
| 94.7 | % |
|
| 106.2 | % |
|
| 87.0 | % |
|
|
|
|
|
| 96.7 | % |
( 1) - Includes Corporate segment intercompany eliminations.
(2) - Includes Other operating expenses and Other underwriting income (expense).
F-13
|
| Year Ended December 31, 2015 |
| |||||||||||||||||
|
| U.S. |
|
| Int'l |
|
|
|
|
|
|
|
|
|
|
|
|
| ||
amounts in thousands |
| Insurance |
|
| Insurance |
|
| GlobalRe |
|
| Corporate (1) |
|
| Total |
| |||||
Net earned premiums |
| $ | 555,836 |
|
| $ | 259,960 |
|
| $ | 168,291 |
|
| $ | - |
|
| $ | 984,087 |
|
Net losses and LAE |
|
| (343,497 | ) |
|
| (134,702 | ) |
|
| (94,399 | ) |
|
| - |
|
|
| (572,598 | ) |
Commission expenses |
|
| (56,319 | ) |
|
| (43,676 | ) |
|
| (32,240 | ) |
|
| 2,258 |
|
|
| (129,977 | ) |
Other operating expenses |
|
| (131,407 | ) |
|
| (75,867 | ) |
|
| (16,242 | ) |
|
| - |
|
|
| (223,516 | ) |
Other underwriting income (expense) |
|
| 1,690 |
|
|
| - |
|
|
| 690 |
|
|
| (2,258 | ) |
|
| 122 |
|
|
|
|
|
|
|
|
|
|
|
|
|
|
|
|
|
|
|
|
|
|
Underwriting profit (loss) |
| $ | 26,303 |
|
| $ | 5,715 |
|
| $ | 26,100 |
|
| $ | - |
|
| $ | 58,118 |
|
|
|
|
|
|
|
|
|
|
|
|
|
|
|
|
|
|
|
|
|
|
Net investment income |
|
|
|
|
|
|
|
|
|
|
|
|
|
| 68,718 |
|
|
| 68,718 |
|
Net realized gains (losses) |
|
|
|
|
|
|
|
|
|
|
|
|
|
| 6,675 |
|
|
| 6,675 |
|
Interest expense |
|
|
|
|
|
|
|
|
|
|
|
|
|
| (15,424 | ) |
|
| (15,424 | ) |
Other income (loss) |
|
|
|
|
|
|
|
|
|
|
|
|
|
| (613 | ) |
|
| (613 | ) |
|
|
|
|
|
|
|
|
|
|
|
|
|
|
|
|
|
|
|
|
|
Income before income taxes |
| $ | 26,303 |
|
| $ | 5,715 |
|
| $ | 26,100 |
|
| $ | 59,356 |
|
| $ | 117,474 |
|
Income tax (expense) benefit |
|
|
|
|
|
|
|
|
|
|
|
|
|
| (36,417 | ) |
|
| (36,417 | ) |
Net income (loss) |
|
|
|
|
|
|
|
|
|
|
|
|
|
|
|
|
| $ | 81,057 |
|
|
|
|
|
|
|
|
|
|
|
|
|
|
|
|
|
|
|
|
|
|
Losses and LAE ratio |
|
| 61.8 | % |
|
| 51.8 | % |
|
| 56.1 | % |
|
|
|
|
|
| 58.2 | % |
Commission expense ratio |
|
| 10.1 | % |
|
| 16.8 | % |
|
| 19.2 | % |
|
|
|
|
|
| 13.2 | % |
Other operating expense ratio (2) |
|
| 23.4 | % |
|
| 29.2 | % |
|
| 9.2 | % |
|
|
|
|
|
| 22.7 | % |
Combined ratio |
|
| 95.3 | % |
|
| 97.8 | % |
|
| 84.5 | % |
|
|
|
|
|
| 94.1 | % |
(1) - Includes Corporate segment intercompany eliminations.
(2) - Includes Other operating expenses and Other underwriting income (expense ).
|
| Year Ended December 31, 2014 |
| |||||||||||||||||
|
| U.S. |
|
| Int'l |
|
|
|
|
|
|
|
|
|
|
|
|
| ||
amounts in thousands |
| Insurance |
|
| Insurance |
|
| GlobalRe |
|
| Corporate (1) |
|
| Total |
| |||||
Net earned premiums |
| $ | 504,289 |
|
| $ | 243,485 |
|
| $ | 188,121 |
|
| $ | - |
|
| $ | 935,895 |
|
Net losses and LAE |
|
| (311,839 | ) |
|
| (115,079 | ) |
|
| (118,311 | ) |
|
| - |
|
|
| (545,229 | ) |
Commission expenses |
|
| (49,840 | ) |
|
| (44,426 | ) |
|
| (33,429 | ) |
|
| 2,167 |
|
|
| (125,528 | ) |
Other operating expenses |
|
| (115,817 | ) |
|
| (65,275 | ) |
|
| (15,733 | ) |
|
| - |
|
|
| (196,825 | ) |
Other underwriting income (expense) |
|
| 2,241 |
|
|
| 32 |
|
|
| 489 |
|
|
| (2,167 | ) |
|
| 595 |
|
|
|
|
|
|
|
|
|
|
|
|
|
|
|
|
|
|
|
|
|
|
Underwriting profit (loss) |
| $ | 29,034 |
|
| $ | 18,737 |
|
| $ | 21,137 |
|
| $ | - |
|
| $ | 68,908 |
|
|
|
|
|
|
|
|
|
|
|
|
|
|
|
|
|
|
|
|
|
|
Net investment income |
|
|
|
|
|
|
|
|
|
|
|
|
|
| 64,168 |
|
|
| 64,168 |
|
Net realized gains (losses) |
|
|
|
|
|
|
|
|
|
|
|
|
|
| 12,812 |
|
|
| 12,812 |
|
Interest expense |
|
|
|
|
|
|
|
|
|
|
|
|
|
| (15,413 | ) |
|
| (15,413 | ) |
Other income (loss) |
|
|
|
|
|
|
|
|
|
|
|
|
|
| 10,061 |
|
|
| 10,061 |
|
|
|
|
|
|
|
|
|
|
|
|
|
|
|
|
|
|
|
|
|
|
Income (loss) before income taxes |
| $ | 29,034 |
|
| $ | 18,737 |
|
| $ | 21,137 |
|
| $ | 71,628 |
|
| $ | 140,536 |
|
Income tax (expense) benefit |
|
|
|
|
|
|
|
|
|
|
|
|
|
| (45,207 | ) |
|
| (45,207 | ) |
Net income (loss) |
|
|
|
|
|
|
|
|
|
|
|
|
|
|
|
|
| $ | 95,329 |
|
|
|
|
|
|
|
|
|
|
|
|
|
|
|
|
|
|
|
|
|
|
Losses and LAE ratio |
|
| 61.8 | % |
|
| 47.3 | % |
|
| 62.9 | % |
|
|
|
|
|
| 58.3 | % |
Commission expense ratio |
|
| 9.9 | % |
|
| 18.2 | % |
|
| 17.8 | % |
|
|
|
|
|
| 13.4 | % |
Other operating expense ratio (2) |
|
| 22.5 | % |
|
| 26.8 | % |
|
| 8.1 | % |
|
|
|
|
|
| 20.9 | % |
Combined ratio |
|
| 94.2 | % |
|
| 92.3 | % |
|
| 88.8 | % |
|
|
|
|
|
| 92.6 | % |
(1) - Includes Corporate segment intercompany eliminations.
(2) - Includes Other operating expenses and Other underwriting income (expense ).
F-14
The following tables provide additional financial data by operating segment for the years ended December 31, 2016, 2015 and 2014:
|
| Year Ended December 31, 2016 |
| |||||||||||||
amounts in thousands |
| Gross written premiums |
|
| Ceded written premiums |
|
| Net written premiums |
|
| Net earned premiums |
| ||||
U.S. Insurance |
|
|
|
|
|
|
|
|
|
|
|
|
|
|
|
|
Marine |
| $ | 169,405 |
|
| $ | (70,858 | ) |
| $ | 98,547 |
|
| $ | 100,132 |
|
P&C |
|
| 631,562 |
|
|
| (135,888 | ) |
|
| 495,674 |
|
|
| 453,673 |
|
Professional Liability |
|
| 118,428 |
|
|
| (29,081 | ) |
|
| 89,347 |
|
|
| 75,503 |
|
Total |
| $ | 919,395 |
|
| $ | (235,827 | ) |
| $ | 683,568 |
|
| $ | 629,308 |
|
|
|
|
|
|
|
|
|
|
|
|
|
|
|
|
|
|
Int'l Insurance |
|
|
|
|
|
|
|
|
|
|
|
|
|
|
|
|
Marine |
| $ | 183,228 |
|
| $ | (40,092 | ) |
| $ | 143,136 |
|
| $ | 141,593 |
|
P&C |
|
| 181,094 |
|
|
| (69,606 | ) |
|
| 111,488 |
|
|
| 89,455 |
|
Professional Liability |
|
| 120,149 |
|
|
| (28,806 | ) |
|
| 91,343 |
|
|
| 76,368 |
|
Total |
| $ | 484,471 |
|
| $ | (138,504 | ) |
| $ | 345,967 |
|
| $ | 307,416 |
|
|
|
|
|
|
|
|
|
|
|
|
|
|
|
|
|
|
GlobalRe | $ | 165,045 |
|
| $ | (8,356 | ) |
| $ | 156,689 |
|
| $ | 163,621 |
| |
|
|
|
|
|
|
|
|
|
|
|
|
|
|
|
|
|
Total |
| $ | 1,568,911 |
|
| $ | (382,687 | ) |
| $ | 1,186,224 |
|
| $ | 1,100,345 |
|
|
| Year Ended December 31, 2015 |
| |||||||||||||
amounts in thousands |
| Gross written premiums |
|
| Ceded written premiums |
|
| Net written premiums |
|
| Net earned premiums |
| ||||
U.S. Insurance |
|
|
|
|
|
|
|
|
|
|
|
|
|
|
|
|
Marine |
| $ | 158,124 |
|
| $ | (61,916 | ) |
| $ | 96,208 |
|
| $ | 96,082 |
|
P&C |
|
| 596,673 |
|
|
| (152,168 | ) |
|
| 444,505 |
|
|
| 401,408 |
|
Professional Liability |
|
| 110,984 |
|
|
| (54,691 | ) |
|
| 56,293 |
|
|
| 58,346 |
|
Total |
| $ | 865,781 |
|
| $ | (268,775 | ) |
| $ | 597,006 |
|
| $ | 555,836 |
|
|
|
|
|
|
|
|
|
|
|
|
|
|
|
|
|
|
Int'l Insurance |
|
|
|
|
|
|
|
|
|
|
|
|
|
|
|
|
Marine |
| $ | 183,707 |
|
| $ | (36,515 | ) |
| $ | 147,192 |
|
| $ | 149,256 |
|
P&C |
|
| 130,729 |
|
|
| (67,722 | ) |
|
| 63,007 |
|
|
| 55,320 |
|
Professional Liability |
|
| 97,511 |
|
|
| (29,768 | ) |
|
| 67,743 |
|
|
| 55,384 |
|
Total |
| $ | 411,947 |
|
| $ | (134,005 | ) |
| $ | 277,942 |
|
| $ | 259,960 |
|
|
|
|
|
|
|
|
|
|
|
|
|
|
|
|
|
|
GlobalRe | $ | 175,774 |
|
| $ | (6,862 | ) |
| $ | 168,912 |
|
| $ | 168,291 |
| |
|
|
|
|
|
|
|
|
|
|
|
|
|
|
|
|
|
Total |
| $ | 1,453,502 |
|
| $ | (409,642 | ) |
| $ | 1,043,860 |
|
| $ | 984,087 |
|
F-15
|
| Year Ended December 31, 2014 |
| |||||||||||||
amounts in thousands |
| Gross written premiums |
|
| Ceded written premiums |
|
| Net written premiums |
|
| Net earned premiums |
| ||||
U.S. Insurance |
|
|
|
|
|
|
|
|
|
|
|
|
|
|
|
|
Marine |
| $ | 154,233 |
|
| $ | (46,685 | ) |
| $ | 107,548 |
|
| $ | 105,650 |
|
P&C |
|
| 543,045 |
|
|
| (169,953 | ) |
|
| 373,092 |
|
|
| 314,833 |
|
Professional Liability |
|
| 109,830 |
|
|
| (38,345 | ) |
|
| 71,485 |
|
|
| 83,806 |
|
Total |
| $ | 807,108 |
|
| $ | (254,983 | ) |
| $ | 552,125 |
|
| $ | 504,289 |
|
|
|
|
|
|
|
|
|
|
|
|
|
|
|
|
|
|
Int'l Insurance |
|
|
|
|
|
|
|
|
|
|
|
|
|
|
|
|
Marine |
| $ | 190,787 |
|
| $ | (47,805 | ) |
| $ | 142,982 |
|
| $ | 141,097 |
|
P&C |
|
| 158,139 |
|
|
| (98,087 | ) |
|
| 60,052 |
|
|
| 62,520 |
|
Professional Liability |
|
| 75,978 |
|
|
| (26,029 | ) |
|
| 49,949 |
|
|
| 39,868 |
|
Total |
| $ | 424,904 |
|
| $ | (171,921 | ) |
| $ | 252,983 |
|
| $ | 243,485 |
|
|
|
|
|
|
|
|
|
|
|
|
|
|
|
|
|
|
GlobalRe | $ | 200,341 |
|
| $ | (5,311 | ) |
| $ | 195,030 |
|
| $ | 188,121 |
| |
|
|
|
|
|
|
|
|
|
|
|
|
|
|
|
|
|
Total |
| $ | 1,432,353 |
|
| $ | (432,215 | ) |
| $ | 1,000,138 |
|
| $ | 935,895 |
|
The assets of the Company are reviewed in total by management for purposes of decision making.
NOTE 3. INVESTMENTS
The following tables set forth our Company's available- for- sale investments as of December 31, 2016 and 2015 and include OTTI securities recognized within AOCI:
|
| December 31, 2016 |
| |||||||||||||
|
|
|
|
|
| Gross |
|
| Gross |
|
|
|
|
| ||
|
|
|
|
|
| Unrealized |
|
| Unrealized |
|
| Amortized |
| |||
amounts in thousands |
| Fair Value |
|
| Gains |
|
| Losses |
|
| Cost |
| ||||
Fixed maturities: |
|
|
|
|
|
|
|
|
|
|
|
|
|
|
|
|
U.S. Treasury bonds, agency bonds and foreign government bonds |
| $ | 273,776 |
|
| $ | 2,192 |
|
| $ | (5,128 | ) |
| $ | 276,712 |
|
States, municipalities and political subdivisions |
|
| 547,415 |
|
|
| 11,542 |
|
|
| (4,036 | ) |
|
| 539,909 |
|
Mortgage-backed and asset-backed securities: |
|
|
|
|
|
|
|
|
|
|
|
|
|
|
|
|
Agency mortgage-backed securities |
|
| 487,364 |
|
|
| 4,016 |
|
|
| (6,585 | ) |
|
| 489,933 |
|
Residential mortgage obligations |
|
| 20,530 |
|
|
| 453 |
|
|
| (55 | ) |
|
| 20,132 |
|
Asset-backed securities |
|
| 314,601 |
|
|
| 824 |
|
|
| (1,178 | ) |
|
| 314,955 |
|
Commercial mortgage-backed securities |
|
| 154,139 |
|
|
| 2,859 |
|
|
| (1,904 | ) |
|
| 153,184 |
|
Subtotal |
| $ | 976,634 |
|
| $ | 8,152 |
|
| $ | (9,722 | ) |
| $ | 978,204 |
|
Corporate bonds |
|
| 838,057 |
|
|
| 10,185 |
|
|
| (5,528 | ) |
|
| 833,400 |
|
Total fixed maturities |
| $ | 2,635,882 |
|
| $ | 32,071 |
|
| $ | (24,414 | ) |
| $ | 2,628,225 |
|
Equity securities |
|
| 349,142 |
|
|
| 27,016 |
|
|
| (5,785 | ) |
|
| 327,911 |
|
Short-term investments |
|
| 143,539 |
|
|
| 88 |
|
|
| - |
|
|
| 143,451 |
|
Total investments |
| $ | 3,128,563 |
|
| $ | 59,175 |
|
| $ | (30,199 | ) |
| $ | 3,099,587 |
|
F-16
|
| December 31, 2015 |
| |||||||||||||
|
|
|
|
|
| Gross |
|
| Gross |
|
|
|
|
| ||
|
|
|
|
|
| Unrealized |
|
| Unrealized |
|
| Amortized |
| |||
amounts in thousands |
| Fair Value |
|
| Gains |
|
| Losses |
|
| Cost |
| ||||
Fixed maturities: |
|
|
|
|
|
|
|
|
|
|
|
|
|
|
|
|
U.S. Treasury bonds, agency bonds and foreign government bonds |
| $ | 252,882 |
|
| $ | 2,273 |
|
| $ | (9,214 | ) |
| $ | 259,823 |
|
States, municipalities and political subdivisions |
|
| 576,859 |
|
|
| 21,233 |
|
|
| (781 | ) |
|
| 556,407 |
|
Mortgage-backed and asset-backed securities: |
|
|
|
|
|
|
|
|
|
|
|
|
|
|
|
|
Agency mortgage-backed securities |
|
| 379,269 |
|
|
| 5,573 |
|
|
| (2,082 | ) |
|
| 375,778 |
|
Residential mortgage obligations |
|
| 30,465 |
|
|
| 694 |
|
|
| (82 | ) |
|
| 29,853 |
|
Asset-backed securities |
|
| 225,012 |
|
|
| 85 |
|
|
| (1,624 | ) |
|
| 226,551 |
|
Commercial mortgage-backed securities |
|
| 189,713 |
|
|
| 3,119 |
|
|
| (1,864 | ) |
|
| 188,458 |
|
Subtotal |
| $ | 824,459 |
|
| $ | 9,471 |
|
| $ | (5,652 | ) |
| $ | 820,640 |
|
Corporate bonds |
|
| 760,010 |
|
|
| 7,373 |
|
|
| (10,738 | ) |
|
| 763,375 |
|
Total fixed maturities |
| $ | 2,414,210 |
|
| $ | 40,350 |
|
| $ | (26,385 | ) |
| $ | 2,400,245 |
|
Equity securities |
|
| 305,271 |
|
|
| 26,341 |
|
|
| (3,013 | ) |
|
| 281,943 |
|
Short-term investments |
|
| 217,745 |
|
|
| 2 |
|
|
| - |
|
|
| 217,743 |
|
Total investments |
| $ | 2,937,226 |
|
| $ | 66,693 |
|
| $ | (29,398 | ) |
| $ | 2,899,931 |
|
During 2016 our Company made strategic investments in certain companies which are reported as Other invested assets on the Consolidated Balance Sheet and accounted for using the equity method. In applying the equity method, these investments are initially recorded at cost and are subsequently adjusted based on our Company's proportionate share of the net income or loss of the companies. Our initial purchase price of $2.0 million is reflected in our December 31, 2016 Consolidated Balance Sheet at $2.0 million.
As of December 31, 2016 and 2015, our Company did not have a concentration of greater than 5% of invested assets in a single non-U.S. government-backed issuer.
As of December 31, 2016 and 2015, fixed maturities for which non-credit OTTI was previously recognized and included in AOCI are now in a net unrealized net gains position of $0.4 million and $0.5 million, respectively.
The fair value of our Company's investment portfolio may fluctuate significantly in response to various factors such as changes in interest rates, investment quality ratings, equity prices, foreign exchange rates and credit spreads. Our Company does not have the intent to sell nor is it more likely than not that it will have to sell fixed maturities in unrealized loss positions that are not other-than-temporarily impaired before recovery. For structured securities, default probability and severity assumptions differ based on property type, vintage and the stress of the collateral. Our Company does not intend to sell, and it is more likely than not that our Company will not be required to sell, these securities before the recovery of the amortized cost basis. For Equity securities, our Company also considers our intent to hold securities as part of the process of evaluating whether a decline in fair value represents an other-than-temporary decline in value. Our Company may realize investment losses to the extent our liquidity needs require the disposition of fixed maturity securities in unfavorable interest rate, liquidity or credit spread environments. Significant changes in the factors our Company considers when evaluating investments for impairment losses could result in a significant change in impairment losses reported in the Consolidated Financial Statements.
The contractual maturity dates for Fixed maturities categorized by the number of years until maturity as of December 31, 2016 are shown in the following table:
|
| December 31, 2016 |
| |||||
|
|
|
|
|
| Amortized |
| |
amounts in thousands |
| Fair Value |
|
| Cost |
| ||
Due in one year or less |
| $ | 133,644 |
|
| $ | 134,931 |
|
Due after one year through five years |
|
| 778,875 |
|
|
| 778,511 |
|
Due after five years through ten years |
|
| 295,742 |
|
|
| 291,811 |
|
Due after ten years |
|
| 450,987 |
|
|
| 444,768 |
|
Mortgage-backed and asset-backed securities |
|
| 976,634 |
|
|
| 978,204 |
|
Total |
| $ | 2,635,882 |
|
| $ | 2,628,225 |
|
F-17
Expected maturities may differ from contractual maturities because issuers may have the right to call or prepay obligations with or without call or prepayment penalties. Prepayment assumptions associated with the mortgage-backed and asset-backed securities are reviewed on a periodic basis. When changes in prepayment assumptions are deemed necessary as the result of actual prepayments differing from anticipated prepayments, securities are revalued based upon the new prepayment assumptions utilizing the retro spective accounting method. Due to the periodic repayment of principal, the mortgage-backed and asset-backed securities are estimated to have an effective maturity of approximately 4.9 years.
The following tables summarize all securities in a gross unrealized loss position as of December 31, 2016 and 2015, showing the aggregate fair value and gross unrealized loss by the length of time those securities have continuously been in a gross unrealized loss position:
|
| December 31, 2016 |
| |||||||||||||||||||||
|
| Less than 12 months |
|
| Greater than 12 months |
|
| Total |
| |||||||||||||||
|
|
|
|
|
| Gross |
|
|
|
|
|
| Gross |
|
|
|
|
|
| Gross |
| |||
|
| Fair |
|
| Unrealized |
|
| Fair |
|
| Unrealized |
|
| Fair |
|
| Unrealized |
| ||||||
amounts in thousands |
| Value |
|
| (Losses) |
|
| Value |
|
| (Losses) |
|
| Value |
|
| (Losses) |
| ||||||
Fixed maturities: |
|
|
|
|
|
|
|
|
|
|
|
|
|
|
|
|
|
|
|
|
|
|
|
|
U.S. Treasury bonds, agency bonds and foreign government bonds |
| $ | 150,891 |
|
| $ | (2,570 | ) |
| $ | 16,819 |
|
| $ | (2,558 | ) |
| $ | 167,710 |
|
| $ | (5,128 | ) |
States, municipalities and political subdivisions |
|
| 137,731 |
|
|
| (3,111 | ) |
|
| 13,255 |
|
|
| (925 | ) |
|
| 150,986 |
|
|
| (4,036 | ) |
Mortgage-backed and asset-backed securities: |
|
|
|
|
|
|
|
|
|
|
|
|
|
|
|
|
|
|
|
|
|
|
|
|
Agency mortgage-backed securities |
|
| 349,119 |
|
|
| (6,155 | ) |
|
| 12,401 |
|
|
| (430 | ) |
|
| 361,520 |
|
|
| (6,585 | ) |
Residential mortgage obligations |
|
| 953 |
|
|
| (18 | ) |
|
| 926 |
|
|
| (37 | ) |
|
| 1,879 |
|
|
| (55 | ) |
Asset-backed securities |
|
| 95,514 |
|
|
| (970 | ) |
|
| 48,093 |
|
|
| (208 | ) |
|
| 143,607 |
|
|
| (1,178 | ) |
Commercial mortgage-backed securities |
|
| 51,932 |
|
|
| (1,164 | ) |
|
| 7,910 |
|
|
| (740 | ) |
|
| 59,842 |
|
|
| (1,904 | ) |
Subtotal |
| $ | 497,518 |
|
| $ | (8,307 | ) |
| $ | 69,330 |
|
| $ | (1,415 | ) |
| $ | 566,848 |
|
| $ | (9,722 | ) |
Corporate bonds |
|
| 325,733 |
|
|
| (5,086 | ) |
|
| 26,005 |
|
|
| (442 | ) |
|
| 351,738 |
|
|
| (5,528 | ) |
Total fixed maturities |
| $ | 1,111,873 |
|
| $ | (19,074 | ) |
| $ | 125,409 |
|
| $ | (5,340 | ) |
| $ | 1,237,282 |
|
| $ | (24,414 | ) |
Equity securities |
|
| 145,014 |
|
|
| (5,419 | ) |
|
| 1,994 |
|
|
| (366 | ) |
|
| 147,008 |
|
|
| (5,785 | ) |
Total fixed maturities and equity securities |
| $ | 1,256,887 |
|
| $ | (24,493 | ) |
| $ | 127,403 |
|
| $ | (5,706 | ) |
| $ | 1,384,290 |
|
| $ | (30,199 | ) |
|
| December 31, 2015 |
| |||||||||||||||||||||
|
| Less than 12 months |
|
| Greater than 12 months |
|
| Total |
| |||||||||||||||
|
|
|
|
|
| Gross |
|
|
|
|
|
| Gross |
|
|
|
|
|
| Gross |
| |||
|
| Fair |
|
| Unrealized |
|
| Fair |
|
| Unrealized |
|
| Fair |
|
| Unrealized |
| ||||||
amounts in thousands |
| Value |
|
| (Losses) |
|
| Value |
|
| (Losses) |
|
| Value |
|
| (Losses) |
| ||||||
Fixed maturities: |
|
|
|
|
|
|
|
|
|
|
|
|
|
|
|
|
|
|
|
|
|
|
|
|
U.S. Treasury bonds, agency bonds and foreign government bonds |
| $ | 142,233 |
|
| $ | (3,032 | ) |
| $ | 22,230 |
|
| $ | (6,182 | ) |
| $ | 164,463 |
|
| $ | (9,214 | ) |
States, municipalities and political subdivisions |
|
| 50,577 |
|
|
| (549 | ) |
|
| 4,808 |
|
|
| (232 | ) |
|
| 55,385 |
|
|
| (781 | ) |
Mortgage-backed and asset-backed securities: |
|
|
|
|
|
|
|
|
|
|
|
|
|
|
|
|
|
|
|
|
|
|
|
|
Agency mortgage-backed securities |
|
| 164,817 |
|
|
| (1,315 | ) |
|
| 29,862 |
|
|
| (767 | ) |
|
| 194,679 |
|
|
| (2,082 | ) |
Residential mortgage obligations |
|
| 3,910 |
|
|
| (5 | ) |
|
| 1,684 |
|
|
| (77 | ) |
|
| 5,594 |
|
|
| (82 | ) |
Asset-backed securities |
|
| 112,479 |
|
|
| (663 | ) |
|
| 81,477 |
|
|
| (961 | ) |
|
| 193,956 |
|
|
| (1,624 | ) |
Commercial mortgage-backed securities |
|
| 83,024 |
|
|
| (1,826 | ) |
|
| 3,065 |
|
|
| (38 | ) |
|
| 86,089 |
|
|
| (1,864 | ) |
Subtotal |
| $ | 364,230 |
|
| $ | (3,809 | ) |
| $ | 116,088 |
|
| $ | (1,843 | ) |
| $ | 480,318 |
|
| $ | (5,652 | ) |
Corporate bonds |
|
| 395,399 |
|
|
| (10,114 | ) |
|
| 13,849 |
|
|
| (624 | ) |
|
| 409,248 |
|
|
| (10,738 | ) |
Total fixed maturities |
| $ | 952,439 |
|
| $ | (17,504 | ) |
| $ | 156,975 |
|
| $ | (8,881 | ) |
| $ | 1,109,414 |
|
| $ | (26,385 | ) |
Equity securities |
|
| 58,531 |
|
|
| (3,013 | ) |
|
| - |
|
|
| - |
|
|
| 58,531 |
|
|
| (3,013 | ) |
Total fixed maturities and equity securities |
| $ | 1,010,970 |
|
| $ | (20,517 | ) |
| $ | 156,975 |
|
| $ | (8,881 | ) |
| $ | 1,167,945 |
|
| $ | (29,398 | ) |
Our Company analyzes impaired securities quarterly to determine if any impairments are other-than-temporary. The above securities with unrealized losses have been determined to be temporarily impaired based on our evaluation.
At December 31, 2016, there were 413 Fixed maturities and 75 Equity securities in an unrealized loss position. In the above table, the gross unrealized loss for the greater than 12 months category consists primarily of agency and foreign government bonds and is mostly
F-18
due to an unfavorable foreign exchange movement in our Canadian portfolio. To a lesser extent the gross unrealized loss for the greater than 12 months category is driven by unrealized losses on our longer dated municipal securities which were impacted by rising interest rates and credit spreads widening. The gross unrealized loss for the less than 12 months category consists primarily of agency mortgage backed securities, corporate bonds and preferred stocks, which are reported in equity securities, due to an increase in interest rates. At December 31, 2015, there were 368 fixed maturities and 57 equity se curities in an unrealized loss position. In the above table, the gross unrealized loss for the greater than 12 months category consists primarily of agency and foreign government bonds mostly due to an unfavorable foreign exchange movement in our Canadian portfolio. The gross unrealized loss for the less than 12 months category consists primarily of corporate bonds in the energy sector which have been impacted by recent declines in oil prices. To a lesser extent, losses on equity securities in the less th an 12 month category were impacted by volatility in the equity markets coupled with the timing of the purchases of certain equity securities.
As of December 31, 2016 and 2015, the largest unrealized loss by a non-government backed issuer in the investment portfolio was $1.0 million and $2.6 million, respectively.
Our Company's ability to hold securities is supported by sufficient cash flow from our operations and from maturities within our investment portfolio in order to meet our claims payments and other disbursement obligations arising from our underwriting operations without selling such investments. With respect to securities where the decline in value is determined to be temporary and the security's value is not written down, a subsequent decision may be made to sell that security and realize a loss. Subsequent decisions on security sales are made within the context of overall risk monitoring, changing information and market conditions.
Our Company had one credit related OTTI loss totaling $0.2 million during the year ended December 31, 2016 from our fixed maturities portfolio. Our Company had three credit related OTTI losses totaling $1.7 million during the year ended December 31, 2015 from our equity portfolio. Our Company did not have any credit related OTTI losses during the year ended December 31, 2014.
The following table summarizes the cumulative amounts related to our Company's credit loss portion of the OTTI losses on fixed maturities for the years ended December 31, 2016, 2015 and 2014.
|
| Years Ended December 31, |
| |||||||||
amounts in thousands |
| 2016 |
|
| 2015 |
|
| 2014 |
| |||
Beginning balance |
| $ | 2,361 |
|
| $ | 2,361 |
|
| $ | 5,154 |
|
Additions for credit loss impairments recognized in the current period on securities not previously impaired |
|
| 150 |
|
|
| - |
|
|
| - |
|
Additions for credit loss impairments recognized in the current period on securities previously impaired |
|
| - |
|
|
| - |
|
|
| - |
|
Reductions for credit loss impairments previously recognized on securities sold during the period |
|
| (150 | ) |
|
| - |
|
|
| (2,793 | ) |
Ending balance |
| $ | 2,361 |
|
| $ | 2,361 |
|
| $ | 2,361 |
|
Our Company's Net investment income was derived from the following sources:
|
| Years Ended December 31, |
| |||||||||
amounts in thousands |
| 2016 |
|
| 2015 |
|
| 2014 |
| |||
Fixed maturities |
| $ | 67,772 |
|
| $ | 61,572 |
|
| $ | 57,219 |
|
Equity securities |
|
| 14,271 |
|
|
| 9,813 |
|
|
| 9,036 |
|
Short-term investments |
|
| 727 |
|
|
| 683 |
|
|
| 911 |
|
Total investment income |
| $ | 82,770 |
|
| $ | 72,068 |
|
| $ | 67,166 |
|
Investment expenses |
|
| (3,319 | ) |
|
| (3,350 | ) |
|
| (2,998 | ) |
Net investment income |
| $ | 79,451 |
|
| $ | 68,718 |
|
| $ | 64,168 |
|
F-19
Realized gains and losses, excluding net OTTI losses recognized in earnings, for the periods indicated, were as follows:
|
| Years Ended December 31, |
| |||||||||
amounts in thousands |
| 2016 |
|
| 2015 |
|
| 2014 |
| |||
Fixed maturities: |
|
|
|
|
|
|
|
|
|
|
|
|
Gains |
| $ | 5,681 |
|
| $ | 4,756 |
|
| $ | 8,326 |
|
Losses |
|
| (4,271 | ) |
|
| (5,926 | ) |
|
| (2,610 | ) |
Fixed maturities, net |
| $ | 1,410 |
|
| $ | (1,170 | ) |
| $ | 5,716 |
|
Short-term: |
|
|
|
|
|
|
|
|
|
|
|
|
Gains |
| $ | 890 |
|
| $ | 130 |
|
| $ | - |
|
Losses |
|
| (1,552 | ) |
|
| (383 | ) |
|
| - |
|
Short-term, net |
| $ | (662 | ) |
| $ | (253 | ) |
| $ | - |
|
Equity securities: |
|
|
|
|
|
|
|
|
|
|
|
|
Gains |
| $ | 9,096 |
|
| $ | 14,331 |
|
| $ | 9,447 |
|
Losses |
|
| (658 | ) |
|
| (4,535 | ) |
|
| (2,351 | ) |
Equity securities, net |
| $ | 8,438 |
|
| $ | 9,796 |
|
| $ | 7,096 |
|
Net realized gains (losses) |
| $ | 9,186 |
|
| $ | 8,373 |
|
| $ | 12,812 |
|
NOTE 4. FAIR VALUE MEASUREMENT
Fair value measurements are received from independent pricing service vendors, utilized by our outside investment manager whom we employ to assist us with investment accounting services. This manager utilizes a pricing committee, which oversees the use of one or more independent pricing service vendors. The pricing committee consists of five or more members of the investment management firm, one from senior management and one from the accounting group, with the remainder representing asset class specialists and client strategists. The pricing source for each security is determined in accordance with the pricing source procedures approved by the pricing committee. The investment manager receives supporting documentation from the independent pricing service vendor detailing the inputs, models and processes used in the vendors' evaluation process to determine the appropriate fair value hierarchy. It is ultimately our responsibility to determine whether the values obtained from these service providers are representative of fair value.
To validate the techniques or models used by pricing sources, our review process includes, but is not limited to:
| (i) | A review of the validity of the fair market valuation of individual securities deemed as outliers (i.e., vendor price differed significantly from other vendor prices), securities with significant price movements from previous months, securities with stale prices and securities with negative yields. |
| (ii) | A comparison of the count of securities priced by certain vendors for significant movements in vendor CUSIP counts. |
| (iii) | A review of the results of back-testing, including the comparison of executed prices to the historical fair value estimates from the pricing service and documentation to support trades above certain variance thresholds. |
| (iv) | A review of the Statement on Standards for Attestation Engagements ("SSAE") No.16 report of our outside investment managers for any exceptions. |
| (v) | Management also periodically independently prices the portfolio using alternative pricing vendors and investigates variances outside of the established thresholds. |
The fair value of our financial instruments is determined based on the following fair value hierarchy:
Level 1 – Quoted prices for identical instruments in active markets. Examples are listed equity and fixed income securities traded on an exchange. U.S. Treasury securities are reported as Level 1 and are valued based on unadjusted quoted prices for identical assets in active markets that our Company can access.
Level 2 – Quoted prices for similar instruments in active markets; quoted prices for identical or similar instruments in markets that are not active; and model-derived valuations in which all significant inputs and significant value drivers are observable in active markets. Examples are asset-backed and mortgage-backed securities that are similar to other asset-backed or mortgage-backed securities observed in the market. U.S. government agency securities are reported as Level 2 and are valued using yields and spreads that are observable in active markets.
Level 3 – Valuations derived from valuation techniques in which one or more significant inputs or significant value drivers are unobservable. An example would be a private placement with minimal liquidity.
F-20
The following tables present, for each of the fair value hierarchy levels as defined by the accounting guidance for fair value measurements and descr ibed below, our Company's fixed maturities and equity securities by asset class that are measured at fair value on a recurring basis, as well as the fair value of the 5.75% Senior notes due October 15, 2023 (the "5.75% Senior notes") carried at amortized c ost as of December 31, 2016 and 2015:
|
| December 31, 2016 |
| |||||||||||||
amounts in thousands |
| Level 1 |
|
| Level 2 |
|
| Level 3 |
|
| Total |
| ||||
Fixed maturities: |
|
|
|
|
|
|
|
|
|
|
|
|
|
|
|
|
U.S. Treasury bonds, agency bonds and foreign government bonds |
| $ | 47,704 |
|
| $ | 226,072 |
|
| $ | - |
|
| $ | 273,776 |
|
States, municipalities and political subdivisions |
|
| - |
|
|
| 547,415 |
|
|
| - |
|
|
| 547,415 |
|
Mortgage-backed and asset-backed securities: |
|
|
|
|
|
|
|
|
|
|
|
|
|
|
|
|
Agency mortgage-backed securities |
|
| - |
|
|
| 487,364 |
|
|
| - |
|
|
| 487,364 |
|
Residential mortgage obligations |
|
| - |
|
|
| 20,530 |
|
|
| - |
|
|
| 20,530 |
|
Asset-backed securities |
|
| - |
|
|
| 314,601 |
|
|
| - |
|
|
| 314,601 |
|
Commercial mortgage-backed securities |
|
| - |
|
|
| 154,139 |
|
|
| - |
|
|
| 154,139 |
|
Subtotal |
| $ | - |
|
| $ | 976,634 |
|
| $ | - |
|
| $ | 976,634 |
|
Corporate bonds |
|
| - |
|
|
| 838,057 |
|
|
| - |
|
|
| 838,057 |
|
Total fixed maturities |
| $ | 47,704 |
|
| $ | 2,588,178 |
|
| $ | - |
|
| $ | 2,635,882 |
|
Equity securities |
|
| 164,088 |
|
|
| 185,054 |
|
|
| - |
|
|
| 349,142 |
|
Short-term investments |
|
| 143,539 |
|
|
| - |
|
|
| - |
|
|
| 143,539 |
|
Total assets measured at fair value |
| $ | 355,331 |
|
| $ | 2,773,232 |
|
| $ | - |
|
| $ | 3,128,563 |
|
Senior notes |
| $ | - |
|
| $ | 280,316 |
|
| $ | - |
|
| $ | 280,316 |
|
Total liabilities measured at fair value |
| $ | - |
|
| $ | 280,316 |
|
| $ | - |
|
| $ | 280,316 |
|
|
|
|
|
|
|
|
|
|
|
|
|
|
|
|
|
|
|
|
|
|
|
|
|
|
|
|
|
|
|
|
|
|
|
|
| December 31, 2015 |
| |||||||||||||
amounts in thousands |
| Level 1 |
|
| Level 2 |
|
| Level 3 |
|
| Total |
| ||||
Fixed maturities: |
|
|
|
|
|
|
|
|
|
|
|
|
|
|
|
|
U.S. Treasury bonds, agency bonds and foreign government bonds |
| $ | 67,394 |
|
| $ | 185,488 |
|
| $ | - |
|
| $ | 252,882 |
|
States, municipalities and political subdivisions |
|
| - |
|
|
| 576,859 |
|
|
| - |
|
|
| 576,859 |
|
Mortgage-backed and asset-backed securities: |
|
|
|
|
|
|
|
|
|
|
|
|
|
|
|
|
Agency mortgage-backed securities |
|
| - |
|
|
| 379,269 |
|
|
| - |
|
|
| 379,269 |
|
Residential mortgage obligations |
|
| - |
|
|
| 30,465 |
|
|
| - |
|
|
| 30,465 |
|
Asset-backed securities |
|
| - |
|
|
| 225,012 |
|
|
| - |
|
|
| 225,012 |
|
Commercial mortgage-backed securities |
|
| - |
|
|
| 189,713 |
|
|
| - |
|
|
| 189,713 |
|
Subtotal |
| $ | - |
|
| $ | 824,459 |
|
| $ | - |
|
| $ | 824,459 |
|
Corporate bonds |
|
| - |
|
|
| 760,010 |
|
|
| - |
|
|
| 760,010 |
|
Total fixed maturities |
| $ | 67,394 |
|
| $ | 2,346,816 |
|
| $ | - |
|
| $ | 2,414,210 |
|
Equity securities |
|
| 126,455 |
|
|
| 178,816 |
|
|
| - |
|
|
| 305,271 |
|
Short-term investments |
|
| 217,745 |
|
|
| - |
|
|
| - |
|
|
| 217,745 |
|
Total assets measured at fair value |
| $ | 411,594 |
|
| $ | 2,525,632 |
|
| $ | - |
|
| $ | 2,937,226 |
|
Senior notes |
| $ | - |
|
| $ | 282,486 |
|
| $ | - |
|
| $ | 282,486 |
|
Total liabilities measured at fair value |
| $ | - |
|
| $ | 282,486 |
|
| $ | - |
|
| $ | 282,486 |
|
|
|
|
|
|
|
|
|
|
|
|
|
|
|
|
|
|
All other financial assets and liabilities including cash, premium receivables, reinsurance recoverables and reinsurance balance payables are carried at cost, which approximates fair value.
Our Company did not have any significant transfers between the Level 1 and Level 2 classifications for the years ended December 31, 2016 and 2015.
F-21
As of December 31, 2016 and 2015, our Company did not have any Level 3 assets.
NOTE 5. RESERVES FOR LOSSES AND LAE
We establish reserves for the estimated unpaid ultimate liability for losses and LAE under the terms of our policies and agreements. The determination of reserves for losses and LAE is partially dependent upon the receipt of information from agents and brokers. Reserves include estimates for both claims that have been reported and for IBNR, and include estimates of expenses associated with processing and settling these claims. Reserves are recorded in Reserves for losses and LAE in the Consolidated Balance Sheets. Our estimates and judgments may be revised as additional experience and other data become available and are reviewed, as new or improved methodologies are developed, or as laws change. Frequency/severity analyses are also performed for certain books of business. To the extent that reserves are found deficient or redundant, a strengthening or release is recognized as a charge or credit to earnings.
The following table summarizes activity for our Company's Reserves for losses and LAE for the years ended December 31, 2016, 2015 and 2014:
|
| Years Ended December 31, |
| |||||||||
amounts in thousands |
| 2016 |
|
| 2015 |
|
| 2014 |
| |||
Net reserves for losses and LAE at beginning of year |
| $ | 1,393,126 |
|
| $ | 1,308,136 |
|
| $ | 1,222,633 |
|
Provision for losses and LAE for claims occurring in the current year |
|
| 693,976 |
|
|
| 637,267 |
|
|
| 601,041 |
|
Increase (decrease) in estimated losses and LAE for claims occurring in prior years |
|
| (28,528 | ) |
|
| (64,669 | ) |
|
| (55,812 | ) |
Incurred losses and LAE |
| $ | 665,448 |
|
| $ | 572,598 |
|
| $ | 545,229 |
|
Losses and LAE paid for claims occurring during: |
|
|
|
|
|
|
|
|
|
|
|
|
Current year |
|
| (119,485 | ) |
|
| (159,802 | ) |
|
| (158,806 | ) |
Prior years |
|
| (412,544 | ) |
|
| (320,863 | ) |
|
| (295,527 | ) |
Losses and LAE payments |
| $ | (532,029 | ) |
| $ | (480,665 | ) |
| $ | (454,333 | ) |
Foreign Currency Adjustment |
|
| (16,094 | ) |
|
| (6,943 | ) |
|
| (5,393 | ) |
Net reserves for losses and LAE at end of year |
|
| 1,510,451 |
|
|
| 1,393,126 |
|
|
| 1,308,136 |
|
Reinsurance recoverables on unpaid losses and LAE |
|
| 779,276 |
|
|
| 809,518 |
|
|
| 851,498 |
|
Gross reserves for losses and LAE at end of year |
| $ | 2,289,727 |
|
| $ | 2,202,644 |
|
| $ | 2,159,634 |
|
The reporting and operating segments breakdowns of prior period net reserve strengthening (releases) for the years ended December 31, 2016, 2015 and 2014 are as follows:
|
| Years Ended December 31, |
| |||||||||
amounts in thousands |
| 2016 |
|
| 2015 |
|
| 2014 |
| |||
U.S. Insurance |
|
|
|
|
|
|
|
|
|
|
|
|
Marine |
| $ | (10,122 | ) |
| $ | (24,825 | ) |
| $ | (29,047 | ) |
P&C |
|
| 2,790 |
|
|
| (706 | ) |
|
| 17,081 |
|
Professional Liability |
|
| 5,984 |
|
|
| (3,788 | ) |
|
| (3,454 | ) |
Total |
| $ | (1,348 | ) |
| $ | (29,319 | ) |
| $ | (15,420 | ) |
|
|
|
|
|
|
|
|
|
|
|
|
|
Int'l Insurance |
|
|
|
|
|
|
|
|
|
|
|
|
Marine |
|
| (22,068 | ) |
|
| (21,914 | ) |
|
| (31,677 | ) |
P&C |
|
| (7,051 | ) |
|
| (8,458 | ) |
|
| (3,829 | ) |
Professional Liability |
|
| 4,100 |
|
|
| 4,156 |
|
|
| (2,746 | ) |
Total |
| $ | (25,019 | ) |
| $ | (26,216 | ) |
| $ | (38,252 | ) |
|
|
|
|
|
|
|
|
|
|
|
|
|
GlobalRe | $ | (2,161 | ) |
| $ | (9,134 | ) |
| $ | (2,140 | ) | |
|
|
|
|
|
|
|
|
|
|
|
|
|
Total strengthening (releases) |
| $ | (28,528 | ) |
| $ | (64,669 | ) |
| $ | (55,812 | ) |
F-22
The following is a discussion of the relevant factors related to the prior period net reserve releases of $28.5 million recorded for the year ended December 31, 2016:
U.S. Insurance reporting segment recorded prior period net reserve releases of $1.3 million. The drivers are as follows:
| • | Marine operating segment recorded prior period net reserve releases of $10.1 million driven by favorable claims development in the Craft, Marine Liability, Customs Bonds and Inland Marine products. |
| • | P&C operating segment recorded prior period net reserve strengthening of $2.8 million driven by large loss activity within our Primary Casualty division, partially offset by ongoing favorable performance within our Excess Casualty, Environmental and Other P&C divisions. |
| • | Professional Liability operating segment recorded prior period net reserve strengthening of $6.0 million driven by unfavorable development on a few large D&O claims. |
Int'l Insurance reporting segment recorded prior period net reserve releases of $25.0 million. The drivers are as follows:
| • | Marine operating segment recorded prior period net reserve releases of $22.1 million due to favorable claims development predominately from our Marine Liability product. |
| • | P&C operating segment recorded prior period net reserve releases of $7.1 million primarily due to favorable claims development in our Energy & Engineering division, partially offset by large loss activity within our Property division. |
| • | Professional Liability operating segment recorded prior period net reserve strengthening of $4.1 million primarily due to a decline in expected recoveries from a large reinsurer resulting in an increase in bad debt reserve within our D&O division. |
GlobalRe reporting segment recorded prior period net reserve releases of $2.2 million primarily driven by favorable loss development in our A&H, P&C and Professional Liability products, partially offset by large loss activity in our Marine product.
The following is a discussion of the relevant factors related to the prior period net reserve releases of $64.7 million recorded for the year ended December 31, 2015:
U.S. Insurance reporting segment recorded prior period net reserve releases of $29.3 million. The drivers are as follows:
| • | Marine operating segment recorded prior period net reserve releases of $24.8 million driven by favorable claims development in the Marine Liability, Inland Marine and Cargo products. |
| • | P&C operating segment recorded prior period net reserve releases of $0.7 million driven by ongoing favorable performance within our Excess Casualty, Environmental and Other P&C divisions, mostly offset by large loss activity within our Primary Casualty division. |
| • | Professional Liability operating segment recorded prior period net reserve releases of $3.8 million driven by favorable emergence in our E&O division, partially offset by unfavorable development in several large D&O claims |
Int'l Insurance reporting segment recorded prior period net reserve releases of $26.2 million. The drivers are as follows:
| • | Marine operating segment recorded prior period net reserve releases of $21.9 million driven primarily due to favorable claims development on the Marine Liability, Protection and Indemnity and Specie products. |
| • | P&C operating segment recorded prior period net reserve releases of $8.5 million due to favorable claims development on the Offshore Energy product within the Energy & Engineering division. |
| • | Professional Liability operating segment recorded prior period net reserve strengthening of $4.2 million driven by adverse development in our D&O division related to two large losses, partially offset by favorable claims development on our E&O division. |
GlobalRe reporting segment recorded prior period net reserve releases of $9.1 million primarily driven by favorable loss development in our Marine, P&C and A&H products.
F-23
The following is a discussion of relevant factors related to the prior period net reserve releases of $55.8 million recorded for the year ended December 31, 2014:
U.S. Insurance reporting segment recorded prior period net reserve releases of $15.4 million. The drivers of these prior period net reserve releases by operating segment are as follows.
| • | Marine operating segment recorded prior period net reserve releases of $29.0 million driven by favorable claims development on our Marine Liability, Craft, Fishing Vessels, Inland Marine, Hull and Cargo products. |
| • | P&C operating segment recorded prior period net reserve strengthening of $17.1 million driven by unfavorable activity on pre-2010 California construction defect liability claims in our Primary Casualty division, partially offset by reserve releases due to favorable loss emergence from our Excess Casualty division. |
| • | Professional Liability operating segment recorded prior period net reserve releases of $3.5 million driven primarily by favorable loss emergence from our D&O division due to a cash settlement of a contract dispute with a former third party administrator. |
Int'l Insurance reporting segment recorded prior period net reserve releases of $38.3 million. The drivers are as follows:
| • | Marine operating segment recorded prior period net reserve releases of $31.7 million driven by favorable loss emergence across various products. |
| • | P&C operating segment recorded prior period net reserve releases of $3.8 million driven primarily by favorable claims development in our Energy & Engineering division. |
| • | Professional Liability operating segment recorded prior period net reserve releases of $2.7 million due to favorable loss emergence in our E&O and D&O divisions. |
GlobalRe reporting segment recorded prior period net reserve releases of $2.1 million driven by favorable claim development in our Marine product.
Supplemental tables related to Short Duration Contracts
Effectively all property and casualty insurance contracts are described as "Short Duration Contracts" as opposed to life insurance, by the Securities and Exchange Commission. Our Company only issues short duration contracts. Below are two tables with reserve data for each reporting and operating segment. These tables are presented net of reinsurance. The first table reflects incurred claims development as of December 31, 2016, as well as the cumulative claims frequency and the total of Incurred But Not Reported ("IBNR") liabilities and expected development on reported claims included within the net incurred claims amounts. The second table reflects the cumulative paid claims development as of December 31, 2016. The conversion of all non USD currencies amounts, for all Accident Years ("AY"), is in USD as of December 31, 2016.
Records for Syndicate 1221 are not available by AY for reporting periods prior to 2012 since data was compiled only on a year-of- account basis prior to 2012, and as such the tables below for our Int'l Insurance reporting segment begin with the 2012 reporting year. Our GlobalRe Segment reserve tables do not have data prior to 2010, as we began writing assumed reinsurance in that year.
Claims frequency is based on claims posted in our Company's data system as reported. Generally, for most direct insurance and excess-of-loss assumed reinsurance, one claim count is posted for each claim. For assumed bordereau business and business written on binders, one claim count is posted for each bordereau received, which could account for multiple claims. Additionally, if the insured is covered for multiple years, a claim may be initially established in all potentially impacted policy years until the appropriate policy year is determined.
The information about incurred claims development and cumulative paid claims and Allocated Loss Adjustment Expense ("ALAE"), net of reinsurance, for the years ended December 31, 2007 through 2015, is presented as unaudited supplementary information.
Note that asbestos reserves are included in the U.S. Marine operating segment in years prior to 2007.
IBNR values shown in the following tables are the difference between the case reserves for reported losses and the estimated future payments for claims arising from the specific accident period. Our Company has always applied prudent claim reserving practices. For a number of segments, this has resulted in case reserves for more mature accident years exceeding the future payments consistently. IBNR estimates will be negative where our history indicates such favorable future emergence is the best estimate.
F-24
| U.S. Marine |
|
|
|
|
|
|
|
| ||||||||||||||||||||||||||||
| Loss and ALAE, Net of Reinsurance |
|
|
|
|
|
|
|
| ||||||||||||||||||||||||||||
amounts in thousands | For the Years Ended December 31, |
|
| As of December 31, 2016 |
| ||||||||||||||||||||||||||||||||
AY | 2007 |
| 2008 |
| 2009 |
| 2010 |
| 2011 |
| 2012 |
| 2013 |
| 2014 |
| 2015 |
| 2016 |
|
| Total IBNR |
| # of Reported Claims |
| ||||||||||||
2007 | $ | 52,974 |
| $ | 60,645 |
| $ | 61,216 |
| $ | 59,148 |
| $ | 65,020 |
| $ | 66,090 |
| $ | 66,024 |
| $ | 65,909 |
| $ | 66,297 |
| $ | 66,846 |
|
| $ | 60 |
|
| 2,737 |
|
2008 |
|
|
|
| 56,923 |
|
| 67,710 |
|
| 72,580 |
|
| 73,970 |
|
| 73,731 |
|
| 68,703 |
|
| 68,873 |
|
| 67,024 |
|
| 67,238 |
|
|
| 348 |
|
| 3,202 |
|
2009 |
|
|
|
|
|
|
| 63,769 |
|
| 60,813 |
|
| 57,266 |
|
| 51,804 |
|
| 49,762 |
|
| 50,905 |
|
| 53,091 |
|
| 52,169 |
|
|
| (186 | ) |
| 2,404 |
|
2010 |
|
|
|
|
|
|
|
|
|
| 66,336 |
|
| 66,187 |
|
| 63,172 |
|
| 57,063 |
|
| 54,815 |
|
| 59,143 |
|
| 58,557 |
|
|
| (263 | ) |
| 2,164 |
|
2011 |
|
|
|
|
|
|
|
|
|
|
|
|
| 71,575 |
|
| 72,232 |
|
| 70,019 |
|
| 65,514 |
|
| 64,196 |
|
| 62,571 |
|
|
| 1,204 |
|
| 2,012 |
|
2012 |
|
|
|
|
|
|
|
|
|
|
|
|
|
|
|
| 87,905 |
|
| 91,118 |
|
| 73,940 |
|
| 70,421 |
|
| 71,868 |
|
|
| (7 | ) |
| 1,968 |
|
2013 |
|
|
|
|
|
|
|
|
|
|
|
|
|
|
|
|
|
|
| 65,132 |
|
| 61,289 |
|
| 55,494 |
|
| 58,148 |
|
|
| (619 | ) |
| 1,910 |
|
2014 |
|
|
|
|
|
|
|
|
|
|
|
|
|
|
|
|
|
|
|
|
|
| 67,610 |
|
| 49,889 |
|
| 48,355 |
|
|
| 1,509 |
|
| 1,962 |
|
2015 |
|
|
|
|
|
|
|
|
|
|
|
|
|
|
|
|
|
|
|
|
|
|
|
|
| 64,575 |
|
| 54,121 |
|
|
| 13,317 |
|
| 2,155 |
|
2016 |
|
|
|
|
|
|
|
|
|
|
|
|
|
|
|
|
|
|
|
|
|
|
|
|
|
|
|
| 56,209 |
|
|
| 32,884 |
|
| 1,824 |
|
|
|
|
|
|
|
|
|
|
|
|
|
|
|
|
|
|
|
|
|
|
|
|
|
| Total |
| $ | 596,082 |
|
|
|
|
|
|
|
| |
|
|
|
|
|
|
|
|
|
|
|
|
|
|
|
|
|
|
|
|
|
|
|
|
|
|
|
|
|
|
|
|
|
|
|
|
|
|
|
|
|
|
|
|
|
|
|
|
|
|
|
|
|
|
|
|
|
|
|
|
|
|
|
|
|
|
|
|
|
|
|
|
|
|
|
|
| U.S. Marine |
|
|
|
|
|
|
|
| ||||||||||||||||||||||||||||
| Cumulative Paid Claims and Allocated Claim Adjustment Expenses, Net of Reinsurance |
|
|
|
|
|
|
|
| ||||||||||||||||||||||||||||
amounts in thousands | For the Years Ended December 31, |
|
|
|
|
|
|
|
| ||||||||||||||||||||||||||||
AY | 2007 |
| 2008 |
| 2009 |
| 2010 |
| 2011 |
| 2012 |
| 2013 |
| 2014 |
| 2015 |
| 2016 |
|
|
|
|
|
|
|
| ||||||||||
2007 | $ | 9,294 |
| $ | 28,937 |
| $ | 40,256 |
| $ | 49,214 |
| $ | 58,772 |
| $ | 62,002 |
| $ | 62,767 |
| $ | 63,384 |
| $ | 64,450 |
| $ | 64,570 |
|
|
|
|
|
|
|
|
2008 |
|
|
|
| 7,554 |
|
| 36,499 |
|
| 54,408 |
|
| 56,695 |
|
| 62,633 |
|
| 62,989 |
|
| 63,316 |
|
| 63,429 |
|
| 64,317 |
|
|
|
|
|
|
|
|
2009 |
|
|
|
|
|
|
| 12,975 |
|
| 30,012 |
|
| 36,593 |
|
| 42,846 |
|
| 44,760 |
|
| 47,347 |
|
| 48,209 |
|
| 50,888 |
|
|
|
|
|
|
|
|
2010 |
|
|
|
|
|
|
|
|
|
| 17,211 |
|
| 33,821 |
|
| 41,941 |
|
| 45,032 |
|
| 50,271 |
|
| 54,044 |
|
| 57,254 |
|
|
|
|
|
|
|
|
2011 |
|
|
|
|
|
|
|
|
|
|
|
|
| 16,007 |
|
| 41,322 |
|
| 50,841 |
|
| 54,471 |
|
| 59,224 |
|
| 60,198 |
|
|
|
|
|
|
|
|
2012 |
|
|
|
|
|
|
|
|
|
|
|
|
|
|
|
| 27,546 |
|
| 47,639 |
|
| 56,040 |
|
| 62,104 |
|
| 68,556 |
|
|
|
|
|
|
|
|
2013 |
|
|
|
|
|
|
|
|
|
|
|
|
|
|
|
|
|
|
| 19,565 |
|
| 38,487 |
|
| 44,606 |
|
| 50,410 |
|
|
|
|
|
|
|
|
2014 |
|
|
|
|
|
|
|
|
|
|
|
|
|
|
|
|
|
|
|
|
|
| 15,702 |
|
| 29,916 |
|
| 41,609 |
|
|
|
|
|
|
|
|
2015 |
|
|
|
|
|
|
|
|
|
|
|
|
|
|
|
|
|
|
|
|
|
|
|
|
| 17,169 |
|
| 32,439 |
|
|
|
|
|
|
|
|
2016 |
|
|
|
|
|
|
|
|
|
|
|
|
|
|
|
|
|
|
|
|
|
|
|
|
|
|
|
| 12,665 |
|
|
|
|
|
|
|
|
|
|
|
|
|
|
|
|
|
|
|
|
|
|
|
|
|
|
|
|
|
|
|
|
| Total |
| $ | 502,906 |
|
|
|
|
|
|
|
| |
|
|
|
|
|
|
|
|
|
|
|
|
|
|
|
|
|
|
|
|
|
|
|
|
| Net reserves < 2007 |
|
| 13,112 |
|
|
|
|
|
|
|
| |
|
|
|
|
|
|
|
|
|
|
|
|
|
|
|
|
|
|
|
|
|
|
|
|
| Total Net reserves |
| $ | 106,288 |
|
|
|
|
|
|
|
| |
| U.S. Marine |
|
|
| ||||||||||||||||||||||||||||
| Average Annual Percentage Payout of Incurred Claims by Age, Net of Reinsurance |
|
|
| ||||||||||||||||||||||||||||
Years | 1 |
| 2 |
| 3 |
| 4 |
| 5 |
| 6 |
| 7 |
| 8 |
| 9 |
| 10 |
|
|
| ||||||||||
U.S. Marine |
| 26.4 | % |
| 32.4 | % |
| 16.5 | % |
| 8.3 | % |
| 8.7 | % |
| 3.7 | % |
| 2.2 | % |
| 2.1 | % |
| 1.5 | % |
| 0.2 | % |
|
|
F-25
| U.S. P&C |
|
|
|
| ||||||||||||||||||||||||||||||||
| Loss and ALAE, Net of Reinsurance |
|
|
|
|
|
|
|
| ||||||||||||||||||||||||||||
amounts in thousands | For the Years Ended December 31, |
|
| As of December 31, 2016 |
| ||||||||||||||||||||||||||||||||
AY | 2007 |
| 2008 |
| 2009 |
| 2010 |
| 2011 |
| 2012 |
| 2013 |
| 2014 |
| 2015 |
| 2016 |
|
| Total IBNR |
| # of Reported Claims |
| ||||||||||||
2007 | $ | 139,377 |
| $ | 139,570 |
| $ | 140,551 |
| $ | 130,501 |
| $ | 133,050 |
| $ | 128,087 |
| $ | 134,310 |
| $ | 139,870 |
| $ | 145,472 |
| $ | 148,609 |
|
| $ | 3,753 |
|
| 11,703 |
|
2008 |
|
|
|
| 158,337 |
|
| 158,336 |
|
| 144,164 |
|
| 140,818 |
|
| 141,332 |
|
| 143,219 |
|
| 147,434 |
|
| 152,416 |
|
| 157,519 |
|
|
| 3,971 |
|
| 10,818 |
|
2009 |
|
|
|
|
|
|
| 133,394 |
|
| 135,984 |
|
| 136,700 |
|
| 142,416 |
|
| 149,975 |
|
| 155,156 |
|
| 155,682 |
|
| 159,110 |
|
|
| 7,717 |
|
| 8,434 |
|
2010 |
|
|
|
|
|
|
|
|
|
| 101,527 |
|
| 100,529 |
|
| 98,675 |
|
| 104,709 |
|
| 107,602 |
|
| 109,323 |
|
| 112,080 |
|
|
| 10,106 |
|
| 7,804 |
|
2011 |
|
|
|
|
|
|
|
|
|
|
|
|
| 86,056 |
|
| 85,238 |
|
| 92,266 |
|
| 95,292 |
|
| 95,958 |
|
| 105,149 |
|
|
| 15,964 |
|
| 6,346 |
|
2012 |
|
|
|
|
|
|
|
|
|
|
|
|
|
|
|
| 111,479 |
|
| 96,618 |
|
| 98,060 |
|
| 103,716 |
|
| 111,746 |
|
|
| 24,895 |
|
| 4,481 |
|
2013 |
|
|
|
|
|
|
|
|
|
|
|
|
|
|
|
|
|
|
| 141,728 |
|
| 130,314 |
|
| 133,068 |
|
| 141,817 |
|
|
| 29,961 |
|
| 3,533 |
|
2014 |
|
|
|
|
|
|
|
|
|
|
|
|
|
|
|
|
|
|
|
|
|
| 193,897 |
|
| 164,364 |
|
| 152,447 |
|
|
| 76,085 |
|
| 3,356 |
|
2015 |
|
|
|
|
|
|
|
|
|
|
|
|
|
|
|
|
|
|
|
|
|
|
|
|
| 251,752 |
|
| 224,532 |
|
|
| 134,029 |
|
| 3,123 |
|
2016 |
|
|
|
|
|
|
|
|
|
|
|
|
|
|
|
|
|
|
|
|
|
|
|
|
|
|
|
| 274,692 |
|
|
| 258,449 |
|
| 2,106 |
|
|
|
|
|
|
|
|
|
|
|
|
|
|
|
|
|
|
|
|
|
|
|
|
|
| Total |
| $ | 1,587,701 |
|
|
|
|
|
|
|
| |
|
|
|
|
|
|
|
|
|
|
|
|
|
|
|
|
|
|
|
|
|
|
|
|
|
|
|
|
|
|
|
|
|
|
|
|
|
|
|
|
|
|
|
|
|
|
|
|
|
|
|
|
|
|
|
|
|
|
|
|
|
|
|
|
|
|
|
|
|
|
|
|
|
|
|
|
| U.S. P&C |
|
|
|
|
|
|
|
| ||||||||||||||||||||||||||||
| Cumulative Paid Claims and Allocated Claim Adjustment Expenses, Net of Reinsurance |
|
|
|
|
|
|
|
| ||||||||||||||||||||||||||||
amounts in thousands | For the Years Ended December 31, |
|
|
|
|
|
|
|
| ||||||||||||||||||||||||||||
AY | 2007 |
| 2008 |
| 2009 |
| 2010 |
| 2011 |
| 2012 |
| 2013 |
| 2014 |
| 2015 |
| 2016 |
|
|
|
|
|
|
|
| ||||||||||
2007 | $ | 7,127 |
| $ | 24,521 |
| $ | 49,616 |
| $ | 72,462 |
| $ | 92,840 |
| $ | 104,841 |
| $ | 114,160 |
| $ | 122,568 |
| $ | 130,279 |
| $ | 136,896 |
|
|
|
|
|
|
|
|
2008 |
|
|
|
| 12,178 |
|
| 36,713 |
|
| 58,491 |
|
| 82,028 |
|
| 103,804 |
|
| 115,526 |
|
| 123,945 |
|
| 133,064 |
|
| 146,463 |
|
|
|
|
|
|
|
|
2009 |
|
|
|
|
|
|
| 14,619 |
|
| 36,641 |
|
| 59,933 |
|
| 92,033 |
|
| 119,360 |
|
| 132,695 |
|
| 138,227 |
|
| 145,407 |
|
|
|
|
|
|
|
|
2010 |
|
|
|
|
|
|
|
|
|
| 12,682 |
|
| 27,542 |
|
| 49,109 |
|
| 69,027 |
|
| 81,262 |
|
| 89,873 |
|
| 94,766 |
|
|
|
|
|
|
|
|
2011 |
|
|
|
|
|
|
|
|
|
|
|
|
| 3,925 |
|
| 19,548 |
|
| 35,551 |
|
| 51,868 |
|
| 63,800 |
|
| 75,806 |
|
|
|
|
|
|
|
|
2012 |
|
|
|
|
|
|
|
|
|
|
|
|
|
|
|
| 10,013 |
|
| 23,019 |
|
| 33,477 |
|
| 51,980 |
|
| 72,495 |
|
|
|
|
|
|
|
|
2013 |
|
|
|
|
|
|
|
|
|
|
|
|
|
|
|
|
|
|
| 7,317 |
|
| 21,500 |
|
| 49,562 |
|
| 85,719 |
|
|
|
|
|
|
|
|
2014 |
|
|
|
|
|
|
|
|
|
|
|
|
|
|
|
|
|
|
|
|
|
| 5,272 |
|
| 13,762 |
|
| 45,324 |
|
|
|
|
|
|
|
|
2015 |
|
|
|
|
|
|
|
|
|
|
|
|
|
|
|
|
|
|
|
|
|
|
|
|
| 3,641 |
|
| 24,291 |
|
|
|
|
|
|
|
|
2016 |
|
|
|
|
|
|
|
|
|
|
|
|
|
|
|
|
|
|
|
|
|
|
|
|
|
|
|
| 7,706 |
|
|
|
|
|
|
|
|
|
|
|
|
|
|
|
|
|
|
|
|
|
|
|
|
|
|
|
|
|
|
|
|
| Total |
| $ | 834,873 |
|
|
|
|
|
|
|
| |
|
|
|
|
|
|
|
|
|
|
|
|
|
|
|
|
|
|
|
|
|
|
|
|
| Net reserves < 2007 |
|
| 16,571 |
|
|
|
|
|
|
|
| |
|
|
|
|
|
|
|
|
|
|
|
|
|
|
|
|
|
|
|
|
|
|
|
|
| Total Net reserves |
| $ | 769,399 |
|
|
|
|
|
|
|
| |
|
|
|
|
|
|
|
|
|
|
|
|
|
|
|
|
|
|
|
|
|
|
|
|
|
|
|
|
|
|
|
|
|
|
|
|
|
|
| U.S. P&C |
|
|
| ||||||||||||||||||||||||||||
| Average Annual Percentage Payout of Incurred Claims by Age, Net of Reinsurance |
|
|
| ||||||||||||||||||||||||||||
Years | 1 |
| 2 |
| 3 |
| 4 |
| 5 |
| 6 |
| 7 |
| 8 |
| 9 |
| 10 |
|
|
| ||||||||||
U.S. P&C |
| 5.9 | % |
| 11.7 | % |
| 16.2 | % |
| 18.0 | % |
| 14.2 | % |
| 8.6 | % |
| 4.9 | % |
| 5.3 | % |
| 6.8 | % |
| 4.5 | % |
|
|
F-26
| U.S. Professional Liability |
|
|
|
|
|
|
|
| ||||||||||||||||||||||||||||
| Loss and ALAE, Net of Reinsurance |
|
|
|
|
|
|
|
| ||||||||||||||||||||||||||||
amounts in thousands | For the Years Ended December 31, |
|
| As of December 31, 2016 |
| ||||||||||||||||||||||||||||||||
AY | 2007 |
| 2008 |
| 2009 |
| 2010 |
| 2011 |
| 2012 |
| 2013 |
| 2014 |
| 2015 |
| 2016 |
|
| Total IBNR |
| # of Reported Claims |
| ||||||||||||
2007 | $ | 38,000 |
| $ | 38,553 |
| $ | 55,491 |
| $ | 57,643 |
| $ | 62,630 |
| $ | 61,935 |
| $ | 60,445 |
| $ | 60,447 |
| $ | 59,936 |
| $ | 59,574 |
|
| $ | (70 | ) |
| 634 |
|
2008 |
|
|
|
| 34,346 |
|
| 38,449 |
|
| 39,130 |
|
| 35,844 |
|
| 37,603 |
|
| 37,939 |
|
| 37,497 |
|
| 37,620 |
|
| 41,766 |
|
|
| (382 | ) |
| 770 |
|
2009 |
|
|
|
|
|
|
| 47,473 |
|
| 53,273 |
|
| 61,023 |
|
| 58,600 |
|
| 60,789 |
|
| 58,487 |
|
| 58,660 |
|
| 58,143 |
|
|
| (563 | ) |
| 1,370 |
|
2010 |
|
|
|
|
|
|
|
|
|
| 52,302 |
|
| 64,020 |
|
| 68,375 |
|
| 75,619 |
|
| 74,535 |
|
| 86,787 |
|
| 85,348 |
|
|
| 83 |
|
| 1,429 |
|
2011 |
|
|
|
|
|
|
|
|
|
|
|
|
| 58,116 |
|
| 62,087 |
|
| 70,240 |
|
| 73,028 |
|
| 79,181 |
|
| 79,136 |
|
|
| 622 |
|
| 1,724 |
|
2012 |
|
|
|
|
|
|
|
|
|
|
|
|
|
|
|
| 61,196 |
|
| 54,480 |
|
| 57,097 |
|
| 55,917 |
|
| 58,344 |
|
|
| 3,214 |
|
| 2,180 |
|
2013 |
|
|
|
|
|
|
|
|
|
|
|
|
|
|
|
|
|
|
| 60,899 |
|
| 54,982 |
|
| 49,104 |
|
| 48,298 |
|
|
| 4,989 |
|
| 2,226 |
|
2014 |
|
|
|
|
|
|
|
|
|
|
|
|
|
|
|
|
|
|
|
|
|
| 50,020 |
|
| 35,870 |
|
| 39,826 |
|
|
| 6,504 |
|
| 2,278 |
|
2015 |
|
|
|
|
|
|
|
|
|
|
|
|
|
|
|
|
|
|
|
|
|
|
|
|
| 31,659 |
|
| 30,764 |
|
|
| 15,870 |
|
| 1,709 |
|
2016 |
|
|
|
|
|
|
|
|
|
|
|
|
|
|
|
|
|
|
|
|
|
|
|
|
|
|
|
| 41,672 |
|
|
| 36,356 |
|
| 1,739 |
|
|
|
|
|
|
|
|
|
|
|
|
|
|
|
|
|
|
|
|
|
|
|
|
|
| Total |
| $ | 542,871 |
|
|
|
|
|
|
|
| |
|
|
|
|
|
|
|
|
|
|
|
|
|
|
|
|
|
|
|
|
|
|
|
|
|
|
|
|
|
|
|
|
|
|
|
|
|
|
|
|
|
|
|
|
|
|
|
|
|
|
|
|
|
|
|
|
|
|
|
|
|
|
|
|
|
|
|
|
|
|
|
|
|
|
|
|
| U.S. Professional Liability |
|
|
|
|
|
|
|
| ||||||||||||||||||||||||||||
| Cumulative Paid Claims and Allocated Claim Adjustment Expenses, Net of Reinsurance |
|
|
|
|
|
|
|
| ||||||||||||||||||||||||||||
amounts in thousands | For the Years Ended December 31, |
|
|
|
|
|
|
|
| ||||||||||||||||||||||||||||
AY | 2007 |
| 2008 |
| 2009 |
| 2010 |
| 2011 |
| 2012 |
| 2013 |
| 2014 |
| 2015 |
| 2016 |
|
|
|
|
|
|
|
| ||||||||||
2007 | $ | 1,861 |
| $ | 10,365 |
| $ | 32,621 |
| $ | 47,980 |
| $ | 52,941 |
| $ | 58,515 |
| $ | 59,280 |
| $ | 59,332 |
| $ | 59,565 |
| $ | 59,570 |
|
|
|
|
|
|
|
|
2008 |
|
|
|
| 1,880 |
|
| 15,288 |
|
| 25,042 |
|
| 30,581 |
|
| 34,902 |
|
| 35,206 |
|
| 35,598 |
|
| 37,175 |
|
| 42,056 |
|
|
|
|
|
|
|
|
2009 |
|
|
|
|
|
|
| 3,837 |
|
| 21,742 |
|
| 41,675 |
|
| 51,642 |
|
| 55,378 |
|
| 53,859 |
|
| 57,744 |
|
| 58,095 |
|
|
|
|
|
|
|
|
2010 |
|
|
|
|
|
|
|
|
|
| 2,981 |
|
| 23,147 |
|
| 46,868 |
|
| 54,019 |
|
| 59,765 |
|
| 82,013 |
|
| 84,511 |
|
|
|
|
|
|
|
|
2011 |
|
|
|
|
|
|
|
|
|
|
|
|
| 3,204 |
|
| 23,878 |
|
| 43,551 |
|
| 59,576 |
|
| 65,710 |
|
| 75,641 |
|
|
|
|
|
|
|
|
2012 |
|
|
|
|
|
|
|
|
|
|
|
|
|
|
|
| 3,855 |
|
| 22,635 |
|
| 35,681 |
|
| 44,028 |
|
| 49,675 |
|
|
|
|
|
|
|
|
2013 |
|
|
|
|
|
|
|
|
|
|
|
|
|
|
|
|
|
|
| 4,677 |
|
| 22,167 |
|
| 32,904 |
|
| 38,876 |
|
|
|
|
|
|
|
|
2014 |
|
|
|
|
|
|
|
|
|
|
|
|
|
|
|
|
|
|
|
|
|
| 2,304 |
|
| 14,371 |
|
| 29,392 |
|
|
|
|
|
|
|
|
2015 |
|
|
|
|
|
|
|
|
|
|
|
|
|
|
|
|
|
|
|
|
|
|
|
|
| 2,257 |
|
| 11,249 |
|
|
|
|
|
|
|
|
2016 |
|
|
|
|
|
|
|
|
|
|
|
|
|
|
|
|
|
|
|
|
|
|
|
|
|
|
|
| 2,383 |
|
|
|
|
|
|
|
|
|
|
|
|
|
|
|
|
|
|
|
|
|
|
|
|
|
|
|
|
|
|
|
|
| Total |
| $ | 451,448 |
|
|
|
|
|
|
|
| |
|
|
|
|
|
|
|
|
|
|
|
|
|
|
|
|
|
|
|
|
|
|
|
|
| Net reserves < 2007 |
|
| (386 | ) |
|
|
|
|
|
|
| |
|
|
|
|
|
|
|
|
|
|
|
|
|
|
|
|
|
|
|
|
|
|
|
|
| Total Net reserves |
| $ | 91,037 |
|
|
|
|
|
|
|
| |
|
|
|
|
|
|
|
|
|
|
|
|
|
|
|
|
|
|
|
|
|
|
|
|
|
|
|
|
|
|
|
|
|
|
|
|
|
|
| U.S. Professional Liability |
|
|
| ||||||||||||||||||||||||||||
| Average Annual Percentage Payout of Incurred Claims by Age, Net of Reinsurance |
|
|
| ||||||||||||||||||||||||||||
Years | 1 |
| 2 |
| 3 |
| 4 |
| 5 |
| 6 |
| 7 |
| 8 |
| 9 |
| 10 |
|
|
| ||||||||||
U.S. Professional Liability |
| 5.7 | % |
| 28.3 | % |
| 28.7 | % |
| 15.9 | % |
| 8.2 | % |
| 9.2 | % |
| 3.0 | % |
| 1.5 | % |
| 6.0 | % |
| 0.0 | % |
|
|
F-27
| Int'l Marine |
|
|
|
|
|
|
|
| ||||||||||||||||||||||||||||
| Loss and ALAE, Net of Reinsurance |
|
|
|
|
|
|
|
| ||||||||||||||||||||||||||||
amounts in thousands | For the Years Ended December 31, |
|
| As of December 31, 2016 |
| ||||||||||||||||||||||||||||||||
AY | 2007 |
| 2008 |
| 2009 |
| 2010 |
| 2011 |
| 2012 |
| 2013 |
| 2014 |
| 2015 |
| 2016 |
|
| Total IBNR |
| # of Reported Claims |
| ||||||||||||
2007 | $ | - |
| $ | - |
| $ | - |
| $ | - |
| $ | - |
| $ | 70,633 |
| $ | 67,148 |
| $ | 66,951 |
| $ | 66,883 |
| $ | 66,239 |
|
| $ | (35 | ) |
| 5,585 |
|
2008 |
|
|
|
| - |
|
| - |
|
| - |
|
| - |
|
| 88,720 |
|
| 85,285 |
|
| 84,131 |
|
| 84,191 |
|
| 82,752 |
|
|
| 98 |
|
| 5,809 |
|
2009 |
|
|
|
|
|
|
| - |
|
| - |
|
| - |
|
| 89,057 |
|
| 86,914 |
|
| 84,497 |
|
| 82,096 |
|
| 79,526 |
|
|
| 111 |
|
| 4,969 |
|
2010 |
|
|
|
|
|
|
|
|
|
| - |
|
| - |
|
| 123,719 |
|
| 119,021 |
|
| 114,188 |
|
| 111,468 |
|
| 108,405 |
|
|
| 282 |
|
| 5,317 |
|
2011 |
|
|
|
|
|
|
|
|
|
|
|
|
| - |
|
| 91,347 |
|
| 86,795 |
|
| 78,872 |
|
| 75,873 |
|
| 70,751 |
|
|
| 25 |
|
| 4,824 |
|
2012 |
|
|
|
|
|
|
|
|
|
|
|
|
|
|
|
| 93,696 |
|
| 115,935 |
|
| 99,683 |
|
| 94,886 |
|
| 90,523 |
|
|
| (216 | ) |
| 5,201 |
|
2013 |
|
|
|
|
|
|
|
|
|
|
|
|
|
|
|
|
|
|
| 68,587 |
|
| 82,313 |
|
| 80,713 |
|
| 77,239 |
|
|
| 747 |
|
| 5,075 |
|
2014 |
|
|
|
|
|
|
|
|
|
|
|
|
|
|
|
|
|
|
|
|
|
| 85,512 |
|
| 105,072 |
|
| 107,789 |
|
|
| (1,500 | ) |
| 4,928 |
|
2015 |
|
|
|
|
|
|
|
|
|
|
|
|
|
|
|
|
|
|
|
|
|
|
|
|
| 70,675 |
|
| 91,371 |
|
|
| 5,194 |
|
| 6,967 |
|
2016 |
|
|
|
|
|
|
|
|
|
|
|
|
|
|
|
|
|
|
|
|
|
|
|
|
|
|
|
| 84,156 |
|
|
| 26,285 |
|
| 5,577 |
|
|
|
|
|
|
|
|
|
|
|
|
|
|
|
|
|
|
|
|
|
|
|
|
|
| Total |
| $ | 858,751 |
|
|
|
|
|
|
|
| |
|
|
|
|
|
|
|
|
|
|
|
|
|
|
|
|
|
|
|
|
|
|
|
|
|
|
|
|
|
|
|
|
|
|
|
|
|
|
|
|
|
|
|
|
|
|
|
|
|
|
|
|
|
|
|
|
|
|
|
|
|
|
|
|
|
|
|
|
|
|
|
|
|
|
|
|
| Int'l Marine |
|
|
|
|
|
|
|
| ||||||||||||||||||||||||||||
| Cumulative Paid Claims and Allocated Claim Adjustment Expenses, Net of Reinsurance |
|
|
|
|
|
|
|
| ||||||||||||||||||||||||||||
amounts in thousands | For the Years Ended December 31, |
|
|
|
|
|
|
|
| ||||||||||||||||||||||||||||
AY | 2007 |
| 2008 |
| 2009 |
| 2010 |
| 2011 |
| 2012 |
| 2013 |
| 2014 |
| 2015 |
| 2016 |
|
|
|
|
|
|
|
| ||||||||||
2007 | $ | - |
| $ | - |
| $ | - |
| $ | - |
| $ | - |
| $ | 59,831 |
| $ | 60,702 |
| $ | 61,956 |
| $ | 62,729 |
| $ | 63,281 |
|
|
|
|
|
|
|
|
2008 |
|
|
|
| - |
|
| - |
|
| - |
|
| - |
|
| 69,959 |
|
| 72,309 |
|
| 73,746 |
|
| 77,535 |
|
| 78,683 |
|
|
|
|
|
|
|
|
2009 |
|
|
|
|
|
|
| - |
|
| - |
|
| - |
|
| 64,058 |
|
| 68,085 |
|
| 70,834 |
|
| 74,311 |
|
| 75,006 |
|
|
|
|
|
|
|
|
2010 |
|
|
|
|
|
|
|
|
|
| - |
|
| - |
|
| 74,920 |
|
| 87,186 |
|
| 93,167 |
|
| 97,132 |
|
| 99,416 |
|
|
|
|
|
|
|
|
2011 |
|
|
|
|
|
|
|
|
|
|
|
|
| - |
|
| 43,740 |
|
| 56,569 |
|
| 60,879 |
|
| 65,580 |
|
| 66,538 |
|
|
|
|
|
|
|
|
2012 |
|
|
|
|
|
|
|
|
|
|
|
|
|
|
|
| 22,777 |
|
| 52,968 |
|
| 68,498 |
|
| 76,572 |
|
| 79,205 |
|
|
|
|
|
|
|
|
2013 |
|
|
|
|
|
|
|
|
|
|
|
|
|
|
|
|
|
|
| 21,703 |
|
| 42,953 |
|
| 54,826 |
|
| 60,828 |
|
|
|
|
|
|
|
|
2014 |
|
|
|
|
|
|
|
|
|
|
|
|
|
|
|
|
|
|
|
|
|
| 24,445 |
|
| 50,168 |
|
| 73,921 |
|
|
|
|
|
|
|
|
2015 |
|
|
|
|
|
|
|
|
|
|
|
|
|
|
|
|
|
|
|
|
|
|
|
|
| 22,323 |
|
| 52,356 |
|
|
|
|
|
|
|
|
2016 |
|
|
|
|
|
|
|
|
|
|
|
|
|
|
|
|
|
|
|
|
|
|
|
|
|
|
|
| 22,192 |
|
|
|
|
|
|
|
|
|
|
|
|
|
|
|
|
|
|
|
|
|
|
|
|
|
|
|
|
|
|
|
|
| Total |
| $ | 671,426 |
|
|
|
|
|
|
|
| |
|
|
|
|
|
|
|
|
|
|
|
|
|
|
|
|
|
|
|
|
|
|
|
|
| Net reserves < 2007 |
|
| 9,207 |
|
|
|
|
|
|
|
| |
|
|
|
|
|
|
|
|
|
|
|
|
|
|
|
|
|
|
|
|
|
|
|
|
| Total Net reserves |
| $ | 196,532 |
|
|
|
|
|
|
|
| |
|
|
|
|
|
|
|
|
|
|
|
|
|
|
|
|
|
|
|
|
|
|
|
|
|
|
|
|
|
|
|
|
|
|
|
|
|
|
| Int'l Marine |
|
|
| ||||||||||||||||||||||||||||
| Average Annual Percentage Payout of Incurred Claims by Age, Net of Reinsurance |
|
|
| ||||||||||||||||||||||||||||
Years | 1 |
| 2 |
| 3 |
| 4 |
| 5 |
| 6 |
| 7 |
| 8 |
| 9 |
| 10 |
|
|
| ||||||||||
Int'l Marine |
| 24.5 | % |
| 28.1 | % |
| 18.2 | % |
| 7.6 | % |
| 5.0 | % |
| 2.8 | % |
| 2.7 | % |
| 2.4 | % |
| 1.3 | % |
| 0.8 | % |
|
|
F-28
| Int'l P&C |
|
|
|
|
|
|
|
| ||||||||||||||||||||||||||||
| Loss and ALAE, Net of Reinsurance |
|
|
|
|
|
|
|
| ||||||||||||||||||||||||||||
amounts in thousands | For the Years Ended December 31, |
|
| As of December 31, 2016 |
| ||||||||||||||||||||||||||||||||
AY | 2007 |
| 2008 |
| 2009 |
| 2010 |
| 2011 |
| 2012 |
| 2013 |
| 2014 |
| 2015 |
| 2016 |
|
| Total IBNR |
| # of Reported Claims |
| ||||||||||||
2007 | $ | - |
| $ | - |
| $ | - |
| $ | - |
| $ | - |
| $ | 26,084 |
| $ | 25,817 |
| $ | 25,740 |
| $ | 25,855 |
| $ | 25,778 |
|
| $ | (60 | ) |
| 584 |
|
2008 |
|
|
|
| - |
|
| - |
|
| - |
|
| - |
|
| 39,504 |
|
| 37,884 |
|
| 37,867 |
|
| 37,296 |
|
| 36,729 |
|
|
| (75 | ) |
| 891 |
|
2009 |
|
|
|
|
|
|
| - |
|
| - |
|
| - |
|
| 26,499 |
|
| 25,804 |
|
| 25,910 |
|
| 25,418 |
|
| 25,113 |
|
|
| 13 |
|
| 743 |
|
2010 |
|
|
|
|
|
|
|
|
|
| - |
|
| - |
|
| 39,082 |
|
| 39,409 |
|
| 39,050 |
|
| 39,031 |
|
| 38,198 |
|
|
| 58 |
|
| 836 |
|
2011 |
|
|
|
|
|
|
|
|
|
|
|
|
| - |
|
| 57,463 |
|
| 53,654 |
|
| 52,093 |
|
| 52,666 |
|
| 52,202 |
|
|
| (198 | ) |
| 833 |
|
2012 |
|
|
|
|
|
|
|
|
|
|
|
|
|
|
|
| 34,479 |
|
| 30,643 |
|
| 30,347 |
|
| 28,626 |
|
| 27,828 |
|
|
| (353 | ) |
| 877 |
|
2013 |
|
|
|
|
|
|
|
|
|
|
|
|
|
|
|
|
|
|
| 29,496 |
|
| 33,720 |
|
| 31,050 |
|
| 29,684 |
|
|
| (308 | ) |
| 1,229 |
|
2014 |
|
|
|
|
|
|
|
|
|
|
|
|
|
|
|
|
|
|
|
|
|
| 20,234 |
|
| 16,987 |
|
| 17,006 |
|
|
| 173 |
|
| 1,167 |
|
2015 |
|
|
|
|
|
|
|
|
|
|
|
|
|
|
|
|
|
|
|
|
|
|
|
|
| 26,414 |
|
| 30,932 |
|
|
| 2,106 |
|
| 1,678 |
|
2016 |
|
|
|
|
|
|
|
|
|
|
|
|
|
|
|
|
|
|
|
|
|
|
|
|
|
|
|
| 75,571 |
|
|
| 13,006 |
|
| 2,646 |
|
|
|
|
|
|
|
|
|
|
|
|
|
|
|
|
|
|
|
|
|
|
|
|
|
| Total |
| $ | 359,041 |
|
|
|
|
|
|
|
| |
|
|
|
|
|
|
|
|
|
|
|
|
|
|
|
|
|
|
|
|
|
|
|
|
|
|
|
|
|
|
|
|
|
|
|
|
|
|
|
|
|
|
|
|
|
|
|
|
|
|
|
|
|
|
|
|
|
|
|
|
|
|
|
|
|
|
|
|
|
|
|
|
|
|
|
|
| Int'l P&C |
|
|
|
|
|
|
|
| ||||||||||||||||||||||||||||
| Cumulative Paid Claims and Allocated Claim Adjustment Expenses, Net of Reinsurance |
|
|
|
|
|
|
|
| ||||||||||||||||||||||||||||
amounts in thousands | For the Years Ended December 31, |
|
|
|
|
|
|
|
| ||||||||||||||||||||||||||||
AY | 2007 |
| 2008 |
| 2009 |
| 2010 |
| 2011 |
| 2012 |
| 2013 |
| 2014 |
| 2015 |
| 2016 |
|
|
|
|
|
|
|
| ||||||||||
2007 | $ | - |
| $ | - |
| $ | - |
| $ | - |
| $ | - |
| $ | 23,885 |
| $ | 24,681 |
| $ | 25,150 |
| $ | 25,292 |
| $ | 25,289 |
|
|
|
|
|
|
|
|
2008 |
|
|
|
| - |
|
| - |
|
| - |
|
| - |
|
| 34,084 |
|
| 35,161 |
|
| 35,463 |
|
| 35,975 |
|
| 35,826 |
|
|
|
|
|
|
|
|
2009 |
|
|
|
|
|
|
| - |
|
| - |
|
| - |
|
| 23,371 |
|
| 24,257 |
|
| 24,713 |
|
| 24,286 |
|
| 24,369 |
|
|
|
|
|
|
|
|
2010 |
|
|
|
|
|
|
|
|
|
| - |
|
| - |
|
| 32,156 |
|
| 36,499 |
|
| 39,017 |
|
| 36,509 |
|
| 36,601 |
|
|
|
|
|
|
|
|
2011 |
|
|
|
|
|
|
|
|
|
|
|
|
| - |
|
| 33,316 |
|
| 42,280 |
|
| 45,125 |
|
| 47,591 |
|
| 48,502 |
|
|
|
|
|
|
|
|
2012 |
|
|
|
|
|
|
|
|
|
|
|
|
|
|
|
| 7,884 |
|
| 15,648 |
|
| 20,850 |
|
| 24,871 |
|
| 26,049 |
|
|
|
|
|
|
|
|
2013 |
|
|
|
|
|
|
|
|
|
|
|
|
|
|
|
|
|
|
| 6,829 |
|
| 17,613 |
|
| 24,735 |
|
| 27,180 |
|
|
|
|
|
|
|
|
2014 |
|
|
|
|
|
|
|
|
|
|
|
|
|
|
|
|
|
|
|
|
|
| 3,813 |
|
| 8,458 |
|
| 12,304 |
|
|
|
|
|
|
|
|
2015 |
|
|
|
|
|
|
|
|
|
|
|
|
|
|
|
|
|
|
|
|
|
|
|
|
| 6,739 |
|
| 18,096 |
|
|
|
|
|
|
|
|
2016 |
|
|
|
|
|
|
|
|
|
|
|
|
|
|
|
|
|
|
|
|
|
|
|
|
|
|
|
| 24,255 |
|
|
|
|
|
|
|
|
|
|
|
|
|
|
|
|
|
|
|
|
|
|
|
|
|
|
|
|
|
|
|
|
| Total |
| $ | 278,471 |
|
|
|
|
|
|
|
| |
|
|
|
|
|
|
|
|
|
|
|
|
|
|
|
|
|
|
|
|
|
|
|
|
| Net reserves < 2007 |
|
| 619 |
|
|
|
|
|
|
|
| |
|
|
|
|
|
|
|
|
|
|
|
|
|
|
|
|
|
|
|
|
|
|
|
|
| Total Net reserves |
| $ | 81,189 |
|
|
|
|
|
|
|
| |
|
|
|
|
|
|
|
|
|
|
|
|
|
|
|
|
|
|
|
|
|
|
|
|
|
|
|
|
|
|
|
|
|
|
|
|
|
|
| Int'l P&C |
|
|
| ||||||||||||||||||||||||||||
| Average Annual Percentage Payout of Incurred Claims by Age, Net of Reinsurance |
|
|
| ||||||||||||||||||||||||||||
Years | 1 |
| 2 |
| 3 |
| 4 |
| 5 |
| 6 |
| 7 |
| 8 |
| 9 |
| 10 |
|
|
| ||||||||||
Int'l P&C |
| 25.4 | % |
| 33.5 | % |
| 21.8 | % |
| 9.4 | % |
| 5.2 | % |
| -1.0 | % |
| -0.2 | % |
| 1.2 | % |
| 0.1 | % |
| 0.0 | % |
|
|
F-29
| Int'l Professional Liability |
|
|
|
|
|
|
|
| ||||||||||||||||||||||||||||
| Loss and ALAE, Net of Reinsurance |
|
|
|
|
|
|
|
| ||||||||||||||||||||||||||||
amounts in thousands | For the Years Ended December 31, |
|
| As of December 31, 2016 |
| ||||||||||||||||||||||||||||||||
AY | 2007 |
| 2008 |
| 2009 |
| 2010 |
| 2011 |
| 2012 |
| 2013 |
| 2014 |
| 2015 |
| 2016 |
|
| Total IBNR |
| # of Reported Claims |
| ||||||||||||
2007 | $ | - |
| $ | - |
| $ | - |
| $ | - |
| $ | - |
| $ | 12,901 |
| $ | 12,587 |
| $ | 12,445 |
| $ | 12,378 |
| $ | 12,381 |
|
| $ | (64 | ) |
| 235 |
|
2008 |
|
|
|
| - |
|
| - |
|
| - |
|
| - |
|
| 15,511 |
|
| 15,302 |
|
| 14,816 |
|
| 14,010 |
|
| 14,023 |
|
|
| (175 | ) |
| 365 |
|
2009 |
|
|
|
|
|
|
| - |
|
| - |
|
| - |
|
| 14,809 |
|
| 15,367 |
|
| 14,972 |
|
| 16,289 |
|
| 15,780 |
|
|
| 629 |
|
| 445 |
|
2010 |
|
|
|
|
|
|
|
|
|
| - |
|
| - |
|
| 18,603 |
|
| 16,159 |
|
| 15,661 |
|
| 17,451 |
|
| 15,619 |
|
|
| 1,409 |
|
| 653 |
|
2011 |
|
|
|
|
|
|
|
|
|
|
|
|
| - |
|
| 9,686 |
|
| 7,648 |
|
| 7,125 |
|
| 7,050 |
|
| 6,835 |
|
|
| 356 |
|
| 681 |
|
2012 |
|
|
|
|
|
|
|
|
|
|
|
|
|
|
|
| 8,204 |
|
| 9,753 |
|
| 9,106 |
|
| 11,175 |
|
| 16,891 |
|
|
| 490 |
|
| 718 |
|
2013 |
|
|
|
|
|
|
|
|
|
|
|
|
|
|
|
|
|
|
| 15,096 |
|
| 17,628 |
|
| 16,272 |
|
| 15,402 |
|
|
| 4,255 |
|
| 1,053 |
|
2014 |
|
|
|
|
|
|
|
|
|
|
|
|
|
|
|
|
|
|
|
|
|
| 18,835 |
|
| 24,070 |
|
| 23,457 |
|
|
| 12,421 |
|
| 1,276 |
|
2015 |
|
|
|
|
|
|
|
|
|
|
|
|
|
|
|
|
|
|
|
|
|
|
|
|
| 22,760 |
|
| 30,104 |
|
|
| 17,379 |
|
| 1,939 |
|
2016 |
|
|
|
|
|
|
|
|
|
|
|
|
|
|
|
|
|
|
|
|
|
|
|
|
|
|
|
| 36,006 |
|
|
| 31,814 |
|
| 2,554 |
|
|
|
|
|
|
|
|
|
|
|
|
|
|
|
|
|
|
|
|
|
|
|
|
|
| Total |
| $ | 186,498 |
|
|
|
|
|
|
|
| |
|
|
|
|
|
|
|
|
|
|
|
|
|
|
|
|
|
|
|
|
|
|
|
|
|
|
|
|
|
|
|
|
|
|
|
|
|
|
|
|
|
|
|
|
|
|
|
|
|
|
|
|
|
|
|
|
|
|
|
|
|
|
|
|
|
|
|
|
|
|
|
|
|
|
|
|
| Int'l Professional Liability |
|
|
|
|
|
|
|
| ||||||||||||||||||||||||||||
| Cumulative Paid Claims and Allocated Claim Adjustment Expenses, Net of Reinsurance |
|
|
|
|
|
|
|
| ||||||||||||||||||||||||||||
amounts in thousands | For the Years Ended December 31, |
|
|
|
|
|
|
|
| ||||||||||||||||||||||||||||
AY | 2007 |
| 2008 |
| 2009 |
| 2010 |
| 2011 |
| 2012 |
| 2013 |
| 2014 |
| 2015 |
| 2016 |
|
|
|
|
|
|
|
| ||||||||||
2007 | $ | - |
| $ | - |
| $ | - |
| $ | - |
| $ | - |
| $ | 11,293 |
| $ | 11,704 |
| $ | 12,269 |
| $ | 12,277 |
| $ | 12,382 |
|
|
|
|
|
|
|
|
2008 |
|
|
|
| - |
|
| - |
|
| - |
|
| - |
|
| 12,150 |
|
| 13,306 |
|
| 13,702 |
|
| 13,732 |
|
| 14,019 |
|
|
|
|
|
|
|
|
2009 |
|
|
|
|
|
|
| - |
|
| - |
|
| - |
|
| 8,805 |
|
| 10,716 |
|
| 12,783 |
|
| 13,803 |
|
| 14,118 |
|
|
|
|
|
|
|
|
2010 |
|
|
|
|
|
|
|
|
|
| - |
|
| - |
|
| 5,801 |
|
| 7,169 |
|
| 10,460 |
|
| 12,632 |
|
| 13,366 |
|
|
|
|
|
|
|
|
2011 |
|
|
|
|
|
|
|
|
|
|
|
|
| - |
|
| 1,197 |
|
| 2,002 |
|
| 2,950 |
|
| 4,007 |
|
| 4,576 |
|
|
|
|
|
|
|
|
2012 |
|
|
|
|
|
|
|
|
|
|
|
|
|
|
|
| 2,133 |
|
| 3,219 |
|
| 4,253 |
|
| 5,483 |
|
| 7,365 |
|
|
|
|
|
|
|
|
2013 |
|
|
|
|
|
|
|
|
|
|
|
|
|
|
|
|
|
|
| 725 |
|
| 2,196 |
|
| 2,952 |
|
| 9,230 |
|
|
|
|
|
|
|
|
2014 |
|
|
|
|
|
|
|
|
|
|
|
|
|
|
|
|
|
|
|
|
|
| 1,368 |
|
| 2,421 |
|
| 5,068 |
|
|
|
|
|
|
|
|
2015 |
|
|
|
|
|
|
|
|
|
|
|
|
|
|
|
|
|
|
|
|
|
|
|
|
| 3,355 |
|
| 5,765 |
|
|
|
|
|
|
|
|
2016 |
|
|
|
|
|
|
|
|
|
|
|
|
|
|
|
|
|
|
|
|
|
|
|
|
|
|
|
| 2,012 |
|
|
|
|
|
|
|
|
|
|
|
|
|
|
|
|
|
|
|
|
|
|
|
|
|
|
|
|
|
|
|
|
| Total |
| $ | 87,901 |
|
|
|
|
|
|
|
| |
|
|
|
|
|
|
|
|
|
|
|
|
|
|
|
|
|
|
|
|
|
|
|
|
| Net reserves < 2007 |
|
| 92 |
|
|
|
|
|
|
|
| |
|
|
|
|
|
|
|
|
|
|
|
|
|
|
|
|
|
|
|
|
|
|
|
|
| Total Net reserves |
| $ | 98,689 |
|
|
|
|
|
|
|
| |
|
|
|
|
|
|
|
|
|
|
|
|
|
|
|
|
|
|
|
|
|
|
|
|
|
|
|
|
|
|
|
|
|
|
|
|
|
|
| Int'l Professional Liability |
|
|
| ||||||||||||||||||||||||||||
| Average Annual Percentage Payout of Incurred Claims by Age, Net of Reinsurance |
|
|
| ||||||||||||||||||||||||||||
Years | 1 |
| 2 |
| 3 |
| 4 |
| 5 |
| 6 |
| 7 |
| 8 |
| 9 |
| 10 |
|
|
| ||||||||||
Int'l Professional |
| 7.5 | % |
| 7.3 | % |
| 7.4 | % |
| 20.6 | % |
| 15.9 | % |
| 11.8 | % |
| 4.7 | % |
| 2.3 | % |
| 1.1 | % |
| 0.8 | % |
|
|
F-30
| GlobalRe |
|
|
|
|
|
|
|
| ||||||||||||||||||||||||||||
| Loss and ALAE, Net of Reinsurance |
|
|
|
|
|
|
|
| ||||||||||||||||||||||||||||
amounts in thousands | For the Years Ended December 31, |
|
| As of December 31, 2016 |
| ||||||||||||||||||||||||||||||||
AY | 2007 |
| 2008 |
| 2009 |
| 2010 |
| 2011 |
| 2012 |
| 2013 |
| 2014 |
| 2015 |
| 2016 |
|
| Total IBNR |
| # of Reported Claims |
| ||||||||||||
2007 | $ | - |
| $ | - |
| $ | - |
| $ | - |
| $ | - |
| $ | 6,215 |
| $ | 6,190 |
| $ | 6,173 |
| $ | 5,889 |
| $ | 5,883 |
|
| $ | (141 | ) |
| 254 |
|
2008 |
|
|
|
| - |
|
| - |
|
| - |
|
| - |
|
| 13,863 |
|
| 14,024 |
|
| 13,530 |
|
| 13,304 |
|
| 13,298 |
|
|
| 672 |
|
| 294 |
|
2009 |
|
|
|
|
|
|
| 4,970 |
|
| 3,734 |
|
| 3,752 |
|
| 11,186 |
|
| 11,380 |
|
| 10,745 |
|
| 10,390 |
|
| 10,475 |
|
|
| 204 |
|
| 202 |
|
2010 |
|
|
|
|
|
|
|
|
|
| 3,743 |
|
| 3,500 |
|
| 13,455 |
|
| 13,661 |
|
| 12,899 |
|
| 11,597 |
|
| 12,330 |
|
|
| (1,000 | ) |
| 195 |
|
2011 |
|
|
|
|
|
|
|
|
|
|
|
|
| 39,678 |
|
| 50,832 |
|
| 74,131 |
|
| 73,511 |
|
| 73,042 |
|
| 72,667 |
|
|
| (461 | ) |
| 766 |
|
2012 |
|
|
|
|
|
|
|
|
|
|
|
|
|
|
|
| 108,790 |
|
| 103,183 |
|
| 94,766 |
|
| 89,053 |
|
| 114,728 |
|
|
| 531 |
|
| 1,419 |
|
2013 |
|
|
|
|
|
|
|
|
|
|
|
|
|
|
|
|
|
|
| 112,735 |
|
| 119,012 |
|
| 101,703 |
|
| 104,913 |
|
|
| 3,973 |
|
| 1,185 |
|
2014 |
|
|
|
|
|
|
|
|
|
|
|
|
|
|
|
|
|
|
|
|
|
| 120,479 |
|
| 141,108 |
|
| 121,535 |
|
|
| 9,825 |
|
| 920 |
|
2015 |
|
|
|
|
|
|
|
|
|
|
|
|
|
|
|
|
|
|
|
|
|
|
|
|
| 99,874 |
|
| 91,098 |
|
|
| 11,623 |
|
| 680 |
|
2016 |
|
|
|
|
|
|
|
|
|
|
|
|
|
|
|
|
|
|
|
|
|
|
|
|
|
|
|
| 88,192 |
|
|
| 38,785 |
|
| 335 |
|
|
|
|
|
|
|
|
|
|
|
|
|
|
|
|
|
|
|
|
|
|
|
|
|
| Total |
| $ | 635,119 |
|
|
|
|
|
|
|
| |
|
|
|
|
|
|
|
|
|
|
|
|
|
|
|
|
|
|
|
|
|
|
|
|
|
|
|
|
|
|
|
|
|
|
|
|
|
|
|
|
|
|
|
|
|
|
|
|
|
|
|
|
|
|
|
|
|
|
|
|
|
|
|
|
|
|
|
|
|
|
|
|
|
|
|
|
| GlobalRe |
|
|
|
|
|
|
|
| ||||||||||||||||||||||||||||
| Cumulative Paid Claims and Allocated Claim Adjustment Expenses, Net of Reinsurance |
|
|
|
|
|
|
|
| ||||||||||||||||||||||||||||
amounts in thousands | For the Years Ended December 31, |
|
|
|
|
|
|
|
| ||||||||||||||||||||||||||||
AY | 2007 |
| 2008 |
| 2009 |
| 2010 |
| 2011 |
| 2012 |
| 2013 |
| 2014 |
| 2015 |
| 2016 |
|
|
|
|
|
|
|
| ||||||||||
2007 | $ | - |
| $ | - |
| $ | - |
| $ | - |
| $ | - |
| $ | 5,225 |
| $ | 5,275 |
| $ | 5,345 |
| $ | 5,357 |
| $ | 5,350 |
|
|
|
|
|
|
|
|
2008 |
|
|
|
| - |
|
| - |
|
| - |
|
| - |
|
| 11,629 |
|
| 11,650 |
|
| 11,510 |
|
| 11,488 |
|
| 11,546 |
|
|
|
|
|
|
|
|
2009 |
|
|
|
|
|
|
| - |
|
| 3,734 |
|
| 3,752 |
|
| 8,620 |
|
| 8,853 |
|
| 8,974 |
|
| 9,932 |
|
| 10,045 |
|
|
|
|
|
|
|
|
2010 |
|
|
|
|
|
|
|
|
|
| 0 |
|
| 3,490 |
|
| 9,875 |
|
| 10,213 |
|
| 10,387 |
|
| 11,009 |
|
| 11,062 |
|
|
|
|
|
|
|
|
2011 |
|
|
|
|
|
|
|
|
|
|
|
|
| 4,160 |
|
| 43,342 |
|
| 71,010 |
|
| 71,677 |
|
| 71,954 |
|
| 72,094 |
|
|
|
|
|
|
|
|
2012 |
|
|
|
|
|
|
|
|
|
|
|
|
|
|
|
| 37,644 |
|
| 77,077 |
|
| 83,183 |
|
| 84,533 |
|
| 111,681 |
|
|
|
|
|
|
|
|
2013 |
|
|
|
|
|
|
|
|
|
|
|
|
|
|
|
|
|
|
| 53,375 |
|
| 82,558 |
|
| 90,567 |
|
| 98,271 |
|
|
|
|
|
|
|
|
2014 |
|
|
|
|
|
|
|
|
|
|
|
|
|
|
|
|
|
|
|
|
|
| 66,249 |
|
| 119,136 |
|
| 105,505 |
|
|
|
|
|
|
|
|
2015 |
|
|
|
|
|
|
|
|
|
|
|
|
|
|
|
|
|
|
|
|
|
|
|
|
| 41,620 |
|
| 64,316 |
|
|
|
|
|
|
|
|
2016 |
|
|
|
|
|
|
|
|
|
|
|
|
|
|
|
|
|
|
|
|
|
|
|
|
|
|
|
| 36,253 |
|
|
|
|
|
|
|
|
|
|
|
|
|
|
|
|
|
|
|
|
|
|
|
|
|
|
|
|
|
|
|
|
| Total |
| $ | 526,123 |
|
|
|
|
|
|
|
| |
|
|
|
|
|
|
|
|
|
|
|
|
|
|
|
|
|
|
|
|
|
|
|
|
| Net reserves < 2007 |
|
| 2,598 |
|
|
|
|
|
|
|
| |
|
|
|
|
|
|
|
|
|
|
|
|
|
|
|
|
|
|
|
|
|
|
|
|
| Total Net reserves |
| $ | 111,594 |
|
|
|
|
|
|
|
| |
|
|
|
|
|
|
|
|
|
|
|
|
|
|
|
|
|
|
|
|
|
|
|
|
|
|
|
|
|
|
|
|
|
|
|
|
|
|
| GlobalRe |
|
|
| ||||||||||||||||||||||||||||
| Average Annual Percentage Payout of Incurred Claims by Age, Net of Reinsurance |
|
|
| ||||||||||||||||||||||||||||
Years | 1 |
| 2 |
| 3 |
| 4 |
| 5 |
| 6 |
| 7 |
| 8 |
| 9 |
| 10 |
|
|
| ||||||||||
GlobalRe |
| 47.1 | % |
| 32.1 | % |
| 0.6 | % |
| 3.1 | % |
| 8.5 | % |
| 2.1 | % |
| 2.8 | % |
| 0.7 | % |
| 0.3 | % |
| -0.1 | % |
|
|
The reconciliation of the net incurred and paid claims development tables to the Reserve for losses and LAE in the consolidated statement of financial position is as follows:
F-31
|
| Carried Reserves Reconciliation |
| |||||||||
amounts in thousands |
| For the Year Ended December 31, 2016 |
| |||||||||
|
| Total Net reserves |
|
| Reinsurance recoverables on unpaid claims |
|
| Total Gross reserves |
| |||
U.S. Marine |
| $ | 106,288 |
|
| $ | 83,988 |
|
| $ | 190,276 |
|
U.S. P&C |
|
| 769,399 |
|
|
| 409,648 |
|
|
| 1,179,047 |
|
U.S. Professional Liability |
|
| 91,037 |
|
|
| 59,938 |
|
|
| 150,975 |
|
Int'l Marine |
|
| 196,532 |
|
|
| 88,900 |
|
|
| 285,432 |
|
Int'l P&C |
|
| 81,189 |
|
|
| 79,548 |
|
|
| 160,737 |
|
Int'l Professional Liability |
|
| 98,689 |
|
|
| 52,518 |
|
|
| 151,207 |
|
GlobalRe |
|
| 111,594 |
|
|
| 4,736 |
|
|
| 116,330 |
|
Liabilities for unpaid claims and claim adjustment expenses |
| $ | 1,454,728 |
|
|
| 779,276 |
|
| $ | 2,234,004 |
|
Unallocated claims adjustment expenses |
|
|
|
|
|
|
|
|
|
| 55,444 |
|
Other |
|
|
|
|
|
|
|
|
|
| 279 |
|
Total gross liability for unpaid claims and claim adjustment expense |
|
|
|
|
|
|
|
|
| $ | 2,289,727 |
|
|
|
|
|
|
|
|
|
|
|
|
|
|
NOTE 6. CEDED REINSURANCE
We utilize reinsurance principally to reduce our exposure on individual risks, to protect against catastrophic losses and to stabilize loss ratios and net underwriting results. Reinsurers are liable to us to the extent the risk is transferred or ceded to them. However, ceded reinsurance arrangements do not eliminate our obligation to pay claims to our policyholders. Accordingly, we bear credit risk with respect to our reinsurers.
We are protected by various treaty and facultative reinsurance agreements. Our exposure to credit risk from any one reinsurer is managed through diversification of reinsurers, principally in the U.S. and European reinsurance markets. A reinsurer generally must have a rating from A.M. Best and/or S&P of "A" or better, or an equivalent financial strength if not rated, plus at least $500 million in policyholders' surplus to meet our standards of acceptability. Our Reinsurance Security Committee, which is part of our Enterprise Risk Management Finance and Credit Sub-Committee of our Board of Directors, monitors the financial strength of our reinsurers and the related reinsurance recoverables and periodically reviews the list of acceptable reinsurers.
The following table lists our Company's 10 largest reinsurers measured by the amount of total reinsurance recoverables as of December 31, 2016, and the reinsurers' ratings from A.M. Best and S&P:
|
| Reinsurance Recoverables |
|
|
|
|
|
|
|
|
| |||||||||
|
| Unearned |
|
| Paid/Unpaid |
|
|
|
|
|
| Collateral |
|
|
|
|
| |||
amounts in thousands |
| Premium |
|
| Losses (1) |
|
| Total |
|
| Held |
|
| A.M. Best |
| S&P | ||||
Everest Reinsurance Company |
| $ | 25,321 |
|
| $ | 82,154 |
|
| $ | 107,475 |
|
| $ | 6,571 |
|
| A+ |
| A+ |
National Indemnity Company |
|
| 7,467 |
|
|
| 98,759 |
|
|
| 106,226 |
|
|
| 3,183 |
|
| A++ |
| AA+ |
Swiss Reinsurance America Corporation |
|
| 22,442 |
|
|
| 77,199 |
|
|
| 99,641 |
|
|
| 6,440 |
|
| A+ |
| AA- |
Transatlantic Reinsurance Company |
|
| 7,669 |
|
|
| 53,347 |
|
|
| 61,016 |
|
|
| 2,494 |
|
| A+ |
| A+ |
Munich Reinsurance America Inc. |
|
| 8,959 |
|
|
| 50,612 |
|
|
| 59,571 |
|
|
| 3,477 |
|
| A+ |
| AA- |
Allied World Reinsurance |
|
| 6,319 |
|
|
| 35,931 |
|
|
| 42,250 |
|
|
| 1,575 |
|
| A |
| A |
Employers Mutual Casualty Company |
|
| 8,856 |
|
|
| 32,687 |
|
|
| 41,543 |
|
|
| 5,551 |
|
| A |
| NR |
Aspen Insurance UK Ltd. |
|
| 11,281 |
|
|
| 22,737 |
|
|
| 34,018 |
|
|
| 5,452 |
|
| A |
| A |
Ace Property and Casualty Insurance Company |
|
| 10,192 |
|
|
| 22,352 |
|
|
| 32,544 |
|
|
| 2,722 |
|
| A++ |
| AA |
Partner Reinsurance Europe |
|
| 6,868 |
|
|
| 20,681 |
|
|
| 27,549 |
|
|
| 25,045 |
|
| A |
| A+ |
Top 10 |
| $ | 115,374 |
|
| $ | 496,459 |
|
| $ | 611,833 |
|
| $ | 62,510 |
|
|
|
|
|
All Others |
|
| 98,003 |
|
|
| 365,399 |
|
|
| 463,402 |
|
|
| 89,198 |
|
|
|
|
|
Total |
| $ | 213,377 |
|
| $ | 861,858 |
|
| $ | 1,075,235 |
|
| $ | 151,708 |
|
|
|
|
|
(1) - Net of reserve for uncollectible reinsurance of approximately $12.1 million.
Our Company holds reserves for uncollectible reinsurance in the amounts of $12.1 million and $6.9 million as of December 31, 2016 and 2015, respectively. This reserve is determined by reinsurer specific default risk as indicated by their financial strength ratings as
F-32
well as additional de fault risk for asbestos and environmental related recoverables. Actual uncollectible reinsurance could exceed or be less than our reserve balance. The increase in our reserves for uncollectible reinsurance as compared to 2015 is driven primarily by one of our reinsurers having been placed under supervision of a conservator by the State of California. We will continue to monitor the conservation process and assess our potential exposure.
Our Company holds collateral of $151.7 million, which consists of $109.0 million in ceded balances payable, $39.7 million in letters of credit and $3.0 million of funds held. NIC and NSIC are required to collateralize reinsurance obligations due to us from reinsurers not authorized by their respective states of domicile.
The following table summarizes the components of Net written premium:
|
| Years Ended December 31, |
| |||||||||
amounts in thousands |
| 2016 |
|
| 2015 |
|
| 2014 |
| |||
Direct |
| $ | 1,403,865 |
|
| $ | 1,277,728 |
|
| $ | 1,232,012 |
|
Assumed |
|
| 165,046 |
|
|
| 175,774 |
|
|
| 200,341 |
|
Ceded |
|
| (382,687 | ) |
|
| (409,642 | ) |
|
| (432,215 | ) |
Net written premiums |
| $ | 1,186,224 |
|
| $ | 1,043,860 |
|
| $ | 1,000,138 |
|
The following table summarizes the components of Net earned premium:
|
| Years Ended December 31, |
| |||||||||
amounts in thousands |
| 2016 |
|
| 2015 |
|
| 2014 |
| |||
Direct |
| $ | 1,330,265 |
|
| $ | 1,223,840 |
|
| $ | 1,183,120 |
|
Assumed |
|
| 171,978 |
|
|
| 175,153 |
|
|
| 193,431 |
|
Ceded |
|
| (401,898 | ) |
|
| (414,906 | ) |
|
| (440,656 | ) |
Net earned premiums |
| $ | 1,100,345 |
|
| $ | 984,087 |
|
| $ | 935,895 |
|
The following table summarizes the components of Net losses and LAE incurred:
|
| Years Ended December 31, |
| |||||||||
amounts in thousands |
| 2016 |
|
| 2015 |
|
| 2014 |
| |||
Direct |
| $ | 795,414 |
|
| $ | 703,361 |
|
| $ | 657,059 |
|
Assumed |
|
| 87,995 |
|
|
| 97,947 |
|
|
| 118,352 |
|
Ceded |
|
| (217,961 | ) |
|
| (228,710 | ) |
|
| (230,182 | ) |
Net losses and LAE |
| $ | 665,448 |
|
| $ | 572,598 |
|
| $ | 545,229 |
|
NOTE 7. DEBT
Credit Facilities
On November 4, 2016, NUAL entered into a credit facility for 14.0 million Australian Dollars with Barclays Bank PLC. Interest is payable under this facility at a rate of 1.25% per annum. The facility may be cancelled by either party after providing written notice. This credit facility contains customary covenants for facilities of this type, including a restriction on future encumbrances that are outside the ordinary course of business, and a requirement to maintain at least £75.0 million of Funds at Lloyd's. As of December 31, 2016, letters of credit with an aggregate face amount of 14.0 million Australian Dollars were outstanding under the credit facility, and our Company was in compliance with all covenants.
On November 7, 2016, we entered into a credit facility agreement with ING Bank N.V., London Branch, individually and as Administrative Agent and a syndicate of lenders (the "Club Facility"), which is secured by all the common stock of NIC and requires us to maintain at least forty percent of the outstanding amounts under such facility as Funds at Lloyd's. The Club Facility has two tranches with one tranche extending a $140.0 million commitment and the other tranche extending a £60.0 million commitment. In addition, in order to support the increased underwriting capacity of the Syndicate for the 2017 UWY, we amended that certain $25.0 million credit facility with ING Bank N.V., London Branch, dated November 20, 2015, on November 7, 2016, to extend the term for an additional two years (the "Bilateral Facility"). Both of these facilities, as well as the November 4, 2016 facility, are used to fund underwriting obligations at Lloyd's for the 2017 UWY, as well as open prior UWYs.
The Bilateral Facility is a non-committed facility which has an applicable fee rate ranging from 0.85% to 1.20% per annum based upon the Company's S&P rating. For the Club Facility the applicable fee rate payable ranges from 0.95% to 1.60% per annum based
F-33
on a tiered schedule that is based on our then-current financial strength ratings issued by S&P and A.M. Best and the amount of our own collateral utilized to fund our participation in the Syndicate. If any letters of credit remain outstanding under these facilities after December 31, 2018, we would be required to post additional collateral to secure the remaining letters of credit. As of December 31, 2016, letters of credit with an aggregate face amount of $125.0 million and £60.0 million were outstandin g under the Club Facility and we had an aggregate of $1.1 million of cash collateral posted. As of December 31, 2016 there were no letters of credit outstanding under the Bilateral Facility.
The Bilateral and Club Facilities contain customary covenants for facilities of this type, including restrictions on indebtedness and liens, limitations on mergers, dividends and the sale of assets, and requirements as to maintaining certain consolidated tangible net worth, statutory surplus and other financial ratios. These credit facilities also provide for customary events of default, including failure to pay principal, interest or fees when due, failure to comply with covenants, any representation or warranty made by our Company being false in any material respect, default under certain other indebtedness, certain insolvency or receivership events affecting our Company and our subsidiaries, the occurrence of certain material judgments, or a change in control of our Company. As of December 31, 2016, our Company was in compliance with all covenants.
Senior notes
On October 4, 2013, our Company completed a public debt offering of $265.0 million principal amount of the 5.75% Senior notes and received net proceeds of $263.3 million. Our Company used a portion of the proceeds for the redemption of the 7.0% Senior notes due May 1, 2016 ("7.0% Senior notes"), as well as a $17.9 million call premium in connection with the redemption of the 7.0% Senior notes. The unamortized discount as of December 31, 2016 and 2015 was $1.3 million and $1.4 million, respectively.
The interest rate payable on the 5.75% Senior notes is subject to a tiered adjustment based on defined changes in our Company's debt ratings. Our Company may redeem the 5.75% Senior notes in whole at any time or in part from time to time at a make-whole redemption price. The 5.75% Senior notes are our Company's only senior unsecured obligation and will rank equally with future senior unsecured indebtedness.
The terms of the 5.75% Senior notes contain various restrictive business and financial covenants, including a restriction on indebtedness, and other restrictions typical for debt obligations of this type, including limitations on mergers, liens and dispositions of the Common stock of certain subsidiaries. As of December 31, 2016, our Company was in compliance with all such covenants.
NOTE 8. COMMITMENT AND CONTINGENCIES
Future minimum annual rental commitments as of December 31, 2016 under various non-cancellable operating leases for our office facilities, which expire at various dates through 2030, are as follows:
Rental Commitments for Years Ended December 31, |
| |||
amounts in thousands |
|
|
|
|
2017 |
| $ | 13,024 |
|
2018 |
|
| 11,843 |
|
2019 |
|
| 9,107 |
|
2020 |
|
| 8,945 |
|
2021 |
|
| 7,684 |
|
2022-2030 |
|
| 38,267 |
|
Total minimum operating lease payments |
| $ | 88,870 |
|
We are also liable for additional payments to the landlords for certain annual cost increases. Rent expense for the years ended December 31, 2016, 2015 and 2014 was $13.2 million, $12.9 million and $13.2 million, respectively.
In 2013, the State of Connecticut ("the State") awarded our Company up to $11.5 million ($8.0 million in loans and $3.5 million in grants) to move our corporate headquarters to Stamford, Connecticut. The loan is non-interest bearing, has a term of 10 years and is subject to forgiveness based on our compliance with certain conditions set forth in the agreement with the State. The amount of the loan to be received is dependent on our Company reaching certain milestones for creation of new jobs over a five-year period, and the funds are to be used to offset certain equipment purchases, facility costs, training of employees and other eligible project-related costs. As of December 31, 2016, our Company received $9.0 million of the award ($7.0 million in loans and $2.0 million of the grant) and earned a loan forgiveness credit of $6.0 million with the State . Our Company is recognizing the amount of loan and grants received over the period in which offsetting expenses are recognized. Our Company recognized $1.4 million, $1.4 million and $1.1 million for the years ended December 31, 2016, 2015 and 2014. As of December 31, 2016 and December 31, 2015, our Company has
F-34
deferred revenue of $4.8 million and $6.3 million, respectively, which is included in Other liabilities on the Consolidated Balance Sheets.
On February 16, 2017, our Company entered into a Guarantee, pursuant to which it guaranteed all of the liabilities and obligations of NIIC (the "Guarantee"), to facilitate the issuance of a financial strength rating to NIIC by A.M. Best. The Guarantee would remain effective until all of such liabilities and obligations are discharged, and in the event that our Company does not meet its obligations under the Guarantee, any person who is covered by an insurance policy, certificate of coverage or reinsurance contract issued by NIIC would be a third party beneficiary under the Guarantee. Our Company's obligations under the Guarantee may be terminated by providing twelve months prior written notice to NIIC. However the obligations of our Company under the Guarantee terminate immediately in the event that (i) the majority of the outstanding voting capital stock in NIIC is sold to any non-affiliated entity; (ii) A.M. Best confirms that NIIC would receive the same financial strength rating as NIC or NSIC, without the benefit of the Guarantee; or (iii) NIIC withdraws its request to be rated by A.M. Best, provided that NIIC has not been downgraded within the prior twelve months.
In the ordinary course of conducting business, our Parent Company's subsidiaries are involved in various legal proceedings. Most of these proceedings consist of claims litigation involving our Parent Company's subsidiaries as either: (a) liability insurers defending or providing indemnity for third party claims brought against insureds or (b) insurers defending first party coverage claims brought against them. In general, our Company believes we have valid defenses to these cases. Our Company's management believes that the ultimate liability, if any, with respect to these legal proceedings, after consideration of provisions made for potential losses and cost of defense, will not be material to our Company's Consolidated Balance Sheets, Statements of Income and Statements of Cash Flows.
NOTE 9. INCOME TAXES
Our Company is subject to the tax laws and regulations of the U.S. and the foreign countries in which it operates. Our Company files a consolidated U.S. Federal tax return, which includes all domestic subsidiaries and the U.K. Branch. The income from the foreign operations is designated as either U.S. connected income or non-U.S. connected income. Lloyd's is required to pay U.S. income tax on U.S. connected income written by Lloyd's syndicates. Lloyd's and the Internal Revenue Service ("IRS") have entered into an agreement whereby the amount of tax due on U.S. connected income is calculated by Lloyd's and remitted directly to the IRS. These amounts are then charged to the corporate member in proportion to its participation in the relevant syndicates. Our Company's corporate member is subject to this agreement and receives U.K. tax credits in the U.K. for any U.S. income tax incurred up to the U.K. income tax charged on the U.S. connected income. The non-U.S. connected insurance income would generally constitute taxable income under the Subpart F income section of the U.S. Internal Revenue Code ("Subpart F") since less than 50% of the Syndicate's premiums are derived within the U.K. and would therefore be subject to U.S. taxation when the Lloyd's year of account closes. Taxes are accrued at a 35% rate on our Company's foreign source insurance income and foreign tax credits, where available, are utilized to offset U.S. tax as permitted. Our Company's effective tax rate for the Syndicate taxable income could substantially exceed 35% to the extent our Company is unable to offset U.S. taxes paid under Subpart F tax regulations with U.K. tax credits on future underwriting year distributions. U.S. taxes are not accrued on the earnings of our Company's foreign agencies as these earnings are subject to the active financing exception and are not includable as Subpart F income.
The components of current and deferred income tax expense (benefit) are as follows:
|
| Years Ended December 31, |
| |||||||||
amounts in thousands |
| 2016 |
|
| 2015 |
|
| 2014 |
| |||
Current income tax expense (benefit): |
|
|
|
|
|
|
|
|
|
|
|
|
Federal and foreign |
| $ | 39,900 |
|
| $ | 27,937 |
|
| $ | 27,290 |
|
State and local |
|
| 638 |
|
|
| 1,476 |
|
|
| 1,036 |
|
Subtotal |
| $ | 40,538 |
|
| $ | 29,413 |
|
| $ | 28,326 |
|
Deferred income tax expense (benefit): |
|
|
|
|
|
|
|
|
|
|
|
|
Federal and foreign |
| $ | (5,755 | ) |
| $ | 7,004 |
|
| $ | 16,881 |
|
State and local |
|
| - |
|
|
| - |
|
|
| - |
|
Subtotal |
| $ | (5,755 | ) |
| $ | 7,004 |
|
| $ | 16,881 |
|
Total income tax expense (benefit) |
| $ | 34,783 |
|
| $ | 36,417 |
|
| $ | 45,207 |
|
F-35
A reconciliation of total income taxes applicable to pre ‑tax operating income and the amounts computed by applying the federal statutory income ta x rate to the pre ‑tax operating income were as follows:
|
| Years Ended December 31, |
| |||||||||||||||||||||
amounts in thousands |
| 2016 |
|
| 2015 |
|
| 2014 |
| |||||||||||||||
Computed expected tax expense |
| $ | 41,128 |
|
|
| 35.0 | % |
| $ | 41,116 |
|
|
| 35.0 | % |
| $ | 49,187 |
|
|
| 35.0 | % |
Tax-exempt interest |
|
| (4,559 | ) |
|
| -3.9 | % |
|
| (4,987 | ) |
|
| -4.2 | % |
|
| (4,771 | ) |
|
| -3.4 | % |
Dividends received deduction |
|
| (3,812 | ) |
|
| -3.2 | % |
|
| (2,086 | ) |
|
| -1.8 | % |
|
| (1,257 | ) |
|
| -0.9 | % |
Proration of DRD and Tax-exempt interest |
|
| 1,256 |
|
|
| 1.1 | % |
|
| 1,061 |
|
|
| 0.9 | % |
|
| 904 |
|
|
| 0.6 | % |
Current state and local income taxes, net of federal income tax deduction |
|
| 415 |
|
|
| 0.4 | % |
|
| 959 |
|
|
| 0.8 | % |
|
| 674 |
|
|
| 0.5 | % |
Other |
|
| 355 |
|
|
| 0.2 | % |
|
| 354 |
|
|
| 0.3 | % |
|
| 470 |
|
|
| 0.4 | % |
Actual tax expense and rate |
| $ | 34,783 |
|
|
| 29.6 | % |
| $ | 36,417 |
|
|
| 31.0 | % |
| $ | 45,207 |
|
|
| 32.2 | % |
The tax effects of cumulative temporary differences that give rise to federal, foreign, state and local deferred tax assets and deferred tax liabilities were as follows:
|
| December 31, |
| |||||
amounts in thousands |
| 2016 |
|
| 2015 |
| ||
Deferred tax assets: |
|
|
|
|
|
|
|
|
Loss reserve discount |
| $ | 25,420 |
|
| $ | 25,353 |
|
Unearned premiums |
|
| 33,886 |
|
|
| 31,486 |
|
Compensation related |
|
| 15,288 |
|
|
| 11,175 |
|
State and local net deferred tax assets |
|
| 699 |
|
|
| 721 |
|
Net currency translation adjustments |
|
| 5,363 |
|
|
| 346 |
|
Other |
|
| 3,618 |
|
|
| 3,969 |
|
Total gross deferred tax assets |
|
| 84,274 |
|
|
| 73,050 |
|
Less: Valuation allowance |
|
| (699 | ) |
|
| (721 | ) |
Total deferred tax assets |
| $ | 83,575 |
|
| $ | 72,329 |
|
Deferred tax liabilities: |
|
|
|
|
|
|
|
|
Net unrealized gains/losses on securities |
| $ | (10,142 | ) |
| $ | (13,053 | ) |
Deferred acquisition costs |
|
| (29,401 | ) |
|
| (24,037 | ) |
Lloyd's year of account deferral |
|
| (15,471 | ) |
|
| (24,466 | ) |
Net unrealized foreign exchange |
|
| (3,575 | ) |
|
| (4,164 | ) |
Other |
|
| (4,048 | ) |
|
| (2,709 | ) |
Total deferred tax liabilities |
| $ | (62,637 | ) |
| $ | (68,429 | ) |
Net deferred income tax asset (liability) |
| $ | 20,938 |
|
| $ | 3,900 |
|
Our Company has not provided for U.S. income taxes on approximately $156.6 million of undistributed earnings of our non-U.S. subsidiaries since it is intended that those earnings will be reinvested indefinitely in those subsidiaries. If a future determination is made that those earnings no longer are intended to be reinvested indefinitely in those subsidiaries, U.S. income taxes of approximately $2.7 million, assuming all foreign tax credits are realized, would be included in the tax provision at that time and would be payable if those earnings were distributed to our Company.
Unrecognized tax benefits are differences between tax positions taken in the tax returns and benefits recognized in the financial statements. Our Company has no unrecognized tax benefits as of December 31, 2016, 2015 and 2014. Our Company did not incur any interest or penalties related to unrecognized tax benefits for the years ended December 31, 2016, 2015 and 2014. Our Company is not currently under examination by the IRS; however is generally subject to U.S. Federal, state or local or foreign tax examinations by tax authorities for 2009 and subsequent years.
Our Company had state and local deferred tax assets amounting to potential future tax benefits of $0.7 million as of December 31, 2016 and 2015. Included in the deferred tax assets are minimal state and local net operating loss carry-forwards. A valuation allowance was established for the full amount of these potential future tax benefits due to the uncertainty associated with their realization. Our Company's state and local tax carry-forwards as of December 31, 2016 expire from 2026 to 2034.
In assessing the realization of deferred tax assets, management considers whether it is more likely than not that, the deferred tax assets will be realized. The ultimate realization of deferred tax assets is dependent upon the generation of future taxable income during the
F-36
periods in which those temporary differences become deductible. Management considers the scheduled reversal of deferred tax liabilities, tax planning strategies and anticipated future taxable income in making this assessment and believes it is more likely than not that our Company will realize the benefits of its deductible differences as of December 31, 2016, net of any valuation allowance.
NOTE 10. STOCKHOLDERS' EQUITY
Our authorized share capital consists of 50,000,000 common shares with a par value of $0.10 per share and 1,000,000 preferred shares with a par value of $0.10 per share. Our Company has not issued any preferred shares as of December 31, 2016.
The following table represents changes in our Company's issued and outstanding common shares for the periods indicated. We completed a two-for-one stock split on January 20, 2017. All share and per share data has been retroactively restated on a post-split basis.
|
| Years Ended December 31, |
| |||||||||
amounts in thousands |
| 2016 |
|
| 2015 |
|
| 2014 |
| |||
Beginning balance |
|
| 28,862 |
|
|
| 28,562 |
|
|
| 28,396 |
|
Vested stock grants |
|
| 220 |
|
|
| 254 |
|
|
| 118 |
|
Employee stock purchase plan |
|
| 42 |
|
|
| 42 |
|
|
| 38 |
|
Stock options exercised |
|
| - |
|
|
| 4 |
|
|
| 10 |
|
Ending balance |
|
| 29,124 |
|
|
| 28,862 |
|
|
| 28,562 |
|
On December 6, 2016, our Board of Directors declared a two-for-one stock split of The Navigators Group, Inc. Common stock, to be effected in the form of a stock dividend. Stockholders of record at the close of business on December 30, 2016 received one additional share of Common stock for every share of Common stock held. All disclosures of shares and per share data have been retroactively adjusted to reflect the stock split for all periods presented.
On July 15, September 30, and December 29, 2016, our Company paid dividends of $0.045 per share to stockholders of record of our Company's Common stock as of June 20, August 19, and November 18, 2016, respectively.
The declaration and amount of any future dividend will be at the discretion of the Board of Directors, and will depend upon our Company's financial condition, results of operations, business requirements, regulatory and legal constraints and any other factors the Board of Directors deems relevant. Refer to Footnote 16 – Subsequent Events.
NIC may pay dividends to our Parent Company out of its statutory earned surplus pursuant to statutory restrictions imposed under the New York insurance law. As of December 31, 2016, the maximum amount available for the payment of dividends by NIC without prior regulatory approval is $102.7 million. NIC paid a dividend to our Parent Company of $5.0 million in 2016. NIC did not pay any dividends to our Parent Company in 2015.
NCUL may pay dividends to our Parent Company up to the extent of available profits that have been distributed from the Syndicate. The Syndicate's capital and surplus as filed with Lloyd's consists of undistributed profits on closed and open UWYs. In connection with the business plan approved in November 2015, NCUL posted all of the available undistributed profits on closed years of $141.9 million to support a portion of the FAL requirement and therefore that amount is not available for distribution to NCUL, which ultimately is not available to our Parent Company in the form of a dividend. As of December 31, 2016, NCUL has the ability to pay up to $3.0 million, consisting of distributed profits on closed UWYs from the Syndicate, to the Parent Company in the form of dividends.
F-37
The amount and nature of net assets that are restricted from payment of dividends as of December 31, 2016 and 2015 are presented in the following table:
|
| As of December 31, |
| |||||
amounts in thousands |
| 2016 |
|
| 2015 |
| ||
Restricted net assets: |
|
|
|
|
|
|
|
|
NIC and NSIC: |
|
|
|
|
|
|
|
|
Fixed maturities at fair value (amortized cost: 2016, $9,820; 2015, $9,950) |
| $ | 10,690 |
|
| $ | 11,277 |
|
Short term investments, at fair value |
|
| 290 |
|
|
| 290 |
|
Cash |
|
| 7,168 |
|
|
| 6,208 |
|
Total NIC and NSIC (1) |
| $ | 18,148 |
|
| $ | 17,775 |
|
NHUK: |
|
|
|
|
|
|
|
|
Fixed maturities at fair value (amortized cost: 2016, $457,225; 2015, $458,558) |
| $ | 452,053 |
|
| $ | 448,666 |
|
Short term investments, at fair value |
|
| 63,729 |
|
|
| 71,320 |
|
Cash |
|
| - |
|
|
| 3,262 |
|
Total NHUK (2) |
| $ | 515,782 |
|
| $ | 523,248 |
|
Total Restricted Net Assets |
| $ | 533,930 |
|
| $ | 541,023 |
|
(1) - The restricted net assets for NIC and NSIC primarily consist of fixed maturities on deposit with various state insurance departments. The cash as of December 31, 2016 and 2015, as presented in the table above, was on deposit with a U.K. bank to comply with the regulatory requirements of the Prudential Regulation Authority for the underwriting activities of the U.K. Branch.
(2) - The restricted net assets for NHUK consists of fixed maturities and cash held in trust for the benefit of syndicate policyholders and short term investments primarily consisting of overseas deposits in various countries with Lloyd's to support underwriting activities in those countries.
NOTE 11. EARNINGS PER SHARE
The following is a reconciliation of the basic and diluted EPS computations for the years ended December 31, 2016, 2015 and 2014:
|
| Years Ended December 31, |
| |||||||||
amounts in thousands, except share and per share amounts |
| 2016 |
|
| 2015 |
|
| 2014 |
| |||
Net income |
| $ | 82,726 |
|
| $ | 81,057 |
|
| $ | 95,329 |
|
Basic weighted average shares (1) |
|
| 29,073,803 |
|
|
| 28,785,044 |
|
|
| 28,519,536 |
|
Effect of common stock equivalents: |
|
|
|
|
|
|
|
|
|
|
|
|
Assumed exercise of stock options and vesting of stock grants |
|
| 957,806 |
|
|
| 866,446 |
|
|
| 773,202 |
|
Diluted weighted average shares |
|
| 30,031,609 |
|
|
| 29,651,490 |
|
|
| 29,292,738 |
|
Net income per common share: |
|
|
|
|
|
|
|
|
|
|
|
|
Basic |
| $ | 2.85 |
|
| $ | 2.82 |
|
| $ | 3.34 |
|
Diluted |
| $ | 2.75 |
|
| $ | 2.73 |
|
| $ | 3.25 |
|
(1) - We completed a two-for-one stock split on January 20, 2017. All share and per share data has been retroactively restated on a post-split basis.
NOTE 12. STATUTORY FINANCIAL INFORMATION
The following table presents statutory Net income and capital and surplus in accordance with statutory accounting practices:
|
| Years Ended December 31, |
| |||||||||
amounts in millions |
| 2016 |
|
| 2015 |
|
| 2014 |
| |||
NIC & NSIC: |
|
|
|
|
|
|
|
|
|
|
|
|
Statutory net income |
| $ | 84.2 |
|
| $ | 60.8 |
|
| $ | 75.7 |
|
Statutory capital and surplus |
| $ | 1,027.3 |
|
| $ | 949.1 |
|
| $ | 893.9 |
|
|
|
|
|
|
|
|
|
|
|
|
|
|
The Syndicate: |
|
|
|
|
|
|
|
|
|
|
|
|
Syndicate's net income |
| $ | 46.3 |
|
| $ | 41.0 |
|
| $ | 33.8 |
|
Syndicate's capital and surplus |
| $ | 180.7 |
|
| $ | 177.5 |
|
| $ | 140.1 |
|
Our insurance subsidiaries file financial statements prepared in accordance with statutory accounting practices prescribed or permitted by domestic and foreign insurance regulatory authorities. The differences between statutory financial statements and financial statements prepared in accordance with U.S. GAAP vary between domestic and foreign jurisdictions.
F-38
For NIC and NSIC, the National Association of Insuranc e Commissioners ("NAIC") has codified Statutory Accounting Practices and Procedures ("SAP") for insurance enterprises. We prepare our statutory basis financial statements in accordance with the most recently updated NAIC SAP manual subject to any deviation s prescribed or permitted by the New York Insurance Commissioner. The following table represents some of the significant differences between SAP and U.S. GAAP as they relate to our operations:
Differences | SAP | U.S. GAAP |
Acquisition and Commission Costs | Expensed when incurred | Costs are generally deferred |
Bonds | Generally stated at amortized cost | Stated at fair value |
Deferred tax assets | Certain temporary differences are not admitted | All temporary differences recognized |
Receivables over 90 days outstanding and other intangible assets | Not recognized | Generally recognized (subject to valuation allowances) |
Unearned premiums and loss reserves | Net of ceded amounts | Gross of ceded amounts |
The Syndicate is subject to oversight by the Council of Lloyd's. Lloyd's as a whole is authorized and regulated by the PRA. Our other international businesses are also regulated by the PRA. The following table represents some of the significant differences between U.K. GAAP and U.S. GAAP as they relate to our operations:
Differences | U.K. GAAP | U.S. GAAP |
Unrealized gains/losses | Recognized in income | Recognized in AOCI |
Foreign exchange gains/losses on translation | Recognized in income | Recognized in AOCI |
Lloyd's membership costs | Expensed when incurred | Amortized over each UWY |
Refer to Note 1, Organization and Summary of Significant Accounting Policies , for additional disclosure on the accounting treatment for the Syndicate as it relates to closed and open UWYs.
For NIC and NSIC, aggregate minimum required statutory capital and surplus is based on the greater of the risk-based capital level that would trigger regulatory action or minimum requirements per state insurance regulation. Capital and surplus requirements of our foreign subsidiaries differ from those prescribed in the U.S. and vary by jurisdiction. The capital requirement of the Syndicate, known as FAL, is currently calculated using the internal Lloyd's risk-based capital model. The FAL may be comprised of cash, investments and undrawn letters of credit provided by various banks. Lloyd's sets the corporate member's required capital annually based on the Syndicate business plans, rating environment, reserving environment and input arising from Lloyd's discussions with regulatory and rating agencies.
As of December 31, 2016 and 2015, all insurance subsidiaries individually exceed the minimum required statutory capital and surplus requirements and all U.S. domestic insurance subsidiaries individually exceeded risk-based capital minimum requirements.
NOTE 13. STOCK-BASED COMPENSATION
As of December 31, 2016, there were 2,000,000 available restricted shares in the Second Amended and Restated 2005 Stock Incentive Plan. As of December 31, 2016, 1,531,058 of such awards were issued leaving 468,942 awards available to be issued in subsequent periods.
Stock-based compensation granted under our Company's stock plans is expensed in tranches over the vesting period. Options and non-performance based grants generally vest equally over a three or four year period and the options have a maximum term of ten years. Our Company's performance based share grants generally consist of three types of awards. The performance units issued in 2016, 2015 and 2014 will cliff vest on the third anniversary of the date of the grant in an amount as determined by the rate of cumulative annual growth in tangible book value for the three years immediately prior to the vesting date, with actual shares that vest ranging between 150% to 50% of that portion of the original award.
F-39
Unv ested restricted stock units and performance units outstanding as of December 31, 2016, 2015 and 2014, and changes during the years ended on those dates, are presented in the following table:
|
| December 31, |
| |||||||||
|
| 2016 |
|
| 2015 |
|
| 2014 |
| |||
Beginning balance |
|
| 1,393,030 |
|
|
| 1,437,784 |
|
|
| 1,253,624 |
|
|
|
|
|
|
|
|
|
|
|
|
|
|
Granted - Performance |
|
| 404,946 |
|
|
| 370,100 |
|
|
| 457,214 |
|
Granted - Non Performance |
|
| 84,000 |
|
|
| 64,316 |
|
|
| 119,046 |
|
Total Granted |
|
| 488,946 |
|
|
| 434,416 |
|
|
| 576,260 |
|
|
|
|
|
|
|
|
|
|
|
|
|
|
Vested - Performance |
|
| (285,208 | ) |
|
| (136,160 | ) |
|
| (186,906 | ) |
Vested - Non Performance |
|
| (55,000 | ) |
|
| (271,200 | ) |
|
| (180,526 | ) |
Total Vested |
|
| (340,208 | ) |
|
| (407,360 | ) |
|
| (367,432 | ) |
|
|
|
|
|
|
|
|
|
|
|
|
|
Forfeited |
|
| (167,604 | ) |
|
| (71,810 | ) |
|
| (24,668 | ) |
|
|
|
|
|
|
|
|
|
|
|
|
|
Ending balance |
|
| 1,374,164 |
|
|
| 1,393,030 |
|
|
| 1,437,784 |
|
As of December 31, 2016 and 2015, the total unrecognized compensation expense, net of estimated forfeitures, related to unvested stock units was $22.3 million and $17.3 million, respectively, which is expected to be recognized as expense over weighted average periods of 1.8 years and 2.0 years, respectively. The aggregate fair value of all unvested restricted stock units as of December 31, 2016 and 2015 was $87.2 million and $55.2 million, respectively. The aggregate fair value will not change after the stock split, as shares will be doubled and the price per share will be halved.
Stock options outstanding as of December 31, 2016, 2015 and 2014 are as follows:
|
| December 31, |
| |||||||||||||||||||||
|
| 2016 (1) |
|
| 2015 |
|
| 2014 |
| |||||||||||||||
|
|
|
|
|
| Average |
|
|
|
|
|
| Average |
|
|
|
|
|
| Average |
| |||
|
| # of Shares |
|
| Exercise Price |
|
| # of Shares |
|
| Exercise Price |
|
| # of Shares |
|
| Exercise Price |
| ||||||
Beginning balance |
|
| - |
|
| $ | - |
|
|
| 1,500 |
|
| $ | 36.03 |
|
|
| 6,750 |
|
| $ | 30.65 |
|
Granted |
|
| - |
|
|
| - |
|
|
| - |
|
|
| - |
|
|
| - |
|
|
| - |
|
Exercised |
|
| - |
|
| $ | - |
|
|
| (1,500 | ) |
| $ | 36.03 |
|
|
| (5,250 | ) |
| $ | 29.11 |
|
Expired or forfeited |
|
| - |
|
|
| - |
|
|
| - |
|
|
| - |
|
|
| - |
|
|
| - |
|
Ending balance |
|
| - |
|
| $ | - |
|
|
| - |
|
| $ | - |
|
|
| 1,500 |
|
| $ | 36.03 |
|
Number of options exercisable |
|
| - |
|
| $ | - |
|
|
| - |
|
| $ | - |
|
|
| 1,500 |
|
| $ | 36.03 |
|
(1) – Our company has not recently issued stock options and does not currently have any options outstanding.
We offer an Employee Stock Purchase Plan (the "ESPP") to all of our eligible employees. Employees are offered the opportunity to purchase our Company's Common stock at 90% of fair market value at the lower of the price at the beginning or the end of each six month offering period. Each employee can invest up to 10% of their base compensation subject to the lesser of 1,000 common stock shares or total market value of $25,000. There were 41,224 shares purchased in 2016 from funds withheld during the July 1, 2015 to December 31, 2015 and January 1, 2016 to June 30, 2016 offering periods. There were 41,714 shares purchased in 2015 in the aggregate from funds withheld during the offering periods of July 1, 2014 to December 31, 2014 and January 1, 2015 to June 30, 2015. We expense both the value of the 10% discount and the "look-back" option, which provides for the more favorable price at either the beginning or end of the offering period.
NOTE 14. RETIREMENT PLANS
We have a 401(k) Plan for all U.S. eligible employees. Each eligible employee can contribute a portion of their salary, limited by certain Federal regulations. The expense recorded for all contributions to the 401(k) Plan for the year ended December 31, 2016 was $7.4 million, consisting of $4.2 million for the retirement savings contributions and $3.2 million for the non-discretionary matching contributions. The expense recorded for all contributions to the 401(k) Plan for the year ended December 31, 2015 was $6.3 million, consisting of $3.8 million for the retirement savings contributions and $2.5 million for the non-discretionary matching contributions. The expense recorded for all contributions to the 401(k) Plan for the year ended December 31, 2014 was $7.5 million, consisting of $3.8 million for the retirement savings contributions, $2.1 million for the non-discretionary matching contributions and $1.6 million for the discretionary matching contribution.
F-40
Our Company sponsors a defined contribution pl an for all of our Company's U.K. employees under U.K. regulations. Contributions, which are fully vested when made, are equal to 15.0% of each eligible employee's gross base salary for all U.K. employees hired prior to November 2014 and 12.0% for all empl oyees hired after November 2014. The expense recorded for the U.K. defined contribution plan was $2.9 million, $2.9 million and $2.6 million for the years ended December 31, 2016, 2015 and 2014, respectively.
Our Company sponsors defined contribution plans for employees in several of our other European offices, outside of the U.K., under each countries' regulations. Contributions, which are fully vested when made, range by European office between 2.1% and 26.0% of each eligible employee's gross base salary. The expense recorded for the other European offices defined contribution plans was $0.5 million, $0.5 million and $0.2 million for the years ended December 31, 2016, 2015 and 2014, respectively.
Such expenses are included in Other operating expenses.
NOTE 15. CONDENSED (Unaudited) QUARTERLY FINANCIAL DATA
The following is a summary of quarterly financial data for the periods indicated:
|
| March 31, |
|
| June 30, |
|
| September 30, |
|
| December 31, |
| ||||
amounts in thousands, except per share amounts |
| 2016 |
|
| 2016 |
|
| 2016 |
|
| 2016 |
| ||||
Gross written premiums |
| $ | 413,877 |
|
| $ | 412,565 |
|
| $ | 374,930 |
|
| $ | 367,539 |
|
Revenues: |
|
|
|
|
|
|
|
|
|
|
|
|
|
|
|
|
Net written premiums |
| $ | 319,820 |
|
| $ | 306,535 |
|
| $ | 277,001 |
|
| $ | 282,868 |
|
Change in unearned premiums |
|
| (55,462 | ) |
|
| (38,543 | ) |
|
| 7,009 |
|
|
| 1,117 |
|
Net earned premiums |
| $ | 264,358 |
|
| $ | 267,992 |
|
| $ | 284,010 |
|
| $ | 283,985 |
|
Net investment income |
|
| 19,594 |
|
|
| 19,875 |
|
|
| 19,875 |
|
|
| 20,107 |
|
Total other-than-temporary impairment losses |
|
| (109 | ) |
|
| (162 | ) |
|
| 23 |
|
|
| 21 |
|
Portion of loss recognized in other comprehensive income (before tax) |
|
| 109 |
|
|
| 12 |
|
|
| (23 | ) |
|
| (21 | ) |
Net other-than-temporary impairment losses recognized in earnings |
|
| - |
|
|
| (150 | ) |
|
| - |
|
|
| - |
|
Net realized gains (losses) |
|
| 1,597 |
|
|
| 1,960 |
|
|
| 1,586 |
|
|
| 4,043 |
|
Other income (expense) |
|
| 2,549 |
|
|
| 4,430 |
|
|
| (183 | ) |
|
| 1,905 |
|
Total revenues |
| $ | 288,098 |
|
| $ | 294,107 |
|
| $ | 305,288 |
|
| $ | 310,040 |
|
|
|
|
|
|
|
|
|
|
|
|
|
|
|
|
|
|
Expenses: |
|
|
|
|
|
|
|
|
|
|
|
|
|
|
|
|
Net losses and LAE |
| $ | 152,956 |
|
| $ | 167,206 |
|
| $ | 172,793 |
|
| $ | 172,493 |
|
Commission expenses |
|
| 37,554 |
|
|
| 40,726 |
|
|
| 42,611 |
|
|
| 44,154 |
|
Other operating expenses |
|
| 60,809 |
|
|
| 59,074 |
|
|
| 56,137 |
|
|
| 58,076 |
|
Interest expense |
|
| 3,858 |
|
|
| 3,858 |
|
|
| 3,859 |
|
|
| 3,860 |
|
Total expenses |
| $ | 255,177 |
|
| $ | 270,864 |
|
| $ | 275,400 |
|
| $ | 278,583 |
|
Income before income taxes |
|
| 32,921 |
|
|
| 23,243 |
|
|
| 29,888 |
|
|
| 31,457 |
|
Income tax expense |
| $ | 9,989 |
|
| $ | 7,053 |
|
| $ | 7,875 |
|
| $ | 9,866 |
|
Net income |
| $ | 22,932 |
|
| $ | 16,190 |
|
| $ | 22,013 |
|
| $ | 21,591 |
|
|
|
|
|
|
|
|
|
|
|
|
|
|
|
|
|
|
Comprehensive income (loss) |
| $ | 45,721 |
|
| $ | 35,228 |
|
| $ | 18,760 |
|
| $ | (31,712 | ) |
|
|
|
|
|
|
|
|
|
|
|
|
|
|
|
|
|
Combined ratio |
|
| 95.1 | % |
|
| 99.6 | % |
|
| 95.6 | % |
|
| 96.7 | % |
Net income per share: (1) |
|
|
|
|
|
|
|
|
|
|
|
|
|
|
|
|
Basic |
| $ | 0.79 |
|
| $ | 0.56 |
|
| $ | 0.76 |
|
| $ | 0.74 |
|
Diluted |
| $ | 0.77 |
|
| $ | 0.54 |
|
| $ | 0.73 |
|
| $ | 0.71 |
|
(1) - We completed a two-for-one stock split on January 20, 2017. All share and per share data has been retroactively restated on a post-split basis.
F-41
|
| March 31, |
|
| June 30, |
|
| September 30, |
|
| December 31, |
| ||||
amounts in thousands, except per share amounts |
| 2015 |
|
| 2015 |
|
| 2015 |
|
| 2015 |
| ||||
Gross written premiums |
| $ | 396,460 |
|
| $ | 379,471 |
|
| $ | 354,062 |
|
| $ | 323,509 |
|
Revenues: |
|
|
|
|
|
|
|
|
|
|
|
|
|
|
|
|
Net written premiums |
| $ | 288,958 |
|
| $ | 258,244 |
|
| $ | 251,939 |
|
| $ | 244,719 |
|
Change in unearned premiums |
|
| (52,826 | ) |
|
| (15,916 | ) |
|
| 2,143 |
|
|
| 6,826 |
|
Net earned premiums |
| $ | 236,132 |
|
| $ | 242,328 |
|
| $ | 254,082 |
|
| $ | 251,545 |
|
Net investment income |
|
| 16,253 |
|
|
| 16,595 |
|
|
| 17,371 |
|
|
| 18,499 |
|
Total other-than-temporary impairment losses |
|
| - |
|
|
| (423 | ) |
|
| (1,298 | ) |
|
| (123 | ) |
Portion of loss recognized in other comprehensive income (before tax) |
|
| - |
|
|
| - |
|
|
| 23 |
|
|
| 123 |
|
Net other-than-temporary impairment losses recognized in earnings |
|
| - |
|
|
| (423 | ) |
|
| (1,275 | ) |
|
| - |
|
Net realized gains |
|
| 5,596 |
|
|
| 4,339 |
|
|
| 518 |
|
|
| (2,080 | ) |
Other income (expense) |
|
| 2,242 |
|
|
| (4,362 | ) |
|
| (2,518 | ) |
|
| 4,147 |
|
Total revenues |
| $ | 260,223 |
|
| $ | 258,477 |
|
| $ | 268,178 |
|
| $ | 272,111 |
|
|
|
|
|
|
|
|
|
|
|
|
|
|
|
|
|
|
Expenses: |
|
|
|
|
|
|
|
|
|
|
|
|
|
|
|
|
Net losses and LAE |
| $ | 130,198 |
|
| $ | 141,973 |
|
| $ | 146,546 |
|
| $ | 153,881 |
|
Commission expenses |
|
| 32,905 |
|
|
| 31,480 |
|
|
| 34,253 |
|
|
| 31,339 |
|
Other operating expenses |
|
| 54,909 |
|
|
| 52,789 |
|
|
| 56,599 |
|
|
| 59,219 |
|
Interest expense |
|
| 3,855 |
|
|
| 3,856 |
|
|
| 3,856 |
|
|
| 3,857 |
|
Total expenses |
| $ | 221,867 |
|
| $ | 230,098 |
|
| $ | 241,254 |
|
| $ | 248,296 |
|
Income before income taxes |
|
| 38,356 |
|
|
| 28,379 |
|
|
| 26,924 |
|
|
| 23,815 |
|
Income tax expense |
| $ | 12,427 |
|
| $ | 9,195 |
|
| $ | 8,723 |
|
| $ | 6,072 |
|
Net income |
| $ | 25,929 |
|
| $ | 19,184 |
|
| $ | 18,201 |
|
| $ | 17,743 |
|
|
|
|
|
|
|
|
|
|
|
|
|
|
|
|
|
|
Comprehensive income |
| $ | 27,052 |
|
| $ | (3,789 | ) |
| $ | 18,849 |
|
| $ | 15,990 |
|
|
|
|
|
|
|
|
|
|
|
|
|
|
|
|
|
|
Combined ratio |
|
| 92.3 | % |
|
| 93.4 | % |
|
| 93.4 | % |
|
| 97.2 | % |
Net income per share: (1) |
|
|
|
|
|
|
|
|
|
|
|
|
|
|
|
|
Basic |
| $ | 0.90 |
|
| $ | 0.67 |
|
| $ | 0.63 |
|
| $ | 0.62 |
|
Diluted |
| $ | 0.89 |
|
| $ | 0.65 |
|
| $ | 0.61 |
|
| $ | 0.59 |
|
(1) - We completed a two-for-one stock split on January 20, 2017. All per share data has been retroactively restated on a post-split basis.
NOTE 16. SUBSEQUENT EVENTS
On December 6, 2016, our Board of Directors declared a two-for-one stock split of The Navigators Group, Inc. Common stock, to be effected in the form of a stock dividend. Stockholders of record at the close of business on December 30, 2016 received one additional share of Common stock for every share of Common stock held. The additional shares of Common stock were issued on January 20, 2017. All disclosures of shares and per share data have been retroactively adjusted to reflect the stock split for all periods presented . In addition , o n February 16, 2017, our Board of Directors declared a cash dividend on The Navigators Group, Inc. Common stock of $0.045 per share, payable on March 24, 2017 to stockholders of record on March 3, 2017.
Effective January 1, 2017, we entered into a reinsurance arrangement to cede 100% of the unearned premium as of such date on the North American exposures of our Property business underwritten at Lloyd's to Vibe Syndicate Management Limited ("Vibe"). All losses occurring after the effective date on this business will be covered by Vibe. Also, effective January 1, 2017, the Parent Company sold its insurance agency operations in Sweden and Denmark to Ryan Specialty Group, LLC ("RSG"). The transaction represents a 100% acquisition of its Sweden and Denmark corporations, NUAL AB and Navigators A/S, respectively. This transaction also included the transfer of the operating lease for the Stockholm office to RSG. We do not expect these transactions to have a material effect on our financial statements.
F-42
On February 16, 2017, our Company entered into that certain Guarantee, pursuant to which it guaranteed all of the liabilities and obligations of NIIC. The Guarantee would remain effective until all of such liabilities and obligations are discharged, and in the event that our Company does not meets its obligations under the Guarantee, any person who is covered by an insurance policy, certificate of coverage or reinsurance contract issued by NIIC would be a third party beneficiary under the Guarantee. Refer to Note 8, Commitment and Contingencies , in the Notes to Consolidated Financial Statements, for additional information on the Guarantee.
F-43
SCHEDULE I
THE NAVIGATORS GROUP, INC. AND SUBSIDIARIES
Summary of Consolidated Investments -
Other than Investments in Related Parties
|
| December 31, 2016 |
| |||||||||||||
|
|
|
|
|
| Gross |
|
| Gross |
|
|
|
|
| ||
|
|
|
|
|
| Unrealized |
|
| Unrealized |
|
| Amortized |
| |||
amounts in thousands |
| Fair Value (1) |
|
| Gains |
|
| Losses |
|
| Cost |
| ||||
Fixed maturities: |
|
|
|
|
|
|
|
|
|
|
|
|
|
|
|
|
U.S. Treasury bonds, agency bonds and foreign government bonds |
| $ | 273,776 |
|
| $ | 2,192 |
|
| $ | (5,128 | ) |
| $ | 276,712 |
|
States, municipalities and political subdivisions |
|
| 547,415 |
|
|
| 11,542 |
|
|
| (4,036 | ) |
|
| 539,909 |
|
Mortgage-backed and asset-backed securities: |
|
| - |
|
|
| - |
|
|
| - |
|
|
| - |
|
Agency mortgage-backed securities |
|
| 487,364 |
|
|
| 4,016 |
|
|
| (6,585 | ) |
|
| 489,933 |
|
Residential mortgage obligations |
|
| 20,530 |
|
|
| 453 |
|
|
| (55 | ) |
|
| 20,132 |
|
Asset-backed securities |
|
| 314,601 |
|
|
| 824 |
|
|
| (1,178 | ) |
|
| 314,955 |
|
Commercial mortgage-backed securities |
|
| 154,139 |
|
|
| 2,859 |
|
|
| (1,904 | ) |
|
| 153,184 |
|
Subtotal |
| $ | 976,634 |
|
| $ | 8,152 |
|
| $ | (9,722 | ) |
| $ | 978,204 |
|
Corporate bonds |
|
| 838,057 |
|
|
| 10,185 |
|
|
| (5,528 | ) |
|
| 833,400 |
|
Total fixed maturities |
| $ | 2,635,882 |
|
| $ | 32,071 |
|
| $ | (24,414 | ) |
| $ | 2,628,225 |
|
Equity securities |
|
| 349,142 |
|
|
| 27,016 |
|
|
| (5,785 | ) |
|
| 327,911 |
|
Other invested assets |
|
| 1,960 |
|
|
| - |
|
|
| - |
|
|
| 1,960 |
|
Short-term investments |
|
| 143,539 |
|
|
| 88 |
|
|
| - |
|
|
| 143,451 |
|
Total investments |
| $ | 3,130,523 |
|
| $ | 59,175 |
|
| $ | (30,199 | ) |
| $ | 3,101,547 |
|
(1) Other invested assets are accounted for using the equity method of accounting. All other investments are shown at fair value.
S-1
SCHEDULE II
THE NAVIGATORS GROUP, INC. AND SUBSIDIARIES
Condensed Financial Information of Registrant
The Navigators Group, Inc.
Balance Sheets
(Parent Company)
|
| December 31, |
| |||||
amounts in thousands except share amounts |
| 2016 |
|
| 2015 |
| ||
ASSETS |
|
|
|
|
|
|
|
|
Investments |
| $ | 1,660 |
|
| $ | 89,586 |
|
Cash |
|
| 11,003 |
|
|
| 6,417 |
|
Investments in subsidiaries |
|
| 1,381,652 |
|
|
| 1,232,012 |
|
Goodwill and other intangible assets |
|
| 2,534 |
|
|
| 2,534 |
|
Other assets |
|
| 49,588 |
|
|
| 33,647 |
|
Total assets |
| $ | 1,446,437 |
|
| $ | 1,364,196 |
|
|
|
|
|
|
|
|
|
|
LIABILITIES AND STOCKHOLDERS' EQUITY |
|
|
|
|
|
|
|
|
|
|
|
|
|
|
|
|
|
Liabilities: |
|
|
|
|
|
|
|
|
Senior notes |
| $ | 263,728 |
|
| $ | 263,580 |
|
Accounts payable and other liabilities |
|
| 1,347 |
|
|
| 1,294 |
|
Accrued interest payable |
|
| 3,174 |
|
|
| 3,174 |
|
Total liabilities |
| $ | 268,249 |
|
| $ | 268,048 |
|
|
|
|
|
|
|
|
|
|
Stockholders' Equity: (1) |
|
|
|
|
|
|
|
|
Preferred stock, $.10 par value, authorized 1,000,000 shares, none issued |
| $ | - |
|
| $ | - |
|
Common stock, $.10 par value, authorized 50,000,000 shares, issued 36,146,899 shares for 2016 and 35,884,538 shares for 2015 |
|
| 3,612 |
|
|
| 3,586 |
|
Additional paid-in capital |
|
| 373,983 |
|
|
| 356,036 |
|
Treasury stock, at cost (7,022,760 shares for 2016 and 2015) |
|
| (155,801 | ) |
|
| (155,801 | ) |
Retained earnings |
|
| 947,519 |
|
|
| 868,723 |
|
Accumulated other comprehensive income: |
|
|
|
|
|
|
|
|
Net unrealized gains (losses) on securities available-for-sale, net of tax |
|
| 8,882 |
|
|
| 23,611 |
|
Foreign currency translation adjustment, net of tax |
|
| (7 | ) |
|
| (7 | ) |
Total stockholders' equity |
| $ | 1,178,188 |
|
| $ | 1,096,148 |
|
Total liabilities and stockholders' equity |
| $ | 1,446,437 |
|
| $ | 1,364,196 |
|
(1) - We completed a two-for-one stock split on January 20, 2017. All share and per share data has been retroactively restated on a post-split basis.
S-2
SCHEDULE II
THE NAVIGATORS GROUP, INC. AND SUBSIDIARIES
Condensed Financial Information of Registrant (Continued)
The Navigators Group, Inc.
Statements of Income
(Parent Company)
|
| Years Ended December 31, |
| |||||||||
amounts in thousands |
| 2016 |
|
| 2015 |
|
| 2014 |
| |||
Revenues: |
|
|
|
|
|
|
|
|
|
|
|
|
Net investment income |
| $ | 53 |
|
| $ | 147 |
|
| $ | 76 |
|
Total revenues |
| $ | 53 |
|
| $ | 147 |
|
| $ | 76 |
|
Expenses: |
|
|
|
|
|
|
|
|
|
|
|
|
Interest expense |
|
| 15,435 |
|
|
| 15,424 |
|
|
| 15,413 |
|
Other (income) expense |
|
| 22 |
|
|
| - |
|
|
| - |
|
Total expenses |
| $ | 15,457 |
|
| $ | 15,424 |
|
| $ | 15,413 |
|
Income (loss) before income tax benefit |
| $ | (15,404 | ) |
| $ | (15,277 | ) |
| $ | (15,337 | ) |
Income tax benefit |
|
| (8,009 | ) |
|
| (5,472 | ) |
|
| (5,287 | ) |
Income (loss) before equity in undistributed net income of wholly owned subsidiaries |
| $ | (7,395 | ) |
| $ | (9,805 | ) |
| $ | (10,050 | ) |
Equity in undistributed net income of wholly-owned subsidiaries |
|
| 90,121 |
|
|
| 90,862 |
|
|
| 105,379 |
|
Net income |
| $ | 82,726 |
|
| $ | 81,057 |
|
| $ | 95,329 |
|
S-3
SCHEDULE II
THE NAVIGATORS GROUP, INC. AND SUBSIDIARIES
Condensed Financial Information of Registrant (Continued)
The Navigators Group, Inc.
Statements of Cash Flows
(Parent Company)
|
| Years Ended December 31, |
| |||||||||
amounts in thousands |
| 2016 |
|
| 2015 |
|
| 2014 |
| |||
Operating activities: |
|
|
|
|
|
|
|
|
|
|
|
|
Net income |
| $ | 82,726 |
|
| $ | 81,057 |
|
| $ | 95,329 |
|
Adjustments to reconcile net income to net cash provided by (used in) operations: |
|
|
|
|
|
|
|
|
|
|
|
|
Equity in undistributed net income of wholly-owned subsidiaries |
|
| (90,121 | ) |
|
| (90,862 | ) |
|
| (105,379 | ) |
Dividends received from subsidiaries |
|
| 5,000 |
|
|
| - |
|
|
| - |
|
Other |
|
| 379 |
|
|
| 3,373 |
|
|
| 9,211 |
|
Net cash provided by (used in) operating activities |
| $ | (2,016 | ) |
| $ | (6,432 | ) |
| $ | (839 | ) |
Investing activities: |
|
|
|
|
|
|
|
|
|
|
|
|
Fixed maturities, available-for-sale |
|
|
|
|
|
|
|
|
|
|
|
|
Sales |
| $ | - |
|
| $ | 1,250 |
|
| $ | 3,200 |
|
Purchases |
|
| - |
|
|
| - |
|
|
| - |
|
Equity securities |
|
|
|
|
|
|
|
|
|
|
|
|
Sales |
|
| - |
|
|
| - |
|
|
| - |
|
Purchases |
|
| - |
|
|
| - |
|
|
| - |
|
Net (increase) decrease in short-term investments |
|
| 87,942 |
|
|
| 3,918 |
|
|
| (3,424 | ) |
Net cash provided by (used in) investing activities |
| $ | 87,942 |
|
| $ | 5,168 |
|
| $ | (224 | ) |
Financing activities: |
|
|
|
|
|
|
|
|
|
|
|
|
Capital contribution to subsidiary |
| $ | (79,250 | ) |
| $ | - |
|
| $ | - |
|
Proceeds of stock issued from employee stock purchase plan |
|
| 1,840 |
|
|
| 1,352 |
|
|
| 1,067 |
|
Proceeds of stock issued from exercise of stock options |
|
| - |
|
|
| 29 |
|
|
| 153 |
|
Dividends paid |
|
| (3,930 | ) |
|
| - |
|
|
| - |
|
Net cash provided by (used in) financing activities |
| $ | (81,340 | ) |
| $ | 1,381 |
|
| $ | 1,220 |
|
Increase (decrease) in cash |
| $ | 4,586 |
|
| $ | 117 |
|
| $ | 157 |
|
Cash at beginning of year |
|
| 6,417 |
|
|
| 6,300 |
|
|
| 6,143 |
|
Cash at end of year |
| $ | 11,003 |
|
| $ | 6,417 |
|
| $ | 6,300 |
|
S-4
SCHEDULE III
THE NAVIGATORS GROUP, INC. AND SUBSIDIARIES
Supplementary Insurance Information
|
|
|
|
|
|
|
|
|
|
|
|
|
|
|
|
|
|
|
|
|
|
|
|
|
|
|
|
|
|
| Amortization |
|
|
|
|
|
|
|
|
| |
|
|
| Deferred |
|
|
|
|
|
|
|
|
|
| Other policy |
|
|
|
|
|
|
|
|
|
|
|
|
|
| of deferred |
|
|
|
|
|
|
|
|
| |||
|
|
| policy |
|
| Reserve |
|
|
|
|
|
| claims and |
|
| Net |
|
| Net |
|
| Losses |
|
| policy |
|
| Other |
|
| Net |
| |||||||||
|
|
| acquisition |
|
| for losses |
|
| Unearned |
|
| benefits |
|
| earned |
|
| investment |
|
| and LAE |
|
| acquisition |
|
| operating |
|
| written |
| ||||||||||
amounts in thousands |
|
| costs |
|
| and LAE |
|
| premiums |
|
| payable |
|
| premiums |
|
| income (1) |
|
| incurred |
|
| costs (2) |
|
| expenses (1) |
|
| premiums |
| ||||||||||
Year ended December 31, 2016 |
|
|
|
|
|
|
|
|
|
|
|
|
|
|
|
|
|
|
|
|
|
|
|
|
|
|
|
|
|
|
|
|
|
|
|
|
|
|
|
|
|
NIC, NSIC and Navigators Management Company, Inc. |
|
| $ | 83,060 |
|
| $ | 1,753,630 |
|
| $ | 640,210 |
|
| $ | - |
|
| $ | 798,151 |
|
| $ | 71,044 |
|
| $ | 482,789 |
|
| $ | 108,809 |
|
| $ | 162,387 |
|
| $ | 844,987 |
|
NHUK |
|
|
| 36,600 |
|
|
| 536,097 |
|
|
| 247,134 |
|
|
| - |
|
|
| 302,194 |
|
|
| 8,344 |
|
|
| 182,659 |
|
|
| 56,236 |
|
|
| 68,152 |
|
|
| 341,237 |
|
NIIC |
|
|
| - |
|
|
| - |
|
|
| - |
|
|
| - |
|
|
| - |
|
|
| 25 |
|
|
| - |
|
|
| - |
|
|
| 44 |
|
|
| - |
|
|
|
| $ | 119,660 |
|
| $ | 2,289,727 |
|
| $ | 887,344 |
|
| $ | - |
|
| $ | 1,100,345 |
|
| $ | 79,413 |
|
| $ | 665,448 |
|
| $ | 165,045 |
|
| $ | 230,583 |
|
| $ | 1,186,224 |
|
Year ended December 31, 2015 |
|
|
|
|
|
|
|
|
|
|
|
|
|
|
|
|
|
|
|
|
|
|
|
|
|
|
|
|
|
|
|
|
|
|
|
|
|
|
|
|
|
NIC, NSIC and Navigators Management Company, Inc. |
|
| $ | 67,144 |
|
| $ | 1,692,886 |
|
| $ | 607,062 |
|
| $ | - |
|
| $ | 722,749 |
|
| $ | 61,863 |
|
| $ | 451,296 |
|
| $ | 88,597 |
|
| $ | 153,194 |
|
| $ | 757,117 |
|
NHUK |
|
|
| 24,839 |
|
|
| 509,758 |
|
|
| 213,614 |
|
|
| - |
|
|
| 261,338 |
|
|
| 6,708 |
|
|
| 121,302 |
|
|
| 41,380 |
|
|
| 67,449 |
|
|
| 286,743 |
|
|
|
| $ | 91,983 |
|
| $ | 2,202,644 |
|
| $ | 820,676 |
|
| $ | - |
|
| $ | 984,087 |
|
| $ | 68,571 |
|
| $ | 572,598 |
|
| $ | 129,977 |
|
| $ | 220,643 |
|
| $ | 1,043,860 |
|
Year ended December 31, 2014 |
|
|
|
|
|
|
|
|
|
|
|
|
|
|
|
|
|
|
|
|
|
|
|
|
|
|
|
|
|
|
|
|
|
|
|
|
|
|
|
|
|
NIC, NSIC and Navigators Management Company, Inc. |
|
| $ | 63,200 |
|
| $ | 1,645,984 |
|
| $ | 579,331 |
|
| $ | - |
|
| $ | 704,574 |
|
| $ | 56,714 |
|
| $ | 434,396 |
|
| $ | 85,137 |
|
| $ | 138,675 |
|
| $ | 752,773 |
|
NHUK |
|
|
| 16,252 |
|
|
| 513,650 |
|
|
| 186,836 |
|
|
| - |
|
|
| 231,321 |
|
|
| 7,378 |
|
|
| 110,833 |
|
|
| 42,558 |
|
|
| 58,150 |
|
|
| 247,365 |
|
|
|
| $ | 79,452 |
|
| $ | 2,159,634 |
|
| $ | 766,167 |
|
| $ | - |
|
| $ | 935,895 |
|
| $ | 64,092 |
|
| $ | 545,229 |
|
| $ | 127,695 |
|
| $ | 196,825 |
|
| $ | 1,000,138 |
|
(1) - Net investment income and Other operating expenses reflect only such amounts attributable to our Company's insurance operations.
(2) - Amortization of deferred policy acquisition costs reflects only such amounts attributable to our Company's insurance operations. A portion of these costs is eliminated in consolidation.
S-5
SCHEDULE IV
THE NAVIGATORS GROUP, INC. AND SUBSIDIARIES
Reinsurance - Written Premium
|
|
|
|
|
| Ceded to |
|
| Assumed |
|
|
|
|
|
| Percentage |
| |||
|
| Direct |
|
| other |
|
| from other |
|
| Net |
|
| of amount |
| |||||
amounts in thousands |
| Amount |
|
| companies |
|
| companies |
|
| amount |
|
| assumed to net |
| |||||
Year ended December 31, 2016 |
|
|
|
|
|
|
|
|
|
|
|
|
|
|
|
|
|
|
|
|
P&C |
| $ | 1,403,865 |
|
| $ | 382,687 |
|
| $ | 165,046 |
|
| $ | 1,186,224 |
|
|
| 14 | % |
Year ended December 31, 2015 |
|
|
|
|
|
|
|
|
|
|
|
|
|
|
|
|
|
|
|
|
P&C |
| $ | 1,277,728 |
|
| $ | 409,642 |
|
| $ | 175,774 |
|
| $ | 1,043,860 |
|
|
| 17 | % |
Year ended December 31, 2014 |
|
|
|
|
|
|
|
|
|
|
|
|
|
|
|
|
|
|
|
|
P&C |
| $ | 1,232,012 |
|
| $ | 432,215 |
|
| $ | 200,341 |
|
| $ | 1,000,138 |
|
|
| 20 | % |
S-6
SCHEDULE V
THE NAVIGATORS GROUP, INC. AND SUBSIDIARIES
Valuation and Qualifying Accounts
|
| Balance at |
|
| Charged (Credited) to |
|
| Charged to |
|
| Deductions |
|
| Balance at |
| |||||
amounts in thousands |
| January 1 |
|
| Costs and Expenses |
|
| Other Accounts |
|
| (Describe) |
|
| December 31 |
| |||||
Year ended December 31, 2016 |
|
|
|
|
|
|
|
|
|
|
|
|
|
|
|
|
|
|
|
|
Allowance for uncollectable reinsurance |
| $ | 6,921 |
|
| $ | 5,157 |
|
| $ | - |
|
| $ | - |
|
| $ | 12,078 |
|
Valuation allowance in deferred taxes |
| $ | 721 |
|
| $ | (22 | ) |
| $ | - |
|
| $ | - |
|
| $ | 699 |
|
Year ended December 31, 2015 |
|
|
|
|
|
|
|
|
|
|
|
|
|
|
|
|
|
|
|
|
Allowance for uncollectable reinsurance |
| $ | 11,332 |
|
| $ | (4,411 | ) |
| $ | - |
|
| $ | - |
|
| $ | 6,921 |
|
Valuation allowance in deferred taxes |
| $ | 776 |
|
| $ | (55 | ) |
| $ | - |
|
| $ | - |
|
| $ | 721 |
|
Year ended December 31, 2014 |
|
|
|
|
|
|
|
|
|
|
|
|
|
|
|
|
|
|
|
|
Allowance for uncollectable reinsurance |
| $ | 11,332 |
|
| $ | - |
|
| $ | - |
|
| $ | - |
|
| $ | 11,332 |
|
Valuation allowance in deferred taxes |
| $ | 554 |
|
| $ | 222 |
|
| $ | - |
|
| $ | - |
|
| $ | 776 |
|
S-7
SCHEDULE VI
THE NAVIGATORS GROUP, INC. AND SUBSIDIARIES
Supplementary Information Concerning P&C Insurance Operations
|
|
|
|
|
|
|
|
|
|
|
|
|
|
|
|
|
|
|
|
|
| Losses and LAE |
|
| Amortization |
|
|
|
|
|
|
|
|
| |||||
|
| Deferred policy |
|
| Reserve |
|
|
|
|
|
| Net |
|
| Net |
|
| expenses incurred related to |
|
| of deferred policy |
|
| Other |
|
| Net |
| |||||||||||
amounts in thousands |
| acquisition |
|
| for losses |
|
| Unearned |
|
| earned |
|
| investment |
|
| Current |
| Prior |
|
| acquisition |
|
| operating |
|
| written |
| ||||||||||
Affiliation with Registrant |
| costs |
|
| and LAE |
|
| premiums |
|
| premiums |
|
| income (1) |
|
| year |
| years |
|
| costs (2) |
|
| expenses (1) |
|
| premiums |
| ||||||||||
Consolidated Subsidiaries: |
|
|
|
|
|
|
|
|
|
|
|
|
|
|
|
|
|
|
|
|
|
|
|
|
|
|
|
|
|
|
|
|
|
|
|
|
|
|
|
Year ended December 31, 2016 |
| $ | 119,660 |
|
| $ | 2,289,727 |
|
| $ | 887,344 |
|
| $ | 1,100,345 |
|
| $ | 79,413 |
|
| $ | 693,976 |
| $ | (28,528 | ) |
| $ | 165,045 |
|
| $ | 230,583 |
|
| $ | 1,186,224 |
|
|
|
|
|
|
|
|
|
|
|
|
|
|
|
|
|
|
|
|
|
|
|
|
|
|
|
|
|
|
|
|
|
|
|
|
|
|
|
|
|
Year ended December 31, 2015 |
| $ | 91,983 |
|
| $ | 2,202,644 |
|
| $ | 820,676 |
|
| $ | 984,087 |
|
| $ | 68,571 |
|
| $ | 637,267 |
| $ | (64,669 | ) |
| $ | 129,977 |
|
| $ | 220,643 |
|
| $ | 1,043,860 |
|
|
|
|
|
|
|
|
|
|
|
|
|
|
|
|
|
|
|
|
|
|
|
|
|
|
|
|
|
|
|
|
|
|
|
|
|
|
|
|
|
Year ended December 31, 2014 |
| $ | 79,452 |
|
| $ | 2,159,634 |
|
| $ | 766,167 |
|
| $ | 935,895 |
|
| $ | 64,092 |
|
| $ | 601,041 |
| $ | (55,812 | ) |
| $ | 127,695 |
|
| $ | 196,825 |
|
| $ | 1,000,138 |
|
(1) - Net investment income and Other operating expenses reflect only such amounts attributable to our Company's insurance operations.
(2) - Amortization of deferred policy acquisition costs reflects only such amounts attributable to our Company's insurance operations. A portion of these costs is eliminated in consolidation.
S-8
Exhibit No. |
| Description of Exhibit |
| Previously filed and Incorporated Herein by Reference to: |
3-1 |
| Restated Certificate of Incorporation |
| Form S-8 filed July 26, 2002 (File No. 333-97183) |
|
|
|
|
|
3-2 |
| Certificate of Amendment to the Restated Certificate of Incorporation |
| Form S-8 filed July 26, 2002 (File No. 333-97183) |
|
|
|
|
|
3-3 |
| By-laws, as amended |
| Form S-1 (File No. 33-5667) |
|
|
|
|
|
3-4 |
| Certificate of Amendment to the Restated Certificate of Incorporation |
| Form 10-Q for June 30, 2006 |
|
|
|
|
|
4-1 |
| Specimen of Common Stock certificate, par value $0.10 per share |
| Form S-8 filed June 20, 2003 (File No. 333-106317) |
|
|
|
|
|
4-2 |
| Second Supplemental Indenture, dated as of October 4, 2013, between the Company and The Bank of New York Mellon |
| Form 8-K filed October 4, 2013 |
|
|
|
|
|
10-1* |
| Stock Option Plan |
| Form S-1 (File No. 33-5667) |
|
|
|
|
|
10-2* |
| Non-Qualified Stock Option Plan |
| Form S-4 (File No. 33-75918) |
|
|
|
|
|
10-3 |
| Employment Agreement with Stanley A. Galanski effective March 26, 2001 |
| Form 10-Q for March 31, 2001 |
|
|
|
|
|
10-4 |
| Employment Agreement with R. Scott Eisdorfer dated September 1, 1999 |
| Form 10-K for December 31, 2002 |
|
|
|
|
|
10-5* |
| 2002 Stock Incentive Plan |
| Proxy Statement filed May 30, 2002 |
|
|
|
|
|
10-6* |
| Employee Stock Purchase Plan |
| Proxy Statement filed May 29, 2003 |
|
|
|
|
|
10-7* |
| Executive Performance Incentive Plan |
| Proxy Statement filed April 4, 2008 |
|
|
|
|
|
10-8 |
| Form of Indemnity Agreement by the Company and the Selling Stockholders (as defined therein) |
| Amendment No. 2 to Form S-3 dated October 1, 2003 (File No.333-108424) |
|
|
|
|
|
10-16* |
| Second Amended and Restated 2005 Stock Incentive Plan |
| Proxy Statement filed April 12, 2013 |
|
|
|
|
|
10-17 |
| Third Amended and Restated Funds at Lloyd's Letter of Credit Agreement, dated as of November 7, 2016, among the Company, ING Bank N.V., London Branch, individually and as Administrative Agent and Letter of Credit Agent, JP Morgan Chase Bank N.A., and Barclays Bank PLC |
| Form 8-K for November 8, 2016 |
|
|
|
|
|
10-18 |
| Employment Agreement with Stephen R. Coward dated December 9, 2010 |
| Form 10-K for December 31, 2013 |
|
|
|
|
|
10-19 |
| Employment Agreement with Colin Sprott dated July 10, 2013 |
| Form 10-K for December 31, 2013 |
|
|
|
|
|
10-20* |
| Non-Qualified Deferred Compensation Plan |
| Form 10-Q for March 31, 2015 |
|
|
|
|
|
10-21 |
| Guarantee, dated February 16, 2017, entered into by the Company |
| ** |
|
|
|
|
|
11-1 |
| Statement re Computation of Per Share Earnings |
| ** |
|
|
|
|
|
21-1 |
| Subsidiaries of Registrant |
| ** |
|
|
|
|
|
23-1 |
| Consent of Independent Registered Public Accounting Firm |
| ** |
|
|
|
|
|
31-1 |
| Certification of CEO per Section 302 of the Sarbanes-Oxley Act |
| ** |
|
|
|
|
|
31-2 |
| Certification of CFO per Section 302 of the Sarbanes-Oxley Act |
| ** |
|
|
|
|
|
32-1 |
| Certification of CEO per Section 906 of the Sarbanes-Oxley Act (This exhibit is intended to be furnished in accordance with regulation S-K item 601(b)(32)(ii) and shall not be deemed to be filed for purposes of section 18 of the Securities Exchange Act of 1934, as amended, or incorporated by reference into any filing under the Securities Act of 1933, except as shall be expressly set forth by specific reference). |
| ** |
|
|
|
|
|
32-2 |
| Certification of CFO per Section 906 of the Sarbanes-Oxley Act (This exhibit is intended to be furnished in accordance with regulation S-K item 601(b)(32)(ii) and shall not be deemed to be filed for purposes of section 18 of the Securities Exchange Act of 1934, as amended, or incorporated by reference into any filing under the Securities Act of 1933, except as shall be expressly set forth by specific reference). |
| ** |
|
|
|
|
|
101.INS |
| XBRL Instance Document |
| ** |
|
|
|
|
|
101.SCH |
| XBRL Taxonomy Extension Scheme |
| ** |
|
|
|
|
|
101.CAL |
| XBRL Taxonomy Extension Calculation Database |
| ** |
|
|
|
|
|
101.LAB |
| XBRL Taxonomy Extension Label Linkbase |
| ** |
|
|
|
|
|
101.PRE |
| XBRL Taxonomy Extension Presentation Linkbase |
| ** |
|
|
|
|
|
101.DEF |
| XBRL Taxonomy Extension Definition Linkbase |
| ** |
* | Compensatory Plan |
** | Included herein |