|
UNITED STATES
SECURITIES AND EXCHANGE COMMISSION
Washington, DC 20549
FORM 10-K
☑ | Annual Report pursuant to Section 13 or 15(d) of the Securities Exchange Act of 1934 |
| For the Fiscal Year Ended December 31, 2017 |
OR
¨ | Transition Report pursuant to Section 13 or 15(d) of the Securities Exchange Act of 1934 |
| For the transition period from to . |
Commission file number 333-199861
MYLAN N.V.
(Exact name of registrant as specified in its charter)
The Netherlands |
| 98-1189497 |
(State or other jurisdiction of incorporation or organization) |
| (I.R.S. Employer Identification No.) |
Building 4, Trident Place, Mosquito Way, Hatfield, Hertfordshire, AL10 9UL, England
(Address of principal executive offices)
+44 (0) 1707-853-000
(Registrant's telephone number, including area code)
Securities registered pursuant to Section 12(b) of the Act:
Title of Each Class: |
| Name of Each Exchange on Which Registered: |
Ordinary shares, nominal value €0.01 |
| The NASDAQ Stock Market |
Securities registered pursuant to Section 12(g) of the Act: None
Indicate by check mark if the registrant is a well-known seasoned issuer, as defined in Rule 405 of the Securities Act. Yes ☑ No ¨
Indicate by check mark if the registrant is not required to file reports pursuant to Section 13 or Section 15(d) of the Act. Yes ¨ No ☑
Indicate by check mark whether the registrant (1) has filed all reports required to be filed by Section 13 or 15(d) of the Securities Exchange Act of 1934 during the preceding 12 months (or for such shorter period that the registrant was required to file such reports), and (2) has been subject to such filing requirements for the past 90 days. Yes ☑ No ¨
Indicate by check mark whether the registrant has submitted electronically and posted on its corporate Web site, if any, every Interactive Data File required to be submitted and posted pursuant to Rule 405 of Regulation S-T (§ 232.405 of this chapter) during the preceding 12 months (or for such shorter period that the registrant was required to submit and post such files). Yes ☑ No ¨
Indicate by check mark if disclosure of delinquent filers pursuant to Item 405 of Regulation S-K (§ 229.405 of this chapter) is not contained herein, and will not be contained, to the best of registrant's knowledge, in definitive proxy or information statements incorporated by reference in Part III of this Form 10-K or any amendment to this Form 10-K. ☑
Indicate by check mark whether the registrant is a large accelerated filer, an accelerated filer, a non-accelerated filer, smaller reporting company or an emerging growth company. See the definitions of "large accelerated filer," "accelerated filer," "smaller reporting company," and "emerging growth company" in Rule 12b-2 of the Exchange Act.:
Large accelerated filer | ☑ |
|
| Accelerated filer |
| ¨ |
Non-accelerated filer | ¨ | (Do not check if a smaller reporting company) |
| Smaller reporting company |
| ¨ |
|
|
|
| Emerging growth company |
| ¨ |
If an emerging growth company, indicate by check mark if the registrant has elected not to use the extended transition period for complying with any new or revised financial accounting standards provided pursuant to Section 13(a) of the Exchange Act. ¨ | ||||||
Indicate by check mark whether the registrant is a shell company (as defined in Rule 12b-2 of the Act). Yes ¨ No ☑
The aggregate market value of the outstanding ordinary shares, nominal value €0.01 , of the registrant other than shares held by persons who may be deemed affiliates of the registrant, as of June 30, 2017 , the last business day of the registrant's most recently completed second fiscal quarter, was approximately $20,669,862,339 .
The number of ordinary shares outstanding, nominal value €0.01 , of the registrant as of February 23, 2018 was 514,781,709 .
INCORPORATED BY REFERENCE
Document | Part of Form 10-K into Which Document is Incorporated |
An amendment to this Form 10-K will be filed no later than 120 days after the close of registrant's fiscal year. | III |
|
Table of Contents
MYLAN N.V.
INDEX TO FORM 10-K
For the Year Ended December 31, 2017
|
| Page |
PART I |
| |
ITEM 1. | Business | 3 |
ITEM 1A. | Risk Factors | 25 |
ITEM 1B. | Unresolved Staff Comments | 49 |
ITEM 2. | Properties | 49 |
ITEM 3. | Legal Proceedings | 49 |
|
|
|
PART II |
| |
ITEM 5. | Market for Registrant's Common Equity, Related Stockholder Matters and Issuer Purchases of Equity Securities | 50 |
ITEM 6. | Selected Financial Data | 53 |
ITEM 7. | Management's Discussion and Analysis of Financial Condition and Results of Operations | 55 |
ITEM 7A. | Quantitative and Qualitative Disclosures about Market Risk | 82 |
ITEM 8. | Financial Statements and Supplementary Data | 83 |
ITEM 9. | Changes in and Disagreements with Accountants on Accounting and Financial Disclosure | 172 |
ITEM 9A. | Controls and Procedures | 172 |
ITEM 9B. | Other Information | 172 |
|
|
|
PART III |
| |
ITEM 10. | Directors, Executive Officers and Corporate Governance | 173 |
ITEM 11. | Executive Compensation | 173 |
ITEM 12. | Security Ownership of Certain Beneficial Owners and Management and Related Stockholder Matters | 173 |
ITEM 13. | Certain Relationships and Related Transactions, and Director Independence | 173 |
ITEM 14. | Principal Accounting Fees and Services | 173 |
|
|
|
PART IV |
| |
ITEM 15. | Exhibits and Consolidated Financial Statement Schedules | 174 |
Signatures | 182 | |
2
Table of Contents
PART I
ITEM 1. | Business |
Mylan N.V. , along with its subsidiaries (collectively, the "Company," " Mylan ," "our" or "we"), is a leading global pharmaceutical company, which develops, licenses, manufactures, markets and distributes generics, branded generics, brand name and over-the-counter ("OTC") products in a variety of dosage forms and therapeutic categories. Mylan is committed to setting new standards in healthcare by creating better health for a better world, and our mission is to provide the world's 7 billion people access to high quality medicine. To do so, we innovate to satisfy unmet needs; make reliability and service excellence a habit; do what's right, not what's easy; and impact the future through passionate global leadership. We believe access to healthcare should be a right, not a privilege. That makes our mission very personal. While a great deal of progress has been made over the years to expand access to healthcare, there's still much to be done. With our strong foundation in pharmaceuticals and long track record of doing good, Mylan is uniquely positioned to address the world's most pressing health concerns.
Mylan offers one of the industry's broadest product portfolios, including more than 7,500 marketed products around the world, to customers in more than 165 countries and territories. We operate a global, high quality, vertically-integrated manufacturing platform around the world and one of the world's largest active pharmaceutical ingredient ("API") operations. We also operate a strong and innovative research and development ("R&D") network that has consistently delivered a robust product pipeline including a variety of dosage forms, therapeutic categories and biosimilars.
Overview
Throughout its history, Mylan has been recognized as a leader in the United States ("U.S.") generic pharmaceutical industry. Our leadership position is the result of, among other factors, our ability to efficiently obtain Abbreviated New Drug Application ("ANDA") approvals and our reliable high quality supply chain. Mylan is one of the largest pharmaceutical companies in the world today in terms of revenue and is recognized as an industry leader because of our organic growth and transformative acquisitions beginning in 2007.
Our most recent significant acquisitions include the June 2016 acquisition of the non-sterile, topicals-focused business (the "Topicals Business") of Renaissance Acquisition Holdings, LLC ("Renaissance") for approximately $1.01 billion in cash at closing, including amounts that were deposited into escrow for potential contingent payments. The Topicals Business provided the Company with a complementary portfolio of commercial and pipeline products, and an established U.S. sales and marketing infrastructure targeting dermatologists. The Topicals Business also provided an integrated manufacturing and development platform.
Also, in August 2016, we acquired Meda AB (publ.) ("Meda") for a total purchase price of approximately $6.92 billion , net of cash acquired. Meda provided a diversified and expansive portfolio of branded and generic medicines along with a strong and growing portfolio of OTC products. The combined company has a balanced global footprint with significant scale in key geographic markets, particularly the U.S. and Europe. The acquisition of Meda also expanded our presence in key emerging markets, including, China, Russia, Turkey, and Mexico, and in countries in South East Asia, and the Middle East, which complemented Mylan's existing presence in India, Brazil and Africa (including South Africa).
One Mylan
Through our recent significant transactions, along with our previous transformative acquisitions of Mylan Inc. and Abbott Laboratories ' (" Abbott ") non-U.S. developed markets specialty and branded generics business (the "EPD Business"), Agila Specialties (‘‘ Agila ''), Matrix Laboratories Limited (now known as Mylan Laboratories Limited or "Mylan India"), Merck KGaA's generics and specialty pharmaceutical business, Bioniche Pharma Holdings Limited and Pfizer Inc.'s ("Pfizer") respiratory delivery platform (the "respiratory delivery platform"), we have created a horizontally and vertically integrated platform with global scale, augmented our diversified product portfolio and further expanded our range of capabilities, all of which we believe position us well for the future.
Today, Mylan has a robust worldwide commercial presence, including leadership positions in the U.S., Australia and France as well as other markets around the world. Mylan 's global portfolio of more than 7,500 marketed generic and branded generic, brand name, and OTC products around the world covers a vast array of therapeutic categories. We offer an extensive range of dosage forms and delivery systems, including oral solids, topicals, liquids and semisolids while focusing on those products that are difficult to formulate and manufacture, and typically have longer life cycles than traditional generic pharmaceuticals, including transdermal patches, high potency formulations, injectables, controlled-release and respiratory
3
Table of Contents
products. OTC products are key complements to prescribed drugs because they are easily accessible, save patients' time and reduce cost pressures on healthcare systems. Mylan also operates one of the largest API manufacturers, supplying low cost, high quality API for our own products and pipeline, as well as for a number of third parties.
We believe that the breadth and depth of our business and platform provide certain competitive advantages in major markets in which we operate, including less dependency on any single market or product. As a result, we are better able to successfully compete on a global basis than many of our competitors.
Our Operations
Mylan N.V. was originally incorporated as a private limited liability company, New Moon B.V., in the Netherlands in 2014. Mylan became a public limited liability company in the Netherlands through its acquisition of the EPD Business on February 27, 2015 . Mylan's corporate seat is located in Amsterdam, the Netherlands , its principal executive offices are located in Hatfield, Hertfordshire, England and Mylan N.V. group's global headquarters are located in Canonsburg, Pennsylvania .
The Company has made a number of significant acquisitions since 2015, and as part of the holistic, global integration of these acquisitions, the Company is focused on how to best optimize and maximize all of its assets across the organization and across all geographies. On December 5, 2016, the Company announced restructuring programs in certain locations representing initial steps in a series of actions that are anticipated to further streamline its operations globally. The Company continues to develop the details of the cost reduction initiatives, including workforce actions and other potential restructuring activities beyond the programs already announced, including potential shutdown or consolidation of certain operations. The continued restructuring actions are expected to be implemented through fiscal year 2018. Refer to Note 16 Restructuring included in Item 8 in this Annual Report on Form 10-K for additional information related to our restructuring initiatives.
We report our results in three segments on a geographic basis as follows: North America, Europe and Rest of World. The operations in each of our segments is described in more detail below.
The chart below reflects third party net sales by reportable segment for the year ended December 31, 2017 .
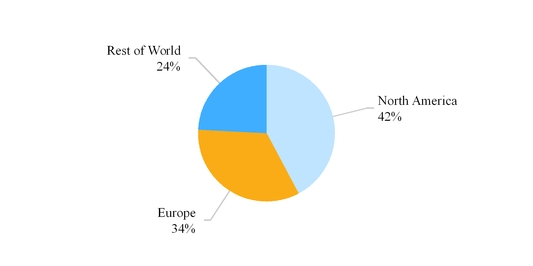
Our third party net sales are derived primarily from the sale of generic and branded generic pharmaceuticals, branded pharmaceuticals, OTC products and API. Our API business is conducted through Mylan India , which is included within our Rest of World segment. Refer to Note 13 Segment Information included in Item 8 in this Annual Report on Form 10-K for additional information related to our reportable segments.
4
Table of Contents
Our global operational footprint, including the locations of our manufacturing, packaging and R&D facilities and capabilities, along with the individual site's primary activities, are detailed on the map below.
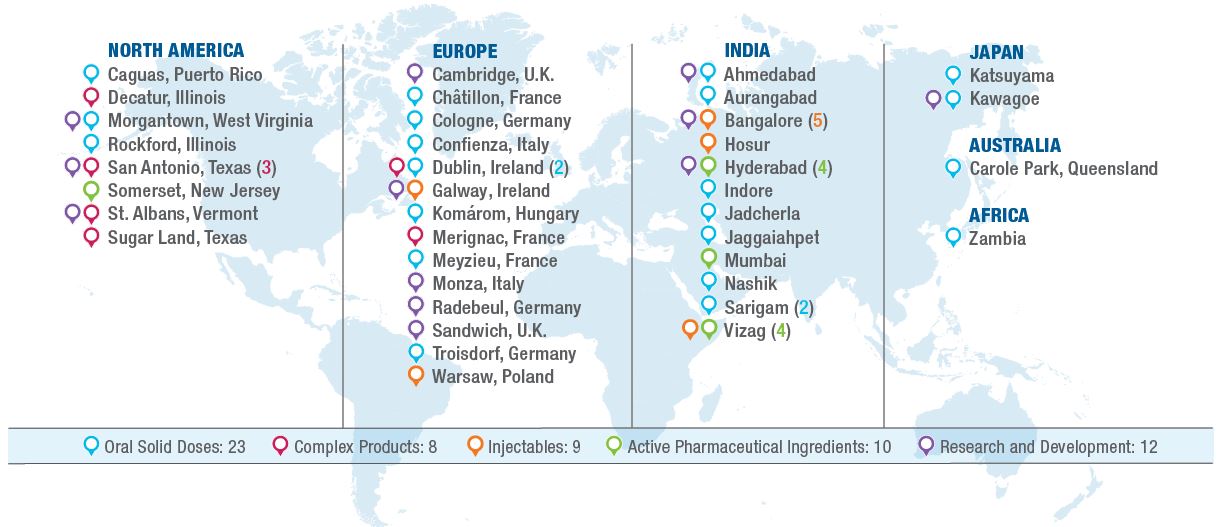
Our global manufacturing platform is an important component of our business model. We own twelve manufacturing and distribution facilities in the U.S. including Puerto Rico, with significant sites in Morgantown, West Virginia; San Antonio, Texas; St. Albans, Vermont; Caguas, Puerto Rico; and Greensboro, North Carolina. Outside the U.S. and Puerto Rico, we utilize production and distribution facilities in eleven countries, including key facilities in India, Australia, Japan, Ireland, Hungary and France. Our manufacturing facilities, which operate around the globe, are capable of producing approximately 80 billion oral solid doses, 4,800 kiloliters of APIs, 500 million injectable units, and 1.5 billion complex products (transdermals, dermals, topicals, respiratory, oral films, and other specialty items) per year.
The Company also leases manufacturing, warehousing, distribution and administrative facilities in numerous locations, both within and outside of the U.S., including properties in New York, Canada, France, India, Ireland and the United Kingdom (the "U.K."). All of the facilities listed above are included in our reportable segments primarily based on the location of the facility. Our global R&D centers of excellence are located in Morgantown, West Virginia and Hyderabad, India. We also have specific technology focused development sites in Texas, Vermont, Canada, Ireland, Germany, Italy, the U.K., India and Japan. In addition, under our collaboration agreements with Biocon Limited ("Biocon") for the development of biosimilar compounds and insulin analog products, certain state of the art manufacturing facilities owned by Biocon in India and Malaysia are to be used for the manufacture of products developed under the agreements, which are excluded from the chart above.
We believe that all of our facilities are in good operating condition, the machinery and equipment are well-maintained, the facilities are suitable for their intended purposes and they have capacities adequate for the current operations.
Unless otherwise indicated, industry data included in Item 1 is sourced from IQVIA Holdings Inc. ("IQVIA") and is for the twelve months ended November 2017 .
North America Segment
Our North America segment primarily develops, manufactures, sells and distributes pharmaceutical products in tablet, capsule, injectable, transdermal patch, gel, nebulized and cream or ointment form. For the year ended December 31, 2017 , North America segment third party net sales were $4.97 billion . Our North America segment includes our operations in the U.S. and Canada, each of which is discussed further below.
The U.S. generics market is the largest in the world, in terms of value, with generic prescription sales of approximately $60.0 billion for the twelve months ended November 2017 and approximately 90% of all pharmaceutical products sold in the U.S. were generic products, which demonstrates the high level of generic penetration in this market. Mylan holds a top two ranking within the U.S. generics prescription market in terms of both sales and prescriptions dispensed. Approximately one in every 14 prescriptions dispensed in the U.S. is a Mylan product. Our sales of products in the U.S. are derived primarily from the sale of oral solid dosages, injectables, transdermal patches, gels, creams, ointments and unit dose offerings. In the U.S., we have one of the largest product portfolios among all generic pharmaceutical companies. With the
5
Table of Contents
acquisition of the Topicals Business, we gained a complementary portfolio of branded and generic topical products, including an active pipeline of products in development as well as an established U.S. sales and marketing infrastructure targeting dermatologists. The Topicals Business added to Mylan an integrated manufacturing and development platform along with a leading topicals-focused contract development and manufacturing organization.
In addition, we manufacture and sell a diverse portfolio of injectable products across several key therapeutic areas, including respiratory and allergy, infectious disease, cardiovascular, oncology and central nervous system and anesthesia. Mylan's injectable manufacturing capabilities include vials, pre-filled syringes, ampoules and lyophilization with a focus on oncology, penems, penicillins, ophthalmics and peptides.
Our unit dose business focuses on providing one of the largest product portfolios along with innovative packaging and barcoding that supports bedside verification throughout the U.S. and Canada for hospitals, group purchasing organizations ("GPOs"), long term care facilities, wholesalers, surgical services, home infusion service providers, correctional facilities, specialty pharmacies and retail outlets.
In October 2017, Mylan launched in the U.S. the first Glatiramer Acetate Injection 40 mg/mL for 3-times-a-week injection that is an AP-rated substitutable generic version of Copaxone® 40 mg/mL, as well as Glatiramer Acetate Injection 20 mg/mL for once-daily injection, an AP-rated, substitutable generic version of Copaxone® 20 mg/mL. These products are indicated for the treatment of patients with relapsing forms of multiple sclerosis, a chronic inflammatory disease of the central nervous system.
The EpiPen® Auto-Injector , which is used in the treatment of severe allergic reactions, is an epinephrine auto-injector that has been sold in the U.S. and internationally since the mid-1980s. Mylan markets the EpiPen® Auto-Injector , which is supplied to Mylan by a wholly owned subsidiary of Pfizer. Anaphylaxis is a severe allergic reaction that is rapid in onset and may cause death, either through swelling that shuts off airways or through a significant drop in blood pressure. In December 2010, the National Institute of Allergy and Infectious Diseases, a division of the National Institutes of Health, introduced the "Guidelines for the Diagnosis and Management of Food Allergy in the United States." These guidelines state that epinephrine is the first line treatment for anaphylaxis. The EpiPen® Auto-Injector is the number one dispensed epinephrine auto-injector. On December 16, 2016, Mylan launched the first authorized generic for the EpiPen® Auto-Injector , which has the same drug formulation and device functionality as the branded product.
Perforomist® Inhalation Solution , Mylan's Formoterol Fumarate Inhalation Solution, was launched in October 2007. Perforomist® Inhalation Solution is a long-acting beta 2 -adrenergic agonist indicated for long-term, twice-daily administration in the maintenance treatment of bronchoconstriction in chronic obstructive pulmonary disorder ("COPD") patients, including those with chronic bronchitis and emphysema. Mylan holds several U.S. and international patents protecting Perforomist® Inhalation Solution .
With the acquisition of Meda, we acquired certain key branded products, including Dymista® which is used for the treatment of seasonal allergic rhinitis and was launched in the U.S. in 2012. We also market several OTC products including Cold-EEZE, Midnite, and Vivarin.
We believe that the breadth and quality of our product offerings help us to successfully meet our customers' needs and to better compete in the generics industry over the long-term. The future growth of our U.S. generics business is partially dependent upon continued acceptance of generic products as affordable alternatives to branded pharmaceuticals, a trend which is largely outside of our control. However, we believe that we can maximize the value of our generic product opportunities by continuing our proven track record of bringing to market high quality products that are difficult to formulate or manufacture. Throughout Mylan's history, we have successfully introduced many generic products that are difficult to formulate or manufacture and continue to be meaningful contributors to our business several years after their initial launch. Additionally, we expect to achieve growth in our U.S. business by launching new products for which we may attain U.S. Food and Drug Administration ("FDA") first-to-file status with Paragraph IV certification. As described further in the "Product Development and Government Regulation" discussion below, a first-filed ANDA with a Paragraph IV certification qualifies the product approval holder for a period of generic marketing and distribution exclusivity.
In Canada , we have successfully leveraged the acquired EPD Business to further broaden our presence in this market. We currently rank sixth in terms of market share in the generic prescription market. As in the U.S., growth in Canada will be dependent upon acceptance of generic products as affordable alternatives to branded pharmaceuticals. Further, we plan to leverage the strength and reliability of the collective Mylan brand to foster continued brand awareness and growth throughout the region.
6
Table of Contents
Europe Segment
Our European operations are conducted through our wholly owned subsidiaries in 35 countries across the region, including France, Italy, Germany, the U.K. and Spain. For the year ended December 31, 2017 , Europe segment third party net sales were $3.96 billion . The types of markets within Europe vary from country to country; however, when combined, the European market is the second largest generic pharmaceutical market in the world in terms of value. Within Europe, by value, the generic prescription market in Germany is the largest , followed by the U.K., France, Spain and Italy, respectively.
In Europe, the manner in which products are marketed varies by country. In addition to selling pharmaceuticals under their International Nonproprietary Name ("INN") (i.e., API), in certain European countries, branded generic pharmaceutical products are given a unique brand name, as these markets tend to be more responsive to the promotion efforts generally used to promote brand products.
The European generic prescription market also varies significantly by country in terms of the extent of generic penetration, the key decision maker in terms of drug choice and other important aspects. Some countries, including Germany, the U.K., the Netherlands, Denmark and Poland, are characterized by relatively high generic penetration, ranging between 70% and 75% of total prescription market sales in the twelve months ended November 2017 , based on volume. Conversely, other major European markets, including France, Italy and Spain, are characterized by much lower generic penetration, ranging between 22% and 44% of total prescription sales in the twelve months ended November 2017 , based on volume. However, actions taken by governments, particularly in these latter under-penetrated countries, to reduce healthcare costs could encourage further use of generic pharmaceutical products. In some of these under-penetrated markets, in addition to growth from new product launches, we expect our future growth to be driven by increased generic utilization and penetration.
As a result of the acquisitions of Meda and the EPD Business, our product portfolio has been diversified with OTC products and additional branded and branded generic products in Europe. In addition, Mylan has significantly expanded and strengthened its presence in Europe. In particular, we have grown our presence in several markets in Central and Eastern Europe, including Poland, Greece, the Czech Republic and Slovakia and gained access into new markets, such as Romania and Bulgaria. As a result of these acquisitions, our revenues in Europe are now significantly diversified across our generics, branded and branded generic portfolios.
Our branded products include Creon, Influvac, EpiPen®, Dymista, Betadine and Elidel. Our OTC products include Dona, Saugella, CB12, Brufen, Endwarts, and Armolipid.
In October 2017, the Company announced that its partner, Synthon, received marketing authorization approval in Europe for Glatiramer Acetate Injection 40 mg/mL. Mylan is partnered with Synthon, the developer and supplier of its European Glatiramer Acetate Injection products, and has exclusive distribution and supply rights in certain key European markets. We have launched the product in several countries in 2018.
Of the top ten generic prescription markets in Europe, we hold leadership positions in several of the markets, including the number one market share position in France and the number two market share position in Italy. In France , we believe the generic market is underpenetrated. Our growth in the French market is expected to come from brand leadership, new product launches, and increased generic utilization and penetration through government initiatives, such as a communication plan to promote generics in France. The acquisition of the EPD Business in 2015 followed by the acquisition of Meda in 2016 strengthened Mylan's position as a major participant across the healthcare system covering prescribers, hospitals and pharmacists and provided growth opportunities and synergies throughout the market.
In Italy , we have the second highest market share in the generic prescription market in terms of volume and value. We believe that the Italian generic market is still under-penetrated, with generics representing approximately 22% of the Italian pharmaceutical market, based on volume. The Italian government has put forth only limited measures aimed at encouraging generic use, and as a result, generic substitution is still in its early stages. As leaders of the generic market, we can benefit from increased generic utilization.
In addition to France and Italy, we have grown our presence in several European markets including Germany, the U.K., Spain and markets in Eastern Europe. In the U.K. , Mylan is ranked third in the U.K. generic prescription market, in terms of value. Mylan is well positioned in the U.K. as a preferred supplier to wholesalers and is also focused on areas such as retail pharmacy chains and hospitals. The acquisition of the EPD and Meda businesses in the U.K. has provided us with an additional branded market presence, particularly in the areas of pancreatic enzyme replacement, hormone replacement therapy, anaphylaxis and allergy.
7
Table of Contents
In Spain , we have the ninth highest market share in the generic prescription market based on volume. The generic market comprised approximately 35% of the total Spanish pharmaceutical market by volume for the twelve months ended November 2017 . Our portfolio and depth in this market were further expanded with the acquisitions of the EPD Business and Meda by adding branded and OTC products. As a result of these acquisitions, we have diversified our product offerings in Spain and generic prescription products now account for less than a quarter of our sales in Spain. New product introductions in all of our categories will be the drivers of our growth in Spain.
As a result of the acquisitions of Meda and the EPD Business, we have strengthened and expanded our presence in Germany and have diversified our portfolio to reduce our reliance on the tender system. A tender system is part of the market in Germany, and as a result, health insurers play a major role. Under a tender system, health insurers invite manufacturers to submit bids that establish prices for generic pharmaceuticals.
In the Nordic region, which we define as Sweden, Norway, Denmark, Finland and Iceland, our presence has expanded significantly as a result of our recent acquisitions. For instance, we now have the fourth highest market share in Sweden, in terms of volume and value, and the fifth highest market share in Norway, based on volume.
We also have a notable presence in other European generic prescription markets, including Portugal and Belgium, where we hold the third and fifth highest market share, respectively, in terms of volume. In the Netherlands, we have the third highest market share in the generic prescription market, which is characterized by relatively high generic penetration.
Rest of World Segment
We market pharmaceuticals in Rest of World primarily through our sales forces in approximately 30 countries and through partners and distributors in approximately 90 additional emerging markets. Our key Rest of World markets include Japan, Australia, China, Brazil, Russia, India, South Africa, and certain markets in the Middle-East and South East Asia. Additionally, through Mylan India , we market API to third parties and also supply other Mylan subsidiaries. For the year ended December 31, 2017 , Rest of World segment third party net sales were $2.83 billion .
The Indian generics market is the largest in the world, in terms of volume. We operate our API business out of Mylan India . We are also one of the world's largest API manufacturers as measured by the number of drug master files ("DMFs") filed with regulatory agencies. Mylan India 's manufacturing capabilities include a range of dosage forms, such as tablets, capsules and injectables, in a wide variety of therapeutic categories. Mylan India has ten API and intermediate manufacturing facilities and a total of fifteen finished dosage form ("FDF") facilities, which includes eight oral solid dose facilities and seven injectable facilities, all located in India. Our presence in India goes beyond manufacturing, sales and marketing. With a global R&D center of excellence in Hyderabad, India and technology driven R&D sites in Bangalore, India, we are able to create unique and efficient R&D capabilities.
Mylan India markets API to third parties around the world and produces anti-retroviral therapy ("ARV") products for people living with HIV/AIDS. Mylan India has a growing commercial presence, with its Hepatitis C products representing approximately 20% of the Hepatitis C market share in India. In addition, our current areas of focus include Critical Care, Hepato Care, HIV Care, Onco Care and Women's Care. We continue to expand our products in the therapeutic categories such as hepatology, oncology and critical care. In November 2015, we completed our acquisition of certain women's healthcare businesses from Famy Care Limited (such businesses "Jai Pharma Limited"), which significantly broadened our women's care portfolio and strengthened our technical capabilities in terms of dedicated hormone manufacturing.
Through Mylan India, we have long been a champion for those living with or at risk for infection of HIV/AIDS. It is part of our belief that access to high quality medicine is a right, not a privilege. Mylan offers a wide range of ARVs, and close to 50% of patients being treated for HIV/AIDS in the developing world depend on our ARVs. Mylan is unique among western pharmaceutical companies in its commitment to providing access to high quality medicines to millions of patients in developing countries. We have invested more than $250 million to expand our ARV production capacity and we now manufacture more than 4 billion ARV tablets and capsules each year. Eight years ago, Mylan was the first company to launch a single pill, once-a-day regimen called TLE. In March 2017, we were the first - and to date, the only - company to launch a lower-cost, reduced-dose version of this treatment. Today, over half of the Company's API manufacturing capacity is devoted to the production of ARVs. In September 2017 at the United Nations, Mylan announced its most recent step in the fight against the HIV epidemic. In partnership with institutions such as the Clinton Health Access Initiative, UNAIDS, the Bill & Melinda Gates Foundation and the U.K.'s Department for International Development, Mylan entered into a unique public/private partnership to accelerate the availability of a next-generation antiretroviral treatment called TLD to patients in more than 90 low and middle income countries. As part of this alliance, Mylan has committed to selling this product (a combination tablet,
8
Table of Contents
taken once daily, of the three molecules Dolutegravir, Lamivudine and Tenofovir Disoproxil Fumarate) to public-sector purchasers in countries such as South Africa and Kenya at a cost of approximately $75 per person per year.
In Australia , we have the highest market share in the generic pharmaceutical market by volume. Mylan is the number one supplier by volume to Australia's national pharmaceuticals program. The generic pharmaceutical market in Australia had sales of approximately $1.30 billion during the twelve months ended November 2017 . The acquired EPD Business and Meda businesses have enabled Mylan to broaden its product portfolio of branded and OTC products. Today Mylan Australia has a diverse platform and sales infrastructure capable of targeting most major market segments.
In Japan, we have a strong generics business which has has been among the fastest growing companies in the market over the past several years. The acquisition of the EPD Business has provided us with additional branded market presence and commercial reach. We also maintain manufacturing capabilities in Japan, which play a key role in supplying our businesses throughout the country. Currently, the market in Japan is largely composed of hospitals and clinics, but pharmacies are playing a greater role as generic substitution, aided by recent pro-generics government action, becomes more prevalent. Japan is the third largest single pharmaceutical market in the world by value, behind the U.S. and China, and the fifth largest generic prescription market worldwide by volume, with sales of approximately $8.0 billion during the twelve months ended November 2017 . According to the Japan Generic Medicines Association, the generic penetration rate reached approximately 69% as of the quarter ended September 2017 , up from approximately 65% in the comparable 2016 period. Beginning in 2013, we established an exclusive long-term strategic collaboration with Pfizer Japan Inc. ("Pfizer Japan") to develop, manufacture, distribute and market generic drugs in Japan. Under the agreement, both parties operate separate legal entities in Japan and collaborate on current and future generic products, sharing the costs and profits resulting from such collaboration. Mylan 's responsibilities, under the agreement, primarily consist of managing operations, including R&D and manufacturing. Pfizer Japan's responsibilities primarily consist of the commercialization of the combined generics portfolio and managing the marketing and sales effort. The acquired EPD Business, with its portfolio of branded products, is being promoted by our own sales force, and is run independently from our strategic collaboration with Pfizer Japan,
In Brazil , we operate a commercial business focused on providing high quality generic and branded injectable products to the Brazilian hospital segment. Our sales in this market segment are made through distributors, tenders, and more recently, direct sales to private hospitals. Brazil is the fourth largest generic pharmaceutical market in the world, behind the U.S., the combined European market and China, in terms of value. In the coming years, the Brazilian generic and branded generic pharmaceutical markets are expected to continue their growth trajectory primarily because of the increase of off patent reference drugs, the growth of biosimilars and the overall growth of the market. Our goal is to continue to build upon this local platform in order to further access the $13.0 billion Brazilian generic pharmaceutical market.
With the acquisition of Meda, we have grown our presence in other markets, such as China which is the third largest generic market in the world by value behind the U.S. and combined European market, with generic market sales of approximately $28.0 billion for the twelve months ended November 2017 . We also gained access to other markets including Russia, Turkey, and Mexico, and countries in South East Asia, and the Middle East. Our portfolio in these markets includes branded prescription, non-prescription and OTC products, and we now have the opportunity to reach these markets through an organized sales forces and direct access to the healthcare providers, as well as through distributor relationships.
Within the Rest of World region our key products include Amitiza in Japan, Dona, Elidel and our ARV products, Tenofovir, Lamivudine and Efavirenz ("TLE") and Tenofovir, Emtricitabine and Efavirenz ("TEE").
Product Development and Government Regulation
North America
U.S.
Prescription pharmaceutical products in the U.S. are generally marketed as either brand or generic drugs, while generic biologics are referred to as biosimilars. Brand products are usually marketed under brand names through marketing programs that are designed to generate physician and consumer loyalty. Brand products are generally patent protected, which provides a period of market exclusivity during which time they are sold with little or no competition, although there are typically other participants in the therapeutic area. Additionally, brand products may benefit from other periods of non-patent market exclusivity.
Generic pharmaceutical products are the pharmaceutical and therapeutic equivalents of an approved brand drug, known as the reference listed drug ("RLD") that is listed in the FDA publication entitled Approved Drug Products with
9
Table of Contents
Therapeutic Equivalence Evaluations , popularly known as the "Orange Book." The Drug Price Competition and Patent Term Restoration Act of 1984 (the "Hatch-Waxman Act") provides that generic drugs may enter the market after the approval of an ANDA, which generally requires that similarity to an RLD, including bioequivalence, be demonstrated, any patents on the RLD have expired or been found to be invalid or not infringed, and any market exclusivity periods related to the RLD have ended. Because approved generic drugs have been found to be the same as their respective RLDs, they can be expected to have the same safety and effectiveness profile as the RLD. Accordingly, generic products provide a safe, effective and cost-efficient alternative to users of these reference brand products. Branded generic pharmaceutical products are generic products that are more responsive to the promotion efforts generally used to promote brand products. Growth in the generic pharmaceutical industry has been, and will continue to be, driven by the increased market acceptance of generic drugs and biosimilars, as well as the number of brand drugs for which patent terms and/or other market exclusivities have expired.
We obtain new generic products primarily through internal product development. Additionally, we increasingly collaborate with other companies by entering into licensing or co-development agreements, including R&D partnerships for biosimilars. All applications for FDA approval must contain information relating to product formulation, raw material suppliers, stability, manufacturing processes, packaging, labeling and quality control. Information to support the bioequivalence of generic drug products or the safety and effectiveness of new drug products for their intended use is also required to be submitted. There are generally four types of applications used for obtaining FDA approval of new products:
New Drug Application ("NDA") - An NDA is filed when approval is sought to market a newly developed branded product and, in certain instances, for a new dosage form, a new delivery system or a new indication for a previously approved drug.
ANDA - An ANDA is filed when approval is sought to market a generic equivalent of a drug product previously approved under an NDA and listed in the FDA's Orange Book or for a new dosage strength for a drug previously approved under an ANDA.
Biologics License Application ("BLA") - A BLA is similar to an NDA, but is submitted to seek approval to market a drug product that is a biologic, which generally is a product derived from a living organism.
Biosimilars Application - This is an abbreviated approval pathway for a biologic product that is "highly similar" to a product previously approved under a BLA.
The ANDA development process is generally less time-consuming and complex than the NDA development process. It typically does not require new preclinical and clinical studies, because it relies on the studies establishing safety and efficacy conducted for the RLD previously approved through the NDA process. The ANDA process, however, does typically require one or more bioequivalence studies to show that the ANDA drug is bioequivalent to the previously approved reference listed brand drug. Bioequivalence studies compare the bioavailability of the proposed drug product with that of the RLD product containing the same active ingredient. Bioavailability is a measure of the rate and extent to which the active ingredient or active moiety is absorbed from a drug product and becomes available at the site of action. Thus, a demonstration of bioequivalence confirms the absence of a significant difference between the proposed product and the reference listed brand drug in terms of the rate and extent to which the active ingredient or active moiety becomes available at the site of drug action when administered at the same molar dose under similar conditions. An ANDA also typically must show that the proposed generic product is the same as the RLD in terms of active ingredient(s), strength, dosage form, route of administration and labeling.
Generic products are generally introduced to the marketplace at the expiration of patent protection for the brand product or at the end of a period of non-patent market exclusivity. However, if an ANDA applicant files an ANDA containing a certification of invalidity, non-infringement or unenforceability related to a patent listed in the Orange Book with respect to a reference drug product, the applicant may be able to market the generic equivalent prior to the expiration of patent protection for the brand product. Such patent certification is commonly referred to as a Paragraph IV certification. Generally, if the patent owner brings an infringement action within 45 days from receiving notification by the applicant, the FDA may not approve the ANDA application until the earlier of the rendering of a court decision favorable to the ANDA applicant or the expiration of 30 months. An ANDA applicant that is first to file a substantially complete ANDA containing a Paragraph IV certification is eligible for a period of generic marketing exclusivity. This exclusivity, which under certain circumstances may be required to be shared with other applicable ANDA sponsors with Paragraph IV certifications, lasts for 180 days, during which the FDA cannot grant final approval to other ANDA sponsors holding applications for a generic equivalent to the same reference drug.
In addition to patent exclusivity, the holder of the NDA for the listed drug may be entitled to a period of non-patent market exclusivity, during which the FDA cannot approve (or in some cases, accept for review) an application for a generic version product. If the reference drug is a new chemical entity (which generally means the active moiety has not previously been approved), the FDA may not accept an ANDA for a generic product for up to five years following approval of the NDA for the new chemical entity. If it is not a new chemical entity, but the holder of the NDA conducted clinical trials essential to
10
Table of Contents
approval of the NDA or a supplement thereto, the FDA may not approve an ANDA for the reference NDA product before the expiration of three years from the date of approval of the NDA or supplement. Certain other periods of exclusivity may be available if the RLD is indicated for treatment of a rare disease or the sponsor conducts pediatric studies in accordance with FDA requirements.
Supplemental ANDAs are required for approval of various types of changes to an approved application and these supplements may be under review for six months or more. In addition, certain types of changes may only be approved once new bioequivalence studies are conducted or other requirements are satisfied.
A number of branded pharmaceutical patent expirations are expected over the next several years. These patent expirations should provide additional generic product opportunities. We intend to concentrate our generic product development activities on branded products with significant sales in specialized or growing markets or in areas that offer significant opportunities and other competitive advantages. In addition, we intend to continue to focus our development efforts on technically difficult-to-formulate products or products that require advanced manufacturing technology.
The Biologics Price Competition and Innovation Act ("BPCIA") authorizes the FDA to license a biological product that is a "biosimilar" to an FDA-licensed biologic through an abbreviated pathway. The BPCIA establishes criteria for determining that a product is biosimilar to an already licensed biologic, known as the "reference product," and establishes a process by which an abbreviated BLA for a biosimilar product is submitted, reviewed and approved. This abbreviated approval pathway is intended to permit a biosimilar product to come to market more quickly and less expensively than if a full BLA were submitted, by relying to some extent on FDA's previous review and approval of the reference product. Generally, a biosimilar must be shown to be highly similar to, and have no clinically meaningful differences in safety, purity or potency from, the reference product. The BPCIA provides periods of exclusivity that protect a reference product from biosimilars competition. Under the BPCIA, the FDA may not accept a biosimilar application for review until four years after the date of first licensure of the reference product, and the biosimilar may not be licensed until twelve years after the reference product's approval. Additionally, the BPCIA establishes procedures by which the biosimilar applicant must provide information about its application and product to the reference product sponsor, and by which information about potentially relevant patents is shared and litigation over patents may proceed in advance of approval. The BPCIA also provides a period of exclusivity for the first biosimilar to be determined by the FDA to be interchangeable with the reference product.
We anticipate that the BPCIA will continue to evolve as the statute is implemented over a period of years. This likely will be accomplished by a variety of means, including FDA issuance of guidance documents, proposed regulations, and decisions in the course of considering specific applications. In that regard, the FDA has to date issued various guidance documents and other materials providing indications of the agency's thinking regarding any number of issues implicated by the BPCIA. Additionally, as the FDA continues to approve biosimilar applications, the agency's approach to certain issues will continue to be defined.
An additional requirement for FDA approval of NDAs and ANDAs is that our manufacturing procedures and operations conform to FDA requirements and guidelines, generally referred to as current Good Manufacturing Practices ("cGMP"). The requirements for FDA approval encompass all aspects of the production process, including validation and recordkeeping, the standards around which are continuously changing and evolving.
Facilities, procedures, operations and/or testing of products are subject to periodic inspection by the FDA, the Drug Enforcement Administration ("DEA") and other authorities. In addition, the FDA conducts pre-approval and post-approval reviews and plant inspections to determine whether our systems and processes are in compliance with cGMP and other FDA regulations. Our suppliers are subject to similar regulations and periodic inspections.
In 2012, the Food and Drug Administration Safety and Innovation Act ("FDASIA") was enacted into law. FDASIA is intended to enhance the safety and security of the U.S. drug supply chain by holding all drug manufacturers supplying products to the U.S. to the same FDA inspection standards. Specifically, prior to the passage of FDASIA, U.S. law required U.S. based manufacturers to be inspected by FDA every two years but remained silent with respect to foreign manufacturers, causing some foreign manufacturers to go as many as nine years without a routine FDA cGMP inspection, according to the Government Accountability Office.
FDASIA also includes the Generic Drug User Fee Agreement ("GDUFA"), a novel user fee program to provide funding to the FDA that focused on three key aims:
Safety – Ensure that industry participants, foreign or domestic, are held to consistent quality standards and are inspected with foreign and domestic parity using a risk-based approach.
11
Table of Contents
Access – Expedite the availability of generic drugs by bringing greater predictability to the review times for ANDAs, amendments and supplements and improving timeliness in the review process.
Transparency – Enhance FDA's visibility into the complex global supply environment by requiring the identification of facilities involved in the manufacture of drugs and associated APIs, and improve FDA's communications and feedback with industry.
In August 2017, the Food and Drug Administration Reauthorization Act reauthorized the generic drug user fee program, which provides for an updated fee structure through September 2022 ("GDUFA II"). Under GDUFA II, approximately 27% of the total fees paid to FDA are derived from facility fees paid by FDF manufacturers, API facilities, and contract manufacturers listed or referenced in pending or approved generic drug applications while approximately 35% derive from newly-implemented, tiered program fees based on the size of a company's ANDA product portfolio. The remaining approximately 38% of the total fees derive from application fees, including generic drug application fees and DMF fees. The objective of GDUFA II is to continue to ensure patients have access to safe, high-quality, and affordable generic medicines.
The process required by the FDA before a pharmaceutical product with active ingredients that have not been previously approved may be marketed in the U.S. generally involves the following:
• | laboratory and preclinical tests; |
• | submission of an Investigational New Drug ("IND") application, which must become effective before clinical studies may begin; |
• | adequate and well-controlled human clinical studies to establish the safety and efficacy of the proposed product for its intended use; |
• | submission of an NDA or BLA containing the results of the preclinical tests and clinical studies establishing the safety and efficacy of the proposed product for its intended use, as well as extensive data addressing matters such as manufacturing and quality assurance; |
• | scale-up to commercial manufacturing; and |
• | FDA approval of an NDA or BLA. |
Preclinical tests include laboratory evaluation of the product and its chemistry, formulation and stability, as well as toxicology and pharmacology studies to help define the pharmacological profile of the drug and assess the potential safety and efficacy of the product. The results of these studies are submitted to the FDA as part of the IND. They must demonstrate that the product delivers sufficient quantities of the drug to the bloodstream or intended site of action to produce the desired therapeutic results before human clinical trials may begin. These studies must also provide the appropriate supportive safety information necessary for the FDA to determine whether the clinical studies proposed to be conducted under the IND can safely proceed. The IND automatically becomes effective 30 days after receipt by the FDA unless the FDA, during that 30-day period, raises concerns or questions about the conduct of the proposed trials, as outlined in the IND. In such cases, the IND sponsor and the FDA must resolve any outstanding concerns before clinical trials may begin. In addition, an independent institutional review board must review and approve any clinical study prior to initiation.
Human clinical studies are typically conducted in three sequential phases, which may overlap:
• | Phase I – The drug is initially introduced into a relatively small number of healthy human subjects or patients and is tested for safety, dosage tolerance, mechanism of action, absorption, metabolism, distribution and excretion. |
• | Phase II – Studies are performed with a limited patient population to identify possible adverse effects and safety risks, to assess the efficacy of the product for specific targeted diseases or conditions, and to determine dosage tolerance and optimal dosage. |
• | Phase III – When Phase II evaluations demonstrate that a dosage range of the product is effective and has an acceptable safety profile, Phase III trials are undertaken to evaluate further dosage and clinical efficacy and to test further for safety in an expanded patient population at geographically dispersed clinical study sites. |
The results of the product development, preclinical studies and clinical studies are then submitted to the FDA as part of the NDA or BLA. The NDA/BLA drug development and approval process could take from three to more than ten years.
12
Table of Contents
Canada
In Canada, the approval process for innovative ("brand") pharmaceuticals is governed by Health Canada, the agency responsible for national public health, to ensure that the quality, safety and efficacy of the product have been established. A brand company may seek approval to sell an innovative product by submitting a new drug submission ("NDS") to Health Canada. The NDS will contain quality, safety and efficacy data from clinical trials of the drug in relevant patient populations. If Health Canada is satisfied with the quality, safety and efficacy described in the NDS, it issues a Notice of Compliance ("NOC") for that product. Once a NOC is obtained, the owner or exclusive licensee of patents relating to the brand drug may list patents relating to the medicinal ingredient, formulation, dosage form or the use of the drug on the Patent Register, which links the patent system to the generic regulatory approval process (discussed below).
The approval process for generic pharmaceuticals has two tracks that may proceed in parallel. The first track involves an examination of the product by Health Canada. Second persons (i.e., generic companies) may seek approval to sell a product by submitting an abbreviated new drug submission ("ANDS") to Health Canada to demonstrate that its product is bioequivalent to the brand reference product already marketed in Canada under an NOC. When Health Canada is satisfied with the quality, safety and efficacy described in the ANDS, it issues a NOC for that product, subject to any brand patents in the second track of the approval process.
The second track of the approval process is governed by the Patented Medicines NOC Regulations. Where a generic applicant makes direct or indirect reference in its ANDS to a brand product for which there are patents listed on the Patent Register, the generic must make at least one of the statutory allegations with respect to each patent listed (e.g., that the generic will await patent expiry, or the patent is invalid and/or would not be infringed). If the generic challenges the listed patent, it is required to serve the originator with a Notice of Allegation ("NOA"), which gives a detailed statement of the factual and legal basis for its allegations. If the brand wishes to seek an order prohibiting the issuance of the NOC to the generic, it must commence a court action within 45 days after it has been served with the NOA. The brand may elect whether to take advantage of a 24-month stay of the issuance of the NOC to the generic during the pendency of the PM (NOC) litigation. If an action is commenced and the brand elects to stay, Health Canada may not issue a NOC until the earlier of the determination of the proceeding by the court, or the expiration of 24 months. To obtain a prohibition order / declaration of infringement, the brand must satisfy the court that the generics' allegations of invalidity and/or non-infringement are not justified.
Section C.08.004.1 of the Canadian Food and Drug Regulations is the so-called data protection provision. A generic applicant does not need to perform duplicate clinical trials similar to those conducted by the first NOC holder (i.e., the brand), but is permitted to demonstrate safety and efficacy by submitting data demonstrating that its formulation is bioequivalent to the approved brand formulation. The first party to obtain an NOC for a drug in Canada will have an eight-year period of exclusivity starting from the date it received its NOC based on that clinical data. A subsequent applicant who seeks to establish safety and efficacy by comparing its product to the product that received the first NOC will not be able to file its own application until six years after the issuance of the first NOC, and cannot receive ultimate approval for an additional two years. If the first NOC holder also conducts clinical trials in pediatric populations, it will be entitled to an extra six months of data protection. A drug is only entitled to data protection so long as it is being marketed in Canada.
Facilities, procedures, operations and/or testing of products are subject to periodic inspection by Health Canada and the Health Products and Food Branch Inspectorate. In addition, Health Canada conducts reviews and plant inspections to determine whether our systems are in compliance with the good manufacturing practices in Canada, Drug Establishment Licensing ("EL") requirements and other provisions of the Regulations. Competitors are subject to similar regulations and inspections.
13
Table of Contents
Europe
The European Union ("EU") presents complex challenges from a regulatory perspective. There is over-arching legislation which is then implemented at a local level by the 28 individual member states, Iceland, Liechtenstein and Norway. Between 1995 and 1998, the legislation was revised in an attempt to simplify and harmonize product registration. This revised legislation introduced the mutual recognition ("MR") procedure, whereby after submission and approval by the authorities of the so-called reference member state ("RMS"), further applications can be submitted into the other chosen member states (known as concerned member states). Theoretically, the authorization of the RMS should be mutually recognized by the concerned member states. More typically, however, a degree of re-evaluation is carried out by the concerned member states. In November 2005, this legislation was further revised. In addition to the MR procedure, the decentralized procedure ("DCP") was introduced. The DCP is also led by the RMS, but applications are simultaneously submitted to all selected countries, provided that no national marketing authorization has been granted yet for the medicinal product in question. From 2005, the centralized procedure operated by the European Medicines Agency ("EMA") became available for generic versions of innovator products approved through the centralized authorization procedure. The centralized procedure results in a single marketing authorization (in addition to separate marketing authorizations for Iceland, Lichtenstein and Norway) which, once granted, can be used by the marketing-authorization holder to file for individual country reimbursement and make the medicine available in all of the EU countries listed on the application.
In the EU, the manufacture and sale of pharmaceutical products is regulated in a manner substantially similar to that of the U.S. requirements, which generally prohibit the handling, manufacture, marketing and importation of any pharmaceutical product unless it is properly registered in accordance with applicable law. The registration file relating to any particular product must contain medical data related to product efficacy and safety, including results of clinical testing and references to medical publications, as well as detailed information regarding production methods and quality control. Health ministries are authorized to cancel the registration of a product if it is found to be harmful or ineffective or if it is manufactured or marketed other than in accordance with registration conditions.
Pursuant to the MR procedure, a marketing authorization is first sought in one member state from the national regulatory agency. The RMS makes its assessment report on the quality, efficacy and safety of the medicinal product available to the other concerned member states where marketing authorizations are also sought under the MR procedure.
The DCP is based on the same fundamental idea as the MR procedure. In contrast to the MR procedure, however, the DCP requires that no national marketing authorization has yet been granted for the medicinal product. The pharmaceutical company applies for marketing authorization simultaneously in all the member states of the EU in which it wants to market the product. After consultation with the pharmaceutical company, one of the member states concerned in the DCP will become the RMS. The competent agency of the RMS undertakes the scientific evaluation of the medicinal product on behalf of the other concerned member states and coordinates the procedure. If all the member states involved (both RMSs and concerned member states) agree to grant marketing authorizations, this decision forms the basis for the granting of the national marketing authorizations in the respective member states.
Neither the MR nor DCPs result in automatic approval in all member states. If any member state has objections, particularly in relation to potential serious risk to public health, which cannot be resolved within the procedure scope and timelines, they will be referred to the coordination group for MR and DCPs and reviewed in a 60 -day procedure. If this 60 -day procedure does not result in a consensus by all member states, the product can be marketed in the countries whose health authorities agree that the product can be licensed. The issue raised will then enter a second referral procedure.
As with the MR procedure, the advantage of the DCP is that the pharmaceutical company receives identical marketing authorizations for its medicinal product in all the member states of the EU in which it wants to market the product. This leads to considerable streamlining of all regulatory activities in regard to the product. Variations, line extensions, renewals, and more are also handled in a coordinated manner with the RMS leading the activity.
Once a DCP has been completed, the pharmaceutical company can subsequently apply for marketing authorizations for the medicinal product in additional EU member states by means of the MR procedure.
All products, whether centrally authorized or authorized by the MR or DCP, may only be sold in other member states if the product information is in the official language of the state in which the product will be sold, which effectively requires specific packaging and labeling of the product.
Before a generic pharmaceutical product can be marketed in the EU, a marketing authorization must be obtained. If a generic pharmaceutical product is shown to be essentially the same as, or bioequivalent to, one that is already on the market
14
Table of Contents
and which has been authorized in the EU for a specified number of years, as explained in the section on data exclusivity below, no further preclinical or clinical trials are required for that new generic pharmaceutical product to be authorized. The generic applicant can file an abridged application for marketing authorization, but in order to take advantage of the abridged procedure, the generic manufacturer must demonstrate specific similarities, including bioequivalence, to the already authorized product. Access to clinical data of the reference drug is governed by the European laws relating to data exclusivity, which are outlined below. Other products, such as new dosages of established products, must be subjected to further testing, and "bridging data" in respect of these further tests must be submitted along with the abridged application.
An applicant for a generic marketing authorization currently cannot avail itself of the abridged procedure in the EU by relying on the originator pharmaceutical company's data until expiry of the relevant period of exclusivity given to that data. Since October 30, 2015, EU directive (2004/27/EC) provides for an eight -year data exclusivity period commencing from the grant of first marketing authorization. After the eight -year period has expired, a generic applicant can refer to the data of the originator pharmaceutical company in order to file an abridged application for approval of its generic equivalent product. Yet, conducting the necessary studies and trials for an abridged application, within the data exclusivity period, is not regarded as contrary to patent rights or to supplementary protection certificates for medicinal products. However, the applicant will not be able to launch its product for an additional two years. This ten -year total period may be extended to 11 years if the original marketing authorization holder obtains, within those initial eight years, a further authorization for a new therapeutic use of the product which is shown to be of significant clinical benefit. Further, specific data exclusivity for one year may be obtained for a new indication for a well-established substance, provided that significant preclinical or clinical studies were carried out in relation to the new indication.
Under the national procedure, a company applies for a marketing authorization in one member state. The national procedure can now only be used if the pharmaceutical company does not seek authorization in more than one member state. If it does seek wider marketing authorizations, it must use the MR or DCP.
In addition to obtaining approval for each product, in most EU countries the pharmaceutical product manufacturer's facilities must obtain approval from the national supervisory authority. The EU has a code of good manufacturing practice, with which the marketing authorization holder must comply. Regulatory authorities in the EU may conduct inspections of the manufacturing facilities to review procedures, operating systems and personnel qualifications.
In order to control expenditures on pharmaceuticals, most member states in the EU regulate the pricing and reimbursement of products and in some cases limit the range of different forms of drugs available for prescription by national health services. These controls can result in considerable price differences between member states. In addition, in past years, as part of overall programs to reduce healthcare costs, certain European governments have prohibited price increases and have introduced various systems designed to lower prices. Some European governments have also set minimum targets for generics prescribing.
Certain European markets in which Mylan does business have recently undergone, some for the first time, or will soon undergo, government-imposed price reductions or similar pricing pressures on pharmaceutical products. In addition, a number of markets in which we operate have implemented or may implement tender, or tender-like, systems for generic pharmaceuticals in an effort to lower prices. Under tender systems, health insurers invite manufacturers to submit bids that establish prices for generic pharmaceuticals. Upon winning the tender, the winning company may receive a preferential reimbursement for a period of time. Such measures are likely to have a negative impact on sales and gross profit in these markets. However, some pro-generic government initiatives in certain markets could help to offset some of this unfavorable effect by potentially increasing generic utilization.
Rest of World
Australia
The pharmaceutical industry is one of the most highly regulated industries in Australia. The Australian government is heavily involved in the operation of the industry, through the registration of medicines and licensing of manufacturing facilities, as well as subsidizing patient cost of most prescription medicines sold in Australia. The Australian government authority, the Therapeutic Goods Administration (the "TGA"), regulates the quality, safety and efficacy of therapeutic goods and is responsible for granting authorization to market pharmaceutical products in Australia and for inspecting and approving manufacturing facilities.
The TGA operates according to the Commonwealth of Australia's Therapeutic Goods Act 1989 (Cth) (the "Act"). Specifically, the Act regulates the registration, listing, quality, safety, efficacy, promotion and sale of therapeutic goods,
15
Table of Contents
including pharmaceuticals, supplied in Australia. The TGA carries out a range of assessment and monitoring activities to ensure that therapeutic goods available in Australia are of an acceptable standard with a goal of ensuring that the Australian community has access within a reasonable time to therapeutic advances. Australian manufacturers of all medicines must be licensed under Part 3-3 of the Act and their manufacturing processes must comply with the principles of good manufacturing practices in Australia. Similar standards and audits apply for both domestic and foreign manufactured products.
Generic medicines are subject to an abbreviated review process by the TGA, if the product can demonstrate essential similarity to the originator brand. Essential similarity means the same active ingredient in the same dose form, delivering the active ingredient to the patient at the same rate and extent, compared to the original brand. If proven, safety and efficacy is assumed to be the same.
All therapeutic goods manufactured for supply in Australia must be listed or registered in the Australian Register of Therapeutic Goods (the "ARTG") before they can be promoted or supplied for use and/or sale in Australia. The ARTG is a database kept for the purpose of compiling information in relation to therapeutic goods for use in humans and lists therapeutic goods which are approved for supply in Australia.
Medicines assessed as having a higher level of risk must be registered, while those with a lower level of risk can be listed. The majority of listed medicines are self-selected by consumers and used for self-treatment. In assessing the level of risk, factors such as the strength of a product, side effects, potential harm through prolonged use, toxicity and the seriousness of the medical condition for which the product is intended to be used are taken into account.
Labeling, packaging and advertising of pharmaceutical products are also regulated by the Act and other relevant statutes including fair trading laws and pharmaceutical industry codes.
Australia has a five-year data exclusivity period, whereby any data relating to a pharmaceutical product cannot be referred to or used in the examination by the TGA of another company's dossier, until five years after the original product was approved.
The Pharmaceutical Benefits Scheme (the "PBS"), which has been in place since 1948, subsidizes the cost to consumers of medicines listed on the PBS, if the medicines have demonstrated acceptable clinical need, cost and effectiveness. The goal of the PBS is to make medicines available at the lowest cost compatible with reliable supply and to base access on medical need rather than ability to pay.
The government exerts a significant degree of control over the pharmaceuticals market through the PBS. More than 80% of all prescription medicine sold in Australia is reimbursed by the PBS. The PBS is operated under the Commonwealth of Australia's National Health Act 1953. This statute governs matters such as who may sell pharmaceutical products, the prices at which pharmaceutical products may be sold to consumers and the prices government pays manufacturers, wholesalers and pharmacists for subsidized medicines.
If a new medicine is to be considered for listing on the PBS, the price is determined through a full health economic analysis submitted to the government's advisory committee, the Pharmaceutical Benefits Advisory Committee (the "PBAC"), based on incremental benefit to health outcome. If the incremental benefit justifies the price requested, the PBAC then makes a recommendation to the government to consider listing the product on the PBS. In May 2014, as part of a government reform program in Australia, the Pharmaceutical Benefits Pricing Authority was abolished and the Minister for Health ("Minister"), or delegate, considers pricing matters for approximately five to six weeks following PBAC meetings. Factors contributing to pricing decisions include items such as information on the claims made in a submission, advice from the PBAC, information about the proposed price, the price and use of comparative medicines and the cost of producing the medicine, although with additional associated costs. The Minister may recommend that the proposed price is accepted; further negotiations take place for a lower price or prices within a specific range; or for some products, risk sharing arrangements to be developed and agreed upon. The Australian government's purchasing power is used to obtain lower prices as a means of controlling the cost of the program. The PBS also stipulates the wholesaler margin for drugs listed on the PBS. Wholesalers therefore have little pricing power over the majority of their product range and as a result are unable to increase profitability by increasing prices.
Following entry of the first generic product(s) onto the market, the PBS price reimbursed to pharmacies decreases by 16% for both the originator product and generic products with a brand equivalence indicator permitting substitution at the pharmacy level. Thereafter, both the originator and generic suppliers are required to disclose pricing information relating to the sale of medicines to the Price Disclosure Data Administrator, and twelve months after initial generic entry, there is a further PBS price reduction based on the weighted average disclosed price if the weighted average disclosed price is 10% or more below the existing PBS price. Ongoing price disclosure cycles and calculation of the weighted average disclosed price occur
16
Table of Contents
every six months, and further reductions are made to the PBS price whenever the weighted average disclosed price is 10% or more below the existing PBS price. Effective from April 2016 to April 2020, the government introduced an annual 5% statutory price reduction for medicines in the F1 (originator) formulary. In addition, during 2017, the government proposed additional measures including an extension of the price reductions to 2022 and additional one-time statutory price reductions. The legislation for these proposals was passed by the Australian Parliament in February 2018. The price disclosure system has had, and will continue to have, a negative impact on sales and gross profit in this market.
Japan
In Japan, we are governed by various laws and regulations, including the Pharmaceutical Affairs Law (Law No. 145, 1960), as amended by the Pharmaceuticals and Medical Devices Law ("PMDL"), and the Products Liability Law (Law No. 85, 1994). The PMDL was amended in November 2014 to establish a fast-track authorization process for regenerative medicine products, restructure medical device regulation and establish reporting obligations for package inserts for drugs and medical devices. Regenerative medicine products are newly defined under the amended PMDL as a product for medical use in humans to reconstruct, restore, or form the structure or function of a human body, in which cells of humans are cultured or otherwise processed.
Under the amended PMDL, there are two routes to obtain authorization to manufacture and market a medicine product. The first route is the standard authorization system for drugs in which the efficacy and safety of the product must be shown in order to obtain authorization. The standard authorization procedure may take a significant amount of time to launch a regenerative medicine product because the quality of regenerative medicine products is heterogeneous by nature and therefore it is difficult to collect the data necessary to evaluate and demonstrate the efficacy. As such, the amended PMDL instituted the second route as follows: if the regenerative medicine product is heterogeneous, the efficacy of the regenerative medicine product is assumed. Thus, if the safety of the regenerative medicine product is demonstrated through clinical trials, the Minister of the Ministry of Health, Labor and Welfare ("MHLW") may authorize the applicant to manufacture and market the regenerative medicine product with certain conditions for a fixed term after receiving an expert opinion from the Pharmaceutical Affairs and Food Sanitation Council.
The amended PMDL also restructured medical device regulations including expanding the scope for certification in accordance with the classifications agreed upon by the Global Harmonization Task Force, new regulations on medical device software in which software may be authorized as a medical device independent of the medical device hardware into which it is incorporated, system change for medical device manufacturing so that a company may manufacture a medical device when the company registers such medical device and streamlined Quality Management Service Inspection such that the inspection is performed for each category of medical products.
In addition, under the amended PMDL, the holder of a business license for the manufacture and marketing of regenerative medicine products or medical devices must notify the MHLW of the contents of the package insert, including any cautionary statements necessary to use and deal with the products, before it manufactures and markets them. The license holder must also publish the contents of the package inserts on the website of the Pharmaceuticals and Medical Devices Agency.
Under the amended PMDL, the retailing or supply of a pharmaceutical that a person has manufactured (including manufacturing under license) or imported is defined as "marketing," and in order to market pharmaceuticals, one has to obtain a license, which we refer to herein as a Marketing License, from the MHLW. The authority to grant the "Marketing License" is delegated to prefectural governors; therefore, the relevant application must be filed with the relevant prefectural governor. A Marketing License will not be granted if the quality control system for the pharmaceutical for which the Marketing License has been applied or the post-marketing safety management system for the relevant pharmaceutical does not comply with the standards specified by the relevant Ministerial Ordinance made under the amended PMDL.
In addition to the Marketing License, a person intending to market a pharmaceutical must, for each product, obtain marketing approval from the MHLW with respect to such marketing, which we refer to herein as "Marketing Approval." Marketing Approval is granted subject to examination of the name, ingredients, quantities, structure, administration and dosage, method of use, indications and effects, performance and adverse reactions, and the quality, efficacy and safety of the pharmaceutical. A person intending to obtain Marketing Approval must attach materials, such as data related to the results of clinical trials (including a bioequivalence study, in the case of generic pharmaceuticals) or conditions of usage in foreign countries. Japan provides for market exclusivity through a reexamination system, which prevents the entry of generic pharmaceuticals until the end of the re-examination period, which can be up to eight years, and ten years in the case of drugs used to treat rare diseases ("orphan drugs").
17
Table of Contents
The authority to grant Marketing Approval in relation to pharmaceuticals for certain specified purposes (e.g., cold medicines and decongestants) is delegated to the prefectural governors by the MHLW, and applications in relation to such pharmaceuticals must be filed with the governor of the relevant prefecture where the relevant company's head office is located. Applications for pharmaceuticals for which the authority to grant the Marketing Approval remains with the MHLW must be filed with the Pharmaceuticals and Medical Devices Agency. When an application is submitted for a pharmaceutical whose active ingredients, quantities, administration and dosage, method of use, indications and effects are distinctly different from those of pharmaceuticals which have already been approved, the MHLW must seek the opinion of the Pharmaceutical Affairs and Food Sanitation Council.
The amended PMDL provides that when (a) the pharmaceutical that is the subject of an application is shown not to result in the indicated effects or performance indicated in the application, (b) the pharmaceutical is found to have no value as a pharmaceutical because it has harmful effects outweighing its indicated effects or performance, or (c) in addition to (a) and (b) above, when the pharmaceutical falls within the category designated by the relevant Ministerial Ordinance as not being appropriate as a pharmaceutical, Marketing Approval shall not be granted.
The MHLW must cancel a Marketing Approval, after hearing the opinion of the Pharmaceutical Affairs and Food Sanitation Council, when the MHLW finds that the relevant pharmaceutical falls under any of (a) through (c) above. In addition, the MHLW can order the amendment of a Marketing Approval when it is necessary to do so from the viewpoint of public health and hygiene. Moreover, the MHLW can order the cancellation or amendment of a Marketing Approval when (1) the necessary materials for re-examination or re-evaluation, which the MHLW has ordered considering the character of pharmaceuticals, have not been submitted, false materials have been submitted or the materials submitted do not comply with the criteria specified by the MHLW, (2) the relevant company's Marketing License has expired or has been canceled (a Marketing License needs to be renewed every five years), (3) the regulations regarding investigations of facilities in relation to manufacturing management standards or quality control have been violated, (4) the conditions set in relation to the Marketing Approval have been violated, or (5) the relevant pharmaceutical has not been marketed for three consecutive years without a due reason.
Doctors and pharmacists providing medical services pursuant to national health insurance (the "NHI") are prohibited from using pharmaceuticals other than those specified by the MHLW. The MHLW also specifies the standards of pharmaceutical prices, which we refer to herein as NHI Drug Price Standards. The NHI Drug Price Standards are used as the basis of the calculation of the price paid by medical insurance for pharmaceuticals. The governmental policy relating to medical services and the health insurance system, as well as the NHI Drug Price Standards, is revised every two years. At the end of 2017, the Council on Economic and Fiscal Policy, announced changes to various aspects of its drug pricing policies, including among others, a move from biannual drug pricing revisions to annual revisions.
Brazil
In Brazil, pharmaceutical manufacturers and all products and services that affect the health of the population are regulated by the National Agency of Sanitary Surveillance ("ANVISA"), created by Law No. 9,782, of January 26, 1999. ANVISA is a governmental body directly linked to the Ministry of Health and is part of the Unified Health System, responsible for the sanitary control of production, storage, distribution, importation and marketing of products and services subject to sanitary surveillance. ANVISA is also responsible for registering drugs and supervising quality control, as well as issuing licenses to companies for the manufacturing, handling, packaging, distribution, advertising, importation and exportation of pharmaceutical products. ANVISA regularly monitors the market's economic regulations and is responsible for the price control of pharmaceutical drugs.
Active Pharmaceutical Ingredients
The primary regulatory oversight of API manufacturers is through inspection of the manufacturing facility in which APIs are produced, as well as the manufacturing processes and standards employed in the facility. The regulatory process by which API manufacturers generally register their products for commercial sale in the U.S. and other similarly regulated countries is via the filing of a DMF. DMFs are confidential documents containing information on the manufacturing facility and processes used in the manufacture, characterization, quality control, packaging and storage of an API. The DMF is reviewed for completeness by the FDA, or other similar regulatory agencies in other countries, in conjunction with applications filed by FDF manufacturers, requesting approval to use the given API in the production of their drug products.
18
Table of Contents
Over-the-Counter Drug Products
A nonprescription, or OTC product, is a product that is sold directly to a consumer without a prescription from a healthcare professional, as compared to a prescription product, which may be sold only to consumers possessing a valid prescription. In many countries, OTC products are generally marketed with some type of safety and effectiveness review by a regulatory agency to ensure that they contain ingredients that are safe and effective when used as labeled without a physician's care. Like prescription products, an OTC product is also subjected to other general regulatory requirements, including those applicable to manufacturing practices and product advertising and promotion.
With the acquisition of Meda, the Company significantly enhanced its OTC product portfolio. The demand for OTC products is driven in part by government and healthcare provider cost pressures. The top OTC markets include developed markets like the U.S. and Europe as well as developing markets like China, Brazil and India, with the developing markets experiencing higher growth rates. In developed markets, the switch from prescription to OTC products in categories such as respiratory and gastrointestinal health has expanded access to treatments while reducing the cost for the healthcare systems.
Research and Development
R&D efforts are conducted on a global basis, primarily to enable us to develop, manufacture and market approved pharmaceutical products in accordance with applicable government regulations. Through various acquisitions, we have significantly bolstered our global R&D capabilities over the past several years, particularly in injectables and respiratory therapies. In the U.S., our largest market, the FDA is the principal regulatory body with respect to pharmaceutical products. Each of our other markets have separate pharmaceutical regulatory bodies, including, but not limited to, the National Agency for Medicines and Health Products in France, Health Canada, the Medicines and Healthcare Products Regulatory Agency in the U.K., the EMA (a decentralized body of the EU), the Federal Institute for Drugs and Medical Devices in Germany, the Health Products Regulatory Agency in Ireland, the Italian Medicines Agency, the Spanish Agency of Medicines and Medical Devices, the TGA in Australia, the MHLW in Japan, Drug Controller General of India, ANVISA in Brazil and the World Health Organization, the regulatory body of the United Nations.
Our global R&D strategy emphasizes the following areas:
• | development of branded, generic and biosimilar finished dose products for the global marketplace; |
• | development of pharmaceutical products that are technically difficult to formulate or manufacture because of either unusual factors that affect their stability or bioequivalence or unusually stringent regulatory requirements; |
• | development of novel controlled-release technologies and the application of these technologies to reference products; |
• | development of drugs that target smaller, specialized or underserved markets; |
• | development of generic drugs that represent first-to-file opportunities in the U.S. market; |
• | expansion of the existing oral solid dosage product portfolio, including with respect to additional dosage strengths; |
• | development of injectable products; |
• | development of unit dose oral inhalation products for nebulization; |
• | development of APIs; |
• | development of compounds using a dry powder inhaler and/or metered-dose inhaler for the treatment of asthma, COPD and other respiratory therapies; |
• | development of monoclonal anti-bodies (which are regulated as biologics); |
• | development of products as a result of changes in product status from prescription only to OTC; |
• | completion of additional preclinical and clinical studies for approved NDA products required by the FDA, known as post-approval (Phase IV) commitments; and |
• | conducting life-cycle management studies intended to further define the profile of products subject to pending or approved NDAs. |
The success of biosimilars in the marketplace and our ability to be successful in this emerging market will depend on the regulators' implementation of balanced scientific standards for approval, while not imposing excessive clinical testing
19
Table of Contents
demands or other hurdles for well-established products. Furthermore, an efficient patent resolution mechanism and a well-defined mechanism to grant interchangeability after the establishment of biosimilarity with the reference biological product will be key elements determining our future success in this area.
We have a robust pipeline. As of December 31, 2017 , we had approximately 2,733 marketing license approvals pending. During 2017 , we completed 1,240 global country level product submissions, which included 51 in North America, 519 in Europe and 670 in Rest of World. These submissions included those for existing products in new markets as well as products new to the Mylan portfolio.
During the year ended December 31, 2017 , we received 822 individual country product approvals globally, which was equal to 1,126 approved new marketing licenses. Of those total individual country product approvals globally, there were 82 approvals in North America, including 68 in the U.S.; 474 approvals in Europe; and 266 approvals in Rest of World, of which 23 approvals were for ARV products. The 68 approvals in the U.S. consisted of 56 final ANDA approvals and twelve tentative ANDA approvals. The 474 approvals in Europe covered 93 different products resulting in a total of 778 product marketing licenses. The 266 approvals in Rest of World included 226 approvals from emerging markets which represented 83 products in 49 countries.
As of December 31, 2017 , in the U.S. we had 211 ANDAs pending FDA approval, representing approximately $93.4 billion in annual sales for the brand name equivalents of these products for the year ended December 31, 2017 . Of those pending product applications, 46 were first-to-file Paragraph IV ANDA patent challenges, representing approximately $42.1 billion in annual brand sales for the year ended December 31, 2017 . The historic branded drug sales are not indicative of future generic sales, but are included to illustrate the size of the branded product market. Our R&D spending totaled approximately $783.3 million , $826.8 million and $671.9 million for the years ended December 31, 2017 , 2016 and 2015 , respectively.
Collaboration and Licensing Agreements
We periodically enter into collaboration and licensing agreements with other pharmaceutical companies for the development, manufacture, marketing and/or sale of pharmaceutical products. Our significant collaboration agreements are focused on the development, manufacture, supply and commercialization of multiple, high-value biosimilar compounds, insulin analog products and respiratory products. Under these agreements, we have future potential milestone payments and co-development expenses payable to third parties as part of our licensing, development and co-development programs. Payments under these agreements generally become due and are payable upon the satisfaction or achievement of certain developmental, regulatory or commercial milestones or as development expenses are incurred on defined projects. Milestone payment obligations are uncertain, including the prediction of timing and the occurrence of events triggering a future obligation. These agreements may also include potential sales-based milestones and call for us to pay a percentage of amounts earned from the sale of the product as a royalty or a profit share. These sales-based milestones or royalty obligations may be significant depending upon the level of commercial sales for each product. The Company's significant collaboration and licensing agreements include agreements with Pfizer, Momenta Pharmaceuticals, Inc. (" Momenta "), Theravance Biopharma, Inc. (" Theravance Biopharma "), and Biocon Ltd. ("Biocon"). Refer to Note 17 Collaboration and Licensing Agreements included in Item 8 in this Annual Report on Form 10-K for additional information related to our collaborations.
Patents, Trademarks and Licenses
We own or license a number of patents in the U.S. and other countries covering certain products and have also developed brand names and trademarks for other products. Generally, the branded pharmaceutical business relies upon patent protection to ensure market exclusivity for the life of the patent. We consider the overall protection of our patents, trademarks and license rights to be of significant value and act to protect these rights from infringement.
In the branded pharmaceutical industry, the majority of an innovative product's commercial value is usually realized during the period in which the product has market exclusivity. In the U.S. and some other countries, when market exclusivity expires and generic versions of a product are approved and marketed, there can often be very substantial and rapid declines in the branded product's sales. The rate of this decline varies by country and by therapeutic category; however, following patent expiration, branded products often continue to have market viability based upon the goodwill of the product name, which typically benefits from trademark protection.
An innovator product's market exclusivity is generally determined by two forms of intellectual property: patent rights held by the innovator company and any regulatory forms of exclusivity to which the innovator is entitled.
20
Table of Contents
Patents are a key determinant of market exclusivity for most branded pharmaceuticals. Patents provide the innovator with the right to lawfully exclude others from practicing an invention related to the medicine. Patents may cover, among other things, the active ingredient(s), various uses of a drug product, pharmaceutical formulations, drug delivery mechanisms and processes for (or intermediates useful in) the manufacture of products. Protection for individual products extends for varying periods in accordance with the expiration dates of patents in the various countries. The protection afforded, which may also vary from country to country, depends upon the type of patent, its scope of coverage and the availability of meaningful legal remedies in the country.
Market exclusivity is also sometimes influenced by regulatory intellectual property rights. Many developed countries provide certain non-patent incentives for the development of medicines. For example, the U.S., the EU and Japan each provide for a minimum period of time after the approval of a new drug during which the regulatory agency may not rely upon the innovator's data to approve a competitor's generic copy. Regulatory intellectual property rights are also available in certain markets as incentives for research on new indications, on orphan drugs and on medicines useful in treating pediatric patients. Regulatory intellectual property rights are independent of any patent rights and can be particularly important when a drug lacks broad patent protection. However, most regulatory forms of exclusivity do not prevent a competitor from gaining regulatory approval prior to the expiration of regulatory data exclusivity on the basis of the competitor's own safety and efficacy data on its drug, even when that drug is identical to that marketed by the innovator.
We estimate the likely market exclusivity period for each of our branded products on a case-by-case basis. It is not possible to predict the length of market exclusivity for any of our branded products with certainty because of the complex interaction between patent and regulatory forms of exclusivity and inherent uncertainties concerning patent litigation. There can be no assurance that a particular product will enjoy market exclusivity for the full period of time that we currently estimate or that the exclusivity will be limited to the estimate.
In addition to patents and regulatory forms of exclusivity, we also market products with trademarks. Trademarks have no effect on market exclusivity for a product, but are considered to have marketing value. Trademark protection continues in some countries as long as used; in other countries, as long as registered. Registration is for fixed terms and may be renewed indefinitely.
Customers and Marketing
In North America, we market products directly to wholesalers, distributors, retail pharmacy chains, long-term care facilities and mail order pharmacies. We also market our generic products indirectly to independent pharmacies, managed care organizations, hospitals, nursing homes, pharmacy benefit managers, GPOs and government entities. These customers, called "indirect customers," purchase our products primarily through our wholesale customers. In North America, wholesalers, retail drug chains, managed care organizations and payers have undergone, and are continuing to undergo, significant consolidation, which may result in these groups gaining additional purchasing leverage. Mylan markets its branded products to a number of different customer audiences in the U.S., including healthcare practitioners, wholesalers, pharmacists and pharmacy chains, hospitals, payers, pharmacy benefit managers, health maintenance organizations ("HMOs"), home healthcare, long-term care and patients. We reach these customers through our field-based sales force and National Accounts team, to increase our customers' understanding of the unique clinical characteristics and benefits of our branded products. Additionally, Mylan supports educational programs to consumers, physicians and patients.
In Europe and Rest of World, pharmaceuticals are sold to wholesalers, distributors, independent pharmacies and, in certain countries, directly to hospitals. Through a broad network of sales representatives, we adapt our marketing strategy to the different markets as dictated by their respective regulatory and competitive landscapes. Our API is sold primarily to pharmaceutical companies throughout the world, as well as to other Mylan subsidiaries.
The market for OTC products is growing and products are primarily marketed directly to consumers through a variety of media channels with an emphasis on developing and positioning the brands in a retail environment. The percentage of OTC products is generally higher in growth markets than in mature markets, often due to the fact that consumers in those markets have less access to advanced healthcare and reimbursement systems. In these circumstances, OTC products may replace prescription drugs. In more developed markets, demand for OTC products is driven by a growing interest in self-healing, wellness and improved quality of life. OTC products are commonly sold via retail channels such as pharmacies, drugstores or supermarkets directly to consumers. This makes it comparable to regular retail business with broad advertising and trade channel promotions. Consumers are often very loyal to well-known brands and as such, recommendation and reputation are very important in this market and it takes time and promotional effort to build strong brand names.
21
Table of Contents
Major Customers
The following table represents the percentage of consolidated third party net sales to Mylan's major customers during the years ended December 31, 2017 , 2016 and 2015 :
| Percentage of Third Party Net Sales | |||||||
| 2017 |
| 2016 |
| 2015 | |||
McKesson Corporation | 13 | % |
| 16 | % |
| 15 | % |
AmerisourceBergen Corporation | 8 | % |
| 14 | % |
| 16 | % |
Cardinal Health, Inc. | 10 | % |
| 11 | % |
| 12 | % |
Consistent with industry practice, we have a return policy that allows our customers to return product within a specified period prior to and subsequent to the expiration date. See the Application of Critical Accounting Policies section of our "Management's Discussion and Analysis of Results of Operations and Financial Condition" for a discussion of our more significant revenue recognition provisions.
Competition
Our primary competitors include other generic companies (both major multinational generic drug companies and various local generic drug companies) and branded drug companies that continue to sell or license branded pharmaceutical products after patent expirations and other statutory expirations. In the branded space, key competitors are generally other branded drug companies that compete based on their clinical characteristics and benefits. Our OTC products face competition from other major pharmaceutical companies and retailers who carry their own private label brands. Our ability to compete in the various OTC markets is affected by several factors, including customer acceptance, reputation, product quality, pricing and the effectiveness of our promotional activities. OTC markets are highly fragmented in terms of product categories and geographic market coverage.
Competitive factors in the major markets in which we participate can be summarized as follows:
North America
The U.S. pharmaceutical industry is very competitive. Our competitors vary depending upon therapeutic areas and product categories. Primary competitors include the major manufacturers of brand name, OTC and generic pharmaceuticals. The primary means of competition are innovation and development, timely FDA approval, manufacturing capabilities, product quality, marketing, portfolio size, customer service, reputation and price. The environment of the U.S. pharmaceutical marketplace is highly sensitive to price. To compete effectively, we rely on cost-effective manufacturing processes to meet the rapidly changing needs of our customers around a reliable, high quality supply of generic pharmaceutical products.
Our competitors include other generic manufacturers, as well as branded companies, including those who license their products to generic manufacturers prior to patent expiration or as relevant patents expire, or who enact pricing strategies for their brands in order to compete directly with generics. Further regulatory approval is not required for a branded manufacturer to sell its pharmaceutical products directly or through a third-party to the generic market, nor do such manufacturers face any other significant barriers to entry into such market. Our competitors for certain branded products include branded manufacturers who offer products for the treatment of COPD and severe allergies, as well as brand companies that license their products to generic manufacturers prior to patent expiration.
The U.S. pharmaceutical market is undergoing, and is expected to continue to undergo, rapid and significant technological changes, and we expect competition to intensify as technological advances are made. We intend to compete in this marketplace by (1) developing therapeutic equivalents to branded products and biosimilars that offer unique marketing opportunities, are difficult to formulate and/or have significant market size, (2) developing or licensing brand pharmaceutical products that are either patented or proprietary and (3) developing or licensing pharmaceutical products that are primarily for indications having relatively large patient populations or that have limited or inadequate treatments available, among other strategies.
Our sales can be impacted by new studies that indicate that a competitor's product has greater efficacy for treating a disease or particular form of a disease than one of our products. Sales of some of our products can also be impacted by additional labeling requirements relating to safety or convenience that may be imposed on our products by the FDA or by
22
Table of Contents
similar regulatory agencies. If competitors introduce new products and processes with therapeutic or cost advantages, our products can be subject to progressive price reductions and/or decreased volume of sales.
Medicaid, a U.S. federal healthcare program, requires pharmaceutical manufacturers to pay rebates to state Medicaid agencies. The rebates are based on the volume of drugs that are reimbursed by the states for Medicaid beneficiaries. Sales of Medicaid-reimbursed non-innovator products require manufacturers to rebate 13% of the average manufacturer's price and, effective beginning in 2017, adjusted by the Consumer Price Index-Urban (the "CPI-U") based on certain data. Sales of the Medicaid-reimbursed innovator or single-source products require manufacturers to rebate the greater of approximately 23% of the average manufacturer's price or the difference between the average manufacturer's price and the best price adjusted by the CPI-U based on certain data. We believe that federal or state governments will continue to enact measures aimed at reducing the cost of drugs to the public.
Under Part D of the Medicare Modernization Act, Medicare beneficiaries are eligible to obtain discounted prescription drug coverage from private sector providers. As a result, usage of pharmaceuticals has increased, which is a trend that we believe will continue to benefit the generic pharmaceutical industry. However, such potential sales increases may be offset by increased pricing pressures, due to the enhanced purchasing power of the private sector providers that are negotiating on behalf of Medicare beneficiaries.
Canada is a well-established generics market characterized by a number of local and multinational competitors. The individual Canadian provinces control pharmaceutical pricing and reimbursement. We expect to see a reduction in the list price on a number of products across multiple provinces in 2018.
Europe
The European markets continues to be highly competitive, especially in terms of pricing, quality standards, service levels and product portfolio. Many governments in Europe provide healthcare at low direct cost to consumers and regulate pharmaceutical prices or patient reimbursement levels to control costs for the government-sponsored healthcare system. A variety of cost-containment measures are utilized, including price cuts, mandatory rebates, value-based pricing, and international reference pricing, which is the practice of many countries linking their regulated medicine prices to those of other countries. Our leadership position in a number of countries provides us a platform to fulfill the needs of patients, physicians, pharmacies, customers and payors.
In France , generic penetration is relatively low compared to other large pharmaceutical markets, with low prices resulting from government initiatives. The government has indicated its support for the development of generics and biosimilars to generate savings for the healthcare system. In this context, pharmacists remain the primary customers in this market and the need for established relationships, driven by breadth of portfolio, and effective supply chain management is a key competitive advantage.
In Italy , the generic product penetration is relatively small due to few incentives for market stakeholders and in part to low prices on available brand name drugs. Additionally, the generic market in Italy has experienced a delay in product launches as compared to other European countries due to extended patent protection. The Italian government has put forth only limited measures aimed at increasing generic usage, and as such generic substitution is still in its early stages.
The U.K. is one of the most competitive off-patent markets, with low barriers to entry and a high degree of fragmentation. Competition among manufacturers, along with indirect control of pricing by the government, has led to strong downward pricing pressure. Companies in the U.K. will continue to compete on price, with consistent supply chain and breadth of product portfolio also coming into play.
Spain is a highly fragmented generic market with many participants. Growth in the Spanish generic market has slowed as compared to previous years and is now declining due to an unfavorable environment in spite of the INN prescribing implemented in many regions. Within the last few years, the Andalusia region, representing approximately 21% of the total retail market, has evolved into a tender market, which favors cost competitiveness. In other regions of Spain, companies are competing based on being first to market, offering a wide portfolio, building strong relationships with customers and providing a consistent supply of quality products.
The markets in the Netherlands and Germany have become highly competitive as a result of a large number of generic participants, both having one of the highest generic penetration rates in Europe and the continued use of tender systems. Under a tender system, health insurers are entitled to issue invitations to tender products. Pricing pressures resulting from an effort to
23
Table of Contents
win the tender will drive increased competition. Mylan is able to play a role in tenders but also has non-tendered sales, which provide further opportunities for growth.
Rest of World
Certain markets outside the U.S. and Europe are attractive because of the growing middle class within these countries combined with an increase in the demand for pharmaceutical products. In addition to the highly competitive environment in many emerging markets, governments in many of these markets are focused on constraining healthcare costs and have enacted price controls and other related measures. Beyond pricing and market access challenges, other conditions in emerging market countries can affect our efforts to continue to grow in these markets, including potential political instability, significant currency fluctuations and limited or changing availability of funding for healthcare. Significant countries within our Rest of World segment include the following.
In India , the commercial pharmaceutical market is a rapidly growing, highly fragmented generic market with a significant number of participants. Companies compete in India based on price, product portfolio and the ability to provide a consistent supply of quality products. Within the API market, intense competition by other API suppliers has, in recent years, led to increased pressure on prices. We expect that the exports of API and generic FDF products from India to developed markets will continue to increase. The success of Indian pharmaceutical companies is attributable to established development expertise in chemical synthesis and process engineering, development of FDF, availability of highly skilled labor and the low cost manufacturing base.
In Australia , the generic market is small by international standards, in terms of volume, value and the number of active participants. Generic penetration rates, however, continue to increase as government polices continue to drive volume growth.
In Japan , government initiatives have historically kept all drug prices low, resulting in little incentive for generic usage. More recent pro-generic actions by the government have led to growth in the generics market in recent years.
The Brazilian pharmaceutical market is the largest in South America. Since the entry into force of generic drug laws in Brazil , the generic segment of the pharmaceutical market has grown rapidly. The industry is highly competitive with a broad presence of multinational and national competitors.
Product Liability
Global product liability litigation represents an inherent risk to firms in the pharmaceutical industry. We utilize a combination of self-insurance (including through our wholly owned captive insurance subsidiary) and traditional third-party insurance policies with regard to our product liability claims. Our insurance coverage at any given time reflects market conditions, including cost and availability, existing at the time the policy was written and our decision to obtain commercial insurance coverage or to self-insure varies accordingly.
Raw Materials
Mylan utilizes a global approach to managing relationships with its suppliers. The APIs and other materials and supplies used in our pharmaceutical manufacturing operations are generally available and purchased from many different U.S. and non-U.S. suppliers, including Mylan India . However, in some cases, the raw materials used to manufacture pharmaceutical products are available only from a single supplier. Even when more than one supplier exists, we may choose, and in some cases have chosen, only to list one supplier in our applications submitted to the various regulatory agencies. Any change in a supplier not previously approved must then be submitted through a formal approval process.
Seasonality
Certain parts of our business are affected by seasonality, including products for asthma and allergy therapies which historically tend to have higher sales during the second and third quarters. In addition, the timing and severity of the cough, cold and flu season can cause variability in sales trends for certain of our prescription and OTC products. The seasonal impact of these particular products may affect a quarterly comparison within any fiscal year; however, this impact is generally not material to our annual consolidated results.
24
Table of Contents
Environment
We strive to comply in all material respects with applicable laws and regulations concerning the environment. While it is impossible to predict accurately the future costs associated with environmental compliance and potential remediation activities, compliance with environmental laws is not expected to require significant capital expenditures and has not had, and is not expected to have, a material adverse effect on our operations or competitive position.
Employees
As of December 31, 2017 , Mylan 's global workforce totaled approximately 35,000 employees and external contractors. Certain production and maintenance employees at our manufacturing facility in Morgantown, West Virginia, are represented by the United Steel, Paper and Forestry, Rubber, Manufacturing, Energy, Allied Industrial and Service Workers International Union and its Local Union 8-957 AFL-CIO. The current collective bargaining agreement for this union expires on March 17, 2023. In addition, there are non-U.S. Mylan locations that have employees who are unionized or part of works councils or trade unions.
Securities Exchange Act Reports
Mylan maintains an Internet website at the following address: Mylan.com . We make available on or through our website certain reports and amendments to those reports that Mylan files with the Securities and Exchange Commission (the "SEC") in accordance with the Securities Exchange Act of 1934 (the "Exchange Act"). These include our annual reports on Form 10-K, quarterly reports on Form 10-Q and current reports on Form 8-K. We make this information available on our website free of charge, as soon as reasonably practicable after electronically filed with, or furnished to, the SEC. The contents of our website are not incorporated by reference in this Annual Report on Form 10-K and shall not be deemed "filed" under the Exchange Act.
The public may also read and copy any materials that we file with the SEC at the SEC's Public Reference Room at 100 F Street NE, Washington, D.C. 20549. You may obtain information about the Public Reference Room by contacting the SEC at 1.800.SEC.0330. Reports filed with the SEC are also made available on the SEC website (www.sec.gov).
ITEM 1A. | Risk Factors |
We operate in a complex and rapidly changing environment that involves risks, many of which are beyond our control. Any of the following risks, if they occur, could have a material adverse effect on our business, financial condition, results of operations, cash flows, and/or share price. These risks should be read in conjunction with the other information in this Annual Report on Form 10-K.
PROVISIONS IN OUR GOVERNANCE ARRANGEMENTS OR THAT ARE OTHERWISE AVAILABLE UNDER DUTCH LAW COULD DISCOURAGE, DELAY, OR PREVENT A CHANGE IN CONTROL OF US AND MAY AFFECT THE MARKET PRICE OF OUR ORDINARY SHARES.
Some provisions of our governance arrangements that are available under Dutch law, such as our grant to a Dutch foundation (stichting) of a call option to acquire preferred shares to safeguard the interests of the Company, its businesses and its stakeholders against threats to our strategy, mission, independence, continuity and/or identity, may discourage, delay, or prevent a change in control of us, even if such a change in control is sought by our shareholders.
WE DO NOT ANTICIPATE PAYING DIVIDENDS FOR THE FORESEEABLE FUTURE, AND OUR SHAREHOLDERS MUST RELY ON INCREASES IN THE TRADING PRICE OF OUR ORDINARY SHARES TO OBTAIN A RETURN ON THEIR INVESTMENT.
Mylan N.V. does not anticipate paying dividends in the immediate future. We anticipate that we will retain all earnings, if any, to support our operations and to opportunistically pursue additional transactions to deliver additional shareholder value. Any future determination as to the payment of dividends will, subject to Dutch law requirements, be at the sole discretion of our board of directors and will depend on our financial position, results of operations, capital requirements, and other factors our board of directors deems relevant at that time. Holders of Mylan N.V.'s ordinary shares must rely on increases in the trading price of their shares to obtain a return on their investment in the foreseeable future.
THE MARKET PRICE OF OUR ORDINARY SHARES MAY BE VOLATILE, AND THE VALUE OF YOUR INVESTMENT COULD MATERIALLY DECLINE.
25
Table of Contents
Investors who hold Mylan N.V.'s ordinary shares may not be able to sell their shares at or above the price at which they purchased such shares. The share price of Mylan N.V.'s ordinary shares fluctuates materially from time to time, and we cannot predict the price of the ordinary shares at any given time. The risk factors described herein could cause the price of the ordinary shares to fluctuate materially. In addition, the stock market in general, including the market for pharmaceutical companies, has experienced price and volume fluctuations. These broad market and industry factors may materially harm the market price of the ordinary shares, regardless of our operating performance. In addition, the price of the ordinary shares may be affected by the valuations and recommendations of the analysts who cover us, and if our results do not meet the analysts' forecasts and expectations, the price of the ordinary shares could decline as a result of analysts lowering their valuations and recommendations or otherwise. In the past, following periods of volatility in the market and/or in the price of a company's stock, securities class-action litigation has been instituted against us and other companies. Such litigation could result in substantial costs and diversion of management's attention and resources, which could have a material adverse effect on our business, financial condition, results of operations, cash flows, and/or ordinary share price. We or our shareholders also may offer or sell our ordinary shares or securities convertible into or exchangeable or exercisable for ordinary shares. An increase in the number of the ordinary shares issued and outstanding and the possibility of sales of ordinary shares or securities convertible into or exchangeable or exercisable for ordinary shares may depress the future trading price of the ordinary shares. In addition, if additional offerings occur, the voting power of our then existing shareholders may be diluted.
OUR PRIOR ACQUISITIONS AND POTENTIAL FUTURE ACQUISITIONS MAY NOT ACHIEVE ALL INTENDED BENEFITS OR MAY DISRUPT OUR PLANS AND OPERATIONS.
There can be no assurance that we will be able to successfully complete the integration of acquired businesses or assets with Mylan, or otherwise fully realize the expected benefits of such transactions. We have grown very rapidly over the past several years as a result of increasing sales and several acquisitions and other transactions, and in the future may opportunistically pursue additional acquisition opportunities that make financial and strategic sense for us. We evaluate various strategic transactions and business arrangements, including acquisitions, asset purchases, partnerships, joint ventures, restructurings, divestitures and investments, on an ongoing basis. These transactions and arrangements may be material both from a strategic and financial perspective. Our growth has, and will continue to, put demands on our processes, systems, and employees. Furthermore, although our expectation is to engage in asset sales only if they advance or otherwise support our overall strategy, any such sale could reduce the size or scope of our business, our market share in particular markets or our opportunities with respect to certain markets, products or therapeutic categories.
In addition, the expected synergies and operating efficiencies of any transaction may not be fully realized within the expected timeframe or at all. Many of the factors that drive such expected synergies and operating efficiencies are outside of our control and the overall integration of a business or asset may result in material unanticipated problems, expenses, liabilities, competitive responses, loss of customer relationships, and diversion of management's attention, among other potential adverse consequences. The difficulties of integrating the operations of a business or asset with Mylan include the matters discussed above and, among others:
• | the diversion of management's attention to integration matters, including restructuring activities; |
• | difficulties in achieving anticipated synergies, operating efficiencies, business opportunities, and growth prospects from combining an acquired business or asset with Mylan; |
• | difficulties in the integration of operations and information technology ("IT") applications, including enterprise resource planning ("ERP") systems; |
• | difficulties in the integration of employees; |
• | difficulties in managing the expanded operations of a significantly larger and more complex company; |
• | challenges in keeping existing customers and obtaining new customers; |
• | challenges in reducing reliance on transition services prior to the expiration of any period in which such services are provided by a transaction counterparty; |
• | operational or financial difficulties that would not have occurred if acquired companies, businesses, or assets continued operating in their former structures; |
• | challenges in attracting and retaining key personnel; and |
• | with respect to the EPD Business, the complexities of managing the ongoing relationship with Abbott, and certain of its business partners, including agreements providing for certain services, development and manufacturing relationships, and license arrangements. |
26
Table of Contents
Any one or more of these matters could result in increased costs, decreases in the amount of expected revenues, and diversion of management's time and energy, and have a material adverse effect on our business, financial condition, results of operations, cash flows, and/or ordinary share price.
WE EXPECT TO BE TREATED AS A NON-U.S. CORPORATION FOR U.S. FEDERAL INCOME TAX PURPOSES. ANY CHANGES TO THE TAX LAWS OR CHANGES IN OTHER LAWS (INCLUDING UNDER APPLICABLE INCOME TAX TREATIES), REGULATIONS, RULES, OR INTERPRETATIONS THEREOF APPLICABLE TO INVERTED COMPANIES AND THEIR AFFILIATES, WHETHER ENACTED BEFORE OR AFTER THE EPD TRANSACTION, MAY MATERIALLY ADVERSELY AFFECT US.
Under current U.S. law, we believe that we should not be treated as a U.S. corporation for U.S. federal income tax purposes as a result of Mylan's acquisition of Mylan Inc. and the EPD Business (the "EPD Transaction"). Changes to Section 7874 of the U.S. Internal Revenue Code of 1986, as amended (the "Code"), or to the U.S. Treasury Regulations promulgated thereunder, or interpretations thereof, or to other relevant tax laws (including applicable income tax treaties), could affect our status as a non-U.S. corporation for U.S. federal income tax purposes and the tax consequences to us and our affiliates. Any such changes could have prospective or retroactive application, and may apply even if enacted or promulgated now that the EPD Transaction has closed. If we were to be treated as a U.S. corporation for U.S. federal income tax purposes, or if the relevant tax laws (including applicable income tax treaties) change, we would likely be subject to significantly greater U.S. tax liability than currently contemplated as a non-U.S. corporation or if the relevant tax laws (including applicable income tax treaties) had not changed.
On April 4, 2016, the U.S. Treasury Department and the U.S. Internal Revenue Service ("IRS") issued proposed and temporary regulations interpreting multiple sections of the Code (which were partially finalized on January 18, 2017), including Section 7874, to address inversion transactions and transactions that Treasury and the IRS characterize as "post-inversion tax avoidance transactions." Such regulations generally apply to transactions completed on or after September 22, 2014, although in some cases they have a later effective date of April 4, 2016. The regulations expand the set of circumstances under which Section 7874 applies to cause the foreign acquirer of a U.S. corporation to be treated as a U.S. corporation for U.S. federal income tax purposes. Such regulations also impose additional U.S. taxes on certain transactions involving the acquired U.S. corporation's controlled foreign corporations. The regulations do not affect our belief that we expect to be treated as a non-U.S. corporation for U.S. federal income tax purposes.
However, if ultimately upheld by a reviewing court, the regulations limit our ability to engage in various intercompany transactions involving non-U.S. subsidiaries. In addition, the U.S. Treasury Department and the IRS issued final and temporary regulations on October 13, 2016, which might limit our ability to deduct interest expense on certain intercompany debt for U.S. federal income tax purposes.
THE IRS MAY NOT AGREE THAT WE SHOULD BE TREATED AS A NON-U.S. CORPORATION FOR U.S. FEDERAL INCOME TAX PURPOSES.
The IRS may not agree that we should be treated as a non-U.S. corporation for U.S. federal income tax purposes. Although we are not incorporated in the U.S. and expect to be treated as a non-U.S. corporation for U.S. federal income tax purposes, the IRS may assert that we should be treated as a U.S. corporation for U.S. federal income tax purposes. If we were to be treated as a U.S. corporation for U.S. federal income tax purposes, we would likely be subject to significantly greater U.S. tax liability than currently contemplated as a non-U.S. corporation.
IF THE INTERCOMPANY TERMS OF CROSS BORDER ARRANGEMENTS THAT WE HAVE AMONG OUR SUBSIDIARIES ARE DETERMINED TO BE INAPPROPRIATE OR INEFFECTIVE, OUR TAX LIABILITY MAY INCREASE.
We have potential tax exposures resulting from the varying application of statutes, regulations, and interpretations which include exposures on intercompany terms of cross-border arrangements among our subsidiaries (including intercompany loans, sales, and services agreements) in relation to various aspects of our business, including manufacturing, marketing, sales, and delivery functions. Although we believe our cross-border arrangements among our subsidiaries are based upon internationally accepted standards and applicable law, tax authorities in various jurisdictions may disagree with and subsequently challenge the amount of profits taxed in their country, which may result in increased tax liability, including accrued interest and penalties, which would cause our tax expense to increase and could have a material adverse effect on our business, financial condition, results of operations, cash flows, and/or ordinary share price.
27
Table of Contents
WE MAY NOT BE ABLE TO MAINTAIN COMPETITIVE FINANCIAL FLEXIBILITY AND OUR CORPORATE TAX RATE, AND NEW U.S. TAX LEGISLATION COULD ADVERSELY AFFECT US AND OUR SHAREHOLDERS.
We believe that our structure and operations give us the ability to achieve competitive financial flexibility and a competitive worldwide effective corporate tax rate. The material assumptions underlying our expected tax rates include the fact that we expect certain of our businesses will be operated outside of the U.S. and, as such, will be subject to a lower tax rate than operations in the U.S., which will result in a lower blended worldwide tax rate than we were previously able to achieve. We must also make assumptions regarding the effect of certain internal reorganization transactions, including various intercompany transactions. We cannot give any assurance as to what our effective tax rate will be, however, because of, among other reasons, uncertainty regarding the tax policies of the jurisdictions where we operate, potential changes of laws and interpretations thereof, and the potential for tax audits or challenges. Our actual effective tax rate may vary from our expectation and that variance may be material. Additionally, the tax laws of the U.K., the Netherlands and other jurisdictions could change in the future, and such changes could cause a material change in our effective tax rate.
On December 22, 2017, the U.S. government enacted comprehensive tax legislation commonly referred to as the Tax Cuts and Jobs Act (the "Tax Act"). The Tax Act makes broad and complex changes to the Code, including, but not limited to, reducing the U.S. federal corporate income tax rate from 35% to 21% effective for tax years beginning after December 31, 2017 and requiring a one-time transition tax on certain unrepatriated earnings of non-U.S. corporate subsidiaries of large U.S. shareholders that may electively be paid over eight years. The Tax Act also puts in place new tax laws that will impact our taxable income beginning in 2018, which include, but are not limited to (1) creating a Base Erosion Anti-Abuse Tax, which is a new minimum tax, (2) generally eliminating U.S. federal income taxes on dividends from foreign subsidiaries, (3) a new provision designed to tax currently global intangible low-taxed income ("GILTI") earned by non-U.S. corporate subsidiaries of large U.S. shareholders, which allows for the possibility of utilizing foreign tax credits (foreign tax credits are limited to 80% of foreign taxes paid that are properly attributable to GILTI and are segregated into a separate basket, with no carryforward or carryback permitted for excess foreign tax credits) and a deduction generally equal to 50% of GILTI (37.5% for tax years beginning after December 31, 2025) to offset the income tax liability, (4) a provision limiting the amount of deductible interest expense in the U.S., (5) the repeal of the domestic manufacturing deduction, (6) limitations on the deductibility of certain executive compensation, and (7) limitations on the utilization of foreign tax credits to reduce the U.S. income tax liability. We are currently evaluating the impact of the Tax Act on our business and our effective tax rate, and we cannot yet be certain what the effect will be.
Any of the factors discussed above could materially increase our overall effective income tax rate and income tax expense and could have a material adverse effect on our business, financial condition, results of operations, cash flows, and/or ordinary share price.
UNANTICIPATED CHANGES IN OUR TAX PROVISIONS OR EXPOSURE TO ADDITIONAL INCOME TAX LIABILITIES AND CHANGES IN INCOME TAX LAWS AND TAX RULINGS MAY HAVE A SIGNIFICANT ADVERSE IMPACT ON OUR EFFECTIVE TAX RATE AND INCOME TAX EXPENSE.
We are subject to income taxes in many jurisdictions. Significant analysis and judgment are required in determining our worldwide provision for income taxes. In the ordinary course of business, there are many transactions and calculations where the ultimate tax determination is uncertain. The final determination of any tax audits or related litigation could be materially different from our income tax provisions and accruals.
Additionally, changes in the effective tax rate as a result of a change in the mix of earnings in countries with differing statutory tax rates, changes in our overall profitability, changes in the valuation of deferred tax assets and liabilities, the results of audits and the examination of previously filed tax returns by taxing authorities, and continuing assessments of our tax exposures could impact our tax liabilities and affect our income tax expense, which could have a material adverse effect on our business, financial condition, results of operations, cash flows, and/or ordinary share price.
WE MAY BECOME TAXABLE IN A JURISDICTION OTHER THAN THE U.K. AND THIS MAY INCREASE THE AGGREGATE TAX BURDEN ON US.
Based on our current management structure and current tax laws of the U.S., the U.K., and the Netherlands, as well as applicable income tax treaties, and current interpretations thereof, the U.K. and the Netherlands competent authorities have determined that we are tax resident solely in the U.K. for the purposes of the Netherlands-U.K. tax treaty. We have received a binding ruling from the competent authorities in the U.K. and in the Netherlands confirming this treatment. We will therefore be tax resident solely in the U.K. so long as the facts and circumstances set forth in the relevant application letters sent to those authorities remain accurate. Even though we received a binding ruling, the applicable tax laws or interpretations thereof may
28
Table of Contents
change, or the assumptions on which such rulings were based may differ from the facts. As a consequence, we may become a tax resident of a jurisdiction other than the U.K. As a consequence, our overall effective income tax rate and income tax expense could materially increase, which could have a material adverse effect on our business, financial condition, results of operations, cash flows, and/or ordinary share price.
WE MAY BE ADVERSELY AFFECTED BY INCREASED SCRUTINY FROM THIRD PARTIES, INCLUDING GOVERNMENTS, OR NEGATIVE PUBLICITY WITH RESPECT TO MATTERS RELATING TO OUR PRODUCTS, PRICING PRACTICES AND OTHER MATTERS.
There has been increased press coverage and increased scrutiny from third parties, including regulators, legislative bodies and enforcement agencies, with respect to matters relating to the Company's business and pricing practices, and other matters related to the Company. This increased press coverage and public scrutiny, including protests by some consumers, have included assertions of wrongdoing by the Company which, regardless of the factual or legal basis for such assertions, have resulted in, and may continue to result in, investigations, and calls for investigations, by governmental agencies at both the federal and state levels and have resulted in, and may continue to result in, claims brought against the Company by governmental agencies or by private parties or by regulators taking other measures that could have a negative effect on the Company's business. For example, both the U.S. House of Representatives and the U.S. Senate have conducted numerous hearings with respect to pharmaceutical drug pricing practices, including in connection with the investigation of specific price increases by several pharmaceutical companies, including Mylan. It is not possible to predict the ultimate outcome of any such investigations or claims or what other investigations or lawsuits or regulatory responses may result from such assertions, or their impact on the Company's business, financial condition, results of operations, cash flows, and/or ordinary share price. Any such investigation or claim could also result in reputational harm and reduced market acceptance and demand for our products, could harm our ability to market our products in the future, could cause us to incur significant expense, could cause our senior management to be distracted from execution of our business strategy, and could have a material adverse effect on our business, financial condition, results of operations, cash flows and/or ordinary share price.
There has also recently been intense publicity regarding the pricing of pharmaceuticals more generally, including publicity and pressure resulting from prices charged by competitors and peer companies for new products as well as price increases by competitors and peer companies on older products that the public has deemed excessive. We have experienced and may continue to experience downward pricing pressure on the price of certain of our products due to social or political pressure to lower the cost of drugs, which could reduce our revenue and future profitability.
WE HAVE AND MAY CONTINUE TO EXPERIENCE PRESSURE ON THE PRICING OF AND REIMBURSEMENTS FOR CERTAIN OF OUR PRODUCTS DUE TO CONSOLIDATION AMONG PURCHASERS OR SOCIAL AND POLITICAL PRESSURE TO LOWER THE COST OF DRUGS, WHICH COULD IMPACT OUR FINANCIAL CONDITION OR RESULTS OF OPERATIONS.
We operate in a challenging environment, with significant pressures on the pricing of our products and on our ability to obtain and maintain satisfactory rates of reimbursement for our products by governments, insurers and other payors. The growth of overall healthcare costs has led governments and payors to implement new measures to control healthcare spending. As a result, we face numerous cost-containment measures by governments and other payors, including government-imposed industry-wide price reductions, mandatory pricing systems, reference pricing systems, tender systems, shifting of the payment burden to patients through higher co-payments, and requirements for increased transparency on pricing. In the U.S., these pressures are further compounded by increasing consolidation among wholesalers, retailer drug chains, pharmacy benefit managers, private insurers, managed care organizations and other private payors, which can increase their negotiating power, particularly with respect to our generic drugs. Refer to " A SIGNIFICANT PORTION OF OUR REVENUES IS DERIVED FROM SALES TO A LIMITED NUMBER OF CUSTOMERS. "
There has also been increasing U.S. federal and state legislative and enforcement interest with respect to drug pricing. In particular, U.S. federal prosecutors have issued subpoenas to pharmaceutical companies, including Mylan, seeking information about their drug pricing practices, among other issues, and members of the Congress have sought information from certain pharmaceutical companies, including Mylan, relating to drug-price increases.
In addition, there has been legislation and legislative proposals concerning drug prices and related issues, including the perceived need to bring more transparency to drug pricing, reviewing the relationship between pricing and manufacturer patient programs, and reforming government program reimbursement methodologies for drugs. For example, in October 2017, the State of Maryland enacted legislation prohibiting pharmaceutical manufacturers from selling certain off-patent or generic drugs with purported "unconscionable" price increases. This type of legislation, at the federal or state level, could affect demand for,
29
Table of Contents
or pricing of, our products and we cannot predict what, if any, additional legislative developments may transpire or what the ultimate impact may be.
Any of the events or developments described above could have a material adverse impact on our business, financial condition or results of operations, cash flows and/or ordinary share price, as well as on our reputation.
CURRENT AND CHANGING ECONOMIC CONDITIONS MAY ADVERSELY AFFECT OUR INDUSTRY, BUSINESS, PARTNERS AND SUPPLIERS, FINANCIAL CONDITION, RESULTS OF OPERATIONS, CASH FLOWS, AND/OR ORDINARY SHARE PRICE.
The global economy continues to experience significant volatility, and the economic environment may continue to be, or become, less favorable than that of past years. Economic volatility, governmental financial restructuring efforts and/or evolving deficit and spending reduction programs could negatively impact the global economy and/or the pharmaceutical industry. This has led, and/or could lead, to reduced consumer and customer spending and/or reduced or eliminated governmental or third party payor coverage or reimbursement in the foreseeable future, and this may include reduced spending on healthcare, including but not limited to pharmaceutical products. While generic drugs present an alternative to higher-priced branded products, our sales could be negatively impacted if patients forego obtaining healthcare, patients and customers reduce spending or purchases, and/or if governments and/or third-party payors reduce or eliminate coverage or reimbursement amounts for pharmaceuticals and/or impose price or other controls adversely impacting the price or availability of pharmaceuticals. In addition, reduced consumer and customer spending, and/or reduced government and/or third-party payor coverage or reimbursement, and/or new government controls, may drive us and our competitors to decrease prices and/or may reduce the ability of customers to pay and/or may result in reduced demand for our products. The occurrence of any of these risks could have a material adverse effect on our industry, business, financial condition, results of operations, cash flows, and/or ordinary share price.
OUR BUSINESS, FINANCIAL CONDITION, AND RESULTS OF OPERATIONS ARE SUBJECT TO RISKS ARISING FROM THE INTERNATIONAL SCOPE OF OUR OPERATIONS.
Our operations extend to numerous countries outside the U.S., including our significant operations in India, and are subject to the risks inherent in conducting business globally and under the laws, regulations, and customs of various jurisdictions. These risks include, but are not limited to:
• | compliance with a variety of national and local laws of countries in which we do business, including, but not limited to, data privacy and security, restrictions on the import and export of certain intermediates, drugs, and technologies, as well as compliance with multiple regulatory regimes, differing data protection requirements and differing degrees of protection for intellectual property; |
• | less established legal and regulatory regimes in certain jurisdictions; |
• | compliance with a variety of U.S. laws including, but not limited to, the Iran Threat Reduction and Syria Human Rights Act of 2012 and rules relating to the use of certain "conflict minerals" under Section 1502 of the Dodd-Frank Wall Street Reform and the Consumer Protection Act; |
• | changes in laws, regulations, and practices affecting the pharmaceutical industry and the healthcare system, including but not limited to imports, exports, manufacturing, quality, cost, pricing, reimbursement, approval, inspection, and delivery of healthcare; |
• | changes in policies designed to promote foreign investment, including significant tax incentives, liberalized import and export duties, and preferential rules on foreign investment and repatriation; |
• | differing local product preferences and product requirements; |
• | adverse changes in the economies in which we or our partners and suppliers operate as a result of a slowdown in overall growth, a change in government or economic policies, or financial, political, or social change or instability in such countries that affects the markets in which we operate, particularly emerging markets; |
• | changes in employment laws, wage increases, or rising inflation in the countries in which we or our partners and suppliers operate; |
• | supply disruptions and increases in energy and transportation costs; |
• | natural disasters, including droughts, floods, and earthquakes in the countries in which we operate; |
30
Table of Contents
• | local disturbances, terrorist attacks, riots, social disruption, wars, or regional hostilities in the countries in which we or our partners and suppliers operate and that could affect the economy, our operations and employees by disrupting operations and communications, making travel and the conduct of our business more difficult, and/or causing our customers to be concerned about our ability to meet their needs; and |
• | government uncertainty, including as a result of new or changed laws and regulations. |
We also face the risk that some of our competitors have more experience with operations in such countries or with international operations generally and may be able to manage unexpected crises more easily. Moreover, the internal political stability of, or the relationship between, any country or countries where we conduct business operations may deteriorate. Changes in a country's political stability or the state of relations between any such countries are difficult to predict and the political or social stability in and/or diplomatic relations between any countries in which we or our partners and suppliers do business could meaningfully deteriorate.
The occurrence of any one or more of the above risks could have a material adverse effect on our business, financial condition, results of operations, cash flows, and/or ordinary share price.
WE ARE SUBJECT TO THE U.S. FOREIGN CORRUPT PRACTICES ACT, THE U.K. BRIBERY ACT, AND SIMILAR WORLDWIDE ANTI-CORRUPTION LAWS, WHICH IMPOSE RESTRICTIONS ON CERTAIN CONDUCT AND MAY CARRY SUBSTANTIAL FINES AND PENALTIES.
We are subject to the U.S. Foreign Corrupt Practices Act, the U.K. Bribery Act and similar anti-corruption laws in other jurisdictions. These laws generally prohibit companies and their intermediaries from engaging in bribery or making other prohibited payments to government officials for the purpose of obtaining or retaining business, and some have record keeping requirements. The failure to comply with these laws could result in substantial criminal and/or monetary penalties. We operate in jurisdictions that have experienced corruption, bribery, pay-offs and other similar practices from time-to-time and, in certain circumstances, such practices may be local custom. We have implemented internal control policies and procedures that mandate compliance with these anti-corruption laws. However, we cannot be certain that these policies and procedures will protect us against liability. There can be no assurance that our employees or other agents will not engage in such conduct for which we might be held responsible. If our employees or agents are found to have engaged in such practices, we could suffer severe criminal or civil penalties and other consequences that could have a material adverse effect on our business, financial condition, results of operations, cash flows, and/or ordinary share price.
OUR FAILURE TO COMPLY WITH APPLICABLE ENVIRONMENTAL AND OCCUPATIONAL HEALTH AND SAFETY LAWS AND REGULATIONS WORLDWIDE COULD ADVERSELY IMPACT OUR BUSINESS, FINANCIAL CONDITION, RESULTS OF OPERATIONS, CASH FLOWS, AND/OR ORDINARY SHARE PRICE.
We are subject to various U.S. federal, state, and local and non-U.S. laws and regulations concerning, among other things, the environment, climate change, regulation of chemicals, employee safety and product safety. These requirements include regulation of the handling, manufacture, transportation, storage, use and disposal of materials, including the discharge of hazardous materials and pollutants into the environment. In the normal course of our business, we are exposed to risks relating to possible releases of hazardous substances into the environment, which could cause environmental or property damage or personal injuries, and which could result in (i) our noncompliance with such environmental and occupational health and safety laws and regulations and (ii) regulatory enforcement actions or claims for personal injury and property damage against us. If an unapproved or illegal environmental discharge occurs, or if we discover contamination caused by prior operations, including by prior owners and operators of properties we acquire, we could be liable for cleanup obligations, damages and fines. The substantial unexpected costs we may incur could have a material and adverse effect on our business, financial condition, results of operations, cash flows, and/or ordinary share price. In addition, our environmental capital expenditures and costs for environmental compliance may increase substantially in the future as a result of changes in environmental laws and regulations, the development and manufacturing of a new product or increased development or manufacturing activities at any of our facilities. We may be required to expend significant funds and our manufacturing activities could be delayed or suspended, which could have a material adverse effect on our business, financial condition, results of operations, cash flows, and/or ordinary share price.
CURRENCY FLUCTUATIONS AND CHANGES IN EXCHANGE RATES COULD ADVERSELY AFFECT OUR BUSINESS, FINANCIAL CONDITION, RESULTS OF OPERATIONS, CASH FLOWS, AND/OR ORDINARY SHARE PRICE.
31
Table of Contents
Although we report our financial results in U.S. Dollars, a significant portion of our revenues, indebtedness and other liabilities and our costs are denominated in non-U.S. currencies, including among others the Euro, Swedish Krona, Indian Rupee, Japanese Yen, Australian Dollar, Canadian Dollar, British Pound Sterling and Brazilian Real. Our results of operations and, in some cases, cash flows, have in the past been and may in the future be adversely affected by certain movements in currency exchange rates. Defaults or restructurings in other countries could have a similar adverse impact. From time to time, we may implement currency hedges intended to reduce our exposure to changes in foreign currency exchange rates. However, our hedging strategies may not be successful, and any of our unhedged foreign exchange exposures will continue to be subject to market fluctuations. The occurrence of any of the above risks could cause a material adverse effect on our business, financial condition, results of operations, cash flows, and/or ordinary share price.
AN INABILITY TO EFFECTIVELY DEAL WITH AND RESPOND TO UNSOLICITED BUSINESS PROPOSALS COULD LIMIT OUR FUTURE GROWTH AND HAVE A MATERIAL ADVERSE EFFECT ON OUR BUSINESS, FINANCIAL CONDITION, RESULTS OF OPERATIONS, CASH FLOWS, AND/OR ORDINARY SHARE PRICE.
We have in the past and may in the future receive proposals to acquire all of our outstanding shares or similar unsolicited business proposals. Such unsolicited business proposals may not be consistent with or enhancing to our financial, operational, or market strategies and may not further the interests of our shareholders and other stakeholders, including employees, creditors, customers, suppliers, relevant patient populations and communities in which Mylan operates and may jeopardize the sustainable success of Mylan's business. However, the evaluation of and response to such unsolicited business proposals may nevertheless distract management and/or disrupt our ongoing businesses, which may adversely affect our relationships with customers, employees, partners, suppliers, regulators, and others with whom we have business or other dealings.
CHARGES TO EARNINGS RESULTING FROM ACQUISITIONS COULD HAVE A MATERIAL ADVERSE EFFECT ON OUR BUSINESS, FINANCIAL CONDITION, RESULTS OF OPERATIONS, CASH FLOWS AND/OR ORDINARY SHARE PRICE.
Under accounting principles generally accepted in the U.S. ("U.S. GAAP") relating to business acquisition accounting standards, we recognize the identifiable assets acquired, the liabilities assumed, and any noncontrolling interests in acquired companies generally at their acquisition date fair values and, in each case, separately from goodwill. Goodwill as of the acquisition date is measured as the excess amount of consideration transferred, which is also generally measured at fair value, and the net of the acquisition date amounts of the identifiable assets acquired and the liabilities assumed. Our estimates of fair value are based upon assumptions believed to be reasonable but which are inherently uncertain. After we complete an acquisition, the following factors could result in material charges and adversely affect our operating results and may adversely affect our cash flows:
• | costs incurred to combine the operations of companies we acquire, such as transitional employee expenses and employee retention, redeployment or relocation expenses; |
• | impairment of goodwill or intangible assets, including acquired in-process research and development; |
• | amortization of intangible assets acquired; |
• | a reduction in the useful lives of intangible assets acquired; |
• | identification of or changes to assumed contingent liabilities, including, but not limited to, contingent purchase price consideration including fair value adjustments, income tax contingencies and other non-income tax contingencies, after our final determination of the amounts for these contingencies or the conclusion of the measurement period (generally up to one year from the acquisition date), whichever comes first; |
• | charges to our operating results to eliminate certain duplicative pre-acquisition activities, to restructure our operations or to reduce our cost structure; and |
• | charges to our operating results resulting from expenses incurred to effect the acquisition. |
A significant portion of these adjustments could be accounted for as expenses that will decrease our net income and earnings per share for the periods in which those costs are incurred. Such charges could cause a material adverse effect on our business, financial condition, results of operations, cash flows, and/or ordinary share price.
THE SIGNIFICANT AND INCREASING AMOUNT OF INTANGIBLE ASSETS AND GOODWILL RECORDED ON OUR BALANCE SHEET, MAINLY RELATED TO ACQUISITIONS, MAY LEAD TO SIGNIFICANT IMPAIRMENT CHARGES IN THE FUTURE WHICH COULD LEAD US TO HAVE TO TAKE SIGNIFICANT CHARGES AGAINST EARNINGS.
32
Table of Contents
We regularly review our long-lived assets, including identifiable intangible assets and goodwill, for impairment. Goodwill and indefinite-lived intangible assets are subject to impairment assessment at least annually. Other long-lived assets are reviewed when there is an indication that an impairment may have occurred. The amount of goodwill and identifiable intangible assets on our consolidated balance sheets has increased significantly as a result of our acquisitions and other transactions, including Meda, and may increase further following future potential acquisitions. In addition, we may from time to time sell assets that we determine are not critical to our strategy or execution. Future events or decisions may lead to asset impairments and/or related charges. Certain non-cash impairments may result from a change in our strategic goals, business direction or other factors relating to the overall business environment. Any impairment of the value of goodwill or other intangible assets will result in a charge against earnings, which could have a material adverse effect on our business, financial condition, results of operations, shareholder's equity, and/or ordinary share price.
THE PHARMACEUTICAL INDUSTRY IS HEAVILY REGULATED AND WE FACE SIGNIFICANT COSTS AND UNCERTAINTIES ASSOCIATED WITH OUR EFFORTS TO COMPLY WITH APPLICABLE LAWS AND REGULATIONS.
The pharmaceutical industry is subject to regulation by various governmental authorities. For instance, we must comply with applicable laws and requirements of the FDA and other regulatory agencies, including foreign authorities, in our other markets with respect to the research, development, manufacture, quality, safety, effectiveness, approval, labeling, tracking, tracing, authentication, storage, record-keeping, reporting, pharmacovigilance, sale, distribution, import, export, marketing, advertising, and promotion of pharmaceutical products. Failure to comply with regulations of the FDA and other U.S. and foreign regulators could result in a range of consequences, including, but not limited to, fines, penalties, disgorgement, unanticipated compliance expenditures, suspension of review of applications or other submissions, rejection or delay in approval of applications, recall or seizure of products, total or partial suspension of production and/or distribution, our inability to sell products, the return by customers of our products, injunctions, and/or criminal prosecution. Under certain circumstances, a regulator may also have the authority to revoke or vary previously granted drug approvals.
The safety profile of any product will continue to be closely monitored by the FDA and comparable foreign regulatory authorities after approval. If the FDA or comparable foreign regulatory authorities become aware of new safety information about any of our marketed or investigational products, those authorities may require labeling changes, establishment of a risk evaluation and mitigation strategy or similar strategy, restrictions on a product's indicated uses or marketing, or post-approval studies or post-market surveillance. In addition, we are subject to regulations in various jurisdictions, including the Federal Drug Supply Chain Security Act in the U.S., the Falsified Medicines Directive in the EU and a dozen other such regulations in other countries that require us to develop electronic systems to serialize, track, trace and authenticate units of our products through the supply chain and distribution system. Compliance with these regulations may result in increased expenses for us or impose greater administrative burdens on our organization, and failure to meet these requirements could result in fines or other penalties.
The FDA and comparable regulatory authorities also regulate the facilities and operational procedures that we use to manufacture our products. We must register our facilities with the FDA and similar regulators in other countries. Products must be manufactured in our facilities in accordance with cGMP or similar standards in each territory in which we manufacture. Compliance with such regulations requires substantial expenditures of time, money, and effort in multiple areas, including training of personnel, record-keeping, production, and quality control and quality assurance. The FDA and other regulatory authorities, including foreign authorities, periodically inspect our manufacturing facilities for compliance with cGMP or similar standards in the applicable territory. Regulatory approval to manufacture a drug is granted on a site-specific basis. Failure to comply with cGMP and other regulatory standards at one of our or our partners' or suppliers' manufacturing facilities could result in an adverse action brought by the FDA or other regulatory authorities, which could result in a receipt of an untitled or warning letter, fines, penalties, disgorgement, unanticipated compliance expenditures, rejection or delay in approval of applications, suspension of review of applications or other submissions, suspension of ongoing clinical trials, recall or seizure of products, total or partial suspension of production and/or distribution, our inability to sell products, the return by customers of our products, orders to suspend, vary, or withdraw marketing authorizations, injunctions, consent decrees, requirements to modify promotional materials or issue corrective information to healthcare practitioners, refusal to permit import or export, criminal prosecution and/or other adverse actions.
If any regulatory body were to delay, withhold, or withdraw approval of an application; require a recall or other adverse product action; require one of our manufacturing facilities to cease or limit production; or suspend, vary, or withdraw related marketing authorization, our business could be adversely affected. Delay and cost in obtaining FDA or other regulatory approval to manufacture at a different facility also could have a material adverse effect on our business, financial condition, results of operations, cash flows, and/or ordinary share price.
33
Table of Contents
Although we have established internal regulatory compliance programs and policies, there is no guarantee that these programs and policies, as currently designed, will meet regulatory agency standards in the future or will prevent instances of non-compliance with applicable laws and regulations. Additionally, despite efforts at compliance, from time to time we or our partners receive notices of manufacturing and quality-related observations following inspections by regulatory authorities around the world, as well as official agency correspondence regarding compliance. We or our partners may receive similar observations and correspondence in the future. If we are unable to resolve these observations and address regulator's concerns in a timely fashion, our business, financial condition, results of operations, cash flows, and/or ordinary share price could be materially affected.
We utilize controlled substances in certain of our current products and products in development, and therefore must meet the requirements of the Controlled Substances Act of 1970 and the related regulations administered by the DEA in the U.S., as well as those of similar laws in other countries where we operate. These laws relate to the manufacture, shipment, storage, sale, and use of controlled substances. The DEA and other regulatory agencies limit the availability of the controlled substances used in certain of our current products and products in development and, as a result, our procurement quota of these active ingredients may not be sufficient to meet commercial demand or complete clinical trials. We must annually apply to the DEA and similar regulatory agencies for procurement quotas in order to obtain these substances. Any delay or refusal by the DEA or such similar agencies in establishing our procurement quota for controlled substances could delay or stop our clinical trials or product launches, or could cause trade inventory disruptions for those products that have already been launched, which could have a material adverse effect on our business, financial condition, results of operations, cash flows, and/or ordinary share price.
THE USE OF LEGAL, REGULATORY, AND LEGISLATIVE STRATEGIES BY BOTH BRAND AND GENERIC COMPETITORS, INCLUDING BUT NOT LIMITED TO "AUTHORIZED GENERICS" AND REGULATORY PETITIONS, AS WELL AS THE POTENTIAL IMPACT OF PROPOSED AND NEWLY ENACTED LEGISLATION, MAY INCREASE COSTS ASSOCIATED WITH THE INTRODUCTION OR MARKETING OF OUR GENERIC PRODUCTS, COULD DELAY OR PREVENT SUCH INTRODUCTION, AND COULD SIGNIFICANTLY REDUCE OUR REVENUE AND PROFIT.
Our competitors, both branded and generic, often pursue strategies to prevent, delay, or eliminate competition from generic alternatives to branded products. These strategies include, but are not limited to:
• | entering into agreements whereby other generic companies will begin to market an authorized generic, a generic equivalent of a branded product, at the same time or after generic competition initially enters the market; |
• | launching a generic version of their own branded product prior to or at the same time or after generic competition initially enters the market or pricing the branded product at a discount equivalent to generic pricing; |
• | filing petitions with the FDA or other regulatory bodies seeking to prevent or delay approvals, including timing the filings so as to thwart generic competition by causing delays of our product approvals; |
• | seeking to establish regulatory and legal obstacles that would make it more difficult to demonstrate bioequivalence or to meet other requirements for approval, and/or to prevent regulatory agency review of applications, such as through the establishment of patent linkage (laws and regulations barring the issuance of regulatory approvals prior to patent expiration); |
• | initiating legislative or other efforts to limit the substitution of generic versions of brand pharmaceuticals; |
• | filing suits for patent infringement and other claims that may delay or prevent regulatory approval, manufacture, and/or sale of generic products; |
• | introducing "next-generation" products prior to the expiration of market exclusivity for the reference product, which often materially reduces the demand for the generic or the reference product for which we seek regulatory approval; |
• | persuading regulatory bodies to withdraw the approval of brand name drugs for which the patents are about to expire and converting the market to another product of the brand company on which longer patent protection exists; |
• | obtaining extensions of market exclusivity by conducting clinical trials of brand drugs in pediatric populations or by other methods; and |
• | seeking to obtain new patents on drugs for which patent protection is about to expire. |
34
Table of Contents
In the U.S., some companies have lobbied Congress for amendments to the Hatch-Waxman Act that would give them additional advantages over generic competitors. For example, although the term of a company's drug patent can be extended to reflect a portion of the time an NDA is under regulatory review, some companies have proposed extending the patent term by a full year for each year spent in clinical trials rather than the one-half year that is currently permitted.
If proposals like these in the U.S., Europe, or in other countries where we or our partners and suppliers operate were to become effective, or if any other actions by our competitors and other third parties to prevent or delay activities necessary to the approval, manufacture, or distribution of our products are successful, our entry into the market and our ability to generate revenues associated with new products may be delayed, reduced, or eliminated, which could have a material adverse effect on our business, financial condition, results of operations, cash flows, and/or ordinary share price.
IF WE ARE UNABLE TO SUCCESSFULLY INTRODUCE NEW PRODUCTS IN A TIMELY MANNER, OUR FUTURE REVENUE AND PROFITABILITY MAY BE ADVERSELY AFFECTED.
Our future revenues and profitability will depend, in part, upon our ability to successfully and timely develop, license, or otherwise acquire and commercialize new generic products as well as branded pharmaceutical products protected by patent or statutory authority. Product development is inherently risky, especially for new drugs for which safety and efficacy have not been established and/or the market is not yet proven as well as for complex generic drugs and biosimilars. Likewise, product licensing involves inherent risks, including, among others, uncertainties due to matters that may affect the achievement of milestones, as well as the possibility of contractual disagreements with regard to whether the supply of product meets certain specifications or terms such as license scope or termination rights. The development and commercialization process, particularly with regard to new and complex drugs, also requires substantial time, effort and financial resources. We, or a partner, may not be successful in commercializing any of such products on a timely basis, or at all, which could adversely affect our business, financial condition, results of operations, cash flows, and/or ordinary share price.
Before any prescription drug product, including generic drug products, can be marketed, marketing authorization approval is required by the relevant regulatory authorities and/or national regulatory agencies (for example, the FDA in the U.S. and the EMA in the EU). The process of obtaining regulatory approval to manufacture and market new branded and generic pharmaceutical products is rigorous, time consuming, costly, and inherently unpredictable. The EU has decided to move the headquarters of the EMA from the UK to the Netherlands by March 2019, which raises the possibility that any existing and/or new regulatory approval applications, whether for existing or new drug products, in the EU could be delayed as a result. A delay in regulatory approval could impact the commercial or financial success of a product.
Outside the U.S., the approval process may be more or less rigorous, depending on the country, and the time required for approval may be longer or shorter than that required in the U.S. Bioequivalence, clinical, or other studies conducted in one country may not be accepted in other countries, the requirements for approval may differ among countries, and the approval of a pharmaceutical product in one country does not necessarily mean that the product will be approved in another country. We, or a partner or supplier, may be unable to obtain requisite approvals on a timely basis, or at all, for new products that we may develop, license or otherwise acquire. Moreover, if we obtain regulatory approval for a drug, it may be limited, for example, with respect to the indicated uses and delivery methods for which the drug may be marketed, or may include warnings, precautions or contraindications in the labeling, which could restrict our potential market for the drug. A regulatory approval may also include post-approval study or risk management requirements that may substantially increase the resources required to market the drug. Also, for products pending approval, we may obtain raw materials or produce batches of inventory to be used in efficacy and bioequivalence testing, as well as in anticipation of the product's launch. In the event that regulatory approval is denied or delayed, we could be exposed to the risk of this inventory becoming obsolete.
The approval process for generic pharmaceutical products often results in the relevant regulatory agency granting final approval to a number of generic pharmaceutical products at the time a patent claim for a corresponding branded product or other market exclusivity expires. This often forces us to face immediate competition when we introduce a generic product into the market. Additionally, further generic approvals often continue to be granted for a given product subsequent to the initial launch of the generic product. These circumstances generally result in significantly lower prices, as well as reduced margins, for generic products compared to branded products. New generic market entrants generally cause continued price, margin, and sales erosion over the generic product life cycle.
In the U.S., the Hatch-Waxman Act provides for a period of 180 days of generic marketing exclusivity for a "first applicant," that is the first submitted ANDA containing a certification of invalidity, non-infringement or unenforceability related to a patent listed with the ANDA's reference drug product, commonly referred to as a Paragraph IV certification. During this exclusivity period, which under certain circumstances may be shared with other ANDAs filed on the same day, the FDA cannot grant final approval to later-submitted ANDAs for the same generic equivalent. If an ANDA is awarded 180-day
35
Table of Contents
exclusivity, the applicant generally enjoys higher market share, net revenues, and gross margin for that generic product. However, our ability to obtain 180 days of generic marketing exclusivity may be dependent upon our ability to obtain FDA approval or tentative approval within an applicable time period of the FDA's acceptance of our ANDA. If we are unable to obtain approval or tentative approval within that time period, we may risk forfeiture of such marketing exclusivity. By contrast, if we are not a "first applicant" to challenge a listed patent for such a product, we may lose significant advantages to a competitor with 180-day exclusivity, even if we obtain FDA approval for our generic drug product. The same would be true in situations where we are required to share our exclusivity period with other ANDA sponsors with Paragraph IV certifications.
In the EU and other countries and regions, there is no exclusivity period for the first generic product. The European Commission or national regulatory agencies may grant marketing authorizations to any number of generics.
If we are unable to navigate our products through the approval process in a timely manner, there could be an adverse effect on our product introduction plans, business, financial condition, results of operations, cash flows, and/or ordinary share price.
WE EXPEND A SIGNIFICANT AMOUNT OF RESOURCES ON R&D EFFORTS THAT MAY NOT LEAD TO SUCCESSFUL PRODUCT INTRODUCTIONS.
Much of our development effort is focused on technically difficult-to-formulate products and/or products that require advanced manufacturing technology, including our biosimilars program and respiratory platform. We conduct R&D primarily to enable us to gain approval for, manufacture, and market pharmaceuticals in accordance with applicable laws and regulations. We also partner with third parties to develop products. Typically, research expenses related to the development of innovative or complex compounds and the filing of marketing authorization applications for innovative and complex compounds (such as NDAs and biosimilar applications in the U.S.) are significantly greater than those expenses associated with the development of and filing of marketing authorization applications for most generic products (such as ANDAs in the U.S. and abridged applications in Europe). As we and our partners continue to develop new and/or complex products, our research expenses will likely increase. Because of the inherent risk associated with R&D efforts in our industry, including the high cost and uncertainty of conducting clinical trials (where required) particularly with respect to new and/or complex drugs, our, or a partner's, research and development expenditures may not result in the successful introduction of new pharmaceutical products approved by the relevant regulatory bodies. Also, after we submit a marketing authorization application for a new compound or generic product, the relevant regulatory authority may change standards and/or request that we conduct additional studies or evaluations and, as a result, we may incur approval delays as well as R&D costs in excess of what we anticipated.
Clinical testing is expensive and can take many years to complete, and its outcome is inherently uncertain. Failure can occur at any time during the clinical trial process. We or our partners may experience delays in our ongoing or future clinical trials, and we do not know whether planned clinical trials will begin or enroll subjects on time, need to be redesigned, or be completed on schedule, if at all.
Clinical trials may be delayed, suspended or prematurely terminated for a variety of reasons. If we experience delays in the completion of, or the termination of, any clinical trial of our product candidates, the commercial prospects of our product candidates will be harmed, and our ability to generate product revenues from any of these product candidates will be delayed. In addition, any delays in completing our clinical trials will increase our costs, slow down our product candidate development and approval process, and jeopardize our ability to commence product sales and generate revenues. Any of these occurrences may harm our business, financial condition and prospects significantly. In addition, many of the factors that cause, or lead to, a delay in the commencement or completion of clinical trials may also ultimately lead to the denial of regulatory approval of our product candidates.
Finally, we cannot be certain that any investment made in developing products will be recovered, even if we are successful in commercialization. To the extent that we expend significant resources on R&D efforts and are not able, ultimately, to introduce successful new and/or complex products as a result of those efforts, there could be a material adverse effect on our business, financial condition, results of operations, cash flows, and/or ordinary share price.
EVEN IF OUR PRODUCTS IN DEVELOPMENT RECEIVE REGULATORY APPROVAL, SUCH PRODUCTS MAY NOT ACHIEVE EXPECTED LEVELS OF MARKET ACCEPTANCE.
36
Table of Contents
Even if we are able to obtain regulatory approvals for our new generic or branded pharmaceutical products, the success of those products is dependent upon market acceptance. Levels of market acceptance for our products could be impacted by several factors, including but not limited to:
• | the availability, perceived advantages, and relative safety and efficacy of alternative products from our competitors; |
• | the degree to which the approved labeling supports promotional initiatives for commercial success; |
• | the prices of our products relative to those of our competitors; |
• | the timing of our market entry; and |
• | the effectiveness of our marketing, sales, and distribution strategy and operations; and other competitor actions. |
Additionally, studies of the proper utilization, safety, and efficacy of pharmaceutical products are being conducted by the industry, government agencies, and others. Such studies, which increasingly employ sophisticated methods and techniques, can call into question the utilization, safety, and efficacy of previously marketed as well as future products. In some cases, such studies have resulted, and may in the future result, in the discontinuation or variation of product marketing authorizations or requirements for risk management programs, such as a patient registry. Any of these events could adversely affect our profitability, business, financial condition, results of operations, cash flows, and/or ordinary share price.
THE DEVELOPMENT, APPROVAL PROCESS, MANUFACTURE AND COMMERCIALIZATION OF BIOSIMILAR PRODUCTS INVOLVE UNIQUE CHALLENGES AND UNCERTAINTIES, AND OUR FAILURE TO SUCCESSFULLY INTRODUCE BIOSIMILAR PRODUCTS COULD HAVE A NEGATIVE IMPACT ON OUR BUSINESS AND FUTURE OPERATING RESULTS.
We and our partners and suppliers are actively working to develop and commercialize biosimilar products - that is, a biological product that is highly similar to an already approved reference biological product, and for which there are no clinically meaningful differences between the biosimilar and the reference biological product in terms of safety, purity and potency. Although the Biologics Price Competition and Innovation Act of 2009 established a framework for the review and approval of biosimilar products and the FDA has begun to review and approve biosimilar product applications, there continues to be significant uncertainty regarding the regulatory pathway in the U.S. and in other countries to obtain approval for biosimilar products. There is also uncertainty regarding the commercial pathway to successfully market and sell such products.
Moreover, biosimilar products will likely be subject to extensive patent clearances and patent infringement litigation, which could delay or prevent the commercial launch of a biosimilar product for many years. If we are unable to obtain FDA or other non-U.S. regulatory authority approval for our products, we will be unable to market them. Even if our biosimilar products are approved for marketing, the products may not be commercially successful and may not generate profits in amounts that are sufficient to offset the amount invested to obtain such approvals. Market success of biosimilar products will depend on demonstrating to regulators, patients, physicians and payors (such as insurance companies) that such products are safe and effective yet offer a more competitive price or other benefit over existing therapies. In addition, the development and manufacture of biosimilars pose unique challenges related to the supply of the materials needed to manufacture biosimilars. Access to and the supply of necessary biological materials may be limited, and government regulations restrict access to and regulate the transport and use of such materials. We may not be able to generate future sales of biosimilar products in certain jurisdictions and may not realize the anticipated benefits of our investments in the development, manufacture and sale of such products. If our development efforts do not result in the development and timely approval of biosimilar products or if such products, once developed and approved, are not commercially successful, or upon the occurrence of any of the above risks, our business, financial condition, results of operations, cash flows, and/or ordinary share price could be materially adversely affected.
OUR BUSINESS IS HIGHLY DEPENDENT UPON MARKET PERCEPTIONS OF US, OUR BRANDS, AND THE SAFETY AND QUALITY OF OUR PRODUCTS, AND MAY BE ADVERSELY IMPACTED BY NEGATIVE PUBLICITY OR FINDINGS.
Market perceptions of us are very important to our business, especially market perceptions of our company and brands and the safety and quality of our products. If we, our partners and suppliers, or our brands suffer from negative publicity, or if any of our products or similar products which other companies distribute are subject to market withdrawal or recall or are proven to be, or are claimed to be, ineffective or harmful to consumers, then this could have a material adverse effect on our business, financial condition, results of operations, cash flows, and/or ordinary share price. Also, because we are dependent on market perceptions, negative publicity associated with product quality, patient illness, or other adverse effects resulting from, or
37
Table of Contents
perceived to be resulting from, our products, or our partners' and suppliers' manufacturing facilities, could have a material adverse effect on our business, financial condition, results of operations, cash flows, and/or ordinary share price.
THE ILLEGAL DISTRIBUTION AND SALE BY THIRD PARTIES OF COUNTERFEIT VERSIONS OF OUR PRODUCTS OR OF DIVERTED OR STOLEN PRODUCTS COULD HAVE A NEGATIVE IMPACT ON OUR REPUTATION AND OUR BUSINESS.
The pharmaceutical drug supply has been increasingly challenged by the vulnerability of distribution channels to illegal counterfeiting and the presence of counterfeit products in a growing number of markets and over the Internet.
Third parties may illegally distribute and sell counterfeit versions of our products that do not meet the rigorous manufacturing and testing standards that our products undergo. Counterfeit products are frequently unsafe or ineffective, and can be potentially life-threatening. Counterfeit medicines may contain harmful substances, the wrong dose of API or no API at all. However, to distributors and users, counterfeit products may be visually indistinguishable from the authentic version.
Reports of adverse reactions to counterfeit drugs or increased levels of counterfeiting could materially affect patient confidence in the authentic product. It is possible that adverse events caused by unsafe counterfeit products will mistakenly be attributed to the authentic product. In addition, unauthorized diversions of products or thefts of inventory at warehouses, plants, or while in-transit, which are not properly stored and which are sold through unauthorized channels, could adversely impact patient safety, our reputation, and our business.
Public loss of confidence in the integrity of pharmaceutical products as a result of counterfeiting, diversion, or theft could have a material adverse effect on our business, financial condition, results of operations, cash flows, and/or ordinary share price.
OUR COMPETITORS, INCLUDING BRANDED PHARMACEUTICAL COMPANIES, AND/OR OTHER THIRD PARTIES, MAY ALLEGE THAT WE AND/OR OUR SUPPLIERS ARE INFRINGING UPON THEIR INTELLECTUAL PROPERTY, INCLUDING IN AN "AT RISK LAUNCH" SITUATION, WHICH COULD RESULT IN SUBSTANTIAL PENALTIES, IMPACT OUR ABILITY TO LAUNCH A PRODUCT AND/OR OUR ABILITY TO CONTINUE MARKETING A PRODUCT, AND/OR FORCE US TO EXPEND SUBSTANTIAL RESOURCES IN RESULTING LITIGATION, THE OUTCOME OF WHICH IS UNCERTAIN.
Companies that produce branded pharmaceutical products and other patent holders routinely bring litigation against entities selling or seeking regulatory approval to manufacture and market generic forms of their branded products, as well as other entities involved in the manufacture, supply, and other aspects relating to active pharmaceutical ingredients and finished pharmaceutical products. These companies and other patent holders may allege patent infringement or other violations of intellectual property rights as the basis for filing suit against an applicant for a generic product as well as others who may be involved in some aspect of the research, production, distribution, or testing process. Litigation often involves significant expense and can delay or prevent introduction or sale of our generic products. If patents are held valid and infringed by our products in a particular jurisdiction, we and/or our supplier(s) or partner(s) may, unless we or the supplier(s) or partner(s) could obtain a license from the patent holder, need to cease manufacturing and other activities, including but not limited to selling in that jurisdiction. We may also need to pay damages, surrender or withdraw the product, or destroy existing stock in that jurisdiction.
There also may be situations, including, for example, the decision to launch our 40mg/mL glatiramer acetate product, where we use our business judgment and decide to manufacture, market, and/or sell products, directly or through third parties, notwithstanding the fact that allegations of patent infringement(s) and other third party rights have not been finally resolved by the courts (i.e., an "at-risk launch"). The risk involved in doing so can be substantial because the remedies available to the owner of a patent for infringement may include, among other things, a reasonable royalty on sales, damages measured by the profits lost by the patent holder, or by profits earned by the infringer. If there is a finding by a court of willful infringement, the definition of which is subjective, such damages may be increased by up to three times. Moreover, because of the discount pricing typically involved with bioequivalent products, patented branded products generally realize a substantially higher profit margin than bioequivalent products. An adverse decision in a case such as this, or a judicial order preventing us or our suppliers and partners from manufacturing, marketing, selling, and/or other activities necessary to the manufacture and distribution of our products, could result in substantial penalties, and/or have a material adverse effect on our business, financial condition, results of operations, cash flows, and/or ordinary share price.
38
Table of Contents
IF WE OR ANY PARTNER OR SUPPLIER FAIL TO OBTAIN OR ADEQUATELY PROTECT OR ENFORCE OUR INTELLECTUAL PROPERTY RIGHTS, THEN WE COULD LOSE REVENUE UNDER OUR LICENSING AGREEMENTS OR LOSE SALES TO GENERIC COPIES OF OUR BRANDED PRODUCTS.
Our success depends in part on our or any partner's or supplier's ability to obtain, maintain and enforce patents, and protect trademarks, trade secrets, know-how, and other intellectual property and proprietary information. Our ability to commercialize any branded product successfully will largely depend upon our or any partner's or supplier's ability to obtain and maintain patents and trademarks of sufficient scope to lawfully prevent third-parties from developing and/or marketing infringing products. In the absence of intellectual property or other protection, competitors may adversely affect our branded products business by independently developing and/or marketing substantially equivalent products. It is also possible that we could incur substantial costs if we are required to initiate litigation against others to protect or enforce our intellectual property rights.
We have filed patent applications covering the composition of, methods of making, and/or methods of using, our branded products and branded product candidates. We may not be issued patents based on patent applications already filed or that we file in the future. Further, due to other factors that affect patentability, and if patents are issued, they may be insufficient in scope to cover or otherwise protect our branded products. Patents are national in scope and therefore the issuance of a patent in one country does not ensure the issuance of a patent in any other country. Furthermore, the patent position of companies in the pharmaceutical industry generally involves complex legal and factual questions and has been and remains the subject of significant litigation. Legal standards relating to scope and validity of patent claims are evolving and may differ in various countries. Any patents we have obtained, or obtain in the future, may be challenged, invalidated or circumvented. Moreover, the U.S. Patent and Trademark Office or any other governmental agency may commence opposition or interference proceedings involving, or consider other challenges to, our patents or patent applications. In addition, branded products often have market viability based upon the goodwill of the product name, which typically benefits from trademark protection. Our branded products may therefore also be subject to risks related to the loss of trademark or patent protection or to competition from generic or other branded products. Challenges can come from other businesses or governments, and governments could require compulsory licensing of this intellectual property.
Any challenge to, or invalidation or circumvention of, our intellectual property (including patents or patent applications and trademark protection) would be costly, would require significant time and attention of our management, and could cause a material adverse effect on our business, financial condition, results of operations, cash flows, and/or ordinary share price.
WE FACE VIGOROUS COMPETITION THAT THREATENS THE COMMERCIAL ACCEPTANCE AND PRICING OF OUR PRODUCTS.
The pharmaceutical industry is highly competitive. We face competition from other pharmaceutical manufacturers globally, some of whom are significantly larger than we are. Our competitors may be able to develop products and processes competitive with or superior to our own for many reasons, including but not limited to the possibility that they may have:
• | proprietary processes or delivery systems; |
• | larger or more productive R&D and marketing staff; |
• | larger or more efficient production capabilities in a particular therapeutic area; |
• | more experience in preclinical testing and human clinical trials; |
• | more products; or |
• | more experience in developing new drugs and greater financial resources, particularly with regard to manufacturers of branded products. |
The occurrence of any of the above risks could have an adverse effect on our business, financial condition, results of operations, cash flows, and/or ordinary share price.
We also face increasing competition from lower-cost generic products and other branded products. Certain of our products are not protected by patent rights or have limited patent life and will soon lose patent protection. Loss of patent protection for a product typically is followed promptly by the introduction of generic substitutes. As a result, sales of many of these products may decline or stop growing over time. Various factors may result in the sales of certain of our products, particularly those acquired in the Meda transaction and the EPD Transaction, declining faster than has been projected, which could have a material adverse effect on our business, financial condition, results of operations, cash flows, and/or ordinary share price. In addition, legislative proposals emerge from time to time in various jurisdictions to further encourage the early
39
Table of Contents
and rapid approval of generic drugs. Any such proposal that is enacted into law could increase competition and worsen this negative effect on our sales and, potentially, our business, financial condition, results of operations, cash flows and/or ordinary share price.
Competitors' products may also be safer, more effective, more effectively marketed or sold, or have lower prices or better performance features than ours. We cannot predict with certainty the timing or impact of competitors' products. In addition, our sales may suffer as a result of changes in consumer demand for our products, including those related to fluctuations in consumer buying patterns tied to seasonality, importation by consumers or the introduction of new products by competitors, which could have a material adverse effect on our business, financial condition, results of operations, cash flows, and/or ordinary share price.
A RELATIVELY SMALL GROUP OF PRODUCTS MAY REPRESENT A SIGNIFICANT PORTION OF OUR REVENUES, GROSS PROFIT, NET SALES, OR NET EARNINGS FROM TIME TO TIME.
Sales of a limited number of our products from time to time represent a significant portion of our revenues, gross profit, and net earnings. For the years ended December 31, 2017 and 2016, Mylan's top ten products in terms of sales, in the aggregate, represented approximately 21% and 27%, respectively, of the Company's third party net sales. If the volume or pricing of our largest selling products declines in the future, our business, financial condition, results of operations, cash flows, and/or ordinary share price could be materially adversely affected.
A SIGNIFICANT PORTION OF OUR REVENUES IS DERIVED FROM SALES TO A LIMITED NUMBER OF CUSTOMERS.
A significant portion of our revenues is derived from sales to a limited number of customers. If we were to experience a significant reduction in or loss of business with one or more such customers, or if one or more such customers were to experience difficulty in paying us on a timely basis, our business, financial condition, results of operations, cash flows, and/or ordinary share price could be materially adversely affected.
In addition, a significant amount of our sales are to a relatively small number of drug wholesalers and retail drug chains. These customers represent an essential part of the distribution chain of generic pharmaceutical products. Drug wholesalers and retail drug chains have undergone, and are continuing to undergo, significant consolidation. This consolidation has resulted in these groups gaining additional purchasing leverage and, consequently, increasing the product pricing pressures facing our business. We expect this trend of increased pricing pressures to continue. Additionally, the emergence of large buying groups representing independent retail pharmacies and the prevalence and influence of managed care organizations and similar institutions increases the negotiating power of these groups, enabling them to attempt to extract price discounts, rebates, and other restrictive pricing terms on our products. These factors could have a material adverse effect on our business, financial condition, results of operations, cash flows, and/or ordinary share price. During the years ended December 31, 2017, 2016 and 2015, Mylan's consolidated third party net sales to Cardinal Health, Inc. were approximately 10%, 11% and 12%, respectively; Mylan's consolidated third party net sales to McKesson Corporation were approximately 13%, 16%, and 15%, respectively; and Mylan's consolidated third party net sales to AmeriSourceBergen Corporation were approximately 8%, 14% and 16%, respectively, of consolidated third party net sales.
OUR BUSINESS COULD BE NEGATIVELY AFFECTED BY THE PERFORMANCE OF OUR THIRD_PARTY COLLABORATION PARTNERS.
We have entered into strategic alliances with partners to develop, manufacture, market and/or distribute certain products, and/or certain components of our products, in various markets. We commit substantial effort, funds and other resources to these various collaborations. There is a risk that the investments made by us in these collaborative arrangements will not generate financial returns. While we believe our relationships with our partners generally are successful, disputes or conflicting priorities and regulatory or legal intervention could be a source of delay or uncertainty as to the expected benefits of the collaboration. A failure or inability of our partners to fulfill their collaboration obligations, or the occurrence of any of the risks above, could have an adverse effect on our business, financial condition, results of operations, cash flows, and/or ordinary share price.
THE SUPPLY OF API INTO EUROPE MAY BE NEGATIVELY AFFECTED BY RECENT REGULATIONS PROMULGATED BY THE EU.
All API imported into the EU has needed to be certified as complying with the good manufacturing practice standards established by the EU laws and guidance, as stipulated by the International Conference for Harmonization. These regulations place the certification requirement on the regulatory bodies of the exporting countries. Accordingly, the national regulatory
40
Table of Contents
authorities of each exporting country must: (i) ensure that all manufacturing plants within their borders that export API into the EU comply with EU manufacturing standards and (ii) for each API exported, present a written document confirming that the exporting plant conforms to EU manufacturing standards. The imposition of this responsibility on the governments of the nations exporting an API may cause delays in delivery or shortages of an API necessary to manufacture our products, as certain governments may not be willing or able to comply with the regulation in a timely fashion, or at all. A shortage in API may prevent us from manufacturing, or cause us to have to cease manufacture of, certain products, or to incur costs and delays to qualify other suppliers to substitute for those API manufacturers unable to export. The occurrence of any of the above risks could have a material adverse effect on our business, financial condition, results of operations, cash flows, and/or ordinary share price.
WE HAVE A LIMITED NUMBER OF MANUFACTURING FACILITIES AND CERTAIN THIRD PARTY SUPPLIERS PRODUCE A SUBSTANTIAL PORTION OF OUR API AND PRODUCTS, SOME OF WHICH REQUIRE A HIGHLY EXACTING AND COMPLEX MANUFACTURING PROCESS.
A substantial portion of our capacity, as well as our current production, is attributable to a limited number of manufacturing facilities and certain third-party suppliers. A significant disruption at any one of such facilities within our internal or third party supply chain, even on a short-term basis, whether due to the failure of a third-party supplier to fulfill the terms of their agreement with us, labor disruption, adverse quality or compliance observation, other regulatory action, infringement of intellectual property rights, act of God, civil or political unrest, export or import restrictions, or other events could impair our ability to produce and ship products to the market on a timely basis and could, among other consequences, subject us to exposure to claims from customers. Any of these events could have a material adverse effect on our reputation, business, financial condition, results of operations, cash flows, and/or ordinary share price.
We purchase certain API and other materials and supplies that we use in our manufacturing operations, as well as certain finished products, from many different foreign and domestic suppliers. The price of API and other materials and supplies is subject to volatility, and in certain cases, we have listed only one supplier in our applications with regulatory agencies. There is no guarantee that we will always have timely, sufficient or affordable access to critical raw materials or finished product supplied by third parties, even when we have more than one supplier. An increase in the price, or an interruption in the supply, of a single-sourced or any other raw material, including the relevant API, or in the supply of finished product, could cause our business, financial condition, results of operations, cash flows, and/or ordinary share price to be materially adversely affected. Our manufacturing and supply capabilities could be adversely impacted by quality deficiencies in the products which our suppliers provide, or at their manufacturing facilities.
In addition, the manufacture of some of our products is a highly exacting and complex process, due in part to strict regulatory requirements. Problems may arise during manufacturing at our or our third party suppliers facilities for a variety of reasons, including, among others, equipment malfunction, failure to follow specific protocols and procedures, problems with raw materials, natural disasters, power outages, labor unrest, and environmental factors. If problems arise during the production of a batch of product, that batch of product may have to be discarded. This could, among other things, lead to increased costs, lost revenue, damage to customer relations, time and expense spent investigating the cause, and, depending on the cause, similar losses with respect to other batches or products. If problems are not discovered before the product is released to the market, recall and product liability costs may also be incurred. If we or one of our suppliers experience any of the problems described above, such problems could have a material adverse effect on our reputation, business, financial condition, results of operations, cash flows, and/or ordinary share price.
OUR REPORTING AND PAYMENT OBLIGATIONS RELATED TO OUR PARTICIPATION IN U.S. FEDERAL HEALTHCARE PROGRAMS, INCLUDING MEDICARE, MEDICAID AND THE DEPARTMENT OF VETERANS AFFAIRS (THE "VA"), ARE COMPLEX AND OFTEN INVOLVE SUBJECTIVE DECISIONS THAT COULD CHANGE AS A RESULT OF NEW BUSINESS CIRCUMSTANCES, NEW REGULATIONS OR AGENCY GUIDANCE, OR ADVICE OF LEGAL COUNSEL. ANY FAILURE TO COMPLY WITH THOSE OBLIGATIONS COULD SUBJECT US TO INVESTIGATION, PENALTIES, AND SANCTIONS.
Federal laws regarding reporting and payment obligations with respect to a pharmaceutical company's participation in federal healthcare programs, including Medicare, Medicaid and the VA, are complex. Because our processes for calculating applicable government prices and the judgments involved in making these calculations involve subjective decisions and complex methodologies, these calculations are subject to risk of errors and differing interpretations. In addition, they are subject to review and challenge by the applicable governmental agencies, and it is possible that such reviews could result in changes that may have material adverse legal, regulatory, or economic consequences.
41
Table of Contents
Pharmaceutical manufacturers that participate in the Medicaid Drug Rebate Program, such as Mylan, are required to report certain pricing data to the Centers for Medicare & Medicaid Services ("CMS"), the federal agency that administers the Medicare and Medicaid programs. This data includes the Average Manufacturer Price ("AMP") for each of the manufacturer's covered outpatient drugs. CMS calculates a type of U.S. federal ceiling on reimbursement rates to pharmacies for multiple source drugs under the Medicaid program, known as the federal upper limit ("FUL"). Since April 2016, CMS is required to use the weighted average AMP for pharmaceutically and therapeutically equivalent multiple source drugs to calculate FULs, instead of the other pricing data CMS previously used. Although weighted average AMP-based FULs do not reveal Mylan's individual AMP, publishing a weighted average AMP available to customers and the public at large could negatively affect our commercial price negotiations.
In addition, a number of state and federal government agencies are conducting investigations of manufacturers' reporting practices with respect to Average Wholesale Prices ("AWP"). The government has alleged that reporting of inflated AWP has led to excessive payments for prescription drugs, and we may be named as a defendant in actions relating to pharmaceutical pricing issues and whether allegedly improper actions by pharmaceutical manufacturers led to excessive payments by Medicare, Medicaid and/or the VA.
Any governmental agencies or authorities that have commenced, or may commence, an investigation of us relating to the sales, marketing, pricing, quality, or manufacturing of pharmaceutical products could seek to impose, based on a claim of violation of anti-fraud and false claims laws or otherwise, civil and/or criminal sanctions, including fines, penalties, and possible exclusion from federal healthcare programs, including Medicare, Medicaid and/or the VA. Some of the applicable laws may impose liability even in the absence of specific intent to defraud. Furthermore, should there be ambiguity with regard to how to properly calculate and report payments - and even in the absence of any such ambiguity - a governmental authority may take a position contrary to a position we have taken, and may impose or pursue civil and/or criminal sanctions. Governmental agencies may also make changes in program interpretations, requirements or conditions of participation, some of which may have implications for amounts previously estimated or paid. We cannot assure you that our submissions will not be found by CMS or the VA to be incomplete or incorrect. Any failure to comply with the above laws and regulations, and any such penalties or sanctions could have a material adverse effect on our business, financial condition, results of operations, cash flows, and/or ordinary share price.
WE MAY EXPERIENCE REDUCTIONS IN THE LEVELS OF REIMBURSEMENT FOR PHARMACEUTICAL PRODUCTS BY GOVERNMENTAL AUTHORITIES, HMOS, OR OTHER THIRD-PARTY PAYORS. IN ADDITION, THE USE OF TENDER SYSTEMS AND OTHER FORMS OF PRICE CONTROL, INCLUDING LEGISLATIVE OR REGULATORY PROGRAMS IMPACTING PHARMACEUTICAL PRICES, COULD REDUCE PRICES FOR OUR PRODUCTS OR REDUCE OUR MARKET OPPORTUNITIES.
Various governmental authorities (including, among others, the U.K. National Health Service and the German statutory health insurance scheme) and private health insurers and other organizations, such as HMOs in the U.S., provide reimbursements or subsidies to consumers for the cost of certain pharmaceutical products. Demand for our products depends in part on the extent to which such reimbursement is available. In the U.S., third-party payors increasingly challenge the pricing of pharmaceutical products. These trends and other trends toward the growth of HMOs, managed healthcare, and legislative healthcare reform create significant uncertainties regarding the future levels of reimbursement for pharmaceutical products. Further, any reimbursement may be reduced in the future to the point that market demand for our products and/or our profitability declines. Such a decline could have a material adverse effect on our business, financial condition, results of operations, cash flows, and/or ordinary share price.
In addition, current or future U.S. federal, U.S. state or other countries' laws and regulations may influence the prices of drugs and, therefore, could adversely affect the payments we receive for our products. For example, existing programs in certain states in the U.S. seek to broadly set prices within those states through the regulation and administration of the sale of prescription drugs. Expansion of these programs, and, in particular, changes to state Medicare and/or Medicaid programs, or changes required in the way in which Medicare payment rates are set and/or the way Medicaid rebates are calculated, could adversely affect the payment we receive for our products. In order to control expenditure on pharmaceuticals, most member states in the EU regulate the pricing of products and, in some cases, limit the range of different forms of pharmaceuticals available for prescription by national health services. These controls can result in considerable price differences between member states.
Several countries in which we operate have implemented, or plan to or may implement, government mandated price reductions and/or other controls. When such price controls occur, pharmaceutical companies have generally experienced significant declines in revenues and profitability and uncertainties continue to exist within the market after the price decrease. Such price reductions or controls could have an adverse effect on our business, and as uncertainties are resolved or if other
42
Table of Contents
countries in which we operate enact similar measures, they could have a material adverse effect on our business, financial condition, results of operations, cash flows, and/or ordinary share price.
A number of markets in which we operate have also implemented or may implement tender systems for generic pharmaceuticals in an effort to lower prices. Under such tender systems, manufacturers submit bids which establish prices for generic pharmaceutical products. Upon winning the tender, the winning company will receive a preferential reimbursement for a period of time. The tender system often results in companies underbidding one another by proposing low pricing in order to win the tender. Certain other countries may consider the implementation of a tender system or other forms of price controls. Even if a tender system is ultimately not implemented, the anticipation of such could result in price reductions.
Failing to win tenders, or the implementation of similar systems or other forms of price controls in other markets leading to further price declines, could have a material adverse effect on our business, financial condition, results of operations, cash flows, and/or ordinary share price.
HEALTHCARE REFORM LEGISLATION COULD HAVE A MATERIAL ADVERSE EFFECT ON OUR BUSINESS.
In recent years, there have been numerous initiatives on the federal and state levels for comprehensive reforms affecting the payment for, the availability of and reimbursement for, healthcare services in the U.S., and it is likely that Congress and state legislatures and health agencies will continue to focus on healthcare reform in the future. The PPACA and The Health Care and Education and Reconciliation Act of 2010 (H.R. 4872), which amends the PPACA (collectively, the "Health Reform Laws"), were signed into law in March 2010. While the Health Reform Laws may increase the number of patients who have insurance coverage for our products, they also include provisions such as the assessment of a pharmaceutical manufacturer fee and an increase in the amount of rebates that manufacturers pay for coverage of their drugs by Medicaid programs.
We are unable to predict the future course of federal or state healthcare legislation. The Health Reform Laws and further changes in the law or regulatory framework that reduce our revenues or increase our costs could have a material adverse effect on our business, financial condition, results of operations, cash flows, and/or ordinary share price.
Additionally, we encounter similar regulatory and legislative issues in most other countries. In the EU and some other international markets, the government provides healthcare at low cost to consumers and regulates pharmaceutical prices, patient eligibility and/or reimbursement levels to control costs for the government-sponsored healthcare system. These systems of price regulations may lead to inconsistent and lower prices. Within the EU and in other countries, the availability of our products in some markets at lower prices undermines our sales in other markets with higher prices. Additionally, certain countries set prices by reference to the prices in other countries where our products are marketed. Thus, our inability to secure adequate prices in a particular country may also impair our ability to obtain acceptable prices in existing and potential new markets, and may create the opportunity for third party cross border trade.
Significant additional reforms to the U.S. healthcare system, or to the healthcare systems of other markets in which we operate, could have a material adverse effect on our business, financial condition, results of operations, cash flows, and/or ordinary share price.
WE ARE INVOLVED IN VARIOUS LEGAL PROCEEDINGS AND CERTAIN GOVERNMENT INQUIRIES AND MAY EXPERIENCE UNFAVORABLE OUTCOMES OF SUCH PROCEEDINGS OR INQUIRIES.
We are or may be involved in various legal proceedings and certain government inquiries or investigations, including, but not limited to, patent infringement, product liability, antitrust matters, breach of contract, and claims involving Medicare, Medicaid and/or VA reimbursements, or laws relating to sales, marketing, and pricing practices, some of which are described in our periodic reports, that involve claims for, or the possibility of, fines and penalties involving substantial amounts of money or other relief, including but not limited to civil or criminal fines and penalties and exclusion from participation in various government healthcare-related programs. With respect to government antitrust enforcement and private plaintiff litigation of so-called "pay for delay" patent settlements, large verdicts, settlements or government fines are possible, especially in the U.S. and EU. If any of these legal proceedings or inquiries were to result in an adverse outcome, the impact could have a material adverse effect on our business, financial condition, results of operations, cash flows, and/or ordinary share price.
With respect to product liability, we maintain a combination of self-insurance (including through our wholly owned captive insurance subsidiary) and commercial insurance to protect against and manage a portion of the risks involved in conducting our business. Although we carry insurance, we believe that no reasonable amount of insurance can fully protect against all such risks because of the potential liability inherent in the business of producing pharmaceuticals for human consumption. Emerging developments in the U.S. legal landscape relative to the liability of generic pharmaceutical
43
Table of Contents
manufacturers for certain product liabilities claims could increase our exposure litigation costs and damages. To the extent that a loss occurs, depending on the nature of the loss and the level of insurance coverage maintained, it could have a material adverse effect on our business, financial condition, results of operations, cash flows, and/or ordinary share price.
In addition, in limited circumstances, entities that we have acquired are party to litigation in matters under which we are, or may be, entitled to indemnification by the previous owners. Even in the case of indemnification, there are risks inherent in such indemnities and, accordingly, there can be no assurance that we will receive the full benefits of such indemnification, or that we will not experience an adverse result in a matter that is not indemnified, which could have a material adverse effect on our business, financial condition, results of operations, cash flows, and/or ordinary share price.
IF WE FAIL TO COMPLY WITH OUR CORPORATE INTEGRITY AGREEMENT, WE COULD BE SUBJECT TO SUBSTANTIAL PENALTIES AND EXCLUSION FROM PARTICIPATION IN FEDERAL HEALTHCARE PROGRAMS.
In August 2017, Mylan Inc. and Mylan Specialty L.P. entered into a Corporate Integrity Agreement (the "CIA") with the Office of Inspector General of the Department of Health and Human Services ("OIG-HHS"). The CIA has a five-year term and requires, among other things, enhancements to our compliance program, fulfillment of reporting and monitoring obligations, management certifications and resolutions from Mylan Inc.'s board, as well as that an independent review organization annually review various matters relating to the Medicaid Drug Rebate Program, among other things. If we fail to comply with the CIA, the OIG-HHS may impose substantial monetary penalties or exclude us from federal healthcare programs, including Medicare, Medicaid or the VA, which could have a material adverse effect on our business, financial condition and results of operations.
WE HAVE A NUMBER OF CLEAN ENERGY INVESTMENTS WHICH ARE SUBJECT TO VARIOUS RISKS AND UNCERTAINTIES.
We have invested in clean energy operations capable of producing refined coal that we believe qualify for tax credits under Section 45 of the Code. Our ability to claim tax credits under Section 45 of the Code depends upon the operations in which we have invested satisfying certain ongoing conditions set forth in Section 45 of the Code. These include, among others, the emissions reduction, "qualifying technology", and "placed-in-service" requirements of Section 45 of the Code, as well as the requirement that at least one of the operations' owners qualifies as a "producer" of refined coal. While we have received some degree of confirmation from the IRS relating to our ability to claim these tax credits, the IRS could ultimately determine that the operations have not satisfied, or have not continued to satisfy, the conditions set forth in Section 45 of the Code.
In addition, the implementation of the Tax Act could limit Mylan's ability to realize the benefit of these investments, or Congress could modify or repeal Section 45 of the Code and remove the tax credits retroactively. In addition, Section 45 of the Code contains phase out provisions based upon the market price of coal, such that, if the price of coal rises to specified levels, we could lose some or all of the tax credits we expect to receive from these investments. Finally, when the price of natural gas or oil declines relative to that of coal, some utilities may choose to burn natural gas or oil instead of coal. Market demand for coal may also decline as a result of an economic slowdown and a corresponding decline in the use of electricity. If utilities burn less coal, eliminate coal in the production of electricity or are otherwise unable to operate for an extended period of time, the availability of the tax credits would also be reduced. During 2017, as a result of a decline in current and expected future production levels at certain of our clean energy facilities, the Company impaired its investment balance and other assets. Additional impairments could occur in the future.
The occurrence of any of the above risks could limit the value of our investment, result in increased costs, materially increase our tax burden or adversely affect our business, financial condition, results of operations, cash flows, and/or ordinary share price.
WE HAVE SIGNIFICANT INDEBTEDNESS, WHICH COULD LEAD TO ADVERSE CONSEQUENCES OR ADVERSELY AFFECT OUR FINANCIAL POSITION AND PREVENT US FROM FULFILLING OUR OBLIGATIONS UNDER SUCH INDEBTEDNESS, AND ANY REFINANCING OF THIS DEBT COULD BE AT SIGNIFICANTLY HIGHER INTEREST RATES.
Our level of indebtedness could have important consequences, including but not limited to:
• | increasing our vulnerability to general adverse economic and industry conditions; |
• | requiring us to dedicate a substantial portion of our cash flow from operations to make debt service payments, thereby reducing the availability of cash flow to fund working capital, capital expenditures, acquisitions and investments and other general corporate purposes; |
44
Table of Contents
• | limiting our flexibility in planning for, or reacting to, challenges and opportunities, and changes in our businesses and the markets in which we operate; |
• | limiting our ability to obtain additional financing to fund our working capital, capital expenditures, acquisitions and debt service requirements and other financing needs; |
• | increasing our vulnerability to increases in interest rates in general because a substantial portion of our indebtedness bears interest at floating rates; and |
• | placing us at a competitive disadvantage to our competitors that have less debt. |
Our ability to service our indebtedness will depend on our future operating performance and financial results, which will be subject, in part, to factors beyond our control, including interest rates and general economic, financial and business conditions. If we do not have sufficient cash flow to service our indebtedness, we may need to refinance all or part of our existing indebtedness, borrow more money or sell securities or assets, some or all of which may not be available to us at acceptable terms or at all. In addition, we may need to incur additional indebtedness in the future in the ordinary course of business. Although the terms of our credit agreements and our bond indentures allow us to incur additional debt, this is subject to certain limitations which may preclude us from incurring the amount of indebtedness we otherwise desire.
In addition, although Mylan expects to maintain an investment grade credit rating, a downgrade in the credit rating of Mylan or any indebtedness of Mylan or its subsidiaries could increase the cost of further borrowings or refinancings of such indebtedness, limit access to sources of financing in the future or lead to other adverse consequences.
In addition, if we incur additional debt, the risks described above could intensify. If global credit markets contract, future debt financing may not be available to us when required or may not be available on acceptable terms or at all, and as a result we may be unable to grow our business, take advantage of business opportunities, respond to competitive pressures or satisfy our obligations under our indebtedness. Any of the foregoing could have a material adverse effect on our business, financial condition, results of operations, cash flows, and/or ordinary share price.
Our credit facilities, senior unsecured notes, other outstanding indebtedness and any additional indebtedness we incur in the future impose, or may impose, significant operating and financial restrictions on us. These restrictions limit our ability to, among other things, incur additional indebtedness, make investments, pay certain dividends, prepay other indebtedness, sell assets, incur certain liens, enter into agreements with our affiliates or restricting our subsidiaries' ability to pay dividends, merge or consolidate. In addition, our credit facilities require us to maintain specified financial ratios. A breach of any of these covenants or our inability to maintain the required financial ratios could result in a default under the related indebtedness. If a default occurs, the relevant lenders could elect to declare our indebtedness, together with accrued interest and other fees, to be immediately due and payable. These factors could have a material adverse effect on our business, financial condition, results of operations, cash flows, and/or ordinary share price.
WE ENTER INTO VARIOUS AGREEMENTS IN THE NORMAL COURSE OF BUSINESS THAT PERIODICALLY INCORPORATE PROVISIONS WHEREBY WE INDEMNIFY THE OTHER PARTY TO THE AGREEMENT.
In the normal course of business, we periodically enter into commercial, employment, legal settlement, and other agreements that incorporate indemnification provisions. In some, but not all, cases, we maintain insurance coverage that we believe will effectively mitigate our obligations under certain of these indemnification provisions. However, should our obligation under an indemnification provision exceed any applicable coverage or should coverage be denied, our business, financial condition, results of operations, cash flows, and/or ordinary share price could be materially adversely affected.
THERE ARE INHERENT UNCERTAINTIES INVOLVED IN ESTIMATES, JUDGMENTS AND ASSUMPTIONS USED IN THE PREPARATION OF FINANCIAL STATEMENTS IN ACCORDANCE WITH U.S. GAAP. ANY FUTURE CHANGES IN ESTIMATES, JUDGMENTS AND ASSUMPTIONS USED OR NECESSARY REVISIONS TO PRIOR ESTIMATES, JUDGMENTS OR ASSUMPTIONS OR CHANGES IN ACCOUNTING STANDARDS COULD LEAD TO A RESTATEMENT OR REVISION TO PREVIOUSLY ISSUED FINANCIAL STATEMENTS.
The Consolidated and Condensed Consolidated Financial Statements included in the periodic reports we file with the SEC are prepared in accordance with U.S. GAAP. The preparation of financial statements in accordance with U.S. GAAP involves making estimates, judgments and assumptions that affect reported amounts of assets, liabilities, revenues, expenses and income. Estimates, judgments and assumptions are inherently subject to change in the future and any necessary revisions to prior estimates, judgments or assumptions could lead to a restatement. Furthermore, although we have recorded reserves for litigation related contingencies based on estimates of probable future costs, such litigation related contingencies could result in
45
Table of Contents
substantial further costs. Also, any new or revised accounting standards may require adjustments to previously issued financial statements. Any such changes could result in corresponding changes to the amounts of liabilities, revenues, expenses and income.
On August 17, 2017, the Company announced that its subsidiaries, Mylan Inc. and Mylan Specialty L.P., signed an agreement with the U.S. Department of Justice ("DOJ") and two relators finalizing the $465 million settlement, plus interest, with the DOJ and other government agencies related to the classification of the EpiPen® Auto-Injector for purposes of the Medicaid Drug Rebate Program that Mylan had agreed to the terms of on October 7, 2016 (the "Medicaid Drug Rebate Program Settlement"). On April 25, 2017, Mylan received a comment letter from the staff of the SEC's Division of Corporation Finance ("Corporation Finance") with respect to Mylan's Annual Report on Form 10-K for the year ended December 31, 2016, requesting information regarding Mylan's accounting treatment of the $465 million Medicaid Drug Rebate Program Settlement with the DOJ, including with respect to the determinations that the settlement amount should be recorded as a charge against earnings in the third quarter of 2016 rather than against any earlier periods, and that the settlement amount should be classified as an expense rather than a reduction of revenue.
Any of the changes discussed above could have a material adverse effect on our business, financial condition, results of operations, cash flows, and/or ordinary share price.
WE MUST MAINTAIN ADEQUATE INTERNAL CONTROLS AND BE ABLE TO PROVIDE AN ASSERTION AS TO THE EFFECTIVENESS OF SUCH CONTROLS ON AN ANNUAL BASIS.
Effective internal controls are necessary for us to provide reasonable assurance with respect to our financial reports. We spend a substantial amount of management and other employee time and resources to comply with laws, regulations and standards relating to corporate governance and public disclosure. In the U.S., such regulations include the Sarbanes-Oxley Act of 2002, SEC regulations and the NASDAQ listing standards. In particular, Section 404 of the Sarbanes-Oxley Act of 2002 requires management's annual review and evaluation of our internal control over financial reporting and attestation as to the effectiveness of these controls by our independent registered public accounting firm. If we fail to maintain the adequacy of our internal controls, we may not be able to ensure that we can conclude on an ongoing basis that we have effective internal control over financial reporting. Additionally, internal control over financial reporting may not prevent or detect misstatements because of its inherent limitations, including the possibility of human error, the circumvention or overriding of controls, or fraud. Therefore, even effective internal controls can provide only reasonable assurance with respect to the preparation and fair presentation of financial statements. In addition, projections of any evaluation of effectiveness of internal control over financial reporting to future periods are subject to the risk that the control may become inadequate because of changes in conditions, or that the degree of compliance with the policies or procedures may deteriorate. If we fail to maintain the adequacy of our internal controls, including any failure to implement required new or improved controls, this could have a material adverse effect on our business, financial condition, results of operations, cash flows, and/or ordinary share price.
OUR FUTURE SUCCESS IS HIGHLY DEPENDENT ON OUR CONTINUED ABILITY TO ATTRACT AND RETAIN KEY PERSONNEL. LOSS OF KEY PERSONNEL COULD LEAD TO LOSS OF CUSTOMERS, BUSINESS DISRUPTION, AND A DECLINE IN REVENUES, ADVERSELY AFFECT THE PROGRESS OF PIPELINE PRODUCTS, OR OTHERWISE ADVERSELY AFFECT OUR OPERATIONS.
It is important that we attract and retain qualified personnel in order to develop and commercialize new products, manage our business, and compete effectively. Competition for qualified personnel in the pharmaceutical industry is very intense. If we fail to attract and retain key scientific, technical, commercial, or management personnel, our business could be affected adversely. Additionally, while we have employment agreements with certain key employees in place, their employment for the duration of the agreement is not guaranteed. Current and prospective employees might also experience uncertainty about their future roles with us following the consummation and integration of our recent transactions, including the EPD Transaction and the Meda transaction, and potential future transactions, which might adversely affect our ability to retain key managers and other employees. If we are unsuccessful in retaining our key employees or enforcing certain post-employment contractual provisions such as confidentiality or non-competition provisions, it could have a material adverse effect on our business, financial condition, results of operations, cash flows, and/or ordinary share price.
OUR ACTUAL FINANCIAL POSITION AND RESULTS OF OPERATIONS MAY DIFFER MATERIALLY FROM THE UNAUDITED PRO FORMA FINANCIAL INFORMATION INCLUDED IN THIS ANNUAL REPORT.
The unaudited pro forma financial information contained in this Annual Report on Form 10-K may not be indicative of what our financial position or results of operations would have been had the Meda transaction and the EPD Transaction been completed on the dates indicated, nor are they indicative of the future operating results of Mylan N.V. The unaudited pro forma
46
Table of Contents
financial information has been derived from the historical consolidated financial statements of Mylan N.V., Mylan Inc., Meda, and the combined financial statements of the EPD Business and reflects certain adjustments related to past operating performance and acquisition accounting adjustments, such as increased amortization expense based on the fair value of assets acquired, the impact of transaction costs, and the related income tax effects. The information upon which these adjustments have been made is subjective, and these types of adjustments are difficult to make with complete accuracy. Accordingly, the actual financial position and results of our operations following the Meda transaction and the EPD Transaction may not be consistent with, or evident from, this unaudited pro forma financial information and other factors may affect our business, financial condition, results of operations, cash flows, and/or ordinary share price, including, among others, those described herein.
WE ARE IN THE PROCESS OF ENHANCING AND FURTHER DEVELOPING OUR GLOBAL ERP SYSTEMS AND ASSOCIATED BUSINESS APPLICATIONS, WHICH COULD RESULT IN BUSINESS INTERRUPTIONS IF WE ENCOUNTER DIFFICULTIES.
We are enhancing and further developing our global ERP and other business critical IT infrastructure systems and associated applications to provide more operating efficiencies and effective management of our business and financial operations. Such changes to ERP systems and related software, and other IT infrastructure carry risks such as cost overruns, project delays and business interruptions and delays. If we experience a material business interruption as a result of our ERP enhancements, it could have a material adverse effect on our business, financial condition, results of operations, cash flows, and/or ordinary share price. Refer to Management's Report on Internal Control over Financial Reporting included in Item 8 in this Form 10-K.
WE ARE INCREASINGLY DEPENDENT ON INFORMATION TECHNOLOGY AND OUR SYSTEMS AND INFRASTRUCTURE FACE CERTAIN RISKS, INCLUDING CYBERSECURITY AND DATA LEAKAGE RISKS.
Significant disruptions to our information technology systems or breaches of information security could adversely affect our business. We are increasingly dependent on sophisticated information technology systems and infrastructure to operate our business. We also have outsourced significant elements of our operations to third parties, some of which are outside the U.S., including significant elements of our information technology infrastructure, and as a result we are managing many independent vendor relationships with third parties who may or could have access to our confidential information. The size and complexity of our information technology systems, and those of our third-party vendors with whom we contract, make such systems potentially vulnerable to service interruptions. In addition, we and our vendors could be susceptible to third party attacks on our information technology systems. Such attacks are increasingly sophisticated and are made by groups and individuals with a wide range of motives and expertise, including state and quasi-state actors, criminal groups, "hackers" and others. Any security breach or other disruption to our or our vendors' information technology infrastructure could also interfere with or disrupt our business operations, including our manufacturing, distribution, R&D, sales and/or marketing activities.
In the ordinary course of business, we and our vendors collect, store and transmit large amounts of confidential information (including trade secrets or other intellectual property, proprietary business information and personal information), and it is critical that we do so in a secure manner to maintain the confidentiality and integrity of such confidential information. The size and complexity of our and our vendors' systems and the large amounts of confidential information that is present on them also makes them potentially vulnerable to security breaches from inadvertent or intentional actions by our employees, partners or vendors, or from attacks by malicious third parties. Maintaining the security, confidentiality and integrity of this confidential information (including trade secrets or other intellectual property, proprietary, business information and personal information) is important to our competitive business position. However, such information can be difficult to protect. While we have taken steps to protect such information, and to ensure that the third-party vendors' on which we rely have taken adequate steps to protect such information, there can be no assurance that our or our vendors' efforts will prevent service interruptions or security breaches in our systems or the unauthorized or inadvertent wrongful use or disclosure of confidential information that could adversely affect our business operations or result in the loss, misappropriation, and/or unauthorized access, use or disclosure of, or the prevention of access to, confidential information. A breach of our or our vendors' security measures or the accidental loss, inadvertent disclosure, unapproved dissemination, misappropriation or misuse of trade secrets, proprietary information, or other confidential information, whether as a result of theft, hacking, fraud, trickery or other forms of deception, or for any other cause, could enable others to produce competing products, use our proprietary technology or information, and/or adversely affect our business position. Further, any such interruption, security breach, or loss, misappropriation, and/or unauthorized access, use or disclosure of confidential information, including personal information regarding our patients and employees, could result in financial, legal, business, and reputational harm to us and could have a material adverse effect on our business, financial condition, results of operations, cash flows, and/or ordinary share price.
47
Table of Contents
WE ARE SUBJECT TO DATA PRIVACY AND SECURITY LAWS AND REGULATIONS IN MANY DIFFERENT JURISDICTIONS AND COUNTRIES WHERE WE DO BUSINESS, AND OUR OR OUR VENDORS' FAILURE TO COMPLY COULD RESULT IN FINES, PENALTIES, REPUTATIONAL DAMAGE, AND COULD IMPACT THE WAY WE OPERATE OUR BUSINESS.
We are subject to laws and regulations governing the collection, use and transmission of personal information, including health information. As the legislative and regulatory landscape for data privacy and protection continues to evolve around the world, there has been an increasing focus on privacy and data protection issues that may affect our business, including the U.S.'s federal Health Insurance Portability and Accountability Act of 1996, as amended ("HIPAA"), the EU's General Data Protection Regulation ("GDPR"), and other laws and regulations described below.
In the U.S., we may be subject to state security breach notification laws, state health information privacy laws and federal and state consumer protections laws which impose requirements for the collection, use, disclosure and transmission of personal information. Each of these laws are subject to varying interpretations by courts and government agencies, creating complex compliance issues for us. If we, or the third-party vendors' on which we reply, fail to comply with applicable laws and regulations we could be subject to fines, penalties or sanctions, including criminal penalties if we knowingly obtain individually identifiable health information from a covered entity in a manner that is not authorized or permitted by HIPAA or for aiding and abetting the violation of HIPAA.
In addition, EU member states and other jurisdictions have adopted data protection laws and regulations that impose significant compliance obligations. The EC's adoption of the 1995 EU Data Protection Directive imposed significant compliance obligations. As implemented into national laws by the EU member states, the Data Protection Directive imposes strict obligations and restrictions on the ability to collect, analyze, and transfer personal data, including health data from clinical trials and adverse event reporting. Data protection authorities from different EU member states have interpreted the privacy laws differently, adding to the complexity of processing personal data in the EU, and guidance on implementation and compliance practices are often updated or otherwise revised. Any failure to comply with the rules arising from the EU Data Protection Directive and related national laws of EU member states could lead to government enforcement actions and significant penalties against us, and adversely impact our operating results.
In 2016, the EU formally adopted GDPR, which will directly apply to and bind all EU member states from May 25, 2018 and will replace the current EU Data Protection Directive on that date. The regulation introduces new data protection requirements in the EU and establishes a framework to govern data sharing and collection and related consumer privacy rights. Compared to the current Directive, the GDPR may result in greater compliance obligations, including the implementation of a number of processes and policies around our data collection and use. In addition, the GDPR includes significant new penalties for non-compliance, with fines up to the higher of €20 million or 4% of total annual worldwide revenue. In general, GDPR, and other local privacy laws, could also lead to adaptation of our technologies or practices to satisfy local privacy requirements and standards that may be more stringent than in the U.S.
Other countries in which we do business have, or are developing, laws governing the collection, use and transmission of personal information as well that may affect our business or require us to adapt our technologies or practices. These include Canada and several Latin American and Asian countries, which have constitutional protections for, or have adopted legislation protecting, individuals' personal information. Other countries, including Australia and Japan, have established specific legal requirements for cross-border transfers of personal information. Some countries, including India, are considering legislation implementing data protection requirements or requiring local storage and processing of data or similar requirements.
These and similar initiatives could increase the cost of developing, implementing or maintaining our IT systems, require us to allocate more resources to compliance initiatives or increase our costs. In addition, a failure by us, or our third-party vendors, to comply with applicable data privacy and security laws could result in financial, legal, business, and reputational harm to us and could have a material adverse effect on the way we operate our business, our financial condition, results of operations, cash flows, and/or ordinary share price.
THE EXPANSION OF SOCIAL MEDIA PLATFORMS PRESENTS NEW RISKS AND CHALLENGES.
The inappropriate use of certain social media vehicles could cause brand damage or information leakage or could lead to legal implications from the improper collection and/or dissemination of personally identifiable information or the improper dissemination of material non-public information. In addition, negative posts or comments about us on any social networking web site could seriously damage our reputation. Further, the disclosure of non-public company sensitive information through external media channels could lead to information loss as there might not be structured processes in place to secure and protect information. If our non-public sensitive information is disclosed or if our reputation is seriously damaged through social media,
48
Table of Contents
it could have a material adverse effect on our business, financial condition, results of operations, cash flows, and/or ordinary share price.
ITEM 1B. | Unresolved Staff Comments |
As previously disclosed, on April 25, 2017, Mylan received a comment letter from the staff of the SEC's Division of Corporation Finance ("Corporation Finance") with respect to Mylan's Annual Report on Form 10-K for the year ended December 31, 2016, requesting information regarding Mylan's accounting treatment of the $465 million Medicaid Drug Rebate Program Settlement with the DOJ, including with respect to the determinations that the settlement amount should be recorded as a charge against earnings in the third quarter of 2016 rather than against any earlier periods, and that the settlement amount should be classified as an expense rather than a reduction of revenue. The Company responded to the comment letter in May 2017 and we will continue to respond to any additional correspondence from Corporation Finance. We believe that our accounting treatment for the aforementioned DOJ settlement is appropriate and consistent with all applicable accounting standards.
ITEM 2. | Properties |
For information regarding properties, refer to Item 1 "Business" in Part I of this Annual Report on Form 10-K.
ITEM 3. | Legal Proceedings |
For information regarding legal proceedings, refer to Note 18 Litigation , in the accompanying Notes to Consolidated Financial Statements in Item 8 in this Annual Report on Form 10-K.
49
Table of Contents
PART II
ITEM 5. | Market for Registrant's Common Equity, Related Stockholder Matters and Issuer Purchases of Equity Securities |
Our ordinary shares are traded on the NASDAQ Stock Market under the symbol "MYL." Our ordinary shares were also traded on the Tel Aviv Stock Exchange ("TASE"). On November 10, 2017, however, the Company announced that it was voluntarily delisting the Company's ordinary shares from trading on the TASE and the TASE delisting became effective on February 12, 2018.
The following table sets forth the quarterly high and low sales prices for Mylan N.V. 's ordinary shares for the quarterly periods of 2017 and 2016 :
Year Ended December 31, 2017 | High |
| Low | ||||
Three months ended March 31, 2017 | $ | 45.87 | |
| $ | 35.16 | |
Three months ended June 30, 2017 | 40.67 | |
| 36.50 | | ||
Three months ended September 30, 2017 | 39.80 | |
| 29.39 | | ||
Three months ended December 31, 2017 | 42.53 | |
| 31.03 | | ||
Year Ended December 31, 2016 | High |
| Low | ||||
Three months ended March 31, 2016 | $ | 54.44 | |
| $ | 40.04 | |
Three months ended June 30, 2016 | 49.42 | |
| 38.01 | | ||
Three months ended September 30, 2016 | 50.40 | |
| 37.65 | | ||
Three months ended December 31, 2016 | 40.50 | |
| 33.60 | | ||
As of January 22, 2018 , there were approximately 147,000 holders of Mylan N.V. ordinary shares, including those held in street or nominee name.
The Company did not pay dividends in 2017 or 2016 and does not intend to pay dividends on its ordinary shares in the near future.
ISSUER PURCHASES OF EQUITY SECURITIES
Period |
| Total Number of Shares Purchased (1)(2) |
| Average Price Paid per Share (3) |
| Total Number of Shares Purchased as Part of Publicly Announced Plans or Programs |
| Approximate Dollar Value of Shares that May Yet Be Purchased Under the Plans or Programs | ||||||
October 1 - October 30, 2017 |
| - | |
| $ | - | |
| - | |
| $ | 932,526,009 | |
November 1 - November 30, 2017 |
| - | |
| $ | - | |
| - | |
| $ | 932,526,009 | |
December 1 - December 31, 2017 |
| 12,384,058 | |
| $ | 40.39 | |
| 12,384,058 | |
| $ | 432,333,906 | |
Total |
| 12,384,058 | |
| $ | 40.39 | |
| 12,384,058 | |
| $ | 432,333,906 | |
(1) | The Company was authorized to repurchase up to $1 billion of the Company's ordinary shares under its repurchase program that was previously approved by the Company's Board of Directors and announced on November 16, 2015 (the "Share Repurchase Program"), but was not obligated to acquire any particular amount of ordinary shares. During 2017 , the Company repurchased approximately 12.4 million ordinary shares at a cost of approximately $500.2 million . In January 2018, the Company repurchased an additional 9.8 million ordinary shares at a cost of approximately $432.0 million and on January 9, 2018, the Share Repurchase Program was completed. |
(2) | The number of shares purchased is based on the purchase date and not the settlement date. |
(3) | Average price per share includes commissions. |
50
Table of Contents
UNREGISTERED SALES OF DEBT SECURITIES
In the past three years, we have issued unregistered securities in connection with the following transactions:
In May 2017, Mylan N.V. issued €500 million aggregate principal amount of senior unsecured debt securities, comprised of floating rate Senior Notes due 2020. These notes were issued in a private offering exempt from the registration requirements of the Securities Act of 1933, as amended (the "Securities Act"), to persons outside of the U.S. pursuant to Regulation S under the Securities Act.
In November 2016, Mylan N.V. issued €3.0 billion aggregate principal amount of senior unsecured debt securities, comprised of floating rate Senior Notes due 2018, 1.250% Senior Notes due 2020, 2.250% Senior Notes due 2024 and 3.125% Senior Notes due 2028. These notes were issued in a private offering exempt from the registration requirements of the Securities Act, to persons outside of the U.S. pursuant to Regulation S under the Securities Act.
In June 2016, Mylan N.V. issued $6.5 billion aggregate principal amount of senior unsecured debt securities, comprised of 2.500% Senior Notes due 2019, 3.150% Senior Notes due 2021, 3.950% Senior Notes due 2026 and 5.250% Senior Notes due 2046. These notes were issued in a private offering exempt from the registration requirements of the Securities Act, to qualified institutional buyers in accordance with Rule 144A and to persons outside of the U.S. pursuant to Regulation S under the Securities Act. In December 2016, Mylan N.V. and Mylan Inc. filed a registration statement with the SEC with respect to an offer to exchange these notes for registered notes with the same aggregate principal amount and terms substantially identical in all material respects, which was declared effective on January 3, 2017. The exchange offer expired on January 31, 2017 and settled on February 3, 2017.
In December 2015, Mylan N.V. issued $1.0 billion aggregate principal amount of senior unsecured debt securities, comprised of 3.000% Senior Notes due 2018 and 3.750% Senior Notes due 2020. These notes were issued in a private offering exempt from the registration requirements of the Securities Act to qualified institutional buyers in accordance with Rule 144A and to persons outside of the United States pursuant to Regulation S under the Securities Act. In December 2016, Mylan N.V. and Mylan Inc. filed a registration statement with the SEC with respect to an offer to exchange these notes for registered notes with the same aggregate principal amount and terms substantially identical in all material respects, which was declared effective on January 3, 2017. The exchange offer expired on January 31, 2017 and settled on February 3, 2017.
51
Table of Contents
STOCK PERFORMANCE GRAPH
Set forth below is a performance graph comparing the cumulative total return (assuming reinvestment of dividends), in U.S. Dollars, for the calendar years ended December 31, 2013 , 2014 , 2015 , 2016 and 2017 of $100 invested on December 31, 2012 in the Company's ordinary shares, the Standard & Poor's 500 Index and the Dow Jones U.S. Pharmaceuticals Index.
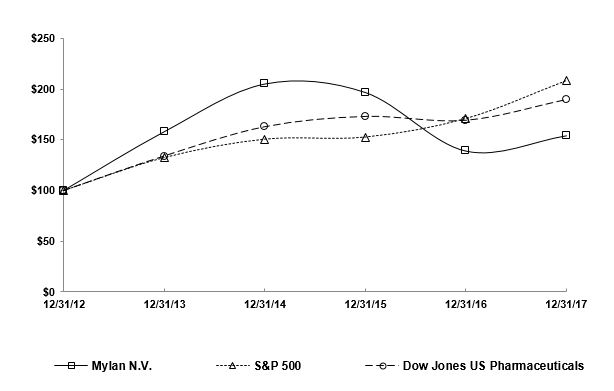
| December 31, |
| December 31, |
| December 31, |
| December 31, |
| December 31, |
| December 31, | ||||||
Mylan N.V. (1) | 100.00 | |
| 158.11 | |
| 205.36 | |
| 196.98 | |
| 138.98 | |
| 154.13 | |
S&P 500 | 100.00 | |
| 132.39 | |
| 150.51 | |
| 152.59 | |
| 170.84 | |
| 208.14 | |
Dow Jones U.S. Pharmaceuticals | 100.00 | |
| 133.92 | |
| 162.59 | |
| 172.69 | |
| 168.93 | |
| 189.27 | |
____________
(1) | Mylan Inc. prior to February 27, 2015 . |
52
Table of Contents
ITEM 6. | Selected Financial Data |
The selected consolidated financial data set forth below should be read in conjunction with "Management's Discussion and Analysis of Results of Operations and Financial Condition" included in Item 7 and the Consolidated Financial Statements and related Notes to Consolidated Financial Statements included in Item 8 in this Annual Report on Form 10-K. The functional currency of the primary economic environment in which the operations of Mylan and its subsidiaries in the U.S. are conducted is the U.S. Dollar. The functional currency of non-U.S. subsidiaries is generally the local currency in the country in which each subsidiary operates.
Mylan N.V. is the successor to Mylan Inc., the information set forth below refers to Mylan Inc. for periods prior to February 27, 2015, and to Mylan N.V. on and after February 27, 2015.
| Year Ended December 31, | ||||||||||||||||||
(In millions, except per share amounts) | 2017 |
| 2016 |
| 2015 |
| 2014 |
| 2013 | ||||||||||
Statements of Operations: |
|
|
|
|
|
|
|
|
| ||||||||||
Total revenues | $ | 11,907.7 | |
| $ | 11,076.9 | |
| $ | 9,429.3 | |
| $ | 7,719.6 | |
| $ | 6,909.1 | |
Cost of sales (1) | 7,124.6 | |
| 6,379.9 | |
| 5,213.2 | |
| 4,191.6 | |
| 3,868.8 | | |||||
Gross profit | 4,783.1 | |
| 4,697.0 | |
| 4,216.1 | |
| 3,528.0 | |
| 3,040.3 | | |||||
Operating expenses: |
|
|
|
|
|
|
|
|
| ||||||||||
Research and development | 783.3 | |
| 826.8 | |
| 671.9 | |
| 581.8 | |
| 507.8 | | |||||
Selling, general and administrative | 2,575.8 | |
| 2,496.1 | |
| 2,180.7 | |
| 1,625.7 | |
| 1,408.5 | | |||||
Litigation settlements and other contingencies, net | (13.1 | ) |
| 672.5 | |
| (97.4 | ) |
| (32.1 | ) |
| (11.5 | ) | |||||
Total operating expenses | 3,346.0 | |
| 3,995.4 | |
| 2,755.2 | |
| 2,175.4 | |
| 1,904.8 | | |||||
Earnings from operations | 1,437.1 | |
| 701.6 | |
| 1,460.9 | |
| 1,352.6 | |
| 1,135.5 | | |||||
Interest expense | 534.6 | |
| 454.8 | |
| 339.4 | |
| 333.2 | |
| 313.3 | | |||||
Other expense (income), net | (0.5 | ) |
| 125.1 | |
| 206.1 | |
| 44.9 | |
| 74.9 | | |||||
Earnings before income taxes and noncontrolling interest | 903.0 | |
| 121.7 | |
| 915.4 | |
| 974.5 | |
| 747.3 | | |||||
Income tax provision (benefit) | 207.0 | |
| (358.3 | ) |
| 67.7 | |
| 41.4 | |
| 120.8 | | |||||
Net earnings (loss) attributable to the noncontrolling interest | - | |
| - | |
| (0.1 | ) |
| (3.7 | ) |
| (2.8 | ) | |||||
Net earnings attributable to Mylan N.V. ordinary shareholders | $ | 696.0 | |
| $ | 480.0 | |
| $ | 847.6 | |
| $ | 929.4 | |
| $ | 623.7 | |
Earnings per ordinary share attributable to Mylan N.V. ordinary shareholders |
|
|
|
|
|
|
|
|
| ||||||||||
Basic | $ | 1.30 | |
| $ | 0.94 | |
| $ | 1.80 | |
| $ | 2.49 | |
| $ | 1.63 | |
Diluted | $ | 1.30 | |
| $ | 0.92 | |
| $ | 1.70 | |
| $ | 2.34 | |
| $ | 1.58 | |
Weighted average ordinary shares outstanding: |
|
|
|
|
|
|
|
|
| ||||||||||
Basic | 534.5 | |
| 513.0 | |
| 472.2 | |
| 373.7 | |
| 383.3 | | |||||
Diluted | 536.7 | |
| 520.5 | |
| 497.4 | |
| 398.0 | |
| 394.5 | | |||||
Selected Balance Sheet data: |
|
|
|
|
|
|
|
|
| ||||||||||
Total assets (2)(3) | $ | 35,806.3 | |
| $ | 34,726.2 | |
| $ | 22,267.7 | |
| $ | 15,820.5 | |
| $ | 15,086.6 | |
Working capital (2)(3)(4) | 828.0 | |
| 2,350.5 | |
| 2,350.5 | |
| 1,137.2 | |
| 1,258.6 | | |||||
Short-term borrowings | 46.5 | |
| 46.4 | |
| 1.3 | |
| 330.7 | |
| 439.8 | | |||||
Long-term debt, including current portion of long-term debt (2) | 14,614.5 | |
| 15,426.2 | |
| 7,294.3 | |
| 8,104.1 | |
| 7,543.8 | | |||||
Total equity | 13,307.6 | |
| 11,117.6 | |
| 9,765.8 | |
| 3,276.0 | |
| 2,959.9 | | |||||
(1) | Cost of sales includes the following amounts primarily related to the amortization of purchased intangibles from acquisitions: $1.42 billion , $1.32 billion , $854.2 million , $375.9 million and $351.1 million for the years ended December 31, 2017 , 2016 , 2015 , 2014 and 2013 , respectively. In addition, cost of sales included the following amounts |
53
Table of Contents
related to impairment charges to intangible assets: $80.8 million , $68.3 million , $31.3 million , $27.7 million and $18.0 million for the years ended December 31, 2017 , 2016 , 2015 , 2014 and 2013 , respectively.
(2) | Pursuant to the Company's adoption of Accounting Standards Update ("ASU") 2015-03, Interest - Imputation of Interest , as of December 31, 2015, deferred financing fees related to term debt have been retrospectively reclassified from other assets to long-term debt or the current portion of long-term debt, depending on the debt instrument, on the Consolidated Balance Sheets for all periods presented. The Company retrospectively reclassified approximately $34.4 million and $42.7 million for the years ended December 31, 2014 and 2013 , respectively. |
(3) | Pursuant to the Company's adoption of ASU 2015-17, Balance Sheet Classification of Deferred Taxes , as of December 31, 2015, deferred tax assets and liabilities that had been previously classified as current have been retrospectively reclassified to noncurrent on the Consolidated Balance Sheets for all periods presented. The reclassification resulted in a decrease in current assets of approximately $345.7 million and $250.1 million for the years ended December 31, 2014 and 2013 , respectively. The reclassification resulted in a decrease in current liabilities of approximately $0.2 million and $1.5 million for the years ended December 31, 2014 and 2013 , respectively. |
(4) | Working capital is calculated as current assets minus current liabilities. |
54
Table of Contents
ITEM 7. | Management's Discussion and Analysis of Financial Condition And Results of Operations |
The following discussion and analysis addresses material changes in the financial condition and results of operations of Mylan N.V. and subsidiaries for the periods presented. Unless context requires otherwise, the "Company," "Mylan," "our," or "we" refer to Mylan N.V. and its subsidiaries. This discussion and analysis should be read in conjunction with the Consolidated Financial Statements , the related Notes to Consolidated Financial Statements and our other SEC filings and public disclosures.
This Annual Report on Form 10-K contains "forward-looking statements." These statements are made pursuant to the safe harbor provisions of the Private Securities Litigation Reform Act of 1995. Such forward-looking statements may include, without limitation, statements about the potential benefits and synergies of acquisitions, future opportunities for Mylan and its products, and any other statements regarding Mylan's future operations, anticipated business levels, future earnings, planned activities, anticipated growth, market opportunities, strategies, competition, and other expectations and targets for future periods. These may often be identified by the use of words such as "will," "may," "could," "should," "would," "project," "believe," "anticipate," "expect," "plan," "estimate," "forecast," "potential," "intend," "continue," "target" and variations of these words or comparable words. Because forward-looking statements inherently involve risks and uncertainties, actual future results may differ materially from those expressed or implied by such forward-looking statements. Factors that could cause or contribute to such differences include, but are not limited to: the ability to meet expectations regarding the accounting and tax treatments of acquisitions, including the EPD Transaction; changes in relevant tax and other laws, including but not limited to changes in the U.S. tax code and healthcare and pharmaceutical laws and regulations in the U.S. and abroad; actions and decisions of healthcare and pharmaceutical regulators; the integration of acquired businesses or assets being more difficult, time-consuming, or costly than expected; operating costs, customer loss, and business disruption (including, without limitation, difficulties in maintaining relationships with employees, customers, clients, or suppliers) being greater than expected following acquisitions; the possibility that Mylan may be unable to achieve expected synergies and operating efficiencies in connection with acquisitions and the December 2016 announced restructuring programs in certain locations, within the expected time-frames or at all expected or targeted future financial and operating performance and results; the capacity to bring new products to market, including but not limited to where Mylan uses its business judgment and decides to manufacture, market, and/or sell products, directly or through third parties, notwithstanding the fact that allegations of patent infringement(s) have not been finally resolved by the courts (i.e., an "at-risk launch"); any regulatory, legal, or other impediments to Mylan's ability to bring new products, including but not limited to generic Advair and Glatiramer Acetate Injection 20 mg/mL and 40 mg/mL, to market, including ongoing and unresolved allegations of patent infringement around our launch of Glatiramer Acetate Injection 40 mg/mL; success of clinical trials and Mylan's ability to execute on new product opportunities, including but not limited to generic Advair and Glatiramer Acetate Injection 20 mg/mL and 40 mg/mL; any changes in or difficulties with our inventory of, and the ability of Meridian Medical Technologies, a Pfizer company, to supply us with the EpiPen® Auto-Injector and EpiPen Jr® Auto-Injector (collectively, "EpiPen® Auto-Injector") to meet anticipated demand; the potential impact of any change in patient access to the EpiPen® Auto-Injector and the introduction of a generic version of the EpiPen® Auto-Injector; the scope, timing, and outcome of any ongoing legal proceedings, including government investigations, and the impact of any such proceedings on financial condition, results of operations, and/or cash flows; the ability to protect intellectual property and preserve intellectual property rights; the effect of any changes in customer and supplier relationships and customer purchasing patterns; the ability to attract and retain key personnel; changes in third-party relationships; the impact of competition; changes in the economic and financial conditions of the businesses of Mylan; the inherent challenges, risks, and costs in identifying, acquiring, and integrating complementary or strategic acquisitions of other companies, products, or assets and in achieving anticipated synergies; uncertainties and matters beyond the control of management; and inherent uncertainties involved in the estimates and judgments used in the preparation of financial statements, and the providing of estimates of financial measures, in accordance with accounting principles generally accepted in the United States of America ("U.S. GAAP") and related standards or on an adjusted basis. For more detailed information on the risks and uncertainties associated with Mylan's business activities, see the risks described in this Annual Report on Form 10-K for the year ended December 31, 2017 and our other filings with the SEC. You can access Mylan's filings with the SEC through the SEC website at www.sec.gov, and Mylan strongly encourages you to do so. Mylan routinely posts information that may be important to investors on our website at investor.mylan.com, and we use this website address as a means of disclosing material information to the public in a broad, non-exclusionary manner for purposes of the SEC's Regulation Fair Disclosure (Reg FD). The contents of our website are not incorporated by reference in this Annual Report on Form 10-K and shall not be deemed "filed" under the Securities Exchange Act of 1934, as amended. Mylan undertakes no obligation to update any statements herein for revisions or changes after the filing date of this Annual Report on Form 10-K.
55
Table of Contents
Executive Overview
Mylan is a leading global pharmaceutical company, which develops, licenses, manufactures, markets and distributes generic, branded generics, brand name and OTC products in a variety of dosage forms and therapeutic categories. Mylan is committed to setting new standards in healthcare by creating better health for a better world, and our mission is to provide the world's 7 billion people access to high quality medicine. To do so, we innovate to satisfy unmet needs; make reliability and service excellence a habit; do what's right, not what's easy; and impact the future through passionate global leadership. We believe access to healthcare should be a right, not a privilege. That makes our mission very personal. While a great deal of progress has been made over the years to expand access to healthcare, there's still much to be done. With our strong foundation in pharmaceuticals and long track record of doing good, Mylan is uniquely positioned to address the world's most pressing health concerns.
Mylan offers one of the industry's broadest product portfolios, including more than 7,500 marketed products around the world, to customers in more than 165 countries and territories. We operate a global, high quality, vertically-integrated manufacturing platform around the world and one of the world's largest API operations. We also operate a strong and innovative R&D network that has consistently delivered a robust product pipeline including a variety of dosage forms, therapeutic categories and biosimilars.
Generic products, particularly in the U.S., generally contribute most significantly to revenues and gross margins at the time of their launch, and even more so in periods of market exclusivity, or in periods of limited generic competition. As such, the timing of new product introductions can have a significant impact on the Company's financial results. The entrance into the market of additional competition generally has a negative impact on the volume and pricing of the affected products. Additionally, pricing is often affected by factors outside of the Company's control.
For branded products, the majority of the product's commercial value is usually realized during the period in which the product has market exclusivity. In the U.S. and some other countries, when market exclusivity expires and generic versions of a product are approved and marketed, there can often be very substantial and rapid declines in the branded product's sales. OTC products also participate in a competitive environment that includes both branded and private label products. In the OTC space, value is realized through innovation, access and consumer activation.
Certain markets within Europe in which we do business have undergone government-imposed price reductions, and further government-imposed price reductions are expected in the future. Such measures, along with the tender systems discussed below, are likely to have a negative impact on sales and gross profit in these markets. However, government initiatives in certain markets that appear to favor generic products could help to mitigate this unfavorable effect by increasing rates of generic substitution and penetration.
Additionally, a number of markets in which we operate in Europe have implemented, or may implement, tender systems for generic pharmaceuticals in an effort to lower prices. Generally speaking, tender systems can have an unfavorable impact on sales and profitability. Under such tender systems, manufacturers submit bids that establish prices for generic pharmaceutical products. Upon winning the tender, the winning company will receive priority placement for a period of time. The tender system often results in companies underbidding one another by proposing low pricing in order to win the tender. The loss of a tender by a third party to whom we supply API can also have a negative impact on our sales and profitability. Sales continue to be negatively affected by the impact of tender systems in certain countries.
As in Europe, both Australia and Japan have undergone government-imposed price reductions that have had, and could continue to have, a negative impact on sales and gross profit in these markets.
In August 2016, we acquired Meda for a total purchase price of approximately $6.92 billion , net of cash acquired. Meda provided a diversified and expansive portfolio of branded and generic medicines along with a strong and growing portfolio of OTC products. The combined company has a balanced global footprint with significant scale in key geographic markets, particularly the U.S. and Europe. The acquisition of Meda also expanded our presence in key emerging markets, including China, Russia, Turkey, and Mexico, and in countries in South East Asia, and the Middle East, which complemented Mylan's existing presence in India, Brazil and Africa (including South Africa).
From time to time, a limited number of our products may represent a significant portion of our net sales, gross profit and net earnings. Generally, this is due to the timing of new product introductions and the amount, if any, of additional competition in the market. Our top ten products in terms of sales, in the aggregate, represented approximately 21% and 27% for the years ended December 31, 2017 and 2016 , respectively.
56
Table of Contents
Recent Developments
In the fourth quarter of 2016, the Company announced restructuring programs in certain locations representing initial steps in a series of actions that are anticipated to further streamline our operations globally. The Company continues to develop the details of the cost reduction initiatives, including workforce actions and other potential restructuring activities beyond the programs already announced. Throughout 2017, the Company committed to additional restructuring actions. During the year ended December 31, 2017 , the Company recorded pre-tax charges of $188.0 million . Included within the charges during the year ended December 31, 2017 were $74.4 million for non-cash asset impairment charges. The remaining charges during the year ended December 31, 2017 primarily relate to severance and employee benefits. The continued restructuring actions are expected to be implemented through fiscal year 2018. The Company estimates total aggregate pre-tax charges for committed restructuring activities ranging from between $375.0 million and $450.0 million , inclusive of the 2016 and 2017 restructuring charges. In addition, as a result of the restructuring activities that have been undertaken to date, management believes the potential annual savings will be between approximately $350.0 million and $425.0 million once fully implemented, with the majority of these savings improving operating cash flow. At this time, the expenses related to the additional restructuring activities cannot be reasonably estimated.
On August 17, 2017, the Company announced that its subsidiaries, Mylan Inc. and Mylan Specialty L.P., signed an agreement with the DOJ and two relators finalizing the $465 million Medicaid Drug Rebate Program Settlement. The settlement resolves claims relating to the classification of EpiPen® Auto-Injector for purposes of the Medicaid Drug Rebate Program. During the year ended December 31, 2017 , the Company made payments of approximately $472.7 million related to this matter.
In October 2017, the Company announced the U.S. launch of the first Glatiramer Acetate Injection 40 mg/mL for 3-times-a-week injection that is an AP-rated substitutable generic version of Teva's Copaxone® 40 mg/mL, as well as Glatiramer Acetate Injection 20 mg/mL for once-daily injection, an AP-rated, substitutable generic version of Teva's Copaxone® 20 mg/mL. These products are indicated for the treatment of patients with relapsing forms of multiple sclerosis (MS), a chronic inflammatory disease of the central nervous system. The Company also announced in October 2017 that its partner, Synthon, received marketing authorization approval in Europe for Glatiramer Acetate Injection 40 mg/mL. Mylan is partnered with Synthon, the developer and supplier of its European Glatiramer Acetate Injection products, and has exclusive distribution and supply rights in certain key European markets. We have launched the product in several countries in 2018.
On December 1, 2017, the Company announced that the FDA approved Mylan's Ogivri™ (trastuzumab-dkst), a biosimilar to Herceptin® (trastuzumab), co-developed with Biocon. Ogivri has been approved for all indications included in the label of the reference product, Herceptin, including for the treatment of HER2-overexpressing breast cancer and metastatic stomach cancer. Ogivri is the first FDA-approved biosimilar to Herceptin and the first biosimilar from Mylan and Biocon's joint portfolio approved in the U.S. Mylan anticipates potentially being the first company to offer a biosimilar to Herceptin, as a result of Mylan's ability to secure global licenses for its trastuzumab product from Genentech and Roche earlier this year.
On December 22, 2017, the Tax Act was signed into law making significant changes to the Code. Changes include, but are not limited to, a U.S. federal corporate income tax rate decrease from 35% to 21% effective for tax years beginning after December 31, 2017, the transition of U.S international taxation from a worldwide tax system to a territorial system, and a one-time transition tax on the mandatory deemed repatriation of cumulative foreign earnings of non-U.S. corporate subsidiaries of large U.S. shareholders as of December 31, 2017.
The Company was authorized to repurchase up to $1 billion of the Company's ordinary shares under its Share Repurchase Program, but was not obligated to acquire any particular amount of ordinary shares. During 2017 , the Company repurchased approximately 12.4 million ordinary shares at a cost of approximately $500.2 million . In January 2018, the Company repurchased an additional 9.8 million ordinary shares at a cost of approximately $432.0 million and on January 9, 2018, the Share Repurchase Program was completed.
On January 29, 2018, the Company announced that the FDA had accepted for review Mylan and Theravance's recently submitted NDA for revefenacin (TD-4208), an investigational long-acting muscarinic antagonist (LAMA). If approved, revefenacin would be the first once-daily, nebulized bronchodilator for the treatment of chronic obstructive pulmonary disease (COPD). The FDA has assigned a Prescription Drug User Fee Act (PDUFA) target action date of November 13, 2018, and indicated that it does not currently plan to convene an advisory committee meeting to discuss the NDA.
57
Table of Contents
Financial Summary
The table below is a summary of the Company's financial results for the year ended December 31, 2017 compared to the prior year period:
| Year Ended December 31, |
|
|
|
| |||||||||
(In millions, except per share amounts) | 2017 |
| 2016 |
| Change |
| % Change | |||||||
Total revenues | $ | 11,907.7 | |
| $ | 11,076.9 | |
| $ | 830.8 | |
| 8 | % |
Gross profit | 4,783.1 | |
| 4,697.0 | |
| 86.1 | |
| 2 | % | |||
Earnings from operations | 1,437.1 | |
| 701.6 | |
| 735.5 | |
| 105 | % | |||
Net earnings | 696.0 | |
| 480.0 | |
| 216.0 | |
| 45 | % | |||
Diluted earnings per ordinary share | $ | 1.30 | |
| $ | 0.92 | |
| $ | 0.38 | |
| 41 | % |
A detailed discussion of the Company's financial results can be found below in the section titled "Results of Operations." As part of this discussion, we also report sales performance using the non-GAAP financial measures of "constant currency" third party net sales and total revenues. This measure provides information on the change in net sales assuming that foreign currency exchange rates had not changed between the prior and current period. The comparisons presented at constant currency rates reflect comparative local currency sales at the prior year's foreign exchange rates. We routinely evaluate our third party net sales performance at constant currency so that sales results can be viewed without the impact of foreign currency exchange rates, thereby facilitating a period-to-period comparison of our operational activities, and believe that this presentation also provides useful information to investors for the same reason. The following table compares third party net sales on an actual and constant currency basis for each reportable segment for the years ended December 31, 2017 , 2016 and 2015 .
More information about other non-GAAP measures used by the Company as part of this discussion, including adjusted third party net sales from Europe, adjusted third party net sales, adjusted total revenues, adjusted cost of sales, adjusted gross margins, adjusted earnings, and adjusted EPS are discussed further in this Item 7 under Results of Operations and Results of Operations - Use of Non-GAAP Financial Measures .
Results of Operations
2017 Compared to 2016
| Year Ended December 31, | ||||||||||||||||||||
(In millions) | 2017 |
| 2016 |
| % Change |
| 2017 Currency Impact (1) |
| 2017 Constant Currency Revenues |
| Constant Currency % Change (2) | ||||||||||
Third party net sales |
|
|
|
|
|
|
|
|
|
|
| ||||||||||
North America | $ | 4,969.6 | |
| $ | 5,629.5 | |
| (12 | )% |
| $ | (6.8 | ) |
| $ | 4,962.8 | |
| (12 | )% |
Europe | 3,958.3 | |
| 2,953.8 | |
| 34 | % |
| (89.7 | ) |
| 3,868.6 | |
| 31 | % | ||||
Rest of World | 2,832.1 | |
| 2,383.8 | |
| 19 | % |
| (52.2 | ) |
| 2,779.9 | |
| 17 | % | ||||
Total third party net sales | 11,760.0 | |
| 10,967.1 | |
| 7 | % |
| (148.7 | ) |
| 11,611.3 | |
| 6 | % | ||||
|
|
|
|
|
|
|
|
|
|
|
| ||||||||||
Other third party revenues | 147.7 | |
| 109.8 | |
| 35 | % |
| (0.8 | ) |
| 146.9 | |
| 34 | % | ||||
Consolidated total revenues | $ | 11,907.7 | |
| $ | 11,076.9 | |
| 8 | % |
| $ | (149.5 | ) |
| $ | 11,758.2 | |
| 6 | % |
(1) | Currency impact is shown as unfavorable (favorable). |
(2) | The constant currency percentage change is derived by translating third party net sales or revenues for the current period at prior year comparative period exchange rates, and in doing so shows the percentage change for 2017 constant currency third party net sales or revenues to the corresponding amount in the prior year. |
58
Table of Contents
Total Revenues
For the year ended December 31, 2017 , Mylan reported total revenues of $11.91 billion , compared to $11.08 billion for the comparable prior year period, representing an increase of $830.8 million , or 8% . Total revenues include both net sales and other revenues from third parties. Third party net sales for the year ended December 31, 2017 were $11.76 billion , compared to $10.97 billion for the comparable prior year period, representing an increase of $792.9 million , or 7% . Other third party revenues for the year ended December 31, 2017 were $147.7 million , compared to $109.8 million for the comparable prior year period, an increase of $37.9 million . The increase in other third party revenues was principally the result of an incremental increase in royalty income from arrangements acquired in the Meda acquisition.
The increase in total revenues included third party net sales growth in the Europe segment of 34% , and in the Rest of World segment of 19% . Third party net sales declined in the North America segment by 12% . Contributing to the overall increase in total revenues were the incremental net sales from the acquisitions of Meda and the Topicals Business of approximately $1.41 billion . This increase was partially offset by a net decrease in net sales from existing products and lower new product introductions of approximately $764.1 million . The decrease from existing products was due primarily to lower pricing and, to a lesser extent, lower volumes in the current period. Mylan's total revenues were favorably impacted by the effect of foreign currency translation, primarily reflecting changes in the U.S. Dollar as compared to the currencies of Mylan's subsidiaries in the European Union, India, and Australia, which was partially offset by the unfavorable impact from changes in the Japanese Yen and the Pound Sterling. The favorable impact of foreign currency translation on current year total revenues was approximately $149.5 million resulting in an increase in constant currency total revenues of approximately $681.3 million , or 6% .
In arriving at net sales, gross sales are reduced by provisions for estimates, including discounts, rebates, promotions, price adjustments, returns and chargebacks. See the Application of Critical Accounting Policies section in this Item 7 for a discussion of our methodology with respect to such provisions. For 2017 , the most significant amounts charged against gross sales were $4.24 billion related to chargebacks and $4.19 billion related to incentives offered to our customers, such as volume related incentives and promotions. For 2016 , the most significant amounts charged against gross sales were for chargebacks in the amount of $4.33 billion and incentives offered to our customers in the amount of $3.93 billion .
Third party net sales are derived from our three geographic reporting segments: North America, Europe and Rest of World. The graph below shows third party net sales by segment for the years ended December 31, 2017 and 2016 and the net change period over period.
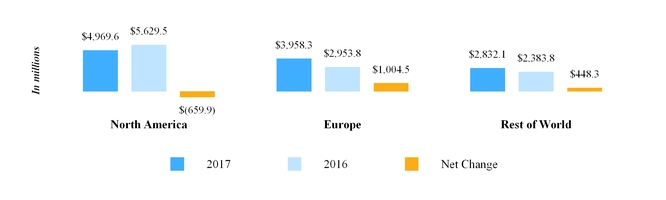
North America Segment
Third party net sales from North America decreased by $659.9 million or 12% during the year ended December 31, 2017 when compared to the prior year. Net sales of existing products decreased principally due to lower pricing and, to a lesser extent, lower volume. This was partially offset by the incremental net sales from the acquisitions of Meda and the Topicals Business , totaling approximately $340.0 million . For the year ended December 31, 2017 , as anticipated, the U.S. generics products experienced price erosion in the high-single-digits, which includes the impact of the loss of exclusivity of armodafinil, olmesartan and olmesartan HCTZ during 2017 . Sales of the EpiPen® Auto-Injector declined approximately $655.4 million from the prior year as a result of the impact of the launch of the authorized generic, higher governmental rebates as a result of the Medicaid Drug Rebate Program Settlement, and increased competition. Excluding the negative impact of the lower sales of the EpiPen® Auto-Injector, overall third-party sales in North America were unchanged in 2017 compared with 2016 . The impact of foreign currency translation on current period third party net sales was insignificant within North America.
59
Table of Contents
Europe Segment
Third party net sales from Europe increased by $1.00 billion or 34% during the year ended December 31, 2017 when compared to the prior year. This increase was primarily the result of incremental net sales from the acquisition of Meda of approximately $833.2 million during the year ended December 31, 2017 . Net sales of existing products increased primarily as a result of sales of new products and favorable pricing and volume. The favorable impact of foreign currency translation on current period third party net sales was $89.7 million , or 3% within Europe. Constant currency third party net sales increased by approximately $914.8 million , or 31% when compared to the prior year.
Rest of World Segment
Third party net sales from Rest of World increased by $448.3 million or 19% during the year ended December 31, 2017 when compared to the prior year. This increase was primarily the result of incremental net sales from the acquisition of Meda totaling approximately $229.2 million . In addition, net sales from existing products increased principally as a result of higher volume, particularly from our ARV franchise, and to a lesser extent Australia and the emerging markets. Throughout the segment, higher volumes and sales of new products more than offset lower pricing. The favorable impact of foreign currency translation was $52.2 million , or 2% . Constant currency third party net sales increased by approximately $396.1 million , or 17% .
Cost of Sales and Gross Profit
Cost of sales increased from $6.38 billion for the year ended December 31, 2016 to $7.12 billion for the year ended December 31, 2017 . Cost of sales was primarily impacted by purchase accounting related amortization of acquired intangible assets, acquisition related costs, restructuring, and other special items, which are described further in the section titled Use of Non-GAAP Financial Measures . Gross profit for the year ended December 31, 2017 was $4.78 billion and gross margins were 40% . For the year ended December 31, 2016 , gross profit was $4.70 billion and gross margins were 42% . Gross margins were negatively impacted in the current period by incremental amortization expense as a result of the acquisitions of Meda and the Topicals Business by approximately 110 basis points, lower gross profit from the sales of existing products in North America, including the EpiPen® Auto-Injector, by approximately 275 basis points, partially offset by the contributions from the acquired businesses. Adjusted gross margins were approximately 54% for the year ended December 31, 2017 , compared to approximately 56% for the year ended December 31, 2016 . Adjusted gross margins were negatively impacted in the current period as a result of lower gross profit from the sales of existing products in North America, including the EpiPen® Auto-Injector, by approximately 200 basis points, partially offset by the contributions from the acquired businesses.
A reconciliation between cost of sales, as reported under U.S. GAAP, and adjusted cost of sales and adjusted gross margin for the year ended December 31, 2017 compared to the year ended December 31, 2016 is as follows:
| Year Ended | ||||||
| December 31, | ||||||
(In millions) | 2017 |
| 2016 | ||||
U.S. GAAP cost of sales | $ | 7,124.6 | |
| $ | 6,379.9 | |
Deduct: |
|
|
| ||||
Purchase accounting amortization and other related items | (1,523.8 | ) |
| (1,389.3 | ) | ||
Acquisition related items | (1.9 | ) |
| (52.7 | ) | ||
Restructuring related costs | (46.0 | ) |
| (28.9 | ) | ||
Other special items | (64.4 | ) |
| (44.6 | ) | ||
Adjusted cost of sales | $ | 5,488.5 | |
| $ | 4,864.4 | |
|
|
|
| ||||
Adjusted gross profit (a) | $ | 6,419.2 | |
| $ | 6,212.5 | |
|
|
|
| ||||
Adjusted gross margin (a) | 54 | % |
| 56 | % | ||
(a) | Adjusted gross profit is calculated as total revenues less adjusted cost of sales. Adjusted gross margin is calculated as adjusted gross profit divided by total revenues. |
60
Table of Contents
Operating Expenses
Research & Development Expense
R&D expense for the year ended December 31, 2017 was $783.3 million , compared to $826.8 million for the prior year, a decrease of $43.5 million . The decrease was due to lower spending when compared to the prior year as a result of the Company's reprioritization of global programs. Partially offsetting this decrease was the impact from incremental R&D expense related to the acquisitions of Meda and the Topicals Business of approximately $45.4 million in the current year as well as an increase in restructuring costs included in R&D from $7.7 million in 2016 to $8.4 million in 2017.
Additionally, during the year ended December 31, 2017 , the Company entered into a joint development and marketing agreement for a respiratory product resulting in approximately $50 million in R&D expense. The Company also incurred R&D expense in 2017 of $31.9 million related to the collaboration agreement with Momenta. In the prior year, the Company made an upfront payment of $45.0 million and incurred additional R&D expense of $29.2 million , both related to the Company's collaboration agreement with Momenta which was entered into on January 8, 2016.
Selling, General & Administrative Expense
Selling, general and administrative expense ("SG&A") for the year ended December 31, 2017 was $2.58 billion , compared to $2.50 billion for the prior year, an increase of $79.7 million . The increase is due primarily to additional incremental expense related to the acquisitions of Meda and the Topicals Business which increased SG&A by approximately $213.1 million . Restructuring charges recorded in SG&A were $133.6 million and $113.1 million , respectively, for the years ended December 31, 2017 and December 31, 2016 . Partially offsetting these increase s were acquisition related costs which were $110.8 million lower than the prior year as well as the year over year benefit of integration activities.
Litigation Settlements and Other Contingencies, Net
During the year ended December 31, 2017 , the Company recorded net gain s of $13.1 million for litigation settlements and other contingencies, net, compared to a net charge of $672.5 million in the prior year.
The following table includes the (gains)/losses recognized in litigation settlements and other contingencies, net during the year ended December 31, 2017 :
(In millions) | Loss/(gain) | ||
Respiratory Delivery Platform contingent consideration adjustment | $ | (93.5 | ) |
Litigation settlements (1) | 51.1 | | |
Topicals Business contingent consideration adjustment | 23.5 | | |
Jai Pharma Limited contingent consideration adjustment | 9.8 | | |
Apicore contingent consideration adjustment | (4.0 | ) | |
Total litigation settlements and other contingencies, net | $ | (13.1 | ) |
(1) | Refer to Note 18 Litigation included in Item 8 in this Annual Report on Form 10-K for additional information related to litigation matters. |
The following table includes the losses/(gains) recognized in litigation settlements and other contingencies, net during the year ended December 31, 2016 :
61
Table of Contents
(In millions) | Loss/(gain) | ||
Medicaid Drug Rebate Program Settlement | $ | 465.0 | |
Modafinil antitrust litigation settlement | 165.0 | | |
Strides Settlement | 90.0 | | |
Respiratory Delivery Platform contingent consideration adjustment | (68.5 | ) | |
Jai Pharma Limited contingent consideration adjustment | 12.6 | | |
Other litigation settlements | 8.4 | | |
Total litigation settlements and other contingencies, net | $ | 672.5 | |
Interest Expense
Interest expense for the year ended December 31, 2017 totaled $534.6 million , compared to $454.8 million for the year ended December 31, 2016 , an increase of $79.8 million . The increase in the current year is primarily due to the incremental impact of the issuance of the senior notes in June 2016 and, the Euro senior notes issued in November 2016 and May 2017. This increase was partially offset by the impact of the repayment of the 1.800% Senior Notes due 2016 and the 1.350% Senior Notes due 2016 in June and November of 2016, respectively, as well as the repayment of the Meda Term Loan and the partial repayment of the Mylan NV Term Loan.
Other (Income) Expense, Net
Other (income) expense, net, was income of $0.5 million for the year ended December 31, 2017 , compared to a net expense of $125.1 million for the prior year. Other (income) expense, net was comprised of the following for the year ended December 31, 2017 and 2016 , respectively:
| Year Ended December 31, | ||||||
(In millions) | 2017 |
| 2016 | ||||
Losses from equity affiliates, primarily clean energy investments | $ | 100.2 | |
| $ | 112.8 | |
Clean energy investment adjustment, net gain | (42.2 | ) |
| - | | ||
Foreign exchange gains, net | (48.1 | ) |
| (0.5 | ) | ||
Interest income | (6.2 | ) |
| (12.3 | ) | ||
Write off of deferred financing fees | 3.2 | |
| 34.8 | | ||
Other gains, net | (7.4 | ) |
| (9.7 | ) | ||
Other (income) expense, net | $ | (0.5 | ) |
| $ | 125.1 | |
During the current year, as a result of a decline in current and expected future production levels at certain of the clean energy facilities the Company impaired its investment balance and other assets by approximately $47 million and reduced the related long-term obligations for these investments by approximately $89 million resulting in a net gain of $42 million which was recognized as a component of the net loss of the equity method investments. In the prior year, other (income) expense, net included a foreign exchange net gain of $0.5 million , which included $128.6 million of losses related to the Company's SEK non-designated foreign currency contracts that were entered into to economically hedge the foreign currency exposure associated with the expected payment of the Swedish krona-denominated cash portion of the purchase price of the offer to the shareholders of Meda to acquire all of the outstanding shares of Meda. This loss was offset by foreign exchange gains of approximately $30.5 million related to the mark-to-market impact for the November 2016 settlement of a portion of outstanding Meda shares and the remaining obligation on non-tendered Meda shares. In addition, the loss was offset by foreign exchange gains related to the mark-to-market on Euro denominated notes of approximately $32.0 million and additional net gains as a result of the Company's foreign currency exchange risk management program.
Income Tax Provision (Benefit)
For the year ended December 31, 2017 , the Company recognized an income tax provision of $207.0 million , compared to an income tax benefit of $358.3 million for the comparable prior year. On December 22, 2017, the Tax Act was signed into law making significant changes to the Code. Changes include, but are not limited to, a U.S. federal corporate income tax rate decrease from 35% to 21% effective for tax years beginning after December 31, 2017, and a one-time transition tax on the mandatory deemed repatriation of cumulative foreign earnings of non-U.S. corporate subsidiaries of large U.S.
62
Table of Contents
shareholders as of December 31, 2017. The Company has calculated its best estimate of the impact of the Tax Act in the 2017 income tax provision in accordance with our understanding of the Tax Act and available guidance and has recorded a provisional net tax charge of $128.6 million related to the Tax Act in the year ended December 31, 2017. In addition, the income tax provision for the year ended December 31, 2017 versus the prior year was impacted by the changing mix of income earned in jurisdictions with differing tax rates, statutory releases of certain tax uncertainties, increases in valuation allowances on certain carryforward tax attributes, the non-recurring nature of tax benefits obtained by the 2016 mergers of certain foreign subsidiaries, and the revaluation of deferred tax assets and liabilities in countries that changed their statutory corporate tax rate.
2016 Compared to 2015
| Year Ended December 31, | ||||||||||||||||||||
(In millions) | 2016 |
| 2015 |
| % Change |
| 2016 Currency Impact (1) |
| 2016 Constant Currency Revenues |
| Constant Currency % Change (2) | ||||||||||
Third party net sales |
|
|
|
|
|
|
|
|
|
|
| ||||||||||
North America (3) | $ | 5,629.5 | |
| $ | 5,100.4 | |
| 10 | % |
| $ | 6.9 | |
| $ | 5,636.4 | |
| 11 | % |
Europe (3)(4) | 2,953.8 | |
| 2,205.6 | |
| 34 | % |
| 30.1 | |
| 2,983.9 | |
| 35 | % | ||||
Rest of World (3) | 2,383.8 | |
| 2,056.6 | |
| 16 | % |
| (21.3 | ) |
| 2,362.5 | |
| 15 | % | ||||
Total third party net sales (3)(4) | 10,967.1 | |
| 9,362.6 | |
| 17 | % |
| 15.7 | |
| 10,982.8 | |
| 17 | % | ||||
|
|
|
|
|
|
|
|
|
|
|
| ||||||||||
Other third party revenues | 109.8 | |
| 66.7 | |
| 65 | % |
| 0.8 | |
| 110.6 | |
| 66 | % | ||||
Consolidated total revenues (4) | $ | 11,076.9 | |
| $ | 9,429.3 | |
| 18 | % |
| $ | 16.5 | |
| $ | 11,093.4 | |
| 18 | % |
(1) | Currency impact is shown as unfavorable (favorable). |
(2) | The constant currency percentage change is derived by translating third party net sales or revenues for the current period at prior year comparative period exchange rates, and in doing so shows the percentage change from 2016 constant currency third party net sales or revenues to the corresponding amount in the prior year. |
(3) | Effective October 1, 2016, the Company expanded its reportable segments as follows: North America, Europe and Rest of World. As a result, the amounts previously reported under the Specialty segment have been recast to North America and amounts related to Brazil are included in Rest of World for all periods presented. |
(4) | For the year ended December 31, 2015 , adjusted third party net sales in Europe totaled $2.22 billion , adjusted third party net sales totaled $9.38 billion , and adjusted total revenues were $9.45 billion . Adjusted third party net sales in Europe, adjusted third party net sales and adjusted total revenues are non-GAAP financial measures. |
Total Revenues
For the year ended December 31, 2016 , Mylan reported total revenues of $11.08 billion compared to $9.43 billion in the prior year. Total revenues include both net sales and other revenues from third parties. Third party net sales for the current year were $10.97 billion compared to $9.36 billion for the prior year, representing an increase of $1.60 billion , or 17% . Other third party revenues for the current year were $109.8 million compared to $66.7 million in the prior year, an increase of $43.1 million . The increase in other third party revenues was principally the result of an increase in royalty income, including due to acquisitions in 2016 .
The increase in total revenues was the result of third party net sales growth in all segments. Contributing to this increase were net sales from the acquisitions of Meda and the Topicals Business, net sales from new product introductions, and to a lesser extent, the two additional months of net sales from the EPD Business (the "incremental EPD Business sales") when compared to the prior year, all of which when combined totaled approximately $1.70 billion . Net sales on existing products decrease d approximately $96.0 million as a result of a decrease in pricing of approximately $195.5 million , offset by an increase in volume of approximately $99.5 million . Mylan's 2016 total revenues were unfavorably impacted by the effect of foreign currency translation, primarily reflecting strengthening in the U.S. Dollar as compared to the currencies of Mylan's subsidiaries in Canada, the European Union, India, the United Kingdom and Brazil, partially offset by the strengthening of the Japanese Yen. The unfavorable impact of foreign currency translation on 2016 total revenues was approximately $16.5 million . As such, constant currency total revenues increased approximately $1.66 billion , or 18% .
63
Table of Contents
In arriving at net sales, gross sales are reduced by provisions for estimates, including discounts, rebates, promotions, price adjustments, returns and chargebacks. See the Application of Critical Accounting Policies section in this Item 7 for a discussion of our methodology with respect to such provisions. For 2016 , the most significant amounts charged against gross sales were $4.33 billion related to chargebacks and $3.93 billion related to incentives offered to our customers, such as volume related incentives and promotions. For 2015 , the most significant amounts charged against gross sales were for chargebacks in the amount of $4.21 billion and incentives offered to our customers in the amount of $3.77 billion .
From time to time, a limited number of our products may represent a significant portion of our net sales, gross profit and net earnings. Generally, this is due to the timing of new product launches and the amount, if any, of additional competition in the market. Our top ten products in terms of net sales, in the aggregate, represented approximately 27% and 28% of the Company's third party net sales in 2016 and 2015 , respectively.
Third party net sales are derived from our three geographic reporting segments: North America, Europe and Rest of World. The graph below shows third party net sales by segment for the years ended December 31, 2016 and 2015 and the increase period over period.
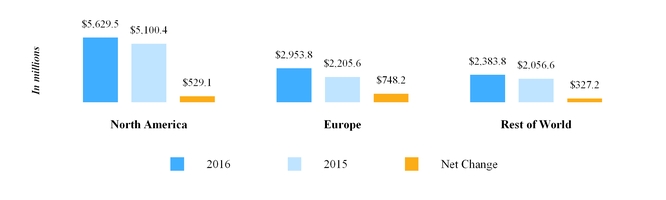
North America Segment
Third party net sales from North America increased $529.1 million , or 10% during the year ended December 31, 2016 when compared to the prior year. The increase was principally due to net sales from the acquisitions of Meda, the Topicals Business and the incremental EPD Business sales, and to a lesser extent, net sales from new product introductions, together totaling approximately $634.4 million . These increase s were partially offset by lower volume and pricing on existing products of approximately $98.7 million . As anticipated, the U.S. generics products experienced price erosion in the mid-single digits. The unfavorable impact of foreign currency translation on 2016 third party net sales was approximately $6.8 million , or less than 1% within North America. As such, constant currency third party net sales increased by approximately $536.0 million , or 11% when compared to 2015 .
Sales of the EpiPen® Auto-Injector are primarily included in the North America segment, and on a worldwide basis totaled approximately $1 billion for the years ended December 31, 2016 and 2015 . On August 29, 2016, the Company announced its intent to launch the first authorized generic to EpiPen® Auto-Injector which was launched on December 16, 2016. The authorized generic has the same drug formulation and device functionality as the branded product. The Company also continues to market and distribute branded EpiPen® Auto-Injector .
Europe Segment
Third party net sales from Europe increased $748.2 million , or 34% during the year ended December 31, 2016 when compared to the prior year. This increase was primarily the result of net sales from the acquisition of Meda and the incremental EPD Business sales, and to a lesser extent, net sales from new product introductions, together totaling approximately $735.8 million . In addition, higher volumes on existing products were partially offset by lower pricing throughout Europe. Lower pricing is a result of government-imposed pricing reductions and competitive market conditions throughout the segment. The unfavorable impact of foreign currency translation on 2016 third party net sales was approximately $30.1 million , or 1% within Europe. As such, constant currency third party net sales increased by approximately $778.3 million , or 35% when compared to 2015 .
The acquisition of Meda significantly increased our operations and revenues throughout Europe, but particularly in France, Italy, Germany and Sweden. Third party net sales from Mylan's business in France increased compared to the prior
64
Table of Contents
year as a result of net sales from the acquisition of Meda, the incremental EPD Business sales, higher volumes on existing products and new product introductions, partially offset by lower pricing. Our market share in France increased in 2016 as compared to 2015 , and we remain the generics market leader. In Italy, net sales increased compared to the prior year as a result of net sales from the acquisition of Meda, the incremental EPD Business sales and new product introductions, partially offset by lower pricing and lower volume. Sales in France and Italy continue to be negatively impacted by government-imposed pricing reductions and an increasingly competitive market.
Certain markets in Europe in which we do business have undergone government-imposed price reductions, and further government-imposed price reductions are expected in the future. Such measures, along with the tender systems discussed below, are likely to have a negative impact on sales and gross profit in these markets. However, government initiatives in certain markets that appear to favor generic products could help to mitigate this unfavorable effect by increasing rates of generic substitution and penetration.
A number of markets in which we operate in Europe have implemented, or may implement, tender systems for generic pharmaceuticals in an effort to lower prices. Generally speaking, tender systems can have an unfavorable impact on sales and profitability. Under such tender systems, manufacturers submit bids that establish prices for generic pharmaceutical products. Upon winning the tender, the winning company will be awarded an exclusive or semi-exclusive contract to supply the market for a period of time. The tender system often results in companies underbidding one another by proposing low pricing in order to win the tender. The loss of a tender by a third party to whom we supply API can also have a negative impact on our sales and profitability. Sales continue to be negatively affected by the impact of tender systems.
Rest of World Segment
In Rest of World, third party net sales increased $327.2 million , or 16% during the year ended December 31, 2016 when compared to the prior year. This increase was primarily driven by the acquisition of Meda, the incremental EPD Business sales, and to a lesser extent, new product introductions, together totaling approximately $328.7 million . In addition, higher sales volumes in Japan, India, Australia and emerging markets positively contributed to the sales growth in this segment. These increases were partially offset by lower pricing throughout the segment, including the ARV franchise. However, sales within our ARV franchise increased progressively throughout 2016 . The favorable impact of foreign currency translation on third party net sales was approximately $21.3 million , or 1% . As such, constant currency third party net sales increased by approximately $305.9 million , or 15% .
In Japan, third party net sales increased as a result of the incremental EPD Business sales, higher volumes on existing products and net sales from new product introductions. In Australia, third party net sales increased as a result of net sales from new product introductions, the incremental EPD Business sales, and to a lesser extent, the acquisition of Meda and higher volumes on existing products. As in Europe, both Australia and Japan have undergone government-imposed price reductions which have had, and could continue to have, a negative impact on sales and gross profit in these markets.
As a result of the acquisition of Meda, we have significantly expanded and strengthened our presence in emerging markets including China, Southeast Asia and the Middle East. These markets provide opportunities for future growth and expansion and are complemented by Mylan's historical presence in India, Brazil and certain countries in Africa (including South Africa).
Cost of Sales and Gross Profit
Cost of sales for the year ended December 31, 2016 was $6.38 billion , compared to $5.21 billion in the prior year, corresponding to the increase in sales. Cost of sales was primarily impacted by purchase accounting related amortization of acquired intangible assets, acquisition related costs and restructuring and other special items, which are described further in the section titled Use of Non-GAAP Financial Measures. In addition to the increase in net sales, the increase in cost of sales was also impacted by acquisition related amortization expense of Meda, the Topicals Business and Jai Pharma Limited as well as an additional two months of amortization expense related to the EPD Business as compared to 2015 .
Gross profit for 2016 was $4.70 billion and gross margins were 42% . For 2015 , gross profit was $4.22 billion and gross margins were 45% . Gross margins were negative ly impacted in 2016 by approximately 315 basis points due to increased amortization of intangible assets, inventory step-up and intangible asset impairment charges, including in-process research and development, (collectively, "purchase accounting amortization and other related items.") This negative impact was partially offset by approximately 110 basis points as a result of the positive impact of net sales from new products. Adjusted gross margins were approximately 56% in both 2016 and 2015 . Adjusted gross margins increased approximately 50 basis points and were positively impacted in 2016 as a result of net sales from new products and the net impact of acquisitions.
65
Table of Contents
A reconciliation between cost of sales, as reported under U.S. GAAP, and adjusted cost of sales and adjusted gross margin for the periods shown follows:
| Year Ended December 31, | ||||||
(In millions) | 2016 |
| 2015 | ||||
U.S. GAAP cost of sales | $ | 6,379.9 | |
| $ | 5,213.2 | |
Deduct: |
|
|
| ||||
Purchase accounting amortization and other related items | (1,389.3 | ) |
| (885.5 | ) | ||
Restructuring related costs | (28.9 | ) |
| (0.2 | ) | ||
Acquisition related and other special items | (97.3 | ) |
| (134.6 | ) | ||
Adjusted cost of sales | $ | 4,864.4 | |
| $ | 4,192.9 | |
|
|
|
| ||||
Adjusted gross profit (a) | $ | 6,212.5 | |
| $ | 5,253.5 | |
|
|
|
| ||||
Adjusted gross margin (a) | 56 | % |
| 56 | % | ||
(a) | Adjusted gross profit is calculated as total revenues (adjusted total revenues for 2015) less adjusted cost of sales. Adjusted gross margin is calculated as adjusted gross profit divided by total revenues (adjusted total revenues for 2015). The reconciliation for 2015 adjusted total revenues can be found under " Use of Non-GAAP Financial Measurements ." |
Operating Expenses
Research & Development Expense
R&D expense in 2016 was $826.8 million , compared to $671.9 million in the prior year, an increase of $154.9 million . R&D expense increased primarily due the Company's collaboration agreement with Momenta. As part of the collaboration agreement, the Company made a $45 million upfront payment and incurred approximately $29.2 million of additional R&D expense during 2016 . The inclusion of Meda increased R&D expense by approximately $26 million . The remainder of the R&D expense increase was due to the continued development of our respiratory, insulin and biologics programs.
Selling, General & Administrative Expense
SG&A for 2016 was $2.50 billion , compared to $2.18 billion for the prior year, an increase of $315.4 million . The primary factors contributing to this increase were the additional expense related to the acquisition of Meda and the additional two months of expense from the EPD Business which together increased SG&A by approximately $295.1 million in 2016 . In addition, we incurred approximately $113.1 million of restructuring charges which were offset by lower acquisition related costs, including consulting and legal costs, which totaled $106.1 million in 2016 , as compared to $209.4 million in the prior year.
66
Table of Contents
Litigation Settlements and Other Contingencies, Net
During 2016 , the Company recorded a net charge of $672.5 million for litigation settlements and other contingencies, net, compared to a net gain of $97.4 million in the prior year. The following table includes the losses/(gains) recognized in litigation settlements and other contingencies, net during the year ended December 31, 2016 :
(In millions) | Loss/(gain) | ||
Medicaid Drug Rebate Program Settlement | $ | 465.0 | |
Modafinil antitrust litigation settlement | 165.0 | | |
Strides Settlement | 90.0 | | |
Respiratory Delivery Platform contingent consideration adjustment | (68.5 | ) | |
Jai Pharma Limited contingent consideration adjustment | 12.6 | | |
Other litigation settlements | 8.4 | | |
Total litigation settlements and other contingencies, net | $ | 672.5 | |
The gain in the prior year was primarily related to the settlement of the Paroxetine CR matter with GlaxoSmithKline for approximately $113.0 million and the settlement of certain antitrust matters. This gain was partially offset by the settlement of patent infringement matters.
Interest Expense
Interest expense for 2016 totaled $454.8 million , compared to $339.4 million for 2015 . The increase in the current year is primarily due to approximately $132.5 million of interest related to the issuance of the June 2016 Senior Notes and approximately $34.0 million of interest related to borrowings acquired from Meda. Partially offsetting these increases was lower amortization of discounts as a result of the repayment of the Company's Cash Convertible Notes in September 2015 and the maturity and repayment of certain debt instruments in 2016 .
Other Expense, Net
Other expense, net was $125.1 million in 2016 , compared to $206.1 million in the prior year. Other expense, net includes losses from equity affiliates, foreign exchange gains and losses and interest and dividend income. Other expense, net was comprised of the following for the years ended December 31, 2016 and 2015 , respectively:
| Year Ended December 31, | ||||||
(In millions) | 2016 |
| 2015 | ||||
Losses from equity affiliates, primarily clean energy investments | $ | 112.8 | |
| $ | 105.0 | |
Write off of deferred financing fees | 34.8 | |
| 54.3 | | ||
Interest income | (12.3 | ) |
| (3.0 | ) | ||
Foreign exchange gains, net | (0.5 | ) |
| (58.0 | ) | ||
Losses from termination of interest rate swaps | - | |
| 71.2 | | ||
Redemption premium on July 2020 Senior Notes | - | |
| 39.4 | | ||
Write off of unamortized premium on July 2020 Senior Notes | - | |
| (9.7 | ) | ||
Other (gains) losses, net | (9.7 | ) |
| 6.9 | | ||
Other expense, net | $ | 125.1 | |
| $ | 206.1 | |
In 2016 , foreign exchange gains, net of approximately $0.5 million included approximately $128.6 million of losses related to the Company's SEK non-designated foreign currency contracts that were entered into to economically hedge the foreign currency exposure associated with the expected payment of the Swedish krona-denominated cash portion of the purchase price of the Offer. This loss was offset by foreign exchange gains of approximately $30.5 million related to the mark-to-market impact for the settlement of the offer to the remaining Meda shareholders to tender all their Meda shares for cash consideration of 161.31kr per Meda share and the remaining obligation on non-tendered Meda shares, foreign exchange gains related to the mark-to-market on the Euro Notes of approximately $32.0 million and additional net gains as a result of the Company's foreign currency exchange risk management program.
67
Table of Contents
Income Tax (Benefit) Provision
For the year ended December 31, 2016 , the Company recognized an income tax benefit of $358.3 million , compared to an income tax provision of $67.7 million in 2015 . During the year ended December 31, 2016 , the Company legally merged its wholly owned subsidiary, Jai Pharma Limited, into Mylan Laboratories Limited, resulting in the recognition of a deferred tax asset of $150 million for the tax deductible goodwill in excess of the book goodwill with a corresponding benefit to income tax provision for the year ended December 31, 2016 . In addition, the effective tax rate for 2016 was also impacted by lower income in the U.S., primarily as a result of litigation charges.
Use of Non-GAAP Financial Measures
Whenever the Company uses non-GAAP financial measures, we provide a reconciliation of the non-GAAP financial measures to their most directly comparable U.S. GAAP financial measure. Investors and other readers are encouraged to review the related U.S. GAAP financial measures and the reconciliation of non-GAAP measures to their most directly comparable U.S. GAAP measure and should consider non-GAAP measures only as a supplement to, not as a substitute for or as a superior measure to, measures of financial performance prepared in accordance with U.S. GAAP. Additionally, since these are not measures determined in accordance with U.S. GAAP, non-GAAP financial measures have no standardized meaning across companies, or as prescribed by U.S. GAAP and, therefore, may not be comparable to the calculation of similar measures or measures with the same title used by other companies.
Management uses these measures internally for forecasting, budgeting, measuring its operating performance, and incentive-based awards. In addition, primarily due to acquisitions, we believe that an evaluation of our ongoing operations (and comparisons of our current operations with historical and future operations) would be difficult if the disclosure of our financial results was limited to financial measures prepared only in accordance with U.S. GAAP. We believe that non-GAAP financial measures are useful supplemental information for our investors and when considered together with our U.S. GAAP financial measures and the reconciliation to the most directly comparable U.S. GAAP financial measure, provide a more complete understanding of the factors and trends affecting our operations. The financial performance of the Company is measured by senior management, in part, using adjusted metrics as described below, along with other performance metrics. Management's annual incentive compensation is derived, in part, based on the adjusted EPS (as defined below) metric.
Adjusted Third Party Net Sales from Europe, Adjusted Third Party Net Sales and Adjusted Total Revenues
The Company is providing the following supplementary non-GAAP financial measures: adjusted third party net sales from Europe, adjusted third party net sales and adjusted total revenues, each of which excludes an acquisition related customer incentive in Europe from the most directly comparable U.S. GAAP financial measure. Management believes that these non-GAAP financial measures are useful to investors to evaluate the ongoing performance of the business as well as to provide a more complete understanding of the financial results and trends impacting the Company. Management also uses these non-GAAP measures to evaluate the ongoing performance of the business.
| Year Ended December 31, | ||||||||||
(In millions) | 2017 |
| 2016 |
| 2015 | ||||||
U.S. GAAP third party net sales from Europe | $ | 3,958.3 | |
| $ | 2,953.8 | |
| $ | 2,205.6 | |
Add: |
|
|
|
|
| ||||||
Acquisition related customer incentive | - | |
| - | |
| 17.1 | | |||
Adjusted third party net sales from Europe | $ | 3,958.3 | |
| $ | 2,953.8 | |
| $ | 2,222.7 | |
U.S. GAAP third party net sales | $ | 11,760.0 | |
| $ | 10,967.1 | |
| $ | 9,362.6 | |
Add: |
|
|
|
|
| ||||||
Acquisition related customer incentive | - | |
| - | |
| 17.1 | | |||
Adjusted third party net sales | $ | 11,760.0 | |
| $ | 10,967.1 | |
| $ | 9,379.7 | |
U.S. GAAP total revenues | $ | 11,907.7 | |
| $ | 11,076.9 | |
| $ | 9,429.3 | |
Add: |
|
|
|
|
| ||||||
Acquisition related customer incentive | - | |
| - | |
| 17.1 | | |||
Adjusted total revenues | $ | 11,907.7 | |
| $ | 11,076.9 | |
| $ | 9,446.4 | |
68
Table of Contents
Adjusted Cost of Sales and Adjusted Gross Margin
We use the non-GAAP financial measure "adjusted cost of sales" and the corresponding non-GAAP financial measure "adjusted gross margin." The principal items excluded from adjusted cost of sales include restructuring, acquisition related and other special items and purchase accounting amortization and other related items, which are described in greater detail below.
Adjusted Earnings and Adjusted EPS
Adjusted net earnings ("adjusted earnings") is a non-GAAP financial measure and provides an alternative view of performance used by management. Management believes that, primarily due to acquisition activity, an evaluation of the Company's ongoing operations (and comparisons of its current operations with historical and future operations) would be difficult if the disclosure of its financial results were limited to financial measures prepared only in accordance with U.S. GAAP. Management believes that adjusted earnings and adjusted earnings per diluted share ("adjusted EPS") are two of the most important internal financial metrics related to the ongoing operating performance of the Company, and are therefore useful to investors and that their understanding of our performance is enhanced by these adjusted measures. Actual internal and forecasted operating results and annual budgets used by management include adjusted earnings and adjusted EPS.
The significant items excluded from adjusted cost of sales, adjusted earnings and adjusted EPS include:
Purchase Accounting Amortization and Other Related Items
The ongoing impact of certain amounts recorded in connection with acquisitions of both businesses and assets is excluded from adjusted cost of sales, adjusted earnings and adjusted EPS. These amounts include the amortization of intangible assets, inventory step-up and intangible asset impairment charges, including in-process research and development. For the acquisition of businesses accounted for under the provisions of the Financial Accounting Standards Board Accounting Standards Codification ("ASC") 805, these purchase accounting impacts are excluded regardless of the financing method used for the acquisitions, including the use of cash, long-term debt, the issuance of ordinary shares, contingent consideration or any combination thereof.
Upfront and Milestone-Related R&D Expenses
These expenses and payments are excluded from adjusted earnings and adjusted EPS because they generally occur at irregular intervals and are not indicative of the Company's ongoing operations. Also included in this adjustment are certain expenses related to the Company's collaboration agreement with Momenta including certain milestone related costs. Such costs include payments related to Mylan's future decisions, on a product by product basis, to continue with the development of such product in the collaboration after certain R&D work is performed. Related amounts are excluded from adjusted earnings as Mylan considers such payments as additional upfront buy-in payments for the products.
Accretion of Contingent Consideration Liability and Other Fair Value Adjustments
The impact of changes to the fair value of contingent consideration and accretion expense are excluded from adjusted earnings and adjusted EPS because they are not indicative of the Company's ongoing operations due to the variability of the amounts and the lack of predictability as to the occurrence and/or timing and management believes their exclusion is helpful to understanding the underlying, ongoing operational performance of the business.
Restructuring, Acquisition Related and Other Special Items
Costs related to restructuring, acquisition and integration activities and other actions are excluded from adjusted cost of sales, adjusted earnings and adjusted EPS, as applicable. These amounts include items such as:
• | Costs related to formal restructuring programs and actions, including costs associated with facilities to be closed or divested, employee separation costs, impairment charges, accelerated depreciation, incremental manufacturing variances, equipment relocation costs and other restructuring related costs; |
• | Certain acquisition related remediation and integration and planning costs, as well as other costs associated with acquisitions such as advisory and legal fees and certain financing related costs, and other business transformation and/or optimization initiatives, which are not part of a formal restructuring program, including employee separation and post-employment costs; |
69
Table of Contents
• | The pre-tax loss of the Company's clean energy investments , whose activities qualify for income tax credits under the Code; only included in adjusted earnings and adjusted EPS is the net tax effect of the entity's activities; and |
• | Certain costs to further develop and optimize our global ERP systems, operations and supply chain. |
The Company has undertaken restructurings and other optimization initiatives of differing types, scope and amount during the covered periods and, therefore, these charges should not be considered non-recurring; however, management excludes these amounts from adjusted earnings and adjusted EPS because it believes it is helpful to understanding the underlying, ongoing operational performance of the business.
Litigation Settlements, Net
Charges and gains related to legal matters, such as those discussed in the Notes to Consolidated Financial Statements - Note 18 Litigation are generally excluded from adjusted earnings and adjusted EPS. Normal, ongoing defense costs of the Company made in the normal course of our business are not excluded.
Reconciliation of Adjusted Earnings and Adjusted EPS
A reconciliation between net earnings and diluted earnings per share, as reported under U.S. GAAP, and adjusted earnings and adjusted EPS for the periods shown follows:
| Year Ended December 31, | ||||||||||||||||||||||
(In millions, except per share amounts) | 2017 |
| 2016 |
| 2015 | ||||||||||||||||||
U.S. GAAP net earnings and U.S. GAAP diluted earnings per share | $ | 696.0 | |
| $ | 1.30 | |
| $ | 480.0 | |
| $ | 0.92 | |
| $ | 847.6 | |
| $ | 1.70 | |
Purchase accounting related amortization (primarily included in cost of sales) (a) | 1,529.7 | |
|
|
| 1,412.3 | |
|
|
| 900.9 | |
|
| |||||||||
Litigation settlements and other contingencies, net (b) | (13.1 | ) |
|
|
| 672.5 | |
|
|
| (97.4 | ) |
|
| |||||||||
Interest expense (primarily related to clean energy investment financing) | 19.5 | |
|
|
| 22.9 | |
|
|
| 44.0 | |
|
| |||||||||
Interest expense related to the accretion of contingent consideration liabilities | 27.6 | |
|
|
| 42.8 | |
|
|
| 40.0 | |
|
| |||||||||
Clean energy investments pre-tax loss (c) | 47.1 | |
|
|
| 92.3 | |
|
|
| 93.2 | |
|
| |||||||||
Financing related costs (included in other expense, net) | - | |
|
|
| - | |
|
|
| 112.0 | |
|
| |||||||||
Acquisition related costs (primarily included in SG&A and cost of sales) (d) | 70.1 | |
|
|
| 335.3 | |
|
|
| 419.8 | |
|
| |||||||||
Acquisition related customer incentive (included in third party net sales) | - | |
|
|
| - | |
|
|
| 17.1 | |
|
| |||||||||
Restructuring related costs (e) | 188.0 | |
|
|
| 149.7 | |
|
|
| 18.7 | |
|
| |||||||||
Other special items included in: |
|
|
|
|
|
|
|
|
|
|
| ||||||||||||
Cost of sales | 64.4 | |
|
|
| 44.6 | |
|
|
| 36.3 | |
|
| |||||||||
Research and development expense (f) | 117.7 | |
|
|
| 121.3 | |
|
|
| 20.3 | |
|
| |||||||||
Selling, general and administrative expense | 13.7 | |
|
|
| 35.5 | |
|
|
| 47.8 | |
|
| |||||||||
Other expense, net | 13.8 | |
|
|
| (18.4 | ) |
|
|
| 7.2 | |
|
| |||||||||
Tax effect of the above items and other income tax related items | (329.7 | ) |
|
|
| (843.5 | ) |
|
|
| (370.1 | ) |
|
| |||||||||
Adjusted earnings and adjusted EPS | $ | 2,444.8 | |
| $ | 4.56 | |
| $ | 2,547.3 | |
| $ | 4.89 | |
| $ | 2,137.4 | |
| $ | 4.30 | |
Weighted average diluted ordinary shares outstanding | 536.7 | |
|
|
| 520.5 | |
|
|
| 497.4 | |
|
| |||||||||
Significant items for the year ended December 31, 2017 include the following:
(a ) | The increase in purchase accounting related amortization is due to the incremental amortization expense associated with the intangible assets related to the Topicals Business and Meda acquisitions. |
(b) | The net gain is the result of a net gain of $64.2 million for contingent consideration adjustments offset by a charge of $51.1 million related to litigation matters. |
70
Table of Contents
(c) | The year ended December 31, 2017 includes a net gain of $42.2 million for the reduction of long-term obligations as a result of a decline in production levels at certain of the related clean energy facilities. |
(d) | Acquisition related costs incurred in 2016 primarily relate to the acquisition of the Topicals Business (June 2016) and costs related to the Meda acquisition (August 2016). These costs primarily related to consulting, professional, and legal costs. Acquisition related costs incurred in 2017 consist primarily of integration activities. |
(e) | For the year ended December 31, 2017 , approximately $46.0 million is included in cost of sales, $8.4 million is included in R&D and $133.6 million is included in SG&A. Refer to Note 16 Restructuring included in Item 8 in this Annual Report on Form 10-K for additional information. |
(f) | R&D expense for the year ended December 31, 2017 includes $31.9 million related to Momenta collaboration expense. The remaining activity for the year relates to upfront expense of $50.2 million related to a joint development and marketing agreement for a respiratory product and also related to several smaller collaboration agreements. |
Liquidity and Capital Resources
Our primary source of liquidity is cash provided by operations, which was $2.06 billion for the year ended December 31, 2017 . We believe that cash provided by operating activities and available liquidity will continue to allow us to meet our needs for working capital, capital expenditures and interest and principal payments on debt obligations. Nevertheless, our ability to satisfy our working capital requirements and debt service obligations, or fund planned capital expenditures, will substantially depend upon our future operating performance (which will be affected by prevailing economic conditions), and financial, business and other factors, some of which are beyond our control.
Operating Activities
Net cash provided by operating activities increased by $17.6 million to $2.06 billion for the year ended December 31, 2017 , as compared to net cash provided by operating activities of $2.05 billion for the year ended December 31, 2016 . Cash provided by operating activities is derived from net earnings adjusted for non-cash operating items, gains and losses attributed to investing and financing activities and changes in operating assets and liabilities resulting from timing differences between the receipts and payments of cash, including changes in cash primarily reflecting the timing of cash collections from customers, payments to vendors and employees and tax payments in the ordinary course of business.
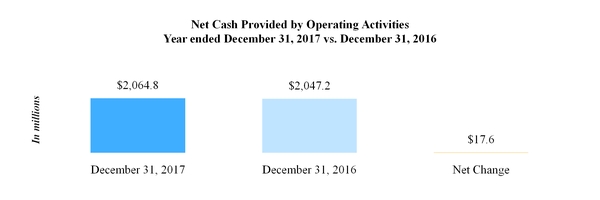
The net increase in cash provided by operating activities was principally due to the following:
• | net earnings for the year ended December 31, 2017 increased $216.0 million when compared to the prior year period, principally as a result of an increase in earnings from operations. Other significant factors impacting cash provided by operating activities in the current year include the following: |
◦ | a net decrease of $149.8 million in the amount of cash used through changes in inventory balances; and |
◦ | a net decrease in the amount of cash used through changes in other assets and liabilities of $103.3 million reflecting the timing of cash payments, which includes current year litigation payments of $532.5 million . |
These items were partially offset by the following:
• | a net decrease in non-cash expenses of $325.5 million , which was partially due to the following: |
◦ | decreased litigation settlements and other contingencies, net, of $637.8 million related to the accrual for Medicaid Drug Rebate Program Settlement, the Modafinil antitrust litigation |
71
Table of Contents
settlement and the Strides Settlement recorded in the prior year period and the impact of payments in 2017;
◦ | a decrease of $128.6 million related to the unrealized losses on acquisition-related foreign currency derivatives recognized in the prior year period; |
◦ | a decrease in loss from equity method investments of $54.8 million ; |
◦ | a decrease of $32.6 million resulting from the write off of deferred financing fees recognized in the prior year; |
◦ | increased depreciation and amortization as a result of acquisitions of approximately $282.8 million , including a decrease resulting from the amortization of the step-up in the fair value of inventory related to the Meda acquisition recognized in other non-cash items in the prior year of $107 million ; and |
◦ | a decrease in the deferred tax benefit of $498.1 million . |
• | a net increase in the amount of cash used through changes in accounts receivable, including estimated sales allowances, of $30.4 million , reflecting the timing of sales, cash collections and customer credits issued related to sales allowances; |
• | a net decrease in the amount of cash provided by changes in trade accounts payable of $73.3 million as a result of the timing of cash payments; and |
• | a decrease in the amount of cash provided by changes in income taxes of $22.3 million as a result of the level and timing of estimated tax payments made during the current period. |
Investing Activities
Cash used in investing activities was $905 million for the year ended December 31, 2017 , as compared to cash used in investing activities of $7.62 billion for the year ended December 31, 2016 , a decrease of $6.72 billion .
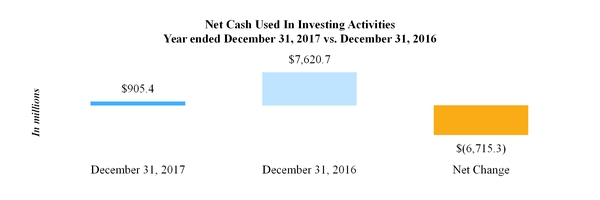
In 2017 , significant items in investing activities included the following:
• | cash paid for acquisitions, net totaling approximately $167.0 million related to the acquisition of Apicore Inc. and the acquisition of the remaining non-tendered shares of Meda in the compulsory acquisition proceeding; |
• | payments for product rights and other, net totaling approximately $620.3 million , which included a payment of $50.0 million related to the acquisition of intellectual property rights for the Cold-EEZE® brand cold remedy line, payments of $291.8 million related to acquisitions of additional intellectual property rights and marketing authorizations and a payment of $256.7 million related to the acquisition of a portfolio of generic product rights in the U.S. ; |
• | proceeds from the sale of certain assets and subsidiaries and assets during the year totaling approximately $86.7 million ; |
• | restricted cash decrease of $71.0 million in the current year due to amounts released from escrow for the payment of contingent consideration related to the acquisition of the Topicals Business and the payment of certain claims related to the Agila contingent consideration; and |
72
Table of Contents
• | capital expenditures, primarily for equipment and facilities, totaling approximately $275.9 million . While there can be no assurance that current expectations will be realized, capital expenditures for the 2018 calendar year are expected to be approximately $300 million to $500 million . |
In 2016 , significant items in investing activities included the following:
• | cash paid for acquisitions totaling approximately $6.48 billion related to the Company's acquisitions of Meda and the Topicals Business; |
• | capital expenditures, primarily for equipment and facilities, totaling approximately $390.4 million ; |
• | payments for product rights and other, net totaling approximately $360.2 million which included payments of $57.9 million to acquire a marketed pharmaceutical product and $165 million related to the acquisition of certain European intellectual property rights and marketing authorizations; |
• | a deferred purchase price payment of $308.0 million relating to Meda's acquisition of Rottapharm S.p.A paid in the third quarter of 2016, which was assumed as part of the acquisition of Meda; and |
• | a $128.6 million settlement of the Company's non-designated foreign exchange forward and options contracts used to economically hedge the foreign currency exposure associated with the payment of the Swedish krona-denominated cash portion of the purchase price of Meda. |
Financing Activities
Cash used in financing activities was $1.89 billion for the year ended December 31, 2017 , as compared to cash provided by financing activities of $5.34 billion for the year ended December 31, 2016 , a net change of $7.24 billion .
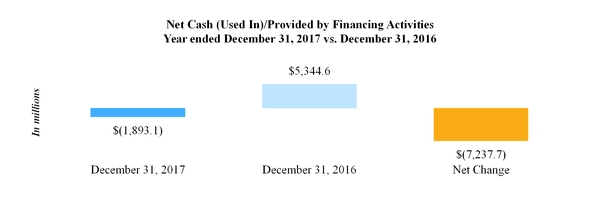
In 2017 , significant items in financing activities included the following:
• | proceeds of approximately $554.5 million related to the issuance of the €500 million Floating Rate Senior Notes due 2020 (the "2020 Floating Rate Euro Notes"), $320.0 million related to borrowings under the 2016 Revolving Facility and $45.0 million borrowed under the Receivables Facility (both as defined in Note 8 Debt in Item 8 in this Annual Report on Form 10-K); |
• | long-term debt repayments consisting of a voluntarily prepayment of $1.50 billion of the 2016 Term Loans, the repayment of the Meda related debt during the year totaling approximately $408.0 million and repayments of $320.0 million of the borrowings under the 2016 Revolving Facility; and |
• | the Company repurchased 12.4 million ordinary shares at a cost of approximately $500.2 million . In January 2018, the Company repurchased an additional 9.8 million ordinary shares at a cost of approximately $432.0 million and on January 9, 2018, the $1 billion Share Repurchase Program was completed. The Company did not repurchase any ordinary shares in 2016 . |
In 2016 , significant items in financing activities included the following:
• | proceeds from long-term debt which totaled approximately $11.75 billion and included the following: |
◦ | the Company borrowed $2.0 billion in term loans denominated in U.S. Dollars (the "2016 Term Loans"); |
◦ | the Company received proceeds of approximately $3.27 billion related to its offering of €500 million aggregate principal amount of the Floating Rate Euro Notes, €750 million aggregate principal amount of the |
73
Table of Contents
2020 Euro Notes, €1.0 billion aggregate principal amount of the 2024 Euro Notes and €750 million aggregate principal amount of the 2028 Euro Notes; and
◦ | the Company received proceeds of approximately $6.48 billion related to the issuance of $1.00 billion aggregate principal amount of 2.500% Senior Notes due 2019, $2.25 billion aggregate principal amount of 3.150% Senior Notes due 2021, $2.25 billion aggregate principal amount of 3.950% Senior Notes due 2026 and $1.00 billion aggregate principal amount of 5.250% Senior Notes due 2046 (collectively, the "June 2016 Senior Notes"). |
• | payments of long-term debt, which totaled $6.30 billion and included the following: |
◦ | the Company repaid the $1.6 billion aggregate principal amount outstanding under the Company's 2015 Term Credit Agreement and the $800 million aggregate principal amount outstanding under the 2014 Term Credit Agreement in conjunction with the effectiveness of the 2016 Senior Term Credit Agreement; |
◦ | the Company voluntarily prepaid $400 million of the aggregate principal amount of the 2016 Term Loans; |
◦ | the Company paid the aggregate principal amount of $500.0 million on the 1.350% Senior Notes due 2016, which matured on November 29, 2016, and the aggregate principal amount of $500 million on the 1.800% Senior Notes due 2016 which matured on June 24, 2016; and |
◦ | the Company repaid approximately $1.8 billion of borrowings under Meda's 25kr billion facility and approximately $567 million of Meda's bank loans. |
• | payments of financing fees which totaled $112.6 million primarily related to a bridge credit agreement related to the Meda acquisition. |
Capital Resources
Our cash and cash equivalents totaled $292.1 million at December 31, 2017 , and the majority of these funds are held by our non-U.S. subsidiaries. The Company anticipates having sufficient liquidity, including existing borrowing capacity under the 2016 Revolving Facility, including the commercial paper program ("CP Program"), and the Receivables Facility combined with cash to be generated from operations, to fund foreseeable cash needs without requiring the repatriation of non-U.S. cash.
On December 22, 2017, the U.S. government enacted the Tax Act which makes broad and complex changes to the Code including, but not limited to, reducing the U.S. federal corporate income tax rate and requiring a one-time transition tax on certain unrepatriated earnings of non-U.S. corporate subsidiaries of large U.S. shareholders that may electively be paid over eight years. We are able to make a reasonable estimate of the transition tax and recorded a provisional transition tax obligation of $113.6 million, which the Company expects to elect to pay, net of certain tax attributes and credit carryforwards, over eight years beginning in 2018.
As of December 31, 2017 , our practice and intention was to reinvest the earnings in our non-U.S. subsidiaries outside of the U.S., and no U.S. deferred income taxes or foreign withholding taxes were recorded. The transition tax noted above will result in the previously untaxed foreign earnings being included in the federal and state 2017 taxable income. We are currently analyzing our global working capital requirements and the potential tax liabilities that would be incurred if the non-U.S. subsidiaries repatriate cash, which include local country withholding tax and potential U.S. state taxation. For these reasons, we are not yet able to reasonably estimate the effect of this provision of the Tax Act and have not recorded any withholding or state tax liabilities.
The Company has access to $2.0 billion under the 2016 Revolving Facility. As of December 31, 2017 , the Company had no amounts outstanding under the 2016 Revolving Facility. Up to $1.65 billion of the 2016 Revolving Facility may be used to support future borrowings under our CP Program.
In addition to the 2016 Revolving Facility, Mylan Pharmaceuticals Inc. ("MPI"), a wholly owned subsidiary of the Company, has a $400 million receivables facility (the "Receivables Facility"), which will expire in January 2019. From time-to-time, the available amount of the Receivables Facility may be less than $400 million based on accounts receivable concentration limits and other eligibility requirements. Under the terms of the Receivables Facility, MPI sells certain accounts receivable to Mylan Securitization LLC, a wholly owned special purpose entity which in turn sells a percentage of ownership interest in the receivables to financial institutions and commercial paper conduits sponsored by financial institutions. As of December 31, 2017 , the Company had $45.0 million of short-term borrowings under the Receivables Facility and included in short-term borrowing in the Consolidated Balance Sheets.
74
Table of Contents
At December 31, 2017 , our long-term debt, including the current portion, totaled $14.6 billion , as compared to $15.4 billion at December 31, 2016 . The decrease in long-term debt was due to the prepayment of a portion of the 2016 Term Loans and the repayment of the bank loans and medium term notes acquired as part of the acquisition of Meda during the year ended December 31, 2017 offset by the issuance of the 2020 Floating Rate Euro Notes. The total long-term debt balance at December 31, 2017 was comprised primarily of $100 million of term loans, $12.23 billion of fixed rate senior notes and $600.2 million of floating rate senior notes. In addition, at December 31, 2017 , we had $1.75 billion of long-term debt classified as current and payable within the next twelve months, as compared to $223.3 million at December 31, 2016 . The increase to the current portion of long-term debt is due to the reclassification of the 2.600% Senior Notes due 2018 which mature in June 2018, the 2018 Floating Rate Euro Notes which mature in November 2018 and the 3.000% Senior Notes due 2018 which mature in December 2018. The Company intends to utilize available liquidity to fund these repayments.
Subsequent to December 31, 2017 , the Company has issued approximately $200 million under the CP Program and borrowed approximately an additional $355 million under the Receivables Facility. Such amounts were used to pay certain amounts related to deferred acquisition related payments and ordinary share repurchases.
For additional information regarding our debt agreements, refer to Note 8 Debt in Item 8 in this Annual Report on Form 10-K.
Long-term Debt Maturity
Mandatory minimum repayments remaining on the outstanding long-term debt at December 31, 2017 , excluding the discounts and premiums, are as follows for each of the periods ending December 31:
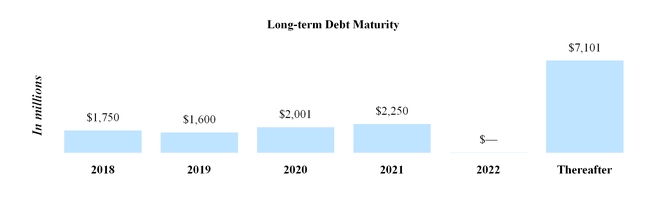
The Company's 2016 Term Loans and 2016 Revolving Facility contain a maximum consolidated leverage ratio financial ratio of 3.75 to 1.00 for consolidated total indebtedness as of the end of any quarter to consolidated EBITDA for the trailing four quarters as defined in the related credit agreements ("leverage ratio"). The 2016 Term Loans and 2016 Revolving Facility also contain customary affirmative covenants for facilities of this type, including among others, covenants pertaining to the delivery of financial statements, notices of default and certain material events, maintenance of corporate existence and rights, property, and insurance and compliance with laws, as well as customary negative covenants for facilities of this type, including limitations on the incurrence of subsidiary indebtedness, liens, mergers and certain other fundamental changes, investments and loans, acquisitions, transactions with affiliates, payments of dividends and other restricted payments and changes in our lines of business.
On November 3, 2017 , the Company entered into amendments to the 2016 Term Facility and 2016 Revolving Facility to modify the leverage ratio covenant. Following such amendments, the 2016 Term Facility and 2016 Revolving Facility contain maximum consolidated leverage ratio financial covenants requiring maintenance of a maximum ratio of 4.25 to 1.00 through December 31, 2018. The Company is in compliance with the leverage ratio covenant at December 31, 2017 and expects to remain in compliance for the next twelve months.
75
Table of Contents
Other Commitments
The Company is involved in various disputes, governmental and/or regulatory inquiries, investigations and proceedings, tax proceedings and litigation matters, both in the U.S. and abroad, that arise from time to time, some of which could result in losses, including damages, fines and/or civil penalties, and/or criminal charges against the Company. These matters are often complex and have outcomes that are difficult to predict. The Company is also party to certain proceedings and litigation matters for which it may be entitled to indemnification under the respective sale and purchase agreements relating to the acquisitions of the former Merck Generics business, Agila, the EPD Business, and certain other acquisitions. We have approximately $181 million accrued for legal contingencies at December 31, 2017 .
While the Company believes that it has meritorious defenses with respect to the claims asserted against it and intends to vigorously defend its position, the process of resolving these matters is inherently uncertain and may develop over a long period of time, and so it is not possible to predict the ultimate resolution of any such matter. It is possible that an unfavorable resolution of any of the ongoing matters or the inability or denial of Merck KGaA, Strides Arcolab, Abbott Laboratories, or another indemnitor or insurer to pay an indemnified claim, could have a material adverse effect on the Company's business, financial condition, results of operations, cash flows and/or ordinary share price.
We are continuously evaluating the potential acquisition of products, as well as companies, as a strategic part of our future growth. Consequently, we may utilize current cash reserves or incur additional indebtedness to finance any such acquisitions, which could impact future liquidity. In addition, on an ongoing basis, we review our operations including the evaluation of potential divestitures of products and businesses as part of our future strategy. Any divestitures could impact future liquidity.
Contractual Obligations
The following table summarizes our contractual obligations at December 31, 2017 and the effect that such obligations are expected to have on our liquidity and cash flows in future periods:
(In millions) | Total |
| Less than |
| One- Three |
| Three- Five |
| Thereafter | ||||||||||
Long-term debt | $ | 14,702.0 | |
| $ | 1,750.0 | |
| $ | 3,601.0 | |
| $ | 2,250.0 | |
| $ | 7,101.0 | |
Scheduled interest payments (1) | 4,151.4 | |
| 440.8 | |
| 768.3 | |
| 574.9 | |
| 2,367.4 | | |||||
Operating leases (2) | 281.7 | |
| 76.1 | |
| 106.5 | |
| 47.9 | |
| 51.2 | | |||||
Other Commitments (3) | 2,166.4 | |
| 1,155.7 | |
| 633.9 | |
| 168.1 | |
| 208.7 | | |||||
| $ | 21,301.5 | |
| $ | 3,422.6 | |
| $ | 5,109.7 | |
| $ | 3,040.9 | |
| $ | 9,728.3 | |
____________
(1) | Scheduled interest payments represent the estimated interest payments related to our outstanding borrowings under term loans, senior notes and other long-term debt. Variable debt interest payments are estimated using current interest rates. |
(2) | We lease certain properties under various operating lease arrangements that expire generally over the next five to seven years. These leases generally provide us with the option to renew the lease at the end of the lease term. |
(3) | Other commitments include funding commitments related to the Company's clean energy investments , agreements to purchase third-party manufactured products, open purchase orders, estimated post-employment payments and capital leases at December 31, 2017 . |
Due to the uncertainty with respect to the timing of future payments, if any, the following contingent payments have not been included in the table above.
We are contractually obligated to make potential future development, regulatory and commercial milestone, royalty and/or profit sharing payments in conjunction with acquisitions we have entered into with third parties. The most significant of these relates to the potential future consideration related to the respiratory delivery platform. These payments are contingent upon the occurrence of certain future events and, given the nature of these events, it is unclear when, if ever, we may be required to pay such amounts. The amount of the contingent consideration liabilities was $453.7 million at December 31, 2017 . In addition, the Company expects to incur approximately $20 million to $25 million of non-cash accretion expense related to the increase in the net present value of the contingent consideration liabilities in 2018 .
76
Table of Contents
With respect to the timing of future cash flows associated with our unrecognized tax benefits at December 31, 2017 , we are unable to make reasonably reliable estimates of the period of cash settlement with the respective taxing authority. As such, $185.7 million of unrecognized tax benefits have been excluded from the contractual obligations table above.
We have entered into employment and other agreements with certain executives and other employees that provide for compensation and certain other benefits. These agreements provide for severance payments under certain circumstances. Certain commercial agreements require us to provide performance bonds and/or indemnification; while it is difficult to forecast the amount of payments, if any, to be made over the next few years, we do not believe the amount would be material to our results of operations, cash flows or financial condition.
Collaboration and Licensing Agreements
We periodically enter into collaboration and licensing agreements with other pharmaceutical companies for the development, manufacture, marketing and/or sale of pharmaceutical products. Our significant collaboration agreements are focused on the development, manufacturing, supply and commercialization of multiple, high-value biosimilar compounds, insulin analog products and respiratory products. Under these agreements, we have future potential milestone payments and co-development expenses payable to third parties as part of our licensing, development and co-development programs. Payments under these agreements generally become due and are payable upon the satisfaction or achievement of certain developmental, regulatory or commercial milestones or as development expenses are incurred on defined projects. Milestone payment obligations are uncertain, including the prediction of timing and the occurrence of events triggering a future obligation and are not reflected as liabilities in the Consolidated Balance Sheets, except for milestone and royalty obligations reflected as acquisition related contingent consideration. Refer to Note 7 Financial Instruments and Risk Management in Item 8 in this Annual Report on Form 10-K for further discussion of contingent consideration. Our potential maximum development milestones not accrued for at December 31, 2017 totaled approximately $545 million . We estimate that the amounts that may be paid in the next twelve months to be approximately $94 million . These agreements may also include potential sales-based milestones and call for us to pay a percentage of amounts earned from the sale of the product as a royalty or a profit share. The amounts disclosed do not include sales based milestones or royalty obligations on future sales of product as the timing and amount of future sales levels and costs to produce products subject to these obligations is not reasonably estimable. These sales-based milestones or royalty obligations may be significant depending upon the level of commercial sales for each product.
The Company's significant collaboration and licensing agreements include agreements with Pfizer, Momenta, Theravance Biopharma Inc., and Biocon. Refer to Note 17 Collaboration and Licensing Agreements included in Item 8 in this Annual Report on Form 10-K for additional information related to our collaborations.
Impact of Currency Fluctuations and Inflation
Because our results are reported in U.S. Dollars, changes in the rate of exchange between the U.S. Dollar and the local currencies in the markets in which we operate, mainly the Euro, Swedish Krona, Indian Rupee, Japanese Yen, Australian Dollar, Canadian Dollar, Pound Sterling and Brazilian Real affect our results as previously noted. We do not believe that inflation has had a material impact on our revenues or operations in any of the past three years.
Application of Critical Accounting Policies
Our significant accounting policies are described in Note 2 Summary of Significant Accounting Policies in Item 8 in this Annual Report on Form 10-K and are in accordance with U.S. GAAP.
Included within these policies are certain policies which contain critical accounting estimates and, therefore, have been deemed to be "critical accounting policies." Critical accounting estimates are those which require management to make assumptions about matters that were uncertain at the time the estimate was made and for which the use of different estimates, which reasonably could have been used, or changes in the accounting estimates that are reasonably likely to occur from period to period could have a material impact on our financial condition or results of operations. We have identified the following to be our critical accounting policies: the determination of net revenue provisions, acquisitions, intangible assets, goodwill and contingent consideration, income taxes and the impact of existing legal matters.
77
Table of Contents
Net Revenue Provisions
Net revenues are recognized for product sales when title and risk of loss have transferred to the customer and when provisions for estimates, including discounts, sales allowances, price adjustments, returns, chargebacks and other promotional programs are reasonably determinable. Accruals for these provisions are presented in the Consolidated Financial Statements as reductions in determining net revenues and in accounts receivable and other current liabilities. Accounts receivable are presented net of allowances relating to these provisions, which were $1.98 billion and $2.05 billion at December 31, 2017 and 2016 , respectively. Other current liabilities include $818.0 million and $809.0 million at December 31, 2017 and 2016 , respectively, for certain sales allowances and other adjustments that are paid to indirect customers. The following is a rollforward of the most significant provisions for estimated sales allowances during 2017 :
(In millions) | Balance at |
| Current Provision Related to |
| Checks/ Credits Issued to Third Parties |
| Effects of Foreign Exchange |
| Balance at | |||||||
December 31, 2016 |
|
|
|
| December 31, 2017 | |||||||||||
Incentives offered to customers | $ | 1,229.0 | |
| 4,194.2 | |
| (4,203.0 | ) |
| 11.5 | |
| $ | 1,231.7 | |
Chargebacks | $ | 610.5 | |
| 4,239.5 | |
| (4,277.5 | ) |
| 1.8 | |
| $ | 574.3 | |
Returns | $ | 470.7 | |
| 390.7 | |
| (390.0 | ) |
| 1.1 | |
| $ | 472.5 | |
We have not made and do not anticipate making any significant changes to the methodologies that we use to measure sales provisions; however, the balances within these reserves can fluctuate significantly through the consistent application of our methodologies. Historically, we have not recorded in any current period any material amounts related to adjustments made to prior period reserves.
Provisions for incentives offered to customers, including estimated discounts, sales allowances, promotional and other credits require a lower degree of subjectivity and are less complex in nature, yet, when combined, represent a significant portion of the overall provisions. These provisions are estimated based on historical payment experience, historical relationships to revenues, estimated customer inventory levels and contract terms. Such provisions are determinable due to the limited number of assumptions and consistency of historical experience.
Others, such as chargebacks and returns, require management to make more subjective judgments and evaluate current market conditions. These provisions are discussed in further detail below.
Chargebacks - The provision for chargebacks is the most significant and complex estimate used in the recognition of revenue. Mylan markets products directly to wholesalers, distributors, retail pharmacy chains, mail order pharmacies and group purchasing organizations. We also market products indirectly to independent pharmacies, managed care organizations, hospitals, nursing homes and pharmacy benefit managers, collectively referred to as "indirect customers." Mylan enters into agreements with its indirect customers to establish contract pricing for certain products. The indirect customers then independently select a wholesaler from which to purchase the products at these contracted prices. Alternatively, certain wholesalers may enter into agreements with indirect customers that establish contract pricing for certain products, which the wholesalers provide. Under either arrangement, Mylan will provide credit to the wholesaler for any difference between the contracted price with the indirect party and the wholesaler's invoice price. Such credit is called a chargeback, while the difference between the contracted price and the wholesaler's invoice price is referred to as the chargeback rate. The provision for chargebacks is based on expected sell-through levels by our wholesaler customers to indirect customers, as well as estimated wholesaler inventory levels. For the latter, in most cases, inventory levels are obtained directly from certain of our largest wholesalers. Additionally, internal estimates are prepared based upon historical buying patterns and estimated end-user demand. Such information allows us to estimate the potential chargeback that we may ultimately owe to our customers given the quantity of inventory on hand. We continually monitor our provision for chargebacks and evaluate our reserve and estimates as additional information becomes available. A change of 5% in the estimated sell-through levels by our wholesaler customers and in the estimated wholesaler inventory levels would have an effect on our reserve balance of approximately $33 million .
Returns - Consistent with industry practice, we maintain a return policy that allows our customers to return product within a specified period prior to and subsequent to the expiration date. Although application of the policy varies from country to country in accordance with local practices, generally, product may be returned for a period beginning six months prior to its expiration date to up to one year after its expiration date. The majority of our product returns occur as a result of product dating, which falls within the range set by our policy, and are settled through the issuance of a credit to our customer. Although the introduction of additional generic competition does not give our customers the right to return product outside of our established policy, we do recognize that such competition could ultimately lead to increased returns. We analyze this on a case-
78
Table of Contents
by-case basis, when significant, and make adjustments to increase our reserve for product returns as necessary. Our estimate of the provision for returns is based upon our historical experience with actual returns, which is applied to the level of sales for the period that corresponds to the period during which our customers may return product. This period is known by us based on the shelf lives of our products at the time of shipment. Additionally, we consider factors such as levels of inventory in the distribution channel, product dating and expiration period, size and maturity of the market prior to a product launch, entrance into the market of additional generic competition, changes in formularies or launch of OTC products, and we make adjustments to the provision for returns in the event that it appears that actual product returns may differ from our established reserves. We obtain data with respect to the level of inventory in the channel directly from certain of our largest customers. A change of 5% in the estimated product return rate used in our calculation of our return reserve would have an effect on our reserve balance of approximately $24 million .
Acquisitions, Intangible Assets, Goodwill and Contingent Consideration
We account for acquired businesses using the acquisition method of accounting in accordance with the provisions of ASC 805, which requires that the assets acquired and liabilities assumed be recorded at the date of acquisition at their respective estimated fair values. The cost to acquire businesses has been allocated to the underlying net assets of the acquired businesses based on estimates of their respective fair values. Amounts allocated to acquired in-process research and development ("IPR&D") are capitalized at the date of an acquisition and, at that time, such IPR&D assets have indefinite lives. As products in development are approved for sale, amounts will be allocated to product rights and licenses and will be amortized over their estimated useful lives. Definite-lived intangible assets are amortized over the expected life of the asset. Any excess of the purchase price over the estimated fair values of the net assets acquired is recorded as goodwill.
Purchases of developed products and licenses that are accounted for as an asset acquisition are capitalized as intangible assets and amortized over an estimated useful life. IPR&D assets acquired as part of an asset acquisition are expensed immediately if they have no alternative future uses.
The judgments made in determining the estimated fair value assigned to each class of assets acquired and liabilities assumed, as well as asset lives, can materially impact our results of operations. Fair values and useful lives are determined based on, among other factors, the expected future period of benefit of the asset, the various characteristics of the asset and projected cash flows. Because this process involves management making estimates with respect to future sales volumes, pricing, new product launches, government reform actions, anticipated cost environment and overall market conditions, and because these estimates form the basis for the determination of whether or not an impairment charge should be recorded, these estimates are considered to be critical accounting estimates.
We record contingent consideration resulting from a business acquisition at its estimated fair value on the acquisition date. Each reporting period thereafter, we revalue these obligations and record increases or decreases in their fair value as an adjustment to litigation settlements and other contingencies, net within the Consolidated Statements of Operations. Changes in the fair value of the contingent consideration obligations can result from adjustments to the discount rates, payment periods and adjustments in the probability of achieving future development steps, regulatory approvals, market launches, sales targets and profitability. These fair value measurements represent Level 3 measurements as they are based on significant inputs not observable in the market.
Significant judgment is employed in determining the assumptions utilized as of the acquisition date and for each subsequent measurement period. Accordingly, changes in assumptions described above, could have a material impact on our consolidated results of operations.
Goodwill and intangible assets, including IPR&D, are reviewed for impairment annually and/or when events or other changes in circumstances indicate that the carrying amount of the assets may not be recoverable. Impairment of goodwill and indefinite-lived intangibles is determined to exist when the fair value is less than the carrying value of the net assets being tested, with any impairment charge being equal to the difference. Impairment of definite-lived intangibles is determined to exist when undiscounted cash flows related to the assets are less than the carrying value of the assets being tested. Future events and decisions may lead to asset impairment and/or related costs.
Goodwill is allocated and evaluated for impairment at the reporting unit level, which is defined as an operating segment or one level below an operating segment. The Company has four reporting units, North America Generics , North America Specialty , Europe and Rest of World and completes its annual goodwill impairment test as of April 1st. As of April 1, 2017, the date of our most recent annual impairment test, the allocation of the Company's total goodwill was as follows: North America Generics $2.89 billion , North America Specialty $350.0 million , Europe $4.30 billion and Rest of World $1.79 billion .
79
Table of Contents
The Company performed a quantitative impairment analysis for all of its reporting units as of April 1, 2017. The impairment analysis consists of a comparison of the estimated fair value of the individual reporting units with their carrying amount, including goodwill. In estimating each reporting unit's fair value, we performed extensive valuation analysis utilizing both income and market-based approaches, in our goodwill assessment process. We utilized an average of the two methods in estimating the fair value of the individual reporting units, except for the North America Specialty reporting unit where the fair value was estimated utilizing the income approach. The following describes the valuation methodologies used to derive the estimated fair value of the reporting units.
Income Approach : Under this approach, to determine fair value, we discounted the expected future cash flows of each reporting unit. We used a discount rate, which reflected the overall level of inherent risk and the rate of return an outside investor would have expected to earn. To estimate cash flows beyond the final year of our model, we used a terminal value approach. Under this approach, we used estimated earnings before interest, taxes, depreciation and amortization ("EBITDA") in the final year of our model, adjusted to estimate a normalized cash flow, applied a perpetuity growth assumption, and discounted by a perpetuity discount factor to determine the terminal value. We incorporated the present value of the resulting terminal value into our estimate of fair value.
Market-Based Approach : The Company also utilizes a market-based approach to estimate fair value, principally utilizing the guideline company method which focuses on comparing our risk profile and growth prospects to a select group of publicly traded companies with reasonably similar guidelines.
As of April 1, 2017 , the Company determined that the fair value of the North America Generics , North America Specialty and Rest of World reporting units was substantially in excess of the respective unit's carrying value. For the Europe reporting unit, the estimated fair value exceeded its carrying value by approximately $800 million or 6% . The excess fair value over the carrying value declined from the prior year primarily as a result of an increase in the discount rate utilized in the income approach from 8.5% to 9.0% and an increase in the estimated tax rate from 22% to 24% . Additionally, the net assets acquired as part of the Meda acquisition, the majority of which were allocated to the Europe reporting unit, were included in the April 1, 2017 impairment test for the first time. As it relates to the income approach for the Europe reporting unit at April 1, 2017, the Company forecasted cash flows for the next five years. During the forecast period, the revenue compound annual growth rate was approximately 4% . A terminal value year was calculated with a 2% revenue growth rate applied. Under the market-based approach, we utilized an estimated range of market multiples of 9.0 to 10.5 times EBITDA plus a control premium of 15% . If all other assumptions are held constant, a reduction in the terminal value growth rate by 2.0% or an increase in discount rate by 1.5% would result in an impairment charge for the Europe reporting unit.
The determination of the fair value of the reporting units requires us to make significant estimates and assumptions that affect the reporting unit's expected future cash flows. These estimates and assumptions primarily include, but are not limited to, market multiples, control premiums, the discount rate, terminal growth rates, operating income before depreciation and amortization, and capital expenditures forecasts. Due to the inherent uncertainty involved in making these estimates, actual results could differ from those estimates. In addition, changes in underlying assumptions, especially as it relates to the key assumptions detailed, could have a significant impact on the fair value of the reporting units.
We have also assessed the recoverability of certain long-lived assets contained within the reporting units. Any impairment of these assets must be considered prior to our impairment review of goodwill. The assessment for impairment is based on our ability to recover the carrying value of the long-lived assets by analyzing the expected future undiscounted pre-tax cash flows specific to the asset grouping.
We assess the recoverability of the carrying value of long-lived assets at the lowest level for which identifiable undiscounted cash flows are largely independent of the cash flows of other assets and liabilities. If these undiscounted cash flows are less than the carrying value of long-lived assets within the asset group, an impairment loss is measured based on the difference between the estimated fair value and carrying value. Significant management judgment is involved in estimating the recoverability of these assets and is dependent upon the accuracy of the assumptions used in making these estimates, as well as how the estimates compare to the eventual future operating performance of the specific asset grouping. Certain asset groupings within the Company's Europe reporting unit remain at risk for potential impairment charges if the projected operating results are not achieved. Any future long-lived assets impairment charges would likely materially impact the Company's reported financial condition and results of operations.
The Company performs its annual impairment review of IPR&D assets during the second, third and fourth quarters of each fiscal year. The impairment test for IPR&D consists of a comparison of the asset's fair value with its carrying value. Impairment is determined to exist when the fair value is less than the carrying value of the assets being tested, with any impairment charge being equal to the difference. This review of IPR&D assets principally relates to assets acquired as part of
80
Table of Contents
the Topicals Business in June 2016, the Jai Pharma Limited acquisition in November 2015, the Agila acquisition in December 2013 and the respiratory delivery platform acquisition in December 2011. The Company calculates the fair value based upon detailed valuations employing the income approach utilizing Level 3 inputs, as defined in Note 7 Financial Instruments and Risk Management in Item 8 in this Annual Report on Form 10-K. The fair value of IPR&D is calculated as the present value of the estimated future net cash flows using a market rate of return. The assumptions inherent in the estimated future cash flows include, among other things, the impact of changes to the development programs, the projected development and regulatory time frames and the current competitive environment. For the years ended December 31, 2017 , 2016 and 2015 , the Company recorded $74.6 million , $49.9 million , and $31.3 million , respectively, of impairment charges, which were recorded as a component of amortization expense. At December 31, 2017 and 2016 , the Company's IPR&D assets totaled $813.2 million and $921.1 million , respectively.
Income Taxes
We compute our income taxes based on the statutory tax rates and tax reliefs available to Mylan in the various jurisdictions in which we generate income. Significant judgment is required in determining our income taxes and in evaluating our tax positions. We establish reserves in accordance with Mylan 's policy regarding accounting for uncertainty in income taxes. Our policy provides that the tax effects from an uncertain tax position be recognized in Mylan 's financial statements, only if the position is more likely than not of being sustained upon audit, based on the technical merits of the position. We adjust these reserves in light of changing facts and circumstances, such as the settlement of a tax audit. Our provision for income taxes includes the impact of reserve provisions and changes to reserves. Favorable resolution would be recognized as a reduction to our provision for income taxes in the period of resolution. Based on this evaluation, as of December 31, 2017 , our reserve for unrecognized tax benefits totaled $185.7 million .
Management assesses the available positive and negative evidence to estimate if sufficient future taxable income will be generated to utilize the existing deferred tax assets. A significant piece of objective negative evidence evaluated was the cumulative loss incurred in certain taxing jurisdictions over the three-year period ended December 31, 2017 . Such objective evidence limits the ability to consider other subjective evidence such as our projections for future growth.
Based on this evaluation, as of December 31, 2017 , a valuation allowance of $662.8 million has been recorded in order to measure only the portion of the deferred tax asset that more likely than not will be realized. The amount of the deferred tax asset considered realizable, however, could be adjusted if estimates of future taxable income during the carryforward period are reduced or if objective negative evidence in the form of cumulative losses is no longer present and additional weight may be given to subjective evidence such as projections for growth.
On December 22, 2017, the Tax Act was signed into law making significant changes to the Code. Changes include, but are not limited to, a U.S. federal corporate income tax rate decrease from 35% to 21% effective for tax years beginning after December 31, 2017, the partial transition of U.S. international taxation from a worldwide tax system to a territorial system, and a one-time transition tax on the mandatory deemed repatriation of cumulative foreign earnings of non-U.S. corporate subsidiaries of large U.S. shareholders as of December 31, 2017. The resolution of tax reserves and changes in valuation allowances could be material to Mylan's results of operations or financial condition. A variance of 5% between estimated reserves and valuation allowances and actual resolution and realization of these tax items would have an effect on our reserve balance and valuation allowance of approximately $42.4 million .
Legal Matters
Mylan is involved in various legal proceedings, some of which involve claims for substantial amounts. An estimate is made to accrue for a loss contingency relating to any of these legal proceedings if it is probable that a liability was incurred as of the date of the financial statements and the amount of loss can be reasonably estimated. Because of the subjective nature inherent in assessing the outcome of litigation and because of the potential that an adverse outcome in a legal proceeding could have a material adverse effect on our business, financial condition, results of operations, cash flows, and/or ordinary share price, such estimates are considered to be critical accounting estimates.
A variance of 5% between estimated and recorded litigation reserves (excluding indemnified claims) and actual resolution of certain legal matters would have an effect on our litigation reserve balance of approximately $9 million . Refer to Note 18 Litigation in Item 8 in this Annual Report on Form 10-K for further discussion of litigation matters.
81
Table of Contents
Recent Accounting Pronouncements
Refer to Note 2 Summary of Significant Accounting Policies in Item 8 in this Annual Report on Form 10-K for recently adopted accounting pronouncements and recently issued accounting pronouncements not yet adopted.
ITEM 7A. | Quantitative and Qualitative Disclosures About Market Risk |
Foreign Currency Exchange Risk
A significant portion of our revenues and earnings are exposed to changes in foreign currency exchange rates. We seek to manage this foreign exchange risk in part through operational means, including managing same currency revenues in relation to same currency costs and same currency assets in relation to same currency liabilities.
From time to time, foreign exchange risk is managed through the use of foreign currency forward-exchange contracts. These contracts are used to offset the potential earnings effects from mostly intercompany foreign currency assets and liabilities that arise from operations and from intercompany loans. Mylan 's primary areas of foreign exchange risk relative to the U.S. Dollar are the Euro, Swedish Krona, Indian Rupee, Japanese Yen, Australian Dollar, Canadian Dollar, Pound Sterling and Brazilian Real . Any unhedged foreign exchange exposures continue to be subject to market fluctuations.
Our financial instrument holdings at year end were analyzed to determine their sensitivity to foreign exchange rate changes. The fair values of these instruments were determined as follows:
• | foreign currency forward-exchange contracts - net present values |
• | foreign currency denominated receivables, payables, debt and loans - changes in exchange rates |
In this sensitivity analysis, we assumed that the change in one currency's rate relative to the U.S. Dollar would not have an effect on other currencies' rates relative to the U.S. Dollar. All other factors were held constant.
If there were an adverse change in foreign currency exchange rates of 10% , the expected net effect on net income related to Mylan 's foreign currency denominated financial instruments would not be material .
The Company is also exposed to translation risk on non-U.S. dollar-denominated net assets. Non-U.S. dollar borrowings, principally our Euro denominated long-term debt, are used to hedge the foreign currency exposures of our net investment in certain foreign affiliates and are designated as hedges of net investments. The effective portion of foreign exchange gains or losses on these hedges is included in the foreign currency translation component of accumulated other comprehensive income/(loss). If our net investment decreases below the equivalent value of the non-U.S. debt borrowings, the change in the remeasurement basis of the debt would be subject to recognition in income as changes occur.
Interest Rate and Long-Term Debt Risk
Mylan 's exposure to interest rate risk arises primarily from our U.S. Dollar and Euro borrowings and U.S. Dollar investments. We invest primarily on a variable-rate basis and we borrow on both a fixed and variable basis. In order to maintain a certain ratio of fixed to variable rate debt, from time to time, depending on market conditions, Mylan will use derivative financial instruments such as interest rate swaps to fix interest rates on variable-rate borrowings or to convert fixed-rate borrowings to variable interest rates.
As of December 31, 2017 , Mylan 's long-term fixed rate borrowings consist principally of $12.1 billion notional amount of Senior Notes and Euro Notes. Generally, the fair value of fixed interest rate debt will decrease as interest rates rise and increase as interest rates fall. As of December 31, 2017 , the fair value of our outstanding fixed rate Senior Notes and Euro Notes was approximately $14.9 billion . A 100 basis point change in interest rates on Mylan 's variable rate debt, net of interest rate swaps, would result in a change in interest expense of approximately $21.0 million per year.
82
Table of Contents
ITEM 8. | Financial Statements And Supplementary Data |
Index to Consolidated Financial Statements and
Supplementary Financial Information
| Page |
|
|
Management's Report on Internal Control over Financial Reporting | 84 |
|
|
Reports of Independent Registered Public Accounting Firm | 85 |
|
|
Consolidated Balance Sheets as of December 31, 2017 and 2016 | 87 |
|
|
Consolidated Statements of Operations for the Years Ended December 31, 2017, 2016 and 2015 | 88 |
|
|
Consolidated Statements of Comprehensive Earnings for the Years Ended December 31, 2017, 2016 and 2015 | 89 |
|
|
Consolidated Statements of Equity for the Years Ended December 31, 2017, 2016 and 2015 | 90 |
|
|
Consolidated Statements of Cash Flows for the Years Ended December 31, 2017, 2016 and 2015 | 91 |
|
|
Notes to Consolidated Financial Statements | 93 |
|
|
Supplementary Financial Information | 171 |
83
Table of Contents
Management's Report on Internal Control over Financial Reporting
Management of Mylan N.V. (the "Company") is responsible for establishing and maintaining adequate internal control over financial reporting. Internal control over financial reporting is a process designed to provide reasonable assurance regarding the reliability of financial reporting and the preparation of financial statements for external purposes in accordance with accounting principles generally accepted in the United States of America. In order to evaluate the effectiveness of internal control over financial reporting, management has conducted an assessment, including testing, using the criteria in Internal Control - Integrated Framework ( 2013 ) , issued by the Committee of Sponsoring Organizations of the Treadway Commission ("COSO"). Because of its inherent limitations, internal control over financial reporting may not prevent or detect misstatements. Also, projections of any evaluation of effectiveness to future periods are subject to the risk that controls may become inadequate because of changes in conditions or that the degree of compliance with the policies or procedures may deteriorate.
As a result of this assessment, management has concluded that the Company maintained effective internal control over financial reporting as of December 31, 2017 based on the criteria in Internal Control - Integrated Framework ( 2013 ) issued by COSO.
Our independent registered public accounting firm, Deloitte & Touche LLP, has audited the effectiveness of the Company's internal control over financial reporting. Deloitte & Touche LLP's opinion on the Company's internal control over financial reporting appears on page 86 of this Annual Report on Form 10-K.
84
Table of Contents
REPORT OF INDEPENDENT REGISTERED PUBLIC ACCOUNTING FIRM
To the shareholders and the Board of Directors of Mylan N.V.:
Opinion on the Financial Statements
We have audited the accompanying consolidated balance sheets of Mylan N.V. and subsidiaries (the "Company") as of December 31, 2017 and 2016, the related consolidated statements of operations, comprehensive earnings, equity, and cash flows for each of the three years in the period ended December 31, 2017, and the related notes and the consolidated financial statement schedule listed in the Index at Item 15 (collectively referred to as the "financial statements"). In our opinion, the financial statements present fairly, in all material respects, the financial position of the Company as of December 31, 2017 and 2016, and the results of its operations and its cash flows for each of the three years in the period ended December 31, 2017 in conformity with accounting principles generally accepted in the United States of America.
We have also audited, in accordance with the standards of the Public Company Accounting Oversight Board (United States) (PCAOB), the Company's internal control over financial reporting as of December 31, 2017, based on criteria established in Internal Control - Integrated Framework (2013) issued by the Committee of Sponsoring Organizations of the Treadway Commission and our report dated February 28, 2018, expressed an unqualified opinion on the Company's internal control over financial reporting.
Basis for Opinion
These financial statements are the responsibility of the Company's management. Our responsibility is to express an opinion on the Company's financial statements based on our audits. We are a public accounting firm registered with the PCAOB and are required to be independent with respect to the Company in accordance with the U.S. federal securities laws and the applicable rules and regulations of the Securities and Exchange Commission and the PCAOB.
We conducted our audits in accordance with the standards of the PCAOB. Those standards require that we plan and perform the audit to obtain reasonable assurance about whether the financial statements are free of material misstatement, whether due to error or fraud. Our audits included performing procedures to assess the risks of material misstatement of the financial statements, whether due to error or fraud, and performing procedures that respond to those risks. Such procedures included examining, on a test basis, evidence regarding the amounts and disclosures in the financial statements. Our audits also included evaluating the accounting principles used and significant estimates made by management, as well as evaluating the overall presentation of the financial statements. We believe that our audits provide a reasonable basis for our opinion.
/s/ DELOITTE & TOUCHE LLP
Pittsburgh, Pennsylvania
February 28, 2018
We have served as the Company's auditor since 1976.
85
Table of Contents
REPORT OF INDEPENDENT REGISTERED PUBLIC ACCOUNTING FIRM
To the shareholders and the Board of Directors of Mylan N.V.:
Opinion on Internal Control over Financial Reporting
We have audited the internal control over financial reporting of Mylan N.V. and subsidiaries (the "Company") as of December 31, 2017, based on criteria established in Internal Control - Integrated Framework (2013) issued by the Committee of Sponsoring Organizations of the Treadway Commission (COSO). In our opinion, the Company maintained, in all material respects, effective internal control over financial reporting as of December 31, 2017, based on criteria established in Internal Control - Integrated Framework (2013) issued by COSO.
We have also audited, in accordance with the standards of the Public Company Accounting Oversight Board (United States) (PCAOB), the consolidated financial statements and consolidated financial statement schedule as of and for the year ended December 31, 2017, of the Company and our report dated February 28, 2018, expressed an unqualified opinion on those financial statements.
Basis for Opinion
The Company's management is responsible for maintaining effective internal control over financial reporting and for its assessment of the effectiveness of internal control over financial reporting, included in the accompanying Management's Report on Internal Control over Financial Reporting. Our responsibility is to express an opinion on the Company's internal control over financial reporting based on our audit. We are a public accounting firm registered with the PCAOB and are required to be independent with respect to the Company in accordance with the U.S. federal securities laws and the applicable rules and regulations of the Securities and Exchange Commission and the PCAOB.
We conducted our audit in accordance with the standards of the PCAOB. Those standards require that we plan and perform the audit to obtain reasonable assurance about whether effective internal control over financial reporting was maintained in all material respects. Our audit included obtaining an understanding of internal control over financial reporting, assessing the risk that a material weakness exists, testing and evaluating the design and operating effectiveness of internal control based on the assessed risk, and performing such other procedures as we considered necessary in the circumstances. We believe that our audit provides a reasonable basis for our opinion.
Definition and Limitations of Internal Control over Financial Reporting
A company's internal control over financial reporting is a process designed to provide reasonable assurance regarding the reliability of financial reporting and the preparation of financial statements for external purposes in accordance with generally accepted accounting principles. A company's internal control over financial reporting includes those policies and procedures that (1) pertain to the maintenance of records that, in reasonable detail, accurately and fairly reflect the transactions and dispositions of the assets of the company; (2) provide reasonable assurance that transactions are recorded as necessary to permit preparation of financial statements in accordance with generally accepted accounting principles, and that receipts and expenditures of the company are being made only in accordance with authorizations of management and directors of the company; and (3) provide reasonable assurance regarding prevention or timely detection of unauthorized acquisition, use, or disposition of the company's assets that could have a material effect on the financial statements.
Because of its inherent limitations, internal control over financial reporting may not prevent or detect misstatements. Also, projections of any evaluation of effectiveness to future periods are subject to the risk that controls may become inadequate because of changes in conditions, or that the degree of compliance with the policies or procedures may deteriorate.
/s/ DELOITTE & TOUCHE LLP
Pittsburgh, Pennsylvania
February 28, 2018
86
Table of Contents
MYLAN N.V. AND SUBSIDIARIES
Consolidated Balance Sheets
(In millions, except share and per share amounts)
| December 31, |
| December 31, | ||||
ASSETS |
|
|
| ||||
Assets |
|
|
| ||||
Current assets: |
|
|
| ||||
Cash and cash equivalents | $ | 292.1 | |
| $ | 998.8 | |
Accounts receivable, net | 3,612.4 | |
| 3,310.9 | | ||
Inventories | 2,542.7 | |
| 2,456.4 | | ||
Prepaid expenses and other current assets | 766.1 | |
| 756.4 | | ||
Total current assets | 7,213.3 | |
| 7,522.5 | | ||
Property, plant and equipment, net | 2,339.1 | |
| 2,322.2 | | ||
Intangible assets, net | 15,245.8 | |
| 14,447.8 | | ||
Goodwill | 10,205.7 | |
| 9,231.9 | | ||
Deferred income tax benefit | 496.8 | |
| 633.2 | | ||
Other assets | 305.6 | |
| 568.6 | | ||
Total assets | $ | 35,806.3 | |
| $ | 34,726.2 | |
LIABILITIES AND EQUITY |
|
|
| ||||
Liabilities |
|
|
| ||||
Current liabilities: |
|
|
| ||||
Trade accounts payable | $ | 1,452.5 | |
| $ | 1,348.1 | |
Short-term borrowings | 46.5 | |
| 46.4 | | ||
Income taxes payable | 112.9 | |
| 97.7 | | ||
Current portion of long-term debt and other long-term obligations | 1,808.9 | |
| 290.0 | | ||
Other current liabilities | 2,964.5 | |
| 3,258.5 | | ||
Total current liabilities | 6,385.3 | |
| 5,040.7 | | ||
Long-term debt | 12,865.3 | |
| 15,202.9 | | ||
Deferred income tax liability | 2,012.4 | |
| 2,006.4 | | ||
Other long-term obligations | 1,235.7 | |
| 1,358.6 | | ||
Total liabilities | 22,498.7 | |
| 23,608.6 | | ||
Equity |
|
|
| ||||
Mylan N.V. shareholders' equity |
|
|
| ||||
Ordinary shares - nominal value €0.01 per share as of December 31, 2017 and December 31, 2016 |
|
|
| ||||
Shares authorized: 1,200,000,000 |
|
|
| ||||
Shares issued: 537,902,426 and 536,639,291 as of December 31, 2017 and December 31, 2016 | 6.0 | |
| 6.0 | | ||
Additional paid-in capital | 8,586.0 | |
| 8,499.3 | | ||
Retained earnings | 5,644.5 | |
| 4,942.1 | | ||
Accumulated other comprehensive loss | (361.2 | ) |
| (2,263.7 | ) | ||
| 13,875.3 | |
| 11,183.7 | | ||
Noncontrolling interest | - | |
| 1.4 | | ||
Less: Treasury stock - at cost |
|
|
| ||||
Ordinary shares: 13,695,251 and 1,311,193 as of December 31, 2017 and December 31, 2016 | 567.7 | |
| 67.5 | | ||
Total equity | 13,307.6 | |
| 11,117.6 | | ||
Total liabilities and equity | $ | 35,806.3 | |
| $ | 34,726.2 | |
See Notes to Consolidated Financial Statements
87
Table of Contents
MYLAN N.V. AND SUBSIDIARIES
Consolidated Statements of Operations
(In millions, except per share amounts)
| Year Ended December 31, | ||||||||||
| 2017 |
| 2016 |
| 2015 | ||||||
Revenues: |
|
|
|
|
| ||||||
Net sales | $ | 11,760.0 | |
| $ | 10,967.1 | |
| $ | 9,362.6 | |
Other revenues | 147.7 | |
| 109.8 | |
| 66.7 | | |||
Total revenues | 11,907.7 | |
| 11,076.9 | |
| 9,429.3 | | |||
Cost of sales | 7,124.6 | |
| 6,379.9 | |
| 5,213.2 | | |||
Gross profit | 4,783.1 | |
| 4,697.0 | |
| 4,216.1 | | |||
Operating expenses: |
|
|
|
|
| ||||||
Research and development | 783.3 | |
| 826.8 | |
| 671.9 | | |||
Selling, general and administrative | 2,575.8 | |
| 2,496.1 | |
| 2,180.7 | | |||
Litigation settlements and other contingencies, net | (13.1 | ) |
| 672.5 | |
| (97.4 | ) | |||
Total operating expenses | 3,346.0 | |
| 3,995.4 | |
| 2,755.2 | | |||
Earnings from operations | 1,437.1 | |
| 701.6 | |
| 1,460.9 | | |||
Interest expense | 534.6 | |
| 454.8 | |
| 339.4 | | |||
Other (income) expense, net | (0.5 | ) |
| 125.1 | |
| 206.1 | | |||
Earnings before income taxes and noncontrolling interest | 903.0 | |
| 121.7 | |
| 915.4 | | |||
Income tax provision (benefit) | 207.0 | |
| (358.3 | ) |
| 67.7 | | |||
Net earnings | 696.0 | |
| 480.0 | |
| 847.7 | | |||
Net earnings (loss) attributable to the noncontrolling interest | - | |
| - | |
| (0.1 | ) | |||
Net earnings attributable to Mylan N.V. ordinary shareholders | $ | 696.0 | |
| $ | 480.0 | |
| $ | 847.6 | |
Earnings per ordinary share attributable to Mylan N.V. ordinary shareholders |
|
|
|
|
| ||||||
Basic | $ | 1.30 | |
| $ | 0.94 | |
| $ | 1.80 | |
Diluted | $ | 1.30 | |
| $ | 0.92 | |
| $ | 1.70 | |
Weighted average ordinary shares outstanding: |
|
|
|
|
| ||||||
Basic | 534.5 | |
| 513.0 | |
| 472.2 | | |||
Diluted | 536.7 | |
| 520.5 | |
| 497.4 | | |||
See Notes to Consolidated Financial Statements
88
Table of Contents
MYLAN N.V. AND SUBSIDIARIES
Consolidated Statements of Comprehensive Earnings
(In millions)
| Year Ended December 31, | ||||||||||
| 2017 |
| 2016 |
| 2015 | ||||||
Net earnings | $ | 696.0 | |
| $ | 480.0 | |
| $ | 847.7 | |
Other comprehensive earnings (loss), before tax: |
|
|
|
|
| ||||||
Foreign currency translation adjustment | 2,103.9 | |
| (507.4 | ) |
| (790.9 | ) | |||
Change in unrecognized gain and prior service cost related to defined benefit plans | 3.8 | |
| 21.4 | |
| 3.1 | | |||
Net unrecognized gain (loss) on derivatives in cash flow hedging relationships | 52.7 | |
| (31.2 | ) |
| 16.7 | | |||
Net unrecognized loss on derivatives in net investment hedging relationships | (238.4 | ) |
| (1.8 | ) |
| - | | |||
Net unrealized (loss) gain on marketable securities | (6.7 | ) |
| 24.6 | |
| (2.0 | ) | |||
Other comprehensive earnings (loss), before tax | 1,915.3 | |
| (494.4 | ) |
| (773.1 | ) | |||
Income tax provision | 12.8 | |
| 5.0 | |
| 4.2 | | |||
Other comprehensive earnings (loss), net of tax | 1,902.5 | |
| (499.4 | ) |
| (777.3 | ) | |||
Comprehensive earnings (loss) | 2,598.5 | |
| (19.4 | ) |
| 70.4 | | |||
Comprehensive earnings attributable to the noncontrolling interest | - | |
| - | |
| (0.1 | ) | |||
Comprehensive earnings (loss) attributable to Mylan N.V. ordinary shareholders | $ | 2,598.5 | |
| $ | (19.4 | ) |
| $ | 70.3 | |
See Notes to Consolidated Financial Statements
89
Table of Contents
MYLAN N.V. AND SUBSIDIARIES Consolidated Statements of Equity (In millions, except share amounts) | |||||||||||||||||||||||||||||||||
|
|
|
|
| Additional Paid-In Capital |
| Retained |
|
|
|
|
| Accumulated Other Comprehensive Loss |
| Noncontrolling |
| Total | ||||||||||||||||
| Ordinary Shares (1) |
|
|
| Treasury Stock |
|
|
| |||||||||||||||||||||||||
| Shares |
| Cost |
|
|
| Shares |
| Cost |
|
|
| |||||||||||||||||||||
Balance at December 31, 2014 | 546,658,507 | |
| $ | 273.3 | |
| $ | 4,212.8 | |
| $ | 3,614.5 | |
| (171,435,200 | ) |
| $ | (3,857.7 | ) |
| $ | (987.0 | ) |
| $ | 20.1 | |
| $ | 3,276.0 | |
Net earnings | - | |
| - | |
| - | |
| 847.6 | |
| - | |
| - | |
| - | |
| 0.1 | |
| 847.7 | | |||||||
Other comprehensive earnings, net of tax | - | |
| - | |
| - | |
| - | |
| - | |
| - | |
| (777.3 | ) |
| - | |
| (777.3 | ) | |||||||
Ordinary share repurchase | - | |
| - | |
| - | |
| - | |
| 1,311,193 | |
| (67.5 | ) |
| - | |
| - | |
| (67.5 | ) | |||||||
Issuance of restricted stock and stock options exercised, net | 6,086,450 | |
| 1.3 | |
| 96.7 | |
| - | |
| 618,338 | |
| 14.5 | |
| - | |
| - | |
| 112.5 | | |||||||
Share-based compensation expense | - | |
| - | |
| 92.8 | |
| - | |
| - | |
| - | |
| - | |
| - | |
| 92.8 | | |||||||
Taxes related to the net share settlement of equity awards | - | |
| - | |
| (56.2 | ) |
| - | |
| - | |
| - | |
| - | |
| - | |
| (56.2 | ) | |||||||
Tax benefit of stock option plans | - | |
| - | |
| 52.5 | |
| - | |
| - | |
| - | |
| - | |
| - | |
| 52.5 | | |||||||
Exchange of Mylan Inc. common stock into Mylan N.V. ordinary shares | (378,388,431 | ) |
| (185.0 | ) |
| 185.0 | |
| - | |
| - | |
| - | |
| - | |
| - | |
| - | | |||||||
Issuance of ordinary shares to Mylan N.V. | 378,388,431 | |
| - | |
| - | |
| - | |
| - | |
| - | |
| - | |
| - | |
| - | | |||||||
Issuance of ordinary shares to purchase the EPD Business | 110,000,000 | |
| 1.3 | |
| 6,304.5 | |
| - | |
| - | |
| - | |
| - | |
| - | |
| 6,305.8 | | |||||||
Retirement of Mylan Inc. treasury stock, net | (170,816,862 | ) |
| (85.4 | ) |
| (3,757.7 | ) |
| - | |
| 170,816,862 | |
| 3,843.1 | |
| - | |
| - | |
| - | | |||||||
Purchase of subsidiary shares from noncontrolling interest | - | |
| - | |
| - | |
| - | |
| - | |
| - | |
| - | |
| (18.7 | ) |
| (18.7 | ) | |||||||
Other | - | |
| - | |
| (1.8 | ) |
| - | |
| - | |
| 0.1 | |
| - | |
| (0.1 | ) |
| (1.8 | ) | |||||||
Balance at December 31, 2015 | 491,928,095 | |
| $ | 5.5 | |
| $ | 7,128.6 | |
| $ | 4,462.1 | |
| 1,311,193 | |
| $ | (67.5 | ) |
| $ | (1,764.3 | ) |
| $ | 1.4 | |
| $ | 9,765.8 | |
Net earnings | - | |
| $ | - | |
| $ | - | |
| $ | 480.0 | |
| - | |
| $ | - | |
| $ | - | |
| $ | - | |
| $ | 480.0 | |
Other comprehensive loss, net of tax | - | |
| - | |
| - | |
| - | |
| - | |
| - | |
| (499.4 | ) |
| - | |
| (499.4 | ) | |||||||
Issuance of restricted stock and stock options exercised, net | 1,283,580 | |
| - | |
| 13.6 | |
| - | |
| - | |
| - | |
| - | |
| - | |
| 13.6 | | |||||||
Share-based compensation expense | - | |
| - | |
| 88.9 | |
| - | |
| - | |
| - | |
| - | |
| - | |
| 88.9 | | |||||||
Taxes related to the net share settlement of equity awards | - | |
| - | |
| (14.2 | ) |
| - | |
| - | |
| - | |
| - | |
| - | |
| (14.2 | ) | |||||||
Tax benefit of stock option plans | - | |
| - | |
| 1.2 | |
| - | |
| - | |
| - | |
| - | |
| - | |
| 1.2 | | |||||||
Shares issued for warrant settlement | 16,979,984 | |
| 0.2 | |
| (0.2 | ) |
| - | |
| - | |
| - | |
| - | |
| - | |
| - | | |||||||
Issuance of ordinary shares to purchase Meda | 26,447,632 | |
| 0.3 | |
| 1,281.4 | |
| - | |
| - | |
| - | |
| - | |
| - | |
| 1,281.7 | | |||||||
Balance at December 31, 2016 | 536,639,291 | |
| $ | 6.0 | |
| $ | 8,499.3 | |
| $ | 4,942.1 | |
| 1,311,193 | |
| $ | (67.5 | ) |
| $ | (2,263.7 | ) |
| $ | 1.4 | |
| $ | 11,117.6 | |
Net earnings | - | |
| $ | - | |
| $ | - | |
| $ | 696.0 | |
| - | |
| $ | - | |
| $ | - | |
| $ | - | |
| $ | 696.0 | |
Other comprehensive earnings, net of tax | - | |
| - | |
| - | |
| - | |
| - | |
| - | |
| 1,902.5 | |
| - | |
| 1,902.5 | | |||||||
Ordinary share repurchase | - | |
| - | |
| - | |
| - | |
| 12,384,058 | |
| (500.2 | ) |
| - | |
| - | |
| (500.2 | ) | |||||||
Issuance of restricted stock and stock options exercised, net | 1,263,135 | |
| - | |
| 17.8 | |
| - | |
| - | |
| - | |
| - | |
| - | |
| 17.8 | | |||||||
Share-based compensation expense | - | |
| - | |
| 74.7 | |
| - | |
| - | |
| - | |
| - | |
| - | |
| 74.7 | | |||||||
Taxes related to the net share settlement of equity awards | - | |
| - | |
| (5.8 | ) |
| - | |
| - | |
| - | |
| - | |
| - | |
| (5.8 | ) | |||||||
Other (2) | - | |
| - | |
| - | |
| 6.4 | |
| - | |
| - | |
| - | |
| (1.4 | ) |
| 5.0 | | |||||||
Balance at December 31, 2017 | 537,902,426 | |
| $ | 6.0 | |
| $ | 8,586.0 | |
| $ | 5,644.5 | |
| 13,695,251 | |
| $ | (567.7 | ) |
| $ | (361.2 | ) |
| $ | - | |
| $ | 13,307.6 | |
____________
(1) | Common stock prior to February 27, 2015 . |
(2) | The change in Retained Earnings represents the cumulative change related to the adoption of Accounting Standards Update 2016-16, Income Taxes (Topic 740) ("ASU 2016-16"). Refer to Note 2 Summary of Significant Accounting Policies in this Annual Report on Form 10-K for additional information. |
See Notes to Consolidated Financial Statements
90
Table of Contents
MYLAN N.V. AND SUBSIDIARIES
Consolidated Statements of Cash Flows
(In millions)
| Year Ended December 31, | ||||||||||
| 2017 |
| 2016 |
| 2015 | ||||||
Cash flows from operating activities: |
|
|
|
|
| ||||||
Net earnings | $ | 696.0 | |
| $ | 480.0 | |
| $ | 847.7 | |
Adjustments to reconcile net earnings to net cash provided by operating activities: |
|
|
|
|
| ||||||
Depreciation and amortization | 1,805.8 | |
| 1,523.0 | |
| 1,032.1 | | |||
Deferred income tax benefit | (111.4 | ) |
| (609.5 | ) |
| (115.9 | ) | |||
Litigation settlements and other contingencies, net | (40.1 | ) |
| 597.7 | |
| 15.1 | | |||
Unrealized losses on acquisition-related foreign currency derivatives | - | |
| 128.6 | |
| - | | |||
Loss from equity method investments | 58.0 | |
| 112.8 | |
| 105.1 | | |||
Share-based compensation expense | 74.7 | |
| 88.9 | |
| 92.8 | | |||
Write off of financing fees | 3.2 | |
| 35.8 | |
| 99.6 | | |||
Other non-cash items | 261.0 | |
| 499.4 | |
| 263.2 | | |||
Changes in operating assets and liabilities: |
|
|
|
|
| ||||||
Accounts receivable | (162.2 | ) |
| (131.8 | ) |
| 65.8 | | |||
Inventories | (129.5 | ) |
| (279.3 | ) |
| (320.4 | ) | |||
Trade accounts payable | 14.4 | |
| 87.7 | |
| 131.8 | | |||
Income taxes | 15.2 | |
| 37.5 | |
| (164.2 | ) | |||
Other operating assets and liabilities, net | (420.3 | ) |
| (523.6 | ) |
| (44.2 | ) | |||
Net cash provided by operating activities | 2,064.8 | |
| 2,047.2 | |
| 2,008.5 | | |||
Cash flows from investing activities: |
|
|
|
|
| ||||||
Cash paid for acquisitions, net of cash acquired | (167.0 | ) |
| (6,481.9 | ) |
| (693.1 | ) | |||
Capital expenditures | (275.9 | ) |
| (390.4 | ) |
| (362.9 | ) | |||
Payments for product rights and other, net | (620.3 | ) |
| (360.2 | ) |
| (506.5 | ) | |||
Cash paid for Meda's unconditional deferred payment | - | |
| (308.0 | ) |
| - | | |||
Settlement of acquisition-related foreign currency derivatives | - | |
| (128.6 | ) |
| - | | |||
Proceeds from sale of assets and subsidiaries | 86.7 | |
| - | |
| - | | |||
Change in restricted cash | 71.0 | |
| 57.1 | |
| 21.8 | | |||
Purchase of marketable securities | (96.5 | ) |
| (30.2 | ) |
| (62.1 | ) | |||
Proceeds from the sale of marketable securities | 96.6 | |
| 21.5 | |
| 33.1 | | |||
Net cash used in investing activities | (905.4 | ) |
| (7,620.7 | ) |
| (1,569.7 | ) | |||
Cash flows from financing activities: |
|
|
|
|
| ||||||
Proceeds from issuance of long-term debt | 876.1 | |
| 11,752.2 | |
| 3,539.2 | | |||
Payments of long-term debt | (2,232.7 | ) |
| (6,296.3 | ) |
| (4,484.1 | ) | |||
Payments of financing fees | (10.1 | ) |
| (112.6 | ) |
| (130.4 | ) | |||
Proceeds from convertible note hedge | - | |
| - | |
| 1,970.8 | | |||
Change in short-term borrowings, net | (2.9 | ) |
| 40.8 | |
| (329.2 | ) | |||
Purchase of ordinary shares | (500.2 | ) |
| - | |
| (67.5 | ) | |||
Proceeds from exercise of stock options | 17.8 | |
| 13.8 | |
| 97.7 | | |||
Taxes paid related to net share settlement of equity awards | (7.4 | ) |
| (17.5 | ) |
| (31.8 | ) | |||
Contingent consideration payments | (26.1 | ) |
| (35.5 | ) |
| - | | |||
Acquisition of noncontrolling interest | (7.5 | ) |
| (1.1 | ) |
| (11.7 | ) | |||
Other items, net | (0.1 | ) |
| 0.8 | |
| 51.8 | | |||
Net cash (used in) provided by financing activities | (1,893.1 | ) |
| 5,344.6 | |
| 604.8 | | |||
Effect on cash of changes in exchange rates | 27.0 | |
| (8.3 | ) |
| (33.1 | ) | |||
Net (decrease) increase in cash and cash equivalents | (706.7 | ) |
| (237.2 | ) |
| 1,010.5 | | |||
Cash and cash equivalents - beginning of period | 998.8 | |
| 1,236.0 | |
| 225.5 | | |||
Cash and cash equivalents - end of period | $ | 292.1 | |
| $ | 998.8 | |
| $ | 1,236.0 | |
Supplemental disclosures of cash flow information - |
|
|
|
|
| ||||||
Non-cash transactions: |
|
|
|
|
| ||||||
See Notes to Consolidated Financial Statements
91
Table of Contents
Contingent consideration | $ | 4.0 | |
| $ | 16.0 | |
| $ | 18.0 | |
Ordinary shares issued for acquisition | $ | - | |
| $ | 1,281.7 | |
| $ | 6,305.8 | |
Cash paid during the period for: |
|
|
|
|
| ||||||
Income taxes | $ | 285.7 | |
| $ | 285.6 | |
| $ | 302.9 | |
Interest | $ | 474.0 | |
| $ | 357.2 | |
| $ | 254.7 | |
See Notes to Consolidated Financial Statements
92
Table of Contents
Mylan N.V. and Subsidiaries
Notes to Consolidated Financial Statements
1. | Nature of Operations |
Mylan N.V. and its subsidiaries (collectively, the "Company," " Mylan ," "our" or "we") are engaged in the global development, licensing, manufacture, marketing and distribution of generic, branded generics, brand name and over-the-counter ("OTC") pharmaceutical products for resale by others and active pharmaceutical ingredients ("API") through three reportable segments on a geographic basis, North America, Europe and Rest of World. Our North America segment is primarily made up of our operations in the United States ("U.S.") and Canada, and also includes the operations of our specialty pharmaceuticals business. Our Europe segment is made up of operations in 35 countries within the region, including France, Italy, Germany, the U.K. and Spain. Our Rest of World segment is made up of our activities in over 120 countries, including our operations in Japan, Australia, China, Brazil, Russia, India, South Africa, and certain markets in the Middle-East and South East Asia. Our API business is conducted through Mylan Laboratories Limited (" Mylan India "), which is included within our Rest of World segment.
2. | Summary of Significant Accounting Policies |
Principles of Consolidation. The Consolidated Financial Statements include the accounts of Mylan and those of its wholly owned and majority-owned subsidiaries. All intercompany accounts and transactions have been eliminated in consolidation. Investments in equity method affiliates are recorded at cost and adjusted for the Company's share of the affiliates' cumulative results of operations, capital contributions and distributions. Noncontrolling interests in the Company's subsidiaries are generally recorded net of tax as net earnings attributable to noncontrolling interests.
Use of Estimates in the Preparation of Financial Statements. The preparation of financial statements, in conformity with accounting principles generally accepted in the United States of America ("U.S. GAAP"), requires management to make estimates and assumptions that affect the reported amounts of assets and liabilities at the date of the financial statements and the reported amounts of revenues and expenses during the reporting period. Because of the uncertainty inherent in such estimates, actual results could differ from those estimates.
Foreign Currencies. The Consolidated Financial Statements are presented in U.S. Dollars, the reporting currency of Mylan . Statements of Operations and Cash Flows of all of the Company's subsidiaries that have functional currencies other than U.S. Dollars are translated at a weighted average exchange rate for the period for inclusion in the Consolidated Statements of Operations and Cash Flows, whereas assets and liabilities are translated at the end of the period exchange rates for inclusion in the Consolidated Balance Sheets. Translation differences are recorded directly in shareholders' equity as foreign currency translation adjustments. Gains or losses on transactions denominated in a currency other than the subsidiaries' functional currency, which arise as a result of changes in foreign currency exchange rates, are recorded in the Consolidated Statements of Operations .
Cash and Cash Equivalents. Cash and cash equivalents are comprised of highly liquid investments with an original maturity of three months or less at the date of purchase.
Marketable Securities. Marketable equity and debt securities classified as available-for-sale are recorded at fair value, with net unrealized gains and losses, net of income taxes, reflected in accumulated other comprehensive loss as a component of shareholders' equity. Net realized gains and losses on sales of available-for-sale securities are computed on a specific security basis and are included in other expense, net , in the Consolidated Statements of Operations . Marketable equity and debt securities classified as trading securities are valued at the quoted market price from broker or dealer quotations or transparent pricing sources at the reporting date, and realized and unrealized gains and losses are included in other expense, net , in the Consolidated Statements of Operations . Refer to Recent Accounting Pronouncements in this Note 2 for additional information.
Concentrations of Credit Risk. Financial instruments that potentially subject the Company to credit risk consist principally of interest-bearing investments, derivatives and accounts receivable.
Mylan invests its excess cash in high-quality, liquid money market instruments, principally overnight deposits and highly rated money market funds. The Company maintains deposit balances at certain financial institutions in excess of federally insured amounts. Periodically, the Company reviews the creditworthiness of its counterparties to derivative transactions, and it does not expect to incur a loss from failure of any counterparties to perform under agreements it has with such counterparties.
93
Table of Contents
Inventories. Inventories are stated at the lower of cost or market, with cost principally determined by the first-in, first-out method. Provisions for potentially obsolete or slow-moving inventory, including pre-launch inventory, are made based on our analysis of inventory levels, historical obsolescence and future sales forecasts. Included as a component of cost of sales is expense related to the net realizable value of inventories.
Property, Plant and Equipment. Property, plant and equipment are stated at cost less accumulated depreciation. Depreciation is computed and recorded on a straight-line basis over the assets' estimated service lives ( 3 to 18 years for machinery and equipment and other fixed assets and 15 to 39 years for buildings and improvements). Capitalized software is included in property, plant and equipment and is amortized over estimated useful lives ranging from 3 to 7 years .
Intangible Assets and Goodwill. Intangible assets are stated at cost less accumulated amortization. Amortization is generally recorded on a straight-line basis over estimated useful lives ranging from 3 to 20 years. The Company periodically reviews the estimated useful lives of intangible assets and makes adjustments when events indicate that a shorter life is appropriate.
The Company accounts for acquired businesses using the acquisition method of accounting in accordance with the provisions of the Financial Accounting Standards Board ("FASB") Accounting Standards Codification ("ASC") 805, which requires that the assets acquired and liabilities assumed be recorded at the date of acquisition at their respective fair values. The cost to acquire a business is allocated to the underlying net assets of the acquired business in proportion to their respective fair values. Amounts allocated to acquired in-process research and development ("IPR&D") are capitalized at the date of acquisition and are not amortized. As products in development are approved for sale, amounts are allocated to product rights and licenses and amortized over their estimated useful lives. Definite-lived intangible assets are amortized over the expected life of the asset. Any excess of the purchase price over the estimated fair values of the net assets acquired is recorded as goodwill.
Purchases of developed products and licenses that are accounted for as an asset acquisition are capitalized as intangible assets and amortized over an estimated useful life. IPR&D assets acquired as part of an asset acquisition are expensed immediately if they have no alternative future uses.
The Company reviews goodwill for impairment at least annually or more frequently if events or changes in circumstances indicate that the carrying value of goodwill may not be recoverable based on management's assessment of the fair value of the Company's reporting units as compared to their related carrying value. Under the authoritative guidance issued by the FASB, we have the option to first assess the qualitative factors to determine whether it is more likely than not that the fair value of the reporting unit is less than its carrying amount as a basis for determining whether it is necessary to perform a quantitative goodwill impairment test. If we determine that it is more likely than not that the fair value of a reporting unit is less than its carrying amount, then the goodwill impairment test is performed. The goodwill impairment test requires the Company to estimate the fair value of the reporting unit and to compare the fair value of the reporting unit with its carrying amount. If the carrying amount exceeds its fair value then there is no impairment recognized. If the carrying value recorded exceeds the fair value calculated, an impairment charge is recorded for the difference. The judgments made in determining the projected cash flows used to estimate the fair value can materially impact the Company's financial condition and results of operations.
Contingent Consideration. Mylan records contingent consideration resulting from business acquisitions at fair value on the acquisition date. Each reporting period thereafter, the Company revalues these obligations and records increases or decreases in their fair value as a charge (credit) to litigation settlements and other contingencies, net within the Consolidated Statements of Operations. Changes in the fair value of the contingent consideration obligations can result from adjustments to the discount rates, payment periods and adjustments in the probability of achieving future development steps, regulatory approvals, market launches, sales targets and profitability. These fair value measurements represent Level 3 measurements, as they are based on significant inputs not observable in the market. Refer to Note 7 Financial Instruments and Risk Management for further information regarding changes recorded to contingent consideration.
Significant judgment is employed in determining the assumptions utilized as of the acquisition date and for each subsequent measurement period. Accordingly, changes in the assumptions described above could have a material impact on the Company's consolidated financial condition and results of operations.
Impairment of Long-Lived Assets. The carrying values of long-lived assets, which include property, plant and equipment and intangible assets with finite lives, are evaluated periodically in relation to the expected future undiscounted cash flows of the underlying assets and monitored for other potential triggering events. Adjustments are made in the event that estimated undiscounted net cash flows are less than the carrying value.
94
Table of Contents
Indefinite-lived intangibles, principally IPR&D, are tested at least annually for impairment or upon the occurrence of a triggering event. The impairment test for IPR&D consists of a comparison of the asset's fair value with its carrying value. Impairment is determined to exist when the fair value is less than the carrying value of the assets being tested in an amount of the difference.
Short-Term Borrowings. The Company's subsidiaries in India have working capital facilities with several banks which are secured by its current assets. Mylan Pharmaceuticals Inc. ("MPI"), a wholly owned subsidiary of the Company, also has a $400 million accounts receivable facility ("Receivables Facility"), which will expire in January 2019.
Revenue Recognition. Mylan recognizes net revenue for product sales when title and risk of loss pass to its customers and when provisions for estimates, including discounts, sales allowances, rebates, Medicaid and other government rebates, price adjustments, returns, chargebacks and other promotional programs, are reasonably determinable. Accruals for these provisions are presented in the Consolidated Financial Statements as reductions in determining net revenues and as a contra asset in accounts receivable, net (if settled via credit) and other current liabilities (if paid in cash). No significant revisions were made to the methodology used in determining these provisions during the years ended December 31, 2017 and 2016 . The following briefly describes the nature of our significant provisions and how such provisions are estimated.
• | Chargebacks: the Company has agreements with certain indirect customers, such as independent pharmacies, managed care organizations, hospitals, nursing homes, governmental agencies and pharmacy benefit managers, which establish contract prices for certain products. The indirect customers then independently select a wholesaler from which to purchase the products at these contracted prices. Alternatively, certain wholesalers may enter into agreements with indirect customers that establish contract pricing for certain products, which the wholesalers provide. Under either arrangement, Mylan will provide credit to the wholesaler for any difference between the contracted price with the indirect party and the wholesaler's invoice price. Such credits are called chargebacks. The provision for chargebacks is based on expected sell-through levels by our wholesaler customers to indirect customers, as well as estimated wholesaler inventory levels. |
• | Provision for returns: consistent with industry practice, Mylan maintains a return policy that allows customers to return a product generally within a specified period prior (six months) and subsequent to the expiration date (twelve months). The Company's estimate of the provision for returns is generally based upon historical experience with actual returns. |
• | Incentives offered to customers: these are offered to key customers to promote customer loyalty and encourage greater product sales. These programs generally provide that upon the attainment of pre-established volumes or the attainment of revenue milestones for a specified period, the customer receives credit against purchases. |
The following briefly describes the nature of our other sales reserves and allowances and how such provisions are estimated:
• | Discounts: these are reductions to invoiced amounts offered to customers for payment within a specified period and are estimated upon sale utilizing historical customer payment experience. |
• | Price adjustments : these are credits issued to reflect decreases in the selling prices of products and based upon the amount of product which the customer has remaining in its inventory at the time of the price reduction. In addition, there are decreases in selling prices that are discretionary decisions made by the Company to reflect market conditions. Amounts recorded for estimated price adjustments are based upon specified terms with customers, estimated launch dates of competing products and estimated declines in market price. |
• | Governmental rebate program s: government reimbursement programs include Medicare, Medicaid, and State Pharmacy Assistance Programs established according to statute, regulations and policy. Manufacturers of pharmaceutical products that are covered by the Medicaid program are required to rebate to each state a percentage of their average manufacturer's price for the products dispensed. Medicare beneficiaries are eligible to obtain discounted prescription drug coverage from private sector providers. In addition, certain states have also implemented supplemental rebate programs that obligate manufacturers to pay rebates in excess of those required under federal law. Our estimate of these rebates is based on the historical trends of rebates paid as well as on changes in wholesaler inventory levels and increases or decreases in the level of sales. |
• | Other promotional programs: these are incentive programs periodically offered to our customers. The Company is able to estimate provisions for volume-based sales allowances and other promotional programs based on the specific terms in each agreement at the time of sale. |
95
Table of Contents
Royalty or profit share revenue from licensees, which are based on third-party sales of licensed products and technology, is recorded in accordance with the contract terms, when third-party sales can be reliably measured and collection of the funds is reasonably assured. Royalty revenue is included in other revenue in the Consolidated Statements of Operations.
The Company recognizes contract manufacturing and other service revenue when the service is performed or when the Company's partners take ownership and title has passed, collectability is reasonably assured, the sales price is fixed or determinable, and there is persuasive evidence of an arrangement. Refer to Recent Accounting Pronouncements in this Note 2 for additional information.
Research and Development. Research and development ("R&D") expenses are charged to operations as incurred.
Income Taxes. Income taxes have been provided for using an asset and liability approach in which deferred income taxes reflect the tax consequences on future years of events that the Company has already recognized in the financial statements or tax returns. Changes in enacted tax rates or laws may result in adjustments to the recorded tax assets or liabilities in the period that the new tax law is enacted.
Earnings per Ordinary Share. Basic earnings per ordinary share is computed by dividing net earnings attributable to Mylan N.V. ordinary shareholders by the weighted average number of ordinary shares outstanding during the period. Diluted earnings per ordinary share is computed by dividing net earnings attributable to Mylan N.V. ordinary shareholders by the weighted average number of ordinary shares outstanding during the period increased by the number of additional shares that would have been outstanding related to potentially dilutive securities or instruments, if the impact is dilutive.
On August 5, 2016 , in conjunction with its acquisition of Meda AB (publ.) (" Meda "), the Company issued approximately 26.4 million Mylan N.V. ordinary shares to Meda shareholders. The impact of the issuance of these ordinary shares is included in the calculation of basic earnings per share. The weighted average impact for the year ended December 31, 2016, was approximately 10.8 million ordinary shares.
The Company was authorized to repurchase up to $1 billion of the Company's ordinary shares under its repurchase program that was previously approved by the Company's Board of Directors and announced on November 16, 2015 (the "Share Repurchase Program"), but was not obligated to acquire any particular amount of ordinary shares. During 2017 , the Company repurchased approximately 12.4 million ordinary shares at a cost of approximately $500.2 million . No ordinary shares were repurchased in 2016 , and in 2015 the Company repurchased approximately 1.3 million ordinary shares at a cost of approximately $67.5 million . In January 2018, the Company repurchased an additional 9.8 million ordinary shares at a cost of approximately $432.0 million and on January 9, 2018, the Share Repurchase Program was completed.
On September 15, 2008, concurrent with the sale of $575 million aggregate principal amount of Cash Convertible Notes due 2015 (the "Cash Convertible Notes"), Mylan Inc. entered into convertible note hedge and warrant transactions with certain counterparties. In connection with the consummation of the EPD Transaction (as defined below in Note 3 Acquisitions and Other Transactions ), the terms of the convertible note hedge were adjusted so that the cash settlement value would be based on Mylan N.V. ordinary shares. The terms of the warrant transactions were also adjusted so that, from and after the consummation of the EPD Transaction, the Company could settle the obligations under the warrant transactions by delivering Mylan N.V. ordinary shares. Pursuant to the warrant transactions, and a subsequent amendment in 2011, there were approximately 43.2 million warrants outstanding, with approximately 41.0 million of those warrants having an exercise price of $30.00 . The remaining warrants had an exercise price of $20.00 . The warrants met the definition of derivatives under the guidance in ASC 815 Derivatives and Hedging ; however, because these instruments had been determined to be indexed to the Company's own ordinary shares and met the criteria for equity classification under ASC 815-40 Contracts in Entity's Own Equity , the warrants were recorded in shareholders' equity in the Consolidated Balance Sheets.
On April 15, 2016, in connection with the expiration and settlement of the warrants, the Company issued approximately 17.0 million Mylan N.V. ordinary shares. The impact of the issuance of these ordinary shares is included in the calculation of basic earnings per share from the date of issuance. The dilutive impact of the warrants, prior to settlement, is included in the calculation of diluted earnings per ordinary share based upon the average market value of the Company's ordinary shares during the period as compared to the exercise price. For the years ended December 31, 2016, and 2015 , warrants included in the calculation of diluted earnings per ordinary share were 4.9 million and 20.7 million , respectively.
96
Table of Contents
Basic and diluted earnings per ordinary share attributable to Mylan N.V. are calculated as follows:
| Year Ended December 31, | ||||||||||
(In millions, except per share amounts) | 2017 |
| 2016 |
| 2015 (1) | ||||||
Basic earnings attributable to Mylan N.V. ordinary shareholders (numerator): |
|
|
|
|
| ||||||
Net earnings attributable to Mylan N.V. ordinary shareholders | $ | 696.0 | |
| $ | 480.0 | |
| $ | 847.6 | |
Shares (denominator): |
|
|
|
|
| ||||||
Weighted average ordinary shares outstanding | 534.5 | |
| 513.0 | |
| 472.2 | | |||
Basic earnings per ordinary share attributable to Mylan N.V. ordinary shareholders | $ | 1.30 | |
| $ | 0.94 | |
| $ | 1.80 | |
|
|
|
|
|
| ||||||
Diluted earnings attributable to Mylan N.V. ordinary shareholders (numerator): |
|
|
|
|
| ||||||
Net earnings attributable to Mylan N.V. ordinary shareholders | $ | 696.0 | |
| $ | 480.0 | |
| $ | 847.6 | |
Shares (denominator): |
|
|
|
|
| ||||||
Weighted average ordinary shares outstanding | 534.5 | |
| 513.0 | |
| 472.2 | | |||
Share-based awards and warrants | 2.2 | |
| 7.5 | |
| 25.2 | | |||
Total dilutive shares outstanding | 536.7 | |
| 520.5 | |
| 497.4 | | |||
Diluted earnings per ordinary share attributable to Mylan N.V. ordinary shareholders | $ | 1.30 | |
| $ | 0.92 | |
| $ | 1.70 | |
____________
(1) | As Mylan N.V. is the successor to Mylan Inc., the information set forth above refers to Mylan Inc. for periods prior to February 27, 2015, and to Mylan N.V. on and after February 27, 2015. |
Additional stock awards and restricted ordinary shares were outstanding during the years ended December 31, 2017 , 2016 and 2015 but were not included in the computation of diluted earnings per ordinary share for each respective period because the effect would be anti-dilutive. Excluded shares also include certain share-based compensation awards and restricted ordinary shares whose performance conditions had not been fully met. Such excluded shares and anti-dilutive awards represented 4.0 million , 7.8 million and 5.9 million shares for the years ended December 31, 2017 , 2016 and 2015 , respectively.
Share-Based Compensation. The fair value of share-based compensation is recognized as expense in the Consolidated Statements of Operations over the vesting period.
Derivatives. From time to time the Company may enter into derivative financial instruments (mainly foreign currency exchange forward contracts, interest rate swaps and purchased equity call options) designed to: 1) hedge the cash flows resulting from existing assets and liabilities and transactions expected to be entered into over the next 24 months in currencies other than the functional currency, 2) hedge the variability in interest expense on floating rate debt, 3) hedge the fair value of fixed-rate notes, 4) hedge against changes in interest rates that could impact future debt issuances, 5) hedge cash or share payments required on conversion of issued convertible notes, 6) hedge a net investment in a foreign operation, or 7) economically hedge the foreign currency exposure associated with the purchase price of non-U.S. acquisitions. Derivatives are recognized as assets or liabilities in the Consolidated Balance Sheets at their fair value. When the derivative instrument qualifies as a cash flow hedge, changes in the fair value are included in earnings or deferred through other comprehensive earnings depending on the nature and effectiveness of the offset. If a derivative instrument qualifies as a fair value hedge, the changes in the fair value, as well as the offsetting changes in the fair value of the hedged items, are generally included in interest expense. When such instruments do not qualify for hedge accounting the changes in fair value are recorded in the Consolidated Statements of Operations within other expense, net . Refer to Recent Accounting Pronouncements in this Note 2 for additional information.
Financial Instruments. The Company's financial instruments consist primarily of short-term and long-term debt, interest rate swaps, forward contracts and option contracts. The Company's financial instruments also include cash and cash equivalents as well as accounts and other receivables and accounts payable, the fair values of which approximate their carrying values. As a policy, the Company does not engage in speculative or leveraged transactions.
The Company uses derivative financial instruments for the purpose of hedging foreign currency and interest rate exposures, which exist as part of ongoing business operations, or to hedge cash, and have been used to hedge share payments required on conversion of issued convertible notes. In addition, the Company has designated certain long-term debt instruments as net investment hedges. The Company carries derivative instruments on the Consolidated Balance Sheets at fair value, determined by reference to market data such as forward rates for currencies, implied volatilities, and interest rate swap yield
97
Table of Contents
curves. The accounting for changes in the fair value of a derivative instrument depends on whether it has been designated and qualifies as part of a hedging relationship and, if so, the reason for holding it.
Recent Accounting Pronouncements. In August 2017, the FASB issued Accounting Standards Update 2017-12, Derivatives and Hedging (Topic 815): Targeted Improvements to Accounting for Hedging Activities . The objective of this update is to improve the financial reporting of hedging relationships to better portray the economic results of an entity's risk management activities in its financial statements. The amendments in this update also make certain targeted improvements to simplify the application of the hedge accounting guidance in current U.S. GAAP. This guidance is effective for fiscal years beginning after December 15, 2018, and interim periods within those fiscal years, with early adoption permitted, including adoption in any interim period. The Company has elected to early adopt this guidance as of January 1, 2018, and expects amounts related to certain hedging relationships will be classified in different line items in the Consolidated Statements of Operations in future periods. Otherwise, the Company believes that the adoption will not have a material impact on its consolidated financial statements.
In May 2017, the FASB issued Accounting Standards Update 2017-09, Compensation - Stock Compensation (Topic 718): Scope of Modification Accounting ("ASU 2017-09"), which amends the scope of modification accounting for share-based payment arrangements. ASU 2017-09 provides guidance on the types of changes to the terms or conditions of share-based payment awards to which an entity would be required to apply modification accounting under Accounting Standards Codification 718. Specifically, an entity would not apply modification accounting if the fair value, vesting conditions and classification of the awards are the same immediately before and after the modification. This guidance is effective for fiscal years, and interim periods within those fiscal years, beginning after December 15, 2017. The Company will adopt this guidance as of January 1, 2018 and will apply it on a prospective basis. The adoption is not expected to have a material impact on its consolidated financial statements.
In March 2017, the FASB issued Accounting Standards Update 2017-07, Compensation - Retirement Benefits (Topic 715): Improving the Presentation of Net Periodic Pension Cost and Net Periodic Postretirement Benefit Cost , which requires companies to disaggregate the service cost component from the other components of net benefit cost and disclose the amount of net benefit cost that is included in the income statement or capitalized in assets, by line item. This guidance requires companies to report the service cost component in the same line item(s) as other compensation costs and to report other pension-related costs (which include interest costs, amortization of pension-related costs from prior periods and gains or losses on plan assets) separately and exclude them from the subtotal of operating income. This guidance also allows only the service cost component to be eligible for capitalization when applicable. This guidance is effective for fiscal years, and interim periods within those fiscal years, beginning after December 15, 2017. This guidance should be applied retrospectively for the presentation of the service cost component and the other components of net periodic pension cost and net periodic postretirement benefit cost in the income statement and prospectively, on and after the effective date, for the capitalization of the service cost component of net periodic pension cost and net periodic postretirement benefit in assets. The update allows a practical expedient that permits a company to use the amounts disclosed in its pension and other postretirement plan note for the prior comparative periods as the estimation basis for applying the retrospective presentation requirements. The Company will adopt this guidance as of January 1, 2018 and the adoption is not expected to have a material impact on its consolidated financial statements. Presentation of the service cost component and other components of net periodic pension cost and net periodic postretirement benefit cost in the income statement will be retrospectively applied in future period disclosures.
In January 2017, the FASB issued Accounting Standards Update 2017-04, Intangibles - Goodwill and Other (Topic 350): Simplifying the Test for Goodwill Impairment ("ASU 2017-04"), which simplifies the subsequent measurement of goodwill by eliminating Step 2 from the goodwill impairment test which previously required measurement of any goodwill impairment loss by comparing the implied fair value of a reporting unit's goodwill with the carrying amount of that goodwill. Under ASU 2017-04, an entity should perform its annual, or interim, goodwill impairment test by comparing the fair value of a reporting unit with its carrying value and recognize an impairment charge for the amount by which the carrying amount exceeds the reporting unit's fair value; without exceeding the total amount of goodwill allocated to that reporting unit. This guidance is effective for fiscal years, and interim periods within those fiscal years, beginning after December 15, 2019, with early adoption permitted. The Company has elected to early adopt this guidance as of January 1, 2017 and is applying it on a prospective basis. The adoption did not have a material impact on its consolidated financial statements.
In January 2017, the FASB issued Accounting Standards Update 2017-01, Business Combinations (Topic 805) Clarifying the Definition of a Business , which narrows the definition of a business and requires an entity to evaluate if substantially all of the fair value of the gross assets acquired is concentrated in a single identifiable asset or a group of similar identifiable assets, which would not constitute the acquisition of a business. The guidance also requires a business to include at least one substantive process and narrows the definition of outputs. This guidance is effective for fiscal years beginning after December 15, 2017, and interim periods within those fiscal years, with early adoption permitted. The Company has elected to
98
Table of Contents
early adopt this guidance as of January 1, 2017 and is applying it on a prospective basis. The adoption did not have a material impact on its consolidated financial statements.
In November 2016, the FASB issued Accounting Standards Update 2016-18, Statement of Cash Flows (Topic 230) Restricted Cash ("ASU 2016-18"), which requires that the reconciliation of the beginning of period and end of period amounts shown in the statement of cash flows include restricted cash and restricted cash equivalents. If restricted cash is presented separately from cash and cash equivalents on the balance sheet, companies will be required to reconcile the amounts presented on the statement of cash flows to the amounts on the balance sheet. This guidance is effective for fiscal years beginning after December 15, 2017, and interim periods within those fiscal years. The Company will adopt this guidance at January 1, 2018 and the adoption is expected to change some of the presentation in our statement of cash flows, but not materially impact total cash flows from operating, investing or financing activities.
In October 2016, the FASB issued Accounting Standards Update 2016-16, Income Taxes (Topic 740) , which reduces the complexity in the accounting standards by allowing the recognition of current and deferred income taxes for an intra-entity asset transfer, other than inventory, when the transfer occurs. This guidance was early adopted on January 1, 2017 using the modified retrospective approach. The adoption did not have a material impact on the Company's consolidated financial statements.
In August 2016, the FASB issued Accounting Standards Update 2016-15, Statement of Cash Flows (Topic 230) , which clarifies how certain cash receipts and cash payments should be presented in the Statement of Cash Flows. This guidance is effective for fiscal years beginning after December 15, 2017, and interim periods within those fiscal years, with early adoption permitted using a retrospective transition approach. The Company will adopt this guidance at January 1, 2018 and does not believe the adoption of this guidance will have a material impact on its consolidated financial statements.
In March 2016, the FASB issued Accounting Standards Update 2016-09, Compensation - Stock Compensation (Topic 718) ("ASU 2016-09"), which simplifies the accounting for share-based compensation payments. The new standard requires all excess tax benefits and tax deficiencies (including tax benefits of dividends on share-based payment awards) to be recognized as income tax expense or benefit on the income statement. The tax effects of exercised or vested awards should be treated as discrete items in the reporting period in which they occur. ASU 2016-09 also addresses the classification of excess tax benefits in the statement of cash flows. As required, the Company applied the provisions of ASU 2016-09 on a prospective basis as of January 1, 2017 and the adoption did not have a material impact on its consolidated financial statements.
In February 2016, the FASB issued Accounting Standards Update 2016-02, Leases (Topic 840) , which provides principles for the recognition, measurement, presentation and disclosure of leases for both lessees and lessors. The new standard requires lessees to apply a dual approach, classifying leases as either finance or operating leases based on the principle of whether or not the lease is effectively a financed purchase by the lessee. This classification will determine whether lease expense is recognized based on an effective interest method or on a straight-line basis over the term of the lease. A lessee is also required to record a right-of-use asset and a lease liability for all leases with a term of greater than twelve months regardless of classification. Leases with a term of twelve months or less will be accounted for similar to existing guidance for operating leases. This guidance is effective for annual and interim periods beginning after December 15, 2018, with early adoption permitted. The Company is currently assessing the impact of the adoption of this guidance on its consolidated financial statements.
In January 2016, the FASB issued Accounting Standards Update 2016-01, Recognition and Measurement of Financial Assets and Financial Liabilities ("ASU 2016-01"), which requires that most equity investments be measured at fair value, with subsequent changes in fair value recognized in net income (other than those accounted for under equity method of accounting). The amendments in this update also require an entity to present separately in other comprehensive earnings the portion of the total change in the fair value of a liability resulting from a change in the instrument-specific credit risk when the entity has elected to measure the liability at fair value in accordance with the fair value option for financial instruments. ASU 2016-01 also impacts financial liabilities under the fair value option and the presentation and disclosure requirements for financial instruments. This guidance is effective for fiscal years, and interim periods within those years, beginning after December 15, 2017. The Company will adopt this guidance at January 1, 2018 and applicable balances recorded in other comprehensive income will be reclassified to opening retained earnings. The impact is not expected to have a material impact on the Company's consolidated financial statements.
99
Table of Contents
In May 2014, the FASB issued Accounting Standards Update 2014-09, Revenue from Contracts with Customers (updated with Accounting Standards Update 2015-14, 2016-08, 2016-10, 2016-12 and 2016-20), which revises accounting guidance on revenue recognition that will supersede nearly all existing revenue recognition guidance under U.S. GAAP. The core principle of this guidance is that an entity should recognize revenue when it transfers promised goods or services to customers in an amount that reflects the consideration which the entity expects to receive in exchange for those goods or services. This guidance also requires additional disclosure about the nature, amount, timing and uncertainty of revenue and cash flows arising from customer contracts, including significant judgments and changes in judgments and assets recognized from costs incurred to obtain or fulfill a contract. This guidance is effective for fiscal years beginning after December 15, 2017, and for interim periods within those fiscal years, and can be applied using a full retrospective or modified retrospective approach. The Company will adopt this standard as of January 1, 2018 and will elect to apply the modified retrospective transition approach. As a result, the Company expects to recognize revenue on certain arrangements upon the transfer of control of product shipments rather than upon sell-through by the customer, and will classify certain costs historically in cost of sales to contra revenue in future periods. The Company believes that adoption of this standard will not have a material impact of the Company's consolidated financial position nor is it expected to have a material impact on future net earnings. Based upon historical activity, the Company also expects total revenue and total cost of sales to be approximately $100 million lower in 2018 as a result of adoption.
3. | Acquisitions and Other Transactions |
Apicore Inc.
On October 3, 2017, the Company completed the acquisition of Apicore, Inc. ("Apicore"), a U.S. based developer and manufacturer of API for approximately $174.9 million , net of cash acquired, which includes estimated contingent consideration of approximately $4 million related to the potential $15 million payment contingent on the achievement of certain 2017 financial results of the acquired business. As of December 31, 2017 , Apicore did not achieve the financial results that would have triggered the contingent consideration payment. As a result, the Company recognized a gain of $4 million during the year ended December 31, 2017 from the reversal of the estimated contingent consideration, which was recognized as a component of litigation settlements and other contingencies, net in the Company's Consolidated Statements of Operations .
The preliminary allocation of the $174.9 million purchase price to the assets acquired and liabilities assumed for this business is as follows:
(In millions) |
| ||
Current assets (net of cash acquired) | $ | 6.5 | |
Identified intangible assets | 121.0 | | |
Goodwill | 92.2 | | |
Other assets | 1.9 | | |
Total assets acquired | 221.6 | | |
Current liabilities | (4.1 | ) | |
Deferred tax liabilities | (40.9 | ) | |
Other non-current liabilities | (1.7 | ) | |
Net assets acquired | $ | 174.9 | |
The preliminary fair value estimates for the assets acquired and liabilities assumed were based upon preliminary calculations, valuations and assumptions that are subject to change as the Company obtains additional information during the measurement period (up to one year from the acquisition date). The primary areas subject to change relate to the finalization of the working capital components, the valuation of intangible assets and income taxes.
100
Table of Contents
The acquisition of Apicore added a diversified portfolio of API products to the Company's existing portfolio. The identified intangible assets of $121.0 million are comprised of product rights and licenses with a weighted average useful life of seven years and includes in-process research and development with a fair value of $9 million at date of the acquisition. Significant assumptions utilized in the valuation of identified intangible assets were based on company specific information and projections which are not observable in the market and are thus considered Level 3 measurements as defined by U.S. GAAP. The goodwill of $92.2 million arising from the acquisition consisted largely of the value of the employee workforce and the expected value of products to be developed in the future. The final allocation of goodwill to Mylan's reportable segments has not been completed; however, the goodwill is expected to be allocated to the North America segment. None of the goodwill recognized in this transaction is currently expected to be deductible for income tax purposes. The acquisition did not have a material impact on the Company's results of operations since the acquisition date or on a pro forma basis for the twelve months ended December 31, 2017 and 2016 .
Meda AB
On February 10, 2016 , the Company issued an offer announcement under the Nasdaq Stockholm's Takeover Rules and the Swedish Takeover Act (collectively, the "Swedish Takeover Rules") setting forth a public offer to the shareholders of Meda to acquire all of the outstanding shares of Meda (the " Offer "), with an enterprise value, including the net debt of Meda , of approximately Swedish krona ("SEK" or "kr") 83.6 billion (based on a SEK/USD exchange rate of 8.4158 ) or $9.9 billion at announcement. On August 2, 2016 , the Company announced that the Offer was accepted by Meda shareholders holding an aggregate of approximately 343 million shares, representing approximately 94% of the total number of outstanding Meda shares, as of July 29, 2016 , and the Company declared the Offer unconditional. On August 5, 2016 , settlement occurred with respect to the Meda shares duly tendered by July 29, 2016 and, as a result, Meda became a controlled subsidiary of the Company. Pursuant to the terms of the Offer, each Meda shareholder that duly tendered Meda shares into the Offer received at settlement (1) in respect of 80% of the number of Meda shares tendered by such shareholder, 165kr in cash per Meda share, and (2) in respect of the remaining 20% of the number of Meda shares tendered by such shareholder, 0.386 of the Company's ordinary shares per Meda share (subject to treatment of fractional shares as described in the offer document published on June 16, 2016). The non-tendered shares were required to be acquired for cash through a compulsory acquisition proceeding, in accordance with the Swedish Companies Act (Sw. aktiebolagslagen (2005:551)). The compulsory acquisition proceeding price accrued interest as required by the Swedish Companies Act. Meda's shares were delisted from the Nasdaq Stockholm exchange on August 23, 2016.
On November 1, 2016, the Company made an offer to the remaining Meda shareholders to tender all their Meda shares for cash consideration of 161.31kr per Meda share (the "November Offer") to provide such remaining shareholders with an opportunity to sell their shares in Meda to the Company in advance of the automatic acquisition of their shares for cash in connection with the compulsory acquisition proceeding. At the end of November 2016, Mylan completed the acquisition of approximately 19 million Meda shares duly tendered for aggregate cash consideration of approximately $330.3 million . In March 2017, the Company received full legal ownership to the remaining non-tendered Meda shares in exchange for a cash payment of approximately $71.6 million , equal to the uncontested portion of the compulsory acquisition price plus statutory interest, and the Company's arrangement of a customary bank guarantee to secure the payment of any additional cash consideration that may be awarded to the former Meda shareholders in the compulsory acquisition proceeding. In October 2017, the arbitration tribunal awarded a price of 163.07kr per Meda share, plus statutory interest of 1.5% per annum, to the former Meda shareholders subject to the compulsory acquisition proceeding. On November 15, 2017 Mylan paid an additional approximately $0.9 million plus interest to such former Meda shareholders and, in accordance with Swedish law, the fees of the arbitrators and costs of other parties to the compulsory acquisition proceeding. As of December 31, 2017 , the Company maintained the bank guarantee as required by Swedish law. The bank guarantee was released on February 27, 2018, definitively concluding the compulsory acquisition proceeding.
On August 5, 2016, the total purchase price was approximately $6.92 billion , net of cash acquired, which includes cash consideration paid of approximately $5.28 billion , the issuance of approximately 26.4 million Mylan N.V. ordinary shares at a fair value of approximately $1.28 billion based on the closing price of the Company's ordinary shares on August 5, 2016, as reported by the NASDAQ Global Select Stock Market ("NASDAQ"), and an assumed liability of approximately $431.0 million related to the compulsory acquisition proceeding of the non-tendered Meda shares. In accordance with U.S. GAAP, the Company used the acquisition method of accounting to account for this transaction. Under the acquisition method of accounting, the assets acquired and liabilities assumed in the transaction have been recorded at their respective estimated fair values at the acquisition date. Acquisition related costs of approximately $182 million were incurred during the year ended December 31, 2016 , which were recorded as components of R&D expense, selling, general and administrative expense ("SG&A"), interest expense and other expense, net in the Consolidated Statements of Operations. These costs included approximately $128.6 million of losses on non-designated foreign currency forward and option contracts entered into in order to economically hedge the SEK purchase price of the Offer (explained further in Note 7 Financial Instruments and Risk
101
Table of Contents
Management ) and approximately $45.2 million of financing fees related to the termination of a 2016 bridge credit agreement entered into in connection with the Meda acquisition.
During the year ended December 31, 2017 , adjustments were made to the preliminary purchase price recorded at December 31, 2016 , and are reflected as "Measurement Period Adjustments" in the table below. The allocation of the $6.92 billion purchase price to the assets acquired and liabilities assumed for Meda is as follows:
(In millions) | Preliminary Purchase Price Allocation as of December 31, 2016 (a) |
| Measurement Period Adjustments (b) |
| Purchase Price Allocation as of December 31, 2017 (as adjusted) | ||||||
Current assets (excluding inventories and net of cash acquired) | $ | 482.5 | |
| $ | (9.2 | ) |
| $ | 473.3 | |
Inventories | 463.1 | |
| 5.0 | |
| 468.1 | | |||
Property, plant and equipment | 177.5 | |
| - | |
| 177.5 | | |||
Identified intangible assets | 8,060.7 | |
| - | |
| 8,060.7 | | |||
Goodwill | 3,676.9 | |
| 7.7 | |
| 3,684.6 | | |||
Other assets | 9.5 | |
| (0.7 | ) |
| 8.8 | | |||
Total assets acquired | 12,870.2 | |
| 2.8 | |
| 12,873.0 | | |||
Current liabilities | (1,105.9 | ) |
| (4.9 | ) |
| (1,110.8 | ) | |||
Long-term debt, including current portion | (2,864.6 | ) |
| - | |
| (2,864.6 | ) | |||
Deferred tax liabilities | (1,613.9 | ) |
| 0.7 | |
| (1,613.2 | ) | |||
Pension and other postretirement benefits | (322.3 | ) |
| - | |
| (322.3 | ) | |||
Other noncurrent liabilities | (42.4 | ) |
| 1.4 | |
| (41.0 | ) | |||
Net assets acquired | $ | 6,921.1 | |
| $ | - | |
| $ | 6,921.1 | |
(a) | As previously reported in the Company's December 31, 2016 Annual Report on Form 10-K, as amended. |
(b) | The measurement period adjustments recorded during the year ended December 31, 2017 are primarily related to certain income tax adjustments and working capital related estimates to reflect facts and circumstances that existed as of the acquisition date. |
The acquisition of Meda created a more diversified and expansive portfolio of branded and generic medicines along with a strong and growing portfolio of OTC products. The combined company has a balanced global footprint with significant scale in key geographic markets, particularly the U.S. and Europe. The acquisition of Meda also expanded our presence in key emerging markets, including, China, Russia, Turkey, and Mexico, and in countries in South East Asia, and the Middle East, which complemented Mylan's existing presence in India, Brazil and Africa (including South Africa). The Company recorded a step-up in the fair value of inventory of approximately $107 million at the acquisition date, which was fully amortized as of December 31, 2016 .
The identified intangible assets of $8.06 billion are comprised of product rights and licenses that have a weighted average useful life of 20 years . Significant assumptions utilized in the valuation of identified intangible assets were based on company specific information and projections which are not observable in the market and are thus considered Level 3 measurements as defined by U.S. GAAP. The goodwill of $3.68 billion arising from the acquisition consisted largely of the value of the employee workforce and the expected value of products to be developed in the future. Approximately $3.4 billion of goodwill recognized was allocated to the Europe segment, with approximately $290 million allocated to the North America segment, and approximately $6 million allocated to the Rest of World segment. None of the goodwill recognized in this transaction is currently expected to be deductible for income tax purposes.
The settlement of the Offer constituted an Acceleration Event (as defined in the Rottapharm Agreement referred to below) under the Sale and Purchase Agreement, dated as of July 30, 2014 (the "Rottapharm Agreement"), among Fidim S.r.l., Meda Pharma S.p.A and Meda, the occurrence of which accelerated an unconditional deferred purchase price payment of approximately $308 million ( €275 million ) relating to Meda's acquisition of Rottapharm S.p.A. which otherwise would have been payable in January 2017. The amount was paid during the year ended December 31, 2016.
102
Table of Contents
The operating results of Meda have been included in the Company's Consolidated Statements of Operations since the acquisition date. The total revenues of Meda for the period from the acquisition date to December 31, 2016 were $833.9 million and the net loss, net of tax, was $208.7 million , which includes the effects of the purchase accounting adjustments and acquisition related costs.
Renaissance Topicals Business
On June 15, 2016 , the Company completed the acquisition of the non-sterile, topicals-focused business (the " Topicals Business ") of Renaissance Acquisition Holdings, LLC (" Renaissance ") for approximately $1.0 billion in cash at closing, including amounts deposited into escrow for potential contingent payments, subject to customary adjustments. The Topicals Business provided the Company with a complementary portfolio of commercial and pipeline products and an established U.S. sales and marketing infrastructure targeting dermatologists. The Topicals Business also provided an integrated manufacturing and development platform. In accordance with U.S. GAAP, the Company used the acquisition method of accounting to account for this transaction. Under the acquisition method of accounting, the assets acquired and liabilities assumed in the transaction were recorded at their respective estimated fair values at the acquisition date. The U.S. GAAP purchase price was $972.7 million , which includes estimated contingent consideration of approximately $16 million related to the potential $50 million payment contingent on the achievement of certain 2016 financial targets. The contingent consideration was resolved in the fourth quarter of 2017 for a net payment of approximately $40 million and the Company recognized a charge of $23.5 million included as a component of litigation settlements and other contingencies, net in the Company's Consolidated Statements of Operations .
The allocation of the $972.7 million purchase price to the assets acquired and liabilities assumed for the Topicals Business is as follows:
(In millions) |
| ||
Current assets (excluding inventories) | $ | 57.7 | |
Inventories | 74.2 | | |
Property, plant and equipment | 54.8 | | |
Identified intangible assets | 467.0 | | |
In-process research and development | 275.0 | | |
Goodwill | 318.6 | | |
Other assets | 0.1 | | |
Total assets acquired | 1,247.4 | | |
Current liabilities | (74.2 | ) | |
Deferred tax liabilities | (194.6 | ) | |
Other noncurrent liabilities | (5.9 | ) | |
Net assets acquired | $ | 972.7 | |
The acquisition of the Topicals Business broadened the Company's dermatological portfolio. The amount allocated to IPR&D represents an estimate of the fair value of purchased in-process technology for research projects that, as of the closing date of the acquisition, had not reached technological feasibility and had no alternative future use. The fair value of IPR&D of $275.0 million was based on the excess earnings method, which utilizes forecasts of expected cash inflows (including estimates for ongoing costs) and other contributory charges. A discount rate of 12.5% was utilized to discount net cash inflows to present values. IPR&D is accounted for as an indefinite-lived intangible asset and will be subject to impairment testing until completion or abandonment of the projects. Upon successful completion and launch of each product, the Company will make a determination of the estimated useful life of the individual IPR&D asset and amounts will be allocated to product rights and licenses in intangible assets. The acquired IPR&D projects are in various stages of completion and the estimated costs to complete these projects total approximately $38 million , which is expected to be incurred through 2019. There are risks and uncertainties associated with the timely and successful completion of the projects included in IPR&D, and no assurances can be given that the underlying assumptions used to estimate the fair value of IPR&D will not change or the timely completion of each project to commercial success will occur.
The identified intangible assets of $467.0 million are comprised of $454.0 million of product rights and licenses that have a weighted average useful life of 14 years and $13.0 million of contract manufacturing agreements that have a weighted average useful life of five years . Significant assumptions utilized in the valuation of identified intangible assets were based on
103
Table of Contents
company specific information and projections which are not observable in the market and are thus considered Level 3 measurements as defined by U.S. GAAP.
The goodwill of $318.6 million arising from the acquisition consisted largely of the value of the employee workforce and the expected value of products to be developed in the future. All of the goodwill was assigned to the North America segment. None of the goodwill recognized in this transaction is currently expected to be deductible for income tax purposes. Acquisition related costs of approximately $3.6 million were incurred during the year ended December 31, 2016 related to this transaction, which were recorded as a component of SG&A in the Consolidated Statements of Operations. The acquisition did not have a material impact on the Company's results of operations since the acquisition date or on a pro forma basis for the twelve months ended December 31, 2016 and 2015.
Jai Pharma Limited
On November 20, 2015, the Company completed the acquisition of certain women's healthcare businesses from Famy Care Limited ("Jai Pharma Limited") through its wholly owned subsidiary Mylan Laboratories Limited for a cash payment of $750 million plus additional contingent payments of up to $50 million for the filing for approval with, and receipt of approval from, the U.S. Food and Drug Administration ("FDA") of a product under development with Jai Pharma Limited .
In accordance with U.S. GAAP, the Company used the acquisition method of accounting to account for this transaction. Under the acquisition method of accounting, the assets acquired and liabilities assumed in the transaction were recorded at their respective estimated fair values at the acquisition date. The U.S. GAAP purchase price was $711.1 million , which excludes the $50 million paid into escrow at closing that was contingent upon at least one of two former principal shareholders of Jai Pharma Limited continuing to provide consulting services to the acquired business for the two -year post-closing period which was treated as compensation expense over the service period. This escrow amount was released to the former owners in November 2017. The U.S. GAAP purchase price also excludes $7 million of working capital and other adjustments and includes estimated contingent consideration at the date of acquisition of approximately $18 million related to the $50 million contingent payment.
The allocation of the $711.1 million purchase price to the assets acquired and liabilities assumed for Jai Pharma Limited is as follows:
(In millions) |
| ||
Current assets (excluding inventories) | $ | 28.6 | |
Inventories | 4.9 | | |
Property, plant and equipment | 17.2 | | |
Identified intangible assets | 437.0 | | |
In-process research and development | 98.0 | | |
Goodwill | 323.9 | | |
Other assets | 0.7 | | |
Total assets acquired | 910.3 | | |
Current liabilities | (14.5 | ) | |
Deferred tax liabilities | (184.7 | ) | |
Net assets acquired | $ | 711.1 | |
The acquisition of Jai Pharma Limited significantly broadened the Company's women's healthcare portfolio and strengthened its technical and manufacturing capabilities. The amount allocated to IPR&D represents an estimate of the fair value of purchased in-process technology for research projects that, as of the closing date of the acquisition, had not reached technological feasibility and had no alternative future use. The fair value of IPR&D was based on the excess earnings method, which utilizes forecasts of expected cash inflows (including estimates for ongoing costs) and other contributory charges. Disco unt rates of 10% and 11% were utilized to discount net cash inflows to present values. IPR&D is accounted for as an indefinite-lived intangible asset and will be subject to impairment testing until completion or abandonment of the projects. Upon successful completion and launch of each product, the Company will make a determination of the estimated useful life of the individual IPR&D asset and amounts will be allocated to product rights and licenses in intangible assets. The acquired IPR&D projects are in various stages of completion and the estimated costs to complete these products are expected to be incurred through 2019. There are risks and uncertainties associated with the timely and successful completion of the projects
104
Table of Contents
included in IPR&D, and no assurances can be given that the underlying assumptions used to estimate the fair value of IPR&D will not change or the timely completion of each project to commercial success will occur.
The identified intangible assets of $437.0 million are comprised of product rights and licenses that have weighted average useful lives of nine years . Significant assumptions utilized in the valuation of identified intangible assets were based on company specific information and projections which are not observable in the market and are thus considered Level 3 measurements as defined by U.S. GAAP. The goodwill of $323.9 million arising from the acquisition consisted largely of the value of the employee workforce and the value of products to be developed in the future. A majority of the goodwill was assigned to Mylan's Rest of World segment. During the year ended December 31, 2016, the Company received approvals from the relevant Indian regulatory authorities to legally merge its wholly owned subsidiary, Jai Pharma Limited, into Mylan Laboratories Limited. The merger resulted in the recognition of a deferred tax asset of $150 million for the tax deductible goodwill in excess of the book goodwill with a corresponding benefit to income tax provision for the year ended December 31, 2016. Acquisition related costs of approximately $8.5 million were incurred during the year ended December 31, 2015, which were recorded as a component of SG&A expense in the Consolidated Statements of Operations . On a pro forma basis, the acquisition did not have a material impact on the Company's results of operations for the year ended December 31, 2015.
EPD Business
On July 13, 2014 , Mylan N.V. , Mylan Inc., and Moon of PA Inc. entered into a definitive agreement with Abbott Laboratories (" Abbott ") to acquire Abbott's' non-U.S. developed markets specialty and branded generics business (the " EPD Business ") in an all-stock transaction (the "EPD Transaction"). On November 4, 2014 , Mylan N.V. , Mylan Inc., Moon of PA Inc. and Abbott entered into an amended and restated definitive agreement implementing the transaction. The EPD Transaction closed on February 27, 2015 (the " EPD Transaction Closing Date "), after receiving approval from Mylan Inc.'s shareholders on January 29, 2015 . At closing, Abbott transferred the EPD Business to Mylan N.V. , in exchange for 110 million ordinary shares of Mylan N.V. Immediately after the transfer of the EPD Business , Mylan Inc. merged with Moon of PA Inc., an indirect wholly owned subsidiary of Mylan N.V. , with Mylan Inc. becoming an indirect wholly owned subsidiary of Mylan N.V. In addition, Mylan Inc.'s outstanding common stock was exchanged on a one to one basis for Mylan N.V. ordinary shares. Following the EPD Transaction , Mylan N.V. 's corporate seat is located in Amsterdam, the Netherlands , its principal executive offices are located in Hatfield, Hertfordshire, England and Mylan N.V. group's global headquarters are located in Canonsburg, Pennsylvania .
The acquired EPD Business included more than 100 specialty and branded generic pharmaceutical products in five major therapeutic areas and included several patent protected, novel and/or hard-to-manufacture products. As a result of the acquisition, Mylan has significantly expanded and strengthened its product portfolio in Europe, Japan, Canada, Australia and New Zealand.
The purchase price for Mylan N.V. of the acquired EPD Business , which was on a debt-free basis, was $6.31 billion base d on the closing price of Mylan Inc.'s stock as of the EPD Transaction Closing Date , as reported by NASDAQ . At the closing of the EPD Transaction , former shareholders of Mylan Inc. owned approximately 78% of Mylan N.V. 's ordinary shares and certain affiliates of Abbott (the "Abbott Shareholders") owned approximately 22% of Mylan N.V. 's ordinary shares. On the EPD Transaction Closing Date , Mylan N.V. , Abbott and the Abbott Shareholders entered into a shareholder agreement. Following an underwritten public offering of the Abbott Shareholders of a portion of the Mylan N.V. ordinary shares held by them, which offering closed on April 6, 2015, the Abbott Shareholders collectively owned approximately 13% of Mylan N.V. 's outstanding ordinary shares. In March 2017, the Abbott Shareholders sold 44 million of Mylan N.V.'s ordinary shares, taking their ownership interest to 4.8% and in January 2018, the Abbott Shareholders sold their remaining Mylan N.V. shares. The Company and Abbott engage in commercial transactions for the supply of products. In addition, Abbott provided certain transitional services to Mylan which ended in 2017.
105
Table of Contents
In accordance with U.S. GAAP, the Company used the acquisition method of accounting to account for the EPD Transaction with Mylan Inc. being treated as the accounting acquirer. Under the acquisition method of accounting, the assets acquired and liabilities assumed in the EPD Transaction were recorded at their respective estimated fair values at the EPD Transaction Closing Date . The purchase price was finalized during the fourth quarter of 2015. The allocation of the $6.31 billion purchase price (as valued on the EPD Transaction Closing Date ) to the assets acquired and liabilities assumed for the acquired EPD Business is as follows:
(In millions) |
| ||
Accounts receivable | $ | 443.8 | |
Inventories | 198.5 | | |
Other current assets | 43.0 | | |
Property, plant and equipment | 140.8 | | |
Identified intangible assets | 4,843.0 | | |
Goodwill | 1,341.0 | | |
Other assets | 41.0 | | |
Total assets acquired | 7,051.1 | | |
Current liabilities | (268.9 | ) | |
Deferred tax liabilities | (421.9 | ) | |
Other non-current liabilities | (54.5 | ) | |
Net assets acquired | $ | 6,305.8 | |
The identified intangible assets of $4.84 billion are comprised of $4.52 billion of product rights and licenses that have weighted average useful lives of 13 years and $320 million of contractual rights that have weighted average useful lives ranging from two to five years . Significant assumptions utilized in the valuation of identified intangible assets were based on company specific information and projections which are not observable in the market and are thus considered Level 3 measurements as defined by U.S. GAAP. The goodwill of $1.34 billion arising from the acquisition primarily relates to the expected synergies of the combined company and the value of the employee workforce. A majority of the goodwill was assigned to the North America segment. Goodwill of approximately $486 million is currently expected to be deductible for income tax purposes. Acquisition related costs of approximately $86.1 million were incurred during the year ended December 31, 2015, which were recorded as a component of SG&A in the Consolidated Statements of Operations .
The operating results of the acquired EPD Business have been included in the Company's Consolidated Statements of Operations since February 27, 2015 . The revenues of the acquired EPD Business for the period from the acquisition date to December 31, 2015 were $1.47 billion and the net loss, net of tax, was $62.4 million . The net loss, net of tax, includes the effects of the purchase accounting adjustments and acquisition related costs.
106
Table of Contents
Unaudited Pro Forma Financial Results
The following table presents supplemental unaudited pro forma information for the acquisitions of Meda, as if it had occurred on January 1, 2015 and the EPD Business, as if it had occurred on January 1, 2014. The unaudited pro forma results reflect certain adjustments related to past operating performance and acquisition accounting adjustments, such as increased amortization expense based on the fair value of assets acquired, the impact of transaction costs and the related income tax effects. The unaudited pro forma results do not include any anticipated synergies which may be achievable subsequent to acquisition of Meda or the EPD Business. Accordingly, the unaudited pro forma results are not necessarily indicative of the results that actually would have occurred, nor are they indicative of the future operating results of Mylan N.V.
| Year Ended December 31, | ||||||
(Unaudited, in millions, except per share amounts) | 2016 |
| 2015 | ||||
Total revenues | $ | 12,376.0 | |
| $ | 11,930.0 | |
Net earnings | $ | 560.6 | |
| $ | 604.1 | |
Earnings per ordinary share: |
|
|
| ||||
Basic | $ | 1.06 | |
| $ | 1.17 | |
Diluted | $ | 1.05 | |
| $ | 1.11 | |
Weighted average ordinary shares outstanding: |
|
|
| ||||
Basic | 528.7 | |
| 516.9 | | ||
Diluted | 536.2 | |
| 542.1 | | ||
Other Transactions
As part of the Meda acquisition, the Company acquired the in-licensed rights to Betadine in certain European markets. These rights were set to expire on December 31, 2017. Under the licensing agreement, Meda had a binding option to acquire a perpetual license for the rights to Betadine under certain conditions. In October 2017, the Company finalized an agreement to acquire the perpetual license. An estimated liability of approximately $300 million for the purchase of these rights was accrued for on the Meda acquisition opening balance sheet. On January 2, 2018, the Company paid the amounts due to acquire the perpetual license.
On December 25, 2017, the Company entered into an agreement to reacquire certain intellectual property rights and marketing authorizations related to a product commercialized in Japan for $90.0 million payable in the second quarter of 2018. The Company has recognized a liability in its Condensed Consolidated Balance Sheet as of December 31, 2017 for the reacquisition of these rights. The Company accounted for this transaction as an asset acquisition and the asset will be amortized over a useful life of five years .
On November 30, 2017, the Company entered into an exclusive license and supply agreement with Natco Pharma Limited ("Natco") for API related to the Company's Glatiramer Acetate Injection 40 mg/mL product for $22.5 million paid at closing and $29.5 million due through 2019. The license grants the Company the exclusive right to license, market and sell the product in North America and certain other territories. The Company may also be required to make additional payments contingent upon the achievement of certain financial results of the product. The intangible asset recognized totaled $52 million and is being amortized over a useful life of 15 months .
On September 29, 2017, the Company completed the acquisition of intellectual property rights and marketing authorizations related to a product in certain markets for $40 million . The Company accounted for this transaction as an asset acquisition and the asset is being amortized over a useful life of five years .
On June 19, 2017, the Company completed the acquisition of a portfolio of four generic pharmaceutical products in the U.S. The acquisition price was $256.7 million and the Company accounted for this transaction as an asset acquisition. The intangible asset recognized totaled $252.5 million with the remaining assets primarily consisting of receivables. The intangible asset is being amortized over a useful life of seven years.
On June 2, 2017, the Company completed the acquisition of additional intellectual property rights and marketing authorizations in certain rest of world markets for a product that the Company previously licensed in certain European markets. The acquisition price was $128.0 million and the Company accounted for this transaction as an asset acquisition. The intangible asset is being amortized over a useful life of five years .
107
Table of Contents
On March 29, 2017, the Company announced that it had completed its acquisition of the global rights to the Cold-EEZE® brand cold remedy line from ProPhase Labs, Inc. for approximately $50 million in cash. The Company accounted for this transaction as an asset acquisition and the asset is being amortized over a useful life of 15 years .
On February 14, 2017, the Company entered into a joint development and marketing agreement for a respiratory product that resulted in approximately $50 million in R&D expense in the first quarter of 2017.
During the year ended December 31, 2016, the Company entered into an agreement to acquire a marketed pharmaceutical product for an upfront payment of approximately $57.9 million in cash. The Company accounted for this transaction as an asset acquisition and is amortizing the product over a weighted useful life of five years .
In December 2015, the Company entered into an agreement to acquire certain European intellectual property rights and marketing authorizations. The purchase price was $202.5 million including approximately $2.5 million of transaction costs. The Company accounted for this transaction as an asset acquisition. The Company paid $10 million in cash at the closing of the transaction. The Company paid approximately $165 million during 2016 and the remaining $25 million was paid in 2017. The asset is being amortized over a useful life of five years .
4. | Balance Sheet Components |
Selected balance sheet components consist of the following:
Accounts receivable, net
(In millions) | December 31, 2017 |
| December 31, 2016 | ||||
Trade receivables, net | $ | 3,173.1 | |
| $ | 3,015.4 | |
Other receivables | 439.3 | |
| 295.5 | | ||
Accounts receivable, net | $ | 3,612.4 | |
| $ | 3,310.9 | |
Trade receivables, net includes certain sales allowances totaling $1.98 billion and $2.05 billion at December 31, 2017 and 2016 , respectively. See Note 2 Summary of Significant Accounting Policies for further discussion of such allowances. Total allowances for doubtful accounts were $75.3 million and $59.0 million at December 31, 2017 and 2016 , respectively. Mylan performs ongoing credit evaluations of its customers and generally does not require collateral. Approximately 35% and 45% of the accounts receivable balances represent amounts due from three customers at December 31, 2017 and 2016 , respectively.
Inventories
(In millions) | December 31, 2017 |
| December 31, 2016 | ||||
Raw materials | $ | 895.5 | |
| $ | 783.4 | |
Work in process | 384.7 | |
| 436.0 | | ||
Finished goods | 1,262.5 | |
| 1,237.0 | | ||
Inventories | $ | 2,542.7 | |
| $ | 2,456.4 | |
Inventory reserves totaled $171.0 million and $174.6 million at December 31, 2017 and 2016 , respectively. Included as a component of cost of sales is expense related to the net realizable value of inventories of $229.3 million , $195.7 million and $221.4 million for the years ended December 31, 2017 , 2016 and 2015 , respectively.
108
Table of Contents
Prepaid expenses and other current assets
(In millions) | December 31, 2017 |
| December 31, 2016 | ||||
Prepaid expenses | $ | 119.8 | |
| $ | 169.1 | |
Restricted cash | 77.8 | |
| 148.1 | | ||
Available-for-sale securities | 76.7 | |
| 83.7 | | ||
Fair value of financial instruments | 88.9 | |
| 62.2 | | ||
Trading securities | 33.9 | |
| 29.6 | | ||
Other current assets | 369.0 | |
| 263.7 | | ||
Prepaid expenses and other current assets | $ | 766.1 | |
| $ | 756.4 | |
Prepaid expenses consists primarily of prepaid rent, insurance and other individually insignificant items. At December 31, 2017 , restricted cash principally relates to amounts deposited in escrow for potential contingent consideration payments related to the Company's acquisition of Agila Specialties ("Agila").
Property, plant and equipment, net
(In millions) | December 31, 2017 |
| December 31, 2016 | ||||
Machinery and equipment | $ | 2,414.5 | |
| $ | 2,227.9 | |
Buildings and improvements | 1,191.7 | |
| 1,106.5 | | ||
Construction in progress | 252.9 | |
| 328.8 | | ||
Land and improvements | 143.1 | |
| 144.7 | | ||
Gross property, plant and equipment | 4,002.2 | |
| 3,807.9 | | ||
Accumulated depreciation | 1,663.1 | |
| 1,485.7 | | ||
Property, plant and equipment, net | $ | 2,339.1 | |
| $ | 2,322.2 | |
Capitalized software costs included on our Consolidated Balance Sheets were $143.0 million and $145.4 million , net of accumulated depreciation, at December 31, 2017 and 2016 , respectively. The Company periodically reviews the estimated useful lives of assets and makes adjustments when appropriate. Depreciation expense was approximately $287.6 million , $259.4 million and $186.1 million for the years ended December 31, 2017 , 2016 and 2015 , respectively.
Other assets
(In millions) | December 31, 2017 |
| December 31, 2016 | ||||
Equity method investments, clean energy investments | $ | 226.0 | |
| $ | 320.6 | |
Equity method investments, Sagent Agila | - | |
| 75.8 | | ||
Other long-term assets | 79.6 | |
| 172.2 | | ||
Other assets | $ | 305.6 | |
| $ | 568.6 | |
Trade accounts payable
(In millions) | December 31, 2017 |
| December 31, 2016 | ||||
Accounts payable | $ | 976.0 | |
| $ | 939.5 | |
Other payables | 476.5 | |
| 408.6 | | ||
Trade accounts payable | $ | 1,452.5 | |
| $ | 1,348.1 | |
109
Table of Contents
Other current liabilities
(In millions) | December 31, 2017 |
| December 31, 2016 | ||||
Accrued sales allowances | $ | 818.0 | |
| $ | 809.0 | |
Payroll and employee benefit plan accruals | 404.6 | |
| 409.8 | | ||
Legal and professional accruals, including litigation accruals | 241.1 | |
| 720.4 | | ||
Contingent consideration | 167.8 | |
| 256.9 | | ||
Restructuring | 91.5 | |
| 138.6 | | ||
Compulsory acquisition proceeding | - | |
| 70.2 | | ||
Equity method investments, clean energy investments | 56.7 | |
| 64.7 | | ||
Accrued interest | 42.3 | |
| 41.0 | | ||
Fair value of financial instruments | 31.1 | |
| 15.3 | | ||
Other | 1,111.4 | |
| 732.6 | | ||
Other current liabilities | $ | 2,964.5 | |
| $ | 3,258.5 | |
Included in legal and professional accruals at December 31, 2016 was $465 million for a settlement with the U.S. Department of Justice and other government agencies related to the classification of the EpiPen® Auto-Injector and EpiPen Jr® Auto-Injector (collectively, " EpiPen® Auto-Injector ") for purposes of the Medicaid Drug Rebate Program (the "Medicaid Drug Rebate Program Settlement"). The Medicaid Drug Rebate Program Settlement was paid during 2017, as discussed further in Note 18 Litigation .
On March 31, 2017, the Company announced that Meridian Medical Technologies ("Meridian"), a Pfizer Inc. ("Pfizer") company that manufactures the EpiPen® Auto-Injector , expanded a voluntary recall of select lots of EpiPen® Auto-Injector and EpiPen Jr® Auto-Injector to include additional lots distributed in the U.S. and other markets in consultation with the FDA (the " EpiPen® Auto-Injector Recall"). This recall was conducted as a result of the receipt of two previously disclosed reports outside of the U.S. of the failure to activate the device due to a potential defect in a supplier component. Both reports were related to the single lot that was previously recalled. The expanded voluntary recall was initiated in the U.S. and also extended to additional markets in Europe, Asia, North and South America. The Company is replacing recalled devices at no cost to the consumer. Estimated costs to Mylan related to product recalls are based on a formal campaign soliciting return of the product and are accrued when they are deemed to be probable and can be reasonably estimated. As of December 31, 2017 , the Company recorded an accrual for certain costs of the recall but there can be no assurance that future costs related to the recall will not exceed amounts recorded. In addition, Meridian is contractually obligated to reimburse Mylan for costs related to the EpiPen® Auto-Injector Recall, and the Company has recorded an asset for the recovery of such costs.
Other long-term obligations
(In millions) | December 31, 2017 |
| December 31, 2016 | ||||
Employee benefit liabilities | $ | 408.2 | |
| $ | 396.7 | |
Equity method investments, clean energy investments | 171.8 | |
| 302.3 | | ||
Contingent consideration | 285.9 | |
| 307.7 | | ||
Tax contingencies | 237.7 | |
| 239.3 | | ||
Other | 132.1 | |
| 112.6 | | ||
Other long-term obligations | $ | 1,235.7 | |
| $ | 1,358.6 | |
110
Table of Contents
5. | Equity Method Investments |
The Company has five equity method investments in limited liability companies that own refined coal production plants (the "clean energy investments"), whose activities qualify for income tax credits under Section 45 of the U.S. Internal Revenue Code of 1986, as amended (the "Code"). The Company does not consolidate these entities as we have determined that we are not the primary beneficiary of these entities and do not have the power to individually direct the activities of these entities. Accordingly, these investments are accounted for under the equity method of accounting. For each of the clean energy investments, the Company has entered into notes payable with the respective project operator, which in part will be paid to the operator as certain production levels are met. As a result of a decline in current and expected future production levels at certain of the facilities, during 2017 , the Company impaired its investment balance and other assets by approximately $47 million and reduced the related long-term obligations for these investments by approximately $89 million resulting in a net gain of $42 million which was recognized as a component of the net loss of the equity method investments in the Consolidated Statement of Operations.
The carrying values and respective balance sheet locations of the Company's clean energy investments were as follows at December 31, 2017 and 2016 , respectively:
(In millions) | December 31, 2017 |
| December 31, 2016 | ||||
Other assets | $ | 226.0 | |
| $ | 320.6 | |
Total liabilities | 228.5 | |
| 367.0 | | ||
Included in other current liabilities | 56.7 | |
| 64.7 | | ||
Included in other long-term obligations | 171.8 | |
| 302.3 | | ||
Summarized financial information, in the aggregate, of the Company's equity method investments on a 100% basis as of December 31, 2017 and 2016 and for the years ended December 31, 2017 , 2016 and 2015 are as follows:
(In millions) | December 31, 2017 |
| December 31, 2016 | ||||
Current assets | $ | 56.4 | |
| $ | 75.6 | |
Noncurrent assets | 18.2 | |
| 12.3 | | ||
Total assets | 74.6 | |
| 87.9 | | ||
Current liabilities | 56.1 | |
| 50.7 | | ||
Noncurrent liabilities | 3.6 | |
| 2.6 | | ||
Total liabilities | 59.7 | |
| 53.3 | | ||
Net assets | $ | 14.9 | |
| $ | 34.6 | |
| Year Ended December 31, | ||||||||||
(In millions) | 2017 |
| 2016 |
| 2015 | ||||||
Total revenues | $ | 473.0 | |
| $ | 589.4 | |
| $ | 774.6 | |
Gross (loss) profit | (12.8 | ) |
| (13.2 | ) |
| (11.3 | ) | |||
Operating and non-operating expense | 22.3 | |
| 22.2 | |
| 25.6 | | |||
Net loss | $ | (35.1 | ) |
| $ | (35.4 | ) |
| $ | (36.9 | ) |
The Company's net losses from equity method investments includes amortization expense related to the excess of the cost basis of the Company's investment to the underlying assets of each individual investee. For the years ended December 31, 2017 , 2016 and 2015 , the Company's share of the net loss of the equity method investments was $58.0 million including the net gain, $112.8 million , and $105.1 million , respectively, which was recognized as a component of other expense, net in the Consolidated Statements of Operations. The Company recognizes the income tax credits and benefits from the clean energy investments as part of its provision for income taxes.
The Company held a 50% interest in Sagent Agila LLC ("Sagent Agila"), which was a joint venture established to develop, manufacture and distribute certain generic injectable products in the U.S. In April 2017, the Company and Sagent Pharmaceuticals Inc. ("Sagent") finalized an agreement to dissolve the joint venture. Under the terms of the agreement, Mylan received Sagent's interest in the joint venture in exchange for an approved product right. The assets in the joint venture
111
Table of Contents
consisted entirely of product rights for commercialized generic injectables. As a result of this transaction, during the year ended December 31, 2017 , the Company recognized a loss of $5.7 million as a component of net losses from equity method investments. Additionally, during the year ended December 31, 2017 , the Company received a dividend payment of $8.4 million from Sagent Agila, which reduced the carrying value of the equity investment. During 2017, the Company reclassified its investment in Sagent Agila to product rights and licenses and is amortizing the amount over the remaining estimated useful lives of the products.
6. | Goodwill and Other Intangible Assets |
The changes in the carrying amount of goodwill for the years ended December 31, 2017 and 2016 are as follows:
(In millions) | North America Segment |
| Europe Segment |
| Rest of World Segment |
| Total | ||||||||
Balance at December 31, 2015: |
|
|
|
|
|
|
| ||||||||
Goodwill | $ | 3,178.7 | |
| $ | 1,000.5 | |
| $ | 1,585.9 | |
| $ | 5,765.1 | |
Accumulated impairment losses | (385.0 | ) |
| - | |
| - | |
| (385.0 | ) | ||||
| 2,793.7 | |
| 1,000.5 | |
| 1,585.9 | |
| 5,380.1 | | ||||
Acquisitions and measurement period adjustments (1) | 818.6 | |
| 2,993.0 | |
| 190.6 | |
| 4,002.2 | | ||||
Foreign currency translation | (6.9 | ) |
| (134.4 | ) |
| (9.1 | ) |
| (150.4 | ) | ||||
| 3,605.4 | |
| 3,859.1 | |
| 1,767.4 | |
| 9,231.9 | | ||||
Balance at December 31, 2016: |
|
|
|
|
|
|
| ||||||||
Goodwill | 3,990.4 | |
| 3,859.1 | |
| 1,767.4 | |
| 9,616.9 | | ||||
Accumulated impairment losses | (385.0 | ) |
| - | |
| - | |
| (385.0 | ) | ||||
| 3,605.4 | |
| 3,859.1 | |
| 1,767.4 | |
| 9,231.9 | | ||||
Acquisitions | 92.2 | |
| - | |
| - | |
| 92.2 | | ||||
Reclassifications (2) | (200.1 | ) |
| 382.2 | |
| (182.1 | ) |
| - | | ||||
Measurement period adjustments | - | |
| 7.7 | |
| - | |
| 7.7 | | ||||
Divestiture | - | |
| (1.3 | ) |
| - | |
| (1.3 | ) | ||||
Foreign currency translation | 52.1 | |
| 719.4 | |
| 103.7 | |
| 875.2 | | ||||
| 3,549.6 | |
| 4,967.1 | |
| 1,689.0 | |
| 10,205.7 | | ||||
Balance at December 31, 2017: |
|
|
|
|
|
|
| ||||||||
Goodwill | 3,934.6 | |
| 4,967.1 | |
| 1,689.0 | |
| 10,590.7 | | ||||
Accumulated impairment losses | (385.0 | ) |
| - | |
| - | |
| (385.0 | ) | ||||
| $ | 3,549.6 | |
| $ | 4,967.1 | |
| $ | 1,689.0 | |
| $ | 10,205.7 | |
____________
(1) | In 2016, includes measurement period adjustments related to the acquisition of Jai Pharma Limited and the recognition of goodwill related to the acquisitions of Meda and the Topicals Business totaling approximately $6.7 million , $3.68 billion and $318.6 million , respectively. |
(2) | The reclassifications relate to the allocation of goodwill for the Meda acquisition. |
112
Table of Contents
Intangible assets consist of the following components at December 31, 2017 and 2016 :
(In millions) | Weighted Average Life (Years) |
| Original Cost |
| Accumulated Amortization |
| Net Book Value | ||||||
December 31, 2017 |
|
|
|
|
|
|
| ||||||
Amortized intangible assets: |
|
|
|
|
|
|
| ||||||
Product rights and licenses | 15 |
| $ | 19,762.9 | |
| $ | 5,373.7 | |
| $ | 14,389.2 | |
Patents and technologies | 20 |
| 116.6 | |
| 113.1 | |
| 3.5 | | |||
Other (1) | 6 |
| 459.2 | |
| 419.3 | |
| 39.9 | | |||
|
|
| 20,338.7 | |
| 5,906.1 | |
| 14,432.6 | | |||
In-process research and development |
|
| 813.2 | |
| - | |
| 813.2 | | |||
|
|
| $ | 21,151.9 | |
| $ | 5,906.1 | |
| $ | 15,245.8 | |
December 31, 2016 |
|
|
|
|
|
|
| ||||||
Amortized intangible assets: |
|
|
|
|
|
|
| ||||||
Product rights and licenses | 15 |
| $ | 16,968.4 | |
| $ | 3,585.7 | |
| $ | 13,382.7 | |
Patents and technologies | 20 |
| 116.6 | |
| 108.5 | |
| 8.1 | | |||
Other (1) | 6 |
| 465.9 | |
| 330.0 | |
| 135.9 | | |||
|
|
| 17,550.9 | |
| 4,024.2 | |
| 13,526.7 | | |||
In-process research and development |
|
| 921.1 | |
| - | |
| 921.1 | | |||
|
|
| $ | 18,472.0 | |
| $ | 4,024.2 | |
| $ | 14,447.8 | |
(1) | Other intangibles consist principally of customer lists, contractual rights and other contracts. |
Product rights and licenses are primarily comprised of the products marketed at the time of acquisition. These product rights and licenses relate to numerous individual products, the net book value of which, by therapeutic franchise, is as follows:
(In millions) | December 31, 2017 |
| December 31, 2016 | ||||
Central Nervous System and Anesthesia | $ | 2,453.7 | |
| $ | 2,172.0 | |
Dermatology | 2,393.0 | |
| 2,070.2 | | ||
Gastroenterology | 2,050.0 | |
| 1,906.2 | | ||
Diabetes and Metabolism | 1,425.6 | |
| 1,395.7 | | ||
Cardiovascular | 1,779.5 | |
| 1,718.0 | | ||
Respiratory and Allergy | 1,769.5 | |
| 1,691.0 | | ||
Infectious Disease | 494.8 | |
| 490.6 | | ||
Oncology | 380.1 | |
| 413.4 | | ||
Women's Healthcare | 371.4 | |
| 371.4 | | ||
Immunology | 301.5 | |
| 284.9 | | ||
Other (1) | 970.1 | |
| 869.3 | | ||
| $ | 14,389.2 | |
| $ | 13,382.7 | |
(1) | Other consists of numerous therapeutic classes, none of which individually exceeds 5% of total product rights and licenses. |
113
Table of Contents
Amortization expense and intangible asset impairment charges, which are included as a component of amortization expense, which is classified primarily within cost of sales in the Consolidated Statements of Operations, for the years ended December 31, 2017 , 2016 and 2015 was as follows:
| Year ended December 31, | ||||||||||
(In millions) | 2017 |
| 2016 |
| 2015 | ||||||
Intangible asset amortization expense | $ | 1,437.4 | |
| $ | 1,195.3 | |
| $ | 814.7 | |
Intangible asset impairment charges | 80.8 | |
| 68.3 | |
| 31.3 | | |||
Total intangible asset amortization expense (including impairment charges) | $ | 1,518.2 | |
| $ | 1,263.6 | |
| $ | 846.0 | |
Indefinite-lived intangibles, such as the Company's IPR&D assets, are tested at least annually for impairment, but they may be tested whenever certain impairment indicators are present. Impairment is determined to exist when the fair value is less than the carrying value of the assets being tested. In addition, the Company monitors long-lived intangible assets for potential triggering events or changes in circumstances that would indicate that the carrying amount of the asset may not be recoverable. During the year ended December 31, 2017 , the Company recorded impairment charges on certain product rights and licenses and IPR&D assets of approximately $6.2 million and $74.6 million , respectively. During the year ended December 31, 2016 , the Company recorded impairment charges on certain product rights and licenses and IPR&D assets of approximately $18.4 million and $49.9 million , respectively. During the year ended December 31, 2015 , the Company recorded no impairment charges on product rights and licenses and approximately $31.3 million impairment charges on IPR&D assets. The impairment charges recognized in 2017 , 2016 and 2015 were recorded as components of amortization expense. The assessment for impairment of long-lived intangible assets is based upon our ability to recover the carrying value of the long-lived assets by analyzing the expected future undiscounted pre-tax cash flows specific to an asset grouping.
In December 2011, the Company completed the acquisition of the exclusive worldwide rights to develop, manufacture and commercialize a generic equivalent to GlaxoSmithKline's Advair® Diskus and Seretide® Diskus incorporating Pfizer's proprietary dry powder inhaler delivery platform (the "respiratory delivery platform"). The Company accounted for this transaction as a purchase of a business and utilized the acquisition method of accounting. In conjunction with the Company's Generic Drug User Fee Agreement goal date, on March 28, 2017, the Company received a complete response letter from the FDA regarding its Abbreviated New Drug Application ("ANDA") for the respiratory delivery platform. As of December 31, 2017 , the Company has an IPR&D asset of $347.2 million . The Company performed an analysis and valuation of the IPR&D asset using a discounted cash flow model. The model contained certain key assumptions including: the expected product launch date, the number of competitors, the timing of competition and a discount factor based on an industry specific weighted average cost of capital. Based on the analysis performed, the Company determined that the IPR&D asset was not impaired at December 31, 2017 . Additionally, a fair value adjustment was required for the related contingent consideration liability resulting in a gain of approximately $93.5 million for the year ended December 31, 2017 based upon changes to assumptions relating to the timing of the product launch along with other competitive and market factors. The fair value of the contingent consideration liability was $360.7 million and was determined based upon detailed valuations employing the income approach which utilized Level 3 inputs, as defined in Note 7 - Financial Instruments and Risk Management . Resolution of the matters with the FDA, market conditions and other factors may result in significant future changes in the projections and assumptions utilized in the discounted cash flow model, which could lead to material adjustments to the amounts recorded for IPR&D and contingent consideration.
The Company performed its annual impairment review of certain IPR&D assets during the second, third, and fourth quarters of December 31, 2017 . This review of IPR&D assets principally related to assets acquired as part of the Topicals Business acquisition in 2016, the Jai Pharma Limited acquisition in 2015, the Agila acquisition in December 2013, the respiratory delivery platform acquisition in December 2011 and the Bioniche Pharma Holdings Limited acquisition in September 2010. The impairment charges recorded resulted from the Company's estimate of the fair value of the assets, which was based upon updated forecasts and commercial development plans, compared with the assigned fair values at the acquisition date. The fair value was determined based upon detailed valuations employing the income approach which utilized Level 3 inputs, as defined in Note 7 Financial Instruments and Risk Management . The fair value of IPR&D was calculated as the present value of the estimated future net cash flows using a market rate of return. The assumptions inherent in the estimated future cash flows include, among other things, the impact of changes to the development programs, the projected development and regulatory time frames and the current competitive environment. Discount rates ranging between 8.4% and 10.5% , 8.5% and 11.9% , and 9.8% and 11.8% were utilized in the valuations performed during the years ended December 31, 2017 , 2016 and 2015 respectively. Changes to any of the Company's assumptions including changes to or abandonment of development programs, regulatory timelines, or the competitive environment related to IPR&D assets could lead to future material impairment charges.
114
Table of Contents
The Company has also performed its annual goodwill impairment test as of April 1, 2017 on a quantitative basis for its four reporting units, North America Generics , North America Specialty , Europe and Rest of World . As of the date of our annual impairment test, the allocation of the Company's total goodwill was as follows: North America Generics $2.89 billion , North America Specialty $350.0 million , Europe $4.30 billion and Rest of World $1.79 billion . The fair value of the North America Generics, North America Specialty and Rest of World reporting units was substantially in excess of the respective unit's carrying value. For the Europe reporting unit, the estimated fair value exceeded its carrying value by approximately $800 million or 6% . The excess fair value over the carrying value declined from the prior year primarily as a result of an increase in the discount rate utilized in the income approach from 8.5% to 9.0% and an increase in the estimated tax rate from 22% to 24% . Additionally, the net assets acquired as part of the Meda acquisition, the majority of which were allocated to the Europe reporting unit, were included in the April 1, 2017 impairment test for the first time. As it relates to the income approach for the Europe reporting unit at April 1, 2017, the Company forecasted cash flows for the next 5 years . During the forecast period, the revenue compound annual growth rate was approximately 4% . A terminal value year was calculated with a 2% revenue growth rate applied. Under the market-based approach, we utilized an estimated range of market multiples of 9.0 to 10.5 times EBITDA plus a control premium of 15% . If all other assumptions are held constant, a reduction in the terminal value growth rate by 2% or an increase in discount rate by 1.5% would result in an impairment charge for the Europe reporting unit.
In estimating each reporting unit's fair value, the Company performed an extensive valuation analysis, utilizing both income and market-based approaches, except for the North America Specialty reporting unit where the fair value was estimated utilizing the income approach. The determination of the fair value of the reporting units requires the Company to make significant estimates and assumptions that affect the reporting unit's expected future cash flows. These estimates and assumptions, utilizing Level 3 inputs, primarily include, but are not limited to, market multiples, control premiums, the discount rate, terminal growth rates, operating income before depreciation and amortization, and capital expenditures forecasts. Due to the inherent uncertainty involved in making these estimates, actual results could differ from those estimates. In addition, changes in underlying assumptions, especially as it relates to the key assumptions detailed, could have a significant impact on the fair value of the reporting units.
Intangible asset amortization expense for the years ended December 31, 2018 through 2022 is estimated to be as follows:
(In millions) |
| ||
2018 | $ | 1,450 | |
2019 | 1,358 | | |
2020 | 1,211 | | |
2021 | 1,131 | | |
2022 | 1,060 | | |
7. | Financial Instruments and Risk Management |
The Company is exposed to certain financial risks relating to its ongoing business operations. The primary financial risks that are managed by using derivative instruments are foreign currency risk, interest rate risk and equity risk.
Foreign Currency Risk Management
In order to manage foreign currency risk, the Company enters into foreign exchange forward contracts to mitigate risk associated with changes in spot exchange rates of mainly non-functional currency denominated assets or liabilities. The foreign exchange forward contracts are measured at fair value and reported as current assets or current liabilities on the Consolidated Balance Sheets . Any gains or losses on the foreign exchange forward contracts are recognized in earnings in the period incurred in the Consolidated Statements of Operations.
The Company has also entered into forward contracts to hedge forecasted foreign currency denominated sales from certain international subsidiaries. These contracts are designated as cash flow hedges to manage foreign currency transaction risk and are measured at fair value and reported as current assets or current liabilities on the Consolidated Balance Sheets . Any changes in fair value are included in earnings or deferred through accumulated other comprehensive earnings ("AOCE"), depending on the nature and effectiveness of the offset. Any ineffectiveness in a cash flow hedging relationship is recognized immediately in earnings in the Consolidated Statements of Operations .
During the year ended December 31, 2017 , the Company designated certain Euro borrowings as a hedge of its investment in certain Euro-functional currency subsidiaries in order to manage foreign currency translation risk. The notional
115
Table of Contents
amount of the net investment hedges was €1.9 billion and consisted of €1.0 billion aggregate principal amount of the 2.250% Euro Senior Notes due 2024 (the "2024 Euro Notes"), €750 million aggregate principal amount of 3.125% Euro Senior Notes due 2028 (the "2028 Euro Notes") and €104 million of the €750 million aggregate principal amount of the 1.250% Euro Senior Notes due 2020 (the "2020 Euro Notes").
Borrowings designated as net investment hedges are marked to market using the current spot exchange rate as of the end of the period, with gains and losses included in the foreign currency translation component of AOCE until the sale or substantial liquidation of the underlying net investments. The Company recorded no ineffectiveness from its net investment hedges for the year ended December 31, 2017 . In addition, the Company manages the related foreign exchange risk of the €500 million aggregate principal amount of Floating Rate Senior Notes due 2018 (the "2018 Floating Rate Euro Notes"), €500 million aggregate principal amount of the Floating Rate Senior Notes due 2020 (the "2020 Floating Rate Euro Notes") and the remaining portion of the 2020 Euro Notes through certain Euro denominated financial assets and forward contracts.
Interest Rate Risk Management
The Company enters into interest rate swaps in order to manage interest rate risk associated with the Company's fixed- and floating-rate debt. These derivative instruments are measured at fair value and reported as current assets or current liabilities on the Consolidated Balance Sheets .
Cash Flow Hedging Relationships
The Company's interest rate swaps designated as cash flow hedges fix the interest rate on a portion of the Company's variable-rate debt or hedge part of the Company's interest rate exposure associated with the variability in the future cash flows attributable to changes in interest rates. Any changes in fair value are included in earnings or deferred through AOCE, depending on the nature and effectiveness of the offset. Any ineffectiveness in a cash flow hedging relationship is recognized immediately in earnings in the Consolidated Statements of Operations .
Following the acquisition of Meda, the Company designated certain interest rate swaps with a notional amount of €750 million as cash flow hedges. In the fourth quarter of 2016, the Company repaid the related debt instrument and terminated these swaps.
In anticipation of issuing fixed-rate debt, the Company may use treasury rate locks or forward starting interest rate swaps that are designated as cash flow hedges. In September 2015, the Company entered into a series of forward starting swaps to hedge against changes in interest rates related to future debt issuances. These swaps were designated as cash flow hedges of expected future issuances of long-term bonds. The Company executed $500 million of notional value swaps with an effective date of June 2016 and an additional $500 million of notional value swaps with an effective date of November 2016. Both sets of swaps had a maturity of ten years . As discussed further in Note 8 Debt , during the second quarter of 2016, the Company issued $2.25 billion in an aggregate principal amount of 3.950% Senior Notes due 2026 (the "2026 Senior Notes") and the Company terminated these swaps. As a result of this termination, the Company recorded losses of $64.9 million in AOCE, which are being amortized over the life of the 2026 Senior Notes. In addition, during the year ended December 31, 2016, approximately $2.1 million of hedge ineffectiveness related to these forward starting swaps was recorded in interest expense on the Consolidated Statements of Operations .
In August 2014, the Company entered into a series of forward starting swaps to hedge against changes in interest rates that could impact future debt issuances. These swaps were designed as cash flow hedges of expected future issuances of long-term bonds. The Company executed $575 million of notional value swaps with an effective date of September 2015. These swaps had a maturity of ten years . In September 2015, the Company terminated these swaps, and as a result of this termination, the Company has recognized losses, net of tax, of approximately $22.4 million , which were recorded in AOCE. During the fourth quarter of 2015, the Company issued $500 million aggregate principal amount of 3.000% Senior Notes due December 2018 and $500 million aggregate principal amount of 3.750% Senior Notes due December 2020. The Company recognized approximately $11.8 million of the loss, net of tax, previously recorded to AOCE in other expense, net during the year ended December 31, 2015. The remaining loss, net of tax, of approximately $10.6 million will be amortized over the remaining lives of the 3.000% Senior Notes due December 2018 and 3.750% Senior Notes due December 2020.
In April 2013, the Company entered into a series of forward starting swaps to hedge against changes in interest rates that could impact future debt issuances. These swaps were designated as cash flow hedges of expected future issuances of long-term bonds. The Company executed $1 billion of notional value swaps with an effective date of August 2015. These swaps had a maturity of ten years . In August 2015, the Company terminated these swaps. As a result of this termination, the Company incurred losses, net of tax, of approximately $32.9 million , which were recorded in AOCE in the third quarter of 2015. During
116
Table of Contents
the fourth quarter of 2015, the balance in AOCE was recognized in other expense, net as the forecasted transaction was no longer probable of occurring.
Fair Value Hedging Relationships
The Company's interest rate swaps designated as fair value hedges convert the fixed rate on a portion of the Company's fixed-rate senior notes to a variable rate. Any changes in the fair value of these derivative instruments, as well as the offsetting change in fair value of the portion of the fixed-rate debt being hedged, is included in interest expense. In December 2013, the Company entered into interest rate swaps with a notional value of $750 million that were designated as hedges of the Company's 3.125% Senior Notes due 2023. The variable rate was 1.78% at December 31, 2017 . The total notional amount of the Company's interest rate swaps on fixed-rate debt was $750 million as of December 31, 2017 and 2016 .
The Company regularly reviews the creditworthiness of its financial counterparties and does not expect to incur a significant loss from failure of any counterparties to perform under any agreements. The Company is not subject to any obligations to post collateral under derivative instrument contracts. Certain derivative instrument contracts entered into by the Company are governed by master agreements, which contain credit-risk-related contingent features that would allow the counterparties to terminate the contracts early and request immediate payment should the Company trigger an event of default on other specified borrowings. The Company records all derivative instruments on a gross basis in the Consolidated Balance Sheets . Accordingly, there are no offsetting amounts that net assets against liabilities.
The Effect of Derivative Instruments on the
Consolidated Balance Sheets
Fair Values of Derivative Instruments
Derivatives Designated as Hedging Instruments
| Asset Derivatives | ||||||||||
| December 31, 2017 |
| December 31, 2016 | ||||||||
(In millions) | Balance Sheet Location |
| Fair Value |
| Balance Sheet Location |
| Fair Value | ||||
Interest rate swaps | Prepaid expenses and other current assets |
| $ | 16.2 | |
| Prepaid expenses and other current assets |
| $ | 26.2 | |
Foreign currency forward contracts | Prepaid expenses and other current assets |
| 63.4 | |
| Prepaid expenses and other current assets |
| 21.9 | | ||
Total |
| $ | 79.6 | |
|
|
| $ | 48.1 | | |
The Effect of Derivative Instruments on the
Consolidated Balance Sheets
Fair Values of Derivative Instruments
Derivatives Not Designated as Hedging Instruments
| Asset Derivatives | ||||||||||
| December 31, 2017 |
| December 31, 2016 | ||||||||
(In millions) | Balance Sheet Location |
| Fair Value |
| Balance Sheet Location |
| Fair Value | ||||
Foreign currency forward contracts | Prepaid expenses and other current assets |
| $ | 9.3 | |
| Prepaid expenses and other current assets |
| $ | 14.0 | |
Total |
| $ | 9.3 | |
|
|
| $ | 14.0 | | |
| Liability Derivatives | ||||||||||
| December 31, 2017 |
| December 31, 2016 | ||||||||
(In millions) | Balance Sheet Location |
| Fair Value |
| Balance Sheet Location |
| Fair Value | ||||
Foreign currency forward contracts | Other current liabilities |
| $ | 31.1 | |
| Other current liabilities |
| $ | 15.3 | |
Total |
| $ | 31.1 | |
|
|
| $ | 15.3 | | |
117
Table of Contents
The Effect of Derivative Instruments on the
Consolidated Statements of Operations
Derivatives in Fair Value Hedging Relationships
| Location of (Loss) or Gain Recognized in Earnings on Derivatives | Amount of (Loss) Gain Recognized in Earnings on Derivatives | ||||||||||
| Year Ended December 31, | |||||||||||
(In millions) | 2017 |
| 2016 |
| 2015 | |||||||
Interest rate swaps | Interest expense | $ | (10.0 | ) |
| $ | (10.0 | ) |
| $ | 5.9 | |
Total | $ | (10.0 | ) |
| $ | (10.0 | ) |
| $ | 5.9 | | |
| Location of Gain or (Loss) Recognized in Earnings on Hedged Items | Amount of Gain or (Loss) Recognized in Earnings on Hedging Items | ||||||||||
| Year Ended December 31, | |||||||||||
(In millions) | 2017 |
| 2016 |
| 2015 | |||||||
2023 Senior Notes (3.125% coupon) | Interest expense | $ | 10.0 | |
| $ | 10.0 | |
| $ | (5.9 | ) |
Total | $ | 10.0 | |
| $ | 10.0 | |
| $ | (5.9 | ) | |
The Effect of Derivative Instruments on the
Consolidated Statements of Comprehensive Earnings
Derivatives in Net Investment Hedging Relationships
| Amount of Loss Recognized in AOCE (Net of Tax) on Derivatives (Effective Portion) | ||||||||||
| Year Ended December 31, | ||||||||||
(In millions) | 2017 |
| 2016 |
| 2015 | ||||||
Foreign currency borrowings and forward contracts | $ | (238.4 | ) |
| $ | (1.4 | ) |
| $ | - | |
Total | $ | (238.4 | ) |
| $ | (1.4 | ) |
| $ | - | |
The Effect of Derivative Instruments on the
Consolidated Statements of Comprehensive Earnings
Derivatives in Cash Flow Hedging Relationships
| Amount of (Loss) or Gain Recognized in AOCE (Net of Tax) on Derivatives (Effective Portion) | ||||||||||
| Year Ended December 31, | ||||||||||
(In millions) | 2017 |
| 2016 |
| 2015 | ||||||
Foreign currency forward contracts | $ | 28.1 | |
| $ | (27.5 | ) |
| $ | (44.5 | ) |
Interest rate swaps | - | |
| (38.7 | ) |
| 13.5 | | |||
Total | $ | 28.1 | |
| $ | (66.2 | ) |
| $ | (31.0 | ) |
The Effect of Derivative Instruments on the
Consolidated Statements of Operations
Derivatives in Cash Flow Hedging Relationships
| Location of Loss Reclassified from AOCE into Earnings (Effective Portion) | Amount of Loss Reclassified from AOCE into Earnings (Effective Portion) | ||||||||||
| Year Ended December 31, | |||||||||||
(In millions) | 2017 |
| 2016 |
| 2015 | |||||||
Foreign currency forward contracts | Net sales | $ | 1.1 | |
| $ | (44.3 | ) |
| $ | (40.3 | ) |
Interest rate swaps | Interest expense | (7.3 | ) |
| (8.7 | ) |
| (0.8 | ) | |||
Total | $ | (6.2 | ) |
| $ | (53.0 | ) |
| $ | (41.1 | ) | |
118
Table of Contents
| Location of Gain Excluded from the Assessment of Hedge Effectiveness | Amount of Gain Excluded from the Assessment of Hedge Effectiveness | ||||||||||
| Year Ended December 31, | |||||||||||
(In millions) | 2017 |
| 2016 |
| 2015 | |||||||
Foreign currency forward contracts | Other expense, net | $ | (3.3 | ) |
| $ | 33.5 | |
| $ | 45.1 | |
Total | $ | (3.3 | ) |
| $ | 33.5 | |
| $ | 45.1 | | |
At December 31, 2017 , the Company expects that approximately $7.0 million of pre-tax net gains on cash flow hedges will be reclassified from AOCE into earnings during the next twelve months .
The Effect of Derivative Instruments on the
Consolidated Statements of Operations
Derivatives Not Designated as Hedging Instruments
| Location of (Loss) or Gain Recognized in Earnings on Derivatives | Amount of (Loss) or Gain Recognized in Earnings on Derivatives | ||||||||||
| Year Ended December 31, | |||||||||||
(In millions) | 2017 |
| 2016 |
| 2015 | |||||||
Foreign currency option and forward contracts | Other expense, net | $ | 47.7 | |
| $ | (104.5 | ) |
| $ | 41.7 | |
Interest rate swaps | Other expense, net | - | |
| - | |
| (71.2 | ) | |||
Cash conversion feature of Cash Convertible Notes | Other expense, net | - | |
| - | |
| 1,853.5 | | |||
Purchased cash convertible note hedge | Other expense, net | - | |
| - | |
| (1,853.5 | ) | |||
Total | $ | 47.7 | |
| $ | (104.5 | ) |
| $ | (29.5 | ) | |
Fair Value Measurement
Fair value is based on the price that would be received from the sale of an identical asset or paid to transfer an identical liability in an orderly transaction between market participants at the measurement date. In order to increase consistency and comparability in fair value measurements, a fair value hierarchy has been established that prioritizes observable and unobservable inputs used to measure fair value into three broad levels, which are described below:
Level 1: | Quoted prices (unadjusted) in active markets that are accessible at the measurement date for identical assets or liabilities. The fair value hierarchy gives the highest priority to Level 1 inputs. |
Level 2: | Observable market-based inputs other than quoted prices in active markets for identical assets or liabilities. |
Level 3: | Unobservable inputs are used when little or no market data is available. The fair value hierarchy gives the lowest priority to Level 3 inputs. |
In determining fair value, the Company utilizes valuation techniques that maximize the use of observable inputs and minimize the use of unobservable inputs to the extent possible, as well as considers counterparty credit risk in its assessment of fair value.
119
Table of Contents
Financial assets and liabilities carried at fair value are classified in the tables below in one of the three categories described above:
| December 31, 2017 | ||||||||||||||
(In millions) | Level 1 |
| Level 2 |
| Level 3 |
| Total | ||||||||
Recurring fair value measurements |
|
|
|
|
|
|
| ||||||||
Financial Assets | |||||||||||||||
Cash equivalents: |
|
|
|
|
|
|
| ||||||||
Money market funds | $ | 8.4 | |
| $ | - | |
| $ | - | |
| $ | 8.4 | |
Total cash equivalents | 8.4 | |
| - | |
| - | |
| 8.4 | | ||||
Trading securities: |
|
|
|
|
|
|
| ||||||||
Equity securities - exchange traded funds | 33.9 | |
| - | |
| - | |
| 33.9 | | ||||
Total trading securities | 33.9 | |
| - | |
| - | |
| 33.9 | | ||||
Available-for-sale fixed income investments: |
|
|
|
|
|
|
| ||||||||
Corporate bonds | - | |
| 16.5 | |
| - | |
| 16.5 | | ||||
U.S. Treasuries | - | |
| 7.4 | |
| - | |
| 7.4 | | ||||
Agency mortgage-backed securities | - | |
| 4.1 | |
| - | |
| 4.1 | | ||||
Asset backed securities | - | |
| 2.1 | |
| - | |
| 2.1 | | ||||
Other | - | |
| 1.4 | |
| - | |
| 1.4 | | ||||
Total available-for-sale fixed income investments | - | |
| 31.5 | |
| - | |
| 31.5 | | ||||
Available-for-sale equity securities: |
|
|
|
|
|
|
| ||||||||
Marketable securities | 45.2 | |
| - | |
| - | |
| 45.2 | | ||||
Total available-for-sale equity securities | 45.2 | |
| - | |
| - | |
| 45.2 | | ||||
Foreign exchange derivative assets | - | |
| 72.7 | |
| - | |
| 72.7 | | ||||
Interest rate swap derivative assets | - | |
| 16.2 | |
| - | |
| 16.2 | | ||||
Total assets at recurring fair value measurement | $ | 87.5 | |
| $ | 120.4 | |
| $ | - | |
| $ | 207.9 | |
Financial Liabilities | |||||||||||||||
Foreign exchange derivative liabilities | $ | - | |
| $ | 31.1 | |
| $ | - | |
| $ | 31.1 | |
Contingent consideration | - | |
| - | |
| 453.7 | |
| 453.7 | | ||||
Total liabilities at recurring fair value measurement | $ | - | |
| $ | 31.1 | |
| $ | 453.7 | |
| $ | 484.8 | |
120
Table of Contents
| December 31, 2016 | ||||||||||||||
(In millions) | Level 1 |
| Level 2 |
| Level 3 |
| Total | ||||||||
Recurring fair value measurements |
|
|
|
|
|
|
| ||||||||
Financial Assets | |||||||||||||||
Cash equivalents: |
|
|
|
|
|
|
| ||||||||
Money market funds | $ | 433.7 | |
| $ | - | |
| $ | - | |
| $ | 433.7 | |
Total cash equivalents | 433.7 | |
| - | |
| - | |
| 433.7 | | ||||
Trading securities: |
|
|
|
|
|
|
| ||||||||
Equity securities - exchange traded funds | 29.6 | |
| - | |
| - | |
| 29.6 | | ||||
Total trading securities | 29.6 | |
| - | |
| - | |
| 29.6 | | ||||
Available-for-sale fixed income investments: |
|
|
|
|
|
|
| ||||||||
Corporate bonds | - | |
| 17.5 | |
| - | |
| 17.5 | | ||||
U.S. Treasuries | - | |
| 6.0 | |
| - | |
| 6.0 | | ||||
Agency mortgage-backed securities | - | |
| 4.0 | |
| - | |
| 4.0 | | ||||
Asset backed securities | - | |
| 1.6 | |
| - | |
| 1.6 | | ||||
Other | - | |
| 2.3 | |
| - | |
| 2.3 | | ||||
Total available-for-sale fixed income investments | - | |
| 31.4 | |
| - | |
| 31.4 | | ||||
Available-for-sale equity securities: |
|
|
|
|
|
|
| ||||||||
Marketable securities | 52.3 | |
| - | |
| - | |
| 52.3 | | ||||
Total available-for-sale equity securities | 52.3 | |
| - | |
| - | |
| 52.3 | | ||||
Foreign exchange derivative assets | - | |
| 35.9 | |
| - | |
| 35.9 | | ||||
Interest rate swap derivative assets | - | |
| 26.2 | |
| - | |
| 26.2 | | ||||
Total assets at recurring fair value measurement | $ | 515.6 | |
| $ | 93.5 | |
| $ | - | |
| $ | 609.1 | |
Financial Liabilities | |||||||||||||||
Foreign exchange derivative liabilities | $ | - | |
| $ | 15.3 | |
| $ | - | |
| $ | 15.3 | |
Contingent consideration | - | |
| - | |
| 564.6 | |
| 564.6 | | ||||
Total liabilities at recurring fair value measurement | $ | - | |
| $ | 15.3 | |
| $ | 564.6 | |
| $ | 579.9 | |
For financial assets and liabilities that utilize Level 2 inputs, the Company utilizes both direct and indirect observable price quotes, including the LIBOR yield curve, foreign exchange forward prices, and bank price quotes. For the years ended December 31, 2017 and 2016 , there were no transfers between Level 1 and 2 of the fair value hierarchy. Below is a summary of valuation techniques for Level 1 and Level 2 financial assets and liabilities:
• | Cash equivalents - valued at observable net asset value prices. |
• | Trading securities - valued at the active quoted market price from broker or dealer quotations or transparent pricing sources at the reporting date. |
• | Available-for-sale fixed income investments - valued at the quoted market price from broker or dealer quotations or transparent pricing sources at the reporting date. |
• | Available-for-sale equity securities - valued using quoted stock prices from public exchanges at the reporting date. |
• | Interest rate swap derivative assets and liabilities - valued using the LIBOR/EURIBOR yield curves at the reporting date. Counterparties to these contracts are highly rated financial institutions. |
• | Foreign exchange derivative assets and liabilities - valued using quoted forward foreign exchange prices and spot rates at the reporting date. Counterparties to these contracts are highly rated financial institutions. |
121
Table of Contents
Contingent Consideration
The fair value measurement of contingent consideration is determined using Level 3 inputs. The Company's contingent consideration represents a component of the total purchase consideration for the acquisitions of the respiratory delivery platform, Agila , Jai Pharma Limited , the Topicals Business, Apicore and certain other acquisitions. The measurement is calculated using unobservable inputs based on the Company's own assumptions and significant unobservable inputs in the valuation include the probability and timing of future development and commercial milestones and future profit sharing payments. When valuing the contingent consideration related to the respiratory delivery platform and Jai Pharma Limited, the value of the obligations are derived from a probability assessment based on expectations of when certain milestones or profit sharing payments occur which are discounted using a market rate of return. At December 31, 2017 and 2016 , discount rates ranging from 0.5% to 10.0% were utilized in such valuations. Significant changes in unobservable inputs could result in material changes to the contingent consideration liability.
On November 1, 2016, the Company and Strides Arcolab Limited ("Strides Arcolab") agreed on a settlement of substantially all outstanding regulatory, warranty and indemnity claims (the "Strides Settlement") related to the acquisition of Agila. As a result of the settlement, the Company received approximately $80 million of cash in the fourth quarter of 2016, which was previously classified as restricted cash. Approximately $110 million will be paid to either settle these pre-acquisition claims or be remitted to Strides. As such, in addition to the $20 million of contingent consideration recorded upon acquisition, the Company recorded expense of approximately $90 million , of which $74.8 million represented additional contingent consideration, which is included in litigation settlements and other contingencies, net in the Consolidated Statements of Operations for the year ended December 31, 2016 .
A rollforward of the activity in the Company's fair value of contingent consideration from December 31, 2015 to December 31, 2017 is as follows:
(In millions) | Current Portion (1) |
| Long-Term Portion (2) |
| Total Contingent Consideration | ||||||
Balance at December 31, 2015 | $ | 35.0 | |
| $ | 491.4 | |
| $ | 526.4 | |
Acquisitions | 21.6 | |
| 1.2 | |
| 22.8 | | |||
Payments | (44.4 | ) |
| (0.5 | ) |
| (44.9 | ) | |||
Reclassifications | 169.8 | |
| (169.8 | ) |
| - | | |||
Accretion | 0.1 | |
| 41.7 | |
| 41.8 | | |||
Fair value loss (gain) (3) | 74.8 | |
| (55.9 | ) |
| 18.9 | | |||
Foreign currency translation | - | |
| (0.4 | ) |
| (0.4 | ) | |||
Balance at December 31, 2016 | $ | 256.9 | |
| $ | 307.7 | |
| $ | 564.6 | |
Acquisitions | - | |
| - | |
| - | | |||
Payments | (77.3 | ) |
| (0.2 | ) |
| (77.5 | ) | |||
Reclassifications | 27.0 | |
| (27.0 | ) |
| - | | |||
Accretion | - | |
| 25.9 | |
| 25.9 | | |||
Fair value loss (gain) (3) | (38.8 | ) |
| (20.5 | ) |
| (59.3 | ) | |||
Balance at December 31, 2017 | $ | 167.8 | |
| $ | 285.9 | |
| $ | 453.7 | |
(1) | Included in other current liabilities on the Consolidated Balance Sheets. |
(2) | Included in other long-term obligations on the Consolidated Balance Sheets. |
(3) | Included in litigation settlements and other contingencies, net in the Consolidated Statements of Operations. |
2016 Changes to Contingent Consideration: During 2016 , the Company recorded a fair value loss resulting in an additional $74.8 million of contingent consideration related to the Strides Settlement, of which approximately $28.3 million was paid in the fourth quarter of 2016. In addition, the Company recorded a fair value loss of $12.6 million related to the Jai Pharma Limited acquisition. Offsetting these items was a fair value gain of approximately $68.5 million related to the respiratory delivery platform contingent consideration. As part of the acquisition of the Topicals Business, the Company recorded contingent consideration of $16 million at the acquisition date. Additionally, the Company reclassified $169.8 million of contingent consideration from other long-term obligations to other current liabilities representing milestone and profit sharing payments related to the respiratory delivery platform, milestone payments related to Jai Pharma Limited and payments related to the Strides Settlement.
122
Table of Contents
2017 Changes to Contingent Consideration: During the year ended December 31, 2017 , the Company recorded a fair value gain of $93.5 million related to the respiratory delivery platform contingent consideration offset by fair value losses of $9.9 million related to Jai Pharma Limited contingent consideration and $23.5 million related to the Topicals Business contingent consideration. In addition, the Company made payments of approximately $13.7 million related to the Agila contingent consideration, a net payment of $40 million to resolve the Topicals Business contingent consideration and a payment of approximately $20.0 million related to the Jai Pharma Limited contingent consideration.
The Company expects to incur approximately $20 million to $25 million of non-cash accretion expense related to the increase in the net present value of the contingent consideration liabilities in 2018 .
Although the Company has not elected the fair value option for financial assets and liabilities, any future transacted financial asset or liability will be evaluated for the fair value election.
Available-for-Sale Securities
The amortized cost and estimated fair value of available-for-sale securities, included in prepaid expenses and other current assets, were as follows:
(In millions) | Cost |
| Gross |
| Gross |
| Fair | ||||||||
December 31, 2017 |
|
|
|
|
|
|
| ||||||||
Debt securities | $ | 31.5 | |
| $ | - | |
| $ | - | |
| $ | 31.5 | |
Equity securities | 29.5 | |
| 16.9 | |
| (1.2 | ) |
| 45.2 | | ||||
| $ | 61.0 | |
| $ | 16.9 | |
| $ | (1.2 | ) |
| $ | 76.7 | |
December 31, 2016 |
|
|
|
|
|
|
| ||||||||
Debt securities | $ | 31.4 | |
| $ | - | |
| $ | - | |
| $ | 31.4 | |
Equity securities | 28.0 | |
| 24.6 | |
| (0.3 | ) |
| 52.3 | | ||||
| $ | 59.4 | |
| $ | 24.6 | |
| $ | (0.3 | ) |
| $ | 83.7 | |
Maturities of available-for-sale debt securities at fair value as of December 31, 2017 , were as follows:
(In millions) |
| ||
Mature within one year | $ | 3.0 | |
Mature in one to five years | 15.5 | | |
Mature in five years and later | 13.0 | | |
| $ | 31.5 | |
123
Table of Contents
8. | Debt |
A summary of long-term debt is as follows:
(In millions) | Coupon |
| December 31, |
| December 31, | |||||
Current portion of long-term debt: |
|
|
|
|
| |||||
Meda Bank Loans |
|
| $ | - | |
| $ | 219.6 | | |
2018 Senior Notes * | 2.600 | % |
| 649.9 | |
| - | | ||
2018 Floating Rate Euro Notes (b) ** |
|
| 600.2 | |
| - | | |||
2018 Senior Notes ** | 3.000 | % |
| 499.8 | |
| - | | ||
Other |
|
| 2.4 | |
| 3.7 | | |||
Deferred financing fees |
|
| (3.1 | ) |
| - | | |||
Current portion of long-term debt |
|
| $ | 1,749.2 | |
| $ | 223.3 | | |
|
|
|
|
|
| |||||
Non-current portion of long-term debt: |
|
|
|
|
| |||||
2016 Term Facility (a) ** | 2.944 | % |
| $ | 100.0 | |
| $ | 1,600.0 | |
Meda Medium Term Notes due 2019 |
|
| - | |
| 146.4 | | |||
2018 Floating Rate Euro Notes (b) ** |
|
| - | |
| 526.0 | | |||
2018 Senior Notes * | 2.600 | % |
| - | |
| 649.6 | | ||
2018 Senior Notes ** | 3.000 | % |
| - | |
| 499.6 | | ||
2019 Senior Notes ** | 2.500 | % |
| 999.5 | |
| 999.1 | | ||
2019 Senior Notes * | 2.550 | % |
| 499.7 | |
| 499.5 | | ||
2020 Floating Rate Euro Notes (c) ** |
|
| 600.2 | |
| - | | |||
2020 Euro Senior Notes ** | 1.250 | % |
| 897.6 | |
| 785.7 | | ||
2020 Senior Notes ** | 3.750 | % |
| 499.9 | |
| 499.9 | | ||
2021 Senior Notes ** | 3.150 | % |
| 2,248.2 | |
| 2,247.7 | | ||
2023 Senior Notes * | 3.125 | % |
| 765.4 | |
| 775.3 | | ||
2023 Senior Notes * | 4.200 | % |
| 498.8 | |
| 498.6 | | ||
2024 Euro Senior Notes ** | 2.250 | % |
| 1,197.7 | |
| 1,049.2 | | ||
2026 Senior Notes ** | 3.950 | % |
| 2,235.0 | |
| 2,233.5 | | ||
2028 Euro Senior Notes ** | 3.125 | % |
| 892.0 | |
| 781.1 | | ||
2043 Senior Notes * | 5.400 | % |
| 497.1 | |
| 497.0 | | ||
2046 Senior Notes ** | 5.250 | % |
| 999.8 | |
| 999.8 | | ||
Other |
|
| 6.3 | |
| 7.1 | | |||
Deferred financing fees |
|
| (71.9 | ) |
| (92.2 | ) | |||
Long-term debt |
|
| $ | 12,865.3 | |
| $ | 15,202.9 | | |
(a) | The 2016 Term Facility bears interest at LIBOR plus a base rate, which margins can fluctuate based on the Company's credit ratings as described below. At December 31, 2017 , the weighted average interest rate of the 2016 Term Facility was approximately 2.94% . |
(b) | Instrument bears interest at a rate of three-month EURIBOR plus 0.870% per annum, reset quarterly. |
(c) | Instrument bears interest at a rate of three-month EURIBOR plus 0.50% per annum, reset quarterly. |
* | Instrument was issued by Mylan Inc. |
** | Instrument was issued by Mylan N.V. |
Receivables Facility
The Company has a $400 million Receivables Facility. In January 2018, the maturity of the Receivables Facility was extended to January 2019.
124
Table of Contents
Under the terms of the Receivables Facility, our subsidiary, MPI, sells certain accounts receivable to Mylan Securitization LLC ("Mylan Securitization"), a wholly-owned special purpose entity which in turn sells a percentage ownership interest in the receivables to financial institutions and commercial paper conduits sponsored by financial institutions. MPI is the servicer of the receivables under the Receivables Facility. Purchases under the Receivables Facility will be repaid as accounts receivable are collected, with new purchases being advanced as new accounts receivable are originated by MPI. Mylan Securitization's assets have been pledged to The Bank of Tokyo-Mitsubishi UFJ, Ltd., as agent, in support of its obligations under the Receivables Facility. Any amounts outstanding under the facility are recorded as borrowings and the underlying receivables will continue to be included in accounts receivable, net, in the Consolidated Balance Sheets of the Company.
The Receivables Facility contains requirements relating to the performance of the accounts receivable and covenants related to the Company with which the Company was compliant as of December 31, 2017 . As of December 31, 2017 and 2016 , the Company had $1.04 billion and $1.13 billion , respectively, of accounts receivable balances sold to Mylan Securitization and no short-term borrowings included in the Consolidated Balance Sheets as of December 31, 2016 . As of December 31, 2017 , the Company had $45.0 million of short-term borrowings under the Receivables Facility and included in Short-term borrowings in the Consolidated Balance Sheets.
Commercial Paper Program
On June 8, 2017, the Company established an unsecured commercial paper program (the "CP Program") pursuant to which the Company may issue short-term, unsecured commercial paper notes (the "CP Notes") pursuant to the exemption from registration contained in Section 4(a)(2) of the Securities Act of 1933, as amended (the "Securities Act"). Amounts available under the CP Program may be borrowed, repaid and re-borrowed from time to time, with the aggregate principal amount of CP Notes outstanding under the CP Program at any time not to exceed $1.65 billion . The net proceeds of issuances of the CP Notes are expected to be used for general corporate purposes. The Company's 2016 Revolving Facility (as defined below) will be available to repay the CP Notes, if necessary. The maturities of the CP Notes will vary but will not exceed 364 days from the date of issue. At December 31, 2017 , the Company had no amounts outstanding under the CP program.
Credit Facilities
2016 Revolving Facility
On November 22, 2016, the Company entered into a revolving credit facility among the Company, as borrower, Mylan Inc., as a guarantor, certain lenders and issuing banks and Bank of America, N.A., as the administrative agent, pursuant to which the Company may obtain extensions of credit in an aggregate principal amount not to exceed $2.0 billion (the "2016 Revolving Facility"). The 2016 Revolving Facility is unsecured.
Any proceeds from the 2016 Revolving Facility may be used for working capital, capital expenditures and other lawful corporate purposes, including, without limitation, to repay outstanding obligations of the Company and its subsidiaries.
Borrowings under the 2016 Revolving Facility will bear interest at LIBOR plus 1.200% per annum, if the Company chooses to make LIBOR borrowings, or at a base rate plus 0.200% per annum. The 2016 Revolving Facility has a facility fee, which currently accrues at 0.175% on the daily amount of the aggregate revolving commitments of the lenders. The applicable margins over LIBOR and the base rate for the revolver can fluctuate based on the long term unsecured senior, non-credit enhanced debt rating of the Company by S&P Global Ratings, Moody's Investors Service, Inc. and Fitch Ratings, Inc.
The 2016 Revolving Facility matures on November 22, 2021 and may be voluntarily prepaid without penalty or premium, other than customary breakage costs related to prepayments of LIBOR borrowings. At December 31, 2017 and 2016 , the Company had no amounts outstanding under the 2016 Revolving Facility.
2016 Term Facility
On November 22, 2016, the Company entered into a term credit facility among the Company, as borrower, Mylan Inc., as a guarantor, certain lenders and Goldman Sachs Bank USA, as administrative agent, pursuant to which the Company borrowed $2.0 billion in term loans (the "2016 Term Facility"). The proceeds of the 2016 Term Facility were used to repay outstanding obligations under, and thereby terminate, the facilities agreement, dated as of December 17, 2014, among Meda, as borrower, the lenders from time to time party thereto and Danske Bank A/S, as agent.
125
Table of Contents
The 2016 Term Facility is guaranteed by Mylan Inc.; provided that if Mylan Inc. is no longer a borrower in respect of third party indebtedness in excess of $500 million , Mylan Inc. shall be released from such guarantee at the option of the Company or Mylan Inc. The 2016 Term Facility is unsecured.
The 2016 Term Facility currently bears interest at LIBOR plus 1.375% per annum, if the Company chooses to make LIBOR borrowings, or at a base rate plus 0.375% per annum. The applicable margins over LIBOR and the base rate for the 2016 Term Facility can fluctuate based on the long term unsecured senior, non-credit enhanced debt rating of the Company by S&P Global Ratings, Moody's Investors Service, Inc. and Fitch Ratings, Inc.
The 2016 Term Facility matures on November 22, 2019 and has no required amortization payments. The 2016 Term Facility may be voluntarily prepaid without penalty or premium, other than customary breakage costs related to prepayments of LIBOR borrowings. The Company has voluntarily prepaid $1.90 billion of the aggregate principal amount of the 2016 Term Facility, including $1.50 billion during 2017 . At December 31, 2017 , the Company had an aggregate principal amount of $100 million outstanding under the 2016 Term Facility.
The Company's 2016 Term Loans and 2016 Revolving Facility contain a maximum consolidated leverage ratio financial ratio of 3.75 to 1.00 for consolidated total indebtedness as of the end of any quarter to consolidated EBITDA for the trailing four quarters as defined in the related credit agreements ("leverage ratio") which was subsequently modified as discussed below. The 2016 Term Loans and 2016 Revolving Facility also contain customary affirmative covenants for facilities of this type, including among others, covenants pertaining to the delivery of financial statements, notices of default and certain material events, maintenance of corporate existence and rights, property, and insurance and compliance with laws, as well as customary negative covenants for facilities of this type, including limitations on the incurrence of subsidiary indebtedness, liens, mergers and certain other fundamental changes, investments and loans, acquisitions, transactions with affiliates, payments of dividends and other restricted payments and changes in our lines of business.
Amendment to 2016 Revolving Facility and 2016 Term Facility
On November 3, 2017 , the Company entered into amendments to the 2016 Term Facility and 2016 Revolving Facility to modify the leverage ratio covenant. Following such amendments, the 2016 Term Facility and 2016 Revolving Facility contain maximum consolidated leverage ratio financial covenants requiring maintenance of a maximum ratio of 4.25 to 1.00 through December 31, 2018. The Company is in compliance with the leverage ratio covenant at December 31, 2017 and expects to remain in compliance for the next twelve months.
Meda Borrowings
Upon settlement of the Offer on August 5, 2016, Meda became a controlled subsidiary of the Company. Meda was party to certain debt obligations, which remained outstanding following the settlement of the Offer, including (i) a 2kr billion loan agreement, dated as of September 17, 2014 (the "Bilateral Loan Agreement"), between Meda, as borrower, and Svensk Exportkredit, as lender and (ii) the 2013/2018 588kr million floating rate notes issued by Meda (the "2018 MTN") and the 2014/2019 745kr million floating rate notes issued by Meda (the "2019 MTN" and, together with the 2018 MTN, the "Meda MTN"). On September 29, 2017, all 2,011kr million of its outstanding debt obligations under the Bilateral Loan Agreement were fully paid using available liquidity.
On December 6, 2017 the holders of the Meda MTNs approved insertion of an early redemption call option and Meda announced its immediate intention to exercise the call option. On December 15, 2017 all outstanding Meda MTNs were redeemed using available liquidity.
At December 31, 2017 , Meda did not have any outstanding debt obligations.
Senior Notes
Issuance of 2017 Euro Notes
On May 24, 2017, the Company completed its offering of €500 million aggregate principal amount of Floating Rate Senior Notes due 2020, issued pursuant to the indenture dated May 24, 2017 (the "2017 Euro Notes Indenture"). The 2020 Floating Rate Euro Notes will mature on May 24, 2020 and cannot be redeemed prior to maturity at the option of the Company.
126
Table of Contents
The 2020 Floating Rate Euro Notes were issued in a private offering exempt from the registration requirements of the Securities Act to persons outside of the U.S. pursuant to Regulation S under the Securities Act. The 2020 Floating Rate Euro Notes are the Company's senior unsecured indebtedness and are guaranteed on a senior unsecured basis by Mylan Inc.
The 2020 Floating Rate Euro Notes bear interest at a rate per annum, reset quarterly, equal to the sum of (i) three-month EURIBOR (as defined in the 2017 Euro Notes Indenture) plus (ii) 0.50% , provided, however, that the minimum interest rate is zero . Interest on the 2020 Floating Rate Euro Notes is payable quarterly in arrears on each February 24, May 24, August 24 and November 24. The interest rate at December 31, 2017 was approximately 0.17% per annum.
The Company utilized the net proceeds from the 2020 Floating Rate Euro Notes offering to repay a portion of the term loans under the 2016 Term Facility and to pay associated fees and expenses.
Issuance of 2016 Euro Notes
On November 22, 2016, the Company completed its offering of €500 million aggregate principal amount of Floating Rate Senior Notes due 2018, €750 million aggregate principal amount of 1.250% Senior Notes due 2020, €1.0 billion aggregate principal amount of 2.250% Senior Notes due 2024 and €750 million aggregate principal amount of 3.125% Senior Notes due 2028, issued pursuant to the indenture dated November 22, 2016 (the "2016 Euro Notes Indenture"). The 2018 Floating Rate Euro Notes, 2020 Euro Notes, 2024 Euro Notes, and 2028 Euro Notes, together, are referred to as the "November 2016 Euro Notes."
The November 2016 Euro Notes were issued in a private offering exempt from the registration requirements of the Securities Act, to persons outside of the United States pursuant to Regulation S under the Securities Act. The November 2016 Euro Notes are the Company's senior unsecured indebtedness and are guaranteed on a senior unsecured basis by Mylan Inc.
The 2018 Floating Rate Euro Notes bear interest at a rate per annum, reset quarterly, equal to the sum of (i) three-month EURIBOR (as defined in the 2016 Euro Notes Indenture) plus (ii) 0.870% ; provided, however, that the minimum interest rate is zero . Interest on the 2018 Floating Rate Euro Notes is payable quarterly in arrears on each February 22, May 22, August 22 and November 22. The 2018 Floating Rate Euro Notes will mature on November 22, 2018. The interest rate on the 2018 Floating Rate Euro Notes at December 31, 2017 was approximately 0.541% per annum. The 2018 Floating Rate Euro Notes cannot be redeemed at the option of the Company.
The 2020 Euro Notes will mature on November 23, 2020, the 2024 Euro Notes will mature on November 22, 2024 and the 2028 Euro Notes will mature on November 22, 2028. Interest on the 2020 Euro Notes is payable annually in arrears on November 23 of each year. Interest on the 2024 Euro Notes and the 2028 Euro Notes is payable annually in arrears on November 22 of each year. The 2020 Euro Notes, 2024 Euro Notes and 2028 Euro Notes are redeemable, in whole or in part, at any time at our option, at the redemption prices set forth in the 2016 Euro Notes Indenture.
The Company utilized the net proceeds from the November 2016 Euro Notes offering to repay or otherwise refinance the Company's indebtedness, to pay related fees and expenses and for general corporate purposes.
At December 31, 2017 , the outstanding balance of the 2018 Floating Rate Euro Notes, 2020 Floating Rate Euro Notes, 2020 Euro Notes, 2024 Euro Notes and 2028 Euro Notes was approximately $600.2 million , $600.2 million , $897.6 million , $1.20 billion and $892.0 million , respectively, converted at the December 31, 2017 EUR to USD spot exchange rate. At December 31, 2017 , discounts on the 2020 Euro Notes, 2024 Euro Notes and 2028 Euro Notes were approximately $2.8 million , $2.8 million and $8.4 million , respectively, converted at the December 31, 2017 EUR to USD spot exchange rate. During the year ended December 31, 2017 , the Company recorded mark-to-market losses related to the 2018 Floating Rate Euro Notes, 2020 Floating Rate Euro Notes, 2020 Euro Notes, 2024 Euro Notes and 2028 Euro Notes of approximately $74.3 million , $45.7 million , $111.4 million , $148.5 million and $111.4 million , respectively. During the year ended December 31, 2016 , the Company recorded mark-to-market losses related to the 2018 Floating Rate Euro Notes, 2020 Euro Notes, 2024 Euro Notes and 2028 Euro Notes of approximately $5.3 million , $8.0 million , $10.7 million , and $8.0 million , respectively. Refer to Note 7 Financial Instruments and Risk Management for further discussion of the foreign currency risk management of these instruments. During the year ended December 31, 2016, the Company incurred approximately $15.6 million in financing fees related to the Euro Notes, which were recorded as deferred financing fees in the Consolidated Balance Sheets.
127
Table of Contents
Issuance of June 2016 Senior Notes
On June 9, 2016, the Company completed its offering of $1.00 billion aggregate principal amount of 2.500% Senior Notes due 2019 (the "2019 Senior Notes"), $2.25 billion aggregate principal amount of 3.150% Senior Notes due 2021 (the "2021 Senior Notes"), $2.25 billion aggregate principal amount of 3.950% Senior Notes due 2026 and $1.00 billion aggregate principal amount of 5.250% Senior Notes due 2046 (the "2046 Senior Notes" and together with the 2019 Senior Notes, the 2021 Senior Notes and the 2026 Senior Notes, (the "June 2016 Senior Notes"), issued pursuant to an indenture, dated as of June 9, 2016 (the "June 2016 Indenture").
The June 2016 Senior Notes were issued in a private offering exempt from the registration requirements of the Securities Act to qualified institutional buyers in accordance with Rule 144A and to persons outside of the U.S. pursuant to Regulation S under the Securities Act. The June 2016 Senior Notes are the Company's senior unsecured indebtedness and are guaranteed on a senior unsecured basis by Mylan Inc.
In addition, the Company entered into a registration rights agreement, dated as of June 9, 2016, pursuant to which the Company and Mylan Inc. were required to use commercially reasonable efforts to file a registration statement with respect to an offer to exchange each series of the June 2016 Senior Notes for new notes with the same aggregate principal amount and terms substantially identical in all material respects. In December 2016, the Company and Mylan Inc. filed a registration statement with the SEC with respect to such an offer, which was declared effective on January 3, 2017. The exchange offer expired on January 31, 2017 and settled on February 3, 2017.
The 2019 Senior Notes will mature on June 7, 2019. Interest on the 2019 Senior Notes is payable semi-annually in arrears on June 7 and December 7 of each year. The 2021 Senior Notes will mature on June 15, 2021, the 2026 Senior Notes will mature on June 15, 2026 and the 2046 Senior Notes will mature on June 15, 2046. Interest on the 2021 Senior Notes, the 2026 Senior Notes and the 2046 Senior Notes is payable semi-annually in arrears on June 15 and December 15 of each year. The June 2016 Senior Notes are redeemable, in whole or in part, at any time at our option, at the redemption prices set forth in the June 2016 Indenture.
At December 31, 2017 , the outstanding balances of the 2019 Senior Notes, 2021 Senior Notes, 2026 Senior Notes and 2046 Senior Notes include discounts of $0.5 million , $1.8 million , $15.0 million and $0.2 million , respectively.
The Company utilized the net proceeds from this offering to fund the Offer, to pay related fees and expenses and for general corporate purposes.
Fair Value
At December 31, 2017 and 2016 , the aggregate fair value of the Company's outstanding notes was approximately $14.93 billion and $13.20 billion , respectively. The fair values of the outstanding notes were valued at quoted market prices from broker or dealer quotations and were classified as Level 2 in the fair value hierarchy. Based on quoted market rates of interest and maturity schedules for similar debt issues, the fair values of the Company's 2016 Term Facility at December 31, 2017 and 2016 , and the Meda borrowings at December 31, 2016, determined based on Level 2 inputs, approximate their carrying values.
Mandatory minimum repayments remaining on the outstanding long-term debt at December 31, 2017 , excluding the discounts and premiums, are as follows for each of the periods ending December 31:
(In millions) | Total | ||
2018 | $ | 1,750 | |
2019 | 1,600 | | |
2020 | 2,001 | | |
2021 | 2,250 | | |
2022 | - | | |
Thereafter | 7,101 | | |
Total | $ | 14,702 | |
Subsequent to December 31, 2017 , the Company has issued approximately $200 million of CP Notes and borrowed approximately an additional $355 million under the Receivables Facility. Such amounts were used to pay certain amounts related to deferred acquisition related payments and ordinary share repurchases.
128
Table of Contents
9. | Comprehensive Earnings |
Accumulated other comprehensive loss , as reflected on the Consolidated Balance Sheets , is comprised of the following:
(In millions) | December 31, 2017 |
| December 31, 2016 | ||||
Accumulated other comprehensive loss: |
|
|
| ||||
Net unrealized gain on marketable securities, net of tax | $ | 10.1 | |
| $ | 14.5 | |
Net unrecognized gains/(losses) and prior service cost related to defined benefit plans, net of tax | 6.0 | |
| (0.5 | ) | ||
Net unrecognized losses on derivatives in cash flow hedging relationships, net of tax | (3.7 | ) |
| (38.6 | ) | ||
Net unrecognized losses on derivatives in net investment hedging relationships, net of tax | (239.8 | ) |
| (1.4 | ) | ||
Foreign currency translation adjustment | (133.8 | ) |
| (2,237.7 | ) | ||
| $ | (361.2 | ) |
| $ | (2,263.7 | ) |
Components of accumulated other comprehensive (loss) earnings, before tax, consist of the following:
| Year Ended December 31, 2017 | ||||||||||||||||||||||||||||
Gains and Losses on Derivatives in Cash Flow Hedging Relationships |
| Gains and Losses on Net Investment Hedges |
| Gains and Losses on Marketable Securities |
| Defined Pension Plan Items |
| Foreign Currency Translation Adjustment |
| Totals | |||||||||||||||||||
(In millions) | Foreign Currency Forward Contracts |
| Interest Rate Swaps |
| Total |
|
|
|
|
|
|
|
|
|
| ||||||||||||||
Balance at December 31, 2016, net of tax |
|
|
|
| $ | (38.6 | ) |
| $ | (1.4 | ) |
| $ | 14.5 | |
| $ | (0.5 | ) |
| $ | (2,237.7 | ) |
| $ | (2,263.7 | ) | ||
Other comprehensive (loss) earnings before reclassifications, before tax |
|
|
|
| 46.5 | |
| (238.4 | ) |
| (6.7 | ) |
| 3.4 | |
| 2,103.9 | |
| 1,908.7 | | ||||||||
Amounts reclassified from accumulated other comprehensive (loss) earnings, before tax: |
|
|
|
|
|
|
|
|
|
|
|
|
|
|
| ||||||||||||||
Gain on foreign exchange forward contracts classified as cash flow hedges, included in net sales | (1.1 | ) |
|
|
| (1.1 | ) |
|
|
|
|
|
|
|
|
| (1.1 | ) | |||||||||||
Loss on interest rate swaps classified as cash flow hedges, included in interest expense |
|
| 7.3 | |
| 7.3 | |
|
|
|
|
|
|
|
|
| 7.3 | | |||||||||||
Amortization of prior service costs included in SG&A |
|
|
|
|
|
|
|
|
|
| (0.2 | ) |
|
|
| (0.2 | ) | ||||||||||||
Amortization of actuarial loss included in SG&A |
|
|
|
|
|
|
|
|
|
| 0.6 | |
|
|
| 0.6 | | ||||||||||||
Net other comprehensive (loss) earnings, before tax |
|
|
|
| 52.7 | |
| (238.4 | ) |
| (6.7 | ) |
| 3.8 | |
| 2,103.9 | |
| 1,915.3 | | ||||||||
Income tax (benefit) provision |
|
|
|
| 17.8 | |
| - | |
| (2.3 | ) |
| (2.7 | ) |
| - | |
| 12.8 | | ||||||||
Balance at December 31, 2017, net of tax |
|
|
|
| $ | (3.7 | ) |
| $ | (239.8 | ) |
| $ | 10.1 | |
| $ | 6.0 | |
| $ | (133.8 | ) |
| $ | (361.2 | ) | ||
129
Table of Contents
| Year Ended December 31, 2016 | ||||||||||||||||||||||||||||
Gains and Losses on Derivatives in Cash Flow Hedging Relationships |
| Gains and Losses on Net Investment Hedges |
| Gains and Losses on Marketable Securities |
| Defined Pension Plan Items |
| Foreign Currency Translation Adjustment |
| Totals | |||||||||||||||||||
(In millions) | Foreign Currency Forward Contracts |
| Interest Rate Swaps |
| Total |
|
|
|
|
|
|
|
|
|
| ||||||||||||||
Balance at December 31, 2015, net of tax |
|
|
|
| $ | (18.1 | ) |
| $ | - | |
| $ | (1.0 | ) |
| $ | (14.9 | ) |
| $ | (1,730.3 | ) |
| $ | (1,764.3 | ) | ||
Other comprehensive (loss) earnings before reclassifications, before tax |
|
|
|
| (84.2 | ) |
| (1.8 | ) |
| 24.6 | |
| 20.0 | |
| (507.4 | ) |
| (548.8 | ) | ||||||||
Amounts reclassified from accumulated other comprehensive (loss) earnings, before tax: |
|
|
|
|
|
|
|
|
|
|
|
|
|
|
| ||||||||||||||
Loss on foreign exchange forward contracts classified as cash flow hedges, included in net sales | 44.3 | |
|
|
| 44.3 | |
|
|
|
|
|
|
|
|
| 44.3 | | |||||||||||
Loss on interest rate swaps classified as cash flow hedges, included in interest expense |
|
| 8.7 | |
| 8.7 | |
|
|
|
|
|
|
|
|
| 8.7 | | |||||||||||
Amortization of prior service costs included in SG&A |
|
|
|
|
|
|
|
|
|
| 0.3 | |
|
|
| 0.3 | | ||||||||||||
Amortization of actuarial gain included in SG&A |
|
|
|
|
|
|
|
|
|
| 1.1 | |
|
|
| 1.1 | | ||||||||||||
Net other comprehensive (loss) earnings, before tax |
|
|
|
| (31.2 | ) |
| (1.8 | ) |
| 24.6 | |
| 21.4 | |
| (507.4 | ) |
| (494.4 | ) | ||||||||
Income tax (benefit) provision |
|
|
|
| (10.7 | ) |
| (0.4 | ) |
| 9.1 | |
| 7.0 | |
| - | |
| 5.0 | | ||||||||
Balance at December 31, 2016, net of tax |
|
|
|
| $ | (38.6 | ) |
| $ | (1.4 | ) |
| $ | 14.5 | |
| $ | (0.5 | ) |
| $ | (2,237.7 | ) |
| $ | (2,263.7 | ) | ||
130
Table of Contents
| Year Ended December 31, 2015 | ||||||||||||||||||||||||
| Gains and Losses on Derivatives in Cash Flow Hedging Relationships |
| Gains and Losses on Marketable Securities |
| Defined Pension Plan Items |
| Foreign Currency Translation Adjustment |
| Totals | ||||||||||||||||
(In millions) | Foreign Currency Forward Contracts |
| Interest Rate Swaps |
| Total |
|
|
|
|
|
|
|
| ||||||||||||
Balance at December 31, 2014, net of tax |
|
|
|
| $ | (28.4 | ) |
| $ | 0.3 | |
| $ | (19.5 | ) |
| $ | (939.4 | ) |
| $ | (987.0 | ) | ||
Other comprehensive earnings (loss) before reclassifications, before tax |
|
|
|
| 129.0 | |
| (2.0 | ) |
| 0.6 | |
| (790.9 | ) |
| (663.3 | ) | |||||||
Amounts reclassified from accumulated other comprehensive loss, before tax: |
|
|
|
|
|
|
|
|
|
|
|
|
| ||||||||||||
Loss on foreign exchange forward contracts classified as cash flow hedges, included in net sales | (40.3 | ) |
|
|
| (40.3 | ) |
|
|
|
|
|
|
| (40.3 | ) | |||||||||
Loss on interest rate swaps classified as cash flow hedges, included in interest expense |
|
| (0.8 | ) |
| (0.8 | ) |
|
|
|
|
|
|
| (0.8 | ) | |||||||||
Loss on interest rate swaps classified as cash flow hedges, included in other expense, net |
|
| (71.2 | ) |
| (71.2 | ) |
|
|
|
|
|
|
| (71.2 | ) | |||||||||
Amortization of prior service costs included in SG&A |
|
|
|
|
|
|
|
| 0.3 | |
|
|
| 0.3 | | ||||||||||
Amortization of actuarial gain included in SG&A |
|
|
|
|
|
|
|
| 2.2 | |
|
|
| 2.2 | | ||||||||||
Net other comprehensive loss, before tax |
|
|
|
| 16.7 | |
| (2.0 | ) |
| 3.1 | |
| (790.9 | ) |
| (773.1 | ) | |||||||
Income tax provision (benefit) |
|
|
|
| 6.4 | |
| (0.7 | ) |
| (1.5 | ) |
| - | |
| 4.2 | | |||||||
Balance at December 31, 2015, net of tax |
|
|
|
| $ | (18.1 | ) |
| $ | (1.0 | ) |
| $ | (14.9 | ) |
| $ | (1,730.3 | ) |
| $ | (1,764.3 | ) | ||
10. | Income Taxes |
On December 22, 2017, the U.S. government enacted comprehensive tax legislation commonly referred to as the Tax Cuts and Jobs Act (the "Tax Act"). The Tax Act makes broad and complex changes to the Code including, but not limited to, reducing the U.S. federal corporate income tax rate and requiring a one-time transition tax on certain unrepatriated earnings of non-U.S. corporate subsidiaries of large U.S. shareholders that may electively be paid over eight years. While the Tax Act reduces the U.S. federal corporate income tax rate from 35% to 21% for tax years beginning after December 31, 2017, ASC 740 requires the Company to remeasure its deferred tax balances in 2017 in accordance with the 2018 rate reduction.
The Tax Act also puts in place new tax laws that will impact our taxable income beginning in 2018, which include, but are not limited to (1) creating a Base Erosion Anti-Abuse Tax ("BEAT"), which is a new minimum tax, (2) generally eliminating U.S. federal income taxes on dividends from foreign subsidiaries (the "participation exemption"), (3) a new provision designed to tax currently global intangible low-taxed income ("GILTI") earned by non-U.S. corporate subsidiaries of large U.S. shareholders, which allows for the possibility of utilizing foreign tax credits (foreign tax credits are limited to 80% of foreign taxes paid that are properly attributable to GILTI and are segregated into a separate basket, with no carryforward or carryback permitted for excess foreign tax credits) and a deduction generally equal to 50 percent of GILTI ( 37.5 percent for tax years beginning after December 31, 2025) to offset the income tax liability, (4) a provision limiting the amount of deductible interest expense in the U.S., (5) the repeal of the domestic manufacturing deduction, (6) limitations on the deductibility of certain executive compensation, and (7) limitations on the utilization of foreign tax credits to reduce the U.S. income tax liability.
Shortly after the Tax Act was enacted, the SEC staff issued Staff Accounting Bulletin No. 118, Income Tax Accounting Implications of the Tax Cuts and Jobs Act ("SAB 118") which provides guidance on accounting for the Tax Act's impact. SAB
131
Table of Contents
118 provides a measurement period, which in no case should extend beyond one year from the Tax Act enactment date, during which a company acting in good faith may complete the accounting for the impacts of the Tax Act under ASC Topic 740. In accordance with SAB 118, the Company must reflect the income tax effects of the Tax Act in the reporting period in which the accounting under ASC Topic 740 is complete.
To the extent that the accounting for certain income tax effects of the Tax Act is incomplete, a company can determine a reasonable estimate for those effects and record a provisional estimate in the financial statements in the first reporting period in which a reasonable estimate can be determined. If a company cannot determine a provisional estimate to be included in the financial statements, then the company should continue to apply ASC 740 based on the provisions of the tax laws that were in effect immediately prior to the Tax Act being enacted. If a company is unable to provide a reasonable estimate of the impacts of the Tax Act in a reporting period, a provisional amount must be recorded in the first reporting period in which a reasonable estimate can be determined.
The Company has recorded a provisional net tax charge of $128.6 million related to the Tax Act in the year ended December 31, 2017. This net charge primarily consists of a net expense of $15.0 million due to the remeasurement of our net deferred tax accounts to reflect the U.S. federal corporate income tax rate reduction to 21% and a net expense for the transition tax of $113.6 million . While we are able to make a reasonable estimate of the impact of the reduction in corporate tax rate, we are continuing to analyze the temporary differences that existed on the date of enactment, and the temporary differences originating in the current fiscal year.
The transition tax is a 2017 tax on the previously untaxed accumulated and current earnings and profits ("E&P") of certain of our foreign subsidiaries. In order to determine the amount of the transition tax, we must determine, in addition to other factors, the amount of post-1986 E&P of the relevant subsidiaries, as well as the amount of non-U.S. income taxes paid on such earnings. E&P is similar to the retained earnings of the subsidiary, but requires other adjustments to conform to the Code. We are able to make a reasonable estimate of the transition tax and recorded a provisional transition tax obligation of $113.6 million which the Company expects to elect to pay, net of certain tax attributes and credit carryforwards, over eight years beginning in 2018. This amount is presented in other long-term liabilities. However, we are awaiting further interpretative guidance, along with continuing to assess available tax methods and elections, and continuing to gather additional information to more precisely compute the amount of the transition tax.
The Tax Act includes a provision designed to currently tax GILTI earned by non-U.S. corporate subsidiaries of large U.S. shareholders starting in 2018. The Company has elected, as permitted in FASB Staff Q&A - Topic 740 - No. 5, to treat any future GILTI tax liabilities as period costs and will expense those liabilities in the period incurred. The Company therefore will not record deferred taxes associated with the GILTI provision of the Tax Act.
As of December 31, 2017, the Company's practice and intention was to reinvest the earnings in our non-U.S. subsidiaries outside of the U.S., and no U.S. deferred income taxes or foreign withholding taxes were recorded. The transition tax noted above will result in the previously untaxed foreign earnings being included in the federal and state 2017 taxable income. We are currently analyzing our global working capital requirements and the potential tax liabilities that would be incurred if the non-U.S. subsidiaries distribute cash to the U.S. parent, which include local country withholding tax and potential U.S. state taxation. For these reasons, we are not yet able to reasonably estimate the effect of this provision of the Tax Act and have not recorded any withholding or state tax liabilities.
The Company is also analyzing other provisions of the Tax Act that come into effect for tax years starting in 2018 to determine if these items would impact the effective tax rate. These provisions include BEAT, the participation exemption, the treatment of amounts in accumulated other comprehensive income, the new provision that could limit the amount of deductible interest expense in the U.S., and the limitations on the deductibility of certain executive compensation.
132
Table of Contents
The income tax provision (benefit) consisted of the following components:
| Year Ended December 31, | ||||||||||
(In millions) | 2017 |
| 2016 |
| 2015 | ||||||
U.S. Federal: |
|
|
|
|
| ||||||
Current | $ | 39.5 | |
| $ | 86.8 | |
| $ | 13.7 | |
Deferred | 28.2 | |
| (303.8 | ) |
| (35.8 | ) | |||
| 67.7 | |
| (217.0 | ) |
| (22.1 | ) | |||
U.S. State: |
|
|
|
|
| ||||||
Current | 3.9 | |
| 13.8 | |
| 8.1 | | |||
Deferred | (0.6 | ) |
| (14.8 | ) |
| (11.9 | ) | |||
| 3.3 | |
| (1.0 | ) |
| (3.8 | ) | |||
Non-U.S.: |
|
|
|
|
| ||||||
Current | 275.0 | |
| 150.6 | |
| 161.8 | | |||
Deferred | (139.0 | ) |
| (290.9 | ) |
| (68.2 | ) | |||
| 136.0 | |
| (140.3 | ) |
| 93.6 | | |||
Income tax provision | $ | 207.0 | |
| $ | (358.3 | ) |
| $ | 67.7 | |
Earnings before income taxes and noncontrolling interest: |
|
|
|
|
| ||||||
United Kingdom | $ | 89.7 | |
| $ | (129.4 | ) |
| $ | (189.6 | ) |
United States | (414.5 | ) |
| (187.4 | ) |
| 474.4 | | |||
Foreign - Other | 1,227.8 | |
| 438.5 | |
| 630.6 | | |||
Total earnings before income taxes and noncontrolling interest | $ | 903.0 | |
| $ | 121.7 | |
| $ | 915.4 | |
For all periods presented, the allocation of earnings before income taxes and noncontrolling interest between U.S. and non-U.S. operations includes intercompany interest allocations between certain domestic and foreign subsidiaries. These amounts are eliminated on a consolidated basis.
Temporary differences and carryforwards that result in deferred tax assets and liabilities were as follows:
(In millions) | December 31, 2017 |
| December 31, 2016 | ||||
Deferred tax assets: |
|
|
| ||||
Employee benefits | $ | 215.0 | |
| $ | 265.2 | |
Litigation reserves | 45.3 | |
| 239.9 | | ||
Accounts receivable allowances | 251.7 | |
| 396.0 | | ||
Tax credit and loss carryforwards | 849.9 | |
| 634.0 | | ||
Interest expense | 151.7 | |
| 51.2 | | ||
Intangible assets | 114.9 | |
| 96.7 | | ||
Other | 212.4 | |
| 232.3 | | ||
| 1,840.9 | |
| 1,915.3 | | ||
Less: Valuation allowance | (662.8 | ) |
| (460.7 | ) | ||
Total deferred tax assets | 1,178.1 | |
| 1,454.6 | | ||
Deferred tax liabilities: |
|
|
| ||||
Plant and equipment | 120.7 | |
| 183.9 | | ||
Intangible assets and goodwill | 2,538.2 | |
| 2,601.6 | | ||
Other | 34.8 | |
| 42.3 | | ||
Total deferred tax liabilities | 2,693.7 | |
| 2,827.8 | | ||
Deferred tax liabilities, net | $ | (1,515.6 | ) |
| $ | (1,373.2 | ) |
133
Table of Contents
For those foreign subsidiaries whose investments are permanent in duration, income and foreign withholding taxes have not been provided on the amount by which the investment in those subsidiaries, as recorded for financial reporting, exceeds the tax basis. This amount may become taxable upon a repatriation of assets from the subsidiary or a sale or liquidation of the subsidiary. The amount of such temporary differences is approximately $431.0 million at December 31, 2017 . Determination of the amount of any unrecognized deferred income tax liability on this temporary difference is not practicable as such determination involves material uncertainties about the potential extent and timing of any distributions, the availability and complexity of calculating foreign tax credits, and the potential indirect tax consequences of such distributions, including withholding taxes. No deferred taxes have been recorded on the instances whereby the Company's investment in foreign subsidiaries is currently greater for tax purposes than for U.S. GAAP purposes, as management has no current plans that would cause that temporary difference to reverse in the foreseeable future.
Prior to the EPD Transaction, the statutory income tax rate applicable to Mylan Inc. in the U.S. was 35% . Since the EPD Transaction the statutory income tax rate applicable to Mylan N.V. in the United Kingdom (the "U.K.") has been 19% for the year ended December 31, 2017 and 20% for the years ending December 31, 2016 and 2015, respectively. A reconciliation of the statutory tax rate to the effective tax rate is as follows:
| Year Ended December 31, | |||||||
| 2017 |
| 2016 |
| 2015 | |||
Statutory tax rate | 19.0 | % |
| 20.0 | % |
| 20.0 | % |
|
|
|
|
|
| |||
United States Operations |
|
|
|
|
| |||
Clean energy and research credits | (10.1 | )% |
| (85.9 | )% |
| (13.0 | )% |
U.S. rate differential | 7.4 | % |
| (36.9 | )% |
| 4.6 | % |
|
|
|
|
|
| |||
Tax Act - transition tax | 6.8 | % |
| - | % |
| - | % |
Tax Act - deferred tax rate change | 1.6 | % |
| - | % |
| - | % |
State income taxes and credits | (0.6 | )% |
| (8.1 | )% |
| (0.6 | )% |
Valuation allowance | 10.3 | % |
| 4.4 | % |
| 0.6 | % |
Other U.S. items | 1.2 | % |
| 3.5 | % |
| - | % |
Other Foreign Operations |
|
|
|
|
| |||
Luxembourg | (10.7 | )% |
| (54.1 | )% |
| 1.7 | % |
Luxembourg - U.S. Branch | - | % |
| (28.8 | )% |
| (11.2 | )% |
Gibraltar | (6.5 | )% |
| (49.2 | )% |
| (4.9 | )% |
India | (0.5 | )% |
| (13.0 | )% |
| (0.6 | )% |
Ireland | (2.1 | )% |
| (7.3 | )% |
| (1.9 | )% |
Other | 0.6 | % |
| (5.2 | )% |
| 1.7 | % |
Uncertain tax positions | (0.9 | )% |
| 0.8 | % |
| (0.3 | )% |
Valuation allowance | 3.9 | % |
| 79.9 | % |
| 6.5 | % |
Merger of foreign subsidiaries | - | % |
| (123.5 | )% |
| - | % |
Other foreign items | 3.5 | % |
| 9.0 | % |
| 4.8 | % |
Effective tax rate | 22.9 | % |
| (294.4 | )% |
| 7.4 | % |
The Company's jurisdictional location of earnings is a component of the effective tax rate each year, and the rate impact of this component is also influenced by the level of such earnings as compared to the Company's total earnings. The jurisdictional mix of earnings can vary as a result of operating fluctuations in the normal course of business and as a result of the extent and location of other income and expense items, such as internal restructurings, and gains and losses on strategic business decisions.
During 2016, the Company merged its wholly owned subsidiary, Jai Pharma Limited, into Mylan Laboratories Limited. The merger resulted in the recognition of a deferred tax asset of approximately $150 million for the tax deductible goodwill in excess of the book goodwill with a corresponding benefit to income tax provision for the year ended December 31, 2016.
134
Table of Contents
Valuation Allowance
A valuation allowance is provided when it is more likely than not that some portion or all of the deferred tax assets will not be realized. At December 31, 2017 , a valuation allowance has been applied to certain foreign and state deferred tax assets in the amount of $662.8 million .
Net Operating Losses
As of December 31, 2017 , the Company has U.S. federal net operating loss carryforwards of $51.0 million , and U.S. state income tax loss carryforwards of approximately $2.70 billion . The Company also has non-U.S. net operating loss carryforwards of approximately $1.90 billion , of which $1.20 billion can be carried forward indefinitely, with the remaining $727.0 million expiring in years 2018 through 2037. Most of the net operating losses have a full valuation allowance. The Company also has $74.0 million of foreign deductible attributes that can be carried forward indefinitely.
The Company has $80.3 million of foreign capital loss carryforwards expiring in 2019 through 2022. A full valuation allowance is recorded against these losses. The Company also has $111.5 million of U.S. and foreign credit carryovers, expiring in various amounts through 2036.
Tax Examinations
The Company is subject to income taxes and tax audits in many jurisdictions. A certain degree of estimation is thus required in recording the assets and liabilities related to income taxes. Tax audits and examinations can involve complex issues, interpretations, and judgments and the resolution of matters that may span multiple years, particularly if subject to litigations or negotiation.
Although the Company believes that adequate provisions have been made for these uncertain tax positions, the Company's assessment of uncertain tax positions is based on estimates and assumptions that the Company believes are reasonable but the estimates for unrecognized tax benefits and potential tax benefits may not be representative of actual outcomes, and variations from such estimates could materially affect the Company's financial condition, results of operations or cash flows in the period of resolution, settlement or when the statues of limitations expire.
Mylan is subject to ongoing U.S. Internal Revenue Service ("IRS") examinations and is a voluntary participant in the IRS Compliance Assurance Process. The years 2015 and 2016 are the open years under examination. The years 2012, 2013 and 2014 have one issue open, and a Tax Court petition has been filed regarding the matter and trial has tentatively been scheduled for June, 2018. The years 2007 through 2011 had one issue open and were scheduled for U.S. Tax Court proceedings in 2017. The matter was settled with the IRS in May, 2017 and was executed by the Tax Court judge in January, 2018. The resolution of this matter will be recorded in the financial statements in 2018.
The Company's major state taxing jurisdictions remain open from fiscal year 2007 through 2017, with several state audits currently in progress. The Company's major international taxing jurisdictions remain open from 2011 through 2017, some of which are indemnified by Strides Arcolab for tax assessments.
Accounting for Uncertainty in Income Taxes
The impact of an uncertain tax position that is more likely than not of being sustained upon audit by the relevant taxing authority must be recognized at the largest amount that is more likely than not to be sustained. No portion of an uncertain tax position will be recognized if the position has less than a 50% likelihood of being sustained.
As of December 31, 2017 and 2016 , the Company's Consolidated Balance Sheets reflect net liabilities for unrecognized tax benefits of $185.7 million and $190.9 million , of which $138.4 million and $146.0 million , respectively, would affect the Company's effective tax rate if recognized. Accrued interest and penalties included in the Consolidated Balance Sheets were $90.9 million and $79.8 million as of December 31, 2017 and 2016 , respectively. For the years ended December 31, 2017 , 2016 and 2015 , Mylan recognized $11.1 million , $6.9 million and $0.8 million , respectively, for interest expense related to uncertain tax positions. Interest expense and penalties related to income taxes are included in the tax provision.
135
Table of Contents
A reconciliation of the unrecognized tax benefits is as follows:
| Year Ended December 31, | ||||||||||
(In millions) | 2017 |
| 2016 |
| 2015 | ||||||
Unrecognized tax benefit - beginning of year | $ | 190.9 | |
| $ | 174.1 | |
| $ | 191.2 | |
Additions for current year tax positions | 4.4 | |
| 2.1 | |
| 1.2 | | |||
Additions for prior year tax positions | 5.5 | |
| - | |
| - | | |||
Reductions for prior year tax positions | (0.8 | ) |
| (1.8 | ) |
| (9.0 | ) | |||
Settlements | (0.4 | ) |
| - | |
| (1.5 | ) | |||
Reductions due to expirations of statute of limitations | (13.9 | ) |
| (7.7 | ) |
| (7.8 | ) | |||
Addition due to acquisition | - | |
| 24.2 | |
| - | | |||
Unrecognized tax benefit - end of year | $ | 185.7 | |
| $ | 190.9 | |
| $ | 174.1 | |
The Company believes that it is reasonably possible that the amount of unrecognized tax benefits will decrease in the next twelve months by approximately $100.0 million , involving federal and state audits and settlements, resolution of a Tax Court matter, and expirations of certain state, federal, and foreign statutes of limitations. The Company does not anticipate significant increases to the reserve within the next twelve months .
11. | Share-Based Incentive Plan |
The Company's shareholders have approved the 2003 Long-Term Incentive Plan (as amended, the "2003 Plan"). Under the 2003 Plan, 55,300,000 ordinary shares are reserved for issuance to key employees, consultants, independent contractors and non-employee directors of the Company through a variety of incentive awards, including: stock options, stock appreciation rights ("SAR"), restricted ordinary shares and units, performance awards ("PSU"), other stock-based awards and short-term cash awards. Stock option awards are granted with an exercise price equal to the fair market value of the ordinary shares underlying the options at the date of the grant, generally become exercisable over periods ranging from three to four years , and generally expire in ten years .
In February 2014, Mylan 's Compensation Committee and the independent members of the Board of Directors adopted the One-Time Special Performance-Based Five-Year Realizable Value Incentive Program (the " 2014 Program ") under the 2003 Plan. Under the 2014 Program , certain key employees received a one-time, performance-based incentive award (the "Awards") either in the form of a grant of SARs or PSUs. The initial Awards were granted in February 2014 and contain a five -year cliff-vesting feature based on the achievement of various performance targets, external market conditions and the employee's continued services. Additional Awards were granted in 2016 and 2017 and are subject to the same performance conditions as the Awards granted in February 2014 and with a service vesting condition of between two and six years. The market condition was met on June 10, 2015 and is therefore no longer applicable to any of the Awards.
136
Table of Contents
The following table summarizes stock option and SAR (together, "stock awards") activity:
| Number of Shares Under Stock Awards |
| Weighted Average Exercise Price per Share | |||
Outstanding at December 31, 2014 | 16,207,777 | |
| $ | 33.21 | |
Granted | 937,873 | |
| 54.92 | | |
Exercised | (5,092,660 | ) |
| 22.48 | | |
Forfeited | (220,491 | ) |
| 46.36 | | |
Converted | (4,100,000 | ) |
| 53.33 | | |
Outstanding at December 31, 2015 | 7,732,499 | |
| $ | 31.85 | |
Granted | 876,397 | |
| 45.51 | | |
Exercised | (612,477 | ) |
| 23.13 | | |
Forfeited | (296,978 | ) |
| 50.70 | | |
Outstanding at December 31, 2016 | 7,699,441 | |
| $ | 33.38 | |
Granted | 964,475 | |
| 42.48 | | |
Exercised | (902,041 | ) |
| 20.06 | | |
Forfeited | (563,191 | ) |
| 47.36 | | |
Outstanding at December 31, 2017 | 7,198,684 | |
| 35.17 | | |
Vested and expected to vest at December 31, 2017 | 6,978,235 | |
| $ | 34.82 | |
Exercisable at December 31, 2017 | 5,535,230 | |
| $ | 31.99 | |
As of December 31, 2017 , stock awards outstanding, stock awards vested and expected to vest, and stock awards exercisable had average remaining contractual terms of 5.5 years , 5.4 years and 4.6 years , respectively. Also at December 31, 2017 , stock awards outstanding, stock awards vested and expected to vest and stock awards exercisable had aggregate intrinsic values of $74.1 million , $73.9 million and $72.6 million , respectively. During the year ended December 31, 2015, the Company recorded additional share-based compensation expense of approximately $21.8 million related to the accelerated vesting of equity awards as a result of the EPD Transaction.
A summary of the status of the Company's nonvested restricted ordinary shares and restricted stock unit awards, including PSUs (collectively, "restricted stock awards") as of December 31, 2017 and the changes during the year ended December 31, 2017 are presented below:
| Number of Restricted Stock Awards |
| Weighted Average Grant-Date Fair Value Per Share | |||
Nonvested at December 31, 2016 | 5,667,830 | |
| $ | 42.46 | |
Granted | 1,406,875 | |
| 44.34 | | |
Released | (502,516 | ) |
| 52.28 | | |
Forfeited | (607,982 | ) |
| 43.95 | | |
Nonvested at December 31, 2017 | 5,964,207 | |
| $ | 41.92 | |
Of the 1,406,875 restricted stock awards granted during the year ended December 31, 2017 , 725,913 vest ratably in five years or less and are not subject to market or performance conditions. Of the remaining restricted stock awards granted, 640,202 are subject to market conditions and will cliff vest in three years or less and 40,760 are not subject to market or performance conditions and will cliff vest in one year or less. 40,507 restricted stock awards were granted under the 2014 Program and are subject to the performance condition and will cliff vest over various periods between two and three years .
As of December 31, 2017 , the Company had $113.1 million of total unrecognized compensation expense, net of estimated forfeitures, related to all of its stock-based awards, which we expect to be recognized over the remaining weighted average vesting period of 1.8 years . The total intrinsic value of stock-based awards exercised and restricted stock awards released during the years ended December 31, 2017 and 2016 was $39.1 million and $60.7 million , respectively.
137
Table of Contents
2003 Plan
With respect to options granted under the Company's 2003 Plan, the fair value of each option grant was estimated at the date of grant using the Black-Scholes option pricing model. Black-Scholes utilizes assumptions related to volatility, the risk-free interest rate, the dividend yield and employee exercise behavior. Expected volatilities utilized in the model are based mainly on the implied volatility of the Company's stock price and other factors. The risk-free interest rate is derived from the U.S. Treasury yield curve in effect at the time of grant. The model incorporates exercise and post-vesting forfeiture assumptions based on an analysis of historical data. The expected lives of the grants are derived from historical and other factors.
The assumptions used for options granted under the 2003 Plan are as follows:
| Year Ended December 31, | ||||
| 2017 |
| 2016 |
| 2015 |
Volatility | 33.2% |
| 38.1% |
| 33.7% |
Risk-free interest rate | 2.2% |
| 1.4% |
| 1.7% |
Expected term (years) | 6.4 |
| 6.3 |
| 6.3 |
Forfeiture rate | 5.5% |
| 5.5% |
| 5.5% |
Weighted average grant date fair value per option | $15.88 |
| $17.90 |
| $20.18 |
2014 Program
Under the 2014 Program , approximately 4.4 million SARs and 1.5 million PSUs were granted in February 2014. The fair value of the Awards was determined using a Monte Carlo simulation as both the SARs and PSUs contain the same performance and market conditions. The Monte Carlo simulation involves a series of random trials that result in different future stock price paths over the contractual life of the SAR or PSU based on appropriate probability distributions. Conditions are imposed on each Monte Carlo simulation to determine the extent to which the performance conditions would have been met, and therefore the extent to which the Awards would have vested, for the particular stock price path. The market condition was met on June 10, 2015. In determining the fair value of the performance-based SARs and PSUs, the Company considered the achievement of the market condition in determining the estimated fair value. The Restricted Ordinary Shares (as defined below) and PSUs remain subject to the achievement of the performance condition and the employee's continued service. Subsequent to the initial grant under the 2014 Program , approximately 500,000 awards have been forfeited.
On June 10, 2015, 4.1 million shares of the Company's performance-based SARs were converted into 1.1 million restricted ordinary shares (the "Restricted Ordinary Shares") pursuant to the terms of the 2014 Program . In addition, the maximum number of the Company's PSUs granted in February 2014 under the 2014 Program that could vest was fixed at 1.4 million units. Each SAR or PSU is equal to one ordinary share with the maximum value of each Award upon vesting subject to varying limitations.
12. | Employee Benefit Plans |
Defined Benefit Plans
The Company sponsors various defined benefit pension plans in several countries. Benefits provided generally depend on length of service, pay grade and remuneration levels. The Company maintains two fully frozen defined benefit pension plans in the U.S., and employees in the U.S. and Puerto Rico are provided retirement benefits through defined contribution plans rather than through a defined benefit plan. During the year ended December 31, 2016, the Company assumed net unfunded pension and other postretirement liabilities, primarily in Germany and the U.S., of approximately $322.3 million as a result of the Meda Transaction.
The Company also sponsors other postretirement benefit plans. There are plans that provide for postretirement supplemental medical coverage. Benefits from these plans are paid to certain employees and their spouses and dependents who meet various minimum age and service requirements. In addition, there are plans that provide for life insurance benefits and postretirement medical coverage for certain officers and management employees.
138
Table of Contents
Accounting for Defined Benefit Pension and Other Postretirement Plans
The Company recognizes on its balance sheet an asset or liability equal to the over- or under-funded benefit obligation of each defined benefit pension and other postretirement plan. Actuarial gains or losses and prior service costs or credits that arise during the period are not recognized as components of net periodic benefit cost, but are recognized, net of tax, as a component of other comprehensive income.
Included in accumulated other comprehensive loss as of December 31, 2017 and 2016 are:
| Pension Benefits |
| Other Postretirement Benefits | ||||||||||||
| December 31, |
| December 31, | ||||||||||||
(In millions) | 2017 |
| 2016 |
| 2017 |
| 2016 | ||||||||
Unrecognized actuarial (gains) losses | $ | (8.6 | ) |
| $ | (9.1 | ) |
| $ | 2.0 | |
| $ | 5.9 | |
Unrecognized prior service costs | 2.0 | |
| 2.0 | |
| 0.7 | |
| - | | ||||
Total | $ | (6.6 | ) |
| $ | (7.1 | ) |
| $ | 2.7 | |
| $ | 5.9 | |
Of the December 31, 2017 amount, the Company expects to recognize approximately $0.1 million of unrecognized actuarial gains and $0.3 million of unrecognized prior service costs in net periodic benefit cost during 2018 . The unrecognized net actuarial losses exceeded 10% of the higher of the market value of plan assets or the projected benefit obligation at the beginning of the year for certain of the plans, therefore, amortization of such excess has been included in net periodic benefit costs for pension and other postretirement benefits in each of the last three years. The amortization period is the average remaining service period that active employees are expected to receive benefits, unless a plan is mostly inactive in which case the amortization period is the average remaining life expectancy of the plan participants. Unrecognized prior service cost is amortized over the future service periods of those employees who are active at the dates of the plan amendments and who are expected to receive benefits. If all or almost all of a plan's participants are inactive, unrecognized prior service cost is amortized over the remaining life expectancy of those participants. The increase in accumulated other comprehensive income in 2017 relating to pension benefits and other postretirement benefits consists of:
(In millions) | Pension Benefits |
| Other Postretirement Benefits | ||||
Unrecognized actuarial (gain)/loss | $ | 2.2 | |
| $ | (3.5 | ) |
Amortization of actuarial (gain)/loss | 1.1 | |
| (0.5 | ) | ||
Unrecognized prior service costs | 0.1 | |
| 0.8 | | ||
Amortization of prior service costs | (0.2 | ) |
| - | | ||
Impact of foreign currency translation | (1.4 | ) |
| - | | ||
Net change | $ | 1.8 | |
| $ | (3.2 | ) |
Components of net periodic benefit cost, change in projected benefit obligation, change in plan assets, funded status, fair value of plan assets, assumptions used to determine net periodic benefit cost, funding policy and estimated future benefit payments are summarized below for the Company's pension plans and other postretirement plans.
139
Table of Contents
Net Periodic Benefit Cost
Components of net periodic benefit cost for the years ended December 31, 2017 , 2016 and 2015 were as follows:
| Pension Benefits |
| Other Postretirement Benefits | ||||||||||||||||||||
| December 31, |
| December 31, | ||||||||||||||||||||
(In millions) | 2017 |
| 2016 |
| 2015 |
| 2017 |
| 2016 |
| 2015 | ||||||||||||
Service cost | $ | 20.1 | |
| $ | 17.4 | |
| $ | 11.9 | |
| $ | 0.7 | |
| $ | 0.6 | |
| $ | 0.6 | |
Interest cost | 13.6 | |
| 8.2 | |
| 4.0 | |
| 1.6 | |
| 1.3 | |
| 1.1 | | ||||||
Expected return on plan assets | (14.3 | ) |
| (10.9 | ) |
| (6.4 | ) |
| - | |
| - | |
| - | | ||||||
Plan curtailment, settlement and termination | (1.7 | ) |
| (2.4 | ) |
| 1.1 | |
| - | |
| - | |
| - | | ||||||
Amortization of prior service costs | 0.2 | |
| 0.3 | |
| 0.3 | |
| - | |
| - | |
| - | | ||||||
Recognized net actuarial losses | 0.3 | |
| 0.8 | |
| 0.9 | |
| 0.4 | |
| 0.3 | |
| 0.3 | | ||||||
Net periodic benefit cost | $ | 18.2 | |
| $ | 13.4 | |
| $ | 11.8 | |
| $ | 2.7 | |
| $ | 2.2 | |
| $ | 2.0 | |
Change in Projected Benefit Obligation, Change in Plan Assets and Funded Status
The table below presents components of the change in projected benefit obligation, change in plan assets and funded status at December 31, 2017 and 2016 .
| Pension Benefits |
| Other Postretirement Benefits | ||||||||||||
(In millions) | 2017 |
| 2016 |
| 2017 |
| 2016 | ||||||||
Change in Projected Benefit Obligation |
|
|
|
|
|
|
| ||||||||
Projected benefit obligation, beginning of year | $ | 632.9 | |
| $ | 234.4 | |
| $ | 38.0 | |
| $ | 26.0 | |
Service cost | 20.1 | |
| 17.4 | |
| 0.7 | |
| 0.6 | | ||||
Interest cost | 13.6 | |
| 8.2 | |
| 1.6 | |
| 1.3 | | ||||
Participant contributions | 1.0 | |
| 1.1 | |
| 0.2 | |
| 0.2 | | ||||
Transferred liabilities | 0.5 | |
| 2.1 | |
| - | |
| - | | ||||
Acquisitions | - | |
| 441.2 | |
| - | |
| 11.1 | | ||||
Plan settlements and terminations | (28.4 | ) |
| (7.9 | ) |
| - | |
| - | | ||||
Actuarial losses (gains) | 9.3 | |
| (28.6 | ) |
| (2.7 | ) |
| 0.7 | | ||||
Benefits paid | (24.5 | ) |
| (17.8 | ) |
| (2.5 | ) |
| (1.9 | ) | ||||
Impact of foreign currency translation | 40.7 | |
| (17.2 | ) |
| (0.2 | ) |
| - | | ||||
Projected benefit obligation, end of year | $ | 665.2 | |
| $ | 632.9 | |
| $ | 35.1 | |
| $ | 38.0 | |
|
|
|
|
|
|
|
| ||||||||
Change in Plan Assets |
|
|
|
|
|
|
| ||||||||
Fair value of plan assets, beginning of year | $ | 291.7 | |
| $ | 162.0 | |
| $ | - | |
| $ | - | |
Actual return on plan assets | 21.7 | |
| 6.1 | |
| - | |
| - | | ||||
Company contributions | 31.5 | |
| 17.4 | |
| 2.3 | |
| 1.8 | | ||||
Participant contributions | 1.0 | |
| 1.1 | |
| 0.2 | |
| 0.1 | | ||||
Acquisitions | - | |
| 128.6 | |
| - | |
| - | | ||||
Transferred assets | 0.5 | |
| 2.1 | |
| - | |
| - | | ||||
Plan settlements | (28.0 | ) |
| (4.0 | ) |
| - | |
| - | | ||||
Benefits paid | (24.5 | ) |
| (17.8 | ) |
| (2.5 | ) |
| (1.9 | ) | ||||
Other | (0.4 | ) |
| (0.8 | ) |
| - | |
| - | | ||||
Impact of foreign currency translation | 2.6 | |
| (3.0 | ) |
| - | |
| - | | ||||
Fair value of plan assets, end of year | 296.1 | |
| 291.7 | |
| - | |
| - | | ||||
Funded status of plans | $ | (369.1 | ) |
| $ | (341.2 | ) |
| $ | (35.1 | ) |
| $ | (38.0 | ) |
140
Table of Contents
Net accrued benefit costs for pension plans and other postretirement benefits are reported in the following components of the Company's Consolidated Balance Sheets at December 31, 2017 and 2016 :
| Pension Benefits |
| Other Postretirement Benefits | ||||||||||||
| December 31, |
| December 31, | ||||||||||||
(In millions) | 2017 |
| 2016 |
| 2017 |
| 2016 | ||||||||
Noncurrent assets | $ | 6.0 | |
| $ | 3.4 | |
| $ | - | |
| $ | - | |
Current liabilities | (11.7 | ) |
| (9.8 | ) |
| (1.6 | ) |
| (1.9 | ) | ||||
Noncurrent liabilities | (363.4 | ) |
| (334.8 | ) |
| (33.5 | ) |
| (36.1 | ) | ||||
Net accrued benefit costs | $ | (369.1 | ) |
| $ | (341.2 | ) |
| $ | (35.1 | ) |
| $ | (38.0 | ) |
The projected benefit obligation is the actuarial present value of benefits attributable to employee service rendered to date, including the effects of estimated future pay increases. The accumulated benefit obligation is the actuarial present value of benefits attributable to employee service rendered to date, but does not include the effects of estimated future pay increases. The accumulated benefit obligation for the Company's pension plans was $598.5 million and $569.6 million at December 31, 2017 and 2016 , respectively.
The projected benefit obligation, accumulated benefit obligation and fair value of plan assets for pension plans with an accumulated benefit obligation in excess of the fair value of plan assets at December 31, 2017 and 2016 were as follows:
| December 31, | ||||||
(In millions) | 2017 |
| 2016 | ||||
Plans with accumulated benefit obligation in excess of plan assets: |
|
|
| ||||
Projected benefit obligation | $ | 530.1 | |
| $ | 493.7 | |
Accumulated benefit obligation | 506.0 | |
| 471.7 | | ||
Fair value of plan assets | 164.8 | |
| 164.3 | | ||
Fair Value of Plan Assets
The Company measures the fair value of plan assets based on the prices that would be received to sell an asset or paid to transfer a liability in an orderly transaction between market participants at the measurement date. Fair value measurements are based on a three-tier hierarchy described in Note 7 Financial Instruments and Risk Management . The table below presents total plan assets by investment category as of December 31, 2017 and 2016 and the classification of each investment category within the fair value hierarchy with respect to the inputs used to measure fair value:
| December 31, 2017 | ||||||||||||||
(In millions) | Level 1 |
| Level 2 |
| Level 3 |
| Total | ||||||||
Cash and cash equivalents | $ | 2.5 | |
| $ | 0.3 | |
| $ | - | |
| $ | 2.8 | |
Equity securities | 65.2 | |
| 71.8 | |
| - | |
| 137.0 | | ||||
Fixed income securities | 45.2 | |
| 57.6 | |
| - | |
| 102.8 | | ||||
Assets held by insurance companies and other | 10.4 | |
| 23.9 | |
| 19.2 | |
| 53.5 | | ||||
Total | $ | 123.3 | |
| $ | 153.6 | |
| $ | 19.2 | |
| $ | 296.1 | |
| December 31, 2016 | ||||||||||||||
(In millions) | Level 1 |
| Level 2 |
| Level 3 |
| Total | ||||||||
Cash and cash equivalents | $ | 0.8 | |
| $ | 0.3 | |
| $ | - | |
| $ | 1.1 | |
Equity securities | 94.5 | |
| 37.8 | |
| - | |
| 132.3 | | ||||
Fixed income securities | 59.5 | |
| 39.6 | |
| - | |
| 99.1 | | ||||
Assets held by insurance companies and other | 8.7 | |
| 19.2 | |
| 31.3 | |
| 59.2 | | ||||
Total | $ | 163.5 | |
| $ | 96.9 | |
| $ | 31.3 | |
| $ | 291.7 | |
141
Table of Contents
Risk tolerance on invested pension plan assets is established through careful consideration of plan liabilities, plan funded status and corporate financial condition. Investment risk is measured and monitored on an ongoing basis through annual liability measures, periodic asset/liability studies and investment portfolio reviews. The Company's investment strategy is to maintain, where possible, a diversified investment portfolio across several asset classes that, when combined with the Company's contributions to the plans, will ensure that required benefit obligations are met.
Assumptions
The following weighted average assumptions were used to determine the benefit obligations for the Company's defined benefit pension and other postretirement plans as of December 31, 2017 and 2016 :
| Pension Benefits |
| Other Postretirement Benefits | ||||||||
| 2017 |
| 2016 |
| 2017 |
| 2016 | ||||
Discount rate | 2.0 | % |
| 2.2 | % |
| 3.7 | % |
| 4.2 | % |
Expected return on plan assets | 4.9 | % |
| 4.9 | % |
| - | % |
| - | % |
Rate of compensation increase | 2.8 | % |
| 2.8 | % |
| - | % |
| - | % |
The following weighted average assumptions were used to determine the net periodic benefit cost for the Company's defined benefit pension and other postretirement benefit plans for the three years in the period ended December 31, 2017 :
| Pension Benefits |
| Other Postretirement Benefits | ||||||||||||||
| 2017 |
| 2016 |
| 2015 |
| 2017 |
| 2016 |
| 2015 | ||||||
Discount rate | 2.2 | % |
| 2.1 | % |
| 2.3 | % |
| 4.2 | % |
| 4.3 | % |
| 4.0 | % |
Expected return on plan assets | 5.0 | % |
| 4.9 | % |
| 4.5 | % |
| - | % |
| - | % |
| - | % |
Rate of compensation increase | 2.8 | % |
| 3.2 | % |
| 5.2 | % |
| - | % |
| - | % |
| - | % |
The assumptions for each plan are reviewed on an annual basis. The discount rate reflects the current rate at which the pension and other benefit liabilities could be effectively settled at the measurement date. In setting the discount rates, we utilize comparable corporate bond indices as an indication of interest rate movements and levels. Corporate bond indices were selected based on individual plan census data and duration. The expected return on plan assets was determined using historical market returns and long-term historical relationships between equities and fixed income securities. The Company compares the expected return on plan assets assumption to actual historic returns to ensure reasonableness. Current market factors such as inflation and interest rates are also evaluated.
The weighted-average healthcare cost trend rate used for 2017 was 7.5% declining to a projected 5.0% in the year 2022 . For 2018 , the assumed weighted-average healthcare cost trend rate used will be 7.5% declining to a projected 5.0% in the year 2023 . In selecting rates for current and long-term healthcare cost assumptions, the Company takes into consideration a number of factors including the Company's actual healthcare cost increases, the design of the Company's benefit programs, the demographics of the Company's active and retiree populations and external expectations of future medical cost inflation rates. If these 2018 healthcare cost trend rates were increased or decreased by one percentage point per year, such increase or decrease would have the following effects:
(In millions) | Increase |
| Decrease | ||||
Increase (decrease) in the aggregate of service and interest cost components of annual expense | $ | 0.1 | |
| $ | (0.1 | ) |
Increase (decrease) in the projected benefit obligation | 1.1 | |
| (1.0 | ) | ||
Estimated Future Benefit Payments
The Company's funding policy for its funded pension plans is based upon local statutory requirements. The Company's funding policy is subject to certain statutory regulations with respect to annual minimum and maximum company contributions. Plan benefits for the nonqualified plans are paid as they come due.
142
Table of Contents
Estimated benefit payments over the next ten years for the Company's pension plans and retiree health plan are as follows:
(In millions) | Pension Benefits |
| Other Postretirement Benefits | ||||
2018 | $ | 31.1 | |
| $ | 1.7 | |
2019 | 30.1 | |
| 1.7 | | ||
2020 | 35.1 | |
| 1.9 | | ||
2021 | 34.3 | |
| 1.9 | | ||
2022 | 35.2 | |
| 2.2 | | ||
Thereafter | 191.5 | |
| 11.2 | | ||
Total | $ | 357.3 | |
| $ | 20.6 | |
Defined Contribution Plans
The Company sponsors defined contribution plans covering its employees in the U.S. and Puerto Rico, as well as certain employees in a number of countries outside the U.S. The Company's domestic defined contribution plans consist primarily of a 401(k) retirement plan with a profit sharing component for non-union represented employees (the "Profit Sharing 401(k) Plan") and a 401(k) retirement plan for union-represented employees. Profit sharing contributions are made at the discretion of the Board of Directors. The Company's non-domestic plans vary in form depending on local legal requirements. The Company's contributions are based upon employee contributions, service hours, or pre-determined amounts depending upon the plan. Obligations for contributions to defined contribution plans are recognized as expense in the Consolidated Statements of Operations when they are earned.
The Company adopted a 401(k) Restoration Plan (the "Restoration Plan"), which permits employees who earn compensation in excess of the limits imposed by Section 401(a)(17) of the Code to (i) defer a portion of base salary and bonus compensation, (ii) be credited with a Company matching contribution in respect of deferrals under the Restoration Plan, and (iii) be credited with Company non-elective contributions (to the extent so made by the Company), in each case, to the extent that participants otherwise would be able to defer or be credited with such amounts, as applicable, under the Profit Sharing 401(k) Plan if not for the limits on contributions and deferrals imposed by the Code.
The Company adopted an Income Deferral Plan, which permits certain management or highly compensated employees who are designated by the plan administrator to participate in the Income Deferral Plan to elect to defer up to 50% of base salary and up to 100% of bonus compensation, in each case, in addition to any amounts that may be deferred by such participants under the Profit Sharing 401(k) Plan and the Restoration Plan. In addition, under the Income Deferral Plan, eligible participants may be granted employee deferral awards, which awards will be subject to the terms and conditions (including vesting) as determined by the plan administrator at the time such awards are granted.
Total employer contributions to defined contribution plans were approximately $95.9 million , $95.6 million and $102.4 million for the years ended December 31, 2017 , 2016 and 2015 , respectively.
Other Benefit Arrangements
The Company participated in a multi-employer pension plan under previous collective bargaining agreements. The PACE Industry Union-Management Pension Fund (the "Plan") provides defined benefits to certain retirees and certain production and maintenance employees at the Company's manufacturing facility in Morgantown, West Virginia who were covered by the previous collective bargaining agreements. Pursuant to a collective bargaining agreement entered into on April 16, 2012, the Company withdrew from the Plan effective May 10, 2012. In the fourth quarter of 2013, the Plan trustee notified the Company that its withdrawal liability was approximately $27.3 million , which was accrued by the Company at December 31, 2013. The withdrawal liability is being paid over a period of approximately nine years; payments began in March 2014 . The withdrawal liability was approximately $18.1 million and $20.7 million at December 31, 2017 and 2016 , respectively. The Employee Identification Number for this Plan is 11-6166763.
143
Table of Contents
13. | Segment Information |
The Company has three reportable segments on a geographic basis as follows: North America, Europe and Rest of World. Our North America segment is primarily made up of our operations in the U.S. and Canada, and also includes the operations of our specialty pharmaceuticals business. Our Europe segment is made up of our operations in over 35 countries within the region, including France, Italy, Germany, the U.K. and Spain. Our Rest of World segment is made up of our activities in over 120 countries, including our operations in Japan, Australia, China, Brazil, Russia, India, South Africa, and certain markets in the Middle-East and South East Asia.
The Company's chief operating decision maker is the Chief Executive Officer, who evaluates the performance of its segments based on total revenues and segment profitability. Segment profitability represents segment gross profit less direct R&D expenses and direct SG&A expenses. Certain general and administrative and R&D expenses not allocated to the segments, net charges for litigation settlements and other contingencies, impairment charges and other expenses not directly attributable to the segments and certain intercompany transactions, including eliminations, are reported in Corporate/Other. Additionally, amortization of intangible assets and other purchase accounting related items, as well as certain other significant special items, are included in Corporate/Other. Items below the earnings from operations line on the Company's Consolidated Statements of Operations are not presented by segment, since they are excluded from the measure of segment profitability. The Company does not report depreciation expense, total assets and capital expenditures by segment, as such information is not used by the chief operating decision maker.
The accounting policies of the segments are the same as those described in Note 2 Summary of Significant Accounting Policies . Intersegment revenues are accounted for at current market values and are eliminated at the consolidated level.
Presented in the table below is segment information for the periods identified and a reconciliation of segment information to total consolidated information.
(In millions) | North America |
| Europe |
| Rest of World |
| Corporate / Other |
| Consolidated | ||||||||||
Year Ended December 31, 2017 |
|
|
|
|
|
|
|
|
| ||||||||||
Third party net sales | $ | 4,969.6 | |
| $ | 3,958.3 | |
| $ | 2,832.1 | |
| $ | - | |
| $ | 11,760.0 | |
Other revenue | 86.5 | |
| 36.5 | |
| 24.7 | |
| - | |
| 147.7 | | |||||
Intersegment revenue | 74.6 | |
| 112.4 | |
| 379.2 | |
| (566.2 | ) |
| - | | |||||
Total | $ | 5,130.7 | |
| $ | 4,107.2 | |
| $ | 3,236.0 | |
| $ | (566.2 | ) |
| $ | 11,907.7 | |
|
|
|
|
|
|
|
|
|
| ||||||||||
Segment profitability | $ | 2,497.1 | |
| $ | 1,082.8 | |
| $ | 650.9 | |
| $ | (2,793.7 | ) |
| $ | 1,437.1 | |
Year Ended December 31, 2016 |
|
|
|
|
|
|
|
|
| ||||||||||
Third party net sales | $ | 5,629.5 | |
| $ | 2,953.8 | |
| $ | 2,383.8 | |
| $ | - | |
| $ | 10,967.1 | |
Other revenue | 88.4 | |
| 12.6 | |
| 8.8 | |
| - | |
| 109.8 | | |||||
Intersegment revenue | 45.4 | |
| 106.3 | |
| 407.6 | |
| (559.3 | ) |
| - | | |||||
Total | $ | 5,763.3 | |
| $ | 3,072.7 | |
| $ | 2,800.2 | |
| $ | (559.3 | ) |
| $ | 11,076.9 | |
|
|
|
|
|
|
|
|
|
| ||||||||||
Segment profitability | $ | 2,921.2 | |
| $ | 669.4 | |
| $ | 423.5 | |
| $ | (3,312.5 | ) |
| $ | 701.6 | |
Year Ended December 31, 2015 |
|
|
|
|
|
|
|
|
| ||||||||||
Third party net sales | $ | 5,100.4 | |
| $ | 2,205.6 | |
| $ | 2,056.6 | |
| $ | - | |
| $ | 9,362.6 | |
Other revenue | 55.3 | |
| 5.3 | |
| 6.1 | |
| - | |
| 66.7 | | |||||
Intersegment revenue | 26.5 | |
| 109.9 | |
| 378.0 | |
| (514.4 | ) |
| - | | |||||
Total | $ | 5,182.2 | |
| $ | 2,320.8 | |
| $ | 2,440.7 | |
| $ | (514.4 | ) |
| $ | 9,429.3 | |
|
|
|
|
|
|
|
|
|
| ||||||||||
Segment profitability | $ | 2,720.8 | |
| $ | 421.5 | |
| $ | 320.7 | |
| $ | (2,002.1 | ) |
| $ | 1,460.9 | |
144
Table of Contents
The Company's third party net sales are generated via the sale of products in the following therapeutic franchises:
| Year Ended December 31, | ||||||||||
(In millions) | 2017 |
| 2016 |
| 2015 | ||||||
Central Nervous System and Anesthesia | $ | 2,238.2 | |
| $ | 2,030.4 | |
| $ | 1,724.7 | |
Respiratory and Allergy | 1,382.5 | |
| 1,813.1 | |
| 1,500.3 | | |||
Infectious Disease | 1,463.2 | |
| 1,303.0 | |
| 1,322.2 | | |||
Cardiovascular | 1,219.5 | |
| 1,165.1 | |
| 1,075.3 | | |||
Gastroenterology | 1,114.5 | |
| 1,029.3 | |
| 830.5 | | |||
Diabetes and Metabolism | 947.1 | |
| 972.0 | |
| 935.2 | | |||
Oncology | 700.6 | |
| 764.2 | |
| 633.3 | | |||
Women's Healthcare | 711.6 | |
| 593.5 | |
| 467.7 | | |||
Dermatology | 911.0 | |
| 369.5 | |
| 226.6 | | |||
Immunology | 145.4 | |
| 133.1 | |
| 118.1 | | |||
Other (1) | 926.4 | |
| 793.9 | |
| 528.7 | | |||
| $ | 11,760.0 | |
| $ | 10,967.1 | |
| $ | 9,362.6 | |
(1) | Other consists of numerous therapeutic franchises, none of which individually exceeds 5% of consolidated net sales. |
The following table represents the percentage of consolidated third party net sales to Mylan's major customers during the years ended December 31, 2017 , 2016 , and 2015 .
| Percentage of Third Party Net Sales | |||||||
| 2017 |
| 2016 |
| 2015 | |||
McKesson Corporation | 13 | % |
| 16 | % |
| 15 | % |
AmerisourceBergen Corporation | 8 | % |
| 14 | % |
| 16 | % |
Cardinal Health, Inc. | 10 | % |
| 11 | % |
| 12 | % |
Sales by Country Information
Third party net sales by country are presented on the basis of geographic location of our subsidiaries:
| Year Ended December 31, | ||||||||||
(In millions) | 2017 |
| 2016 |
| 2015 | ||||||
United States | $ | 4,683.7 | |
| $ | 5,385.6 | |
| $ | 4,848.9 | |
India | 1,082.6 | |
| 985.8 | |
| 1,033.4 | | |||
The Netherlands (1) | 117.5 | |
| 88.3 | |
| 66.5 | | |||
Other countries (2) | 5,876.2 | |
| 4,507.4 | |
| 3,413.8 | | |||
| $ | 11,760.0 | |
| $ | 10,967.1 | |
| $ | 9,362.6 | |
____________
(1) | Mylan N.V. has its corporate seat in the Netherlands. |
(2) | No other country's net sales represents more than 10% of consolidated net sales for the years ended December 31, 2017 , 2016 and 2015 , respectively. |
14. | Commitments |
Operating Leases
The Company leases certain property under various operating lease arrangements. These leases generally provide the Company with the option to renew the lease at the end of the lease term. For the years ended December 31, 2017 , 2016 and 2015 , the Company had operating lease expense of approximately $83.8 million , $70.8 million and $57.1 million , respectively.
145
Table of Contents
Future minimum lease payments under operating lease commitments are as follows:
(In millions) |
| ||
December 31, |
| ||
2018 | $ | 76.1 | |
2019 | 64.5 | | |
2020 | 42.0 | | |
2021 | 28.3 | | |
2022 | 19.6 | | |
Thereafter | 51.2 | | |
| $ | 281.7 | |
Other Commitments
The Company has also entered into employment and other agreements with certain executives and other employees that provide for compensation, retirement and certain other benefits. These agreements provide for severance payments under certain circumstances. Additionally, the Company has split-dollar life insurance agreements with certain retired executives.
In the normal course of business, Mylan periodically enters into employment, legal settlement and other agreements which incorporate indemnification provisions. While the maximum amount to which Mylan may be exposed under such agreements cannot be reasonably estimated, the Company maintains insurance coverage, which management believes will effectively mitigate the Company's obligations under these indemnification provisions. No amounts have been recorded in the Consolidated Financial Statements with respect to the Company's obligations under such agreements.
15. | Subsidiary Guarantors |
The following tables present condensed consolidating financial information for (a) Mylan N.V., the issuer of the 3.000% Senior Notes due 2018, 2.500% Senior Notes due 2019, 3.750% Senior Notes due 2020, 3.150% Senior Notes due 2021, 3.950% Senior Notes due 2026 and 5.250% Senior Notes due 2046 (collectively, the "Mylan N.V. Senior Notes"), which are guaranteed on a senior unsecured basis by Mylan Inc.; (b) Mylan Inc., the issuer of the 2.600% Senior Notes due 2018, 2.550% Senior Notes due 2019, 3.125% Senior Notes due 2023, 4.200% Senior Notes due 2023 and 5.400% Senior Notes due 2043 (collectively, the "Mylan Inc. Senior Notes"), which are guaranteed on a senior unsecured basis by Mylan N.V.; and (c) all other subsidiaries of the Company on a combined basis, none of which guarantee the Mylan N.V. Senior Notes or guarantee the Mylan Inc. Senior Notes ("Non-Guarantor Subsidiaries"). The consolidating adjustments primarily relate to eliminations of investments in subsidiaries and intercompany balances and transactions. The condensed consolidating financial statements present investments in subsidiaries using the equity method of accounting.
The following financial information presents the related Condensed Consolidating Balance Sheet as of December 31, 2017 and 2016 and the related Condensed Consolidating Statements of Operations, Condensed Consolidating Statements of Comprehensive Earnings and Condensed Consolidating Statements of Cash Flows for each of the three years in the period ended December 31, 2017 . This condensed consolidating financial information has been prepared and presented in accordance with SEC Regulation S-X Rule 3-10 "Financial Statements of Guarantors and Issuers of Guaranteed Securities Registered or Being Registered."
The Company has revised its consolidating balance sheet as previously presented in the 2016 Annual Report on Form 10-K to appropriately present intercompany activity relating to certain subsidiaries which were included in the Mylan Inc. column. The Company understated the line items investment in subsidiaries and total equity within the Mylan Inc. column with a corresponding offset to the elimination column. Specifically, the balance sheet caption investment in subsidiaries has been revised from the previously reported amount of $8.28 billion as of December 31, 2016 to $13.42 billion with an offset to total equity. There is no impact to the consolidated financial statements of Mylan N.V. as previously filed in the 2016 Annual Report on Form 10-K.
146
Table of Contents
CONDENSED CONSOLIDATING BALANCE SHEET
As of December 31, 2017
(In millions) | Mylan N.V. |
| Mylan Inc. |
| Guarantor Subsidiaries |
| Non-Guarantor Subsidiaries |
| Eliminations |
| Consolidated | ||||||||||||
ASSETS |
|
|
|
|
|
|
|
|
|
|
| ||||||||||||
Assets |
|
|
|
|
|
|
|
|
|
|
| ||||||||||||
Current assets: |
|
|
|
|
|
|
|
|
|
|
| ||||||||||||
Cash and cash equivalents | $ | - | |
| $ | 0.2 | |
| $ | - | |
| $ | 291.9 | |
| $ | - | |
| $ | 292.1 | |
Accounts receivable, net | - | |
| 1.0 | |
| - | |
| 3,611.4 | |
| - | |
| 3,612.4 | | ||||||
Inventories | - | |
| - | |
| - | |
| 2,542.7 | |
| - | |
| 2,542.7 | | ||||||
Intercompany receivables | 317.2 | |
| 462.1 | |
| - | |
| 11,828.5 | |
| (12,607.8 | ) |
| - | | ||||||
Prepaid expenses and other current assets | 5.6 | |
| 171.1 | |
| - | |
| 589.4 | |
| - | |
| 766.1 | | ||||||
Total current assets | 322.8 | |
| 634.4 | |
| - | |
| 18,863.9 | |
| (12,607.8 | ) |
| 7,213.3 | | ||||||
Property, plant and equipment, net | - | |
| 294.1 | |
| - | |
| 2,045.0 | |
| - | |
| 2,339.1 | | ||||||
Investments in subsidiaries | 19,736.5 | |
| 15,288.3 | |
| - | |
| - | |
| (35,024.8 | ) |
| - | | ||||||
Intercompany notes and interest receivable | 7,822.6 | |
| 10,271.2 | |
| - | |
| 2,186.3 | |
| (20,280.1 | ) |
| - | | ||||||
Intangible assets, net | - | |
| - | |
| - | |
| 15,245.8 | |
| - | |
| 15,245.8 | | ||||||
Goodwill | - | |
| 17.1 | |
| - | |
| 10,188.6 | |
| - | |
| 10,205.7 | | ||||||
Other assets | 4.9 | |
| 56.5 | |
| - | |
| 741.0 | |
| - | |
| 802.4 | | ||||||
Total assets | $ | 27,886.8 | |
| $ | 26,561.6 | |
| $ | - | |
| $ | 49,270.6 | |
| $ | (67,912.7 | ) |
| $ | 35,806.3 | |
|
|
|
|
|
|
|
|
|
|
|
| ||||||||||||
LIABILITIES AND EQUITY |
|
|
|
|
|
|
|
|
|
|
| ||||||||||||
Liabilities |
|
|
|
|
|
|
|
|
|
|
| ||||||||||||
Current liabilities: |
|
|
|
|
|
|
|
|
|
|
| ||||||||||||
Trade accounts payable | $ | - | |
| $ | 45.3 | |
| $ | - | |
| $ | 1,407.2 | |
| $ | - | |
| $ | 1,452.5 | |
Short-term borrowings | - | |
| - | |
| - | |
| 46.5 | |
| - | |
| 46.5 | | ||||||
Income taxes payable | - | |
| - | |
| - | |
| 112.9 | |
| - | |
| 112.9 | | ||||||
Current portion of long-term debt and other long-term obligations | 1,097.8 | |
| 649.1 | |
| - | |
| 62.0 | |
| - | |
| 1,808.9 | | ||||||
Intercompany payables | 664.7 | |
| 11,911.5 | |
| - | |
| 31.6 | |
| (12,607.8 | ) |
| - | | ||||||
Other current liabilities | 35.5 | |
| 397.0 | |
| - | |
| 2,532.0 | |
| - | |
| 2,964.5 | | ||||||
Total current liabilities | 1,798.0 | |
| 13,002.9 | |
| - | |
| 4,192.2 | |
| (12,607.8 | ) |
| 6,385.3 | | ||||||
Long-term debt | 10,614.3 | |
| 2,244.5 | |
| - | |
| 6.5 | |
| - | |
| 12,865.3 | | ||||||
Intercompany notes payable | 2,166.9 | |
| 3,312.7 | |
| - | |
| 14,800.5 | |
| (20,280.1 | ) |
| - | | ||||||
Other long-term obligations | - | |
| 57.3 | |
| - | |
| 3,190.8 | |
| - | |
| 3,248.1 | | ||||||
Total liabilities | 14,579.2 | |
| 18,617.4 | |
| - | |
| 22,190.0 | |
| (32,887.9 | ) |
| 22,498.7 | | ||||||
|
|
|
|
|
|
|
|
|
|
|
| ||||||||||||
Total equity | 13,307.6 | |
| 7,944.2 | |
| - | |
| 27,080.6 | |
| (35,024.8 | ) |
| 13,307.6 | | ||||||
|
|
|
|
|
|
|
|
|
|
|
| ||||||||||||
Total liabilities and equity | $ | 27,886.8 | |
| $ | 26,561.6 | |
| $ | - | |
| $ | 49,270.6 | |
| $ | (67,912.7 | ) |
| $ | 35,806.3 | |
147
Table of Contents
CONDENSED CONSOLIDATING BALANCE SHEET
As of December 31, 2016
(In millions) | Mylan N.V. |
| Mylan Inc. |
| Guarantor Subsidiaries |
| Non-Guarantor Subsidiaries |
| Eliminations |
| Consolidated | ||||||||||||
ASSETS |
|
|
|
|
|
|
|
|
|
|
| ||||||||||||
Assets |
|
|
|
|
|
|
|
|
|
|
| ||||||||||||
Current assets: |
|
|
|
|
|
|
|
|
|
|
| ||||||||||||
Cash and cash equivalents | $ | 0.3 | |
| $ | 12.3 | |
| $ | - | |
| $ | 986.2 | |
| $ | - | |
| $ | 998.8 | |
Accounts receivable, net | - | |
| 12.3 | |
| - | |
| 3,298.6 | |
| - | |
| 3,310.9 | | ||||||
Inventories | - | |
| - | |
| - | |
| 2,456.4 | |
| - | |
| 2,456.4 | | ||||||
Intercompany receivables | 215.9 | |
| 416.0 | |
| - | |
| 10,506.6 | |
| (11,138.5 | ) |
| - | | ||||||
Prepaid expenses and other current assets | - | |
| 256.4 | |
| - | |
| 500.0 | |
| - | |
| 756.4 | | ||||||
Total current assets | 216.2 | |
| 697.0 | |
| - | |
| 17,747.8 | |
| (11,138.5 | ) |
| 7,522.5 | | ||||||
Property, plant and equipment, net | - | |
| 360.3 | |
| - | |
| 1,961.9 | |
| - | |
| 2,322.2 | | ||||||
Investments in subsidiaries | 15,606.2 | |
| 13,424.1 | |
| - | |
| - | |
| (29,030.3 | ) |
| - | | ||||||
Intercompany notes and interest receivable | 7,952.3 | |
| 9,817.3 | |
| - | |
| 16.7 | |
| (17,786.3 | ) |
| - | | ||||||
Intangible assets, net | - | |
| - | |
| - | |
| 14,447.8 | |
| - | |
| 14,447.8 | | ||||||
Goodwill | - | |
| 17.1 | |
| - | |
| 9,214.8 | |
| - | |
| 9,231.9 | | ||||||
Other assets | 5.2 | |
| 51.9 | |
| - | |
| 1,144.7 | |
| - | |
| 1,201.8 | | ||||||
Total assets | $ | 23,779.9 | |
| $ | 24,367.7 | |
| $ | - | |
| $ | 44,533.7 | |
| $ | (57,955.1 | ) |
| $ | 34,726.2 | |
|
|
|
|
|
|
|
|
|
|
|
| ||||||||||||
LIABILITIES AND EQUITY |
|
|
|
|
|
|
|
|
|
|
| ||||||||||||
Liabilities |
|
|
|
|
|
|
|
|
|
|
| ||||||||||||
Current liabilities: |
|
|
|
|
|
|
|
|
|
|
| ||||||||||||
Trade accounts payable | $ | 3.9 | |
| $ | 69.6 | |
| $ | - | |
| $ | 1,274.6 | |
| $ | - | |
| $ | 1,348.1 | |
Short-term borrowings | - | |
| - | |
| - | |
| 46.4 | |
| - | |
| 46.4 | | ||||||
Income taxes payable | - | |
| - | |
| - | |
| 97.7 | |
| - | |
| 97.7 | | ||||||
Current portion of long-term debt and other long-term obligations | - | |
| 0.2 | |
| - | |
| 289.8 | |
| - | |
| 290.0 | | ||||||
Intercompany payables | 416.0 | |
| 10,722.5 | |
| - | |
| - | |
| (11,138.5 | ) |
| - | | ||||||
Other current liabilities | 90.9 | |
| 388.8 | |
| - | |
| 2,778.8 | |
| - | |
| 3,258.5 | | ||||||
Total current liabilities | 510.8 | |
| 11,181.1 | |
| - | |
| 4,487.3 | |
| (11,138.5 | ) |
| 5,040.7 | | ||||||
Long-term debt | 12,151.5 | |
| 2,897.6 | |
| - | |
| 153.8 | |
| - | |
| 15,202.9 | | ||||||
Intercompany notes payable | - | |
| 3,870.9 | |
| - | |
| 13,915.4 | |
| (17,786.3 | ) |
| - | | ||||||
Other long-term obligations | - | |
| 58.1 | |
| - | |
| 3,306.9 | |
| - | |
| 3,365.0 | | ||||||
Total liabilities | 12,662.3 | |
| 18,007.7 | |
| - | |
| 21,863.4 | |
| (28,924.8 | ) |
| 23,608.6 | | ||||||
|
|
|
|
|
|
|
|
|
|
|
| ||||||||||||
Total equity | 11,117.6 | |
| 6,360.0 | |
| - | |
| 22,670.3 | |
| (29,030.3 | ) |
| 11,117.6 | | ||||||
|
|
|
|
|
|
|
|
|
|
|
| ||||||||||||
Total liabilities and equity | $ | 23,779.9 | |
| $ | 24,367.7 | |
| $ | - | |
| $ | 44,533.7 | |
| $ | (57,955.1 | ) |
| $ | 34,726.2 | |
148
Table of Contents
CONDENSED CONSOLIDATING STATEMENT OF OPERATIONS
Year Ended December 31, 2017
(In millions) | Mylan N.V. |
| Mylan Inc. |
| Guarantor Subsidiaries |
| Non-Guarantor Subsidiaries |
| Eliminations |
| Consolidated | ||||||||||||
Revenues: |
|
|
|
|
|
|
|
|
|
|
| ||||||||||||
Net sales | $ | - | |
| $ | - | |
| $ | - | |
| $ | 11,760.0 | |
| $ | - | |
| $ | 11,760.0 | |
Other revenues | - | |
| - | |
| - | |
| 147.7 | |
| - | |
| 147.7 | | ||||||
Total revenues | - | |
| - | |
| - | |
| 11,907.7 | |
| - | |
| 11,907.7 | | ||||||
Cost of sales | - | |
| - | |
| - | |
| 7,124.6 | |
| - | |
| 7,124.6 | | ||||||
Gross profit | - | |
| - | |
| - | |
| 4,783.1 | |
| - | |
| 4,783.1 | | ||||||
Operating expenses: |
|
|
|
|
|
|
|
|
|
|
| ||||||||||||
Research and development | - | |
| - | |
| - | |
| 783.3 | |
| - | |
| 783.3 | | ||||||
Selling, general and administrative | 45.5 | |
| 650.9 | |
| - | |
| 1,879.4 | |
| - | |
| 2,575.8 | | ||||||
Litigation settlements and other contingencies, net | - | |
| 17.0 | |
| - | |
| (30.1 | ) |
| - | |
| (13.1 | ) | ||||||
Total operating expenses | 45.5 | |
| 667.9 | |
| - | |
| 2,632.6 | |
| - | |
| 3,346.0 | | ||||||
(Losses) earnings from operations | (45.5 | ) |
| (667.9 | ) |
| - | |
| 2,150.5 | |
| - | |
| 1,437.1 | | ||||||
Interest expense | 378.0 | |
| 104.1 | |
| - | |
| 52.5 | |
| - | |
| 534.6 | | ||||||
Other (income) expense, net | (484.9 | ) |
| (264.6 | ) |
| - | |
| 749.0 | |
| - | |
| (0.5 | ) | ||||||
Earnings (losses) before income taxes | 61.4 | |
| (507.4 | ) |
| - | |
| 1,349.0 | |
| - | |
| 903.0 | | ||||||
Income tax (benefit) provision | (21.1 | ) |
| (14.0 | ) |
| - | |
| 242.1 | |
| - | |
| 207.0 | | ||||||
Earnings of equity interest subsidiaries | 613.5 | |
| 886.4 | |
| - | |
| - | |
| (1,499.9 | ) |
| - | | ||||||
Net earnings | $ | 696.0 | |
| $ | 393.0 | |
| $ | - | |
| $ | 1,106.9 | |
| $ | (1,499.9 | ) |
| $ | 696.0 | |
149
Table of Contents
CONDENSED CONSOLIDATING STATEMENT OF OPERATIONS
Year Ended December 31, 2016
(In millions) | Mylan N.V. |
| Mylan Inc. |
| Guarantor Subsidiaries |
| Non-Guarantor Subsidiaries |
| Eliminations |
| Consolidated | ||||||||||||
Revenues: |
|
|
|
|
|
|
|
|
|
|
| ||||||||||||
Net sales | $ | - | |
| $ | - | |
| $ | - | |
| $ | 10,967.1 | |
| $ | - | |
| $ | 10,967.1 | |
Other revenues | - | |
| - | |
| - | |
| 109.8 | |
| - | |
| 109.8 | | ||||||
Total revenues | - | |
| - | |
| - | |
| 11,076.9 | |
| - | |
| 11,076.9 | | ||||||
Cost of sales | - | |
| - | |
| - | |
| 6,379.9 | |
| - | |
| 6,379.9 | | ||||||
Gross profit | - | |
| - | |
| - | |
| 4,697.0 | |
| - | |
| 4,697.0 | | ||||||
Operating expenses: |
|
|
|
|
|
|
|
|
|
|
| ||||||||||||
Research and development | - | |
| - | |
| - | |
| 826.8 | |
| - | |
| 826.8 | | ||||||
Selling, general and administrative | 71.6 | |
| 664.1 | |
| - | |
| 1,760.4 | |
| - | |
| 2,496.1 | | ||||||
Litigation settlements and other contingencies, net | - | |
| - | |
| - | |
| 672.5 | |
| - | |
| 672.5 | | ||||||
Total operating expenses | 71.6 | |
| 664.1 | |
| - | |
| 3,259.7 | |
| - | |
| 3,995.4 | | ||||||
(Losses) earnings from operations | (71.6 | ) |
| (664.1 | ) |
| - | |
| 1,437.3 | |
| - | |
| 701.6 | | ||||||
Interest expense | 198.4 | |
| 161.3 | |
| - | |
| 95.1 | |
| - | |
| 454.8 | | ||||||
Other (income) expense, net | (55.6 | ) |
| (193.2 | ) |
| - | |
| 373.9 | |
| - | |
| 125.1 | | ||||||
(Losses) earnings before income taxes and noncontrolling interest | (214.4 | ) |
| (632.2 | ) |
| - | |
| 968.3 | |
| - | |
| 121.7 | | ||||||
Income tax benefit | (19.5 | ) |
| (18.2 | ) |
| - | |
| (320.6 | ) |
| - | |
| (358.3 | ) | ||||||
Earnings of equity interest subsidiaries | 674.9 | |
| 1,360.2 | |
| - | |
| - | |
| (2,035.1 | ) |
| - | | ||||||
Net earnings | $ | 480.0 | |
| $ | 746.2 | |
| $ | - | |
| $ | 1,288.9 | |
| $ | (2,035.1 | ) |
| $ | 480.0 | |
150
Table of Contents
CONDENSED CONSOLIDATING STATEMENT OF OPERATIONS
Year Ended December 31, 2015
(In millions) | Mylan N.V. |
| Mylan Inc. |
| Guarantor Subsidiaries |
| Non-Guarantor Subsidiaries |
| Eliminations |
| Consolidated | ||||||||||||
Revenues: |
|
|
|
|
|
|
|
|
|
|
| ||||||||||||
Net sales | $ | - | |
| $ | - | |
| $ | - | |
| $ | 9,362.6 | |
| $ | - | |
| $ | 9,362.6 | |
Other revenues | - | |
| - | |
| - | |
| 66.7 | |
| - | |
| 66.7 | | ||||||
Total revenues | - | |
| - | |
| - | |
| 9,429.3 | |
| - | |
| 9,429.3 | | ||||||
Cost of sales | - | |
| - | |
| - | |
| 5,213.2 | |
| - | |
| 5,213.2 | | ||||||
Gross profit | - | |
| - | |
| - | |
| 4,216.1 | |
| - | |
| 4,216.1 | | ||||||
Operating expenses: |
|
|
|
|
|
|
|
|
|
|
| ||||||||||||
Research and development | - | |
| - | |
| - | |
| 671.9 | |
| - | |
| 671.9 | | ||||||
Selling, general and administrative | 106.1 | |
| 572.1 | |
| - | |
| 1,502.5 | |
| - | |
| 2,180.7 | | ||||||
Litigation settlements and other contingencies, net | - | |
| - | |
| - | |
| (97.4 | ) |
| - | |
| (97.4 | ) | ||||||
Total operating expenses | 106.1 | |
| 572.1 | |
| - | |
| 2,077.0 | |
| - | |
| 2,755.2 | | ||||||
(Losses) earnings from operations | (106.1 | ) |
| (572.1 | ) |
| - | |
| 2,139.1 | |
| - | |
| 1,460.9 | | ||||||
Interest expense | 58.3 | |
| 217.9 | |
| - | |
| 63.2 | |
| - | |
| 339.4 | | ||||||
Other expense, net | 41.1 | |
| - | |
| - | |
| 165.0 | |
| - | |
| 206.1 | | ||||||
(Losses) earnings before income taxes and noncontrolling interest | (205.5 | ) |
| (790.0 | ) |
| - | |
| 1,910.9 | |
| - | |
| 915.4 | | ||||||
Income tax (benefit) provision | - | |
| (23.2 | ) |
| - | |
| 90.9 | |
| - | |
| 67.7 | | ||||||
Earnings of equity interest subsidiaries | 1,053.2 | |
| 1,814.8 | |
| - | |
| - | |
| (2,868.0 | ) |
| - | | ||||||
Net earnings | 847.7 | |
| 1,048.0 | |
| - | |
| 1,820.0 | |
| (2,868.0 | ) |
| 847.7 | | ||||||
Net earnings attributable to noncontrolling interest | (0.1 | ) |
| - | |
| - | |
| (0.1 | ) |
| 0.1 | |
| (0.1 | ) | ||||||
Net earnings attributable to Mylan N.V. ordinary shareholders | $ | 847.6 | |
| $ | 1,048.0 | |
| $ | - | |
| $ | 1,819.9 | |
| $ | (2,867.9 | ) |
| $ | 847.6 | |
151
Table of Contents
CONDENSED CONSOLIDATING STATEMENT OF COMPREHENSIVE EARNINGS
Year Ended December 31, 2017
(In millions) | Mylan N.V. |
| Mylan Inc. |
| Guarantor Subsidiaries |
| Non-Guarantor Subsidiaries |
| Eliminations |
| Consolidated | ||||||||||||
Net earnings | $ | 696.0 | |
| $ | 393.0 | |
| $ | - | |
| $ | 1,106.9 | |
| $ | (1,499.9 | ) |
| $ | 696.0 | |
Other comprehensive earnings, before tax: |
|
|
|
|
|
|
|
|
|
|
| ||||||||||||
Foreign currency translation adjustment | 2,103.9 | |
| - | |
| - | |
| 2,103.9 | |
| (2,103.9 | ) |
| 2,103.9 | | ||||||
Change in unrecognized gain and prior service cost related to defined benefit plans | 3.8 | |
| 3.0 | |
| - | |
| 0.8 | |
| (3.8 | ) |
| 3.8 | | ||||||
Net unrecognized gain on derivatives in cash flow hedging relationships | 52.7 | |
| 7.3 | |
| - | |
| 45.4 | |
| (52.7 | ) |
| 52.7 | | ||||||
Net unrecognized loss on derivatives in net investment hedging relationships | (238.4 | ) |
| - | |
| - | |
| - | |
| - | |
| (238.4 | ) | ||||||
Net unrealized loss on marketable securities | (6.7 | ) |
| (6.4 | ) |
| - | |
| (0.3 | ) |
| 6.7 | |
| (6.7 | ) | ||||||
Other comprehensive earnings, before tax | 1,915.3 | |
| 3.9 | |
| - | |
| 2,149.8 | |
| (2,153.7 | ) |
| 1,915.3 | | ||||||
Income tax provision (benefit) | 12.8 | |
| (1.6 | ) |
| - | |
| 14.4 | |
| (12.8 | ) |
| 12.8 | | ||||||
Other comprehensive earnings, net of tax | 1,902.5 | |
| 5.5 | |
| - | |
| 2,135.4 | |
| (2,140.9 | ) |
| 1,902.5 | | ||||||
Comprehensive earnings | $ | 2,598.5 | |
| $ | 398.5 | |
| $ | - | |
| $ | 3,242.3 | |
| $ | (3,640.8 | ) |
| $ | 2,598.5 | |
152
Table of Contents
CONDENSED CONSOLIDATING STATEMENT OF COMPREHENSIVE EARNINGS
Year Ended December 31, 2016
(In millions) | Mylan N.V. |
| Mylan Inc. |
| Guarantor Subsidiaries |
| Non-Guarantor Subsidiaries |
| Eliminations |
| Consolidated | ||||||||||||
Net earnings | $ | 480.0 | |
| $ | 746.2 | |
| $ | - | |
| $ | 1,288.9 | |
| $ | (2,035.1 | ) |
| $ | 480.0 | |
Other comprehensive loss, before tax: |
|
|
|
|
|
|
|
|
|
|
| ||||||||||||
Foreign currency translation adjustment | (507.4 | ) |
| - | |
| - | |
| (507.4 | ) |
| 507.4 | |
| (507.4 | ) | ||||||
Change in unrecognized gain (loss) and prior service cost related to defined benefit plans | 21.4 | |
| (1.1 | ) |
| - | |
| 22.5 | |
| (21.4 | ) |
| 21.4 | | ||||||
Net unrecognized (loss) gain on derivatives | (31.2 | ) |
| (47.7 | ) |
| - | |
| 16.5 | |
| 31.2 | |
| (31.2 | ) | ||||||
Net unrecognized loss on derivatives in net investment hedging relationships | (1.8 | ) |
| - | |
| - | |
| (1.8 | ) |
| 1.8 | |
| (1.8 | ) | ||||||
Net unrealized gain on marketable securities | 24.6 | |
| 24.6 | |
| - | |
| - | |
| (24.6 | ) |
| 24.6 | | ||||||
Other comprehensive loss, before tax | (494.4 | ) |
| (24.2 | ) |
| - | |
| (470.2 | ) |
| 494.4 | |
| (494.4 | ) | ||||||
Income tax provision (benefit) | 5.0 | |
| (9.1 | ) |
| - | |
| 4.1 | |
| 5.0 | |
| 5.0 | | ||||||
Other comprehensive (loss, net of tax | (499.4 | ) |
| (15.1 | ) |
| - | |
| (474.3 | ) |
| 489.4 | |
| (499.4 | ) | ||||||
Comprehensive (loss) earnings | $ | (19.4 | ) |
| $ | 731.1 | |
| $ | - | |
| $ | 814.6 | |
| $ | (1,545.7 | ) |
| $ | (19.4 | ) |
153
Table of Contents
CONDENSED CONSOLIDATING STATEMENT OF COMPREHENSIVE EARNINGS
Year Ended December 31, 2015
(In millions) | Mylan N.V. |
| Mylan Inc. |
| Guarantor Subsidiaries |
| Non-Guarantor Subsidiaries |
| Eliminations |
| Consolidated | ||||||||||||
Net earnings | $ | 847.7 | |
| $ | 1,048.0 | |
| $ | - | |
| $ | 1,820.0 | |
| $ | (2,868.0 | ) |
| $ | 847.7 | |
Other comprehensive (loss) earnings, before tax: |
|
|
|
|
|
|
|
|
|
|
| ||||||||||||
Foreign currency translation adjustment | (790.9 | ) |
| - | |
| - | |
| (790.9 | ) |
| 790.9 | |
| (790.9 | ) | ||||||
Change in unrecognized gain and prior service cost related to defined benefit plans | 3.1 | |
| 0.4 | |
| - | |
| 2.7 | |
| (3.1 | ) |
| 3.1 | | ||||||
Net unrecognized gain (loss) on derivatives | 16.7 | |
| 23.4 | |
| - | |
| (6.7 | ) |
| (16.7 | ) |
| 16.7 | | ||||||
Net unrealized loss on marketable securities | (2.0 | ) |
| (1.3 | ) |
| - | |
| (0.7 | ) |
| 2.0 | |
| (2.0 | ) | ||||||
Other comprehensive (loss) earnings, before tax | (773.1 | ) |
| 22.5 | |
| - | |
| (795.6 | ) |
| 773.1 | |
| (773.1 | ) | ||||||
Income tax provision (benefit) | 4.2 | |
| 8.7 | |
| - | |
| (4.5 | ) |
| (4.2 | ) |
| 4.2 | | ||||||
Other comprehensive (loss) earnings, net of tax | (777.3 | ) |
| 13.8 | |
| - | |
| (791.1 | ) |
| 777.3 | |
| (777.3 | ) | ||||||
Comprehensive earnings | 70.4 | |
| 1,061.8 | |
| - | |
| 1,028.9 | |
| (2,090.7 | ) |
| 70.4 | | ||||||
Comprehensive earnings attributable to the noncontrolling interest | (0.1 | ) |
| - | |
| - | |
| (0.1 | ) |
| 0.1 | |
| (0.1 | ) | ||||||
Comprehensive earnings attributable to Mylan N.V. ordinary shareholders | $ | 70.3 | |
| $ | 1,061.8 | |
| $ | - | |
| $ | 1,028.8 | |
| $ | (2,090.6 | ) |
| $ | 70.3 | |
154
Table of Contents
CONDENSED CONSOLIDATING STATEMENT OF CASH FLOWS
Year Ended December 31, 2017
(In millions) | Mylan N.V. |
| Mylan Inc. |
| Guarantor Subsidiaries |
| Non-Guarantor Subsidiaries |
| Eliminations |
| Consolidated | ||||||||||||
Cash flows from operating activities: |
|
|
|
|
|
|
|
|
|
|
| ||||||||||||
Net cash (used in) provided by operating activities | $ | (326.6 | ) |
| $ | (381.1 | ) |
| $ | - | |
| $ | 2,772.5 | |
| $ | - | |
| $ | 2,064.8 | |
Cash flows from investing activities: |
|
|
|
|
|
|
|
|
|
|
| ||||||||||||
Capital expenditures | - | |
| (54.8 | ) |
| - | |
| (221.1 | ) |
| - | |
| (275.9 | ) | ||||||
Change in restricted cash | - | |
| 49.5 | |
| - | |
| 21.5 | |
| - | |
| 71.0 | | ||||||
Cash paid for acquisitions, net | (71.6 | ) |
| - | |
| - | |
| (95.4 | ) |
| - | |
| (167.0 | ) | ||||||
Proceeds from sale of assets and subsidiaries | - | |
| - | |
| - | |
| 86.7 | |
| - | |
| 86.7 | | ||||||
Purchase of marketable securities | - | |
| - | |
| - | |
| (96.5 | ) |
| - | |
| (96.5 | ) | ||||||
Proceeds from the sale of marketable securities | - | |
| - | |
| - | |
| 96.6 | |
| - | |
| 96.6 | | ||||||
Investments in affiliates | - | |
| (30.2 | ) |
| - | |
| - | |
| 30.2 | |
| - | | ||||||
Dividends from affiliates | 261.3 | |
| - | |
| - | |
| - | |
| (261.3 | ) |
| - | | ||||||
Loans to affiliates | (322.7 | ) |
| (98.0 | ) |
| - | |
| (3,493.7 | ) |
| 3,914.4 | |
| - | | ||||||
Repayments of loans from affiliates | 1,258.8 | |
| 0.3 | |
| - | |
| 1,630.9 | |
| (2,890.0 | ) |
| - | | ||||||
Payments for product rights and other, net | - | |
| (0.9 | ) |
| - | |
| (619.4 | ) |
| - | |
| (620.3 | ) | ||||||
Net cash provided by (used in) investing activities | 1,125.8 | |
| (134.1 | ) |
| - | |
| (2,690.4 | ) |
| 793.3 | |
| (905.4 | ) | ||||||
Cash flows from financing activities: |
|
|
|
|
|
|
|
|
|
|
| ||||||||||||
Payments of financing fees | (9.7 | ) |
| (0.4 | ) |
| - | |
| - | |
| - | |
| (10.1 | ) | ||||||
Purchase of ordinary shares | (500.2 | ) |
| - | |
| - | |
| - | |
| - | |
| (500.2 | ) | ||||||
Change in short-term borrowings, net | - | |
| - | |
| - | |
| (2.9 | ) |
| - | |
| (2.9 | ) | ||||||
Proceeds from issuance of long-term debt | 874.5 | |
| - | |
| - | |
| 1.6 | |
| - | |
| 876.1 | | ||||||
Payments of long-term debt | (1,820.0 | ) |
| - | |
| - | |
| (412.7 | ) |
| - | |
| (2,232.7 | ) | ||||||
Proceeds from exercise of stock options | 17.8 | |
| - | |
| - | |
| - | |
| - | |
| 17.8 | | ||||||
Taxes paid related to net share settlement of equity awards | (7.4 | ) |
| - | |
| - | |
| - | |
| - | |
| (7.4 | ) | ||||||
Contingent consideration payments | - | |
| - | |
| - | |
| (26.1 | ) |
| - | |
| (26.1 | ) | ||||||
Capital contribution from affiliates | - | |
| - | |
| - | |
| 30.2 | |
| (30.2 | ) |
| - | | ||||||
Capital payments to affiliates | - | |
| - | |
| - | |
| (261.3 | ) |
| 261.3 | |
| - | | ||||||
Payments on borrowings from affiliates | - | |
| (2,447.2 | ) |
| - | |
| (442.8 | ) |
| 2,890.0 | |
| - | | ||||||
Proceeds from borrowings from affiliates | 645.5 | |
| 2,966.7 | |
| - | |
| 302.2 | |
| (3,914.4 | ) |
| - | | ||||||
Acquisition of noncontrolling interest | - | |
| - | |
| - | |
| (7.5 | ) |
| - | |
| (7.5 | ) | ||||||
Other items, net | - | |
| (16.0 | ) |
| - | |
| 15.9 | |
| - | |
| (0.1 | ) | ||||||
Net cash (used in) provided by financing activities | (799.5 | ) |
| 503.1 | |
| - | |
| (803.4 | ) |
| (793.3 | ) |
| (1,893.1 | ) | ||||||
Effect on cash of changes in exchange rates | - | |
| - | |
| - | |
| 27.0 | |
| - | |
| 27.0 | | ||||||
Net decrease in cash and cash equivalents | (0.3 | ) |
| (12.1 | ) |
| - | |
| (694.3 | ) |
| - | |
| (706.7 | ) | ||||||
Cash and cash equivalents - beginning of period | 0.3 | |
| 12.3 | |
| - | |
| 986.2 | |
| - | |
| 998.8 | | ||||||
Cash and cash equivalents - end of period | $ | - | |
| $ | 0.2 | |
| $ | - | |
| $ | 291.9 | |
| $ | - | |
| $ | 292.1 | |
Supplemental disclosures of cash flow information - |
|
|
|
|
|
|
|
|
|
|
| ||||||||||||
Non-cash transactions: |
|
|
|
|
|
|
|
|
|
|
| ||||||||||||
Contingent consideration | $ | - | |
| $ | - | |
| $ | - | |
| $ | 4.0 | |
| $ | - | |
| $ | 4.0 | |
Ordinary shares issued for acquisition | $ | - | |
| $ | - | |
| $ | - | |
| $ | - | |
| $ | - | |
| $ | - | |
155
Table of Contents
CONDENSED CONSOLIDATING STATEMENT OF CASH FLOWS
(In millions) | Mylan N.V. |
| Mylan Inc. |
| Guarantor Subsidiaries |
| Non-Guarantor Subsidiaries |
| Eliminations |
| Consolidated | ||||||||||||
Cash flows from operating activities: |
|
|
|
|
|
|
|
|
|
|
| ||||||||||||
Net cash (used in) provided by operating activities | $ | (0.3 | ) |
| $ | (518.3 | ) |
| $ | - | |
| $ | 2,565.8 | |
| $ | - | |
| $ | 2,047.2 | |
Cash flows from investing activities: |
|
|
|
|
|
|
|
|
|
|
| ||||||||||||
Capital expenditures | - | |
| (94.4 | ) |
| - | |
| (296.0 | ) |
| - | |
| (390.4 | ) | ||||||
Change in restricted cash | - | |
| (49.5 | ) |
| - | |
| 106.6 | |
| - | |
| 57.1 | | ||||||
Cash paid for acquisitions, net | (5,608.8 | ) |
| (931.3 | ) |
| - | |
| 58.2 | |
| - | |
| (6,481.9 | ) | ||||||
Settlement of acquisition-related foreign currency derivatives | (128.6 | ) |
| - | |
| - | |
| - | |
| - | |
| (128.6 | ) | ||||||
Cash paid for deferred purchase price | - | |
| - | |
| - | |
| (308.0 | ) |
| - | |
| (308.0 | ) | ||||||
Purchase of marketable securities | - | |
| (4.3 | ) |
| - | |
| (25.9 | ) |
| - | |
| (30.2 | ) | ||||||
Proceeds from the sale of marketable securities | - | |
| - | |
| - | |
| 21.5 | |
| - | |
| 21.5 | | ||||||
Investments in affiliates | - | |
| (49.6 | ) |
| - | |
| - | |
| 49.6 | |
| - | | ||||||
Dividends from affiliates | 135.6 | |
| - | |
| - | |
| - | |
| (135.6 | ) |
| - | | ||||||
Loans to affiliates | (14,073.5 | ) |
| (530.2 | ) |
| - | |
| (3,185.0 | ) |
| 17,788.7 | |
| - | | ||||||
Repayments of loans from affiliates | 8,539.6 | |
| 793.0 | |
| - | |
| 1,914.1 | |
| (11,246.7 | ) |
| - | | ||||||
Payments for product rights and other, net | - | |
| 3.3 | |
| - | |
| (363.5 | ) |
| - | |
| (360.2 | ) | ||||||
Net cash (used in) investing activities | (11,135.7 | ) |
| (863.0 | ) |
| - | |
| (2,078.0 | ) |
| 6,456.0 | |
| (7,620.7 | ) | ||||||
Cash flows from financing activities: |
|
|
|
|
|
|
|
|
|
|
| ||||||||||||
Payments of financing fees | (112.6 | ) |
| - | |
| - | |
| - | |
| - | |
| (112.6 | ) | ||||||
Change in short-term borrowings, net | - | |
| - | |
| - | |
| 40.8 | |
| - | |
| 40.8 | | ||||||
Proceeds from issuance of long-term debt | 11,652.6 | |
| - | |
| - | |
| 99.6 | |
| - | |
| 11,752.2 | | ||||||
Payments of long-term debt | (400.0 | ) |
| (3,400.0 | ) |
| - | |
| (2,496.3 | ) |
| - | |
| (6,296.3 | ) | ||||||
Proceeds from exercise of stock options | 13.8 | |
| - | |
| - | |
| - | |
| - | |
| 13.8 | | ||||||
Taxes paid related to net share settlement of equity awards | (17.5 | ) |
| - | |
| - | |
| - | |
| - | |
| (17.5 | ) | ||||||
Contingent consideration payments | - | |
| - | |
| - | |
| (35.5 | ) |
| - | |
| (35.5 | ) | ||||||
Capital contribution from affiliates | - | |
| - | |
| - | |
| 49.6 | |
| (49.6 | ) |
| - | | ||||||
Capital payments to affiliates | - | |
| - | |
| - | |
| (135.6 | ) |
| 135.6 | |
| - | | ||||||
Payments on borrowings from affiliates | - | |
| (3,021.9 | ) |
| - | |
| (8,224.9 | ) |
| 11,246.8 | |
| - | | ||||||
Proceeds from borrowings from affiliates | - | |
| 6,961.2 | |
| - | |
| 10,827.6 | |
| (17,788.8 | ) |
| - | | ||||||
Acquisition of noncontrolling interest | - | |
| - | |
| - | |
| (1.1 | ) |
| - | |
| (1.1 | ) | ||||||
Other items, net | - | |
| (16.2 | ) |
| - | |
| 17.0 | |
| - | |
| 0.8 | | ||||||
Net cash provided by financing activities | 11,136.3 | |
| 523.1 | |
| - | |
| 141.2 | |
| (6,456.0 | ) |
| 5,344.6 | | ||||||
Effect on cash of changes in exchange rates | - | |
| - | |
| - | |
| (8.3 | ) |
| - | |
| (8.3 | ) | ||||||
Net increase (decrease) in cash and cash equivalents | 0.3 | |
| (858.2 | ) |
| - | |
| 620.7 | |
| - | |
| (237.2 | ) | ||||||
Cash and cash equivalents - beginning of period | - | |
| 870.5 | |
| - | |
| 365.5 | |
| - | |
| 1,236.0 | | ||||||
Cash and cash equivalents - end of period | $ | 0.3 | |
| $ | 12.3 | |
| $ | - | |
| $ | 986.2 | |
| $ | - | |
| $ | 998.8 | |
Supplemental disclosures of cash flow information - |
|
|
|
|
|
|
|
|
|
|
| ||||||||||||
Non-cash transactions: |
|
|
|
|
|
|
|
|
|
|
| ||||||||||||
Contingent consideration | $ | - | |
| $ | - | |
| $ | - | |
| $ | 16.0 | |
| $ | - | |
| $ | 16.0 | |
Ordinary shares issued for acquisition | $ | 1,281.7 | |
| $ | - | |
| $ | - | |
| $ | - | |
| $ | - | |
| $ | 1,281.7 | |
156
Table of Contents
CONDENSED CONSOLIDATING STATEMENT OF CASH FLOWS
(In millions) | Mylan N.V. |
| Mylan Inc. |
| Guarantor Subsidiaries |
| Non-Guarantor Subsidiaries |
| Eliminations |
| Consolidated | ||||||||||||
Cash flows from operating activities: |
|
|
|
|
|
|
|
|
|
|
| ||||||||||||
Net cash (used in) provided by operating activities | $ | (57.5 | ) |
| $ | (707.2 | ) |
| $ | - | |
| $ | 2,773.2 | |
| $ | - | |
| $ | 2,008.5 | |
Cash flows from investing activities: |
|
|
|
|
|
|
|
|
|
|
| ||||||||||||
Capital expenditures | - | |
| (85.4 | ) |
| - | |
| (277.5 | ) |
| - | |
| (362.9 | ) | ||||||
Change in restricted cash | - | |
| (3.6 | ) |
| - | |
| 25.4 | |
| - | |
| 21.8 | | ||||||
Cash paid for acquisitions, net | - | |
| - | |
| - | |
| (693.1 | ) |
| - | |
| (693.1 | ) | ||||||
Purchase of marketable securities | - | |
| - | |
| - | |
| (62.1 | ) |
| - | |
| (62.1 | ) | ||||||
Proceeds from sale of marketable securities | - | |
| - | |
| - | |
| 33.1 | |
| - | |
| 33.1 | | ||||||
Investments in affiliates | - | |
| (607.9 | ) |
| - | |
| - | |
| 607.9 | |
| - | | ||||||
Loans to affiliates | (1,097.5 | ) |
| (5,856.4 | ) |
| - | |
| (7,682.2 | ) |
| 14,636.1 | |
| - | | ||||||
Repayments of loans from affiliates | - | |
| 358.5 | |
| - | |
| 1,198.5 | |
| (1,557.0 | ) |
| - | | ||||||
Payments for product rights and other, net | - | |
| (1.5 | ) |
| - | |
| (505.0 | ) |
| - | |
| (506.5 | ) | ||||||
Net cash used in investing activities | (1,097.5 | ) |
| (6,196.3 | ) |
| - | |
| (7,962.9 | ) |
| 13,687.0 | |
| (1,569.7 | ) | ||||||
Cash flows from financing activities: |
|
|
|
|
|
|
|
|
|
|
| ||||||||||||
Payment of financing fees | (104.4 | ) |
| (26.0 | ) |
| - | |
| - | |
| - | |
| (130.4 | ) | ||||||
Purchase of ordinary shares | (67.5 | ) |
| - | |
| - | |
| - | |
| - | |
| (67.5 | ) | ||||||
Change in short-term borrowings, net | - | |
| - | |
| - | |
| (329.2 | ) |
| - | |
| (329.2 | ) | ||||||
Proceeds from convertible note hedge | - | |
| 1,970.8 | |
| - | |
| - | |
| - | |
| 1,970.8 | | ||||||
Proceeds from issuance of long-term debt | 999.2 | |
| 2,540.0 | |
| - | |
| - | |
| - | |
| 3,539.2 | | ||||||
Payment of long-term debt | - | |
| (4,484.1 | ) |
| - | |
| - | |
| - | |
| (4,484.1 | ) | ||||||
Proceeds from exercise of stock options | 44.4 | |
| 53.3 | |
| - | |
| - | |
| - | |
| 97.7 | | ||||||
Taxes paid related to net share settlement of equity awards | - | |
| (25.9 | ) |
| - | |
| (5.9 | ) |
| - | |
| (31.8 | ) | ||||||
Capital contribution from affiliates | - | |
| - | |
| - | |
| 607.9 | |
| (607.9 | ) |
| - | | ||||||
Proceeds from borrowings from affiliates | 283.2 | |
| 8,779.7 | |
| - | |
| 5,573.2 | |
| (14,636.1 | ) |
| - | | ||||||
Payments on borrowings from affiliates | - | |
| (1,198.5 | ) |
| - | |
| (358.5 | ) |
| 1,557.0 | |
| - | | ||||||
Acquisition of noncontrolling interest | - | |
| - | |
| - | |
| (11.7 | ) |
| - | |
| (11.7 | ) | ||||||
Other items, net | - | |
| 51.8 | |
| - | |
| - | |
| - | |
| 51.8 | | ||||||
Net cash provided by financing activities | 1,154.9 | |
| 7,661.1 | |
| - | |
| 5,475.8 | |
| (13,687.0 | ) |
| 604.8 | | ||||||
Effect on cash of changes in exchange rates | - | |
| - | |
| - | |
| (33.1 | ) |
| - | |
| (33.1 | ) | ||||||
Net (decrease) increase in cash and cash equivalents | (0.1 | ) |
| 757.6 | |
| - | |
| 253.0 | |
| - | |
| 1,010.5 | | ||||||
Cash and cash equivalents - beginning of period | 0.1 | |
| 112.9 | |
| - | |
| 112.5 | |
| - | |
| 225.5 | | ||||||
Cash and cash equivalents - end of period | $ | - | |
| $ | 870.5 | |
| $ | - | |
| $ | 365.5 | |
| $ | - | |
| $ | 1,236.0 | |
Supplemental disclosures of cash flow information - |
|
|
|
|
|
|
|
|
|
|
| ||||||||||||
Non-cash transactions: |
|
|
|
|
|
|
|
|
|
|
| ||||||||||||
Contingent consideration | $ | - | |
| $ | - | |
| $ | - | |
| $ | 18.0 | |
| $ | - | |
| $ | 18.0 | |
Ordinary shares issued for acquisition | $ | 6,305.8 | |
| $ | - | |
| $ | - | |
| $ | - | |
| $ | - | |
| $ | 6,305.8 | |
157
Table of Contents
16. | Restructuring |
On December 5, 2016, the Company announced restructuring programs in certain locations representing initial steps in a series of actions that are anticipated to further streamline its operations globally. On November 3, 2017, the Company committed to additional restructuring actions. Since 2015, the Company has made a number of significant acquisitions, and as part of the holistic, global integration of these acquisitions, the Company is focused on how to best optimize and maximize all of its assets across the organization and across all geographies.
Charges for restructuring and ongoing cost reduction initiatives are recorded in the period the Company commits to a restructuring or cost reduction plan, or executes specific actions contemplated by the plan and all criteria for liability recognition have been met.
The Company continues to develop the details of the cost reduction initiatives, including workforce actions and other potential restructuring activities beyond the programs announced, including potential shutdown or consolidation of certain operations. The continued restructuring actions are expected to be implemented through fiscal year 2018. For the restructuring activities that have been initiated to date, the Company estimates that it will incur aggregate pre-tax charges ranging between $375.0 million and $450.0 million , inclusive of the 2016 and 2017 restructuring charges. As additional restructuring activities are undertaken, the Company expects to incur additional costs including employee related costs, such as severance and continuation of healthcare and other benefits; asset impairments; accelerated depreciation; costs associated with contract terminations; and other closure costs. At this time, the expenses related to the additional restructuring activities cannot be reasonably estimated.
The following table summarizes the restructuring charges and the reserve activity from December 31, 2015 to December 31, 2017 :
(In millions) | Employee Related Costs |
| Other Exit Costs |
| Total | ||||||
Balance at December 31, 2015: | $ | 14.8 | |
| $ | - | |
| $ | 14.8 | |
Charges | 148.1 | |
| 1.6 | |
| 149.7 | | |||
Cash payment | (24.3 | ) |
| - | |
| (24.3 | ) | |||
Balance at December 31, 2016: | $ | 138.6 | |
| $ | 1.6 | |
| $ | 140.2 | |
Charges (1) | 107.4 | |
| 80.6 | |
| 188.0 | | |||
Cash payment | (150.0 | ) |
| (2.4 | ) |
| (152.4 | ) | |||
Reclassifications | (8.3 | ) |
| 8.3 | |
| - | | |||
Utilization | - | |
| (74.4 | ) |
| (74.4 | ) | |||
Foreign currency translation | 5.2 | |
| 0.4 | |
| 5.6 | | |||
Balance at December 31, 2017: | $ | 92.9 | |
| $ | 14.1 | |
| $ | 107.0 | |
(1) | For the year ended December 31, 2017 , total restructuring charges in North America, Europe, Rest of World, and Corporate/Other were approximately $48.0 million , $70.1 million , $36.5 million , and $33.4 million , respectively. For the year ended December 31, 2016 , total restructuring charges in North America, Europe, and Rest of World were approximately $89.9 million , $55.3 million , and $4.5 million , respectively. |
17. | Collaboration and Licensing Agreements |
We periodically enter into collaboration and licensing agreements with other pharmaceutical companies for the development, manufacture, marketing and/or sale of pharmaceutical products. Our significant collaboration agreements are primarily focused on the development, manufacturing, supply and commercialization of multiple, high-value generic biologic compounds, insulin analog products and respiratory products. Under these agreements, we have future potential milestone payments and co-development expenses payable to third parties as part of our licensing, development and co-development programs. Payments under these agreements generally become due and are payable upon the satisfaction or achievement of certain developmental, regulatory or commercial milestones or as development expenses are incurred on defined projects. Milestone payment obligations are uncertain, including the prediction of timing and the occurrence of events triggering a future obligation and are not reflected as liabilities in the Consolidated Balance Sheets, except for milestone and royalty obligations reflected as acquisition related contingent consideration. Refer to Note 7 Financial Instruments and Risk Management for
158
Table of Contents
further discussion of contingent consideration. Our potential maximum development milestones not accrued for at December 31, 2017 totaled approximately $545 million . We estimate that the amounts that may be paid in the next twelve months to be approximately $94 million . These agreements are generally accounted for as asset acquisitions and may also include potential sales-based milestones and call for us to pay a percentage of amounts earned from the sale of the product as a royalty or a profit share. The amounts disclosed do not include sales based milestones or royalty obligations on future sales of product as the timing and amount of future sales levels and costs to produce products subject to these obligations is not reasonably estimable. These sales-based milestones or royalty obligations may be significant depending upon the level of commercial sales for each product. A summary of our most significant collaboration and licensing agreements is included below:
Respiratory Delivery Platform
On December 23, 2011 the Company completed the acquisition of the respiratory delivery platform. Under the agreement, the development program for the respiratory delivery platform was transferred to the Company along with exclusive licenses and assignments of the intellectual property effective from the closing date. The Company is responsible for all development costs after the closing date. The Company will also lead the commercialization efforts in certain territories, including the U.S. and Europe. Pfizer is eligible to receive milestone payments, which are contingent upon the future product development achievements including regulatory approvals, market launches, sales targets and profitability.
In accordance with U.S. GAAP guidance regarding business combinations, the Company accounted for this transaction as a purchase of a business and utilized the acquisition method of accounting. Under the acquisition method of accounting, the assets acquired and liabilities assumed in the transaction were recorded at the date of acquisition at the estimate of their respective fair values. The fair value of the contingent consideration liability related to the estimate of future profit sharing and milestone payments was $360.7 million at December 31, 2017 . These payments are contingent upon the occurrence of certain future events and the ultimate success of the respective projects. We estimate the amount of development milestones that may be paid in the next twelve months to be approximately $60 million , a portion of which is accrued as contingent consideration. Given the inherent uncertainty of these events, it is unclear when, if ever, we may be required to pay such amounts or pay amounts in excess of those accrued.
Momenta
On January 8, 2016 , the Company entered into an agreement with Momenta Pharmaceuticals, Inc. ("Momenta") to develop, manufacture and commercialize up to six of Momenta 's current biosimilar candidates, including Momenta 's biosimilar candidate, ORENCIA® (abatacept) ("ORENCIA®"). Mylan paid an up-front cash payment of $45 million to Momenta. Under the terms of the agreement, the Company and Momenta are jointly responsible for product development and equally share in the costs and profits of the products with Mylan leading the worldwide commercialization efforts.
Under the terms of the agreement, Momenta is eligible to receive additional contingent milestone payments for the development of biosimilar candidates. The Company paid $60 million related to certain milestones in 2016 . There were no milestone payments in 2017 . The total remaining amount of contingent milestone payments at December 31, 2017 was approximately $140 million .
On November 2, 2016 , the Company and Momenta announced that dosing had begun in a Phase 1 study to compare the pharmacokinetics, safety and immunogenicity of M834, a proposed biosimilar of ORENCIA®, to U.S. and European Union sourced ORENCIA® in normal healthy volunteers. On November 1, 2017, the Company and Momenta announced that M834 did not meet its primary pharmacokinetic (PK) endpoints in the Phase 1 study to compare the pharmacokinetics, safety and immunogenicity of M834 to US- and EU-sourced ORENCIA® in normal healthy volunteers. The Company and Momenta continue to gather and analyze this data to determine the next steps for the program.
On January 3, 2018, the Company and Momenta announced the development strategy for M710, a proposed biosimilar to EYLEA® (aflibercept) ("EYLEA®") injection. EYLEA® is the market-leading vascular endothelial growth factor (VEGF) inhibitor indicated for the treatment of neovascular (wet) age-related macular degeneration, macular edema following retinal vein occlusion, diabetic macular edema and diabetic retinopathy in patients with diabetic macular edema. The companies plan to initiate a pivotal clinical trial in patients in the first half of 2018.
In accordance with ASC 730 , Research and Development and based upon the cost sharing provisions of the agreement, the Company is accounting for the contingent milestone payments related to the Momenta collaboration as non-refundable advance payments for services to be used in future R&D activities, which are required to be capitalized until the related services have been performed. More specifically, as costs are incurred within the scope of the collaboration, the Company will
159
Table of Contents
record its share of the costs as R&D expense. In addition to the upfront cash payment, during the year ended December 31, 2016 the Company incurred approximately $29.2 million of R&D expense related to this collaboration and approximately $31.9 million of R&D expense during the year ended December 31, 2017 . To the extent the contingent milestone payments made by the Company exceed the liability incurred, a prepaid asset will be reflected on the Company's Consolidated Balance Sheets. To the extent the contingent milestone payments made by the Company are less than the expense incurred, the difference between the payment and the expense will be recorded as a liability on the Company's Consolidated Balance Sheets. At December 31, 2017 , approximately $8.1 million was recorded as a prepaid asset on the Consolidated Balance Sheets.
Theravance
On January 30, 2015 , the Company entered into a development and commercialization collaboration with Theravance Biopharma, Inc. ("Theravance Biopharma") for the development and, subject to FDA approval, commercialization of Revefenacin ("TD-4208"), a novel once-daily nebulized long-acting muscarinic antagonist for chronic obstructive pulmonary disease ("COPD") and other respiratory diseases. Under the terms of the agreement, Mylan and Theravance Biopharma are co-developing nebulized TD-4208 for COPD and other respiratory diseases. Theravance Biopharma is leading the U.S. registrational development program and Mylan is responsible for the reimbursement of Theravance Biopharma 's development costs for that program up until the approval of the first NDA, after which costs will be shared. In addition, Mylan is responsible for commercial manufacturing. In the U.S., Mylan is leading commercialization and Theravance Biopharma retains the right to co-promote the product under a profit-sharing arrangement. In addition to funding the U.S. registrational development program, the Company made a $30 million investment in Theravance Biopharma 's common stock during the first quarter of 2015, which is being accounted for as an available-for-sale security. The Company incurred $15 million in an upfront licensing payment during the year ended December 31, 2015. Under the terms of the agreement, Theravance Biopharma is eligible to receive potential development and sales milestone payments totaling $220 million in the aggregate. As of December 31, 2017 , Mylan has paid a total of $30 million in milestone payments to Theravance Biopharma . On January 29, 2018, the Company announced that the FDA accepted for review the Companies' recently submitted NDA for TD-4208 with a PDUFA target action date of November 13, 2018.
Biocon
The Company has entered into exclusive collaborations with Biocon Limited ("Biocon") on the development, manufacturing, supply and commercialization of multiple, high value biosimilar compounds and three insulin analog products for the global marketplace. Under the agreements with Biocon, Mylan has exclusive commercialization rights for the products under the collaborations in the U.S., Canada, Japan, Australia, New Zealand and in the European Union and European Free Trade Association countries. Biocon has co-exclusive commercialization rights with Mylan for the products in the rest of the world. In December 2017, the FDA approved Mylan's Ogivri™ (trastuzumab-dkst), a biosimilar to Herceptin® (trastuzumab), co-developed with Biocon. Ogivri has been approved for all indications included in the label of the reference product, Herceptin, including for the treatment of HER2-overexpressing breast cancer and metastatic stomach cancer (gastric or gastroesophageal junction adenocarcinoma). Ogivri is the first FDA-approved biosimilar to Herceptin and the first biosimilar from Mylan and Biocon's joint portfolio approved in the U.S. Mylan anticipates potentially being the first company to commercialize a biosimilar to Herceptin. The Company continues to provide development funding related to this collaboration. As the timing of cash expenditures is dependent upon a number of factors, many of which are out of the Company's control, it is difficult to forecast the amount of payments to be made over the next few years, which could be significant.
We are actively pursuing, and are currently involved in, joint projects related to the development, distribution and marketing of both generic and branded products. Many of these arrangements provide for payments by us upon the attainment of specified milestones. While these arrangements help to reduce the financial risk for unsuccessful projects, fulfillment of specified milestones or the occurrence of other obligations may result in fluctuations in cash flows and R&D expense.
18. | Litigation |
The Company is involved in various disputes, governmental and/or regulatory inquiries, investigations and proceedings, tax proceedings and litigation matters, both in the U.S. and abroad, that arise from time to time, some of which could result in losses, including damages, fines and/or civil penalties, and/or criminal charges against the Company. These matters are often complex and have outcomes that are difficult to predict. The Company is also party to certain proceedings and litigation matters for which it may be entitled to indemnification under the respective sale and purchase agreements relating to the acquisitions of the former Merck Generics business, Agila, the EPD Business and branded generics business, and certain other acquisitions.
160
Table of Contents
While the Company believes that it has meritorious defenses with respect to the claims asserted against it and intends to vigorously defend its position, the process of resolving these matters is inherently uncertain and may develop over a long period of time, and so it is not possible to predict the ultimate resolution of any such matter. It is possible that an unfavorable resolution of any of the ongoing matters or the inability or denial of Merck KGaA, Strides Arcolab , Abbott, or another indemnitor or insurer to pay an indemnified claim, could have a material effect on the Company's business, financial condition, results of operations, cash flows and/or ordinary share price.
Some of these governmental inquiries, investigations, proceedings and litigation matters with which the Company is involved are described below, and unless otherwise disclosed, the Company is unable to predict the outcome of the matter or to provide an estimate of the range of reasonably possible material losses. The Company records accruals for loss contingencies to the extent we conclude it is probable that a liability has been incurred and the amount of the loss can be reasonably estimated. The Company is also involved in other pending proceedings that, in the opinion of the Company based upon facts and circumstances known at the time, either the likelihood of loss is remote or any reasonably possible loss associated with the resolution of such proceedings is not expected to be material to the Company's business, financial position, results of operations, cash flows and/or ordinary share price. If and when such other pending proceedings, in the opinion of the Company, become material, the Company will disclose such matters.
Legal costs are recorded as incurred and are classified in SG&A in the Company's Consolidated Statements of Operations .
Lorazepam and Clorazepate
On June 1, 2005, a jury verdict was rendered against Mylan, MPI, and co-defendants Cambrex Corporation ("Cambrex") and Gyma Laboratories ("Gyma") in the U.S. District Court for the District of Columbia in the amount of approximately $12.0 million , which was accrued for by the Company. The jury found that Mylan and its co-defendants willfully violated Massachusetts, Minnesota and Illinois state antitrust laws in connection with API supply agreements entered into between the Company and its API supplier (Cambrex) and broker (Gyma) for two drugs, Lorazepam and Clorazepate, in 1997, and subsequent price increases on these drugs in 1998. The case was brought by four health insurers who opted out of earlier class action settlements agreed to by the Company in 2001 and represents the last remaining antitrust claims relating to Mylan's 1998 price increases for Lorazepam and Clorazepate. Following the verdict, the Company filed a motion for judgment as a matter of law, a motion for a new trial, a motion to dismiss two of the insurers and a motion to reduce the verdict. On December 20, 2006, the Company's motion for judgment as a matter of law and motion for a new trial were denied and the remaining motions were denied on January 24, 2008. In post-trial filings, the plaintiffs requested that the verdict be trebled and that request was granted on January 24, 2008. On February 6, 2008, a judgment was issued against Mylan and its co-defendants in the total amount of approximately $69.0 million , which, in the case of three of the plaintiffs, reflects trebling of the compensatory damages in the original verdict (approximately $11.0 million in total) and, in the case of the fourth plaintiff, reflects their amount of the compensatory damages in the original jury verdict plus doubling this compensatory damage award as punitive damages assessed against each of the defendants (approximately $58.0 million in total), some or all of which may be subject to indemnification obligations by Mylan. Plaintiffs are also seeking an award of attorneys' fees and litigation costs in unspecified amounts and prejudgment interest of approximately $8.0 million . The Company and its co-defendants appealed to the U.S. Court of Appeals for the D.C. Circuit and have challenged the verdict as legally erroneous on multiple grounds. The appeals were held in abeyance pending a ruling on the motion for prejudgment interest, which has been granted. Mylan has contested this ruling along with the liability finding and other damages awards as part of its appeal, which was filed in the Court of Appeals for the D.C. Circuit. On January 18, 2011, the Court of Appeals issued a judgment remanding the case to the District Court for further proceedings based on lack of diversity with respect to certain plaintiffs. On June 13, 2011, Mylan filed a certiorari petition with the U.S. Supreme Court requesting review of the judgment of the D.C. Circuit. On October 3, 2011, the certiorari petition was denied. The case then proceeded before the District Court. On January 14, 2013, following limited court-ordered jurisdictional discovery, the plaintiffs filed a fourth amended complaint containing additional factual averments with respect to the diversity of citizenship of the parties, along with a motion to voluntarily dismiss 775 (of 1,387 ) self-funded customers whose presence would destroy the District Court's diversity jurisdiction. The plaintiffs also moved for a remittitur (reduction) of approximately $8.1 million from the full damages award. Mylan's brief in response to the new factual averments in the complaint was filed on February 13, 2013. On July 29, 2014, the court granted both plaintiffs' motion to amend the complaint and their motion to dismiss 775 self-funded customers. The Court granted the plaintiffs' motion for remittitur on August 18, 2017, reducing approximately $9.5 million from the full damages award. The Court entered final judgment on August 30, 2017 in the amount of approximately $67 million (not including post-judgment interest and fees and costs). Mylan filed a notice of appeal on September 15, 2017 with the United States Court of Appeals for the District of Columbia Circuit. Briefing in the appeal is ongoing and is expected to be completed by March 15, 2018. The total accrual for this matter at December 31, 2017 is approximately $29 million , which includes a $17 million charge recorded during 2017 as a result of the final judgment.
161
Table of Contents
In connection with the Company's appeal of the judgment, the Company maintains a surety bond underwritten by a third-party insurance company in the amount of $66.6 million .
Pricing and Medicaid Litigation
Dey L.P. (now known as Mylan Specialty L.P. and herein as " Mylan Specialty "), a wholly owned subsidiary of the Company, was named as a defendant in several class actions brought by consumers and third-party payors. Mylan Specialty reached a settlement of these class actions, which was approved by the court and all claims have been dismissed. Additionally, a complaint was filed under seal by a plaintiff on behalf of the United States of America against Mylan Specialty in August 1997. In August 2006, the Government filed its complaint-in-intervention and the case was unsealed in September 2006. The Government asserted that Mylan Specialty was jointly liable with a co-defendant and sought recovery of alleged overpayments, together with treble damages, civil penalties and equitable relief. Mylan Specialty completed a settlement of this action in December 2010. These cases all have generally alleged that Mylan Specialty falsely reported certain price information concerning certain drugs marketed by Mylan Specialty , that Mylan Specialty caused false claims to be made to Medicaid and to Medicare, and that Mylan Specialty caused Medicaid and Medicare to make overpayments on those claims.
Under the terms of the purchase agreement with Merck KGaA, Mylan is fully indemnified for the claims in the preceding paragraph and Merck KGaA is entitled to any income tax benefit the Company realizes for any deductions of amounts paid for such pricing litigation. Under the indemnity, Merck KGaA is responsible for all settlement and legal costs, and, as such, these settlements had no impact on the Company's Consolidated Statements of Operations. At December 31, 2017 , the Company has accrued approximately $65.7 million in other current liabilities, which represents its estimate of the remaining amount of anticipated income tax benefits due to Merck KGaA. We are not aware of any outstanding related claims.
Modafinil Antitrust Litigation and FTC Inquiry
Beginning in April 2006, Mylan and four other drug manufacturers were named as defendants in civil lawsuits filed in or transferred to the U.S. District Court for the Eastern District of Pennsylvania by a variety of plaintiffs purportedly representing direct and indirect purchasers of the drug modafinil and in a lawsuit filed by Apotex, Inc., a manufacturer of generic drugs. These actions alleged violations of federal antitrust and state laws in connection with the generic defendants' settlement of patent litigation with Cephalon relating to modafinil. On March 24, 2015, Mylan reached a settlement in principle with the putative indirect purchasers, and on November 20, 2015, Mylan entered into a settlement agreement with the putative indirect purchasers for approximately $16 million . Plaintiffs have not yet moved for preliminary approval of that settlement, but they have advised the Court that they intend to seek preliminary approval of that settlement. In December 2016, Mylan reached a settlement with the putative direct purchaser class and the retailer opt-out plaintiffs for $165 million , of which approximately $68.5 million was paid before December 31, 2016 and approximately $7.3 million was paid during 2017. The settlement with the retailer opt-out plaintiffs has been completed. On February 3, 2017, the putative direct purchaser class moved for preliminary approval of the settlement. The direct purchaser class' motion for preliminary approval of the settlement was denied on August 29, 2017. The parties are engaging in a continuing dialogue to resolve this matter according to the terms of the settlement agreement. On June 8, 2017, Mylan and Apotex agreed to a settlement in principle. The settlement with Apotex has been completed. The Company has also received subpoenas from certain state Attorneys General requesting documents related to the modafinil patent litigation.
On June 29, 2015, the City of Providence, Rhode Island filed suit in the District of Rhode Island against the same parties named as defendants in litigation pending in the Eastern District of Pennsylvania, including Mylan, asserting state law claims based on the same underlying allegations. All defendants, including Mylan, moved to dismiss the suit on October 15, 2015, and the case was subsequently settled.
On July 10, 2015, the Louisiana Attorney General filed in the 19th Judicial District Court in Louisiana a petition against Mylan and three other drug manufacturers asserting state law claims based on the same underlying allegations as those made in litigation pending in the Eastern District of Pennsylvania. The petition was filed by the State of Louisiana purportedly in its capacity as an indirect purchaser. On May 16, 2016, the Judicial District Court deferred Mylan's declinatory exception of no personal jurisdiction and its peremptory exception of prescription, and granted in part and denied in part Mylan's peremptory exceptions of no cause of action and no right of action. On June 30, 2016, the plaintiff filed a supplemental and amended petition. The defendants filed a motion to strike and joint peremptory exceptions to the amended petition. On July 21, 2016, the plaintiff filed in the First Circuit Court of Appeal its application for a supervisory writ regarding the granting of defendant's exceptions, which the defendants opposed. The appeal was denied on October 31, 2016. On April 20, 2016, the State of Louisiana filed a motion to consolidate the pending action with four other actions against other pharmaceutical manufacturers concerning products not related to modafinil, which Mylan opposed. On June 27, 2016, the Judicial District Court declined to consolidate Mylan's case with the other four actions, with leave to renew the consolidation request after filing the above-
162
Table of Contents
referenced amended petition. On July 21, 2016, the plaintiff filed a motion to reurge consolidation. Subsequently, the action to which plaintiff seeks to join Mylan was stayed, resulting in a stay of the consolidation motion. On December 8, 2016, Mylan's peremptory exceptions of no cause of action with respect to the supplemental and amended petition were granted in their entirety and with prejudice and judgment was entered. On February 17, 2017, the plaintiff filed in the 19th Judicial District Court a motion for appeal, which the Judicial District Court granted on February 21, 2017. The appeal was lodged with the First Circuit Court of Appeal on April 4, 2017. Briefing on the appeal has been completed and an oral argument was held November 1, 2017. The First Circuit Court of Appeal has not yet ruled.
On July 28, 2016, United Healthcare filed a complaint against Mylan Inc. and four other drug manufacturers in the United States District Court for the District of Minnesota, asserting state law claims based on the same underlying allegations as those made in litigation pending in the Eastern District of Pennsylvania. On January 6, 2017, the case was transferred to the Eastern District of Pennsylvania. Mylan filed its answer to the complaint on March 31, 2017. United Healthcare filed an amended complaint adding MPI as a defendant, which was entered on January 30, 2018.
The Company believes that it has strong defenses to these remaining cases. Although it is reasonably possible that the Company may incur additional losses from these matters, any amount cannot be reasonably estimated at this time.
In addition, by letter dated July 11, 2006, Mylan was notified by the U.S. Federal Trade Commission ("FTC") of an investigation relating to the settlement of the modafinil patent litigation. In its letter, the FTC requested certain information from Mylan, MPI and Mylan Technologies, Inc. pertaining to the patent litigation and the settlement thereof. On March 29, 2007, the FTC issued a subpoena, and on April 26, 2007, the FTC issued a civil investigative demand to Mylan, requesting additional information from the Company relating to the investigation. Mylan has cooperated fully with the government's investigation and completed all requests for information. On February 13, 2008, the FTC filed a lawsuit against Cephalon in the U.S. District Court for the District of Columbia and the case was subsequently transferred to the U.S. District Court for the Eastern District of Pennsylvania. On July 1, 2010, the FTC issued a third party subpoena to Mylan, requesting documents in connection with its lawsuit against Cephalon. Mylan has responded to the subpoena. The lawsuit against Cephalon settled and a Stipulated Order for Permanent Injunction and Equitable Monetary Relief was entered by the Court on June 17, 2015.
The Company has a total accrual of approximately $105.2 million related to this matter at December 31, 2017 , which is included in other current liabilities in the Consolidated Balance Sheets.
Pioglitazone
Beginning in December 2013, Mylan, Takeda, and several other drug manufacturers have been named as defendants in civil lawsuits consolidated in the U.S. District Court for the Southern District of New York by plaintiffs which purport to represent indirect purchasers of branded or generic Actos® and Actoplus Met®. These actions allege violations of state and federal competition laws in connection with the defendants' settlements of patent litigation in 2010 relating to Actos and Actoplus Met®. Plaintiffs filed an amended complaint on August 22, 2014. Mylan and the other defendants filed motions to dismiss the amended complaint on October 10, 2014. Two additional complaints were subsequently filed by plaintiffs purporting to represent classes of direct purchasers of branded or generic Actos® and Actoplus Met®. On September 23, 2015, the District Court granted defendants' motions to dismiss the indirect purchasers amended complaints with prejudice. The indirect purchasers filed a notice of appeal on October 22, 2015; however they did not appeal the District Court's dismissal of claims asserted against Mylan. The putative direct purchaser class filed an amended complaint on January 8, 2016. Defendants' motion to dismiss was filed on January 28, 2016 and the briefing has been completed. The case was stayed pending the resolution of the indirect purchasers' appeal against the defendants remaining in that case. A decision was issued by the Second Circuit on February 8, 2017, reversing in part and affirming in part, the District Court's decision as to the remaining defendants. Following this decision, the direct purchasers filed an amended complaint; Mylan's motion to dismiss is pending.
SEC Investigation
On September 10, 2015, Mylan N.V. received a subpoena from the SEC seeking documents with regard to certain related party matters. Mylan has received additional requests for information and will continue to fully cooperate with the SEC.
EpiPen® Auto-Injector and Certain Congressional Matters
Classification of EpiPen® Auto-Injector and EpiPen Jr® Auto-Injector
In November 2014, the Company received a subpoena from the U.S. Department of Justice ("DOJ") related to the classification of the EpiPen® Auto-Injector for purposes of the Medicaid Drug Rebate Program. The Company complied with
163
Table of Contents
various information requests received from the DOJ pursuant to the subpoena. The question in the underlying matter was whether EpiPen® Auto-Injector should be classified with the Centers for Medicare and Medicaid Services ("CMS") as a non-innovator drug under the applicable definition in the Medicaid Rebate statute and subject to the formula that is used to calculate rebates to Medicaid for such drugs. EpiPen® Auto-Injector had been classified with CMS as a non-innovator drug since before Mylan acquired the product in 2007 based on longstanding written guidance from the federal government. Beginning in August 2016, questions regarding the pricing of the EpiPen® Auto-Injector significantly increased and the Company has received or has been the subject of additional inquiries, including with respect to the classification of EpiPen® Auto-Injector for purposes of the Medicaid Drug Rebate Program and certain other federal programs, from committees and members of Congress and from other federal and state governmental agencies.
Subsequent to these developments, on October 7, 2016, Mylan agreed to the terms of a $465 million settlement, plus interest, with the DOJ and other government agencies related to the classification of the EpiPen® Auto-Injector for purposes of the Medicaid Drug Rebate Program. On August 17, 2017, two of Mylan's subsidiaries - Mylan Inc. and Mylan Specialty L.P. - signed an agreement with the DOJ and two relators finalizing the $465 million settlement. The settlement agreement provided for resolution of all potential Medicaid rebate liability claims by the federal government, as well as potential claims by certain hospitals and other covered entities that participate in the 340B Drug Pricing Program. The settlement agreement allocated money to the Medicaid programs of all 50 states and established a framework for resolving all potential state Medicaid rebate liability claims within 60 days. All 50 states plus the District of Columbia have agreed to the settlement, and therefore, all potential state Medicaid rebate liability claims have been resolved. Both the federal and state matters have been dismissed through stipulations of dismissal. In connection with the settlement, Mylan Inc. and Mylan Specialty L.P. entered into a Corporate Integrity Agreement (the "CIA") with the Office of Inspector General of the Department of Health and Human Services. The CIA has a five-year term and requires, among other things, that an independent review organization annually review various matters relating to the Medicaid Drug Rebate Program. Neither the settlement agreement nor the CIA contains an admission or finding of wrongdoing. In connection with the settlement, Mylan Specialty L.P. has reclassified EpiPen® Auto-Injector as an innovator product for purposes of the Medicaid Drug Rebate Program effective April 1, 2017. The Company recorded an accrual of $465 million related to the settlement during the year ended December 31, 2016 and recorded an additional accrual for interest related to the settlement amount prior to the payment made in 2017 .
Department of Veterans Affairs Request for Information
On June 30, 2017, the Company responded to a request for information from the Department of Veterans Affairs ("VA") (acting on behalf of itself and other government agencies) requesting certain historical pricing data related to the EpiPen® Auto-Injector. The Company and the VA are engaged in a continuing dialogue regarding the classification of the EpiPen® Auto-Injector as a covered drug under Section 603 of the Veterans Health Care Act of 1992, Public Law 102-585. The EpiPen® Auto-Injector has been classified as a non covered drug with the VA based upon long standing written guidance from the federal government. The Company is fully cooperating with the VA.
SEC Request for Information/Subpoena
On October 7, 2016, Mylan received a document request from the Division of Enforcement at the SEC seeking communications with CMS and documents concerning Mylan products sold and related to the Medicaid Drug Rebate Program, and any related complaints. On November 15, 2016, Mylan received a follow-up letter, modifying the initial document request, seeking information on and public disclosures regarding the $465 million Medicaid Drug Rebate Program Settlement and the classification of the EpiPen® Auto-Injector under the Medicaid Drug Rebate Program. On February 6, 2017, Mylan received a subpoena from the SEC in this matter, seeking additional documents. Mylan has received additional requests for information and will continue to fully cooperate with the SEC.
On April 25, 2017, Mylan received a comment letter from the staff of the SEC's Division of Corporation Finance ("Corporation Finance") with respect to Mylan's Annual Report on Form 10-K for the year ended December 31, 2016, requesting information regarding Mylan's accounting treatment of the $465 million Medicaid Drug Rebate Program Settlement with the DOJ, including with respect to the determinations that the settlement amount should be recorded as a charge against earnings in the third quarter of 2016 rather than against any earlier periods, and that the settlement amount should be classified as an expense rather than a reduction of revenue. The Company responded to the comment letter in May 2017 and we will continue to respond to any additional correspondence from Corporation Finance. We believe that our accounting treatment for the aforementioned DOJ settlement is appropriate and consistent with all applicable accounting standards.
FTC Request for Information
164
Table of Contents
On November 18, 2016, Mylan received a request from the FTC Bureau of Competition seeking documents and information relating to its preliminary investigation into potential anticompetitive practices relating to epinephrine auto-injectors. Mylan is fully cooperating with the FTC.
Federal Securities Litigation
Purported class action complaints were filed in October 2016 against Mylan N.V., Mylan Inc. and certain of their current and former directors and officers (collectively, for purposes of this paragraph, the "defendants") in the United States District Court for the Southern District of New York on behalf of certain purchasers of securities of Mylan N.V. and/or Mylan Inc. on the NASDAQ. The complaints alleged that defendants made false or misleading statements and omissions of purportedly material fact, in violation of federal securities laws, in connection with disclosures relating to Mylan N.V. and Mylan Inc.'s classification of their EpiPen® Auto-Injector as a non-innovator drug for purposes of the Medicaid Drug Rebate Program. The complaints sought damages, as well as the plaintiffs' fees and costs. On March 20, 2017, after the actions were consolidated, a consolidated amended complaint was filed, alleging substantially similar claims and seeking substantially similar relief, but adding allegations that defendants made false or misleading statements and omissions of purportedly material fact in connection with allegedly anticompetitive conduct with respect to EpiPen® Auto-Injector and certain generic drugs, and alleging violations of both federal securities laws (on behalf of a purported class of certain purchasers of securities of Mylan N.V. and/or Mylan Inc. on the NASDAQ) and Israeli securities laws (on behalf of a purported class of certain purchasers of securities of Mylan N.V. on the Tel Aviv Stock Exchange). Defendants' motion to dismiss the consolidated amended complaint was filed on May 30, 2017 and has been fully briefed. We believe that the claims in the consolidated amended complaint are without merit and intend to defend against them vigorously.
Israeli Securities Litigation
On October 13, 2016, a purported shareholder of Mylan N.V. filed a lawsuit, together with a motion to certify the lawsuit as a class action on behalf of certain Mylan N.V. shareholders on the Tel Aviv Stock Exchange, against Mylan N.V. and four of its directors and officers (collectively, for purposes of this paragraph, the "defendants") in the Tel Aviv District Court (Economic Division). The plaintiff alleges that the defendants made false or misleading statements and omissions of purportedly material fact in Mylan N.V.'s reports to the Tel Aviv Stock Exchange regarding Mylan N.V.'s classification of its EpiPen® Auto-Injector for purposes of the Medicaid Drug Rebate Program, in violation of both U.S. and Israeli securities laws, the Israeli Companies Law and the Israeli Torts Ordinance. The plaintiff seeks damages, among other remedies. On January 19, 2017, the Court stayed this case until a final judgment is issued in the securities litigation currently pending in the United States District Court for the Southern District of New York. On April 30, 2017, another purported shareholder of Mylan N.V. filed a separate lawsuit, together with a motion to certify the lawsuit as a class action on behalf of certain Mylan N.V. shareholders on the Tel Aviv Stock Exchange, in the Tel Aviv District Court (Economic Division), alleging substantially similar claims and seeking substantially similar relief against the defendants and other directors and officers of Mylan N.V., but alleging also that this group of defendants made false or misleading statements and omissions of purportedly material fact in connection with allegedly anticompetitive conduct with respect to EpiPen® Auto-Injector and certain generic drugs, and alleging violations of both U.S. federal securities laws and Israeli law. We believe that the claims in these lawsuits are without merit and intend to defend against them vigorously.
EpiPen® Auto-Injector Civil Litigation
Beginning in August 2016, Mylan Specialty L.P. and other Mylan-affiliated entities have been named as defendants in fifteen putative class actions relating to the pricing and/or marketing of the EpiPen® Auto-Injector . The plaintiffs in these cases assert violations of various federal and state antitrust and consumer protection laws, the Racketeer Influenced and Corrupt Organizations Act ("RICO"), as well as common law claims. Plaintiffs' claims include purported challenges to the prices charged for the EpiPen® Auto-Injector and/or the marketing of the product in packages containing two auto-injectors, as well as allegedly anti-competitive conduct. A Mylan officer and other non-Mylan affiliated companies also have been named as defendants in some of the class actions. These lawsuits were filed in the U.S. District Courts for the Northern District of California, Northern District of Illinois, District of Kansas, Eastern District of Michigan, Western District of Washington, District of New Jersey, the Southern District of Alabama, and the Western District of Pennsylvania, as well as the Hamilton County, Ohio Court of Common Pleas (later removed to the Southern District of Ohio). All of these lawsuits have either been dismissed or transferred into a multidistrict litigation ("MDL") in the U.S. District Court for the District of Kansas and have been consolidated through the filing of an amended complaint on October 17, 2017. Mylan filed a motion to dismiss the consolidated amended complaint on December 15, 2017. This motion has now been fully briefed and a decision is pending. A trial date has been scheduled for July 2020. We believe that the claims in these lawsuits are without merit and intend to defend against them vigorously.
165
Table of Contents
On April 24, 2017, Sanofi-Aventis U.S., LLC ("Sanofi") filed a lawsuit against Mylan Inc. and Mylan Specialty L.P. in the U.S. District Court for the District of New Jersey. This lawsuit has been transferred into the aforementioned MDL in the U.S. District Court for the District of Kansas. In this lawsuit, Sanofi alleges exclusive dealings and anti-competitive marketing practices in violation of the antitrust laws in connection with the sale and marketing of the EpiPen® Auto-Injector. Mylan's motion to dismiss was granted in part and denied in part on December 21, 2017. Mylan filed an answer and counterclaims on January 16, 2018. Sanofi filed its answer on February 6, 2018. We believe that Sanofi's claims in this lawsuit are without merit and intend to defend against them vigorously.
On September 29, 2017, plaintiffs in a pending putative class action brought against certain pharmacy benefit managers ("PBMs") in the U.S. District Court for the District of Kansas filed a motion for leave to file an amended complaint that would add Mylan N.V., Mylan Specialty, and MPI as additional defendants to this case. In the proposed amended complaint, plaintiffs bring claims under the Employee Retirement Income Security Act of 1974 for allegedly knowingly participating in conduct related to the pricing of EpiPen products that plaintiffs assert was a breach of fiduciary duties by the PBMs. The case has been transferred to the U.S. District Court for the District of Minnesota and plaintiffs' motion for leave to file an amended complaint remains pending. We believe that the claims in this lawsuit are without merit and intend to defend against them vigorously.
EpiPen® Auto-Injector State AG Investigations
Beginning in August 2016, the Company and certain of its affiliated entities have received subpoenas and informal requests from various state attorneys general seeking information and documents relating to the pricing and/or marketing of the EpiPen® Auto-Injector . The Company is fully cooperating with the various state attorneys general.
U.S. Congress/State Requests for Information and Documents
Beginning in August 2016, Mylan has received several requests for information and documents from various Committees of the U.S. Congress and federal and state lawmakers concerning the marketing, distribution and sales of Mylan products. Mylan has cooperated and intends to continue cooperating with federal and state lawmakers as appropriate in response to their requests.
The Company has a total accrual of approximately $10.0 million related to this matter at December 31, 2017 , which is included in other current liabilities in the Consolidated Balance Sheets. During the year ended December 31, 2017 , the Company made payments of approximately $472.7 million related to this matter. The Company believes that it has strong defenses to current and future potential civil litigation, as well as governmental investigations and enforcement proceedings, discussed in this " EpiPen® Auto-Injector and Certain Congressional Matters" section of this Note 18 Litigation . Although it is reasonably possible that the Company may incur additional losses from these matters, any amount cannot be reasonably estimated at this time. In addition, the Company expects to incur additional legal and other professional service expenses associated with such matters in future periods and will recognize these expenses as services are received. The Company believes that the ultimate amount paid for these services and claims could have a material effect on the Company's business, consolidated financial condition, results of operations, cash flows and/or ordinary share price in future periods.
Opioids
On July 27, 2017, Mylan N.V. received a subpoena from the DOJ seeking information relating to opioids manufactured, marketed or sold by Mylan during the period from January 1, 2013 to December 31, 2016. On August 29, 2017, Mylan N.V. received a civil investigative demand from the Attorney General of the State of Missouri seeking information relating to opioids manufactured, marketed or sold by Mylan during the period from January 1, 2010 to the present and related subject matter. Mylan is fully cooperating with these subpoena requests.
Mylan also has responded to a letter from the ranking member of the U.S. Senate Committee on Homeland Security and Governmental Affairs seeking information relating to sales, marketing and educational strategies for opioid products manufactured by Mylan. In connection with this matter, Senator Claire McCaskill issued a report on February 15, 2018 relating to payments by five drug manufacturers to third-party advocacy groups and professional societies. This report positively differentiated Mylan, finding that Mylan is "[a]t the other end of the spectrum" from the other companies whose payments were examined because Mylan made only de minimis payments, and to only one of the fourteen third-parties cited in the report.
Mylan has been named, along with numerous other manufacturers, distributors, and/or individual healthcare professionals, in certain civil lawsuits brought by plaintiffs, including local governmental entities generally asserting statutory and/or common law claims arising from the manufacture, distribution, marketing, and promotion of purported prescription
166
Table of Contents
opioids. The lawsuits seek damages, including punitive and/or exemplary damages, injunctive relief, attorneys' fees and costs, and other relief. Mylan believes that the claims in these lawsuits are without merit and intends to defend against them vigorously.
Drug Pricing Matters
Department of Justice Subpoena
On December 3, 2015, a subsidiary of Mylan N.V. received a subpoena from the Antitrust Division of the DOJ seeking information relating to the marketing, pricing, and sale of our generic Doxycycline products and any communications with competitors about such products.
On September 8, 2016, a subsidiary of Mylan N.V., as well as certain employees and a member of senior management, received subpoenas from the DOJ seeking additional information relating to the marketing, pricing and sale of our generic Cidofovir, Glipizide-metformin, Propranolol and Verapamil products and any communications with competitors about such products. Related search warrants also were executed. The Company is fully cooperating with the DOJ.
Civil Litigation
On March 2, 2016, a putative class action was filed in the United States District Court for the Eastern District of Pennsylvania ("EDPA") by indirect purchasers against Mylan and several other manufacturers, generally alleging anticompetitive conduct with respect to certain generic doxycycline and digoxin products. The complaint alleges harm under federal antitrust laws, state antitrust laws, state consumer protection laws and theories of unjust enrichment. Subsequently, additional cases were filed by putative classes of indirect purchasers, direct purchasers and an indirect reseller. These cases were consolidated in an MDL proceeding in the EDPA. Similar lawsuits were filed by direct and indirect purchasers in the EDPA, the Southern District of New York, the District of Puerto Rico and the District of New Jersey involving Mylan's and other manufacturer's pravastatin, divalproex, levothyroxine, propranolol, clomipramine, albuterol, benazepril and amitriptyline products (as well as non-Mylan products clobatesol, desonide, fluocinonide, econazole, lidocaine/prilocaine, glyburide, ursodiol and baclofen). All of the above-referenced lawsuits have also been consolidated in the MDL proceeding in the EDPA. Putative classes of direct purchasers, indirect purchasers, and indirect resellers filed consolidated complaints with respect to the products referenced above on August 15, 2017. Mylan is no longer a named defendant in the pravastatin lawsuits. The Court has sequenced the complaints into three separate product groups. Defendants' filed motions to dismiss complaints in the first product group and decisions are pending. On January 22, 2018 three direct purchaser retailers filed a complaint against Mylan and other manufacturers asserting similar allegations with respect to the products identified above, as well as doxycycline monohydrate, glipizide-metformin, and verapamil. The Company believes that the claims in these lawsuits are without merit and intends to defend against them vigorously.
A complaint was filed on January 31, 2017 by putative classes of direct and indirect purchasers against MPI and other pharmaceutical manufacturers in the United States District Court for the District of Connecticut. Plaintiffs alleged anticompetitive conduct and RICO violations with respect to, among other things, certain Doxycycline products. Following the transfer of this case to the above-mentioned MDL, this action has been dismissed.
Attorneys General Litigation
On December 21, 2015, the Company received a subpoena and interrogatories from the Connecticut Office of the Attorney General seeking information relating to the marketing, pricing and sale of certain of the Company's generic products (including Doxycycline) and communications with competitors about such products. On December 14, 2016, attorneys general of twenty states filed a complaint in the United States District Court for the District of Connecticut against several generic pharmaceutical drug manufacturers, including Mylan, alleging anticompetitive conduct with respect to, among other things, Doxycycline Hyclate Delayed Release. On March 1, 2017, the complaint was amended to add the attorneys general of twenty additional states; the complaint alleges violation of federal and state antitrust laws, as well as violation of various states' consumer protection laws. On July 17, 2017, another complaint containing similar allegations as those contained in the complaints referenced above was filed by four additional states and the District of Columbia. This lawsuit has been transferred to the aforementioned MDL proceeding in the EDPA. On October 31, 2017, attorneys general of forty-five states, the District of Columbia and the Commonwealth of Puerto Rico filed a motion for leave to file a consolidated amended complaint ("proposed amended complaint") against various drug manufacturers, including Mylan. Mylan is alleged to have engaged in anticompetitive conduct with respect to Doxycycline Hyclate Delayed Release, Doxycycline Monohydrate, Glipizide-Metformin, and Verapamil. The proposed amended complaint also includes claims asserted by attorneys general of thirty-four states and the Commonwealth of Puerto Rico against certain individuals, including Rajiv Malik, President of Mylan, with
167
Table of Contents
respect to Doxycycline Hyclate Delayed Release. The allegations in the proposed amended complaint are similar to those in the previously filed complaints. On December 8, 2016, the Defendants in the case - including Mylan - filed an opposition to the Attorneys General motion for leave to file a proposed amended complaint as to certain allegations. This motion has now been fully briefed and a decision is pending. We believe that the claims in this lawsuit against Mylan and Rajiv Malik are without merit and intend to defend against them vigorously.
Tax Court Proceeding
The Company's U.S. federal income tax returns for 2007 through 2011 have been subject to proceedings in U.S. Tax Court involving a dispute with the IRS regarding whether the proceeds received by the Company in connection with the 2008 sale of its rights in nebivolol constituted a capital gain or ordinary income. On May 16, 2017, the Company and the IRS filed a joint stipulation of settled issues with the Tax Court that resolved all issues in this dispute. The final computations resulting from the stipulation were submitted to the Tax Court, which has issued the final order closing this case in 2018. The Company expects that a portion of its unrecognized tax benefits will be reduced as a result of the resolution of this dispute.
European Commission Proceedings
Perindopril
On or around July 8, 2009, the European Commission (the "Commission") stated that it had initiated antitrust proceedings pursuant to Article 11(6) of Regulation No. 1/2003 and Article 2(1) of Regulation No. 773/2004 to explore possible infringement of Articles 81 and 82 EC and Articles 53 and 54 of the European Economic Area Agreement by Les Laboratoires Servier ("Servier") as well as possible infringement of Article 81 EC by the Company's Indian subsidiary, Mylan Laboratories Limited , and four other companies, each of which entered into agreements with Servier relating to the product Perindopril. On July 30, 2012, the Commission issued a Statement of Objections to Servier SAS, Servier Laboratories Limited, Les Laboratories Servier, Adir, Biogaran, Krka, d.d. Novo mesto, Lupin Limited, Mylan Laboratories Limited , Mylan, Niche Generics Limited, Teva UK Limited, Teva Pharmaceutical Industries Ltd., Teva Pharmaceuticals Europe B.V. and Unichem Laboratories Limited. Mylan Inc. and Mylan Laboratories Limited filed responses to the Statement of Objections. On July 9, 2014 , the Commission issued a decision finding that Mylan Laboratories Limited and Mylan, as well as the companies noted above (with the exception of Adir, a subsidiary of Servier), had violated European Union competition rules and fined Mylan Laboratories Limited approximately €17.2 million , including approximately €8.0 million jointly and severally with Mylan Inc. The Company paid approximately $21.7 million related to this matter during the fourth quarter of 2014. In September 2014, the Company filed an appeal of the Commission's decision to the General Court of the European Union. A hearing on the appeal before the General Court of the European Union was held in June 2017 and a decision is pending.
Citalopram
On March 19, 2010, Mylan and Generics [U.K.] Limited, a wholly owned subsidiary of the Company, received notice that the Commission had opened proceedings against Lundbeck with respect to alleged unilateral practices and/or agreements related to Citalopram in the European Economic Area. On July 25, 2012 a Statement of Objections was issued to Lundbeck, Merck KGaA, Generics [U.K.] Limited, Arrow, Resolution Chemicals, Xelia Pharmaceuticals, Alpharma, A.L. Industrier and Ranbaxy. Generics [U.K.] Limited filed a response to the Statement of Objections and vigorously defended itself against allegations contained therein. On June 19, 2013, the Commission issued a decision finding that Generics [U.K.] Limited, as well as the companies noted above, had violated European Union competition rules and fined Generics [U.K.] Limited approximately €7.8 million , jointly and severally with Merck KGaA. Generics [U.K.] Limited appealed the Commission's decision to the General Court of the EU and a hearing took place on October 8, 2015. On September 8, 2016, the General Court dismissed all appeals against the European Commission's decision. Mylan filed an appeal of the decision on November 18, 2016 to the European Court of Justice. The United Kingdom applied and was granted permission to intervene in this proceeding. The Company has accrued €7.4 million as of December 31, 2017 and 2016 , respectively, related to this matter. Generics [U.K.] Limited has received notices from NHS Departments across the United Kingdom stating an intention to commence follow-on litigation and asserting damages. Generics [U.K.] Limited has also sought indemnification from Merck KGaA with respect to the €7.8 million portion of the fine for which Merck KGaA and Generics [U.K.] Limited were held jointly and severally liable. Merck KGaA has counterclaimed against Generics [U.K.] Limited seeking the same indemnification. It is reasonably possible that we will incur additional losses above the amount accrued but we cannot estimate a range of such reasonably possible losses at this time. There are no assurances, however, that settlements reached and/or adverse judgments received, if any, will not exceed amounts accrued.
168
Table of Contents
U.K. Competition and Markets Authority
Paroxetine
On August 12, 2011, Generics [U.K.] Limited received notice that the Office of Fair Trading (subsequently changed to the Competition and Markets Authority (the "CMA")) was opening an investigation to explore the possible infringement of the Competition Act 1998 and Articles 101 and 102 of the Treaty on the Functioning of the European Union, with respect to alleged agreements related to Paroxetine. On April 19, 2013, a Statement of Objections was issued to Beecham Group plc, GlaxoSmithKline UK Limited, GlaxoSmithKline plc and SmithKline Beecham Limited (formerly, SmithKline Beecham plc) (together, "GlaxoSmithKline"), Generics [U.K.] Limited, Merck KGaA, Actavis UK Limited (formerly, Alpharma Limited), Xellia Pharmaceuticals ApS (formerly, Alpharma ApS) and Alpharma LLC (formerly, Zoetis Products LLC, Alpharma LLC, and Alpharma Inc.) (together, "Alpharma"), and Ivax LLC (formerly, Ivax Corporation) and Norton Healthcare Limited (which previously traded as Ivax Pharmaceuticals UK) (together, "Ivax"). Generics [U.K.] Limited filed a response to the Statement of Objections, defending itself against the allegations contained therein. The CMA issued a Supplementary Statement of Objections ("SSO") to the above-referenced parties on October 21, 2014 and a hearing with regard to the SSO took place on December 19, 2014. The CMA issued a decision on February 12, 2016, finding that GlaxoSmithKline, Generics [U.K.] Limited, Merck KGaA and Alpharma, were liable for infringing EU and U.K. competition rules. With respect to Merck KGaA and Generics [U.K.] Limited, the CMA issued a penalty of approximately £5.8 million , for which Merck KGaA is liable for the entire amount; and of that amount Generics [U.K.] Limited is jointly and severally liable for approximately £2.7 million , which has been accrued for as of December 31, 2017 . Generics [U.K.] Limited has appealed the decision. The hearing before the Competition Appeals Tribunal concluded on March 30, 2017 and the parties are presently awaiting a decision.
Nefopam
On October 10, 2017, Mylan N.V. and Meda Pharmaceuticals Limited received notice that the CMA was opening an investigation to explore the possible infringement of the Competition Act 1998 and Article 101 of the Treaty on the Functioning of the European Union, with respect to alleged agreements related to Nefopam, a product from Meda's portfolio. On October 16, 2017, the CMA issued a notice under Section 26 of the Competition Act 1998 to Mylan N.V. and Meda Pharmaceuticals Limited to provide specified information and produce specified documents. The Company is fully cooperating with the CMA.
Product Liability
The Company is involved in a number of product liability lawsuits and claims related to alleged personal injuries arising out of certain products manufactured and/or distributed by the Company, including but not limited to Phenytoin, Alendronate Sodium and Reglan. The Company believes that it has meritorious defenses to these lawsuits and claims and is vigorously defending itself with respect to those matters. From time to time, the Company has agreed to settle or otherwise resolve certain lawsuits and claims on terms and conditions that are in the best interests of the Company. The Company has accrued approximately $8.4 million and $31.5 million at December 31, 2017 and December 31, 2016 , respectively. It is reasonably possible that we will incur additional losses and fees above the amount accrued but we cannot estimate a range of such reasonably possible losses or legal fees related to these claims at this time. There are no assurances, however, that settlements reached and/or adverse judgments received, if any, will not exceed amounts accrued.
Intellectual Property
MPI filed with the FDA a Paragraph IV certification stating that approval of MPI's Abbreviated New Drug Application ("ANDA") for glatiramer acetate injection, 20 mg/mL will not infringe any valid claim of patents owned or controlled by Teva Pharmaceuticals USA, Inc., Yeda Research and Development Co., or their affiliates (for purposes of these paragraphs, "Plaintiffs"), listed in the FDA's Orange Book. There are currently no unexpired patents for the product listed in the FDA's Orange Book. On October 3, 2017, MPI received final FDA approval and launched its 20 mg/mL glatiramer acetate product in the United States.
MPI filed with the FDA a Paragraph IV certification stating that approval of MPI's ANDA for glatiramer acetate injection, 40 mg/mL will not infringe any valid claim of patents owned or controlled by the Plaintiffs listed in the FDA's Orange Book. On October 6, 2014, Plaintiffs filed suit against MPI and Mylan Inc. in the District Court for the District of Delaware seeking monetary damages, injunctive relief, attorneys' fees, costs and other relief. In February and March 2015, MPI and Mylan Inc. filed petitions with the Patent Trial and Appeal Board requesting inter partes review of the claims of three asserted patents. On August 24, 2016 and September 1, 2016, respectively, the Patent Trial and Appeal Board issued final written decisions finding all claims of three asserted patents unpatentable as obvious. After Plaintiffs' requests for reconsideration of those decisions, the Patent Trial and Appeal Board issued revised final written decisions addressing issues
169
Table of Contents
raised in the requests for reconsideration and again finding all claims of three asserted patents unpatentable as obvious. On January 30, 2017, the Delaware District Court found, after trial, the asserted claims of the four patents-in-suit invalid as obvious. Plaintiffs have appealed both decisions, and those appeals are pending. On January 17, 2017, Plaintiffs filed suit against MPI and Mylan Inc. in the District Court for the Northern District of West Virginia asserting claims related to a process patent not listed in the FDA's Orange Book seeking monetary damages, injunctive relief, attorneys' fees, costs and other relief. The West Virginia District Court granted Mylan's request to transfer the case to the Delaware District Court. On December 11, 2017, Plaintiffs dismissed the litigation against Mylan related to the process patent.
On October 19, 2017, Teva Pharmaceutical Industries Ltd. commenced an action with the Irish High Court against Mylan Teoranta alleging that Mylan's glatiramer acetate 40mg/mL product, which is manufactured in Ireland, approved by the FDA and is currently being sold in the U.S., infringes two European patents, EP (IE) 2 949 335 and EP (IE) 3 050 556. Teva subsequently dropped its infringement allegation related to the EP (IE) 3 050 556 patent. Teva is seeking damages and/or an account of profits from Mylan for the alleged infringement. Teva has also requested the Irish High Court to enjoin Mylan Teoranta from making, offering, putting on the market and/or using its glatiramer acetate 40mg/mL product in Ireland pending final determination of the action. A hearing on Teva's Ireland injunction request was completed on January 16, 2018 and a decision is pending.
The Company has used its business judgment in connection with the decision to launch the 40mg/mL glatiramer acetate product and has also used its business judgment in certain other situations to decide to market and sell products, notwithstanding the fact that allegations of patent infringement(s) or other potential third party rights have not been finally resolved by the courts. The risk involved in doing so can be substantial because the remedies available to the owner of a patent for infringement may include, a reasonable royalty on sales or damages measured by the profits lost by the patent owner. If there is a finding of willful infringement, damages may be increased up to three times. Moreover, because of the discount pricing typically involved with bioequivalent products, patented branded products generally realize a substantially higher profit margin than bioequivalent products. An adverse decision could have an adverse effect that is material to our business, financial condition, results of operations, cash flows and/or ordinary share price.
Other Litigation
The Company is involved in various other legal proceedings that are considered normal to its business. The Company has approximately $15.4 million accrued related to these various other legal proceedings at December 31, 2017 .
170
Table of Contents
Mylan N.V.
Supplementary Financial Information
Quarterly Financial Data
(Unaudited, in millions, except per share data)
Year Ended December 31, 2017
| Three-Month Period Ended | ||||||||||||||
| March 31, 2017 |
| June 30, 2017 |
| September 30, 2017 |
| December 31, 2017 | ||||||||
Total revenues | $ | 2,719.5 | |
| $ | 2,962.2 | |
| $ | 2,987.1 | |
| $ | 3,238.9 | |
Gross profit | 1,085.0 | |
| 1,225.4 | |
| 1,178.1 | |
| 1,294.6 | | ||||
Net earnings (loss) | 66.4 | |
| 297.0 | |
| 88.3 | |
| 244.3 | | ||||
Earnings (loss) per share (1) : |
|
|
|
|
|
|
| ||||||||
Basic | $ | 0.12 | |
| $ | 0.56 | |
| $ | 0.17 | |
| $ | 0.46 | |
Diluted | $ | 0.12 | |
| $ | 0.55 | |
| $ | 0.16 | |
| $ | 0.46 | |
Share prices (2) : |
|
|
|
|
|
|
| ||||||||
High | $ | 45.28 | |
| $ | 40.09 | |
| $ | 39.49 | |
| $ | 42.31 | |
Low | $ | 35.81 | |
| $ | 36.72 | |
| $ | 29.63 | |
| $ | 32.39 | |
Year Ended December 31, 2016
| Three-Month Period Ended | ||||||||||||||
| March 31, 2016 |
| June 30, 2016 |
| September 30, 2016 |
| December 31, 2016 | ||||||||
Total revenues | $ | 2,191.3 | |
| $ | 2,560.7 | |
| $ | 3,057.1 | |
| $ | 3,267.8 | |
Gross profit | 907.0 | |
| 1,171.7 | |
| 1,283.3 | |
| 1,335.0 | | ||||
Net earnings | 13.9 | |
| 168.4 | |
| (119.8 | ) |
| 417.5 | | ||||
Earnings per share (1) : |
|
|
|
|
|
|
| ||||||||
Basic | $ | 0.03 | |
| $ | 0.33 | |
| $ | (0.23 | ) |
| $ | 0.78 | |
Diluted | $ | 0.03 | |
| $ | 0.33 | |
| $ | (0.23 | ) |
| $ | 0.78 | |
Share prices (2) : |
|
|
|
|
|
|
| ||||||||
High | $ | 54.09 | |
| $ | 48.80 | |
| $ | 49.92 | |
| $ | 38.92 | |
Low | $ | 41.42 | |
| $ | 38.62 | |
| $ | 38.12 | |
| $ | 34.14 | |
(1) | The sum of earnings per share for the quarters may not equal earnings per share for the total year due to changes in the average number of ordinary shares outstanding. |
(2) | Closing prices are as reported on NASDAQ. |
171
Table of Contents
ITEM 9. | Changes in and Disagreements with Accountants on Accounting and Financial Disclosures |
None.
ITEM 9A. | Controls and Procedures |
An evaluation was performed under the supervision and with the participation of the Company's management, including the Principal Executive Officer and the Principal Financial Officer, of the effectiveness of the design and operation of the Company's disclosure controls and procedures as of December 31, 2017 . Based upon that evaluation, the Principal Executive Officer and the Principal Financial Officer concluded that the Company's disclosure controls and procedures were effective.
Management has not identified any changes in the Company's internal control over financial reporting that occurred during the fourth quarter of 2017 that have materially affected, or are reasonably likely to materially affect, the Company's internal control over financial reporting.
Management's Report on Internal Control over Financial Reporting is on page 84 , which is incorporated herein by reference. The effectiveness of the Company's internal control over financial reporting as of December 31, 2017 has been audited by Deloitte & Touche LLP, an independent registered public accounting firm, as stated in their report on page 86 , which is incorporated herein by reference.
ITEM 9B. | Other Information |
None.
172
Table of Contents
PART III
ITEM 10. | Directors, Executive Officers and Corporate Governance |
Certain information required by this Item will be provided in an amendment to this Annual Report on Form 10-K in accordance with General Instruction G(3) to Form 10-K.
Code of Ethics
The Mylan board of directors has adopted a Code of Ethics for the Company's Chief Executive Officer, Chief Financial Officer and Controller. The Mylan Board also has adopted a Code of Business Conduct and Ethics applicable to all directors, officers, and employees. The Code of Ethics for our Chief Executive Officer, Chief Financial Officer and Controller and the Code of Business Conduct and Ethics are posted on Mylan 's website at http://www.mylan.com/company/corporate-governance, and Mylan intends to post any amendments to and waivers from each of the Code of Ethics for the Company's Chief Executive Officer, Chief Financial Officer and Controller and the Code of Business Conduct and Ethics that are required to be disclosed on that website.
ITEM 11. | Executive Compensation |
The information required by this Item will be provided in an amendment to this Annual Report on Form 10-K in accordance with General Instruction G(3) to Form 10-K.
ITEM 12. | Security Ownership of Certain Beneficial Owners and Management and Related Stockholder Matters |
The additional information required by this Item will be provided in an amendment to this Form 10-K in accordance with General Instruction G(3) to Form 10-K.
Equity Compensation Plan Information
The following table shows information about the securities authorized for issuance under Mylan 's equity compensation plans as of December 31, 2017 :
| Number of Securities to be |
| Weighted-Average Exercise |
| Number of Securities | ||||
Plan Category |
|
| |||||||
Equity compensation plans approved by security holders | 13,168,768 | |
| $ | 38.23 | |
| 9,583,554 | |
Equity compensation plans not approved by security holders | - | |
| - | |
| - | | |
Total | 13,168,768 | |
| $ | 38.23 | |
| 9,583,554 | |
ITEM 13. | Certain Relationships and Related Transactions, and Director Independence |
The information required by this Item will be provided in an amendment to this Annual Report on Form 10-K in accordance with General Instruction G(3) to Form 10-K.
ITEM 14. | Principal Accounting Fees and Services |
The information required by this Item will be provided in an amendment to this Annual Report on Form 10-K in accordance with General Instruction G(3) to Form 10-K.
173
Table of Contents
PART IV
ITEM 15. | Exhibits, Consolidated Financial Statement Schedules |
1. | Consolidated Financial Statements |
The Consolidated Financial Statements listed in the Index to Consolidated Financial Statements are filed as part of this Form.
2. | Consolidated Financial Statement Schedules |
MYLAN N.V. AND SUBSIDIARIES
SCHEDULE II - VALUATION AND QUALIFYING ACCOUNTS
(In millions)
Mylan N.V. is the successor to Mylan Inc., the information set forth below refers to Mylan Inc. for periods prior to February 27, 2015, and to Mylan N.V. on and after February 27, 2015.
Description | Beginning |
| Additions Charged to Costs and Expenses |
| Additions |
| Deductions |
| Ending | |||||||
Allowance for doubtful accounts: |
|
|
|
|
|
|
|
|
| |||||||
Year ended December 31, 2017 | $ | 59.0 | |
| 16.8 | |
| 6.0 | |
| (6.5 | ) |
| $ | 75.3 | |
Year ended December 31, 2016 | $ | 33.6 | |
| 15.6 | |
| 13.0 | |
| (3.2 | ) |
| $ | 59.0 | |
Year ended December 31, 2015 | $ | 25.7 | |
| 10.5 | |
| 0.3 | |
| (2.9 | ) |
| $ | 33.6 | |
Valuation allowance for deferred tax assets: |
|
|
|
|
|
|
|
|
| |||||||
Year ended December 31, 2017 | $ | 460.7 | |
| 194.1 | |
| 18.9 | |
| (10.9 | ) |
| $ | 662.8 | |
Year ended December 31, 2016 | $ | 355.7 | |
| 108.8 | |
| 3.4 | |
| (7.2 | ) |
| $ | 460.7 | |
Year ended December 31, 2015 | $ | 304.5 | |
| 75.6 | |
| 6.1 | |
| (30.5 | ) |
| $ | 355.7 | |
____________
(1) | In 2016, this amount includes opening balances of businesses acquired in the period. |
3. | Exhibits |
2.1 |
| Amended and Restated Business Transfer Agreement and Plan of Merger, dated November 4, 2014, between and among Abbott Laboratories, Mylan Inc., New Moon B.V. and Moon of PA Inc., filed as Annex A to the Registration Statement on Form S-4 filed with the SEC on November 5, 2014, as amended on December 9 and December 23, 2014, and incorporated herein by reference.^ |
2.2(a) |
| Irrevocable Undertaking, dated February 10, 2016, between Mylan N.V. and Stena Sessan Rederi AB, filed as Exhibit 2.1 to the Report on Form 8-K filed with the SEC on February 17, 2016, and incorporated herein by reference. |
2.2(b) |
| Irrevocable Undertaking, dated February 10, 2016, between Mylan N.V. and Fidim S.r.l., filed as Exhibit 2.2 to the Report on Form 8-K filed with the SEC on February 17, 2016, and incorporated herein by reference. |
2.2(c) |
| Shareholder Agreement, dated February 10, 2016, between Mylan N.V. and Stena Sessan Rederi AB, filed as Exhibit 2.3 to the Report on Form 8-K filed with the SEC on February 17, 2016, and incorporated herein by reference.^ |
2.2(d) |
| Shareholder Agreement, dated February 10, 2016, between Mylan N.V. and Fidim S.r.l., filed as Exhibit 2.4 to the Report on Form 8-K filed with the SEC on February 17, 2016, and incorporated herein by reference.^ |
3.1 |
| Amended and Restated Articles of Association of Mylan N.V., filed as Exhibit 3.1 to the Report on Form 8-K filed with the SEC on February 27, 2015, and incorporated herein by reference. |
174
Table of Contents
4.1(a) |
| Indenture, dated December 21, 2012, between and among Mylan Inc., the guarantors named therein, and The Bank of New York Mellon, as trustee, filed by Mylan Inc. as Exhibit 4.1 to the Report on Form 8-K filed with the SEC on December 24, 2012, and incorporated herein by reference. |
4.1(b) |
| First Supplemental Indenture, dated February 27, 2015, between and among Mylan Inc., as Issuer, Mylan N.V., as Guarantor, and The Bank of New York Mellon, as Trustee, to the Indenture, dated December 21, 2012, filed as Exhibit 4.4 to the Report on Form 8-K filed with the SEC on February 27, 2015, and incorporated herein by reference. |
4.1(c) |
| Second Supplemental Indenture, dated March 12, 2015, between and among Mylan Inc., as Issuer, Mylan N.V., as Parent, and The Bank of New York Mellon, as Trustee, to the Indenture, dated December 21, 2012, filed as Exhibit 4.3(b) to Form 10-Q for the quarter ended March 31, 2015, and incorporated herein by reference. |
4.2(a) |
| Indenture, dated June 25, 2013, among Mylan Inc., the guarantors thereto and The Bank of New York Mellon, as trustee, filed by Mylan Inc. as Exhibit 4.1 to the Report on Form 8-K filed with the SEC on June 27, 2013, and incorporated herein by reference. |
4.2(b) |
| First Supplemental Indenture, dated February 27, 2015, between and among Mylan Inc., as Issuer, Mylan N.V., as Guarantor, and The Bank of New York Mellon, as Trustee, to the Indenture, dated June 25, 2013, filed as Exhibit 4.5 to the Report on Form 8-K filed with the SEC on February 27, 2015, and incorporated herein by reference. |
4.2(c) |
| Second Supplemental Indenture, dated March 12, 2015, between and among Mylan Inc., as Issuer, Mylan N.V., as Parent, and The Bank of New York Mellon, as Trustee, to the Indenture, dated June 25, 2013, filed as Exhibit 4.4(b) to Form 10-Q for the quarter ended March 31, 2015, and incorporated herein by reference. |
4.3(a) |
| Indenture, dated November 29, 2013, by and between Mylan Inc. and The Bank of New York Mellon, as trustee, filed by Mylan Inc. as Exhibit 4.1 to the Report on Form 8-K filed with the SEC on November 29, 2013, and incorporated herein by reference. |
4.3(b) |
| First Supplemental Indenture, dated November 29, 2013, by and between Mylan Inc. and The Bank of New York Mellon, as trustee, filed by Mylan Inc. as Exhibit 4.2 to the Report on Form 8-K filed with the SEC on November 29, 2013, and incorporated herein by reference. |
4.3(c) |
| Second Supplemental Indenture, dated February 27, 2015, between and among Mylan Inc., as Issuer, Mylan N.V., as Guarantor, and The Bank of New York Mellon, as Trustee, to the Indenture, dated November 29, 2013, filed as Exhibit 4.6 to the Report on Form 8-K filed with the SEC on February 27, 2015, and incorporated herein by reference. |
4.3(d) |
| Third Supplemental Indenture, dated March 12, 2015, between and among Mylan Inc., as Issuer, Mylan N.V., as Parent, and The Bank of New York Mellon, as Trustee, to the Indenture, dated November 29, 2013, filed as Exhibit 4.5(b) to Form 10-Q for the quarter ended March 31, 2015, and incorporated herein by reference. |
4.4 |
| Indenture, dated as of December 9, 2015, among Mylan N.V., Mylan Inc., as guarantor, and The Bank of New York Mellon, as trustee, filed as Exhibit 4.1 to the Report on Form 8-K filed with the SEC on December 15, 2015, and incorporated herein by reference. |
4.5 |
| Indenture, dated as of June 9, 2016, among Mylan N.V., as issuer, Mylan Inc., as guarantor, and The Bank of New York Mellon, as trustee, filed as Exhibit 4.1 to the Report on Form 8-K filed with the SEC on June 15, 2016, and incorporated herein by reference. |
4.6 |
| Registration Rights Agreement, dated as of June 9, 2016, among Mylan N.V., as issuer, Mylan Inc., as guarantor, and Deutsche Bank Securities Inc., Goldman, Sachs & Co. and Merrill Lynch, Pierce, Fenner & Smith Incorporated, as representatives of the initial purchasers of the $1 billion aggregate principal amount of Mylan N.V.'s 2.500% Senior Notes due 2019, $2.25 billion aggregate principal amount of Mylan N.V.'s 3.150% Senior Notes due 2021, $2.25 billion aggregate principal amount of Mylan N.V.'s 3.950% Senior Notes due 2026, and $1 billion aggregate principal amount of Mylan N.V.'s 5.250% Senior Notes due 2046, filed as Exhibit 10.1 to the Report on Form 8-K filed with the SEC on June 15, 2016, and incorporated herein by reference. |
4.7 |
| Indenture, dated November 22, 2016, among Mylan N.V., as issuer, Mylan, Inc., as guarantor and Citibank, N.A., London Branch, as trustee, filed as Exhibit 4.9 to Form 10-K for the fiscal year ended December 31, 2016, and incorporated herein by reference. |
4.8 |
| Indenture, dated as of May 24, 2017, among Mylan N.V., as issuer, Mylan Inc., as guarantor, and Citibank, N.A., London Branch, as trustee, filed as Exhibit 4.1 to the Report on Form 8-K filed with the SEC on May 31, 2017, and incorporated herein by reference. |
175
Table of Contents
10.1(a) |
| Amended and Restated 2003 Long-Term Incentive Plan, filed as Appendix B to the Definitive Proxy Statement on Schedule 14A filed on May 25, 2016, and incorporated herein by reference.* |
10.1(b) |
| Amendment to Amended and Restated 2003 Long-Term Incentive Plan, filed as Appendix B to the Definitive Proxy Statement on Schedule 14A filed on May 25, 2016, and incorporated herein by reference.* |
10.1(c) |
| Amended and Restated Form of Stock Option Agreement under the 2003 Long-Term Incentive Plan for Robert J. Coury, Heather Bresch, and Rajiv Malik, filed by Mylan Inc. as Exhibit 10.2 to Form 10-Q for the quarter ended September 30, 2013, and incorporated herein by reference.* |
10.1(d) |
| Amended and Restated Form of Stock Option Agreement under the 2003 Long-Term Incentive Plan for awards granted following fiscal year 2012, filed by Mylan Inc. as Exhibit 10.4(i) to Form 10-K for the fiscal year ended December 31, 2013, and incorporated herein by reference.* |
10.1(e) |
| Amended and Restated Form of Restricted Stock Unit Award Agreement under the 2003 Long-Term Incentive Plan for awards granted following fiscal year 2012, filed by Mylan Inc. as Exhibit 10.4(j) to Form 10-K for the fiscal year ended December 31, 2013, and incorporated herein by reference.* |
10.1(f) |
| Amended and Restated Form of Performance-Based Restricted Stock Unit Award Agreement under the 2003 Long-Term Incentive Plan for awards granted following fiscal year 2012, filed by Mylan Inc. as Exhibit 10.4(k) to Form 10-K for the fiscal year ended December 31, 2013, and incorporated herein by reference.* |
10.1(g) |
| Form of Stock Option Agreement under the 2003 Long-Term Incentive Plan for Robert J. Coury, Heather Bresch, and Rajiv Malik for awards granted after February 27, 2015, filed as Exhibit 10.1(i) to Form 10-K for the fiscal year ended December 31, 2015, and incorporated herein by reference.* |
10.1(h) |
| Form of Restricted Stock Unit Award Agreement under the 2003 Long-Term Incentive Plan for Heather Bresch and Rajiv Malik for awards granted after February 27, 2015, filed as Exhibit 10.1(j) to Form 10-K for the fiscal year ended December 31, 2015, and incorporated herein by reference.* |
10.1(i) |
| Form of Performance-Based Restricted Stock Unit Award Agreement under the 2003 Long-Term Incentive Plan for Heather Bresch and Rajiv Malik for awards granted after February 27, 2015, filed as Exhibit 10.1(k) to Form 10-K for the fiscal year ended December 31, 2015, and incorporated herein by reference.* |
10.1(j) |
| Form of Stock Option Agreement under the 2003 Long-Term Incentive Plan for awards granted after February 27, 2015, filed as Exhibit 10.1(l) to Form 10-K for the fiscal year ended December 31, 2015, and incorporated herein by reference.* |
10.1(k) |
| Form of Restricted Stock Unit Award Agreement under the 2003 Long-Term Incentive Plan for awards granted after February 27, 2015, filed as Exhibit 10.1(m) to Form 10-K for the fiscal year ended December 31, 2015, and incorporated herein by reference.* |
10.1(l) |
| Form of Performance-Based Restricted Stock Unit Award Agreement under the 2003 Long-Term Incentive Plan for awards granted after February 27, 2015, filed as Exhibit 10.1(n) to Form 10-K for the fiscal year ended December 31, 2015, and incorporated herein by reference.* |
10.1(m) |
| Amendment to Amended and Restated 2003 Long-Term Incentive Plan, adopted as of February 23, 2017, filed as Exhibit 10.1 to Form 10-Q for the quarter ended March 31, 2017, and incorporated herein by reference.* |
10.1(n) |
| Form of Restricted Stock Unit Award Agreement under the 2003 Long-Term Incentive Plan for Heather Bresch and Rajiv Malik for awards granted on or after February 23, 2017, filed as Exhibit 10.2 to Form 10-Q for the quarter ended March 31, 2017, and incorporated herein by reference.* |
10.1(o) |
| Form of Performance-Based Restricted Stock Unit Award Agreement under the 2003 Long-Term Incentive Plan for Heather Bresch and Rajiv Malik for awards granted on or after February 23, 2017, filed as Exhibit 10.3 to Form 10-Q for the quarter ended March 31, 2017, and incorporated herein by reference.* |
10.2(a) |
| Mylan Inc. Severance Plan, amended as of August, 2009, filed by Mylan Inc. as Exhibit 10.6 to Form 10-Q for the quarter ended September 30, 2009, and incorporated herein by reference.* |
10.2(b) |
| Amendment to Mylan Inc. Severance Plan, dated July 13, 2014, filed by Mylan Inc. as Exhibit 10.1 to Form 10-Q for the quarter ended September 30, 2014, and incorporated herein by reference.* |
176
Table of Contents
10.3(a) |
| Retirement Benefit Agreement, dated December 31, 2004, between Mylan Inc. and Robert J. Coury, filed by Mylan Inc. as Exhibit 10.7 to Form 10-Q for the quarter ended December 31, 2004, and incorporated herein by reference.* |
10.3(b) |
| Amendment to Retirement Benefit Agreement, dated April 3, 2006, between Mylan Inc. and Robert J. Coury, filed by Mylan Inc. as Exhibit 10.11(b) to Form 10-K for the fiscal year ended March 31, 2006, and incorporated herein by reference.* |
10.3(c) |
| Amendment to Retirement Benefit Agreement, dated December 22, 2008, between Mylan Inc. and Robert J. Coury, filed by Mylan Inc. as Exhibit 10.20(c) to Form 10-K for the fiscal year ended December 31, 2008, and incorporated herein by reference.* |
10.3(d) |
| Amendment to Retirement Benefit Agreement, dated March 3, 2010, by and between Mylan Inc. and Robert J. Coury, filed by Mylan Inc. as Exhibit 10.1 to Form 8-K filed with the SEC on March 5, 2010, and incorporated herein by reference.* |
10.3(e) |
| Amendment to Retirement Benefit Agreement, effective as of January 1, 2012, by and between Mylan Inc. and Robert J. Coury, filed by Mylan Inc. as Exhibit 10.6 to Form 8-K filed with the SEC on October 28, 2011, and incorporated herein by reference.* |
10.3(f) |
| Amendment to Retirement Benefit Agreement, effective as of January 1, 2014, by and between Mylan Inc. and Robert J. Coury, filed by Mylan Inc. as Exhibit 10.2 to the Report on Form 8-K filed with the SEC on February 28, 2014, and incorporated herein by reference.* |
10.4 |
| Retirement Benefit Agreement, dated August 31, 2009, by and between Mylan Inc. and Heather Bresch filed by Mylan Inc. as Exhibit 10.3 to Form 10-Q for the quarter ended September 30, 2009, and incorporated herein by reference.* |
10.5 |
| Retirement Benefit Agreement, dated August 31, 2009, by and between Mylan Inc. and Rajiv Malik, filed by Mylan Inc. as Exhibit 10.4 to Form 10-Q for the quarter ended September 30, 2009, and incorporated herein by reference.* |
10.6 |
| Form of Retirement Benefit Agreement Waiver Letter by and between Mylan Inc. and certain executive officers of Mylan Inc., filed by Mylan Inc. as Exhibit 10.58 to Form 10-K for the fiscal year ended December 31, 2014, and incorporated herein by reference.* |
10.7(a) |
| Transition and Succession Agreement, dated December 15, 2003, between Mylan Inc. and Robert J. Coury, filed by Mylan Inc. as Exhibit 10.19 to Form 10-Q for the quarter ended December 31, 2003, and incorporated herein by reference.* |
10.7(b) |
| Amendment No. 1 to Transition and Succession Agreement, dated December 2, 2004, between Mylan Inc. and Robert J. Coury, filed by Mylan Inc. as Exhibit 10.1 to Form 10-Q for the quarter ended December 31, 2004, and incorporated herein by reference.* |
10.7(c) |
| Amendment No. 2 to Transition and Succession Agreement, dated April 3, 2006, between Mylan Inc. and Robert J. Coury filed by Mylan Inc. as Exhibit 10.19(c) to Form 10-K for the fiscal year ended March 31, 2006, and incorporated herein by reference.* |
10.7(d) |
| Amendment No. 3 to Transition and Succession Agreement, dated December 22, 2008, between Mylan Inc. and Robert J. Coury, filed by Mylan Inc. as Exhibit 10.25(d) to Form 10-K for the fiscal year ended December 31, 2008, and incorporated herein by reference.* |
10.8(a) |
| Amended and Restated Transition and Succession Agreement, dated December 31, 2007, between Mylan Inc. and Heather Bresch, filed by Mylan Inc. as Exhibit 10.2 to Form 10-Q for the quarter ended March 31, 2008, and incorporated herein by reference.* |
10.8(b) |
| Amendment No. 1 to Transition and Succession Agreement, dated December 22, 2008, between Mylan Inc. and Heather Bresch, filed by Mylan Inc. as Exhibit 10.27(b) to Form 10-K for the fiscal year ended December 31, 2008, and incorporated herein by reference.* |
10.9(a) |
| Transition and Succession Agreement, dated January 31, 2007, between Mylan Inc. and Rajiv Malik, filed by Mylan Inc. as Exhibit 10.5 to Form 10-Q for the quarter ended March 31, 2008, and incorporated herein by reference.* |
10.9(b) |
| Amendment No. 1 to Transition and Succession Agreement, dated December 22, 2008, between Mylan Inc. and Rajiv Malik, filed by Mylan Inc. as Exhibit 10.28(b) to Form 10-K for the fiscal year ended December 31, 2008, and incorporated herein by reference.* |
177
Table of Contents
10.10(a) |
| Transition and Succession Agreement, dated February 25, 2008, by and between Mylan Inc. and Anthony Mauro, filed by Mylan Inc. as Exhibit 10.5(a) to Form 10-Q for the quarter ended March 31, 2012, and incorporated herein by reference.* |
10.10(b) |
| Amendment No. 1 to Transition and Succession Agreement, dated December 15, 2008, by and between Mylan Inc. and Anthony Mauro, filed by Mylan Inc. as Exhibit 10.5(b) to Form 10-Q for the quarter ended March 31, 2012, and incorporated herein by reference.* |
10.10(c) |
| Amendment No. 2 to Transition and Succession Agreement, dated October 15, 2009, by and between Mylan Inc. and Anthony Mauro, filed by Mylan Inc. as Exhibit 10.5(c) to Form 10-Q for the quarter ended March 31, 2012, and incorporated herein by reference.* |
10.11 |
| Form of Transition and Succession Agreement Waiver Letter by and between Mylan Inc. and certain executive officers of Mylan Inc., filed by Mylan Inc. as Exhibit 10.57 to Form 10-K for the fiscal year ended December 31, 2014, and incorporated herein by reference.* |
10.12 |
| Form of Transition and Succession Agreement Waiver Letter by and between Mylan Inc. and certain executive officers of Mylan Inc., filed as Exhibit 10.2 to Form 10-Q for the quarter ended September 30, 2015, and incorporated herein by reference.* |
10.13 |
| Transition and Succession Agreement, dated April 27, 2016 and effective June 6, 2016, between Mylan Inc. and Kenneth S. Parks, filed as Exhibit 10.3 to Form 10-Q for the quarter ended June 30, 2016, and incorporated herein by reference.* |
10.14 |
| Transition and Succession Agreement, dated March 24, 2017, between Mylan Inc. and Daniel M. Gallagher, filed as Exhibit 10.6 to Form 10-Q for the quarter ended March 31, 2017, and incorporated herein by reference. * |
10.15(a) |
| Mylan 401(k) Restoration Plan, dated January 1, 2010, filed by Mylan Inc. as Exhibit 10.1 to the Report on Form 8-K filed by Mylan Inc. with the SEC on December 14, 2009, and incorporated herein by reference.* |
10.15(b) |
| Amendment to Mylan 401(k) Restoration Plan, dated November 4, 2014, filed by Mylan Inc. as Exhibit 10.41(b) to Form 10-K for the fiscal year ended December 31, 2014, and incorporated herein by reference.* |
10.16(a) |
| Mylan Executive Income Deferral Plan, filed by Mylan Inc. as Exhibit 10.2 to the Report on Form 8-K filed with the SEC on December 14, 2009, and incorporated herein by reference.* |
10.16(b) |
| Amendment to Mylan Executive Income Deferral Plan, dated November 4, 2014, filed by Mylan Inc. as Exhibit 10.42(b) to Form 10-K for the fiscal year ended December 31, 2014, and incorporated herein by reference.* |
10.17 |
| The Executive Nonqualified Excess Plan Adoption Agreement, effective as of December 28, 2007, between Mylan International Holdings, Inc. and Rajiv Malik, filed by Mylan Inc. as Exhibit 10.27(b) to Form 10-K for the fiscal year ended December 31, 2013, and incorporated herein by reference.* |
10.18 |
| The Executive Nonqualified Excess Plan, effective as of December 28, 2007, between Mylan International Holdings, Inc. and Rajiv Malik, filed by Mylan Inc. as Exhibit 10.57 to Form 10-K for the fiscal year ended December 31, 2013, and incorporated herein by reference.* |
10.19 |
| Third Amended and Restated Executive Employment Agreement, entered into on February 25, 2014, by and between Mylan Inc. and Robert J. Coury, filed by Mylan Inc. as Exhibit 10.1 to the Report on Form 8-K filed with the SEC on February 28, 2014, and incorporated herein by reference.* |
10.20 |
| Second Amended and Restated Executive Employment Agreement, entered into on February 25, 2014, by and between Mylan Inc. and Heather Bresch, filed by Mylan Inc. as Exhibit 10.3 to the Report on Form 8-K filed with the SEC on February 28, 2014, and incorporated herein by reference.* |
10.21 |
| Second Amended and Restated Executive Employment Agreement, entered into on February 25, 2014, by and between Mylan Inc. and Rajiv Malik, filed by Mylan Inc. as Exhibit 10.4 to the Report on Form 8-K filed with the SEC on February 28, 2014, and incorporated herein by reference.* |
10.22 |
| Amended and Restated Executive Employment Agreement, dated January 8, 2016 and effective January 1, 2016, by and between Mylan Inc. and Anthony Mauro, filed as Exhibit 10.16 to Form 10-K for the fiscal year ended December 31, 2015, and incorporated herein by reference.* |
178
Table of Contents
10.23 |
| Executive Employment Agreement, dated April 27, 2016 and effective June 6, 2016, between Mylan Inc. and Kenneth S. Parks, filed as Exhibit 10.2 to Form 10-Q for the quarter ended June 30, 2016, and incorporated herein by reference.* |
10.24 |
| Executive Employment Agreement, dated March 24, 2017 and effective April 1, 2017, between Mylan Inc. and Daniel M. Gallagher, filed as Exhibit 10.5 to Form 10-Q for the quarter ended March 31, 2017, and incorporated herein by reference * |
10.25 |
| Retirement and Consulting Agreement, dated April 13, 2016, between Mylan Inc. and John D. Sheehan, filed as Exhibit 10.1 to Form 10-Q for the quarter ended June 30, 2016, and incorporated herein by reference.* |
10.26 |
| Letter Agreement, entered into on November 4, 2014, by and between Mylan Inc. and Robert J. Coury, filed by Mylan Inc. as Exhibit 10.59 to Form 10-K for the fiscal year ended December 31, 2014, and incorporated herein by reference.* |
10.27 |
| Letter Agreement, dated June 3, 2016, among Mylan N.V., Mylan Inc., and Robert J. Coury, filed as Exhibit 10.5 to Form 10-Q for the quarter ended June 30, 2016, and incorporated herein by reference.* |
10.28(a) |
| Form of Performance-Based Stock Appreciation Rights Award Agreement under the Mylan Inc. One-Time Special Five-Year Performance-Based Realizable Value Incentive Program, filed by Mylan Inc. as Exhibit 10.5 to the Report on Form 8-K filed with the SEC on February 28, 2014, and incorporated herein by reference.* |
10.28(b) |
| Form of Performance-Based Restricted Stock Unit Award Agreement under the Mylan Inc. One-Time Special Five-Year Performance-Based Realizable Value Incentive Program, filed by Mylan Inc. as Exhibit 10.6 to the Report on Form 8-K filed with the SEC on February 28, 2014, and incorporated herein by reference.* |
10.29(a) |
| Form of One-Time Special Five-Year Performance-Based Realizable Value Incentive Program Waiver Letter with respect to Stock Appreciation Rights, by and between Mylan Inc. and certain executive officers of Mylan Inc., filed by Mylan Inc. as Exhibit 10.56(a) to Form 10-K for the fiscal year ended December 31, 2014, and incorporated herein by reference.* |
10.29(b) |
| Form of One-Time Special Five-Year Performance-Based Realizable Value Incentive Program Waiver Letter with respect to Performance Based Restricted Stock Units, by and between Mylan Inc. and certain employees of Mylan Inc., filed by Mylan Inc. as Exhibit 10.56(b) to Form 10-K for the fiscal year ended December 31, 2014, and incorporated herein by reference.* |
10.29(c) |
| Form of Performance-Based Restricted Stock Unit Award Agreement under the One-Time Special Five-Year Performance-Based Realizable Value Incentive Program for Kenneth S. Parks, filed as Exhibit 10.66 to Form 10-K for the fiscal year ended December 31, 2016, and incorporated herein by reference.* |
10.29(d) |
| Form of Performance-Based Restricted Stock Unit Award Agreement under the One-Time Special Five-Year Performance-Based Realizable Value Incentive Program for Daniel M. Gallagher, filed as Exhibit 10.7 to Form 10-Q for the quarter ended March 31, 2017, and incorporated herein by reference. * |
10.30 |
| Form of Waiver Letter with respect to Specified Award Agreements by and between Mylan N.V and Heather Bresch and Rajiv Malik, February 23, 2017, filed as Exhibit 10.4 to Form 10-Q for the quarter ended March 31, 2017, and incorporated herein by reference. * |
10.31 |
| Supplemental Health Insurance Program For Certain Officers of Mylan Inc., effective December 15, 2001, filed by Mylan Inc. as Exhibit 10.1 to Form 10-Q for the quarter ended December 31, 2001, and incorporated herein by reference.* |
10.32 |
| Amended and Restated Form of Indemnification Agreement between Mylan Inc. and each Director, filed by Mylan Inc. as Exhibit 10.38 to Form 10-K for the fiscal year ended December 31, 2013, and incorporated herein by reference.* |
10.33 |
| Form of Indemnification Agreement between Mylan N.V. and each Director, filed as Exhibit 10.1 to the Report on Form 8-K filed with the SEC on February 27, 2015, and incorporated herein by reference.* |
10.34 |
| Share Purchase Agreement, dated May 12, 2007, by and among Merck Generics Holding GmbH, Merck S.A., Merck Internationale Beteiligung GmbH, Merck KGaA and Mylan Inc., filed by Mylan Inc. as Exhibit 10.1 to the Report on Form 8-K filed with the SEC on May 17, 2007, and incorporated herein by reference. |
10.35 |
| Amendment No. 1 to Share Purchase Agreement, dated October 1, 2007, by and among Mylan Inc. and Merck Generics Holding GmbH, Merck S.A., Merck Internationale Beteiligung GmbH and Merck KGaA, filed by Mylan Inc. as Exhibit 10.1 to the Report on Form 8-K filed with the SEC on October 5, 2007, and incorporated herein by reference. |
179
Table of Contents
10.36 |
| Share Purchase Agreement, dated July 14, 2010, by and among Mylan Inc., Mylan Luxembourg L3 S.C.S., Bioniche Pharma Holdings Limited, the shareholders party thereto and the optionholders party thereto, filed by Mylan Inc. as Exhibit 2.1 to the Report on Form 8-K filed with the SEC on July 16, 2010, and incorporated herein by reference. |
10.37 |
| Amended and Restated Sale and Purchase Agreement, dated December 4, 2013, by and among Mylan Inc., Mylan Institutional Inc., Strides Pharma Asia Pte Ltd (Agila Specialties Asia Pte Ltd), and the promoters named therein, filed by Mylan Inc. as Exhibit 10.50 to Form 10-K for the fiscal year ended December 31, 2013, and incorporated herein by reference.† |
10.38 |
| Amended and Restated Sale and Purchase Agreement, dated December 4, 2013, by and among Mylan Inc., Mylan Laboratories Limited, Strides Arcolab Limited, and the promoters named therein, filed by Mylan Inc. as Exhibit 10.51 to Form 10-K for the fiscal year ended December 31, 2013, and incorporated herein by reference.† |
10.39 |
| Restrictive Covenants Agreement, effective February 27, 2013, by and among Mylan Inc., Strides Arcolab Limited, and the promoters named therein, filed by Mylan Inc. as Exhibit 10.3 to Form 10-Q for the quarter ended March 31, 2013, and incorporated herein by reference.† |
10.40(a) |
| Completion Deed, effective February 27, 2013, by and among Mylan Inc., Strides Arcolab Limited, Agila Specialties Asia Pte Ltd, and the promoters named therein, filed by Mylan Inc. as Exhibit 10.4 to Form 10-Q for the quarter ended March 31, 2013, and incorporated herein by reference.† |
10.40(b) |
| Amendment to Completion Deed, effective December 4, 2013, by and among Mylan Institutional Inc., Mylan Laboratories Limited, Strides Arcolab Limited, Strides Pharma Asia Pte Ltd (f/k/a Agila Specialties Asia Pte Ltd), and the promoters named therein, filed by Mylan Inc. as Exhibit 10.53(b) to Form 10-K for the fiscal year ended December 31, 2013, and incorporated herein by reference.† |
10.41 |
| Agila Global Guarantee Deed, effective February 27, 2013, by and between Mylan Inc. and Strides Arcolab Ltd., filed by Mylan Inc. as Exhibit 10.5 to Form 10-Q for the quarter ended March 31, 2013, and incorporated herein by reference.† |
10.42 |
| Call Option Agreement between Mylan N.V. and Stichting Preferred Shares Mylan, dated April 3, 2015, filed as Exhibit 10.1 to the Report on Form 8-K filed with the SEC on April 3, 2015, and incorporated herein by reference. |
10.43(a) |
| Revolving Credit Agreement, dated November 22, 2016, among Mylan N.V., Mylan Inc., as a guarantor, the lenders and issuing banks party thereto and Bank of America, N.A., as the administrative agent, filed as Exhibit 10.62 to Form 10-K for the fiscal year ended December 31, 2016, and incorporated herein by reference. |
10.43(b) |
| Amendment, dated as of November 3, 2017, to the Revolving Credit Agreement dated as of November 22, 2016, among the Company, certain affiliates and subsidiaries of the Company from time to time party thereto as guarantors, each lender from time to time party thereto and Bank of America, N.A., as administrative agent, filed as Exhibit 10.3 to the Form 10-Q for the quarter ended September 30, 2017, and incorporated herein by reference. |
10.44(a) |
| Term Credit Agreement, dated November 22, 2016, among Mylan N.V., Mylan Inc., as a guarantor, the lenders party thereto and Goldman Sachs Bank USA, as administrative agent, filed as Exhibit 10.63 to Form 10-K for the fiscal year ended December 31, 2016, and incorporated herein by reference. |
10.44(b) |
| Amendment, dated as of November 3, 2017, to the Term Credit Agreement dated as of November 22, 2016, among the Company, certain affiliates and subsidiaries of the Company from time to time party thereto as guarantors, each lender from time to time party thereto and Goldman Sachs Bank USA, as administrative agent, filed as Exhibit 10.4 to the Form 10-Q for the quarter ended September 30, 2017, and incorporated herein by reference. |
10.45 |
| Guarantee Agreement, dated as of December 22, 2016, among Meda AB (publ), Mylan N.V. and AB Svensk Exportkredit (publ), filed as Exhibit 10.64 to Form 10-K for the fiscal year ended December 31, 2016, and incorporated herein by reference. |
10.46 |
| Guarantee, dated December 20, 2016, by Mylan N.V. of Meda AB (publ)'s obligations under the 2013/2018 SEK 600,000,000 floating rate notes and 2014/2019 SEK 750,000,000 floating rate notes issued by Meda AB (publ), filed as Exhibit 10.65 to Form 10-K for the fiscal year ended December 31, 2016, and incorporated herein by reference. |
10.47 |
| Form of Dealer Agreement among Mylan N.V., Mylan Inc. and the Dealer thereto, filed as Exhibit 10.1 to the Report on Form 8-K filed with the SEC on June 8, 2017, and incorporated herein by reference. |
180
Table of Contents
10.48 |
| Settlement Agreement with the U.S. Department of Justice and two relators finalizing the Medicaid drug rebate settlement, dated August 16, 2017, filed as Exhibit 10.1 to the Report on Form 8-K filed with the SEC on August 21, 2017, and incorporated herein by reference. |
10.49 |
| Corporate Integrity Agreement between the Office of Inspector General of the Department of Health and Human Services and Mylan Inc. and Mylan Specialty L.P., dated August 16, 2017, filed as Exhibit 10.2 to the Report on Form 8-K filed with the SEC on August 21, 2017, and incorporated herein by reference. |
12.1 |
| Statement of Computation of Ratios of Earnings to Fixed Charges and Preferred Stock Dividends. |
21.1 |
| Subsidiaries of the registrant. |
23 |
| Consent of Independent Registered Public Accounting Firm. |
31.1 |
| Certification of Principal Executive Officer pursuant to Section 302 of the Sarbanes-Oxley Act of 2002. |
31.2 |
| Certification of Principal Financial Officer pursuant to Section 302 of the Sarbanes-Oxley Act of 2002. |
32 |
| Certification of Principal Executive Officer and Principal Financial Officer pursuant to Section 906 of the Sarbanes-Oxley Act of 2002. |
101.INS |
| XBRL Instance Document |
101.SCH |
| XBRL Taxonomy Extension Schema |
101.CAL |
| XBRL Taxonomy Extension Calculation Linkbase |
101.LAB |
| XBRL Taxonomy Extension Label Linkbase |
101.PRE |
| XBRL Taxonomy Extension Presentation Linkbase |
101.DEF |
| XBRL Taxonomy Extension Definition Linkbase |
* | Denotes management contract or compensatory plan or arrangement. |
† | The Company's request for confidential treatment with respect to certain portions of this exhibit has been accepted. |
^ | Exhibits and schedules have been omitted pursuant to Item 601(b)(2) of Regulation S-K. The Company will furnish a copy of any omitted exhibits and schedules to the Securities and Exchange Commission upon request but may request confidential treatment for any exhibit or schedule so furnished. |
181
Table of Contents
SIGNATURES
Pursuant to the requirements of section 13 or 15(d) of the Securities Exchange Act of 1934, the registrant has duly caused this Form to be signed on its behalf by the undersigned, thereunto duly authorized on February 28, 2018 .
|
|
| Mylan N.V. |
|
|
|
|
| by |
| /s/ HEATHER BRESCH |
|
|
| Heather Bresch |
|
|
| Chief Executive Officer |
Pursuant to the requirements of the Securities Exchange Act of 1934, this Form has been signed below by the following persons on behalf of the registrant and in the capacities indicated as of February 28, 2018 .
Signature |
| Title |
|
|
|
/s/ HEATHER BRESCH |
| Chief Executive Officer and Director |
Heather Bresch |
| (Principal Executive Officer) |
|
|
|
/s/ KENNETH S. PARKS |
| Chief Financial Officer |
Kenneth S. Parks |
| (Principal Financial Officer) |
|
|
|
/s/ PAUL B. CAMPBELL |
| Senior Vice President and Chief Accounting Officer |
Paul B. Campbell |
| (Principal Accounting Officer) |
|
|
|
/s/ ROBERT J. COURY |
| Chairman and Director |
Robert J. Coury |
|
|
|
|
|
/s/ WENDY CAMERON |
| Director |
Wendy Cameron |
|
|
|
|
|
/s/ ROBERT J. CINDRICH |
| Director |
Robert J. Cindrich |
|
|
|
|
|
/s/ JOELLEN LYONS DILLON |
| Director |
JoEllen Lyons Dillon |
|
|
|
|
|
/s/ NEIL DIMICK |
| Director |
Neil Dimick |
|
|
|
|
|
/s/ MELINA HIGGINS |
| Director |
Melina Higgins |
|
|
|
|
|
/s/ RAJIV MALIK |
| President and Director |
Rajiv Malik |
|
|
|
|
|
/s/ MARK W. PARRISH |
| Director |
Mark W. Parrish |
|
|
|
|
|
/s/ SJOERD S. VOLLEBREGT |
| Director |
Sjoerd S. Vollebregt |
|
|
|
|
|
/s/ RANDALL L. VANDERVEEN, PH.D. |
| Director |
Randall L. Vanderveen, Ph.D. |
|
|
182