UNITED STATES SECURITIES AND EXCHANGE COMMISSION
Washington, D.C. 20549
FORM 10-Q
x QUARTERLY REPORT PURSUANT TO SECTION 13 OR 15(d) OF THE SECURITIES
EXCHANGE ACT OF 1934
For the quarterly period ended September 30, 2015
OR
¨ TRANSITION REPORT PURSUANT TO SECTION 13 OR 15(d) OF THE SECURITIES
EXCHANGE ACT OF 1934
Commission File Number 1-11758

(Exact Name of Registrant as specified in its charter)
Delaware (State or other jurisdiction of incorporation or organization) | 1585 Broadway New York, NY 10036 (Address of principal executive offices, including zip code) | 36-3145972 (I.R.S. Employer Identification No.) | (212) 761-4000 (Registrant's telephone number, including area code) | |||
Indicate by check mark whether the Registrant (1) has filed all reports required to be filed by Section 13 or 15(d) of the Securities Exchange Act of 1934 during the preceding 12 months (or for such shorter period that the Registrant was required to file such reports), and (2) has been subject to such filing requirements for the past 90 days. Yes x No ¨
Indicate by check mark whether the Registrant has submitted electronically and posted on its corporate Web site, if any, every Interactive Data File required to be submitted and posted pursuant to Rule 405 of Regulation S-T (§ 232.405 of this chapter) during the preceding 12 months (or for such shorter period that the Registrant was required to submit and post such files). Yes x No ¨
Indicate by check mark whether the Registrant is a large accelerated filer, an accelerated filer, a non-accelerated filer, or a smaller reporting company. See the definitions of "large accelerated filer," "accelerated filer" and "smaller reporting company" in Rule 12b-2 of the Exchange Act. (Check one):
Large Accelerated Filer x | Accelerated Filer ¨ | |
Non-Accelerated Filer ¨ | Smaller reporting company ¨ | |
(Do not check if a smaller reporting company) |
Indicate by check mark whether the Registrant is a shell company (as defined in Rule 12b-2 of the Exchange Act). Yes ¨ No x
As of October 30, 2015, there were 1,936,223,959 shares of the Registrant's Common Stock, par value $0.01 per share, outstanding.

QUARTERLY REPORT ON FORM 10-Q
For the quarter ended September 30, 2015
| Table of Contents | Page | |||||||
Part I-Financial Information | ||||||||
Item 1. | Financial Statements (unaudited) | 1 | ||||||
Condensed Consolidated Statements of Income-Three and Nine Months Ended September 30, 2015 and 2014 | 1 | |||||||
Condensed Consolidated Statements of Comprehensive Income-Three and Nine Months Ended September 30, 2015 and 2014 | 2 | |||||||
Condensed Consolidated Statements of Financial Condition-September 30, 2015 and December 31, 2014 | 3 | |||||||
Condensed Consolidated Statements of Changes in Total Equity-Nine Months Ended September 30, 2015 and 2014 | 4 | |||||||
Condensed Consolidated Statements of Cash Flows-Nine Months Ended September 30, 2015 and 2014 | 5 | |||||||
| Notes to Condensed Consolidated Financial Statements (unaudited) | 6 | |||||||
1. Introduction and Basis of Presentation | 6 | |||||||
2. Significant Accounting Policies | 7 | |||||||
3. Fair Values | 8 | |||||||
4. Derivative Instruments and Hedging Activities | 30 | |||||||
5. Investment Securities | 43 | |||||||
6. Collateralized Transactions | 49 | |||||||
7. Loans and Allowance for Credit Losses | 52 | |||||||
8. Equity Method Investments | 57 | |||||||
9. Deposits | 57 | |||||||
10. Long-Term Borrowings and Other Secured Financings | 58 | |||||||
11. Commitments, Guarantees and Contingencies | 59 | |||||||
12. Variable Interest Entities and Securitization Activities | 65 | |||||||
13. Regulatory Requirements | 72 | |||||||
| 14. Total Equity | 75 | |||||||
| 15. Earnings per Common Share | 79 | |||||||
| 16. Interest Income and Interest Expense | 80 | |||||||
| 17. Employee Benefit Plans | 81 | |||||||
| 18. Income Taxes | 81 | |||||||
| 19. Segment and Geographic Information | 82 | |||||||
| 20. Subsequent Events | 85 | |||||||
Report of Independent Registered Public Accounting Firm | 86 | |||||||
| Item 2. | Management's Discussion and Analysis of Financial Condition and Results of Operations | 87 | ||||||
| Introduction | 87 | |||||||
| Business Segments | 97 | |||||||
| Supplemental Financial Information and Disclosures | 116 | |||||||
| Accounting Development Updates | 118 | |||||||
| Critical Accounting Policies | 119 | |||||||
| Liquidity and Capital Resources | 120 | |||||||
Item 3. | Quantitative and Qualitative Disclosures about Market Risk | 141 | ||||||
Item 4. | Controls and Procedures | 157 | ||||||
Financial Data Supplement (unaudited) | 158 | |||||||
Part II-Other Information | ||||||||
Item 1. | Legal Proceedings | 164 | ||||||
Item 2. | Unregistered Sales of Equity Securities and Use of Proceeds | 166 | ||||||
Item 5. | Other Information | 167 | ||||||
Item 6. | Exhibits | 167 | ||||||
| i |  |
AVAILABLE INFORMATION
Morgan Stanley files annual, quarterly and current reports, proxy statements and other information with the U.S. Securities and Exchange Commission (the "SEC"). You may read and copy any document we file with the SEC at the SEC's public reference room at 100 F Street, NE, Washington, DC 20549. Please call the SEC at 1-800-SEC-0330 for information on the public reference room. The SEC maintains an internet site that contains annual, quarterly and current reports, proxy and information statements and other information that issuers (including Morgan Stanley) file electronically with the SEC. Morgan Stanley's electronic SEC filings are available to the public at the SEC's internet site, www.sec.gov .
Morgan Stanley's internet site is www.morganstanley.com . You can access Morgan Stanley's Investor Relations webpage at www.morganstanley.com/about-us-ir . Morgan Stanley makes available free of charge, on or through its Investor Relations webpage, its proxy statements, Annual Reports on Form 10-K, Quarterly Reports on Form 10-Q, Current Reports on Form 8-K and any amendments to those reports filed or furnished pursuant to the Securities Exchange Act of 1934, as amended (the "Exchange Act"), as soon as reasonably practicable after such material is electronically filed with, or furnished to, the SEC. Morgan Stanley also makes available, through its Investor Relations webpage, via a link to the SEC's internet site, statements of beneficial ownership of Morgan Stanley's equity securities filed by its directors, officers, 10% or greater shareholders and others under Section 16 of the Exchange Act.
Morgan Stanley has a Corporate Governance webpage. You can access information about Morgan Stanley's corporate governance at www.morganstanley.com/about-us-governance . Morgan Stanley posts the following on its Corporate Governance webpage:
| • | Amended and Restated Certificate of Incorporation; |
| • | Amended and Restated Bylaws; |
| • | Charters for its Audit Committee; Operations and Technology Committee; Compensation, Management Development and Succession Committee; Nominating and Governance Committee; and Risk Committee; |
| • | Corporate Governance Policies; |
| • | Policy Regarding Communication with the Board of Directors; |
| • | Policy Regarding Director Candidates Recommended by Shareholders; |
| • | Policy Regarding Corporate Political Activities; |
| • | Policy Regarding Shareholder Rights Plan; |
| • | Code of Ethics and Business Conduct; |
| • | Code of Conduct; and |
| • | Integrity Hotline information. |
Morgan Stanley's Code of Ethics and Business Conduct applies to all directors, officers and employees, including its Chief Executive Officer, Chief Financial Officer and Deputy Chief Financial Officer. Morgan Stanley will post any amendments to the Code of Ethics and Business Conduct and any waivers that are required to be disclosed by the rules of either the SEC or the New York Stock Exchange LLC ("NYSE") on its internet site. You can request a copy of these documents, excluding exhibits, at no cost, by contacting Investor Relations, 1585 Broadway, New York, NY 10036 (212-761-4000). The information on Morgan Stanley's internet site is not incorporated by reference into this report.
| | ii |
Part I-Financial Information.
| Item 1. | Financial Statements. |
MORGAN STANLEY
Condensed Consolidated Statements of Income
(dollars in millions, except share and per share data)
(unaudited)
| Three Months Ended September 30, | Nine Months Ended September 30, | |||||||||||||||
| 2015 | 2014 | 2015 | 2014 | |||||||||||||
Revenues: | ||||||||||||||||
Investment banking | $ | 1,313 | $ | 1,551 | $ | 4,284 | $ | 4,492 | ||||||||
Trading | 2,026 | 2,448 | 8,649 | 7,926 | ||||||||||||
Investments | (119 | ) | 138 | 408 | 724 | |||||||||||
Commissions and fees | 1,115 | 1,124 | 3,459 | 3,478 | ||||||||||||
Asset management, distribution and administration fees | 2,732 | 2,716 | 8,155 | 7,886 | ||||||||||||
Other | (62 | ) | 373 | 406 | 873 | |||||||||||
|
|
|
|
|
|
|
| |||||||||
Total non-interest revenues | 7,005 | 8,350 | 25,361 | 25,379 | ||||||||||||
|
|
|
|
|
|
|
| |||||||||
Interest income | 1,451 | 1,384 | 4,321 | 3,977 | ||||||||||||
Interest expense | 689 | 827 | 2,265 | 2,845 | ||||||||||||
|
|
|
|
|
|
|
| |||||||||
Net interest | 762 | 557 | 2,056 | 1,132 | ||||||||||||
|
|
|
|
|
|
|
| |||||||||
Net revenues | 7,767 | 8,907 | 27,417 | 26,511 | ||||||||||||
|
|
|
|
|
|
|
| |||||||||
Non-interest expenses: | ||||||||||||||||
Compensation and benefits | 3,437 | 4,214 | 12,366 | 12,720 | ||||||||||||
Occupancy and equipment | 341 | 350 | 1,034 | 1,069 | ||||||||||||
Brokerage, clearing and exchange fees | 485 | 437 | 1,435 | 1,338 | ||||||||||||
Information processing and communications | 447 | 396 | 1,300 | 1,231 | ||||||||||||
Marketing and business development | 158 | 160 | 487 | 472 | ||||||||||||
Professional services | 576 | 522 | 1,660 | 1,506 | ||||||||||||
Other | 849 | 608 | 2,079 | 1,653 | ||||||||||||
|
|
|
|
|
|
|
| |||||||||
Total non-interest expenses | 6,293 | 6,687 | 20,361 | 19,989 | ||||||||||||
|
|
|
|
|
|
|
| |||||||||
Income from continuing operations before income taxes | 1,474 | 2,220 | 7,056 | 6,522 | ||||||||||||
Provision for income taxes | 423 | 463 | 1,704 | 1,263 | ||||||||||||
|
|
|
|
|
|
|
| |||||||||
Income from continuing operations | 1,051 | 1,757 | 5,352 | 5,259 | ||||||||||||
|
|
|
|
|
|
|
| |||||||||
Discontinued operations: | ||||||||||||||||
Income (loss) from discontinued operations before income taxes | (4 | ) | (8 | ) | (13 | ) | (11 | ) | ||||||||
Provision for (benefit from) income taxes | (2 | ) | (3 | ) | (4 | ) | (5 | ) | ||||||||
|
|
|
|
|
|
|
| |||||||||
Income (loss) from discontinued operations | (2 | ) | (5 | ) | (9 | ) | (6 | ) | ||||||||
|
|
|
|
|
|
|
| |||||||||
Net income | $ | 1,049 | $ | 1,752 | $ | 5,343 | $ | 5,253 | ||||||||
Net income applicable to nonredeemable noncontrolling interests | 31 | 59 | 124 | 156 | ||||||||||||
|
|
|
|
|
|
|
| |||||||||
Net income applicable to Morgan Stanley | $ | 1,018 | $ | 1,693 | $ | 5,219 | $ | 5,097 | ||||||||
Preferred stock dividends and other | 79 | 64 | 301 | 199 | ||||||||||||
|
|
|
|
|
|
|
| |||||||||
Earnings applicable to Morgan Stanley common shareholders | $ | 939 | $ | 1,629 | $ | 4,918 | $ | 4,898 | ||||||||
|
|
|
|
|
|
|
| |||||||||
Earnings per basic common share: | ||||||||||||||||
Income from continuing operations | $ | 0.49 | $ | 0.85 | $ | 2.57 | $ | 2.55 | ||||||||
Income (loss) from discontinued operations | - | - | - | (0.01 | ) | |||||||||||
|
|
|
|
|
|
|
| |||||||||
Earnings per basic common share | $ | 0.49 | $ | 0.85 | $ | 2.57 | $ | 2.54 | ||||||||
|
|
|
|
|
|
|
| |||||||||
Earnings per diluted common share: | ||||||||||||||||
Income from continuing operations | $ | 0.48 | $ | 0.83 | $ | 2.52 | $ | 2.49 | ||||||||
Income (loss) from discontinued operations | - | - | (0.01 | ) | - | |||||||||||
|
|
|
|
|
|
|
| |||||||||
Earnings per diluted common share | $ | 0.48 | $ | 0.83 | $ | 2.51 | $ | 2.49 | ||||||||
|
|
|
|
|
|
|
| |||||||||
Dividends declared per common share | $ | 0.15 | $ | 0.10 | $ | 0.40 | $ | 0.25 | ||||||||
Average common shares outstanding: | ||||||||||||||||
Basic | 1,904,213,493 | 1,922,995,835 | 1,915,807,606 | 1,925,172,108 | ||||||||||||
|
|
|
|
|
|
|
| |||||||||
Diluted | 1,949,281,601 | 1,970,922,473 | 1,957,544,581 | 1,970,091,170 | ||||||||||||
|
|
|
|
|
|
|
| |||||||||
See Notes to Condensed Consolidated Financial Statements.
| 1 | |
MORGAN STANLEY
Condensed Consolidated Statements of Comprehensive Income
(dollars in millions)
(unaudited)
| Three Months Ended September 30, | Nine Months Ended September 30, | |||||||||||||||
| 2015 | 2014 | 2015 | 2014 | |||||||||||||
Net income | $ | 1,049 | $ | 1,752 | $ | 5,343 | $ | 5,253 | ||||||||
Other comprehensive income (loss), net of tax: | ||||||||||||||||
Foreign currency translation adjustments(1) | $ | (61 | ) | $ | (327 | ) | $ | (249 | ) | $ | (175 | ) | ||||
Change in net unrealized gains (losses) on available for sale securities(2) | 100 | (102 | ) | 72 | 134 | |||||||||||
Pension, postretirement and other(3) | 4 | (15 | ) | 3 | (7 | ) | ||||||||||
|
|
|
|
|
|
|
| |||||||||
Total other comprehensive income (loss) | $ | 43 | $ | (444 | ) | $ | (174 | ) | $ | (48 | ) | |||||
|
|
|
|
|
|
|
| |||||||||
Comprehensive income | $ | 1,092 | $ | 1,308 | $ | 5,169 | $ | 5,205 | ||||||||
Net income applicable to nonredeemable noncontrolling interests | 31 | 59 | 124 | 156 | ||||||||||||
Other comprehensive income (loss) applicable to nonredeemable noncontrolling interests | 15 | (62 | ) | (3 | ) | (26 | ) | |||||||||
|
|
|
|
|
|
|
| |||||||||
Comprehensive income applicable to Morgan Stanley | $ | 1,046 | $ | 1,311 | $ | 5,048 | $ | 5,075 | ||||||||
|
|
|
|
|
|
|
| |||||||||
| (1) | Amounts include provision for (benefit from) income taxes of $30 million and $249 million for the quarters ended September 30, 2015 and 2014, respectively, and $150 million and $137 million for the nine months ended September 30, 2015 and 2014, respectively. |
| (2) | Amounts include provision for (benefit from) income taxes of $57 million and $(70) million for the quarters ended September 30, 2015 and 2014, respectively, and $41 million and $92 million for the nine months ended September 30, 2015 and 2014, respectively. |
| (3) | Amounts include provision for (benefit from) income taxes of $(2) million and $(7) million for the quarters ended September 30, 2015 and 2014, respectively, and $(2) million and $(4) million for the nine months ended September 30, 2015 and 2014, respectively. |
See Notes to Condensed Consolidated Financial Statements.
| | 2 |
MORGAN STANLEY
Condensed Consolidated Statements of Financial Condition
(dollars in millions, except share data)
(unaudited)
| September 30, 2015 | December 31, 2014 | |||||||
Assets | ||||||||
Cash and due from banks ($13 and $45 at September 30, 2015 and December 31, 2014, respectively, related to consolidated variable interest entities, generally not available to the Company) | $ | 19,244 | $ | 21,381 | ||||
Interest bearing deposits with banks | 34,274 | 25,603 | ||||||
Cash deposited with clearing organizations or segregated under federal and other regulations or requirements ($165 and $149 at September 30, 2015 and December 31, 2014, respectively, related to consolidated variable interest entities, generally not available to the Company) | 35,552 | 40,607 | ||||||
Trading assets, at fair value ($129,632 and $127,342 were pledged to various parties at September 30, 2015 and December 31, 2014, respectively) ($834 and $966 at September 30, 2015 and December 31, 2014, respectively, related to consolidated variable interest entities, generally not available to the Company) | 237,811 | 256,801 | ||||||
Investment securities (includes $61,159 and $69,216 at fair value at September 30, 2015 and December 31, 2014, respectively) | 64,689 | 69,316 | ||||||
Securities received as collateral, at fair value | 9,456 | 21,316 | ||||||
Securities purchased under agreements to resell (includes $809 and $1,113 at fair value at September 30, 2015 and December 31, 2014, respectively) | 127,206 | 83,288 | ||||||
Securities borrowed | 148,245 | 136,708 | ||||||
Customer and other receivables | 50,070 | 48,961 | ||||||
Loans: | ||||||||
Held for investment (net of allowances of $173 and $149 at September 30, 2015 and December 31, 2014, respectively) | 69,010 | 57,119 | ||||||
Held for sale | 9,199 | 9,458 | ||||||
Other investments ($364 and $467 at September 30, 2015 and December 31, 2014, respectively, related to consolidated variable interest entities, generally not available to the Company) | 4,282 | 4,355 | ||||||
Premises, equipment and software costs (net of accumulated depreciation of $6,906 and $6,219 at September 30, 2015 and December 31, 2014, respectively) ($187 and $191 at September 30, 2015 and December 31, 2014, respectively, related to consolidated variable interest entities, generally not available to the Company) | 6,259 | 6,108 | ||||||
Goodwill | 6,587 | 6,588 | ||||||
Intangible assets (net of accumulated amortization of $2,050 and $1,824 at September 30, 2015 and December 31, 2014, respectively) (includes $5 and $6 at fair value at September 30, 2015 and December 31, 2014, respectively) | 3,069 | 3,159 | ||||||
Other assets ($57 and $59 at September 30, 2015 and December 31, 2014, respectively, related to consolidated variable interest entities, generally not available to the Company) | 9,160 | 10,742 | ||||||
|
|
|
| |||||
Total assets | $ | 834,113 | $ | 801,510 | ||||
|
|
|
| |||||
Liabilities | ||||||||
Deposits | $ | 147,226 | $ | 133,544 | ||||
Short-term borrowings (includes $1,768 and $1,765 at fair value at September 30, 2015 and December 31, 2014, respectively) | 1,982 | 2,261 | ||||||
Trading liabilities, at fair value | 125,525 | 107,381 | ||||||
Obligation to return securities received as collateral, at fair value | 20,328 | 25,685 | ||||||
Securities sold under agreements to repurchase (includes $597 and $612 at fair value at September 30, 2015 and December 31, 2014, respectively) | 58,570 | 69,949 | ||||||
Securities loaned | 20,644 | 25,219 | ||||||
Other secured financings (includes $3,450 and $4,504 at fair value at September 30, 2015 and December 31, 2014, respectively) ($456 and $348 at September 30, 2015 and December 31, 2014, respectively, related to consolidated variable interest entities, generally non-recourse to the Company) | 10,171 | 12,085 | ||||||
Customer and other payables | 193,775 | 181,069 | ||||||
Other liabilities and accrued expenses ($3 and $72 at September 30, 2015 and December 31, 2014, respectively, related to consolidated variable interest entities, generally non-recourse to the Company) | 19,129 | 19,441 | ||||||
Long-term borrowings (includes $31,387 and $31,774 at fair value at September 30, 2015 and December 31, 2014, respectively) | 160,343 | 152,772 | ||||||
|
|
|
| |||||
Total liabilities | 757,693 | 729,406 | ||||||
|
|
|
| |||||
Commitments and contingent liabilities (see Note 11) | ||||||||
Equity | ||||||||
Morgan Stanley shareholders' equity: | ||||||||
Preferred stock (see Note 14) | 7,520 | 6,020 | ||||||
Common stock, $0.01 par value: | ||||||||
Shares authorized: 3,500,000,000 at September 30, 2015 and December 31, 2014; | ||||||||
Shares issued: 2,038,893,979 at September 30, 2015 and December 31, 2014; | ||||||||
Shares outstanding: 1,938,069,312 and 1,950,980,142 at September 30, 2015 and December 31, 2014, respectively | 20 | 20 | ||||||
Additional paid-in capital | 23,876 | 24,249 | ||||||
Retained earnings | 48,746 | 44,625 | ||||||
Employee stock trusts | 2,399 | 2,127 | ||||||
Accumulated other comprehensive loss | (1,419 | ) | (1,248 | ) | ||||
Common stock held in treasury, at cost, $0.01 par value: | ||||||||
Shares outstanding: 100,824,667 and 87,913,837 at September 30, 2015 and December 31, 2014, respectively | (3,456 | ) | (2,766 | ) | ||||
Common stock issued to employee stock trusts | (2,399 | ) | (2,127 | ) | ||||
|
|
|
| |||||
Total Morgan Stanley shareholders' equity | 75,287 | 70,900 | ||||||
Nonredeemable noncontrolling interests | 1,133 | 1,204 | ||||||
|
|
|
| |||||
Total equity | 76,420 | 72,104 | ||||||
|
|
|
| |||||
Total liabilities and equity | $ | 834,113 | $ | 801,510 | ||||
|
|
|
| |||||
See Notes to Condensed Consolidated Financial Statements.
| 3 | |
MORGAN STANLEY
Condensed Consolidated Statements of Changes in Total Equity
Nine Months Ended September 30, 2015 and 2014
(dollars in millions)
(unaudited)
| Preferred Stock | Common Stock | Additional Paid-in Capital | Retained Earnings | Employee Stock Trusts | Accumulated Other Comprehensive Income (Loss) | Common Stock Held in Treasury at Cost | Common Stock Issued to Employee Stock Trusts | Non- redeemable Non- controlling Interests | Total Equity | |||||||||||||||||||||||||||||||
BALANCE AT DECEMBER 31, 2014 | $ | 6,020 | $ | 20 | $ | 24,249 | $ | 44,625 | $ | 2,127 | $ | (1,248 | ) | $ | (2,766 | ) | $ | (2,127 | ) | $ | 1,204 | $ | 72,104 | |||||||||||||||||
Net income applicable to Morgan Stanley | - | - | - | 5,219 | - | - | - | - | - | 5,219 | ||||||||||||||||||||||||||||||
Net income applicable to nonredeemable noncontrolling interests | - | - | - | - | - | - | - | - | 124 | 124 | ||||||||||||||||||||||||||||||
Dividends | - | - | - | (1,098 | ) | - | - | - | - | - | (1,098 | ) | ||||||||||||||||||||||||||||
Shares issued under employee plans and related tax effects | - | - | (356 | ) | - | 272 | - | 1,445 | (272 | ) | - | 1,089 | ||||||||||||||||||||||||||||
Repurchases of common stock and employee tax withholdings | - | - | - | - | - | - | (2,135 | ) | - | - | (2,135 | ) | ||||||||||||||||||||||||||||
Net change in Accumulated other comprehensive income | - | - | - | - | - | (171 | ) | - | - | (3 | ) | (174 | ) | |||||||||||||||||||||||||||
Issuance of preferred stock | 1,500 | - | (7 | ) | - | - | - | - | - | - | 1,493 | |||||||||||||||||||||||||||||
Deconsolidation of certain legal entities associated with a real estate fund | - | - | - | - | - | - | - | - | (191 | ) | (191 | ) | ||||||||||||||||||||||||||||
Other net decreases | - | - | (10 | ) | - | - | - | - | - | (1 | ) | (11 | ) | |||||||||||||||||||||||||||
|
|
|
|
|
|
|
|
|
|
|
|
|
|
|
|
|
|
|
| |||||||||||||||||||||
BALANCE AT SEPTEMBER 30, 2015 | $ | 7,520 | $ | 20 | $ | 23,876 | $ | 48,746 | $ | 2,399 | $ | (1,419 | ) | $ | (3,456 | ) | $ | (2,399 | ) | $ | 1,133 | $ | 76,420 | |||||||||||||||||
|
|
|
|
|
|
|
|
|
|
|
|
|
|
|
|
|
|
|
| |||||||||||||||||||||
BALANCE AT DECEMBER 31, 2013 | $ | 3,220 | $ | 20 | $ | 24,570 | $ | 42,172 | $ | 1,718 | $ | (1,093 | ) | $ | (2,968 | ) | $ | (1,718 | ) | $ | 3,109 | $ | 69,030 | |||||||||||||||||
Net income applicable to Morgan Stanley | - | - | - | 5,097 | - | - | - | - | - | 5,097 | ||||||||||||||||||||||||||||||
Net income applicable to nonredeemable noncontrolling interests | - | - | - | - | - | - | - | - | 156 | 156 | ||||||||||||||||||||||||||||||
Dividends | - | - | - | (696 | ) | - | - | - | - | - | (696 | ) | ||||||||||||||||||||||||||||
Shares issued under employee plans and related tax effects | - | - | (627 | ) | - | 409 | - | 1,638 | (409 | ) | - | 1,011 | ||||||||||||||||||||||||||||
Repurchases of common stock and employee tax withholdings | - | - | - | - | - | - | (1,172 | ) | - | - | (1,172 | ) | ||||||||||||||||||||||||||||
Net change in Accumulated other comprehensive income | - | - | - | - | - | (22 | ) | - | - | (26 | ) | (48 | ) | |||||||||||||||||||||||||||
Issuance of preferred stock | 2,800 | - | (18 | ) | - | - | - | - | - | - | 2,782 | |||||||||||||||||||||||||||||
Deconsolidation of certain legal entities associated with a real estate fund | - | - | - | - | - | - | - | - | (1,606 | ) | (1,606 | ) | ||||||||||||||||||||||||||||
Other net decreases | - | - | (3 | ) | - | - | - | - | - | (540 | ) | (543 | ) | |||||||||||||||||||||||||||
|
|
|
|
|
|
|
|
|
|
|
|
|
|
|
|
|
|
|
| |||||||||||||||||||||
BALANCE AT SEPTEMBER 30, 2014 | $ | 6,020 | $ | 20 | $ | 23,922 | $ | 46,573 | $ | 2,127 | $ | (1,115 | ) | $ | (2,502 | ) | $ | (2,127 | ) | $ | 1,093 | $ | 74,011 | |||||||||||||||||
|
|
|
|
|
|
|
|
|
|
|
|
|
|
|
|
|
|
|
| |||||||||||||||||||||
See Notes to Condensed Consolidated Financial Statements.
| | 4 |
MORGAN STANLEY
Condensed Consolidated Statements of Cash Flows
(dollars in millions)
(unaudited)
| Nine Months Ended September 30, | ||||||||
| 2015 | 2014 | |||||||
CASH FLOWS FROM OPERATING ACTIVITIES | ||||||||
Net income | $ | 5,343 | $ | 5,253 | ||||
Adjustments to reconcile net income to net cash provided by (used for) operating activities: | ||||||||
Income from equity method investments | (118 | ) | (108 | ) | ||||
Compensation payable in common stock and options | 836 | 933 | ||||||
Depreciation and amortization | 1,023 | 748 | ||||||
Net gain on sale of available for sale securities | (74 | ) | (36 | ) | ||||
Impairment charges | 91 | 85 | ||||||
Provision for credit losses on lending activities | 47 | 1 | ||||||
Other operating activities | 264 | (167 | ) | |||||
Changes in assets and liabilities: | ||||||||
Cash deposited with clearing organizations or segregated under federal and other regulations or requirements | 5,055 | (5,903 | ) | |||||
Trading assets, net of Trading liabilities | 39,775 | 39,156 | ||||||
Securities borrowed | (11,537 | ) | (10,596 | ) | ||||
Securities loaned | (4,575 | ) | (5,142 | ) | ||||
Customer and other receivables and other assets | 787 | 2,931 | ||||||
Customer and other payables and other liabilities | 10,351 | 23,335 | ||||||
Securities purchased under agreements to resell | (43,918 | ) | 19,136 | |||||
Securities sold under agreements to repurchase | (11,313 | ) | (61,935 | ) | ||||
|
|
|
| |||||
Net cash provided by (used for) operating activities | (7,963 | ) | 7,691 | |||||
|
|
|
| |||||
CASH FLOWS FROM INVESTING ACTIVITIES | ||||||||
Proceeds from (payments for): | ||||||||
Premises, equipment and software, net | (964 | ) | (533 | ) | ||||
Business dispositions, net of cash disposed | - | 962 | ||||||
Loans: | ||||||||
Purchases, net of proceeds from sales | (1,053 | ) | (797 | ) | ||||
Originations, net of repayments | (10,260 | ) | (13,177 | ) | ||||
Investment securities: | ||||||||
Purchases | (32,133 | ) | (24,581 | ) | ||||
Proceeds from sales | 32,788 | 11,212 | ||||||
Proceeds from paydowns and maturities | 4,285 | 3,415 | ||||||
Other investing activities | (61 | ) | (264 | ) | ||||
|
|
|
| |||||
Net cash used for investing activities | (7,398 | ) | (23,763 | ) | ||||
|
|
|
| |||||
CASH FLOWS FROM FINANCING ACTIVITIES | ||||||||
Net proceeds from (payments for): | ||||||||
Short-term borrowings | (279 | ) | (382 | ) | ||||
Nonredeemable noncontrolling interests | (70 | ) | (189 | ) | ||||
Other secured financings | (1,677 | ) | (1,725 | ) | ||||
Deposits | 13,682 | 12,003 | ||||||
Proceeds from: | ||||||||
Excess tax benefits associated with stock-based awards | 180 | 91 | ||||||
Derivatives financing activities | 392 | 784 | ||||||
Issuance of preferred stock, net of issuance costs | 1,493 | 2,782 | ||||||
Issuance of long-term borrowings | 30,159 | 26,529 | ||||||
Payments for: | ||||||||
Long-term borrowings | (17,615 | ) | (24,731 | ) | ||||
Derivatives financing activities | (372 | ) | (384 | ) | ||||
Repurchases of common stock and employee tax withholdings | (2,135 | ) | (1,172 | ) | ||||
Cash dividends | (1,096 | ) | (652 | ) | ||||
|
|
|
| |||||
Net cash provided by financing activities | 22,662 | 12,954 | ||||||
|
|
|
| |||||
Effect of exchange rate changes on cash and cash equivalents | (767 | ) | (939 | ) | ||||
|
|
|
| |||||
Net decrease in cash and cash equivalents | 6,534 | (4,057 | ) | |||||
Cash and cash equivalents, at beginning of period | 46,984 | 59,883 | ||||||
|
|
|
| |||||
Cash and cash equivalents, at end of period | $ | 53,518 | $ | 55,826 | ||||
|
|
|
| |||||
Cash and cash equivalents include: | ||||||||
Cash and due from banks | $ | 19,244 | $ | 20,242 | ||||
Interest bearing deposits with banks | 34,274 | 35,584 | ||||||
|
|
|
| |||||
Cash and cash equivalents, at end of period | $ | 53,518 | $ | 55,826 | ||||
|
|
|
| |||||
SUPPLEMENTAL DISCLOSURE OF CASH FLOW INFORMATION
Cash payments for interest were $1,456 million and $2,116 million for the nine months ended September 30, 2015 and 2014, respectively.
Cash payments for income taxes were $541 million and $620 million for the nine months ended September 30, 2015 and 2014, respectively.
See Notes to Condensed Consolidated Financial Statements.
| 5 | |
MORGAN STANLEY
NOTES TO CONDENSED CONSOLIDATED FINANCIAL STATEMENTS (Unaudited)
| 1. | Introduction and Basis of Presentation. |
The Company.
Morgan Stanley, a financial holding company, is a global financial services firm that maintains significant market positions in each of its business segments-Institutional Securities, Wealth Management and Investment Management. Morgan Stanley, through its subsidiaries and affiliates, provides a wide variety of products and services to a large and diversified group of clients and customers, including corporations, governments, financial institutions and individuals. Unless the context otherwise requires, the terms "Morgan Stanley" or the "Company" mean Morgan Stanley (the "Parent") together with its consolidated subsidiaries.
For a summary of the activities of each of the Company's business segments, see Note 1 to the consolidated financial statements in the Company's Annual Report on Form 10-K for the year ended December 31, 2014 (the "2014 Form 10-K").
Basis of Financial Information.
The Company's condensed consolidated financial statements are prepared in accordance with accounting principles generally accepted in the United States of America ("U.S. GAAP"), which require the Company to make estimates and assumptions regarding the valuations of certain financial instruments, the valuation of goodwill and intangible assets, compensation, deferred tax assets, the outcome of legal and tax matters, allowance for credit losses and other matters that affect its condensed consolidated financial statements and related disclosures. The Company believes that the estimates utilized in the preparation of its condensed consolidated financial statements are prudent and reasonable. Actual results could differ materially from these estimates. Intercompany balances and transactions have been eliminated.
The accompanying condensed consolidated financial statements should be read in conjunction with the Company's consolidated financial statements and notes thereto included in the 2014 Form 10-K. Certain footnote disclosures included in the 2014 Form 10-K have been condensed or omitted from the condensed consolidated financial statements as they are not required for interim reporting under U.S. GAAP. The condensed consolidated financial statements reflect all adjustments of a normal recurring nature that are, in the opinion of management, necessary for the fair presentation of the results for the interim period. The results of operations for interim periods are not necessarily indicative of results for the entire year.
Consolidation.
The condensed consolidated financial statements include the accounts of the Company, its wholly owned subsidiaries and other entities in which the Company has a controlling financial interest, including certain variable interest entities ("VIE") (see Note 12). For consolidated subsidiaries that are less than wholly owned, the third-party holdings of equity interests are referred to as noncontrolling interests. The net income attributable to noncontrolling interests for such subsidiaries is presented as Net income (loss) applicable to nonredeemable noncontrolling interests in the Company's condensed consolidated statements of income. The portion of shareholders' equity of such subsidiaries that is attributable to noncontrolling interests for such subsidiaries is presented as Nonredeemable noncontrolling interests, a component of total equity, in the Company's condensed consolidated statements of financial condition.
For a discussion of the Company's VIEs and its significant regulated U.S. and international subsidiaries, see Note 1 to the consolidated financial statements in the 2014 Form 10-K.
| | 6 |
MORGAN STANLEY
NOTES TO CONDENSED CONSOLIDATED FINANCIAL STATEMENTS (Unaudited)-(Continued)
Income Statement Presentation.
The Company, through its subsidiaries and affiliates, provides a wide variety of products and services to a large and diversified group of clients and customers, including corporations, governments, financial institutions and individuals. In connection with the delivery of the various products and services to clients, the Company manages its revenues and related expenses in the aggregate. As such, when assessing the performance of its businesses, primarily in its Institutional Securities business segment, the Company considers its trading, investment banking, commissions and fees, and interest income, along with the associated interest expense, as one integrated activity.
Statements of Cash Flows Presentation.
During 2015, the Company deconsolidated approximately $191 million in net assets previously attributable to nonredeemable noncontrolling interests that were related to a real estate fund sponsored by the Company. The deconsolidation resulted in a non-cash reduction of assets of $169 million. During 2014, the Company deconsolidated approximately $1.6 billion in net assets previously attributable to nonredeemable noncontrolling interests related to certain legal entities associated with another real estate fund sponsored by the Company. The deconsolidation resulted in a non-cash reduction of assets of $1.3 billion.
Global Oil Merchanting Business.
As a result of entering into a definitive agreement to sell the global oil merchanting unit of the commodities division to Castleton Commodities International LLC, on May 11, 2015, the Company recognized an impairment charge of $10 million and $69 million in Other revenues in the Company's condensed consolidated statements of income in the quarter and nine months ended September 30, 2015, respectively, to reduce the carrying amount of the unit to its estimated fair value less costs to sell. The Company closed the transaction on November 1, 2015. The transaction does not meet the criteria for discontinued operations and is not expected to have a material impact on the Company's financial results (see Note 3).
TransMontaigne.
On July 1, 2014, the Company completed the sale of its ownership stake in TransMontaigne Inc. ("TransMontaigne"), a U.S.-based oil storage, marketing and transportation company, as well as related physical inventory and the assumption of the Company's obligations under certain terminal storage contracts, to NGL Energy Partners LP. The gain on sale, which was included in continuing operations, was approximately $101 million for the quarter and nine months ended September 30, 2014.
CanTerm.
On March 27, 2014, the Company completed the sale of Canterm Canadian Terminals Inc. ("CanTerm"), a public storage terminal operator for refined products with two distribution terminals in Canada. As a result of the Company's level of continuing involvement with CanTerm, the results of CanTerm are reported as a component of continuing operations within the Company's Institutional Securities business segment for the nine months ended September 30, 2014. The gain on sale was approximately $45 million and is included in the condensed consolidated statement of income for the nine months ended September 30, 2014.
| 2. | Significant Accounting Policies. |
For a detailed discussion about the Company's significant accounting policies, see Note 2 to the consolidated financial statements in the 2014 Form 10-K.
| 7 | |
MORGAN STANLEY
NOTES TO CONDENSED CONSOLIDATED FINANCIAL STATEMENTS (Unaudited)-(Continued)
During the quarter and nine months ended September 30, 2015, other than the following, there were no significant updates made to the Company's significant accounting policies.
Accounting Standards Adopted.
Repurchase-to-Maturity Transactions, Repurchase Financings, and Disclosures.
In June 2014, the Financial Accounting Standards Board (the "FASB") issued an accounting update requiring repurchase-to-maturity transactions be accounted for as secured borrowings consistent with the accounting for other repurchase agreements. This accounting update also requires separate accounting for a transfer of a financial asset executed contemporaneously with a repurchase agreement with the same counterparty (a repurchase financing), which will result in secured borrowing accounting for the repurchase agreement. This guidance became effective for the Company beginning January 1, 2015. In addition, new disclosures are required for sales of financial assets where the Company retains substantially all the exposure throughout the term and for the collateral pledged and remaining maturity of repurchase and securities lending agreements, which were effective January 1, 2015, and April 1, 2015, respectively. The adoption of this guidance did not have a material impact on the Company's condensed consolidated financial statements. For further information on the adoption of this guidance, see Notes 6 and 12.
Disclosures for Investments in Certain Entities That Calculate Net Asset Value per Share (or Its Equivalent).
In May 2015, the FASB issued an accounting update that removes the requirement to categorize within the fair value hierarchy all investments for which fair value is measured at net asset value ("NAV") per share, or its equivalent using the practical expedient. The Company adopted this guidance retrospectively during the second quarter of 2015, as early adoption is permitted. For further information on the adoption of this guidance, see Note 3.
Goodwill.
The Company completed its annual goodwill impairment testing at July 1, 2015. The Company's impairment testing did not indicate any goodwill impairment, as each of the Company's reporting units with goodwill had a fair value that was substantially in excess of its carrying value. However, adverse market or economic events could result in impairment charges in future periods.
| 3. | Fair Values. |
Fair Value Measurements.
For a description of the valuation techniques applied to the Company's major categories of assets and liabilities measured at fair value on a recurring basis, see Note 4 to the consolidated financial statements in the 2014 Form 10-K.
| | 8 |
MORGAN STANLEY
NOTES TO CONDENSED CONSOLIDATED FINANCIAL STATEMENTS (Unaudited)-(Continued)
The following fair value hierarchy tables present information about the Company's assets and liabilities measured at fair value on a recurring basis at September 30, 2015 and December 31, 2014.
Assets and Liabilities Measured at Fair Value on a Recurring Basis.
At September 30, 2015.
| Quoted Prices in Active Markets for Identical Assets (Level 1) | Significant Observable Inputs (Level 2) | Significant Unobservable Inputs (Level 3) | Counterparty and Cash Collateral Netting | Balance at September 30, 2015 | ||||||||||||||||
| (dollars in millions) | ||||||||||||||||||||
Assets at Fair Value | ||||||||||||||||||||
Trading assets: | ||||||||||||||||||||
U.S. government and agency securities: | ||||||||||||||||||||
U.S. Treasury securities | $ | 18,359 | $ | - | $ | - | $ | - | $ | 18,359 | ||||||||||
U.S. agency securities | 1,328 | 18,690 | - | - | 20,018 | |||||||||||||||
|
|
|
|
|
|
|
|
|
| |||||||||||
Total U.S. government and agency securities | 19,687 | 18,690 | - | - | 38,377 | |||||||||||||||
Other sovereign government obligations | 19,597 | 7,493 | 11 | - | 27,101 | |||||||||||||||
Corporate and other debt: | ||||||||||||||||||||
State and municipal securities | - | 1,954 | 33 | - | 1,987 | |||||||||||||||
Residential mortgage-backed securities | - | 1,746 | 404 | - | 2,150 | |||||||||||||||
Commercial mortgage-backed securities | - | 1,868 | 79 | - | 1,947 | |||||||||||||||
Asset-backed securities | - | 771 | 31 | - | 802 | |||||||||||||||
Corporate bonds | - | 13,207 | 226 | - | 13,433 | |||||||||||||||
Collateralized debt and loan obligations | - | 187 | 545 | - | 732 | |||||||||||||||
Loans and lending commitments | - | 6,170 | 5,164 | - | 11,334 | |||||||||||||||
Other debt | - | 1,714 | 530 | - | 2,244 | |||||||||||||||
|
|
|
|
|
|
|
|
|
| |||||||||||
Total corporate and other debt | - | 27,617 | 7,012 | - | 34,629 | |||||||||||||||
Corporate equities(1) | 96,023 | 491 | 575 | - | 97,089 | |||||||||||||||
Derivative and other contracts: | ||||||||||||||||||||
Interest rate contracts | 860 | 368,503 | 2,160 | - | 371,523 | |||||||||||||||
Credit contracts | - | 23,844 | 937 | - | 24,781 | |||||||||||||||
Foreign exchange contracts | 102 | 70,801 | 347 | - | 71,250 | |||||||||||||||
Equity contracts | 876 | 49,833 | 951 | - | 51,660 | |||||||||||||||
Commodity contracts | 3,392 | 14,646 | 3,203 | - | 21,241 | |||||||||||||||
Other | - | 364 | - | - | 364 | |||||||||||||||
Netting(2) | (4,652 | ) | (437,820 | ) | (3,981 | ) | (61,072 | ) | (507,525 | ) | ||||||||||
|
|
|
|
|
|
|
|
|
| |||||||||||
Total derivative and other contracts | 578 | 90,171 | 3,617 | (61,072 | ) | 33,294 | ||||||||||||||
Investments: | ||||||||||||||||||||
Investments measured at NAV(3) | 4,278 | |||||||||||||||||||
Principal investments | 23 | 97 | 541 | - | 661 | |||||||||||||||
Other | 149 | 204 | 312 | - | 665 | |||||||||||||||
|
|
|
|
|
|
|
|
|
| |||||||||||
Total investments | 172 | 301 | 853 | - | 5,604 | |||||||||||||||
Physical commodities | - | 1,717 | - | - | 1,717 | |||||||||||||||
|
|
|
|
|
|
|
|
|
| |||||||||||
Total trading assets | 136,057 | 146,480 | 12,068 | (61,072 | ) | 237,811 | ||||||||||||||
AFS securities | 27,765 | 33,394 | - | - | 61,159 | |||||||||||||||
Securities received as collateral | 9,455 | - | 1 | - | 9,456 | |||||||||||||||
Securities purchased under agreements to resell | - | 809 | - | - | 809 | |||||||||||||||
Intangible assets(4) | - | - | 5 | - | 5 | |||||||||||||||
|
|
|
|
|
|
|
|
|
| |||||||||||
Total assets measured at fair value | $ | 173,277 | $ | 180,683 | $ | 12,074 | $ | (61,072 | ) | $ | 309,240 | |||||||||
|
|
|
|
|
|
|
|
|
| |||||||||||
| 9 | |
MORGAN STANLEY
NOTES TO CONDENSED CONSOLIDATED FINANCIAL STATEMENTS (Unaudited)-(Continued)
| Quoted Prices in Active Markets for Identical Assets (Level 1) | Significant Observable Inputs (Level 2) | Significant Unobservable Inputs (Level 3) | Counterparty and Cash Collateral Netting | Balance at September 30, 2015 | ||||||||||||||||
| (dollars in millions) | ||||||||||||||||||||
Liabilities at Fair Value | ||||||||||||||||||||
Short-term borrowings | $ | - | $ | 1,699 | $ | 69 | $ | - | $ | 1,768 | ||||||||||
Trading liabilities: | ||||||||||||||||||||
U.S. government and agency securities: | ||||||||||||||||||||
U.S. Treasury securities | 14,524 | - | - | - | 14,524 | |||||||||||||||
U.S. agency securities | 1,026 | 135 | - | - | 1,161 | |||||||||||||||
|
|
|
|
|
|
|
|
|
| |||||||||||
Total U.S. government and agency securities | 15,550 | 135 | - | - | 15,685 | |||||||||||||||
Other sovereign government obligations | 13,611 | 2,379 | - | - | 15,990 | |||||||||||||||
Corporate and other debt: | ||||||||||||||||||||
State and municipal securities | - | 3 | - | - | 3 | |||||||||||||||
Corporate bonds | - | 6,783 | 19 | - | 6,802 | |||||||||||||||
Lending commitments | - | 2 | - | - | 2 | |||||||||||||||
Other debt | - | 7 | 4 | - | 11 | |||||||||||||||
|
|
|
|
|
|
|
|
|
| |||||||||||
Total corporate and other debt | - | 6,795 | 23 | - | 6,818 | |||||||||||||||
Corporate equities(1) | 50,017 | 1,145 | 97 | - | 51,259 | |||||||||||||||
Derivative and other contracts: | ||||||||||||||||||||
Interest rate contracts | 780 | 346,806 | 2,071 | - | 349,657 | |||||||||||||||
Credit contracts | - | 22,900 | 1,742 | - | 24,642 | |||||||||||||||
Foreign exchange contracts | 60 | 72,593 | 281 | - | 72,934 | |||||||||||||||
Equity contracts | 691 | 53,728 | 2,992 | - | 57,411 | |||||||||||||||
Commodity contracts | 3,845 | 13,551 | 1,771 | - | 19,167 | |||||||||||||||
Other | - | 51 | - | - | 51 | |||||||||||||||
Netting(2) | (4,652 | ) | (437,820 | ) | (3,981 | ) | (41,636 | ) | (488,089 | ) | ||||||||||
|
|
|
|
|
|
|
|
|
| |||||||||||
Total derivative and other contracts | 724 | 71,809 | 4,876 | (41,636 | ) | 35,773 | ||||||||||||||
Total trading liabilities | 79,902 | 82,263 | 4,996 | (41,636 | ) | 125,525 | ||||||||||||||
Obligation to return securities received as collateral | 20,327 | - | 1 | - | 20,328 | |||||||||||||||
Securities sold under agreements to repurchase | - | 443 | 154 | - | 597 | |||||||||||||||
Other secured financings | - | 3,109 | 341 | - | 3,450 | |||||||||||||||
Long-term borrowings | - | 28,925 | 2,462 | - | 31,387 | |||||||||||||||
|
|
|
|
|
|
|
|
|
| |||||||||||
Total liabilities measured at fair value | $ | 100,229 | $ | 116,439 | $ | 8,023 | $ | (41,636 | ) | $ | 183,055 | |||||||||
|
|
|
|
|
|
|
|
|
| |||||||||||
AFS-available for sale
| (1) | For trading purposes, the Company holds or sells short equity securities issued by entities in diverse industries and of varying size. |
| (2) | For positions with the same counterparty that cross over the levels of the fair value hierarchy, both counterparty netting and cash collateral netting are included in the column titled "Counterparty and Cash Collateral Netting." For contracts with the same counterparty, counterparty netting among positions classified within the same level is included within that shared level. For further information on derivative instruments and hedging activities, see Note 4. |
| (3) | Certain investments that are measured at fair value using the NAV per share, or its equivalent, are not classified in the fair value hierarchy. For additional disclosure about such investments, see "Fair Value of Investments that are Measured at Net Asset Value" herein. |
| (4) | Amount represents mortgage servicing rights ("MSRs") accounted for at fair value. |
| | 10 |
MORGAN STANLEY
NOTES TO CONDENSED CONSOLIDATED FINANCIAL STATEMENTS (Unaudited)-(Continued)
At December 31, 2014.
| Quoted Prices in Active Markets for Identical Assets (Level 1) | Significant Observable Inputs (Level 2) | Significant Unobservable Inputs (Level 3) | Counterparty and Cash Collateral Netting | Balance at December 31, 2014 | ||||||||||||||||
| (dollars in millions) | ||||||||||||||||||||
Assets at Fair Value | ||||||||||||||||||||
Trading assets: | ||||||||||||||||||||
U.S. government and agency securities: | ||||||||||||||||||||
U.S. Treasury securities | $ | 16,961 | $ | - | $ | - | $ | - | $ | 16,961 | ||||||||||
U.S. agency securities | 850 | 18,193 | - | - | 19,043 | |||||||||||||||
|
|
|
|
|
|
|
|
|
| |||||||||||
Total U.S. government and agency securities | 17,811 | 18,193 | - | - | 36,004 | |||||||||||||||
Other sovereign government obligations | 15,149 | 7,888 | 41 | - | 23,078 | |||||||||||||||
Corporate and other debt: | ||||||||||||||||||||
State and municipal securities | - | 2,049 | - | - | 2,049 | |||||||||||||||
Residential mortgage-backed securities | - | 1,991 | 175 | - | 2,166 | |||||||||||||||
Commercial mortgage-backed securities | - | 1,484 | 96 | - | 1,580 | |||||||||||||||
Asset-backed securities | - | 583 | 76 | - | 659 | |||||||||||||||
Corporate bonds | - | 15,800 | 386 | - | 16,186 | |||||||||||||||
Collateralized debt and loan obligations | - | 741 | 1,152 | - | 1,893 | |||||||||||||||
Loans and lending commitments | - | 6,088 | 5,874 | - | 11,962 | |||||||||||||||
Other debt | - | 2,167 | 285 | - | 2,452 | |||||||||||||||
|
|
|
|
|
|
|
|
|
| |||||||||||
Total corporate and other debt | - | 30,903 | 8,044 | - | 38,947 | |||||||||||||||
Corporate equities(1) | 112,490 | 1,357 | 272 | - | 114,119 | |||||||||||||||
Derivative and other contracts: | ||||||||||||||||||||
Interest rate contracts | 663 | 495,026 | 2,484 | - | 498,173 | |||||||||||||||
Credit contracts | - | 30,813 | 1,369 | - | 32,182 | |||||||||||||||
Foreign exchange contracts | 83 | 72,769 | 249 | - | 73,101 | |||||||||||||||
Equity contracts(2) | 571 | 45,967 | 1,586 | - | 48,124 | |||||||||||||||
Commodity contracts | 4,105 | 18,042 | 2,268 | - | 24,415 | |||||||||||||||
Other | - | 376 | - | - | 376 | |||||||||||||||
Netting(3) | (4,910 | ) | (564,127 | ) | (4,220 | ) | (66,720 | ) | (639,977 | ) | ||||||||||
|
|
|
|
|
|
|
|
|
| |||||||||||
Total derivative and other contracts | 512 | 98,866 | 3,736 | (66,720 | ) | 36,394 | ||||||||||||||
Investments: | ||||||||||||||||||||
Investments measured at NAV(4) | 5,009 | |||||||||||||||||||
Principal investments | 58 | 3 | 835 | - | 896 | |||||||||||||||
Other | 225 | 198 | 323 | - | 746 | |||||||||||||||
|
|
|
|
|
|
|
|
|
| |||||||||||
Total investments | 283 | 201 | 1,158 | - | 6,651 | |||||||||||||||
Physical commodities | - | 1,608 | - | - | 1,608 | |||||||||||||||
|
|
|
|
|
|
|
|
|
| |||||||||||
Total trading assets | 146,245 | 159,016 | 13,251 | (66,720 | ) | 256,801 | ||||||||||||||
AFS securities | 37,200 | 32,016 | - | - | 69,216 | |||||||||||||||
Securities received as collateral | 21,265 | 51 | - | - | 21,316 | |||||||||||||||
Securities purchased under agreements to resell | - | 1,113 | - | - | 1,113 | |||||||||||||||
Intangible assets(5) | - | - | 6 | - | 6 | |||||||||||||||
|
|
|
|
|
|
|
|
|
| |||||||||||
Total assets measured at fair value | $ | 204,710 | $ | 192,196 | $ | 13,257 | $ | (66,720 | ) | $ | 348,452 | |||||||||
|
|
|
|
|
|
|
|
|
| |||||||||||
| 11 | |
MORGAN STANLEY
NOTES TO CONDENSED CONSOLIDATED FINANCIAL STATEMENTS (Unaudited)-(Continued)
| Quoted Prices in Active Markets for Identical Assets (Level 1) | Significant Observable Inputs (Level 2) | Significant Unobservable Inputs (Level 3) | Counterparty and Cash Collateral Netting | Balance at December 31, 2014 | ||||||||||||||||
| (dollars in millions) | ||||||||||||||||||||
Liabilities at Fair Value | ||||||||||||||||||||
Short-term borrowings | $ | - | $ | 1,765 | $ | - | $ | - | $ | 1,765 | ||||||||||
Trading liabilities: | ||||||||||||||||||||
U.S. government and agency securities: | ||||||||||||||||||||
U.S. Treasury securities | 14,199 | - | - | - | 14,199 | |||||||||||||||
U.S. agency securities | 1,274 | 85 | - | - | 1,359 | |||||||||||||||
|
|
|
|
|
|
|
|
|
| |||||||||||
Total U.S. government and agency securities | 15,473 | 85 | - | - | 15,558 | |||||||||||||||
Other sovereign government obligations | 11,653 | 2,109 | - | - | 13,762 | |||||||||||||||
Corporate and other debt: | ||||||||||||||||||||
State and municipal securities | - | 1 | - | - | 1 | |||||||||||||||
Corporate bonds | - | 5,943 | 78 | - | 6,021 | |||||||||||||||
Lending commitments | - | 10 | 5 | - | 15 | |||||||||||||||
Other debt | - | 63 | 38 | - | 101 | |||||||||||||||
|
|
|
|
|
|
|
|
|
| |||||||||||
Total corporate and other debt | - | 6,017 | 121 | - | 6,138 | |||||||||||||||
Corporate equities(1) | 31,340 | 326 | 45 | - | 31,711 | |||||||||||||||
Derivative and other contracts: | ||||||||||||||||||||
Interest rate contracts | 602 | 469,319 | 2,657 | - | 472,578 | |||||||||||||||
Credit contracts | - | 29,997 | 2,112 | - | 32,109 | |||||||||||||||
Foreign exchange contracts | 21 | 72,233 | 98 | - | 72,352 | |||||||||||||||
Equity contracts(2) | 416 | 51,405 | 3,751 | - | 55,572 | |||||||||||||||
Commodity contracts | 4,817 | 15,584 | 1,122 | - | 21,523 | |||||||||||||||
Other | - | 172 | - | - | 172 | |||||||||||||||
Netting(3) | (4,910 | ) | (564,127 | ) | (4,220 | ) | (40,837 | ) | (614,094 | ) | ||||||||||
|
|
|
|
|
|
|
|
|
| |||||||||||
Total derivative and other contracts | 946 | 74,583 | 5,520 | (40,837 | ) | 40,212 | ||||||||||||||
Total trading liabilities | 59,412 | 83,120 | 5,686 | (40,837 | ) | 107,381 | ||||||||||||||
Obligation to return securities received as collateral | 25,629 | 56 | - | - | 25,685 | |||||||||||||||
Securities sold under agreements to repurchase | - | 459 | 153 | - | 612 | |||||||||||||||
Other secured financings | - | 4,355 | 149 | - | 4,504 | |||||||||||||||
Long-term borrowings | - | 29,840 | 1,934 | - | 31,774 | |||||||||||||||
|
|
|
|
|
|
|
|
|
| |||||||||||
Total liabilities measured at fair value | $ | 85,041 | $ | 119,595 | $ | 7,922 | $ | (40,837 | ) | $ | 171,721 | |||||||||
|
|
|
|
|
|
|
|
|
| |||||||||||
| (1) | For trading purposes, the Company holds or sells short equity securities issued by entities in diverse industries and of varying size. |
| (2) | The balance of Level 3 asset derivative equity contracts increased by $57 million with a corresponding decrease in the balance of Level 2 asset derivative equity contracts, and the balance of Level 3 liability derivative equity contracts increased by $842 million with a corresponding decrease in the balance of Level 2 liability derivative equity contracts to correct the fair value level assigned to these contracts at December 31, 2014. The total amount of asset and liability derivative equity contracts remained unchanged. |
| (3) | For positions with the same counterparty that cross over the levels of the fair value hierarchy, both counterparty netting and cash collateral netting are included in the column titled "Counterparty and Cash Collateral Netting." For contracts with the same counterparty, counterparty netting among positions classified within the same level is included within that shared level. For further information on derivative instruments and hedging activities, see Note 4. |
| (4) | Certain investments that are measured at fair value using the NAV per share, or its equivalent, are not classified in the fair value hierarchy. For additional disclosure about such investments, see "Fair Value of Investments that are Measured at Net Asset Value" herein. |
| (5) | Amount represents MSRs accounted for at fair value. |
| | 12 |
MORGAN STANLEY
NOTES TO CONDENSED CONSOLIDATED FINANCIAL STATEMENTS (Unaudited)-(Continued)
Changes in Level 3 Assets and Liabilities Measured at Fair Value on a Recurring Basis.
The following tables present additional information about Level 3 assets and liabilities measured at fair value on a recurring basis for the quarters and nine months ended September 30, 2015 and 2014, respectively. Level 3 instruments may be hedged with instruments classified in Level 1 and Level 2. As a result, the realized and unrealized gains (losses) for assets and liabilities within the Level 3 category presented in the tables below do not reflect the related realized and unrealized gains (losses) on hedging instruments that have been classified by the Company within the Level 1 and/or Level 2 categories.
Additionally, both observable and unobservable inputs may be used to determine the fair value of positions that the Company has classified within the Level 3 category. As a result, the unrealized gains (losses) during the period for assets and liabilities within the Level 3 category presented in the tables below may include changes in fair value during the period that were attributable to both observable ( e.g. , changes in market interest rates) and unobservable ( e.g. , changes in unobservable long-dated volatilities) inputs.
For assets and liabilities that were transferred into Level 3 during the period, gains (losses) are presented as if the assets or liabilities had been transferred into Level 3 at the beginning of the period; similarly, for assets and liabilities that were transferred out of Level 3 during the period, gains (losses) are presented as if the assets or liabilities had been transferred out at the beginning of the period.
| 13 | |
MORGAN STANLEY
NOTES TO CONDENSED CONSOLIDATED FINANCIAL STATEMENTS (Unaudited)-(Continued)
Three Months Ended September 30, 2015.
| Beginning Balance at June 30, 2015 | Total Realized and Unrealized Gains (Losses)(1) | Purchases(2) | Sales | Issuances | Settlements | Net Transfers | Ending Balance at September 30, 2015 | Unrealized Gains (Losses) for Level 3 Assets/ Liabilities Outstanding at September 30, 2015(3) | ||||||||||||||||||||||||||||
| (dollars in millions) | ||||||||||||||||||||||||||||||||||||
Assets at Fair Value | ||||||||||||||||||||||||||||||||||||
Trading assets: | ||||||||||||||||||||||||||||||||||||
U.S. agency securities | $ | 3 | $ | - | $ | - | $ | - | $ | - | $ | - | $ | (3 | ) | $ | - | $ | - | |||||||||||||||||
Other sovereign government obligations | 12 | - | 5 | (4 | ) | - | - | (2 | ) | 11 | - | |||||||||||||||||||||||||
Corporate and other debt: | ||||||||||||||||||||||||||||||||||||
State and municipal securities | 7 | 5 | 12 | (5 | ) | - | - | 14 | 33 | 5 | ||||||||||||||||||||||||||
Residential mortgage-backed securities | 378 | 3 | 59 | (55 | ) | - | - | 19 | 404 | 4 | ||||||||||||||||||||||||||
Commercial mortgage-backed securities | 84 | (12 | ) | 17 | (6 | ) | - | - | (4 | ) | 79 | (12 | ) | |||||||||||||||||||||||
Asset-backed securities | 19 | - | 13 | (7 | ) | - | - | 6 | 31 | - | ||||||||||||||||||||||||||
Corporate bonds | 479 | (25 | ) | 78 | (228 | ) | - | (50 | ) | (28 | ) | 226 | (6 | ) | ||||||||||||||||||||||
Collateralized debt and loan obligations | 660 | (7 | ) | 80 | (188 | ) | - | - | - | 545 | (11 | ) | ||||||||||||||||||||||||
Loans and lending commitments | 5,512 | (78 | ) | 939 | (156 | ) | - | (1,229 | ) | 176 | 5,164 | (53 | ) | |||||||||||||||||||||||
Other debt | 564 | (22 | ) | 9 | (4 | ) | - | (1 | ) | (16 | ) | 530 | (23 | ) | ||||||||||||||||||||||
|
|
|
|
|
|
|
|
|
|
|
|
|
|
|
|
|
| |||||||||||||||||||
Total corporate and other debt | 7,703 | (136 | ) | 1,207 | (649 | ) | - | (1,280 | ) | 167 | 7,012 | (96 | ) | |||||||||||||||||||||||
Corporate equities | 486 | 10 | 150 | (80 | ) | - | - | 9 | 575 | 4 | ||||||||||||||||||||||||||
Net derivative and other contracts(4): | ||||||||||||||||||||||||||||||||||||
Interest rate contracts | (236 | ) | (137 | ) | 12 | - | (7 | ) | 74 | 383 | 89 | (66 | ) | |||||||||||||||||||||||
Credit contracts | (989 | ) | 210 | - | - | (74 | ) | 86 | (38 | ) | (805 | ) | 219 | |||||||||||||||||||||||
Foreign exchange contracts | 446 | 42 | 3 | - | - | (327 | ) | (98 | ) | 66 | 45 | |||||||||||||||||||||||||
Equity contracts | (2,102 | ) | 309 | 16 | - | (50 | ) | (187 | ) | (27 | ) | (2,041 | ) | 296 | ||||||||||||||||||||||
Commodity contracts | 1,205 | 238 | - | - | - | (11 | ) | - | 1,432 | 179 | ||||||||||||||||||||||||||
|
|
|
|
|
|
|
|
|
|
|
|
|
|
|
|
|
| |||||||||||||||||||
Total net derivative and other contracts | (1,676 | ) | 662 | 31 | - | (131 | ) | (365 | ) | 220 | (1,259 | ) | 673 | |||||||||||||||||||||||
Investments: | ||||||||||||||||||||||||||||||||||||
Principal investments | 581 | 26 | 8 | (50 | ) | - | - | (24 | ) | 541 | 26 | |||||||||||||||||||||||||
Other | 300 | 11 | 1 | - | - | - | - | 312 | 11 | |||||||||||||||||||||||||||
| Securities received as collateral | 3 | - | - | (2 | ) | - | - | - | 1 | - | ||||||||||||||||||||||||||
| Intangible assets | 6 | (1 | ) | - | - | - | - | - | 5 | (1 | ) | |||||||||||||||||||||||||
Liabilities at Fair Value | ||||||||||||||||||||||||||||||||||||
| Short-term borrowings | $ | - | $ | (2 | ) | $ | - | $ | - | $ | 4 | $ | - | $ | 63 | $ | 69 | $ | (2 | ) | ||||||||||||||||
| Trading liabilities: | ||||||||||||||||||||||||||||||||||||
Corporate and other debt: | ||||||||||||||||||||||||||||||||||||
Corporate bonds | 15 | 9 | (10 | ) | 23 | - | - | - | 19 | 7 | ||||||||||||||||||||||||||
Other debt | 4 | - | - | - | - | - | - | 4 | - | |||||||||||||||||||||||||||
|
|
|
|
|
|
|
|
|
|
|
|
|
|
|
|
|
| |||||||||||||||||||
Total corporate and other debt | 19 | 9 | (10 | ) | 23 | - | - | - | 23 | 7 | ||||||||||||||||||||||||||
Corporate equities | 112 | 72 | (50 | ) | 99 | - | - | 8 | 97 | 73 | ||||||||||||||||||||||||||
Obligation to return securities received as collateral | 3 | - | (2 | ) | - | - | - | - | 1 | - | ||||||||||||||||||||||||||
Securities sold under agreements to repurchase | 154 | - | - | - | - | - | - | 154 | - | |||||||||||||||||||||||||||
Other secured financings | 168 | 2 | - | - | 187 | (12 | ) | - | 341 | 2 | ||||||||||||||||||||||||||
Long-term borrowings | 2,221 | 61 | - | - | 237 | (81 | ) | 146 | 2,462 | 64 | ||||||||||||||||||||||||||
| (1) | Total realized and unrealized gains (losses) are primarily included in Trading revenues in the condensed consolidated statements of income except for $37 million related to Trading assets-Investments, which is included in Investments revenues. |
| (2) | Loan originations are included in purchases. |
| (3) | Amounts represent unrealized gains (losses) for the quarter ended September 30, 2015 related to assets and liabilities still outstanding at September 30, 2015. |
| (4) | Net derivative and other contracts represent Trading assets-Derivative and other contracts net of Trading liabilities-Derivative and other contracts. For further information on derivative instruments and hedging activities, see Note 4. |
| | 14 |
MORGAN STANLEY
NOTES TO CONDENSED CONSOLIDATED FINANCIAL STATEMENTS (Unaudited)-(Continued)
Nine Months Ended September 30, 2015.
| Beginning Balance at December 31, 2014 | Total Realized and Unrealized Gains (Losses)(1) | Purchases(2) | Sales | Issuances | Settlements | Net Transfers | Ending Balance at September 30, 2015 | Unrealized Gains (Losses) for Level 3 Assets/ Liabilities Outstanding at September 30, 2015(3) | ||||||||||||||||||||||||||||
| (dollars in millions) | ||||||||||||||||||||||||||||||||||||
Assets at Fair Value | ||||||||||||||||||||||||||||||||||||
Trading assets: | ||||||||||||||||||||||||||||||||||||
Other sovereign government obligations | $ | 41 | $ | (1 | ) | $ | 7 | $ | (31 | ) | $ | - | $ | - | $ | (5 | ) | $ | 11 | $ | - | |||||||||||||||
Corporate and other debt: | ||||||||||||||||||||||||||||||||||||
State and municipal securities | - | 5 | 14 | (1 | ) | - | - | 15 | 33 | 5 | ||||||||||||||||||||||||||
Residential mortgage-backed securities | 175 | 28 | 172 | (57 | ) | - | - | 86 | 404 | 19 | ||||||||||||||||||||||||||
Commercial mortgage-backed securities | 96 | (17 | ) | 23 | (23 | ) | - | - | - | 79 | (19 | ) | ||||||||||||||||||||||||
Asset-backed securities | 76 | (1 | ) | 22 | (31 | ) | - | - | (35 | ) | 31 | 4 | ||||||||||||||||||||||||
Corporate bonds | 386 | (19 | ) | 155 | (218 | ) | - | (53 | ) | (25 | ) | 226 | (16 | ) | ||||||||||||||||||||||
Collateralized debt and loan obligations | 1,152 | 141 | 320 | (709 | ) | - | (331 | ) | (28 | ) | 545 | (7 | ) | |||||||||||||||||||||||
Loans and lending commitments | 5,874 | (34 | ) | 1,860 | (95 | ) | - | (2,461 | ) | 20 | 5,164 | (62 | ) | |||||||||||||||||||||||
Other debt | 285 | (13 | ) | 30 | (14 | ) | - | (25 | ) | 267 | 530 | - | ||||||||||||||||||||||||
|
|
|
|
|
|
|
|
|
|
|
|
|
|
|
|
|
| |||||||||||||||||||
Total corporate and other debt | 8,044 | 90 | 2,596 | (1,148 | ) | - | (2,870 | ) | 300 | 7,012 | (76 | ) | ||||||||||||||||||||||||
Corporate equities | 272 | 57 | 437 | (199 | ) | - | - | 8 | 575 | 67 | ||||||||||||||||||||||||||
Net derivative and other contracts(4): | ||||||||||||||||||||||||||||||||||||
Interest rate contracts | (173 | ) | (37 | ) | 16 | - | (22 | ) | 277 | 28 | 89 | 20 | ||||||||||||||||||||||||
Credit contracts | (743 | ) | (69 | ) | 6 | - | (94 | ) | 86 | 9 | (805 | ) | (89 | ) | ||||||||||||||||||||||
Foreign exchange contracts | 151 | 133 | 4 | - | (1 | ) | (197 | ) | (24 | ) | 66 | 133 | ||||||||||||||||||||||||
Equity contracts(5) | (2,165 | ) | (76 | ) | 115 | - | (279 | ) | 252 | 112 | (2,041 | ) | (237 | ) | ||||||||||||||||||||||
Commodity contracts | 1,146 | 345 | 2 | - | (112 | ) | 111 | (60 | ) | 1,432 | 420 | |||||||||||||||||||||||||
|
|
|
|
|
|
|
|
|
|
|
|
|
|
|
|
|
| |||||||||||||||||||
Total net derivative and other contracts | (1,784 | ) | 296 | 143 | - | (508 | ) | 529 | 65 | (1,259 | ) | 247 | ||||||||||||||||||||||||
Investments: | ||||||||||||||||||||||||||||||||||||
Principal investments | 835 | 22 | 20 | (109 | ) | - | (187 | ) | (40 | ) | 541 | - | ||||||||||||||||||||||||
Other | 323 | (5 | ) | 2 | (6 | ) | - | - | (2 | ) | 312 | - | ||||||||||||||||||||||||
| Securities received as collateral | - | - | 1 | - | - | - | - | 1 | - | |||||||||||||||||||||||||||
| Intangible assets | 6 | - | - | - | - | (1 | ) | - | 5 | - | ||||||||||||||||||||||||||
Liabilities at Fair Value | ||||||||||||||||||||||||||||||||||||
| Short-term borrowings | $ | - | $ | (2 | ) | $ | - | $ | - | $ | 60 | $ | - | $ | 7 | $ | 69 | $ | (2 | ) | ||||||||||||||||
| Trading liabilities: | ||||||||||||||||||||||||||||||||||||
Corporate and other debt: | ||||||||||||||||||||||||||||||||||||
Corporate bonds | 78 | 6 | (25 | ) | 37 | - | - | (65 | ) | 19 | 6 | |||||||||||||||||||||||||
Lending commitments | 5 | 5 | - | - | - | - | - | - | 5 | |||||||||||||||||||||||||||
Other debt | 38 | - | (1 | ) | 7 | - | (39 | ) | (1 | ) | 4 | - | ||||||||||||||||||||||||
|
|
|
|
|
|
|
|
|
|
|
|
|
|
|
|
|
| |||||||||||||||||||
Total corporate and other debt | 121 | 11 | (26 | ) | 44 | - | (39 | ) | (66 | ) | 23 | 11 | ||||||||||||||||||||||||
Corporate equities | 45 | 90 | (88 | ) | 128 | - | - | 102 | 97 | 90 | ||||||||||||||||||||||||||
Obligation to return securities received as collateral | - | - | - | 1 | - | - | - | 1 | - | |||||||||||||||||||||||||||
Securities sold under agreements to repurchase | 153 | (1 | ) | - | - | - | - | - | 154 | - | ||||||||||||||||||||||||||
Other secured financings | 149 | (5 | ) | - | - | 223 | (36 | ) | - | 341 | 4 | |||||||||||||||||||||||||
Long-term borrowings | 1,934 | 159 | - | - | 853 | (213 | ) | 47 | 2,462 | 157 | ||||||||||||||||||||||||||
| (1) | Total realized and unrealized gains (losses) are primarily included in Trading revenues in the Company's condensed consolidated statements of income except for $17 million related to Trading assets-Investments, which is included in Investments revenues. |
| (2) | Loan originations are included in purchases. |
| (3) | Amounts represent unrealized gains (losses) for the nine months ended September 30, 2015 related to assets and liabilities still outstanding at September 30, 2015. |
| (4) | Net derivative and other contracts represent Trading assets-Derivative and other contracts net of Trading liabilities-Derivative and other contracts. For further information on derivative instruments and hedging activities, see Note 4. |
| (5) | Net liability Level 3 derivative equity contracts increased by $785 million to correct the fair value level assigned to these contracts at December 31, 2014. The total amount of derivative equity contracts remained unchanged at December 31, 2014. |
| 15 | |
MORGAN STANLEY
NOTES TO CONDENSED CONSOLIDATED FINANCIAL STATEMENTS (Unaudited)-(Continued)
Three Months Ended September 30, 2014.
| Beginning Balance at June 30, 2014 | Total Realized and Unrealized Gains (Losses)(1) | Purchases(2) | Sales | Issuances | Settlements | Net Transfers | Ending Balance at September 30, 2014 | Unrealized Gains (Losses) for Level 3 Assets/ Liabilities Outstanding at September 30, 2014(3) | ||||||||||||||||||||||||||||
| (dollars in millions) | ||||||||||||||||||||||||||||||||||||
Assets at Fair Value | ||||||||||||||||||||||||||||||||||||
Trading assets: | ||||||||||||||||||||||||||||||||||||
Other sovereign government obligations | $ | 14 | $ | (1 | ) | $ | - | $ | (1 | ) | $ | - | $ | - | $ | 1 | $ | 13 | $ | (1 | ) | |||||||||||||||
Corporate and other debt: | ||||||||||||||||||||||||||||||||||||
State and municipal securities | 4 | - | - | - | - | - | (4 | ) | - | - | ||||||||||||||||||||||||||
Residential mortgage-backed securities | 55 | 11 | 33 | (7 | ) | - | (11 | ) | - | 81 | 11 | |||||||||||||||||||||||||
Commercial mortgage-backed securities | 47 | (1 | ) | 1 | (3 | ) | - | - | 13 | 57 | (2 | ) | ||||||||||||||||||||||||
Asset-backed securities | 65 | 5 | 27 | (8 | ) | - | - | 22 | 111 | 5 | ||||||||||||||||||||||||||
Corporate bonds | 510 | 36 | 99 | (148 | ) | - | - | 9 | 506 | 38 | ||||||||||||||||||||||||||
Collateralized debt obligations | 1,332 | 8 | 299 | (362 | ) | - | (6 | ) | - | 1,271 | 6 | |||||||||||||||||||||||||
Loans and lending commitments | 5,829 | (20 | ) | 2,138 | (676 | ) | - | (721 | ) | 957 | 7,507 | (24 | ) | |||||||||||||||||||||||
Other debt | 22 | - | 135 | (3 | ) | - | - | 1 | 155 | - | ||||||||||||||||||||||||||
|
|
|
|
|
|
|
|
|
|
|
|
|
|
|
|
|
| |||||||||||||||||||
Total corporate and other debt | 7,864 | 39 | 2,732 | (1,207 | ) | - | (738 | ) | 998 | 9,688 | 34 | |||||||||||||||||||||||||
Corporate equities | 243 | (2 | ) | 30 | (41 | ) | - | - | 11 | 241 | 7 | |||||||||||||||||||||||||
Net derivative and other contracts(4): | ||||||||||||||||||||||||||||||||||||
Interest rate contracts | (109 | ) | (15 | ) | 7 | - | (3 | ) | (17 | ) | 150 | 13 | (22 | ) | ||||||||||||||||||||||
Credit contracts | (710 | ) | 209 | 7 | - | (64 | ) | (108 | ) | (16 | ) | (682 | ) | 140 | ||||||||||||||||||||||
Foreign exchange contracts | 109 | (27 | ) | 6 | (3 | ) | - | 70 | (1 | ) | 154 | (25 | ) | |||||||||||||||||||||||
Equity contracts | (1,097 | ) | (6 | ) | 56 | - | (59 | ) | (105 | ) | 23 | (1,188 | ) | (9 | ) | |||||||||||||||||||||
Commodity contracts | 1,132 | 73 | 36 | - | - | (62 | ) | (12 | ) | 1,167 | 12 | |||||||||||||||||||||||||
Other | (3 | ) | (1 | ) | - | - | - | 4 | - | - | - | |||||||||||||||||||||||||
|
|
|
|
|
|
|
|
|
|
|
|
|
|
|
|
|
| |||||||||||||||||||
Total net derivative and other contracts | (678 | ) | 233 | 112 | (3 | ) | (126 | ) | (218 | ) | 144 | (536 | ) | 96 | ||||||||||||||||||||||
Investments: | ||||||||||||||||||||||||||||||||||||
Principal investments | 883 | (1 | ) | 22 | (23 | ) | - | - | 32 | 913 | (1 | ) | ||||||||||||||||||||||||
Other | 380 | (3 | ) | 14 | - | - | - | 2 | 393 | (3 | ) | |||||||||||||||||||||||||
Intangible assets | 6 | - | - | - | - | - | - | 6 | - | |||||||||||||||||||||||||||
Liabilities at Fair Value | ||||||||||||||||||||||||||||||||||||
Trading liabilities: | ||||||||||||||||||||||||||||||||||||
Other sovereign government obligations | $ | - | $ | - | $ | - | $ | - | $ | - | $ | - | $ | 2 | $ | 2 | $ | - | ||||||||||||||||||
Corporate and other debt: | ||||||||||||||||||||||||||||||||||||
Corporate bonds | 14 | 1 | (8 | ) | 46 | - | - | (3 | ) | 48 | 1 | |||||||||||||||||||||||||
Lending commitments | 12 | 12 | - | - | - | - | - | - | - | |||||||||||||||||||||||||||
Other debt | 42 | 5 | - | - | - | (2 | ) | - | 35 | 5 | ||||||||||||||||||||||||||
|
|
|
|
|
|
|
|
|
|
|
|
|
|
|
|
|
| |||||||||||||||||||
Total corporate and other debt | 68 | 18 | (8 | ) | 46 | - | (2 | ) | (3 | ) | 83 | 6 | ||||||||||||||||||||||||
Corporate equities | 6 | (5 | ) | (12 | ) | 2 | - | - | 2 | 3 | (4 | ) | ||||||||||||||||||||||||
Securities sold under agreements to repurchase | 155 | 2 | - | - | - | - | - | 153 | 2 | |||||||||||||||||||||||||||
Other secured financings | 135 | - | - | - | 4 | (3 | ) | 26 | 162 | - | ||||||||||||||||||||||||||
Long-term borrowings | 1,779 | 72 | - | - | 136 | (108 | ) | 186 | 1,921 | 72 | ||||||||||||||||||||||||||
| (1) | Total realized and unrealized gains (losses) are primarily included in Trading revenues in the condensed consolidated statements of income except for $(4) million related to Trading assets-Investments, which is included in Investments revenues. |
| (2) | Loan originations are included in purchases. |
| (3) | Amounts represent unrealized gains (losses) for the quarter ended September 30, 2014 related to assets and liabilities still outstanding at September 30, 2014. |
| (4) | Net derivative and other contracts represent Trading assets-Derivative and other contracts net of Trading liabilities-Derivative and other contracts. For further information on derivative instruments and hedging activities, see Note 4. |
| | 16 |
MORGAN STANLEY
NOTES TO CONDENSED CONSOLIDATED FINANCIAL STATEMENTS (Unaudited)-(Continued)
Nine Months Ended September 30, 2014.
| Beginning Balance at December 31, 2013 | Total Realized and Unrealized Gains (Losses)(1) | Purchases(2) | Sales | Issuances | Settlements | Net Transfers | Ending Balance at September 30, 2014 | Unrealized Gains (Losses) for Level 3 Assets/ Liabilities Outstanding at September 30, 2014(3) | ||||||||||||||||||||||||||||
| (dollars in millions) | ||||||||||||||||||||||||||||||||||||
Assets at Fair Value | ||||||||||||||||||||||||||||||||||||
Trading assets: | ||||||||||||||||||||||||||||||||||||
Other sovereign government obligations | $ | 27 | $ | (1 | ) | $ | 7 | $ | (21 | ) | $ | - | $ | - | $ | 1 | $ | 13 | $ | (1 | ) | |||||||||||||||
Corporate and other debt: | ||||||||||||||||||||||||||||||||||||
Residential mortgage-backed securities | 47 | 34 | 30 | (9 | ) | - | (20 | ) | (1 | ) | 81 | 29 | ||||||||||||||||||||||||
Commercial mortgage-backed securities | 108 | 11 | 22 | (97 | ) | - | - | 13 | 57 | (3 | ) | |||||||||||||||||||||||||
Asset-backed securities | 103 | (3 | ) | 58 | (93 | ) | - | - | 46 | 111 | (3 | ) | ||||||||||||||||||||||||
Corporate bonds | 522 | 107 | 185 | (302 | ) | - | - | (6 | ) | 506 | 84 | |||||||||||||||||||||||||
Collateralized debt and loan obligations | 1,468 | 137 | 716 | (940 | ) | - | (109 | ) | (1 | ) | 1,271 | 45 | ||||||||||||||||||||||||
Loans and lending commitments | 5,129 | (202 | ) | 3,962 | (327 | ) | - | (1,299 | ) | 244 | 7,507 | (181 | ) | |||||||||||||||||||||||
Other debt | 27 | 4 | 128 | (6 | ) | - | (2 | ) | 4 | 155 | 3 | |||||||||||||||||||||||||
|
|
|
|
|
|
|
|
|
|
|
|
|
|
|
|
|
| |||||||||||||||||||
Total corporate and other debt | 7,404 | 88 | 5,101 | (1,774 | ) | - | (1,430 | ) | 299 | 9,688 | (26 | ) | ||||||||||||||||||||||||
Corporate equities | 190 | 17 | 83 | (47 | ) | - | - | (2 | ) | 241 | 10 | |||||||||||||||||||||||||
Net derivative and other contracts(4): | ||||||||||||||||||||||||||||||||||||
Interest rate contracts | 113 | (4 | ) | 8 | - | (3 | ) | (61 | ) | (40 | ) | 13 | 4 | |||||||||||||||||||||||
Credit contracts | (147 | ) | (434 | ) | 52 | - | (118 | ) | 10 | (45 | ) | (682 | ) | (475 | ) | |||||||||||||||||||||
Foreign exchange contracts | 68 | (6 | ) | 6 | (1 | ) | - | 106 | (19 | ) | 154 | (2 | ) | |||||||||||||||||||||||
Equity contracts | (831 | ) | (19 | ) | 223 | (1 | ) | (273 | ) | (370 | ) | 83 | (1,188 | ) | (66 | ) | ||||||||||||||||||||
Commodity contracts | 880 | 177 | 200 | - | - | (90 | ) | - | 1,167 | 99 | ||||||||||||||||||||||||||
Other | (4 | ) | (1 | ) | - | - | - | 5 | - | - | - | |||||||||||||||||||||||||
|
|
|
|
|
|
|
|
|
|
|
|
|
|
|
|
|
| |||||||||||||||||||
Total net derivative and other contracts | 79 | (287 | ) | 489 | (2 | ) | (394 | ) | (400 | ) | (21 | ) | (536 | ) | (440 | ) | ||||||||||||||||||||
Investments: | ||||||||||||||||||||||||||||||||||||
Principal investments | 2,160 | 49 | 36 | (124 | ) | - | (1,234 | ) | 26 | 913 | 129 | |||||||||||||||||||||||||
Other | 538 | (13 | ) | 17 | (11 | ) | - | - | (138 | ) | 393 | (6 | ) | |||||||||||||||||||||||
| Intangible assets | 8 | - | - | - | - | (2 | ) | - | 6 | (1 | ) | |||||||||||||||||||||||||
Liabilities at Fair Value | ||||||||||||||||||||||||||||||||||||
| Short-term borrowings | $ | 1 | $ | - | $ | - | $ | - | $ | - | $ | (1 | ) | $ | - | $ | - | $ | - | |||||||||||||||||
| Trading liabilities: | ||||||||||||||||||||||||||||||||||||
Other sovereign government obligations | - | - | - | - | - | - | 2 | 2 | - | |||||||||||||||||||||||||||
Corporate and other debt: | ||||||||||||||||||||||||||||||||||||
Corporate bonds | 22 | 2 | (46 | ) | 85 | - | - | (11 | ) | 48 | 3 | |||||||||||||||||||||||||
Lending commitments | 2 | 2 | - | - | - | - | - | - | - | |||||||||||||||||||||||||||
Other debt | 48 | 15 | - | - | - | 1 | 1 | 35 | 5 | |||||||||||||||||||||||||||
|
|
|
|
|
|
|
|
|
|
|
|
|
|
|
|
|
| |||||||||||||||||||
Total corporate and other debt | 72 | 19 | (46 | ) | 85 | - | 1 | (10 | ) | 83 | 8 | |||||||||||||||||||||||||
Corporate equities | 8 | (6 | ) | (16 | ) | 2 | - | - | 3 | 3 | (6 | ) | ||||||||||||||||||||||||
Securities sold under agreements to repurchase | 154 | 1 | - | - | - | - | - | 153 | 1 | |||||||||||||||||||||||||||
Other secured financings | 278 | (9 | ) | - | - | 21 | (188 | ) | 42 | 162 | (6 | ) | ||||||||||||||||||||||||
Long-term borrowings | 1,887 | 17 | - | - | 372 | (289 | ) | (32 | ) | 1,921 | 15 | |||||||||||||||||||||||||
| (1) | Total realized and unrealized gains (losses) are primarily included in Trading revenues in the Company's condensed consolidated statements of income except for $36 million related to Trading assets-Investments, which is included in Investments revenues. |
| (2) | Loan originations are included in purchases. |
| (3) | Amounts represent unrealized gains (losses) for the nine months ended September 30, 2014 related to assets and liabilities still outstanding at September 30, 2014. |
| (4) | Net derivative and other contracts represent Trading assets-Derivative and other contracts, net of Trading liabilities-Derivative and other contracts. For further information on derivative instruments and hedging activities, see Note 4. |
| 17 | |
MORGAN STANLEY
NOTES TO CONDENSED CONSOLIDATED FINANCIAL STATEMENTS (Unaudited)-(Continued)
Quantitative Information about and Sensitivity of Significant Unobservable Inputs Used in Recurring Level 3 Fair Value Measurements.
The disclosures below provide information on the valuation techniques, significant unobservable inputs, and their ranges and averages for each major category of assets and liabilities measured at fair value on a recurring basis with a significant Level 3 balance. The level of aggregation and breadth of products cause the range of inputs to be wide and not evenly distributed across the inventory. Further, the range of unobservable inputs may differ across firms in the financial services industry because of diversity in the types of products included in each firm's inventory. The following disclosures also include qualitative information on the sensitivity of the fair value measurements to changes in the significant unobservable inputs.
At September 30, 2015
| Balance at September 30, 2015 | Valuations Technique(s) / Significant Unobservable Input(s) / Sensitivity of the Fair Value to | Range(1) | Averages(2) | |||||||||||
| (dollars in millions) | ||||||||||||||
Assets at Fair Value | ||||||||||||||
Trading assets: | ||||||||||||||
Corporate and other debt: | ||||||||||||||
Residential mortgage-backed securities | $ | 404 | Comparable pricing: | |||||||||||
Comparable bond price / (A) | 0 to 80 points | 36 points | ||||||||||||
Commercial mortgage-backed securities | 79 | Comparable pricing: | ||||||||||||
Comparable bond price / (A) | 0 to 9 points | 2 points | ||||||||||||
Corporate bonds | 226 | Comparable pricing: | ||||||||||||
Comparable bond price / (A) | 4 to 119 points | 83 points | ||||||||||||
Collateralized debt and loan obligations | 545 | Comparable pricing(3): | ||||||||||||
Comparable bond price / (A) | 45 to 103 points | 77 points | ||||||||||||
Correlation model: | ||||||||||||||
Credit correlation / (B) | 35% to 60% | 49% | ||||||||||||
Loans and lending commitments | 5,164 | Corporate loan model: | ||||||||||||
Credit spread / (C) | 72 to 831 basis points | 544 basis points | ||||||||||||
Margin loan model: | ||||||||||||||
Credit spread / (C)(D) | 80 to 548 basis points | 165 basis points | ||||||||||||
Volatility skew / (C)(D) | 14% to 70% | 36% | ||||||||||||
Discount rate / (C)(D) | 2% to 6% | 4% | ||||||||||||
Option model: | ||||||||||||||
Volatility skew / (C) | -1% | -1% | ||||||||||||
Comparable pricing(3): | ||||||||||||||
Comparable loan price / (A) | 40 to 103 points | 89 points | ||||||||||||
Discounted cash flow: | ||||||||||||||
Implied weighted average cost of capital / (C)(D) | 6% to 8% | 7% | ||||||||||||
Capitalization rate / (C)(D) | 4% to 10% | 4% | ||||||||||||
Other debt | 530 | Comparable pricing: | ||||||||||||
Comparable loan price / (A) | 3 to 84 points | 65 points | ||||||||||||
Comparable pricing: | ||||||||||||||
Comparable bond price / (A) | 11 points | 11 points | ||||||||||||
Option model: | ||||||||||||||
At the money volatility / (A) | 16% to 53% | 16% | ||||||||||||
Margin loan model(3): | ||||||||||||||
Discount rate / (C) | 1% to 2% | 1% | ||||||||||||
Corporate equities | 575 | Comparable pricing: | ||||||||||||
Comparable price / (A) | 59% to 91% | 78% | ||||||||||||
Comparable pricing(3): | ||||||||||||||
Comparable equity price / (A) | 100% | 100% | ||||||||||||
| | 18 |
MORGAN STANLEY
NOTES TO CONDENSED CONSOLIDATED FINANCIAL STATEMENTS (Unaudited)-(Continued)
| Balance at September 30, 2015 | Valuations Technique(s) / Significant Unobservable Input(s) / Sensitivity of the Fair Value to | Range(1) | Averages(2) | |||||||||||
| (dollars in millions) | ||||||||||||||
Market approach: | ||||||||||||||
EBITDA multiple / (A)(D) | 9 times | 9 times | ||||||||||||
Price / Book ratio / (A)(D) | 0 times | 0 times | ||||||||||||
Net derivative and other | ||||||||||||||
Interest rate contracts | 89 | Option model: | ||||||||||||
Interest rate volatility concentration liquidity multiple / (C)(D) | 0 to 3 times | 2 times | ||||||||||||
Interest rate - Foreign exchange correlation / (C)(D) | 26% to 62% | 44% / 43%(5) | ||||||||||||
Interest rate volatility skew / (A)(D) | 32% to 91% | 44% / 43%(5) | ||||||||||||
Interest rate quanto correlation / (A)(D) | -8% to 37% | 2% / -8%(5) | ||||||||||||
Interest rate curve correlation / (C)(D) | 24% to 93% | 69% / 75%(5) | ||||||||||||
Inflation volatility / (A)(D) | 60% | 60% / 60%(5) | ||||||||||||
Interest rate - Inflation | -43% to -41% | -43% /-43%(5) | ||||||||||||
Credit contracts | (805 | ) | Comparable pricing: | |||||||||||
Cash synthetic basis / (C)(D) | 5 to 12 points | 9 points | ||||||||||||
Comparable bond price / (C)(D) | 0 to 75 points | 25 points | ||||||||||||
Correlation model(3): | ||||||||||||||
Credit correlation / (B) | 34% to 99% | 58% | ||||||||||||
Foreign exchange contracts(6) | 66 | Option model: | ||||||||||||
Interest rate - Foreign exchange correlation / (C)(D) | 26% to 62% | 44% / 43%(5) | ||||||||||||
Interest rate volatility skew / (A)(D) | 32% to 91% | 44% / 43%(5) | ||||||||||||
Interest rate curve / (A)(D) | 0% to 1% | 0% / 0%(5) | ||||||||||||
Interest rate quanto correlation / (A)(D) | -8% to 37% | 2% / -8%(5) | ||||||||||||
Equity contracts(6) | (2,041 | ) | Option model: | |||||||||||
At the money volatility / (A)(D) | 16% to 62% | 31% | ||||||||||||
Volatility skew / (A)(D) | -3% to 0% | -1% | ||||||||||||
Equity - Equity correlation / (C)(D) | 40% to 99% | 72% | ||||||||||||
Equity - Foreign exchange correlation / (A)(D) | -50% to 10% | -16% | ||||||||||||
Equity - Interest rate correlation / (C)(D) | -31% to 50% | 14% / 7%(5) | ||||||||||||
Commodity contracts | 1,432 | Option model: | ||||||||||||
Forward power price / (C)(D) | $4 to $91 per | $33 per | ||||||||||||
| Megawatt hour | Megawatt hour | |||||||||||||
Commodity volatility / (A)(D) | 10% to 59% | 18% | ||||||||||||
Cross commodity correlation / (C)(D) | 43% to 100% | 93% | ||||||||||||
Investments: | ||||||||||||||
Principal investments | 541 | Discounted cash flow: | ||||||||||||
Implied weighted average cost of capital / (C)(D) | 14% | 14% | ||||||||||||
Exit multiple / (A)(D) | 10 times | 10 times | ||||||||||||
Capitalization rate / (C)(D) | 5% to 10% | 6% | ||||||||||||
Equity discount rate / (C)(D) | 18% to 35% | 21% | ||||||||||||
Market approach(3): | ||||||||||||||
EBITDA multiple / (A)(D) | 9 to 19 times | 11 times | ||||||||||||
Forward capacity price / (A)(D) | $5 to $9 | $7 | ||||||||||||
Comparable pricing: | ||||||||||||||
Comparable equity price / (A) | 75% to 100% | 84% | ||||||||||||
Other | 312 | Discounted cash flow: | ||||||||||||
Implied weighted average cost of capital / (C)(D) | 10% | 10% | ||||||||||||
Exit multiple / (A)(D) | 10 times | 10 times | ||||||||||||
Market approach: | ||||||||||||||
EBITDA multiple / (A) | 8 to 14 times | 10 times | ||||||||||||
| 19 | |
MORGAN STANLEY
NOTES TO CONDENSED CONSOLIDATED FINANCIAL STATEMENTS (Unaudited)-(Continued)
| Balance at September 30, 2015 | Valuations Technique(s) / Significant Unobservable Input(s) / Sensitivity of the Fair Value to | Range(1) | Averages(2) | |||||||||||
| (dollars in millions) | ||||||||||||||
Comparable pricing(3): | ||||||||||||||
Comparable equity price / (A) | 100% | 100% | ||||||||||||
| Liabilities at Fair Value | ||||||||||||||
| Short-term borrowings | $ | 69 | Comparable pricing: | |||||||||||
Comparable equity price / (A) | 20% | 20% | ||||||||||||
| Corporate equities | 97 | Comparable pricing: Comparable equity price / (A) | 0% to 100% | 80% | ||||||||||
Securities sold under agreements to repurchase | 154 | Discounted cash flow: | ||||||||||||
Funding spread / (A) | 96 to 123 basis points | 113 basis points | ||||||||||||
| Other secured financings | 341 | Comparable pricing: | ||||||||||||
Comparable bond price / (A) | 100 points | 100 points | ||||||||||||
Discounted cash flow(3): | ||||||||||||||
Discount rate / (C) | 4% to 17% | 5% | ||||||||||||
Discounted cash flow: | ||||||||||||||
Funding spread / (A) | 108 to 130 basis points | 119 basis points | ||||||||||||
| Long-term borrowings | 2,462 | Option model(3): | ||||||||||||
At the money volatility / (C)(D) | 22% to 40% | 29% | ||||||||||||
Volatility skew / (A)(D) | -2% to 0% | -1% | ||||||||||||
Equity - Equity correlation / (A)(D) | 40% to 97% | 78% | ||||||||||||
Equity - Foreign exchange | -70% to 35% | -42% | ||||||||||||
Option model: | ||||||||||||||
Equity alpha / (A) | 25% to 80% | 63% | ||||||||||||
Correlation model: | ||||||||||||||
Credit correlation / (B) | 40% to 60% | 44% | ||||||||||||
Comparable pricing: | ||||||||||||||
Comparable equity price / (A) | 100% | 100% | ||||||||||||
At December 31, 2014.
| Balance at December 31, 2014 | Valuation Technique(s) / Significant | Range(1) | Averages(2) | |||||||||||
| (dollars in millions) | ||||||||||||||
Assets at Fair Value | ||||||||||||||
Trading assets: | ||||||||||||||
Corporate and other debt: | ||||||||||||||
Residential mortgage-backed securities | $ | 175 | Comparable pricing: | |||||||||||
Comparable bond price / (A) | 3 to 90 points | 15 points | ||||||||||||
Commercial mortgage-backed securities | 96 | Comparable pricing: | ||||||||||||
Comparable bond price / (A) | 0 to 7 points | 1 point | ||||||||||||
Asset-backed securities | 76 | Comparable pricing: | ||||||||||||
Comparable bond price / (A) | 0 to 62 points | 23 points | ||||||||||||
Corporate bonds | 386 | Comparable pricing: | ||||||||||||
Comparable bond price / (A) | 1 to 160 points | 90 points | ||||||||||||
Collateralized debt and loan obligations | 1,152 | Comparable pricing(3): | ||||||||||||
Comparable bond price / (A) | 20 to 100 points | 66 points | ||||||||||||
Correlation model: | ||||||||||||||
Credit correlation / (B) | 47% to 65% | 56% | ||||||||||||
Loans and lending commitments | 5,874 | Corporate loan model: | ||||||||||||
Credit spread / (C) | 36 to 753 basis points | 373 basis points | ||||||||||||
Margin loan model: | ||||||||||||||
Credit spread / (C)(D) | 150 to 451 basis points | 216 basis points | ||||||||||||
Volatility skew / (C)(D) | 3% to 37% | 21% | ||||||||||||
| | 20 |
MORGAN STANLEY
NOTES TO CONDENSED CONSOLIDATED FINANCIAL STATEMENTS (Unaudited)-(Continued)
| Balance at December 31, 2014 | Valuation Technique(s) / Significant | Range(1) | Averages(2) | |||||||||||
| (dollars in millions) | ||||||||||||||
Discount rate / (C)(D) | 2% to 3% | 3% | ||||||||||||
Option model: | ||||||||||||||
Volatility skew / (C) | -1% | -1% | ||||||||||||
Comparable pricing(3): | ||||||||||||||
Comparable loan price / (A) | 15 to 105 points | 89 points | ||||||||||||
Other debt | 285 | Comparable pricing(3): | ||||||||||||
Comparable loan price / (A) | 0 to 75 points | 39 points | ||||||||||||
Comparable pricing: | ||||||||||||||
Comparable bond price / (A) | 15 points | 15 points | ||||||||||||
Option model: | ||||||||||||||
At the money volatility / (A) | 15% to 54% | 15% | ||||||||||||
Corporate equities | 272 | Net asset value: | ||||||||||||
Discount to net asset value / (C) | 0% to 71% | 36% | ||||||||||||
Comparable pricing: | ||||||||||||||
Comparable price / (A) | 83% to 96% | 85% | ||||||||||||
Comparable pricing(3): | ||||||||||||||
Comparable equity price / (A) | 100% | 100% | ||||||||||||
Market approach: | ||||||||||||||
EBITDA multiple / (A)(D) | 6 to 9 times | 8 times | ||||||||||||
Price / Book ratio / (A)(D) | 0 times | 0 times | ||||||||||||
Net derivative and other contracts(4): | ||||||||||||||
Interest rate contracts | (173) | Option model: | ||||||||||||
Interest rate volatility concentration liquidity multiple / (C)(D) | 0 to 3 times | 2 times | ||||||||||||
Interest rate - Foreign exchange correlation / (A)(D) | 28% to 62% | 44% / 42% | (5) | |||||||||||
Interest rate volatility skew / (A)(D) | 38% to 104% | 86% / 60%(5) | ||||||||||||
Interest rate quanto correlation / (A)(D) | -9% to 35% | 6% / -6%(5) | ||||||||||||
Interest rate curve correlation / (A)(D) | 44% to 87% | 73% / 80%(5) | ||||||||||||
Inflation volatility / (A)(D) | 69% to 71% | 70% / 71%(5) | ||||||||||||
Interest rate - Inflation correlation / (A)(D) | -44% to -40% | -42% / -43%(5) | ||||||||||||
Credit contracts | (743) | Comparable pricing: | ||||||||||||
Cash synthetic basis / (C)(D) | 5 to 13 points | 9 points | ||||||||||||
Comparable bond price / (C)(D) | 0 to 55 points | 18 points | ||||||||||||
Correlation model(3): | ||||||||||||||
Credit correlation / (B) | 42% to 95% | 63% | ||||||||||||
Foreign exchange | 151 | Option model: | ||||||||||||
Interest rate quanto correlation / (A)(D) | -9% to 35% | 6% / -6%(5) | ||||||||||||
Interest rate - Credit spread correlation / (A)(D) | -54% to -2% | -17% / -11%(5) | ||||||||||||
Interest rate curve correlation / (A)(D) | 44% to 87% | 73% / 80%(5) | ||||||||||||
Interest rate - Foreign exchange correlation / (A)(D) | 28% to 62% | 44% / 42%(5) | ||||||||||||
Interest rate curve / (A)(D) | 0% to 2% | 1% / 1%(5) | ||||||||||||
Equity contracts(6)(7) | (2,165) | Option model: | ||||||||||||
At the money volatility / (A)(D) | 14% to 51% | 29% | ||||||||||||
Volatility skew / (A)(D) | -2% to 0% | -1% | ||||||||||||
Equity - Equity correlation / (C)(D) | 40% to 99% | 72% | ||||||||||||
Equity - Foreign exchange correlation / (C)(D) | -50% to 10% | -16% | ||||||||||||
Equity - Interest rate correlation / (C)(D) | -18% to 81% | 26% / 11%(5) | ||||||||||||
Commodity contracts | 1,146 | Option model: | ||||||||||||
Forward power price / (C)(D) | $5 to $106 per | $38 per | ||||||||||||
| Megawatt hour | Megawatt hour | |||||||||||||
Commodity volatility / (A)(D) | 11% to 90% | 19% | ||||||||||||
Cross commodity correlation / (C)(D) | 33% to 100% | 93% | ||||||||||||
| 21 | |
MORGAN STANLEY
NOTES TO CONDENSED CONSOLIDATED FINANCIAL STATEMENTS (Unaudited)-(Continued)
| Balance at December 31, 2014 | Valuation Technique(s) / Significant | Range(1) | Averages(2) | |||||||||||
| (dollars in millions) | ||||||||||||||
Investments: | ||||||||||||||
Principal investments | 835 | Discounted cash flow: | ||||||||||||
Implied weighted average cost of capital / (C)(D) | 11% | 11% | ||||||||||||
Exit multiple / (A)(D) | 10 times | 10 times | ||||||||||||
Discounted cash flow: | ||||||||||||||
Equity discount rate / (C) | 25% | 25% | ||||||||||||
Market approach(3): | ||||||||||||||
EBITDA multiple / (A)(D) | 4 to 14 times | 10 times | ||||||||||||
Price / Earnings ratio / (A)(D) | 23 times | 23 times | ||||||||||||
Forward capacity price / (A)(D) | $5 to $7 | $7 | ||||||||||||
Comparable pricing: | ||||||||||||||
Comparable equity price / (A) | 64% to 100% | 95% | ||||||||||||
Other | 323 | Discounted cash flow: | ||||||||||||
Implied weighted average cost of capital / (C)(D) | 10% to 13% | 11% | ||||||||||||
Exit multiple / (A)(D) | 6 to 9 times | 9 times | ||||||||||||
Market approach: | ||||||||||||||
EBITDA multiple / (A)(D) | 9 to 13 times | 10 times | ||||||||||||
Comparable pricing(3): | ||||||||||||||
Comparable equity price / (A) | 100% | 100% | ||||||||||||
Liabilities at Fair Value | ||||||||||||||
Trading liabilities: | ||||||||||||||
Corporate and other debt: | ||||||||||||||
Corporate bonds | $ | 78 | Option model: | |||||||||||
Volatility skew / (C)(D) | -1% | -1% | ||||||||||||
At the money volatility / (C)(D) | 10% | 10% | ||||||||||||
Securities sold under agreements to repurchase | 153 | Discounted cash flow: | ||||||||||||
Funding spread / (A) | 75 to 91 basis points | 86 basis points | ||||||||||||
Other secured financings | 149 | Comparable pricing: | ||||||||||||
Comparable bond price / (A) | 99 to 101 points | 100 points | ||||||||||||
Discounted cash flow(3): | ||||||||||||||
Funding spread / (A) | 82 to 98 basis points | 95 basis points | ||||||||||||
Long-term borrowings | 1,934 | Option model(3): | ||||||||||||
At the money volatility / (C)(D) | 18% to 32% | 27% | ||||||||||||
Volatility skew / (A)(D) | -1% to 0% | 0% | ||||||||||||
Equity - Equity correlation / (A)(D) | 40% to 90% | 68% | ||||||||||||
Equity - Foreign exchange correlation / (C)(D) | -73% to 30% | -32% | ||||||||||||
Option model: | ||||||||||||||
Equity alpha / (A) | 0% to 94% | 67% | ||||||||||||
Correlation model: | ||||||||||||||
Credit correlation / (B) | 48% to 65% | 51% | ||||||||||||
EBITDA-Earnings before interest, taxes, depreciation and amortization
| (1) | The ranges of significant unobservable inputs are represented in points, percentages, basis points, times or megawatt hours. Points are a percentage of par; for example, 80 points would be 80% of par. A basis point equals 1/100th of 1%; for example, 831 basis points would equal 8.31%. |
| (2) | Amounts represent weighted averages except where simple averages and the median of the inputs are provided (see footnote 5 below). Weighted averages are calculated by weighting each input by the fair value of the respective financial instruments except for collateralized debt and loan obligations, principal investments, other debt, corporate bonds, long-term borrowings and derivative instruments where some or all inputs are weighted by risk. |
| (3) | This is the predominant valuation technique for this major asset or liability class. |
| (4) | Credit Valuation Adjustment ("CVA") and Funding Valuation Adjustments ("FVA") are included in the balance, but excluded from the Valuation Technique(s) and Significant Unobservable Input(s) in the table above. CVA is a Level 3 input when the underlying counterparty credit curve is unobservable. FVA is a Level 3 input in its entirety given the lack of observability of funding spreads in the principal market. |
| | 22 |
MORGAN STANLEY
NOTES TO CONDENSED CONSOLIDATED FINANCIAL STATEMENTS (Unaudited)-(Continued)
| (5) | The data structure of the significant unobservable inputs used in valuing interest rate contracts, foreign exchange contracts and certain equity contracts may be in a multi-dimensional form, such as a curve or surface, with risk distributed across the structure. Therefore, a simple average and median, together with the range of data inputs, may be more appropriate measurements than a single point weighted average. |
| (6) | Includes derivative contracts with multiple risks ( i.e., hybrid products). |
| (7) | Net liability Level 3 derivative equity contracts increased by $785 million to correct the fair value level assigned to these contracts at December 31, 2014. This correction did not result in a change to the Valuation Technique(s), Significant Unobservable Inputs, Ranges or Averages. |
Sensitivity of the fair value to changes in the unobservable inputs:
| (A) | Significant increase (decrease) in the unobservable input in isolation would result in a significantly higher (lower) fair value measurement. |
| (B) | Significant changes in credit correlation may result in a significantly higher or lower fair value measurement. Increasing (decreasing) correlation drives a redistribution of risk within the capital structure such that junior tranches become less (more) risky and senior tranches become more (less) risky. |
| (C) | Significant increase (decrease) in the unobservable input in isolation would result in a significantly lower (higher) fair value measurement. |
| (D) | There are no predictable relationships between the significant unobservable inputs. |
For a description of the Company's significant unobservable inputs included in the September 30, 2015 and December 31, 2014 tables above for all major categories of assets and liabilities, see Note 4 to the consolidated financial statements in the 2014 Form 10-K.
During the quarter and nine months ended September 30, 2015, there were no significant updates made to the Company's significant unobservable inputs.
Fair Value of Investments that are Measured at Net Asset Value.
For a description of the Company's investments in private equity funds, real estate funds and hedge funds measured at fair value based on NAV, see Note 4 to the consolidated financial statements in the 2014 Form 10-K. The following tables present information solely about the Company's investments in private equity funds, real estate funds and hedge funds measured at fair value using the NAV per share, or its equivalent, at September 30, 2015 and December 31, 2014:
| At September 30, 2015 | At December 31, 2014 | |||||||||||||||
| Fair Value | Commitment | Fair Value | Commitment | |||||||||||||
| (dollars in millions) | ||||||||||||||||
Private equity funds | $ | 1,962 | $ | 597 | $ | 2,569 | $ | 613 | ||||||||
Real estate funds | 1,664 | 135 | 1,753 | 112 | ||||||||||||
Hedge funds(1): | ||||||||||||||||
Long-short equity hedge funds | 447 | - | 433 | - | ||||||||||||
Fixed income/credit-related hedge funds | 73 | - | 76 | - | ||||||||||||
Event-driven hedge funds | 3 | - | 39 | - | ||||||||||||
Multi-strategy hedge funds | 129 | 4 | 139 | 3 | ||||||||||||
|
|
|
|
|
|
|
| |||||||||
Total | $ | 4,278 | $ | 736 | $ | 5,009 | $ | 728 | ||||||||
|
|
|
|
|
|
|
| |||||||||
| (1) | Fixed income/credit-related hedge funds, event-driven hedge funds and multi-strategy hedge funds are redeemable at least on a three-month period basis, primarily with a notice period of 90 days or less. At September 30, 2015, approximately 32% of the fair value amount of long-short equity hedge funds was redeemable at least quarterly, 48% is redeemable every six months and 20% of these funds have a redemption frequency of greater than six months. At December 31, 2014, approximately 36% of the fair value amount of long-short equity hedge funds was redeemable at least quarterly, 47% is redeemable every six months and 17% of these funds have a redemption frequency of greater than six months. The notice period for long-short equity hedge funds at September 30, 2015 and December 31, 2014 was primarily greater than six months. |
| 23 | |
MORGAN STANLEY
NOTES TO CONDENSED CONSOLIDATED FINANCIAL STATEMENTS (Unaudited)-(Continued)
Private Equity Funds and Real Estate Funds.
Investments in these funds generally are not redeemable due to the closed-ended nature of these funds. Instead, distributions from each fund will be received as the underlying investments of the funds are disposed and monetized. The following table presents information about the fair value of the funds estimated to be liquidated over time:
| At September 30, 2015 | ||||||||||||||||
| Fair Value of the Funds Estimated to be Liquidated | ||||||||||||||||
Fund Type | Less than 5 years | 5-10 years | Over 10 years | Total | ||||||||||||
| (dollars in millions) | ||||||||||||||||
Private equity funds | $ | 139 | $ | 1,151 | $ | 672 | $ | 1,962 | ||||||||
Real estate funds | 235 | 882 | 547 | 1,664 | ||||||||||||
Hedge Funds.
Investments in hedge funds may be subject to initial period lock-up restrictions or gates. A hedge fund lock-up provision is a provision that provides that, during a certain initial period, an investor may not make a withdrawal from the fund. The purpose of a gate is to restrict the level of redemptions that an investor in a particular hedge fund can demand on any redemption date. The following table presents information about lock-up restrictions and gates by hedge fund type:
| At September 30, 2015 | ||||||||||||
| Hedge Fund Restrictions | ||||||||||||
Hedge Fund Type | Fair Value | Lock-up Restrictions | Gate Restrictions | |||||||||
| (dollars in millions) | ||||||||||||
Long-short equity(1)(2) | $ | 447 | 1 | % | 12 | % | ||||||
Fixed income/credit-related(1) | 73 | 13 | % | N/A | ||||||||
Event-driven(1) | 3 | 3 | % | N/A | ||||||||
Multi-strategy(1)(2) | 129 | 37 | % | 28 | % | |||||||
N/A-Not Applicable.
| (1) | The remaining restriction period subject to lock-up restrictions was primarily over three years at September 30, 2015. |
| (2) | The restriction period for these investments subject to an exit restriction was indefinite at September 30, 2015. |
| | 24 |
MORGAN STANLEY
NOTES TO CONDENSED CONSOLIDATED FINANCIAL STATEMENTS (Unaudited)-(Continued)
Fair Value Option.
The Company elected the fair value option for certain eligible instruments that are risk managed on a fair value basis to mitigate income statement volatility caused by measurement basis differences between the elected instruments and their associated risk management transactions or to eliminate complexities of applying certain accounting models. The following table presents net gains (losses) due to changes in fair value for items measured at fair value pursuant to the fair value option election for the quarters and nine months ended September 30, 2015 and 2014, respectively:
| Interest | Gains (Losses) | |||||||||||
| Trading | Income | Included in | ||||||||||
| Revenues | (Expense) | Net Revenues | ||||||||||
| (dollars in millions) | ||||||||||||
Three Months Ended September 30, 2015 | ||||||||||||
Securities purchased under agreements to resell | $ | (1 | ) | $ | 2 | $ | 1 | |||||
Short-term borrowings(1) | (85 | ) | - | (85 | ) | |||||||
Securities sold under agreements to repurchase | - | (2 | ) | (2 | ) | |||||||
Long-term borrowings(1) | 1,137 | (129 | ) | 1,008 | ||||||||
Nine Months Ended September 30, 2015 | ||||||||||||
Securities purchased under agreements to resell | $ | (4 | ) | $ | 7 | $ | 3 | |||||
Short-term borrowings(1) | (127 | ) | - | (127 | ) | |||||||
Securities sold under agreements to repurchase | 4 | (5 | ) | (1 | ) | |||||||
Long-term borrowings(1) | 2,226 | (399 | ) | 1,827 | ||||||||
Three Months Ended September 30, 2014 | ||||||||||||
Securities purchased under agreements to resell | $ | (2 | ) | $ | 2 | $ | - | |||||
Short-term borrowings(2) | 5 | 2 | 7 | |||||||||
Securities sold under agreements to repurchase | 3 | (2 | ) | 1 | ||||||||
Long-term borrowings(2) | 1,579 | (174 | ) | 1,405 | ||||||||
Nine Months Ended September 30, 2014 | ||||||||||||
Securities purchased under agreements to resell | $ | (4 | ) | $ | 6 | $ | 2 | |||||
Short-term borrowings(2) | (32 | ) | 2 | (30 | ) | |||||||
Securities sold under agreements to repurchase | (2 | ) | (4 | ) | (6 | ) | ||||||
Long-term borrowings(2) | 631 | (520 | ) | 111 | ||||||||
| (1) | Of the total gains (losses) recorded in Trading revenues for short-term and long-term borrowings for the quarter and nine months ended September 30, 2015, $435 million and $742 million, respectively, are attributable to changes in the credit quality of the Company and other credit factors, and the respective remainder is attributable to changes in foreign currency rates or interest rates or movements in the reference price or index for structured notes before the impact of related hedges. |
| (2) | Of the total gains (losses) recorded in Trading revenues for short-term and long-term borrowings for the quarter and nine months ended September 30, 2014, $215 million and $428 million, respectively, are attributable to changes in the credit quality of the Company and other credit factors, and the respective remainder is attributable to changes in foreign currency rates or interest rates or movements in the reference price or index for structured notes before the impact of related hedges. |
In addition to the amounts in the above table, as discussed in Note 2 to the consolidated financial statements in the 2014 Form 10-K, all of the instruments within Trading assets or Trading liabilities are measured at fair value, either through the election of the fair value option or as required by other accounting guidance. The amounts in the above table are included within Net revenues and do not reflect gains or losses on related hedging instruments, if any.
| 25 | |
MORGAN STANLEY
NOTES TO CONDENSED CONSOLIDATED FINANCIAL STATEMENTS (Unaudited)-(Continued)
The Company hedges the economics of market risk for short-term and long-term borrowings ( i.e ., risks other than that related to the credit quality of the Company) as part of its overall trading strategy and manages the market risks embedded within the issuance by the related business unit as part of the business unit's portfolio. The gains and losses on related economic hedges are recorded in Trading revenues and largely offset the gains and losses on short-term and long-term borrowings attributable to market risk.
At September 30, 2015 and December 31, 2014, a breakdown of the short-term and long-term borrowings measured at fair value on a recurring basis by business unit responsible for risk-managing each borrowing is shown in the table below.
| Short-Term and Long-Term Borrowings | ||||||||
Business Unit | At September 30, 2015 | At December 31, 2014 | ||||||
| (dollars in millions) | ||||||||
Equity | $ | 17,054 | $ | 17,253 | ||||
Interest rates | 13,614 | 13,545 | ||||||
Credit and foreign exchange | 1,947 | 2,105 | ||||||
Commodities | 540 | 636 | ||||||
|
|
|
| |||||
Total | $ | 33,155 | $ | 33,539 | ||||
|
|
|
| |||||
The following tables present information on the Company's short-term and long-term borrowings (primarily structured notes), and loans and lending commitments for which the fair value option was elected:
Gains (Losses) due to Changes in Instrument-Specific Credit Risk.
| Three Months Ended | Nine Months Ended | |||||||||||||||
| September 30, | September 30, | |||||||||||||||
| 2015 | 2014 | 2015 | 2014 | |||||||||||||
| (dollars in millions) | ||||||||||||||||
Short-term and long-term borrowings(1) | $ | 435 | $ | 215 | $ | 742 | $ | 428 | ||||||||
Loans and other debt(2) | (32 | ) | 25 | 39 | 153 | |||||||||||
Lending commitments(3) | 5 | 2 | 13 | 29 | ||||||||||||
| (1) | The change in the fair value of short-term and long-term borrowings (primarily structured notes) includes an adjustment to reflect the change in credit quality of the Company based upon observations of the Company's secondary bond market spreads and changes in other credit factors. |
| (2) | Loans and other debt instrument-specific credit gains (losses) were determined by excluding the non-credit components of gains and losses, such as those due to changes in interest rates. |
| (3) | Gains (losses) on lending commitments were generally determined based on the differential between estimated expected client yields and contractual yields at each respective period-end. |
Net Difference between Contractual Principal Amount and Fair Value.
| Contractual Principal Amount Exceeds Fair Value | ||||||||
| At September 30, 2015 | At December 31, 2014 | |||||||
| (dollars in millions) | ||||||||
Loans and other debt(1) | $ | 14,186 | $ | 14,990 | ||||
Loans 90 or more days past due and/or on nonaccrual status(1)(2) | 11,798 | 12,916 | ||||||
Short-term and long-term borrowings(3) | 694 | (670 | ) | |||||
| | 26 |
MORGAN STANLEY
NOTES TO CONDENSED CONSOLIDATED FINANCIAL STATEMENTS (Unaudited)-(Continued)
| (1) | The majority of the difference between principal and fair value amounts for loans and other debt emanates from the Company's distressed debt trading business, which purchases distressed debt at amounts well below par. |
| (2) | The aggregate fair value of loans that were in nonaccrual status, which includes all loans 90 or more days past due, was $2,070 million and $1,367 million at September 30, 2015 and December 31, 2014, respectively. The aggregate fair value of loans that were 90 or more days past due was $916 million and $643 million at September 30, 2015 and December 31, 2014, respectively. |
| (3) | Short-term and long-term borrowings do not include structured notes where the repayment of the initial principal amount fluctuates based on changes in the reference price or index. |
The tables above exclude non-recourse debt from consolidated VIEs, liabilities related to failed sales of financial assets, pledged commodities and other liabilities that have specified assets attributable to them.
Assets and Liabilities Measured at Fair Value on a Non-recurring Basis.
Certain assets and liabilities were measured at fair value on a non-recurring basis and are not included in the tables above. These assets and liabilities may include loans, other investments, premises, equipment and software costs, intangible assets and lending commitments.
The following tables present, by caption on the Company's condensed consolidated statements of financial condition, the fair value hierarchy for those assets measured at fair value on a non-recurring basis for which the Company recognized a non-recurring fair value adjustment for the quarters and nine months ended September 30, 2015 and 2014.
Three Months and Nine Months Ended September 30, 2015.
| Fair Value Measurements Using: | ||||||||||||||||||||||||
| Carrying Value at September 30, 2015(1) | Quoted in Active Markets for Identical Assets (Level 1) | Significant Observable Inputs (Level 2) | Significant Unobservable Inputs (Level 3) | Total Gains (Losses) for the Three Months Ended September 30, 2015(2) | Total Gains (Losses) for the Nine Months Ended September 30, 2015(2) | |||||||||||||||||||
| (dollars in millions) | ||||||||||||||||||||||||
Assets: | ||||||||||||||||||||||||
Loans(3) | $ | 5,089 | $ | - | $ | 3,060 | $ | 2,029 | $ | 12 | $ | (201 | ) | |||||||||||
Other investments(4) | - | - | - | - | - | (2 | ) | |||||||||||||||||
Premises, equipment and software costs(5) | - | - | - | - | (2 | ) | (24 | ) | ||||||||||||||||
|
|
|
|
|
|
|
|
|
|
|
| |||||||||||||
Total assets | $ | 5,089 | $ | - | $ | 3,060 | $ | 2,029 | $ | 10 | $ | (227 | ) | |||||||||||
|
|
|
|
|
|
|
|
|
|
|
| |||||||||||||
Liabilities: | ||||||||||||||||||||||||
Other liabilities and accrued expenses(3) | $ | (427 | ) | $ | - | $ | (365 | ) | $ | (62 | ) | $ | (144 | ) | $ | (171 | ) | |||||||
|
|
|
|
|
|
|
|
|
|
|
| |||||||||||||
Total liabilities | $ | (427 | ) | $ | - | $ | (365 | ) | $ | (62 | ) | $ | (144 | ) | $ | (171 | ) | |||||||
|
|
|
|
|
|
|
|
|
|
|
| |||||||||||||
| 27 | |
MORGAN STANLEY
NOTES TO CONDENSED CONSOLIDATED FINANCIAL STATEMENTS (Unaudited)-(Continued)
Three Months and Nine Months Ended September 30, 2014.
| Fair Value Measurements Using: | ||||||||||||||||||||||||
| Carrying Value at September 30, 2014(1) | Quoted in Active Markets for Identical Assets (Level 1) | Significant Observable Inputs (Level 2) | Significant Unobservable Inputs (Level 3) | Total Gains (Losses) for the Three Months Ended September 30, 2014(2) | Total Gains (Losses) for the Nine Months Ended September 30, 2014(2) | |||||||||||||||||||
| (dollars in millions) | ||||||||||||||||||||||||
Assets: | ||||||||||||||||||||||||
Loans(3) | $ | 2,672 | $ | - | $ | 1,996 | $ | 676 | $ | (45 | ) | $ | (55 | ) | ||||||||||
Other investments(4) | 38 | - | - | 38 | (2 | ) | (27 | ) | ||||||||||||||||
Premises, equipment and software costs(5) | - | - | - | - | (27 | ) | (43 | ) | ||||||||||||||||
Intangible assets(4) | 20 | - | - | 20 | (4 | ) | (6 | ) | ||||||||||||||||
Other assets(5) | - | - | - | - | - | (9 | ) | |||||||||||||||||
|
|
|
|
|
|
|
|
|
|
|
| |||||||||||||
Total assets | $ | 2,730 | $ | - | $ | 1,996 | $ | 734 | $ | (78 | ) | $ | (140 | ) | ||||||||||
|
|
|
|
|
|
|
|
|
|
|
| |||||||||||||
| (1) | Carrying values relate only to those assets that had fair value adjustments during the quarters ended September 30, 2015 and 2014. |
| (2) | Changes in the fair value of Loans and losses related to Other investments are recorded within Other revenues in the Company's condensed consolidated statements of income. Losses related to Premises, equipment and software costs, Intangible assets and Other assets are recorded within Other expenses if not held for sale and within Other revenues if held for sale. Losses related to Other liabilities and accrued expenses are recorded within Other revenues and represent non-recurring fair value adjustments for certain lending commitments designated as held for sale. |
| (3) | Non-recurring changes in the fair value of loans and lending commitments held for investment or held for sale were calculated using recently executed transactions; market price quotations; valuation models that incorporate market observable inputs where possible, such as comparable loan or debt prices and credit default swap spread levels adjusted for any basis difference between cash and derivative instruments; or default recovery analysis where such transactions and quotations are unobservable. |
| (4) | Losses related to Other investments and Intangible assets were determined primarily using discounted cash flow models and methodologies that incorporate multiples of certain comparable companies. |
| (5) | Losses related to Premises, equipment and software costs and Other assets were determined primarily using a default recovery analysis. |
In addition to the table above, as a result of entering into an agreement to sell the global oil merchanting unit of the commodities division, the Company recognized an impairment charge of $10 million and $69 million in Other revenues in the Company's condensed consolidated statements of income in the quarter and nine months ended September 30, 2015, respectively, to reduce the carrying amount of the unit to its estimated fair value less costs to sell.
There were no significant liabilities measured at fair value on a non-recurring basis during the quarter and nine months ended September 30, 2014.
| | 28 |
MORGAN STANLEY
NOTES TO CONDENSED CONSOLIDATED FINANCIAL STATEMENTS (Unaudited)-(Continued)
Financial Instruments Not Measured at Fair Value.
The tables below present the carrying value, fair value and fair value hierarchy category of certain financial instruments that are not measured at fair value in the Company's condensed consolidated statements of financial condition. The tables below exclude certain financial instruments such as equity method investments and all non-financial assets and liabilities such as the value of the long-term relationships with our deposit customers.
For a further discussion of the Company's financial instruments not measured at fair value, see Note 4 to the consolidated financial statements in 2014 Form 10-K.
At September 30, 2015.
| At September 30, 2015 | Fair Value Measurements Using: | |||||||||||||||||||
| Carrying Value | Fair Value | Quoted Prices in Active Markets for Identical Assets (Level 1) | Significant Observable Inputs (Level 2) | Significant Unobservable Inputs (Level 3) | ||||||||||||||||
| (dollars in millions) | ||||||||||||||||||||
Financial Assets: | ||||||||||||||||||||
Cash and due from banks | $ | 19,244 | $ | 19,244 | $ | 19,244 | $ | - | $ | - | ||||||||||
Interest bearing deposits with banks | 34,274 | 34,274 | 34,274 | - | - | |||||||||||||||
Cash deposited with clearing organizations or segregated under federal and other regulations or requirements | 35,552 | 35,552 | 35,552 | - | - | |||||||||||||||
Investment securities-HTM securities | 3,530 | 3,528 | 1,007 | 2,521 | - | |||||||||||||||
Securities purchased under agreements to resell | 126,397 | 126,397 | - | 125,731 | 666 | |||||||||||||||
Securities borrowed | 148,245 | 148,232 | - | 148,148 | 84 | |||||||||||||||
Customer and other receivables(1) | 46,134 | 46,028 | - | 41,230 | 4,798 | |||||||||||||||
Loans(2) | 78,209 | 79,026 | - | 17,317 | 61,709 | |||||||||||||||
Financial Liabilities: | ||||||||||||||||||||
Deposits | $ | 147,226 | $ | 147,248 | $ | - | $ | 147,248 | $ | - | ||||||||||
Short-term borrowings | 214 | 214 | - | 214 | - | |||||||||||||||
Securities sold under agreements to repurchase | 57,973 | 58,036 | - | 55,598 | 2,438 | |||||||||||||||
Securities loaned | 20,644 | 20,657 | - | 20,488 | 169 | |||||||||||||||
Other secured financings | 6,721 | 6,720 | - | 5,441 | 1,279 | |||||||||||||||
Customer and other payables(1) | 190,434 | 190,434 | - | 190,434 | - | |||||||||||||||
Long-term borrowings | 128,956 | 130,826 | - | 130,747 | 79 | |||||||||||||||
| 29 | |
MORGAN STANLEY
NOTES TO CONDENSED CONSOLIDATED FINANCIAL STATEMENTS (Unaudited)-(Continued)
At December 31, 2014.
| At December 31, 2014 | Fair Value Measurements Using: | |||||||||||||||||||
| Carrying Value | Fair Value | Quoted Prices in Active Markets for Identical Assets (Level 1) | Significant Observable Inputs (Level 2) | Significant Unobservable Inputs (Level 3) | ||||||||||||||||
| (dollars in millions) | ||||||||||||||||||||
Financial Assets: | ||||||||||||||||||||
Cash and due from banks | $ | 21,381 | $ | 21,381 | $ | 21,381 | $ | - | $ | - | ||||||||||
Interest bearing deposits with banks | 25,603 | 25,603 | 25,603 | - | - | |||||||||||||||
Cash deposited with clearing organizations or segregated under federal and other regulations or requirements | 40,607 | 40,607 | 40,607 | - | - | |||||||||||||||
Investment securities-HTM securities | 100 | 100 | 100 | - | - | |||||||||||||||
Securities purchased under agreements to resell | 82,175 | 82,165 | - | 81,981 | 184 | |||||||||||||||
Securities borrowed | 136,708 | 136,708 | - | 136,696 | 12 | |||||||||||||||
Customer and other receivables(1) | 45,116 | 45,028 | - | 39,945 | 5,083 | |||||||||||||||
Loans(2) | 66,577 | 67,800 | - | 18,212 | 49,588 | |||||||||||||||
Financial Liabilities: | ||||||||||||||||||||
Deposits | $ | 133,544 | $ | 133,572 | $ | - | $ | 133,572 | $ | - | ||||||||||
Short-term borrowings | 496 | 496 | - | 496 | - | |||||||||||||||
Securities sold under agreements to repurchase | 69,337 | 69,433 | - | 63,921 | 5,512 | |||||||||||||||
Securities loaned | 25,219 | 25,244 | - | 24,740 | 504 | |||||||||||||||
Other secured financings | 7,581 | 7,881 | - | 5,465 | 2,416 | |||||||||||||||
Customer and other payables(1) | 178,373 | 178,373 | - | 178,373 | - | |||||||||||||||
Long-term borrowings | 120,998 | 124,961 | - | 124,150 | 811 | |||||||||||||||
HTM-held to maturity
| (1) | Accrued interest, fees, and dividend receivables and payables where carrying value approximates fair value have been excluded. |
| (2) | Amounts include all loans measured at fair value on a non-recurring basis. |
The fair value of the Company's lending commitments, primarily related to corporate lending in the Company's Institutional Securities business segment, that are not carried at fair value at September 30, 2015 was $1,807 million, of which $1,544 million and $263 million would have been categorized in Level 2 and Level 3 of the fair value hierarchy, respectively. The notional amount of these commitments was $109.8 billion.
The fair value of the Company's lending commitments, primarily related to corporate lending in the Company's Institutional Securities business segment, that are not carried at fair value at December 31, 2014 was $1,178 million, of which $928 million and $250 million would have been categorized in Level 2 and Level 3 of the fair value hierarchy, respectively. The notional amount of these commitments was $86.8 billion.
| 4. | Derivative Instruments and Hedging Activities. |
The Company trades and makes markets globally in listed futures, over-the-counter ("OTC") swaps, forwards, options and other derivatives referencing, among other things, interest rates, currencies, investment grade and non-investment grade corporate credits, loans, bonds, U.S. and other sovereign securities, emerging market bonds and loans, credit indices, asset-backed security indices, property indices, mortgage-related and other asset-backed securities, and real estate loan products. The Company uses these instruments for trading, foreign currency exposure management, and asset and liability management.
| | 30 |
MORGAN STANLEY
NOTES TO CONDENSED CONSOLIDATED FINANCIAL STATEMENTS (Unaudited)-(Continued)
The Company manages its trading positions by employing a variety of risk mitigation strategies. These strategies include diversification of risk exposures and hedging. Hedging activities consist of the purchase or sale of positions in related securities and financial instruments, including a variety of derivative products ( e.g. , futures, forwards, swaps and options). The Company manages the market risk associated with its trading activities on a Company-wide basis, on a worldwide trading division level and on an individual product basis.
Offsetting of Derivative Instruments.
In connection with its derivative activities, the Company generally enters into master netting agreements and collateral agreements with its counterparties. For a further discussion of these agreements, see Note 12 to the consolidated financial statements in the 2014 Form 10-K. The following tables present information about the offsetting of derivative instruments and related collateral amounts. See information related to offsetting of certain collateralized transactions in Note 6.
| At September 30, 2015 | ||||||||||||||||||||||||
| Gross Amounts(1) | Amounts Offset in the Condensed Consolidated Statements of Financial Condition | Net Amounts Presented in the Condensed Consolidated Statements of Financial Condition | Amounts Not Offset in the Condensed Consolidated Statements of Financial Condition(2) | Net Exposure | ||||||||||||||||||||
| Financial Instruments Collateral | Other Cash Collateral | |||||||||||||||||||||||
| (dollars in millions) | ||||||||||||||||||||||||
Derivative assets | ||||||||||||||||||||||||
Bilateral OTC | $ | 379,609 | $ | (351,265 | ) | $ | 28,344 | $ | (9,967 | ) | $ | (8 | ) | $ | 18,369 | |||||||||
Cleared OTC(3) | 129,262 | (127,987 | ) | 1,275 | - | - | 1,275 | |||||||||||||||||
Exchange traded | 31,948 | (28,273 | ) | 3,675 | - | - | 3,675 | |||||||||||||||||
|
|
|
|
|
|
|
|
|
|
|
| |||||||||||||
Total derivative assets | $ | 540,819 | $ | (507,525 | ) | $ | 33,294 | $ | (9,967 | ) | $ | (8 | ) | $ | 23,319 | |||||||||
|
|
|
|
|
|
|
|
|
|
|
| |||||||||||||
Derivative liabilities | ||||||||||||||||||||||||
Bilateral OTC | $ | 361,467 | $ | (332,549 | ) | $ | 28,918 | $ | (6,967 | ) | $ | - | $ | 21,951 | ||||||||||
Cleared OTC(3) | 128,153 | (127,267 | ) | 886 | - | (2 | ) | 884 | ||||||||||||||||
Exchange traded | 34,242 | (28,273 | ) | 5,969 | (735 | ) | - | 5,234 | ||||||||||||||||
|
|
|
|
|
|
|
|
|
|
|
| |||||||||||||
Total derivative liabilities | $ | 523,862 | $ | (488,089 | ) | $ | 35,773 | $ | (7,702 | ) | $ | (2 | ) | $ | 28,069 | |||||||||
|
|
|
|
|
|
|
|
|
|
|
| |||||||||||||
| 31 | |
MORGAN STANLEY
NOTES TO CONDENSED CONSOLIDATED FINANCIAL STATEMENTS (Unaudited)-(Continued)
| At December 31, 2014 | ||||||||||||||||||||||||
| Gross Amounts(4) | Amounts Offset in the Condensed Consolidated Statements of Financial Condition | Net Amounts Presented in the Condensed Consolidated Statements of Financial Condition | Amounts Not Offset in the Condensed Consolidated Statements of Financial Condition(2) | Net Exposure | ||||||||||||||||||||
| Financial Instruments Collateral | Other Cash Collateral | |||||||||||||||||||||||
| (dollars in millions) | ||||||||||||||||||||||||
Derivative assets | ||||||||||||||||||||||||
Bilateral OTC | $ | 427,079 | $ | (396,582 | ) | $ | 30,497 | $ | (9,844 | ) | $ | (19 | ) | $ | 20,634 | |||||||||
Cleared OTC(3) | 217,169 | (215,576 | ) | 1,593 | - | - | 1,593 | |||||||||||||||||
Exchange traded | 32,123 | (27,819 | ) | 4,304 | - | - | 4,304 | |||||||||||||||||
|
|
|
|
|
|
|
|
|
|
|
| |||||||||||||
Total derivative assets | $ | 676,371 | $ | (639,977 | ) | $ | 36,394 | $ | (9,844 | ) | $ | (19 | ) | $ | 26,531 | |||||||||
|
|
|
|
|
|
|
|
|
|
|
| |||||||||||||
Derivative liabilities | ||||||||||||||||||||||||
Bilateral OTC | $ | 410,003 | $ | (375,095 | ) | $ | 34,908 | $ | (11,192 | ) | $ | (179 | ) | $ | 23,537 | |||||||||
Cleared OTC(3) | 211,695 | (211,180 | ) | 515 | - | (6 | ) | 509 | ||||||||||||||||
Exchange traded | 32,608 | (27,819 | ) | 4,789 | (726 | ) | - | 4,063 | ||||||||||||||||
|
|
|
|
|
|
|
|
|
|
|
| |||||||||||||
Total derivative liabilities | $ | 654,306 | $ | (614,094 | ) | $ | 40,212 | $ | (11,918 | ) | $ | (185 | ) | $ | 28,109 | |||||||||
|
|
|
|
|
|
|
|
|
|
|
| |||||||||||||
| (1) | Amounts include $6.2 billion of derivative assets and $6.9 billion of derivative liabilities, which are either not subject to master netting agreements or collateral agreements or are subject to such agreements but the Company has not determined the agreements to be legally enforceable. See also "Fair Value and Notional of Derivative Instruments" herein, for additional disclosure about gross fair values and notionals for derivative instruments by risk type. |
| (2) | Amounts relate to master netting agreements and collateral agreements, which have been determined by the Company to be legally enforceable in the event of default but where certain other criteria are not met in accordance with applicable offsetting accounting guidance. |
| (3) | Amounts include OTC derivatives that are centrally cleared in accordance with certain regulatory requirements. |
| (4) | Amounts include $6.5 billion of derivative assets and $6.9 billion of derivative liabilities, which are either not subject to master netting agreements or collateral agreements or are subject to such agreements but the Company has not determined the agreements to be legally enforceable. See also "Fair Value and Notional of Derivative Instruments" herein, for additional disclosure about gross fair values and notionals for derivative instruments by risk type. |
The Company incurs credit risk as a dealer in OTC derivatives. Credit risk with respect to derivative instruments arises from the failure of a counterparty to perform according to the terms of the contract. The Company's exposure to credit risk at any point in time is represented by the fair value of the derivative contracts reported as assets. The fair value of a derivative represents the amount at which the derivative could be exchanged in an orderly transaction between market participants and is further described in Note 2 to the consolidated financial statements in the 2014 Form 10-K and Note 3.
| | 32 |
MORGAN STANLEY
NOTES TO CONDENSED CONSOLIDATED FINANCIAL STATEMENTS (Unaudited)-(Continued)
OTC Derivative Products-Trading Assets.
The tables below present a summary by counterparty credit rating and remaining contract maturity of the fair value of OTC derivatives in a gain position at September 30, 2015 and December 31, 2014. Fair value is presented in the final column, net of collateral received (principally cash and U.S. government and agency securities):
| At September 30, 2015(1) | ||||||||||||||||||||||||||||
| Years to Maturity | Cross-Maturity and Cash Collateral Netting(3) | Net
Exposure Post-cash Collateral | Net Exposure Post-collateral | |||||||||||||||||||||||||
Credit Rating(2) | Less than 1 | 1-3 | 3-5 | Over 5 | ||||||||||||||||||||||||
| (dollars in millions) | ||||||||||||||||||||||||||||
AAA | $ | 260 | $ | 289 | $ | 895 | $ | 4,174 | $ | (4,514 | ) | $ | 1,104 | $ | 924 | |||||||||||||
AA | 2,599 | 2,493 | 1,848 | 11,978 | (13,432 | ) | 5,486 | 2,887 | ||||||||||||||||||||
A | 10,807 | 9,428 | 5,885 | 22,520 | (38,543 | ) | 10,097 | 6,606 | ||||||||||||||||||||
BBB | 4,202 | 4,711 | 2,414 | 12,306 | (15,682 | ) | 7,951 | 5,654 | ||||||||||||||||||||
Non-investment grade | 4,502 | 3,339 | 1,521 | 3,755 | (8,144 | ) | 4,973 | 3,573 | ||||||||||||||||||||
|
|
|
|
|
|
|
|
|
|
|
|
|
| |||||||||||||||
Total | $ | 22,370 | $ | 20,260 | $ | 12,563 | $ | 54,733 | $ | (80,315 | ) | $ | 29,611 | $ | 19,644 | |||||||||||||
|
|
|
|
|
|
|
|
|
|
|
|
|
| |||||||||||||||
| At December 31, 2014(1) | ||||||||||||||||||||||||||||
| Years to Maturity | Cross-Maturity and Cash Collateral Netting(3) | Net Exposure Post-cash Collateral | Net Exposure Post-collateral | |||||||||||||||||||||||||
Credit Rating(2) | Less than 1 | 1-3 | 3-5 | Over 5 | ||||||||||||||||||||||||
| (dollars in millions) | ||||||||||||||||||||||||||||
AAA | $ | 499 | $ | 246 | $ | 1,313 | $ | 4,281 | $ | (5,009 | ) | $ | 1,330 | $ | 1,035 | |||||||||||||
AA | 2,679 | 2,811 | 2,704 | 14,137 | (15,415 | ) | 6,916 | 4,719 | ||||||||||||||||||||
A | 11,733 | 10,833 | 7,585 | 23,968 | (43,644 | ) | 10,475 | 6,520 | ||||||||||||||||||||
BBB | 5,119 | 3,753 | 2,592 | 13,132 | (15,844 | ) | 8,752 | 6,035 | ||||||||||||||||||||
Non-investment grade | 3,196 | 3,089 | 1,541 | 2,499 | (5,727 | ) | 4,598 | 3,918 | ||||||||||||||||||||
|
|
|
|
|
|
|
|
|
|
|
|
|
| |||||||||||||||
Total | $ | 23,226 | $ | 20,732 | $ | 15,735 | $ | 58,017 | $ | (85,639 | ) | $ | 32,071 | $ | 22,227 | |||||||||||||
|
|
|
|
|
|
|
|
|
|
|
|
|
| |||||||||||||||
| (1) | Fair values shown represent the Company's net exposure to counterparties related to the Company's OTC derivative products. Amounts include centrally cleared OTC derivatives. The tables do not include exchange-traded derivatives and the effect of any related hedges utilized by the Company. |
| (2) | Obligor credit ratings are determined by the Company's Credit Risk Management Department. |
| (3) | Amounts represent the netting of receivable balances with payable balances for the same counterparty across maturity categories. Receivable and payable balances with the same counterparty in the same maturity category are netted within such maturity category, where appropriate. Cash collateral received is netted on a counterparty basis, provided legal right of offset exists. |
For a discussion of hedge accounting, fair value hedges-interest rate risk and net investment hedges, see Note 12 to the consolidated financial statements in the 2014 Form 10-K.
| 33 | |
MORGAN STANLEY
NOTES TO CONDENSED CONSOLIDATED FINANCIAL STATEMENTS (Unaudited)-(Continued)
Fair Value and Notional of Derivative Instruments.
The following tables summarize the fair value of derivative instruments designated as accounting hedges and the fair value of derivative instruments not designated as accounting hedges by type of derivative contract and the platform on which these instruments are traded or cleared on a gross basis. Fair values of derivative contracts in an asset position are included in Trading assets, and fair values of derivative contracts in a liability position are reflected in Trading liabilities in the Company's condensed consolidated statements of financial condition (see Note 3):
| Derivative Assets at September 30, 2015 | ||||||||||||||||||||||||||||||||
| Fair Value | Notional | |||||||||||||||||||||||||||||||
| Bilateral OTC | Cleared OTC(1) | Exchange Traded | Total | Bilateral OTC | Cleared OTC(1) | Exchange Traded | Total | |||||||||||||||||||||||||
| (dollars in millions) | ||||||||||||||||||||||||||||||||
Derivatives designated as accounting hedges: | ||||||||||||||||||||||||||||||||
Interest rate contracts | $ | 3,565 | $ | 1,828 | $ | - | $ | 5,393 | $ | 38,389 | $ | 43,193 | $ | - | $ | 81,582 | ||||||||||||||||
Foreign exchange contracts | 210 | 5 | - | 215 | 6,533 | 438 | - | 6,971 | ||||||||||||||||||||||||
|
|
|
|
|
|
|
|
|
|
|
|
|
|
|
| |||||||||||||||||
Total derivatives designated as accounting hedges | 3,775 | 1,833 | - | 5,608 | 44,922 | 43,631 | - | 88,553 | ||||||||||||||||||||||||
|
|
|
|
|
|
|
|
|
|
|
|
|
|
|
| |||||||||||||||||
Derivatives not designated as accounting hedges(2): | ||||||||||||||||||||||||||||||||
Interest rate contracts | 242,212 | 123,482 | 436 | 366,130 | 4,570,771 | 6,416,792 | 1,231,155 | 12,218,718 | ||||||||||||||||||||||||
Credit contracts | 21,246 | 3,535 | - | 24,781 | 684,536 | 171,985 | - | 856,521 | ||||||||||||||||||||||||
Foreign exchange contracts | 70,521 | 412 | 102 | 71,035 | 1,964,784 | 13,908 | 42,417 | 2,021,109 | ||||||||||||||||||||||||
Equity contracts | 25,261 | - | 26,399 | 51,660 | 356,509 | - | 294,745 | 651,254 | ||||||||||||||||||||||||
Commodity contracts | 16,230 | - | 5,011 | 21,241 | 87,566 | - | 103,188 | 190,754 | ||||||||||||||||||||||||
Other | 364 | - | - | 364 | 7,568 | - | - | 7,568 | ||||||||||||||||||||||||
|
|
|
|
|
|
|
|
|
|
|
|
|
|
|
| |||||||||||||||||
Total derivatives not designated as accounting hedges | 375,834 | 127,429 | 31,948 | 535,211 | 7,671,734 | 6,602,685 | 1,671,505 | 15,945,924 | ||||||||||||||||||||||||
|
|
|
|
|
|
|
|
|
|
|
|
|
|
|
| |||||||||||||||||
Total derivatives | $ | 379,609 | $ | 129,262 | $ | 31,948 | $ | 540,819 | $ | 7,716,656 | $ | 6,646,316 | $ | 1,671,505 | $ | 16,034,477 | ||||||||||||||||
Cash collateral netting | (54,391 | ) | (2,480 | ) | - | (56,871 | ) | - | - | - | - | |||||||||||||||||||||
Counterparty netting | (296,874 | ) | (125,507 | ) | (28,273 | ) | (450,654 | ) | - | - | - | - | ||||||||||||||||||||
|
|
|
|
|
|
|
|
|
|
|
|
|
|
|
| |||||||||||||||||
Total derivative assets | $ | 28,344 | $ | 1,275 | $ | 3,675 | $ | 33,294 | $ | 7,716,656 | $ | 6,646,316 | $ | 1,671,505 | $ | 16,034,477 | ||||||||||||||||
|
|
|
|
|
|
|
|
|
|
|
|
|
|
|
| |||||||||||||||||
| | 34 |
MORGAN STANLEY
NOTES TO CONDENSED CONSOLIDATED FINANCIAL STATEMENTS (Unaudited)-(Continued)
| Derivative Liabilities at September 30, 2015 | ||||||||||||||||||||||||||||||||
| Fair Value | Notional | |||||||||||||||||||||||||||||||
| Bilateral OTC | Cleared OTC(1) | Exchange Traded | Total | Bilateral OTC | Cleared OTC(1) | Exchange Traded | Total | |||||||||||||||||||||||||
| (dollars in millions) | ||||||||||||||||||||||||||||||||
Derivatives designated as accounting hedges: | ||||||||||||||||||||||||||||||||
Interest rate contracts | $ | 61 | $ | 98 | $ | - | $ | 159 | $ | 2,000 | $ | 4,519 | $ | - | $ | 6,519 | ||||||||||||||||
Foreign exchange contracts | 37 | 2 | - | 39 | 4,155 | 153 | - | 4,308 | ||||||||||||||||||||||||
|
|
|
|
|
|
|
|
|
|
|
|
|
|
|
| |||||||||||||||||
Total derivatives designated as accounting hedges | 98 | 100 | - | 198 | 6,155 | 4,672 | - | 10,827 | ||||||||||||||||||||||||
|
|
|
|
|
|
|
|
|
|
|
|
|
|
|
| |||||||||||||||||
Derivatives not designated as accounting hedges(2): | ||||||||||||||||||||||||||||||||
Interest rate contracts | 224,805 | 124,372 | 321 | 349,498 | 4,259,745 | 6,013,571 | 1,189,701 | 11,463,017 | ||||||||||||||||||||||||
Credit contracts | 21,224 | 3,418 | - | 24,642 | 617,011 | 165,496 | - | 782,507 | ||||||||||||||||||||||||
Foreign exchange contracts | 72,572 | 263 | 60 | 72,895 | 1,968,292 | 12,137 | 9,274 | 1,989,703 | ||||||||||||||||||||||||
Equity contracts | 28,858 | - | 28,553 | 57,411 | 351,276 | - | 293,615 | 644,891 | ||||||||||||||||||||||||
Commodity contracts | 13,859 | - | 5,308 | 19,167 | 79,641 | - | 89,147 | 168,788 | ||||||||||||||||||||||||
Other | 51 | - | - | 51 | 4,170 | - | - | 4,170 | ||||||||||||||||||||||||
|
|
|
|
|
|
|
|
|
|
|
|
|
|
|
| |||||||||||||||||
Total derivatives not designated as accounting hedges | 361,369 | 128,053 | 34,242 | 523,664 | 7,280,135 | 6,191,204 | 1,581,737 | 15,053,076 | ||||||||||||||||||||||||
|
|
|
|
|
|
|
|
|
|
|
|
|
|
|
| |||||||||||||||||
Total derivatives | $ | 361,467 | $ | 128,153 | $ | 34,242 | $ | 523,862 | $ | 7,286,290 | $ | 6,195,876 | $ | 1,581,737 | $ | 15,063,903 | ||||||||||||||||
Cash collateral netting | (35,675 | ) | (1,760 | ) | - | (37,435 | ) | - | - | - | - | |||||||||||||||||||||
Counterparty netting | (296,874 | ) | (125,507 | ) | (28,273 | ) | (450,654 | ) | - | - | - | - | ||||||||||||||||||||
|
|
|
|
|
|
|
|
|
|
|
|
|
|
|
| |||||||||||||||||
Total derivative liabilities | $ | 28,918 | $ | 886 | $ | 5,969 | $ | 35,773 | $ | 7,286,290 | $ | 6,195,876 | $ | 1,581,737 | $ | 15,063,903 | ||||||||||||||||
|
|
|
|
|
|
|
|
|
|
|
|
|
|
|
| |||||||||||||||||
| Derivative Assets at December 31, 2014 | ||||||||||||||||||||||||||||||||
| Fair Value | Notional | |||||||||||||||||||||||||||||||
| Bilateral OTC | Cleared OTC(1) | Exchange Traded | Total | Bilateral OTC | Cleared OTC(1) | Exchange Traded | Total | |||||||||||||||||||||||||
| (dollars in millions) | ||||||||||||||||||||||||||||||||
Derivatives designated as accounting hedges: | ||||||||||||||||||||||||||||||||
Interest rate contracts | $ | 3,947 | $ | 1,053 | $ | - | $ | 5,000 | $ | 44,324 | $ | 27,692 | $ | - | $ | 72,016 | ||||||||||||||||
Foreign exchange contracts | 498 | 6 | - | 504 | 9,362 | 261 | - | 9,623 | ||||||||||||||||||||||||
|
|
|
|
|
|
|
|
|
|
|
|
|
|
|
| |||||||||||||||||
Total derivatives designated as accounting hedges | 4,445 | 1,059 | - | 5,504 | 53,686 | 27,953 | - | 81,639 | ||||||||||||||||||||||||
|
|
|
|
|
|
|
|
|
|
|
|
|
|
|
| |||||||||||||||||
Derivatives not designated as accounting hedges(3): | ||||||||||||||||||||||||||||||||
Interest rate contracts | 281,214 | 211,552 | 407 | 493,173 | 4,854,953 | 9,187,454 | 1,467,056 | 15,509,463 | ||||||||||||||||||||||||
Credit contracts | 27,776 | 4,406 | - | 32,182 | 806,441 | 167,390 | - | 973,831 | ||||||||||||||||||||||||
Foreign exchange contracts | 72,362 | 152 | 83 | 72,597 | 1,955,343 | 11,538 | 9,663 | 1,976,544 | ||||||||||||||||||||||||
Equity contracts | 23,208 | - | 24,916 | 48,124 | 299,363 | - | 271,164 | 570,527 | ||||||||||||||||||||||||
Commodity contracts | 17,698 | - | 6,717 | 24,415 | 115,792 | - | 156,440 | 272,232 | ||||||||||||||||||||||||
Other | 376 | - | - | 376 | 5,179 | - | - | 5,179 | ||||||||||||||||||||||||
|
|
|
|
|
|
|
|
|
|
|
|
|
|
|
| |||||||||||||||||
Total derivatives not designated as accounting hedges | 422,634 | 216,110 | 32,123 | 670,867 | 8,037,071 | 9,366,382 | 1,904,323 | 19,307,776 | ||||||||||||||||||||||||
|
|
|
|
|
|
|
|
|
|
|
|
|
|
|
| |||||||||||||||||
Total derivatives | $ | 427,079 | $ | 217,169 | $ | 32,123 | $ | 676,371 | $ | 8,090,757 | $ | 9,394,335 | $ | 1,904,323 | $ | 19,389,415 | ||||||||||||||||
Cash collateral netting | (58,541 | ) | (4,654 | ) | - | (63,195 | ) | - | - | - | - | |||||||||||||||||||||
Counterparty netting | (338,041 | ) | (210,922 | ) | (27,819 | ) | (576,782 | ) | - | - | - | - | ||||||||||||||||||||
|
|
|
|
|
|
|
|
|
|
|
|
|
|
|
| |||||||||||||||||
Total derivative assets | $ | 30,497 | $ | 1,593 | $ | 4,304 | $ | 36,394 | $ | 8,090,757 | $ | 9,394,335 | $ | 1,904,323 | $ | 19,389,415 | ||||||||||||||||
|
|
|
|
|
|
|
|
|
|
|
|
|
|
|
| |||||||||||||||||
| 35 | |
MORGAN STANLEY
NOTES TO CONDENSED CONSOLIDATED FINANCIAL STATEMENTS (Unaudited)-(Continued)
| Derivative Liabilities at December 31, 2014 | ||||||||||||||||||||||||||||||||
| Fair Value | Notional | |||||||||||||||||||||||||||||||
| Bilateral OTC | Cleared OTC(1) | Exchange Traded | Total | Bilateral OTC | Cleared OTC(1) | Exchange Traded | Total | |||||||||||||||||||||||||
| (dollars in millions) | ||||||||||||||||||||||||||||||||
Derivatives designated as accounting hedges: | ||||||||||||||||||||||||||||||||
Interest rate contracts | $ | 125 | $ | 99 | $ | - | $ | 224 | $ | 2,024 | $ | 7,588 | $ | - | $ | 9,612 | ||||||||||||||||
Foreign exchange contracts | 5 | 1 | - | 6 | 1,491 | 121 | - | 1,612 | ||||||||||||||||||||||||
|
|
|
|
|
|
|
|
|
|
|
|
|
|
|
| |||||||||||||||||
Total derivatives designated as accounting hedges | 130 | 100 | - | 230 | 3,515 | 7,709 | - | 11,224 | ||||||||||||||||||||||||
|
|
|
|
|
|
|
|
|
|
|
|
|
|
|
| |||||||||||||||||
Derivatives not designated as accounting hedges(3): | ||||||||||||||||||||||||||||||||
Interest rate contracts | 264,579 | 207,482 | 293 | 472,354 | 4,615,886 | 9,138,417 | 1,714,021 | 15,468,324 | ||||||||||||||||||||||||
Credit contracts | 28,165 | 3,944 | - | 32,109 | 714,181 | 154,054 | - | 868,235 | ||||||||||||||||||||||||
Foreign exchange contracts | 72,156 | 169 | 21 | 72,346 | 1,947,178 | 11,477 | 1,761 | 1,960,416 | ||||||||||||||||||||||||
Equity contracts | 30,061 | - | 25,511 | 55,572 | 339,884 | - | 302,205 | 642,089 | ||||||||||||||||||||||||
Commodity contracts | 14,740 | - | 6,783 | 21,523 | 93,019 | - | 132,136 | 225,155 | ||||||||||||||||||||||||
Other | 172 | - | - | 172 | 5,478 | - | - | 5,478 | ||||||||||||||||||||||||
|
|
|
|
|
|
|
|
|
|
|
|
|
|
|
| |||||||||||||||||
Total derivatives not designated as accounting hedges | 409,873 | 211,595 | 32,608 | 654,076 | 7,715,626 | 9,303,948 | 2,150,123 | 19,169,697 | ||||||||||||||||||||||||
|
|
|
|
|
|
|
|
|
|
|
|
|
|
|
| |||||||||||||||||
Total derivatives | $ | 410,003 | $ | 211,695 | $ | 32,608 | $ | 654,306 | $ | 7,719,141 | $ | 9,311,657 | $ | 2,150,123 | $ | 19,180,921 | ||||||||||||||||
Cash collateral netting | (37,054 | ) | (258 | ) | - | (37,312 | ) | - | - | - | - | |||||||||||||||||||||
Counterparty netting | (338,041 | ) | (210,922 | ) | (27,819 | ) | (576,782 | ) | - | - | - | - | ||||||||||||||||||||
|
|
|
|
|
|
|
|
|
|
|
|
|
|
|
| |||||||||||||||||
Total derivative liabilities | $ | 34,908 | $ | 515 | $ | 4,789 | $ | 40,212 | $ | 7,719,141 | $ | 9,311,657 | $ | 2,150,123 | $ | 19,180,921 | ||||||||||||||||
|
|
|
|
|
|
|
|
|
|
|
|
|
|
|
| |||||||||||||||||
| (1) | Amounts include OTC derivatives that are centrally cleared in accordance with certain regulatory requirements. |
| (2) | Notional amounts include gross notionals related to open long and short futures contracts of $886 billion and $950 billion, respectively. The unsettled fair value on these futures contracts (excluded from the table above) of $432 million and $9 million is included in Customer and other receivables and Customer and other payables, respectively, in the Company's condensed consolidated statements of financial condition. |
| (3) | Notional amounts include gross notionals related to open long and short futures contracts of $685 billion and $1,122 billion, respectively. The unsettled fair value on these futures contracts (excluded from the table above) of $472 million and $21 million is included in Customer and other receivables and Customer and other payables, respectively, in the Company's condensed consolidated statements of financial condition. |
At September 30, 2015, cash collateral payables of $3 million and at December 31, 2014, cash collateral receivables and payables of $21 million and $30 million, respectively, were not offset against certain contracts that did not meet the definition of a derivative. The Company had no cash collateral receivable at September 30, 2015 that was not offset against certain contracts that did not meet the definition of a derivative.
| | 36 |
MORGAN STANLEY
NOTES TO CONDENSED CONSOLIDATED FINANCIAL STATEMENTS (Unaudited)-(Continued)
Derivatives Designated as Fair Value Hedges.
The following table presents gains (losses) reported on interest rate derivative instruments designated and qualifying as accounting hedges and the related hedged item as well as the hedge ineffectiveness included in Interest expense in the Company's condensed consolidated statements of income:
| Gains (Losses) Recognized in Interest Expense | ||||||||||||||||
| Three Months Ended September 30, | Nine Months Ended September 30, | |||||||||||||||
Product Type | 2015 | 2014 | 2015 | 2014 | ||||||||||||
| (dollars in millions) | ||||||||||||||||
Derivatives | $ | 1,531 | $ | (384 | ) | $ | 390 | $ | 547 | |||||||
Borrowings | (1,334 | ) | 757 | 386 | 429 | |||||||||||
|
|
|
|
|
|
|
| |||||||||
Total | $ | 197 | $ | 373 | $ | 776 | $ | 976 | ||||||||
|
|
|
|
|
|
|
| |||||||||
Derivatives Designated as Net Investment Hedges.
The following table presents gains (losses) reported on derivative instruments designated and qualifying as accounting hedges:
| Gains (Losses) Recognized in OCI (effective portion) | ||||||||||||||||
| Three Months Ended | Nine Months Ended | |||||||||||||||
| September 30, | September 30, | |||||||||||||||
Product Type | 2015 | 2014 | 2015 | 2014 | ||||||||||||
| (dollars in millions) | ||||||||||||||||
Foreign exchange contracts(1) | $ | 210 | $ | 438 | $ | 391 | $ | 262 | ||||||||
|
|
|
|
|
|
|
| |||||||||
Total | $ | 210 | $ | 438 | $ | 391 | $ | 262 | ||||||||
|
|
|
|
|
|
|
| |||||||||
| (1) | Losses of $37 million and $117 million related to the forward points on the hedging instruments were excluded from hedge effectiveness testing and recognized in interest income during the quarter and nine months ended September 30, 2015, respectively. Losses of $46 million and $143 million related to the forward points on the hedging instruments were excluded from hedge effectiveness testing and recognized in interest income during the quarter and nine months ended September 30, 2014, respectively. |
Derivatives Not Designated as Accounting Hedges.
The following table summarizes gains (losses) on derivative instruments not designated as accounting hedges:
| Gains (Losses) Recognized in Income(1) | ||||||||||||||||
| Three Months Ended | Nine Months Ended | |||||||||||||||
| September 30, | September 30, | |||||||||||||||
Product Type | 2015 | 2014 | 2015 | 2014 | ||||||||||||
| (dollars in millions) | ||||||||||||||||
Interest rate contracts | $ | 103 | $ | (37 | ) | $ | 579 | $ | (1,847 | ) | ||||||
Credit contracts | 99 | 407 | (110 | ) | 258 | |||||||||||
Foreign exchange contracts | 3,570 | 191 | (1,224 | ) | 1,795 | |||||||||||
Equity contracts | 3,678 | 114 | 1,658 | (2,212 | ) | |||||||||||
Commodity contracts | 787 | 60 | 1,435 | 531 | ||||||||||||
Other contracts | 35 | 22 | (30 | ) | 133 | |||||||||||
|
|
|
|
|
|
|
| |||||||||
Total derivative instruments | $ | 8,272 | $ | 757 | $ | 2,308 | $ | (1,342 | ) | |||||||
|
|
|
|
|
|
|
| |||||||||
| 37 | |
MORGAN STANLEY
NOTES TO CONDENSED CONSOLIDATED FINANCIAL STATEMENTS (Unaudited)-(Continued)
| (1) | Gains (losses) on derivative contracts not designated as hedges are primarily included in Trading revenues in the Company's condensed consolidated statements of income. Gains (losses) associated with certain derivative contracts that have physically settled are excluded from the table above. Gains (losses) on these contracts are reflected with the associated cash instruments, which are also included in Trading revenues in the Company's condensed consolidated statements of income. |
The Company also has certain embedded derivatives that have been bifurcated from the related structured borrowings. Such derivatives are classified in Long-term borrowings and had a net fair value of $19 million and $10 million at September 30, 2015 and December 31, 2014, respectively, and a notional value of $2,069 million at both September 30, 2015 and December 31, 2014. The Company recognized a loss of $6 million and a gain of $10 million related to changes in the fair value of its bifurcated embedded derivatives for the quarter and nine months ended September 30, 2015, respectively. The Company recognized a gain of $5 million and a loss of $23 million related to changes in the fair value of its bifurcated embedded derivatives for the quarter and nine months ended September 30, 2014, respectively.
Credit Risk-Related Contingencies.
In connection with certain OTC trading agreements, the Company may be required to provide additional collateral or immediately settle any outstanding liability balances with certain counterparties in the event of a credit rating downgrade of the Company. The following table presents the aggregate fair value of certain derivative contracts that contain credit risk-related contingent features that are in a net liability position for which the Company has posted collateral in the normal course of business.
| At September 30, 2015 | ||||
| (dollars in millions) | ||||
Net derivative liabilities | $ | 26,700 | ||
Collateral posted | 22,247 | |||
The additional collateral or termination payments which may be called in the event of a future credit rating downgrade vary by contract and can be based on ratings by either or both of Moody's Investors Service, Inc. ("Moody's") and Standard & Poor's Ratings Services ("S&P"). At September 30, 2015, for such OTC trading agreements, the future potential collateral amounts and termination payments that could be called or required by counterparties or exchange and clearing organizations in the event of one-notch or two-notch downgrade scenarios based on the relevant contractual downgrade triggers were as follows:
| At September 30, 2015 | ||||
| (dollars in millions) | ||||
Incremental collateral or termination payments upon potential future ratings downgrade(1): | ||||
One-notch downgrade | $ | 1,111 | ||
Two-notch downgrade | 1,251 | |||
| (1) | Amounts include $1,879 million related to bilateral arrangements between the Company and other parties where upon the downgrade of one party, the downgraded party must deliver collateral to the other party. These bilateral downgrade arrangements are a risk management tool used extensively by the Company as credit exposures are reduced if counterparties are downgraded. |
Credit Derivatives and Other Credit Contracts.
The Company enters into credit derivatives, principally through credit default swaps, under which it receives or provides protection against the risk of default on a set of debt obligations issued by a specified reference entity or entities. A majority of the Company's counterparties are banks, broker-dealers, insurance and other financial institutions, and monoline insurers.
| | 38 |
MORGAN STANLEY
NOTES TO CONDENSED CONSOLIDATED FINANCIAL STATEMENTS (Unaudited)-(Continued)
The tables below summarize the notional and fair value of protection sold and protection purchased through credit default swaps:
| At September 30, 2015 | ||||||||||||||||
| Maximum Potential Payout/Notional | ||||||||||||||||
| Protection Sold | Protection Purchased | |||||||||||||||
| Notional | Fair Value (Asset)/Liability | Notional | Fair Value (Asset)/Liability | |||||||||||||
| (dollars in millions) | ||||||||||||||||
Single name credit default swaps | $ | 458,768 | $ | 1,241 | $ | 439,328 | $ | (593 | ) | |||||||
Index and basket credit default swaps | 264,416 | (148 | ) | 231,528 | (68 | ) | ||||||||||
Tranched index and basket credit default swaps | 74,353 | (1,394 | ) | 170,635 | 823 | |||||||||||
|
|
|
|
|
|
|
| |||||||||
Total | $ | 797,537 | $ | (301 | ) | $ | 841,491 | $ | 162 | |||||||
|
|
|
|
|
|
|
| |||||||||
| At December 31, 2014 | ||||||||||||||||
| Maximum Potential Payout/Notional | ||||||||||||||||
| Protection Sold | Protection Purchased | |||||||||||||||
| Notional | Fair Value (Asset)/Liability | Notional | Fair Value (Asset)/Liability | |||||||||||||
| (dollars in millions) | ||||||||||||||||
Single name credit default swaps | $ | 535,415 | $ | (2,479 | ) | $ | 509,872 | $ | 1,641 | |||||||
Index and basket credit default swaps | 276,465 | (1,777 | ) | 229,789 | 1,563 | |||||||||||
Tranched index and basket credit default swaps | 96,182 | (2,355 | ) | 194,343 | 3,334 | |||||||||||
|
|
|
|
|
|
|
| |||||||||
Total | $ | 908,062 | $ | (6,611 | ) | $ | 934,004 | $ | 6,538 | |||||||
|
|
|
|
|
|
|
| |||||||||
| 39 | |
MORGAN STANLEY
NOTES TO CONDENSED CONSOLIDATED FINANCIAL STATEMENTS (Unaudited)-(Continued)
The tables below summarize the credit ratings of the reference obligation and maturities of protection sold through credit default swaps and other credit contracts:
| At September 30, 2015 | ||||||||||||||||||||||||
| Maximum Potential Payout/Notional | Fair
Value (Asset)/ Liability(1)(2) | |||||||||||||||||||||||
| Years to Maturity | ||||||||||||||||||||||||
Credit Ratings of the Reference Obligation | Less than 1 | 1-3 | 3-5 | Over 5 | Total | |||||||||||||||||||
| (dollars in millions) | ||||||||||||||||||||||||
Single name credit default swaps: | ||||||||||||||||||||||||
AAA | $ | 4,247 | $ | 13,475 | $ | 5,252 | $ | 1,587 | $ | 24,561 | $ | (253 | ) | |||||||||||
AA | 9,247 | 18,450 | 10,605 | 2,689 | 40,991 | (433 | ) | |||||||||||||||||
A | 18,861 | 36,875 | 11,145 | 1,825 | 68,706 | (803 | ) | |||||||||||||||||
BBB | 43,071 | 92,864 | 41,808 | 11,883 | 189,626 | (325 | ) | |||||||||||||||||
Non-investment grade | 35,030 | 66,058 | 28,914 | 4,882 | 134,884 | 3,055 | ||||||||||||||||||
|
|
|
|
|
|
|
|
|
|
|
| |||||||||||||
Total | 110,456 | 227,722 | 97,724 | 22,866 | 458,768 | 1,241 | ||||||||||||||||||
|
|
|
|
|
|
|
|
|
|
|
| |||||||||||||
Index and basket credit default swaps: | ||||||||||||||||||||||||
AAA | 14,890 | 41,296 | 1,663 | - | 57,849 | (1,006 | ) | |||||||||||||||||
A | 4,700 | 4,668 | 6,271 | 12 | 15,651 | (197 | ) | |||||||||||||||||
BBB | 9,904 | 27,045 | 49,952 | 34,893 | 121,794 | (818 | ) | |||||||||||||||||
Non-investment grade | 24,331 | 82,978 | 16,048 | 20,118 | 143,475 | 479 | ||||||||||||||||||
|
|
|
|
|
|
|
|
|
|
|
| |||||||||||||
Total | 53,825 | 155,987 | 73,934 | 55,023 | 338,769 | (1,542 | ) | |||||||||||||||||
|
|
|
|
|
|
|
|
|
|
|
| |||||||||||||
Total credit default swaps sold | $ | 164,281 | $ | 383,709 | $ | 171,658 | $ | 77,889 | $ | 797,537 | $ | (301 | ) | |||||||||||
|
|
|
|
|
|
|
|
|
|
|
| |||||||||||||
Other credit contracts(3) | $ | 1 | $ | 806 | $ | 340 | $ | 49 | $ | 1,196 | $ | (1,042 | ) | |||||||||||
|
|
|
|
|
|
|
|
|
|
|
| |||||||||||||
Total credit derivatives and other credit contracts | $ | 164,282 | $ | 384,515 | $ | 171,998 | $ | 77,938 | $ | 798,733 | $ | (1,343 | ) | |||||||||||
|
|
|
|
|
|
|
|
|
|
|
| |||||||||||||
| | 40 |
MORGAN STANLEY
NOTES TO CONDENSED CONSOLIDATED FINANCIAL STATEMENTS (Unaudited)-(Continued)
| At December 31, 2014 | ||||||||||||||||||||||||
| Maximum Potential Payout/Notional | Fair
Value (Asset)/ Liability(1)(2) | |||||||||||||||||||||||
| Years to Maturity | ||||||||||||||||||||||||
Credit Ratings of the Reference Obligation | Less than 1 | 1-3 | 3-5 | Over 5 | Total | |||||||||||||||||||
| (dollars in millions) | ||||||||||||||||||||||||
Single name credit default swaps: | ||||||||||||||||||||||||
AAA | $ | 2,385 | $ | 9,400 | $ | 6,147 | $ | 692 | $ | 18,624 | $ | (113 | ) | |||||||||||
AA | 9,080 | 23,701 | 14,769 | 3,318 | 50,868 | (688 | ) | |||||||||||||||||
A | 22,861 | 52,291 | 22,083 | 2,944 | 100,179 | (1,962 | ) | |||||||||||||||||
BBB | 48,547 | 114,384 | 60,629 | 13,536 | 237,096 | (1,489 | ) | |||||||||||||||||
Non-investment grade | 29,857 | 66,066 | 29,011 | 3,714 | 128,648 | 1,773 | ||||||||||||||||||
|
|
|
|
|
|
|
|
|
|
|
| |||||||||||||
Total | 112,730 | 265,842 | 132,639 | 24,204 | 535,415 | (2,479 | ) | |||||||||||||||||
|
|
|
|
|
|
|
|
|
|
|
| |||||||||||||
Index and basket credit default swaps: | ||||||||||||||||||||||||
AAA | 17,625 | 31,124 | 7,265 | 1,883 | 57,897 | (985 | ) | |||||||||||||||||
AA | 704 | 6,512 | 716 | 2,864 | 10,796 | (270 | ) | |||||||||||||||||
A | 1,283 | 6,841 | 10,154 | 30 | 18,308 | (465 | ) | |||||||||||||||||
BBB | 30,265 | 40,575 | 60,141 | 7,730 | 138,711 | (2,904 | ) | |||||||||||||||||
Non-investment grade | 25,750 | 88,105 | 22,971 | 10,109 | 146,935 | 492 | ||||||||||||||||||
|
|
|
|
|
|
|
|
|
|
|
| |||||||||||||
Total | 75,627 | 173,157 | 101,247 | 22,616 | 372,647 | (4,132 | ) | |||||||||||||||||
|
|
|
|
|
|
|
|
|
|
|
| |||||||||||||
Total credit default swaps sold | $ | 188,357 | $ | 438,999 | $ | 233,886 | $ | 46,820 | $ | 908,062 | $ | (6,611 | ) | |||||||||||
|
|
|
|
|
|
|
|
|
|
|
| |||||||||||||
Other credit contracts(3) | $ | 51 | $ | 539 | $ | 1 | $ | 620 | $ | 1,211 | $ | (500 | ) | |||||||||||
|
|
|
|
|
|
|
|
|
|
|
| |||||||||||||
Total credit derivatives and other credit contracts | $ | 188,408 | $ | 439,538 | $ | 233,887 | $ | 47,440 | $ | 909,273 | $ | (7,111 | ) | |||||||||||
|
|
|
|
|
|
|
|
|
|
|
| |||||||||||||
| (1) | Fair value amounts are shown on a gross basis prior to cash collateral or counterparty netting. |
| (2) | Fair value amounts of certain credit default swaps where the Company sold protection have an asset carrying value because credit spreads of the underlying reference entity or entities tightened during the term of the contracts. |
| (3) | Other credit contracts include credit-linked notes ("CLNs"), collateralized debt obligations ("CDOs") and credit default swaps that are considered hybrid instruments. Fair value amounts shown represent the fair value of the hybrid instruments. |
Single Name Credit Default Swaps.
A credit default swap protects the buyer against the loss of principal on a bond or loan in case of a default by the issuer. The protection buyer pays a periodic premium (generally quarterly) over the life of the contract and is protected for the period. The Company in turn will have to perform under a credit default swap if a credit event as defined under the contract occurs. Typical credit events include bankruptcy, dissolution or insolvency of the referenced entity, failure to pay and restructuring of the obligations of the referenced entity. In order to provide an indication of the current payment status or performance risk of the credit default swaps, a breakdown by credit ratings is provided. Agency ratings, if available, are used for this purpose; otherwise the Company's internal ratings are used.
Index and Basket Credit Default Swaps.
Index and basket credit default swaps are products where credit protection is provided on a portfolio of single name credit default swaps. Generally, in the event of a default on one of the underlying names, the Company will have to pay a pro rata portion of the total notional amount of the credit default swap.
The Company also enters into tranched index and basket credit default swaps where credit protection is provided on a particular portion of the portfolio loss distribution. The most junior tranches cover initial defaults, and once losses exceed the notional of the tranche, they are passed on to the next most senior tranche in the capital structure.
| 41 | |
MORGAN STANLEY
NOTES TO CONDENSED CONSOLIDATED FINANCIAL STATEMENTS (Unaudited)-(Continued)
In order to provide an indication of the current payment status or performance risk of the credit default swaps, a breakdown by the Company's internal credit ratings is provided. Effective January 1, 2015, the Company utilized its internal credit ratings as compared with December 31, 2014 where external agency ratings, if available, were utilized. The change in the rating methodology did not have a significant impact on investment grade versus non-investment grade classifications or the fair values of tranched and non-tranched index and basket products in the above table.
Credit Protection Sold through CLNs and CDOs.
The Company has invested in CLNs and CDOs, which are hybrid instruments containing embedded derivatives, in which credit protection has been sold to the issuer of the note. If there is a credit event of a reference entity underlying the instrument, the principal balance of the note may not be repaid in full to the Company.
Purchased Credit Protection with Identical Underlying Reference Obligations.
For single name credit default swaps and non-tranched index and basket credit default swaps, the Company has purchased protection with a notional amount of approximately $668 billion and $731 billion at September 30, 2015 and December 31, 2014, respectively, compared with a notional amount of approximately $721 billion and $805 billion at September 30, 2015 and December 31, 2014, respectively, of credit protection sold with identical underlying reference obligations. In order to identify purchased protection with the same underlying reference obligations, the notional amount for individual reference obligations within non-tranched indices and baskets was determined on a pro rata basis and matched off against single name and non-tranched index and basket credit default swaps where credit protection was sold with identical underlying reference obligations.
The purchase of credit protection does not represent the sole manner in which the Company risk manages its exposure to credit derivatives. The Company manages its exposure to these derivative contracts through a variety of risk mitigation strategies, which include managing the credit and correlation risk across single name, non-tranched indices and baskets, tranched indices and baskets, and cash positions. Aggregate market risk limits have been established for credit derivatives, and market risk measures are routinely monitored against these limits. The Company may also recover amounts on the underlying reference obligation delivered to the Company under credit default swaps where credit protection was sold.
| | 42 |
MORGAN STANLEY
NOTES TO CONDENSED CONSOLIDATED FINANCIAL STATEMENTS (Unaudited)-(Continued)
| 5. | Investment Securities. |
The following tables present information about the Company's AFS securities, which are carried at fair value, and HTM securities, which are carried at amortized cost. The net unrealized gains or losses on AFS securities are reported on an after-tax basis as a component of Accumulated other comprehensive income (loss) ("AOCI").
| At September 30, 2015 | ||||||||||||||||||||
| Amortized Cost | Gross Unrealized Gains | Gross Unrealized Losses | Other-than- Temporary Impairment | Fair Value | ||||||||||||||||
| (dollars in millions) | ||||||||||||||||||||
AFS debt securities: | ||||||||||||||||||||
U.S. government and agency securities: | ||||||||||||||||||||
U.S. Treasury securities | $ | 24,718 | $ | 119 | $ | 3 | $ | - | $ | 24,834 | ||||||||||
U.S. agency securities(1) | 21,000 | 90 | 68 | - | 21,022 | |||||||||||||||
|
|
|
|
|
|
|
|
|
| |||||||||||
Total U.S. government and agency securities | 45,718 | 209 | 71 | - | 45,856 | |||||||||||||||
Corporate and other debt: | ||||||||||||||||||||
Commercial mortgage-backed securities: | ||||||||||||||||||||
Agency | 1,996 | 4 | 44 | - | 1,956 | |||||||||||||||
Non-agency | 2,174 | 16 | 12 | - | 2,178 | |||||||||||||||
Auto loan asset-backed securities | 2,679 | 3 | 1 | - | 2,681 | |||||||||||||||
Corporate bonds | 3,866 | 14 | 17 | - | 3,863 | |||||||||||||||
Collateralized loan obligations | 912 | - | 13 | - | 899 | |||||||||||||||
FFELP student loan asset-backed securities(2) | 3,807 | - | 93 | - | 3,714 | |||||||||||||||
|
|
|
|
|
|
|
|
|
| |||||||||||
Total corporate and other debt | 15,434 | 37 | 180 | - | 15,291 | |||||||||||||||
|
|
|
|
|
|
|
|
|
| |||||||||||
Total AFS debt securities | 61,152 | 246 | 251 | - | 61,147 | |||||||||||||||
|
|
|
|
|
|
|
|
|
| |||||||||||
AFS equity securities | 15 | - | 3 | - | 12 | |||||||||||||||
|
|
|
|
|
|
|
|
|
| |||||||||||
Total AFS securities | 61,167 | 246 | 254 | - | 61,159 | |||||||||||||||
HTM securities: | ||||||||||||||||||||
U.S. government securities: | ||||||||||||||||||||
U.S. Treasury securities | 1,002 | 5 | - | - | 1,007 | |||||||||||||||
U.S. agency securities(1) | 2,528 | 1 | 8 | - | 2,521 | |||||||||||||||
|
|
|
|
|
|
|
|
|
| |||||||||||
Total HTM securities | 3,530 | 6 | 8 | - | 3,528 | |||||||||||||||
|
|
|
|
|
|
|
|
|
| |||||||||||
Total Investment securities | $ | 64,697 | $ | 252 | $ | 262 | $ | - | $ | 64,687 | ||||||||||
|
|
|
|
|
|
|
|
|
| |||||||||||
| 43 | |
MORGAN STANLEY
NOTES TO CONDENSED CONSOLIDATED FINANCIAL STATEMENTS (Unaudited)-(Continued)
| At December 31, 2014 | ||||||||||||||||||||
| Amortized Cost | Gross Unrealized Gains | Gross Unrealized Losses | Other-than- Temporary Impairment | Fair Value | ||||||||||||||||
| (dollars in millions) | ||||||||||||||||||||
AFS debt securities: | ||||||||||||||||||||
U.S. government and agency securities: | ||||||||||||||||||||
U.S. Treasury securities | $ | 35,855 | $ | 42 | $ | 67 | $ | - | $ | 35,830 | ||||||||||
U.S. agency securities(1) | 18,030 | 77 | 72 | - | 18,035 | |||||||||||||||
|
|
|
|
|
|
|
|
|
| |||||||||||
Total U.S. government and agency securities | 53,885 | 119 | 139 | - | 53,865 | |||||||||||||||
Corporate and other debt: | ||||||||||||||||||||
Commercial mortgage-backed securities: | ||||||||||||||||||||
Agency | 2,288 | 1 | 76 | - | 2,213 | |||||||||||||||
Non-agency | 1,820 | 11 | 6 | - | 1,825 | |||||||||||||||
Auto loan asset-backed securities | 2,433 | - | 5 | - | 2,428 | |||||||||||||||
Corporate bonds | 3,640 | 10 | 22 | - | 3,628 | |||||||||||||||
Collateralized loan obligations | 1,087 | - | 20 | - | 1,067 | |||||||||||||||
FFELP student loan asset-backed securities(2) | 4,169 | 18 | 8 | - | 4,179 | |||||||||||||||
|
|
|
|
|
|
|
|
|
| |||||||||||
Total corporate and other debt | 15,437 | 40 | 137 | - | 15,340 | |||||||||||||||
|
|
|
|
|
|
|
|
|
| |||||||||||
Total AFS debt securities | 69,322 | 159 | 276 | - | 69,205 | |||||||||||||||
|
|
|
|
|
|
|
|
|
| |||||||||||
AFS equity securities | 15 | - | 4 | - | 11 | |||||||||||||||
|
|
|
|
|
|
|
|
|
| |||||||||||
Total AFS securities | 69,337 | 159 | 280 | - | 69,216 | |||||||||||||||
HTM securities: | ||||||||||||||||||||
U.S. government securities: | ||||||||||||||||||||
U.S. Treasury securities | 100 | - | - | - | 100 | |||||||||||||||
|
|
|
|
|
|
|
|
|
| |||||||||||
Total HTM securities | 100 | - | - | - | 100 | |||||||||||||||
|
|
|
|
|
|
|
|
|
| |||||||||||
Total Investment securities | $ | 69,437 | $ | 159 | $ | 280 | $ | - | $ | 69,316 | ||||||||||
|
|
|
|
|
|
|
|
|
| |||||||||||
| (1) | U.S. agency securities are composed of three main categories consisting of agency-issued debt, agency mortgage pass-through pool securities and collateralized mortgage obligations. |
| (2) | FFELP-Federal Family Education Loan Program. Amounts are backed by a guarantee from the U.S. Department of Education of at least 95% of the principal balance and interest on such loans. |
| | 44 |
MORGAN STANLEY
NOTES TO CONDENSED CONSOLIDATED FINANCIAL STATEMENTS (Unaudited)-(Continued)
The following tables present the fair value of Investment securities that are in an unrealized loss position:
| At September 30, 2015 | ||||||||||||||||||||||||
| Less than 12 Months | 12 Months or Longer | Total | ||||||||||||||||||||||
| Fair Value | Gross Unrealized Losses | Fair Value | Gross Unrealized Losses | Fair Value | Gross Unrealized Losses | |||||||||||||||||||
| (dollars in millions) | ||||||||||||||||||||||||
AFS debt securities: | ||||||||||||||||||||||||
U.S. government and agency securities: | ||||||||||||||||||||||||
U.S. Treasury securities | $ | 1,926 | $ | 3 | $ | - | $ | - | $ | 1,926 | $ | 3 | ||||||||||||
U.S. agency securities | 8,137 | 31 | 1,943 | 37 | 10,080 | 68 | ||||||||||||||||||
|
|
|
|
|
|
|
|
|
|
|
| |||||||||||||
Total U.S. government and agency securities | 10,063 | 34 | 1,943 | 37 | 12,006 | 71 | ||||||||||||||||||
Corporate and other debt: | ||||||||||||||||||||||||
Commercial mortgage-backed securities: | ||||||||||||||||||||||||
Agency | 43 | - | 1,250 | 44 | 1,293 | 44 | ||||||||||||||||||
Non-agency | 634 | 6 | 475 | 6 | 1,109 | 12 | ||||||||||||||||||
Auto loan asset-backed securities | 782 | - | 309 | 1 | 1,091 | 1 | ||||||||||||||||||
Corporate bonds | 1,196 | 8 | 469 | 9 | 1,665 | 17 | ||||||||||||||||||
Collateralized loan obligations | - | - | 900 | 13 | 900 | 13 | ||||||||||||||||||
FFELP student loan asset-backed securities | 2,767 | 62 | 877 | 31 | 3,644 | 93 | ||||||||||||||||||
|
|
|
|
|
|
|
|
|
|
|
| |||||||||||||
Total corporate and other debt | 5,422 | 76 | 4,280 | 104 | 9,702 | 180 | ||||||||||||||||||
|
|
|
|
|
|
|
|
|
|
|
| |||||||||||||
Total AFS debt securities | 15,485 | 110 | 6,223 | 141 | 21,708 | 251 | ||||||||||||||||||
|
|
|
|
|
|
|
|
|
|
|
| |||||||||||||
AFS equity securities | 12 | 3 | - | - | 12 | 3 | ||||||||||||||||||
|
|
|
|
|
|
|
|
|
|
|
| |||||||||||||
Total AFS securities | 15,497 | 113 | 6,223 | 141 | 21,720 | 254 | ||||||||||||||||||
|
|
|
|
|
|
|
|
|
|
|
| |||||||||||||
HTM securities: | ||||||||||||||||||||||||
U.S. government and agency securities: | ||||||||||||||||||||||||
U.S. agency securities | 1,921 | 8 | - | - | 1,921 | 8 | ||||||||||||||||||
|
|
|
|
|
|
|
|
|
|
|
| |||||||||||||
Total HTM securities | 1,921 | 8 | - | - | 1,921 | 8 | ||||||||||||||||||
|
|
|
|
|
|
|
|
|
|
|
| |||||||||||||
Total Investment securities | $ | 17,418 | $ | 121 | $ | 6,223 | $ | 141 | $ | 23,641 | $ | 262 | ||||||||||||
|
|
|
|
|
|
|
|
|
|
|
| |||||||||||||
| 45 | |
MORGAN STANLEY
NOTES TO CONDENSED CONSOLIDATED FINANCIAL STATEMENTS (Unaudited)-(Continued)
| At December 31, 2014 | ||||||||||||||||||||||||
| Less than 12 Months | 12 Months or Longer | Total | ||||||||||||||||||||||
| Fair Value | Gross Unrealized Losses | Fair Value | Gross Unrealized Losses | Fair Value | Gross Unrealized Losses | |||||||||||||||||||
| (dollars in millions) | ||||||||||||||||||||||||
AFS debt securities: | ||||||||||||||||||||||||
U.S. government and agency securities: | ||||||||||||||||||||||||
U.S. Treasury securities | $ | 11,410 | $ | 14 | $ | 5,924 | $ | 53 | $ | 17,334 | $ | 67 | ||||||||||||
U.S. agency securities | 2,739 | 6 | 4,133 | 66 | 6,872 | 72 | ||||||||||||||||||
|
|
|
|
|
|
|
|
|
|
|
| |||||||||||||
Total U.S. government and agency securities | 14,149 | 20 | 10,057 | 119 | 24,206 | 139 | ||||||||||||||||||
Corporate and other debt: | ||||||||||||||||||||||||
Commercial mortgage-backed securities: | ||||||||||||||||||||||||
Agency | 42 | - | 1,822 | 76 | 1,864 | 76 | ||||||||||||||||||
Non-agency | 706 | 3 | 346 | 3 | 1,052 | 6 | ||||||||||||||||||
Auto loan asset-backed securities | 2,034 | 5 | - | - | 2,034 | 5 | ||||||||||||||||||
Corporate bonds | 905 | 6 | 1,299 | 16 | 2,204 | 22 | ||||||||||||||||||
Collateralized loan obligations | - | - | 1,067 | 20 | 1,067 | 20 | ||||||||||||||||||
FFELP student loan asset-backed securities | 1,523 | 6 | 393 | 2 | 1,916 | 8 | ||||||||||||||||||
|
|
|
|
|
|
|
|
|
|
|
| |||||||||||||
Total corporate and other debt | 5,210 | 20 | 4,927 | 117 | 10,137 | 137 | ||||||||||||||||||
|
|
|
|
|
|
|
|
|
|
|
| |||||||||||||
Total AFS debt securities | 19,359 | 40 | 14,984 | 236 | 34,343 | 276 | ||||||||||||||||||
|
|
|
|
|
|
|
|
|
|
|
| |||||||||||||
AFS equity securities | 11 | 4 | - | - | 11 | 4 | ||||||||||||||||||
|
|
|
|
|
|
|
|
|
|
|
| |||||||||||||
Total Investment securities | $ | 19,370 | $ | 44 | $ | 14,984 | $ | 236 | $ | 34,354 | $ | 280 | ||||||||||||
|
|
|
|
|
|
|
|
|
|
|
| |||||||||||||
As discussed in Note 2 to the Company's consolidated financial statements in the 2014 Form 10-K, AFS and HTM securities with a current fair value less than their amortized cost are analyzed as part of the Company's ongoing assessment of temporary versus other-than-temporarily impaired at the individual security level. The net unrealized losses on AFS debt securities reported in the table above are primarily due to higher interest rates since those securities were purchased. The risk of credit loss on securities in an unrealized loss position is considered minimal because all of the Company's agency securities as well as the Company's asset-backed securities, commercial mortgage-backed securities ("CMBS") and collateralized loan obligations ("CLOs") are highly rated and because the Company's corporate bonds are all investment grade. The Company does not intend to sell and is not likely to be required to sell its AFS debt securities prior to recovery of its amortized cost basis. The Company does not expect to experience a credit loss on its AFS debt securities or HTM securities based on consideration of the relevant information (as discussed in Note 2 to the Company's consolidated financial statements in the 2014 Form 10-K), including for U.S. government and agency securities, the existence of an explicit and implicit guarantee provided by the U.S. government. The Company believes that its AFS debt securities in an unrealized loss position were not other-than-temporarily impaired at September 30, 2015 and December 31, 2014.
For AFS equity securities in an unrealized loss position, the Company does not intend to sell these securities or expect to be required to sell these securities prior to the recovery of the cost basis and the Company believes that these securities were not other-than-temporarily impaired at September 30, 2015 and December 31, 2014.
| | 46 |
MORGAN STANLEY
NOTES TO CONDENSED CONSOLIDATED FINANCIAL STATEMENTS (Unaudited)-(Continued)
The following table presents the amortized cost, fair value and annualized average yield of Investment securities by contractual maturity dates at September 30, 2015:
| At September 30, 2015 | ||||||||||||
| Amortized Cost | Fair Value | Annualized Average Yield | ||||||||||
| (dollars in millions) | ||||||||||||
AFS debt securities: | ||||||||||||
U.S. government and agency securities: | ||||||||||||
U.S. Treasury securities: | ||||||||||||
After 1 year through 5 years | $ | 24,570 | $ | 24,683 | 1.1 | % | ||||||
After 5 years through 10 years | 148 | 151 | 2.1 | % | ||||||||
|
|
|
| |||||||||
Total | 24,718 | 24,834 | ||||||||||
|
|
|
| |||||||||
U.S. agency securities: | ||||||||||||
After 1 year through 5 years | 2,436 | 2,437 | 0.7 | % | ||||||||
After 5 years through 10 years | 2,087 | 2,103 | 1.6 | % | ||||||||
After 10 years | 16,477 | 16,482 | 1.8 | % | ||||||||
|
|
|
| |||||||||
Total | 21,000 | 21,022 | ||||||||||
|
|
|
| |||||||||
Total U.S. government and agency securities | 45,718 | 45,856 | 1.3 | % | ||||||||
|
|
|
| |||||||||
Corporate and other debt: | ||||||||||||
Commercial mortgage-backed securities: | ||||||||||||
Agency: | ||||||||||||
Due within 1 year | 2 | 2 | 0.5 | % | ||||||||
After 1 year through 5 years | 673 | 675 | 0.9 | % | ||||||||
After 5 years through 10 years | 218 | 217 | 1.5 | % | ||||||||
After 10 years | 1,103 | 1,062 | 1.5 | % | ||||||||
|
|
|
| |||||||||
Total | 1,996 | 1,956 | ||||||||||
|
|
|
| |||||||||
Non-agency: | ||||||||||||
After 10 years | 2,174 | 2,178 | 1.8 | % | ||||||||
|
|
|
| |||||||||
Total | 2,174 | 2,178 | ||||||||||
|
|
|
| |||||||||
Auto loan asset-backed securities: | ||||||||||||
Due within 1 year | 11 | 11 | 0.7 | % | ||||||||
After 1 year through 5 years | 2,315 | 2,316 | 1.1 | % | ||||||||
After 5 years through 10 years | 353 | 354 | 1.5 | % | ||||||||
|
|
|
| |||||||||
Total | 2,679 | 2,681 | ||||||||||
|
|
|
| |||||||||
Corporate bonds: | ||||||||||||
Due within 1 year | 458 | 459 | 1.0 | % | ||||||||
After 1 year through 5 years | 2,694 | 2,688 | 1.6 | % | ||||||||
After 5 years through 10 years | 714 | 716 | 2.7 | % | ||||||||
|
|
|
| |||||||||
Total | 3,866 | 3,863 | ||||||||||
|
|
|
| |||||||||
| 47 | |
MORGAN STANLEY
NOTES TO CONDENSED CONSOLIDATED FINANCIAL STATEMENTS (Unaudited)-(Continued)
| At September 30, 2015 | ||||||||||||
| Amortized Cost | Fair Value | Annualized Average Yield | ||||||||||
| (dollars in millions) | ||||||||||||
Collateralized loan obligations: | ||||||||||||
After 5 years through 10 years | $ | 912 | $ | 899 | 1.4 | % | ||||||
|
|
|
| |||||||||
Total | 912 | 899 | ||||||||||
|
|
|
| |||||||||
FFELP student loan asset-backed securities: | ||||||||||||
After 1 year through 5 years | 87 | 87 | 0.7 | % | ||||||||
After 5 years through 10 years | 697 | 687 | 0.9 | % | ||||||||
After 10 years | 3,023 | 2,940 | 0.9 | % | ||||||||
|
|
|
| |||||||||
Total | 3,807 | 3,714 | ||||||||||
|
|
|
| |||||||||
Total corporate and other debt | 15,434 | 15,291 | 1.6 | % | ||||||||
|
|
|
| |||||||||
Total AFS debt securities | 61,152 | 61,147 | 1.3 | % | ||||||||
|
|
|
| |||||||||
AFS equity securities | 15 | 12 | - | % | ||||||||
|
|
|
| |||||||||
Total AFS securities | 61,167 | 61,159 | 1.3 | % | ||||||||
|
|
|
| |||||||||
HTM securities: | ||||||||||||
U.S. government securities: | ||||||||||||
U.S. Treasury securities: | ||||||||||||
After 1 year through 5 years | 1,002 | 1,007 | 1.0 | % | ||||||||
|
|
|
| |||||||||
Total | 1,002 | 1,007 | ||||||||||
|
|
|
| |||||||||
U.S. agency securities: | ||||||||||||
After 10 years | 2,528 | 2,521 | 2.4 | % | ||||||||
|
|
|
| |||||||||
Total | 2,528 | 2,521 | ||||||||||
|
|
|
| |||||||||
Total HTM securities | 3,530 | 3,528 | 2.0 | % | ||||||||
|
|
|
| |||||||||
Total Investment securities | $ | 64,697 | $ | 64,687 | 1.4 | % | ||||||
|
|
|
| |||||||||
See Note 12 for additional information on securities issued by VIEs, including U.S. agency mortgage-backed securities, non-agency CMBS, auto loan asset-backed securities, CLO and FFELP student loan asset-backed securities.
The following table presents information pertaining to gross realized gains and losses on sales of AFS securities within the Company's Investment securities portfolio during the quarters and nine months ended September 30, 2015 and 2014:
| Three Months Ended | Nine Months Ended | |||||||||||||||
| September 30, | September 30, | |||||||||||||||
| 2015 | 2014 | 2015 | 2014 | |||||||||||||
| (dollars in millions) | ||||||||||||||||
Gross realized gains | $ | 22 | $ | 20 | $ | 91 | $ | 37 | ||||||||
Gross realized (losses) | (4 | ) | - | (17 | ) | (1 | ) | |||||||||
|
|
|
|
|
|
|
| |||||||||
Total | $ | 18 | $ | 20 | $ | 74 | $ | 36 | ||||||||
|
|
|
|
|
|
|
| |||||||||
Gross realized gains and losses are recognized in Other revenues in the Company's condensed consolidated statements of income.
| | 48 |
MORGAN STANLEY
NOTES TO CONDENSED CONSOLIDATED FINANCIAL STATEMENTS (Unaudited)-(Continued)
| 6. | Collateralized Transactions. |
The Company enters into reverse repurchase agreements, repurchase agreements, securities borrowed and securities loaned transactions to, among other things, acquire securities to cover short positions and settle other securities obligations, to accommodate customers' needs and to finance the Company's inventory positions.
The Company manages credit exposure arising from such transactions by, in appropriate circumstances, entering into master netting agreements and collateral agreements with counterparties that provide the Company, in the event of a counterparty default (such as bankruptcy or a counterparty's failure to pay or perform), with the right to net a counterparty's rights and obligations under such agreement and liquidate and set off collateral held by the Company against the net amount owed by the counterparty.
The Company's policy is generally to take possession of securities purchased under agreements to resell and securities borrowed, and to receive securities and cash posted as collateral (with rights of rehypothecation). In certain cases, the Company may agree for such collateral to be posted to a third-party custodian under a tri-party arrangement that enables the Company to take control of such collateral in the event of a counterparty default. The Company also monitors the fair value of the underlying securities as compared with the related receivable or payable, including accrued interest, and, as necessary, requests additional collateral as provided under the applicable agreement to ensure such transactions are adequately collateralized. The risk related to a decline in the market value of collateral (pledged or received) is managed by setting appropriate market-based haircuts. Increases in collateral margin calls on secured financing due to market value declines may be mitigated by increases in collateral margin calls on reverse repurchase agreements and securities borrowed transactions with similar quality collateral. Additionally, the Company may request lower quality collateral pledged be replaced with higher quality collateral through collateral substitution rights in the underlying agreements.
The Company actively manages its secured financing in a manner that reduces the potential refinancing risk of secured financing for less liquid assets. The Company considers the quality of collateral when negotiating collateral eligibility with counterparties, as defined by the Company's fundability criteria. The Company utilizes shorter-term secured financing for highly liquid assets and has established longer tenor limits for less liquid assets, for which funding may be at risk in the event of a market disruption.
Offsetting of Certain Collateralized Transactions.
The following tables present information about the offsetting of these instruments and related collateral amounts. For information related to offsetting of derivatives, see Note 4.
| At September 30, 2015 | ||||||||||||||||||||
| Gross Amounts(1) | Amounts Offset in the Condensed Consolidated Statements of Financial Condition | Net Amounts Presented in the Condensed Consolidated Statements of Financial Condition | Financial Instruments Not Offset in the Condensed Consolidated Statements of Financial Condition(2) | Net Exposure | ||||||||||||||||
| (dollars in millions) | ||||||||||||||||||||
Assets | ||||||||||||||||||||
Securities purchased under agreements to resell | $ | 185,825 | $ | (58,619 | ) | $ | 127,206 | $ | (122,156 | ) | $ | 5,050 | ||||||||
Securities borrowed | 157,456 | (9,211 | ) | 148,245 | (141,809 | ) | 6,436 | |||||||||||||
Liabilities | ||||||||||||||||||||
Securities sold under agreements to repurchase | $ | 117,189 | $ | (58,619 | ) | $ | 58,570 | $ | (48,777 | ) | $ | 9,793 | ||||||||
Securities loaned | 29,855 | (9,211 | ) | 20,644 | (20,183 | ) | 461 | |||||||||||||
| 49 | |
MORGAN STANLEY
NOTES TO CONDENSED CONSOLIDATED FINANCIAL STATEMENTS (Unaudited)-(Continued)
| At December 31, 2014 | ||||||||||||||||||||
| Gross Amounts(3) | Amounts Offset in the Condensed Consolidated Statements of Financial Condition | Net Amounts Presented in the Condensed Consolidated Statements of Financial Condition | Financial Instruments Not Offset in the Condensed Consolidated Statements of Financial Condition(2) | Net Exposure | ||||||||||||||||
| (dollars in millions) | ||||||||||||||||||||
Assets | ||||||||||||||||||||
Securities purchased under agreements to resell | $ | 148,234 | $ | (64,946 | ) | $ | 83,288 | $ | (79,343 | ) | $ | 3,945 | ||||||||
Securities borrowed | 145,556 | (8,848 | ) | 136,708 | (128,282 | ) | 8,426 | |||||||||||||
Liabilities | ||||||||||||||||||||
Securities sold under agreements to repurchase | $ | 134,895 | $ | (64,946 | ) | $ | 69,949 | $ | (56,454 | ) | $ | 13,495 | ||||||||
Securities loaned | 34,067 | (8,848 | ) | 25,219 | (24,252 | ) | 967 | |||||||||||||
| (1) | Amounts include $4.9 billion of Securities purchased under agreements to resell, $3.5 billion of Securities borrowed, $9.7 billion of Securities sold under agreements to repurchase and $0.4 billion of Securities loaned, which are either not subject to master netting agreements or are subject to such agreements but the Company has not determined the agreements to be legally enforceable. |
| (2) | Amounts relate to master netting agreements, which have been determined by the Company to be legally enforceable in the event of default but where certain other criteria are not met in accordance with applicable offsetting accounting guidance. |
| (3) | Amounts include $3.9 billion of Securities purchased under agreements to resell, $4.2 billion of Securities borrowed, $15.6 billion of Securities sold under agreements to repurchase and $0.7 billion of Securities loaned, which are either not subject to master netting agreements or are subject to such agreements but the Company has not determined the agreements to be legally enforceable. |
Secured Financing Transactions-Maturities and Collateral Pledged.
The following tables present gross obligations for repurchase agreements, securities loaned transactions and obligations to return securities received as collateral by remaining contractual maturity and class of collateral pledged.
| At September 30, 2015 | ||||||||||||||||||||
| Remaining Contractual Maturity | ||||||||||||||||||||
| Overnight and Open | Less than 30 days | 30-90 days | Over 90 days | Total | ||||||||||||||||
| (dollars in millions) | ||||||||||||||||||||
Securities sold under agreements to repurchase(1) | $ | 46,165 | $ | 21,392 | $ | 12,312 | $ | 37,320 | $ | 117,189 | ||||||||||
Securities loaned(1) | 16,224 | 2,026 | 2,103 | 9,502 | 29,855 | |||||||||||||||
|
|
|
|
|
|
|
|
|
| |||||||||||
Gross amount of secured financing included in the above offsetting disclosure | $ | 62,389 | $ | 23,418 | $ | 14,415 | $ | 46,822 | $ | 147,044 | ||||||||||
Obligation to return securities received as collateral | 20,328 | - | - | - | 20,328 | |||||||||||||||
|
|
|
|
|
|
|
|
|
| |||||||||||
Total | $ | 82,717 | $ | 23,418 | $ | 14,415 | $ | 46,822 | $ | 167,372 | ||||||||||
|
|
|
|
|
|
|
|
|
| |||||||||||
| | 50 |
MORGAN STANLEY
NOTES TO CONDENSED CONSOLIDATED FINANCIAL STATEMENTS (Unaudited)-(Continued)
Secured Financing by the Class of Collateral Pledged | At September 30, 2015 | |||
| (dollars in millions) | ||||
Securities sold under agreements to repurchase(1) |
| |||
U.S. government and agency securities | $ | 65,438 | ||
State and municipal securities | 51 | |||
Other sovereign government obligations | 35,608 | |||
Asset-backed securities | 776 | |||
Corporate and other debt | 4,426 | |||
Corporate equities | 10,587 | |||
Other | 303 | |||
|
| |||
Total securities sold under agreements to repurchase | $ | 117,189 | ||
|
| |||
Securities loaned(1) | ||||
Other sovereign government obligations | $ | 9,356 | ||
Corporate and other debt | 176 | |||
Corporate equities | 20,312 | |||
Other | 11 | |||
|
| |||
Total securities loaned | $ | 29,855 | ||
|
| |||
Gross amount of secured financing included in the above offsetting disclosure | $ | 147,044 | ||
|
| |||
Obligation to return securities received as collateral | ||||
Corporate equities | $ | 20,328 | ||
|
| |||
Total obligation to return securities received as collateral | $ | 20,328 | ||
|
| |||
Total | $ | 167,372 | ||
|
| |||
| (1) | Amounts presented on a gross basis, prior to netting as shown on the Company's condensed consolidated statements of financial condition. |
Trading Assets Pledged.
The Company pledges its trading assets to collateralize repurchase agreements and other secured financings. Pledged financial instruments that can be sold or repledged by the secured party are identified as Trading assets (pledged to various parties) in the Company's condensed consolidated statements of financial condition. At September 30, 2015 and December 31, 2014, the carrying value of Trading assets by the Company that have been loaned or pledged to counterparties where those counterparties do not have the right to sell or repledge the collateral were $43.1 billion and $31.3 billion, respectively.
Collateral Received.
The Company receives collateral in the form of securities in connection with reverse repurchase agreements, securities borrowed and derivative transactions, customer margin loans and securities-based lending. In many cases, the Company is permitted to sell or repledge these securities held as collateral and use the securities to secure repurchase agreements, to enter into securities lending and derivative transactions or for delivery to counterparties to cover short positions. The Company additionally receives securities as collateral in connection with certain securities-for-securities transactions in which the Company is the lender. In instances where the Company is permitted to sell or repledge these securities, the Company reports the fair value of the collateral received and the related obligation to return the collateral in its condensed consolidated statements of financial condition. At September 30, 2015 and December 31, 2014, the total fair value of financial instruments received as collateral where the Company is permitted to sell or repledge the securities was $593 billion and $546 billion, respectively, and the fair value of the portion that had been sold or repledged was $438 billion and $403 billion, respectively.
| 51 | |
MORGAN STANLEY
NOTES TO CONDENSED CONSOLIDATED FINANCIAL STATEMENTS (Unaudited)-(Continued)
Other.
The Company also engages in margin lending to clients that allows the client to borrow against the value of qualifying securities and is included within Customer and other receivables in the Company's condensed consolidated statements of financial condition. For a further discussion of the Company's margin lending activities, see Note 6 to the consolidated financial statements in the 2014 Form 10-K. At September 30, 2015 and December 31, 2014, there were approximately $25.7 billion and $29.0 billion, respectively, of customer margin loans outstanding.
Other secured financings include the liabilities related to transfers of financial assets that are accounted for as financings rather than sales, consolidated VIEs where the Company is deemed to be the primary beneficiary, and certain equity-linked notes and other secured borrowings. These liabilities are generally payable from the cash flows of the related assets accounted for as Trading assets (see Notes 10 and 12).
At September 30, 2015 and December 31, 2014, cash and securities deposited with clearing organizations or segregated under federal and other regulations or requirements were as follows:
| At September 30, 2015 | At December 31, 2014 | |||||||
| (dollars in millions) | ||||||||
Cash deposited with clearing organizations or segregated under federal and other regulations or requirements(1) | $ | 35,552 | $ | 40,607 | ||||
Securities(2) | 16,946 | 14,630 | ||||||
|
|
|
| |||||
Total | $ | 52,498 | $ | 55,237 | ||||
|
|
|
| |||||
| (1) | In June 2015, the Company made amendments to certain arrangements by which it acts in the capacity of a clearing member to clear derivatives on behalf of customers. These amendments resulted in approximately $3.8 billion related to cash initial margin received from customers and remitted to clearing organizations or third-party custodian banks no longer qualifying for recognition in the Company's condensed consolidated statements of financial condition. |
| (2) | Securities deposited with clearing organizations or segregated under federal and other regulations or requirements are sourced from Securities purchased under agreements to resell and Trading assets in the Company's condensed consolidated statements of financial condition. |
| 7. | Loans and Allowance for Credit Losses. |
Loans.
The Company's loans held for investment are recorded at amortized cost, and its loans held for sale are recorded at lower of cost or fair value in the Company's condensed consolidated statements of financial condition.
| | 52 |
MORGAN STANLEY
NOTES TO CONDENSED CONSOLIDATED FINANCIAL STATEMENTS (Unaudited)-(Continued)
The Company's outstanding loans at September 30, 2015 and December 31, 2014 included the following:
| At September 30, 2015 | At December 31, 2014 | |||||||||||||||||||||||
Loans by Product Type | Loans Held for Investment | Loans Held for Sale | Total Loans(1)(2) | Loans Held for Investment | Loans Held for Sale | Total Loans(1)(2) | ||||||||||||||||||
| (dollars in millions) | ||||||||||||||||||||||||
Corporate loans | $ | 22,519 | $ | 8,509 | $ | 31,028 | $ | 19,659 | $ | 8,200 | $ | 27,859 | ||||||||||||
Consumer loans | 20,447 | - | 20,447 | 16,576 | - | 16,576 | ||||||||||||||||||
Residential real estate loans | 19,640 | 121 | 19,761 | 15,735 | 114 | 15,849 | ||||||||||||||||||
Wholesale real estate loans | 6,577 | 569 | 7,146 | 5,298 | 1,144 | 6,442 | ||||||||||||||||||
|
|
|
|
|
|
|
|
|
|
|
| |||||||||||||
Total loans, gross of allowance for loan losses | 69,183 | 9,199 | 78,382 | 57,268 | 9,458 | 66,726 | ||||||||||||||||||
Allowance for loan losses | (173 | ) | - | (173 | ) | (149 | ) | - | (149 | ) | ||||||||||||||
|
|
|
|
|
|
|
|
|
|
|
| |||||||||||||
Total loans, net of allowance for loan losses | $ | 69,010 | $ | 9,199 | $ | 78,209 | $ | 57,119 | $ | 9,458 | $ | 66,577 | ||||||||||||
|
|
|
|
|
|
|
|
|
|
|
| |||||||||||||
| (1) | Amounts include loans that are made to non-U.S. borrowers of $7,455 million and $7,017 million at September 30, 2015 and December 31, 2014, respectively. |
| (2) | Loans at fixed interest rates and floating or adjustable interest rates were $7,280 million and $70,929 million, respectively, at September 30, 2015 and $6,663 million and $59,914 million, respectively, at December 31, 2014 |
The above table does not include Loans and lending commitments held at fair value of $11,334 million and $11,962 million that were recorded as Trading assets in the Company's condensed consolidated statement of financial condition at September 30, 2015 and December 31, 2014, respectively. At September 30, 2015, Loans and lending commitments held at fair value consisted of $6,762 million of corporate loans, $1,933 million of residential real estate loans and $2,639 million of wholesale real estate loans. At December 31, 2014, Loans and lending commitments held at fair value consisted of $7,093 million of corporate loans, $1,682 million of residential real estate loans and $3,187 million of wholesale real estate loans. See Note 3 for further information regarding Loans and lending commitments held at fair value.
Credit Quality.
For a discussion about the Company's evaluation of credit transactions and monitoring, see Note 8 to the Company's consolidated financial statements in the 2014 Form 10-K.
The Company utilizes the following credit quality indicators which are consistent with U.S. banking regulators' definitions of criticized exposures, in its credit monitoring process for loans held for investment.
| • | Pass . A credit exposure rated pass has a continued expectation of timely repayment, all obligations of the borrower are current, and the obligor complies with material terms and conditions of the lending agreement. |
| • | Special Mention . Extensions of credit that have potential weakness that deserve management's close attention, and if left uncorrected may, at some future date, result in the deterioration of the repayment prospects or collateral position. |
| • | Substandard . Obligor has a well-defined weakness that jeopardizes the repayment of the debt and has a high probability of payment default with the distinct possibility that the Company will sustain some loss if noted deficiencies are not corrected. |
| 53 | |
MORGAN STANLEY
NOTES TO CONDENSED CONSOLIDATED FINANCIAL STATEMENTS (Unaudited)-(Continued)
| • | Doubtful . Inherent weakness in the exposure makes the collection or repayment in full, based on existing facts, conditions and circumstances, highly improbable, and the amount of loss is uncertain. |
| • | Loss . Extensions of credit classified as loss are considered uncollectible and are charged off. |
Loans considered as doubtful or loss are considered impaired. Substandard loans are regularly reviewed for impairment. When a loan is impaired the impairment is measured based on the present value of expected future cash flows discounted at the loan's effective interest rate or as a practical expedient the observable market price of the loan or the fair value of the collateral if the loan is collateral dependent. For further information, see Note 2 to the Company's consolidated financial statements in the 2014 Form 10-K.
The following tables present credit quality indicators for the Company's loans held for investment, gross of allowance for loan losses, by product type.
| At September 30, 2015 | ||||||||||||||||||||
Loans by Credit Quality Indicators | Corporate | Consumer | Residential Real Estate | Wholesale Real Estate | Total | |||||||||||||||
| (dollars in millions) | ||||||||||||||||||||
Pass | $ | 21,265 | $ | 20,447 | $ | 19,596 | $ | 6,577 | $ | 67,885 | ||||||||||
Special mention | 786 | - | - | - | 786 | |||||||||||||||
Substandard | 447 | - | 44 | - | 491 | |||||||||||||||
Doubtful | 21 | - | - | - | 21 | |||||||||||||||
|
|
|
|
|
|
|
|
|
| |||||||||||
Total loans | $ | 22,519 | $ | 20,447 | $ | 19,640 | $ | 6,577 | $ | 69,183 | ||||||||||
|
|
|
|
|
|
|
|
|
| |||||||||||
| At December 31, 2014 | ||||||||||||||||||||
Loans by Credit Quality Indicators | Corporate | Consumer | Residential Real Estate | Wholesale Real Estate | Total | |||||||||||||||
| (dollars in millions) | ||||||||||||||||||||
Pass | $ | 17,847 | $ | 16,576 | $ | 15,688 | $ | 5,298 | $ | 55,409 | ||||||||||
Special mention | 1,683 | - | - | - | 1,683 | |||||||||||||||
Substandard | 127 | - | 47 | - | 174 | |||||||||||||||
Doubtful | 2 | - | - | - | 2 | |||||||||||||||
|
|
|
|
|
|
|
|
|
| |||||||||||
Total loans | $ | 19,659 | $ | 16,576 | $ | 15,735 | $ | 5,298 | $ | 57,268 | ||||||||||
|
|
|
|
|
|
|
|
|
| |||||||||||
Allowance for Credit Losses and Impaired Loans.
For factors considered by the Company in determining the allowance for loan losses and impairments, see Notes 2 and 8 to the Company's consolidated financial statements in the 2014 Form 10-K.
The tables below provide details on impaired and past due loans for the Company's loans held for investment.
| At September 30, 2015 | At December 31, 2014 | |||||||||||||||||||||||
Loans by Product Type | Corporate | Residential Real Estate | Total | Corporate | Residential Real Estate | Total | ||||||||||||||||||
| (dollars in millions) | ||||||||||||||||||||||||
Impaired loans with allowance | $ | 17 | $ | - | $ | 17 | $ | - | $ | - | $ | - | ||||||||||||
Impaired loans without allowance(1) | 76 | 25 | 101 | 2 | 17 | 19 | ||||||||||||||||||
Impaired loans unpaid principal balance | 93 | 25 | 118 | 2 | 17 | 19 | ||||||||||||||||||
Past due 90 days loans and on nonaccrual | 53 | 28 | 81 | 2 | 25 | 27 | ||||||||||||||||||
| (1) | At September 30, 2015 and December 31, 2014, no allowance was outstanding for these loans as the present value of the expected future cash flows (or alternatively, the observable market price of the loan or the fair value of the collateral held) exceeded or equaled the carrying value. |
| | 54 |
MORGAN STANLEY
NOTES TO CONDENSED CONSOLIDATED FINANCIAL STATEMENTS (Unaudited)-(Continued)
| At September 30, 2015 | At December 31, 2014 | |||||||||||||||||||||||||||||||
Loans by Region | Americas | EMEA | Asia-Pacific | Total | Americas | EMEA | Asia-Pacific | Total | ||||||||||||||||||||||||
| (dollars in millions) | ||||||||||||||||||||||||||||||||
Impaired loans | $ | 101 | $ | 17 | $ | - | $ | 118 | $ | 19 | $ | - | $ | - | $ | 19 | ||||||||||||||||
Past due 90 days loans and on nonaccrual | 81 | - | - | 81 | 27 | - | - | 27 | ||||||||||||||||||||||||
Allowance for loan losses | 140 | 28 | 5 | 173 | 121 | 20 | 8 | 149 | ||||||||||||||||||||||||
EMEA-Europe, Middle East and Africa.
The table below summarizes information about the allowance for loan losses, loans by impairment methodology, the allowance for lending commitments and lending commitments by impairment methodology.
| Corporate | Consumer | Residential Real Estate | Wholesale Real Estate | Total | ||||||||||||||||
| (dollars in millions) | ||||||||||||||||||||
Allowance for loan losses: | ||||||||||||||||||||
Balance at December 31, 2014 | $ | 118 | $ | 2 | $ | 8 | $ | 21 | $ | 149 | ||||||||||
Gross charge-offs | - | - | (1 | ) | - | (1 | ) | |||||||||||||
Gross recoveries | 1 | - | - | - | 1 | |||||||||||||||
|
|
|
|
|
|
|
|
|
| |||||||||||
Net recoveries/(charge-offs) | 1 | - | (1 | ) | - | - | ||||||||||||||
|
|
|
|
|
|
|
|
|
| |||||||||||
Provision for loan losses(1) | 31 | - | 3 | 1 | 35 | |||||||||||||||
Other(2) | (11 | ) | - | - | - | (11 | ) | |||||||||||||
|
|
|
|
|
|
|
|
|
| |||||||||||
Balance at September 30, 2015 | $ | 139 | $ | 2 | $ | 10 | $ | 22 | $ | 173 | ||||||||||
|
|
|
|
|
|
|
|
|
| |||||||||||
Allowance for loan losses by impairment methodology: | ||||||||||||||||||||
Inherent | $ | 134 | $ | 2 | $ | 10 | $ | 22 | $ | 168 | ||||||||||
Specific | 5 | - | - | - | 5 | |||||||||||||||
|
|
|
|
|
|
|
|
|
| |||||||||||
Total allowance for loan losses at September 30, 2015 | $ | 139 | $ | 2 | $ | 10 | $ | 22 | $ | 173 | ||||||||||
|
|
|
|
|
|
|
|
|
| |||||||||||
Loans evaluated by impairment methodology(3): | ||||||||||||||||||||
Inherent | $ | 22,426 | $ | 20,447 | $ | 19,615 | $ | 6,577 | $ | 69,065 | ||||||||||
Specific | 93 | - | 25 | - | 118 | |||||||||||||||
|
|
|
|
|
|
|
|
|
| |||||||||||
Total loans evaluated at September 30, 2015 | $ | 22,519 | $ | 20,447 | $ | 19,640 | $ | 6,577 | $ | 69,183 | ||||||||||
|
|
|
|
|
|
|
|
|
| |||||||||||
Allowance for lending commitments: | ||||||||||||||||||||
Balance at December 31, 2014 | $ | 147 | $ | - | $ | - | $ | 2 | $ | 149 | ||||||||||
Provision for lending commitments(4) | 11 | - | - | 1 | 12 | |||||||||||||||
|
|
|
|
|
|
|
|
|
| |||||||||||
Balance at September 30, 2015 | $ | 158 | $ | - | $ | - | $ | 3 | $ | 161 | ||||||||||
|
|
|
|
|
|
|
|
|
| |||||||||||
Allowance for lending commitments by impairment methodology: | ||||||||||||||||||||
Inherent | $ | 158 | $ | - | $ | - | $ | 3 | $ | 161 | ||||||||||
Specific | - | - | - | - | - | |||||||||||||||
|
|
|
|
|
|
|
|
|
| |||||||||||
Total allowance for lending commitments at September 30, 2015 | $ | 158 | $ | - | $ | - | $ | 3 | $ | 161 | ||||||||||
|
|
|
|
|
|
|
|
|
| |||||||||||
Lending commitments evaluated by impairment methodology(3): | ||||||||||||||||||||
Inherent | $ | 65,627 | $ | 4,587 | $ | 310 | $ | 446 | $ | 70,970 | ||||||||||
Specific | 128 | - | - | - | 128 | |||||||||||||||
|
|
|
|
|
|
|
|
|
| |||||||||||
Total lending commitments evaluated at September 30, 2015 | $ | 65,755 | $ | 4,587 | $ | 310 | $ | 446 | $ | 71,098 | ||||||||||
|
|
|
|
|
|
|
|
|
| |||||||||||
| 55 | |
MORGAN STANLEY
NOTES TO CONDENSED CONSOLIDATED FINANCIAL STATEMENTS (Unaudited)-(Continued)
| Corporate | Consumer | Residential Real Estate | Wholesale Real Estate | Total | ||||||||||||||||
| (dollars in millions) | ||||||||||||||||||||
Allowance for loan losses: | ||||||||||||||||||||
Balance at December 31, 2013 | $ | 137 | $ | 1 | $ | 4 | $ | 14 | $ | 156 | ||||||||||
Gross charge-offs | - | - | - | (3 | ) | (3 | ) | |||||||||||||
Gross recoveries | - | - | - | 1 | 1 | |||||||||||||||
|
|
|
|
|
|
|
|
|
| |||||||||||
Net charge-offs | - | - | - | (2 | ) | (2 | ) | |||||||||||||
|
|
|
|
|
|
|
|
|
| |||||||||||
Provision (release) for loan losses(1) | (20 | ) | 1 | 3 | 3 | (13 | ) | |||||||||||||
|
|
|
|
|
|
|
|
|
| |||||||||||
Balance at September 30, 2014 | $ | 117 | $ | 2 | $ | 7 | $ | 15 | $ | 141 | ||||||||||
|
|
|
|
|
|
|
|
|
| |||||||||||
Allowance for loan losses by impairment methodology: | ||||||||||||||||||||
Inherent | $ | 115 | $ | 2 | $ | 7 | $ | 15 | $ | 139 | ||||||||||
Specific | 2 | - | - | - | 2 | |||||||||||||||
|
|
|
|
|
|
|
|
|
| |||||||||||
Total allowance for loan losses at September 30, 2014 | $ | 117 | $ | 2 | $ | 7 | $ | 15 | $ | 141 | ||||||||||
|
|
|
|
|
|
|
|
|
| |||||||||||
Loans evaluated by impairment methodology(3): | ||||||||||||||||||||
Inherent | $ | 18,575 | $ | 15,389 | $ | 14,169 | $ | 3,430 | $ | 51,563 | ||||||||||
Specific | 14 | - | 29 | - | 43 | |||||||||||||||
|
|
|
|
|
|
|
|
|
| |||||||||||
Total loan evaluated at September 30, 2014 | $ | 18,589 | $ | 15,389 | $ | 14,198 | $ | 3,430 | $ | 51,606 | ||||||||||
|
|
|
|
|
|
|
|
|
| |||||||||||
Allowance for lending commitments: | ||||||||||||||||||||
Balance at December 31, 2013 | $ | 125 | $ | - | $ | - | $ | 2 | $ | 127 | ||||||||||
Provision for lending commitments(4) | 14 | - | - | - | 14 | |||||||||||||||
|
|
|
|
|
|
|
|
|
| |||||||||||
Balance at September 30, 2014 | $ | 139 | $ | - | $ | - | $ | 2 | $ | 141 | ||||||||||
|
|
|
|
|
|
|
|
|
| |||||||||||
Allowance for lending commitments by impairment methodology: | ||||||||||||||||||||
Inherent | $ | 139 | $ | - | $ | - | $ | 2 | $ | 141 | ||||||||||
Specific | - | - | - | - | - | |||||||||||||||
|
|
|
|
|
|
|
|
|
| |||||||||||
Total allowance for lending commitments at September 30, 2014 | $ | 139 | $ | - | $ | - | $ | 2 | $ | 141 | ||||||||||
|
|
|
|
|
|
|
|
|
| |||||||||||
Lending commitments evaluated by impairment methodology(3): | ||||||||||||||||||||
Inherent | $ | 63,702 | $ | 4,354 | $ | 269 | $ | 288 | $ | 68,613 | ||||||||||
Specific | 53 | - | - | - | 53 | |||||||||||||||
|
|
|
|
|
|
|
|
|
| |||||||||||
Total lending commitments evaluated at September 30, 2014 | $ | 63,755 | $ | 4,354 | $ | 269 | $ | 288 | $ | 68,666 | ||||||||||
|
|
|
|
|
|
|
|
|
| |||||||||||
| (1) | The Company recorded provisions of $5 million and $2 million for loan losses within Other revenues for the quarters ended September 30, 2015 and 2014, respectively. |
| (2) | Amount includes the impact related to the transfer to loans held for sale and foreign currency translation adjustments. |
| (3) | Loan balances are gross of the allowance for loan losses and lending commitments are gross of credit losses. |
| (4) | The Company recorded a provision of $4 million and a release of $16 million for lending commitments within Other non-interest expenses for the quarters ended September 30, 2015 and 2014, respectively. |
| | 56 |
MORGAN STANLEY
NOTES TO CONDENSED CONSOLIDATED FINANCIAL STATEMENTS (Unaudited)-(Continued)
Employee Loans.
Employee loans are granted primarily in conjunction with a program established in the Company's Wealth Management business segment to retain and recruit certain employees. These loans are recorded in Customer and other receivables in the Company's condensed consolidated statements of financial condition. These loans are full recourse, generally require periodic payments and have repayment terms ranging from one to twelve years. The Company establishes an allowance for loan amounts it does not consider recoverable, which is recorded in Compensation and benefits expense. At September 30, 2015, the Company had $4,887 million of employee loans, net of an allowance of approximately $121 million. At December 31, 2014, the Company had $5,130 million of employee loans, net of an allowance of approximately $116 million.
| 8. | Equity Method Investments. |
Equity Method Investments.
The Company has investments accounted for under the equity method of accounting (see Note 1 to the consolidated financial statements in the 2014 Form 10-K) of $3,244 million and $3,332 million at September 30, 2015 and December 31, 2014, respectively, included in Other investments in the Company's condensed consolidated statements of financial condition. Income from equity method investments was $35 million and $32 million for the quarters ended September 30, 2015 and 2014, respectively, and $118 million and $108 million for the nine months ended September 30, 2015 and 2014, respectively, and is included in Other revenues in the Company's condensed consolidated statements of income. Income from the Company's equity method investments for the quarters and nine months ended September 30, 2015 and 2014 was primarily related to the Company's 40% stake in Mitsubishi UFJ Morgan Stanley Securities Co., Ltd. ("MUMSS"), as described below.
Japanese Securities Joint Venture.
The Company holds a 40% voting interest and Mitsubishi UFJ Financial Group, Inc. holds a 60% voting interest in MUMSS. The Company accounts for its interest in MUMSS as an equity method investment within the Company's Institutional Securities business segment. During the quarters ended September 30, 2015 and 2014, the Company recorded income of $54 million and $55 million, respectively, and income of $194 million and $146 million in the nine months ended September 30, 2015 and 2014, respectively, within Other revenues in the Company's condensed consolidated statements of income, arising from the Company's 40% stake in MUMSS.
In June 2015 and 2014, MUMSS paid a dividend of approximately $291 million and $594 million, respectively, of which the Company received approximately $116 million and $238 million, respectively, for its proportionate share of MUMSS.
| 9. | Deposits. |
The Company's deposits, which were primarily in the U.S., were as follows:
| At September 30, 2015(1) | At December 31, 2014(1) | |||||||
| (dollars in millions) | ||||||||
Savings and demand deposits | $ | 143,543 | $ | 132,159 | ||||
Time deposits | 3,683 | 1,385 | ||||||
|
|
|
| |||||
Total | $ | 147,226 | $ | 133,544 | ||||
|
|
|
| |||||
| (1) | Total deposits subject to the Federal Deposit Insurance Corporation (the "FDIC") insurance at September 30, 2015 and December 31, 2014 were $107 billion and $99 billion, respectively. |
| 57 | |
MORGAN STANLEY
NOTES TO CONDENSED CONSOLIDATED FINANCIAL STATEMENTS (Unaudited)-(Continued)
Interest-bearing deposits at September 30, 2015 included $143,528 million of saving deposits payable upon demand, and $2,437 million of time deposits maturing in 2015, $1,053 million of time deposits maturing in 2016, $180 million of time deposits maturing in 2017 and $13 million of time deposits maturing in 2018.
The vast majority of deposits in Morgan Stanley Bank, N.A. ("MSBNA") and Morgan Stanley Private Bank, National Association ("MSPBNA") (collectively, "U.S. Bank Subsidiaries") are sourced from the Company's retail brokerage accounts. Concurrent with the acquisition of the remaining 35% stake in the purchase of the retail securities joint venture between the Company and Citigroup Inc. ("Citi") (the "Wealth Management JV") in 2013, the deposit sweep agreement between Citi and the Company was terminated (see Note 3 to the consolidated financial statements in the 2014 Form 10-K). The transfer of deposits previously held by Citi to the Company's depository institutions relating to the Company's customer accounts was completed at June 30, 2015. During 2015, $8.7 billion of deposits were transferred by Citi to the Company's depository institutions.
| 10. | Long-Term Borrowings and Other Secured Financings. |
Long-Term Borrowings.
The Company's long-term borrowings included the following components:
| At September 30, 2015 | At December 31, 2014 | |||||||
| (dollars in millions) | ||||||||
Senior debt | $ | 146,899 | $ | 139,565 | ||||
Subordinated debt | 10,575 | 8,339 | ||||||
Junior subordinated debentures | 2,869 | 4,868 | ||||||
|
|
|
| |||||
Total | $ | 160,343 | $ | 152,772 | ||||
|
|
|
| |||||
During the nine months ended September 30, 2015 and 2014, the Company issued notes with a principal amount of approximately $30.2 billion and $26.5 billion, respectively, and approximately $17.6 billion and $24.7 billion, respectively, in aggregate long-term borrowings matured or were retired.
The weighted average maturity of the Company's long-term borrowings, based upon stated maturity dates, was approximately 5.9 years for both September 30, 2015 and December 31, 2014.
During May of 2015, Morgan Stanley Capital Trusts VI and VII redeemed all of their issued and outstanding 6.60% Capital Securities, respectively.
Other Secured Financings.
Other secured financings include the liabilities related to transfers of financial assets that are accounted for as financings rather than sales, consolidated VIEs where the Company is deemed to be the primary beneficiary, pledged commodities, certain equity-linked notes and other secured borrowings. See Note 12 for further information on Other secured financings related to VIEs and securitization activities.
| | 58 |
MORGAN STANLEY
NOTES TO CONDENSED CONSOLIDATED FINANCIAL STATEMENTS (Unaudited)-(Continued)
The Company's Other secured financings consisted of the following:
| At September 30, 2015 | At December 31, 2014 | |||||||
| (dollars in millions) | ||||||||
Secured financings with original maturities greater than one year | $ | 8,096 | $ | 10,346 | ||||
Secured financings with original maturities one year or less | 1,733 | 1,395 | ||||||
Failed sales(1) | 342 | 344 | ||||||
|
|
|
| |||||
Total | $ | 10,171 | $ | 12,085 | ||||
|
|
|
| |||||
| (1) | For more information on failed sales, see Note 12. |
| 11. | Commitments, Guarantees and Contingencies. |
Commitments.
The Company's commitments associated with outstanding letters of credit and other financial guarantees obtained to satisfy collateral requirements, investment activities, corporate lending, securities financing arrangements, mortgage lending, underwriting commitments and other financing arrangements at September 30, 2015 are summarized below by years to maturity. Since commitments associated with these instruments may expire unused, the amounts shown do not necessarily reflect the actual future cash funding requirements:
| Years to Maturity at September 30, 2015 | ||||||||||||||||||||
| Less than 1 | 1-3 | 3-5 | Over 5 | Total | ||||||||||||||||
| (dollars in millions) | ||||||||||||||||||||
Letters of credit and other financial guarantees obtained to satisfy collateral requirements | $ | 315 | $ | 8 | $ | - | $ | 1 | $ | 324 | ||||||||||
Investment activities | 484 | 61 | 20 | 533 | 1,098 | |||||||||||||||
Primary lending commitments-investment grade(1) | 13,636 | 20,928 | 34,007 | 3,453 | 72,024 | |||||||||||||||
Primary lending commitments-non-investment grade(1) | 2,278 | 6,246 | 14,131 | 5,947 | 28,602 | |||||||||||||||
Secondary lending commitments | 45 | 81 | 48 | 40 | 214 | |||||||||||||||
Commitments for secured lending transactions | 1,895 | 294 | 511 | 1,188 | 3,888 | |||||||||||||||
Forward starting reverse repurchase agreements and securities borrowing agreements(2)(3) | 73,680 | - | - | - | 73,680 | |||||||||||||||
Commercial and residential mortgage-related commitments | 18 | 359 | 70 | 1,262 | 1,709 | |||||||||||||||
Other lending commitments | 5,058 | 980 | 601 | 139 | 6,778 | |||||||||||||||
|
|
|
|
|
|
|
|
|
| |||||||||||
Total | $ | 97,409 | $ | 28,957 | $ | 49,388 | $ | 12,563 | $ | 188,317 | ||||||||||
|
|
|
|
|
|
|
|
|
| |||||||||||
| (1) | Due to the nature of the Company's obligations under the commitments, these amounts include certain commitments participated to third parties totaling $1.8 billion of investment grade and $3.0 billion of non-investment grade. |
| (2) | The Company enters into forward starting reverse repurchase and securities borrowing agreements (agreements that have a trade date at or prior to September 30, 2015 and settle subsequent to period-end) that are primarily secured by collateral from U.S. government agency securities and other sovereign government obligations. These agreements primarily settle within three business days of the trade date, and of the total amount at September 30, 2015, $60.3 billion settled within three business days. |
| (3) | The Company also has a contingent obligation to provide financing to a clearinghouse through which it clears certain transactions. The financing is required only upon the default of a clearinghouse member. The financing takes the form of a reverse repurchase facility, with a maximum amount of approximately $1.3 billion. |
| 59 | |
MORGAN STANLEY
NOTES TO CONDENSED CONSOLIDATED FINANCIAL STATEMENTS (Unaudited)-(Continued)
For a further description of these commitments, refer to Note 13 to the Company's consolidated financial statements in the 2014 Form 10-K.
The Company sponsors several non-consolidated investment funds for third-party investors where the Company typically acts as general partner of, and investment advisor to, these funds and typically commits to invest a minority of the capital of such funds, with subscribing third-party investors contributing the majority. The Company's employees, including its senior officers, as well as the Company's Directors, may participate on the same terms and conditions as other investors in certain of these funds that the Company forms primarily for client investment, except that the Company may waive or lower applicable fees and charges for its employees. The Company has contractual capital commitments, guarantees, lending facilities and counterparty arrangements with respect to these investment funds.
Guarantees.
The table below summarizes certain information regarding the Company's obligations under guarantee arrangements at September 30, 2015:
| Maximum Potential Payout/Notional | Carrying Amount (Asset)/ Liability | Collateral/ Recourse | ||||||||||||||||||||||||||
| Years to Maturity | ||||||||||||||||||||||||||||
Type of Guarantee | Less than 1 | 1-3 | 3-5 | Over 5 | Total | |||||||||||||||||||||||
| (dollars in millions) | ||||||||||||||||||||||||||||
Credit derivative contracts(1) | $ | 164,281 | $ | 383,709 | $ | 171,658 | $ | 77,889 | $ | 797,537 | $ | (301 | ) | $ | - | |||||||||||||
Other credit contracts | 1 | 806 | 340 | 49 | 1,196 | (1,042 | ) | - | ||||||||||||||||||||
Non-credit derivative contracts(1) | 1,069,489 | 825,927 | 301,902 | 590,735 | 2,788,053 | 80,932 | - | |||||||||||||||||||||
Standby letters of credit and other financial guarantees issued(2) | 818 | 1,509 | 1,311 | 6,284 | 9,922 | (188 | ) | 6,962 | ||||||||||||||||||||
Market value guarantees | 26 | 397 | 221 | 34 | 678 | 4 | 82 | |||||||||||||||||||||
Liquidity facilities | 2,842 | - | - | - | 2,842 | (4 | ) | 4,473 | ||||||||||||||||||||
Whole loan sales guarantees | - | - | 1 | 23,484 | 23,485 | 9 | - | |||||||||||||||||||||
Securitization representations and warranties | - | - | - | 63,613 | 63,613 | 98 | - | |||||||||||||||||||||
General partner guarantees | 71 | 37 | 87 | 454 | 649 | 71 | - | |||||||||||||||||||||
| (1) | Carrying amounts of derivative contracts are shown on a gross basis prior to cash collateral or counterparty netting. For further information on derivative contracts, see Note 4. |
| (2) | These amounts include certain standby letters of credit participated to third parties totaling $0.7 billion due to the nature of the Company's obligations under these arrangements. |
For a further description of these guarantees, refer to Note 13 to the Company's consolidated financial statements in the 2014 Form 10-K.
The Company has obligations under certain guarantee arrangements, including contracts and indemnification agreements, that contingently require a guarantor to make payments to the guaranteed party based on changes in an underlying measure (such as an interest or foreign exchange rate, security or commodity price, an index, or the occurrence or non-occurrence of a specified event) related to an asset, liability or equity security of a guaranteed party. Also included as guarantees are contracts that contingently require the guarantor to make payments to the guaranteed party based on another entity's failure to perform under an agreement, as well as indirect guarantees of the indebtedness of others. The Company's use of guarantees is described in Note 13 to the Company's consolidated financial statements in the 2014 Form 10-K.
| | 60 |
MORGAN STANLEY
NOTES TO CONDENSED CONSOLIDATED FINANCIAL STATEMENTS (Unaudited)-(Continued)
Other Guarantees and Indemnities.
In the normal course of business, the Company provides guarantees and indemnifications in a variety of commercial transactions. These provisions generally are standard contractual terms. Certain of these guarantees and indemnifications related to trust preferred securities, indemnities, exchange/clearinghouse member guarantees and merger and acquisition guarantees are described in Note 13 to the Company's consolidated financial statements in the 2014 Form 10-K.
In the ordinary course of business, the Company guarantees the debt and/or certain trading obligations (including obligations associated with derivatives, foreign exchange contracts and the settlement of physical commodities) of certain subsidiaries. These guarantees generally are entity or product specific and are required by investors or trading counterparties. The activities of the Company's subsidiaries covered by these guarantees (including any related debt or trading obligations) are included in the Company's condensed consolidated financial statements.
Contingencies.
Legal . In the normal course of business, the Company has been named, from time to time, as a defendant in various legal actions, including arbitrations, class actions and other litigation, arising in connection with its activities as a global diversified financial services institution. Certain of the actual or threatened legal actions include claims for substantial compensatory and/or punitive damages or claims for indeterminate amounts of damages. In some cases, the entities that would otherwise be the primary defendants in such cases are bankrupt or are in financial distress. These actions have included, but are not limited to, residential mortgage and credit crisis related matters. Over the last several years, the level of litigation and investigatory activity (both formal and informal) by governmental and self-regulatory agencies has increased materially in the financial services industry. As a result, the Company expects that it may become the subject of increased claims for damages and other relief and, while the Company has identified below any individual proceedings where the Company believes a material loss to be reasonably possible and reasonably estimable, there can be no assurance that material losses will not be incurred from claims that have not yet been asserted or are not yet determined to be probable or possible and reasonably estimable losses.
The Company contests liability and/or the amount of damages as appropriate in each pending matter. Where available information indicates that it is probable a liability had been incurred at the date of the consolidated financial statements and the Company can reasonably estimate the amount of that loss, the Company accrues the estimated loss by a charge to income. The Company expects future litigation accruals in general to continue to be elevated and the changes in accruals from period to period may fluctuate significantly, given the current environment regarding government investigations and private litigation affecting global financial services firms, including the Company.
The Company incurred legal expenses of $320 million and $555 million in the quarter and nine months ended September 30, 2015, respectively, and $66 million and $256 million in the quarter and nine months ended September 30, 2014, respectively, within Other non-interest expenses.
In many proceedings and investigations, however, it is inherently difficult to determine whether any loss is probable or even possible or to estimate the amount of any loss. In addition, even where a loss is possible or an exposure to loss exists in excess of the liability already accrued with respect to a previously recognized loss contingency, it is not always possible to reasonably estimate the size of the possible loss or range of loss.
For certain legal proceedings and investigations, the Company cannot reasonably estimate such losses, particularly for proceedings and investigations where the factual record is being developed or contested or where plaintiffs or governmental entities seek substantial or indeterminate damages, restitution, disgorgement or penalties. Numerous issues may need to be resolved, including through potentially lengthy discovery and determination of important factual matters, determination of issues related to class certification and the
| 61 | |
MORGAN STANLEY
NOTES TO CONDENSED CONSOLIDATED FINANCIAL STATEMENTS (Unaudited)-(Continued)
calculation of damages or other relief, and by addressing novel or unsettled legal questions relevant to the proceedings or investigations in question, before a loss or additional loss or range of loss or additional loss can be reasonably estimated for a proceeding or investigation.
For certain other legal proceedings and investigations, the Company can estimate reasonably possible losses, additional losses, ranges of loss or ranges of additional loss in excess of amounts accrued, but does not believe, based on current knowledge and after consultation with counsel, that such losses will have a material adverse effect on the Company's consolidated financial statements as a whole, other than the matters referred to in the following paragraphs.
On July 15, 2010, China Development Industrial Bank ("CDIB") filed a complaint against the Company, styled China Development Industrial Bank v. Morgan Stanley & Co. Incorporated et al ., which is pending in the Supreme Court of the State of New York, New York County ("Supreme Court of NY"). The complaint relates to a $275 million credit default swap referencing the super senior portion of the STACK 2006-1 CDO. The complaint asserts claims for common law fraud, fraudulent inducement and fraudulent concealment and alleges that the Company misrepresented the risks of the STACK 2006-1 CDO to CDIB, and that the Company knew that the assets backing the CDO were of poor quality when it entered into the credit default swap with CDIB. The complaint seeks compensatory damages related to the approximately $228 million that CDIB alleges it has already lost under the credit default swap, rescission of CDIB's obligation to pay an additional $12 million, punitive damages, equitable relief, fees and costs. On February 28, 2011, the court denied the Company's motion to dismiss the complaint. Based on currently available information, the Company believes it could incur a loss of up to approximately $240 million plus pre- and post-judgment interest, fees and costs.
On April 25, 2012, The Prudential Insurance Company of America and certain affiliates filed a complaint against the Company and certain affiliates in the Superior Court of the State of New Jersey, styled The Prudential Insurance Company of America, et al. v. Morgan Stanley, et al. On October 16, 2012, plaintiffs filed an amended complaint which alleges that defendants made untrue statements and material omissions in connection with the sale to plaintiffs of certain mortgage pass-through certificates backed by securitization trusts containing residential mortgage loans. The total amount of certificates allegedly sponsored, underwritten and/or sold by the Company was approximately $1.073 billion. The amended complaint raises claims under the New Jersey Uniform Securities Law, as well as common law claims of negligent misrepresentation, fraud, fraudulent inducement, equitable fraud, aiding and abetting fraud, and violations of the New Jersey RICO statute, and includes a claim for treble damages. On April 26, 2013, the defendants filed an answer to the amended complaint. On January 2, 2015, the court denied defendants' renewed motion to dismiss the amended complaint. At September 25, 2015, the current unpaid balance of the mortgage pass-through certificates at issue in this action was approximately $581 million, and the certificates had not yet incurred actual losses. Based on currently available information, the Company believes it could incur a loss in this action up to the difference between the $581 million unpaid balance of these certificates (plus any losses incurred) and their fair market value at the time of a judgment against the Company, or upon sale, plus pre- and post-judgment interest, fees and costs. The Company may be entitled to be indemnified for some of these losses and to an offset for interest received by the plaintiff prior to a judgment.
On August 7, 2012, U.S. Bank, in its capacity as Trustee, filed a complaint on behalf of Morgan Stanley Mortgage Loan Trust 2006-4SL and Mortgage Pass-Through Certificates, Series 2006-4SL (together, the "Trust") against the Company. The matter is styled Morgan Stanley Mortgage Loan Trust 2006-4SL, et al. v. Morgan Stanley Mortgage Capital Inc. and is pending in the Supreme Court of NY. The complaint asserts claims for breach of contract and alleges, among other things, that the loans in the trust, which had an original principal balance of approximately $303 million, breached various representations and warranties. The complaint seeks,
| | 62 |
MORGAN STANLEY
NOTES TO CONDENSED CONSOLIDATED FINANCIAL STATEMENTS (Unaudited)-(Continued)
among other relief, rescission of the mortgage loan purchase agreement underlying the transaction, specific performance and unspecified damages and interest. On August 8, 2014, the court granted in part and denied in part the Company's motion to dismiss. On September 3, 2014, the Company filed its answer to the complaint. Based on currently available information, the Company believes that it could incur a loss in this action of up to approximately $149 million, the total original unpaid balance of the mortgage loans for which the Company received repurchase demands that it did not repurchase, plus pre- and post-judgment interest, fees and costs, but plaintiff is seeking to expand the number of loans at issue and the possible range of loss could increase.
On August 8, 2012, U.S. Bank, in its capacity as Trustee, filed a complaint on behalf of Morgan Stanley Mortgage Loan Trust 2006-14SL, Mortgage Pass-Through Certificates, Series 2006-14SL, Morgan Stanley Mortgage Loan Trust 2007-4SL and Mortgage Pass-Through Certificates, Series 2007-4SL against the Company. The complaint is styled Morgan Stanley Mortgage Loan Trust 2006-14SL, et al. v. Morgan Stanley Mortgage Capital Holdings LLC, as successor in interest to Morgan Stanley Mortgage Capital Inc . and is pending in the Supreme Court of NY. The complaint asserts claims for breach of contract and alleges, among other things, that the loans in the trusts, which had original principal balances of approximately $354 million and $305 million respectively, breached various representations and warranties. On August 16, 2013, the court granted in part and denied in part the Company's motion to dismiss the complaint. On September 17, 2013, the Company filed its answer to the complaint. On September 26, 2013, and October 7, 2013, the Company and the plaintiff, respectively, filed notices of appeal with respect to the court's August 16, 2013 decision. The plaintiff is seeking, among other relief, rescission of the mortgage loan purchase agreements underlying the transactions, specific performance and unspecified damages and interest. Based on currently available information, the Company believes that it could incur a loss in this action of up to approximately $527 million, the total original unpaid balance of the mortgage loans for which the Company received repurchase demands that it did not repurchase, plus pre- and post-judgment interest, fees and costs, but plaintiff is seeking to expand the number of loans at issue and the possible range of loss could increase.
On September 28, 2012, U.S. Bank, in its capacity as Trustee, filed a complaint on behalf of Morgan Stanley Mortgage Loan Trust 2006-13ARX against the Company styled Morgan Stanley Mortgage Loan Trust 2006-13ARX v. Morgan Stanley Mortgage Capital Holdings LLC, as successor in interest to Morgan Stanley Mortgage Capital Inc., pending in the Supreme Court of NY. U.S. Bank filed an amended complaint on January 17, 2013, which asserts claims for breach of contract and alleges, among other things, that the loans in the trust, which had an original principal balance of approximately $609 million, breached various representations and warranties. The amended complaint seeks, among other relief, declaratory judgment relief, specific performance and unspecified damages and interest. On September 25, 2014, the court granted in part and denied in part the Company's motion to dismiss. Based on currently available information, the Company believes that it could incur a loss in this action of up to approximately $170 million, the total original unpaid balance of the mortgage loans for which the Company received repurchase demands that it did not repurchase, plus pre- and post-judgment interest, fees and costs, but plaintiff is seeking to expand the number of loans at issue and the possible range of loss could increase.
On January 10, 2013, U.S. Bank, in its capacity as Trustee, filed a complaint on behalf of Morgan Stanley Mortgage Loan Trust 2006-10SL and Mortgage Pass-Through Certificates, Series 2006-10SL against the Company. The complaint is styled Morgan Stanley Mortgage Loan Trust 2006-10SL, et al. v. Morgan Stanley Mortgage Capital Holdings LLC, as successor in interest to Morgan Stanley Mortgage Capital Inc. and is pending in the Supreme Court of NY. The complaint asserts claims for breach of contract and alleges, among other things, that the loans in the trust, which had an original principal balance of approximately $300 million, breached various representations and warranties. The complaint seeks, among other relief, an order requiring the Company to comply with the loan breach remedy procedures in the transaction documents, unspecified damages,
| 63 | |
MORGAN STANLEY
NOTES TO CONDENSED CONSOLIDATED FINANCIAL STATEMENTS (Unaudited)-(Continued)
and interest. On August 8, 2014, the court granted in part and denied in part the Company's motion to dismiss. On September 3, 2014, the Company filed its answer to the complaint. Based on currently available information, the Company believes that it could incur a loss in this action of up to approximately $197 million, the total original unpaid balance of the mortgage loans for which the Company received repurchase demands that it did not repurchase, plus pre- and post-judgment interest, fees and costs, but plaintiff is seeking to expand the number of loans at issue and the possible range of loss could increase.
On May 3, 2013, plaintiffs in Deutsche Zentral-Genossenschaftsbank AG et al. v. Morgan Stanley et al. filed a complaint against the Company, certain affiliates, and other defendants in the Supreme Court of NY. The complaint alleges that defendants made material misrepresentations and omissions in the sale to plaintiffs of certain mortgage pass-through certificates backed by securitization trusts containing residential mortgage loans. The total amount of certificates allegedly sponsored, underwritten and/or sold by the Company to plaintiff currently at issue in this action was approximately $644 million. The complaint alleges causes of action against the Company for common law fraud, fraudulent concealment, aiding and abetting fraud, negligent misrepresentation, and rescission and seeks, among other things, compensatory and punitive damages. On September 12, 2014, the Company filed a notice of appeal from the June 10, 2014 denial of the defendants' motion to dismiss. On January 12, 2015, the Company filed an amended answer to the complaint. At September 25, 2015, the current unpaid balance of the mortgage pass-through certificates at issue in this action was approximately $277 million, and the certificates had incurred actual losses of approximately $81 million. Based on currently available information, the Company believes it could incur a loss in this action up to the difference between the $277 million unpaid balance of these certificates (plus any losses incurred) and their fair market value at the time of a judgment against the Company, or upon sale, plus pre- and post-judgment interest, fees and costs. The Company may be entitled to be indemnified for some of these losses.
On September 23, 2013, the plaintiff in National Credit Union Administration Board v. Morgan Stanley & Co. Inc., et al. filed a complaint against the Company and certain affiliates in the United States District Court for the Southern District of New York ("SDNY"). The complaint alleges that defendants made untrue statements of material fact or omitted to state material facts in the sale to the plaintiff of certain mortgage pass-through certificates issued by securitization trusts containing residential mortgage loans. The total amount of certificates allegedly sponsored, underwritten and/or sold by the Company to plaintiffs was approximately $417 million. The amended complaint, filed November 17, 2014, alleges causes of action against the Company for violations of the Texas Securities Act and the Illinois Securities Law of 1953 and seeks, among other things, rescissory and compensatory damages. On December 15, 2014, defendants answered the amended complaint. At September 25, 2015, the current unpaid balance of the mortgage pass-through certificates at issue in this action was approximately $194 million, and the certificates had incurred actual losses of $31 million. Based on currently available information, the Company believes it could incur a loss in this action up to the difference between the $194 million unpaid balance of these certificates (plus any losses incurred) and their fair market value at the time of a judgment against the Company, or upon sale, plus pre- and post-judgment interest, fees and costs. The Company may be entitled to be indemnified for some of these losses and to an offset for interest received by the plaintiff prior to a judgment.
On April 28, 2014, Deutsche Bank National Trust Company, in its capacity as trustee for Morgan Stanley Structured Trust I 2007-1, filed a complaint against the Company. The matter is styled Deutsche Bank National Trust Company v. Morgan Stanley Mortgage Capital Holdings LLC and is pending in the SDNY. The complaint asserts claims for breach of contract and alleges, among other things, that the loans in the trust, which had an original principal balance of approximately $735 million, breached various representations and warranties. The complaint seeks, among other relief, specific performance of the loan breach remedy procedures in the transaction documents, unspecified compensatory and/or rescissory damages, interest and costs. On April 3, 2015, the court granted in part and denied in part the Company's motion to dismiss. On April 17, 2015, the
| | 64 |
MORGAN STANLEY
NOTES TO CONDENSED CONSOLIDATED FINANCIAL STATEMENTS (Unaudited)-(Continued)
Company filed its answer to the complaint. Based on currently available information, the Company believes that it could incur a loss in this action of up to approximately $292 million, the total original unpaid balance of the mortgage loans for which the Company received repurchase demands that it did not repurchase, plus pre- and post-judgment interest, fees and costs, but plaintiff is seeking to expand the number of loans at issue and the possible range of loss could increase.
On July 8, 2013, U.S. Bank National Association, in its capacity as trustee for Morgan Stanley Mortgage Loan Trust 2007-2AX, filed a complaint against the Company. The matter is styled U.S. Bank National Association, solely in its capacity as Trustee of the Morgan Stanley Mortgage Loan Trust 2007-2AX (MSM 2007-2AX) v. Morgan Stanley Mortgage Capital Holdings LLC, as Successor-by-Merger to Morgan Stanley Mortgage Capital Inc. and GreenPoint Mortgage Fundin g, Inc. and is pending in the Supreme Court of NY. The complaint asserts claims for breach of contract and alleges, among other things, that the loans in the trust, which had an original principal balance of approximately $650 million, breached various representations and warranties. The complaint seeks, among other relief, specific performance of the loan breach remedy procedures in the transaction documents, unspecified damages and interest. On August 22, 2013, the Company filed a motion to dismiss the complaint, which was granted in part and denied in part on November 24, 2014. The Company filed its answer on December 12, 2014. Based on currently available information, the Company believes that it could incur a loss in this action of up to approximately $240 million, the total original unpaid balance of the mortgage loans for which the Company received repurchase demands that it did not repurchase, plus pre- and post-judgment interest, fees and costs, but plaintiff is seeking to expand the number of loans at issue and the possible range of loss could increase.
On January 23, 2015, Deutsche Bank National Trust Company, in its capacity as trustee for Morgan Stanley ABS Capital I Inc. Trust 2007-NC4, filed a complaint against the Company. The matter is styled Deutsche Bank National Trust Company solely in its capacity as Trustee of the Morgan Stanley ABS Capital I Inc. Trust 2007-NC4 v. Morgan Stanley Mortgage Capital Holdings LLC as Successor-by-Merger to Morgan Stanley Mortgage Capital Inc., and Morgan Stanley ABS Capital I Inc. and is pending in the Supreme Court of NY. The complaint asserts claims for breach of contract and alleges, among other things, that the loans in the trust, which had an original principal balance of approximately $1.05 billion, breached various representations and warranties. The complaint seeks, among other relief, specific performance of the loan breach remedy procedures in the transaction documents, compensatory, consequential, rescissory, equitable and punitive damages, attorneys' fees, costs and other related expenses, and interest. On October 20, 2015, the court granted in part and denied in part the Company's motion to dismiss. Based on currently available information, the Company believes that it could incur a loss in this action of up to approximately $277 million, the total original unpaid balance of the mortgage loans for which the Company received repurchase demands from a certificate holder and a monoline insurer that the Company did not repurchase, plus pre- and post-judgment interest, fees and costs, but plaintiff is seeking to expand the number of loans at issue and the possible range of loss could increase.
| 12. | Variable Interest Entities and Securitization Activities. |
The Company is involved with various special purpose entities ("SPE") in the normal course of business. In most cases, these entities are deemed to be VIEs. The Company's transactions with VIEs primarily include securitizations, municipal tender option bond trusts, credit protection purchased through credit-linked notes, other structured financings, collateralized loan and debt obligations, equity-linked notes, managed real estate partnerships and asset management investment funds. The Company's continuing involvement in VIEs that it does not consolidate can include ownership of retained interests in Company-sponsored transactions, interests purchased in the secondary market (both for Company-sponsored transactions and transactions sponsored by third parties), and
| 65 | |
MORGAN STANLEY
NOTES TO CONDENSED CONSOLIDATED FINANCIAL STATEMENTS (Unaudited)-(Continued)
derivatives with securitization SPEs (primarily interest rate derivatives in commercial mortgage and residential mortgage securitizations and credit derivatives in which the Company has purchased protection in synthetic CDOs).
For a further discussion on the Company's VIEs, the determination and structure of VIEs and securitization activities, see Note 7 to the Company's consolidated financial statements in the 2014 Form 10-K.
Consolidated VIEs.
Except for consolidated VIEs included in other structured financings and managed real estate partnerships in the tables below, the Company accounts for the assets held by the entities primarily in Trading assets and the liabilities of the entities in Other secured financings in its condensed consolidated statements of financial condition. For consolidated VIEs included in other structured financings, the Company accounts for the assets held by the entities primarily in Premises, equipment and software costs, and Other assets in its condensed consolidated statements of financial condition. For consolidated VIEs included in managed real estate partnerships, the Company accounts for the assets held by the entities primarily in Trading assets in its condensed consolidated statements of financial condition. Except for consolidated VIEs included in other structured financings, the assets and liabilities are measured at fair value, with changes in fair value reflected in earnings.
The assets owned by many consolidated VIEs cannot be removed unilaterally by the Company and are not generally available to the Company. The related liabilities issued by many consolidated VIEs are non-recourse to the Company. In certain other consolidated VIEs, the Company either has the unilateral right to remove assets or provide additional recourse through derivatives such as total return swaps, guarantees or other forms of involvement.
The following table presents information at September 30, 2015 and December 31, 2014 about VIEs that the Company consolidates. Consolidated VIE assets and liabilities are presented after intercompany eliminations and include assets financed on a non-recourse basis:
| At September 30, 2015 | At December 31, 2014 | |||||||||||||||
| VIE assets | VIE liabilities | VIE assets | VIE liabilities | |||||||||||||
| (dollars in millions) | ||||||||||||||||
Mortgage- and asset-backed securitizations | $ | 437 | $ | 254 | $ | 563 | $ | 337 | ||||||||
Managed real estate partnerships(1) | 60 | 1 | 288 | 4 | ||||||||||||
Other structured financings | 830 | 13 | 928 | 80 | ||||||||||||
Credit linked notes and Other | 1,635 | 192 | 1,199 | - | ||||||||||||
| (1) | During the second quarter of 2015, the Company deconsolidated approximately $191 million in net assets previously attributable to nonredeemable noncontrolling interests that were related to a real estate fund sponsored by the Company. |
In general, the Company's exposure to loss in consolidated VIEs is limited to losses that would be absorbed on the VIE's assets recognized in its financial statements, net of losses absorbed by third-party holders of the VIE's liabilities. At September 30, 2015 and December 31, 2014, managed real estate partnerships reflected nonredeemable noncontrolling interests in the Company's condensed consolidated financial statements of $59 million and $240 million, respectively. The Company also had additional maximum exposure to losses of approximately $69 million and $105 million at September 30, 2015 and December 31, 2014, respectively, primarily related to certain derivatives, commitments, guarantees and other forms of involvement.
| | 66 |
MORGAN STANLEY
NOTES TO CONDENSED CONSOLIDATED FINANCIAL STATEMENTS (Unaudited)-(Continued)
Non-Consolidated VIEs.
The following tables present information about certain non-consolidated VIEs in which the Company had variable interests at September 30, 2015 and December 31, 2014. The tables include all VIEs in which the Company has determined that its maximum exposure to loss is greater than specific thresholds or meets certain other criteria. Most of the VIEs included in the tables below are sponsored by unrelated parties; the Company's involvement generally is the result of the Company's secondary market-making activities and securities held in its Investment securities portfolio (see Note 5):
| At September 30, 2015 | ||||||||||||||||||||
| Mortgage-and Asset-Backed Securitizations | Collateralized Debt Obligations | Municipal Tender Option Bonds | Other Structured Financings | Other | ||||||||||||||||
| (dollars in millions) | ||||||||||||||||||||
VIE assets that the Company does not consolidate (unpaid principal balance)(1) | $ | 161,547 | $ | 15,046 | $ | 4,343 | $ | 1,696 | $ | 20,012 | ||||||||||
Maximum exposure to loss: | ||||||||||||||||||||
Debt and equity interests(2) | $ | 15,121 | $ | 1,704 | $ | 12 | $ | 1,078 | $ | 3,560 | ||||||||||
Derivative and other contracts | 13 | - | 2,597 | - | 66 | |||||||||||||||
Commitments, guarantees and other | 956 | 1,120 | - | 609 | 268 | |||||||||||||||
|
|
|
|
|
|
|
|
|
| |||||||||||
Total maximum exposure to loss | $ | 16,090 | $ | 2,824 | $ | 2,609 | $ | 1,687 | $ | 3,894 | ||||||||||
|
|
|
|
|
|
|
|
|
| |||||||||||
Carrying value of exposure to loss-Assets: | ||||||||||||||||||||
Debt and equity interests(2) | $ | 15,121 | $ | 1,704 | $ | 12 | $ | 644 | $ | 3,560 | ||||||||||
Derivative and other contracts | 13 | - | 21 | - | 30 | |||||||||||||||
|
|
|
|
|
|
|
|
|
| |||||||||||
Total carrying value of exposure to loss-Assets | $ | 15,134 | $ | 1,704 | $ | 33 | $ | 644 | $ | 3,590 | ||||||||||
|
|
|
|
|
|
|
|
|
| |||||||||||
Carrying value of exposure to loss-Liabilities: | ||||||||||||||||||||
Derivative and other contracts | $ | - | $ | - | $ | 17 | $ | - | $ | 2 | ||||||||||
Commitments, guarantees and other | - | - | - | 5 | - | |||||||||||||||
|
|
|
|
|
|
|
|
|
| |||||||||||
Total carrying value of exposure to loss-Liabilities | $ | - | $ | - | $ | 17 | $ | 5 | $ | 2 | ||||||||||
|
|
|
|
|
|
|
|
|
| |||||||||||
| 67 | |
MORGAN STANLEY
NOTES TO CONDENSED CONSOLIDATED FINANCIAL STATEMENTS (Unaudited)-(Continued)
| At December 31, 2014 | ||||||||||||||||||||
| Mortgage-and Asset-Backed Securitizations | Collateralized Debt Obligations | Municipal Tender Option Bonds | Other Structured Financings | Other | ||||||||||||||||
| (dollars in millions) | ||||||||||||||||||||
VIE assets that the Company does not consolidate (unpaid principal balance)(3) | $ | 174,548 | $ | 26,567 | $ | 3,449 | $ | 2,040 | $ | 19,237 | ||||||||||
Maximum exposure to loss: | ||||||||||||||||||||
Debt and equity interests(4) | $ | 15,028 | $ | 3,062 | $ | 13 | $ | 1,158 | $ | 3,884 | ||||||||||
Derivative and other contracts | 15 | 2 | 2,212 | - | 164 | |||||||||||||||
Commitments, guarantees and other | 1,054 | 432 | - | 617 | 429 | |||||||||||||||
|
|
|
|
|
|
|
|
|
| |||||||||||
Total maximum exposure to loss | $ | 16,097 | $ | 3,496 | $ | 2,225 | $ | 1,775 | $ | 4,477 | ||||||||||
|
|
|
|
|
|
|
|
|
| |||||||||||
Carrying value of exposure to loss-Assets: | ||||||||||||||||||||
Debt and equity interests(4) | $ | 15,028 | $ | 3,062 | $ | 13 | $ | 741 | $ | 3,884 | ||||||||||
Derivative and other contracts | 15 | 2 | 4 | - | 74 | |||||||||||||||
|
|
|
|
|
|
|
|
|
| |||||||||||
Total carrying value of exposure to loss-Assets | $ | 15,043 | $ | 3,064 | $ | 17 | $ | 741 | $ | 3,958 | ||||||||||
|
|
|
|
|
|
|
|
|
| |||||||||||
Carrying value of exposure to loss-Liabilities: | ||||||||||||||||||||
Derivative and other contracts | $ | - | $ | - | $ | - | $ | - | $ | 57 | ||||||||||
Commitments, guarantees and other | - | - | - | 5 | - | |||||||||||||||
|
|
|
|
|
|
|
|
|
| |||||||||||
Total carrying value of exposure to loss-Liabilities | $ | - | $ | - | $ | - | $ | 5 | $ | 57 | ||||||||||
|
|
|
|
|
|
|
|
|
| |||||||||||
| (1) | Mortgage-and asset-backed securitizations include VIE assets as follows: $14.5 billion of residential mortgages; $77.3 billion of commercial mortgages; $17.3 billion of U.S. agency collateralized mortgage obligations; and $52.4 billion of other consumer or commercial loans. |
| (2) | Mortgage-and asset-backed securitizations include VIE debt and equity interests as follows: $1.2 billion of residential mortgages; $3.1 billion of commercial mortgages; $3.8 billion of U.S. agency collateralized mortgage obligations; and $7.0 billion of other consumer or commercial loans. |
| (3) | Mortgage-and asset-backed securitizations include VIE assets as follows: $30.8 billion of residential mortgages; $71.9 billion of commercial mortgages; $20.6 billion of U.S. agency collateralized mortgage obligations; and $51.2 billion of other consumer or commercial loans. |
| (4) | Mortgage-and asset-backed securitizations include VIE debt and equity interests as follows: $1.9 billion of residential mortgages; $2.4 billion of commercial mortgages; $4.0 billion of U.S. agency collateralized mortgage obligations; and $6.8 billion of other consumer or commercial loans. |
The Company's maximum exposure to loss often differs from the carrying value of the variable interests held by the Company. The maximum exposure to loss is dependent on the nature of the Company's variable interest in the VIEs and is limited to the notional amounts of certain liquidity facilities, other credit support, total return swaps, written put options, and the fair value of certain other derivatives and investments the Company has made in the VIEs. Liabilities issued by VIEs generally are non-recourse to the Company. Where notional amounts are utilized in quantifying maximum exposure related to derivatives, such amounts do not reflect fair value write-downs already recorded by the Company.
The Company's maximum exposure to loss does not include the offsetting benefit of any financial instruments that the Company may utilize to hedge these risks associated with the Company's variable interests. In addition, the Company's maximum exposure to loss is not reduced by the amount of collateral held as part of a transaction with the VIE or any party to the VIE directly against a specific exposure to loss.
| | 68 |
MORGAN STANLEY
NOTES TO CONDENSED CONSOLIDATED FINANCIAL STATEMENTS (Unaudited)-(Continued)
Securitization transactions generally involve VIEs. Primarily as a result of its secondary market-making activities, the Company owned additional securities issued by securitization SPEs for which the maximum exposure to loss is less than specific thresholds. These additional securities totaled $13.7 billion and $14.0 billion at September 30, 2015, and December 31, 2014, respectively. These securities were either retained in connection with transfers of assets by the Company, acquired in connection with secondary market-making activities or held as AFS securities in the Company's Investment securities portfolio (see Note 5). At September 30, 2015, and December 31, 2014, these securities consisted of securities backed by residential mortgage loans, commercial mortgage loans or other consumer loans, such as credit card receivables, automobile loans and student loans, and CDOs or CLOs. The Company's primary risk exposure is to the securities issued by the SPE owned by the Company, with the risk highest on the most subordinate class of beneficial interests. These securities generally are included in Trading assets-Corporate and other debt or AFS securities within the Company's Investment securities portfolio and are measured at fair value (see Note 3). The Company does not provide additional support in these transactions through contractual facilities, such as liquidity facilities, guarantees or similar derivatives. The Company's maximum exposure to loss generally equals the fair value of the securities owned.
Transfers of Assets with Continuing Involvement.
The following tables present information at September 30, 2015, and December 31, 2014, respectively, regarding transactions with SPEs in which the Company, acting as principal, transferred financial assets with continuing involvement and received sales treatment:
| At September 30, 2015 | ||||||||||||||||
| Residential Mortgage Loans | Commercial Mortgage Loans | U.S. Agency Collateralized Mortgage Obligations | Credit- Linked Notes and Other(1) | |||||||||||||
| (dollars in millions) | ||||||||||||||||
SPE assets (unpaid principal balance)(2) | $ | 24,523 | $ | 58,983 | $ | 19,020 | $ | 20,296 | ||||||||
Retained interests (fair value): | ||||||||||||||||
Investment grade | $ | - | $ | 150 | $ | 1,290 | $ | - | ||||||||
Non-investment grade | 203 | 69 | - | 1,194 | ||||||||||||
|
|
|
|
|
|
|
| |||||||||
Total retained interests (fair value) | $ | 203 | $ | 219 | $ | 1,290 | $ | 1,194 | ||||||||
|
|
|
|
|
|
|
| |||||||||
Interests purchased in the secondary market (fair value): | ||||||||||||||||
Investment grade | $ | - | $ | 231 | $ | 204 | $ | 2 | ||||||||
Non-investment grade | 92 | 81 | - | 31 | ||||||||||||
|
|
|
|
|
|
|
| |||||||||
Total interests purchased in the secondary market (fair value) | $ | 92 | $ | 312 | $ | 204 | $ | 33 | ||||||||
|
|
|
|
|
|
|
| |||||||||
Derivative assets (fair value) | $ | - | $ | 376 | $ | - | $ | 117 | ||||||||
Derivative liabilities (fair value) | - | - | - | 780 | ||||||||||||
| (1) | Amounts include CLO transactions managed by unrelated third parties. |
| (2) | Amounts include assets transferred by unrelated transferors. |
| 69 | |
MORGAN STANLEY
NOTES TO CONDENSED CONSOLIDATED FINANCIAL STATEMENTS (Unaudited)-(Continued)
| At September 30, 2015 | ||||||||||||||||
| Level 1 | Level 2 | Level 3 | Total | |||||||||||||
| (dollars in millions) | ||||||||||||||||
Retained interests (fair value): | ||||||||||||||||
Investment grade | $ | - | $ | 1,437 | $ | 3 | $ | 1,440 | ||||||||
Non-investment grade | - | 28 | 1,438 | 1,466 | ||||||||||||
|
|
|
|
|
|
|
| |||||||||
Total retained interests (fair value) | $ | - | $ | 1,465 | $ | 1,441 | $ | 2,906 | ||||||||
|
|
|
|
|
|
|
| |||||||||
Interests purchased in the secondary market (fair value): | ||||||||||||||||
Investment grade | $ | - | $ | 437 | $ | - | $ | 437 | ||||||||
Non-investment grade | - | 168 | 36 | 204 | ||||||||||||
|
|
|
|
|
|
|
| |||||||||
Total interests purchased in the secondary market (fair value) | $ | - | $ | 605 | $ | 36 | $ | 641 | ||||||||
|
|
|
|
|
|
|
| |||||||||
Derivative assets (fair value) | $ | - | $ | 456 | $ | 37 | $ | 493 | ||||||||
Derivative liabilities (fair value) | - | 764 | 16 | 780 | ||||||||||||
| At December 31, 2014 | ||||||||||||||||
| Residential Mortgage Loans | Commercial Mortgage Loans | U.S. Agency Collateralized Mortgage Obligations | Credit- Linked Notes and Other(1) | |||||||||||||
| (dollars in millions) | ||||||||||||||||
SPE assets (unpaid principal balance)(2) | $ | 26,549 | $ | 58,660 | $ | 20,826 | $ | 24,011 | ||||||||
Retained interests (fair value): | ||||||||||||||||
Investment grade | $ | 10 | $ | 117 | $ | 1,019 | $ | 57 | ||||||||
Non-investment grade | 98 | 120 | - | 1,264 | ||||||||||||
|
|
|
|
|
|
|
| |||||||||
Total retained interests (fair value) | $ | 108 | $ | 237 | $ | 1,019 | $ | 1,321 | ||||||||
|
|
|
|
|
|
|
| |||||||||
Interests purchased in the secondary market (fair value): | ||||||||||||||||
Investment grade | $ | 32 | $ | 129 | $ | 61 | $ | 423 | ||||||||
Non-investment grade | 32 | 72 | - | 59 | ||||||||||||
|
|
|
|
|
|
|
| |||||||||
Total interests purchased in the secondary market (fair value) | $ | 64 | $ | 201 | $ | 61 | $ | 482 | ||||||||
|
|
|
|
|
|
|
| |||||||||
Derivative assets (fair value) | $ | - | $ | 495 | $ | - | $ | 138 | ||||||||
Derivative liabilities (fair value) | - | - | - | 86 | ||||||||||||
| (1) | Amounts include CLO transactions managed by unrelated third parties. |
| (2) | Amounts include assets transferred by unrelated transferors. |
| | 70 |
MORGAN STANLEY
NOTES TO CONDENSED CONSOLIDATED FINANCIAL STATEMENTS (Unaudited)-(Continued)
| At December 31, 2014 | ||||||||||||||||
| Level 1 | Level 2 | Level 3 | Total | |||||||||||||
| (dollars in millions) | ||||||||||||||||
Retained interests (fair value): | ||||||||||||||||
Investment grade | $ | - | $ | 1,166 | $ | 37 | $ | 1,203 | ||||||||
Non-investment grade | - | 123 | 1,359 | 1,482 | ||||||||||||
|
|
|
|
|
|
|
| |||||||||
Total retained interests (fair value) | $ | - | $ | 1,289 | $ | 1,396 | $ | 2,685 | ||||||||
|
|
|
|
|
|
|
| |||||||||
Interests purchased in the secondary market (fair value): | ||||||||||||||||
Investment grade | $ | - | $ | 644 | $ | 1 | $ | 645 | ||||||||
Non-investment grade | - | 129 | 34 | 163 | ||||||||||||
|
|
|
|
|
|
|
| |||||||||
Total interests purchased in the secondary market (fair value) | $ | - | $ | 773 | $ | 35 | $ | 808 | ||||||||
|
|
|
|
|
|
|
| |||||||||
Derivative assets (fair value) | $ | - | $ | 559 | $ | 74 | $ | 633 | ||||||||
Derivative liabilities (fair value) | - | 82 | 4 | 86 | ||||||||||||
Transferred assets are carried at fair value prior to securitization, and any changes in fair value are recognized in the Company's condensed consolidated statements of income. The Company may act as underwriter of the beneficial interests issued by these securitization vehicles. Investment banking underwriting net revenues are recognized in connection with these transactions. The Company may retain interests in the securitized financial assets as one or more tranches of the securitization. These retained interests are included in the Company's condensed consolidated statements of financial condition at fair value. Any changes in the fair value of such retained interests are recognized in the Company's condensed consolidated statements of income.
Net gains on sale of assets in securitization transactions at the time of the sale were not material for the quarters and nine months ended September 30, 2015 and 2014.
For the quarters and nine months ended September 30, 2015 and 2014, proceeds from new securitization transactions and proceeds from retained interests in securitization transactions received by the Company were as follows:
| For the Three Months Ended September 30, | For the Nine Months Ended September 30, | |||||||||||||||
| 2015 | 2014 | 2015 | 2014 | |||||||||||||
| (dollars in millions) | ||||||||||||||||
Proceeds received from new securitization transactions | $ | 6,105 | $ | 7,662 | $ | 17,270 | $ | 17,310 | ||||||||
Proceeds from retained interests in securitization transactions | 476 | 714 | 2,082 | 2,186 | ||||||||||||
The Company has provided, or otherwise agreed to be responsible for, representations and warranties regarding certain assets transferred in securitization transactions sponsored by the Company (see Note 11).
In connection with its underwriting of CLO transactions for unaffiliated sponsors, the Company received proceeds from the sale of corporate loans sold to those SPEs as follows:
| For the Three Months Ended September 30, | For the Nine Months Ended September 30, | |||||||||||||||
| 2015 | 2014 | 2015 | 2014 | |||||||||||||
| (dollars in millions) | ||||||||||||||||
Proceeds from sale of corporate loans sold to those SPEs | $ | 121 | $ | 447 | $ | 1,086 | $ | 1,572 | ||||||||
| 71 | |
MORGAN STANLEY
NOTES TO CONDENSED CONSOLIDATED FINANCIAL STATEMENTS (Unaudited)-(Continued)
Net gains on sale of corporate loans to CLO transactions at the time of sale were not material for the quarters and nine months ended September 30, 2015 and 2014.
The Company also enters into transactions in which it sells equity securities and contemporaneously enters into bilateral OTC equity derivatives with the purchasers of the securities, through which derivatives it retains the exposure to the securities. For transactions where the derivatives were outstanding at September 30, 2015, the carrying value of assets derecognized at the time of sale and the gross cash proceeds were $7.7 billion. In addition, the fair value at September 30, 2015 of the assets sold was $7.4 billion while the fair value of derivative assets and derivative liabilities recognized in the Company's condensed consolidated statement of financial condition at September 30, 2015 was $39.5 million and $225 million, respectively (see Note 4).
Failed Sales.
In order to be treated as a sale of assets for accounting purposes, a transaction must meet all of the criteria stipulated in the accounting guidance for the transfer of financial assets. A transfer that fails to meet these criteria is treated as a failed sale. In such cases, the Company continues to recognize the assets in Trading assets, and the Company recognizes the associated liabilities in Other secured financings in its condensed consolidated statements of financial condition (see Note 10).
The assets transferred to unconsolidated VIEs in transactions accounted for as failed sales cannot be removed unilaterally by the Company and are not generally available to the Company. The related liabilities are also non-recourse to the Company. In certain other failed sale transactions, the Company has the right to remove assets or provide additional recourse through derivatives such as total return swaps, guarantees or other forms of involvement.
The following table presents information about the carrying value (equal to fair value) of assets and liabilities resulting from transfers of financial assets treated by the Company as secured financings:
| At September 30, 2015 | At December 31, 2014 | |||||||||||||||
| Carrying Value of | Carrying Value of | |||||||||||||||
| Assets | Liabilities | Assets | Liabilities | |||||||||||||
| (dollars in millions) | ||||||||||||||||
Failed sales | $ | 342 | $ | 342 | $ | 352 | $ | 344 | ||||||||
| 13. | Regulatory Requirements. |
Regulatory Capital Framework.
For a discussion of the Company's regulatory capital framework, see Note 14 to the consolidated financial statements in the 2014 Form 10-K.
Calculation of Risk-Based Capital Ratios.
The Company is required to calculate and hold capital against credit, market and operational risk-weighted assets ("RWAs"). For a further discussion of the Company's RWAs, see Note 14 to the consolidated financial statements in the 2014 Form 10-K.
As a U.S. Basel III Advanced Approach banking organization, the Company is subject to a permanent "capital floor" based on the lower of the risk-based capital ratios calculated using (i) standardized approaches for calculating credit risk RWAs and market risk RWAs (the "Standardized Approach"); and (ii) an advanced
| | 72 |
MORGAN STANLEY
NOTES TO CONDENSED CONSOLIDATED FINANCIAL STATEMENTS (Unaudited)-(Continued)
internal ratings-based approach for calculating credit risk RWAs, an advanced measurement approach for calculating operational risk RWAs, and an advanced approach for calculating market risk RWAs (the "Advanced Approach") under the U.S. revised risk-based and leverage capital framework, referred to herein as "U.S. Basel III." The capital floor applies to the calculation of the minimum risk-based capital requirements and, when in effect, the capital conservation buffer, the countercyclical capital buffer (if deployed by banking regulators), and the global systemically important bank ("G-SIB") capital surcharge.
The methods for calculating each of the Company's risk-based capital ratios will change through January 1, 2022 as aspects of U.S. Basel III are phased in. These ongoing methodological changes may result in differences in the Company's reported capital ratios from one reporting period to the next that are independent of changes to the Company's capital base, asset composition, off-balance sheet exposures or risk profile.
The Company's Regulatory Capital and Capital Ratios.
Beginning on January 1, 2015, the risk-based capital ratios for regulatory purposes of the Company and its U.S. Bank Subsidiaries are the lower of each ratio calculated using RWAs under the Advanced Approach or the Standardized Approach under U.S. Basel III, in both cases subject to transitional provisions. In 2014, the Company's binding risk-based capital ratios were the lower of its ratios computed under the Advanced Approach or U.S. banking regulators' U.S. Basel I-based rules ("U.S. Basel I") as supplemented by rules that implemented the Basel Committee's market risk capital framework amendment, commonly referred to as "Basel 2.5". At September 30, 2015, the Company's risk-based capital ratios were lower under the Advanced Approach transitional rules; however, the risk-based capital ratios for its U.S. Bank Subsidiaries were lower under the Standardized Approach transitional rules.
The following table presents the Company's capital measures under the U.S. Basel III Advanced Approach transitional rules and the minimum regulatory capital ratios.
| At September 30, 2015 | At December 31, 2014 | |||||||||||||||||||||||
| Amount | Ratio | Minimum Regulatory Capital Ratio(1) | Amount | Ratio | Minimum Regulatory Capital Ratio(1) | |||||||||||||||||||
| (dollars in millions) | ||||||||||||||||||||||||
Regulatory capital and capital ratios: | ||||||||||||||||||||||||
Common Equity Tier 1 capital | $ | 59,056 | 14.0 | % | 4.5 | % | $ | 57,324 | 12.6 | % | 4.0 | % | ||||||||||||
Tier 1 capital | 66,071 | 15.6 | % | 6.0 | % | 64,182 | 14.1 | % | 5.5 | % | ||||||||||||||
Total capital | 78,921 | 18.6 | % | 8.0 | % | 74,972 | 16.4 | % | 8.0 | % | ||||||||||||||
Tier 1 leverage | - | 8.1 | % | 4.0 | % | - | 7.9 | % | 4.0 | % | ||||||||||||||
Assets: | ||||||||||||||||||||||||
RWAs | $ | 423,242 | N/A | N/A | $ | 456,008 | N/A | N/A | ||||||||||||||||
Adjusted average assets(2) | 816,722 | N/A | N/A | 810,524 | N/A | N/A | ||||||||||||||||||
N/A-Not Applicable.
| (1) | Percentages represent minimum regulatory capital ratios under U.S. Basel III transitional rules. |
| (2) | Beginning with the first quarter of 2015, in accordance with U.S. Basel III, adjusted average assets represent the denominator of the Tier 1 leverage ratio and were composed of the average daily balance of consolidated on-balance sheet assets under U.S. GAAP during the calendar quarter, adjusted for disallowed goodwill, transitional intangible assets, certain deferred tax assets, certain investments in the capital instruments of unconsolidated financial institutions and other adjustments. |
| 73 | |
MORGAN STANLEY
NOTES TO CONDENSED CONSOLIDATED FINANCIAL STATEMENTS (Unaudited)-(Continued)
The Company's U.S. Bank Subsidiaries.
The Company's U.S. Bank Subsidiaries are subject to similar regulatory capital requirements as the Company. Failure to meet minimum capital requirements can initiate certain mandatory and discretionary actions by regulators that, if undertaken, could have a direct material effect on the Company's U.S. Bank Subsidiaries' financial statements. Under capital adequacy guidelines and the regulatory framework for prompt corrective action, each of the Company's U.S. Bank Subsidiaries must meet specific capital guidelines that involve quantitative measures of its assets, liabilities and certain off-balance sheet items as calculated under regulatory accounting practices.
The following table sets forth the capital information for MSBNA:
| At September 30, 2015 | At December 31, 2014 | |||||||||||||||||||||||
| U.S. Basel
III Transitional/ Standardized Approach | Required Capital Ratio(1) | U.S. Basel
III Transitional/ Basel I + Basel 2.5 Approach | Required Capital Ratio(1) | |||||||||||||||||||||
| Amount | Ratio | Amount | Ratio | |||||||||||||||||||||
| (dollars in millions) | ||||||||||||||||||||||||
Common Equity Tier 1 capital | $ | 12,939 | 13.8 | % | 6.5 | % | $ | 12,355 | 12.2 | % | 6.5 | % | ||||||||||||
Tier 1 capital | 12,939 | 13.8 | % | 8.0 | % | 12,355 | 12.2 | % | 8.0 | % | ||||||||||||||
Total capital | 14,649 | 15.7 | % | 10.0 | % | 14,040 | 13.9 | % | 10.0 | % | ||||||||||||||
Tier 1 leverage | 12,939 | 10.1 | % | 5.0 | % | 12,355 | 10.2 | % | 5.0 | % | ||||||||||||||
The following table sets forth the capital information for MSPBNA:
| At September 30, 2015 | At December 31, 2014 | |||||||||||||||||||||||
| U.S. Basel
III Transitional/ Standardized Approach | Required Capital Ratio(1) | U.S. Basel
III Transitional/ Basel I + Basel 2.5 Approach | Required Capital Ratio(1) | |||||||||||||||||||||
| Amount | Ratio | Amount | Ratio | |||||||||||||||||||||
| (dollars in millions) | ||||||||||||||||||||||||
Common Equity Tier 1 capital | $ | 3,433 | 23.0 | % | 6.5 | % | $ | 2,468 | 20.3 | % | 6.5 | % | ||||||||||||
Tier 1 capital | 3,433 | 23.0 | % | 8.0 | % | 2,468 | 20.3 | % | 8.0 | % | ||||||||||||||
Total capital | 3,447 | 23.1 | % | 10.0 | % | 2,480 | 20.4 | % | 10.0 | % | ||||||||||||||
Tier 1 leverage | 3,433 | 9.9 | % | 5.0 | % | 2,468 | 9.4 | % | 5.0 | % | ||||||||||||||
| (1) | Capital ratios required to be considered well-capitalized for U.S. regulatory purposes. |
Under regulatory capital requirements adopted by the U.S. federal banking agencies, U.S. depository institutions, in order to be considered well-capitalized, must maintain certain minimum capital ratios. Each U.S. depository institution subsidiary of the Company must be well-capitalized in order for the Company to continue to qualify as a financial holding company and to continue to engage in the broadest range of financial activities permitted for financial holding companies. At September 30, 2015 and December 31, 2014, the Company's U.S. Bank Subsidiaries maintained capital at levels in excess of the universally mandated well-capitalized requirements. The Company's U.S. Bank Subsidiaries maintained capital at levels sufficiently in excess of these "well capitalized" requirements to address any additional capital needs and requirements identified by the U.S. federal banking regulators.
| | 74 |
MORGAN STANLEY
NOTES TO CONDENSED CONSOLIDATED FINANCIAL STATEMENTS (Unaudited)-(Continued)
MS&Co. and Other Broker-Dealers.
Morgan Stanley & Co. LLC ("MS&Co.") is a registered broker-dealer and registered futures commission merchant and, accordingly, is subject to the minimum net capital requirements of the SEC and the U.S. Commodity Futures Trading Commission ("CFTC"). MS&Co. has consistently operated with capital in excess of its regulatory capital requirements. MS&Co.'s net capital totaled $9,533 million and $6,593 million at September 30, 2015 and December 31, 2014, respectively, which exceeded the amount required by $7,784 million and $4,928 million, respectively. MS&Co. is required to hold tentative net capital in excess of $1 billion and net capital in excess of $500 million in accordance with the market and credit risk standards of Appendix E of SEC Rule 15c3-1. MS&Co. is also required to notify the SEC in the event that its tentative net capital is less than $5 billion. At September 30, 2015 and December 31, 2014, MS&Co. had tentative net capital in excess of the minimum and the notification requirements.
Morgan Stanley Smith Barney LLC ("MSSB LLC") is a registered broker-dealer and introducing broker for the futures business and, accordingly, is subject to the minimum net capital requirements of the SEC and the CFTC. MSSB LLC has consistently operated with capital in excess of its regulatory capital requirements. MSSB LLC's net capital totaled $4,452 million and $4,620 million at September 30, 2015 and December 31, 2014, respectively, which exceeded the amount required by $4,295 million and $4,460 million, respectively.
Morgan Stanley & Co. International plc ("MSIP"), a London-based broker-dealer subsidiary, is subject to the capital requirements of the Prudential Regulation Authority, and Morgan Stanley MUFG Securities Co., Ltd. ("MSMS"), a Tokyo-based broker-dealer subsidiary, is subject to the capital requirements of the Financial Services Agency. MSIP and MSMS have consistently operated with capital in excess of their respective regulatory capital requirements.
Other Regulated Subsidiaries.
Certain other U.S. and non-U.S. subsidiaries of the Company are subject to various securities, commodities and banking regulations, and capital adequacy requirements promulgated by the regulatory and exchange authorities of the countries in which they operate. These subsidiaries have consistently operated with capital in excess of their local capital adequacy requirements.
Morgan Stanley Derivative Products Inc. ("MSDP"), a derivative products subsidiary rated A1 by Moody's and AA- by S&P, maintains certain operating restrictions that have been reviewed by Moody's and S&P. MSDP is operated such that creditors of the Company should not expect to have any claims on the assets of MSDP, unless and until the obligations to its own creditors are satisfied in full. Creditors of MSDP should not expect to have any claims on the assets of the Company or any of its affiliates, other than the respective assets of MSDP.
| 14. | Total Equity. |
Dividends and Share Repurchases.
In March 2015, the Company received no objection from the Board of Governors of the Federal Reserve System (the "Federal Reserve") to its 2015 capital plan. The capital plan included a share repurchase of up to $3.1 billion of the Company's outstanding common stock that began in the second quarter of 2015 through the end of the second quarter of 2016. Additionally, the capital plan included an increase in the Company's quarterly common stock dividend to $0.15 per share from $0.10 per share that began with the dividend declared on April 20, 2015. During the quarter and nine months ended September 30, 2015, the Company repurchased approximately $625 million and $1,500 million, respectively. During the quarter and nine months ended September 30, 2014, the Company repurchased approximately $195 million and $629 million, respectively, of the Company's outstanding common stock as part of its share repurchase program.
| 75 | |
MORGAN STANLEY
NOTES TO CONDENSED CONSOLIDATED FINANCIAL STATEMENTS (Unaudited)-(Continued)
Pursuant to the share repurchase program, the Company considers, among other things, business segment capital needs as well as equity-based compensation and benefit plan requirements. Share repurchases under the Company's program will be exercised from time to time at prices the Company deems appropriate subject to various factors, including the Company's capital position and market conditions. The share repurchases may be effected through open market purchases or privately negotiated transactions, including through Rule 10b5-1 plans, and may be suspended at any time. Share repurchases by the Company are subject to regulatory approval.
Preferred Stock.
Series J Preferred Stock.
On March 19, 2015, the Company issued 1,500,000 Depositary Shares, for an aggregate price of $1,500 million. Each Depositary Share represents a 1/25th interest in a share of perpetual Fixed-to-Floating Rate Non-Cumulative Preferred Stock, Series J, $0.01 par value ("Series J Preferred Stock"). The Series J Preferred Stock is redeemable at the Company's option, (i) in whole or in part, from time to time, on any dividend payment date on or after July 15, 2020 or (ii) in whole but not in part at any time within 90 days following a regulatory capital treatment event (as described in the terms of that series), in each case at a redemption price of $25,000 per share (equivalent to $1,000 per Depositary Share), plus any declared and unpaid dividends up to, but excluding, the date fixed for redemption, without accumulation of any undeclared dividends. The Series J Preferred Stock also has a preference over the Company's common stock upon liquidation. The Series J Preferred Stock offering (net of related issuance costs) resulted in proceeds of approximately $1,493 million.
For a description of Series A through Series I preferred stock issuances, see Note 15 to the consolidated financial statements in the 2014 Form 10-K.
The Company is authorized to issue 30 million shares of preferred stock. At September 30, 2015 and December 31, 2014, the Company's preferred stock outstanding consisted of the following (dollars in millions, except per share data):
Series | Shares Outstanding at September 30, 2015 | Liquidation Preference per Share | Carrying Value | |||||||||||||
| At September 30, 2015 | At December 31, 2014 | |||||||||||||||
A | 44,000 | $ | 25,000 | $ | 1,100 | $ | 1,100 | |||||||||
C | 519,882 | 1,000 | 408 | 408 | ||||||||||||
E | 34,500 | 25,000 | 862 | 862 | ||||||||||||
F | 34,000 | 25,000 | 850 | 850 | ||||||||||||
G | 20,000 | 25,000 | 500 | 500 | ||||||||||||
H | 52,000 | 25,000 | 1,300 | 1,300 | ||||||||||||
I | 40,000 | 25,000 | 1,000 | 1,000 | ||||||||||||
J | 60,000 | 25,000 | 1,500 | - | ||||||||||||
|
|
|
| |||||||||||||
Total | $ | 7,520 | $ | 6,020 | ||||||||||||
|
|
|
| |||||||||||||
The Company's preferred stock qualifies as Tier 1 capital in accordance with regulatory capital requirements (see Note 13).
During the quarters ended September 30, 2015 and 2014, dividends declared on the Company's outstanding preferred stock were $78 million and $62 million, respectively. During the nine months ended September 30, 2015 and 2014, dividends declared on the Company's outstanding preferred stock were $297 million and $192 million, respectively.
| | 76 |
MORGAN STANLEY
NOTES TO CONDENSED CONSOLIDATED FINANCIAL STATEMENTS (Unaudited)-(Continued)
Accumulated Other Comprehensive Income (Loss).
The following tables present changes in AOCI by component, net of noncontrolling interests, during the quarters ended September 30, 2015 and 2014:
| Foreign Currency Translation Adjustments | Change
in Net Unrealized Gains (Losses) on AFS Securities | Pensions, Postretirement and Other | Total | |||||||||||||
| (dollars in millions) | ||||||||||||||||
Balance at June 30, 2015 | $ | (833 | ) | $ | (101 | ) | $ | (513 | ) | $ | (1,447 | ) | ||||
|
|
|
|
|
|
|
| |||||||||
Other comprehensive income (loss) before reclassifications | (76 | ) | 111 | 2 | 37 | |||||||||||
Amounts reclassified from AOCI | - | (11 | ) | 2 | (9 | ) | ||||||||||
|
|
|
|
|
|
|
| |||||||||
Net other comprehensive income (loss) during the period | (76 | ) | 100 | 4 | 28 | |||||||||||
|
|
|
|
|
|
|
| |||||||||
Balance at September 30, 2015 | $ | (909 | ) | $ | (1 | ) | $ | (509 | ) | $ | (1,419 | ) | ||||
|
|
|
|
|
|
|
| |||||||||
Balance at June 30, 2014 | $ | (150 | ) | $ | (46 | ) | $ | (537 | ) | $ | (733 | ) | ||||
|
|
|
|
|
|
|
| |||||||||
Other comprehensive income (loss) before reclassifications | (265 | ) | (90 | ) | (18 | ) | (373 | ) | ||||||||
Amounts reclassified from AOCI | - | (12 | ) | 3 | (9 | ) | ||||||||||
|
|
|
|
|
|
|
| |||||||||
Net other comprehensive income (loss) during the period | (265 | ) | (102 | ) | (15 | ) | (382 | ) | ||||||||
|
|
|
|
|
|
|
| |||||||||
Balance at September 30, 2014 | $ | (415 | ) | $ | (148 | ) | $ | (552 | ) | $ | (1,115 | ) | ||||
|
|
|
|
|
|
|
| |||||||||
The Company had no significant reclassifications out of AOCI during the quarters ended September 30, 2015 and 2014.
| 77 | |
MORGAN STANLEY
NOTES TO CONDENSED CONSOLIDATED FINANCIAL STATEMENTS (Unaudited)-(Continued)
The following table presents changes in AOCI by component, net of noncontrolling interests, during the nine months ended September 30, 2015 and 2014:
| Foreign Currency Translation Adjustments | Change in Net Unrealized Gains (Losses) on AFS Securities | Pensions, Postretirement and Other | Total | |||||||||||||
| (dollars in millions) | ||||||||||||||||
Balance at December 31, 2014 | $ | (663 | ) | $ | (73 | ) | $ | (512 | ) | $ | (1,248 | ) | ||||
|
|
|
|
|
|
|
| |||||||||
Other comprehensive income (loss) before reclassifications | (246 | ) | 118 | (2 | ) | (130 | ) | |||||||||
Amounts reclassified from AOCI | - | (46 | ) | 5 | (41 | ) | ||||||||||
|
|
|
|
|
|
|
| |||||||||
Net other comprehensive income (loss) during the period | (246 | ) | 72 | 3 | (171 | ) | ||||||||||
|
|
|
|
|
|
|
| |||||||||
Balance at September 30, 2015 | $ | (909 | ) | $ | (1 | ) | $ | (509 | ) | $ | (1,419 | ) | ||||
|
|
|
|
|
|
|
| |||||||||
Balance at December 31, 2013 | $ | (266 | ) | $ | (282 | ) | $ | (545 | ) | $ | (1,093 | ) | ||||
|
|
|
|
|
|
|
| |||||||||
Other comprehensive income (loss) before reclassifications | (149 | ) | 156 | (16 | ) | (9 | ) | |||||||||
Amounts reclassified from AOCI | - | (22 | ) | 9 | (13 | ) | ||||||||||
|
|
|
|
|
|
|
| |||||||||
Net other comprehensive income (loss) during the period | (149 | ) | 134 | (7 | ) | (22 | ) | |||||||||
|
|
|
|
|
|
|
| |||||||||
Balance at September 30, 2014 | $ | (415 | ) | $ | (148 | ) | $ | (552 | ) | $ | (1,115 | ) | ||||
|
|
|
|
|
|
|
| |||||||||
The Company had no significant reclassifications out of AOCI during the nine months ended September 30, 2015 and 2014.
Nonredeemable Noncontrolling Interests.
Nonredeemable noncontrolling interests were $1,133 million and $1,204 million at September 30, 2015 and December 31, 2014, respectively. The reduction in nonredeemable noncontrolling interests was primarily due to the deconsolidation of certain legal entities associated with real estate funds sponsored by the Company in the second quarters of 2015 and 2014.
| | 78 |
MORGAN STANLEY
NOTES TO CONDENSED CONSOLIDATED FINANCIAL STATEMENTS (Unaudited)-(Continued)
| 15. | Earnings per Common Share. |
Basic earnings per common share ("EPS") is computed by dividing earnings applicable to Morgan Stanley common shareholders by the weighted average number of common shares outstanding for the period. Common shares outstanding include common stock and vested restricted stock units ("RSUs") where recipients have satisfied either the explicit vesting terms or retirement eligibility requirements. Diluted EPS reflects the assumed conversion of all dilutive securities. The Company calculates EPS using the two-class method, which allocates a portion of the Company's earnings to instruments granted in share-based payment transactions that are considered participating securities (see Note 2 to the consolidated financial statements in the 2014 Form 10-K). The following table presents the calculation of basic and diluted EPS (in millions, except for per share data):
| Three Months Ended September 30, | Nine Months Ended September 30, | |||||||||||||||
| 2015 | 2014 | 2015 | 2014 | |||||||||||||
Basic EPS: | ||||||||||||||||
Income from continuing operations | $ | 1,051 | $ | 1,757 | $ | 5,352 | $ | 5,259 | ||||||||
Income (loss) from discontinued operations | (2 | ) | (5 | ) | (9 | ) | (6 | ) | ||||||||
|
|
|
|
|
|
|
| |||||||||
Net income | 1,049 | 1,752 | 5,343 | 5,253 | ||||||||||||
Net income applicable to nonredeemable noncontrolling interests | 31 | 59 | 124 | 156 | ||||||||||||
|
|
|
|
|
|
|
| |||||||||
Net income applicable to Morgan Stanley | 1,018 | 1,693 | 5,219 | 5,097 | ||||||||||||
Less: Preferred dividends | (78 | ) | (62 | ) | (297 | ) | (192 | ) | ||||||||
Less: Allocation of (earnings) loss to participating RSUs(1): | ||||||||||||||||
From continuing operations | (1 | ) | (2 | ) | (4 | ) | (7 | ) | ||||||||
|
|
|
|
|
|
|
| |||||||||
Earnings applicable to Morgan Stanley common shareholders | $ | 939 | $ | 1,629 | $ | 4,918 | $ | 4,898 | ||||||||
|
|
|
|
|
|
|
| |||||||||
Weighted average common shares outstanding | 1,904 | 1,923 | 1,916 | 1,925 | ||||||||||||
|
|
|
|
|
|
|
| |||||||||
Earnings per basic common share: | ||||||||||||||||
Income from continuing operations | $ | 0.49 | $ | 0.85 | $ | 2.57 | $ | 2.55 | ||||||||
Income (loss) from discontinued operations | - | - | - | (0.01 | ) | |||||||||||
|
|
|
|
|
|
|
| |||||||||
Earnings per basic common share | $ | 0.49 | $ | 0.85 | $ | 2.57 | $ | 2.54 | ||||||||
|
|
|
|
|
|
|
| |||||||||
Diluted EPS: | ||||||||||||||||
Earnings applicable to Morgan Stanley common shareholders | $ | 939 | $ | 1,629 | $ | 4,918 | $ | 4,898 | ||||||||
Weighted average common shares outstanding | 1,904 | 1,923 | 1,916 | 1,925 | ||||||||||||
Effect of dilutive securities: |
| |||||||||||||||
Stock options and RSUs(1) | 45 | 48 | 42 | 45 | ||||||||||||
|
|
|
|
|
|
|
| |||||||||
Weighted average common shares outstanding and common stock equivalents | 1,949 | 1,971 | 1,958 | 1,970 | ||||||||||||
|
|
|
|
|
|
|
| |||||||||
Earnings per diluted common share: | ||||||||||||||||
Income from continuing operations | $ | 0.48 | $ | 0.83 | $ | 2.52 | $ | 2.49 | ||||||||
Income (loss) from discontinued operations | - | - | (0.01 | ) | - | |||||||||||
|
|
|
|
|
|
|
| |||||||||
Earnings per diluted common share | $ | 0.48 | $ | 0.83 | $ | 2.51 | $ | 2.49 | ||||||||
|
|
|
|
|
|
|
| |||||||||
| (1) | RSUs that are considered participating securities participate in all of the earnings of the Company in the computation of basic EPS, and, therefore, such RSUs are not included as incremental shares in the diluted calculation. |
| 79 | |
MORGAN STANLEY
NOTES TO CONDENSED CONSOLIDATED FINANCIAL STATEMENTS (Unaudited)-(Continued)
The following securities were considered antidilutive and, therefore, were excluded from the computation of diluted EPS:
| Three Months Ended September 30, | Nine Months Ended September 30, | |||||||||||||||
Number of Antidilutive Securities Outstanding at End of Period: | 2015 | 2014 | 2015 | 2014 | ||||||||||||
| (shares in millions) | ||||||||||||||||
Stock options | 11 | 13 | 11 | 13 | ||||||||||||
RSUs and performance-based stock units | 1 | 2 | 1 | 2 | ||||||||||||
|
|
|
|
|
|
|
| |||||||||
Total | 12 | 15 | 12 | 15 | ||||||||||||
|
|
|
|
|
|
|
| |||||||||
| 16. | Interest Income and Interest Expense. |
Details of Interest income and Interest expense were as follows:
| Three Months Ended September 30, | Nine Months Ended September 30, | |||||||||||||||
| 2015 | 2014 | 2015 | 2014 | |||||||||||||
| (dollars in millions) | ||||||||||||||||
Interest income(1): | ||||||||||||||||
Trading assets(2) | $ | 568 | $ | 508 | $ | 1,707 | $ | 1,520 | ||||||||
Investment securities | 211 | 162 | 650 | 449 | ||||||||||||
Loans | 560 | 474 | 1,573 | 1,220 | ||||||||||||
Interest bearing deposits with banks | 29 | 22 | 74 | 81 | ||||||||||||
Securities purchased under agreements to resell and Securities borrowed(3) | (99 | ) | (103 | ) | (404 | ) | (239 | ) | ||||||||
Customer receivables and Other(4) | 182 | 321 | 721 | 946 | ||||||||||||
|
|
|
|
|
|
|
| |||||||||
Total interest income | $ | 1,451 | $ | 1,384 | $ | 4,321 | $ | 3,977 | ||||||||
|
|
|
|
|
|
|
| |||||||||
Interest expense(1): | ||||||||||||||||
Deposits | $ | 17 | $ | 12 | $ | 51 | $ | 44 | ||||||||
Short-term borrowings | 7 | 1 | 16 | 3 | ||||||||||||
Long-term borrowings | 908 | 865 | 2,749 | 2,730 | ||||||||||||
Securities sold under agreements to repurchase and Securities loaned(5) | 254 | 301 | 797 | 930 | ||||||||||||
Customer payables and Other(6) | (497 | ) | (352 | ) | (1,348 | ) | (862 | ) | ||||||||
|
|
|
|
|
|
|
| |||||||||
Total interest expense | $ | 689 | $ | 827 | $ | 2,265 | $ | 2,845 | ||||||||
|
|
|
|
|
|
|
| |||||||||
Net interest | $ | 762 | $ | 557 | $ | 2,056 | $ | 1,132 | ||||||||
|
|
|
|
|
|
|
| |||||||||
| (1) | Interest income and expense are recorded within the Company's condensed consolidated statements of income depending on the nature of the instrument and related market conventions. When interest is included as a component of the instrument's fair value, interest is included within Trading revenues or Investments revenues. Otherwise, it is included within Interest income or Interest expense. |
| (2) | Interest expense on Trading liabilities is reported as a reduction to Interest income on Trading assets. |
| (3) | Includes fees paid on Securities borrowed. |
| (4) | Includes interest from Customer receivables and Other interest earning assets. |
| (5) | Includes fees received on Securities loaned. |
| (6) | Includes fees received from prime brokerage customers for stock loan transactions incurred to cover customers' short positions. |
| | 80 |
MORGAN STANLEY
NOTES TO CONDENSED CONSOLIDATED FINANCIAL STATEMENTS (Unaudited)-(Continued)
| 17. | Employee Benefit Plans. |
The Company sponsors various pension plans for the majority of its U.S. and non-U.S. employees. The Company provides certain other postretirement benefits, primarily health care and life insurance, to eligible U.S. employees. The Company also provides certain postemployment benefits to certain former employees or inactive employees prior to retirement.
The components of the Company's net periodic benefit expense for its pension and postretirement plans were as follows:
| Three Months Ended September 30, | Nine Months Ended September 30, | |||||||||||||||
| 2015 | 2014 | 2015 | 2014 | |||||||||||||
| (dollars in millions) | ||||||||||||||||
Service cost, benefits earned during the period | $ | 5 | $ | 6 | $ | 15 | $ | 18 | ||||||||
Interest cost on projected benefit obligation | 39 | 40 | 116 | 120 | ||||||||||||
Expected return on plan assets | (30 | ) | (27 | ) | (89 | ) | (82 | ) | ||||||||
Net amortization of prior service cost (credit) | (4 | ) | (3 | ) | (14 | ) | (9 | ) | ||||||||
Net amortization of actuarial loss | 6 | 6 | 19 | 18 | ||||||||||||
Curtailment loss | - | 3 | - | 3 | ||||||||||||
|
|
|
|
|
|
|
| |||||||||
Net periodic benefit expense | $ | 16 | $ | 25 | $ | 47 | $ | 68 | ||||||||
|
|
|
|
|
|
|
| |||||||||
| 18. | Income Taxes. |
The Company is under continuous examination by the Internal Revenue Service (the "IRS") and other tax authorities in certain countries, such as Japan and the United Kingdom ("U.K."), and in states in which the Company has significant business operations, such as New York. The Company is currently at various levels of field examination with respect to audits by the IRS, as well as New York State and New York City, for tax years 2009–2012 and 2007–2009, respectively. The IRS has substantially completed the field examination for the audit of tax years 2006–2008. The Company believes that the resolution of these tax matters will not have a material effect on the Company's condensed consolidated statements of financial condition, although a resolution could have a material impact on the Company's condensed consolidated statements of income for a particular future period and on the effective tax rate for any period in which such resolution occurs.
During the third quarter of 2015, the IRS completed an Appeals Office review of matters from tax years 1999-2005 and submitted a final report to the Congressional Joint Committee on Taxation for approval. The Company has reserved the right to contest certain items, the resolution of which is not expected to have a material impact on the effective tax rate or the Company's condensed consolidated financial statements.
During 2016, the Company expects to reach a conclusion with the U.K. tax authorities on substantially all issues through tax year 2010, the resolution of which is not expected to have a material impact on the effective tax rate or the Company's condensed consolidated financial statements.
The Company has established a liability for unrecognized tax benefits that the Company believes is adequate in relation to the potential for additional assessments. Once established, the Company adjusts unrecognized tax benefits only when more information is available or when an event occurs necessitating a change.
It is reasonably possible that significant changes in the gross balance of unrecognized tax benefits may occur within the next 12 months related to certain tax authority examinations referred to above. At this time, however, it is not possible to reasonably estimate the expected change to the total amount of unrecognized tax benefits and impact on the Company's effective tax rate over the next 12 months.
| 81 | |
MORGAN STANLEY
NOTES TO CONDENSED CONSOLIDATED FINANCIAL STATEMENTS (Unaudited)-(Continued)
The Company's effective tax rate from continuing operations for the nine months ended September 30, 2015 included a net discrete tax benefit of $564 million. This net discrete tax benefit was primarily associated with the repatriation of non-U.S. earnings at a cost lower than originally estimated due to an internal restructuring to simplify the Company's legal entity organization in the U.K.
The Company's effective tax rate from continuing operations for the quarter and nine months ended September 30, 2014 included a net discrete tax benefit of $237 million primarily associated with the repatriation of non-U.S. earnings at a cost lower than originally estimated. Additionally, the Company's effective tax rate from continuing operations for the nine months ended September 30, 2014 included a net discrete tax benefit of $609 million principally associated with remeasurement of reserves and related interest due to new information regarding the status of the IRS field examination referred to above.
| 19. | Segment and Geographic Information. |
Segment Information.
For a discussion about the Company's business segments, see Note 21 to the consolidated financial statements in the 2014 Form 10-K.
Selected financial information for the Company's business segments is presented below:
| Three Months Ended September 30, 2015 | ||||||||||||||||||||
| Institutional Securities | Wealth Management | Investment Management | Intersegment Eliminations | Total | ||||||||||||||||
| (dollars in millions) | ||||||||||||||||||||
Total non-interest revenues(1)(2) | $ | 3,889 | $ | 2,889 | $ | 278 | $ | (51 | ) | $ | 7,005 | |||||||||
Interest income | 825 | 777 | - | (151 | ) | 1,451 | ||||||||||||||
Interest expense | 810 | 26 | 4 | (151 | ) | 689 | ||||||||||||||
|
|
|
|
|
|
|
|
|
| |||||||||||
Net interest | 15 | 751 | (4 | ) | - | 762 | ||||||||||||||
|
|
|
|
|
|
|
|
|
| |||||||||||
Net revenues | $ | 3,904 | $ | 3,640 | $ | 274 | $ | (51 | ) | $ | 7,767 | |||||||||
|
|
|
|
|
|
|
|
|
| |||||||||||
Income (loss) from continuing operations before income taxes | $ | 688 | $ | 824 | $ | (38 | ) | $ | - | $ | 1,474 | |||||||||
Provision for (benefit from) income taxes | 141 | 315 | (33 | ) | - | 423 | ||||||||||||||
|
|
|
|
|
|
|
|
|
| |||||||||||
Income (loss) from continuing operations | 547 | 509 | (5 | ) | - | 1,051 | ||||||||||||||
|
|
|
|
|
|
|
|
|
| |||||||||||
Discontinued operations: | ||||||||||||||||||||
Income (loss) from discontinued operations before income taxes | (5 | ) | - | 1 | - | (4 | ) | |||||||||||||
Provision for (benefit from) income taxes | (2 | ) | - | - | - | (2 | ) | |||||||||||||
|
|
|
|
|
|
|
|
|
| |||||||||||
Income (loss) from discontinued operations | (3 | ) | - | 1 | - | (2 | ) | |||||||||||||
|
|
|
|
|
|
|
|
|
| |||||||||||
Net income (loss) | 544 | 509 | (4 | ) | - | 1,049 | ||||||||||||||
Net income applicable to nonredeemable noncontrolling interests | 26 | - | 5 | - | 31 | |||||||||||||||
|
|
|
|
|
|
|
|
|
| |||||||||||
Net income (loss) applicable to Morgan Stanley | $ | 518 | $ | 509 | $ | (9 | ) | $ | - | $ | 1,018 | |||||||||
|
|
|
|
|
|
|
|
|
| |||||||||||
| | 82 |
MORGAN STANLEY
NOTES TO CONDENSED CONSOLIDATED FINANCIAL STATEMENTS (Unaudited)-(Continued)
| Three Months Ended September 30, 2014 | ||||||||||||||||||||
| Institutional Securities | Wealth Management(3) | Investment Management(3) | Intersegment Eliminations | Total | ||||||||||||||||
| (dollars in millions) | ||||||||||||||||||||
Total non-interest revenues(1)(4)(5) | $ | 4,560 | $ | 3,174 | $ | 668 | $ | (52 | ) | $ | 8,350 | |||||||||
Interest income | 859 | 649 | - | (124 | ) | 1,384 | ||||||||||||||
Interest expense | 903 | 50 | 1 | (127 | ) | 827 | ||||||||||||||
|
|
|
|
|
|
|
|
|
| |||||||||||
Net interest | (44 | ) | 599 | (1 | ) | 3 | 557 | |||||||||||||
|
|
|
|
|
|
|
|
|
| |||||||||||
Net revenues | $ | 4,516 | $ | 3,773 | $ | 667 | $ | (49 | ) | $ | 8,907 | |||||||||
|
|
|
|
|
|
|
|
|
| |||||||||||
Income from continuing operations before income taxes | $ | 1,227 | $ | 800 | $ | 193 | $ | - | $ | 2,220 | ||||||||||
Provision for income taxes(6) | 89 | 321 | 53 | - | 463 | |||||||||||||||
|
|
|
|
|
|
|
|
|
| |||||||||||
Income from continuing operations | 1,138 | 479 | 140 | - | 1,757 | |||||||||||||||
|
|
|
|
|
|
|
|
|
| |||||||||||
Discontinued operations: | ||||||||||||||||||||
Income (loss) from discontinued operations before income taxes | (9 | ) | - | 1 | - | (8 | ) | |||||||||||||
Provision for (benefit from) income taxes | (3 | ) | - | - | - | (3 | ) | |||||||||||||
|
|
|
|
|
|
|
|
|
| |||||||||||
Income (loss) from discontinued operations | (6 | ) | - | 1 | - | (5 | ) | |||||||||||||
|
|
|
|
|
|
|
|
|
| |||||||||||
Net income | 1,132 | 479 | 141 | - | 1,752 | |||||||||||||||
Net income applicable to nonredeemable noncontrolling interests | 41 | - | 18 | - | 59 | |||||||||||||||
|
|
|
|
|
|
|
|
|
| |||||||||||
Net income applicable to Morgan Stanley | $ | 1,091 | $ | 479 | $ | 123 | $ | - | $ | 1,693 | ||||||||||
|
|
|
|
|
|
|
|
|
| |||||||||||
| Nine Months Ended September 30, 2015 | ||||||||||||||||||||
| Institutional Securities | Wealth Management | Investment Management | Intersegment Eliminations | Total | ||||||||||||||||
| (dollars in millions) | ||||||||||||||||||||
Total non-interest revenues(1)(2) | $ | 14,640 | $ | 9,172 | $ | 1,709 | $ | (160 | ) | $ | 25,361 | |||||||||
Interest income | 2,418 | 2,296 | 1 | (394 | ) | 4,321 | ||||||||||||||
Interest expense | 2,524 | 119 | 16 | (394 | ) | 2,265 | ||||||||||||||
|
|
|
|
|
|
|
|
|
| |||||||||||
Net interest | (106 | ) | 2,177 | (15 | ) | - | 2,056 | |||||||||||||
|
|
|
|
|
|
|
|
|
| |||||||||||
Net revenues | $ | 14,534 | $ | 11,349 | $ | 1,694 | $ | (160 | ) | $ | 27,417 | |||||||||
|
|
|
|
|
|
|
|
|
| |||||||||||
Income from continuing operations before income taxes | $ | 4,123 | $ | 2,564 | $ | 369 | $ | - | $ | 7,056 | ||||||||||
Provision for income taxes(6) | 658 | 959 | 87 | - | 1,704 | |||||||||||||||
|
|
|
|
|
|
|
|
|
| |||||||||||
Income from continuing operations | 3,465 | 1,605 | 282 | - | 5,352 | |||||||||||||||
|
|
|
|
|
|
|
|
|
| |||||||||||
Discontinued operations: | ||||||||||||||||||||
Income (loss) from discontinued operations before income taxes | (14 | ) | - | 1 | - | (13 | ) | |||||||||||||
Provision for (benefit from) income taxes | (4 | ) | - | - | - | (4 | ) | |||||||||||||
|
|
|
|
|
|
|
|
|
| |||||||||||
Income (loss) from discontinued operations | (10 | ) | - | 1 | - | (9 | ) | |||||||||||||
|
|
|
|
|
|
|
|
|
| |||||||||||
Net income | 3,455 | 1,605 | 283 | - | 5,343 | |||||||||||||||
Net income applicable to nonredeemable noncontrolling interests | 100 | - | 24 | - | 124 | |||||||||||||||
|
|
|
|
|
|
|
|
|
| |||||||||||
Net income applicable to Morgan Stanley | $ | 3,355 | $ | 1,605 | $ | 259 | $ | - | $ | 5,219 | ||||||||||
|
|
|
|
|
|
|
|
|
| |||||||||||
| 83 | |
MORGAN STANLEY
NOTES TO CONDENSED CONSOLIDATED FINANCIAL STATEMENTS (Unaudited)-(Continued)
| Nine Months Ended September 30, 2014 | ||||||||||||||||||||
| Institutional Securities | Wealth Management(3) | Investment Management(3) | Intersegment Eliminations | Total | ||||||||||||||||
| (dollars in millions) | ||||||||||||||||||||
Total non-interest revenues(1)(4)(5) | $ | 14,016 | $ | 9,370 | $ | 2,136 | $ | (143 | ) | $ | 25,379 | |||||||||
Interest income | 2,498 | 1,846 | 2 | (369 | ) | 3,977 | ||||||||||||||
Interest expense | 3,073 | 132 | 14 | (374 | ) | 2,845 | ||||||||||||||
|
|
|
|
|
|
|
|
|
| |||||||||||
Net interest | (575 | ) | 1,714 | (12 | ) | 5 | 1,132 | |||||||||||||
|
|
|
|
|
|
|
|
|
| |||||||||||
Net revenues | $ | 13,441 | $ | 11,084 | $ | 2,124 | $ | (138 | ) | $ | 26,511 | |||||||||
|
|
|
|
|
|
|
|
|
| |||||||||||
Income from continuing operations before income taxes | $ | 3,603 | $ | 2,249 | $ | 670 | $ | - | $ | 6,522 | ||||||||||
Provision for income taxes(6) | 171 | 882 | 210 | - | 1,263 | |||||||||||||||
|
|
|
|
|
|
|
|
|
| |||||||||||
Income from continuing operations | 3,432 | 1,367 | 460 | - | 5,259 | |||||||||||||||
|
|
|
|
|
|
|
|
|
| |||||||||||
Discontinued operations: | ||||||||||||||||||||
Income (loss) from discontinued operations before income taxes | (18 | ) | - | 7 | - | (11 | ) | |||||||||||||
Provision for (benefit from) income taxes | (7 | ) | - | 2 | - | (5 | ) | |||||||||||||
|
|
|
|
|
|
|
|
|
| |||||||||||
Income (loss) from discontinued operations | (11 | ) | - | 5 | - | (6 | ) | |||||||||||||
|
|
|
|
|
|
|
|
|
| |||||||||||
Net income | 3,421 | 1,367 | 465 | - | 5,253 | |||||||||||||||
Net income applicable to nonredeemable noncontrolling interests | 77 | - | 79 | - | 156 | |||||||||||||||
|
|
|
|
|
|
|
|
|
| |||||||||||
Net income applicable to Morgan Stanley | $ | 3,344 | $ | 1,367 | $ | 386 | $ | - | $ | 5,097 | ||||||||||
|
|
|
|
|
|
|
|
|
| |||||||||||
| (1) | In certain management fee arrangements, the Company is entitled to receive performance-based fees (also referred to as incentive fees) when the return on assets under management exceeds certain benchmark returns or other performance targets. In such arrangements, performance fee revenue is accrued (or reversed) quarterly based on measuring account fund performance to date versus the performance benchmark stated in the investment management agreement. The Company's portion of unrealized cumulative performance-based fee revenue at risk of reversing if fund performance falls below stated investment management agreement benchmarks was approximately $456 million at September 30, 2015 and approximately $634 million at December 31, 2014 (see Note 2 to the Company's consolidated financial statements in the 2014 Form 10-K). See also Note 11 for information regarding general partner guarantees which include potential obligations to return performance fee distributions previously received. |
| (2) | During the quarter and nine months ended September 30, 2015, Other revenues included losses within the Company's Institutional Securities business segment as a result of write-downs on loans and lending commitments held for sale, which were partially offset by gains on the sales of investment securities within the Company's Wealth Management business segment. |
| (3) | On October 1, 2014, the Managed Futures business was transferred from the Company's Wealth Management business segment to the Company's Investment Management business segment. All prior-period amounts have been recast to conform to the current year's presentation. |
| (4) | In September 2014, the Company sold a retail property space resulting in a gain on sale of $141 million (within Institutional Securities $84 million, Wealth Management $40 million and Investment Management $17 million), which was included within Other revenues on the condensed consolidated statement of income. |
| (5) | On July 1, 2014, the Company completed the sale of its ownership stake in TransMontaigne. The gain on sale, which was included in continuing operations, was approximately $101 million (within the Company's Institutional Securities business segment) for the quarter and nine months ended September 30, 2014. |
| (6) | The Company's effective tax rate from continuing operations for the nine months ended September 30, 2015 included a net discrete tax benefit of $564 million (within the Company's Institutional Securities business segment). The Company's effective tax rate from continuing operations for the quarter and nine months ended September 30, 2014 included a net discrete tax benefit of $237 million and $846 million, respectively (primarily within the Company's Institutional Securities business segment) (see Note 18). |
| | 84 |
MORGAN STANLEY
NOTES TO CONDENSED CONSOLIDATED FINANCIAL STATEMENTS (Unaudited)-(Continued)
Total Assets(1) | Institutional Securities | Wealth Management | Investment Management | Total | ||||||||||||
| (dollars in millions) | ||||||||||||||||
At September 30, 2015 | $ | 658,867 | $ | 170,295 | $ | 4,951 | $ | 834,113 | ||||||||
At December 31, 2014 | $ | 630,341 | $ | 165,147 | $ | 6,022 | $ | 801,510 | ||||||||
| (1) | Corporate assets have been fully allocated to the Company's business segments. |
Geographic Information.
For a discussion about the Company's geographic net revenues, see Note 21 to the consolidated financial statements in the 2014 Form 10-K.
| Three Months Ended September 30, | Nine Months Ended September 30, | |||||||||||||||
Net Revenues | 2015 | 2014 | 2015 | 2014 | ||||||||||||
| (dollars in millions) | ||||||||||||||||
Americas | $ | 5,652 | $ | 6,308 | $ | 19,359 | $ | 19,022 | ||||||||
EMEA | 1,198 | 1,271 | 4,396 | 4,191 | ||||||||||||
Asia-Pacific | 917 | 1,328 | 3,662 | 3,298 | ||||||||||||
|
|
|
|
|
|
|
| |||||||||
Net revenues | $ | 7,767 | $ | 8,907 | $ | 27,417 | $ | 26,511 | ||||||||
|
|
|
|
|
|
|
| |||||||||
| 20. | Subsequent Events. |
The Company has evaluated subsequent events for adjustment to or disclosure in its condensed consolidated financial statements through the date of this report, and has not identified any recordable or disclosable events, not otherwise reported in these condensed consolidated financial statements or the notes thereto, except for the following:
Global Oil Merchanting Business.
The Company closed the sale of its global oil merchanting unit of the commodities division to Castleton Commodities International LLC on November 1, 2015.
Common Stock Dividend.
On October 19, 2015, the Company announced that its Board of Directors declared a quarterly dividend per common share of $0.15. The dividend is payable on November 13, 2015 to common shareholders of record on October 30, 2015 (see Note 14).
Long-Term Borrowings.
Subsequent to September 30, 2015 and through October 30, 2015, the Company's long-term borrowings decreased by approximately $2.3 billion, net of issuances.
| 85 | |
REPORT OF INDEPENDENT REGISTERED PUBLIC ACCOUNTING FIRM
To the Board of Directors and Shareholders of Morgan Stanley:
We have reviewed the accompanying condensed consolidated statement of financial condition of Morgan Stanley and subsidiaries (the "Company") as of September 30, 2015, and the related condensed consolidated statements of income and comprehensive income for the three-month and nine-month periods ended September 30, 2015 and 2014, and the condensed consolidated statements of cash flows and changes in total equity for the nine-month periods ended September 30, 2015 and 2014. These interim condensed consolidated financial statements are the responsibility of the management of the Company.
We conducted our reviews in accordance with the standards of the Public Company Accounting Oversight Board (United States). A review of interim financial information consists principally of applying analytical procedures and making inquiries of persons responsible for financial and accounting matters. It is substantially less in scope than an audit conducted in accordance with the standards of the Public Company Accounting Oversight Board (United States), the objective of which is the expression of an opinion regarding the financial statements taken as a whole. Accordingly, we do not express such an opinion.
Based on our reviews, we are not aware of any material modifications that should be made to such condensed consolidated financial statements for them to be in conformity with accounting principles generally accepted in the United States of America.
We have previously audited, in accordance with the standards of the Public Company Accounting Oversight Board (United States), the consolidated statement of financial condition of the Company as of December 31, 2014, and the consolidated statements of income, comprehensive income, cash flows and changes in total equity for the year then ended (not presented herein) included in the Company's Annual Report on Form 10-K; and in our report dated March 2, 2015, we expressed an unqualified opinion on those consolidated financial statements. In our opinion, the information set forth in the accompanying condensed consolidated statement of financial condition as of December 31, 2014 is fairly stated, in all material respects, in relation to the consolidated statement of financial condition from which it has been derived.
/s/ Deloitte & Touche LLP
New York, New York
November 3, 2015
| 86 |
| Item 2. | Management's Discussion and Analysis of Financial Condition and Results of Operations. |
Introduction.
Morgan Stanley, a financial holding company, is a global financial services firm that maintains significant market positions in each of its business segments-Institutional Securities, Wealth Management and Investment Management. Morgan Stanley, through its subsidiaries and affiliates, provides a wide variety of products and services to a large and diversified group of clients and customers, including corporations, governments, financial institutions and individuals. Unless the context otherwise requires, the terms "Morgan Stanley" or the "Company" mean Morgan Stanley (the "Parent") together with its consolidated subsidiaries.
A brief summary of the activities of each of the Company's business segments is as follows:
Institutional Securities provides financial advisory and capital-raising services, including: advice on mergers and acquisitions, restructurings, real estate and project finance; corporate lending; sales, trading, financing and market-making activities in equity and fixed income securities and related products, including foreign exchange and commodities; and investment activities.
Wealth Management provides brokerage and investment advisory services to individual investors and small-to-medium sized businesses and institutions covering various investment alternatives; financial and wealth planning services; annuity and other insurance products; credit and other lending products; cash management services; and retirement services; and engages in fixed income trading, which primarily facilitates clients' trading or investments in such securities.
Investment Management provides a broad array of investment strategies that span the risk/return spectrum across geographies, asset classes, and public and private markets to a diverse group of clients across the institutional and intermediary channels as well as high net worth clients.
The results of operations in the past have been, and in the future may continue to be, materially affected by many factors, including: the effect of economic and political conditions and geopolitical events; sovereign risk; the effect of market conditions, particularly in the global equity, fixed income, currency, credit and commodities markets, including corporate and mortgage (commercial and residential) lending and commercial real estate markets and energy markets; the impact of current, pending and future legislation (including the Dodd-Frank Wall Street Reform and Consumer Protection Act (the "Dodd-Frank Act")), regulation (including capital, leverage and liquidity requirements), policies (including fiscal and monetary), and legal and regulatory actions in the United States of America ("U.S.") and worldwide; the level and volatility of equity, fixed income and commodity prices (including oil prices), interest rates, currency values and other market indices; the availability and cost of both credit and capital as well as the credit ratings assigned to the Company's unsecured short-term and long-term debt; investor, consumer and business sentiment and confidence in the financial markets; the performance of the Company's acquisitions, divestitures, joint ventures, strategic alliances or other strategic arrangements; the Company's reputation and the general perception of the financial services industry; inflation, natural disasters, pandemics and acts of war or terrorism; the actions and initiatives of current and potential competitors as well as governments, regulators and self-regulatory organizations; the effectiveness of the Company's risk management policies; technological changes and risks and cybersecurity risks (including cyber attacks and business continuity risks); or a combination of these or other factors. In addition, legislative, legal and regulatory developments related to the Company's businesses are likely to increase costs, thereby affecting results of operations. These factors also may have an adverse impact on the Company's ability to achieve its strategic objectives. For a further discussion of these and other important factors that could affect the Company's business, see "Business-Competition" and "Business-Supervision and Regulation" in Part I, Item 1, "Risk Factors" in Part I, Item 1A of the Company's Annual Report on Form 10-K for the year ended December 31, 2014 (the "2014 Form 10-K") and "Liquidity and Capital Resources-Regulatory Requirements" herein.
The discussion of the Company's results of operations below may contain forward-looking statements. These statements, which reflect management's beliefs and expectations, are subject to risks and uncertainties that may
| 87 | |
cause actual results to differ materially. For a discussion of the risks and uncertainties that may affect the Company's future results, see "Forward-Looking Statements" immediately preceding Part I, Item 1, "Business-Competition" and "Business-Supervision and Regulation" in Part I, Item 1, "Risk Factors" in Part I, Item 1A of the 2014 Form 10-K and "Liquidity and Capital Resources-Regulatory Requirements" herein.
Executive Summary.
Overview of Financial Results.
Consolidated Results for the Quarter Ended September 30, 2015.
The Company reported net revenues of $7,767 million for the quarter ended September 30, 2015 ("current quarter") compared with $8,907 million in the quarter ended September 30, 2014 ("prior year quarter"). Net revenues in the current quarter included positive revenues due to the impact of debt valuation adjustment ("DVA") of $435 million compared with positive revenues of $215 million in the prior year quarter. For the current quarter, net income applicable to Morgan Stanley was $1,018 million, or $0.48 per diluted common share, compared with net income of $1,693 million, or $0.83 per diluted common share, for the prior year quarter. The earnings for the prior year quarter included a net discrete tax benefit of $237 million or $0.12 per diluted common share, primarily associated with the repatriation of non-U.S. earnings at a cost lower than originally estimated.
Excluding DVA, net revenues for the current quarter were $7,332 million compared with $8,692 million in the prior year quarter. Excluding DVA and the net discrete tax benefit in the prior year quarter, net income applicable to Morgan Stanley was $740 million, or $0.34 per diluted common share in the current quarter, compared with $1,319 million, or $0.64 per diluted common share in the prior year quarter.
Net revenues of $7,767 million were 13% lower than the prior year quarter. Institutional Securities net revenues were $3,904 million in the current quarter, down 14% compared with $4,516 million in the prior year quarter, primarily as a result of lower underwriting revenues, lower fixed income product sales and trading net revenues and lower Other revenues. Wealth Management net revenues of $3,640 million in the current quarter decreased 4% from $3,773 million in the prior year quarter, primarily as a result of lower transactional revenues and lower Other revenues, partially offset by an increase in net interest income. Investment Management net revenues were $274 million in the current quarter, down 59% from $667 million in the prior year quarter, primarily reflecting the reversal of previously accrued carried interest associated with Asia private equity and lower results in the Traditional Asset Management business.
Total non-interest expenses of $6,293 million in the current quarter were down 6% compared to the prior year quarter. Compensation expenses of $3,437 million in the current quarter decreased 18% from $4,214 million in the prior year quarter. The decrease was due to a combination of a decrease in discretionary incentive compensation driven by lower revenues, a decrease in amortization due to accelerated vesting of certain awards during the fourth quarter of 2014 and a decrease in fair value of deferred compensation plan referenced investments and carried interest, partially offset by a reduction of average deferral rates for discretionary incentive based awards. Non-compensation expenses were $2,856 million during the current quarter, compared with $2,473 million in the prior year quarter, representing a 15% increase primarily as a result of an increase in Other non-interest expenses related to the settlement of a credit default swap ("CDS") antitrust litigation matter in the Company's Institutional Securities business segment and other matters.
The annualized return on average common equity from continuing operations was 5.6% in the current quarter, or 3.9% excluding DVA. The annualized return on average common equity from continuing operations for the prior year quarter was 9.9%, or 8.9% excluding DVA, and 7.5% excluding DVA and the net discrete tax benefit.
Consolidated Results for the Nine Months Ended September 30, 2015.
For the nine months ended September 30, 2015, the Company reported net revenues of $27,417 million compared with $26,511 million in the prior year period. Net revenues in the current nine-month period included
| | 88 |
positive revenues due to the impact of DVA of $742 million compared with positive revenues of $428 million in the prior year period. For the nine months ended September 30, 2015, net income applicable to Morgan Stanley was $5,219 million, or $2.51 per diluted common share, compared with net income applicable to Morgan Stanley of $5,097 million, or $2.49 per diluted common share, in the prior year period. The earnings for the nine months ended September 30, 2015 included a net discrete tax benefit of $564 million or $0.29 per diluted common share, associated with the repatriation of non-U.S. earnings at a cost lower than originally estimated. The earnings for the nine months ended September 30, 2014 included a net discrete tax benefit of $846 million or $0.43 per diluted common share, composed of a net discrete tax benefit primarily associated with the repatriation of non-U.S. earnings at a cost lower than originally estimated and a net discrete tax benefit principally associated with remeasurement of reserves and related interest due to new information regarding the status of a multi-year tax authority examination.
Excluding DVA, net revenues for the nine months ended September 30, 2015 were $26,675 million compared with $26,083 million in the prior year period. Excluding DVA and the net discrete tax benefit in each period, net income applicable to Morgan Stanley was $4,178 million, or $1.98 per diluted common share for the nine months ended September 30, 2015, compared with $3,978 million, or $1.92 per diluted common share in the prior year period.
Net revenues of $27,417 million for the nine months ended September 30, 2015 were up 3% compared to the prior year period. Institutional Securities net revenues were $14,534 million for the nine months ended September 30, 2015, up 8% compared with $13,441 million in the prior year period, resulting primarily from higher sales and trading net revenues for equity products. Wealth Management net revenues of $11,349 million for the nine months ended September 30, 2015 increased 2% from $11,084 million a year ago as a result of an increase in net interest income and higher asset management revenues, partially offset by lower transactional revenues. Investment Management net revenues were $1,694 million for the nine months ended September 30, 2015, down 20% from $2,124 million in the prior year period, primarily reflecting the reversal of previously accrued carried interest and markdowns on principal investments in the Company's Merchant Banking and Real Estate Investing businesses and lower net investment gains in the Traditional Asset Management business.
Total non-interest expenses of $20,361 million for the nine months ended September 30, 2015 were up 2% compared to the prior year period. Compensation expenses of $12,366 million for the nine months ended September 30, 2015 decreased 3% from $12,720 million in the prior year period primarily due to a decrease in amortization resulting from accelerated vesting of certain awards during the fourth quarter of 2014 and a decrease in the fair value of deferred compensation plan referenced investments and carried interest, partially offset by an increase in discretionary incentive compensation driven by higher revenues and a reduction of average deferral rates for discretionary incentive based awards. Non-compensation expenses were $7,995 million for the nine months ended September 30, 2015, compared with $7,269 million in the prior year period, representing a 10% increase due to higher Other non-interest expenses and higher Professional services expenses.
The annualized return on average common equity from continuing operations was 9.9% for the nine months ended September 30, 2015, or 8.8% excluding DVA and 7.7% excluding DVA and the net discrete tax benefit. The annualized return on average common equity from continuing operations for the prior year period was 10.1%, or 9.4% excluding DVA, and 7.7% excluding DVA and the net discrete tax benefit.
| 89 | |
Financial Information and Statistical Data (dollars in millions, except where noted and per share amounts).
| Three Months Ended September 30, | Nine Months Ended September 30, | |||||||||||||||
| 2015 | 2014 | 2015 | 2014 | |||||||||||||
Net revenues: | ||||||||||||||||
Institutional Securities | $ | 3,904 | $ | 4,516 | $ | 14,534 | $ | 13,441 | ||||||||
Wealth Management(1) | 3,640 | 3,773 | 11,349 | 11,084 | ||||||||||||
Investment Management(1) | 274 | 667 | 1,694 | 2,124 | ||||||||||||
Intersegment Eliminations | (51 | ) | (49 | ) | (160 | ) | (138 | ) | ||||||||
|
|
|
|
|
|
|
| |||||||||
Consolidated net revenues | $ | 7,767 | $ | 8,907 | $ | 27,417 | $ | 26,511 | ||||||||
|
|
|
|
|
|
|
| |||||||||
Income (loss) from continuing operations applicable to Morgan Stanley: | ||||||||||||||||
Institutional Securities(2) | $ | 521 | $ | 1,097 | $ | 3,365 | $ | 3,355 | ||||||||
Wealth Management(1) | 509 | 479 | 1,605 | 1,367 | ||||||||||||
Investment Management(1)(2) | (10 | ) | 122 | 258 | 381 | |||||||||||
|
|
|
|
|
|
|
| |||||||||
Income from continuing operations applicable to Morgan Stanley | $ | 1,020 | $ | 1,698 | $ | 5,228 | $ | 5,103 | ||||||||
Income (loss) from discontinued operations applicable to Morgan Stanley | (2 | ) | (5 | ) | (9 | ) | (6 | ) | ||||||||
|
|
|
|
|
|
|
| |||||||||
Net income applicable to Morgan Stanley | $ | 1,018 | $ | 1,693 | $ | 5,219 | $ | 5,097 | ||||||||
Preferred stock dividend and other | 79 | 64 | 301 | 199 | ||||||||||||
|
|
|
|
|
|
|
| |||||||||
Earnings applicable to Morgan Stanley common shareholders | $ | 939 | $ | 1,629 | $ | 4,918 | $ | 4,898 | ||||||||
|
|
|
|
|
|
|
| |||||||||
Earnings per basic common share(3) | $ | 0.49 | $ | 0.85 | $ | 2.57 | $ | 2.54 | ||||||||
Earnings per diluted common share(3) | $ | 0.48 | $ | 0.83 | $ | 2.51 | $ | 2.49 | ||||||||
Regional net revenues(4): | ||||||||||||||||
Americas | $ | 5,652 | $ | 6,308 | $ | 19,359 | $ | 19,022 | ||||||||
EMEA | 1,198 | 1,271 | 4,396 | 4,191 | ||||||||||||
Asia-Pacific | 917 | 1,328 | 3,662 | 3,298 | ||||||||||||
|
|
|
|
|
|
|
| |||||||||
Net revenues | $ | 7,767 | $ | 8,907 | $ | 27,417 | $ | 26,511 | ||||||||
|
|
|
|
|
|
|
| |||||||||
Effective income tax rate from continuing operations | 28.7 | % | 20.9 | % | 24.1 | % | 19.4 | % | ||||||||
| | 90 |
| At September 30, 2015 | At December 31, 2014 | |||||||
Total loans(5) | $ | 78,209 | $ | 66,577 | ||||
Total assets | $ | 834,113 | $ | 801,510 | ||||
Global Liquidity Reserve managed by bank and non-bank legal entities(6): | ||||||||
Bank legal entities | $ | 88,645 | $ | 87,944 | ||||
Non-bank legal entities | 102,220 | 105,225 | ||||||
|
|
|
| |||||
Total | $ | 190,865 | $ | 193,169 | ||||
|
|
|
| |||||
Total deposits | $ | 147,226 | $ | 133,544 | ||||
Long-term borrowings | $ | 160,343 | $ | 152,772 | ||||
Maturities of long-term borrowings outstanding (next 12 months) | $ | 25,022 | $ | 20,740 | ||||
Book value per common share(7) | $ | 34.97 | $ | 33.25 | ||||
Capital ratios (Advanced/Transitional)(8): | ||||||||
Common Equity Tier 1 capital ratio | 14.0 | % | 12.6 | % | ||||
Tier 1 capital ratio | 15.6 | % | 14.1 | % | ||||
Total capital ratio | 18.6 | % | 16.4 | % | ||||
Tier 1 leverage ratio(9) | 8.1 | % | 7.9 | % | ||||
Assets under management or supervision (dollars in billions)(1)(10)(11): | ||||||||
Wealth Management | $ | 759 | $ | 778 | ||||
Investment Management | 404 | 403 | ||||||
|
|
|
| |||||
Total | $ | 1,163 | $ | 1,181 | ||||
|
|
|
| |||||
Worldwide employees | 56,267 | 55,802 | ||||||
| 91 | |
Selected Non-GAAP Financial Information (dollars in millions, except where noted and per share amounts)(12).
| Three Months Ended September 30, | Nine Months Ended September 30, | |||||||||||||||
| 2015 | 2014 | 2015 | 2014 | |||||||||||||
Pre-tax profit margin(13): | ||||||||||||||||
Institutional Securities | 18 | % | 27 | % | 28 | % | 27 | % | ||||||||
Wealth Management | 23 | % | 21 | % | 23 | % | 20 | % | ||||||||
Investment Management | N/M | 29 | % | 22 | % | 32 | % | |||||||||
Consolidated | 19 | % | 25 | % | 26 | % | 25 | % | ||||||||
Average common equity (dollars in billions)(14): | ||||||||||||||||
Institutional Securities | $ | 33.8 | $ | 32.6 | $ | 35.4 | $ | 32.1 | ||||||||
Wealth Management | 11.4 | 11.2 | 10.9 | 11.3 | ||||||||||||
Investment Management | 2.1 | 3.1 | 2.2 | 2.9 | ||||||||||||
Parent capital | 20.3 | 19.3 | 18.2 | 18.4 | ||||||||||||
|
|
|
|
|
|
|
| |||||||||
Consolidated average common equity | $ | 67.6 | $ | 66.2 | $ | 66.7 | $ | 64.7 | ||||||||
|
|
|
|
|
|
|
| |||||||||
Return on average common equity from continuing operations(15): | ||||||||||||||||
Institutional Securities | 5.6 | % | 13.0 | % | 12.0 | % | 13.5 | % | ||||||||
Wealth Management | 16.8 | % | 16.2 | % | 18.1 | % | 15.2 | % | ||||||||
Investment Management | N/M | 15.8 | % | 15.4 | % | 17.7 | % | |||||||||
Consolidated | 5.6 | % | 9.9 | % | 9.9 | % | 10.1 | % | ||||||||
Average tangible common equity (dollars in billions)(16) | $ | 57.9 | $ | 56.5 | $ | 57.0 | $ | 54.9 | ||||||||
Return on average tangible common equity from continuing operations(17) | 6.5 | % | 11.6 | % | 11.5 | % | 11.9 | % | ||||||||
Selected financial measures excluding DVA: | ||||||||||||||||
Net revenues | $ | 7,332 | $ | 8,692 | $ | 26,675 | $ | 26,083 | ||||||||
Net income applicable to Morgan Stanley | $ | 740 | $ | 1,556 | $ | 4,742 | $ | 4,824 | ||||||||
Earnings per diluted common share | $ | 0.34 | $ | 0.76 | $ | 2.27 | $ | 2.35 | ||||||||
Return on average common equity from continuing operations(15) | 3.9 | % | 8.9 | % | 8.8 | % | 9.4 | % | ||||||||
Return on average tangible common equity from continuing operations(17) | 4.5 | % | 10.4 | % | 10.3 | % | 11.0 | % | ||||||||
| At September 30, 2015 | At December 31, 2014 | |||||||||||
Tangible book value per common share(18) | $ 29.99 | $ 28.26 | ||||||||||
| | 92 |
Reconciliation of selected financial measures from a non-GAAP to a U.S. GAAP basis (dollars in millions, except per share amounts)(12).
| Three Months Ended September 30, | Nine Months Ended September 30, | |||||||||||||||
| 2015 | 2014 | 2015 | 2014 | |||||||||||||
Net revenues | ||||||||||||||||
Net revenues-non-GAAP | $ | 7,332 | $ | 8,692 | $ | 26,675 | $ | 26,083 | ||||||||
Impact of DVA | 435 | 215 | 742 | 428 | ||||||||||||
|
|
|
|
|
|
|
| |||||||||
Net revenues-U.S. GAAP | $ | 7,767 | $ | 8,907 | $ | 27,417 | $ | 26,511 | ||||||||
|
|
|
|
|
|
|
| |||||||||
Net income applicable to Morgan Stanley | ||||||||||||||||
Net income applicable to Morgan Stanley, excluding DVA and net discrete tax benefit-non-GAAP | $ | 740 | $ | 1,319 | $ | 4,178 | $ | 3,978 | ||||||||
Impact of net discrete tax benefit | N/A | 237 | 564 | 846 | ||||||||||||
|
|
|
|
|
|
|
| |||||||||
Net income applicable to Morgan Stanley, excluding DVA-non-GAAP | $ | 740 | $ | 1,556 | $ | 4,742 | $ | 4,824 | ||||||||
Impact of DVA | 278 | 137 | 477 | 273 | ||||||||||||
|
|
|
|
|
|
|
| |||||||||
Net income applicable to Morgan Stanley-U.S. GAAP | $ | 1,018 | $ | 1,693 | $ | 5,219 | $ | 5,097 | ||||||||
|
|
|
|
|
|
|
| |||||||||
Earnings per diluted common share | ||||||||||||||||
Earnings per diluted common share, excluding DVA and net discrete tax benefit-non-GAAP | $ | 0.34 | $ | 0.64 | $ | 1.98 | $ | 1.92 | ||||||||
Impact of net discrete tax benefit | N/A | 0.12 | 0.29 | 0.43 | ||||||||||||
|
|
|
|
|
|
|
| |||||||||
Earnings per diluted common share, excluding DVA-non-GAAP | $ | 0.34 | $ | 0.76 | $ | 2.27 | $ | 2.35 | ||||||||
Impact of DVA | 0.14 | 0.07 | 0.24 | 0.14 | ||||||||||||
|
|
|
|
|
|
|
| |||||||||
Earnings per diluted common share-U.S. GAAP | $ | 0.48 | $ | 0.83 | $ | 2.51 | $ | 2.49 | ||||||||
|
|
|
|
|
|
|
| |||||||||
Effective income tax rate from continuing operations-non-GAAP | 28.7 | % | 31.5 | % | 32.1 | % | 32.3 | % | ||||||||
Impact of net discrete tax benefit | N/A | 10.6 | % | 8.0 | % | 12.9 | % | |||||||||
Effective income tax rate from continuing operations-U.S. GAAP | 28.7 | % | 20.9 | % | 24.1 | % | 19.4 | % | ||||||||
| Reconciliation of return on average common equity from continuing operations, excluding DVA and net discrete tax benefit to return on average common equity (all non-GAAP measures)(12). | ||||||||||||||||
| Three Months Ended September 30, | Nine Months Ended September 30, | |||||||||||||||
| 2015 | 2014 | 2015 | 2014 | |||||||||||||
Return on average common equity, excluding DVA and net discrete tax benefit(15) | 3.9 | % | 7.5 | % | 7.7 | % | 7.7 | % | ||||||||
Impact of net discrete tax benefit | N/A | 1.4 | % | 1.1 | % | 1.7 | % | |||||||||
|
|
|
|
|
|
|
| |||||||||
Return on average common equity, excluding DVA(15) | 3.9 | % | 8.9 | % | 8.8 | % | 9.4 | % | ||||||||
Impact of DVA | 1.7 | % | 1.0 | % | 1.1 | % | 0.7 | % | ||||||||
|
|
|
|
|
|
|
| |||||||||
Return on average common equity(15) | 5.6 | % | 9.9 | % | 9.9 | % | 10.1 | % | ||||||||
|
|
|
|
|
|
|
| |||||||||
EMEA-Europe, Middle East and Africa.
U.S. GAAP-Accounting principles generally accepted in the U.S.
DVA-Debt Valuation Adjustment represents the change in the fair value of certain of the Company's long-term and short-term borrowings resulting from the fluctuation in the Company's credit spreads and other credit factors.
N/M-Not Meaningful.
N/A-Not Applicable.
| (1) | On October 1, 2014, the Managed Futures business was transferred from the Company's Wealth Management business segment to the Company's Investment Management business segment. All prior-period amounts have been recast to conform to the current period's presentation. |
| 93 | |
| (2) | The Company's Institutional Securities business segment's net income applicable to nonredeemable noncontrolling interests was $26 million and $41 million for the quarters ended September 30, 2015 and 2014, respectively, and $100 million and $77 million for the nine months ended September 30, 2015 and 2014, respectively. The Company's Investment Management business segment's net income applicable to nonredeemable noncontrolling interests was $5 million and $18 million for the quarters ended September 30, 2015 and 2014, respectively, and $24 million and $79 million for the nine months ended September 30, 2015 and 2014, respectively. See Notes 2 and 3 to the Company's consolidated financial statements in Item 8 of the 2014 Form 10-K and Note 14 to the Company's condensed consolidated financial statements in Item 1 for information on nonredeemable noncontrolling interests. |
| (3) | For the calculation of basic and diluted earnings per common share, see Note 15 to the Company's condensed consolidated financial statements in Item 1. |
| (4) | Regional net revenues reflect the regional view of the Company's consolidated net revenues on a managed basis. For a further discussion regarding the geographic methodology for net revenues, see Note 21 to the Company's consolidated financial statements in Item 8 of the 2014 Form 10-K. |
| (5) | Amounts include loans held for investment and loans held for sale but exclude loans at fair value which are included in Trading assets in the Company's condensed consolidated statements of financial condition (see Note 7 to the Company's condensed consolidated financial statements in Item 1). |
| (6) | For a discussion of Global Liquidity Reserve, see "Liquidity and Capital Resources-Liquidity Risk Management Framework-Global Liquidity Reserve" in Part II, Item 7 of the 2014 Form 10-K. |
| (7) | Book value per common share equals common shareholders' equity of $67,767 million at September 30, 2015 and $64,880 million at December 31, 2014 divided by common shares outstanding of 1,938 million at September 30, 2015 and 1,951 million at December 31, 2014. |
| (8) | For a discussion of the Company's methods for calculating its risk-based capital ratios and risk-weighted assets ("RWAs"), see "Liquidity and Capital Resources-Regulatory Requirements" herein. |
| (9) | Tier 1 leverage ratio equals Tier 1 capital (calculated under U.S. Basel III Transitional rules) divided by the average daily balance of consolidated on-balance sheet assets under U.S. GAAP, adjusted for disallowed goodwill, transitional intangible assets, certain deferred tax assets, certain investments in the capital instruments of unconsolidated financial institutions and other adjustments (see Note 13 to the Company's condensed consolidated financial statements in Item 1). |
| (10) | Revenues and expenses associated with these assets are included in the Company's Wealth Management and Investment Management business segments. |
| (11) | Amounts exclude the Company's Investment Management business segment's proportionate share of assets managed by entities in which it owns a minority stake and assets for which fees are not generated. For the quarter and nine months ended September 30, 2015, amounts include $4.6 billion of inflows related to the transfer of certain portfolio managers, and their portfolios, from the Company's Wealth Management business segment to the Company's Investment Management business segment. |
| (12) | From time to time, the Company may disclose certain "non-GAAP financial measures" in the course of its earnings releases, earnings conference calls, financial presentations and otherwise. The U.S. Securities and Exchange Commission (the "SEC") defines a "non-GAAP financial measure" as a numerical measure of historical or future financial performance, financial positions, or cash flows that excludes, or includes, amounts or is subject to adjustments that effectively exclude, or include, amounts from the most directly comparable measure calculated and presented in accordance with U.S. GAAP. Non-GAAP financial measures disclosed by the Company are provided as additional information to investors in order to provide them with further transparency about, or as an alternative method for assessing, the Company's financial condition and operating results. These measures are not in accordance with, or a substitute for, U.S. GAAP, and may be different from or inconsistent with non-GAAP financial measures used by other companies. Whenever the Company refers to a non-GAAP financial measure, the Company will also generally define it or present the most directly comparable financial measure calculated and presented in accordance with U.S. GAAP, along with a reconciliation of the differences between the non-GAAP financial measure and the U.S. GAAP financial measure. |
| (13) | Pre-tax profit margin is a non-GAAP financial measure that the Company considers to be a useful measure to the Company and investors to assess operating performance. Percentages represent income from continuing operations before income taxes as a percentage of net revenues. |
| (14) | The computation of average common equity for each business segment is determined using the Company's Required Capital framework, an internal capital adequacy measure (see "Liquidity and Capital Resources-Regulatory Requirements-Required Capital" herein). Average common equity for each business segment is a non-GAAP financial measure that the Company considers to be a useful measure to the Company and investors to assess capital adequacy. |
| | 94 |
| (15) | The calculation of return on average common equity from continuing operations and return on average common equity uses income from continuing operations applicable to Morgan Stanley less preferred dividends as a percentage of average common equity. The annualized return on average common equity from continuing operations and annualized return on average common equity, excluding DVA, and excluding DVA and net discrete tax benefit, are non-GAAP financial measures that the Company considers useful for investors to allow better comparability of period-to-period operating performance. To determine the return on average common equity, excluding DVA, and excluding DVA and net discrete tax benefit, both the numerator and denominator were adjusted to exclude those items. The calculation of each business segment's return on average common equity uses income from continuing operations applicable to Morgan Stanley less preferred dividends as a percentage of each business segment's average common equity. The effective tax rates used in the computation of each business segments' return on average common equity were determined on a separate legal entity basis. |
| (16) | Average tangible common equity is a non-GAAP financial measure that the Company considers to be a useful measure to the Company and investors to assess capital adequacy. For a discussion of tangible common equity, see "Liquidity and Capital Resources-Tangible Equity" herein. |
| (17) | Annualized return on average tangible common equity from continuing operations is a non-GAAP financial measure that the Company considers to be a useful measure to the Company and investors to assess capital adequacy. The calculation of return on average tangible common equity uses income from continuing operations applicable to Morgan Stanley less preferred dividends as a percentage of average tangible common equity. To determine the return on average tangible common equity from continuing operations, excluding the impact of DVA, both the numerator and the denominator were adjusted to exclude the impact of DVA. The impact of DVA for the quarters ended September 30, 2015 and 2014 was 2.0% and 1.2%, respectively, and the impact of DVA for the nine months ended September 30, 2015 and 2014 was 1.2% and 0.9%, respectively. |
| (18) | Tangible book value per common share equals tangible common equity of $58,115 million at September 30, 2015 and $55,138 million at December 31, 2014 divided by common shares outstanding of 1,938 million at September 30, 2015 and 1,951 million at December 31, 2014. Tangible book value per common share is a non-GAAP financial measure that the Company considers to be a useful measure that the Company and investors use to assess capital adequacy. |
Return on Equity Goal.
The Company is aiming to improve its returns to shareholders with a goal of achieving a sustainable 10% or more return on average common equity excluding DVA ("Return on Equity") over time, subject to the successful execution of its strategic objectives. For further information on the Company's Return on Equity goal, see "Other Matters-Return on Equity Goal" in Part II, Item 7 of the 2014 Form 10-K.
Global Market and Economic Conditions.
Global economic growth decelerated during the third quarter 2015 as a result of slower growth in emerging market ("EM") economies, including a deceleration in China and recessions in Brazil and Russia. Growth in major developed market ("DM") economies held up better than the EM economies, which were supported by continued easing of monetary policy, but were affected by weaker EM growth and weaker EM currencies. The consumer price indexes ("CPI") in the largest DM economies remained near or below zero in September of 2015 following renewed weakness in energy prices during the third quarter of 2015. China continued to experience entrenched producer price index deflation, while other EM economies showed mixed inflation trends, high inflation in commodity export EMs facing deteriorating terms of trade and weaker currencies and low inflation in commodity import EMs. Global equity markets declined substantially in the aggregate during the third quarter of 2015, driven in part by the devaluation of the Chinese currency and concerns surrounding the timing of a potential increase of U.S. interest rates.
In the U.S., a 3.9% annualized increase in real gross domestic product ("GDP") in the second quarter of 2015 following a 0.6% gain in the first quarter, resulted in an annualized GDP growth rate of 2.3% for the first half of 2015. Economic growth in the third quarter of 2015 slowed to a 1.5% annualized rate, as a slowdown in the buildup of business inventory and a deceleration in exports from a strong dollar was offset by solid gains in
| 95 | |
consumer spending. The unemployment rate fell to 5.1% in September 2015 from 5.3% in June 2015. As of September 30, 2015, the federal funds rate target range remained between 0.00% and 0.25%, while the discount rate remained at 0.75%, unchanged from June 30, 2015. The S&P 500 stock index declined 6.9%, the Dow Jones Industrial Average fell 7.6%, and the NASDAQ Composite index fell by 7.4% during the third quarter of 2015. The 10-year Treasury note yield declined to 2.06% at September 30, 2015 from 2.35% at June 30, 2015. The Federal Reserve Board's nominal broad dollar index rose 4.6% from June 30, 2015 to September 30, 2015.
In Europe, the cyclical recovery continued with a 0.4% gain in euro area GDP growth in the second quarter of 2015 after a 0.5% rise in the first quarter of 2015, aided in part by the European Central Bank's ("ECB") quantitative easing program's support for credit availability. Monthly economic data in the third quarter of 2015 showed resilience following the resolution to the Greek debt crisis in July 2015. However, the drag from external conditions, lower commodity prices, and rising uncertainty about global economic growth led the ECB to describe risks to the euro zone economic growth and inflation outlook as tilted to the downside at its September 3, 2015 policy meeting. As of September 30, 2015, the ECB's deposit facility rate was at negative 0.20% and the benchmark interest rate was at 0.05%, both unchanged from June 30, 2015. ECB asset purchases continued at a €60 billion per month pace and were confirmed to continue at least through September 2016. The STOXX Europe 600 index fell 8.8% in the third quarter of 2015 after falling 4.0% in the second quarter of 2015, reversing most of a 16.0% gain during the first quarter of 2015. The 10-year German Bund yield fell to 0.59% on September 30, 2015 from 0.76% on June 30, 2015. In the United Kingdom ("U.K."), annual inflation fell back slightly below zero in September 2015, as weakness in externally-driven goods inflation offset firmer services inflation supported by tightening labor markets. In the U.K., GDP accelerated to 0.7% in the second quarter of 2015 from 0.4% in the first quarter of 2015. The Bank of England's benchmark interest rate remained at 0.50% as of September 30, 2015, unchanged from June 30, 2015. The FTSE 100 index declined 7.0% from June 30, 2015 to September 30, 2015, and the 10-year gilt yield fell to 1.79% from 2.16% over this period.
In Japan, declines in industrial production in July and August of 2015 pointed to a second straight quarterly drop in the third quarter of 2015. Nationwide CPI was at 0.2% on a year over year basis in August of 2015. In the policy statement released after its September 14-15, 2015 policy meeting, the Bank of Japan announced that inflation expectations appear to be rising on the whole and highlighted a drag on exports and production from EM economies. The NIKKEI 225 equity index fell 14.1% from June 30, 2015 to September 30, 2015 and the 10-year Japanese government bond yield fell to 0.35% from 0.45% over this period.
Economic growth in EM economies, particularly in China, in aggregate remained challenged during the third quarter of 2015 by cyclical and structural headwinds. Cyclical headwinds included slower economic growth in China, lower commodity prices, and risks looking ahead to the expected start of U.S. monetary policy normalization, while structural headwinds included demographic challenges and high debt levels. In China, GDP grew to 6.9% during the third quarter of 2015. The producer price index registered a 5.9% year over year decline in September 2015, continuing entrenched deflation at the producer level. The People's Bank of China ("PBOC") reduced its 1-year lending rate by 25 basis points to 4.60% effective August 26, 2015, bringing the cumulative reduction in the past year to 140 basis points. The PBOC also announced a 2% lower daily fixing in Chinese renminbi versus the U.S. dollar on August 11, 2015 and a shift in regime to adjusting the daily central parity fixing. The Shanghai Stock Exchange Composite Index fell 28.6% between June 30, 2015 and September 30, 2015, and the Chinese renminbi per U.S. dollar exchange rate moved to 6.36 from 6.20 over that period.
| | 96 |
Business Segments.
Substantially all of the Company's operating revenues and operating expenses are directly attributable to its business segments. Certain revenues and expenses have been allocated to each business segment, generally in proportion to its respective net revenues, non-interest expenses or other relevant measures.
As a result of treating certain intersegment transactions as transactions with external parties, the Company includes an Intersegment Eliminations category to reconcile the business segment results to the Company's consolidated results. Intersegment Eliminations also reflect the effect of fees paid by the Company's Institutional Securities business segment to the Company's Wealth Management business segment related to the bank deposit program.
Net Revenues.
For a discussion of the Company's net revenues, see "Management's Discussion and Analysis of Financial Condition and Results of Operations ("MD&A")-Business Segments-Net Revenues" in Part II, Item 7 of the 2014 Form 10-K.
Compensation Expense.
For a discussion of the Company's compensation expense, see "MD&A-Business Segments-Compensation Expense" in Part II, Item 7 of the 2014 Form 10-K.
| 97 | |
INSTITUTIONAL SECURITIES
INCOME STATEMENT INFORMATION
| Three Months Ended September 30, | Nine Months Ended September 30, | |||||||||||||||
| 2015 | 2014 | 2015 | 2014 | |||||||||||||
| (dollars in millions) | ||||||||||||||||
Revenues: | ||||||||||||||||
Investment banking | $ | 1,181 | $ | 1,340 | $ | 3,794 | $ | 3,908 | ||||||||
Trading | 1,984 | 2,262 | 8,191 | 7,226 | ||||||||||||
Investments | 113 | 39 | 241 | 210 | ||||||||||||
Commissions and fees | 657 | 629 | 2,013 | 1,936 | ||||||||||||
Asset management, distribution and administration fees | 66 | 66 | 211 | 213 | ||||||||||||
Other | (112 | ) | 224 | 190 | 523 | |||||||||||
|
|
|
|
|
|
|
| |||||||||
Total non-interest revenues | 3,889 | 4,560 | 14,640 | 14,016 | ||||||||||||
|
|
|
|
|
|
|
| |||||||||
Interest income | 825 | 859 | 2,418 | 2,498 | ||||||||||||
Interest expense | 810 | 903 | 2,524 | 3,073 | ||||||||||||
|
|
|
|
|
|
|
| |||||||||
Net interest | 15 | (44 | ) | (106 | ) | (575 | ) | |||||||||
|
|
|
|
|
|
|
| |||||||||
Net revenues | 3,904 | 4,516 | 14,534 | 13,441 | ||||||||||||
|
|
|
|
|
|
|
| |||||||||
Compensation and benefits | 1,318 | 1,779 | 5,241 | 5,354 | ||||||||||||
Non-compensation expenses | 1,898 | 1,510 | 5,170 | 4,484 | ||||||||||||
|
|
|
|
|
|
|
| |||||||||
Total non-interest expenses | 3,216 | 3,289 | 10,411 | 9,838 | ||||||||||||
|
|
|
|
|
|
|
| |||||||||
Income from continuing operations before income taxes | 688 | 1,227 | 4,123 | 3,603 | ||||||||||||
Provision for income taxes | 141 | 89 | 658 | 171 | ||||||||||||
|
|
|
|
|
|
|
| |||||||||
Income from continuing operations | 547 | 1,138 | 3,465 | 3,432 | ||||||||||||
|
|
|
|
|
|
|
| |||||||||
Discontinued operations: | ||||||||||||||||
Income (loss) from discontinued operations before income taxes | (5 | ) | (9 | ) | (14 | ) | (18 | ) | ||||||||
Provision for (benefit from) income taxes | (2 | ) | (3 | ) | (4 | ) | (7 | ) | ||||||||
|
|
|
|
|
|
|
| |||||||||
Income (losses) from discontinued operations | (3 | ) | (6 | ) | (10 | ) | (11 | ) | ||||||||
|
|
|
|
|
|
|
| |||||||||
Net income | 544 | 1,132 | 3,455 | 3,421 | ||||||||||||
Net income applicable to nonredeemable noncontrolling interests | 26 | 41 | 100 | 77 | ||||||||||||
|
|
|
|
|
|
|
| |||||||||
Net income applicable to Morgan Stanley | $ | 518 | $ | 1,091 | $ | 3,355 | $ | 3,344 | ||||||||
|
|
|
|
|
|
|
| |||||||||
Amounts applicable to Morgan Stanley: | ||||||||||||||||
Income from continuing operations | $ | 521 | $ | 1,097 | $ | 3,365 | $ | 3,355 | ||||||||
Income (loss) from discontinued operations | (3 | ) | (6 | ) | (10 | ) | (11 | ) | ||||||||
|
|
|
|
|
|
|
| |||||||||
Net income applicable to Morgan Stanley | $ | 518 | $ | 1,091 | $ | 3,355 | $ | 3,344 | ||||||||
|
|
|
|
|
|
|
| |||||||||
| | 98 |
Net Revenues.
Investment Banking Revenues.
Investment banking revenues are composed of fees from advisory services and revenues from the underwriting of securities offerings and syndication of loans, net of syndication expenses.
Investment banking revenues were as follows:
| Three Months Ended September 30, | Nine Months Ended September 30, | |||||||||||||||
| 2015 | 2014 | 2015 | 2014 | |||||||||||||
| (dollars in millions) | ||||||||||||||||
Advisory revenues | $ | 557 | $ | 392 | $ | 1,451 | $ | 1,146 | ||||||||
Underwriting revenues: | ||||||||||||||||
Equity underwriting revenues | 250 | 464 | 1,046 | 1,268 | ||||||||||||
Fixed income underwriting revenues | 374 | 484 | 1,297 | 1,494 | ||||||||||||
|
|
|
|
|
|
|
| |||||||||
Total underwriting revenues | 624 | 948 | 2,343 | 2,762 | ||||||||||||
|
|
|
|
|
|
|
| |||||||||
Total investment banking revenues | $ | 1,181 | $ | 1,340 | $ | 3,794 | $ | 3,908 | ||||||||
|
|
|
|
|
|
|
| |||||||||
The following table presents the Company's volumes of announced and completed mergers and acquisitions, equity and equity-related offerings, and fixed income offerings:
| Three Months Ended September 30, | Nine Months Ended September 30, | |||||||||||||||
| 2015(1) | 2014(1) | 2015(1) | 2014(1) | |||||||||||||
| (dollars in billions) | ||||||||||||||||
Announced mergers and acquisitions(2) | $ | 348 | $ | 125 | $ | 951 | $ | 531 | ||||||||
Completed mergers and acquisitions(2) | 190 | 150 | 446 | 466 | ||||||||||||
Equity and equity-related offerings(3) | 11 | 19 | 50 | 54 | ||||||||||||
Fixed income offerings(4) | 47 | 70 | 203 | 226 | ||||||||||||
| (1) | Source: Thomson Reuters, data at October 15, 2015. Announced and completed mergers and acquisitions volumes are based on full credit to each of the advisors in a transaction. Equity and equity-related offerings and fixed income offerings are based on full credit for single book managers and equal credit for joint book managers. Transaction volumes may not be indicative of net revenues in a given period. In addition, transaction volumes for prior periods may vary from amounts previously reported due to the subsequent withdrawal or change in the value of a transaction. |
| (2) | Amounts include transactions of $100 million or more. Announced mergers and acquisitions exclude terminated transactions. |
| (3) | Amounts include Rule 144A issuances and public common stock, convertible and rights offerings under the Securities Act. |
| (4) | Amounts include non-convertible preferred stock, mortgage-backed and asset-backed securities and taxable municipal debt. Amounts also include publicly registered and Rule 144A issues. Amounts exclude leveraged loans and self-led issuances. |
Investment banking revenues during the current quarter decreased 12% from the prior year quarter reflecting decreases in equity and fixed income underwriting, partially offset by higher advisory revenues. Advisory revenues from announced merger, acquisition and restructuring transactions ("M&A") were $557 million during the current quarter, an increase of 42% from the prior year quarter, driven by increased M&A activity primarily in the Americas. Underwriting revenues of $624 million decreased 34% from the prior year quarter. Equity underwriting revenues decreased 46% to $250 million for the current quarter reflecting a decrease in initial public offering revenues. Fixed income underwriting revenues of $374 million decreased 23% from the prior year quarter, primarily driven by lower debt underwriting volumes.
Investment banking revenues during the nine months ended September 30, 2015 decreased 3% from the comparable period in 2014 driven by lower underwriting revenues partially offset by higher advisory revenues. Advisory revenues increased 27% led by M&A activity primarily in the Americas. Underwriting revenues during the nine months ended September 30, 2015 decreased 15% to $2,343 million from the comparable period of
| 99 | |
2014. Equity underwriting revenues decreased 18% to $1,046 million reflecting decreases in initial public offering volumes. Fixed income underwriting revenues decreased 13% to $1,297 million, primarily driven by lower non-investment grade bond and loan revenues.
Sales and Trading Net Revenues.
Sales and trading net revenues are composed of Trading revenues; Commissions and fees; Asset management, distribution and administration fees; and Net interest income (expenses). For a discussion of the Company's Net revenues, see "MD&A-Business Segments-Net Revenues" in Part II, Item 7 of the 2014 Form 10-K. For additional information on the Company's Institutional Securities sales and trading net revenues, see "MD&A-Business Segments-Institutional Securities-Sales and Trading Net Revenues" in Part II, Item 7 of the 2014 Form 10-K. See also Note 4 to the Company's condensed consolidated financial statements in Item 1 for further information related to gains (losses) on derivative instruments.
Sales and trading net revenues were as follows:
| Three Months Ended September 30, | Nine Months Ended September 30, | |||||||||||||||
| 2015 | 2014 | 2015 | 2014 | |||||||||||||
| (dollars in millions) | ||||||||||||||||
Trading | $ | 1,984 | $ | 2,262 | $ | 8,191 | $ | 7,226 | ||||||||
Commissions and fees | 657 | 629 | 2,013 | 1,936 | ||||||||||||
Asset management, distribution and administration fees | 66 | 66 | 211 | 213 | ||||||||||||
Net interest | 15 | (44 | ) | (106 | ) | (575 | ) | |||||||||
|
|
|
|
|
|
|
| |||||||||
Total sales and trading net revenues | $ | 2,722 | $ | 2,913 | $ | 10,309 | $ | 8,800 | ||||||||
|
|
|
|
|
|
|
| |||||||||
Sales and trading net revenues by business were as follows:
| Three Months Ended September 30, | Nine Months Ended September 30, | |||||||||||||||
| 2015 | 2014 | 2015 | 2014 | |||||||||||||
| (dollars in millions) | ||||||||||||||||
Equity | $ | 1,869 | $ | 1,867 | $ | 6,504 | $ | 5,448 | ||||||||
Fixed income and commodities | 918 | 1,129 | 4,298 | 3,920 | ||||||||||||
Other(1) | (65 | ) | (83 | ) | (493 | ) | (568 | ) | ||||||||
|
|
|
|
|
|
|
| |||||||||
Total sales and trading net revenues | $ | 2,722 | $ | 2,913 | $ | 10,309 | $ | 8,800 | ||||||||
|
|
|
|
|
|
|
| |||||||||
| (1) | Amounts include net losses associated with costs related to the amount of liquidity held ("negative carry"), losses related to investments associated with certain employee deferred compensation plans, losses on economic hedges and other costs related to the Company's long-term borrowings, and net revenues from corporate loans and lending commitments and related hedges. |
| | 100 |
The following sales and trading net revenues results exclude the impact of DVA. The reconciliation of sales and trading, including equity sales and trading and fixed income and commodities sales and trading net revenues, from a non-GAAP to a GAAP basis is as follows:
| Three Months Ended September 30, | Nine Months Ended September 30, | |||||||||||||||
| 2015 | 2014 | 2015 | 2014 | |||||||||||||
| (dollars in millions) | ||||||||||||||||
Total sales and trading net revenues-non-GAAP(1) | $ | 2,287 | $ | 2,698 | $ | 9,567 | $ | 8,372 | ||||||||
Impact of DVA | 435 | 215 | 742 | 428 | ||||||||||||
|
|
|
|
|
|
|
| |||||||||
Total sales and trading net revenues | $ | 2,722 | $ | 2,913 | $ | 10,309 | $ | 8,800 | ||||||||
|
|
|
|
|
|
|
| |||||||||
Equity sales and trading net revenues-non-GAAP(1) | $ | 1,769 | $ | 1,784 | $ | 6,307 | $ | 5,278 | ||||||||
Impact of DVA | 100 | 83 | 197 | 170 | ||||||||||||
|
|
|
|
|
|
|
| |||||||||
Equity sales and trading net revenues | $ | 1,869 | $ | 1,867 | $ | 6,504 | $ | 5,448 | ||||||||
|
|
|
|
|
|
|
| |||||||||
Fixed income and commodities sales and trading net revenues- | $ | 583 | $ | 997 | $ | 3,753 | $ | 3,662 | ||||||||
Impact of DVA | 335 | 132 | 545 | 258 | ||||||||||||
|
|
|
|
|
|
|
| |||||||||
Fixed income and commodities sales and trading net revenues | $ | 918 | $ | 1,129 | $ | 4,298 | $ | 3,920 | ||||||||
|
|
|
|
|
|
|
| |||||||||
| (1) | Sales and trading net revenues, including equity and fixed income and commodities sales and trading net revenues that exclude the impact of DVA, are non-GAAP financial measures that the Company considers useful for the Company and investors to allow further comparability of period-to-period operating performance. |
Sales and Trading Net Revenues during the Quarter Ended September 30, 2015. Total sales and trading net revenues decreased 7% to $2,722 million during the current quarter from $2,913 million during the prior year quarter.
• Equity . Equity sales and trading net revenues was essentially unchanged at $1,869 million during the current quarter from $1,867 million in the prior year quarter. Equity sales and trading net revenues, excluding the impact of DVA, decreased 1% to $1,769 million during the current quarter from $1,784 million in the prior year quarter, primarily reflecting lower revenues from cash equities products offset by solid results in derivatives products and prime brokerage. The decline in cash equities reflected a challenging market environment during the current quarter. The improved results in derivatives primarily reflected increased client activity, while the increase in prime brokerage results was driven by higher client balances and increased client activity across regions.
• Fixed Income and Commodities . Fixed income and commodities sales and trading net revenues decreased 19% to $918 million during the current quarter from $1,129 million during the prior year quarter. Excluding the impact of DVA, fixed income and commodities sales and trading net revenues decreased 42% to $583 million during the current quarter from $997 million during the prior year quarter primarily reflecting lower fixed income product net revenues which were partially offset by higher commodity net revenues. Fixed income product net revenues, excluding the impact of DVA, during the current quarter decreased 55% from the prior year quarter reflecting lower revenues across all major product lines. Difficult market conditions resulted in lower revenues due to the widening of credit spreads in securitized products and distressed debt, and lower client activity in structured credit and interest rate products. Commodity net revenues, excluding the impact of DVA, during the current quarter improved from the prior year quarter, as a result of improved client flow and oil market volatility.
| 101 | |
Fixed income and commodities sales and trading net revenues during the current quarter included losses of $56 million, net of hedges, related to credit valuation adjustments ("CVA") and funding valuation adjustments ("FVA") as a result of changes in the fair value of net derivative and certain other contracts attributable to counterparties' CDS spreads and the Company's CDS spreads and other factors compared with gains of $68 million, net of hedges, during the prior year quarter. The Company began incorporating FVA into the fair value measurements of over-the-counter ("OTC") uncollateralized and certain other derivatives during the fourth quarter of 2014.
• Other . During the current quarter, other sales and trading reflected negative net revenues of $65 million compared with negative net revenues of $83 million during the prior year quarter. Losses related to negative carry, losses related to investments associated with certain employee deferred compensation plans, and losses on economic hedges and other costs related to the Company's long-term borrowings, partially offset by net revenues from corporate loans and lending commitments and related hedges.
Sales and Trading Net Revenues during the Nine Months Ended September 30, 2015. Total sales and trading net revenues increased 17% to $10,309 million during the nine months ended September 30, 2015 from $8,800 million during the nine months ended September 30, 2014.
• Equity . Equity sales and trading net revenues increased 19% to $6,504 million during the nine months ended September 30, 2015 from the comparable period in 2014. Equity sales and trading net revenues, excluding the impact of DVA, increased 19% to $6,307 million during the nine months ended September 30, 2015 from the comparable period in 2014, reflecting strong results in prime brokerage and derivatives products. Improved results in derivatives reflected favorable market conditions and increased client activity, while higher client balances primarily drove the increase in prime brokerage results.
• Fixed Income and Commodities . Fixed income and commodities sales and trading net revenues increased 10% to $4,298 million during the nine months ended September 30, 2015 from $3,920 million during the nine months ended September 30, 2014. Excluding the impact of DVA, fixed income and commodities sales and trading net revenues increased 2% to $3,753 million during the nine months ended September 30, 2015 from $3,662 million during the nine months ended September 30, 2014. Fixed income product net revenues, excluding the impact of DVA, during the nine months ended September 30, 2015 increased 1% from the comparable period of 2014 as higher revenues in interest rate and foreign exchange products were partially offset by lower results in credit and securitized products. Commodity net revenues, excluding the impact of DVA, during the nine months ended September 30, 2015 increased from the comparable period of 2014, primarily reflecting increased structured client activity. The net improvement was partially offset by the absence of revenues from TransMontaigne Inc. ("TransMontaigne"), which was sold on July 1, 2014.
Fixed income and commodities sales and trading net revenues during the nine months ended September 30, 2015 included gains of $54 million, net of hedges, related to CVA and FVA as a result of changes in the fair value of net derivative and certain other contracts attributable to counterparties' CDS spreads and the Company's CDS spreads and other factors compared with gains of $18 million, net of hedges, during the nine months ended September 30, 2014. The Company began incorporating FVA into the fair value measurements of OTC uncollateralized and certain other derivatives during the fourth quarter of 2014.
• Other . During the nine months ended September 30, 2015, other sales and trading reflected negative net revenues of $493 million compared with negative net revenues of $568 million during the nine months ended September 30, 2014. Results in both periods included losses related to negative carry, losses related to investments associated with certain employee deferred compensation plans and losses on economic hedges and other costs related to the Company's long-term borrowings, partially offset by net revenues from corporate loans and lending commitments and related hedges.
| | 102 |
Investments Revenues.
Net investment gains of $113 million and $241 million were recognized during the quarter and nine months ended September 30, 2015, respectively, compared with net investment gains of $39 million and $210 million for the comparable periods in 2014. The increases in both periods were driven by gains on business related investments.
Other Revenues.
Negative revenues of $112 million were recognized in Other revenues during the current quarter compared with revenues of $224 million for the prior year quarter, reflecting primarily write-downs on held for sale loans and lending commitments. The results for the prior year quarter also included a $101 million gain on the sale of the Company's stake in TransMontaigne and a gain on the sale of a retail property space of $84 million.
During the nine months ended September 30, 2015, Other revenues were $190 million compared with $523 million during the nine months ended September 30, 2014. The decrease was primarily due to write-downs on held for sale loans and lending commitments. The results for the nine months ended September 30, 2014 also included a $101 million gain on the sale of the Company's stake in TransMontaigne, an $84 million gain on sale of a retail property space and a $45 million gain on the sale of Canterm Canadian Terminals Inc. which was completed on March 27, 2014 (see Note 1 to the Company's condensed consolidated financial statements in Item 1).
Non-interest Expenses.
Non-interest expenses decreased 2% during the current quarter from the prior year quarter. The decrease in the current quarter was primarily due to lower Compensation and benefits expenses partially offset by an increase in Non-compensation expenses. Compensation and benefits expenses decreased 26% during the current quarter compared with prior year quarter. The decrease was due to the combination of a decrease in discretionary incentive compensation driven by lower revenues, a decrease in amortization due to accelerated vesting of certain awards during the fourth quarter of 2014 and a decrease in fair value of deferred compensation plan referenced investments, partially offset by the reduction of average deferral rates for discretionary incentive based awards. Non-compensation expenses increased 26% during the current quarter compared with the prior year quarter, primarily as a result of an increase in Other non-interest expenses, related to an increase in a reserve for the settlement of a CDS antitrust litigation and other matters (see "Legal Proceedings" in Part II, Item 1).
During the nine months ended September 30, 2015, Non-interest expenses increased 6% from the comparable period in 2014. The increase in the nine months ended September 30, 2015 was primarily due to higher Non-compensation expenses, which was partially offset by lower Compensation and benefits expenses. Compensation and benefits expenses decreased 2% during the nine months ended September 30, 2015 from the comparable period in 2014. The decrease was primarily due to a decrease in amortization resulting from accelerated vesting of certain awards during the fourth quarter of 2014 and a decrease in the fair value of deferred compensation plan referenced investments, partially offset by an increase in discretionary incentive compensation driven by higher revenues and the reduction of average deferral rates for discretionary incentive based awards. Non-compensation expenses during the nine months ended September 30, 2015 increased 15%, due to higher litigation reserves and higher Professional services expenses.
| 103 | |
Nonredeemable Noncontrolling Interests.
Nonredeemable noncontrolling interests primarily relate to Mitsubishi UFJ Financial Group, Inc.'s interest in Morgan Stanley MUFG Securities Co., Ltd. (see Note 8 to the Company's condensed consolidated financial statements in Item 1).
Global Oil Merchanting Business.
As a result of entering into a definitive agreement to sell the global oil merchanting unit of the commodities division to Castleton Commodities International LLC, on May 11, 2015, the Company recognized an impairment charge of $10 million and $69 million in Other revenues in the Company's condensed consolidated statements of income in the quarter and nine months ended September 30, 2015, respectively, to reduce the carrying amount of the unit to its estimated fair value less costs to sell. The Company closed the transaction on November 1, 2015. The transaction does not meet the criteria for discontinued operations and is not expected to have a material impact on the Company's financial results for 2015.
| | 104 |
WEALTH MANAGEMENT
INCOME STATEMENT INFORMATION
| Three Months Ended | Nine Months Ended | |||||||||||||||
| September 30, | September 30, | |||||||||||||||
| 2015 | 2014(1) | 2015 | 2014(1) | |||||||||||||
| (dollars in millions) | ||||||||||||||||
Revenues: | ||||||||||||||||
Investment banking | $ | 140 | $ | 224 | $ | 518 | $ | 618 | ||||||||
Trading | 47 | 185 | 475 | 727 | ||||||||||||
Investments | 3 | 2 | 18 | 8 | ||||||||||||
Commissions and fees | 465 | 503 | 1,481 | 1,554 | ||||||||||||
Asset management, distribution and administration fees | 2,182 | 2,148 | 6,471 | 6,210 | ||||||||||||
Other | 52 | 112 | 209 | 253 | ||||||||||||
|
|
|
|
|
|
|
| |||||||||
Total non-interest revenues | 2,889 | 3,174 | 9,172 | 9,370 | ||||||||||||
|
|
|
|
|
|
|
| |||||||||
Interest income | 777 | 649 | 2,296 | 1,846 | ||||||||||||
Interest expense | 26 | 50 | 119 | 132 | ||||||||||||
|
|
|
|
|
|
|
| |||||||||
Net interest | 751 | 599 | 2,177 | 1,714 | ||||||||||||
|
|
|
|
|
|
|
| |||||||||
Net revenues | 3,640 | 3,773 | 11,349 | 11,084 | ||||||||||||
|
|
|
|
|
|
|
| |||||||||
Compensation and benefits | 2,024 | 2,182 | 6,449 | 6,534 | ||||||||||||
Non-compensation expenses | 792 | 791 | 2,336 | 2,301 | ||||||||||||
|
|
|
|
|
|
|
| |||||||||
Total non-interest expenses | 2,816 | 2,973 | 8,785 | 8,835 | ||||||||||||
|
|
|
|
|
|
|
| |||||||||
Income from continuing operations before income taxes | 824 | 800 | 2,564 | 2,249 | ||||||||||||
Provision for income taxes | 315 | 321 | 959 | 882 | ||||||||||||
|
|
|
|
|
|
|
| |||||||||
Income from continuing operations | 509 | 479 | 1,605 | 1,367 | ||||||||||||
|
|
|
|
|
|
|
| |||||||||
Net income | 509 | 479 | 1,605 | 1,367 | ||||||||||||
|
|
|
|
|
|
|
| |||||||||
Net income applicable to Morgan Stanley | $ | 509 | $ | 479 | $ | 1,605 | $ | 1,367 | ||||||||
|
|
|
|
|
|
|
| |||||||||
Amounts applicable to Morgan Stanley: | ||||||||||||||||
Income from continuing operations | $ | 509 | $ | 479 | $ | 1,605 | $ | 1,367 | ||||||||
|
|
|
|
|
|
|
| |||||||||
Net income applicable to Morgan Stanley | $ | 509 | $ | 479 | $ | 1,605 | $ | 1,367 | ||||||||
|
|
|
|
|
|
|
| |||||||||
| (1) | On October 1, 2014, the Managed Futures business was transferred from the Company's Wealth Management business segment to the Company's Investment Management business segment. All prior-period amounts have been recast to conform to the current year's presentation. |
| 105 | |
Financial Information and Statistical Data (dollars in billions, except where noted).
| At September 30, 2015 | At December 31, 2014 | |||||||
Client assets | $ | 1,925 | $ | 2,025 | ||||
Fee-based client assets(1) | $ | 770 | $ | 785 | ||||
Fee-based client assets as a percentage of total client assets(1) | 40 | % | 39 | % | ||||
Client liabilities | $ | 61 | $ | 51 | ||||
Bank deposit program(2) | $ | 139 | $ | 137 | ||||
Investment securities portfolio | $ | 52.4 | $ | 57.3 | ||||
Loans and lending commitments | $ | 52.3 | $ | 42.7 | ||||
Wealth Management representatives | 15,807 | 16,076 | ||||||
Retail locations | 616 | 622 | ||||||
| Three Months Ended September 30, | Nine Months Ended September 30, | |||||||||||||||
| 2015 | 2014(3) | 2015 | 2014(3) | |||||||||||||
Annualized revenues per representative (dollars in thousands)(4) | $ | 922 | $ | 929 | $ | 952 | $ | 904 | ||||||||
Client assets per representative (dollars in millions)(5) | $ | 122 | $ | 124 | $ | 122 | $ | 124 | ||||||||
Fee-based asset flows(6) | $ | 7.7 | $ | 6.5 | $ | 34.9 | $ | 38.0 | ||||||||
| (1) | Fee-based client assets represent the amount of assets in client accounts where the basis of payment for services is a fee calculated on those assets. |
| (2) | Balances in the bank deposit program included deposits held by Morgan Stanley Bank, N.A. ("MSBNA") and Morgan Stanley Private Bank, National Association ("MSPBNA") (collectively, "U.S. Bank Subsidiaries") of $139 billion and $128 billion at September 30, 2015 and December 31, 2014, respectively, with the remainder held at Citi-affiliated Federal Deposit Insurance Corporation ("FDIC") insured depositories at December 31, 2014. At June 30, 2015, the transfer of deposits from Citi to the Company was completed. See Note 3 to the Company's consolidated financial statements in Item 8 of the 2014 Form 10-K and Note 9 to the Company's condensed consolidated financial statements in Item 1 for further discussion of the Company's customer deposits previously held by Citi. |
| (3) | On October 1, 2014, the Managed Futures business was transferred from the Company's Wealth Management business segment to the Company's Investment Management business segment. All prior-period amounts have been recast to conform to the current year's presentation. |
| (4) | Annualized revenues per representative equal the Company's Wealth Management business segment's annualized revenues divided by the average representative headcount. |
| (5) | Client assets per representative equal total period-end client assets divided by period-end representative headcount. |
| (6) | Fee-based asset flows include net new fee-based assets, net account transfers, dividends, interest and client fees and exclude cash management-related activity. |
Wealth Management earns fees based on a contractual percentage of fee-based client assets related to certain account types, which are offered to Wealth Management clients. These fees, which the Company records in the Asset management, distribution and administrative fees line on its income statement, are earned based on the client assets in the specific account types in which the client participates and are generally not driven by asset class. For most account types, fees are billed in the first month of each quarter based on the related client assets as of the end of the prior quarter. Across the account types, the fees will vary based on both the distinct services provided within each account type and on the level of household assets under supervision in Wealth Management. The following tables present fee-based client assets activity and average fee rate by account type in the Company's Wealth Management business segment for the quarters and nine months ended September 30, 2015 and 2014.
| | 106 |
Three Months Ended September 30, 2015
| At June 30, 2015 | Inflows (1) | Outflows (2) | Market Impact (3) | At September 30, 2015 | Average for the Three Months Ended September 30, 2015 | |||||||||||||||||||
| Fee Rate(4) | ||||||||||||||||||||||||
| (dollars in billions) | (in bps) | |||||||||||||||||||||||
Separately managed accounts(5)(6) | $ | 294 | $ | 13 | $ | (11 | ) | $ | (18 | ) | $ | 278 | 34 | |||||||||||
Unified managed accounts(7) | 103 | 6 | (4 | ) | (7 | ) | 98 | 112 | ||||||||||||||||
Mutual fund advisory(8) | 29 | - | (1 | ) | (3 | ) | 25 | 120 | ||||||||||||||||
Representative as advisor(9) | 120 | 7 | (7 | ) | (8 | ) | 112 | 88 | ||||||||||||||||
Representative as portfolio | 253 | 15 | (10 | ) | (16 | ) | 242 | 103 | ||||||||||||||||
|
|
|
|
|
|
|
|
|
| |||||||||||||||
Subtotal | $ | 799 | $ | 41 | $ | (33 | ) | $ | (52 | ) | $ | 755 | 76 | |||||||||||
Cash management(11) | 14 | 3 | (2 | ) | - | 15 | 6 | |||||||||||||||||
|
|
|
|
|
|
|
|
|
| |||||||||||||||
Total fee-based client assets | $ | 813 | $ | 44 | $ | (35 | ) | $ | (52 | ) | $ | 770 | 74 | |||||||||||
|
|
|
|
|
|
|
|
|
| |||||||||||||||
Three Months Ended September 30, 2014
| At June 30, 2014 | Inflows (1) | Outflows (2) | Market Impact (3) | At September 30, 2014 | Average for the Three Months Ended September 30, 2014 | |||||||||||||||||||
| Fee Rate(4) | ||||||||||||||||||||||||
| (dollars in billions) | (in bps) | |||||||||||||||||||||||
Separately managed accounts(5)(6) | $ | 282 | $ | 7 | $ | (11 | ) | $ | 6 | $ | 284 | 35 | ||||||||||||
Unified managed accounts(7) | 87 | 6 | (3 | ) | (2 | ) | 88 | 116 | ||||||||||||||||
Mutual fund advisory(8) | 34 | 1 | (2 | ) | (1 | ) | 32 | 120 | ||||||||||||||||
Representative as advisor(9) | 119 | 8 | (7 | ) | (2 | ) | 118 | 90 | ||||||||||||||||
Representative as portfolio manager(10) | 226 | 16 | (8 | ) | (3 | ) | 231 | 106 | ||||||||||||||||
|
|
|
|
|
|
|
|
|
| |||||||||||||||
Subtotal | $ | 748 | $ | 38 | $ | (31 | ) | $ | (2 | ) | $ | 753 | 77 | |||||||||||
Cash management(11) | 14 | 4 | (3 | ) | - | 15 | 6 | |||||||||||||||||
|
|
|
|
|
|
|
|
|
| |||||||||||||||
Total fee-based client assets | $ | 762 | $ | 42 | $ | (34 | ) | $ | (2 | ) | $ | 768 | 75 | |||||||||||
|
|
|
|
|
|
|
|
|
| |||||||||||||||
Nine Months Ended September 30, 2015
| At December 31, 2014 | Inflows (1) | Outflows (2) | Market Impact (3) | At September 30, 2015 | Average for the Nine Months Ended September 30, 2015 | |||||||||||||||||||
| Fee Rate(4) | ||||||||||||||||||||||||
| (dollars in billions) | (in bps) | |||||||||||||||||||||||
Separately managed accounts(5)(6) | $ | 285 | $ | 34 | $ | (24 | ) | $ | (17 | ) | $ | 278 | 34 | |||||||||||
Unified managed accounts(7) | 93 | 21 | (10 | ) | (6 | ) | 98 | 113 | ||||||||||||||||
Mutual fund advisory(8) | 31 | 1 | (5 | ) | (2 | ) | 25 | 121 | ||||||||||||||||
Representative as advisor(9) | 119 | 22 | (20 | ) | (9 | ) | 112 | 89 | ||||||||||||||||
Representative as portfolio manager(10) | 241 | 44 | (28 | ) | (15 | ) | 242 | 104 | ||||||||||||||||
|
|
|
|
|
|
|
|
|
| |||||||||||||||
Subtotal | $ | 769 | $ | 122 | $ | (87 | ) | $ | (49 | ) | $ | 755 | 76 | |||||||||||
Cash management(11) | 16 | 7 | (8 | ) | - | 15 | 6 | |||||||||||||||||
|
|
|
|
|
|
|
|
|
| |||||||||||||||
Total fee-based client assets | $ | 785 | $ | 129 | $ | (95 | ) | $ | (49 | ) | $ | 770 | 75 | |||||||||||
|
|
|
|
|
|
|
|
|
| |||||||||||||||
| 107 | |
Nine Months Ended September 30, 2014
| At December 31, 2013 | Inflows (1) | Outflows (2) | Market Impact (3) | At September 30, 2014 | Average for the Nine Months Ended September 30, 2014 | |||||||||||||||||||
| Fee Rate(4) | ||||||||||||||||||||||||
| (dollars in billions) | (in bps) | |||||||||||||||||||||||
Separately managed accounts(5)(6) | $ | 260 | $ | 30 | $ | (25 | ) | $ | 19 | $ | 284 | 35 | ||||||||||||
Unified managed accounts(7) | 78 | 17 | (8 | ) | 1 | 88 | 117 | |||||||||||||||||
Mutual fund advisory(8) | 34 | 2 | (5 | ) | 1 | 32 | 121 | |||||||||||||||||
Representative as advisor(9) | 111 | 22 | (18 | ) | 3 | 118 | 90 | |||||||||||||||||
Representative as portfolio manager(10) | 201 | 44 | (21 | ) | 7 | 231 | 106 | |||||||||||||||||
|
|
|
|
|
|
|
|
|
| |||||||||||||||
Subtotal | $ | 684 | $ | 115 | $ | (77 | ) | $ | 31 | $ | 753 | 77 | ||||||||||||
Cash management(11) | 13 | 10 | (8 | ) | - | 15 | 6 | |||||||||||||||||
|
|
|
|
|
|
|
|
|
| |||||||||||||||
Total fee-based client assets | $ | 697 | $ | 125 | $ | (85 | ) | $ | 31 | $ | 768 | 75 | ||||||||||||
|
|
|
|
|
|
|
|
|
| |||||||||||||||
BPS-Basis points
| (1) | Inflows include new accounts, account transfers, deposits, dividends and interest. |
| (2) | Outflows include closed or terminated accounts, account transfers, withdrawals and client fees. |
| (3) | Market impact includes realized and unrealized gains and losses on portfolio investments. |
| (4) | Average fee rate is for the quarters and nine months ended September 30, 2015 and 2014, respectively. |
| (5) | Separately managed accounts-Accounts by which third-party asset managers are engaged to manage clients' assets with investment decisions made by the asset manager. One third-party asset manager strategy can be held per account. |
| (6) | Institutional non-custody account values reflect prior quarter-end balance due to a quarterly lag in the reporting of assets under management ("AUM") values by custodians. |
| (7) | Unified managed accounts-Accounts that provide the client with the ability to combine separately managed accounts, mutual funds, and exchange-traded funds all in one aggregate account. Unified managed accounts can be client-directed, financial advisor-directed or Company-directed (with "directed" referring to the investment direction or decision / discretion / power of attorney). |
| (8) | Mutual fund advisory-Accounts that give the client the ability to systematically allocate assets across a wide range of mutual funds. Investment decisions are made by the client. |
| (9) | Representative as advisor-Accounts where the investment decisions must be approved by the client and the financial advisor must obtain approval each time a change is made to the account or its investments. |
| (10) | Representative as portfolio manager-Accounts where a financial advisor has discretion (contractually approved by the client) to make ongoing investment decisions without the client's approval for each individual change. |
| (11) | Cash management-Accounts where the financial advisor provides discretionary cash management services to institutional clients whereby securities or proceeds are invested and re-invested in accordance with the client's investment criteria. Generally, the portfolio will be invested in short-term fixed income and cash equivalent investments. |
| | 108 |
Net Revenues.
The Company's Wealth Management business segment's net revenues are composed of Transactional, Asset management, Net interest and Other revenues. Transactional revenues include Investment banking, Trading, and Commissions and fees. Asset management revenues include Asset management, distribution and administration fees, and referral fees related to the bank deposit program. Net interest income includes interest related to the bank deposit program, interest on available for sale ("AFS") securities and held to maturity ("HTM") securities, interest on lending activities and other net interest. Other revenues include revenues from AFS securities, customer account services fees, other miscellaneous revenues and revenues from Investments.
| Three Months Ended September 30, | Nine Months Ended September 30, | |||||||||||||||
| 2015 | 2014(1) | 2015 | 2014(1) | |||||||||||||
| (dollars in millions) | ||||||||||||||||
Net revenues: | ||||||||||||||||
Asset management | $ | 2,182 | $ | 2,148 | $ | 6,471 | $ | 6,210 | ||||||||
Transactional | 652 | 912 | 2,474 | 2,899 | ||||||||||||
Net interest | 751 | 599 | 2,177 | 1,714 | ||||||||||||
Other | 55 | 114 | 227 | 261 | ||||||||||||
|
|
|
|
|
|
|
| |||||||||
Net revenues | $ | 3,640 | $ | 3,773 | $ | 11,349 | $ | 11,084 | ||||||||
|
|
|
|
|
|
|
| |||||||||
| (1) | On October 1, 2014, the Managed Futures business was transferred from the Company's Wealth Management business segment to the Company's Investment Management business segment. All prior-period amounts have been recast to conform to the current year's presentation. |
Transactional.
Investment Banking. Investment banking revenues decreased 38% to $140 million and decreased 16% to $518 million in the quarter and nine months ended September 30, 2015, respectively, from the comparable periods of 2014, primarily due to lower revenues from the distribution of underwritten offerings.
Trading. Trading revenues decreased 75% to $47 million and decreased 35% to $475 million in the quarter and nine months ended September 30, 2015, respectively, from the comparable periods of 2014, primarily due to losses related to investments associated with certain employee deferred compensation plans and lower revenues from fixed income products.
Commissions and Fees. Commissions and fees revenues decreased 8% to $465 million and decreased 5% to $1,481 million in the quarter and nine months ended September 30, 2015, respectively, from the comparable periods of 2014, primarily due to lower revenues from equity, mutual fund and annuity products, partially offset by higher revenues from alternatives asset classes.
Asset Management.
Asset Management, Distribution and Administration Fees. Asset management, distribution and administration fees increased 2% to $2,182 million and increased 4% to $6,471 million in the quarter and nine months ended September 30, 2015, respectively, from the comparable periods of 2014, primarily due to higher fee-based revenues due to positive flows and market conditions, partially offset by lower revenues from referral fees from the bank deposit program, reflecting the transfer of deposits to the Company from Citi.
Balances in the bank deposit program were $139 billion at September 30, 2015 and $137 billion at December 31, 2014, which included deposits held by the Company's U.S. Bank Subsidiaries of $139 billion at September 30, 2015 and $128 billion at December 31, 2014.
| 109 | |
Client assets in fee-based accounts decreased to $770 billion and represented 40% of total client assets at September 30, 2015 compared with $785 billion and 39% at December 31, 2014, respectively. Total client asset balances decreased to $1,925 billion at September 30, 2015 from $2,025 billion at December 31, 2014, primarily due to the impact of market conditions, partially offset by favorable asset flows. Fee-based client asset flows for the current quarter were $7.7 billion compared with $6.5 billion in the prior year quarter.
Other.
Other revenues were $52 million and $209 million in the quarter and nine months ended September 30, 2015, respectively, compared with $112 million and $253 million in the comparable periods of 2014, respectively, primarily due to a $40 million gain on sale of a retail property space in the prior year periods. The decrease in the current quarter also reflected lower gains on sales of AFS securities and the decrease in the nine months ended September 30, 2015 was partially offset by higher gains on sales of AFS securities.
Net Interest.
Net interest increased 25% to $751 million and increased 27% to $2,177 million in the quarter and nine months ended September 30, 2015 from the comparable periods of 2014, primarily due to higher balances in the bank deposit program and growth in loans and lending commitments. Total client liability balances, which include margin lending, increased to $61 billion at September 30, 2015 from $51 billion at December 31, 2014, primarily due to higher growth from Portfolio Loan Account ("PLA") and Liquidity Access Line ("LAL") securities-based lending products and residential real estate loans. The loans and lending commitments in the Company's Wealth Management business segment have grown in the nine months ended September 30, 2015, and the Company expects this trend to continue. See "Supplemental Financial Information and Disclosures-U.S. Bank Subsidiaries Lending Activities" herein and "Quantitative and Qualitative Disclosures about Market Risk-Credit Risk-Lending Activities" in Item 3.
Non-interest Expenses.
Non-interest expenses decreased 5% and 1% in the quarter and nine months ended September 30, 2015, respectively, from the comparable periods of 2014. Compensation and benefits expenses decreased 7% in the current quarter from the prior year quarter, primarily due to a decrease in the fair value of deferred compensation plan referenced investments and a lower formulaic payout to Wealth Management representatives linked to lower net revenues. Compensation and benefits expenses decreased 1% in the nine months ended September 30, 2015 from the comparable period of 2014, primarily due to a decrease in the fair value of deferred compensation plan referenced investments and a decrease in amortization, partially offset by a higher formulaic payout to Wealth Management representatives linked to higher net revenues. Non-compensation expenses were essentially unchanged in the current quarter from the prior year quarter. Non-compensation expenses increased 2% in the nine months ended September 30, 2015 from the comparable period of 2014, primarily due to an increase in Professional services, resulting from consulting and legal fees, partially offset by a provision related to a rescission offer in the prior year period, see "Supplemental Financial Information and Disclosures-Prospectus Delivery" herein.
| | 110 |
INVESTMENT MANAGEMENT
INCOME STATEMENT INFORMATION
| Three Months Ended September 30, | Nine Months Ended September 30, | |||||||||||||||
| 2015 | 2014(1) | 2015 | 2014(1) | |||||||||||||
| (dollars in millions) | ||||||||||||||||
Revenues: | ||||||||||||||||
Investment banking | $ | 1 | $ | - | $ | 1 | $ | 5 | ||||||||
Trading | - | 4 | (3 | ) | (22 | ) | ||||||||||
Investments | (235 | ) | 97 | 149 | 506 | |||||||||||
Asset management, distribution and administration fees | 511 | 529 | 1,547 | 1,543 | ||||||||||||
Other | 1 | 38 | 15 | 104 | ||||||||||||
|
|
|
|
|
|
|
| |||||||||
Total non-interest revenues | 278 | 668 | 1,709 | 2,136 | ||||||||||||
|
|
|
|
|
|
|
| |||||||||
Interest income | - | - | 1 | 2 | ||||||||||||
Interest expense | 4 | 1 | 16 | 14 | ||||||||||||
|
|
|
|
|
|
|
| |||||||||
Net interest | (4 | ) | (1 | ) | (15 | ) | (12 | ) | ||||||||
|
|
|
|
|
|
|
| |||||||||
Net revenues | 274 | 667 | 1,694 | 2,124 | ||||||||||||
|
|
|
|
|
|
|
| |||||||||
Compensation and benefits | 95 | 253 | 676 | 832 | ||||||||||||
Non-compensation expenses | 217 | 221 | 649 | 622 | ||||||||||||
|
|
|
|
|
|
|
| |||||||||
Total non-interest expenses | 312 | 474 | 1,325 | 1,454 | ||||||||||||
|
|
|
|
|
|
|
| |||||||||
Income (loss) from continuing operations before income taxes | (38 | ) | 193 | 369 | 670 | |||||||||||
Provision for (benefit from) income taxes | (33 | ) | 53 | 87 | 210 | |||||||||||
|
|
|
|
|
|
|
| |||||||||
Income (loss) from continuing operations | (5 | ) | 140 | 282 | 460 | |||||||||||
|
|
|
|
|
|
|
| |||||||||
Discontinued operations: | ||||||||||||||||
Income from discontinued operations before income taxes | 1 | 1 | 1 | 7 | ||||||||||||
Provision for income taxes | - | - | - | 2 | ||||||||||||
|
|
|
|
|
|
|
| |||||||||
Income from discontinued operations | 1 | 1 | 1 | 5 | ||||||||||||
|
|
|
|
|
|
|
| |||||||||
Net income (loss) | (4 | ) | 141 | 283 | 465 | |||||||||||
Net income applicable to nonredeemable noncontrolling interests | 5 | 18 | 24 | 79 | ||||||||||||
|
|
|
|
|
|
|
| |||||||||
Net income (loss) applicable to Morgan Stanley | $ | (9 | ) | $ | 123 | $ | 259 | $ | 386 | |||||||
|
|
|
|
|
|
|
| |||||||||
Amounts applicable to Morgan Stanley: | ||||||||||||||||
Income (loss) from continuing operations | $ | (10 | ) | $ | 122 | $ | 258 | $ | 381 | |||||||
Income from discontinued operations | 1 | 1 | 1 | 5 | ||||||||||||
|
|
|
|
|
|
|
| |||||||||
Net income (loss) applicable to Morgan Stanley | $ | (9 | ) | $ | 123 | $ | 259 | $ | 386 | |||||||
|
|
|
|
|
|
|
| |||||||||
| (1) | On October 1, 2014, the Managed Futures business was transferred from the Company's Wealth Management business segment to the Company's Investment Management business segment. All prior-period amounts have been recast to conform to the current year's presentation. |
| 111 | |
Statistical Data.
Activity in the Company's Investment Management business segment's assets under management or supervision and the average fee rate by asset class, during the quarters and nine months ended September 30, 2015 and 2014 was as follows:
Three Months Ended September 30, 2015
| At June 30, 2015 | Inflows (1)(2) | Market Impact (5) | Foreign Currency Impact (6) | At September 30, 2015 | Average for the Three Months Ended September 30, 2015 | |||||||||||||||||||||||||||||||
| Outflows | Distributions | Fee Rate | ||||||||||||||||||||||||||||||||||
| (3) | (4) | AUM | (7) | |||||||||||||||||||||||||||||||||
| (dollars in billions) | (in bps) | |||||||||||||||||||||||||||||||||||
Traditional Asset Management: | ||||||||||||||||||||||||||||||||||||
Equity | $ | 137 | $ | 11 | $ | (12 | ) | $ | - | $ | (11 | ) | $ | - | $ | 125 | $ | 132 | 71 | |||||||||||||||||
Fixed income | 64 | 5 | (8 | ) | - | - | - | 61 | 62 | 32 | ||||||||||||||||||||||||||
Liquidity | 132 | 338 | (323 | ) | - | 1 | - | 148 | 141 | 9 | ||||||||||||||||||||||||||
Alternatives(8)(9) | 37 | 1 | (2 | ) | - | - | - | 36 | 37 | 61 | ||||||||||||||||||||||||||
Managed Futures(10) | 3 | - | - | - | - | - | 3 | 3 | 109 | |||||||||||||||||||||||||||
|
|
|
|
|
|
|
|
|
|
|
|
|
|
|
| |||||||||||||||||||||
Total Traditional Asset Management | 373 | 355 | (345 | ) | - | (10 | ) | - | 373 | 375 | 40 | |||||||||||||||||||||||||
Merchant Banking and Real | 30 | 2 | - | (1 | ) | - | - | 31 | 31 | 106 | ||||||||||||||||||||||||||
|
|
|
|
|
|
|
|
|
|
|
|
|
|
|
| |||||||||||||||||||||
Total assets under management or supervision | $ | 403 | $ | 357 | $ | (345 | ) | $ | (1 | ) | $ | (10 | ) | $ | - | $ | 404 | $ | 406 | 45 | ||||||||||||||||
|
|
|
|
|
|
|
|
|
|
|
|
|
|
|
| |||||||||||||||||||||
Shares of minority stake assets(11) | 7 | 8 | 8 | |||||||||||||||||||||||||||||||||
Three Months Ended September 30, 2014
| At June 30, 2014 | Market Impact (5) | Foreign Currency Impact (6) | At September 30, 2014 | Average for the Three Months Ended September 30, 2014 | ||||||||||||||||||||||||||||||||
| Inflows | Outflows | Distributions | Fee Rate | |||||||||||||||||||||||||||||||||
| (1) | (3) | (4) | AUM | (7) | ||||||||||||||||||||||||||||||||
| (dollars in billions) | (in bps) | |||||||||||||||||||||||||||||||||||
Traditional Asset Management: | ||||||||||||||||||||||||||||||||||||
Equity | $ | 150 | $ | 6 | $ | (9 | ) | $ | - | $ | (2 | ) | $ | (2 | ) | $ | 143 | $ | 148 | 70 | ||||||||||||||||
Fixed income | 62 | 8 | (4 | ) | - | 1 | (2 | ) | 65 | 64 | 33 | |||||||||||||||||||||||||
Liquidity | 121 | 238 | (233 | ) | - | 1 | (1 | ) | 126 | 122 | 8 | |||||||||||||||||||||||||
Alternatives(8)(9) | 35 | 1 | - | - | (1 | ) | - | 35 | 35 | 64 | ||||||||||||||||||||||||||
Managed Futures(10) | 3 | - | - | - | - | - | 3 | 3 | 123 | |||||||||||||||||||||||||||
|
|
|
|
|
|
|
|
|
|
|
|
|
|
|
| |||||||||||||||||||||
Total Traditional Asset Management | 371 | 253 | (246 | ) | - | (1 | ) | (5 | ) | 372 | 372 | 43 | ||||||||||||||||||||||||
Merchant Banking and Real | 28 | 3 | (1 | ) | - | (1 | ) | - | 29 | 29 | 101 | |||||||||||||||||||||||||
|
|
|
|
|
|
|
|
|
|
|
|
|
|
|
| |||||||||||||||||||||
Total assets under management or supervision | $ | 399 | $ | 256 | $ | (247 | ) | $ | - | $ | (2 | ) | $ | (5 | ) | $ | 401 | $ | 401 | 47 | ||||||||||||||||
|
|
|
|
|
|
|
|
|
|
|
|
|
|
|
| |||||||||||||||||||||
Shares of minority stake assets(11) | 7 | 7 | 7 | |||||||||||||||||||||||||||||||||
| | 112 |
Nine Months Ended September 30, 2015
| At December 31, 2014 | Market Impact (5) | Foreign Currency Impact ( 6) | At September 30, 2015 | Average for the Nine Months Ended September 30, 2015 | ||||||||||||||||||||||||||||||||
| Inflows | Outflows | Distributions | Fee Rate | |||||||||||||||||||||||||||||||||
| (1)(2) | (3) | (4) | AUM | (7) | ||||||||||||||||||||||||||||||||
| (dollars in billions) | (in bps) | |||||||||||||||||||||||||||||||||||
Traditional Asset Management: | ||||||||||||||||||||||||||||||||||||
Equity | $ | 141 | $ | 25 | $ | (34 | ) | $ | - | $ | (6 | ) | $ | (1 | ) | $ | 125 | $ | 138 | 71 | ||||||||||||||||
Fixed income | 65 | 17 | (19 | ) | - | - | (2 | ) | 61 | 64 | 32 | |||||||||||||||||||||||||
Liquidity | 128 | 927 | (908 | ) | - | 1 | - | 148 | 133 | 9 | ||||||||||||||||||||||||||
Alternatives(8)(9) | 36 | 3 | (3 | ) | - | - | - | 36 | 36 | 62 | ||||||||||||||||||||||||||
Managed Futures(10) | 3 | - | - | - | - | - | 3 | 3 | 111 | |||||||||||||||||||||||||||
|
|
|
|
|
|
|
|
|
|
|
|
|
|
|
| |||||||||||||||||||||
Total Traditional Asset Management | 373 | 972 | (964 | ) | - | (5 | ) | (3 | ) | 373 | 374 | 42 | ||||||||||||||||||||||||
Merchant Banking and Real Estate Investing(9) | 30 | 4 | (1 | ) | (3 | ) | 1 | - | 31 | 31 | 105 | |||||||||||||||||||||||||
|
|
|
|
|
|
|
|
|
|
|
|
|
|
|
| |||||||||||||||||||||
Total assets under management or supervision | $ | 403 | $ | 976 | $ | (965 | ) | $ | (3 | ) | $ | (4 | ) | $ | (3 | ) | $ | 404 | $ | 405 | 46 | |||||||||||||||
|
|
|
|
|
|
|
|
|
|
|
|
|
|
|
| |||||||||||||||||||||
Shares of minority stake assets(11) | 7 | 8 | 7 | |||||||||||||||||||||||||||||||||
Nine Months Ended September 30, 2014
| At December 31, 2013 | Market Impact (5) | Foreign Currency Impact (6) | At September 30, 2014 | Average for the | ||||||||||||||||||||||||||||||||
| Nine Months Ended | ||||||||||||||||||||||||||||||||||||
| September 30, | ||||||||||||||||||||||||||||||||||||
| 2014 | ||||||||||||||||||||||||||||||||||||
| Inflows | Outflows | Distributions | Fee Rate | |||||||||||||||||||||||||||||||||
| (1) | (3) | (4) | AUM | (7) | ||||||||||||||||||||||||||||||||
| (dollars in billions) | (in bps) | |||||||||||||||||||||||||||||||||||
Traditional Asset Management: | ||||||||||||||||||||||||||||||||||||
Equity | $ | 140 | $ | 26 | $ | (25 | ) | $ | - | $ | 4 | $ | (2 | ) | $ | 143 | $ | 145 | 69 | |||||||||||||||||
Fixed income | 60 | 19 | (16 | ) | - | 3 | (1 | ) | 65 | 62 | 33 | |||||||||||||||||||||||||
Liquidity | 112 | 713 | (699 | ) | 1 | (1 | ) | 126 | 117 | 8 | ||||||||||||||||||||||||||
Alternatives(8)(9) | 31 | 5 | (1 | ) | - | - | - | 35 | 34 | 65 | ||||||||||||||||||||||||||
Managed | 4 | - | (1 | ) | - | - | - | 3 | 3 | 126 | ||||||||||||||||||||||||||
|
|
|
|
|
|
|
|
|
|
|
|
|
|
|
| |||||||||||||||||||||
Total Traditional Asset Management | 347 | 763 | (742 | ) | - | 8 | (4 | ) | 372 | 361 | 43 | |||||||||||||||||||||||||
Merchant Banking and Real Estate Investing(9) | 30 | 6 | (6 | ) | (1 | ) | - | - | 29 | 29 | 105 | |||||||||||||||||||||||||
|
|
|
|
|
|
|
|
|
|
|
|
|
|
|
| |||||||||||||||||||||
Total assets under management or supervision | $ | 377 | $ | 769 | $ | (748 | ) | $ | (1 | ) | $ | 8 | $ | (4 | ) | $ | 401 | $ | 390 | 48 | ||||||||||||||||
|
|
|
|
|
|
|
|
|
|
|
|
|
|
|
| |||||||||||||||||||||
Shares of minority stake assets(11) | 6 | 7 | 7 | |||||||||||||||||||||||||||||||||
| (1) | Inflows represent investments or commitments from new and existing clients in new or existing investment products, including reinvestments of client dividends and increases in invested capital. Excludes the impact of exchanges occurring whereby a client changes positions within the same asset class. |
| 113 | |
| (2) | Includes $4.6 billion related to the transfer of certain equity portfolio managers and their portfolios from the Company's Wealth Management business segment to the Company's Investment Management business segment. |
| (3) | Outflows represent redemptions from clients' funds, transition of funds from the committed capital period to the invested capital period and decreases in invested capital. Excludes the impact of exchanges occurring whereby a client changes positions within the same asset class. |
| (4) | Distributions represent decreases in invested capital due to returns of capital after the investment period of a fund. It also includes fund dividends for which the client has not elected to reinvest. |
| (5) | Market impact includes realized and unrealized gains and losses on portfolio investments. This excludes any funds where market impact does not impact management fees. |
| (6) | Foreign currency impact reflects foreign currency changes for non-U.S. dollar denominated funds. |
| (7) | The average fee rate is based on asset management and administration fees, net of waivers. It excludes performance-based fees and other non-management fees. For certain non-U.S. funds it includes the portion of advisory fees that the Advisor collects on behalf of third-party distributors. The payment of those fees to the distributor is included in Non-compensation expenses in the Company's condensed consolidated statements of income. |
| (8) | The Alternatives asset class includes a range of investment products such as funds of hedge funds, funds of private equity funds and funds of real estate funds. |
| (9) | Assets under management or supervision for Merchant Banking and Real Estate Investing and Alternatives reflect the basis on which management fees are earned. This calculation excludes assets under management where no management fees are earned or where the fair value of these assets including lending commitments differ from the basis on which management fees are earned. Including these assets, assets under management at September 30, 2015 and 2014 for Merchant Banking and Real Estate Investing were $45 billion and $40 billion, respectively, and for Alternatives were $39 billion and $38 billion, respectively. |
| (10) | On October 1, 2014, the Managed Futures business was transferred from the Company's Wealth Management business segment to the Company's Investment Management business segment. All prior-period amounts have been recast to conform to the current year's presentation. |
| (11) | Amounts represent the Company's Investment Management business segment's proportional share of assets managed by entities in which it owns a minority stake. |
Net Revenues.
Trading.
Trading losses were $3 million in the nine months ended September 30, 2015 compared with losses of $22 million in the comparable period of 2014, primarily reflected lower losses related to the deconsolidation of certain real estate funds sponsored by the Company in the second quarters of 2015 and 2014.
Investments.
Net investment losses were $235 million in the current quarter compared with gains of $97 million in the prior year quarter. The Company recorded a net investment gain of $149 million in the nine months ended September 30, 2015, compared with a gain of $506 million in the comparable period of 2014. The decrease in the quarter and nine months ended September 30, 2015 reflected the reversal of previously accrued carried interest associated with Asia private equity, markdowns on principal investments in the Company's Merchant Banking and Real Estate Investing businesses and lower net investment gains in the Traditional Asset Management business.
Asset Management, Distribution and Administration Fees.
Asset management, distribution and administration fees decreased 3% to $511 million in the current quarter compared with the prior year quarter, primarily due to a shift in our asset class mix. Asset management, distribution and administration fees were $1,547 million in the nine months ended September 30, 2015, essentially unchanged with the comparable period of 2014. The Company's average assets under management increased $15 billion from $390 billion for the nine months ended September 30, 2014 to $405 billion for the nine months ended September 30, 2015, reflecting positive net flows, partially offset by the impact of market conditions and foreign currency.
| | 114 |
Other.
Other revenues were $1 million and $15 million in the quarter and nine months ended September 30, 2015, respectively, compared with $38 million and $104 million in the comparable periods of 2014. The results included lower revenues associated with the Company's minority investment in certain third-party investment managers in the current year periods and a $17 million gain on sale of a retail property space in the prior year periods.
Non-interest Expenses.
Non-interest expenses decreased 34% and 9% in the quarter and nine months ended September 30, 2015, respectively, compared with the comparable periods of 2014. Compensation and benefits expenses decreased 62% and 19% in the quarter and nine months ended September 30, 2015, respectively, primarily due to the decrease in deferred compensation associated with carried interest and a decrease in amortization attributed to the accelerated vesting of certain awards during the fourth quarter of 2014. The decrease in the nine months ended September 30, 2015 was partially offset by an increase in discretionary incentive compensation due to a reduction of average deferral rates for discretionary incentive based awards. Non-compensation expenses decreased 2% in the current quarter compared with the prior year quarter, primarily due to lower other expenses as a result of accruals for litigation and settlements in the prior year period. Non-compensation expenses increased 4% in the nine months ended September 30, 2015 compared with the comparable period of 2014, primarily due to higher Professional services expenses.
Nonredeemable Noncontrolling Interests.
Nonredeemable noncontrolling interests are primarily related to the consolidation of certain real estate funds sponsored by the Company. Investment gains (losses) associated with noncontrolling interests in these consolidated funds were $(1) million and $12 million in the quarter and nine months ended September 30, 2015, respectively, compared with gains of $17 million and $94 million in the quarter and nine months ended September 30, 2014, respectively. Nonredeemable noncontrolling interests decreased in the quarter and nine months ended September 30, 2015 primarily due to the deconsolidation of certain legal entities associated with real estate funds sponsored by the Company in the second quarters of 2015 and 2014.
| 115 | |
Supplemental Financial Information and Disclosures.
U.S. Bank Subsidiaries.
The Company provides loans to a variety of customers, from large corporate and institutional clients to high net worth individuals, primarily through the Company's U.S. Bank Subsidiaries. The Company's lending activities in its Institutional Securities business segment primarily include corporate lending activities, in which the Company provides loans or lending commitments to certain corporate clients. In addition to corporate lending activities, the Institutional Securities business segment engages in other lending activities. The Company's lending activities in its Wealth Management business segment primarily include securities-based lending that allows clients to borrow money against the value of qualifying securities and also include residential real estate loans. The Company expects its lending activities to continue to grow through further penetration of the Company's Institutional Securities and Wealth Management business segments' client base. For a further discussion of the Company's credit risks, see "Quantitative and Qualitative Disclosures about Market Risk-Credit Risk" in Item 3. Also see Notes 7 and 11 to the Company's condensed consolidated financial statements in Item 1 for additional information about the Company's loans and lending commitments, respectively.
The following table presents the Company's U.S. Bank Subsidiaries' supplemental financial information included in its condensed consolidated statements of financial condition and amounts presented below exclude transactions with affiliated entities:
| At September 30, 2015 | At December 31, 2014 | |||||||
| (dollars in billions) | ||||||||
U.S. Bank Subsidiaries assets | $ | 165.0 | $ | 151.2 | ||||
U.S. Bank Subsidiaries investment securities portfolio(1) | $ | 52.4 | $ | 57.3 | ||||
Wealth Management U.S. Bank Subsidiaries data: | ||||||||
Securities-based lending and other loans | $ | 26.8 | $ | 21.9 | ||||
Residential real estate loans | 19.7 | 15.8 | ||||||
|
|
|
| |||||
Total | $ | 46.5 | $ | 37.7 | ||||
|
|
|
| |||||
Institutional Securities U.S. Bank Subsidiaries data: | ||||||||
Corporate Lending | $ | 10.0 | $ | 9.6 | ||||
Other lending(2): | ||||||||
Corporate loans | $ | 10.5 | $ | 8.0 | ||||
Wholesale real estate loans and other loans | 9.2 | 8.6 | ||||||
|
|
|
| |||||
Total other loans | $ | 19.7 | $ | 16.6 | ||||
|
|
|
| |||||
Total | $ | 29.7 | $ | 26.2 | ||||
|
|
|
| |||||
| (1) | The U.S. Bank Subsidiaries investment securities portfolio includes HTM investment securities of $3.5 billion at September 30, 2015 and $100 million at December 31, 2014. |
| (2) | Other lending includes activities relate to commercial and residential mortgage lending, asset-backed lending, corporate loans purchased in the secondary market, financing extended to equities and commodities customers, and loans to municipalities. |
Income Tax Matters.
The Company's effective tax rate from continuing operations was 28.7% and 24.1% for the quarter and nine months ended September 30, 2015, respectively. The Company's effective tax rate from continuing operations for the nine months ended September 30, 2015 included a net discrete tax benefit of $564 million associated with the repatriation of non-U.S. earnings at a cost lower than originally estimated due to an internal restructuring to simplify the Company's legal entity organization in the U.K. Excluding this net discrete tax benefit, the effective tax rate from continuing operations for the nine months ended September 30, 2015 would have been 32.1%.
| | 116 |
The Company's effective tax rate from continuing operations was 20.9% and 19.4% for the quarter and nine months ended September 30, 2014, respectively. The Company's effective tax rate from continuing operations for the quarter and nine months ended September 30, 2014 included a net discrete tax benefit of $237 million primarily associated with the repatriation of non-U.S. earnings at a cost lower than originally estimated. Additionally, the Company's effective tax rate from continuing operations for the nine months ended September 30, 2014 included a net discrete tax benefit of $609 million principally associated with remeasurement of reserves and related interest due to new information regarding the status of a multi-year tax authority examination. Excluding these net discrete tax benefits, the effective tax rate from continuing operations for the quarter and nine months ended September 30, 2014 would have been 31.5% and 32.3%, respectively.
The effective tax rates excluding the net discrete tax benefits for the quarters and nine months ended September 30, 2015 and 2014 are reflective of the geographic mix of earnings.
Prospectus Delivery.
Other expenses for the quarter and nine months ended September 30, 2014 included $50 million (reported within Non-compensation expenses in the Company's Wealth Management business segment) related to a rescission offer to Wealth Management clients who may not have received a prospectus for certain securities transactions, for which delivery of a prospectus was required.
| 117 | |
Accounting Development Updates.
During 2015, the Financial Accounting Standards Board (the "FASB") issued the following accounting updates:
| • | Simplifying the Accounting for Measurement-Period Adjustments. The guidance is effective for the Company prospectively beginning January 1, 2016. Early adoption is permitted. |
| • | Simplifying the Presentation of Debt Issuance Costs. The guidance is effective for the Company retrospectively beginning January 1, 2016. Early adoption is permitted. |
| • | Amendments to the Consolidation Analysis. The guidance is effective for the Company beginning January 1, 2016. Early adoption is permitted. |
The above accounting updates issued in 2015 are not expected to have a material impact on the Company's condensed consolidated financial statements.
During 2014, the FASB issued the following accounting updates:
| • | Determining Whether the Host Contract in a Hybrid Financial Instrument Issued in the Form of a Share Is More Akin to Debt or to Equity. The guidance is effective for the Company beginning on January 1, 2016 and must be applied on a modified retrospective basis. The guidance may be applied on a full retrospective basis to all relevant prior periods and early adoption is permitted. |
| • | Disclosure of Uncertainties about an Entity's Ability to Continue as a Going Concern. The guidance is effective for the Company beginning January 1, 2017. Early adoption is permitted. |
| • | Measuring the Financial Assets and Financial Liabilities of a Consolidated Collateralized Financing Entity. The guidance is effective for the Company beginning January 1, 2016. Early adoption is permitted. |
| • | Accounting for Share-Based Payments When the Terms of an Award Provide That a Performance Target Could Be Achieved after the Requisite Service Period. The guidance is effective for the Company beginning January 1, 2016. Early adoption is permitted. |
The above accounting updates issued in 2014 are not expected to have a material impact on the Company's condensed consolidated financial statements.
During 2014, the FASB also issued the following accounting update:
| • | Revenue from Contracts with Customers. The guidance is effective for the Company beginning on January 1, 2018, with early adoption permitted beginning on January 1, 2017. |
The above accounting update issued in 2014 is currently being evaluated to determine the potential impact of adoption.
| | 118 |
Critical Accounting Policies.
The Company's condensed consolidated financial statements are prepared in accordance with U.S. GAAP, which require the Company to make estimates and assumptions (see Note 1 to the Company's condensed consolidated financial statements in Item 1). The Company believes that of its significant accounting policies (see Note 2 to the Company's consolidated financial statements in Item 8 of the 2014 Form 10-K and Note 2 to the Company's condensed consolidated financial statements in Item 1), the fair value, goodwill and intangible assets, legal and regulatory contingencies and income taxes policies involve a higher degree of judgment and complexity. For a further discussion about the Company's critical accounting policies, see "MD&A-Critical Accounting Policies" in Part II, Item 7, of the 2014 Form 10-K.
| 119 | |
Liquidity and Capital Resources.
The Company's senior management establishes liquidity and capital policies. Through various risk and control committees, the Company's senior management reviews business performance relative to these policies, monitors the availability of alternative sources of financing, and oversees the liquidity, interest rate and currency sensitivity of the Company's asset and liability position. The Company's Treasury Department, Firm Risk Committee, Asset and Liability Management Committee, and other committees and control groups assist in evaluating, monitoring and controlling the impact that the Company's business activities have on its condensed consolidated statements of financial condition, liquidity and capital structure. Liquidity and capital matters are reported regularly to the Board's Risk Committee.
The Balance Sheet.
The Company monitors and evaluates the composition and size of its balance sheet on a regular basis. The Company's balance sheet management process includes quarterly planning, business-specific limits, monitoring of business-specific usage versus limits, key metrics and new business impact assessments.
The Company establishes balance sheet limits at the consolidated, business segment and business unit levels. The Company monitors balance sheet usage versus limits and reviews variances resulting from business activity or market fluctuations. On a regular basis, the Company reviews current performance versus limits and assesses the need to re-allocate limits based on business unit needs. The Company also monitors key metrics, including asset and liability size, composition of the balance sheet, limit utilization and capital usage.
The tables below summarize total assets for the Company's business segments at September 30, 2015 and December 31, 2014:
| At September 30, 2015 | ||||||||||||||||
| Institutional Securities | Wealth Management | Investment Management | Total | |||||||||||||
| (dollars in millions) | ||||||||||||||||
Assets | ||||||||||||||||
Cash and cash equivalents(1) | $ | 21,727 | $ | 31,354 | $ | 437 | $ | 53,518 | ||||||||
Cash deposited with clearing organizations or segregated under federal and other regulations or requirements | 33,613 | 1,939 | - | 35,552 | ||||||||||||
Trading assets | 234,268 | 1,083 | 2,460 | 237,811 | ||||||||||||
Investment securities(2) | 12,306 | 52,383 | - | 64,689 | ||||||||||||
Securities received as collateral | 9,456 | - | - | 9,456 | ||||||||||||
Securities purchased under agreements to resell | 122,840 | 4,366 | - | 127,206 | ||||||||||||
Securities borrowed | 147,842 | 403 | - | 148,245 | ||||||||||||
Customer and other receivables | 28,276 | 21,236 | 558 | 50,070 | ||||||||||||
Loans, net of allowance(3) | 31,594 | 46,615 | - | 78,209 | ||||||||||||
Other assets(4) | 16,945 | 10,916 | 1,496 | 29,357 | ||||||||||||
|
|
|
|
|
|
|
| |||||||||
Total assets | $ | 658,867 | $ | 170,295 | $ | 4,951 | $ | 834,113 | ||||||||
|
|
|
|
|
|
|
| |||||||||
| | 120 |
| At December 31, 2014 | ||||||||||||||||
| Institutional Securities | Wealth Management | Investment Management | Total | |||||||||||||
| (dollars in millions) | ||||||||||||||||
Assets | ||||||||||||||||
Cash and cash equivalents(1) | $ | 23,161 | $ | 23,363 | $ | 460 | $ | 46,984 | ||||||||
Cash deposited with clearing organizations or segregated under federal and other regulations or requirements | 37,841 | 2,766 | - | 40,607 | ||||||||||||
Trading assets | 252,021 | 1,300 | 3,480 | 256,801 | ||||||||||||
Investment securities(2) | 11,999 | 57,317 | - | 69,316 | ||||||||||||
Securities received as collateral | 21,316 | - | - | 21,316 | ||||||||||||
Securities purchased under agreements to resell | 73,299 | 9,989 | - | 83,288 | ||||||||||||
Securities borrowed | 136,336 | 372 | - | 136,708 | ||||||||||||
Customer and other receivables | 27,328 | 21,022 | 611 | 48,961 | ||||||||||||
Loans, net of allowance(3) | 28,755 | 37,822 | - | 66,577 | ||||||||||||
Other assets(4) | 18,285 | 11,196 | 1,471 | 30,952 | ||||||||||||
|
|
|
|
|
|
|
| |||||||||
Total assets | $ | 630,341 | $ | 165,147 | $ | 6,022 | $ | 801,510 | ||||||||
|
|
|
|
|
|
|
| |||||||||
| (1) | Cash and cash equivalents include Cash and due from banks and Interest bearing deposits with banks. |
| (2) | Investment securities include both AFS securities and HTM securities. |
| (3) | Amounts include loans held for sale and loans held for investment but exclude loans at fair value, which are included in Trading assets in the Company's condensed consolidated statements of financial condition (see Note 7 to the Company's condensed consolidated financial statements in Item 1). |
| (4) | Other assets include Other investments; Premises, equipment and software costs; Goodwill; Intangible assets; and Other assets. |
A substantial portion of the Company's total assets consists of liquid marketable securities and short-term receivables arising principally from sales and trading activities in the Company's Institutional Securities business segment. The liquid nature of these assets provides the Company with flexibility in managing the size of its balance sheet. The Company's total assets increased to $834 billion at September 30, 2015 from $802 billion at December 31, 2014. The increase in total assets was primarily due to increases in Securities purchased under agreements to resell, Loans, Securities borrowed, and Interest bearing deposits with banks, partially offset by decreases in Trading assets, Securities received as collateral, Investment securities, and Cash deposited with clearing organizations or segregated under federal and other regulations or requirements.
The Company's assets and liabilities include significant balances related to transactions attributable to sales and trading and securities financing activities. The following table summarizes the Company's assets and liabilities held against securities financing transactions:
| At September 30, 2015 | At December 31, 2014 | |||||||||||||||
| Assets | Liabilities | Assets | Liabilities | |||||||||||||
| (dollars in millions) | ||||||||||||||||
Securities financing transactions(1) | $ | 355,336 | $ | 287,233 | $ | 319,999 | $ | 294,503 | ||||||||
| (1) | Includes Cash deposited with clearing organizations or segregated under federal and other regulations or requirements, repurchase and resale agreements, Securities borrowed and loaned transactions, Securities received as collateral and obligations to return securities received, and Customer and other receivables and payables. |
| 121 | |
Securities borrowed or securities purchased under agreements to resell and securities loaned or securities sold under agreements to repurchase are treated as collateralized financings (see Notes 2 and 6 to the Company's condensed consolidated financial statements in Item 1). The following table presents collateralized financing transactions at September 30, 2015 and December 31, 2014 and the average balance for the nine months ended September 30, 2015 and 2014:
| At September 30, 2015 | At December 31, 2014 | Average Balance | ||||||||||||||
| For the Nine Months Ended September 30, | ||||||||||||||||
| 2015 | 2014 | |||||||||||||||
| (dollars in millions) | ||||||||||||||||
Securities purchased under agreements to resell and Securities borrowed | $ | 275,451 | $ | 219,996 | $ | 253,955 | $ | 260,191 | ||||||||
Securities sold under agreements to repurchase and Securities loaned | $ | 79,214 | $ | 95,168 | $ | 93,247 | $ | 147,592 | ||||||||
Securities purchased under agreements to resell and Securities borrowed period-end balances at September 30, 2015 were higher than the average balances during 2015 driven by a reduction in inventory and an increase in highly liquid collateral. Securities sold under agreements to repurchase and Securities loaned period-end balances at September 30, 2015 were lower than the average balances during 2015 driven by a reduction in secured financing requirements.
Securities financing assets and liabilities also include matched book transactions with minimal market, credit and/or liquidity risk. Matched book transactions accommodate customers, as well as obtain securities for the settlement and financing of inventory positions. The customer receivable portion of the securities financing transactions includes customer margin loans, collateralized by customer-owned securities, and customer cash, which is segregated in accordance with regulatory requirements. The customer payable portion of the securities financing transactions primarily includes customer payables to the Company's prime brokerage customers. The Company's risk exposure on these transactions is mitigated by collateral maintenance policies that limit the Company's credit exposure to customers. Included within securities financing assets were $9 billion at September 30, 2015 and $21 billion at December 31, 2014, recorded in accordance with accounting guidance for the transfer of financial assets that represented offsetting assets and liabilities for fully collateralized non-cash loan transactions.
Investment Securities-Available for Sale and Held to Maturity.
During the nine months ended September 30, 2015 and 2014, the Company reported unrealized gains of $72 million and $134 million, net of tax, respectively, on its AFS securities portfolio. Unrealized gains (losses) in the AFS securities portfolio are included in Accumulated other comprehensive income (loss) for all periods presented. The net unrealized gains (losses) for the nine months ended September 30, 2015 and 2014 primarily reflected changes in interest rates. During the nine months ended September 30, 2015, the net unrealized (losses) in the Company's HTM securities portfolio were $(2) million. The Company held $3,530 million in HTM securities at September 30, 2015 and expects to grow its HTM securities portfolio. The Company did not own any HTM securities at September 30, 2014.
Liquidity Risk Management Framework.
The primary goal of the Company's liquidity risk management framework is to ensure that the Company has access to adequate funding across a wide range of market conditions. The framework is designed to enable the Company to fulfill its financial obligations and support the execution of the Company's business strategies.
| | 122 |
The following principles guide the Company's liquidity risk management framework:
| • | Sufficient liquid assets should be maintained to cover maturing liabilities and other planned and contingent outflows; |
| • | Maturity profile of assets and liabilities should be aligned, with limited reliance on short-term funding; |
| • | Source, counterparty, currency, region, and term of funding should be diversified; and |
| • | Contingency Funding Plan ("CFP") should anticipate, and account for, periods of limited access to funding. |
The core components of the Company's liquidity risk management framework are the CFP, Liquidity Stress Tests and the Global Liquidity Reserve, which support the Company's target liquidity profile. For a further discussion about the Company's CFP and Liquidity Stress Tests, see "MD&A-Liquidity and Capital Resources-Liquidity Risk Management Framework" in Part II, Item 7 of the 2014 Form 10-K.
Liquidity Stress Tests.
At September 30, 2015 and December 31, 2014, the Company maintained sufficient liquidity to meet current and contingent funding obligations as modeled in its Liquidity Stress Tests.
Global Liquidity Reserve.
The Company maintains sufficient liquidity reserves ("Global Liquidity Reserve") to cover daily funding needs and to meet strategic liquidity targets sized by the CFP and Liquidity Stress Tests. For further discussion of the Company's Global Liquidity Reserve, see "MD&A-Liquidity and Capital Resources-Liquidity Risk Management Framework-Global Liquidity Reserve" in Part II, Item 7 of the 2014 Form 10-K.
Global Liquidity Reserve by Type of Investment. The table below summarizes the Company's Global Liquidity Reserve by type of investment:
| At September 30, 2015 | At December 31, 2014 | |||||||
| (dollars in millions) | ||||||||
Cash deposits with banks | $ | 11,109 | $ | 12,173 | ||||
Cash deposits with central banks | 37,003 | 29,607 | ||||||
Unencumbered highly liquid securities: | ||||||||
U.S. government obligations | 76,495 | 76,555 | ||||||
U.S. agency and agency mortgage-backed securities | 28,352 | 32,358 | ||||||
Non-U.S. sovereign obligations(1) | 22,318 | 25,888 | ||||||
Investments in money market funds | - | 277 | ||||||
Other investment grade securities | 15,588 | 16,311 | ||||||
|
|
|
| |||||
Global Liquidity Reserve | $ | 190,865 | $ | 193,169 | ||||
|
|
|
| |||||
| (1) | Non-U.S. sovereign obligations are composed of unencumbered German, French, Dutch, U.K., Brazilian and Japanese government obligations. |
| 123 | |
Global Liquidity Reserve Managed by Bank and Non-Bank Legal Entities. The table below summarizes period-end and average balances of the Company's Global Liquidity Reserve managed by bank and non-bank legal entities:
| At September 30, 2015 | At December 31, 2014 | Average Balance(1) | ||||||||||||||
| For the Nine Months Ended September 30, | ||||||||||||||||
| 2015 | 2014 | |||||||||||||||
| (dollars in millions) | ||||||||||||||||
Bank legal entities: | ||||||||||||||||
Domestic | $ | 82,552 | $ | 82,484 | $ | 80,785 | $ | 81,976 | ||||||||
Foreign | 6,093 | 5,460 | 4,875 | 5,315 | ||||||||||||
|
|
|
|
|
|
|
| |||||||||
Total Bank legal entities | 88,645 | 87,944 | 85,660 | 87,291 | ||||||||||||
|
|
|
|
|
|
|
| |||||||||
Non-Bank legal entities(2): | ||||||||||||||||
Domestic | 63,330 | 70,122 | 72,676 | 75,831 | ||||||||||||
Foreign | 38,890 | 35,103 | 33,834 | 32,515 | ||||||||||||
|
|
|
|
|
|
|
| |||||||||
Total Non-Bank legal entities | 102,220 | 105,225 | 106,510 | 108,346 | ||||||||||||
|
|
|
|
|
|
|
| |||||||||
Total | $ | 190,865 | $ | 193,169 | $ | 192,170 | $ | 195,637 | ||||||||
|
|
|
|
|
|
|
| |||||||||
| (1) | The Company calculates the average Global Liquidity Reserve based upon daily amounts. |
| (2) | The Parent managed $46,210 million and $55,094 million at September 30, 2015 and December 31, 2014, respectively, and averaged $53,730 million and $56,284 million for the nine months ended September 30, 2015 and 2014, respectively. |
Regulatory Framework for Liquidity Risk Measurement.
The U.S. banking agencies and the Basel Committee have adopted, or are in the process of considering liquidity standards. The Basel Committee has developed two standards intended for use in liquidity risk supervision: the Liquidity Coverage Ratio ("LCR") and the Net Stable Funding Ratio ("NSFR").
For a discussion of the Company's LCR and NSFR, see "MD&A-Liquidity and Capital Resources-Liquidity Risk Management Framework-Basel Liquidity Framework-Liquidity Coverage Ratio and Net Stable Funding Ratio" in Part II, Item 7 of the 2014 Form 10-K.
Funding Management.
The Company manages its funding in a manner that reduces the risk of disruption to the Company's operations. The Company pursues a strategy of diversification of secured and unsecured funding sources (by product, by investor and by region) and attempts to ensure that the tenor of the Company's liabilities equals or exceeds the expected holding period of the assets being financed.
The Company funds its balance sheet on a global basis through diverse sources. These sources may include the Company's equity capital, long-term debt, repurchase agreements, securities lending, deposits, commercial paper, letters of credit and lines of credit. The Company has active financing programs for both standard and structured products targeting global investors and currencies.
Secured Financing.
For a discussion of the Company's secured financing activities, see "MD&A-Liquidity and Capital Resources-Funding Management-Secured Financing" in Part II, Item 7 of the 2014 Form 10-K.
At September 30, 2015 and December 31, 2014, the weighted average maturity of the Company's secured financing against less liquid assets was greater than 120 days.
| | 124 |
Unsecured Financing .
For a discussion of the Company's unsecured financing activities, see "MD&A-Liquidity and Capital Resources-Funding Management-Unsecured Financing" in Part II, Item 7 of the 2014 Form 10-K. When appropriate, the Company may use derivative products to conduct asset and liability management and to make adjustments to the Company's interest rate and structured borrowings risk profile (see Note 4 to the Company's condensed consolidated financial statements in Item 1).
Deposits.
Available funding sources to the Company's bank subsidiaries include time deposits, money market deposit accounts, demand deposit accounts, repurchase agreements, federal funds purchased, commercial paper and Federal Home Loan Bank advances. The vast majority of deposits in the Company's U.S. Bank Subsidiaries are sourced from the Company's retail brokerage accounts and are considered to have stable, low-cost funding characteristics. The transfer of deposits previously held by Citi to the Company's depository institutions relating to the Company's customer accounts from its acquisition of the Wealth Management JV (see Note 3 to the Company's consolidated financial statements in Item 8 of the 2014 Form 10-K) was completed at June 30, 2015. During 2015, $8.7 billion of deposits were transferred by Citi to the Company's depository institutions.
Deposits were as follows:
| At September 30, 2015(1) | At December 31, 2014(1) | |||||||
| (dollars in millions) | ||||||||
Savings and demand deposits | $ | 143,543 | $ | 132,159 | ||||
Time deposits | 3,683 | 1,385 | ||||||
|
|
|
| |||||
Total | $ | 147,226 | $ | 133,544 | ||||
|
|
|
| |||||
| (1) | Total deposits subject to FDIC insurance at September 30, 2015 and December 31, 2014 were $107 billion and $99 billion, respectively. |
Short-Term Borrowings.
The Company's unsecured Short-term borrowings may consist of bank loans, bank notes, commercial paper and structured notes with maturities of twelve months or less at issuance. At September 30, 2015 and December 31, 2014, the Company had approximately $1,982 million and $2,261 million, respectively, in Short-term borrowings.
Long-Term Borrowings.
The Company believes that accessing debt investors through multiple distribution channels helps provide consistent access to the unsecured markets. In addition, the issuance of long-term debt allows the Company to reduce reliance on short-term credit sensitive instruments ( e.g ., commercial paper and other unsecured short-term borrowings). Long-term borrowings are generally managed to achieve staggered maturities, thereby mitigating refinancing risk, and to maximize investor diversification through sales to global institutional and retail clients across regions, currencies and product types. Availability and cost of financing to the Company can vary depending on market conditions, the volume of certain trading and lending activities, the Company's credit ratings and the overall availability of credit.
The Company may engage in various transactions in the credit markets (including, for example, debt retirements) that it believes are in the best interests of the Company and its investors.
| 125 | |
Long-term borrowings by maturity profile at September 30, 2015 consisted of the following:
| Parent | Subsidiaries | Total | ||||||||||
| (dollars in millions) | ||||||||||||
Due in 2015 | $ | 8,405 | $ | 2,381 | $ | 10,786 | ||||||
Due in 2016 | 18,202 | 1,568 | 19,770 | |||||||||
Due in 2017 | 21,321 | 1,115 | 22,436 | |||||||||
Due in 2018 | 17,111 | 822 | 17,933 | |||||||||
Due in 2019 | 17,699 | 640 | 18,339 | |||||||||
Thereafter | 68,602 | 2,477 | 71,079 | |||||||||
|
|
|
|
|
| |||||||
Total | $ | 151,340 | $ | 9,003 | $ | 160,343 | ||||||
|
|
|
|
|
| |||||||
The Company's long-term borrowings included the following components:
| At September 30, 2015 | At December 31, 2014 | |||||||
| (dollars in millions) | ||||||||
Senior debt | $ | 146,899 | $ | 139,565 | ||||
Subordinated debt | 10,575 | 8,339 | ||||||
Junior subordinated debentures | 2,869 | 4,868 | ||||||
|
|
|
| |||||
Total | $ | 160,343 | $ | 152,772 | ||||
|
|
|
| |||||
During the nine months ended September 30, 2015, the Company issued notes with a principal amount of approximately $30.2 billion. In connection with these note issuances, the Company generally enters into certain transactions to obtain floating interest rates. The weighted average maturity of the Company's long-term borrowings, based upon stated maturity dates, was approximately 5.9 years at September 30, 2015. During the nine months ended September 30, 2015, approximately $17.6 billion in aggregate long-term borrowings matured or were retired. Subsequent to September 30, 2015 and through October 30, 2015, the Company's long-term borrowings decreased by approximately $2.3 billion, net of issuances. For a further discussion of the Company's long-term borrowings, including the amount of senior debt outstanding at September 30, 2015, see Note 10 to the Company's condensed consolidated financial statements in Item 1.
During May of 2015, Morgan Stanley Capital Trusts VI and VII redeemed all of their issued and outstanding 6.60% Capital Securities, respectively.
Capital Covenants.
In April 2007, the Company executed replacement capital covenants in connection with an offering by Morgan Stanley Capital Trust VIII Capital Securities, which become effective after the scheduled redemption date in 2046. Under the terms of the replacement capital covenants, the Company has agreed, for the benefit of certain specified holders of debt, to limitations on its ability to redeem or repurchase any of the Capital Securities for specified periods of time. For a complete description of the Capital Securities and the terms of the replacement capital covenants, see the Company's Current Report on Form 8-K dated April 26, 2007.
Credit Ratings.
The Company relies on external sources to finance a significant portion of its day-to-day operations. The cost and availability of financing generally are impacted by, among other things, the Company's credit ratings. In addition, the Company's credit ratings can have an impact on certain trading revenues, particularly in those businesses where longer-term counterparty performance is a key consideration, such as OTC derivative transactions, including credit derivatives and interest rate swaps. Rating agencies consider company-specific factors; other industry factors such as regulatory or legislative changes; the macroeconomic environment; and perceived levels of government support, among other things.
| | 126 |
Some rating agencies have stated that they currently incorporate various degrees of credit rating uplift from external sources of potential support, as well as perceived government support of systemically important banks, including the credit ratings of the Company. Rating agencies continue to monitor the progress of U.S. financial reform legislation and regulations to assess whether the possibility of extraordinary government support for the financial system in any future financial crises is negatively impacted. Legislative and rulemaking outcomes may lead to reduced uplift assumptions for U.S. banks and, thereby, place downward pressure on credit ratings. At the same time, proposed and final U.S. financial reform legislation and attendant rulemaking, such as higher standards for capital and liquidity levels, also have positive implications for credit ratings. The net result on credit ratings and the timing of any change in rating agency views on changes in potential government support and financial reform efforts are currently uncertain.
At November 2, 2015, the Parent's and MSBNA's senior unsecured ratings were as set forth below:
| Parent | Morgan Stanley Bank, N.A. | |||||||||||||||||
| Short-Term | Long-Term | Rating | Short-Term | Long-Term | Rating | |||||||||||||
| Debt | Debt | Outlook | Debt | Debt | Outlook | |||||||||||||
DBRS, Inc. | R-1 (middle) | A (high) | Stable | - | - | - | ||||||||||||
Fitch Ratings, Inc.(1) | F1 | A | Stable | F1 | A+ | Stable | ||||||||||||
Moody's Investors Service(2) | P-2 | A3 | Stable | P-1 | A1 | Stable | ||||||||||||
Rating and Investment Information, Inc. | a-1 | A | Negative | - | - | - | ||||||||||||
Standard & Poor's Ratings Services(3) | A-2 | A- | Negative Watch | A-1 | A | | Positive Watch | | ||||||||||
| (1) | On May 19, 2015, Fitch Ratings Inc. upgraded the long-term ratings of MSBNA by one notch to A+ from A. The rating outlook remained stable. |
| (2) | On May 28, 2015, Moody's Investors Service ("Moody's") upgraded the long-term ratings of the Parent and MSBNA by two notches to A3 from Baa2 and A1 from A3, respectively. The rating outlook for the Parent and MSBNA were revised to stable. |
| (3) | On November 2, 2015, Standard and Poor's Ratings Services ("S&P") revised the ratings outlook for the Parent from negative to negative watch, and for MSBNA from positive to positive watch. |
In connection with certain OTC trading agreements and certain other agreements where the Company is a liquidity provider to certain financing vehicles associated with the Company's Institutional Securities business segment, the Company may be required to provide additional collateral or immediately settle any outstanding liability balances with certain counterparties or pledge additional collateral to certain exchanges and clearing organizations in the event of a future credit rating downgrade irrespective of whether the Company is in a net asset or net liability position.
The additional collateral or termination payments that may be called in the event of a future credit rating downgrade vary by contract and can be based on ratings by either or both of Moody's and S&P. At September 30, 2015 and December 31, 2014, the future potential collateral amounts and termination payments that could be called or required by counterparties or exchanges and clearing organizations in the event of one-notch or two-notch downgrade scenarios, from the lowest of Moody's or S&P ratings, based on the relevant contractual downgrade triggers were as follows:
| At September 30, 2015 | At December 31, 2014 | |||||||
| (dollars in millions) | ||||||||
Incremental collateral or terminating payments upon potential future ratings downgrade: | ||||||||
One-notch downgrade | $ | 1,266 | $ | 1,856 | ||||
Two-notch downgrade | 1,384 | 2,984 | ||||||
While certain aspects of a credit rating downgrade are quantifiable pursuant to contractual provisions, the impact it will have on the Company's business and results of operation in future periods is inherently uncertain and will depend on a number of interrelated factors, including, among others, the magnitude of the downgrade, the rating relative to peers, the rating assigned by the relevant agency pre-downgrade, individual client behavior and future mitigating actions the Company may take. The liquidity impact of additional collateral requirements is included in the Company's Liquidity Stress Tests.
| 127 | |
Capital Management.
The Company's senior management views capital as an important source of financial strength. The Company actively manages its consolidated capital position based upon, among other things, business opportunities, risks, capital availability and rates of return together with internal capital policies, regulatory requirements and rating agency guidelines and, therefore, in the future may expand or contract its capital base to address the changing needs of its businesses. The Company attempts to maintain total capital, on a consolidated basis, at least equal to the sum of its operating subsidiaries' required equity.
In March 2015, the Company received no objection from the Federal Reserve to its 2015 capital plan. The capital plan included a share repurchase of up to $3.1 billion of the Company's outstanding common stock that began in the second quarter of 2015 through the end of the second quarter of 2016. Additionally, the capital plan included an increase in the Company's quarterly common stock dividend to $0.15 per share from $0.10 per share, that began with the dividend declared on April 20, 2015. During the quarter and nine months ended September 30, 2015 the Company repurchased approximately $625 million and $1,500 million, respectively, of the Company's outstanding common stock as part of its share repurchase program. During the quarter and nine months ended September 30, 2014, the Company repurchased approximately $195 million and $629 million, respectively, of the Company's outstanding common stock as part of its share repurchase program (see Note 14 to the Company's condensed consolidated financial statements in Item 1).
Pursuant to the share repurchase program, the Company considers, among other things, business segment capital needs as well as equity-based compensation and benefit plan requirements. Share repurchases under the Company's program will be exercised from time to time at prices the Company deems appropriate subject to various factors, including the Company's capital position and market conditions. The share repurchases may be effected through open market purchases or privately negotiated transactions, including through Rule 10b5-1 plans, and may be suspended at any time. Share repurchases by the Company are subject to regulatory approval (see also Unregistered Sales of Equity Securities and Uses of Proceeds" in Part II, Item 2).
The Company's Board of Directors determines the declaration and payment of dividends on a quarterly basis. On October 19, 2015, the Company announced that its Board of Directors declared a quarterly dividend per common share of $0.15. The dividend is payable on November 13, 2015 to common shareholders of record on October 30, 2015 (see Note 20 to the Company's condensed consolidated financial statements in Item 1).
Issuance of Preferred Stock.
Series J Preferred Stock. On March 19, 2015, the Company issued 1,500,000 Depositary Shares for an aggregate price of $1,500 million. Each Depositary Share represents a 1/25th interest in a share of perpetual Fixed-to-Floating Rate Non-Cumulative Preferred Stock, Series J, $0.01 par value ("Series J Preferred Stock"). The Series J Preferred Stock is redeemable at the Company's option (i) in whole or in part, from time to time, on any dividend payment date on or after July 15, 2020 or (ii) in whole but not in part at any time within 90 days following a regulatory capital treatment event (as described in the terms of that series), in each case at a redemption price of $25,000 per share (equivalent to $1,000 per Depositary Share), plus any declared and unpaid dividends to, but excluding, the date fixed for redemption, without accumulation of any undeclared dividends. The Series J Preferred Stock also has a preference over the Company's common stock upon liquidation. The Series J Preferred Stock offering (net of related issuance costs) resulted in proceeds of approximately $1,493 million.
| | 128 |
On September 15, 2015, the Company announced that its Board of Directors declared a quarterly dividend for preferred stock shareholders of record on September 30, 2015, that was paid on October 15, 2015 as follows:
Series | Preferred Stock Description | Quarterly Per Share(1) | ||||||
| A | Floating Rate Non-Cumulative Preferred Stock (represented by Depositary Shares, each representing a 1/1,000th interest in a share of preferred stock and each having a dividend of $0.25556) | $255.56 | ||||||
| C | 10% Non-Cumulative Non-Voting Perpetual Preferred Stock | 25.00 | ||||||
| E | Fixed-to-Floating Rate Non-Cumulative Preferred Stock (represented by Depositary Shares, each representing a 1/1,000th interest in a share of preferred stock and each having a dividend of $0.44531) | 445.31 | ||||||
| F | Fixed-to-Floating Rate Non-Cumulative Preferred Stock (represented by Depositary Shares, each representing a 1/1,000th interest in a share of preferred stock and each having a dividend of $0.42969) | 429.69 | ||||||
| G | 6.625% Non-Cumulative Preferred Stock (represented by Depositary Shares, each representing a 1/1,000th interest in a share of preferred stock and each having a dividend of $0.41406) | 414.06 | ||||||
| I | Fixed-to-Floating Rate Non-Cumulative Preferred Stock (represented by Depositary Shares, each representing a 1/1,000th interest in a share of preferred stock and each having a dividend of $0.39844) | 398.44 | ||||||
| (1) | The Company has outstanding Series H and Series J Preferred Stock for which a dividend declaration date did not occur during the third quarter of 2015, in accordance with the terms thereof. |
Tangible Equity.
The following table sets forth tangible Morgan Stanley shareholders' equity and tangible common equity at September 30, 2015 and December 31, 2014 and average tangible Morgan Stanley shareholders' equity and average tangible common equity for the nine months ended September 30, 2015 and 2014:
| Average Balance(1) | ||||||||||||||||
| Balance at | For the Nine Months Ended September 30, | |||||||||||||||
| September 30, 2015 | December 31, 2014 | 2015 | 2014 | |||||||||||||
| (dollars in millions) | ||||||||||||||||
Common equity | $ | 67,767 | $ | 64,880 | $ | 66,723 | $ | 64,660 | ||||||||
Preferred equity | 7,520 | 6,020 | 7,070 | 4,400 | ||||||||||||
|
|
|
|
|
|
|
| |||||||||
Morgan Stanley shareholders' equity | 75,287 | 70,900 | 73,793 | 69,060 | ||||||||||||
Junior subordinated debentures issued to capital trusts | 2,869 | 4,868 | 3,870 | 4,865 | ||||||||||||
Less: Goodwill and net intangible assets(2) | (9,652 | ) | (9,742 | ) | (9,683 | ) | (9,763 | ) | ||||||||
|
|
|
|
|
|
|
| |||||||||
Tangible Morgan Stanley shareholders' equity(3) | $ | 68,504 | $ | 66,026 | $ | 67,980 | $ | 64,162 | ||||||||
|
|
|
|
|
|
|
| |||||||||
Common equity | $ | 67,767 | $ | 64,880 | $ | 66,723 | $ | 64,660 | ||||||||
Less: Goodwill and net intangible assets(2) | (9,652 | ) | (9,742 | ) | (9,683 | ) | (9,763 | ) | ||||||||
|
|
|
|
|
|
|
| |||||||||
Tangible common equity(3) | $ | 58,115 | $ | 55,138 | $ | 57,040 | $ | 54,897 | ||||||||
|
|
|
|
|
|
|
| |||||||||
| (1) | Average balances were based upon month-end balances. |
| (2) | The deduction for Goodwill and net intangible assets is partially offset by mortgage servicing rights ("MSR"), net of disallowable MSR, at September 30, 2015, and at December 31, 2014. |
| (3) | Tangible Morgan Stanley shareholders' equity and tangible common equity are non-GAAP financial measures that the Company and its investors consider to be a useful measure to assess capital adequacy. |
| 129 | |
Regulatory Requirements.
Regulatory Capital Framework.
The Company is a financial holding company under the Bank Holding Company Act of 1956, as amended (the "BHC Act"), and is subject to the regulation and oversight of the Federal Reserve. The Federal Reserve establishes capital requirements for the Company, including well-capitalized standards, and evaluates the Company's compliance with such capital requirements. The Office of the Comptroller of the Currency ("OCC") establishes similar capital requirements and standards for the Company's U.S. Bank Subsidiaries.
Implementation of U.S. Basel III.
The U.S. banking regulators have comprehensively revised their risk-based and leverage capital framework to implement many aspects of the Basel III capital standards established by the Basel Committee. The U.S. banking regulators' revised capital framework is referred to herein as "U.S. Basel III." The Company and its U.S. Bank Subsidiaries became subject to U.S. Basel III on January 1, 2014. Aspects of U.S. Basel III, such as the minimum risk-based capital ratio requirements, new capital buffers, and certain deductions from and adjustments to capital, will be phased in over several years.
Regulatory Capital. Under U.S. Basel III, new items (including certain investments in the capital instruments of unconsolidated financial institutions) are deducted from the respective tiers of regulatory capital, and certain existing regulatory deductions and adjustments are modified or are no longer applicable. The majority of these capital deductions are subject to a phase-in schedule and will be fully phased in by 2018. Unrealized gains and losses on AFS securities are reflected in Common Equity Tier 1 capital, subject to a phase-in schedule. The percentage of the regulatory deductions and adjustments to Common Equity Tier 1 capital that applied to the Company at September 30, 2015 and December 31, 2014 ranged from 20% to 100%, depending on the specific item.
In addition, U.S. Basel III narrows the eligibility criteria for regulatory capital instruments. Existing trust preferred securities will be fully phased-out of the Company's Tier 1 capital by January 1, 2016. Thereafter, existing trust preferred securities that do not satisfy U.S. Basel III's eligibility criteria for Tier 2 capital will be phased out of the Company's regulatory capital by January 1, 2022.
In addition, beginning with the third quarter of 2015, the required deductions under the new restrictions on activities and investments imposed by a section of the BHC Act added by the Dodd-Frank Act, referred to as the "Volcker Rule," are reflected in the relevant regulatory capital tiers and ratios (see "Activities Restrictions under the Volcker Rule" herein).
Risk-Weighted Assets. The Company is required to calculate and hold capital against credit, market and operational risk RWAs. RWAs reflect both on- and off-balance sheet risk of the Company. Credit risk RWAs reflect capital charges attributable to the risk of loss arising from a borrower or counterparty failing to meet its financial obligations. Market risk RWAs reflect capital charges attributable to the risk of loss resulting from adverse changes in market prices and other factors. For a further discussion of the Company's market and credit risks, see "Quantitative and Qualitative Disclosures about Market Risk" in Item 3. Operational risk RWAs reflect capital charges attributable to the risk of loss resulting from inadequate or failed processes, people and systems or from external events ( e.g. , fraud, theft, legal and compliance risks or damage to physical assets). The Company may incur operational risks across the full scope of its business activities, including revenue-generating activities ( e.g. , sales and trading) and control groups ( e.g. , information technology and trade processing). In addition, given the evolving regulatory and litigation environment across the financial services industry and that operational risk RWAs incorporate the impact of such related matters, operational risk RWAs may increase in future periods.
The Basel Committee is in the process of considering revisions to various provisions of the Basel III framework that, if adopted by the U.S. banking agencies, could result in substantial changes to U.S. Basel III. In particular, the Basel Committee has finalized a new methodology for calculating counterparty credit risk exposures, the
| | 130 |
standardized approach for measuring counterparty credit risk exposures; has also finalized a revised framework establishing capital requirements for securitizations; and has proposed revisions to various regulatory capital standards, including for trading and banking book exposures, interest rate risk in the banking book, the credit valuation adjustment, the credit risk framework, operational risk and capital floors. In each case, the impact of these revised standards on the Company and its U.S. Bank Subsidiaries is uncertain and depends on future rulemakings by the U.S. banking agencies.
Calculation of Risk-Based Capital Ratios. As a U.S. Basel III Advanced Approach banking organization, the Company is subject to a permanent "capital floor" based on the lower of the risk-based capital ratios calculated using (i) standardized approaches for calculating credit risk RWAs and market risk RWAs (the "Standardized Approach"); and (ii) an advanced internal ratings-based approach for calculating credit risk RWAs, an advanced measurement approach for calculating operational risk RWAs, and an advanced approach for calculating market risk RWAs (the "Advanced Approach") under U.S. Basel III. The capital floor applies to the calculation of the minimum risk-based capital requirements and, when in effect, the capital conservation buffer, the countercyclical capital buffer (if deployed by banking regulators), and the global systemically important bank ("G-SIB") capital surcharge.
The methods for calculating each of the Company's risk-based capital ratios will change through January 1, 2022 as aspects of U.S. Basel III are phased in. These ongoing methodological changes may result in differences in the Company's reported capital ratios from one reporting period to the next that are independent of changes to the Company's capital base, asset composition, off-balance sheet exposures or risk profile.
For information on the basis for the calculation of the Company's U.S. Basel III capital ratios, on a transitional and fully phased-in basis, see "MD&A-Liquidity and Capital Resources-Regulatory Requirements-Implementation of U.S. Basel III-Calculation of Risk-Based Capital Ratios" in Part II, Item 7 of the 2014 Form 10-K.
Regulatory Capital Ratios. The Company is required to calculate capital ratios under both the Advanced Approach and the Standardized Approach, in both cases subject to transitional provisions. The following table presents the Company's regulatory capital ratios at September 30, 2015, as well as the minimum required regulatory capital ratios applicable under U.S. Basel III in 2015.
| At September 30, 2015 | Minimum Regulatory Capital Ratio(1)(2) | |||||||||||
| Actual Capital Ratio | ||||||||||||
| U.S. Basel III
Transitional/ Standardized Approach | U.S. Basel III
Transitional/ Advanced Approach | 2015 | ||||||||||
Common Equity Tier 1 capital ratio | 14.4 | % | 14.0 | % | 4.5 | % | ||||||
Tier 1 capital ratio | 16.2 | % | 15.6 | % | 6.0 | % | ||||||
Total capital ratio | 19.4 | % | 18.6 | % | 8.0 | % | ||||||
Tier 1 leverage ratio(3) | 8.1 | % | 8.1 | % | 4.0 | % | ||||||
| (1) | Percentages represent minimum regulatory capital ratios for calendar year 2015 under U.S. Basel III. |
| (2) | On a fully phased-in basis by 2019, the Company will be subject to a greater than 2.5% Common Equity Tier 1 capital conservation buffer, a G-SIB capital surcharge and, if deployed by banking regulators, up to a 2.5% Common Equity Tier 1 countercyclical buffer. The capital conservation buffer, G-SIB capital surcharge, and countercyclical capital buffer, if any, apply over each of the Company's Common Equity Tier 1, Tier 1 and Total risk-based capital ratios. For information on the recently adopted G-SIB capital surcharge, see "G-SIB Capital Surcharge" herein. |
| (3) | Tier 1 leverage ratio equals Tier 1 capital divided by the average daily balance of consolidated on-balance sheet assets under U.S. GAAP during the calendar quarter, adjusted for disallowed goodwill, transitional intangible assets, certain deferred tax assets, certain investments in the capital instruments of unconsolidated financial institutions and other adjustments. |
Beginning on January 1, 2015, for the Company to remain a financial holding company, its U.S. Bank Subsidiaries must qualify as "well-capitalized" under the higher capital requirements of U.S. Basel III by maintaining a total risk-based capital ratio (total capital to risk-weighted assets) of at least 10%, a Tier 1 risk-
| 131 | |
based capital ratio of at least 8%, a Common Equity Tier 1 risk-based capital ratio of at least 6.5%, and a Tier 1 leverage ratio of at least 5%. The Federal Reserve has not yet revised the "well-capitalized" standard for financial holding companies to reflect the higher capital standards in U.S. Basel III. Assuming that the Federal Reserve would apply the same or very similar well-capitalized standards to financial holding companies, each of the Company's risk-based capital ratios and Tier 1 leverage ratio at September 30, 2015 would have exceeded the revised well-capitalized standard. The Federal Reserve may require the Company and its peer financial holding companies to maintain risk- and leverage-based capital ratios substantially in excess of mandated minimum levels, depending upon general economic conditions and a financial holding company's particular condition, risk profile and growth plans.
At September 30, 2015, the Company's capital ratios calculated under the U.S. Basel III Advanced Approach were lower than those calculated under the U.S. Basel III Standardized Approach and therefore are the binding ratios for the Company as a result of the capital floor. At December 31, 2014, the Company's capital ratios calculated under the U.S. Basel III Advanced Approach were lower than those calculated under the Standardized Approach, represented as the U.S. banking regulators' U.S. Basel I-based rules ("U.S. Basel I") as supplemented by rules that implemented the Basel Committee's market risk capital framework amendment, commonly referred to as "Basel 2.5". The table below presents the Company's RWAs and regulatory capital ratios under the U.S. Basel III Advanced Approach transitional rules at September 30, 2015 and December 31, 2014.
| At September 30, 2015 | At December 31, 2014 | |||||||
| (dollars in millions) | ||||||||
RWAs: | ||||||||
Credit risk | $ | 181,214 | $ | 184,645 | ||||
Market risk | 101,459 | 121,363 | ||||||
Operational risk | 140,569 | 150,000 | ||||||
|
|
|
| |||||
Total RWAs | $ | 423,242 | $ | 456,008 | ||||
|
|
|
| |||||
Capital ratios: | ||||||||
Common Equity Tier 1 ratio | 14.0 | % | 12.6 | % | ||||
Tier 1 capital ratio | 15.6 | % | 14.1 | % | ||||
Total capital ratio | 18.6 | % | 16.4 | % | ||||
Tier 1 leverage ratio | 8.1 | % | 7.9 | % | ||||
Adjusted average assets(1) | $ | 816,722 | $ | 810,524 | ||||
| (1) | Beginning with the first quarter of 2015, in accordance with U.S. Basel III, adjusted average assets represent the denominator of the Tier 1 leverage ratio and were composed of the average daily balance of consolidated on-balance sheet assets under U.S. GAAP during the calendar quarter, adjusted for disallowed goodwill, transitional intangible assets, certain deferred tax assets, certain investments in the capital instruments of unconsolidated financial institutions and other adjustments. |
| | 132 |
The following table represents a roll-forward of the Company's Common Equity Tier 1 capital, Additional Tier 1 capital and Tier 2 capital calculated under the U.S. Basel III Advanced Approach transitional rules from December 31, 2014 to September 30, 2015 (dollars in millions).
Common Equity Tier 1 capital: |
| |||
Common Equity Tier 1 capital at December 31, 2014 | $ | 57,324 | ||
Change related to the following items: | ||||
Value of shareholders' common equity | 2,887 | |||
Net goodwill | (34 | ) | ||
Net intangible assets (other than goodwill and mortgage servicing assets) | (594 | ) | ||
Credit spread premium over risk-free rate for derivative liabilities | (61 | ) | ||
Net deferred tax assets | (369 | ) | ||
Debt valuation adjustment | (34 | ) | ||
Adjustments related to accumulated other comprehensive income | (159 | ) | ||
Expected credit loss that exceeds eligible credit reserves | 10 | |||
Other deductions and adjustments | 86 | |||
|
| |||
Common Equity Tier 1 capital at September 30, 2015 | $ | 59,056 | ||
|
| |||
Additional Tier 1 capital: | ||||
Additional Tier 1 capital at December 31, 2014 | $ | 6,858 | ||
New issuance of qualifying preferred stock | 1,500 | |||
Change related to the following items: | ||||
Trust preferred securities | (1,732 | ) | ||
Nonredeemable noncontrolling interests | (245 | ) | ||
Net deferred tax assets | 895 | |||
Credit spread premium over risk-free rate for derivative liabilities | 311 | |||
Debt valuation adjustment | (444 | ) | ||
Expected credit loss that exceeds eligible credit reserves | 39 | |||
Other adjustments and deductions | (167 | ) | ||
|
| |||
Additional Tier 1 capital at September 30, 2015 | $ | 7,015 | ||
|
| |||
Tier 1 capital (Common Equity Tier 1 capital plus Additional Tier 1 capital) at September 30, 2015 | $ | 66,071 | ||
|
| |||
Tier 2 capital: | ||||
Tier 2 capital at December 31, 2014 | $ | 10,790 | ||
Change related to the following items: | ||||
Subordinated debt | 2,236 | |||
Trust preferred securities | (329 | ) | ||
Nonredeemable noncontrolling interests | 15 | |||
Other adjustments and deductions | 138 | |||
|
| |||
Tier 2 capital at September 30, 2015 | $ | 12,850 | ||
|
| |||
Total capital at September 30, 2015 | $ | 78,921 | ||
|
| |||
| 133 | |
The following table summarizes the Company's Common Equity Tier 1 capital, Additional Tier 1 capital and Tier 2 capital calculated under the U.S. Basel III Advanced Approach transitional rules at September 30, 2015 and December 31, 2014:
| At September 30, 2015 | At December 31, 2014 | |||||||
| (dollars in millions) | ||||||||
Common Equity Tier 1 capital: | ||||||||
Common stock and surplus | $ | 20,440 | $ | 21,503 | ||||
Retained earnings | 48,746 | 44,625 | ||||||
Accumulated other comprehensive (loss) | (1,419 | ) | (1,248 | ) | ||||
Regulatory adjustments and deductions: | ||||||||
Net goodwill | (6,646 | ) | (6,612 | ) | ||||
Net intangible assets (other than goodwill and mortgage servicing assets) | (1,226 | ) | (632 | ) | ||||
Credit spread premium over risk-free rate for derivative liabilities | (222 | ) | (161 | ) | ||||
Net deferred tax assets | (949 | ) | (580 | ) | ||||
Debt valuation adjustment | 124 | 158 | ||||||
Adjustments related to accumulated other comprehensive income | 303 | 462 | ||||||
Expected credit loss over eligible credit reserves | - | (10 | ) | |||||
Other adjustments and deductions | (95 | ) | (181 | ) | ||||
|
|
|
| |||||
Total Common Equity Tier 1 capital | $ | 59,056 | $ | 57,324 | ||||
|
|
|
| |||||
Additional Tier 1 capital: | ||||||||
Preferred stock | $ | 7,520 | $ | 6,020 | ||||
Trust preferred securities | 702 | 2,434 | ||||||
Nonredeemable noncontrolling interests | 759 | 1,004 | ||||||
Regulatory adjustments and deductions: | ||||||||
Net deferred tax assets | (1,423 | ) | (2,318 | ) | ||||
Credit spread premium over risk-free rate for derivative liabilities | (333 | ) | (644 | ) | ||||
Debt valuation adjustment | 186 | 630 | ||||||
Expected credit loss over eligible credit reserves | - | (39 | ) | |||||
Other adjustments and deductions | (396 | ) | (229 | ) | ||||
|
|
|
| |||||
Additional Tier 1 capital | $ | 7,015 | $ | 6,858 | ||||
|
|
|
| |||||
Total Tier 1 capital | $ | 66,071 | $ | 64,182 | ||||
|
|
|
| |||||
Tier 2 capital: | ||||||||
Subordinated debt | $ | 10,575 | $ | 8,339 | ||||
Trust preferred securities | 2,105 | 2,434 | ||||||
Other qualifying amounts | 42 | 27 | ||||||
Regulatory adjustments and deductions | 128 | (10 | ) | |||||
|
|
|
| |||||
Total Tier 2 capital | $ | 12,850 | $ | 10,790 | ||||
|
|
|
| |||||
Total capital | $ | 78,921 | $ | 74,972 | ||||
|
|
|
| |||||
| | 134 |
The following table represents a roll-forward of the Company's RWAs calculated under the U.S. Basel III Advanced Approach transitional rules from December 31, 2014 to September 30, 2015. The RWAs for each category in the table reflect both on- and off-balance sheet exposures, where appropriate (dollars in millions).
Credit risk RWAs: |
| |||
Balance at December 31, 2014 | $ | 184,645 | ||
Change related to the following items: | ||||
Derivatives | (3,737 | ) | ||
Securities financing transactions | 1,932 | |||
Other counterparty credit risk | (198 | ) | ||
Securitizations | 1,596 | |||
Credit valuation adjustment | (2,904 | ) | ||
Investment securities | 1,508 | |||
Loans | 5,295 | |||
Cash | (466 | ) | ||
Equity investments | (4,789 | ) | ||
Other credit risk(1) | (1,668 | ) | ||
|
| |||
Total change in credit risk RWAs | $ | (3,431 | ) | |
|
| |||
Balance at September 30, 2015 | $ | 181,214 | ||
|
| |||
Market risk RWAs: | ||||
Balance at December 31, 2014 | $ | 121,363 | ||
Change related to the following items: | ||||
Regulatory VaR | 562 | |||
Regulatory stressed VaR | 840 | |||
Incremental risk charge | (8,084 | ) | ||
Comprehensive risk measure | (1,011 | ) | ||
Specific risk: | ||||
Non-securitizations | (1,925 | ) | ||
Securitizations | (10,286 | ) | ||
|
| |||
Total change in market risk RWAs | $ | (19,904 | ) | |
|
| |||
Balance at September 30, 2015 | $ | 101,459 | ||
|
| |||
Operational risk RWAs: | ||||
Balance at December 31, 2014 | $ | 150,000 | ||
Changes during the period(2) | (9,431 | ) | ||
|
| |||
Balance at September 30, 2015 | $ | 140,569 | ||
|
| |||
VaR-Value-at-Risk.
| (1) | Amount reflects assets not in a defined category, non-material portfolios of exposures and unsettled transactions. |
| (2) | Amount primarily reflects model recalibration related to residential mortgage litigation expense recorded in the fourth quarter of 2014. |
Pro Forma Regulatory Capital Ratios. The following table presents the Company's pro forma estimates under the fully phased-in U.S. Basel III Advanced and Standardized Approaches at September 30, 2015:
| At September 30, 2015 | ||||||||
| Fully Phased-In Basis Pro Forma Estimates | ||||||||
| U.S. Basel
III Advanced Approach | U.S. Basel
III Standardized Approach | |||||||
| (dollars in millions) | ||||||||
Common Equity Tier 1 capital | $ | 54,513 | $ | 54,513 | ||||
RWAs | 433,745 | 418,609 | ||||||
Common Equity Tier 1 ratio | 12.6 | % | 13.0 | % | ||||
| 135 | |
These fully phased-in basis pro forma estimates are based on the Company's current understanding of U.S. Basel III and other factors, which may be subject to change as the Company receives additional clarification and implementation guidance from the Federal Reserve relating to U.S. Basel III and as the interpretation of the regulation evolves over time. The fully phased-in basis pro forma Common Equity Tier 1 capital, RWAs and Common Equity Tier 1 risk-based capital ratio estimates are non-GAAP financial measures that the Company considers to be useful measures for evaluating compliance with new regulatory capital requirements that were not yet effective at September 30, 2015. These preliminary estimates are subject to risks and uncertainties that may cause actual results to differ materially and should not be taken as a projection of what the Company's capital ratios, RWAs, earnings or other results will actually be at future dates. See "Risk Factors" in Part I, Item 1A of the 2014 Form 10-K for a discussion of risks and uncertainties that may affect the future results of the Company.
As of January 1, 2015, the Company is subject to the following minimum capital ratios under U.S. Basel III: Common Equity Tier 1 capital ratio of 4.5%; Tier 1 capital ratio of 6.0%; Total capital ratio of 8.0%; and Tier 1 leverage ratio of 4.0%. As of January 1, 2018, the Company will be subject to a supplementary leverage ratio requirement of at least 5.0%, which includes a Tier 1 supplementary leverage capital buffer of at least 2.0% in addition to the 3.0% minimum supplementary leverage ratio (see "Supplementary Leverage Ratio" herein). In addition, on a fully phased-in basis by 2019, the Company will be subject to a greater than 2.5% Common Equity Tier 1 capital conservation buffer and, if deployed by banking regulators, up to a 2.5% Common Equity Tier 1 countercyclical buffer. The capital conservation buffer and countercyclical capital buffer, if any, apply over each of the Company's Common Equity Tier 1, Tier 1 and Total risk-based capital ratios. Failure to maintain such buffers will result in restrictions on the Company's ability to make capital distributions, including the payment of dividends and the repurchase of stock, and to pay discretionary bonuses to executive officers. In July 2015, the Federal Reserve issued a final rule imposing risk-based capital surcharges, which augment the capital conservation buffer, on U.S. bank holding companies that are identified as G-SIBs (see "G-SIB Capital Surcharge" herein).
G-SIB Capital Surcharge.
In July 2015, the Federal Reserve issued a final rule imposing risk-based capital surcharges on U.S. bank holding companies that are identified as G-SIBs, which include the Company. Under the final rule, a G-SIB must calculate its G-SIB capital surcharge under two methods and use the higher of the two surcharges. The first method considers the G-SIB's size, interconnectedness, cross-jurisdictional activity, substitutability and complexity, which is generally consistent with the methodology developed by the Basel Committee. The second method uses similar inputs, but replaces substitutability with the use of short-term wholesale funding and generally results in higher surcharges than the first method. Under the final rule, the G-SIB capital surcharge must be satisfied using Common Equity Tier 1 capital and will function as an extension of the capital conservation buffer. The Federal Reserve has stated that, under the final rule and using the most recent available data, the estimated G-SIB surcharges will range from 1.0% to 4.5% of a GSIB's RWAs. Under the Federal Reserve's calculation for the Company, the Company's G-SIB surcharge would be 3%. The surcharge will be phased in between January 1, 2016 and January 1, 2019.
Total Loss-Absorbing Capacity.
On October 30, 2015, the Federal Reserve issued a proposal for top-tier bank holding companies of U.S. G-SIBs ("covered BHCs"), including the Company, which establishes external total loss-absorbing capacity ("TLAC") requirements. The proposal contains various definitions and restrictions, such as requiring eligible long-term debt to be unsecured, to have a maturity greater than one year, and not include certain debt with derivative-linked features, such as certain structured notes. Under the proposal, a covered BHC would be required to maintain a minimum external TLAC of the greater of 16% of RWAs, excluding regulatory buffers, and 9.5% of the denominator of its U.S. Basel III total leverage exposure by January 1, 2019, increasing to the greater of 18% of RWAs, excluding regulatory buffers, and 9.5% of the denominator of its U.S. Basel III total leverage exposure
| | 136 |
by January 1, 2022. In addition, covered BHCs must meet the external TLAC requirement with minimum eligible long-term debt equal to the greater of 6% of RWAs plus the G-SIB capital surcharge, and 4.5% of the denominator of its U.S. Basel III total leverage exposure. The proposal would also impose restrictions on other liabilities that covered BHCs incur or have outstanding, as well as require all U.S. banking organizations supervised by the Federal Reserve with assets of at least $1 billion to make certain deductions from capital for their investments in unsecured debt issued by covered BHCs. The Company is currently reviewing the proposal and evaluating the potential impact of these proposed requirements.
Capital Plans and Stress Tests .
Pursuant to the Dodd-Frank Act, the Federal Reserve has adopted capital planning and stress test requirements for large bank holding companies, including the Company, which form part of the Federal Reserve's annual Comprehensive Capital Analysis and Review ("CCAR") framework. Under the Federal Reserve's capital plan rule, the Company must submit an annual capital plan to the Federal Reserve, taking into account the results of separate stress tests designed by the Company and the Federal Reserve, so that the Federal Reserve may assess the Company's systems and processes that incorporate forward-looking projections of revenues and losses to monitor and maintain its internal capital adequacy. The capital plan rule requires that such companies receive no objection from the Federal Reserve before making a capital distribution. In addition, even with an approved capital plan, a large bank holding company must seek the approval of the Federal Reserve before making a capital distribution if, among other reasons, it would not meet its regulatory capital requirements after making the proposed capital distribution. In addition, the Federal Reserve's final rule on stress testing under the Dodd-Frank Act requires the Company to conduct semi-annual company-run stress tests. The rule also subjects the Company to an annual supervisory stress test conducted by the Federal Reserve.
The Company submitted its 2015 annual capital plan to the Federal Reserve in January 2015 and received no objection to the plan (see "Capital Management" herein). In March 2015, the Federal Reserve published summary results of the Dodd-Frank Act and CCAR supervisory stress tests of each large bank holding company, including the Company. As required, the Company disclosed a summary of the results of its company-run stress tests on March 11, 2015. In July 2015, the Company submitted its 2015 semi-annual stress test to the Federal Reserve.
| 137 | |
The final rule also requires Advanced Approach banking organizations that have exited from the parallel run, including the Company, to incorporate the Advanced Approach into their capital planning and company-run stress tests beginning with the January 1, 2016 cycle. However, in July 2015, the Federal Reserve issued proposed revisions to its capital plan and stress test rules that would, among other things, indefinitely defer the use of the Advanced Approach, remove the Tier 1 common ratio requirement, and delay the incorporation of the supplementary leverage ratio until the 2017 cycle. In addition, the Federal Reserve has indicated that it is considering whether and, if so, how to incorporate the G-SIB capital surcharge in the CCAR and Dodd-Frank Act stress tests. In October 2014, the Federal Reserve revised its capital planning and stress testing regulations to, among other things, generally limit a large bank holding company's ability to make capital distributions (other than scheduled payments on Additional Tier 1 and Tier 2 capital instruments) if the bank holding company's net capital issuances are less than the amount indicated in its capital plan, and to shift the start and submission dates of the capital plan and stress test cycles beginning with the 2016 cycle.
The Dodd-Frank Act also requires each of the Company's U.S. Bank Subsidiaries to conduct an annual stress test. MSBNA submitted its 2015 annual company-run stress tests to the OCC in January 2015 and MSPBNA submitted its annual company-run stress tests to the OCC in March 2015. MSBNA published a summary of its stress test results on March 11, 2015, and MSPBNA published a summary of its stress test results on June 15, 2015. In June 2014, the OCC issued a proposed rule, among other things, to shift the timing of the annual stress testing cycle that applies to the Company's U.S. Bank Subsidiaries beginning with the 2016 cycle.
Supplementary Leverage Ratio.
Beginning on January 1, 2015, the Company and its U.S. Bank Subsidiaries are required to publicly disclose their U.S. Basel III supplementary leverage ratio, which will become effective as a capital standard on January 1, 2018. By January 1, 2018, the Company must also maintain a Tier 1 supplementary leverage capital buffer of at least 2% in addition to the 3% minimum supplementary leverage ratio (for a total of at least 5%), in order to avoid limitations on capital distributions, including dividends and stock repurchases, and discretionary bonus payments to executive officers. In addition, beginning in 2018, the Company's U.S. Bank Subsidiaries must maintain a supplementary leverage ratio of 6% to be considered "well-capitalized."
The following table presents the Company's total consolidated assets and consolidated daily average assets under U.S. GAAP, its total supplementary leverage exposure and its supplementary leverage ratio disclosures on a transitional basis under the U.S. Basel III rules:
| At September 30, 2015 | ||||
| (dollars in millions) | ||||
Total assets | $ | 834,113 | ||
Consolidated daily average assets(1) | $ | 827,464 | ||
Adjustment for derivative exposures(2) | 229,158 | |||
Adjustment for repo-style transactions(2) | 15,443 | |||
Adjustment for off-balance sheet exposures(2) | 64,630 | |||
Other adjustments(3) | (10,742 | ) | ||
|
| |||
Supplementary leverage exposure | $ | 1,125,953 | ||
|
| |||
Supplementary leverage ratio(4) | 5.9 | % | ||
| (1) | Amount is computed as the average daily balance of consolidated assets under U.S. GAAP during the calendar quarter. |
| (2) | Amount is computed as the arithmetic mean of the month-end balances over the calendar quarter. |
| (3) | Amount reflects adjustments to Tier 1 capital, including disallowed goodwill, transitional intangible assets, certain deferred tax assets, certain investments in the capital instruments of unconsolidated financial institutions and other adjustments. |
| (4) | At September 30, 2015, supplementary leverage ratios calculated using Tier 1 capital and supplementary leverage exposures computed under U.S. Basel III on a transitional basis for the Company's U.S. Bank Subsidiaries were as follows: MSBNA: 7.3%; and MSPBNA: 9.7%. |
The supplementary leverage exposure (noted in the above table) represents the Company's consolidated daily average assets under U.S. GAAP as adjusted, among other items, by: (i) the addition of the potential future
| | 138 |
exposure for derivative contracts (including derivatives that are centrally cleared for clients), the gross-up of cash collateral netting where certain qualifying criteria are not met, and the effective notional principal amount of sold credit protection offset by certain qualifying purchased credit protection; (ii) the counterparty credit risk associated with repo-style transactions; (iii) the credit equivalent amount of off-balance sheet exposures, which is computed by applying the relevant credit conversion factors; and (iv) certain amounts deducted or adjusted from Tier 1 capital under U.S. Basel III. The supplementary leverage exposure and supplementary leverage ratio are non-GAAP financial measures that the Company considers to be useful measures for evaluating compliance with new regulatory capital requirements that have not yet become effective.
The Company estimates its pro forma fully phased-in supplementary leverage ratio to be approximately 5.5% at September 30, 2015. This estimate utilizes a fully phased-in U.S. Basel III Tier 1 capital numerator and a denominator of approximately $1.12 trillion. The Company's estimates are subject to risks and uncertainties that may cause actual results to differ materially from estimates based on these regulations. Further, these expectations should not be taken as projections of what the Company's supplementary leverage ratios, earnings, assets or exposures will actually be at future dates. See "Risk Factors" in Part I, Item 1A of the 2014 Form 10-K for a discussion of risks and uncertainties that may affect the future results of the Company.
Required Capital.
The Company's required capital ("Required Capital") estimation is based on the Required Capital framework, an internal capital adequacy measure. This framework is a risk-based and leverage use-of-capital measure, which is compared with the Company's regulatory capital to ensure that the Company maintains an amount of going concern capital after absorbing potential losses from extreme stress events, where applicable, at a point in time. The Company defines the difference between its regulatory capital and aggregate Required Capital as Parent capital. Average Common Equity Tier 1 capital, aggregate Required Capital and Parent capital for the quarter ended September 30, 2015 were approximately $58.8 billion, $38.4 billion and $20.4 billion, respectively. The Company generally holds Parent capital for prospective regulatory requirements, including for example, supplementary leverage ratio and U.S. Basel III transitional deductions and adjustments expected to reduce the Company's capital through 2018. The Company also holds Parent capital for organic growth, acquisitions and other capital needs.
Common Equity Tier 1 capital and common equity attribution to the business segments is based on capital usage calculated by the Required Capital framework as well as each business segment's relative contribution to the Company's total Required Capital. Required Capital is assessed at each business segment and further attributed to product lines. This process is intended to align capital with the risks in each business segment in order to allow senior management to evaluate returns on a risk-adjusted basis. The Required Capital framework will evolve over time in response to changes in the business and regulatory environment and to incorporate enhancements in modeling techniques. The Company will continue to evaluate the framework with respect to the impact of future regulatory requirements, as appropriate.
The following table presents the Company's business segments' and the Parent's average Common Equity Tier 1 capital and average common equity, which were calculated on a monthly basis:
| Three Months Ended September 30, | ||||||||||||||||
| 2015 | 2014 | |||||||||||||||
| Average Common Equity Tier 1 Capital | Average Common Equity | Average Common Equity Tier 1 Capital | Average Common Equity | |||||||||||||
| (dollars in billions) | ||||||||||||||||
Institutional Securities | $ | 32.0 | $ | 33.8 | $ | 31.9 | $ | 32.6 | ||||||||
Wealth Management | 5.1 | 11.4 | 5.2 | 11.2 | ||||||||||||
Investment Management | 1.3 | 2.1 | 2.2 | 3.1 | ||||||||||||
Parent capital | 20.4 | 20.3 | 19.4 | 19.3 | ||||||||||||
|
|
|
|
|
|
|
| |||||||||
Total | $ | 58.8 | $ | 67.6 | $ | 58.7 | $ | 66.2 | ||||||||
|
|
|
|
|
|
|
| |||||||||
| 139 | |
Activities Restrictions under the Volcker Rule.
In December 2013, U.S. regulators issued final regulations to implement the Volcker Rule. The Volcker Rule prohibits "banking entities," including the Company and its affiliates, from engaging in certain prohibited "proprietary trading" activities, as defined in the Volcker Rule, subject to exemptions for underwriting, market making-related activities, risk-mitigating hedging and certain other activities. The Volcker Rule also prohibits certain investments and relationships by banking entities with "covered funds," as defined in the Volcker Rule, subject to certain exemptions and exclusions. Banking entities were required to bring all of their activities and investments into conformance with the Volcker Rule by July 21, 2015, subject to certain extensions. In addition, the Volcker Rule requires banking entities to have comprehensive compliance programs reasonably designed to ensure and monitor compliance with the Volcker Rule.
The Volcker Rule also requires that deductions be made from a bank holding company's Tier 1 capital for certain permissible investments in covered funds. Beginning with the third quarter of 2015, the required deductions are reflected in the relevant regulatory capital tiers and ratios.
Resolution and Recovery Planning.
Pursuant to the Dodd-Frank Act, the Company is required to submit to the Federal Reserve and the FDIC an annual resolution plan that describes its strategy for a rapid and orderly resolution under the U.S. Bankruptcy Code in the event of material financial distress or failure of the Company. The Company submitted its 2015 resolution plan in July 2015. In addition, MSBNA is required to submit to the FDIC an annual resolution plan that describes MSBNA's strategy for a rapid and orderly resolution in the event of a material financial distress or failure of MSBNA. MSBNA submitted its 2015 resolution plan in September 2015. For further information on the Company's resolution and recovery planning, see "Business-Supervision and Regulation-Resolution and Recovery Planning" in Part I, Item 1 of the 2014 Form 10-K.
Off-Balance Sheet Arrangements with Unconsolidated Entities.
The Company enters into various arrangements with unconsolidated entities, including variable interest entities, primarily in connection with its Institutional Securities and Investment Management business segments. See "Off-Balance Sheet Arrangements with Unconsolidated Entities" included in Part II, Item 7 of the 2014 Form 10-K and Note 12 to the condensed consolidated financial statements in Item 1 for further information.
See Note 11 to the condensed consolidated financial statements in Item 1 for information on guarantees.
Commitments.
The Company's commitments associated with outstanding letters of credit and other financial guarantees obtained to satisfy collateral requirements, investment activities, corporate lending, securities financing arrangements, mortgage lending, underwriting commitments and other financing arrangements at September 30, 2015 were approximately $188 billion. See Note 11 to the condensed consolidated financial statements in Item 1 for further information on commitments.
Effects of Inflation and Changes in Foreign Exchange Rates.
To the extent that an increased inflation outlook results in rising interest rates or has negative impacts on the valuation of financial instruments that exceed the impact on the value of the Company's liabilities, it may adversely affect the Company's financial position and profitability. A significant portion of the Company's business is conducted in currencies other than the U.S. dollar, and changes in foreign exchange rates relative to the U.S. dollar, therefore, can affect the value of non-U.S. dollar net assets, revenues and expenses. For a further discussion of the effects of inflation and changes in foreign exchange rates on the Company's business and financial results and strategies to mitigate potential exposures see "MD&A-Liquidity and Capital Resources-Effects of Inflation and Changes in Foreign Exchange Rates" in Part II, Item 7 of the 2014 Form 10-K.
| | 140 |
| Item 3. | Quantitative and Qualitative Disclosures about Market Risk. |
Market Risk.
Market risk refers to the risk that a change in the level of one or more market prices, rates, indices, implied volatilities (the price volatility of the underlying instrument imputed from option prices), correlations or other market factors, such as market liquidity, will result in losses for a position or portfolio. Generally, the Company incurs market risk as a result of trading, investing and client facilitation activities, principally within the Company's Institutional Securities business segment where the substantial majority of the Company's Value-at-Risk ("VaR") for market risk exposures is generated. In addition, the Company incurs trading-related market risk within its Wealth Management business segment. The Company's Investment Management business segment incurs principally Non-trading market risk primarily from capital investments in real estate funds and investments in private equity vehicles. For a further discussion of the Company's Market Risk, see "Quantitative and Qualitative Disclosures about Market Risk-Risk Management" in Part II, Item 7A of the 2014 Form 10-K.
VaR.
The Company uses the statistical technique known as VaR as one of the tools used to measure, monitor and review the market risk exposures of its trading portfolios. The Company's Market Risk Department calculates and distributes daily VaR-based risk measures to various levels of management.
VaR Methodology, Assumptions and Limitations. For information regarding the Company's VaR methodology, assumptions and limitations, see "Quantitative and Qualitative Disclosures about Market Risk-Risk Management-Market Risk-VaR Methodology, Assumptions and Limitations" in Part II, Item 7A of the 2014 Form 10-K.
The Company utilizes the same VaR model for risk management purposes as well as for regulatory capital calculations. The Company's VaR model has been approved by the Company's regulators for use in regulatory capital calculations.
The portfolio of positions used for the Company's VaR for risk management purposes ("Management VaR") differs from that used for regulatory capital requirements ("Regulatory VaR"), as Management VaR contains certain positions that are excluded from Regulatory VaR. Examples include counterparty Credit Valuation Adjustments ("CVA") and related hedges, as well as loans that are carried at fair value and associated hedges.
Table 1 below presents the Management VaR for the Company's Trading portfolio, on a period-end, quarterly average and quarterly high and low basis. To further enhance the transparency of the Company's traded market risk, the Credit Portfolio VaR has been disclosed as a separate category from the Primary Risk Categories. The Credit Portfolio includes counterparty CVA and related hedges, as well as loans that are carried at fair value and associated hedges.
| 141 | |
Trading Risks.
The table below presents the Company's 95%/one-day Management VaR:
| Table 1: 95% Management VaR | 95%/One-Day VaR for the | 95%/One-Day VaR for the | ||||||||||||||||||||||||||||||
| Quarter Ended September 30, 2015 | Quarter Ended June 30, 2015 | |||||||||||||||||||||||||||||||
Market Risk Category | Period End | Average | High | Low | Period End | Average | High | Low | ||||||||||||||||||||||||
| (dollars in millions) | ||||||||||||||||||||||||||||||||
Interest rate and credit spread | $ | 42 | $ | 37 | $ | 42 | $ | 33 | $ | 34 | $ | 35 | $ | 40 | $ | 28 | ||||||||||||||||
Equity price | 17 | 18 | 28 | 15 | 18 | 23 | 30 | 17 | ||||||||||||||||||||||||
Foreign exchange rate | 12 | 12 | 18 | 7 | 13 | 12 | 16 | 9 | ||||||||||||||||||||||||
Commodity price | 17 | 17 | 19 | 15 | 16 | 16 | 18 | 13 | ||||||||||||||||||||||||
Less: Diversification benefit(1)(2) | (36 | ) | (34 | ) | N/A | N/A | (35 | ) | (36 | ) | N/A | N/A | ||||||||||||||||||||
|
|
|
|
|
|
|
| |||||||||||||||||||||||||
Primary Risk Categories | $ | 52 | $ | 50 | $ | 56 | $ | 45 | $ | 46 | $ | 50 | $ | 56 | $ | 44 | ||||||||||||||||
|
|
|
|
|
|
|
| |||||||||||||||||||||||||
Credit Portfolio | 14 | 12 | 14 | 10 | 10 | 12 | 14 | 10 | ||||||||||||||||||||||||
Less: Diversification benefit(1)(2) | (13 | ) | (9 | ) | N/A | N/A | (7 | ) | (8 | ) | N/A | N/A | ||||||||||||||||||||
|
|
|
|
|
|
|
| |||||||||||||||||||||||||
Total Management VaR | $ | 53 | $ | 53 | $ | 58 | $ | 48 | $ | 49 | $ | 54 | $ | 61 | $ | 47 | ||||||||||||||||
|
|
|
|
|
|
|
| |||||||||||||||||||||||||
N/A-Not Applicable
| (1) | Diversification benefit equals the difference between the total Management VaR and the sum of the component VaRs. This benefit arises because the simulated one-day losses for each of the components occur on different days; similar diversification benefits also are taken into account within each component. |
| (2) | The high and low VaR values for the total Management VaR and each of the component VaRs might have occurred on different days during the quarter, and therefore, the diversification benefit is not an applicable measure. |
The Company's average Total Management VaR for the quarter ended September 30, 2015 was $53 million compared with $54 million for the quarter ended June 30, 2015. This decrease was driven by reduced trading risks offset by higher market volatility.
Distribution of VaR Statistics and Net Revenues for the quarter ended September 30, 2015. One method of evaluating the reasonableness of the Company's VaR model as a measure of the Company's potential volatility of net revenues is to compare VaR with actual trading revenues. Assuming no intraday trading, for a 95%/one-day VaR, the expected number of times that trading losses should exceed VaR during the year is 13, and, in general, if trading losses were to exceed VaR more than 21 times in a year, the adequacy of the VaR model would be questioned. The Company evaluates the reasonableness of its VaR model by comparing the potential declines in portfolio values generated by the model with actual trading results for the Company, as well as individual business units. For days where losses exceed the VaR statistic, the Company examines the drivers of trading losses to evaluate the VaR model's accuracy relative to realized trading results.
The distribution of VaR Statistics and Net Revenues is presented in the histograms below for both the Primary Risk Categories and the Total Trading populations.
| | 142 |
Primary Risk Categories. As shown in Table 1, the Company's average 95%/one-day Primary Risk Categories VaR for the quarter ended September 30, 2015 was $50 million. The histogram below presents the distribution of the Company's daily 95%/one-day Primary Risk Categories VaR for the quarter ended September 30, 2015, which was in a range between $45 million and $54 million for approximately 97% of the trading days during the quarter.
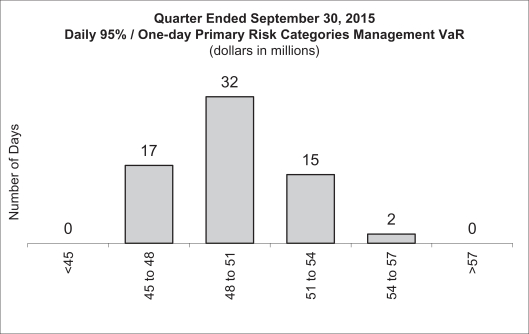
| 143 | |
The histogram below shows the distribution for the quarter ended September 30, 2015 of daily net trading revenues, including profits and losses from positions included in VaR for the Company's businesses that comprise the Primary Risk Categories. Daily net trading revenues also include intraday trading activities but exclude certain items not captured in the VaR model, such as fees, commissions and net interest income. Daily net trading revenues differ from the definition of revenues required for Regulatory VaR backtesting, which further excludes intraday trading. During the quarter ended September 30, 2015, the Company's businesses that comprise the Primary Risk Categories experienced net trading losses on 11 days, of which no day was in excess of the 95%/one-day Primary Risk Categories VaR.
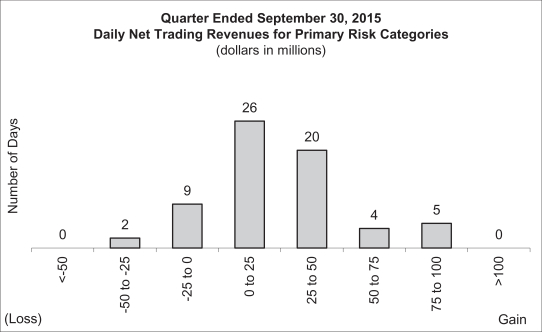
| | 144 |
Total Trading-Including the Primary Risk Categories and the Credit Portfolio. As shown in Table 1, the Company's average 95%/one-day Total Management VaR, which includes the Primary Risk Categories and the Credit Portfolio, for the quarter ended September 30, 2015 was $53 million. The histogram below presents the distribution of the Company's daily 95%/one-day Total Management VaR for the quarter ended September 30, 2015, which was in a range between $49 million and $57 million for approximately 95% of trading days during the quarter.
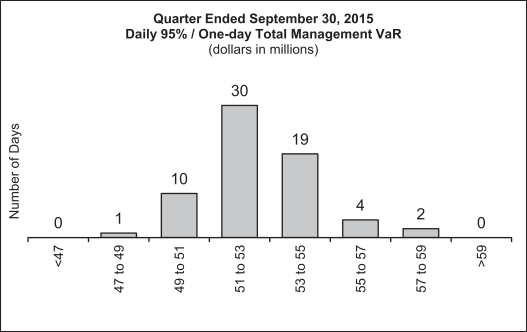
| 145 | |
The histogram below shows the distribution for the quarter ended September 30, 2015 of daily net trading revenues, including profits and losses from Primary Risk Categories, Credit Portfolio positions and intraday trading activities, for the Company's Trading businesses. Daily net trading revenues also include intraday trading activities but exclude certain items not captured in the VaR model, such as fees, commissions and net interest income. Daily net trading revenues differ from the definition of revenues required for Regulatory VaR backtesting, which further excludes intraday trading. During the quarter ended September 30, 2015, the Company experienced net trading losses on 13 days, of which no day was in excess of the 95%/one-day Total Management VaR.
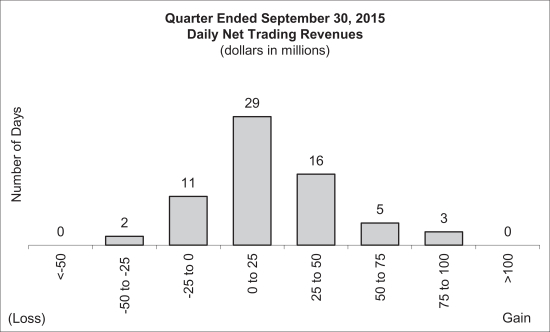
Non-trading Risks.
The Company believes that sensitivity analysis is an appropriate representation of the Company's non-trading risks. Reflected below is this analysis covering substantially all of the non-trading risk in the Company's portfolio.
Counterparty Exposure Related to the Company's Own Credit Spread. The credit spread risk sensitivity of the counterparty exposure related to the Company's own credit spread corresponded to an increase in value of approximately $6 million for each 1 basis point widening in the Company's credit spread level at both September 30, 2015 and June 30, 2015.
Funding Liabilities. The credit spread risk sensitivity of the Company's mark-to-market funding liabilities corresponded to an increase in value of approximately $10 million and $11 million for each 1 basis point widening in the Company's credit spread level at September 30, 2015 and June 30, 2015, respectively.
| | 146 |
Interest Rate Risk Sensitivity. The table below presents the estimated impact of selected hypothetical instantaneous upward and downward parallel interest rate shocks on net interest income over the next 12 months for the Company's U.S. Bank Subsidiaries. These shocks are applied to the Company's 12-month forecast for its U.S. Bank Subsidiaries, which incorporates market expectations of interest rates and the Company's forecasted business activity, including its deposit deployment strategy and asset-liability management hedges. Thus, the impacts are incremental to that forecast, and additionally, do not reflect the impact of the repricing of assets and liabilities beyond 12 months. The Company does not manage to any single rate scenario, but rather manages net interest income in its U.S. Bank Subsidiaries to optimize across a range of possible outcomes.
| +200 Basis Points | +100 Basis Points | -100 Basis Points | ||||||||||
| (dollars in millions) | ||||||||||||
Impact on the Company's U.S. Bank Subsidiaries' net interest income: | ||||||||||||
At September 30, 2015 | $ | 132 | $ | 120 | $ | (406 | ) | |||||
At June 30, 2015 | 280 | 121 | (391 | ) | ||||||||
Investments. The Company makes investments in both public and private companies. These investments are predominantly equity positions with long investment horizons, the majority of which are for business facilitation purposes. The market risk related to these investments is measured by estimating the potential reduction in net income associated with a 10% decline in investment values and related impact on performance fees.
| 10% Sensitivity | ||||||||
Investments | At September 30, 2015 | At June 30, 2015 | ||||||
| (dollars in millions) | ||||||||
Investments related to Investment Management activities: | ||||||||
Real estate funds | $ | 174 | $ | 166 | ||||
Private equity and infrastructure funds | 131 | 160 | ||||||
Hedge fund investments | 98 | 103 | ||||||
Other investments: | ||||||||
Mitsubishi UFJ Morgan Stanley Securities Co., Ltd. | 149 | 141 | ||||||
Other Company investments | 226 | 196 | ||||||
Equity Market Sensitivity. In the Company's Wealth Management and Investment Management business segments, certain fee-based revenue streams are driven by the value of clients' equity holdings. The overall level of revenues for these streams also depends on multiple additional factors that include, but are not limited to, the level and duration of the equity market decline, price volatility, the geographic and industry mix of client assets, the rate and magnitude of client investments and redemptions, and the impact of such market decline and price volatility on client behavior. Therefore, overall revenues do not correlate completely with changes in the equity markets.
Credit Risk.
Credit risk refers to the risk of loss arising when a borrower, counterparty or issuer does not meet its financial obligations to the Company. For a further discussion of the Company's credit risks, see "Quantitative and Qualitative Disclosures about Market Risk-Risk Management-Credit Risk" in Part II, Item 7A of the 2014 Form 10-K. Also, see Notes 7 and 11 to the condensed consolidated financial statements in Item 1 for additional information about the Company's loans and lending commitments, respectively.
Lending Activities.
The Company provides loans to a variety of customers, from large corporate and institutional clients to high net worth individuals. In addition, the Company purchases loans in the secondary market. Loans held for investment and loans held for sale are classified in Loans, and loans held at fair value are classified in Trading assets in the Company's condensed consolidated statements of financial condition. See Notes 3 and 7 to the Company's condensed consolidated financial statements in Item 1 for further information.
| 147 | |
The following tables present the Company's loan portfolio by loan type within its Institutional Securities and Wealth Management business segments at September 30, 2015 and December 31, 2014.
| At September 30, 2015 | ||||||||||||||||
| Institutional Securities Corporate Lending(1) | Institutional Securities Other Lending(2) | Wealth Management Lending(3) | Total | |||||||||||||
| (dollars in millions) | ||||||||||||||||
Corporate loans | $ | 7,780 | $ | 8,136 | $ | 6,464 | $ | 22,380 | ||||||||
Consumer loans | - | - | 20,445 | 20,445 | ||||||||||||
Residential real estate loans | - | - | 19,630 | 19,630 | ||||||||||||
Wholesale real estate loans | - | 6,555 | - | 6,555 | ||||||||||||
|
|
|
|
|
|
|
| |||||||||
Loans held for investment, net of allowance | 7,780 | 14,691 | 46,539 | 69,010 | ||||||||||||
|
|
|
|
|
|
|
| |||||||||
Corporate loans | 7,254 | 1,255 | - | 8,509 | ||||||||||||
Residential real estate loans | - | 45 | 76 | 121 | ||||||||||||
Wholesale real estate loans | - | 569 | - | 569 | ||||||||||||
|
|
|
|
|
|
|
| |||||||||
Loans held for sale | 7,254 | 1,869 | 76 | 9,199 | ||||||||||||
|
|
|
|
|
|
|
| |||||||||
Corporate loans | 249 | 6,513 | - | 6,762 | ||||||||||||
Residential real estate loans | - | 1,933 | - | 1,933 | ||||||||||||
Wholesale real estate loans | - | 2,639 | - | 2,639 | ||||||||||||
|
|
|
|
|
|
|
| |||||||||
Loans held at fair value | 249 | 11,085 | - | 11,334 | ||||||||||||
|
|
|
|
|
|
|
| |||||||||
Total loans(4) | $ | 15,283 | $ | 27,645 | $ | 46,615 | $ | 89,543 | ||||||||
|
|
|
|
|
|
|
| |||||||||
| At December 31, 2014 | ||||||||||||||||
| Institutional Securities Corporate Lending(1) | Institutional Securities Other Lending(2) | Wealth Management Lending(3) | Total | |||||||||||||
| (dollars in millions) | ||||||||||||||||
Corporate loans | $ | 7,957 | $ | 6,161 | $ | 5,423 | $ | 19,541 | ||||||||
Consumer loans | - | - | 16,574 | 16,574 | ||||||||||||
Residential real estate loans | - | - | 15,727 | 15,727 | ||||||||||||
Wholesale real estate loans | - | 5,277 | - | 5,277 | ||||||||||||
|
|
|
|
|
|
|
| |||||||||
Loans held for investment, net of allowance | 7,957 | 11,438 | 37,724 | 57,119 | ||||||||||||
|
|
|
|
|
|
|
| |||||||||
Corporate loans | 7,801 | 399 | - | 8,200 | ||||||||||||
Residential real estate loans | - | 16 | 98 | 114 | ||||||||||||
Wholesale real estate loans | - | 1,144 | - | 1,144 | ||||||||||||
|
|
|
|
|
|
|
| |||||||||
Loans held for sale | 7,801 | 1,559 | 98 | 9,458 | ||||||||||||
|
|
|
|
|
|
|
| |||||||||
Corporate loans | 483 | 6,610 | - | 7,093 | ||||||||||||
Residential real estate loans | - | 1,682 | - | 1,682 | ||||||||||||
Wholesale real estate loans | - | 3,187 | - | 3,187 | ||||||||||||
|
|
|
|
|
|
|
| |||||||||
Loans held at fair value | 483 | 11,479 | - | 11,962 | ||||||||||||
|
|
|
|
|
|
|
| |||||||||
Total loans(4) | $ | 16,241 | $ | 24,476 | $ | 37,822 | $ | 78,539 | ||||||||
|
|
|
|
|
|
|
| |||||||||
| (1) | In addition to loans, at September 30, 2015, and December 31, 2014 there were $100.6 billion and $82.0 billion of lending commitments, respectively. |
| (2) | In addition to loans, at September 30, 2015, and December 31, 2014 there were $6.9 billion and $5.2 billion of lending commitments, respectively. |
| (3) | In addition to loans, at September 30, 2015, and December 31, 2014 there were $5.7 billion and $5.0 billion of lending commitments, respectively. |
| (4) | Amounts exclude customer margin loans outstanding of $25.7 billion and $29.0 billion and employee loans outstanding of $4.9 billion and $5.1 billion at September 30, 2015, and December 31, 2014, respectively. See Notes 6 and 7 to the Company's condensed consolidated financial statements in Item 1 for further information. |
| | 148 |
At September 30, 2015 and December 31, 2014, the allowance for loan losses related to loans that were accounted for as held for investment was $173 million and $149 million, respectively, and the allowance for commitment losses related to lending commitments that were accounted for as held for investment was $161 million and $149 million, respectively. The aggregate allowance for loan and commitment losses for loans and lending commitments, respectively, increased over the nine months ended September 30, 2015 due primarily to the growth in the portfolios, and reflected the high quality of the Company's lending portfolios resulting from strong credit risk management. See Note 7 to the Company's condensed consolidated financial statements in Item 1 for further information.
Institutional Securities Corporate Lending Activities.
For a discussion of the Company's Institutional Securities corporate lending activities, see "Quantitative and Qualitative Disclosures about Market Risk-Risk Management-Credit Risk-Institutional Securities Corporate Lending Activities" in Part II, Item 7A of the 2014 Form 10-K.
The Company's credit exposure from its corporate lending positions and lending commitments are measured in accordance with the Company's internal risk management standards. Lending commitments represent legally binding obligations to provide funding to clients for all lending transactions. Since commitments associated with these business activities may expire unused or may not be utilized to full capacity, they do not necessarily reflect the actual future cash funding requirements.
The following tables present the Company's Institutional Securities Corporate Lending Commitments and Loans at September 30, 2015 and December 31, 2014.
| At September 30, 2015 | ||||||||||||||||||||
| Years to Maturity | ||||||||||||||||||||
Credit Rating(1) | Less than 1 | 1-3 | 3-5 | Over 5 | Total(2) | |||||||||||||||
| (dollars in millions) | ||||||||||||||||||||
AAA | $ | 287 | $ | 24 | $ | 50 | $ | - | $ | 361 | ||||||||||
AA | 4,326 | 3,960 | 3,513 | - | 11,799 | |||||||||||||||
A | 3,436 | 6,079 | 11,485 | 18 | 21,018 | |||||||||||||||
BBB | 6,728 | 12,947 | 21,245 | 3,580 | 44,500 | |||||||||||||||
|
|
|
|
|
|
|
|
|
| |||||||||||
Investment grade | 14,777 | 23,010 | 36,293 | 3,598 | 77,678 | |||||||||||||||
Non-investment grade | 3,985 | 8,761 | 19,117 | 6,368 | 38,231 | |||||||||||||||
|
|
|
|
|
|
|
|
|
| |||||||||||
Total | $ | 18,762 | $ | 31,771 | $ | 55,410 | $ | 9,966 | $ | 115,909 | ||||||||||
|
|
|
|
|
|
|
|
|
| |||||||||||
| At December 31, 2014 | ||||||||||||||||||||
| Years to Maturity | ||||||||||||||||||||
Credit Rating(1) | Less than 1 | 1-3 | 3-5 | Over 5 | Total(2)(3) | |||||||||||||||
| (dollars in millions) | ||||||||||||||||||||
AAA | $ | 275 | $ | 74 | $ | 37 | $ | - | $ | 386 | ||||||||||
AA | 3,760 | 2,764 | 4,580 | - | 11,104 | |||||||||||||||
A | 2,135 | 4,534 | 12,029 | 173 | 18,871 | |||||||||||||||
BBB | 3,350 | 9,303 | 22,424 | 1,503 | 36,580 | |||||||||||||||
|
|
|
|
|
|
|
|
|
| |||||||||||
Investment grade | 9,520 | 16,675 | 39,070 | 1,676 | 66,941 | |||||||||||||||
Non-investment grade | 2,034 | 7,222 | 17,755 | 4,050 | 31,061 | |||||||||||||||
|
|
|
|
|
|
|
|
|
| |||||||||||
Total | $ | 11,554 | $ | 23,897 | $ | 56,825 | $ | 5,726 | $ | 98,002 | ||||||||||
|
|
|
|
|
|
|
|
|
| |||||||||||
| (1) | Obligor credit ratings are determined by the Company's Credit Risk Management Department. |
| (2) | For syndications led by the Company, lending commitments accepted by the borrower but not yet closed are net of the amounts agreed to by counterparties that will participate in the syndication. For syndications that the Company participates in and does not lead, lending commitments accepted by the borrower but not yet closed include only the amount that the Company expects it will be allocated from the lead syndicate bank. |
| (3) | Amounts include the fair value adjustment of $0.3 billion related to the Company's lending commitments at December 31, 2014. |
| 149 | |
At September 30, 2015 and December 31, 2014, the aggregate amount of investment grade loans was $5.7 billion and $6.3 billion, respectively, and the aggregate amount of non-investment grade loans was $9.6 billion and $9.9 billion, respectively. In connection with the Company's lending activities (which include both loans and lending commitments), the Company had hedges (which included "single name," "sector" and "index" hedges) with a notional amount of $14.1 billion related to the total corporate lending exposure of $115.9 billion at September 30, 2015 and with a notional amount of $12.9 billion related to the total corporate lending exposure of $98.0 billion at December 31, 2014. At September 30, 2015 and December 31, 2014, there were no significant loans and lending commitments held for investment under non-accrual status within Corporate Lending, as no significant loans or lending commitments were past due or had payments that were in doubt.
"Event-Driven" Loans and Lending Commitments. Included in the total corporate lending exposure amounts in the table above at September 30, 2015 were "event-driven" exposures of $30.4 billion composed of loans of $4.2 billion and lending commitments of $26.2 billion. Included in the "event-driven" exposure at September 30, 2015 were $15.8 billion of loans and lending commitments to non-investment grade borrowers. The maturity profile of these "event-driven" loans and lending commitments at September 30, 2015 were as follows: 31% will mature in less than 1 year, 19% will mature within 1 to 3 years, 20% will mature within 3 to 5 years and 30% will mature in over 5 years.
Industry Exposure-Corporate Lending. The Company also monitors its credit exposure to individual industries for credit exposure arising from corporate loans and lending commitments as discussed below.
The following table presents the Company's Institutional Securities credit exposure from its primary Corporate Lending Commitments and Loans by industry:
Industry(1) | At September
30, 2015 | At December
31, 2014 | ||||||
| (dollars in millions) | ||||||||
Energy | $ | 15,922 | $ | 14,056 | ||||
Utilities | 14,336 | 11,717 | ||||||
Healthcare | 12,388 | 9,707 | ||||||
Information technology | 11,902 | 7,572 | ||||||
Consumer discretionary | 11,289 | 10,214 | ||||||
Industrials | 11,063 | 9,134 | ||||||
Funds, exchanges and other financial services(2) | 9,749 | 9,277 | ||||||
Consumer staples | 7,915 | 7,320 | ||||||
Materials | 6,982 | 5,259 | ||||||
Real Estate | 5,226 | 4,616 | ||||||
Telecommunications services | 4,144 | 4,335 | ||||||
Insurance | 4,087 | 3,313 | ||||||
Other | 906 | 1,482 | ||||||
|
|
|
| |||||
Total | $ | 115,909 | $ | 98,002 | ||||
|
|
|
| |||||
| (1) | Industry categories are based on the Global Industry Classification Standard. |
| (2) | Includes mutual funds, pension funds, private equity and real estate funds, exchanges and clearinghouses, and diversified financial services. |
Institutional Securities Other Lending Activities.
In addition to the primary corporate lending activities described above, the Company's Institutional Securities business segment engages in other lending activities. These activities include commercial and residential mortgage lending, asset-backed lending, corporate loans purchased in the secondary market, financing extended to equities and commodities customers, and loans to municipalities. At September 30, 2015 and December 31, 2014, there were no significant loans and lending commitments held for investment under non-accrual status as no significant loans or lending commitments were past due or had payments that were in doubt.
| | 150 |
The following tables present the Company's Institutional Securities business segment's other loans by remaining contract maturity:
| At September 30, 2015(1) | ||||||||||||||||||||
| Years to Maturity | ||||||||||||||||||||
| Less than 1 | 1-3 | 3-5 | Over 5 | Total | ||||||||||||||||
| (dollars in millions) | ||||||||||||||||||||
Corporate loans | $ | 5,141 | $ | 6,111 | $ | 2,368 | $ | 2,284 | $ | 15,904 | ||||||||||
Residential real estate loans | - | 31 | - | 1,947 | 1,978 | |||||||||||||||
Wholesale real estate loans | 1,067 | 4,207 | 2,054 | 2,435 | 9,763 | |||||||||||||||
|
|
|
|
|
|
|
|
|
| |||||||||||
Total | $ | 6,208 | $ | 10,349 | $ | 4,422 | $ | 6,666 | $ | 27,645 | ||||||||||
|
|
|
|
|
|
|
|
|
| |||||||||||
| At December 31, 2014(1) | ||||||||||||||||||||
| Years to Maturity | ||||||||||||||||||||
| Less than 1 | 1-3 | 3-5 | Over 5 | Total | ||||||||||||||||
| (dollars in millions) | ||||||||||||||||||||
Corporate loans | $ | 4,231 | $ | 4,826 | $ | 1,884 | $ | 2,229 | $ | 13,170 | ||||||||||
Residential real estate loans | - | 43 | - | 1,655 | 1,698 | |||||||||||||||
Wholesale real estate loans | 100 | 5,060 | 2,112 | 2,336 | 9,608 | |||||||||||||||
|
|
|
|
|
|
|
|
|
| |||||||||||
Total | $ | 4,331 | $ | 9,929 | $ | 3,996 | $ | 6,220 | $ | 24,476 | ||||||||||
|
|
|
|
|
|
|
|
|
| |||||||||||
| (1) | In addition to loans, at September 30, 2015 and December 31, 2014 there were $6.9 billion and $5.2 billion of lending commitments, respectively. |
Institutional Securities Lending Exposures Related to the Energy Industry. At September 30, 2015, Institutional Securities' loans and lending commitments related to the energy industry were $17.2 billion ($15.9 billion for Corporate Lending and $1.3 billion for Other Lending activities), which were relatively unchanged from June 30, 2015. Approximately two thirds of these energy industry loans and lending commitments were to investment grade counterparties. The energy industry portfolio included $1.5 billion in loans and $2.7 billion in lending commitments to Oil and Gas Exploration and Production ("E&P") companies. The E&P loans were principally to non-investment grade counterparties, while the E&P lending commitments were essentially split between investment grade and non-investment grade counterparties. Such loans and lending commitments to non-investment grade counterparties are subject to semi-annual borrowing base reassessments based on the value of the underlying oil and gas reserves pledged as collateral.
Margin Lending. In addition, Institutional Securities other lending activities include margin lending, which allows the client to borrow against the value of qualifying securities. At September 30, 2015 and December 31, 2014, Institutional Securities margin lending of $11.0 billion and $15.3 billion, respectively, were classified within Customer and other receivables in the Company's condensed consolidated statements of financial condition.
Wealth Management Lending Activities.
The principal Wealth Management lending activities include securities-based lending and residential real estate loans. The following tables present the Company's Wealth Management business segment lending activities by remaining contract maturity:
| At September 30, 2015 | ||||||||||||||||||||
| Years to Maturity | ||||||||||||||||||||
| Less than 1 | 1-3 | 3-5 | Over 5 | Total | ||||||||||||||||
| (dollars in millions) | ||||||||||||||||||||
Securities-based lending and other loans | $ | 24,406 | $ | 925 | $ | 895 | $ | 683 | $ | 26,909 | ||||||||||
Residential real estate loans | - | - | 24 | 19,682 | 19,706 | |||||||||||||||
|
|
|
|
|
|
|
|
|
| |||||||||||
Total | $ | 24,406 | $ | 925 | $ | 919 | $ | 20,365 | $ | 46,615 | ||||||||||
|
|
|
|
|
|
|
|
|
| |||||||||||
| 151 | |
| At December 31, 2014 | ||||||||||||||||||||
| Years to Maturity | ||||||||||||||||||||
| Less than 1 | 1-3 | 3-5 | Over 5 | Total | ||||||||||||||||
| (dollars in millions) | ||||||||||||||||||||
Securities-based lending and other loans | $ | 19,408 | $ | 1,071 | $ | 750 | $ | 768 | $ | 21,997 | ||||||||||
Residential real estate loans | - | - | - | 15,825 | 15,825 | |||||||||||||||
|
|
|
|
|
|
|
|
|
| |||||||||||
Total | $ | 19,408 | $ | 1,071 | $ | 750 | $ | 16,593 | $ | 37,822 | ||||||||||
|
|
|
|
|
|
|
|
|
| |||||||||||
Securities-based lending provided to the Company's retail clients is primarily conducted through the Company's PLA and LAL platforms which had an outstanding loan balance of $23.8 billion and $19.1 billion at September 30, 2015 and December 31, 2014, respectively. These loans allow the client to borrow money against the value of qualifying securities for any purpose other than purchasing securities. For a further discussion on the Company's credit lines against the value of qualifying securities see "Quantitative and Qualitative Disclosures about Market Risk-Risk Management-Credit Risk-Wealth Management Lending Activities" in Part II, Item 7A of the 2014 Form 10-K.
Residential real estate loans consist of first and second lien mortgages, including home equity lines of credit ("HELOC") loans. The vast majority of mortgage and HELOC loans are held for investment in the Company's Wealth Management business segment's loan portfolio. For a discussion of the Company's residential real estate loan evaluation process see "Quantitative and Qualitative Disclosures about Market Risk-Risk Management-Credit Risk-Wealth Management Lending Activities" in Part II, Item 7A of the 2014 Form 10-K.
For the nine months ended September 30, 2015, loans and lending commitments associated with the Company's Wealth Management business segment lending activities increased by approximately 22%, mainly due to growth in PLA, LAL and residential real estate loans. At September 30, 2015 and December 31, 2014, approximately 99.9% of the Company's Wealth Management business segment lending activities held for investment were current; while approximately 0.1% were on non-accrual status because the loans were past due for a period of 90 days or more or payment of principal or interest was in doubt.
The Company's Wealth Management business segment also provides margin lending to clients and had an outstanding balance of $14.7 billion and $13.7 billion at September 30, 2015 and December 31, 2014, respectively, which were classified within Customer and other receivables within the Company's condensed consolidated statements of financial condition.
In addition, the Company's Wealth Management business segment has employee loans that are granted primarily in conjunction with programs established by the Company to recruit and retain certain employees. These loans, recorded in Customer and other receivables in the Company's condensed consolidated statements of financial condition, are full recourse, require periodic payments and have repayment terms ranging from 2 to 12 years. The Company establishes an allowance for loan amounts it does not consider recoverable from terminated employees, which is recorded in Compensation and benefits expense.
Credit Exposure-Derivatives.
For a discussion of the Company's credit exposure to derivative contracts, see "Quantitative and Qualitative Disclosures about Market Risk-Risk Management-Credit Risk-Credit Exposure-Derivatives" in Part II, Item 7A of the 2014 Form 10-K.
| | 152 |
The following tables summarize the key characteristics of the Company's credit derivative portfolio by counterparty type at September 30, 2015 and December 31, 2014. The fair values shown are before the application of contractual netting or collateral. For additional credit exposure information on the Company's credit derivative portfolio, see Note 4 to the Company's condensed consolidated financial statements in Item 1.
| At September 30, 2015 | ||||||||||||||||||||
| Fair Values(1) | Notionals | |||||||||||||||||||
| Receivable | Payable | Net | Beneficiary | Guarantor | ||||||||||||||||
| (dollars in millions) | ||||||||||||||||||||
Banks and securities firms | $ | 19,095 | $ | 18,677 | $ | 418 | $ | 611,416 | $ | 561,190 | ||||||||||
Insurance and other financial institutions | 5,587 | 5,863 | (276 | ) | 224,157 | 232,983 | ||||||||||||||
Non-financial entities | 99 | 102 | (3 | ) | 5,918 | 3,364 | ||||||||||||||
|
|
|
|
|
|
|
|
|
| |||||||||||
Total | $ | 24,781 | $ | 24,642 | $ | 139 | $ | 841,491 | $ | 797,537 | ||||||||||
|
|
|
|
|
|
|
|
|
| |||||||||||
| At December 31, 2014 | ||||||||||||||||||||
| Fair Values(1) | Notionals | |||||||||||||||||||
| Receivable | Payable | Net | Beneficiary | Guarantor | ||||||||||||||||
| (dollars in millions) | ||||||||||||||||||||
Banks and securities firms | $ | 25,452 | $ | 25,323 | $ | 129 | $ | 712,466 | $ | 687,155 | ||||||||||
Insurance and other financial institutions | 6,639 | 6,697 | (58 | ) | 216,489 | 217,201 | ||||||||||||||
Non-financial entities | 91 | 89 | 2 | 5,049 | 3,706 | |||||||||||||||
|
|
|
|
|
|
|
|
|
| |||||||||||
Total | $ | 32,182 | $ | 32,109 | $ | 73 | $ | 934,004 | $ | 908,062 | ||||||||||
|
|
|
|
|
|
|
|
|
| |||||||||||
| (1) | The Company's CDS are classified in either Level 2 or Level 3 of the fair value hierarchy. Approximately 4% of receivable fair values and 7% of payable fair values represented Level 3 amounts at September 30, 2015 and December 31, 2014, respectively (see Note 3 to the condensed consolidated financial statements in Item 1). |
Industry Exposure-OTC Derivative Products.
The Company also monitors its credit exposure to individual industries for current exposure arising from the Company's OTC derivative contracts.
The following table shows the Company's OTC derivative products at fair value, net of collateral, by industry:
| Industry(1) | At September
30, 2015 | At December
31, 2014 | ||||||
| (dollars in millions) | ||||||||
Utilities | $ | 4,101 | $ | 3,797 | ||||
Industrials | 2,253 | 2,278 | ||||||
Banks and securities firms | 2,164 | 3,297 | ||||||
Funds, exchanges and other financial services(2) | 2,157 | 2,321 | ||||||
Regional governments | 1,367 | 1,603 | ||||||
Healthcare | 1,154 | 1,365 | ||||||
Not-for-profit organizations | 933 | 905 | ||||||
Special purpose vehicles | 853 | 1,089 | ||||||
Consumer discretionary | 759 | 423 | ||||||
Sovereign governments | 670 | 889 | ||||||
Materials | 625 | 591 | ||||||
Real estate | 588 | 761 | ||||||
Consumer staples | 563 | 650 | ||||||
Insurance | 494 | 455 | ||||||
Energy | 411 | 575 | ||||||
Other | 551 | 1,228 | ||||||
|
|
|
| |||||
Total(3) | $ | 19,643 | $ | 22,227 | ||||
|
|
|
| |||||
| 153 | |
| (1) | Industry categories are based on the Global Industry Classification Standard. |
| (2) | Amounts include mutual funds, pension funds, private equity and real estate funds, exchanges and clearinghouses, and diversified financial services. |
| (3) | For further information on derivative instruments and hedging activities, see Note 4 to the Company's condensed consolidated financial statements in Item 1. |
Other.
In addition to the activities noted above, there are other credit risks managed by the Company's Credit Risk Management Department and various business areas within the Company's Institutional Securities business segment. The Company participates in securitization activities whereby it extends short-term or long-term funding to clients through loans and lending commitments that are secured by the assets of the borrower and generally provide for over-collateralization, including commercial real estate loans, loans secured by loan pools, commercial company loans, and secured lines of revolving credit. Credit risk with respect to these loans and lending commitments arises from the failure of a borrower to perform according to the terms of the loan agreement or a decline in the underlying collateral value. See Note 12 to the Company's condensed consolidated financial statements in Item 1 for information about the Company's securitization activities. In addition, a collateral management group monitors collateral levels against requirements and oversees the administration of the collateral function. See Note 6 to the Company's condensed consolidated financial statements in Item 1 for additional information about the Company's collateralized transactions.
Country Risk Exposure.
Country risk exposure is the risk that uncertainties arising from the economic, social, security and political conditions within a foreign country (any country other than the U.S.) will adversely affect the ability of the sovereign government and/or obligors within the country to honor their obligations to the Company. The Company actively manages country risk exposure through a comprehensive risk management framework that combines credit and market fundamentals and allows the Company to effectively identify, monitor and limit country risk. For a further discussion of the Company's country risk exposure see "Quantitative and Qualitative Disclosures about Market Risk-Risk Management-Credit Risk- Country Risk Exposure" in Part II, Item 7A of the 2014 Form 10-K.
The Company's sovereign exposures consist of financial instruments entered into with sovereign and local governments. Its non-sovereign exposures consist of exposures to primarily corporations and financial institutions. The following table shows the Company's ten largest non-U.S. country risk net exposures at September 30, 2015. Index credit derivatives are included in the Company's country risk exposure tables. Each reference entity within an index is allocated to that reference entity's country of risk. Index exposures are allocated to the underlying reference entities in proportion to the notional weighting of each reference entity in the index, adjusted for any fair value receivable/payable for that reference entity. Where credit risk crosses multiple jurisdictions, for example, a CDS purchased from an issuer in a specific country that references bonds issued by an entity in a different country, the fair value of the CDS is reflected in the Net Counterparty Exposure column based on the country of the CDS issuer. Further, the notional amount of the CDS adjusted for the fair value of the receivable/payable is reflected in the Net Inventory column based on the country of the underlying reference entity.
| | 154 |
Country | Net Inventory(1) | Net Counterparty Exposure(2)(3) | Loans | Lending Commitments | Exposure Before Hedges | Hedges(4) | Net Exposure(5) | |||||||||||||||||||||
| (dollars in millions) | ||||||||||||||||||||||||||||
United Kingdom: | ||||||||||||||||||||||||||||
Sovereigns | $ | (393 | ) | $ | 64 | $ | - | $ | - | $ | (329 | ) | $ | (117 | ) | $ | (446 | ) | ||||||||||
Non-sovereigns | 385 | 10,787 | 2,074 | 8,231 | 21,477 | (1,399 | ) | 20,078 | ||||||||||||||||||||
|
|
|
|
|
|
|
|
|
|
|
|
|
| |||||||||||||||
Subtotal | $ | (8 | ) | $ | 10,851 | $ | 2,074 | $ | 8,231 | $ | 21,148 | $ | (1,516 | ) | $ | 19,632 | ||||||||||||
|
|
|
|
|
|
|
|
|
|
|
|
|
| |||||||||||||||
France: | ||||||||||||||||||||||||||||
Sovereigns | $ | 1,969 | $ | - | $ | - | $ | - | $ | 1,969 | $ | - | $ | 1,969 | ||||||||||||||
Non-sovereigns | (113 | ) | 2,201 | 22 | 2,242 | 4,352 | (1,041 | ) | 3,311 | |||||||||||||||||||
|
|
|
|
|
|
|
|
|
|
|
|
|
| |||||||||||||||
Subtotal | $ | 1,856 | $ | 2,201 | $ | 22 | $ | 2,242 | $ | 6,321 | $ | (1,041 | ) | $ | 5,280 | |||||||||||||
|
|
|
|
|
|
|
|
|
|
|
|
|
| |||||||||||||||
Brazil: | ||||||||||||||||||||||||||||
Sovereigns | $ | 3,568 | $ | - | $ | - | $ | - | $ | 3,568 | $ | (8 | ) | $ | 3,560 | |||||||||||||
Non-sovereigns | 66 | 487 | 1,043 | 92 | 1,688 | (578 | ) | 1,110 | ||||||||||||||||||||
|
|
|
|
|
|
|
|
|
|
|
|
|
| |||||||||||||||
Subtotal | $ | 3,634 | $ | 487 | $ | 1,043 | $ | 92 | $ | 5,256 | $ | (586 | ) | $ | 4,670 | |||||||||||||
|
|
|
|
|
|
|
|
|
|
|
|
|
| |||||||||||||||
Germany: | ||||||||||||||||||||||||||||
Sovereigns | $ | 439 | 180 | - | - | $ | 619 | $ | (1,506 | ) | $ | (887 | ) | |||||||||||||||
Non-sovereigns | 225 | 2,616 | 324 | 3,786 | 6,951 | (1,867 | ) | 5,084 | ||||||||||||||||||||
|
|
|
|
|
|
|
|
|
|
|
|
|
| |||||||||||||||
Subtotal | $ | 664 | $ | 2,796 | $ | 324 | $ | 3,786 | $ | 7,570 | $ | (3,373 | ) | $ | 4,197 | |||||||||||||
|
|
|
|
|
|
|
|
|
|
|
|
|
| |||||||||||||||
China: | ||||||||||||||||||||||||||||
Sovereigns | $ | 637 | $ | 221 | $ | - | $ | - | $ | 858 | $ | (269 | ) | $ | 589 | |||||||||||||
Non-sovereigns | 1,714 | 334 | 703 | 290 | 3,041 | (70 | ) | 2,971 | ||||||||||||||||||||
|
|
|
|
|
|
|
|
|
|
|
|
|
| |||||||||||||||
Subtotal | $ | 2,351 | $ | 555 | $ | 703 | $ | 290 | $ | 3,899 | $ | (339 | ) | $ | 3,560 | |||||||||||||
|
|
|
|
|
|
|
|
|
|
|
|
|
| |||||||||||||||
Canada: | ||||||||||||||||||||||||||||
Sovereigns | $ | 117 | $ | 91 | $ | - | $ | - | $ | 208 | $ | - | $ | 208 | ||||||||||||||
Non-sovereigns | (36 | ) | 1,468 | 207 | 1,543 | 3,182 | (180 | ) | 3,002 | |||||||||||||||||||
|
|
|
|
|
|
|
|
|
|
|
|
|
| |||||||||||||||
Subtotal | $ | 81 | $ | 1,559 | $ | 207 | $ | 1,543 | $ | 3,390 | $ | (180 | ) | $ | 3,210 | |||||||||||||
|
|
|
|
|
|
|
|
|
|
|
|
|
| |||||||||||||||
Singapore: | ||||||||||||||||||||||||||||
Sovereigns | $ | 2,188 | $ | 384 | $ | - | $ | - | $ | 2,572 | $ | - | $ | 2,572 | ||||||||||||||
Non-sovereigns | 64 | 291 | 51 | 122 | 528 | (32 | ) | 496 | ||||||||||||||||||||
|
|
|
|
|
|
|
|
|
|
|
|
|
| |||||||||||||||
Subtotal | $ | 2,252 | $ | 675 | $ | 51 | $ | 122 | $ | 3,100 | $ | (32 | ) | $ | 3,068 | |||||||||||||
|
|
|
|
|
|
|
|
|
|
|
|
|
| |||||||||||||||
Australia: | ||||||||||||||||||||||||||||
Sovereigns | $ | (25 | ) | $ | 40 | $ | - | $ | - | $ | 15 | $ | - | $ | 15 | |||||||||||||
Non-sovereigns | 412 | 722 | 285 | 949 | 2,368 | (156 | ) | 2,212 | ||||||||||||||||||||
|
|
|
|
|
|
|
|
|
|
|
|
|
| |||||||||||||||
Subtotal | $ | 387 | $ | 762 | $ | 285 | $ | 949 | $ | 2,383 | $ | (156 | ) | $ | 2,227 | |||||||||||||
|
|
|
|
|
|
|
|
|
|
|
|
|
| |||||||||||||||
Netherlands: | ||||||||||||||||||||||||||||
Sovereigns | $ | (59 | ) | $ | - | $ | - | $ | - | $ | (59 | ) | $ | - | $ | (59 | ) | |||||||||||
Non-sovereigns | 380 | 594 | 173 | 1,298 | 2,445 | (241 | ) | 2,204 | ||||||||||||||||||||
|
|
|
|
|
|
|
|
|
|
|
|
|
| |||||||||||||||
Subtotal | $ | 321 | $ | 594 | $ | 173 | $ | 1,298 | $ | 2,386 | $ | (241 | ) | $ | 2,145 | |||||||||||||
|
|
|
|
|
|
|
|
|
|
|
|
|
| |||||||||||||||
Italy: | ||||||||||||||||||||||||||||
Sovereigns | $ | 288 | $ | (21 | ) | $ | - | $ | - | $ | 267 | $ | (54 | ) | $ | 213 | ||||||||||||
Non-sovereigns | 295 | 955 | 10 | 685 | 1,945 | (173 | ) | 1,772 | ||||||||||||||||||||
|
|
|
|
|
|
|
|
|
|
|
|
|
| |||||||||||||||
Subtotal | $ | 583 | $ | 934 | $ | 10 | $ | 685 | $ | 2,212 | $ | (227 | ) | $ | 1,985 | |||||||||||||
|
|
|
|
|
|
|
|
|
|
|
|
|
| |||||||||||||||
| (1) | Net inventory represents exposure to both long and short single-name and index positions ( i.e. , bonds and equities at fair value and CDS based on a notional amount assuming zero recovery adjusted for any fair value receivable or payable). As a market maker, the Company transacts in these CDS positions to facilitate client trading. At September 30, 2015, gross purchased protection, gross written protection and net exposures related to single-name and index credit derivatives for those countries were $(235.6) billion, $231.7 billion and $(3.9) billion, respectively. For a further description of the triggers for purchased credit protection and whether those triggers may limit the effectiveness of the Company's hedges, see "Credit Exposure-Derivatives" in Part II, Item 7A, "quantitative and Qualitative Disclosures about Market Risk-Credit Risk" in the 2014 Form 10-K. |
| (2) | Net counterparty exposure ( i.e ., repurchase transactions, securities lending and OTC derivatives) takes into consideration legally enforceable master netting agreements and collateral. |
| (3) | At September 30, 2015, the benefit of collateral received against counterparty credit exposure was $11.8 billion in the U.K., with 98% of collateral consisting of cash, U.S. and U.K. government obligations, and $11.7 billion in Germany with 96% of collateral consisting of cash and government obligations of France, Belgium and Germany. The benefit of collateral received against counterparty credit exposure in the other countries totaled approximately $14.2 billion, with collateral primarily consisting of cash, Germany, France and U.S. government obligations. These amounts do not include collateral received on secured financing transactions. |
| 155 | |
| (4) | Amounts represent CDS hedges (purchased and sold) on net counterparty exposure and lending executed by trading desks responsible for hedging counterparty and lending credit risk exposures for the Company. Based on the CDS notional amount assuming zero recovery adjusted for any fair value receivable or payable. |
| (5) | In addition, at September 30, 2015, the Company had exposure to these countries for overnight deposits with banks of approximately $6.6 billion. |
Country Risk Exposures Related to Brazil and China.
At September 30, 2015, the Company's country risk exposures in Brazil included net exposures of $4,670 million (shown in the above table). The Company's sovereign net exposures in Brazil were principally in the form of local-currency government bonds held onshore to support client activity. The $1,110 million (shown in the above table) of exposures to non-sovereigns were diversified across both names and sectors. The Company's net exposure in Brazil increased from June 30, 2015, reflecting changes in local currency bond positions resulting primarily from changes in client activity.
At September 30, 2015, the Company's country risk exposures in China included net exposures of $3,560 million (shown in the above table) and overnight deposits with international banks of $1,411 million. The $2,971 million (shown in the above table) of exposures to non-sovereigns were diversified across both names and sectors and were primarily concentrated in high quality positions with negligible direct exposure to onshore equities. The Company's net exposure in China declined from June 30, 2015, reflecting a combination of repayments and return of collateral, a reduction of positions in government and quasi-government bonds, and increased hedging.
| | 156 |
| Item 4. | Controls and Procedures. |
Under the supervision and with the participation of the Company's management, including our Chief Executive Officer and Chief Financial Officer, we conducted an evaluation of the effectiveness of the Company's disclosure controls and procedures (as defined in Rule 13a-15(e) of the Securities Exchange Act of 1934, as amended (the "Exchange Act")). Based on this evaluation, our Chief Executive Officer and Chief Financial Officer concluded that our disclosure controls and procedures were effective as of the end of the period covered by this report.
No change in the Company's internal control over financial reporting (as defined in Rule 13a-15(f) of the Exchange Act) occurred during the period covered by this report that materially affected, or is reasonably likely to materially affect, the Company's internal control over financial reporting.
| 157 | |
FINANCIAL DATA SUPPLEMENT (Unaudited)
Average Balances and Interest Rates and Net Interest Income
| Three Months Ended September 30, 2015 | ||||||||||||
| Average Daily Balance | Interest | Annualized Average Rate | ||||||||||
| (dollars in millions) | ||||||||||||
Assets | ||||||||||||
Interest earning assets: | ||||||||||||
Trading assets(1): | ||||||||||||
U.S. | $ | 99,151 | $ | 468 | 1.9 | % | ||||||
Non-U.S. | 107,577 | 100 | 0.4 | |||||||||
Investment securities: | ||||||||||||
U.S. | 62,745 | 211 | 1.4 | |||||||||
Loans: | ||||||||||||
U.S. | 77,686 | 552 | 2.9 | |||||||||
Non-U.S. | 239 | 8 | 13.6 | |||||||||
Interest bearing deposits with banks: | ||||||||||||
U.S. | 29,252 | 20 | 0.3 | |||||||||
Non-U.S. | 922 | 9 | 4.0 | |||||||||
Securities purchased under agreements to resell and Securities borrowed(2): | ||||||||||||
U.S. | 173,622 | (119 | ) | (0.3 | ) | |||||||
Non-U.S. | 85,061 | 20 | 0.1 | |||||||||
Customer receivables and Other(3): | ||||||||||||
U.S. | 47,779 | 325 | 2.8 | |||||||||
Non-U.S. | 28,811 | (143 | ) | (2.0 | ) | |||||||
|
|
|
| |||||||||
Total | $ | 712,845 | $ | 1,451 | 0.8 | % | ||||||
|
| |||||||||||
Non-interest earning assets | 114,619 | |||||||||||
|
| |||||||||||
Total assets | $ | 827,464 | ||||||||||
|
| |||||||||||
Liabilities and Equity | ||||||||||||
Interest bearing liabilities: | ||||||||||||
Deposits: | ||||||||||||
U.S. | $ | 141,726 | $ | 16 | - | % | ||||||
Non-U.S. | 2,962 | 1 | 0.1 | |||||||||
Short-term borrowings(4): | ||||||||||||
U.S. | 1,300 | 2 | 0.6 | |||||||||
Non-U.S. | 1,078 | 5 | 1.9 | |||||||||
Long-term borrowings(4): | ||||||||||||
U.S. | 152,617 | 900 | 2.4 | |||||||||
Non-U.S. | 7,343 | 8 | 0.4 | |||||||||
Trading liabilities(1): | ||||||||||||
U.S. | 30,693 | - | - | |||||||||
Non-U.S. | 55,641 | - | - | |||||||||
Securities sold under agreements to repurchase and Securities loaned(5): | ||||||||||||
U.S. | 45,559 | 116 | 1.0 | |||||||||
Non-U.S. | 33,032 | 138 | 1.7 | |||||||||
Customer payables and Other(6): | ||||||||||||
U.S. | 112,001 | (291 | ) | (1.1 | ) | |||||||
Non-U.S. | 68,251 | (206 | ) | (1.2 | ) | |||||||
|
|
|
| |||||||||
Total | $ | 652,203 | $ | 689 | 0.4 | |||||||
|
| |||||||||||
Non-interest bearing liabilities and equity | 175,261 | |||||||||||
|
| |||||||||||
Total liabilities and equity | $ | 827,464 | ||||||||||
|
| |||||||||||
Net interest income and net interest rate spread | $ | 762 | 0.4 | % | ||||||||
|
|
|
| |||||||||
| | 158 |
FINANCIAL DATA SUPPLEMENT (Unaudited)-(Continued)
Average Balances and Interest Rates and Net Interest Income
| Three Months Ended September 30, 2014 | ||||||||||||
| Average Weekly Balance | Interest | Annualized Average Rate | ||||||||||
| (dollars in millions) | ||||||||||||
Assets | ||||||||||||
Interest earning assets: | ||||||||||||
Trading assets(1): | ||||||||||||
U.S. | $ | 100,135 | $ | 400 | 1.6 | % | ||||||
Non-U.S. | 110,972 | 108 | 0.4 | |||||||||
Investment securities: | ||||||||||||
U.S. | 65,590 | 162 | 1.0 | |||||||||
Loans: | ||||||||||||
U.S. | 55,920 | 461 | 3.3 | |||||||||
Non-U.S. | 347 | 13 | 15.2 | |||||||||
Interest bearing deposits with banks: | ||||||||||||
U.S. | 28,809 | 15 | 0.2 | |||||||||
Non-U.S. | 4,963 | 7 | 0.6 | |||||||||
Securities purchased under agreements to resell and Securities borrowed(2): | ||||||||||||
U.S. | 182,641 | (156 | ) | (0.3 | ) | |||||||
Non-U.S. | 77,355 | 53 | 0.3 | |||||||||
Customer receivables and Other(3): | ||||||||||||
U.S. | 67,981 | 161 | 1.0 | |||||||||
Non-U.S. | 16,373 | 160 | 4.0 | |||||||||
|
|
|
| |||||||||
Total | $ | 711,086 | $ | 1,384 | 0.8 | % | ||||||
|
| |||||||||||
Non-interest earning assets | 109,704 | |||||||||||
|
| |||||||||||
Total assets | $ | 820,790 | ||||||||||
|
| |||||||||||
Liabilities and Equity | ||||||||||||
Interest bearing liabilities: | ||||||||||||
Deposits: | ||||||||||||
U.S. | $ | 120,046 | $ | 12 | - | % | ||||||
Non-U.S. | 239 | - | - | |||||||||
Short-term borrowings(4): | ||||||||||||
U.S. | 949 | 1 | 0.4 | |||||||||
Non-U.S. | 637 | - | - | |||||||||
Long-term borrowings(4): | ||||||||||||
U.S. | 142,782 | 848 | 2.4 | |||||||||
Non-U.S. | 8,687 | 17 | 0.8 | |||||||||
Trading liabilities(1): | ||||||||||||
U.S. | 29,067 | - | - | |||||||||
Non-U.S. | 52,565 | - | - | |||||||||
Securities sold under agreements to repurchase and Securities loaned(5): | ||||||||||||
U.S. | 80,841 | 139 | 0.7 | |||||||||
Non-U.S. | 47,394 | 162 | 1.4 | |||||||||
Customer payables and Other(6): | ||||||||||||
U.S. | 120,627 | (384 | ) | (1.3 | ) | |||||||
Non-U.S. | 51,767 | 32 | 0.3 | |||||||||
|
|
|
| |||||||||
Total | $ | 655,601 | $ | 827 | 0.5 | |||||||
|
| |||||||||||
Non-interest bearing liabilities and equity | 165,189 | |||||||||||
|
| |||||||||||
Total liabilities and equity | $ | 820,790 | ||||||||||
|
| |||||||||||
Net interest income and net interest rate spread | $ | 557 | 0.3 | % | ||||||||
|
|
|
| |||||||||
| 159 | |
FINANCIAL DATA SUPPLEMENT (Unaudited)-(Continued)
Average Balances and Interest Rates and Net Interest Income
| Nine Months Ended September 30, 2015 | ||||||||||||
| Average Daily Balance | Interest | Annualized Average Rate | ||||||||||
| (dollars in millions) | ||||||||||||
Assets | ||||||||||||
Interest earning assets: | ||||||||||||
Trading assets(1): | ||||||||||||
U.S. | $ | 98,668 | $ | 1,414 | 1.9 | % | ||||||
Non-U.S. | 113,321 | 293 | 0.3 | |||||||||
Investment securities: | ||||||||||||
U.S. | 68,794 | 650 | 1.3 | |||||||||
Loans: | ||||||||||||
U.S. | 72,306 | 1,547 | 2.9 | |||||||||
Non-U.S. | 253 | 26 | 13.7 | |||||||||
Interest bearing deposits with banks: | ||||||||||||
U.S. | 22,450 | 51 | 0.3 | |||||||||
Non-U.S. | 1,000 | 23 | 3.1 | |||||||||
Securities purchased under agreements to resell and Securities borrowed(2): | ||||||||||||
U.S. | 170,895 | (454 | ) | (0.4 | ) | |||||||
Non-U.S. | 83,061 | 50 | 0.1 | |||||||||
Customer receivables and Other(3): | ||||||||||||
U.S. | 55,778 | 596 | 1.4 | |||||||||
Non-U.S. | 27,217 | 125 | 0.6 | |||||||||
|
|
|
| |||||||||
Total | $ | 713,743 | $ | 4,321 | 0.8 | % | ||||||
|
| |||||||||||
Non-interest earning assets | 123,981 | |||||||||||
|
| |||||||||||
Total assets | $ | 837,724 | ||||||||||
|
| |||||||||||
Liabilities and Equity | ||||||||||||
Interest bearing liabilities: | ||||||||||||
Deposits: | ||||||||||||
U.S. | $ | 136,128 | $ | 48 | - | % | ||||||
Non-U.S. | 2,092 | 3 | 0.2 | |||||||||
Short-term borrowings(4): | ||||||||||||
U.S. | 1,195 | 3 | 0.3 | |||||||||
Non-U.S. | 1,127 | 13 | 1.5 | |||||||||
Long-term borrowings(4): | ||||||||||||
U.S. | 150,227 | 2,723 | 2.4 | |||||||||
Non-U.S. | 7,686 | 26 | 0.5 | |||||||||
Trading liabilities(1): | ||||||||||||
U.S. | 29,551 | - | - | |||||||||
Non-U.S. | 54,176 | - | - | |||||||||
Securities sold under agreements to repurchase and Securities loaned(5): | ||||||||||||
U.S. | 58,306 | 341 | 0.8 | |||||||||
Non-U.S. | 34,941 | 456 | 1.7 | |||||||||
Customer payables and Other(6): | ||||||||||||
U.S. | 115,150 | (1,154 | ) | (1.3 | ) | |||||||
Non-U.S. | 63,739 | (194 | ) | (0.4 | ) | |||||||
|
|
|
| |||||||||
Total | $ | 654,318 | $ | 2,265 | 0.5 | |||||||
|
| |||||||||||
Non-interest bearing liabilities and equity | 183,406 | |||||||||||
|
| |||||||||||
Total liabilities and equity | $ | 837,724 | ||||||||||
|
| |||||||||||
Net interest income and net interest rate spread | $ | 2,056 | 0.3 | % | ||||||||
|
|
|
| |||||||||
| | 160 |
FINANCIAL DATA SUPPLEMENT (Unaudited)-(Continued)
Average Balances and Interest Rates and Net Interest Income
| Nine Months Ended September 30, 2014 | ||||||||||||
| Average Weekly Balance | Interest | Annualized Average Rate | ||||||||||
| (dollars in millions) | ||||||||||||
Assets | ||||||||||||
Interest earning assets: | ||||||||||||
Trading assets(1): | ||||||||||||
U.S. | $ | 104,250 | $ | 1,193 | 1.5 | % | ||||||
Non-U.S. | 114,636 | 327 | 0.4 | |||||||||
Investment securities: | ||||||||||||
U.S. | 61,009 | 449 | 1.0 | |||||||||
Loans: | ||||||||||||
U.S. | 50,023 | 1,180 | 3.2 | |||||||||
Non-U.S. | 377 | 40 | 14.2 | |||||||||
Interest bearing deposits with banks: | ||||||||||||
U.S. | 35,563 | 55 | 0.2 | |||||||||
Non-U.S. | 6,170 | 26 | 0.6 | |||||||||
Securities purchased under agreements to resell and Securities borrowed(2): | ||||||||||||
U.S. | 175,724 | (374 | ) | (0.3 | ) | |||||||
Non-U.S. | 84,468 | 135 | 0.2 | |||||||||
Customer receivables and Other(3): | ||||||||||||
U.S. | 68,790 | 491 | 1.0 | |||||||||
Non-U.S. | 16,094 | 455 | 3.8 | |||||||||
|
|
|
| |||||||||
Total | $ | 717,104 | $ | 3,977 | 0.7 | % | ||||||
|
| |||||||||||
Non-interest earning assets | 112,374 | |||||||||||
|
| |||||||||||
Total assets | $ | 829,478 | ||||||||||
|
| |||||||||||
Liabilities and Equity | ||||||||||||
Interest bearing liabilities: | ||||||||||||
Deposits: | ||||||||||||
U.S. | $ | 117,133 | $ | 42 | - | % | ||||||
Non-U.S. | 209 | 2 | 1.3 | |||||||||
Short-term borrowings(4): | ||||||||||||
U.S. | 927 | 1 | 0.1 | |||||||||
Non-U.S. | 620 | 2 | 0.4 | |||||||||
Long-term borrowings(4): | ||||||||||||
U.S. | 143,220 | 2,686 | 2.5 | |||||||||
Non-U.S. | 8,371 | 44 | 0.7 | |||||||||
Trading liabilities(1): | ||||||||||||
U.S. | 26,535 | - | - | |||||||||
Non-U.S. | 54,838 | - | - | |||||||||
Securities sold under agreements to repurchase and Securities loaned(5): | ||||||||||||
U.S. | 89,557 | 416 | 0.6 | |||||||||
Non-U.S. | 58,035 | 514 | 1.2 | |||||||||
Customer payables and Other(6): | ||||||||||||
U.S. | 116,708 | (992 | ) | (1.1 | ) | |||||||
Non-U.S. | 48,449 | 130 | 0.4 | |||||||||
|
|
|
| |||||||||
Total | $ | 664,602 | $ | 2,845 | 0.6 | |||||||
|
| |||||||||||
Non-interest bearing liabilities and equity | 164,876 | |||||||||||
|
| |||||||||||
Total liabilities and equity | $ | 829,478 | ||||||||||
|
| |||||||||||
Net interest income and net interest rate spread | $ | 1,132 | 0.1 | % | ||||||||
|
|
|
| |||||||||
| (1) | Interest expense on Trading liabilities is reported as a reduction of Interest income on Trading assets. |
| (2) | Includes fees paid on Securities borrowed. |
| (3) | Includes interest from Customer receivables and Other interest earning assets. |
| (4) | The Company also issues structured notes that have coupon or repayment terms linked to the performance of debt or equity securities, indices, currencies or commodities, which are recorded within Trading revenues (see Note 3). |
| (5) | Includes fees received on Securities loaned. |
| (6) | Includes fees received from prime brokerage customers for stock loan transactions incurred to cover customers' short positions. |
| 161 | |
FINANCIAL DATA SUPPLEMENT (Unaudited)-(Continued)
Rate/Volume Analysis
The following tables set forth an analysis of the effect on net interest income of volume and rate changes:
| Three Months Ended September 30, 2015 versus | ||||||||||||
| Three Months Ended September 30, 2014 | ||||||||||||
| Increase (decrease) due to change in: | ||||||||||||
| Volume | Rate | Net Change | ||||||||||
| (dollars in millions) | ||||||||||||
Interest earning assets | ||||||||||||
Trading Assets: | ||||||||||||
U.S. | $ | (4 | ) | $ | 72 | $ | 68 | |||||
Non-U.S. | (3 | ) | (5 | ) | (8 | ) | ||||||
Investment securities: | ||||||||||||
U.S. | (7 | ) | 56 | 49 | ||||||||
Loans: | ||||||||||||
U.S. | 179 | (88 | ) | 91 | ||||||||
Non-U.S. | (4 | ) | (1 | ) | (5 | ) | ||||||
Interest bearing deposits with banks: | ||||||||||||
U.S. | - | 5 | 5 | |||||||||
Non-U.S. | (6 | ) | 8 | 2 | ||||||||
Securities purchased under agreements to resell and Securities borrowed: | ||||||||||||
U.S. | 8 | 29 | 37 | |||||||||
Non-U.S. | 5 | (38 | ) | (33 | ) | |||||||
Customer receivables and Other: | ||||||||||||
U.S. | (48 | ) | 212 | 164 | ||||||||
Non-U.S. | 122 | (425 | ) | (303 | ) | |||||||
|
|
|
|
|
| |||||||
Change in interest income | $ | 242 | $ | (175 | ) | $ | 67 | |||||
|
|
|
|
|
| |||||||
Interest bearing liabilities | ||||||||||||
Deposits: | ||||||||||||
U.S. | $ | 2 | $ | 2 | $ | 4 | ||||||
Non-U.S. | - | 1 | 1 | |||||||||
Short-term borrowings: | ||||||||||||
U.S. | - | 1 | 1 | |||||||||
Non-U.S. | - | 5 | 5 | |||||||||
Long-term borrowings: | ||||||||||||
U.S. | 58 | (6 | ) | 52 | ||||||||
Non-U.S. | (3 | ) | (6 | ) | (9 | ) | ||||||
Securities sold under agreements to repurchase and Securities loaned: | ||||||||||||
U.S. | (61 | ) | 38 | (23 | ) | |||||||
Non-U.S. | (49 | ) | 25 | (24 | ) | |||||||
Customer payables and Other: | ||||||||||||
U.S. | 27 | 66 | 93 | |||||||||
Non-U.S. | 10 | (248 | ) | (238 | ) | |||||||
|
|
|
|
|
| |||||||
Change in interest expense | $ | (16 | ) | $ | (122 | ) | $ | (138 | ) | |||
|
|
|
|
|
| |||||||
Change in net interest income | $ | 258 | $ | (53 | ) | $ | 205 | |||||
|
|
|
|
|
| |||||||
| | 162 |
FINANCIAL DATA SUPPLEMENT (Unaudited)-(Continued)
Rate/Volume Analysis
| Nine Months Ended September 30, 2015 versus | ||||||||||||
| Nine Months Ended September 30, 2014 | ||||||||||||
| Increase (decrease) due to change in: | ||||||||||||
| Volume | Rate | Net Change | ||||||||||
| (dollars in millions) | ||||||||||||
Interest earning assets | ||||||||||||
Trading assets: | ||||||||||||
U.S. | $ | (64 | ) | $ | 285 | $ | 221 | |||||
Non-U.S. | (4 | ) | (30 | ) | (34 | ) | ||||||
Investment securities: | ||||||||||||
U.S. | 57 | 144 | 201 | |||||||||
Loans: | ||||||||||||
U.S. | 526 | (159 | ) | 367 | ||||||||
Non-U.S. | (13 | ) | (1 | ) | (14 | ) | ||||||
Interest bearing deposits with banks: | ||||||||||||
U.S. | (20 | ) | 16 | (4 | ) | |||||||
Non-U.S. | (22 | ) | 19 | (3 | ) | |||||||
Securities purchased under agreements to resell and Securities borrowed: | ||||||||||||
U.S. | 10 | (90 | ) | (80 | ) | |||||||
Non-U.S. | (2 | ) | (83 | ) | (85 | ) | ||||||
Customer receivables and Other: | ||||||||||||
U.S. | (93 | ) | 198 | 105 | ||||||||
Non-U.S. | 314 | (644 | ) | (330 | ) | |||||||
|
|
|
|
|
| |||||||
Change in interest income | $ | 689 | $ | (345 | ) | $ | 344 | |||||
|
|
|
|
|
| |||||||
Interest bearing liabilities | ||||||||||||
Deposits: | ||||||||||||
U.S. | $ | 7 | $ | (1 | ) | $ | 6 | |||||
Non-U.S. | 18 | (17 | ) | 1 | ||||||||
Short-term borrowings: | ||||||||||||
U.S. | - | 2 | 2 | |||||||||
Non-U.S. | 2 | 9 | 11 | |||||||||
Long-term borrowings: | ||||||||||||
U.S. | 131 | (94 | ) | 37 | ||||||||
Non-U.S. | (4 | ) | (14 | ) | (18 | ) | ||||||
Securities sold under agreements to repurchase and Securities loaned: | ||||||||||||
U.S. | (145 | ) | 70 | (75 | ) | |||||||
Non-U.S. | (205 | ) | 147 | (58 | ) | |||||||
Customer payables and Other: | ||||||||||||
U.S. | 13 | (175 | ) | (162 | ) | |||||||
Non-U.S. | 41 | (365 | ) | (324 | ) | |||||||
|
|
|
|
|
| |||||||
Change in interest expense | $ | (142 | ) | $ | (438 | ) | $ | (580 | ) | |||
|
|
|
|
|
| |||||||
Change in net interest income | $ | 831 | $ | 93 | $ | 924 | ||||||
|
|
|
|
|
| |||||||
| 163 | |
Part II-Other Information.
| Item 1. | Legal Proceedings. |
The following new matters and developments have occurred since previously reporting certain matters in the Company's Annual Report on Form 10-K for the year ended December 31, 2014 (the "Form 10-K") and the Company's Quarterly Report on Form 10-Q for the quarterly period ended March 31, 2015 (the "First Quarter Form 10-Q") and June 30, 2015 (the "Second Quarter Form 10-Q"). See also the disclosures set forth under "Legal Proceedings" in Part I, Item 3 of the Form 10-K and Part II, Item 1 of the First Quarter Form 10-Q and Second Quarter Form 10-Q.
Residential Mortgage and Credit Crisis Related Matters.
Other Litigation.
On August 12, 2015, the plaintiff in Bank Hapoalim B.M. v. Morgan Stanley et al. filed a stipulation of discontinuance with prejudice.
On August 17, 2015, the parties in Commerzbank AG London Branch v. UBS AG et al. filed a stipulation of discontinuance with prejudice.
On August 19, 2015, the Company filed a Notice of Appeal of the court's decision in HSH Nordbank AG et al. v. Morgan Stanley et al. on the Company's motion to dismiss the complaint, and on August 20, 2015, the plaintiffs filed a Notice of Cross-Appeal. On August 25, 2015, the plaintiffs filed a motion for leave to amend their complaint.
On October 2, 2015, the defendants in Federal Deposit Insurance Corporation as Receiver for Colonial Bank v. Credit Suisse Securities (USA) LLC et al. filed a motion for summary judgment with respect to the plaintiffs' claims in their entirety.
On October 20, 2015, the court in Deutsche Bank National Trust Company solely in its capacity as Trustee of the Morgan Stanley ABS Capital I Inc. Trust 2007-NC4 v. Morgan Stanley Mortgage Capital Holdings LLC as Successor-by-Merger to Morgan Stanley Mortgage Capital Inc., and Morgan Stanley ABS Capital I Inc. granted in part and denied in part the Company's motion to dismiss.
Matters Related to the CDS Market.
On September 30, 2015, the Company reached an agreement with plaintiffs in In Re: Credit Default Swaps Antitrust Litigation to settle the litigation. The settlement is subject to court approval.
Currency Related Matters.
Class Action Litigation.
On September 11, 2015, several foreign exchange dealers (including the Company and an affiliate) were named as defendants in a purported class action filed in the Ontario Superior Court of Justice styled Christopher Staines v. Royal Bank of Canada, et al. The plaintiff has made allegations similar to those in the In Re Foreign Exchange Benchmark Rates Antitrust Litigation and seeks C$1 billion as well as C$50 million in punitive damages. On September 16, 2015, a parallel proceeding was initiated in Quebec Superior Court styled Christine Beland v. Royal Bank of Canada, et al. based on similar allegations and seeking C$100 million as well as C$50 million in punitive damages.
| | 164 |
Wealth Management Related Matters.
The Company is currently defending itself in an ongoing arbitration styled Lynnda L. Speer, as Personal Representative of the Estate of Roy M. Speer, et al. v. Morgan Stanley Smith Barney LLC, et al. , which is pending before a Financial Industry Regulatory Authority arbitration panel in the state of Florida. Plaintiffs assert claims for excessive trading, unauthorized use of discretion, undue influence, negligence and negligent supervision, constructive fraud, abuse of fiduciary duty, unjust enrichment and violations of several Florida statutes in connection with brokerage accounts owned by a former high-net worth wealth management client who is now deceased. Plaintiffs are seeking disgorgement, compensatory damages, statutory damages, punitive damages and treble damages under various factual and legal theories.
| 165 | |
| Item 2. | Unregistered Sales of Equity Securities and Use of Proceeds. |
The table below sets forth the information with respect to purchases made by or on behalf of the Company of its common stock during the quarterly period ended September 30, 2015.
Issuer Purchases of Equity Securities
(dollars in millions, except per share amounts)
Period | Total Number of Shares Purchased | Average Price Paid Per Share | Total Number of Shares Purchased As Part of Publicly Announced Plans or Programs(C) | Approximate Dollar Value of Shares that May Yet Be Purchased Under the Plans or Programs | ||||||||||||
Month #1 | ||||||||||||||||
(July 1, 2015-July 31, 2015) | ||||||||||||||||
Share Repurchase Program(A) | 2,273,878 | $ | 39.74 | 2,273,878 | $ | 2,470 | ||||||||||
Employee Transactions(B) | 778,069 | $ | 39.93 | - | - | |||||||||||
Month #2 | ||||||||||||||||
(August 1, 2015-August 31, 2015) | ||||||||||||||||
Share Repurchase Program(A) | 9,585,532 | $ | 36.75 | 9,585,532 | $ | 2,117 | ||||||||||
Employee Transactions(B) | 64,255 | $ | 37.56 | - | - | |||||||||||
Month #3 | ||||||||||||||||
(September 1, 2015-September 30, 2015) | ||||||||||||||||
Share Repurchase Program(A) | 5,393,125 | $ | 33.81 | 5,393,125 | $ | 1,935 | ||||||||||
Employee Transactions(B) | 110,128 | $ | 33.44 | - | - | |||||||||||
Total | ||||||||||||||||
Share Repurchase Program(A) | 17,252,535 | $ | 36.23 | 17,252,535 | $ | 1,935 | ||||||||||
Employee Transactions(B) | 952,452 | $ | 39.02 | - | - | |||||||||||
| (A) | The Company's Board of Directors has authorized the repurchase of the Company's outstanding stock under a share repurchase program (the "Share Repurchase Program"). The Share Repurchase Program is a program for capital management purposes that considers, among other things, business segment capital needs, as well as equity-based compensation and benefit plan requirements. The Share Repurchase Program has no set expiration or termination date. Share repurchases by the Company are subject to regulatory approval. In March 2015, the Company received no objection from the Federal Reserve to repurchase up to $3.1 billion of the Company's outstanding common stock that began in the second quarter of 2015 through the end of the second quarter of 2016 under the Company's 2015 capital plan. During the quarter ended September 30, 2015, the Company repurchased approximately $625 million of the Company's outstanding common stock as part of its Share Repurchase Program. For further information, see "Liquidity and Capital Resources-Capital Management" in Part I, Item 2. |
| (B) | Includes: (1) shares delivered or attested in satisfaction of the exercise price and/or tax withholding obligations by holders of employee and director stock options (granted under employee and director stock compensation plans) who exercised options; (2) shares withheld, delivered or attested (under the terms of grants under employee and director stock compensation plans) to offset tax withholding obligations that occur upon vesting and release of restricted shares; (3) shares withheld, delivered and attested (under the terms of grants under employee and director stock compensation plans) to offset tax withholding obligations that occur upon the delivery of outstanding shares underlying restricted stock units; and (4) shares withheld, delivered and attested (under the terms of grants under employee and director stock compensation plans) to offset the cash payment for fractional shares. The Company's employee and director stock compensation plans provide that the value of the shares withheld, delivered or attested, shall be valued using the fair market value of the Company's common stock on the date the relevant transaction occurs, using a valuation methodology established by the Company. |
| (C) | Share purchases under publicly announced programs are made pursuant to open-market purchases, Rule 10b5-1 plans or privately negotiated transactions (including with employee benefit plans) as market conditions warrant and at prices the Company deems appropriate and may be suspended at any time. |
| | 166 |
| Item 5. | Other Information. |
On November 3, 2015, the Compensation, Management Development and Succession Committee of the Board of Directors (the "Committee") approved an amendment of the Company's Directors and Officers allowance program for members of the Company's Operating Committee who are identified as "Code Staff," including the Company's President of Institutional Securities. The amendment, which was made at the direction of the Company's regulators in the U.K. and will have effect as of November 3, 2015, provides for payment of a Code Staff employee's annual Director and Officer allowance on a pro-rated basis for the period during the year for which he or she performed his or her Director and Officer role should his or her employment terminate or role cease for any reason.
| Item 6. | Exhibits. |
An exhibit index has been filed as part of this Report on Page E-1.
| 167 | |
SIGNATURE
Pursuant to the requirements of the Securities Exchange Act of 1934, the Registrant has duly caused this report to be signed on its behalf by the undersigned thereunto duly authorized.
MORGAN STANLEY (Registrant) | ||
| By: | /s/ J ONATHAN P RUZAN | |
Jonathan Pruzan Executive Vice President and Chief Financial Officer | ||
| By: | /s/ P AUL C. W IRTH | |
Paul C. Wirth Deputy Chief Financial Officer | ||
Date: November 3, 2015
| | 168 |
EXHIBIT INDEX
MORGAN STANLEY
Quarter Ended September 30, 2015
Exhibit No. | Description | |||
| 3.1 | Amended and Restated By-Laws of Morgan Stanley, amended as of October 29, 2015 (incorporated by reference to Exhibit 3.1 to the Registrant's Current Report on Form 8-K, filed on October 29, 2015). | |||
| 12 | Statement Re: Computation of Ratio of Earnings to Fixed Charges and Computation of Earnings to Fixed Charges and Preferred Stock Dividends. | |||
| 15 | Letter of awareness from Deloitte & Touche LLP, dated November 3, 2015, concerning unaudited interim financial information. | |||
| 31.1 | Rule 13a-14(a) Certification of Chief Executive Officer. | |||
| 31.2 | Rule 13a-14(a) Certification of Chief Financial Officer. | |||
| 32.1 | Section 1350 Certification of Chief Executive Officer. | |||
| 32.2 | Section 1350 Certification of Chief Financial Officer. | |||
| 101 | Interactive data files pursuant to Rule 405 of Regulation S-T: (i) the Condensed Consolidated Statements of Financial Condition-September 30, 2015 and December 31, 2014, (ii) the Condensed Consolidated Statements of Income-Three Months and Nine Months Ended September 30, 2015 and 2014, (iii) the Condensed Consolidated Statements of Comprehensive Income-Three Months and Nine Months Ended September 30, 2015 and 2014, (iv) the Condensed Consolidated Statements of Cash Flows-Nine Months Ended September 30, 2015 and 2014, (v) the Condensed Consolidated Statements of Changes in Total Equity-Nine Months Ended September 30, 2015 and 2014, and (vi) Notes to Condensed Consolidated Financial Statements (unaudited). | |||
| E-1 | |