 (Exact name of Registrant
as specified in its charter)
(Exact name of Registrant
as specified in its charter) | Delaware (State or other jurisdiction of incorporation�or�organization) | 1585 Broadway New�York,�NY�10036 (Address�of�principal�executive�offices, including zip code) | 36-3145972 (I.R.S.�Employer�Identification�No.) | (212) 761-4000 (Registrant�s�telephone�number, including area code) |
| Securities registered pursuant to Section�12(b) of the Act: | ||||
| Title of each class | Name�of�exchange�on which registered | |||
| Common Stock, $0.01 par value | New�York�Stock�Exchange | |||
| Depositary Shares, each representing 1/1,000th interest in a share of Floating Rate Non-Cumulative Preferred Stock, Series�A, $0.01�par value | New York Stock Exchange | |||
| Depositary Shares, each representing 1/1,000th interest in a share of Fixed-to-Floating Rate Non-Cumulative Preferred Stock, Series�E, $0.01�par value | New York Stock Exchange | |||
| Depositary Shares, each representing 1/1,000th interest in a share of Fixed-to-Floating Rate Non-Cumulative Preferred Stock, Series�F, $0.01�par value | New York Stock Exchange | |||
| Depositary Shares, each representing 1/1,000th interest in a share of 6.625% Non-Cumulative Preferred Stock, Series�G, $0.01�par value | New York Stock Exchange | |||
| Depositary Shares, each representing 1/1,000th interest in a share of Fixed-to-Floating Rate Non-Cumulative Preferred Stock, Series�I, $0.01�par value | New York Stock Exchange | |||
| 6 1 / 4 % Capital Securities of Morgan Stanley Capital Trust III (and Registrant�s guarantee with respect thereto) | New York Stock Exchange | |||
| 6 1 / 4 % Capital Securities of Morgan Stanley Capital Trust IV (and Registrant�s guarantee with respect thereto) | New York Stock Exchange | |||
| 5 3 / 4 % Capital Securities of Morgan Stanley Capital Trust V (and Registrant�s guarantee with respect thereto) | New York Stock Exchange | |||
| 6.45% Capital Securities of Morgan Stanley Capital Trust VIII (and Registrant�s guarantee with respect thereto) | New York Stock Exchange | |||
| Global Medium-Term Notes, Series A, Fixed Rate Step-Up Senior Notes Due 2026 of Morgan Stanley Finance LLC (and Registrant�s guarantee with respect thereto) | New York Stock Exchange | |||
| Market Vectors ETNs due March�31, 2020 (2 issuances); Market Vectors ETNs due April�30, 2020 (2 issuances) | NYSE Arca, Inc. | |||
| Morgan Stanley Cushing � MLP High Income Index ETNs due March�21, 2031 | NYSE Arca, Inc. | |||
| Large Accelerated Filer x Non-Accelerated�Filer � (Do not check if a smaller reporting company) | Accelerated�Filer � Smaller reporting company � |
ANNUAL REPORT ON FORM
10-K for the year ended December�31, 2015 | Table�of�Contents | Page | |||||
| Part I | ||||||
| Item�1. | Business | 1 | ||||
| Overview | 1 | |||||
| Business Segments | 1 | |||||
| Competition | 1 | |||||
| Supervision and Regulation | 2 | |||||
| Executive Officers of Morgan Stanley | 11 | |||||
| Item�1A. | Risk Factors | 13 | ||||
| Item�1B. | Unresolved Staff Comments | 23 | ||||
| Item�2. | Properties | 23 | ||||
| Item�3. | Legal Proceedings | 24 | ||||
| Item�4. | Mine Safety Disclosures | 32 | ||||
| Part�II | ||||||
| Item 5. | Market for Registrant�s Common Equity, Related Stockholder Matters and Issuer Purchases of Equity Securities | 33 | ||||
| Item 6. | Selected Financial Data | 36 | ||||
| Item 7. | Management�s Discussion and Analysis of Financial Condition and Results of Operations | 38 | ||||
| Introduction | 38 | |||||
| Executive Summary | 39 | |||||
| Business Segments | 46 | |||||
| Supplemental Financial Information and Disclosures | 67 | |||||
| Accounting Developments Updates | 70 | |||||
| Critical Accounting Policies | 71 | |||||
| Liquidity and Capital Resources | 75 | |||||
| Item�7A. | Quantitative and Qualitative Disclosures about Market Risk | 98 | ||||
| Item 8. | Financial Statements and Supplementary Data | 121 | ||||
| Report of Independent Registered Public Accounting Firm | 121 | |||||
| Consolidated Statements of Income | 122 | |||||
| Consolidated Statements of Comprehensive Income | 123 | |||||
| Consolidated Statements of Financial Condition | 124 | |||||
| Consolidated Statements of Changes in Total Equity | 125 | |||||
| Consolidated Statements of Cash Flows | 126 | |||||
| Notes to Consolidated Financial Statements | 127 | |||||
| 1. Introduction and Basis of Presentation | 127 | |||||
| 2. Significant Accounting Policies | 129 | |||||
| 3. Fair Values | 141 | |||||
| 4. Derivative Instruments and Hedging Activities | 167 | |||||
| 5. Investment Securities | 176 | |||||
| 6. Collateralized Transactions | 181 | |||||
| 7. Loans and Allowance for Credit Losses | 185 | |||||
| 8. Equity Method Investments | 191 | |||||
| 9. Goodwill and Net Intangible Assets | 191 | |||||
| 10. Deposits | 193 | |||||
| 11. Borrowings and Other Secured Financings | 194 | |||||
| i |  |
| Table�of�Contents | Page | |||||
| 12. Commitments, Guarantees and Contingencies | 197 | |||||
| 13. Variable Interest Entities and Securitization Activities | 205 | |||||
| 14. Regulatory Requirements | 214 | |||||
| 15. Total Equity | 218 | |||||
| 16. Earnings per Common Share | 222 | |||||
| 17. Interest Income and Interest Expense | 223 | |||||
| 18. Deferred Compensation Plans | 223 | |||||
| 19. Employee Benefit Plans | 228 | |||||
| 20. Income Taxes | 237 | |||||
| 21. Segment and Geographic Information | 241 | |||||
| 22. Parent Company | 245 | |||||
| 23. Quarterly Results (Unaudited) | 249 | |||||
| 24. Subsequent Events | 250 | |||||
| Financial Data Supplement (Unaudited) | 251 | |||||
| Item 9. | Changes in and Disagreements with Accountants on Accounting and Financial Disclosure | 259 | ||||
| Item�9A. | Controls and Procedures | 259 | ||||
| Item�9B. | Other Information | 261 | ||||
| Part III | ||||||
| Item 10. | Directors, Executive Officers and Corporate Governance | 262 | ||||
| Item 11. | Executive Compensation | 262 | ||||
| Item 12. | Security Ownership of Certain Beneficial Owners and Management and Related Stockholder Matters | 262 | ||||
| Item 13. | Certain Relationships and Related Transactions, and Director Independence | 262 | ||||
| Item 14. | Principal Accounting Fees and Services | 262 | ||||
| Part IV | ||||||
| Item�15. | Exhibits, Financial Statement Schedules | 263 | ||||
| Signatures | S-1 | |||||
| Exhibit Index | E-1 | |||||
| | ii |
| � | the effect of economic and political conditions and geopolitical events; |
| � | sovereign risk; |
| � | the effect of market conditions, particularly in the global equity, fixed income, currency, credit and commodities markets, including corporate and mortgage (commercial and residential) lending and commercial real estate markets and energy markets; |
| � | the impact of current, pending and future legislation (including the Dodd-Frank Wall Street Reform and Consumer Protection Act (the �Dodd-Frank�Act�)), regulation (including capital, leverage, funding and liquidity requirements), policies (including fiscal and monetary), and legal and regulatory actions in the United States of America (�U.S.�) and worldwide; |
| � | the level and volatility of equity, fixed income and commodity prices (including oil prices), interest rates, currency values and other market indices; |
| � | the availability and cost of both credit and capital as well as the credit ratings assigned to our unsecured short-term and long-term debt; |
| � | investor, consumer and business sentiment and confidence in the financial markets; |
| � | the performance and results of our acquisitions, divestitures, joint ventures, strategic alliances or other strategic arrangements; |
| � | our reputation and the general perception of the financial services industry; |
| � | inflation, natural disasters, pandemics and acts of war or terrorism; |
| � | the actions and initiatives of current and potential competitors as well as governments, regulators and self-regulatory organizations; |
| � | the effectiveness of our risk management policies; |
| � | technological changes instituted by us, our competitors or counterparties and technological risks, including cybersecurity, business continuity and related operational risks; |
| � | our ability to provide innovative products and services and execute our strategic objectives; and |
| � | other risks and uncertainties detailed under �Business�Competition� and �Business�Supervision and Regulation� in Part I, Item�1, �Risk Factors� in Part I, Item�1A and elsewhere throughout this report. |
| iii | |
| � | Amended and Restated Certificate of Incorporation; |
| � | Amended and Restated Bylaws; |
| � | Charters for its Audit Committee, Compensation, Management Development and Succession Committee, Nominating and Governance Committee, Operations and Technology Committee, and Risk Committee; |
| � | Corporate Governance Policies; |
| � | Policy Regarding Communication with the Board of Directors; |
| � | Policy Regarding Director Candidates Recommended by Shareholders; |
| � | Policy Regarding Corporate Political Activities; |
| � | Policy Regarding Shareholder Rights Plan; |
| � | Equity Ownership Commitment; |
| � | Code of Ethics and Business Conduct; |
| � | Code of Conduct; and |
| � | Integrity Hotline information. |
| | iv |
| Item�1. | Business. |
| 1 | |
| | 2 |
| � | A minimum Common Equity Tier 1 capital ratio of 4.5%; Tier 1 capital ratio of 6.0%; Total capital ratio of 8.0%; and Tier 1 leverage ratio of 4.0%; |
| � | A supplementary leverage ratio of at least 5.0%, which includes a Tier 1 supplementary leverage capital buffer of at least 2.0% in addition to the 3.0% minimum supplementary leverage ratio; |
| 3 | |
| � | A greater than 2.5% Common Equity Tier 1 capital conservation buffer; |
| � | Up to a 2.5% Common Equity Tier 1 countercyclical buffer, if deployed by banking regulators; and |
| � | A global systemically important bank capital surcharge, which the Federal Reserve calculated at 3% for the Company in July 2015. |
| | 4 |
| 5 | |
| | 6 |
| 7 | |
| | 8 |
| 9 | |
| | 10 |
| 11 | |
| | 12 |
| Item�1A. | Risk Factors. |
| 13 | |
| | 14 |
| 15 | |
| | 16 |
| 17 | |
| | 18 |
| 19 | |
| | 20 |
| 21 | |
| | 22 |
| Item�1B. | Unresolved Staff Comments. |
| Item�2. | Properties. |
| Location | Owned/ Leased | Lease Expiration | Approximate�Square�Footage as of December�31, 2015(1) | |||||||
| U.S. Locations | ||||||||||
| 1585 Broadway New York, New York (Global Headquarters and Institutional Securities Headquarters) | Owned | N/A | 1,332,700�square�feet | |||||||
| 2000 Westchester Avenue Purchase, New York (Wealth Management Headquarters) | Owned | N/A | 597,400 square feet | |||||||
| 522 Fifth Avenue New York, New York (Investment Management Headquarters) | Owned | N/A | 571,800 square feet | |||||||
| International Locations | ||||||||||
| 20 Bank Street London (London Headquarters) | Leased | 2038 | 546,500 square feet | |||||||
| 1 Austin Road West Kowloon (Hong Kong Headquarters) | Leased | 2019 | 499,900 square feet | |||||||
| Otemachi Financial City South Tower Otemachi, Chiyoda-ku (Tokyo Headquarters) | Leased | 2028 | 245,600 square feet | |||||||
| (1) | The indicated total aggregate square footage leased does not include space leased by Morgan Stanley branch offices. |
| 23 | |
| Item�3. | Legal Proceedings. |
| | 24 |
| 25 | |
| | 26 |
| 27 | |
| | 28 |
| 29 | |
| | 30 |
| 31 | |
| Item�4. | Mine Safety Disclosures. |
| | 32 |
| Item�5. | Market for Registrant�s Common Equity, Related Stockholder Matters and Issuer Purchases of Equity Securities. |
| Low Sale�Price | High Sale�Price | Dividends Declared�per Common�Share | ||||||||||
| 2015: | ||||||||||||
| Fourth Quarter | $ | 30.15 | $ | 35.74 | $ | 0.15 | ||||||
| Third Quarter | $ | 30.40 | $ | 41.04 | $ | 0.15 | ||||||
| Second Quarter | $ | 35.36 | $ | 40.26 | $ | 0.15 | ||||||
| First Quarter | $ | 33.72 | $ | 39.15 | $ | 0.10 | ||||||
| 2014: | ||||||||||||
| Fourth Quarter | $ | 31.35 | $ | 39.19 | $ | 0.10 | ||||||
| Third Quarter | $ | 31.12 | $ | 36.44 | $ | 0.10 | ||||||
| Second Quarter | $ | 28.31 | $ | 32.82 | $ | 0.10 | ||||||
| First Quarter | $ | 28.78 | $ | 33.52 | $ | 0.05 | ||||||
| 33 | |
| Period | Total Number�of Shares Purchased | Average�Price Paid� per Share | Total�Number�of Shares�Purchased as�Part� of�Publicly Announced Plans or Programs(1) | Approximate�Dollar Value of Shares That May Yet Be Purchased under the Plans or Programs | ||||||||||||
| Month #1 (October 1, 2015-October 31, 2015) | ||||||||||||||||
| Share Repurchase Program(2) | 2,448,000 | $ | 32.17 | 2,448,000 | $ | 1,796 | ||||||||||
| Employee transactions(3) | 83,738 | $ | 32.06 | � | � | |||||||||||
| Month #2 (November 1, 2015-November 30, 2015) | ||||||||||||||||
| Share Repurchase Program(2) | 7,985,128 | $ | 33.99 | 7,985,128 | $ | 1,525 | ||||||||||
| Employee transactions(3) | 243,334 | $ | 34.58 | � | � | |||||||||||
| Month #3 (December 1, 2015-December 31, 2015) | ||||||||||||||||
| Share Repurchase Program(2) | 8,210,166 | $ | 33.47 | 8,210,166 | $ | 1,250 | ||||||||||
| Employee transactions(3) | 72,712 | $ | 33.87 | � | � | |||||||||||
| Quarter ended at December�31, 2015 | ||||||||||||||||
| Share Repurchase Program(2) | 18,643,294 | $ | 33.52 | 18,643,294 | $ | 1,250 | ||||||||||
| Employee transactions(3) | 399,784 | $ | 33.92 | � | � | |||||||||||
| (1) | Share purchases under publicly announced programs are made pursuant to open-market purchases, Rule 10b5-1 plans or privately negotiated transactions (including with employee benefit plans) as market conditions warrant and at prices the Company deems appropriate and may be suspended at any time. |
| (2) | The Company�s Board of Directors has authorized the repurchase of the Company�s outstanding stock under a share repurchase program (the �Share Repurchase Program�). The Share Repurchase Program is a program for capital management purposes that considers, among other things, business segment capital needs, as well as stock-based compensation and benefit plan requirements. The Share Repurchase Program has no set expiration or termination date. Share repurchases by the Company are subject to regulatory approval. In March 2015, the Company received no objection from the Federal Reserve to repurchase up to $3.1 billion of the Company�s outstanding common stock during the period that began April�1, 2015 through June�30, 2016 under the Company�s 2015 capital plan. During the quarter ended December�31, 2015, the Company repurchased approximately $625 million of the Company�s outstanding common stock as part of its Share Repurchase Program. For further information, see �Liquidity and Capital Resources�Capital Management� in Part II, Item�7. |
| (3) | Includes shares acquired by the Company in satisfaction of the tax withholding obligations on stock-based awards and the exercise price of stock options granted under the Company�s stock-based compensation plans. |
| | 34 |
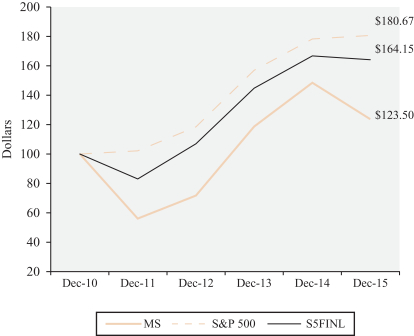
| MS | S&P�500 | S5FINL | ||||||||||
| 12/31/2010 | $ | 100.00 | $ | 100.00 | $ | 100.00 | ||||||
| 12/31/2011 | $ | 56.07 | $ | 102.10 | $ | 82.94 | ||||||
| 12/31/2012 | $ | 71.73 | $ | 118.44 | $ | 106.78 | ||||||
| 12/31/2013 | $ | 118.60 | $ | 156.78 | $ | 144.79 | ||||||
| 12/31/2014 | $ | 148.35 | $ | 178.22 | $ | 166.76 | ||||||
| 12/31/2015 | $ | 123.50 | $ | 180.67 | $ | 164.15 | ||||||
| 35 | |
| Item�6. | Selected Financial Data. |
| 2015 | 2014 | 2013 | 2012 | 2011 | ||||||||||||||||
| Income Statement Data: | ||||||||||||||||||||
| Revenues: | ||||||||||||||||||||
| Total non-interest revenues | $ | 32,062 | $ | 32,540 | $ | 31,715 | $ | 26,383 | $ | 31,953 | ||||||||||
| Interest income | 5,835 | 5,413 | 5,209 | 5,692 | 7,234 | |||||||||||||||
| Interest expense | 2,742 | 3,678 | 4,431 | 5,897 | 6,883 | |||||||||||||||
| Net interest | 3,093 | 1,735 | 778 | (205 | ) | 351 | ||||||||||||||
| Net revenues | 35,155 | 34,275 | 32,493 | 26,178 | 32,304 | |||||||||||||||
| Non-interest expenses: | ||||||||||||||||||||
| Compensation and benefits | 16,016 | 17,824 | 16,277 | 15,615 | 16,325 | |||||||||||||||
| Other | 10,644 | 12,860 | 11,658 | 9,967 | 9,792 | |||||||||||||||
| Total non-interest expenses | 26,660 | 30,684 | 27,935 | 25,582 | 26,117 | |||||||||||||||
| Income from continuing operations before income taxes | 8,495 | 3,591 | 4,558 | 596 | 6,187 | |||||||||||||||
| Provision for (benefit from) income taxes | 2,200 | (90 | ) | 902 | (161 | ) | 1,491 | |||||||||||||
| Income from continuing operations | 6,295 | 3,681 | 3,656 | 757 | 4,696 | |||||||||||||||
| Discontinued operations: | ||||||||||||||||||||
| Income (loss) from discontinued operations before income taxes | (23 | ) | (19 | ) | (72 | ) | (48 | ) | (170 | ) | ||||||||||
| Provision for (benefit from) income taxes | (7 | ) | (5 | ) | (29 | ) | (7 | ) | (119 | ) | ||||||||||
| Income (loss) from discontinued operations | (16 | ) | (14 | ) | (43 | ) | (41 | ) | (51 | ) | ||||||||||
| Net income | 6,279 | 3,667 | 3,613 | 716 | 4,645 | |||||||||||||||
| Net income applicable to redeemable noncontrolling interests(1) | � | � | 222 | 124 | � | |||||||||||||||
| Net income applicable to nonredeemable noncontrolling interests(1) | 152 | 200 | 459 | 524 | 535 | |||||||||||||||
| Net income applicable to Morgan Stanley | $ | 6,127 | $ | 3,467 | $ | 2,932 | $ | 68 | $ | 4,110 | ||||||||||
| Preferred stock dividends and other | 456 | 315 | 277 | 98 | 2,043 | |||||||||||||||
| Earnings (loss) applicable to Morgan Stanley common shareholders(2) | $ | 5,671 | $ | 3,152 | $ | 2,655 | $ | (30 | ) | $ | 2,067 | |||||||||
| Amounts applicable to Morgan Stanley: | ||||||||||||||||||||
| Income from continuing operations | $ | 6,143 | $ | 3,481 | $ | 2,975 | $ | 138 | $ | 4,168 | ||||||||||
| Income (loss) from discontinued operations | (16 | ) | (14 | ) | (43 | ) | (70 | ) | (58 | ) | ||||||||||
| Net income applicable to Morgan Stanley | $ | 6,127 | $ | 3,467 | $ | 2,932 | $ | 68 | $ | 4,110 | ||||||||||
| | 36 |
| 2015 | 2014 | 2013 | 2012 | 2011 | ||||||||||||||||
| Per Share Data: | ||||||||||||||||||||
| Earnings (loss) per basic common share(3): | ||||||||||||||||||||
| Income from continuing operations | $ | 2.98 | $ | 1.65 | $ | 1.42 | $ | 0.02 | $ | 1.28 | ||||||||||
| Income (loss) from discontinued operations | (0.01 | ) | (0.01 | ) | (0.03 | ) | (0.04 | ) | (0.03 | ) | ||||||||||
| Earnings (loss) per basic common share | $ | 2.97 | $ | 1.64 | $ | 1.39 | $ | (0.02 | ) | $ | 1.25 | |||||||||
| Earnings (loss) per diluted common share(3): | ||||||||||||||||||||
| Income from continuing operations | $ | 2.91 | $ | 1.61 | $ | 1.38 | $ | 0.02 | $ | 1.27 | ||||||||||
| Income (loss) from discontinued operations | (0.01 | ) | (0.01 | ) | (0.02 | ) | (0.04 | ) | (0.04 | ) | ||||||||||
| Earnings (loss) per diluted common share | $ | 2.90 | $ | 1.60 | $ | 1.36 | $ | (0.02 | ) | $ | 1.23 | |||||||||
| Book value per common share(4) | $ | 35.24 | $ | 33.25 | $ | 32.24 | $ | 30.70 | $ | 31.42 | ||||||||||
| Dividends declared per common share | 0.55 | 0.35 | 0.20 | 0.20 | 0.20 | |||||||||||||||
| Average common shares outstanding(2): | ||||||||||||||||||||
| Basic | 1,909,116,527 | 1,923,805,397 | 1,905,823,882 | 1,885,774,276 | 1,654,708,640 | |||||||||||||||
| Diluted | 1,952,815,453 | 1,970,535,560 | 1,956,519,738 | 1,918,811,270 | 1,675,271,669 | |||||||||||||||
| Balance Sheet and Other Operating Data: | ||||||||||||||||||||
| Trading assets | $ | 228,280 | $ | 256,801 | $ | 280,744 | $ | 267,603 | $ | 275,353 | ||||||||||
| Loans(5) | 85,759 | 66,577 | 42,874 | 29,046 | 15,369 | |||||||||||||||
| Total assets | 787,465 | 801,510 | 832,702 | 780,960 | 749,898 | |||||||||||||||
| Total deposits | 156,034 | 133,544 | 112,379 | 83,266 | 65,662 | |||||||||||||||
| Long-term borrowings | 153,768 | 152,772 | 153,575 | 169,571 | 184,234 | |||||||||||||||
| Morgan Stanley shareholders� equity | 75,182 | 70,900 | 65,921 | 62,109 | 62,049 | |||||||||||||||
| Return on average common equity(6) | 8.5% | 4.8% | 4.3% | N/M | 3.8% | |||||||||||||||
| (1) | Reflects 51% ownership of the retail securities joint venture between the Company and Citigroup Inc. up to September�17, 2012, 65% up to June�28, 2013 and 100% thereafter (see Note 15 to the consolidated financial statements in Part II, Item�8). |
| (2) | Amounts shown are used to calculate earnings (loss) per basic and diluted common share. |
| (3) | For the calculation of basic and diluted earnings (loss) per common share, see Note 16 to the consolidated financial statements in Part II, Item�8. |
| (4) | Book value per common share equals common shareholders� equity of $67,662 million at December�31, 2015, $64,880 million at December�31, 2014, $62,701 million at December�31, 2013, $60,601 million at December�31, 2012 and $60,541 million at December�31, 2011, divided by common shares outstanding of 1,920�million at December�31, 2015, 1,951�million at December�31, 2014, 1,945�million at December�31, 2013, 1,974�million at December�31, 2012 and 1,927�million at December�31, 2011. |
| (5) | Amounts include loans held for investment and loans held for sale but exclude loans at fair value, which are included in Trading assets in the consolidated statements of financial condition (see Note 7 to the consolidated financial statements in Part II, Item�8). |
| (6) | The calculation of return on average common equity equals net income applicable to Morgan Stanley less preferred dividends as a percentage of average common equity. The return on average common equity is a non-generally accepted accounting principle (�non-GAAP�) financial measure that the Company considers to be a useful measure to the Company and its investors to assess operating performance. |
| 37 | |
| Item�7. | Management�s Discussion and Analysis of Financial Condition and Results of Operations. |
| | 38 |
| � | The Company reported net revenues of $35,155 million in 2015, a 3% increase from net revenues of $34,275 million in 2014. The impact of debt valuation adjustment (�DVA�) included in net revenues was positive $618 million and $651 million in 2015 and 2014, respectively. |
| � | Net income applicable to Morgan Stanley for the current year was $6,127 million, or $2.90 per diluted common share, compared with $3,467 million, or $1.60 per diluted common share, a year ago. The current year included net discrete tax benefits of $564 million, or $0.29 per diluted common share, compared with $2,226 million, or $1.13 per diluted common share, in the prior year. For a further discussion of these net discrete tax benefits, see �Supplemental Financial Information and Disclosures�Income Tax Matters� herein. The prior year also included litigation costs related to residential mortgage-backed securities and credit crisis matters of $3,083 million, or a loss of $1.47 per diluted common share, 2014 compensation actions of approximately $1,137 million (see also �Supplemental Financial Information and Disclosures�Discretionary Incentive Compensation� herein), or a loss of $0.39 per diluted common share, and a funding valuation adjustment (�FVA�) implementation charge of $468 million, or a loss of $0.17 per diluted common share. |
| � | Excluding DVA, net revenues were $34,537 million in 2015 compared with $33,624 million in 2014, and net income applicable to Morgan Stanley was $5,728 million, or $2.70 per diluted common share, in 2015 compared with $3,049 million, or $1.39 per diluted common share, in 2014. Excluding both DVA and the net discrete tax benefits, net income applicable to Morgan Stanley was $5,164 million, or $2.41 per diluted common share, in 2015 compared with $823 million, or $0.26 per diluted common share, in 2014. |
| � | Institutional Securities net revenues of $17,953 million in 2015 increased 6% compared with $16,871 million in 2014, primarily as a result of higher Sales and trading net revenues, partially offset by lower Other revenues and lower revenues in Investment banking. |
| � | Wealth Management net revenues of $15,100 million in 2015 increased 1% from $14,888 million in 2014, primarily as a result of higher net interest income and asset management revenues, partially offset by lower transactional revenues. |
| � | Investment Management net revenues of $2,315 million in 2015 decreased 15% from $2,712 million in 2014, primarily reflecting the reversal of previously accrued carried interest, reduction in revenues attributable to non-controlling interests and markdowns on principal investments. |
| � | Compensation and benefits expenses of $16,016 million in 2015 were down 10% from $17,824 million in 2014, primarily due to the 2014 compensation actions, a decrease in 2015 in the fair value of deferred compensation plan referenced investments and carried interest, and a decrease in the level of discretionary incentive compensation in 2015 (see also �Supplemental Financial Information and Disclosures�Discretionary Incentive Compensation� herein). |
| � | Non-compensation expenses were $10,644 million in 2015 compared with $12,860 million in 2014, representing a 17% decrease, primarily as a result of lower legal expenses in the Institutional Securities business segment associated with residential mortgage-backed securities and credit crisis-related matters. |
| 39 | |
| � | The return on average common equity was 8.5% in 2015, or 7.8% excluding DVA, and 7.0% excluding DVA and the net discrete tax benefits. For 2014, the return on average common equity was 4.8%, or 4.1% excluding DVA, and 0.8% excluding DVA and the net discrete tax benefits. |
| � | The Company reported net revenues of $34,275 million in 2014, a 5% increase compared with $32,493 million in 2013. Net revenues in 2014 included positive revenues due to the impact of DVA of $651 million compared with negative revenues of $681 million in 2013. In addition, net revenues in 2014 included a charge of approximately $468 million related to the implementation of FVA (see �Critical Accounting Policies� herein and Note 2 to the consolidated financial statements in Item�8), which was recorded in the Institutional Securities business segment. |
| � | For 2014, net income applicable to Morgan Stanley was $3,467 million, or $1.60 per diluted common share, compared with $2,932 million, or $1.36 per diluted common share, in 2013. 2014 included net discrete tax benefits of $2,226 million, or $1.13 per diluted common share, compared with $407 million, or $0.21 per diluted common share, in 2013. For a further discussion of these net discrete tax benefits, see �Supplemental Financial Information and Disclosures�Income Tax Matters� herein. |
| � | Excluding DVA, net revenues were $33,624 million in 2014 compared with $33,174 million in 2013, and net income applicable to Morgan Stanley was $3,049 million, or $1.39 per diluted common share, in 2014 compared with $3,384 million, or $1.59 per diluted common share, in 2013. Excluding both DVA and the net discrete tax benefits, net income applicable to Morgan Stanley was $823 million, or $0.26 per diluted common share, in 2014 compared with $2,977 million, or $1.38 per diluted common share, in 2013. |
| � | Institutional Securities net revenues of $16,871 million in 2014 increased 9% compared with $15,519 million in 2013, primarily as a result of an increase in Sales and trading net revenues and Investment banking revenues, partially offset by lower net investment gains. |
| � | Wealth Management net revenues of $14,888 million in 2014 increased 5% from $14,143 million in 2013, primarily as a result of higher Asset management, distribution and administration fees and an increase in net interest income, partially offset by lower transactional revenues. |
| � | Investment Management net revenues of $2,712 million in 2014 decreased 11% from $3,059 million in 2013. The decrease in net revenues was primarily related to lower net investment gains, including from investments in the Company�s employee deferred compensation and co-investment plans, and lower carried interest, partially offset by higher management and administration revenues. |
| � | Compensation and benefits expenses of $17,824 million in 2014 increased 10% from $16,277 million in 2013, primarily due to the 2014 compensation actions of approximately $1,137 million (see �Supplemental Financial Information and Disclosures�Discretionary Incentive Compensation� herein). |
| � | Non-compensation expenses were $12,860 million in 2014 compared with $11,658 million in 2013, representing a 10% increase, primarily due to higher legal expenses. |
| � | The return on average common equity was 4.8% in 2014, or 4.1% excluding DVA, and 0.8% excluding DVA and the net discrete tax benefits. Return on average common equity in 2013 was 4.3%, or 4.9% excluding DVA, and 4.3% excluding DVA and the net discrete tax benefits. |
| | 40 |
| 2015 | 2014 | 2013 | ||||||||||
| (dollars in millions, except where noted) | ||||||||||||
| Net revenues: | ||||||||||||
| Institutional Securities | $ | 17,953 | $ | 16,871 | $ | 15,519 | ||||||
| Wealth Management | 15,100 | 14,888 | 14,143 | |||||||||
| Investment Management | 2,315 | 2,712 | 3,059 | |||||||||
| Intersegment Eliminations | (213 | ) | (196 | ) | (228 | ) | ||||||
| Consolidated net revenues | $ | 35,155 | $ | 34,275 | $ | 32,493 | ||||||
| Income (loss) from continuing operations applicable to Morgan Stanley(1): | ||||||||||||
| Institutional Securities | $ | 3,713 | $ | (77 | ) | $ | 983 | |||||
| Wealth Management | 2,085 | 3,192 | 1,473 | |||||||||
| Investment Management | 345 | 366 | 519 | |||||||||
| Income from continuing operations applicable to Morgan Stanley | $ | 6,143 | $ | 3,481 | $ | 2,975 | ||||||
| Pre-tax profit margin(2): | ||||||||||||
| Institutional Securities | 26% | N/M | 6% | |||||||||
| Wealth Management | 22% | 20% | 18% | |||||||||
| Investment Management | 21% | 24% | 33% | |||||||||
| Consolidated | 24% | 10% | 14% | |||||||||
| Average common equity (dollars in billions)(3)(4): | ||||||||||||
| Institutional Securities | $ | 34.6 | $ | 32.2 | $ | 37.9 | ||||||
| Wealth Management | 11.2 | 11.2 | 13.2 | |||||||||
| Investment Management | 2.2 | 2.9 | 2.8 | |||||||||
| Parent capital | 18.9 | 19.0 | 8.0 | |||||||||
| Consolidated average common equity | $ | 66.9 | $ | 65.3 | $ | 61.9 | ||||||
| Return on average common equity(3)(4): | ||||||||||||
| Institutional Securities | 10.0% | N/M | 2.3% | |||||||||
| Wealth Management | 16.9% | 27.5% | 9.9% | |||||||||
| Investment Management | 15.8% | 12.8% | 18.1% | |||||||||
| Consolidated | 8.5% | 4.8% | 4.3% | |||||||||
| Regional net revenues(5): | ||||||||||||
| Americas | $ | 25,080 | $ | 25,140 | $ | 23,358 | ||||||
| EMEA | 5,353 | 4,772 | 4,542 | |||||||||
| Asia-Pacific | 4,722 | 4,363 | 4,593 | |||||||||
| Net revenues | $ | 35,155 | $ | 34,275 | $ | 32,493 | ||||||
| Effective income tax rate from continuing operations | 25.9% | (2.5)% | 19.8% | |||||||||
| 41 | |
| At December�31, 2015 | At December�31, 2014 | |||||||
| (dollars in millions, except where noted) | ||||||||
| Global Liquidity Reserve managed by bank and non-bank legal entities(6): | ||||||||
| Bank legal entities | $ | 94,328 | $ | 87,944 | ||||
| Non-bank legal entities | 108,936 | 105,225 | ||||||
| Total | $ | 203,264 | $ | 193,169 | ||||
| Maturities of long-term borrowings outstanding (next 12 months) | $ | 22,396 | $ | 20,740 | ||||
| Capital ratios (Transitional)(7): | ||||||||
| Common Equity Tier 1 capital ratio | 15.5% | 12.6% | ||||||
| Tier 1 capital ratio | 17.4% | 14.1% | ||||||
| Total capital ratio | 20.7% | 16.4% | ||||||
| Tier 1 leverage ratio(8) | 8.3% | 7.9% | ||||||
| Assets under management or supervision (dollars in billions)(9): | ||||||||
| Wealth Management | $ | 784 | $ | 778 | ||||
| Investment Management | 406 | 403 | ||||||
| Total | $ | 1,190 | $ | 1,181 | ||||
| Worldwide employees | 56,218 | 55,802 | ||||||
| | 42 |
| 2015 | 2014 | 2013 | ||||||||||
| (dollars in millions, except per share amounts) | ||||||||||||
| Net revenues | ||||||||||||
| Net revenues�non-GAAP | $ | 34,537 | $ | 33,624 | $ | 33,174 | ||||||
| Impact of DVA | 618 | 651 | (681 | ) | ||||||||
| Net revenues�U.S. GAAP | $ | 35,155 | $ | 34,275 | $ | 32,493 | ||||||
| Net income applicable to Morgan Stanley | ||||||||||||
| Net income applicable to Morgan Stanley, excluding DVA and net discrete tax benefits�non-GAAP | $ | 5,164 | $ | 823 | $ | 2,977 | ||||||
| Impact of net discrete tax benefits(10) | 564 | 2,226 | 407 | |||||||||
| Net income applicable to Morgan Stanley, excluding DVA�non-GAAP | $ | 5,728 | $ | 3,049 | $ | 3,384 | ||||||
| Impact of DVA | 399 | 418 | (452 | ) | ||||||||
| Net income applicable to Morgan Stanley�U.S. GAAP | $ | 6,127 | $ | 3,467 | $ | 2,932 | ||||||
| Earnings per diluted common share | ||||||||||||
| Earnings per diluted common share, excluding DVA and net discrete tax benefits�non-GAAP | $ | 2.41 | $ | 0.26 | $ | 1.38 | ||||||
| Impact of net discrete tax benefits(10) | 0.29 | 1.13 | 0.21 | |||||||||
| Earnings per diluted common share, excluding DVA�non-GAAP | $ | 2.70 | $ | 1.39 | $ | 1.59 | ||||||
| Impact of DVA | 0.20 | 0.21 | (0.23 | ) | ||||||||
| Earnings per diluted common share�U.S. GAAP | $ | 2.90 | $ | 1.60 | $ | 1.36 | ||||||
| Effective income tax rate | ||||||||||||
| Effective income tax rate from continuing operations�non-GAAP | 32.5% | 59.5% | 28.7% | |||||||||
| Impact of net discrete tax benefits(10) | (6.6)% | (62.0)% | (8.9)% | |||||||||
| Effective income tax rate from continuing operations�U.S. GAAP | 25.9% | (2.5)% | 19.8% | |||||||||
| 2015 | 2014 | 2013 | ||||||||||
| (dollars in millions) | ||||||||||||
| Average common equity(4)(11) | ||||||||||||
| Average common equity, excluding DVA and net discrete tax benefits | $ | 67,139 | $ | 65,679 | $ | 62,805 | ||||||
| Average common equity, excluding DVA | $ | 67,573 | $ | 66,392 | $ | 62,952 | ||||||
| Average common equity | $ | 66,936 | $ | 65,284 | $ | 61,895 | ||||||
| Return on average common equity(4)(12) | ||||||||||||
| Return on average common equity, excluding DVA and net discrete tax benefits | 7.0% | 0.8% | 4.3% | |||||||||
| Return on average common equity, excluding DVA | 7.8% | 4.1% | 4.9% | |||||||||
| Return on average common equity | 8.5% | 4.8% | 4.3% | |||||||||
| Average tangible common equity(11) | ||||||||||||
| Average tangible common equity, excluding DVA and net discrete tax benefits | $ | 57,478 | $ | 55,943 | $ | 53,906 | ||||||
| Average tangible common equity, excluding DVA | $ | 57,912 | $ | 56,656 | $ | 54,052 | ||||||
| Average tangible common equity | $ | 57,275 | $ | 55,548 | $ | 52,995 | ||||||
| Return on average tangible common equity(13) | ||||||||||||
| Return on average tangible common equity, excluding DVA and net discrete tax benefits | 8.2 | % | 0.9 | % | 5.0 | % | ||||||
| Return on average tangible common equity, excluding DVA | 9.1% | 4.8% | 5.8% | |||||||||
| Return on average tangible common equity | 9.9% | 5.7% | 5.0% | |||||||||
| 43 | |
| At December�31,� 2015 | At December�31,� 2014 | |||||||
| Tangible book value per common share(14) | $ | 30.26 | $ | 28.26 | ||||
| (1) | The Institutional Securities business segment�s net income applicable to noncontrolling interests was $133 million, $109 million and $278 million in 2015, 2014 and 2013, respectively. The Wealth Management business segment�s net income applicable to noncontrolling interests was $221 million in 2013. The Investment Management business segment�s net income applicable to noncontrolling interests was $19 million, $91 million and $182 million in 2015, 2014 and 2013, respectively. See Note 15 to the consolidated financial statements in Item�8 for further information. |
| (2) | Pre-tax profit margin is a non-GAAP financial measure that the Company considers to be a useful measure to the Company and investors to assess operating performance. Percentages represent income from continuing operations before income taxes as a percentage of net revenues. |
| (3) | The computation of average common equity for each business segment is determined using the Company�s Required Capital framework, an internal capital adequacy measure (see �Liquidity and Capital Resources�Regulatory Requirements�Required Capital� herein). The calculation of each business segment�s return on average common equity equals net income applicable to Morgan Stanley less preferred dividends as a percentage of each business segment�s average common equity. The effective tax rates used in the computation of each business segment�s return on average common equity were determined on a separate legal entity basis. Average common equity and the return on average common equity for each business segment are non-GAAP financial measures that the Company considers to be useful measures to the Company and investors to assess capital adequacy and to allow better comparability of period-to-period operating performance, respectively. |
| (4) | The calculation of return on average common equity equals consolidated net income applicable to Morgan Stanley less preferred dividends as a percentage of average common equity. To determine the return on average common equity, excluding DVA, and excluding DVA and net discrete tax benefits, both the numerator and denominator were adjusted to exclude those items. Average common equity, the return on average common equity, and average common equity and the return on average common equity, both excluding DVA, and excluding DVA and net discrete tax benefits, are non-GAAP financial measures that the Company considers useful for investors to assess capital adequacy and to allow better comparability of period-to-period operating performance. |
| (5) | For a discussion regarding the geographic methodology for net revenues, see Note 21 to the consolidated financial statements in Item�8. |
| (6) | For a discussion of Global Liquidity Reserve, see �Liquidity and Capital Resources�Liquidity Risk Management Framework�Global Liquidity Reserve� herein. |
| (7) | For a discussion of the Company�s methods for calculating its risk-based capital ratios, see �Liquidity and Capital Resources�Regulatory Requirements� herein. |
| (8) | See Note 14 to the consolidated financial statements in Item�8 for information on the Tier 1 leverage ratio. |
| (9) | Amounts exclude the Investment Management business segment�s proportionate share of assets managed by entities in which it owns a minority stake and assets for which fees are not generated. For 2015, amounts include $4.6 billion of inflows related to the transfer of certain portfolio managers and their portfolios from the Wealth Management business segment to the Investment Management business segment. |
| (10) | For a discussion of the Company�s net discrete tax benefits, see �Supplemental Financial Information and Disclosures�Income Tax Matters� herein. |
| (11) | The impact of DVA on average common equity and average tangible common equity was $(637) million, $(1,108) million and $(1,057) million in 2015, 2014 and 2013, respectively. The impact of net discrete tax benefits on average common equity and average tangible common equity was approximately $434 million, $713 million and $146 million in 2015, 2014 and 2013, respectively. |
| (12) | The impact of DVA on return on average common equity was 0.7%, 0.7% and (0.6)% in 2015, 2014 and 2013, respectively. The impact of net discrete tax benefits on return on average common equity was 0.8%, 3.3% and 0.6% in 2015, 2014 and 2013, respectively. |
| | 44 |
| (13) | The calculation of return on average tangible common equity equals net income applicable to Morgan Stanley less preferred dividends as a percentage of average tangible common equity. To determine the return on average tangible common equity, excluding DVA, and excluding DVA and net discrete tax benefits, both the numerator and the denominator were adjusted to exclude the impact of DVA and the impact of net discrete tax benefits. The impact of DVA was 0.8%, 0.9% and (0.8)% in 2015, 2014 and 2013, respectively. The impact of net discrete tax benefits was 0.9%, 3.9% and 0.8% in 2015, 2014 and 2013, respectively. |
| (14) | Tangible book value per common share equals tangible common equity of $58,098 million at December�31, 2015 and $55,138 million at December�31, 2014 divided by common shares outstanding of 1,920�million at December�31, 2015 and 1,951�million at December�31, 2014. |
| � | Revenue and profitability growth: |
| � | Wealth Management pre-tax margin improvement to approximately 23% to 25% through net interest income growth via continued high quality lending, expense efficiency and business growth; |
| � | Continued strength in Investment Banking and Equity Sales and Trading results; |
| � | Steady performance in Investment Management; |
| � | Expense efficiency: |
| � | Achieve an expense efficiency target ratio excluding DVA of 74%, assuming a flat revenue environment (not including any outsized litigation expense or penalties); |
| � | Sufficient capital: |
| � | Continuing to right-size the Fixed Income and Commodities Sales and Trading business from an operational and capital standpoint; and |
| � | Increasing capital returns to shareholders, subject to regulatory approval. |
| 45 | |
| | 46 |
| 47 | |
| | 48 |
| % Change from�Prior�Year: | ||||||||||||||||||||
| 2015 | 2014 | 2013 | 2015 | 2014 | ||||||||||||||||
| (dollars in millions) | ||||||||||||||||||||
| Revenues: | ||||||||||||||||||||
| Investment banking | $ | 5,008 | $ | 5,203 | $ | 4,377 | (4)% | 19% | ||||||||||||
| Trading | 9,400 | 8,445 | 8,147 | 11% | 4% | |||||||||||||||
| Investments | 274 | 240 | 707 | 14% | (66)% | |||||||||||||||
| Commissions and fees | 2,616 | 2,610 | 2,425 | � | 8% | |||||||||||||||
| Asset management, distribution and administration fees | 281 | 281 | 280 | � | � | |||||||||||||||
| Other | 221 | 684 | 684 | (68)% | � | |||||||||||||||
| Total non-interest revenues | 17,800 | 17,463 | 16,620 | 2% | 5% | |||||||||||||||
| Interest income | 3,190 | 3,389 | 3,572 | (6)% | (5)% | |||||||||||||||
| Interest expense | 3,037 | 3,981 | 4,673 | (24)% | (15)% | |||||||||||||||
| Net interest | 153 | (592 | ) | (1,101 | ) | N/M | 46% | |||||||||||||
| Net revenues | 17,953 | 16,871 | 15,519 | 6% | 9% | |||||||||||||||
| Compensation and benefits | 6,467 | 7,786 | 6,823 | (17)% | 14% | |||||||||||||||
| Non-compensation expenses | 6,815 | 9,143 | 7,750 | (25)% | 18% | |||||||||||||||
| Total non-interest expenses | 13,282 | 16,929 | 14,573 | (22)% | 16% | |||||||||||||||
| Income (loss) from continuing operations before income taxes | 4,671 | (58 | ) | 946 | N/M | N/M | ||||||||||||||
| Provision for (benefit from) income taxes | 825 | (90 | ) | (315 | ) | N/M | 71% | |||||||||||||
| Income from continuing operations | 3,846 | 32 | 1,261 | N/M | (97)% | |||||||||||||||
| Discontinued operations: | ||||||||||||||||||||
| Income (loss) from discontinued operations before income taxes | (24 | ) | (26 | ) | (81 | ) | 8% | 68% | ||||||||||||
| Provision for (benefit from) income taxes | (7 | ) | (7 | ) | (29 | ) | � | 76% | ||||||||||||
| Income (losses) from discontinued operations | (17 | ) | (19 | ) | (52 | ) | 11% | 63% | ||||||||||||
| Net income | 3,829 | 13 | 1,209 | N/M | (99)% | |||||||||||||||
| Net income applicable to redeemable noncontrolling interests | � | � | 1 | N/M | (100)% | |||||||||||||||
| Net income applicable to nonredeemable noncontrolling interests | 133 | 109 | 277 | 22% | (61)% | |||||||||||||||
| Net income (loss) applicable to Morgan Stanley | $ | 3,696 | $ | (96 | ) | $ | 931 | N/M | N/M | |||||||||||
| Amounts applicable to Morgan Stanley: | ||||||||||||||||||||
| Income (loss) from continuing operations | $ | 3,713 | $ | (77 | ) | $ | 983 | N/M | N/M | |||||||||||
| Income (loss) from discontinued operations | (17 | ) | (19 | ) | (52 | ) | 11% | 63% | ||||||||||||
| Net income (loss) applicable to Morgan Stanley | $ | 3,696 | $ | (96 | ) | $ | 931 | N/M | N/M | |||||||||||
| 49 | |
| %
Change from�Prior�Year: | ||||||||||||||||||||
| 2015 | 2014 | 2013 | 2015 | 2014 | ||||||||||||||||
| (dollars in millions) | ||||||||||||||||||||
| Advisory revenues | $ | 1,967 | $ | 1,634 | $ | 1,310 | 20% | 25% | ||||||||||||
| Underwriting revenues: | ||||||||||||||||||||
| Equity underwriting revenues | 1,398 | 1,613 | 1,262 | (13)% | 28% | |||||||||||||||
| Fixed income underwriting revenues | 1,643 | 1,956 | 1,805 | (16)% | 8% | |||||||||||||||
| Total underwriting revenues | 3,041 | 3,569 | 3,067 | (15)% | 16% | |||||||||||||||
| Total investment banking revenues | $ | 5,008 | $ | 5,203 | $ | 4,377 | (4)% | 19% | ||||||||||||
| 2015(1) | 2014(1) | 2013(1) | ||||||||||
| (dollars in billions) | ||||||||||||
| Announced mergers and acquisitions(2) | $ | 1,550 | $ | 657 | $ | 497 | ||||||
| Completed mergers and acquisitions(2) | 636 | 624 | 526 | |||||||||
| Equity and equity-related offerings(3) | 67 | 72 | 61 | |||||||||
| Fixed income offerings(4) | 256 | 286 | 291 | |||||||||
| (1) | Source: Thomson Reuters, data at January�15, 2016. Announced and completed mergers and acquisitions volumes are based on full credit to each of the advisors in a transaction. Equity and equity-related offerings and fixed income offerings are based on full credit for single book managers and equal credit for joint book managers. Transaction volumes may not be indicative of net revenues in a given period. In addition, transaction volumes for prior periods may vary from amounts previously reported due to the subsequent withdrawal or change in the value of a transaction. |
| (2) | Amounts include transactions of $100 million or more. Announced mergers and acquisitions exclude terminated transactions. |
| (3) | Amounts include Rule 144A issuances and registered public offerings of common stock and convertible securities and rights offerings. |
| (4) | Amounts include non-convertible preferred stock, mortgage-backed and asset-backed securities, and taxable municipal debt. Amounts include publicly registered and Rule 144A issues. Amounts exclude leveraged loans and self-led issuances. |
| � | Advisory revenues increased led primarily by merger, acquisition and restructuring transactions (�M&A�) in the Americas. Global industry-wide announced M&A volume activity for 2015 increased significantly compared with 2014. |
| � | Equity underwriting revenues decreased driven by decreases in initial public offering volumes. Fixed income underwriting revenues decreased primarily driven by lower non-investment grade bond and loan fees. |
| � | Advisory revenues from M&A increased due to increased deal activity in the Americas and Asia-Pacific regions. Industry-wide announced M&A volume activity for 2014 increased across all regions compared with 2013, primarily driven by cross-border activity. |
| � | Equity underwriting revenues increased driven by increased activity with clients across all regions. Fixed income underwriting revenues increased driven by increased investment grade volumes. |
| | 50 |
| %
Change from�Prior�Year: | ||||||||||||||||||||
| 2015 | 2014(1) | 2013 | 2015 | 2014 | ||||||||||||||||
| (dollars in millions) | ||||||||||||||||||||
| Trading | $ | 9,400 | $ | 8,445 | $ | 8,147 | 11% | 4% | ||||||||||||
| Commissions and fees | 2,616 | 2,610 | 2,425 | � | 8% | |||||||||||||||
| Asset management, distribution and administration fees | 281 | 281 | 280 | � | � | |||||||||||||||
| Net interest | 153 | (592 | ) | (1,101 | ) | N/M | 46% | |||||||||||||
| Total sales and trading net revenues | $ | 12,450 | $ | 10,744 | $ | 9,751 | 16% | 10% | ||||||||||||
| %
Change from�Prior�Year: | ||||||||||||||||||||
| 2015 | 2014(1) | 2013 | 2015 | 2014 | ||||||||||||||||
| (dollars in millions) | ||||||||||||||||||||
| Equity | $ | 8,288 | $ | 7,135 | $ | 6,529 | 16% | 9% | ||||||||||||
| Fixed income and commodities | 4,758 | 4,214 | 3,594 | 13% | 17% | |||||||||||||||
| Other | (596 | ) | (605 | ) | (372 | ) | 1% | (63)% | ||||||||||||
| Total sales and trading net revenues | $ | 12,450 | $ | 10,744 | $ | 9,751 | 16% | 10% | ||||||||||||
| (1) | Results in 2014 included a charge of $468 million related to the implementation of FVA (Equity: $2 million; Fixed income and commodities: $466 million). |
| %
Change from�Prior�Year: | ||||||||||||||||||||
| 2015 | 2014 | 2013 | 2015 | 2014 | ||||||||||||||||
| (dollars in millions) | ||||||||||||||||||||
| Total sales and trading net revenues�non-GAAP | $ | 11,832 | $ | 10,561 | $ | 10,432 | 12% | 1% | ||||||||||||
| Impact of DVA | 618 | 651 | (681 | ) | (5)% | N/M | ||||||||||||||
| Impact of FVA | � | (468 | ) | � | 100% | N/M | ||||||||||||||
| Total sales and trading net revenues | $ | 12,450 | $ | 10,744 | $ | 9,751 | 16% | 10% | ||||||||||||
| Equity sales and trading net revenues�non-GAAP | $ | 8,125 | $ | 6,905 | $ | 6,607 | 18% | 5% | ||||||||||||
| Impact of DVA | 163 | 232 | (78 | ) | (30)% | N/M | ||||||||||||||
| Impact of FVA | � | (2 | ) | � | 100% | N/M | ||||||||||||||
| Equity sales and trading net revenues | $ | 8,288 | $ | 7,135 | $ | 6,529 | 16% | 9% | ||||||||||||
| Fixed income and commodities sales and trading net revenues�non-GAAP | $ | 4,303 | $ | 4,261 | $ | 4,197 | 1% | 2% | ||||||||||||
| Impact of DVA | 455 | 419 | (603 | ) | 9% | N/M | ||||||||||||||
| Impact of FVA | � | (466 | ) | � | 100% | N/M | ||||||||||||||
| Fixed income and commodities sales and trading net revenues | $ | 4,758 | $ | 4,214 | $ | 3,594 | 13% | 17% | ||||||||||||
| 51 | |
| � | Equity sales and trading net revenues, excluding the impact of DVA and the implementation of FVA, increased driven by strong results in prime brokerage and derivatives products. Higher client balances primarily drove the increase in prime brokerage results, while the improved results in derivatives reflected increased client activity and gains on inventory. |
| � | Excluding the impact of DVA and the implementation of FVA, fixed income and commodities sales and trading net revenues increased as higher commodity net revenues were partially offset by lower fixed income product results. |
| � | Fixed income product net revenues, excluding the impact of DVA and the implementation of FVA, decreased due to lower results in credit and securitized products from wider credit spread environment which were partially offset by higher revenues in interest rates and foreign exchange products from higher client activity. |
| � | Commodity net revenues, excluding the impact of DVA and the implementation of FVA, increased primarily reflecting higher revenues from the global oil merchanting business, which was sold on November�1, 2015 (see �Investments, Other Revenues, Non-interest Expenses, Income Tax Items, Dispositions and Other Items�2015 Compared with 2014�Dispositions� herein). The increase was partially offset by credit driven losses and the absence of revenues from TransMontaigne Inc., which was sold on July�1, 2014 (see �Investments, Other Revenues, Non-interest Expenses, Income Tax Items, Dispositions and Other Items�2014 Compared with 2013�Dispositions� herein). |
| � | Equity sales and trading net revenues, excluding the impact of DVA and the implementation of FVA of $2 million, increased primarily due to higher revenues in the prime brokerage business driven by higher client balances partially offset by a decrease in derivatives revenues, reflecting unfavorable volatility movement. |
| � | Fixed income and commodities sales and trading net revenues in 2014 included a charge of $466 million related to the implementation of FVA. Excluding the impact of DVA and the implementation of FVA, fixed income and commodities sales and trading net revenues increased as higher commodity net revenues were partially offset by lower fixed income product results. |
| � | Fixed income product net revenues, excluding the impact of DVA and the implementation of FVA, decreased as higher results in interest rate products were offset by declines in credit products, which reflected an unfavorable market environment. |
| � | Commodity net revenues, excluding the impact of DVA and the implementation of FVA, increased reflecting higher levels of client demand for structured transactions and volatility in natural gas and power partly offset by lower revenues in the oil related businesses in part attributable to TransMontaigne Inc., which was sold on July�1, 2014 |
| | 52 |
| (see �Investments, Other Revenues, Non-interest Expenses, Income Tax Items, Dispositions and Other Items�2014 Compared with 2013�Dispositions� herein). |
| � | Net investment gains of $274 million in 2015 increased 14% from the prior year driven by gains on business related investments. |
| � | Other revenues of $221 million in 2015 decreased 68% from the prior year primarily due to the absence of gains realized on certain assets sold in 2014 (see Note 1 to the consolidated financial statements in Item�8) and markdowns and provisions on loans held for sale and held for investment, respectively. |
| � | Compensation and benefits expenses decreased primarily due to the 2014 compensation actions, a decrease in the fair value of deferred compensation plan referenced investments, and a decrease in the level of discretionary incentive compensation in 2015 (see also �Supplemental Financial Information and Disclosures�Discretionary Incentive Compensation� herein). |
| � | Non-compensation expenses decreased primarily due to lower litigation expenses. |
| � | Net investment gains of $240 million in 2014 decreased 66% from the prior year reflecting a gain recorded in 2013 related to the disposition of an investment in an insurance broker, and lower gains on principal investments and investments associated with the deferred compensation and co-investment plans in 2014. |
| � | Other revenues of $684 million remained unchanged. The results in 2014 included lower income from the Company�s 40% stake in Mitsubishi UFJ Morgan Stanley Securities Co., Ltd. (�MUMSS�) compared with 2013 (see �Other Items�Japanese Securities Joint Venture� herein and Note 8 to the consolidated financial statements in |
| 53 | |
| Item�8). In 2014, Other revenues also included gains realized on certain assets sold (see Note 1 to the consolidated financial statements in Item�8). |
| � | Compensation and benefits expenses increased primarily due to the 2014 compensation actions and an increase in base salaries and fixed allowances partially offset by a decrease in the fair value of deferred compensation plan referenced investments (see also �Supplemental Financial Information and Disclosures�Discretionary Incentive Compensation� herein). |
| � | Non-compensation expenses increased primarily due to higher legal expenses related to certain legacy residential mortgage-backed securities and credit crisis-related matters (see �Supplemental Financial Information and Disclosures�Legal� herein and �Contingencies�Legal� in Note 12 to the consolidated financial statements in Item�8). |
| | 54 |
| 55 | |
| % Change from�Prior�Year: | ||||||||||||||||||||
| 2015 | 2014 | 2013 | 2015 | 2014 | ||||||||||||||||
| (dollars in millions) | ||||||||||||||||||||
| Revenues: | ||||||||||||||||||||
| Investment banking | $ | 623 | $ | 791 | $ | 923 | (21)% | (14)% | ||||||||||||
| Trading | 731 | 957 | 1,161 | (24)% | (18)% | |||||||||||||||
| Investments | 18 | 9 | 14 | 100% | (36)% | |||||||||||||||
| Commissions and fees | 1,981 | 2,127 | 2,209 | (7)% | (4)% | |||||||||||||||
| Asset management, distribution and administration fees | 8,536 | 8,345 | 7,571 | 2% | 10% | |||||||||||||||
| Other | 255 | 320 | 390 | (20)% | (18)% | |||||||||||||||
| Total non-interest revenues | 12,144 | 12,549 | 12,268 | (3)% | 2% | |||||||||||||||
| Interest income | 3,105 | 2,516 | 2,100 | 23% | 20% | |||||||||||||||
| Interest expense | 149 | 177 | 225 | (16)% | (21)% | |||||||||||||||
| Net interest | 2,956 | 2,339 | 1,875 | 26% | 25% | |||||||||||||||
| Net revenues | 15,100 | 14,888 | 14,143 | 1% | 5% | |||||||||||||||
| Compensation and benefits | 8,595 | 8,825 | 8,265 | (3)% | 7% | |||||||||||||||
| Non-compensation expenses | 3,173 | 3,078 | 3,274 | 3% | (6)% | |||||||||||||||
| Total non-interest expenses | 11,768 | 11,903 | 11,539 | (1)% | 3% | |||||||||||||||
| Income from continuing operations before income taxes | 3,332 | 2,985 | 2,604 | 12% | 15% | |||||||||||||||
| Provision for (benefit from) income taxes | 1,247 | (207 | ) | 910 | N/M | N/M | ||||||||||||||
| Income from continuing operations | 2,085 | 3,192 | 1,694 | (35)% | 88% | |||||||||||||||
| Discontinued operations: | ||||||||||||||||||||
| Income (loss) from discontinued operations before income taxes | � | � | (1 | ) | N/M | (100)% | ||||||||||||||
| Provision for (benefit from) income taxes | � | � | � | N/M | N/M | |||||||||||||||
| Income (loss) from discontinued operations | � | � | (1 | ) | N/M | (100)% | ||||||||||||||
| Net income | 2,085 | 3,192 | 1,693 | (35)% | 89% | |||||||||||||||
| Net income applicable to redeemable noncontrolling interests | � | � | 221 | N/M | (100)% | |||||||||||||||
| Net income applicable to Morgan Stanley | $ | 2,085 | $ | 3,192 | $ | 1,472 | (35)% | N/M | ||||||||||||
| Amounts applicable to Morgan Stanley: | ||||||||||||||||||||
| Income from continuing operations | $ | 2,085 | $ | 3,192 | $ | 1,473 | (35)% | N/M | ||||||||||||
| Income (loss) from discontinued operations | � | � | (1 | ) | N/M | (100)% | ||||||||||||||
| Net income applicable to Morgan Stanley | $ | 2,085 | $ | 3,192 | $ | 1,472 | (35)% | N/M | ||||||||||||
| | 56 |
| % Change from�Prior�Year: | ||||||||||||||||||||
| 2015 | 2014 | 2013 | 2015 | 2014 | ||||||||||||||||
| (dollars in millions) | ||||||||||||||||||||
| Investment banking | $ | 623 | $ | 791 | $ | 923 | (21)% | (14)% | ||||||||||||
| Trading | 731 | 957 | 1,161 | (24)% | (18)% | |||||||||||||||
| Commissions and fees | 1,981 | 2,127 | 2,209 | (7)% | (4)% | |||||||||||||||
| Transactional revenues | $ | 3,335 | $ | 3,875 | $ | 4,293 | (14)% | (10)% | ||||||||||||
| � | Investment banking revenues decreased primarily due to lower revenues from the distribution of underwritten offerings. |
| � | Trading revenues decreased primarily due to losses related to investments associated with certain employee deferred compensation plans and lower revenues from fixed income products. |
| � | Commissions and fees decreased primarily due to lower revenues from equity, mutual fund and annuity products partially offset by higher revenues from alternatives asset classes. |
| � | Investment banking revenues decreased primarily due to lower levels of underwriting activity in closed-end funds partially offset by higher revenues from structured products. |
| � | Trading revenues decreased primarily as a result of lower gains related to investments associated with certain employee deferred compensation plans and lower revenues from fixed income products. |
| � | Commissions and fees revenues decreased primarily due to lower equity, insurance and mutual fund activity. |
| � | Asset management, distribution and administration fees of $8,536 million in 2015 increased 2% from the prior year primarily due to higher fee-based revenues that resulted from positive flows and higher average market values over 2015 as compared with the average market values during 2014 (see �Statistical Data� herein). The increase in fee-based revenues was partially offset by lower referral fees from the bank deposit program, reflecting the completion of the transfer of the deposits from Citigroup Inc. (�Citi�) to the Company (see Note 10 to the consolidated financial statements in Item�8). |
| � | Net interest of $2,956 million in 2015 increased 26% from the prior year primarily due to higher balances in the bank deposit program and growth in loans and lending commitments. |
| 57 | |
| � | Other revenues of $255 million in 2015 decreased 20% from the prior year primarily due to a $40 million gain on sale of a retail property space in the prior year and an increase in the allowance for credit losses in 2015. |
| � | Compensation and benefits expenses decreased primarily due to the 2014 compensation actions, a decrease in the fair value of deferred compensation plan referenced investments and a decrease in the level of discretionary incentive compensation in 2015 (see also �Supplemental Financial Information and Disclosures�Discretionary Incentive Compensation� herein). |
| � | Non-compensation expenses increased primarily due to an increase in Professional services, resulting from increased consulting and legal fees partially offset by a provision related to a rescission offer in the prior year. Other expenses in 2014 included $50 million related to a rescission offer to Wealth Management clients who may not have received a prospectus for certain securities transactions, for which delivery of a prospectus was required. |
| � | Asset management, distribution and administration fees of $8,345 million in 2014 increased 10% from the prior year primarily due to higher fee-based revenues partially offset by lower revenues from referral fees from the bank deposit program. The referral fees for deposits placed with Citi-affiliated depository institutions declined to $81 million in 2014 from $240 million in 2013, reflecting the transfer of deposits to the Company from Citi. |
| � | Net interest of $2,339 million in 2014 increased 25% from the prior year primarily due to higher lending balances and growth in loans and lending commitments in Portfolio Loan Account (�PLA�) securities-based lending products. |
| � | Other revenues of $320 million in 2014 decreased 18% from the prior year primarily as a result of a gain on sale of the U.K. operation of the Global Stock Plan Services business in 2013 and lower account fees. The results for Other revenues in 2014 included a $40 million gain on sale of a retail property space. |
| � | Compensation and benefits expenses increased primarily due to a higher formulaic payout to Wealth Management representatives linked to higher net revenues and an increase in base salaries. |
| � | Non-compensation expenses decreased in 2014 primarily driven by technology write-offs and an impairment expense related to certain intangible assets (management contracts) associated with alternative investments funds in 2013, lower intangible amortization and a lower Federal Deposit Insurance Corporation (�FDIC�) assessment on deposits partially offset by a provision in 2014 related to a rescission offer to Wealth Management clients. |
| 58 |
| At December� 31, 2015 | At December� 31, 2014 | |||||||||||
| Client assets | $ | 1,985 | $ | 2,025 | ||||||||
| Fee-based client assets(1) | $ | 795 | $ | 785 | ||||||||
| Fee-based client assets as a percentage of total client assets | 40% | 39% | ||||||||||
| Client liabilities(2) | $ | 64 | $ | 51 | ||||||||
| Bank deposit program(3) | $ | 149 | $ | 137 | ||||||||
| Investment securities portfolio | $ | 57.9 | $ | 57.3 | ||||||||
| Loans and lending commitments | $ | 55.3 | $ | 42.7 | ||||||||
| Wealth Management representatives | 15,889 | 16,076 | ||||||||||
| Retail locations | 608 | 622 | ||||||||||
| 2015 | 2014 | 2013 | ||||||||||
| Annual revenues per representative (dollars in thousands)(4) | $ | 950 | $ | 914 | $ | 863 | ||||||
| Client assets per representative (dollars in millions)(5) | $ | 125 | $ | 126 | $ | 116 | ||||||
| Fee-based asset flows(6) | $ | 46.3 | $ | 58.8 | $ | 51.9 | ||||||
| (1) | Fee-based client assets represent the amount of assets in client accounts where the basis of payment for services is a fee calculated on those assets. |
| (2) | Client liabilities include securities-based and tailored lending, home loans and margin lending. |
| (3) | Balances in the bank deposit program included deposits held by Morgan Stanley Bank, N.A. (�MSBNA�) and Morgan Stanley Private Bank, National Association (�MSPBNA�) (collectively, �U.S. Bank Subsidiaries�) of $149 billion and $128 billion at December�31, 2015 and December�31, 2014, respectively, with the remainder at December�31, 2014 held at Citi-affiliated FDIC insured depositories. At June�30, 2015, the transfer of deposits from Citi to the Company was completed. See Note 10 to the consolidated financial statements in Item�8 for further discussion of the Company�s customer deposits previously held by Citi. |
| (4) | Annual revenues per representative equal the Wealth Management business segment�s annual revenues divided by the average representative headcount. |
| (5) | Client assets per representative equal total period-end client assets divided by period-end representative headcount. |
| (6) | Fee-based asset flows include net new fee-based assets, net account transfers, dividends, interest and client fees and exclude cash management-related activity. |
| 59 | |
| At December�31, 2014 | Inflows | Outflows | Market Impact | At December�31, 2015 | Average�for�the Year Ended December�31, 2015 | |||||||||||||||||
| Fee�Rate(1) | ||||||||||||||||||||||
| (dollars in billions) | (in bps) | |||||||||||||||||||||
| Separately managed accounts(2) | $ | 285 | $ | 42 | $ | (32 | ) | $ | (12 | ) | $ | 283 | 34 | |||||||||
| Unified managed accounts | 93 | 29 | (14 | ) | (3 | ) | 105 | 113 | ||||||||||||||
| Mutual fund advisory | 31 | 3 | (6 | ) | (3 | ) | 25 | 121 | ||||||||||||||
| Representative as advisor | 119 | 29 | (25 | ) | (8 | ) | 115 | 89 | ||||||||||||||
| Representative as portfolio manager | 241 | 58 | (38 | ) | (9 | ) | 252 | 104 | ||||||||||||||
| Subtotal | $ | 769 | $ | 161 | $ | (115 | ) | $ | (35 | ) | $ | 780 | 76 | |||||||||
| Cash management | 16 | 9 | (10 | ) | � | 15 | 6 | |||||||||||||||
| Total fee-based client assets | $ | 785 | $ | 170 | $ | (125 | ) | $ | (35 | ) | $ | 795 | 74 | |||||||||
| At December�31, 2013 | Inflows | Outflows | Market Impact | At December�31, 2014 | Average�for�the Year Ended December�31, 2014 | |||||||||||||||||
| Fee�Rate(1) | ||||||||||||||||||||||
| (dollars in billions) | (in bps) | |||||||||||||||||||||
| Separately managed accounts(2) | $ | 260 | $ | 41 | $ | (31 | ) | $ | 15 | $ | 285 | 35 | ||||||||||
| Unified managed accounts | 78 | 24 | (11 | ) | 2 | 93 | 116 | |||||||||||||||
| Mutual fund advisory | 34 | 5 | (8 | ) | � | 31 | 121 | |||||||||||||||
| Representative as advisor | 111 | 30 | (23 | ) | 1 | 119 | 90 | |||||||||||||||
| Representative as portfolio manager | 201 | 60 | (28 | ) | 8 | 241 | 106 | |||||||||||||||
| Subtotal | $ | 684 | $ | 160 | $ | (101 | ) | $ | 26 | $ | 769 | 77 | ||||||||||
| Cash management | 13 | 12 | (9 | ) | � | 16 | 6 | |||||||||||||||
| Total fee-based client assets | $ | 697 | $ | 172 | $ | (110 | ) | $ | 26 | $ | 785 | 75 | ||||||||||
| At December�31, 2012 | Inflows | Outflows | Market Impact/ Other (3) | At December�31, 2013 | Average�for�the Year Ended December�31, 2013 | |||||||||||||||||
| Fee�Rate(1) | ||||||||||||||||||||||
| (dollars in billions) | (in bps) | |||||||||||||||||||||
| Separately managed accounts(2) | $ | 195 | $ | 43 | $ | (32 | ) | $ | 54 | $ | 260 | 37 | ||||||||||
| Unified managed accounts | 61 | 19 | (10 | ) | 8 | 78 | 120 | |||||||||||||||
| Mutual fund advisory | 31 | 5 | (6 | ) | 4 | 34 | 121 | |||||||||||||||
| Representative as advisor | 94 | 28 | (21 | ) | 10 | 111 | 91 | |||||||||||||||
| Representative as portfolio manager | 160 | 51 | (25 | ) | 15 | 201 | 109 | |||||||||||||||
| Subtotal | $ | 541 | $ | 146 | $ | (94 | ) | $ | 91 | $ | 684 | 78 | ||||||||||
| Cash management | 13 | 6 | (6 | ) | � | 13 | 6 | |||||||||||||||
| Total fee-based client assets | $ | 554 | $ | 152 | $ | (100 | ) | $ | 91 | $ | 697 | 77 | ||||||||||
| (1) | Average fee rate is for the year ended December�31, 2015,�December�31, 2014 and December�31, 2013, respectively. |
| (2) | Includes non-custody account values reflecting prior quarter-end balances due to a lag in the reporting of asset values by third-party custodians. |
| (3) | Effective in 2013, client assets include certain additional non-custodied assets as a result of the completion of the platform conversion between the Company and Citi. |
| � | Inflows �include new accounts, account transfers, deposits, dividends and interest. |
| � | Outflows �include closed or terminated accounts, account transfers, withdrawals and client fees. |
| � | Market impact �includes realized and unrealized gains and losses on portfolio investments. |
| | 60 |
| � | Separately managed accounts �Accounts by which third-party asset managers are engaged to manage clients� assets with investment decisions made by the asset manager. One third-party asset manager strategy can be held per account. |
| � | Unified managed accounts �Accounts that provide the client with the ability to combine separately managed accounts, mutual funds and exchange traded funds all in one aggregate account. Unified managed accounts can be client-directed, financial advisor-directed or Company-directed (with �directed� referring to the investment direction or decision/discretion/power of attorney). |
| � | Mutual fund advisory �Accounts that give the client the ability to systematically allocate assets across a wide range of mutual funds. Investment decisions are made by the client. |
| � | Representative as advisor �Accounts where the investment decisions must be approved by the client and the financial advisor must obtain approval each time a change is made to the account or its investments. |
| � | Representative as portfolio manager �Accounts where a financial advisor has discretion (contractually approved by the client) to make ongoing investment decisions without the client�s approval for each individual change. |
| � | Cash management �Accounts where the financial advisor provides discretionary cash management services to institutional clients whereby securities or proceeds are invested and reinvested in accordance with the client�s investment criteria. Generally, the portfolio will be invested in short-term fixed income and cash equivalent investments. |
| 61 | |
| % Change from�Prior�Year: | ||||||||||||||||||||
| 2015 | 2014 | 2013 | 2015 | 2014 | ||||||||||||||||
| (dollars in millions) | ||||||||||||||||||||
| Revenues: | ||||||||||||||||||||
| Investment banking | $ | 1 | $ | 5 | $ | 11 | (80)% | (55)% | ||||||||||||
| Trading | (1 | ) | (19 | ) | 41 | 95% | N/M | |||||||||||||
| Investments | 249 | 587 | 1,056 | (58)% | (44)% | |||||||||||||||
| Commissions and fees | 1 | � | � | N/M | N/M | |||||||||||||||
| Asset management, distribution and administration fees | 2,049 | 2,049 | 1,920 | � | 7% | |||||||||||||||
| Other | 32 | 106 | 32 | (70)% | N/M | |||||||||||||||
| Total non-interest revenues | 2,331 | 2,728 | 3,060 | (15)% | (11)% | |||||||||||||||
| Interest income | 2 | 2 | 9 | � | (78)% | |||||||||||||||
| Interest expense | 18 | 18 | 10 | � | 80% | |||||||||||||||
| Net interest | (16 | ) | (16 | ) | (1 | ) | � | N/M | ||||||||||||
| Net revenues | 2,315 | 2,712 | 3,059 | (15)% | (11)% | |||||||||||||||
| Compensation and benefits | 954 | 1,213 | 1,189 | (21)% | 2% | |||||||||||||||
| Non-compensation expenses | 869 | 835 | 862 | 4% | (3)% | |||||||||||||||
| Total non-interest expenses | 1,823 | 2,048 | 2,051 | (11)% | � | |||||||||||||||
| Income from continuing operations before income taxes | 492 | 664 | 1,008 | (26)% | (34)% | |||||||||||||||
| Provision for income taxes | 128 | 207 | 307 | (38)% | (33)% | |||||||||||||||
| Income from continuing operations | 364 | 457 | 701 | (20)% | (35)% | |||||||||||||||
| Discontinued operations: | ||||||||||||||||||||
| Income from discontinued operations before income taxes | 1 | 7 | 9 | (86)% | (22)% | |||||||||||||||
| Provision for (benefit from) income taxes | � | 2 | � | (100)% | N/M | |||||||||||||||
| Income from discontinued operations | 1 | 5 | 9 | (80)% | (44)% | |||||||||||||||
| Net income | 365 | 462 | 710 | (21)% | (35)% | |||||||||||||||
| Net income applicable to nonredeemable noncontrolling interests | 19 | 91 | 182 | (79)% | (50)% | |||||||||||||||
| Net income applicable to Morgan Stanley | $ | 346 | $ | 371 | $ | 528 | (7)% | (30)% | ||||||||||||
| Amounts applicable to Morgan Stanley: | ||||||||||||||||||||
| Income from continuing operations | $ | 345 | $ | 366 | $ | 519 | (6)% | (29)% | ||||||||||||
| Income from discontinued operations | 1 | 5 | 9 | (80)% | (44)% | |||||||||||||||
| Net income applicable to Morgan Stanley | $ | 346 | $ | 371 | $ | 528 | (7)% | (30)% | ||||||||||||
| | 62 |
| � | Investments of $249 million in 2015 decreased 58% from the prior year reflecting the reversal of previously accrued carried interest associated with Asia Private Equity and additional net markdowns on principal investments. |
| � | Asset management, distribution and administration fees were unchanged from the prior year as the impact of positive net flows was offset by a shift in the asset class mix from equity and fixed income products to liquidity products, (see �Statistical Data� herein). |
| � | Other revenues of $32 million in 2015 decreased 70% from the prior year due to lower revenues associated with the Company�s minority investment in certain third-party investment managers. |
| � | Compensation and benefits expenses decreased primarily due to the 2014 compensation actions, a decrease in deferred compensation associated with carried interest and a decrease in the level of incentive compensation in 2015 (see also �Supplemental Financial Information and Disclosures�Discretionary Incentive Compensation� herein). |
| � | Non-compensation expenses increased primarily due to higher Brokerage and clearing, Professional services, resulting from higher consulting and legal fees and Information processing and communications expenses. |
| � | Trading losses of $19 million in 2014 compared with gains of $41�million in 2013 primarily reflected losses related to certain consolidated real estate funds sponsored by the Company. |
| � | Investments of $587 million in 2014 decreased 44% from the prior year primarily related to lower net investment gains, lower carried interest in the Merchant Banking and Real Estate Investing businesses and lower gains from investments in the Company�s employee deferred compensation and co-investment plans. 2014 results were also negatively impacted by the deconsolidation in the second quarter of 2014 of certain legal entities associated with a real estate fund sponsored by the Company. |
| � | Asset management, distribution and administration fees of $2,049 million in 2014 increased 7% from the prior year primarily reflected higher management and administration revenues as a result of higher average assets under management (�AUM�), (see �Statistical Data� herein). |
| � | Other revenues of $106 million in 2014 increased from $32 million in 2013 primarily due to higher revenues associated with the Company�s minority investment in certain third-party investment managers and a $17 million gain on sale of a retail property space. |
| 63 | |
| � | Compensation and benefits expenses increased due to the 2014 compensation actions and increases in salaries partially offset by a decrease in the fair value of deferred compensation plan referenced investments (see also �Supplemental Financial Information and Disclosures�Discretionary Incentive Compensation� herein). |
| � | Non-compensation expenses decreased primarily due to an impairment expense related to certain intangible assets (management contracts) associated with alternative investments funds in 2013 and the result of lower consumption taxes in the European Union. |
| At December� 31, 2014 | Inflows (1) | Outflows | Distributions | Market Impact | Foreign Currency Impact | At December� 31, 2015 | Average�for�the Year Ended December�31, 2015 | |||||||||||||||||||||||||||||
| AUM | Fee�Rate | |||||||||||||||||||||||||||||||||||
| (dollars in billions) | (in bps) | |||||||||||||||||||||||||||||||||||
| Traditional Asset Management: | ||||||||||||||||||||||||||||||||||||
| Equity | $ | 141 | $ | 33 | $ | (44 | ) | $ | � | $ | (2 | ) | $ | (2 | ) | $ | 126 | $ | 136 | 70 | ||||||||||||||||
| Fixed income | 65 | 21 | (23 | ) | � | (1 | ) | (2 | ) | 60 | 63 | 32 | ||||||||||||||||||||||||
| Liquidity | 128 | 1,259 | (1,238 | ) | � | � | � | 149 | 136 | 9 | ||||||||||||||||||||||||||
| Alternatives(2) | 36 | 4 | (3 | ) | (1 | ) | � | � | 36 | 36 | 61 | |||||||||||||||||||||||||
| Managed Futures | 3 | � | � | � | � | � | 3 | 3 | 111 | |||||||||||||||||||||||||||
| Total Traditional Asset Management | 373 | 1,317 | (1,308 | ) | (1 | ) | (3 | ) | (4 | ) | 374 | 374 | 41 | |||||||||||||||||||||||
| Merchant Banking and Real Estate Investing(2) | 30 | 6 | (1 | ) | (5 | ) | 2 | � | 32 | 31 | 106 | |||||||||||||||||||||||||
| Total assets under management or supervision | $ | 403 | $ | 1,323 | $ | (1,309 | ) | $ | (6 | ) | $ | (1 | ) | $ | (4 | ) | $ | 406 | $ | 405 | 46 | |||||||||||||||
| Shares of minority stake assets | 7 | 8 | 7 | |||||||||||||||||||||||||||||||||
| | 64 |
| At December� 31, 2013 | Market Impact | Foreign Currency Impact | At December� 31, 2014 | Average�for�the Year Ended December�31, 2014 | ||||||||||||||||||||||||||||||||
| Inflows | Outflows | Distributions | AUM | Fee�Rate | ||||||||||||||||||||||||||||||||
| (dollars in billions) | (in bps) | |||||||||||||||||||||||||||||||||||
| Traditional Asset Management: | ||||||||||||||||||||||||||||||||||||
| Equity | $ | 140 | $ | 33 | $ | (34 | ) | $ | (1 | ) | $ | 5 | $ | (2 | ) | $ | 141 | $ | 145 | 69 | ||||||||||||||||
| Fixed income | 60 | 26 | (20 | ) | � | 1 | (2 | ) | 65 | 63 | 32 | |||||||||||||||||||||||||
| Liquidity | 112 | 963 | (945 | ) | � | (2 | ) | � | 128 | 119 | 8 | |||||||||||||||||||||||||
| Alternatives(2) | 31 | 6 | (2 | ) | � | 1 | � | 36 | 34 | 65 | ||||||||||||||||||||||||||
| Managed Futures | 4 | � | (1 | ) | � | � | � | 3 | 3 | 122 | ||||||||||||||||||||||||||
| Total Traditional Asset Management | 347 | 1,028 | (1,002 | ) | (1 | ) | 5 | (4 | ) | 373 | 364 | 43 | ||||||||||||||||||||||||
| Merchant Banking and Real Estate�Investing(2) | 30 | 8 | (7 | ) | (2 | ) | 1 | � | 30 | 30 | 104 | |||||||||||||||||||||||||
| Total assets under management or�supervision | $ | 377 | $ | 1,036 | $ | (1,009 | ) | $ | (3 | ) | $ | 6 | $ | (4 | ) | $ | 403 | $ | 394 | 47 | ||||||||||||||||
| Shares of minority stake assets | 6 | 7 | 7 | |||||||||||||||||||||||||||||||||
| At December� 31, 2012 | Market Impact | Foreign Currency Impact | At�December�
31, 2013 | Average�for�the Year Ended December�31, 2013 | ||||||||||||||||||||||||||||||||
| Inflows | Outflows | Distributions | AUM | Fee�Rate | ||||||||||||||||||||||||||||||||
| (dollars in billions) | (in�bps) | |||||||||||||||||||||||||||||||||||
| Traditional Asset Management: | ||||||||||||||||||||||||||||||||||||
| Equity | $ | 120 | $ | 29 | $ | (30 | ) | $ | � | $ | 22 | $ | (1 | ) | $ | 140 | $ | 130 | 65 | |||||||||||||||||
| Fixed income | 62 | 27 | (27 | ) | � | � | (2 | ) | 60 | 61 | 34 | |||||||||||||||||||||||||
| Liquidity | 100 | 742 | (730 | ) | � | � | � | 112 | 104 | 10 | ||||||||||||||||||||||||||
| Alternatives(2) | 27 | 5 | (2 | ) | (1 | ) | 2 | � | 31 | 29 | 65 | |||||||||||||||||||||||||
| Managed Futures | 5 | � | (1 | ) | � | � | � | 4 | 5 | 125 | ||||||||||||||||||||||||||
| Total Traditional Asset Management | 314 | 803 | (790 | ) | (1 | ) | 24 | (3 | ) | 347 | 329 | 43 | ||||||||||||||||||||||||
| Merchant�Banking�and�Real Estate�Investing(2) | 29 | 5 | (3 | ) | (3 | ) | 2 | � | 30 | 29 | 96 | |||||||||||||||||||||||||
| Total assets under management or supervision | $ | 343 | $ | 808 | $ | (793 | ) | $ | (4 | ) | $ | 26 | $ | (3 | ) | $ | 377 | $ | 358 | 47 | ||||||||||||||||
| Shares of minority stake assets | 5 | 6 | 6 | |||||||||||||||||||||||||||||||||
| (1) | Includes $4.6 billion related to the transfer of certain equity portfolio managers and their portfolios from the Wealth Management business segment to the Investment Management business segment. |
| (2) | Assets under management or supervision for Merchant Banking and Real Estate Investing and Alternatives reflect the basis on which management fees are earned. This calculation excludes AUM where no management fees are earned or where the fair value of these assets, including lending commitments, differs from the basis on which management fees are earned. Including these assets, AUM at December�31, 2015 and December�31, 2014 for Merchant Banking and Real Estate Investing were $44 billion and $42 billion, respectively, and for Alternatives were $39 billion and $39 billion, respectively. |
| � | Inflows �represent investments or commitments from new and existing clients in new or existing investment products, including reinvestments of client dividends and increases in invested capital. Excludes the impact of exchanges occurring whereby a client changes positions within the same asset class. |
| � | Outflows �represent redemptions from clients� funds, transition of funds from the committed capital period to the invested capital period and decreases in invested capital. Excludes the impact of exchanges occurring whereby a client changes positions within the same asset class. |
| 65 | |
| � | Distributions �represent decreases in invested capital due to returns of capital after the investment period of a fund. It also includes fund dividends for which the client has not elected to reinvest. |
| � | Market impact �includes realized and unrealized gains and losses on portfolio investments. This excludes any funds where market impact does not impact management fees. |
| � | Foreign currency impact �reflects foreign currency changes for non-U.S. dollar denominated funds. |
| � | Average fee rate �based on asset management and administration fees, net of waivers. It excludes performance-based fees and other non-management fees. For certain non-U.S. funds, it includes the portion of advisory fees that the advisor collects on behalf of third-party distributors. The payment of those fees to the distributor is included in Non-compensation expenses in the consolidated statements of income. |
| � | Alternatives asset class �includes a range of investment products such as funds of hedge funds, funds of private equity funds and funds of real estate funds. |
| � | Shares of minority stake assets �represent the Investment Management business segment�s proportional share of assets managed by entities in which it owns a minority stake. |
| | 66 |
| At�December�31,�2015 | At�December�31,�2014 | |||||||
| (dollars in billions) | ||||||||
| U.S. Bank Subsidiaries assets | $ | 174.2 | $ | 151.2 | ||||
| U.S. Bank Subsidiaries investment securities portfolio(1) | $ | 57.9 | $ | 57.3 | ||||
| Wealth Management U.S. Bank Subsidiaries data: | ||||||||
| Securities-based lending and other loans(2) | $ | 28.6 | $ | 22.0 | ||||
| Residential real estate loans | 20.9 | 15.8 | ||||||
| Total | $ | 49.5 | $ | 37.8 | ||||
| Institutional Securities U.S. Bank Subsidiaries data: | ||||||||
| Corporate Lending | $ | 10.0 | $ | 9.6 | ||||
| Other lending(3): | ||||||||
| Corporate loans | $ | 12.9 | $ | 8.0 | ||||
| Wholesale real estate loans and other loans | 8.9 | 8.6 | ||||||
| Total other loans | $ | 21.8 | $ | 16.6 | ||||
| Total | $ | 31.8 | $ | 26.2 | ||||
| (1) | The U.S. Bank Subsidiaries investment securities portfolio includes AFS investment securities of $53.0 billion at December�31, 2015 and $57.2 billion at December�31, 2014. The remaining balance represents HTM investment securities. |
| (2) | Other loans primarily include tailored lending. |
| (3) | Other lending includes activities related to commercial and residential mortgage lending, asset-backed lending, corporate loans purchased in the secondary market, financing extended to equities and commodities customers, and loans to municipalities. |
| 67 | |
| Institutional Securities | Wealth Management | Investment Management | Total | |||||||||||||
| (dollars in millions) | ||||||||||||||||
| 2014 compensation and benefits expense before fourth quarter actions(1) | $ | 6,882 | $ | 8,737 | $ | 1,068 | $ | 16,687 | ||||||||
| Fourth quarter actions: | ||||||||||||||||
| Change in 2014 level of deferrals(2) | 610 | 66 | 80 | 756 | ||||||||||||
| Acceleration of prior-year cash-based deferred awards(3) | 294 | 22 | 65 | 381 | ||||||||||||
| Fourth quarter actions total | $ | 904 | $ | 88 | $ | 145 | $ | 1,137 | ||||||||
| 2014 compensation and benefits expense | $ | 7,786 | $ | 8,825 | $ | 1,213 | $ | 17,824 | ||||||||
| | 68 |
| (1) | Amount represents compensation and benefits expense at pre-adjustment accrual levels ( i.e. , at an approximate average baseline 74% deferral rate and with no acceleration of cash-based award vesting that was utilized for the first three quarters of 2014). |
| (2) | Amounts reflect reduction in deferral level from an approximate average baseline of 74% to an approximate average baseline of 50%. |
| (3) | Amounts represent acceleration of vesting for certain cash-based awards. |
| 69 | |
| � | Recognition and Measurement of Financial Assets and Financial Liabilities. The guidance is effective for the Company beginning January�1, 2018. Early adoption is permitted for a specific component in the accounting standard, in which the Company would present separately in other comprehensive income the portion of the total change in the fair value of a liability resulting from a change in the instrument-specific credit risk if the Company has elected to measure the liability at fair value in accordance with the fair value option for financial instruments ( i.e. , DVA). This accounting update is currently being evaluated to determine the potential impact of adoption. |
| � | Simplifying the Accounting for Measurement-Period Adjustments. |
| � | Simplifying the Presentation of Debt Issuance Costs. |
| � | Amendments to the Consolidation Analysis. |
| � | Determining Whether the Host Contract in a Hybrid Financial Instrument Issued in the Form of a Share Is More Akin to Debt or to Equity. |
| � | Disclosure of Uncertainties about an Entity�s Ability to Continue as a Going Concern. |
| � | Measuring the Financial Assets and Financial Liabilities of a Consolidated Collateralized Financing Entity. |
| � | Accounting for Share-Based Payments When the Terms of an Award Provide That a Performance Target Could Be Achieved after the Requisite Service Period. |
| � | Revenue from Contracts with Customers. In May 2014, the FASB issued an accounting update to clarify the principles of revenue recognition, to develop a common revenue recognition standard across all industries for U.S. GAAP and International Financial Reporting Standards and to provide enhanced disclosures for users of the financial statements. The core principle of this guidance is that an entity should recognize revenue to depict the transfer of promised goods or services to customers in an amount that reflects the consideration to which the entity expects to be entitled in exchange for those goods or services. On April�1, 2015, the FASB voted to propose a deferral of the effective date of this accounting update by one year to January�1, 2018. Additionally, the FASB permits an entity to adopt this accounting update early but not before the original effective date, beginning January�1, 2017. This accounting update is currently being evaluated to determine the potential impact of adoption. |
| | 70 |
| � | Trading assets and Trading liabilities; |
| � | AFS securities; |
| � | Securities received as collateral and Obligation to return securities received as collateral; |
| � | Certain Securities purchased under agreements to resell; |
| � | Certain Deposits, primarily structured certificates of deposits; |
| � | Certain Short-term borrowings, primarily structured notes; |
| � | Certain Securities sold under agreements to repurchase; |
| � | Certain Other secured financings; and |
| � | Certain Long-term borrowings, primarily structured notes. |
| 71 | |
| | 72 |
| 73 | |
| | 74 |
| At December�31, 2015 | ||||||||||||||||
| Institutional Securities | Wealth Management | Investment Management | Total | |||||||||||||
| (dollars in millions) | ||||||||||||||||
| Assets | ||||||||||||||||
| Cash and cash equivalents | $ | 22,356 | $ | 31,216 | $ | 511 | $ | 54,083 | ||||||||
| Cash deposited with clearing organizations or segregated under federal and other regulations or requirements | 28,663 | 2,806 | � | 31,469 | ||||||||||||
| Trading assets | 224,949 | 883 | 2,448 | 228,280 | ||||||||||||
| Investment securities | 14,124 | 57,858 | 1 | 71,983 | ||||||||||||
| Securities received as collateral | 11,225 | � | � | 11,225 | ||||||||||||
| Securities purchased under agreements to resell | 83,205 | 4,452 | � | 87,657 | ||||||||||||
| Securities borrowed | 141,971 | 445 | � | 142,416 | ||||||||||||
| Customer and other receivables | 23,390 | 21,406 | 611 | 45,407 | ||||||||||||
| Loans, net of allowance | 36,237 | 49,522 | � | 85,759 | ||||||||||||
| Other assets(1) | 16,594 | 11,120 | 1,472 | 29,186 | ||||||||||||
| Total assets | $ | 602,714 | $ | 179,708 | $ | 5,043 | $ | 787,465 | ||||||||
| 75 | |
| At December�31, 2014 | ||||||||||||||||
| Institutional Securities | Wealth Management | Investment Management | Total | |||||||||||||
| (dollars in millions) | ||||||||||||||||
| Assets | ||||||||||||||||
| Cash and cash equivalents | $ | 23,161 | $ | 23,363 | $ | 460 | $ | 46,984 | ||||||||
| Cash deposited with clearing organizations or segregated under federal and other regulations or requirements | 37,841 | 2,766 | � | 40,607 | ||||||||||||
| Trading assets | 252,021 | 1,300 | 3,480 | 256,801 | ||||||||||||
| Investment securities | 11,999 | 57,317 | � | 69,316 | ||||||||||||
| Securities received as collateral | 21,316 | � | � | 21,316 | ||||||||||||
| Securities purchased under agreements to resell | 73,299 | 9,989 | � | 83,288 | ||||||||||||
| Securities borrowed | 136,336 | 372 | � | 136,708 | ||||||||||||
| Customer and other receivables | 27,328 | 21,022 | 611 | 48,961 | ||||||||||||
| Loans, net of allowance | 28,755 | 37,822 | � | 66,577 | ||||||||||||
| Other assets(1) | 18,285 | 11,196 | 1,471 | 30,952 | ||||||||||||
| Total assets | $ | 630,341 | $ | 165,147 | $ | 6,022 | $ | 801,510 | ||||||||
| (1) | Other assets primarily includes Other investments; Premises, equipment and software costs; Goodwill; Intangible assets and deferred tax assets. |
| At�December�31,�2015 | At�December�31,�2014 | Average Balance | ||||||||||||||
| 2015 | 2014 | |||||||||||||||
| (dollars in millions) | ||||||||||||||||
| Securities purchased under agreements to resell and Securities borrowed | $ | 230,073 | $ | 219,996 | $ | 252,971 | $ | 254,612 | ||||||||
| Securities sold under agreements to repurchase and Securities loaned | $ | 56,050 | $ | 95,168 | $ | 85,421 | $ | 136,954 | ||||||||
| | 76 |
| � | Sufficient liquid assets should be maintained to cover maturing liabilities and other planned and contingent outflows; |
| � | Maturity profile of assets and liabilities should be aligned, with limited reliance on short-term funding; |
| � | Source, counterparty, currency, region and term of funding should be diversified; and |
| � | Liquidity Stress Tests should anticipate, and account for, periods of limited access to funding. |
| � | No government support; |
| � | No access to equity and unsecured debt markets; |
| � | Repayment of all unsecured debt maturing within the stress horizon; |
| � | Higher haircuts and significantly lower availability of secured funding; |
| � | Additional collateral that would be required by trading counterparties, certain exchanges and clearing organizations related to credit rating downgrades; |
| � | Additional collateral that would be required due to collateral substitutions, collateral disputes and uncalled collateral; |
| 77 | |
| � | Discretionary unsecured debt buybacks; |
| � | Drawdowns on lending commitments provided to third parties; |
| � | Client cash withdrawals and reduction in customer short positions that fund long positions; |
| � | Limited access to the foreign exchange swap markets; and |
| � | Maturity roll-off of outstanding letters of credit with no further issuance. |
| At�December�31,�2015 | At�December�31,�2014 | |||||||
| (dollars in millions) | ||||||||
| Cash deposits with banks | $ | 10,187 | $ | 12,173 | ||||
| Cash deposits with central banks | 39,774 | 29,607 | ||||||
| Unencumbered highly liquid securities: | ||||||||
| U.S. government obligations | 72,265 | 76,555 | ||||||
| U.S. agency and agency mortgage-backed securities | 37,678 | 32,358 | ||||||
| Non-U.S. sovereign obligations(1) | 28,999 | 25,888 | ||||||
| Investments in money market funds | � | 277 | ||||||
| Other investment grade securities | 14,361 | 16,311 | ||||||
| Global Liquidity Reserve | $ | 203,264 | $ | 193,169 | ||||
| (1) | Non-U.S. sovereign obligations are composed of unencumbered German, French, Dutch, U.K., Brazilian and Japanese government obligations. |
| | 78 |
| At�December�31,�2015 | At�December�31,�2014 | Average Balance(1) | ||||||||||||||
| 2015 | 2014 | |||||||||||||||
| (dollars in millions) | ||||||||||||||||
| Bank legal entities: | ||||||||||||||||
| Domestic | $ | 88,432 | $ | 82,484 | $ | 81,691 | $ | 81,874 | ||||||||
| Foreign | 5,896 | 5,460 | 5,097 | 5,366 | ||||||||||||
| Total Bank legal entities | 94,328 | 87,944 | 86,788 | 87,240 | ||||||||||||
| Non-Bank legal entities(2): | ||||||||||||||||
| Domestic | 74,811 | 70,122 | 72,115 | 75,499 | ||||||||||||
| Foreign | 34,125 | 35,103 | 34,133 | 31,934 | ||||||||||||
| Total Non-Bank legal entities | 108,936 | 105,225 | 106,248 | 107,433 | ||||||||||||
| Total | $ | 203,264 | $ | 193,169 | $ | 193,036 | $ | 194,673 | ||||||||
| (1) | The Company calculates the average Global Liquidity Reserve based upon daily amounts. |
| (2) | The Parent managed $54,810 million and $55,094 million at December�31, 2015 and December�31, 2014, respectively, and averaged $53,620 million and $56,501 million during 2015 and 2014, respectively. |
| 79 | |
| | 80 |
| At December�31,�2015(1) | At December�31,�2014(1) | |||||||
| (dollars in millions) | ||||||||
| Savings and demand deposits | $ | 153,346 | $ | 132,159 | ||||
| Time deposits(2) | 2,688 | 1,385 | ||||||
| Total(3) | $ | 156,034 | $ | 133,544 | ||||
| (1) | Total deposits subject to the FDIC insurance at December�31, 2015 and December�31, 2014 were $113 billion and $99 billion, respectively. |
| (2) | Certain time deposit accounts are carried at fair value under the fair value option (see Note 3 to the consolidated financial statements in Item�8). |
| (3) | The Company�s deposits were primarily held in the U.S. |
| Parent | Subsidiaries | Total | ||||||||||
| (dollars in millions) | ||||||||||||
| Due in 2016 | $ | 18,110 | $ | 4,286 | $ | 22,396 | ||||||
| Due in 2017 | 21,161 | 1,105 | 22,266 | |||||||||
| Due in 2018 | 17,099 | 838 | 17,937 | |||||||||
| Due in 2019 | 17,959 | 609 | 18,568 | |||||||||
| Due in 2020 | 16,002 | 1,003 | 17,005 | |||||||||
| Thereafter | 53,759 | 1,837 | 55,596 | |||||||||
| Total | $ | 144,090 | $ | 9,678 | $ | 153,768 | ||||||
| 81 | |
| Parent | Morgan Stanley Bank, N.A. | |||||||||||
| Short-Term Debt | Long-Term Debt | Rating Outlook | Short-Term Debt | Long-Term Debt | Rating Outlook | |||||||
| DBRS, Inc. | R-1�(middle) | A�(high) | Stable | � | � | � | ||||||
| Fitch Ratings, Inc.(1) | F1 | A | Stable | F1 | A+ | Stable | ||||||
| Moody�s Investors Service, Inc.(2) | P-2 | A3 | Stable | P-1 | A1 | Stable | ||||||
| Rating and Investment Information, Inc.(3) | a-1 | A- | Stable | � | � | � | ||||||
| Standard & Poor�s Ratings Services(4) | A-2 | BBB+ | Stable | A-1 | A | Positive�Watch | ||||||
| (1) | On May�19, 2015, Fitch Ratings, Inc. upgraded the long-term rating of MSBNA by one notch to A+ from A. The rating outlook remained Stable. |
| (2) | On May�28, 2015, Moody�s Investors Service, Inc. (�Moody�s�) upgraded the long-term rating of the Parent and MSBNA by two notches to A3 from Baa2 and A1 from A3, respectively. The rating outlook for the Parent and MSBNA was revised to Stable. |
| (3) | On November�6, 2015, Rating and Investment Information, Inc. downgraded the long-term rating of the Parent one-notch to A- from A. The rating outlook for the Parent was revised to Stable. |
| (4) | On December�2, 2015, Standard�& Poor�s Ratings Services (�S&P�) downgraded the rating of the non-operating holding companies of all eight U.S. global systemically important banks by removing the government support uplift from the rating based on S&P�s view that it is uncertain that the U.S. government would provide extraordinary support to its banking system given S&P�s review of the progress made toward putting in place a viable U.S. resolution plan. The Parent�s long-term rating was lowered by one-notch to BBB+ from A-. The rating outlook for the Parent was revised to Stable. On November�2, 2015, MSBNA�s rating outlook was revised to Positive Watch from Positive. |
| | 82 |
| At�December�31,�2015 | At�December�31,�2014 | |||||||
| (dollars in millions) | ||||||||
| One-notch downgrade | $ | 1,169 | $ | 1,856 | ||||
| Two-notch downgrade | 1,465 | 2,984 | ||||||
| 83 | |
| Series | Preferred Stock Description | Quarterly Dividend per� Share(1) | ||||
| A | Floating Rate Non-Cumulative Preferred Stock (represented by depositary shares, each representing a 1/1,000th interest in a share of preferred stock and each having a dividend of $0.25556) | $ | 255.56 | |||
| C | 10% Non-Cumulative Non-Voting Perpetual Preferred Stock | 25.00 | ||||
| E | Fixed-to-Floating Rate Non-Cumulative Preferred Stock (represented by depositary shares, each representing a 1/1,000th interest in a share of preferred stock and each having a dividend of $0.44531) | 445.31 | ||||
| F | Fixed-to-Floating Rate Non-Cumulative Preferred Stock (represented by depositary shares, each representing a 1/1,000th interest in a share of preferred stock and each having a dividend of $0.42969) | 429.69 | ||||
| G | 6.625% Non-Cumulative Preferred Stock (represented by depositary shares, each representing a 1/1,000th interest in a share of preferred stock and each having a dividend of $0.41406) | 414.06 | ||||
| H | Fixed-to-Floating Rate Non-Cumulative Preferred Stock (represented by depositary shares, each representing a 1/25th interest in a share of preferred stock and each having a dividend of $27.25000)(1) | 681.25 | ||||
| I | Fixed-to-Floating Rate Non-Cumulative Preferred Stock (represented by depositary shares, each representing a 1/1,000th interest in a share of preferred stock and each having a dividend of $0.39844) | 398.44 | ||||
| J | Fixed-to-Floating Rate Non-Cumulative Preferred Stock (represented by depositary shares, each representing a 1/25th interest in a share of preferred stock and each having a dividend of $27.75000)(2) | 693.75 | ||||
| (1) | Dividend on Series H Preferred Stock is payable semiannually until July�15, 2019 and quarterly thereafter. |
| (2) | Dividend on Series J Preferred Stock is payable semiannually until July�15, 2020 and quarterly thereafter. |
| Balance at | Average Balance(1) | |||||||||||||||
| December�31,�2015 | December�31,�2014 | 2015 | 2014 | |||||||||||||
| (dollars in millions) | ||||||||||||||||
| Common equity | $ | 67,662 | $ | 64,880 | $ | 66,936 | $ | 65,284 | ||||||||
| Preferred equity | 7,520 | 6,020 | 7,174 | 4,774 | ||||||||||||
| Morgan Stanley shareholders� equity | 75,182 | 70,900 | 74,110 | 70,058 | ||||||||||||
| Junior subordinated debentures issued to capital trusts | 2,870 | 4,868 | 3,640 | 4,866 | ||||||||||||
| Less: Goodwill and net intangible assets | (9,564 | ) | (9,742 | ) | (9,661 | ) | (9,737 | ) | ||||||||
| Tangible Morgan Stanley shareholders� equity(2) | $ | 68,488 | $ | 66,026 | $ | 68,089 | $ | 65,187 | ||||||||
| Common equity | $ | 67,662 | $ | 64,880 | $ | 66,936 | $ | 65,284 | ||||||||
| Less: Goodwill and net intangible assets | (9,564 | ) | (9,742 | ) | (9,661 | ) | (9,737 | ) | ||||||||
| Tangible common equity(2) | $ | 58,098 | $ | 55,138 | $ | 57,275 | $ | 55,547 | ||||||||
| (1) | Average balances were calculated based upon month-end balances. |
| (2) | Tangible Morgan Stanley shareholders� equity and tangible common equity are non-GAAP financial measures that the Company and investors consider to be a useful measure to assess capital adequacy. |
| | 84 |
| 85 | |
| Transition Period | Fully�Phased�In(1) | |||||||
| Second�to�Fourth Quarter�of�2014 | 2015�to�2017 | 2018 and Onward | ||||||
| Regulatory Capital (Numerator of risk-based capital and leverage ratios) | U.S.�Basel�III�Transitional(2) | U.S.�Basel�III | ||||||
| RWAs (Denominator of risk-based capital ratios) | Standardized�Approach | U.S.�Basel�I�and�Basel�2.5 | U.S.�Basel�III Standardized�Approach | |||||
| Advanced Approach | U.S.�Basel�III�Advanced� Approach | |||||||
| Denominator of leverage ratios | Tier�1�Leverage�Ratio | Adjusted�Average�On-Balance�Sheet�Assets(3) | ||||||
| Supplementary�Leverage�Ratio | Adjusted�Average On-Balance�Sheet�Assets(3) and�Certain�Off-Balance Sheet Exposures | |||||||
| | 86 |
| (1) | Beginning in 2018, U.S. Basel III rules defining capital (numerator of capital ratios) will be fully phased in, except for the exclusion of non-qualifying trust preferred securities from Tier 2 capital, which will be fully phased in as of January�1, 2022. In addition, the Company will also be subject to a greater than 2.5% Common Equity Tier 1 capital conservation buffer, a G-SIB capital surcharge and, if deployed by banking regulators, up to a 2.5% Common Equity Tier 1 countercyclical buffer, all of which will be fully phased in by the beginning of 2019. The capital conservation buffer, the G-SIB capital surcharge and, if deployed, the countercyclical buffer apply in addition to each of the Company�s Common Equity Tier 1, Tier 1 and Total capital ratios. The requirements for these additional capital buffers will be phased in beginning in 2016. For information on the recently adopted G-SIB capital surcharge, see �G-SIB Capital Surcharge� herein. |
| (2) | In 2015, as a result of the Company�s and its U.S. Bank Subsidiaries� completion of the Advanced Approach parallel run, the amount of expected credit loss that exceeds eligible credit reserves must be deducted 40% from Common Equity Tier 1 capital and 60% from Additional Tier 1 capital. Over the next two years, this deduction from Common Equity Tier 1 capital will incrementally increase and the amount deducted from Additional Tier 1 capital will correspondingly decrease until fully phased in by the beginning of 2018. In addition, under the Advanced Approach framework, the allowance for loan losses cannot be included in Tier 2 capital. Instead, an Advanced Approach banking organization may include in Tier 2 capital any eligible credit reserves that exceed its total expected credit losses to the extent that the excess reserve amount does not exceed 0.6% of its Advanced Approach credit risk RWAs. The allowance for loan losses may continue to be included in Tier 2 capital for purposes of calculating capital ratios under the Standardized Approach, up to 1.25% of credit risk RWAs. |
| (3) | In accordance with U.S. Basel III, adjusted average assets represent the denominator of the Tier 1 leverage ratio and are composed of the average daily balance of consolidated on-balance sheet assets under U.S. GAAP during the calendar quarter, adjusted for disallowed goodwill, transitional intangible assets, certain deferred tax assets, certain investments in the capital instruments of unconsolidated financial institutions and other adjustments. |
| At December�31, 2015 | Minimum�Regulatory Capital�Ratio | |||||||||||
| Actual Capital Ratio | ||||||||||||
| U.S.�Basel�III�Transitional/ Standardized�Approach | U.S.�Basel�III�Transitional/ Advanced�Approach | |||||||||||
| Calendar Year 2015 | ||||||||||||
| Common Equity Tier 1 capital ratio | 16.4% | 15.5% | 4.5% | |||||||||
| Tier 1 capital ratio | 18.4% | 17.4% | 6.0% | |||||||||
| Total capital ratio | 22.0% | 20.7% | 8.0% | |||||||||
| Tier 1 leverage ratio | 8.3% | N/A | 4.0% | |||||||||
| 87 | |
| At�December�31,�2015 | At�December�31,�2014 | |||||||
| (dollars in millions) | ||||||||
| RWAs: | ||||||||
| Credit risk | $ | 173,586 | $ | 184,645 | ||||
| Market risk | 71,476 | 121,363 | ||||||
| Operational risk | 139,100 | 150,000 | ||||||
| Total RWAs | $ | 384,162 | $ | 456,008 | ||||
| Capital ratios: | ||||||||
| Common Equity Tier 1 ratio | 15.5% | 12.6% | ||||||
| Tier 1 capital ratio | 17.4% | 14.1% | ||||||
| Total capital ratio | 20.7% | 16.4% | ||||||
| Tier 1 leverage ratio(1) | 8.3% | 7.9% | ||||||
| Adjusted average assets(2) | $ | 803,574 | $ | 810,524 | ||||
| (1) | Tier 1 leverage ratios are calculated under U.S. Basel III Standardized Approach transitional rules. |
| (2) | Beginning with the first quarter of 2015, in accordance with U.S. Basel III, adjusted average assets represent the denominator of the Tier 1 leverage ratio and are composed of the average daily balance of consolidated on-balance sheet assets under U.S. GAAP during the calendar quarter, adjusted for disallowed goodwill, transitional intangible assets, certain deferred tax assets, certain investments in the capital instruments of unconsolidated financial institutions and other adjustments. |
| | 88 |
| At�December�31,�2015 | At�December�31,�2014 | |||||||
| (dollars in millions) | ||||||||
| Common Equity Tier 1 capital: | ||||||||
| Common stock and surplus | $ | 20,114 | $ | 21,503 | ||||
| Retained earnings | 49,204 | 44,625 | ||||||
| Accumulated other comprehensive income (loss) | (1,656 | ) | (1,248 | ) | ||||
| Regulatory adjustments and deductions: | ||||||||
| Net goodwill | (6,582 | ) | (6,612 | ) | ||||
| Net intangible assets (other than goodwill and mortgage servicing assets) | (1,192 | ) | (632 | ) | ||||
| Credit spread premium over risk-free rate for derivative liabilities | (202 | ) | (161 | ) | ||||
| Net deferred tax assets | (675 | ) | (580 | ) | ||||
| Net after-tax debt valuation adjustment | 156 | 158 | ||||||
| Adjustments related to accumulated other comprehensive income | 411 | 462 | ||||||
| Expected credit loss over eligible credit reserves | � | (10 | ) | |||||
| Other adjustments and deductions | (169 | ) | (181 | ) | ||||
| Total Common Equity Tier 1 capital | $ | 59,409 | $ | 57,324 | ||||
| Additional Tier 1 capital: | ||||||||
| Preferred stock | $ | 7,520 | $ | 6,020 | ||||
| Trust preferred securities | 702 | 2,434 | ||||||
| Nonredeemable noncontrolling interests | 678 | 1,004 | ||||||
| Regulatory adjustments and deductions: | ||||||||
| Net deferred tax assets | (1,012 | ) | (2,318 | ) | ||||
| Credit spread premium over risk-free rate for derivative liabilities | (303 | ) | (644 | ) | ||||
| Net after-tax debt valuation adjustment | 233 | 630 | ||||||
| Expected credit loss over eligible credit reserves | � | (39 | ) | |||||
| Other adjustments and deductions | (253 | ) | (229 | ) | ||||
| Additional Tier 1 capital | $ | 7,565 | $ | 6,858 | ||||
| Deduction for investments in covered funds | (252 | ) | � | |||||
| Total Tier 1 capital | $ | 66,722 | $ | 64,182 | ||||
| Tier 2 capital: | ||||||||
| Subordinated debt | $ | 10,404 | $ | 8,339 | ||||
| Trust preferred securities | 2,106 | 2,434 | ||||||
| Other qualifying amounts | 35 | 27 | ||||||
| Regulatory adjustments and deductions | 136 | (10 | ) | |||||
| Total Tier 2 capital | $ | 12,681 | $ | 10,790 | ||||
| Total capital | $ | 79,403 | $ | 74,972 | ||||
| 89 | |
| 2015 | ||||
| (dollars�in�millions) | ||||
| Common Equity Tier 1 capital: | ||||
| Common Equity Tier 1 capital at December�31, 2014 | $ | 57,324 | ||
| Change related to the following items: | ||||
| Value of shareholders� common equity | 2,782 | |||
| Net goodwill | 30 | |||
| Net intangible assets (other than goodwill and mortgage servicing assets) | (560 | ) | ||
| Credit spread premium over risk-free rate for derivative liabilities | (41 | ) | ||
| Net deferred tax assets | (95 | ) | ||
| Net after-tax debt valuation adjustment | (2 | ) | ||
| Adjustments related to accumulated other comprehensive income | (51 | ) | ||
| Expected credit loss over eligible credit reserves | 10 | |||
| Other deductions and adjustments | 12 | |||
| Common Equity Tier 1 capital at December�31, 2015 | $ | 59,409 | ||
| Additional Tier 1 capital: | ||||
| Additional Tier 1 capital at December�31, 2014 | $ | 6,858 | ||
| New issuance of qualifying preferred stock | 1,500 | |||
| Change related to the following items: | ||||
| Trust preferred securities | (1,732 | ) | ||
| Nonredeemable noncontrolling interests | (326 | ) | ||
| Net deferred tax assets | 1,306 | |||
| Credit spread premium over risk-free rate for derivative liabilities | 341 | |||
| Net after-tax debt valuation adjustment | (397 | ) | ||
| Expected credit loss over eligible credit reserves | 39 | |||
| Other adjustments and deductions | (24 | ) | ||
| Additional Tier 1 capital at December�31, 2015 | $ | 7,565 | ||
| Deduction for investments in covered funds | (252 | ) | ||
| Tier 1 capital at December�31, 2015 | $ | 66,722 | ||
| Tier 2 capital: | ||||
| Tier 2 capital at December�31, 2014 | $ | 10,790 | ||
| Change related to the following items: | ||||
| Subordinated debt | 2,065 | |||
| Trust preferred securities | (328 | ) | ||
| Nonredeemable noncontrolling interests | 8 | |||
| Other adjustments and deductions | 146 | |||
| Tier 2 capital at December�31, 2015 | $ | 12,681 | ||
| Total capital at December�31, 2015 | $ | 79,403 | ||
| | 90 |
| 2015(1) | ||||
| (dollars�in�millions) | ||||
| Credit risk RWAs: | ||||
| Balance at December�31, 2014 | $ | 184,645 | ||
| Change related to the following items: | ||||
| Derivatives | (6,509 | ) | ||
| Securities financing transactions | 1,486 | |||
| Other counterparty credit risk | (39 | ) | ||
| Securitizations | 4,071 | |||
| Credit valuation adjustment | (3,303 | ) | ||
| Investment securities | 1,402 | |||
| Loans | (247 | ) | ||
| Cash | (682 | ) | ||
| Equity investments | (4,794 | ) | ||
| Other credit risk(2) | (2,444 | ) | ||
| Total change in credit risk RWAs | $ | (11,059 | ) | |
| Balance at December�31, 2015 | $ | 173,586 | ||
| Market risk RWAs: | ||||
| Balance at December�31, 2014 | $ | 121,363 | ||
| Change related to the following items: | ||||
| Regulatory VaR | (1,575 | ) | ||
| Regulatory stressed VaR | (16,256 | ) | ||
| Incremental risk charge | (9,826 | ) | ||
| Comprehensive risk measure | (2,750 | ) | ||
| Specific risk: | ||||
| Non-securitizations | (3,848 | ) | ||
| Securitizations | (15,632 | ) | ||
| Total change in market risk RWAs | $ | (49,887 | ) | |
| Balance at December�31, 2015 | $ | 71,476 | ||
| Operational risk RWAs: | ||||
| Balance at December�31, 2014 | $ | 150,000 | ||
| Change in operational risk RWAs(3) | (10,900 | ) | ||
| Balance at December�31, 2015 | $ | 139,100 | ||
| (1) | The RWAs for each category in the table reflect both on- and off-balance sheet exposures, where appropriate. |
| (2) | Amount reflects assets not in a defined category, non-material portfolios of exposures and unsettled transactions. |
| (3) | Amount primarily reflects model recalibration related to residential mortgage litigation expense recorded in 2014. |
| At December�31, 2015 | ||||||||
| U.S.�Basel�
III Advanced�Approach | U.S.�Basel�
III Standardized�Approach | |||||||
| (dollars in millions) | ||||||||
| Common Equity Tier 1 capital | $ | 55,441 | $ | 55,441 | ||||
| Total RWAs | 395,277 | 373,421 | ||||||
| Common Equity Tier 1 ratio | 14.0% | 14.8% | ||||||
| Required Common Equity Tier 1 ratio at January�1, 2019(1) | 10.0% | 10.0% | ||||||
| (1) | Includes the applicable minimum risk-based capital ratio and capital conservation buffer and assumes that: (1)�the G-SIB capital surcharge for the Company remains at 3% as calculated by the Federal Reserve in July 2015; and (2)�no countercyclical buffer has been deployed. |
| 91 | |
| | 92 |
| 93 | |
| At�December�31,�2015 | ||||
| (dollars in millions) | ||||
| Total assets | $ | 787,465 | ||
| Consolidated daily average total assets(1) | $ | 813,715 | ||
| Adjustment for derivative exposures(2)(3) | 216,317 | |||
| Adjustment for repo-style transactions(2)(4) | 15,064 | |||
| Adjustment for off-balance sheet exposures(2)(5) | 62,850 | |||
| Other adjustments(6) | (10,141 | ) | ||
| Pro forma supplementary leverage exposure | $ | 1,097,805 | ||
| Pro forma supplementary leverage ratio(7) | 6.1% | |||
| (1) | Computed as the average daily balance of consolidated total assets under U.S. GAAP during the calendar quarter. |
| (2) | Computed as the arithmetic mean of the month-end balances over the calendar quarter. |
| (3) | Reflects the addition of the potential future exposure for derivative contracts (including derivatives that are centrally cleared for clients), the gross-up of cash collateral netting where certain qualifying criteria are not met, and the effective notional principal amount of sold credit protection offset by certain qualifying purchased credit protection. |
| (4) | Reflects the counterparty credit risk associated with repo-style transactions. |
| (5) | Reflects the credit equivalent amount of off-balance sheet exposures, which is computed by applying the relevant credit conversion factors. |
| (6) | Reflects adjustments to Tier 1 capital, including disallowed goodwill, transitional intangible assets, certain deferred tax assets, certain investments in the capital instruments of unconsolidated financial institutions and other adjustments. |
| (7) | At December�31, 2015, pro forma supplementary leverage ratios calculated using Tier 1 capital and pro forma supplementary leverage exposures computed under U.S. Basel III on a transitional basis for the Company�s U.S. Bank Subsidiaries were as follows: MSBNA: 7.3%; and MSPBNA: 10.3%. |
| | 94 |
| 2015 | 2014 | |||||||||||||||
| Average�Common Equity�Tier�1�Capital(1) | Average�Common Equity(1) | Average�Common Equity�Tier�1�Capital(1) | Average�Common Equity(1) | |||||||||||||
| (dollars in billions) | ||||||||||||||||
| Institutional Securities | $ | 32.8 | $ | 34.6 | $ | 31.3 | $ | 32.2 | ||||||||
| Wealth Management | 4.9 | 11.2 | 5.2 | 11.2 | ||||||||||||
| Investment Management | 1.3 | 2.2 | 1.9 | 2.9 | ||||||||||||
| Parent capital | 19.2 | 18.9 | 19.2 | 19.0 | ||||||||||||
| Total | $ | 58.2 | $ | 66.9 | $ | 57.6 | $ | 65.3 | ||||||||
| (1) | Amounts are calculated on a monthly basis. Average Common Equity and average Common Equity Tier 1 capital are non-GAAP financial measures that the Company and investors consider to be useful measures to assess capital adequacy. |
| 95 | |
| At December�31, 2015 | ||||||||||||||||||||
| Payments Due in: | ||||||||||||||||||||
| 2016 | 2017-2018 | 2019-2020 | Thereafter | Total | ||||||||||||||||
| (dollars in millions) | ||||||||||||||||||||
| Long-term borrowings(1) | $ | 22,396 | $ | 40,203 | $ | 35,573 | $ | 55,596 | $ | 153,768 | ||||||||||
| Other secured financings(1) | 2,333 | 3,675 | 1,290 | 331 | 7,629 | |||||||||||||||
| Contractual interest payments(2) | 4,965 | 7,763 | 5,409 | 18,075 | 36,212 | |||||||||||||||
| Time deposits(3) | 2,604 | 68 | � | 20 | 2,692 | |||||||||||||||
| Operating leases�premises(4) | 612 | 1,212 | 923 | 3,127 | 5,874 | |||||||||||||||
| Purchase obligations(5) | 554 | 438 | 148 | 233 | 1,373 | |||||||||||||||
| Total(6) | $ | 33,464 | $ | 53,359 | $ | 43,343 | $ | 77,382 | $ | 207,548 | ||||||||||
| (1) | For further information on long-term borrowings and other secured financings, see Note 11 to the consolidated financial statements in Item�8. Amounts presented for Other secured financings are financings with original maturities greater than one year. |
| (2) | Amounts represent estimated future contractual interest payments related to unsecured long-term borrowings based on applicable interest rates at December�31, 2015. |
| (3) | Amounts represent contractual principal and interest payments related to time deposits primarily held at the Company�s U.S. Bank Subsidiaries. |
| (4) | For further information on operating leases covering premises and equipment, see Note 12 to the consolidated financial statements in Item�8. |
| (5) | Purchase obligations for goods and services include payments for, among other things, consulting, outsourcing, computer and telecommunications maintenance agreements, and certain transmission, transportation and storage contracts related to the commodities business. Purchase obligations at December�31, 2015 reflect the minimum contractual obligation under legally enforceable contracts with contract terms that are both fixed and determinable. These amounts exclude obligations for goods and services that already have been incurred and are reflected on the consolidated statements of financial condition. |
| (6) | Amounts exclude unrecognized tax benefits, as the timing and amount of future cash payments are not determinable at this time (see Note 20 to the consolidated financial statements in Item�8 for further information). |
| | 96 |
| 97 | |
| Item��7A. | Quantitative and Qualitative Disclosures about Market Risk. |
| | 98 |
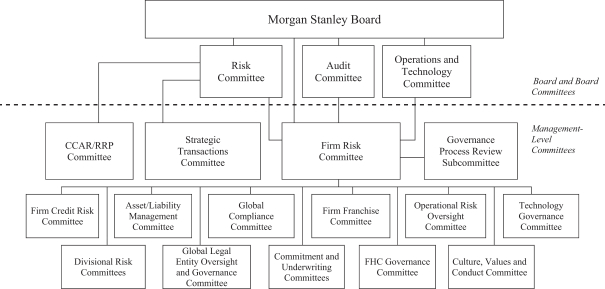 Morgan Stanley Board of
Directors. The Board has oversight for the ERM framework and is responsible for helping to ensure that the Company�s risks are managed in a sound manner. The Board has authorized the committees within the ERM
framework to help facilitate its risk oversight responsibilities. As set forth in the Company�s Corporate Governance Policies, the Board also oversees, and receives reports on, the Company�s practices and procedures relating to culture,
values and conduct. Risk Committee of the
Board. The BRC is composed of non-management directors. The BRC oversees the Company�s global ERM framework; oversees the major risk exposures of the Company, including market, credit, operational, liquidity, funding,
reputational and franchise risk, against established risk measurement methodologies and the steps management has taken to monitor and control such exposures; oversees the Company�s risk appetite statement, including risk limits and tolerances;
reviews capital, liquidity and funding strategy and related guidelines and policies; reviews the contingency funding plan and internal capital adequacy assessment process and capital plan; oversees the Company�s significant risk management and
risk assessment guidelines and policies; oversees the performance of the Chief Risk Officer; reviews reports from the Company�s Strategic Transactions Committee and Comprehensive Capital Analysis and Review (�CCAR�)/Resolution and
Recovery Planning (�RRP�) Committee; reviews significant reputational risk, franchise risk, new product risk, emerging risks and regulatory matters; and reviews results of Internal Audit reviews and assessment of the risk management,
liquidity and capital functions. The BRC reports to the entire Board on a regular basis and the entire Board attends quarterly meetings with the BRC. Audit Committee of the Board. The BAC is composed of independent directors. The BAC oversees the integrity
of the Company�s consolidated financial statements, compliance with legal and regulatory requirements and system of internal controls; oversees risk management and risk assessment guidelines in coordination with the Board, BRC and BOTC and
reviews the major legal and compliance risk exposures of the Company and the steps management has taken to monitor and control such exposures; selects, determines the compensation of, evaluates and when appropriate, replaces the independent auditor;
oversees the qualifications, independence and performance of the Company�s independent auditor, and pre-approves audit and permitted non-audit services; oversees the performance of the Company�s head of internal audit; and after review,
recommends to the Board the acceptance and inclusion of the annual audited consolidated financial statements in the Company�s Annual Report on Form 10-K. The BAC reports to the entire Board on a regular basis. Operations and Technology Committee of the
Board. The BOTC is composed of non-management directors. The BOTC oversees the Company�s operations and technology strategy, including trends that may affect such strategy; reviews operations and technology budget and
significant expenditures and investments; reviews operations and technology metrics; oversees risk management and risk assessment guidelines and policies regarding operations and technology risk; reviews the major operations and technology risk
exposures of the Company, including information security and cybersecurity risks, and
Morgan Stanley Board of
Directors. The Board has oversight for the ERM framework and is responsible for helping to ensure that the Company�s risks are managed in a sound manner. The Board has authorized the committees within the ERM
framework to help facilitate its risk oversight responsibilities. As set forth in the Company�s Corporate Governance Policies, the Board also oversees, and receives reports on, the Company�s practices and procedures relating to culture,
values and conduct. Risk Committee of the
Board. The BRC is composed of non-management directors. The BRC oversees the Company�s global ERM framework; oversees the major risk exposures of the Company, including market, credit, operational, liquidity, funding,
reputational and franchise risk, against established risk measurement methodologies and the steps management has taken to monitor and control such exposures; oversees the Company�s risk appetite statement, including risk limits and tolerances;
reviews capital, liquidity and funding strategy and related guidelines and policies; reviews the contingency funding plan and internal capital adequacy assessment process and capital plan; oversees the Company�s significant risk management and
risk assessment guidelines and policies; oversees the performance of the Chief Risk Officer; reviews reports from the Company�s Strategic Transactions Committee and Comprehensive Capital Analysis and Review (�CCAR�)/Resolution and
Recovery Planning (�RRP�) Committee; reviews significant reputational risk, franchise risk, new product risk, emerging risks and regulatory matters; and reviews results of Internal Audit reviews and assessment of the risk management,
liquidity and capital functions. The BRC reports to the entire Board on a regular basis and the entire Board attends quarterly meetings with the BRC. Audit Committee of the Board. The BAC is composed of independent directors. The BAC oversees the integrity
of the Company�s consolidated financial statements, compliance with legal and regulatory requirements and system of internal controls; oversees risk management and risk assessment guidelines in coordination with the Board, BRC and BOTC and
reviews the major legal and compliance risk exposures of the Company and the steps management has taken to monitor and control such exposures; selects, determines the compensation of, evaluates and when appropriate, replaces the independent auditor;
oversees the qualifications, independence and performance of the Company�s independent auditor, and pre-approves audit and permitted non-audit services; oversees the performance of the Company�s head of internal audit; and after review,
recommends to the Board the acceptance and inclusion of the annual audited consolidated financial statements in the Company�s Annual Report on Form 10-K. The BAC reports to the entire Board on a regular basis. Operations and Technology Committee of the
Board. The BOTC is composed of non-management directors. The BOTC oversees the Company�s operations and technology strategy, including trends that may affect such strategy; reviews operations and technology budget and
significant expenditures and investments; reviews operations and technology metrics; oversees risk management and risk assessment guidelines and policies regarding operations and technology risk; reviews the major operations and technology risk
exposures of the Company, including information security and cybersecurity risks, and | 99 | |
| | 100 |
| 101 | |
| | 102 |
| 103 | |
| 95%/One-Day VaR for 2015 | 95%/One-Day VaR for 2014 | |||||||||||||||||||||||||||||||
| Market Risk Category | Period End | Average | High | Low | Period End | Average | High | Low | ||||||||||||||||||||||||
| (dollars in millions) | ||||||||||||||||||||||||||||||||
| Interest rate and credit spread | $ | 28 | $ | 34 | $ | 42 | $ | 27 | $ | 31 | $ | 31 | $ | 44 | $ | 25 | ||||||||||||||||
| Equity price | 17 | 19 | 40 | 14 | 18 | 18 | 26 | 15 | ||||||||||||||||||||||||
| Foreign exchange rate | 6 | 11 | 20 | 6 | 10 | 11 | 17 | 6 | ||||||||||||||||||||||||
| Commodity price | 10 | 16 | 21 | 10 | 15 | 17 | 24 | 12 | ||||||||||||||||||||||||
| Less: Diversification benefit(1)(2) | (23 | ) | (33 | ) | N/A | N/A | (30 | ) | (34 | ) | N/A | N/A | ||||||||||||||||||||
| Primary Risk Categories | $ | 38 | $ | 47 | $ | 57 | $ | 38 | $ | 44 | $ | 43 | $ | 53 | $ | 34 | ||||||||||||||||
| Credit Portfolio | 12 | 13 | 20 | 10 | 15 | 11 | 15 | 9 | ||||||||||||||||||||||||
| Less: Diversification benefit(1)(2) | (9 | ) | (10 | ) | N/A | N/A | (14 | ) | (7 | ) | N/A | N/A | ||||||||||||||||||||
| Total Management VaR | $ | 41 | $ | 50 | $ | 61 | $ | 41 | $ | 45 | $ | 47 | $ | 58 | $ | 38 | ||||||||||||||||
| (1) | Diversification benefit equals the difference between the total Management VaR and the sum of the component VaRs. This benefit arises because the simulated one-day losses for each of the components occur on different days; similar diversification benefits also are taken into account within each component. |
| (2) | The high and low VaR values for the total Management VaR and each of the component VaRs might have occurred on different days during the year, and therefore, the diversification benefit is not an applicable measure. |
| | 104 |
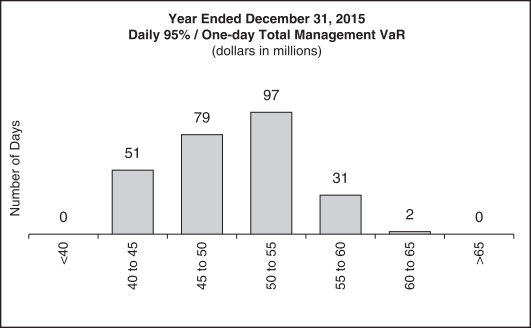
| 105 | |
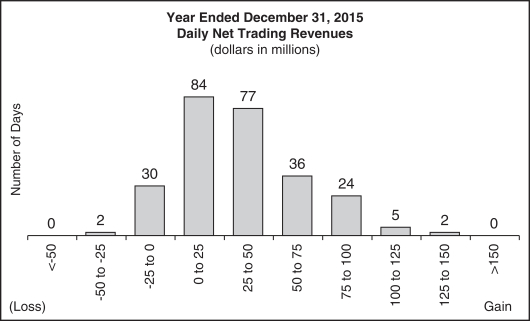 Non-trading Risks. The Company believes that sensitivity
analysis is an appropriate representation of the Company�s non-trading risks. Reflected below is this analysis covering substantially all of the non-trading risk in the Company�s portfolio. Counterparty Exposure Related to the Company�s Own
Credit Spread .����The credit spread risk sensitivity of the counterparty exposure related to the Company�s own credit spread corresponded to an increase in value of approximately $6 million for each 1 basis point
widening in the Company�s credit spread level at both December�31, 2015 and December�31, 2014. Funding Liabilities .����The credit spread risk sensitivity of the Company�s mark-to-market funding
liabilities corresponded to an increase in value of approximately $11 million and $10 million for each 1 basis point widening in the Company�s credit spread level at December�31, 2015 and December�31, 2014, respectively. Interest Rate Risk
Sensitivity .����The table below presents an analysis of selected instantaneous upward and downward parallel interest rate shocks on net interest income over the next 12 months for the Company�s U.S. Bank Subsidiaries.
These shocks are applied to the Company�s 12-month forecast for its U.S. Bank Subsidiaries, which incorporates market expectations of interest rates and the Company�s forecasted business activity, including its deposit deployment strategy
and asset-liability management hedges. Thus, the impacts are incremental to that forecast and, additionally, do not reflect the impact of the repricing of assets and liabilities beyond 12 months. As a result, impacts from an instantaneous shock can
vary significantly from period to period and can vary compared with impacts from a similar move in rates over time. For example, depending on interest rate levels and the relative sensitivity of assets and liabilities, an instantaneous increase (as
opposed to an increase over time) may have a negative or positive impact on net interest income over the subsequent 12 months. At December 31, 2015, large instantaneous interest rates shocks had a negative impact to the Company�s U.S. Bank
Subsidiaries� projected net interest income over the following 12 months due to composition of the banks� assets as well as expected deposit pricing behavior at higher levels of interest rates.
Non-trading Risks. The Company believes that sensitivity
analysis is an appropriate representation of the Company�s non-trading risks. Reflected below is this analysis covering substantially all of the non-trading risk in the Company�s portfolio. Counterparty Exposure Related to the Company�s Own
Credit Spread .����The credit spread risk sensitivity of the counterparty exposure related to the Company�s own credit spread corresponded to an increase in value of approximately $6 million for each 1 basis point
widening in the Company�s credit spread level at both December�31, 2015 and December�31, 2014. Funding Liabilities .����The credit spread risk sensitivity of the Company�s mark-to-market funding
liabilities corresponded to an increase in value of approximately $11 million and $10 million for each 1 basis point widening in the Company�s credit spread level at December�31, 2015 and December�31, 2014, respectively. Interest Rate Risk
Sensitivity .����The table below presents an analysis of selected instantaneous upward and downward parallel interest rate shocks on net interest income over the next 12 months for the Company�s U.S. Bank Subsidiaries.
These shocks are applied to the Company�s 12-month forecast for its U.S. Bank Subsidiaries, which incorporates market expectations of interest rates and the Company�s forecasted business activity, including its deposit deployment strategy
and asset-liability management hedges. Thus, the impacts are incremental to that forecast and, additionally, do not reflect the impact of the repricing of assets and liabilities beyond 12 months. As a result, impacts from an instantaneous shock can
vary significantly from period to period and can vary compared with impacts from a similar move in rates over time. For example, depending on interest rate levels and the relative sensitivity of assets and liabilities, an instantaneous increase (as
opposed to an increase over time) may have a negative or positive impact on net interest income over the subsequent 12 months. At December 31, 2015, large instantaneous interest rates shocks had a negative impact to the Company�s U.S. Bank
Subsidiaries� projected net interest income over the following 12 months due to composition of the banks� assets as well as expected deposit pricing behavior at higher levels of interest rates. | | 106 |
| At December�31,�2015 | At December�31,�2014 | |||||||
| (dollars in millions) | ||||||||
| +200 basis points | $ | (149) | $ | 256 | ||||
| +100 basis points | (84) | 204 | ||||||
| �100 basis points | (512) | (393) | ||||||
| 10% Sensitivity | ||||||||
| At December�31,�2015 | At December�31,�2014 | |||||||
| (dollars in millions) | ||||||||
| Investments related to Investment Management activities: | ||||||||
| Real estate funds | $ | 139 | $ | 175 | ||||
| Private equity and infrastructure funds | 131 | 186 | ||||||
| Traditional asset management and hedge fund investments | 101 | 109 | ||||||
| Other investments: | ||||||||
| Mitsubishi UFJ Morgan Stanley Securities Co., Ltd. | 142 | 142 | ||||||
| Other Company investments | 194 | 195 | ||||||
| � | entering into swap or other derivative contracts under which counterparties have obligations to make payments to the Company; |
| � | extending credit to clients through various lending commitments; |
| � | providing short- or long-term funding that is secured by physical or financial collateral whose value may at times be insufficient to fully cover the loan repayment amount; |
| 107 | |
| � | posting margin and/or collateral to clearinghouses, clearing agencies, exchanges, banks, securities firms and other financial counterparties; |
| � | placing funds on deposit at other financial institutions to support the Company�s clearing and settlement obligations; and |
| � | investing or trading in securities and loan pools, whereby the value of these assets may fluctuate based on realized or expected defaults on the underlying obligations or loans. |
| � | margin loans collateralized by securities; |
| � | securities-based and other forms of secured loans; and |
| � | single-family residential mortgage loans in conforming, non-conforming or home equity lines of credit (�HELOC�) form, primarily to existing Wealth Management clients. |
| | 108 |
| At December�31, 2015 | ||||||||||||
| Institutional Securities Lending | Wealth Management Lending | Total | ||||||||||
| (dollars in millions) | ||||||||||||
| Corporate loans | $ | 16,452 | $ | 7,102 | $ | 23,554 | ||||||
| Consumer loans | � | 21,528 | 21,528 | |||||||||
| Residential real estate loans | � | 20,863 | 20,863 | |||||||||
| Wholesale real estate loans | 6,839 | � | 6,839 | |||||||||
| Loans held for investment, gross of allowance | 23,291 | 49,493 | 72,784 | |||||||||
| Allowance for loan losses | (195 | ) | (30 | ) | (225 | ) | ||||||
| Loans held for investment, net of allowance | 23,096 | 49,463 | 72,559 | |||||||||
| Corporate loans | 11,924 | � | 11,924 | |||||||||
| Residential real estate loans | 45 | 59 | 104 | |||||||||
| Wholesale real estate loans | 1,172 | � | 1,172 | |||||||||
| Loans held for sale | 13,141 | 59 | 13,200 | |||||||||
| Corporate loans | 7,286 | � | 7,286 | |||||||||
| Residential real estate loans | 1,885 | � | 1,885 | |||||||||
| Wholesale real estate loans | 1,447 | � | 1,447 | |||||||||
| Loans held at fair value | 10,618 | � | 10,618 | |||||||||
| Total loans(1) | 46,855 | 49,522 | 96,377 | |||||||||
| Lending commitments(2)(3) | 95,572 | 5,821 | 101,393 | |||||||||
| Total loans and lending commitments(2)(3) | $ | 142,427 | $ | 55,343 | $ | 197,770 | ||||||
| 109 | |
| At December 31, 2014 | ||||||||||||
| Institutional Securities Lending | Wealth Management Lending | Total | ||||||||||
| (dollars in millions) | ||||||||||||
| Corporate loans | $ | 14,233 | $ | 5,426 | $ | 19,659 | ||||||
| Consumer loans | � | 16,576 | 16,576 | |||||||||
| Residential real estate loans | � | 15,735 | 15,735 | |||||||||
| Wholesale real estate loans | 5,298 | � | 5,298 | |||||||||
| Loans held for investment, gross of allowance | 19,531 | 37,737 | 57,268 | |||||||||
| Allowance for loan losses | (136 | ) | (13 | ) | (149 | ) | ||||||
| Loans held for investment, net of allowance | 19,395 | 37,724 | 57,119 | |||||||||
| Corporate loans | 8,200 | � | 8,200 | |||||||||
| Residential real estate loans | 16 | 98 | 114 | |||||||||
| Wholesale real estate loans | 1,144 | � | 1,144 | |||||||||
| Loans held for sale | 9,360 | 98 | 9,458 | |||||||||
| Corporate loans | 7,093 | � | 7,093 | |||||||||
| Residential real estate loans | 1,682 | � | 1,682 | |||||||||
| Wholesale real estate loans | 3,187 | � | 3,187 | |||||||||
| Loans held at fair value | 11,962 | � | 11,962 | |||||||||
| Total loans(1) | 40,717 | 37,822 | 78,539 | |||||||||
| Lending commitments(2)(3) | 87,000 | 4,914 | 91,914 | |||||||||
| Total loans and lending commitments(2)(3) | $ | 127,717 | $ | 42,736 | $ | 170,453 | ||||||
| (1) | Amounts exclude $25.3 billion and $29.0 billion related to margin loans and $4.9 billion and $5.1 billion related to employee loans at December�31, 2015 and December�31, 2014, respectively. See Notes 6 and 7 to the consolidated financial statements in Item�8 for further information. |
| (2) | Lending commitments represent the notional amount of legally binding obligations to provide funding to clients for all lending transactions. Since commitments associated with these business activities may expire unused or may not be utilized to full capacity, they do not necessarily reflect the actual future cash funding requirements. |
| (3) | For syndications led by the Company, the lending commitments accepted by the borrower but not yet closed are net of the amounts agreed to by counterparties that will participate in the syndication. For syndications that the Company participates in and does not lead, lending commitments accepted by the borrower but not yet closed include only the amount that the Company expects it will be allocated from the lead, syndicate bank. Due to the nature of the Company�s obligations under the commitments, these amounts include certain commitments participated to third parties. |
| | 110 |
| At December�31, 2015 | ||||||||||||||||||||
| Years to Maturity | ||||||||||||||||||||
| Less�than�1 | 1-3 | 3-5 | Over 5 | Total | ||||||||||||||||
| (dollars in millions) | ||||||||||||||||||||
| AAA | $ | 287 | $ | 24 | $ | 50 | $ | � | $ | 361 | ||||||||||
| AA | 5,022 | 2,553 | 3,735 | 63 | 11,373 | |||||||||||||||
| A | 3,996 | 5,726 | 11,993 | 1,222 | 22,937 | |||||||||||||||
| BBB | 5,089 | 16,720 | 23,248 | 4,086 | 49,143 | |||||||||||||||
| Investment grade | 14,394 | 25,023 | 39,026 | 5,371 | 83,814 | |||||||||||||||
| Non-investment grade | 7,768 | 15,863 | 22,818 | 7,779 | 54,228 | |||||||||||||||
| Unrated(2) | 930 | 1,091 | 246 | 2,118 | 4,385 | |||||||||||||||
| Total | $ | 23,092 | $ | 41,977 | $ | 62,090 | $ | 15,268 | $ | 142,427 | ||||||||||
| At December�31, 2014 | ||||||||||||||||||||
| Years to Maturity | ||||||||||||||||||||
| Less�than�1 | 1-3 | 3-5 | Over 5 | Total | ||||||||||||||||
| (dollars in millions) | ||||||||||||||||||||
| AAA | $ | 275 | $ | 74 | $ | 37 | $ | � | $ | 386 | ||||||||||
| AA | 3,760 | 3,025 | 4,580 | � | 11,365 | |||||||||||||||
| A | 2,135 | 5,060 | 12,090 | 657 | 19,942 | |||||||||||||||
| BBB | 4,710 | 11,902 | 23,740 | 3,035 | 43,387 | |||||||||||||||
| Investment grade | 10,880 | 20,061 | 40,447 | 3,692 | 75,080 | |||||||||||||||
| Non-investment grade | 6,161 | 14,645 | 20,716 | 7,386 | 48,908 | |||||||||||||||
| Unrated(2) | 128 | 906 | 235 | 2,460 | 3,729 | |||||||||||||||
| Total | $ | 17,169 | $ | 35,612 | $ | 61,398 | $ | 13,538 | $ | 127,717 | ||||||||||
| (1) | Obligor credit ratings are determined by the Credit Risk Management Department. |
| (2) | Unrated loans and lending commitments are primarily trading positions that are measured at fair value and risk managed as a component of Market Risk. For a further discussion of the Company�s Market Risk, see �Quantitative and Qualitative Disclosures about Market Risk�Risk Management� in Part II, Item�7A. |
| 111 | |
| Industry(1) | At�December�31,�2015 | At�December�31,�2014 | ||||||
| (dollars in millions) | ||||||||
| Real estate | $ | 17,847 | $ | 16,867 | ||||
| Energy | 15,921 | 14,926 | ||||||
| Healthcare | 12,677 | 10,203 | ||||||
| Utilities | 12,631 | 11,986 | ||||||
| Consumer discretionary | 12,098 | 11,755 | ||||||
| Funds, exchanges and other financial services(2) | 11,649 | 9,949 | ||||||
| Information technology | 11,122 | 7,931 | ||||||
| Industrials | 10,018 | 9,896 | ||||||
| Consumer staples | 8,597 | 7,584 | ||||||
| Mortgage finance | 8,260 | 6,516 | ||||||
| Materials | 6,440 | 5,357 | ||||||
| Insurance | 4,682 | 3,313 | ||||||
| Telecommunications services | 4,403 | 4,484 | ||||||
| Special purpose vehicles | 3,482 | 3,326 | ||||||
| Consumer finance | 977 | 1,065 | ||||||
| Other | 1,623 | 2,559 | ||||||
| Total | $ | 142,427 | $ | 127,717 | ||||
| (1) | Industry categories are based on the Global Industry Classification Standard�. |
| (2) | Includes mutual funds, pension funds, private equity and real estate funds, exchanges and clearinghouses, and diversified financial services. |
| | 112 |
| At December�31, 2015 | ||||||||||||||||||||
| Years to Maturity | ||||||||||||||||||||
| Less�than�1 | 1-3 | 3-5 | Over 5 | Total | ||||||||||||||||
| (dollars in millions) | ||||||||||||||||||||
| Securities-based lending and other loans | $ | 25,975 | $ | 1,004 | $ | 889 | $ | 749 | $ | 28,617 | ||||||||||
| Residential real estate loans | � | � | 35 | 20,870 | 20,905 | |||||||||||||||
| Total | $ | 25,975 | $ | 1,004 | $ | 924 | $ | 21,619 | $ | 49,522 | ||||||||||
| Lending commitments | 5,143 | 286 | 115 | 277 | 5,821 | |||||||||||||||
| Total loans and lending commitments | $ | 31,118 | $ | 1,290 | $ | 1,039 | $ | 21,896 | $ | 55,343 | ||||||||||
| At December�31, 2014 | ||||||||||||||||||||
| Years to Maturity | ||||||||||||||||||||
| Less�than�1 | 1-3 | 3-5 | Over 5 | Total | ||||||||||||||||
| (dollars in millions) | ||||||||||||||||||||
| Securities-based lending and other loans | $ | 19,408 | $ | 1,071 | $ | 750 | $ | 768 | $ | 21,997 | ||||||||||
| Residential real estate loans | � | � | � | 15,825 | 15,825 | |||||||||||||||
| Total | $ | 19,408 | $ | 1,071 | $ | 750 | $ | 16,593 | $ | 37,822 | ||||||||||
| Lending commitments | 4,192 | 290 | 131 | 301 | 4,914 | |||||||||||||||
| Total loans and lending commitments | $ | 23,600 | $ | 1,361 | $ | 881 | $ | 16,894 | $ | 42,736 | ||||||||||
| 113 | |
| At December�31, 2015 | ||||||||||||||||||||
| Fair Values(1) | Notionals | |||||||||||||||||||
| Receivable | Payable | Net | Protection Purchased | Protection Sold | ||||||||||||||||
| (dollars in millions) | ||||||||||||||||||||
| Banks and securities firms | $ | 16,962 | $ | 17,295 | $ | (333) | $ | 533,557 | $ | 491,267 | ||||||||||
| Insurance and other financial institutions | 5,842 | 6,247 | (405) | 189,439 | 194,723 | |||||||||||||||
| Non-financial entities | 115 | 123 | (8) | 5,932 | 3,529 | |||||||||||||||
| Total | $ | 22,919 | $ | 23,665 | $ | (746) | $ | 728,928 | $ | 689,519 | ||||||||||
| | 114 |
| At December�31, 2014 | ||||||||||||||||||||
| Fair Values(1) | Notionals | |||||||||||||||||||
| Receivable | Payable | Net | Protection Purchased | Protection Sold | ||||||||||||||||
| (dollars in millions) | ||||||||||||||||||||
| Banks and securities firms | $ | 25,452 | $ | 25,323 | $ | 129 | $ | 712,466 | $ | 687,155 | ||||||||||
| Insurance and other financial institutions | 6,639 | 6,697 | (58) | 216,489 | 217,201 | |||||||||||||||
| Non-financial entities | 91 | 89 | 2 | 5,049 | 3,706 | |||||||||||||||
| Total | $ | 32,182 | $ | 32,109 | $ | 73 | $ | 934,004 | $ | 908,062 | ||||||||||
| (1) | The Company�s CDS are classified in either Level 2 or Level 3 of the fair value hierarchy. Approximately 3% and 4% of receivable fair values and 6% and 7% of payable fair values represented Level 3 amounts at December�31, 2015 and December�31, 2014, respectively (see Note 3 to the consolidated financial statements in Item�8). |
| Industry(1) | At�December�31,�2015 | At�December�31,�2014 | ||||||
| (dollars in millions) | ||||||||
| Utilities | $ | 3,920 | $ | 3,797 | ||||
| Industrials | 2,635 | 2,278 | ||||||
| Funds, exchanges and other financial services(2) | 2,322 | 3,638 | ||||||
| Banks and securities firms | 1,912 | 3,297 | ||||||
| Regional governments | 1,329 | 1,603 | ||||||
| Healthcare | 1,190 | 1,365 | ||||||
| Not-for-profit organizations | 908 | 905 | ||||||
| Consumer discretionary | 829 | 423 | ||||||
| Special purpose vehicles | 821 | 1,089 | ||||||
| Sovereign governments | 599 | 889 | ||||||
| Consumer staples | 578 | 650 | ||||||
| Materials | 540 | 591 | ||||||
| Energy | 453 | 575 | ||||||
| Other | 975 | 1,127 | ||||||
| Total(3) | $ | 19,011 | $ | 22,227 | ||||
| (1) | Industry categories are based on the Global Industry Classification Standard�. |
| (2) | Amounts include mutual funds, pension funds, private equity and real estate funds, exchanges and clearinghouses, and diversified financial services. |
| (3) | For further information on derivative instruments and hedging activities, see Note 4 to the consolidated financial statements in Item�8. |
| 115 | |
| | 116 |
| Country | Net�Inventory(1) | Net Counterparty Exposure(2)(3) | Loans | Lending Commitments | Exposure�Before Hedges | Hedges(4) | Net�Exposure(5) | |||||||||||||||||||||
| (dollars in millions) | ||||||||||||||||||||||||||||
| United Kingdom: | ||||||||||||||||||||||||||||
| Sovereigns | $ | (88) | $ | 56 | $ | � | $ | � | $ | (32) | $ | (166) | $ | (198) | ||||||||||||||
| Non-sovereigns | 654 | 10,649 | 4,643 | 7,161 | 23,107 | (1,722) | 21,385 | |||||||||||||||||||||
| Subtotal | $ | 566 | $ | 10,705 | $ | 4,643 | $ | 7,161 | $ | 23,075 | $ | (1,888) | $ | 21,187 | ||||||||||||||
| Brazil: | ||||||||||||||||||||||||||||
| Sovereigns | $ | 3,536 | $ | � | $ | � | $ | � | $ | 3,536 | $ | � | $ | 3,536 | ||||||||||||||
| Non-sovereigns | (28) | 519 | 1,097 | 87 | 1,675 | (650) | 1,025 | |||||||||||||||||||||
| Subtotal | $ | 3,508 | $ | 519 | $ | 1,097 | $ | 87 | $ | 5,211 | $ | (650) | $ | 4,561 | ||||||||||||||
| China: | ||||||||||||||||||||||||||||
| Sovereigns | $ | 616 | $ | 166 | $ | � | $ | � | $ | 782 | $ | (508) | $ | 274 | ||||||||||||||
| Non-sovereigns | 1,423 | 404 | 956 | 262 | 3,045 | (64) | 2,981 | |||||||||||||||||||||
| Subtotal | $ | 2,039 | $ | 570 | $ | 956 | $ | 262 | $ | 3,827 | $ | (572) | $ | 3,255 | ||||||||||||||
| Italy: | ||||||||||||||||||||||||||||
| Sovereigns | $ | 1,950 | $ | (19) | $ | � | $ | � | $ | 1,931 | $ | (61) | $ | 1,870 | ||||||||||||||
| Non-sovereigns | 174 | 661 | 9 | 667 | 1,511 | (198) | 1,313 | |||||||||||||||||||||
| Subtotal | $ | 2,124 | $ | 642 | $ | 9 | $ | 667 | $ | 3,442 | $ | (259) | $ | 3,183 | ||||||||||||||
| Canada: | ||||||||||||||||||||||||||||
| Sovereigns | $ | (61) | $ | 90 | $ | � | $ | � | $ | 29 | $ | � | $ | 29 | ||||||||||||||
| Non-sovereigns | (143) | 1,661 | 239 | 1,550 | 3,307 | (163) | 3,144 | |||||||||||||||||||||
| Subtotal | $ | (204) | $ | 1,751 | $ | 239 | $ | 1,550 | $ | 3,336 | $ | (163) | $ | 3,173 | ||||||||||||||
| Singapore: | ||||||||||||||||||||||||||||
| Sovereigns | $ | 1,950 | $ | 197 | $ | � | $ | � | $ | 2,147 | $ | � | $ | 2,147 | ||||||||||||||
| Non-sovereigns | 76 | 278 | 48 | 122 | 524 | (30) | 494 | |||||||||||||||||||||
| Subtotal | $ | 2,026 | $ | 475 | $ | 48 | $ | 122 | $ | 2,671 | $ | (30) | $ | 2,641 | ||||||||||||||
| France: | ||||||||||||||||||||||||||||
| Sovereigns | $ | (682) | $ | � | $ | � | $ | � | $ | (682) | $ | � | $ | (682) | ||||||||||||||
| Non-sovereigns | (103) | 1,751 | 14 | 2,310 | 3,972 | (1,149) | 2,823 | |||||||||||||||||||||
| Subtotal | $ | (785) | $ | 1,751 | $ | 14 | $ | 2,310 | $ | 3,290 | $ | (1,149) | $ | 2,141 | ||||||||||||||
| United Arab Emirates: | ||||||||||||||||||||||||||||
| Sovereigns | $ | 2 | $ | 1,162 | $ | � | $ | � | $ | 1,164 | $ | (56) | $ | 1,108 | ||||||||||||||
| Non-sovereigns | (95) | 455 | 181 | 350 | 891 | (16) | 875 | |||||||||||||||||||||
| Subtotal | $ | (93) | $ | 1,617 | $ | 181 | $ | 350 | $ | 2,055 | $ | (72) | $ | 1,983 | ||||||||||||||
| Netherlands: | ||||||||||||||||||||||||||||
| Sovereigns | $ | (71) | $ | � | $ | � | $ | � | $ | (71) | $ | � | $ | (71) | ||||||||||||||
| Non-sovereigns | 267 | 623 | 188 | 1,230 | 2,308 | (280) | 2,028 | |||||||||||||||||||||
| Subtotal | $ | 196 | $ | 623 | $ | 188 | $ | 1,230 | $ | 2,237 | $ | (280) | $ | 1,957 | ||||||||||||||
| Australia: | ||||||||||||||||||||||||||||
| Sovereigns | $ | (115) | $ | 21 | $ | � | $ | � | $ | (94) | $ | � | $ | (94) | ||||||||||||||
| Non-sovereigns | 449 | 348 | 168 | 875 | 1,840 | (123) | 1,717 | |||||||||||||||||||||
| Subtotal | $ | 334 | $ | 369 | $ | 168 | $ | 875 | $ | 1,746 | $ | (123) | $ | 1,623 | ||||||||||||||
| (1) | Net inventory represents exposure to both long and short single-name and index positions ( i.e. , bonds and equities at fair value and CDS based on a notional amount assuming zero recovery adjusted for any fair value receivable or payable). As a market maker, the Company transacts in these CDS positions to facilitate client trading. At December�31, 2015, gross purchased protection, gross written protection, and net exposures related to single-name and index credit derivatives for those countries were $(164.9) billion, $161.5 billion and $(3.4) billion, respectively. For a further description of the triggers for purchased credit protection and whether those triggers may limit the effectiveness of the Company�s hedges, see �Credit Exposure�Derivatives� herein. |
| (2) | Net counterparty exposure ( i.e ., repurchase transactions, securities lending and OTC derivatives) takes into consideration legally enforceable master netting agreements and collateral. |
| 117 | |
| (3) | At December�31, 2015, the benefit of collateral received against counterparty credit exposure was $10.4 billion in the United Kingdom (�U.K.�), with 99% of collateral consisting of cash and U.K. and U.S. government obligations, and $5.9 billion in France with 99% of collateral consisting of cash and government obligations of France. The benefit of collateral received against counterparty credit exposure in the other countries totaled approximately $7.0 billion, with collateral primarily consisting of cash and government obligations of Germany, U.S. and France. These amounts do not include collateral received on secured financing transactions. |
| (4) | Amounts represent CDS hedges (purchased and sold) on net counterparty exposure and lending executed by trading desks responsible for hedging counterparty and lending credit risk exposures for the Company. Amounts are based on the CDS notional amount assuming zero recovery adjusted for any fair value receivable or payable. |
| (5) | In addition, at December�31, 2015, the Company had exposure to these countries for overnight deposits with banks of approximately $4.3 billion. |
| | 118 |
| 119 | |
| | 120 |
| Item�8. | Financial Statements and Supplementary Data. |
| /s/ Deloitte�& Touche LLP |
| New York, New York |
| February 23, 2016 |
| 2015 | 2014 | 2013 | ||||||||||
| Revenues: | ||||||||||||
| Investment banking | $ | 5,594 | $ | 5,948 | $ | 5,246 | ||||||
| Trading | 10,114 | 9,377 | 9,359 | |||||||||
| Investments | 541 | 836 | 1,777 | |||||||||
| Commissions and fees | 4,554 | 4,713 | 4,629 | |||||||||
| Asset management, distribution and administration fees | 10,766 | 10,570 | 9,638 | |||||||||
| Other | 493 | 1,096 | 1,066 | |||||||||
| Total non-interest revenues | 32,062 | 32,540 | 31,715 | |||||||||
| Interest income | 5,835 | 5,413 | 5,209 | |||||||||
| Interest expense | 2,742 | 3,678 | 4,431 | |||||||||
| Net interest | 3,093 | 1,735 | 778 | |||||||||
| Net revenues | 35,155 | 34,275 | 32,493 | |||||||||
| Non-interest expenses: | ||||||||||||
| Compensation and benefits | 16,016 | 17,824 | 16,277 | |||||||||
| Occupancy and equipment | 1,382 | 1,433 | 1,499 | |||||||||
| Brokerage, clearing and exchange fees | 1,892 | 1,806 | 1,711 | |||||||||
| Information processing and communications | 1,767 | 1,635 | 1,768 | |||||||||
| Marketing and business development | 681 | 658 | 638 | |||||||||
| Professional services | 2,298 | 2,117 | 1,894 | |||||||||
| Other | 2,624 | 5,211 | 4,148 | |||||||||
| Total non-interest expenses | 26,660 | 30,684 | 27,935 | |||||||||
| Income from continuing operations before income taxes | 8,495 | 3,591 | 4,558 | |||||||||
| Provision for (benefits from) income taxes | 2,200 | (90) | 902 | |||||||||
| Income from continuing operations | 6,295 | 3,681 | 3,656 | |||||||||
| Discontinued operations: | ||||||||||||
| Income (loss) from discontinued operations before income taxes | (23) | (19) | (72) | |||||||||
| Provision for (benefit from) income taxes | (7) | (5) | (29) | |||||||||
| Income (loss) from discontinued operations | (16) | (14) | (43) | |||||||||
| Net income | $ | 6,279 | $ | 3,667 | $ | 3,613 | ||||||
| Net income applicable to redeemable noncontrolling interests | � | � | 222 | |||||||||
| Net income applicable to nonredeemable noncontrolling interests | 152 | 200 | 459 | |||||||||
| Net income applicable to Morgan Stanley | $ | 6,127 | $ | 3,467 | $ | 2,932 | ||||||
| Preferred stock dividends and other | 456 | 315 | 277 | |||||||||
| Earnings applicable to Morgan Stanley common shareholders | $ | 5,671 | $ | 3,152 | $ | 2,655 | ||||||
| Earnings per basic common share: | ||||||||||||
| Income from continuing operations | $ | 2.98 | $ | 1.65 | $ | 1.42 | ||||||
| Income (loss) from discontinued operations | (0.01) | (0.01) | (0.03) | |||||||||
| Earnings per basic common share | $ | 2.97 | $ | 1.64 | $ | 1.39 | ||||||
| Earnings per diluted common share: | ||||||||||||
| Income from continuing operations | $ | 2.91 | $ | 1.61 | $ | 1.38 | ||||||
| Income (loss) from discontinued operations | (0.01) | (0.01) | (0.02) | |||||||||
| Earnings per diluted common share | $ | 2.90 | $ | 1.60 | $ | 1.36 | ||||||
| Dividends declared per common share | $ | 0.55 | $ | 0.35 | $ | 0.20 | ||||||
| Average common shares outstanding: | ||||||||||||
| Basic | 1,909,116,527 | 1,923,805,397 | 1,905,823,882 | |||||||||
| Diluted | 1,952,815,453 | 1,970,535,560 | 1,956,519,738 | |||||||||
| | 122 |
| 2015 | 2014 | 2013 | ||||||||||
| Net income | $ | 6,279 | $ | 3,667 | $ | 3,613 | ||||||
| Other comprehensive income (loss), net of tax: | ||||||||||||
| Foreign currency translation adjustments(1) | $ | (304) | $ | (491) | $ | (348) | ||||||
| Change in net unrealized gains (losses) on available for sale securities(2) | (246) | 209 | (433) | |||||||||
| Pension, postretirement and other(3) | 138 | 33 | (1) | |||||||||
| Total other comprehensive income (loss) | $ | (412) | $ | (249) | $ | (782) | ||||||
| Comprehensive income | $ | 5,867 | $ | 3,418 | $ | 2,831 | ||||||
| Net income applicable to redeemable noncontrolling interests | � | � | 222 | |||||||||
| Net income applicable to nonredeemable noncontrolling interests | 152 | 200 | 459 | |||||||||
| Other comprehensive income (loss) applicable to nonredeemable noncontrolling interests | (4) | (94) | (205) | |||||||||
| Comprehensive income applicable to Morgan Stanley | $ | 5,719 | $ | 3,312 | $ | 2,355 | ||||||
| (1) | Amounts include provision for (benefit from) income taxes of $185 million, $352 million and $351 million for 2015, 2014 and 2013, respectively. |
| (2) | Amounts include provision for (benefit from) income taxes of $(143) million, $142 million and $(296) million for 2015, 2014 and 2013, respectively. |
| (3) | Amounts include provision for (benefit from) income taxes of $73 million, $20 million and $11 million for 2015, 2014 and 2013, respectively. |
| 123 | |
| December�31, 2015 | December�31, 2014 | |||||||
| Assets | ||||||||
| Cash and due from banks ($14 and $45 at December�31, 2015 and December�31, 2014, respectively, related to consolidated variable interest entities, generally not available to the Company) | $ | 19,827 | $ | 21,381 | ||||
| Interest bearing deposits with banks | 34,256 | 25,603 | ||||||
| Cash deposited with clearing organizations or segregated under federal and other regulations or requirements ($186 and $149 at December�31, 2015 and December�31, 2014, respectively, related to consolidated variable interest entities, generally not available to the Company) | 31,469 | 40,607 | ||||||
| Trading assets, at fair value ($127,627 and $127,342 were pledged to various parties at December�31, 2015 and December�31, 2014, respectively) ($722 and $966 at December�31, 2015 and December�31, 2014, respectively, related to consolidated variable interest entities, generally not available to the Company) | 228,280 | 256,801 | ||||||
| Investment securities (includes $66,759 and $69,216 at fair value at December�31, 2015 and December�31, 2014, respectively) | 71,983 | 69,316 | ||||||
| Securities received as collateral, at fair value | 11,225 | 21,316 | ||||||
| Securities purchased under agreements to resell (includes $806 and $1,113 at fair value at December�31, 2015 and December�31, 2014, respectively) | 87,657 | 83,288 | ||||||
| Securities borrowed | 142,416 | 136,708 | ||||||
| Customer and other receivables | 45,407 | 48,961 | ||||||
| Loans: | ||||||||
| Held for investment (net of allowances of $225 and $149 at December�31, 2015 and December�31, 2014, respectively) | 72,559 | 57,119 | ||||||
| Held for sale | 13,200 | 9,458 | ||||||
| Other investments ($328 and $467 at December�31, 2015 and December�31, 2014, respectively, related to consolidated variable interest entities, generally not available to the Company) | 4,202 | 4,355 | ||||||
| Premises, equipment and software costs (net of accumulated depreciation of $7,140 and $6,219 at December�31, 2015 and December�31, 2014, respectively) ($183 and $191 at December�31, 2015 and December�31, 2014, respectively, related to consolidated variable interest entities, generally not available to the Company) | 6,373 | 6,108 | ||||||
| Goodwill | 6,584 | 6,588 | ||||||
| Intangible assets (net of accumulated amortization of $2,130 and $1,824 at December�31, 2015 and December�31, 2014, respectively) (includes $5 and $6 at fair value at December�31, 2015 and December�31, 2014, respectively) | 2,984 | 3,159 | ||||||
| Other assets ($47 and $59 at December�31, 2015 and December�31, 2014, respectively, related to consolidated variable interest entities, generally not available to the Company) | 9,043 | 10,742 | ||||||
| Total assets | $ | 787,465 | $ | 801,510 | ||||
| Liabilities | ||||||||
| Deposits (includes $125 at fair value at December�31, 2015). | $ | 156,034 | $ | 133,544 | ||||
| Short-term borrowings (includes $1,648 and $1,765 at fair value at December�31, 2015 and December�31, 2014, respectively) | 2,173 | 2,261 | ||||||
| Trading liabilities, at fair value | 109,139 | 107,381 | ||||||
| Obligation to return securities received as collateral, at fair value | 19,316 | 25,685 | ||||||
| Securities sold under agreements to repurchase (includes $683 and $612 at fair value at December�31, 2015 and December�31, 2014, respectively) | 36,692 | 69,949 | ||||||
| Securities loaned | 19,358 | 25,219 | ||||||
| Other secured financings (includes $2,854 and $4,504 at fair value at December�31, 2015 and December�31, 2014, respectively) ($432 and $348 at December�31, 2015 and December�31, 2014, respectively, related to consolidated variable interest entities, generally non-recourse to the Company) | 9,464 | 12,085 | ||||||
| Customer and other payables | 186,626 | 181,069 | ||||||
| Other liabilities and accrued expenses ($4 and $72 at December�31, 2015 and December�31, 2014, respectively, related to consolidated variable interest entities, generally non-recourse to the Company) | 18,711 | 19,441 | ||||||
| Long-term borrowings (includes $33,045 and $31,774 at fair value at December�31, 2015 and December�31, 2014, respectively) | 153,768 | 152,772 | ||||||
| Total liabilities | 711,281 | 729,406 | ||||||
| Commitments and contingent liabilities (see Note 12) | ||||||||
| Equity | ||||||||
| Morgan Stanley shareholders� equity: | ||||||||
| Preferred stock (see Note 15) | 7,520 | 6,020 | ||||||
| Common stock, $0.01 par value: | ||||||||
| Shares authorized: 3,500,000,000 at December�31, 2015 and December�31, 2014; | ||||||||
| Shares issued: 2,038,893,979 at December�31, 2015 and December�31, 2014; | ||||||||
| Shares outstanding: 1,920,024,027 and 1,950,980,142 at December�31, 2015 and December�31, 2014, respectively | 20 | 20 | ||||||
| Additional paid-in capital | 24,153 | 24,249 | ||||||
| Retained earnings | 49,204 | 44,625 | ||||||
| Employee stock trusts | 2,409 | 2,127 | ||||||
| Accumulated other comprehensive loss | (1,656) | (1,248) | ||||||
| Common stock held in treasury, at cost, $0.01 par value: | ||||||||
| Shares outstanding: 118,869,952 and 87,913,837 at December�31, 2015 and December�31, 2014, respectively | (4,059) | (2,766) | ||||||
| Common stock issued to employee stock trusts | (2,409) | (2,127) | ||||||
| Total Morgan Stanley shareholders� equity | 75,182 | 70,900 | ||||||
| Nonredeemable noncontrolling interests | 1,002 | 1,204 | ||||||
| Total equity | 76,184 | 72,104 | ||||||
| Total liabilities and equity | $ | 787,465 | $ | 801,510 | ||||
| | 124 |
| Preferred Stock | Common Stock | Additional Paid-in Capital | Retained Earnings | Employee Stock Trusts | Accumulated Other Comprehensive Income (Loss) | Common Stock Held in Treasury at Cost | Common Stock Issued to Employee Stock Trusts | Non- redeemable Non- controlling Interests | Total Equity | |||||||||||||||||||||||||||||||
| BALANCE AT DECEMBER 31, 2012 | $ | 1,508 | $ | 20 | $ | 23,426 | $ | 39,912 | $ | 2,932 | $ | (516 | ) | $ | (2,241 | ) | $ | (2,932 | ) | $ | 3,319 | $ | 65,428 | |||||||||||||||||
| Net income applicable to Morgan Stanley | � | � | � | 2,932 | � | � | � | � | � | 2,932 | ||||||||||||||||||||||||||||||
| Net income applicable to nonredeemable noncontrolling interests | � | � | � | � | � | � | � | � | 459 | 459 | ||||||||||||||||||||||||||||||
| Dividends | � | � | � | (521 | ) | � | � | � | � | � | (521 | ) | ||||||||||||||||||||||||||||
| Shares issued under employee plans and related tax effects | � | � | 1,160 | � | (1,214 | ) | � | (36 | ) | 1,214 | � | 1,124 | ||||||||||||||||||||||||||||
| Repurchases of common stock and employee tax withholdings | � | � | � | � | � | � | (691 | ) | � | � | (691 | ) | ||||||||||||||||||||||||||||
| Net change in Accumulated other comprehensive income | � | � | � | � | � | (577 | ) | � | � | (205 | ) | (782 | ) | |||||||||||||||||||||||||||
| Issuance of preferred stock | 1,712 | � | (16 | ) | � | � | � | � | � | � | 1,696 | |||||||||||||||||||||||||||||
| Wealth Management JV redemption value adjustment | � | � | � | (151 | ) | � | � | � | � | � | (151 | ) | ||||||||||||||||||||||||||||
| Other net decreases | � | � | � | � | � | � | � | � | (464 | ) | (464 | ) | ||||||||||||||||||||||||||||
| BALANCE AT DECEMBER 31, 2013 | 3,220 | 20 | 24,570 | 42,172 | 1,718 | (1,093 | ) | (2,968 | ) | (1,718 | ) | 3,109 | 69,030 | |||||||||||||||||||||||||||
| Net income applicable to Morgan Stanley | � | � | � | 3,467 | � | � | � | � | � | 3,467 | ||||||||||||||||||||||||||||||
| Net income applicable to nonredeemable noncontrolling interests | � | � | � | � | � | � | � | � | 200 | 200 | ||||||||||||||||||||||||||||||
| Dividends | � | � | � | (1,014 | ) | � | � | � | � | � | (1,014 | ) | ||||||||||||||||||||||||||||
| Shares issued under employee plans and related tax effects | � | � | (294 | ) | � | 409 | � | 1,660 | (409 | ) | � | 1,366 | ||||||||||||||||||||||||||||
| Repurchases of common stock and employee tax withholdings | � | � | � | � | � | � | (1,458 | ) | � | � | (1,458 | ) | ||||||||||||||||||||||||||||
| Net change in Accumulated other comprehensive income | � | � | � | � | � | (155 | ) | � | � | (94 | ) | (249 | ) | |||||||||||||||||||||||||||
| Issuance of preferred stock | 2,800 | � | (18 | ) | � | � | � | � | � | � | 2,782 | |||||||||||||||||||||||||||||
| Deconsolidation of certain legal entities associated with a real estate fund | � | � | � | � | � | � | � | � | (1,606 | ) | (1,606 | ) | ||||||||||||||||||||||||||||
| Other net decreases | � | � | (9 | ) | � | � | � | � | � | (405 | ) | (414 | ) | |||||||||||||||||||||||||||
| BALANCE AT DECEMBER 31, 2014 | 6,020 | 20 | 24,249 | 44,625 | 2,127 | (1,248 | ) | (2,766 | ) | (2,127 | ) | 1,204 | 72,104 | |||||||||||||||||||||||||||
| Net income applicable to Morgan Stanley | � | � | � | 6,127 | � | � | � | � | � | 6,127 | ||||||||||||||||||||||||||||||
| Net income applicable to nonredeemable noncontrolling interests | � | � | � | � | � | � | � | � | 152 | 152 | ||||||||||||||||||||||||||||||
| Dividends | � | � | � | (1,548 | ) | � | � | � | � | � | (1,548 | ) | ||||||||||||||||||||||||||||
| Shares issued under employee plans and related tax effects | � | � | (79 | ) | � | 282 | � | 1,480 | (282 | ) | � | 1,401 | ||||||||||||||||||||||||||||
| Repurchases of common stock and employee tax withholdings | � | � | � | � | � | � | (2,773 | ) | � | � | (2,773 | ) | ||||||||||||||||||||||||||||
| Net change in Accumulated other comprehensive income | � | � | � | � | � | (408 | ) | � | � | (4 | ) | (412 | ) | |||||||||||||||||||||||||||
| Issuance of preferred stock | 1,500 | � | (7 | ) | � | � | � | � | � | � | 1,493 | |||||||||||||||||||||||||||||
| Deconsolidation of certain legal entities associated with a real estate fund | � | � | � | � | � | � | � | � | (191 | ) | (191 | ) | ||||||||||||||||||||||||||||
| Other net decreases | � | � | (10 | ) | � | � | � | � | � | (159 | ) | (169 | ) | |||||||||||||||||||||||||||
| BALANCE AT DECEMBER 31, 2015 | $ | 7,520 | $ | 20 | $ | 24,153 | $ | 49,204 | $ | 2,409 | $ | (1,656 | ) | $ | (4,059 | ) | $ | (2,409 | ) | $ | 1,002 | $ | 76,184 | |||||||||||||||||
| 125 | |
| 2015 | 2014 | 2013 | ||||||||||
| CASH FLOWS FROM OPERATING ACTIVITIES | ||||||||||||
| Net income | $ | 6,279 | $ | 3,667 | $ | 3,613 | ||||||
| Adjustments to reconcile net income to net cash provided by (used for) operating activities: | ||||||||||||
| Deferred income taxes | 1,189 | (231 | ) | (117 | ) | |||||||
| Income from equity method investments | (114 | ) | (156 | ) | (451 | ) | ||||||
| Compensation payable in common stock and options | 1,104 | 1,260 | 1,180 | |||||||||
| Depreciation and amortization | 1,433 | 1,161 | 1,511 | |||||||||
| Net gain on sale of available for sale securities | (84 | ) | (40 | ) | (45 | ) | ||||||
| Impairment charges | 69 | 111 | 198 | |||||||||
| Provision for credit losses on lending activities | 123 | 23 | 110 | |||||||||
| Other operating adjustments | 322 | (72 | ) | 142 | ||||||||
| Changes in assets and liabilities: | ||||||||||||
| Cash deposited with clearing organizations or segregated under federal and other regulations or requirements | 9,138 | (1,404 | ) | (8,233 | ) | |||||||
| Trading assets, net of Trading liabilities | 29,471 | 20,619 | (23,598 | ) | ||||||||
| Securities borrowed | (5,708 | ) | (7,001 | ) | (8,006 | ) | ||||||
| Securities loaned | (5,861 | ) | (7,580 | ) | (4,050 | ) | ||||||
| Customer and other receivables and other assets | (434 | ) | 3,608 | 6,774 | ||||||||
| Customer and other payables and other liabilities | 4,373 | 27,971 | 26,697 | |||||||||
| Securities purchased under agreements to resell | (4,369 | ) | 34,842 | 16,282 | ||||||||
| Securities sold under agreements to repurchase | (33,257 | ) | (75,692 | ) | 23,002 | |||||||
| Net cash provided by operating activities | 3,674 | 1,086 | 35,009 | |||||||||
| CASH FLOWS FROM INVESTING ACTIVITIES | ||||||||||||
| Proceeds from (payments for): | ||||||||||||
| Premises, equipment and software, net | (1,373 | ) | (992 | ) | (1,316 | ) | ||||||
| Business dispositions, net of cash disposed | 998 | 989 | 1,147 | |||||||||
| Changes in loans, net | (15,816 | ) | (20,116 | ) | (10,057 | ) | ||||||
| Investment securities: | ||||||||||||
| Purchases | (47,291 | ) | (32,623 | ) | (30,557 | ) | ||||||
| Proceeds from sales | 37,926 | 12,980 | 11,425 | |||||||||
| Proceeds from paydowns and maturities | 5,663 | 4,651 | 4,757 | |||||||||
| Other investing activities | (102 | ) | (213 | ) | 140 | |||||||
| Net cash used for investing activities | (19,995 | ) | (35,324 | ) | (24,461 | ) | ||||||
| CASH FLOWS FROM FINANCING ACTIVITIES | ||||||||||||
| Net proceeds from (payments for): | ||||||||||||
| Short-term borrowings | (88 | ) | 119 | 4 | ||||||||
| Nonredeemable noncontrolling interests | (96 | ) | (189 | ) | (557 | ) | ||||||
| Other secured financings | (2,370 | ) | (2,189 | ) | (10,726 | ) | ||||||
| Deposits | 22,490 | 21,165 | 29,113 | |||||||||
| Proceeds from: | ||||||||||||
| Excess tax benefits associated with stock-based awards | 211 | 101 | 10 | |||||||||
| Derivatives financing activities | 512 | 855 | 1,003 | |||||||||
| Issuance of preferred stock, net of issuance costs | 1,493 | 2,782 | 1,696 | |||||||||
| Issuance of long-term borrowings | 34,182 | 36,740 | 27,939 | |||||||||
| Payments for: | ||||||||||||
| Long-term borrowings | (27,289 | ) | (33,103 | ) | (38,742 | ) | ||||||
| Derivatives financing activities | (452 | ) | (776 | ) | (1,216 | ) | ||||||
| Repurchases of common stock and employee tax withholdings | (2,773 | ) | (1,458 | ) | (691 | ) | ||||||
| Purchase of additional stake in Wealth Management JV | � | � | (4,725 | ) | ||||||||
| Cash dividends | (1,455 | ) | (904 | ) | (475 | ) | ||||||
| Net cash provided by financing activities | 24,365 | 23,143 | 2,633 | |||||||||
| Effect of exchange rate changes on cash and cash equivalents | (945 | ) | (1,804 | ) | (202 | ) | ||||||
| Net increase (decrease) in cash and cash equivalents | 7,099 | (12,899 | ) | 12,979 | ||||||||
| Cash and cash equivalents, at beginning of period | 46,984 | 59,883 | 46,904 | |||||||||
| Cash and cash equivalents, at end of period | $ | 54,083 | $ | 46,984 | $ | 59,883 | ||||||
| Cash and cash equivalents include: | ||||||||||||
| Cash and due from banks | $ | 19,827 | $ | 21,381 | $ | 16,602 | ||||||
| Interest bearing deposits with banks | 34,256 | 25,603 | 43,281 | |||||||||
| Cash and cash equivalents, at end of period | $ | 54,083 | $ | 46,984 | $ | 59,883 | ||||||
| | 126 |
| 1. | Introduction and Basis of Presentation. |
| 127 | |
| | 128 |
| 2. | Significant Accounting Policies. |
| 129 | |
| | 130 |
| 131 | |
| | 132 |
| 133 | |
| | 134 |
| 135 | |
| | 136 |
| 137 | |
| | 138 |
| 139 | |
| | 140 |
| Asset/Liability | Valuation Technique | Valuation Hierarchy Classification | ||||||
| Trading Assets and Trading Liabilities | ||||||||
| U.S. Government and Agency Securities | ||||||||
| U.S.�Treasury�Securities | Fair value is determined using quoted market prices; valuation adjustments are not applied. | � Generally Level 1 | ||||||
| U.S. Agency Securities | Composed of three main categories consisting of: 1. Agency-issued debt -��Non-callable agency-issued debt securities are generally valued using quoted market prices. -��Callable agency-issued debt securities are valued by benchmarking model-derived prices to quoted market prices and trade data for identical or comparable securities. 2. Agency mortgage pass-through pool securities -��Fair value is model-driven based on spreads of the comparable to-be-announced security. 3. Collateralized mortgage obligations -��Fair value is determined based on quoted market prices and trade data adjusted by subsequent changes in related indices for identical or comparable securities. | � Generally Level 1�actively traded non-callable agency-issued debt securities � Generally Level 2�callable agency-issued debt securities, agency mortgage pass-through pool securities and collateralized mortgage obligations | ||||||
| Other Sovereign Government Obligations | Fair value is determined using quoted prices in active markets when available. | � Generally Level 1 � Level 2�if the market is less active or prices are dispersed � Level 3�in instances where the inputs are unobservable | ||||||
| 141 | |
| Asset/Liability | Valuation Technique | Valuation Hierarchy Classification | ||||||
| Corporate and Other Debt | ||||||||
| State and Municipal Securities | Fair value is determined using: -��recently executed transactions -��market price quotations -��pricing models that factor in, where applicable, interest rates, bond or CDS spreads and volatility | � Generally Level 2 | ||||||
| Residential Mortgage-Backed Securities (�RMBS�), Commercial Mortgage-Backed Securities (�CMBS�) and other Asset-Backed Securities (�ABS�) | RMBS, CMBS and other ABS may be valued based on price or spread data obtained from observed transactions or independent external parties such as vendors or brokers. When position-specific external price data are not observable, the fair value determination may require benchmarking to similar instruments, and/or analyzing expected credit losses, default and recovery rates, and/or applying discounted cash flow techniques. In evaluating the fair value of each security, the Company considers security collateral-specific attributes, including payment priority, credit enhancement levels, type of collateral, delinquency rates and loss severity. In addition, for RMBS borrowers, Fair Isaac Corporation (�FICO�) scores and the level of documentation for the loan are considered. Market standard models, such as Intex, Trepp or others, may be deployed to model the specific collateral composition and cash flow structure of each transaction. Key inputs to these models are market spreads, forecasted credit losses, and default and prepayment rates for each asset category. Valuation levels of RMBS and CMBS indices are used as an additional data point for benchmarking purposes or to price outright index positions. Auction Rate Securities (�ARS�) The Company primarily holds investments in Student Loan Auction Rate Securities (�SLARS�) and Municipal Auction Rate Securities (�MARS�), which are floating rate instruments for which the rates reset through periodic auctions. SLARS are ABS backed by pools of student loans. MARS are municipal bonds often wrapped by municipal bond insurance. The fair value of ARS is primarily determined using recently executed transactions and market price quotations obtained from independent external parties such as vendors and brokers, where available. The Company uses an internally developed methodology to discount for the lack of liquidity and non-performance risk where independent external market data are not available. Inputs that impact the valuation of SLARS are: -independent external market data -recently executed transactions of comparable ARS -underlying collateral types -level of seniority in the capital structure -amount of leverage in each structure -credit rating and liquidity considerations | � Generally Level 2 � Level 3�-�if external prices or significant spread inputs are unobservable or if the comparability assessment involves significant subjectivity related to property type differences, cash flows, performance and other inputs � Generally Level 2�-�as the valuation technique relies on observable external data |
| | 142 |
| Asset/Liability | Valuation Technique | Valuation Hierarchy Classification | ||||||
| Inputs that impact the valuation of MARS are: -recently executed transactions -the maximum rate -quality of underlying issuers/insurers -evidence of issuer calls/prepayment SLARS and MARS are presented within ABS and State and municipal securities, respectively, in the fair value hierarchy table. | ||||||||
| Corporate Bonds | Fair value is determined using: -��recently executed transactions -��market price quotations (where observable) -��bond spreads -��CDS spreads -��at the money volatility and/or volatility skew obtained from independent external parties such as vendors and brokers adjusted for any basis difference between cash and derivative instruments The spread data used are for the same maturity as the bond. If the spread data do not reference the issuer, then data that reference a comparable issuer are used. When position-specific external price data are not observable, fair value is determined based on either benchmarking to similar instruments or cash flow models with yield curves, bond or single name CDS spreads and recovery rates as significant inputs. | � Generally Level 2 � Level 3�-�if prices, spreads or any of the other aforementioned key inputs are unobservable | ||||||
| Collateralized Debt Obligations (�CDO�) and Collateralized Loan Obligations (�CLO�) | The Company holds cash CDOs/CLOs that typically reference a tranche of an underlying synthetic portfolio of single name CDS spreads collateralized by corporate bonds (�credit-linked notes�) or cash portfolio of asset-backed securities/loans (�asset-backed CDOs/CLOs�). Credit correlation, a primary input used to determine the fair value of credit-linked notes, is usually unobservable and derived using a benchmarking technique. The other credit-linked note model inputs such as credit spreads, including collateral spreads, and interest rates are typically observable. Asset-backed CDOs/CLOs are valued based on an evaluation of the market and model input parameters sourced from similar positions as indicated by primary and secondary market activity. Each asset-backed CDO/CLO position is evaluated independently taking into consideration available comparable market levels, underlying collateral performance and pricing, deal structures and liquidity. | � Level 2�-�when either the credit correlation input is insignificant or comparable market transactions are observable � Level 3�-�when either the credit correlation input is deemed to be significant or comparable market transactions are unobservable | ||||||
| Loans and Lending Commitments | Corporate Loans and Lending Commitments Fair value of corporate loans is determined using: -��recently executed transactions -��market price quotations (where observable) -��implied yields from comparable debt -��market observable CDS spread levels obtained from independent external parties such as vendors and brokers adjusted for any basis difference between cash and derivative instruments, along with proprietary valuation models and default recovery analysis where such transactions and quotations are unobservable | � Level 2�-�if value based on observable market data for identical or comparable instruments � Level 3�-�in instances where prices or significant spread inputs are unobservable |
| 143 | |
| Asset/Liability | Valuation Technique | Valuation Hierarchy Classification | ||||||
| The fair value of contingent corporate lending commitments is determined by using executed transactions on comparable loans and the anticipated market price based on pricing indications from syndicate banks and customers. The valuation of loans and lending commitments also takes into account fee income that is considered an attribute of the contract. | ||||||||
| Mortgage Loans Fair value is determined using observable prices based on transactional data or third-party pricing for identical or comparable instruments, when available. Where position-specific external prices are not observable, fair value is estimated based on benchmarking to prices and rates observed in the primary market for similar loan or borrower types or based on the present value of expected future cash flows using its best estimates of the key assumptions, including forecasted credit losses, prepayment rates, forward yield curves and discount rates commensurate with the risks involved or a methodology that utilizes the capital structure and credit spreads of recent comparable securitization transactions. | ��Level 2 - if value is based on observable market data for identical or comparable instruments ��Level 3 - if observable prices are not available due to the subjectivity involved in the comparability assessment related to mortgage loan vintage, geographical concentration, prepayment speed and projected loss assumptions | |||||||
| Corporate Equities | Exchange-Traded Equity Securities Fair value is generally determined based on quoted prices from the exchange. To the extent these securities are actively traded, valuation adjustments are not applied. Unlisted Equity Securities Fair value is determined based on an assessment of each underlying security, considering rounds of financing and third-party transactions, discounted cash flow analyses and market-based information, including comparable company transactions, trading multiples and changes in market outlook, among other factors. | � Level 1�-�if actively traded � Level 2 or Level 3�-�if not actively traded � Generally Level 3 | ||||||
| Fund Units Listed fund units are generally marked to the exchange-traded price. Listed fund units if not actively traded and unlisted fund units are generally marked to NAV. | � Level 1 - listed fund units if actively traded on an exchange � Certain fund units that are measured at fair value using the NAV per share are not classified in the fair value hierarchy. | |||||||
| Derivative and Other Contracts | Listed Derivative Contracts | |||||||
| Listed derivatives that are actively traded are valued based on quoted prices from the exchange. Listed derivatives that are not actively traded are valued using the same approaches as those applied to OTC derivatives. | � Level 1 - listed derivatives that are actively traded � Level 2 - listed derivatives that are not actively traded | |||||||
| | 144 |
| Asset/Liability | Valuation Technique | Valuation Hierarchy Classification | ||||||
| OTC Derivative Contracts OTC derivative contracts include forward, swap and option contracts related to interest rates, foreign currencies, credit standing of reference entities, equity prices or commodity prices. Depending on the product and the terms of the transaction, the fair value of OTC derivative products can be either observed or modeled using a series of techniques and model inputs from comparable benchmarks, including closed-form analytic formulas, such as the Black-Scholes option-pricing model, and simulation models or a combination thereof. Many pricing models do not entail material subjectivity because the methodologies employed do not necessitate significant judgment, and the pricing inputs are observed from actively quoted markets, as is the case for generic interest rate swaps, certain option contracts and certain CDS. In the case of more established derivative products, the pricing models used by the Company are widely accepted by the financial services industry. Other derivative products, including complex products that have become illiquid, require more judgment in the implementation of the valuation technique applied due to the complexity of the valuation assumptions and the reduced observability of inputs. This includes certain types of interest rate derivatives with both volatility and correlation exposure and credit derivatives, including CDS on certain mortgage-backed or asset-backed securities and basket CDS, where direct trading activity or quotes are unobservable. Derivative interests in CDS on certain mortgage-backed or asset-backed securities, for which observability of external price data is limited, are valued based on an evaluation of the market and model input parameters sourced from similar positions as indicated by primary and secondary market activity. Each position is evaluated independently taking into consideration available comparable market levels as well as a cash synthetic basis or the underlying collateral performance and pricing, behavior of the tranche under various cumulative loss and prepayment scenarios, deal structures ( e.g ., non-amortizing reference obligations, call features, etc.) and liquidity. While these factors may be supported by historical and actual external observations, the determination of their value as it relates to specific positions nevertheless requires significant judgment. For basket CDS, the correlation input between reference credits is unobservable for each specific swap or position and is benchmarked to standardized proxy baskets for which correlation data are available. The other model inputs such as credit spread, interest rates and recovery rates are observable. The Company trades various derivative structures with commodity underlyings. Depending on the type of structure, | � Generally Level 2 - OTC derivative products valued using pricing models; basket CDS if the correlation input is not deemed to be significant; commodity derivatives � Level 3 - OTC derivative products with significant unobservable inputs; basket CDS if the correlation input is deemed to be significant; commodity derivatives in instances where significant inputs are unobservable |
| 145 | |
| Asset/Liability | Valuation Technique | Valuation Hierarchy Classification | ||||||
| the model inputs generally include interest rate yield curves, commodity underlier price curves, implied volatility of the underlying commodities and, in some cases, the implied correlation between these inputs. The fair value of these products is determined using executed trades and broker and consensus data to provide values for the aforementioned inputs. Where these inputs are unobservable, relationships to observable commodities and data points, based on historic and/or implied observations, are employed as a technique to estimate the model input values. For further information on the valuation techniques for OTC derivative products, see Note 2. For further information on derivative instruments and hedging activities, see Note 4. | ||||||||
| Investments | Investments include direct investments in equity securities as well as investments in private equity funds, real estate funds and hedge funds, which include investments made in connection with certain employee deferred compensation plans. Direct investments are presented in the fair value hierarchy table as Principal investments and Other. Initially, the transaction price is generally considered by the Company as the exit price and is its best estimate of fair value. After initial recognition, in determining the fair value of non-exchange-traded internally and externally managed funds, the Company generally considers the NAV of the fund provided by the fund manager to be the best estimate of fair value. For non-exchange-traded investments either held directly or held within internally managed funds, fair value after initial recognition is based on an assessment of each underlying investment, considering rounds of financing and third-party transactions, discounted cash flow analyses and market-based information, including comparable company transactions, trading multiples and changes in market outlook, among other factors. Exchange-traded direct equity investments are generally valued based on quoted prices from the exchange. | � Level 1 - exchange-traded direct equity investments in an active market � Level 2 - non-exchange-traded direct equity investments and investments in private equity and real estate funds if valued based on rounds of financing or third-party transactions; exchange-traded direct equity investments if not actively traded � Level 3 - non-exchange-traded direct equity investments and investments in private equity and real estate funds where rounds of financing or third-party transactions are not available Certain investments that are measured at fair value using the NAV per share are not classified in the fair value hierarchy. For additional disclosure about such investments, see �Fair Value of Investments Measured at Net Asset Value� herein. | ||||||
| Physical Commodities | The Company trades various physical commodities, including crude oil and refined products, natural gas, base and precious metals, and agricultural products. Fair value is determined using observable inputs, including broker quotations and published indices. | � Generally Level 2 � Level 3 - in instances where significant inputs are unobservable | ||||||
| | 146 |
| Asset/Liability | Valuation Technique | Valuation Hierarchy Classification | ||||||
| Investment Securities | ||||||||
| AFS Securities | AFS securities are composed of U.S. government and agency securities ( e.g. , U.S. Treasury securities, agency-issued debt, agency mortgage pass-through securities and collateralized mortgage obligations), CMBS, Federal Family Education Loan Program (�FFELP�) student loan ABS, auto loan ABS, corporate bonds, CLOs and actively traded equity securities. For further information on the determination of fair value, refer to the corresponding asset/liability valuation technique described herein. For further information on AFS securities, see Note 5. | � Generally Level 1 - actively traded U.S. Treasury securities, non-callable agency-issued debt securities and equity securities � Generally Level 2 - callable agency-issued debt securities, agency mortgage pass-through securities, collateralized mortgage obligations, CMBS, FFELP student loan ABS, auto loan ABS, corporate bonds and CLOs | ||||||
| Deposits | Certificates of Deposit | ��Generally Level 2 | ||||||
| The Company issues Federal Deposit Insurance Corporation (�FDIC�) insured certificates of deposit that pay either fixed coupons or that have repayment terms linked to the performance of debt or equity securities, indices or currencies. The fair value of these certificates of deposit is determined using valuation models that incorporate observable inputs referencing identical or comparable securities, including: -prices to which the deposits are linked -interest rate yield curves -option volatility and currency rates -equity prices -the impact of the Company�s own credit spreads, adjusted for the impact of the FDIC insurance, which is based on vanilla deposit issuance rates | ||||||||
| Short-Term Borrowings/Long-Term Borrowings | Structured Notes | � Generally Level 2 | ||||||
| The Company issues structured notes that have coupon or repayment terms linked to the performance of debt or equity securities, indices, currencies or commodities. Fair value of structured notes is determined using valuation models for the derivative and debt portions of the notes. These models incorporate observable inputs referencing identical or comparable securities, including: -prices to which the notes are linked -interest rate yield curves -option volatility and currency -commodity or equity prices Independent, external and traded prices for the notes are considered as well. The impact of the Company�s own credit spreads is also included based on observed secondary bond market spreads. | ||||||||
| Securities Purchased under Agreements to Resell and Securities Sold under Agreements to Repurchase | Fair value is computed using a standard cash flow discounting methodology. The inputs to the valuation include contractual cash flows and collateral funding spreads, which are estimated using various benchmarks, interest rate yield curves and option volatilities. | � Generally Level 2 � Level 3 - in instances where the unobservable inputs are deemed significant | ||||||
| 147 | |
| Assets and Liabilities Measured at Fair Value on a Recurring Basis. | ||||||||||||||||||||
| Level 1 | Level 2 | Level�3 | Counterparty and Cash Collateral Netting | Balance at December�31, 2015 | ||||||||||||||||
| (dollars in millions) | ||||||||||||||||||||
| Assets at Fair Value | ||||||||||||||||||||
| Trading assets: | ||||||||||||||||||||
| U.S. government and agency securities: | ||||||||||||||||||||
| U.S. Treasury securities | $ | 17,658 | $ | � | $ | � | $ | � | $ | 17,658 | ||||||||||
| U.S. agency securities | 797 | 17,886 | � | � | 18,683 | |||||||||||||||
| Total U.S. government and agency securities | 18,455 | 17,886 | � | � | 36,341 | |||||||||||||||
| Other sovereign government obligations | 13,559 | 7,400 | 4 | � | 20,963 | |||||||||||||||
| Corporate and other debt: | ||||||||||||||||||||
| State and municipal securities | � | 1,651 | 19 | � | 1,670 | |||||||||||||||
| Residential mortgage-backed securities | � | 1,456 | 341 | � | 1,797 | |||||||||||||||
| Commercial mortgage-backed securities | � | 1,520 | 72 | � | 1,592 | |||||||||||||||
| Asset-backed securities | � | 494 | 25 | � | 519 | |||||||||||||||
| Corporate bonds | � | 9,959 | 267 | � | 10,226 | |||||||||||||||
| Collateralized debt and loan obligations | � | 284 | 430 | � | 714 | |||||||||||||||
| Loans and lending commitments(1) | � | 4,682 | 5,936 | � | 10,618 | |||||||||||||||
| Other debt | � | 2,263 | 448 | � | 2,711 | |||||||||||||||
| Total corporate and other debt | � | 22,309 | 7,538 | � | 29,847 | |||||||||||||||
| Corporate equities(2) | 106,296 | 379 | 433 | � | 107,108 | |||||||||||||||
| Derivative and other contracts: | ||||||||||||||||||||
| Interest rate contracts | 406 | 323,586 | 2,052 | � | 326,044 | |||||||||||||||
| Credit contracts | � | 22,258 | 661 | � | 22,919 | |||||||||||||||
| Foreign exchange contracts | 55 | 64,608 | 292 | � | 64,955 | |||||||||||||||
| Equity contracts | 653 | 38,552 | 1,084 | � | 40,289 | |||||||||||||||
| Commodity contracts | 3,140 | 10,654 | 3,358 | � | 17,152 | |||||||||||||||
| Other | � | 219 | � | � | 219 | |||||||||||||||
| Netting(3) | (3,840 | ) | (380,443 | ) | (3,120 | ) | (55,562 | ) | (442,965 | ) | ||||||||||
| Total derivative and other contracts | 414 | 79,434 | 4,327 | (55,562 | ) | 28,613 | ||||||||||||||
| Investments(4): | ||||||||||||||||||||
| Principal investments | 20 | 44 | 486 | � | 550 | |||||||||||||||
| Other | 163 | 310 | 221 | � | 694 | |||||||||||||||
| Total investments | 183 | 354 | 707 | � | 1,244 | |||||||||||||||
| Physical commodities | � | 321 | � | � | 321 | |||||||||||||||
| Total trading assets(4) | 138,907 | 128,083 | 13,009 | (55,562 | ) | 224,437 | ||||||||||||||
| AFS securities | 34,351 | 32,408 | � | � | 66,759 | |||||||||||||||
| Securities received as collateral | 11,221 | 3 | 1 | � | 11,225 | |||||||||||||||
| Securities purchased under agreements to resell | � | 806 | � | � | 806 | |||||||||||||||
| Intangible assets | � | � | 5 | � | 5 | |||||||||||||||
| Total assets measured at fair value | $ | 184,479 | $ | 161,300 | $ | 13,015 | $ | (55,562 | ) | $ | 303,232 | |||||||||
| Liabilities at Fair Value | ||||||||||||||||||||
| Deposits | $ | � | $ | 106 | $ | 19 | $ | � | $ | 125 | ||||||||||
| Short-term borrowings | � | 1,647 | 1 | � | 1,648 | |||||||||||||||
| Trading liabilities: | ||||||||||||||||||||
| U.S. government and agency securities: | ||||||||||||||||||||
| U.S. Treasury securities | 12,932 | � | � | � | 12,932 | |||||||||||||||
| U.S. agency securities | 854 | 127 | � | � | 981 | |||||||||||||||
| Total U.S. government and agency securities | 13,786 | 127 | � | � | 13,913 | |||||||||||||||
| Other sovereign government obligations | 10,970 | 2,558 | � | � | 13,528 | |||||||||||||||
| Corporate and other debt: | ||||||||||||||||||||
| Commercial mortgage-backed securities | � | 2 | � | � | 2 | |||||||||||||||
| Corporate bonds | � | 5,035 | � | � | 5,035 | |||||||||||||||
| Lending commitments | � | 3 | � | � | 3 | |||||||||||||||
| Other debt | � | 5 | 4 | � | 9 | |||||||||||||||
| Total corporate and other debt | � | 5,045 | 4 | � | 5,049 | |||||||||||||||
| Corporate equities(2) | 47,123 | 35 | 17 | � | 47,175 | |||||||||||||||
| Derivative and other contracts: | ||||||||||||||||||||
| Interest rate contracts | 466 | 305,151 | 1,792 | � | 307,409 | |||||||||||||||
| Credit contracts | � | 22,160 | 1,505 | � | 23,665 | |||||||||||||||
| Foreign exchange contracts | 22 | 65,177 | 151 | � | 65,350 | |||||||||||||||
| Equity contracts | 570 | 42,447 | 3,115 | � | 46,132 | |||||||||||||||
| Commodity contracts | 3,012 | 9,431 | 2,308 | � | 14,751 | |||||||||||||||
| Other | � | 43 | � | � | 43 | |||||||||||||||
| Netting(3) | (3,840 | ) | (380,443 | ) | (3,120 | ) | (40,473 | ) | (427,876 | ) | ||||||||||
| Total derivative and other contracts | 230 | 63,966 | 5,751 | (40,473 | ) | 29,474 | ||||||||||||||
| Total trading liabilities | 72,109 | 71,731 | 5,772 | (40,473 | ) | 109,139 | ||||||||||||||
| Obligation to return securities received as collateral | 19,312 | 3 | 1 | � | 19,316 | |||||||||||||||
| Securities sold under agreements to repurchase | � | 532 | 151 | � | 683 | |||||||||||||||
| Other secured financings | � | 2,393 | 461 | � | 2,854 | |||||||||||||||
| Long-term borrowings | � | 31,058 | 1,987 | � | 33,045 | |||||||||||||||
| Total liabilities measured at fair value | $ | 91,421 | $ | 107,470 | $ | 8,392 | $ | (40,473 | ) | $ | 166,810 | |||||||||
| | 148 |
| Level 1 | Level 2 | Level�3 | Counterparty and Cash Collateral Netting | Balance at December�31, 2014 | ||||||||||||||||
| (dollars in millions) | ||||||||||||||||||||
| Assets at Fair Value | ||||||||||||||||||||
| Trading assets: | ||||||||||||||||||||
| U.S. government and agency securities: | ||||||||||||||||||||
| U.S. Treasury securities | $ | 16,961 | $ | � | $ | � | $ | � | $ | 16,961 | ||||||||||
| U.S. agency securities | 850 | 18,193 | � | � | 19,043 | |||||||||||||||
| Total U.S. government and agency securities | 17,811 | 18,193 | � | � | 36,004 | |||||||||||||||
| Other sovereign government obligations | 15,149 | 7,888 | 41 | � | 23,078 | |||||||||||||||
| Corporate and other debt: | ||||||||||||||||||||
| State and municipal securities | � | 2,049 | � | � | 2,049 | |||||||||||||||
| Residential mortgage-backed securities | � | 1,991 | 175 | � | 2,166 | |||||||||||||||
| Commercial mortgage-backed securities | � | 1,484 | 96 | � | 1,580 | |||||||||||||||
| Asset-backed securities | � | 583 | 76 | � | 659 | |||||||||||||||
| Corporate bonds | � | 15,800 | 386 | � | 16,186 | |||||||||||||||
| Collateralized debt and loan obligations | � | 741 | 1,152 | � | 1,893 | |||||||||||||||
| Loans and lending commitments(1) | � | 6,088 | 5,874 | � | 11,962 | |||||||||||||||
| Other debt | � | 2,167 | 285 | � | 2,452 | |||||||||||||||
| Total corporate and other debt | � | 30,903 | 8,044 | � | 38,947 | |||||||||||||||
| Corporate equities(2) | 112,490 | 1,357 | 272 | � | 114,119 | |||||||||||||||
| Derivative and other contracts: | ||||||||||||||||||||
| Interest rate contracts | 663 | 495,026 | 2,484 | � | 498,173 | |||||||||||||||
| Credit contracts | � | 30,813 | 1,369 | � | 32,182 | |||||||||||||||
| Foreign exchange contracts | 83 | 72,769 | 249 | � | 73,101 | |||||||||||||||
| Equity contracts(5) | 571 | 45,967 | 1,586 | � | 48,124 | |||||||||||||||
| Commodity contracts | 4,105 | 18,042 | 2,268 | � | 24,415 | |||||||||||||||
| Other | � | 376 | � | � | 376 | |||||||||||||||
| Netting(3) | (4,910 | ) | (564,127 | ) | (4,220 | ) | (66,720 | ) | (639,977 | ) | ||||||||||
| Total derivative and other contracts | 512 | 98,866 | 3,736 | (66,720 | ) | 36,394 | ||||||||||||||
| Investments(4): | ||||||||||||||||||||
| Principal investments | 58 | 3 | 835 | � | 896 | |||||||||||||||
| Other | 225 | 198 | 323 | � | 746 | |||||||||||||||
| Total investments | 283 | 201 | 1,158 | � | 1,642 | |||||||||||||||
| Physical commodities | � | 1,608 | � | � | 1,608 | |||||||||||||||
| Total trading assets(4) | 146,245 | 159,016 | 13,251 | (66,720 | ) | 251,792 | ||||||||||||||
| AFS securities | 37,200 | 32,016 | � | � | 69,216 | |||||||||||||||
| Securities received as collateral | 21,265 | 51 | � | � | 21,316 | |||||||||||||||
| Securities purchased under agreements to resell | � | 1,113 | � | � | 1,113 | |||||||||||||||
| Intangible assets | � | � | 6 | � | 6 | |||||||||||||||
| Total assets measured at fair value | $ | 204,710 | $ | 192,196 | $ | 13,257 | $ | (66,720 | ) | $ | 343,443 | |||||||||
| Liabilities at Fair Value | ||||||||||||||||||||
| Short-term borrowings | $ | � | $ | 1,765 | $ | � | $ | � | $ | 1,765 | ||||||||||
| Trading liabilities: | ||||||||||||||||||||
| U.S. government and agency securities: | ||||||||||||||||||||
| U.S. Treasury securities | 14,199 | � | � | � | 14,199 | |||||||||||||||
| U.S. agency securities | 1,274 | 85 | � | � | 1,359 | |||||||||||||||
| Total U.S. government and agency securities | 15,473 | 85 | � | � | 15,558 | |||||||||||||||
| Other sovereign government obligations | 11,653 | 2,109 | � | � | 13,762 | |||||||||||||||
| Corporate and other debt: | ||||||||||||||||||||
| State and municipal securities | � | 1 | � | � | 1 | |||||||||||||||
| Corporate bonds | � | 5,943 | 78 | � | 6,021 | |||||||||||||||
| Lending commitments | � | 10 | 5 | � | 15 | |||||||||||||||
| Other debt | � | 63 | 38 | � | 101 | |||||||||||||||
| Total corporate and other debt | � | 6,017 | 121 | � | 6,138 | |||||||||||||||
| Corporate equities(2) | 31,340 | 326 | 45 | � | 31,711 | |||||||||||||||
| Derivative and other contracts: | ||||||||||||||||||||
| Interest rate contracts | 602 | 469,319 | 2,657 | � | 472,578 | |||||||||||||||
| Credit contracts | � | 29,997 | 2,112 | � | 32,109 | |||||||||||||||
| Foreign exchange contracts | 21 | 72,233 | 98 | � | 72,352 | |||||||||||||||
| Equity contracts(5) | 416 | 51,405 | 3,751 | � | 55,572 | |||||||||||||||
| Commodity contracts | 4,817 | 15,584 | 1,122 | � | 21,523 | |||||||||||||||
| Other | � | 172 | � | � | 172 | |||||||||||||||
| Netting(3) | (4,910 | ) | (564,127 | ) | (4,220 | ) | (40,837 | ) | (614,094 | ) | ||||||||||
| Total derivative and other contracts | 946 | 74,583 | 5,520 | (40,837 | ) | 40,212 | ||||||||||||||
| Total trading liabilities | 59,412 | 83,120 | 5,686 | (40,837 | ) | 107,381 | ||||||||||||||
| Obligation to return securities received as collateral | 25,629 | 56 | � | � | 25,685 | |||||||||||||||
| Securities sold under agreements to repurchase | � | 459 | 153 | � | 612 | |||||||||||||||
| Other secured financings | � | 4,355 | 149 | � | 4,504 | |||||||||||||||
| Long-term borrowings | � | 29,840 | 1,934 | � | 31,774 | |||||||||||||||
| Total liabilities measured at fair value | $ | 85,041 | $ | 119,595 | $ | 7,922 | $ | (40,837 | ) | $ | 171,721 | |||||||||
| 149 | |
| (1) | At December�31, 2015, Loans and lending commitments held at fair value consisted of $7,286 million of corporate loans, $1,885 million of residential real estate loans and $1,447 million of wholesale real estate loans. At December�31, 2014, Loans and lending commitments held at fair value consisted of $7,093 million of corporate loans, $1,682 million of residential real estate loans and $3,187 million of wholesale real estate loans. |
| (2) | For trading purposes, the Company holds or sells short equity securities issued by entities in diverse industries and of varying sizes. |
| (3) | For positions with the same counterparty that cross over the levels of the fair value hierarchy, both counterparty netting and cash collateral netting are included in the column titled �Counterparty and Cash Collateral Netting.� For contracts with the same counterparty, counterparty netting among positions classified within the same level is included within that shared level. For further information on derivative instruments and hedging activities, see Note 4. |
| (4) | Amounts exclude certain investments that are measured at fair value using the NAV per share, which are not classified in the fair value hierarchy. At December�31, 2015 and December�31, 2014, the fair value of these investments was $3,843 million and $5,009 million, respectively. For additional disclosure about such investments, see �Fair Value of Investments Measured at Net Asset Value� herein. |
| (5) | The balance of Level 3 asset derivative equity contracts increased by $57 million with a corresponding decrease in the balance of Level 2 asset derivative equity contracts, and the balance of Level 3 liability derivative equity contracts increased by $842 million with a corresponding decrease in the balance of Level 2 liability derivative equity contracts to correct the fair value level assigned to these contracts at December�31, 2014. The total amount of asset and liability derivative equity contracts remained unchanged. |
| | 150 |
| Beginning Balance at December�31, 2014 | Total Realized and Unrealized Gains (Losses)(1) | Purchases (2) | Sales | Issuances | Settlements | Net�Transfers | Ending Balance at December�31, 2015 | Unrealized Gains�(Losses) for Level 3 Assets/ Liabilities Outstanding�at December�31, 2015 | ||||||||||||||||||||||||||||
| (dollars in millions) | ||||||||||||||||||||||||||||||||||||
| Assets at Fair Value | ||||||||||||||||||||||||||||||||||||
| Trading assets: | ||||||||||||||||||||||||||||||||||||
| Other sovereign government obligations | $ | 41 | $ | (1 | ) | $ | 2 | $ | (30 | ) | $ | � | $ | � | $ | (8 | ) | $ | 4 | $ | � | |||||||||||||||
| Corporate and other debt: | ||||||||||||||||||||||||||||||||||||
| State and municipal securities | � | 2 | 3 | � | � | � | 14 | 19 | 2 | |||||||||||||||||||||||||||
| Residential mortgage-backed securities | 175 | 24 | 176 | (83 | ) | � | � | 49 | 341 | 12 | ||||||||||||||||||||||||||
| Commercial mortgage-backed securities | 96 | (28 | ) | 27 | (23 | ) | � | � | � | 72 | (32 | ) | ||||||||||||||||||||||||
| Asset-backed securities | 76 | (9 | ) | 23 | (30 | ) | � | � | (35 | ) | 25 | � | ||||||||||||||||||||||||
| Corporate bonds | 386 | (44 | ) | 374 | (381 | ) | � | (53 | ) | (15 | ) | 267 | (44 | ) | ||||||||||||||||||||||
| Collateralized debt and loan obligations | 1,152 | 123 | 325 | (798 | ) | � | (344 | ) | (28 | ) | 430 | (19 | ) | |||||||||||||||||||||||
| Loans and lending commitments | 5,874 | (42 | ) | 3,216 | (207 | ) | � | (2,478 | ) | (427 | ) | 5,936 | (76 | ) | ||||||||||||||||||||||
| Other debt | 285 | (23 | ) | 131 | (5 | ) | � | (81 | ) | 141 | 448 | (9 | ) | |||||||||||||||||||||||
| Total corporate and other debt | 8,044 | 3 | 4,275 | (1,527 | ) | � | (2,956 | ) | (301 | ) | 7,538 | (166 | ) | |||||||||||||||||||||||
| Corporate equities | 272 | (1 | ) | 373 | (333 | ) | � | � | 122 | 433 | 11 | |||||||||||||||||||||||||
| Net derivative and other contracts(3): | ||||||||||||||||||||||||||||||||||||
| Interest rate contracts | (173 | ) | (51 | ) | 58 | � | (54 | ) | 207 | 273 | 260 | 20 | ||||||||||||||||||||||||
| Credit contracts | (743 | ) | (172 | ) | 19 | � | (121 | ) | 196 | (23 | ) | (844 | ) | (179 | ) | |||||||||||||||||||||
| Foreign exchange contracts | 151 | 53 | 4 | � | (2 | ) | (18 | ) | (47 | ) | 141 | 52 | ||||||||||||||||||||||||
| Equity contracts(4) | (2,165 | ) | 166 | 81 | (1 | ) | (310 | ) | 22 | 176 | (2,031 | ) | 62 | |||||||||||||||||||||||
| Commodity contracts | 1,146 | 433 | 35 | � | (222 | ) | (116 | ) | (226 | ) | 1,050 | 402 | ||||||||||||||||||||||||
| Total net derivative and other contracts | (1,784 | ) | 429 | 197 | (1 | ) | (709 | ) | 291 | 153 | (1,424 | ) | 357 | |||||||||||||||||||||||
| Investments: | ||||||||||||||||||||||||||||||||||||
| Principal investments | 835 | 11 | 32 | (133 | ) | � | (188 | ) | (71 | ) | 486 | 6 | ||||||||||||||||||||||||
| Other | 323 | (12 | ) | 1 | (6 | ) | � | � | (85 | ) | 221 | (7 | ) | |||||||||||||||||||||||
| Securities received as collateral | � | � | 1 | � | � | � | � | 1 | � | |||||||||||||||||||||||||||
| Intangible assets | 6 | � | � | � | � | (1 | ) | � | 5 | � | ||||||||||||||||||||||||||
| Liabilities at Fair Value | ||||||||||||||||||||||||||||||||||||
| Deposits | $ | � | $ | (1 | ) | $ | � | $ | � | $ | 18 | $ | � | $ | � | $ | 19 | $ | (1 | ) | ||||||||||||||||
| Short-term borrowings | � | � | � | � | 1 | � | � | 1 | � | |||||||||||||||||||||||||||
| Trading liabilities: | ||||||||||||||||||||||||||||||||||||
| Corporate and other debt: | ||||||||||||||||||||||||||||||||||||
| Corporate bonds | 78 | � | (19 | ) | 6 | � | (65 | ) | � | � | � | |||||||||||||||||||||||||
| Lending commitments | 5 | 5 | � | � | � | � | � | � | 5 | |||||||||||||||||||||||||||
| Other debt | 38 | � | (1 | ) | 7 | � | (39 | ) | (1 | ) | 4 | � | ||||||||||||||||||||||||
| Total corporate and other debt | 121 | 5 | (20 | ) | 13 | � | (104 | ) | (1 | ) | 4 | 5 | ||||||||||||||||||||||||
| Corporate equities | 45 | 79 | (86 | ) | 32 | � | � | 105 | 17 | 79 | ||||||||||||||||||||||||||
| Obligation to return securities received as collateral | � | � | � | 1 | � | � | � | 1 | � | |||||||||||||||||||||||||||
| Securities sold under agreements to repurchase | 153 | 2 | � | � | � | � | � | 151 | 2 | |||||||||||||||||||||||||||
| Other secured financings | 149 | 192 | � | � | 327 | (232 | ) | 409 | 461 | 181 | ||||||||||||||||||||||||||
| Long-term borrowings | 1,934 | 61 | � | � | 881 | (364 | ) | (403 | ) | 1,987 | 52 | |||||||||||||||||||||||||
| 151 | |
| Beginning Balance�at December�31, 2013 | Total Realized and Unrealized Gains (Losses)(1) | Purchases (2) | Sales | Issuances | Settlements | Net�Transfers | Ending Balance at December�31, 2014 | Unrealized Gains (Losses) for Level 3 Assets/ Liabilities Outstanding�at December�31, 2014 | ||||||||||||||||||||||||||||
| (dollars in millions) | ||||||||||||||||||||||||||||||||||||
| Assets at Fair Value | ||||||||||||||||||||||||||||||||||||
| Trading assets: | ||||||||||||||||||||||||||||||||||||
| Other sovereign government obligations | $ | 27 | $ | 1 | $ | 48 | $ | (34 | ) | $ | � | $ | � | $ | (1 | ) | $ | 41 | $ | � | ||||||||||||||||
| Corporate and other debt: | ||||||||||||||||||||||||||||||||||||
| Residential mortgage-backed securities | 47 | 9 | 105 | (14 | ) | � | � | 28 | 175 | 4 | ||||||||||||||||||||||||||
| Commercial mortgage-backed securities | 108 | 65 | 16 | (102 | ) | � | � | 9 | 96 | 45 | ||||||||||||||||||||||||||
| Asset-backed securities | 103 | 3 | 66 | (96 | ) | � | � | � | 76 | 9 | ||||||||||||||||||||||||||
| Corporate bonds | 522 | 86 | 106 | (306 | ) | � | � | (22 | ) | 386 | 66 | |||||||||||||||||||||||||
| Collateralized debt and loan obligations | 1,468 | 142 | 644 | (964 | ) | � | (143 | ) | 5 | 1,152 | 27 | |||||||||||||||||||||||||
| Loans and lending commitments | 5,129 | (87 | ) | 3,784 | (415 | ) | � | (2,552 | ) | 15 | 5,874 | (191 | ) | |||||||||||||||||||||||
| Other debt | 27 | 21 | 274 | (35 | ) | � | (2 | ) | � | 285 | 20 | |||||||||||||||||||||||||
| Total corporate and other debt | 7,404 | 239 | 4,995 | (1,932 | ) | � | (2,697 | ) | 35 | 8,044 | (20 | ) | ||||||||||||||||||||||||
| Corporate equities | 190 | 20 | 146 | (102 | ) | � | � | 18 | 272 | (3 | ) | |||||||||||||||||||||||||
| Net derivative and other contracts(3)(5): | ||||||||||||||||||||||||||||||||||||
| Interest rate contracts | 113 | (258 | ) | 18 | � | (14 | ) | (43 | ) | 11 | (173 | ) | (349 | ) | ||||||||||||||||||||||
| Credit contracts | (147 | ) | (408 | ) | 68 | � | (179 | ) | (15 | ) | (62 | ) | (743 | ) | (474 | ) | ||||||||||||||||||||
| Foreign exchange contracts | 68 | (13 | ) | 7 | � | � | 108 | (19 | ) | 151 | (17 | ) | ||||||||||||||||||||||||
| Equity contracts(4) | (831 | ) | (527 | ) | 339 | (2 | ) | (562 | ) | (46 | ) | (536 | ) | (2,165 | ) | (600 | ) | |||||||||||||||||||
| Commodity contracts | 880 | 158 | 287 | � | (52 | ) | (127 | ) | � | 1,146 | 72 | |||||||||||||||||||||||||
| Other | (4 | ) | � | � | � | � | 4 | � | � | � | ||||||||||||||||||||||||||
| Total net derivative and other contracts | 79 | (1,048 | ) | 719 | (2 | ) | (807 | ) | (119 | ) | (606 | ) | (1,784 | ) | (1,368 | ) | ||||||||||||||||||||
| Investments: | ||||||||||||||||||||||||||||||||||||
| Principal investments | 2,160 | 53 | 36 | (181 | ) | � | (1,258 | ) | 25 | 835 | 49 | |||||||||||||||||||||||||
| Other | 538 | 17 | 17 | (29 | ) | � | � | (220 | ) | 323 | 24 | |||||||||||||||||||||||||
| Intangible assets | 8 | � | � | � | � | (2 | ) | � | 6 | (1 | ) | |||||||||||||||||||||||||
| Liabilities at Fair Value | ||||||||||||||||||||||||||||||||||||
| Short-term borrowings | $ | 1 | $ | � | $ | � | $ | � | $ | � | $ | (1 | ) | $ | � | $ | � | $ | � | |||||||||||||||||
| Trading liabilities: | ||||||||||||||||||||||||||||||||||||
| Corporate and other debt: | ||||||||||||||||||||||||||||||||||||
| Corporate bonds | 22 | 1 | (46 | ) | 117 | � | � | (14 | ) | 78 | 2 | |||||||||||||||||||||||||
| Lending commitments | 2 | (3 | ) | � | � | � | � | � | 5 | (3 | ) | |||||||||||||||||||||||||
| Other debt | 48 | 7 | (8 | ) | � | � | � | 5 | 38 | (2 | ) | |||||||||||||||||||||||||
| Total corporate and other debt | 72 | 5 | (54 | ) | 117 | � | � | (9 | ) | 121 | (3 | ) | ||||||||||||||||||||||||
| Corporate equities | 8 | � | (3 | ) | 39 | � | � | 1 | 45 | � | ||||||||||||||||||||||||||
| Securities sold under agreements to repurchase | 154 | 1 | � | � | � | � | � | 153 | 1 | |||||||||||||||||||||||||||
| Other secured financings | 278 | (9 | ) | � | � | 21 | (201 | ) | 42 | 149 | (6 | ) | ||||||||||||||||||||||||
| Long-term borrowings | 1,887 | 109 | � | � | 791 | (391 | ) | (244 | ) | 1,934 | 102 | |||||||||||||||||||||||||
| | 152 |
| Beginning Balance at December�31, 2012 | Total Realized and Unrealized Gains (Losses)(1) | Purchases (2) | Sales | Issuances | Settlements | Net�Transfers | Ending Balance at December�31, 2013 | Unrealized Gains (Losses) for Level 3 Assets/ Liabilities Outstanding�at December�31, 2013 | ||||||||||||||||||||||||||||
| (dollars in millions) | ||||||||||||||||||||||||||||||||||||
| Assets at Fair Value | ||||||||||||||||||||||||||||||||||||
| Trading assets: | ||||||||||||||||||||||||||||||||||||
| Other sovereign government obligations | $ | 6 | $ | (18 | ) | $ | 41 | $ | (7 | ) | $ | � | $ | � | $ | 5 | $ | 27 | $ | (18 | ) | |||||||||||||||
| Corporate and other debt: | ||||||||||||||||||||||||||||||||||||
| Residential mortgage-backed securities | 45 | 25 | 54 | (51 | ) | � | � | (26 | ) | 47 | (6 | ) | ||||||||||||||||||||||||
| Commercial mortgage-backed securities | 232 | 13 | 57 | (187 | ) | � | (7 | ) | � | 108 | 4 | |||||||||||||||||||||||||
| Asset-backed securities | 109 | � | 6 | (12 | ) | � | � | � | 103 | � | ||||||||||||||||||||||||||
| Corporate bonds | 660 | (20 | ) | 324 | (371 | ) | � | (19 | ) | (52 | ) | 522 | (55 | ) | ||||||||||||||||||||||
| Collateralized debt and loan obligations | 1,951 | 363 | 742 | (960 | ) | � | (626 | ) | (2 | ) | 1,468 | 131 | ||||||||||||||||||||||||
| Loans and lending commitments | 4,694 | (130 | ) | 3,744 | (448 | ) | � | (3,096 | ) | 365 | 5,129 | (199 | ) | |||||||||||||||||||||||
| Other debt | 45 | (1 | ) | 20 | (36 | ) | � | � | (1 | ) | 27 | (2 | ) | |||||||||||||||||||||||
| Total corporate and other debt | 7,736 | 250 | 4,947 | (2,065 | ) | � | (3,748 | ) | 284 | 7,404 | (127 | ) | ||||||||||||||||||||||||
| Corporate equities | 288 | (63 | ) | 113 | (127 | ) | � | � | (21 | ) | 190 | (72 | ) | |||||||||||||||||||||||
| Net derivative and other contracts(3): | ||||||||||||||||||||||||||||||||||||
| Interest rate contracts | (82 | ) | 28 | 6 | � | (34 | ) | 135 | 60 | 113 | 36 | |||||||||||||||||||||||||
| Credit contracts | 1,822 | (1,674 | ) | 266 | � | (703 | ) | (295 | ) | 437 | (147 | ) | (1,723 | ) | ||||||||||||||||||||||
| Foreign exchange contracts | (359 | ) | 130 | � | � | � | 281 | 16 | 68 | 124 | ||||||||||||||||||||||||||
| Equity contracts | (1,144 | ) | 463 | 170 | (74 | ) | (318 | ) | (11 | ) | 83 | (831 | ) | 61 | ||||||||||||||||||||||
| Commodity contracts | 709 | 200 | 41 | � | (36 | ) | (29 | ) | (5 | ) | 880 | 174 | ||||||||||||||||||||||||
| Other | (7 | ) | (6 | ) | � | � | � | 9 | � | (4 | ) | (7 | ) | |||||||||||||||||||||||
| Total net derivative and other contracts | 939 | (859 | ) | 483 | (74 | ) | (1,091 | ) | 90 | 591 | 79 | (1,335 | ) | |||||||||||||||||||||||
| Investments: | ||||||||||||||||||||||||||||||||||||
| Principal investments | 2,833 | 110 | 111 | (445 | ) | � | � | (449 | ) | 2,160 | 3 | |||||||||||||||||||||||||
| Other | 486 | 76 | 13 | (36 | ) | � | � | (1 | ) | 538 | 77 | |||||||||||||||||||||||||
| Intangible assets | 7 | 9 | � | � | � | (8 | ) | � | 8 | 3 | ||||||||||||||||||||||||||
| Liabilities at Fair Value | ||||||||||||||||||||||||||||||||||||
| Short-term borrowings | $ | 19 | $ | � | $ | � | $ | � | $ | � | $ | (1 | ) | $ | (17 | ) | $ | 1 | $ | � | ||||||||||||||||
| Trading liabilities: | ||||||||||||||||||||||||||||||||||||
| Corporate and other debt: | ||||||||||||||||||||||||||||||||||||
| Residential mortgage-backed securities | 4 | 4 | � | � | � | � | � | � | 4 | |||||||||||||||||||||||||||
| Corporate bonds | 177 | 28 | (64 | ) | 43 | � | � | (106 | ) | 22 | 28 | |||||||||||||||||||||||||
| Lending commitments | 46 | 44 | � | � | � | � | � | 2 | 44 | |||||||||||||||||||||||||||
| Other debt | 49 | 2 | � | 5 | � | (6 | ) | 2 | 48 | 2 | ||||||||||||||||||||||||||
| Total corporate and other debt | 276 | 78 | (64 | ) | 48 | � | (6 | ) | (104 | ) | 72 | 78 | ||||||||||||||||||||||||
| Corporate equities | 5 | 1 | (26 | ) | 29 | � | � | 1 | 8 | 3 | ||||||||||||||||||||||||||
| Securities sold under agreements to repurchase | 151 | (3 | ) | � | � | � | � | � | 154 | (3 | ) | |||||||||||||||||||||||||
| Other secured financings | 406 | 11 | � | � | 19 | (136 | ) | � | 278 | 4 | ||||||||||||||||||||||||||
| Long-term borrowings | 2,789 | (162 | ) | � | � | 877 | (606 | ) | (1,335 | ) | 1,887 | (138 | ) | |||||||||||||||||||||||
| (1) | Total realized and unrealized gains (losses) are primarily included in Trading revenues in the consolidated statements of income except for Trading assets�Investments, which is included in Investments revenues. |
| (2) | Loan originations are included in purchases. |
| (3) | Net derivative and other contracts represent Trading assets�Derivative and other contracts, net of Trading liabilities�Derivative and other contracts. For further information on derivative instruments and hedging activities, see Note 4. |
| (4) | Net liability Level 3 derivative equity contracts increased by $785 million to correct the fair value level assigned to these contracts at December�31, 2014. The total amount of derivative equity contracts remained unchanged at December�31, 2014. |
| (5) | During 2014, the Company incurred a charge of approximately $468 million related to the implementation of FVA, which was recognized in Trading revenues. For further information on the implementation of FVA, see Note 2. |
| 153 | |
| Balance at December�31, 2015 | Valuation�Technique(s)�/ Significant�Unobservable�Input(s)�/ Sensitivity�of�the�Fair�Value�to�Changes in the Unobservable Inputs | Range(1) | Averages(2) | |||||||||||
| (dollars�in�millions) | ||||||||||||||
| Assets at Fair Value | ||||||||||||||
| Trading assets: | ||||||||||||||
| Corporate and other debt: | ||||||||||||||
| Residential mortgage-backed securities | $ | 341 | Comparable�pricing: | |||||||||||
| Comparable�bond�price�/ (A) | 0�to�75�points | 32�points | ||||||||||||
| Commercial mortgage-backed securities | 72 | Comparable pricing: | ||||||||||||
| Comparable bond price / (A) | 0�to�9�points | 2�points | ||||||||||||
| Corporate bonds | 267 | Comparable pricing(3): | ||||||||||||
| Comparable bond price / (A) | 3�to�119�points | 90�points | ||||||||||||
| Comparable pricing: | ||||||||||||||
| EBITDA multiple / (A) | 7�to�9�times | 8�times | ||||||||||||
| Structured bond model: | ||||||||||||||
| Discount rate / (C) | 15% | 15% | ||||||||||||
| Collateralized debt and loan obligations | 430 | Comparable pricing(3): | ||||||||||||
| Comparable�bond�price�/ (A) | 47�to�103�points | 67�points | ||||||||||||
| Correlation model: | ||||||||||||||
| Credit correlation / (B) | 39%�to�60% | 49% | ||||||||||||
| Loans and lending commitments | 5,936 | Corporate loan model: | ||||||||||||
| Credit spread / (C) | 250�to�866�bps | 531�bps | ||||||||||||
| Margin loan model(3): | ||||||||||||||
| Credit spread / (C)(D) | 62�to�499�bps | 145�bps | ||||||||||||
| Volatility skew / (C)(D) | 14%�to�70% | 33% | ||||||||||||
| Discount rate / (C)(D) | 1% to 4% | 2% | ||||||||||||
| Option model: | ||||||||||||||
| Volatility skew / (C) | -1% | -1% | ||||||||||||
| Comparable pricing: | ||||||||||||||
| Comparable loan price / (A) | 35�to�100�points | 88�points | ||||||||||||
| Discounted cash flow: | ||||||||||||||
| Implied weighted average cost of capital�/�(C)(D) | 6% to 8% | 7% | ||||||||||||
| Capitalization rate / (C)(D) | 4%�to�10% | 4% | ||||||||||||
| | 154 |
| Balance at December�31, 2015 | Valuation�Technique(s)�/ Significant�Unobservable�Input(s)�/ Sensitivity�of�the�Fair�Value�to�Changes in the Unobservable Inputs | Range(1) | Averages(2) | |||||||||||
| (dollars�in�millions) | ||||||||||||||
| Other debt | 448 | Comparable pricing: | ||||||||||||
| Comparable loan price / (A) | 4�to�84�points | 59�points | ||||||||||||
| Comparable pricing: | ||||||||||||||
| Comparable bond price / (A) | 8�points | 8�points | ||||||||||||
| Option model: | ||||||||||||||
| At the money volatility / (C) | 16%�to�53% | 53% | ||||||||||||
| Margin loan model(3): | ||||||||||||||
| Discount rate / (C) | 1% | 1% | ||||||||||||
| Corporate equities | 433 | Comparable pricing: | ||||||||||||
| Comparable price / (A) | 50%�to�80% | 72% | ||||||||||||
| Comparable pricing(3): | ||||||||||||||
| Comparable equity price / (A) | 100% | 100% | ||||||||||||
| Market approach: | ||||||||||||||
| EBITDA multiple / (A) | 9�times | 9�times | ||||||||||||
| Net derivative and other contracts(4): | ||||||||||||||
| Interest rate contracts | 260 | Option model: | ||||||||||||
| Interest rate volatility concentration liquidity multiple / (C)(D) | 0 to 3�times | 2�times | ||||||||||||
| Interest rate-Foreign exchange correlation / (C)(D) | 25%�to�62% | 43%�/�43%(5) | ||||||||||||
| Interest rate volatility skew / (A)(D) | 29%�to�82% | 43% / 40%(5) | ||||||||||||
| Interest�rate�quanto�correlation�/(A)(D) | -8% to 36% | 5% / -6%(5) | ||||||||||||
| Interest rate curve correlation / (C)(D) | 24%�to�95% | 60% / 69%(5) | ||||||||||||
| Inflation volatility / (A)(D) | 58% | 58% / 58%(5) | ||||||||||||
| Interest rate-Inflation correlation / (A)(D) | -41%�to�-39% | -41%�/�-41%(5) | ||||||||||||
| Credit contracts | (844 | ) | Comparable pricing: | |||||||||||
| Cash synthetic basis / (C)(D) | 5�to�12�points | 9�points | ||||||||||||
| Comparable bond price / (C)(D) | 0�to�75�points | 24�points | ||||||||||||
| Correlation model(3): | ||||||||||||||
| Credit correlation / (B) | 39%�to�97% | 57% | ||||||||||||
| Foreign exchange contracts(6) | 141 | Option model: | ||||||||||||
| Interest rate-Foreign exchange correlation / (C)(D) | 25%�to�62% | 43%�/�43%(5) | ||||||||||||
| Interest rate volatility skew / (A)(D) | 29%�to�82% | 43%�/�40%(5) | ||||||||||||
| Interest rate curve / (A)(D) | 0% | 0%�/�0%(5) | ||||||||||||
| Equity contracts(6) | (2,031 | ) | Option model: | |||||||||||
| At the money volatility / (A)(D) | 16%�to�65% | 32% | ||||||||||||
| Volatility skew / (A)(D) | -3% to 0% | -1% | ||||||||||||
| Equity-Equity correlation / (C)(D) | 40%�to�99% | 71% | ||||||||||||
| Equity-Foreign exchange correlation / (A)(D) | -60%�to�-11% | -39% | ||||||||||||
| Equity-Interest rate correlation /(C)(D) | -29% to�50% | 16%�/�8%(5) | ||||||||||||
| Commodity contracts | 1,050 | Option model: | ||||||||||||
| Forward power price / (C)(D) | $3�to�$91�per | $32�per | ||||||||||||
| megawatt�hour | megawatt�hour | |||||||||||||
| Commodity volatility / (A)(D) | 10%�to�92% | 18% | ||||||||||||
| Cross commodity correlation / (C)(D) | 43%�to�99% | 93% | ||||||||||||
| 155 | |
| Balance at December�31, 2015 | Valuation�Technique(s)�/ Significant�Unobservable�Input(s)�/ Sensitivity�of�the�Fair�Value�to�Changes in the Unobservable Inputs | Range(1) | Averages(2) | |||||||||||
| (dollars�in�millions) | ||||||||||||||
| Investments: | ||||||||||||||
| Principal investments | 486 | Discounted cash flow: | ||||||||||||
| Implied weighted average cost of capital / (C)(D) | 16% | 16% | ||||||||||||
| Exit multiple / (A)(D) | 8�to�14�times | 9�times | ||||||||||||
| Capitalization rate / (C)(D) | 5% to 9% | 6% | ||||||||||||
| Equity discount rate / (C)(D) | 20%�to�35% | 26% | ||||||||||||
| Market approach(3): | ||||||||||||||
| EBITDA multiple / (A)(D) | 8�to�20�times | 11�times | ||||||||||||
| Forward capacity price / (A)(D) | $5 to $9 | $7 | ||||||||||||
| Comparable pricing: | ||||||||||||||
| Comparable equity price / (A) | 43%�to�100% | 81% | ||||||||||||
| Other | 221 | Discounted cash flow: | ||||||||||||
| Implied weighted average cost of capital / (C)(D) | 10% | 10% | ||||||||||||
| Exit multiple / (A)(D) | 13�times | 13�times | ||||||||||||
| Market approach: | ||||||||||||||
| EBITDA multiple / (A) | 7�to�14�times | 12�times | ||||||||||||
| Comparable pricing(3): | ||||||||||||||
| Comparable equity price / (A) | 100% | 100% | ||||||||||||
| Liabilities at Fair Value | ||||||||||||||
| Securities sold under agreements to repurchase | 151 | Discounted cash flow: | ||||||||||||
| Funding spread / (A) | 86�to�116�bps | 105�bps | ||||||||||||
| Other secured financings | 461 | Option model: | ||||||||||||
| Volatility skew / (C) | -1% | -1% | ||||||||||||
| Discounted cash flow(3): | ||||||||||||||
| Discount rate / (C) | 4%�to�13% | 4% | ||||||||||||
| Discounted cash flow: | ||||||||||||||
| Funding spread / (A) | 95�to�113�bps | 104�bps | ||||||||||||
| Long-term borrowings | 1,987 | Option model(3): | ||||||||||||
| At the money volatility / (C)(D) | 20%�to�50% | 29% | ||||||||||||
| Volatility skew / (A)(D) | -1%�to�0% | -1% | ||||||||||||
| Equity-Equity correlation / (A)(D) | 40%�to�97% | 77% | ||||||||||||
| Equity-Foreign exchange correlation / (C)(D) | -70%�to�-11% | -39% | ||||||||||||
| Option model: | ||||||||||||||
| Interest rate volatility skew / (A)(D) | 50% | 50% | ||||||||||||
| Equity volatility discount / (A)(D) | 10% | 10% | ||||||||||||
| Correlation model: | ||||||||||||||
| Credit correlation / (B) | 40%�to�60% | 52% | ||||||||||||
| Comparable pricing: | ||||||||||||||
| Comparable equity price / (A) | 100% | 100% | ||||||||||||
| Balance at December�31, 2014 | Valuation Technique(s) / Significant Unobservable Input(s) / Sensitivity�of�the�Fair�Value�to�Changes in the Unobservable Inputs | Range(1) | Averages(2) | |||||||||||
| (dollars�in�millions) | ||||||||||||||
| Assets at Fair Value | ||||||||||||||
| Trading assets: | ||||||||||||||
| Corporate and other debt: | ||||||||||||||
| Residential mortgage-backed securities | $ | 175 | Comparable pricing: | |||||||||||
| Comparable bond price / (A) | 3�to�90�points | 15�points | ||||||||||||
| Commercial mortgage-backed securities | 96 | Comparable pricing: | ||||||||||||
| Comparable bond price / (A) | 0�to�7�points | 1�point | ||||||||||||
| | 156 |
| Balance at December�31, 2014 | Valuation Technique(s) / Significant Unobservable Input(s) / Sensitivity�of�the�Fair�Value�to�Changes in the Unobservable Inputs | Range(1) | Averages(2) | |||||||||||
| (dollars�in�millions) | ||||||||||||||
| Asset-backed securities | 76 | Comparable pricing: | ||||||||||||
| Comparable bond price / (A) | 0�to�62�points | 23�points | ||||||||||||
| Corporate bonds | 386 | Comparable pricing: | ||||||||||||
| Comparable bond price / (A) | 1�to�160�points | 90�points | ||||||||||||
| Collateralized debt and loan obligations | 1,152 | Comparable pricing(3): | ||||||||||||
| Comparable bond price / (A) | 20�to�100�points | 66�points | ||||||||||||
| Correlation model: | ||||||||||||||
| Credit correlation / (B) | 47%�to�65% | 56% | ||||||||||||
| Loans and lending commitments | 5,874 | Corporate loan model: | ||||||||||||
| Credit spread / (C) | 36�to�753�bps | 373�bps | ||||||||||||
| Margin loan model: | ||||||||||||||
| Credit spread / (C)(D) | 150�to�451�bps | 216�bps | ||||||||||||
| Volatility skew / (C)(D) | 3%�to�37% | 21% | ||||||||||||
| Discount rate / (C)(D) | 2% to 3% | 3% | ||||||||||||
| Option model: | ||||||||||||||
| Volatility skew / (C) | -1% | -1% | ||||||||||||
| Comparable pricing(3): | ||||||||||||||
| Comparable loan price / (A) | 15�to�105�points | 89�points | ||||||||||||
| Other debt | 285 | Comparable pricing(3): | ||||||||||||
| Comparable loan price / (A) | 0�to�75�points | 39�points | ||||||||||||
| Comparable pricing: | ||||||||||||||
| Comparable bond price / (A) | 15�points | 15�points | ||||||||||||
| Option model: | ||||||||||||||
| At the money volatility / (A) | 15%�to�54% | 15% | ||||||||||||
| Corporate equities | 272 | Net asset value: | ||||||||||||
| Discount to net asset value / (C) | 0%�to�71% | 36% | ||||||||||||
| Comparable pricing: | ||||||||||||||
| Comparable price / (A) | 83%�to�96% | 85% | ||||||||||||
| Comparable pricing(3): | ||||||||||||||
| Comparable equity price / (A) | 100% | 100% | ||||||||||||
| Market approach: | ||||||||||||||
| EBITDA multiple / (A)(D) | 6�to�9�times | 8�times | ||||||||||||
| Price / Book ratio / (A)(D) | 0�times | 0�times | ||||||||||||
| Net derivative and other contracts(4): | ||||||||||||||
| Interest rate contracts | (173 | ) | Option model: | |||||||||||
| Interest rate volatility concentration liquidity multiple�/�(C)(D) | 0�to�3�times | 2�times | ||||||||||||
| Interest rate-Foreign exchange correlation / (A)(D) | 28%�to�62% | 44%�/��42%(5) | ||||||||||||
| Interest rate volatility�skew / (A)(D) | 38%�to�104% | 86%�/�60%(5) | ||||||||||||
| Interest rate quanto�correlation / (A)(D) | -9%�to�35% | 6%�/-6%(5) | ||||||||||||
| Interest rate curve correlation / (A)(D) | 44%�to�87% | 73%�/�80%(5) | ||||||||||||
| Inflation volatility / (A)(D) | 69%�to�71% | 70%�/�71%(5) | ||||||||||||
| Interest�rate-Inflation�correlation�/ (A)(D) | -44%�to�-40% | -42%�/�-43%(5) | ||||||||||||
| Credit contracts | (743 | ) | Comparable pricing: | |||||||||||
| Cash synthetic basis / (C)(D) | 5�to�13�points | 9�points | ||||||||||||
| Comparable bond price / (C)(D) | 0�to�55�points | 18�points | ||||||||||||
| Correlation model(3): | ||||||||||||||
| Credit correlation / (B) | 42%�to�95% | 63% | ||||||||||||
| 157 | |
| Balance at December�31, 2014 | Valuation Technique(s) / Significant Unobservable Input(s) / Sensitivity�of�the�Fair�Value�to�Changes in the Unobservable Inputs | Range(1) | Averages(2) | |||||||||||
| (dollars�in�millions) | ||||||||||||||
| Foreign exchange contracts(6) | 151 | Option model: | ||||||||||||
| Interest rate quanto correlation�/�(A)(D) | -9%�to�35% | 6%�/�-�6%(5) | ||||||||||||
| Interest rate-Credit spread correlation�/�(A)(D) | -54%�to�-2% | -17%�/�-�11%(5) | ||||||||||||
| Interest rate curve correlation�/�(A)(D) | 44%�to�87% | 73%�/�80%(5) | ||||||||||||
| Interest rate-Foreign exchange correlation / (A)(D) | 28%�to�62% | 44%�/42%(5) | ||||||||||||
| Interest rate curve / (A)(D) | 0% to 2% | 1%�/�1�%(5) | ||||||||||||
| Equity contracts(6)(7) | (2,165 | ) | Option model: | |||||||||||
| At the money volatility / (A)(D) | 14%�to�51% | 29% | ||||||||||||
| Volatility skew / (A)(D) | -2% to 0% | -1% | ||||||||||||
| Equity-Equity correlation / (C)(D) | 40%�to�99% | 72% | ||||||||||||
| Equity-Foreign exchange correlation�/�(C)(D) | -50%�to�10% | -16% | ||||||||||||
| Equity-Interest rate correlation /�(C)(D) | -18%�to�81% | 26%�/11%(5) | ||||||||||||
| Commodity contracts | 1,146 | Option model: | ||||||||||||
| Forward power price / (C)(D) | $5�to�$106�per | $38�per | ||||||||||||
| megawatt�hour | megawatt�hour | |||||||||||||
| Commodity volatility / (A)(D) | 11%�to�90% | 19% | ||||||||||||
| Cross commodity correlation / (C)(D) | 33%�to�100% | 93% | ||||||||||||
| Investments: | ||||||||||||||
| Principal investments | 835 | Discounted cash flow: | ||||||||||||
| Implied�weighted�average�cost�of�capital / (C)(D) | 11% | 11% | ||||||||||||
| Exit multiple / (A)(D) | 10�times | 10�times | ||||||||||||
| Discounted cash flow: | ||||||||||||||
| Equity discount rate / (C) | 25% | 25% | ||||||||||||
| Market approach(3): | ||||||||||||||
| EBITDA multiple / (A)(D) | 4�to�14�times | 10�times | ||||||||||||
| Price / Earnings ratio / (A)(D) | 23�times | 23�times | ||||||||||||
| Forward capacity price / (A)(D) | $5 to $7 | $7 | ||||||||||||
| Comparable pricing: | ||||||||||||||
| Comparable equity price / (A) | 64%�to�100% | 95% | ||||||||||||
| Other | 323 | Discounted cash flow: | ||||||||||||
| Implied weighted average cost of capital / (C)(D) | 10%�to�13% | 11% | ||||||||||||
| Exit multiple / (A)(D) | 6�to�9�times | 9�times | ||||||||||||
| Market approach: | ||||||||||||||
| EBITDA multiple / (A)(D) | 9�to�13�times | 10�times | ||||||||||||
| Comparable pricing(3): | ||||||||||||||
| Comparable equity price / (A) | 100% | 100% | ||||||||||||
| Liabilities at Fair Value | ||||||||||||||
| Trading liabilities: | ||||||||||||||
| Corporate and other debt: | ||||||||||||||
| Corporate bonds | $ | 78 | Option model: | |||||||||||
| Volatility skew / (C)(D) | -1% | -1% | ||||||||||||
| At the money volatility / (C)(D) | 10% | 10% | ||||||||||||
| Securities sold under agreements to repurchase | 153 | Discounted cash flow: | ||||||||||||
| Funding spread / (A) | 75�to�91�bps | 86�bps | ||||||||||||
| Other secured financings | 149 | Comparable pricing: | ||||||||||||
| Comparable bond price / (A) | 99�to�101�points | 100�points | ||||||||||||
| Discounted cash flow(3): | ||||||||||||||
| Funding spread / (A) | 82�to�98�bps | 95�bps | ||||||||||||
| | 158 |
| Balance at December�31, 2014 | Valuation Technique(s) / Significant Unobservable Input(s) / Sensitivity�of�the�Fair�Value�to�Changes in the Unobservable Inputs | Range(1) | Averages(2) | |||||||||||
| (dollars�in�millions) | ||||||||||||||
| Long-term borrowings | 1,934 | Option model(3): | ||||||||||||
| At the money volatility / (C)(D) | 18%�to�32% | 27% | ||||||||||||
| Volatility skew / (A)(D) | -1%�to�0% | 0% | ||||||||||||
| Equity - Equity correlation / (A)(D) | 40%�to�90% | 68% | ||||||||||||
| Equity - Foreign exchange correlation�/�(C)(D) | -73%�to�30% | -32% | ||||||||||||
| Option model: | ||||||||||||||
| Equity alpha / (A) | 0% to 94% | 67% | ||||||||||||
| Correlation model: | ||||||||||||||
| Credit correlation / (B) | 48%�to�65% | 51% | ||||||||||||
| (1) | The range of significant unobservable inputs is represented in points, percentages, basis points, times or megawatt hours. Points are a percentage of par; for example, 75 points would be 75% of par. A basis point equals 1/100th of 1%; for example, 866 bps would equal 8.66%. |
| (2) | Amounts represent weighted averages except where simple averages and the median of the inputs are provided (see footnote 5 below). Weighted averages are calculated by weighting each input by the fair value of the respective financial instruments except for collateralized debt and loan obligations, principal investments, other debt, corporate bonds, long-term borrowings and derivative instruments where some or all inputs are weighted by risk. |
| (3) | This is the predominant valuation technique for this major asset or liability class. |
| (4) | Credit valuation adjustments (�CVA�) and FVA are included in the balance but excluded from the Valuation Technique(s) and Significant Unobservable Input(s) in the table above. CVA is a Level 3 input when the underlying counterparty credit curve is unobservable. FVA is a Level 3 input in its entirety given the lack of observability of funding spreads in the principal market. |
| (5) | The data structure of the significant unobservable inputs used in valuing interest rate contracts, foreign exchange contracts and certain equity contracts may be in a multi-dimensional form, such as a curve or surface, with risk distributed across the structure. Therefore, a simple average and median, together with the range of data inputs, may be more appropriate measurements than a single point weighted average. |
| (6) | Includes derivative contracts with multiple risks ( i.e., hybrid products). |
| (7) | Net liability Level 3 derivative equity contracts increased by $785 million to correct the fair value level assigned to these contracts at December�31, 2014. This correction did not result in a change to the Valuation Technique(s), Significant Unobservable Inputs, Range or Averages. |
| (A) | Significant increase (decrease) in the unobservable input in isolation would result in a significantly higher (lower) fair value measurement. |
| (B) | Significant changes in credit correlation may result in a significantly higher or lower fair value measurement. Increasing (decreasing) correlation drives a redistribution of risk within the capital structure such that junior tranches become less (more) risky and senior tranches become more (less) risky. |
| (C) | Significant increase (decrease) in the unobservable input in isolation would result in a significantly lower (higher) fair value measurement. |
| (D) | There are no predictable relationships between the significant unobservable inputs. |
| � | Capitalization rate �the ratio between net operating income produced by an asset and its market value at the projected disposition date. |
| � | Cash synthetic basis �the measure of the price differential between cash financial instruments and their synthetic derivative-based equivalents. The range disclosed in the table above signifies the number of points by which the synthetic bond equivalent price is higher than the quoted price of the underlying cash bonds. |
| � | Comparable bond price �a pricing input used when prices for the identical instrument are not available. Significant subjectivity may be involved when fair value is determined using pricing data available for comparable instruments. Valuation using comparable instruments can be done by calculating an implied yield (or spread over a liquid benchmark) from the price of a comparable bond, then adjusting that yield (or spread) to derive a value for the bond. The adjustment to yield (or spread) should account for relevant differences in the bonds such as maturity or credit quality. |
| 159 | |
| � | Comparable equity price� a price derived from equity raises, share buybacks and external bid levels, etc. A discount or premium may be included in the fair value estimate. |
| � | Correlation� a pricing input where the payoff is driven by more than one underlying risk. Correlation is a measure of the relationship between the movements of two variables ( i.e ., how the change in one variable influences a change in the other variable). Credit correlation, for example, is the factor that describes the relationship between the probability of individual entities to default on obligations and the joint probability of multiple entities to default on obligations. |
| � | Credit spread �the difference in yield between different securities due to differences in credit quality. The credit spread reflects the additional net yield an investor can earn from a security with more credit risk relative to one with less credit risk. The credit spread of a particular security is often quoted in relation to the yield on a credit risk-free benchmark security or reference rate, typically either U.S. Treasury or London Interbank Offered Rate (�LIBOR�). |
| � | EBITDA multiple / Exit multiple �the ratio of the Enterprise Value to EBITDA, where the Enterprise Value is the aggregate value of equity and debt minus cash and cash equivalents. The EBITDA multiple reflects the value of the company in terms of its full-year EBITDA, whereas the exit multiple reflects the value of the company in terms of its full-year expected EBITDA at exit. Either multiple allows comparison between companies from an operational perspective as the effect of capital structure, taxation and depreciation/amortization is excluded. |
| � | Equity alpha� a parameter used in the modeling of equity hybrid prices. |
| � | Funding spread �the difference between the general collateral rate (which refers to the rate applicable to a broad class of U.S. Treasury issuances) and the specific collateral rate (which refers to the rate applicable to a specific type of security pledged as collateral, such as a municipal bond). Repurchase agreements and certain other secured financings are discounted based on collateral curves. The curves are constructed as spreads over the corresponding overnight indexed swap (�OIS�) or LIBOR curves, with the short end of the curve representing spreads over the corresponding OIS curves and the long end of the curve representing spreads over LIBOR. |
| � | Implied weighted average cost of capital (�WACC�) �the WACC implied by the current value of equity in a discounted cash flow model. The model assumes that the cash flow assumptions, including projections, are fully reflected in the current equity value, while the debt to equity ratio is held constant. The WACC theoretically represents the required rate of return to debt and equity investors. |
| � | Interest rate curve �the term structure of interest rates (relationship between interest rates and the time to maturity) and a market�s measure of future interest rates at the time of observation. An interest rate curve is used to set interest rate and foreign exchange derivative cash flows and is a pricing input used in the discounting of any OTC derivative cash flow. |
| � | Price / Book ratio �the ratio used to compare a stock�s market value with its book value. The ratio is calculated by dividing the current closing price of the stock by the latest book value per share. This multiple allows comparison between companies from an operational perspective. |
| | 160 |
| � | Price / Earnings ratio �the ratio used to measure a company�s equity value in relation to its earnings. The ratio is calculated by dividing the equity value per share by the latest historical or forward-looking earnings per share. The ratio results in a standardized metric that allows comparison between companies, after also considering the effects of different leverage ratios and taxation rates. |
| � | Volatility �the measure of the variability in possible returns for an instrument given how much that instrument changes in value over time. Volatility is a pricing input for options, and, generally, the lower the volatility, the less risky the option. The level of volatility used in the valuation of a particular option depends on a number of factors, including the nature of the risk underlying that option ( e.g. , the volatility of a particular underlying equity security may be significantly different from that of a particular underlying commodity index), the tenor and the strike price of the option. |
| � | Volatility skew �the measure of the difference in implied volatility for options with identical underliers and expiry dates but with different strikes. The implied volatility for an option with a strike price that is above or below the current price of an underlying asset will typically deviate from the implied volatility for an option with a strike price equal to the current price of that same underlying asset. |
| At December�31, 2015 | At December�31, 2014 | |||||||||||||||
| Fair�Value | Commitment | Fair�Value | Commitment | |||||||||||||
| (dollars in millions) | ||||||||||||||||
| Private equity funds | $ | 1,917 | $ | 538 | $ | 2,569 | $ | 613 | ||||||||
| Real estate funds | 1,337 | 128 | 1,753 | 112 | ||||||||||||
| Hedge funds(1): | ||||||||||||||||
| Long-short equity hedge funds | 422 | � | 433 | � | ||||||||||||
| Fixed income/credit-related hedge funds | 71 | � | 76 | � | ||||||||||||
| Event-driven hedge funds | 2 | � | 39 | � | ||||||||||||
| Multi-strategy hedge funds | 94 | 4 | 139 | 3 | ||||||||||||
| Total | $ | 3,843 | $ | 670 | $ | 5,009 | $ | 728 | ||||||||
| (1) | Fixed income/credit-related hedge funds, event-driven hedge funds and multi-strategy hedge funds are redeemable at least on a three-month period basis, primarily with a notice period of 90 days or less. At December�31, 2015, approximately 34% of the fair value amount of long-short equity hedge funds was redeemable at least quarterly, 51% is redeemable every six months and 15% of these funds have a redemption frequency of greater than six months. At December�31, 2014, approximately 36% of the fair value amount of long-short equity hedge funds was redeemable at least quarterly, 47% is redeemable every six months and 17% of these funds have a redemption frequency of greater than six months. The notice period for long-short equity hedge funds at December�31, 2015 and December�31, 2014 was primarily greater than six months. |
| 161 | |
| At December�31, 2015 | ||||||||||||||||
| Fund Type | Less�than�5�years | 5-10�years | Over�10�years | Total | ||||||||||||
| (dollars in millions) | ||||||||||||||||
| Private equity funds | $ | 142 | $ | 1,095 | $ | 680 | $ | 1,917 | ||||||||
| Real estate funds | 128 | 753 | 456 | 1,337 | ||||||||||||
| At�December�31,�2015 | ||||
| Hedge Fund Type | Fair Value | |||
| (dollars in millions) | ||||
| Long-short equity(1) | $ | 422 | ||
| Fixed income/credit-related(2) | 71 | |||
| Event-driven | 2 | |||
| Multi-strategy(3)(4) | 94 | |||
| (1) | Investments representing approximately 12% of the fair value of investments cannot be redeemed currently because an exit restriction has been imposed by the hedge fund manager. The restriction period for these investments subject to an exit restriction was indefinite at December�31, 2015. |
| (2) | Investments representing approximately 80% of the fair value of investments cannot be redeemed currently because an exit restriction has been imposed by the hedge fund manager. The restriction period for these investments subject to an exit restriction was indefinite at December�31, 2015. |
| (3) | Investments representing approximately 16% of the fair value of investments cannot be redeemed currently because the investments include certain initial period lock-up restrictions. The remaining restriction period subject to lock-up restrictions was primarily over three years at December�31, 2015. |
| (4) | Investments representing approximately 3% of the fair value of investments cannot be redeemed currently because an exit restriction has been imposed by the hedge fund manager. The restriction period for these investments subject to an exit restriction was indefinite at December�31, 2015. |
| | 162 |
| Trading Revenues | Interest Income (Expense) | Gains (Losses) Included�in Net�Revenues | ||||||||||
| (dollars in millions) | ||||||||||||
| 2015 | ||||||||||||
| Securities purchased under agreements to resell | $ | (6 | ) | $ | 10 | $ | 4 | |||||
| Short-term borrowings(1) | 63 | � | 63 | |||||||||
| Securities sold under agreements to repurchase | 13 | (6 | ) | 7 | ||||||||
| Long-term borrowings(1) | 2,404 | (528 | ) | 1,876 | ||||||||
| 2014 | ||||||||||||
| Securities purchased under agreements to resell | $ | (4 | ) | $ | 9 | $ | 5 | |||||
| Short-term borrowings(1) | (136 | ) | 1 | (135 | ) | |||||||
| Securities sold under agreements to repurchase | (5 | ) | (6 | ) | (11 | ) | ||||||
| Long-term borrowings(1) | 1,867 | (638 | ) | 1,229 | ||||||||
| 2013 | ||||||||||||
| Securities purchased under agreements to resell | $ | (1 | ) | $ | 6 | $ | 5 | |||||
| Deposits | 52 | (60 | ) | (8 | ) | |||||||
| Short-term borrowings(1) | 181 | (8 | ) | 173 | ||||||||
| Securities sold under agreements to repurchase | (3 | ) | (6 | ) | (9 | ) | ||||||
| Long-term borrowings(1) | 664 | (971 | ) | (307 | ) | |||||||
| (1) | Of the total gains (losses) recorded in Trading revenues for short-term and long-term borrowings for 2015, 2014 and 2013, $618 million, $651 million and $(681) million, respectively, are attributable to changes in the credit quality of the Company and other credit factors, and the respective remainder is attributable to changes in foreign currency rates or interest rates or movements in the reference price or index for structured notes before the impact of related hedges. |
| Business Unit Responsible for Risk Management | At�December�31,�2015 | At�December�31,�2014 | ||||||
| (dollars in millions) | ||||||||
| Equity | $ | 17,789 | $ | 17,253 | ||||
| Interest rates | 14,255 | 13,545 | ||||||
| Credit and foreign exchange | 2,266 | 2,105 | ||||||
| Commodities | 383 | 636 | ||||||
| Total | $ | 34,693 | $ | 33,539 | ||||
| 2015 | 2014 | 2013 | ||||||||||
| (dollars in millions) | ||||||||||||
| Short-term and long-term borrowings(1) | $ | 618 | $ | 651 | $ | (681 | ) | |||||
| Loans and other debt(2) | (193 | ) | 179 | 137 | ||||||||
| Lending commitments(3) | 12 | 30 | 255 | |||||||||
| (1) | The change in the fair value of short-term and long-term borrowings (primarily structured notes) includes an adjustment to reflect the change in credit quality of the Company based upon observations of its secondary bond market spreads and changes in other credit factors. |
| 163 | |
| (2) | Loans and other debt instrument-specific credit gains (losses) were determined by excluding the non-credit components of gains and losses, such as those due to changes in interest rates. |
| (3) | Gains (losses) on lending commitments were generally determined based on the differential between estimated expected client yields and contractual yields at each respective period-end. |
| At�December�31,�2015 | At�December�31,�2014 | |||||||
| (dollars in millions) | ||||||||
| Loans and other debt(1) | $ | 14,095 | $ | 14,990 | ||||
| Loans 90 or more days past due and/or on nonaccrual status(1)(2) | 11,651 | 12,916 | ||||||
| Short-term and long-term borrowings(3) | 508 | (670 | ) | |||||
| (1) | The majority of the difference between principal and fair value amounts for loans and other debt emanates from the distressed debt trading business, which purchases distressed debt at amounts well below par. |
| (2) | The aggregate fair value of loans that were in nonaccrual status, which includes all loans 90 or more days past due, was $1,853 million and $1,367 million at December�31, 2015 and December�31, 2014, respectively. The aggregate fair value of loans that were 90 or more days past due was $885 million and $643 million at December�31, 2015 and December�31, 2014, respectively. |
| (3) | Short-term and long-term borrowings do not include structured notes where the repayment of the initial principal amount fluctuates based on changes in the reference price or index. |
| Carrying�Value at�December�31, 2015 | Fair�Value�Measurements�Using: | Total Gains (Losses)�for 2015(1) | ||||||||||||||||||
| Level�1 | Level�2 | Level�3 | ||||||||||||||||||
| (dollars in millions) | ||||||||||||||||||||
| Assets: | ||||||||||||||||||||
| Loans(2) | $ | 5,850 | $ | � | $ | 3,400 | $ | 2,450 | $ | (220 | ) | |||||||||
| Other investments(3) | � | � | � | � | (3 | ) | ||||||||||||||
| Premises, equipment and software costs(4) | � | � | � | � | (44 | ) | ||||||||||||||
| Other assets(4) | 31 | � | 31 | � | (22 | ) | ||||||||||||||
| Total assets | $ | 5,881 | $ | � | $ | 3,431 | $ | 2,450 | $ | (289 | ) | |||||||||
| Liabilities: | ||||||||||||||||||||
| Other liabilities and accrued expenses(2) | $ | 476 | $ | � | $ | 418 | $ | 58 | $ | (207 | ) | |||||||||
| Total liabilities | $ | 476 | $ | � | $ | 418 | $ | 58 | $ | (207 | ) | |||||||||
| | 164 |
| Carrying�Value at�December�31, 2014 | Fair�Value�Measurements�Using: | Total Gains (Losses)�for 2014(1) | ||||||||||||||||||
| Level�1 | Level�2 | Level�3 | ||||||||||||||||||
| (dollars in millions) | ||||||||||||||||||||
| Assets: | ||||||||||||||||||||
| Loans(2) | $ | 3,336 | $ | � | $ | 2,386 | $ | 950 | $ | (165 | ) | |||||||||
| Other investments(3) | 46 | � | � | 46 | (38 | ) | ||||||||||||||
| Premises, equipment and software costs(4) | � | � | � | � | (58 | ) | ||||||||||||||
| Intangible assets(3) | 46 | � | � | 46 | (6 | ) | ||||||||||||||
| Other assets(4) | � | � | � | � | (9 | ) | ||||||||||||||
| Total assets | $ | 3,428 | $ | � | $ | 2,386 | $ | 1,042 | $ | (276 | ) | |||||||||
| Liabilities: | ||||||||||||||||||||
| Other liabilities and accrued expenses(2) | $ | 219 | $ | � | $ | 178 | $ | 41 | $ | (165 | ) | |||||||||
| Total liabilities | $ | 219 | $ | � | $ | 178 | $ | 41 | $ | (165 | ) | |||||||||
| Carrying�Value at�December�31, 2013 | Fair�Value�Measurements�Using: | Total�Gains (Losses)�for 2013(1) | ||||||||||||||||||
| Level�1 | Level�2 | Level�3 | ||||||||||||||||||
| (dollars in millions) | ||||||||||||||||||||
| Loans(2) | $ | 1,822 | $ | � | $ | 1,616 | $ | 206 | $ | (71 | ) | |||||||||
| Other investments(3) | 46 | � | � | 46 | (38 | ) | ||||||||||||||
| Premises, equipment and software costs(4) | 8 | � | � | 8 | (133 | ) | ||||||||||||||
| Intangible assets(3) | 92 | � | � | 92 | (44 | ) | ||||||||||||||
| Total assets | $ | 1,968 | $ | � | $ | 1,616 | $ | 352 | $ | (286 | ) | |||||||||
| (1) | Changes in the fair value of Loans and losses related to Other investments are recorded within Other revenues in the consolidated statements of income. Losses related to Premises, equipment and software costs, Intangible assets and Other assets are recorded within Other expenses if not held for sale and within Other revenues if held for sale. Losses related to Other liabilities and accrued expenses are recorded within Other revenues and represent non-recurring fair value adjustments for certain lending commitments designated as held for sale. |
| (2) | Non-recurring changes in the fair value of loans and lending commitments held for investment or held for sale were calculated using recently executed transactions; market price quotations; valuation models that incorporate market observable inputs where possible, such as comparable loan or debt prices and credit default swap spread levels adjusted for any basis difference between cash and derivative instruments; or default recovery analysis where such transactions and quotations are unobservable. |
| (3) | Losses related to Other investments and Intangible assets were determined primarily using discounted cash flow models and methodologies that incorporate multiples of certain comparable companies. |
| (4) | Losses related to Premises, equipment and software costs and Other assets were determined primarily using a default recovery analysis. |
| 165 | |
| Asset/Liability | Valuation Technique | |||
| The following longer dated instruments: -Securities purchased under agreements to resell -Securities borrowed -Securities sold under agreements to repurchase -Securities loaned -Other secured financings | Fair value is determined using a standard cash flow discounting methodology. The inputs to the valuation include contractual cash flows and collateral funding spreads, which are estimated using various benchmarks and interest rate yield curves. | |||
| HTM securities | Fair value is determined using quoted market prices. | |||
| Loans | The fair value of consumer and residential real estate loans and lending commitments where position-specific external price data are not observable is determined based on the credit risks of the borrower using a probability of default and loss given default method, discounted at the estimated external cost of funding level. The fair value of corporate loans and lending commitments is determined using the following: -recently executed transactions -market price quotations (where observable) -implied yields from comparable debt -market observable credit default swap spread levels along with proprietary valuation models and default recovery analysis where such transactions and quotations are unobservable | |||
| Long-term borrowings | The fair value is generally determined based on transactional data or third-party pricing for identical or comparable instruments, when available. Where position-specific external prices are not observable, fair value is determined based on current interest rates and credit spreads for debt instruments with similar terms and maturity. | |||
| At December�31, 2015 | Fair Value Measurements Using: | |||||||||||||||||||
| Carrying Value | Fair�Value | Level 1 | Level 2 | Level 3 | ||||||||||||||||
| (dollars in millions) | ||||||||||||||||||||
| Financial Assets: | ||||||||||||||||||||
| Cash and due from banks | $ | 19,827 | $ | 19,827 | $ | 19,827 | $ | � | $ | � | ||||||||||
| Interest bearing deposits with banks | 34,256 | 34,256 | 34,256 | � | � | |||||||||||||||
| Cash deposited with clearing organizations or segregated under federal and other regulations or requirements | 31,469 | 31,469 | 31,469 | � | � | |||||||||||||||
| Investment securities�HTM securities | 5,224 | 5,188 | 998 | 4,190 | � | |||||||||||||||
| Securities purchased under agreements to resell | 86,851 | 86,837 | � | 86,186 | 651 | |||||||||||||||
| Securities borrowed | 142,416 | 142,414 | � | 142,266 | 148 | |||||||||||||||
| Customer and other receivables(1) | 41,676 | 41,576 | � | 36,752 | 4,824 | |||||||||||||||
| Loans(2) | 85,759 | 86,423 | � | 19,241 | 67,182 | |||||||||||||||
| | 166 |
| At December�31, 2015 | Fair Value Measurements Using: | |||||||||||||||||||
| Carrying Value | Fair�Value | Level 1 | Level 2 | Level 3 | ||||||||||||||||
| (dollars in millions) | ||||||||||||||||||||
| Financial Liabilities: | ||||||||||||||||||||
| Deposits | $ | 155,909 | $ | 156,163 | $ | � | $ | 156,163 | $ | � | ||||||||||
| Short-term borrowings | 525 | 525 | � | 525 | � | |||||||||||||||
| Securities sold under agreements to repurchase | 36,009 | 36,060 | � | 34,150 | 1,910 | |||||||||||||||
| Securities loaned | 19,358 | 19,382 | � | 19,192 | 190 | |||||||||||||||
| Other secured financings | 6,610 | 6,610 | � | 5,333 | 1,277 | |||||||||||||||
| Customer and other payables(1) | 183,895 | 183,895 | � | 183,895 | � | |||||||||||||||
| Long-term borrowings | 120,723 | 123,219 | � | 123,219 | � | |||||||||||||||
| At December�31, 2014 | Fair Value Measurements Using: | |||||||||||||||||||
| Carrying Value | Fair Value | Level 1 | Level 2 | Level 3 | ||||||||||||||||
| (dollars in millions) | ||||||||||||||||||||
| Financial Assets: | ||||||||||||||||||||
| Cash and due from banks | $ | 21,381 | $ | 21,381 | $ | 21,381 | $ | � | $ | � | ||||||||||
| Interest bearing deposits with banks | 25,603 | 25,603 | 25,603 | � | � | |||||||||||||||
| Cash deposited with clearing organizations or segregated under federal and other regulations or requirements | 40,607 | 40,607 | 40,607 | � | � | |||||||||||||||
| Investment securities�HTM securities | 100 | 100 | 100 | � | � | |||||||||||||||
| Securities purchased under agreements to resell | 82,175 | 82,165 | � | 81,981 | 184 | |||||||||||||||
| Securities borrowed | 136,708 | 136,708 | � | 136,696 | 12 | |||||||||||||||
| Customer and other receivables(1) | 45,116 | 45,028 | � | 39,945 | 5,083 | |||||||||||||||
| Loans(2) | 66,577 | 67,800 | � | 18,212 | 49,588 | |||||||||||||||
| Financial Liabilities: | ||||||||||||||||||||
| Deposits | $ | 133,544 | $ | 133,572 | $ | � | $ | 133,572 | $ | � | ||||||||||
| Short-term borrowings | 496 | 496 | � | 496 | � | |||||||||||||||
| Securities sold under agreements to repurchase | 69,337 | 69,433 | � | 63,921 | 5,512 | |||||||||||||||
| Securities loaned | 25,219 | 25,244 | � | 24,740 | 504 | |||||||||||||||
| Other secured financings | 7,581 | 7,881 | � | 5,465 | 2,416 | |||||||||||||||
| Customer and other payables(1) | 178,373 | 178,373 | � | 178,373 | � | |||||||||||||||
| Long-term borrowings | 120,998 | 124,961 | � | 124,150 | 811 | |||||||||||||||
| (1) | Accrued interest, fees, and dividend receivables and payables where carrying value approximates fair value have been excluded. |
| (2) | Amounts include all loans measured at fair value on a non-recurring basis. |
| 4. | Derivative Instruments and Hedging Activities. |
| 167 | |
| Derivative Assets at December�31, 2015 | ||||||||||||||||||||||||||||||||
| Fair Value | Notional | |||||||||||||||||||||||||||||||
| Bilateral OTC | Cleared OTC | Exchange Traded | Total | Bilateral OTC | Cleared OTC | Exchange Traded | Total | |||||||||||||||||||||||||
| (dollars in millions) | ||||||||||||||||||||||||||||||||
| Derivatives designated as accounting hedges: | ||||||||||||||||||||||||||||||||
| Interest rate contracts | $ | 2,825 | $ | 1,442 | $ | � | $ | 4,267 | $ | 36,999 | $ | 35,362 | $ | � | $ | 72,361 | ||||||||||||||||
| Foreign exchange contracts | 166 | 1 | � | 167 | 5,996 | 167 | � | 6,163 | ||||||||||||||||||||||||
| Total derivatives designated as accounting hedges | 2,991 | 1,443 | � | 4,434 | 42,995 | 35,529 | � | 78,524 | ||||||||||||||||||||||||
| Derivatives not designated as accounting hedges(1): | ||||||||||||||||||||||||||||||||
| Interest rate contracts | 220,289 | 101,276 | 212 | 321,777 | 4,348,002 | 5,748,525 | 1,218,645 | 11,315,172 | ||||||||||||||||||||||||
| Credit contracts | 19,310 | 3,609 | � | 22,919 | 585,731 | 139,301 | � | 725,032 | ||||||||||||||||||||||||
| Foreign exchange contracts | 64,438 | 295 | 55 | 64,788 | 1,907,290 | 13,402 | 7,715 | 1,928,407 | ||||||||||||||||||||||||
| Equity contracts | 20,212 | � | 20,077 | 40,289 | 316,770 | � | 229,859 | 546,629 | ||||||||||||||||||||||||
| Commodity contracts | 13,114 | � | 4,038 | 17,152 | 67,449 | � | 82,313 | 149,762 | ||||||||||||||||||||||||
| Other | 219 | � | � | 219 | 5,684 | � | � | 5,684 | ||||||||||||||||||||||||
| Total derivatives not designated as accounting hedges | 337,582 | 105,180 | 24,382 | 467,144 | 7,230,926 | 5,901,228 | 1,538,532 | 14,670,686 | ||||||||||||||||||||||||
| Total derivatives | $ | 340,573 | $ | 106,623 | $ | 24,382 | $ | 471,578 | $ | 7,273,921 | $ | 5,936,757 | $ | 1,538,532 | $ | 14,749,210 | ||||||||||||||||
| Cash collateral netting | (50,335 | ) | (1,037 | ) | � | (51,372 | ) | � | � | � | � | |||||||||||||||||||||
| Counterparty netting | (265,707 | ) | (104,294 | ) | (21,592 | ) | (391,593 | ) | � | � | � | � | ||||||||||||||||||||
| Total derivative assets | $ | 24,531 | $ | 1,292 | $ | 2,790 | $ | 28,613 | $ | 7,273,921 | $ | 5,936,757 | $ | 1,538,532 | $ | 14,749,210 | ||||||||||||||||
| Derivative Liabilities at December�31, 2015 | ||||||||||||||||||||||||||||||||
| Fair Value | Notional | |||||||||||||||||||||||||||||||
| Bilateral OTC | Cleared OTC | Exchange Traded | Total | Bilateral OTC | Cleared OTC | Exchange Traded | Total | |||||||||||||||||||||||||
| (dollars in millions) | ||||||||||||||||||||||||||||||||
| Derivatives designated as accounting hedges: | ||||||||||||||||||||||||||||||||
| Interest rate contracts | $ | 20 | $ | 250 | $ | � | $ | 270 | $ | 3,560 | $ | 9,869 | $ | � | $ | 13,429 | ||||||||||||||||
| Foreign exchange contracts | 56 | 6 | � | 62 | 4,604 | 455 | � | 5,059 | ||||||||||||||||||||||||
| Total derivatives designated as accounting hedges | 76 | 256 | � | 332 | 8,164 | 10,324 | � | 18,488 | ||||||||||||||||||||||||
| Derivatives not designated as accounting hedges(1): | ||||||||||||||||||||||||||||||||
| Interest rate contracts | 203,004 | 103,852 | 283 | 307,139 | 4,030,039 | 5,682,322 | 1,077,710 | 10,790,071 | ||||||||||||||||||||||||
| Credit contracts | 19,942 | 3,723 | � | 23,665 | 562,027 | 131,388 | � | 693,415 | ||||||||||||||||||||||||
| Foreign exchange contracts | 65,034 | 232 | 22 | 65,288 | 1,868,015 | 13,322 | 2,655 | 1,883,992 | ||||||||||||||||||||||||
| Equity contracts | 25,708 | � | 20,424 | 46,132 | 332,734 | � | 229,266 | 562,000 | ||||||||||||||||||||||||
| Commodity contracts | 10,864 | � | 3,887 | 14,751 | 59,169 | � | 62,974 | 122,143 | ||||||||||||||||||||||||
| Other | 43 | � | � | 43 | 4,114 | � | � | 4,114 | ||||||||||||||||||||||||
| Total derivatives not designated as accounting hedges | 324,595 | 107,807 | 24,616 | 457,018 | 6,856,098 | 5,827,032 | 1,372,605 | 14,055,735 | ||||||||||||||||||||||||
| Total derivatives | $ | 324,671 | $ | 108,063 | $ | 24,616 | $ | 457,350 | $ | 6,864,262 | $ | 5,837,356 | $ | 1,372,605 | $ | 14,074,223 | ||||||||||||||||
| Cash collateral netting | (33,332 | ) | (2,951 | ) | � | (36,283 | ) | � | � | � | � | |||||||||||||||||||||
| Counterparty netting | (265,707 | ) | (104,294 | ) | (21,592 | ) | (391,593 | ) | � | � | � | � | ||||||||||||||||||||
| Total derivative liabilities | $ | 25,632 | $ | 818 | $ | 3,024 | $ | 29,474 | $ | 6,864,262 | $ | 5,837,356 | $ | 1,372,605 | $ | 14,074,223 | ||||||||||||||||
| | 168 |
| Derivative Assets at December�31, 2014 | ||||||||||||||||||||||||||||||||
| Fair Value | Notional | |||||||||||||||||||||||||||||||
| Bilateral OTC | Cleared OTC | Exchange Traded | Total | Bilateral OTC | Cleared OTC | Exchange Traded | Total | |||||||||||||||||||||||||
| (dollars in millions) | ||||||||||||||||||||||||||||||||
| Derivatives designated as accounting hedges: | ||||||||||||||||||||||||||||||||
| Interest rate contracts | $ | 3,947 | $ | 1,053 | $ | � | $ | 5,000 | $ | 44,324 | $ | 27,692 | $ | � | $ | 72,016 | ||||||||||||||||
| Foreign exchange contracts | 498 | 6 | � | 504 | 9,362 | 261 | � | 9,623 | ||||||||||||||||||||||||
| Total derivatives designated as accounting hedges | 4,445 | 1,059 | � | 5,504 | 53,686 | 27,953 | � | 81,639 | ||||||||||||||||||||||||
| Derivatives not designated as accounting hedges(2): | ||||||||||||||||||||||||||||||||
| Interest rate contracts | 281,214 | 211,552 | 407 | 493,173 | 4,854,953 | 9,187,454 | 1,467,056 | 15,509,463 | ||||||||||||||||||||||||
| Credit contracts | 27,776 | 4,406 | � | 32,182 | 806,441 | 167,390 | � | 973,831 | ||||||||||||||||||||||||
| Foreign exchange contracts | 72,362 | 152 | 83 | 72,597 | 1,955,343 | 11,538 | 9,663 | 1,976,544 | ||||||||||||||||||||||||
| Equity contracts | 23,208 | � | 24,916 | 48,124 | 299,363 | � | 271,164 | 570,527 | ||||||||||||||||||||||||
| Commodity contracts | 17,698 | � | 6,717 | 24,415 | 115,792 | � | 156,440 | 272,232 | ||||||||||||||||||||||||
| Other | 376 | � | � | 376 | 5,179 | � | � | 5,179 | ||||||||||||||||||||||||
| Total derivatives not designated as accounting hedges | 422,634 | 216,110 | 32,123 | 670,867 | 8,037,071 | 9,366,382 | 1,904,323 | 19,307,776 | ||||||||||||||||||||||||
| Total derivatives | $ | 427,079 | $ | 217,169 | $ | 32,123 | $ | 676,371 | $ | 8,090,757 | $ | 9,394,335 | $ | 1,904,323 | $ | 19,389,415 | ||||||||||||||||
| Cash collateral netting | (58,541 | ) | (4,654 | ) | � | (63,195 | ) | � | � | � | � | |||||||||||||||||||||
| Counterparty netting | (338,041 | ) | (210,922 | ) | (27,819 | ) | (576,782 | ) | � | � | � | � | ||||||||||||||||||||
| Total derivative assets | $ | 30,497 | $ | 1,593 | $ | 4,304 | $ | 36,394 | $ | 8,090,757 | $ | 9,394,335 | $ | 1,904,323 | $ | 19,389,415 | ||||||||||||||||
| Derivative Liabilities at December�31, 2014 | ||||||||||||||||||||||||||||||||
| Fair Value | Notional | |||||||||||||||||||||||||||||||
| Bilateral OTC | Cleared OTC | Exchange Traded | Total | Bilateral OTC | Cleared OTC | Exchange Traded | Total | |||||||||||||||||||||||||
| (dollars in millions) | ||||||||||||||||||||||||||||||||
| Derivatives designated as accounting hedges: | ||||||||||||||||||||||||||||||||
| Interest rate contracts | $ | 125 | $ | 99 | $ | � | $ | 224 | $ | 2,024 | $ | 7,588 | $ | � | $ | 9,612 | ||||||||||||||||
| Foreign exchange contracts | 5 | 1 | � | 6 | 1,491 | 121 | � | 1,612 | ||||||||||||||||||||||||
| Total derivatives designated as accounting hedges | 130 | 100 | � | 230 | 3,515 | 7,709 | � | 11,224 | ||||||||||||||||||||||||
| Derivatives not designated as accounting hedges(2): | ||||||||||||||||||||||||||||||||
| Interest rate contracts | 264,579 | 207,482 | 293 | 472,354 | 4,615,886 | 9,138,417 | 1,714,021 | 15,468,324 | ||||||||||||||||||||||||
| Credit contracts | 28,165 | 3,944 | � | 32,109 | 714,181 | 154,054 | � | 868,235 | ||||||||||||||||||||||||
| Foreign exchange contracts | 72,156 | 169 | 21 | 72,346 | 1,947,178 | 11,477 | 1,761 | 1,960,416 | ||||||||||||||||||||||||
| Equity contracts | 30,061 | � | 25,511 | 55,572 | 339,884 | � | 302,205 | 642,089 | ||||||||||||||||||||||||
| Commodity contracts | 14,740 | � | 6,783 | 21,523 | 93,019 | � | 132,136 | 225,155 | ||||||||||||||||||||||||
| Other | 172 | � | � | 172 | 5,478 | � | � | 5,478 | ||||||||||||||||||||||||
| Total derivatives not designated as accounting hedges | 409,873 | 211,595 | 32,608 | 654,076 | 7,715,626 | 9,303,948 | 2,150,123 | 19,169,697 | ||||||||||||||||||||||||
| Total derivatives | $ | 410,003 | $ | 211,695 | $ | 32,608 | $ | 654,306 | $ | 7,719,141 | $ | 9,311,657 | $ | 2,150,123 | $ | 19,180,921 | ||||||||||||||||
| Cash collateral netting | (37,054 | ) | (258 | ) | � | (37,312 | ) | � | � | � | � | |||||||||||||||||||||
| Counterparty netting | (338,041 | ) | (210,922 | ) | (27,819 | ) | (576,782 | ) | � | � | � | � | ||||||||||||||||||||
| Total derivative liabilities | $ | 34,908 | $ | 515 | $ | 4,789 | $ | 40,212 | $ | 7,719,141 | $ | 9,311,657 | $ | 2,150,123 | $ | 19,180,921 | ||||||||||||||||
| (1) | Notional amounts include gross notionals related to open long and short futures contracts of $1,009.5 billion and $653.0 billion, respectively. The unsettled fair value on these futures contracts (excluded from the table above) of $1,145 million and $437 million is included in Customer and other receivables and Customer and other payables, respectively, in the consolidated statements of financial condition. |
| (2) | Notional amounts include gross notionals related to open long and short futures contracts of $685.3 billion and $1,122.3 billion, respectively. The unsettled fair value on these futures contracts (excluded from the table above) of $472 million and $21 million is included in Customer and other receivables and Customer and other payables, respectively, in the consolidated statements of financial condition. |
| 169 | |
| At December�31, 2015 | ||||||||||||||||||||||||
| Gross Amounts(1) | Amounts�Offset in the Consolidated Statements of Financial Condition | Net�Amounts Presented�in�the Consolidated Statements of Financial Condition | Amounts�Not�Offset�in�the Consolidated�Statements�of Financial Condition(2) | Net�Exposure | ||||||||||||||||||||
| Financial Instruments Collateral | Other Cash Collateral | |||||||||||||||||||||||
| (dollars in millions) | ||||||||||||||||||||||||
| Derivative assets | ||||||||||||||||||||||||
| Bilateral OTC | $ | 340,573 | $ | (316,042 | ) | $ | 24,531 | $ | (9,190 | ) | $ | (9 | ) | $ | 15,332 | |||||||||
| Cleared OTC | 106,623 | (105,331 | ) | 1,292 | � | � | 1,292 | |||||||||||||||||
| Exchange traded | 24,382 | (21,592 | ) | 2,790 | � | � | 2,790 | |||||||||||||||||
| Total derivative assets | $ | 471,578 | $ | (442,965 | ) | $ | 28,613 | $ | (9,190 | ) | $ | (9) | $ | 19,414 | ||||||||||
| Derivative liabilities | ||||||||||||||||||||||||
| Bilateral OTC | $ | 324,671 | $ | (299,039 | ) | $ | 25,632 | $ | (5,384 | ) | $ | (5 | ) | $ | 20,243 | |||||||||
| Cleared OTC | 108,063 | (107,245 | ) | 818 | � | � | 818 | |||||||||||||||||
| Exchange traded | 24,616 | (21,592 | ) | 3,024 | (405 | ) | � | 2,619 | ||||||||||||||||
| Total derivative liabilities | $ | 457,350 | $ | (427,876 | ) | $ | 29,474 | $ | (5,789 | ) | $ | (5 | ) | $ | 23,680 | |||||||||
| At December�31, 2014 | ||||||||||||||||||||||||
| Gross Amounts(1) | Amounts�Offset in the Consolidated Statements of Financial Condition | Net�Amounts Presented�in�the Consolidated Statements of Financial Condition | Amounts�Not�Offset�in�the Consolidated�Statements�of Financial Condition(2) | Net�Exposure | ||||||||||||||||||||
| Financial Instruments Collateral | Other�Cash Collateral | |||||||||||||||||||||||
| (dollars in millions) | ||||||||||||||||||||||||
| Derivative assets | ||||||||||||||||||||||||
| Bilateral OTC | $ | 427,079 | $ | (396,582 | ) | $ | 30,497 | $ | (9,844 | ) | $ | (19 | ) | $ | 20,634 | |||||||||
| Cleared OTC | 217,169 | (215,576 | ) | 1,593 | � | � | 1,593 | |||||||||||||||||
| Exchange traded | 32,123 | (27,819 | ) | 4,304 | � | � | 4,304 | |||||||||||||||||
| Total derivative assets | $ | 676,371 | $ | (639,977 | ) | $ | 36,394 | $ | (9,844 | ) | $ | (19 | ) | $ | 26,531 | |||||||||
| Derivative liabilities | ||||||||||||||||||||||||
| Bilateral OTC | $ | 410,003 | $ | (375,095 | ) | $ | 34,908 | $ | (11,192 | ) | $ | (179 | ) | $ | 23,537 | |||||||||
| Cleared OTC | 211,695 | (211,180 | ) | 515 | � | (6 | ) | 509 | ||||||||||||||||
| Exchange traded | 32,608 | (27,819 | ) | 4,789 | (726 | ) | � | 4,063 | ||||||||||||||||
| Total derivative liabilities | $ | 654,306 | $ | (614,094 | ) | $ | 40,212 | $ | (11,918 | ) | $ | (185 | ) | $ | 28,109 | |||||||||
| (1) | Amounts include $4.2 billion of derivative assets and $5.2 billion of derivative liabilities at December�31, 2015 and $6.5 billion of derivative assets and $6.9 billion of derivative liabilities at December�31, 2014, which are either not subject to master netting agreements or collateral agreements or are subject to such agreements but the Company has not determined the agreements to be legally enforceable. See also �Fair Value and Notional of Derivative Instruments� herein, for additional disclosure about gross fair values and notionals for derivative instruments by risk type. |
| (2) | Amounts relate to master netting agreements and collateral agreements, that have been determined by the Company to be legally enforceable in the event of default but where certain other criteria are not met in accordance with applicable offsetting accounting guidance. |
| | 170 |
| Gains�(Losses) Recognized�in Interest�Expense | ||||||||||||
| Product Type | 2015 | 2014 | 2013 | |||||||||
| (dollars in millions) | ||||||||||||
| Derivatives | $ | (700 | ) | $ | 1,462 | $ | (4,332 | ) | ||||
| Borrowings | 461 | (1,616 | ) | 4,335 | ||||||||
| Total | $ | (239 | ) | $ | (154 | ) | $ | 3 | ||||
| Gains (Losses) Recognized in Other Comprehensive Income (effective portion) | ||||||||||||
| Product Type | 2015 | 2014 | 2013 | |||||||||
| (dollars in millions) | ||||||||||||
| Foreign exchange contracts(1) | $ | 434 | $ | 606 | $ | 448 | ||||||
| (1) | Losses of $149 million, $186 million and $154 million related to the forward points on the hedging instruments were excluded from hedge effectiveness testing and recognized in Interest income during 2015, 2014 and 2013, respectively. |
| Gains (Losses) Recognized in�Trading Revenues | ||||||||||||
| Product Type | 2015 | 2014 | 2013 | |||||||||
| (dollars in millions) | ||||||||||||
| Interest rate contracts | $ | 1,249 | $ | 1,065 | $ | 820 | ||||||
| Foreign exchange contracts | 984 | 729 | 963 | |||||||||
| Equity security and index contracts(1) | 5,695 | 4,603 | 5,044 | |||||||||
| Commodity and other contracts(2) | 793 | 1,055 | 688 | |||||||||
| Credit contracts | 775 | 1,274 | 2,525 | |||||||||
| Subtotal | $ | 9,496 | $ | 8,726 | $ | 10,040 | ||||||
| Debt valuation adjustment | 618 | 651 | (681 | ) | ||||||||
| Total | $ | 10,114 | $ | 9,377 | $ | 9,359 | ||||||
| (1) | Dividend income is included within equity security and index contracts. |
| (2) | Other contracts represent contracts not reported as interest rate, foreign exchange, equity security and index or credit contracts. |
| 171 | |
| At December�31, 2015(1) | ||||||||||||||||||||||||||||
| Years to Maturity | Cross-Maturity and Cash Collateral Netting(3) | Net�
Exposure Post-cash Collateral | Net�
Exposure Post- collateral(4) | |||||||||||||||||||||||||
| Credit Rating(2) | Less�than�1 | 1-3 | 3-5 | Over 5 | ||||||||||||||||||||||||
| (dollars in millions) | ||||||||||||||||||||||||||||
| AAA | $ | 203 | $ | 453 | $ | 827 | $ | 3,665 | $ | (4,319 | ) | $ | 829 | $ | 715 | |||||||||||||
| AA | 2,689 | 2,000 | 1,876 | 9,223 | (10,981 | ) | 4,807 | 2,361 | ||||||||||||||||||||
| A | 9,748 | 8,191 | 4,774 | 20,918 | (34,916 | ) | 8,715 | 5,448 | ||||||||||||||||||||
| BBB | 3,614 | 4,863 | 1,948 | 11,801 | (15,086 | ) | 7,140 | 4,934 | ||||||||||||||||||||
| Non-investment grade | 3,982 | 2,333 | 1,157 | 3,567 | (6,716 | ) | 4,323 | 3,166 | ||||||||||||||||||||
| Total | $ | 20,236 | $ | 17,840 | $ | 10,582 | $ | 49,174 | $ | (72,018 | ) | $ | 25,814 | $ | 16,624 | |||||||||||||
| At December�31, 2014(1) | ||||||||||||||||||||||||||||
| Years to Maturity | Cross-Maturity and Cash Collateral Netting(3) | Net�Exposure Post-cash Collateral | Net�Exposure Post- collateral(4) | |||||||||||||||||||||||||
| Credit Rating(2) | Less�than�1 | 1-3 | 3-5 | Over 5 | ||||||||||||||||||||||||
| (dollars in millions) | ||||||||||||||||||||||||||||
| AAA | $ | 499 | $ | 246 | $ | 1,313 | $ | 4,281 | $ | (5,009 | ) | $ | 1,330 | $ | 1,035 | |||||||||||||
| AA | 2,679 | 2,811 | 2,704 | 14,137 | (15,415 | ) | 6,916 | 4,719 | ||||||||||||||||||||
| A | 11,733 | 10,833 | 7,585 | 23,968 | (43,644 | ) | 10,475 | 6,520 | ||||||||||||||||||||
| BBB | 5,119 | 3,753 | 2,592 | 13,132 | (15,844 | ) | 8,752 | 6,035 | ||||||||||||||||||||
| Non-investment grade | 3,196 | 3,089 | 1,541 | 2,499 | (5,727 | ) | 4,598 | 3,918 | ||||||||||||||||||||
| Total | $ | 23,226 | $ | 20,732 | $ | 15,735 | $ | 58,017 | $ | (85,639 | ) | $ | 32,071 | $ | 22,227 | |||||||||||||
| (1) | Fair values shown represent the Company�s net exposure to counterparties related to its OTC derivative products. |
| (2) | Obligor credit ratings are determined by the Credit Risk Management Department. |
| (3) | Amounts represent the netting of receivable balances with payable balances for the same counterparty across maturity categories. Receivable and payable balances with the same counterparty in the same maturity category are netted within such maturity category, where appropriate. Cash collateral received is netted on a counterparty basis, provided legal right of offset exists. |
| (4) | Fair value is shown, net of collateral received (primarily cash and U.S. government and agency securities). |
| At�December�31,�2015 | ||||
| (dollars in millions) | ||||
| Net derivative liabilities | $ | 23,526 | ||
| Collateral posted | 19,070 | |||
| | 172 |
| At�December�31,�2015(1) | ||||
| (dollars in millions) | ||||
| One-notch downgrade | $ | 1,224 | ||
| Two-notch downgrade | 1,146 | |||
| (1) | Amounts include $1,573 million related to bilateral arrangements between the Company and other parties where upon the downgrade of one party, the downgraded party must deliver collateral to the other party. These bilateral downgrade arrangements are a risk management tool used extensively by the Company as credit exposures are reduced if counterparties are downgraded. |
| At December�31, 2015 | ||||||||||||||||
| Maximum Potential Payout/Notional | ||||||||||||||||
| Protection Sold | Protection Purchased | |||||||||||||||
| Notional | Fair�Value (Asset)/Liability | Notional | Fair�Value (Asset)/Liability | |||||||||||||
| (dollars in millions) | ||||||||||||||||
| Single name credit default swaps | $ | 420,806 | $ | 1,980 | $ | 405,361 | $ | (2,079 | ) | |||||||
| Index and basket credit default swaps | 199,688 | (102 | ) | 173,936 | (82 | ) | ||||||||||
| Tranched index and basket credit default swaps | 69,025 | (1,093 | ) | 149,631 | 2,122 | |||||||||||
| Total | $ | 689,519 | $ | 785 | $ | 728,928 | $ | (39 | ) | |||||||
| At December�31, 2014 | ||||||||||||||||
| Maximum Potential Payout/Notional | ||||||||||||||||
| Protection Sold | Protection Purchased | |||||||||||||||
| Notional | Fair Value (Asset)/Liability | Notional | Fair Value (Asset)/Liability | |||||||||||||
| (dollars in millions) | ||||||||||||||||
| Single name credit default swaps | $ | 535,415 | $ | (2,479 | ) | $ | 509,872 | $ | 1,641 | |||||||
| Index and basket credit default swaps | 276,465 | (1,777 | ) | 229,789 | 1,563 | |||||||||||
| Tranched index and basket credit default swaps | 96,182 | (2,355 | ) | 194,343 | 3,334 | |||||||||||
| Total | $ | 908,062 | $ | (6,611 | ) | $ | 934,004 | $ | 6,538 | |||||||
| 173 | |
| At December�31, 2015 | ||||||||||||||||||||||||
| Maximum Potential Payout/Notional | Fair
Value (Asset)/ Liability(1) | |||||||||||||||||||||||
| Years to Maturity | ||||||||||||||||||||||||
| Less�than�1 | 1-3 | 3-5 | Over 5 | Total | ||||||||||||||||||||
| (dollars in millions) | ||||||||||||||||||||||||
| Single name credit default swaps(2): | ||||||||||||||||||||||||
| Investment grade | $ | 84,543 | $ | 138,467 | $ | 63,754 | $ | 12,906 | $ | 299,670 | $ | (1,831 | ) | |||||||||||
| Non-investment grade | 38,054 | 56,261 | 24,432 | 2,389 | 121,136 | 3,811 | ||||||||||||||||||
| Total | $ | 122,597 | $ | 194,728 | $ | 88,186 | $ | 15,295 | $ | 420,806 | $ | 1,980 | ||||||||||||
| Index and basket credit default swaps(2): | ||||||||||||||||||||||||
| Investment grade | $ | 33,507 | $ | 59,403 | $ | 45,505 | $ | 5,327 | $ | 143,742 | $ | (1,977 | ) | |||||||||||
| Non-investment grade | 52,590 | 43,899 | 15,480 | 13,002 | 124,971 | 782 | ||||||||||||||||||
| Total | $ | 86,097 | $ | 103,302 | $ | 60,985 | $ | 18,329 | $ | 268,713 | $ | (1,195 | ) | |||||||||||
| Total credit default swaps sold | $ | 208,694 | $ | 298,030 | $ | 149,171 | $ | 33,624 | $ | 689,519 | $ | 785 | ||||||||||||
| Other credit contracts | 19 | 107 | 2 | 332 | 460 | (24 | ) | |||||||||||||||||
| Total credit derivatives and other credit contracts | $ | 208,713 | $ | 298,137 | $ | 149,173 | $ | 33,956 | $ | 689,979 | $ | 761 | ||||||||||||
| At December�31, 2014 | ||||||||||||||||||||||||
| Maximum Potential Payout/Notional | Fair
Value (Asset)/ Liability(1) | |||||||||||||||||||||||
| Years to Maturity | ||||||||||||||||||||||||
| Less�than�1 | 1-3 | 3-5 | Over 5 | Total | ||||||||||||||||||||
| (dollars in millions) | ||||||||||||||||||||||||
| Single name credit default swaps(2): | ||||||||||||||||||||||||
| Investment grade | $ | 82,873 | $ | 199,776 | $ | 103,628 | $ | 20,490 | $ | 406,767 | $ | (4,252 | ) | |||||||||||
| Non-investment grade | 29,857 | 66,066 | 29,011 | 3,714 | 128,648 | 1,773 | ||||||||||||||||||
| Total | $ | 112,730 | $ | 265,842 | $ | 132,639 | $ | 24,204 | $ | 535,415 | $ | (2,479 | ) | |||||||||||
| Index and basket credit default swaps(2): | ||||||||||||||||||||||||
| Investment grade | $ | 49,877 | $ | 85,052 | $ | 78,276 | $ | 12,507 | $ | 225,712 | $ | (4,624 | ) | |||||||||||
| Non-investment grade | 25,750 | 88,105 | 22,971 | 10,109 | 146,935 | 492 | ||||||||||||||||||
| Total | $ | 75,627 | $ | 173,157 | $ | 101,247 | $ | 22,616 | $ | 372,647 | $ | (4,132 | ) | |||||||||||
| Total credit default swaps sold | $ | 188,357 | $ | 438,999 | $ | 233,886 | $ | 46,820 | $ | 908,062 | $ | (6,611 | ) | |||||||||||
| Other credit contracts | 51 | 539 | 1 | 620 | 1,211 | (500 | ) | |||||||||||||||||
| Total credit derivatives and other credit contracts | $ | 188,408 | $ | 439,538 | $ | 233,887 | $ | 47,440 | $ | 909,273 | $ | (7,111 | ) | |||||||||||
| (1) | Fair value amounts are shown on a gross basis prior to cash collateral or counterparty netting. |
| (2) | In order to provide an indication of the current payment status or performance risk of the credit default swaps, a breakdown of credit default swaps based on the Company�s internal credit ratings by investment grade and non-investment grade is provided. During 2015, the Company began utilizing its internal credit ratings as compared with 2014 where external agency ratings, if available, were utilized. The change in the rating methodology did not have a significant impact on investment grade versus non-investment grade classifications or the fair values. |
| | 174 |
| 175 | |
| 5. | Investment Securities. |
| At December�31, 2015 | ||||||||||||||||
| Amortized Cost | Gross Unrealized Gains | Gross Unrealized Losses | Fair Value | |||||||||||||
| (dollars in millions) | ||||||||||||||||
| AFS debt securities: | ||||||||||||||||
| U.S. government and agency securities: | ||||||||||||||||
| U.S. Treasury securities | $ | 31,555 | $ | 5 | $ | 143 | $ | 31,417 | ||||||||
| U.S. agency securities(1) | 21,103 | 29 | 156 | 20,976 | ||||||||||||
| Total U.S. government and agency securities | 52,658 | 34 | 299 | 52,393 | ||||||||||||
| Corporate and other debt: | ||||||||||||||||
| Commercial mortgage-backed securities: | ||||||||||||||||
| Agency | 1,906 | 1 | 60 | 1,847 | ||||||||||||
| Non-agency | 2,220 | 3 | 25 | 2,198 | ||||||||||||
| Auto loan asset-backed securities | 2,556 | � | 9 | 2,547 | ||||||||||||
| Corporate bonds | 3,780 | 5 | 30 | 3,755 | ||||||||||||
| Collateralized loan obligations | 502 | � | 7 | 495 | ||||||||||||
| FFELP student loan asset-backed securities(2) | 3,632 | � | 115 | 3,517 | ||||||||||||
| Total corporate and other debt | 14,596 | 9 | 246 | 14,359 | ||||||||||||
| Total AFS debt securities | 67,254 | 43 | 545 | 66,752 | ||||||||||||
| AFS equity securities | 15 | � | 8 | 7 | ||||||||||||
| Total AFS securities | 67,269 | 43 | 553 | 66,759 | ||||||||||||
| HTM securities: | ||||||||||||||||
| U.S. government securities: | ||||||||||||||||
| U.S. Treasury securities | 1,001 | � | 3 | 998 | ||||||||||||
| U.S. agency securities(1) | 4,223 | 1 | 34 | 4,190 | ||||||||||||
| Total HTM securities | 5,224 | 1 | 37 | 5,188 | ||||||||||||
| Total Investment securities | $ | 72,493 | $ | 44 | $ | 590 | $ | 71,947 | ||||||||
| | 176 |
| At December�31, 2014 | ||||||||||||||||
| Amortized Cost | Gross Unrealized Gains | Gross Unrealized Losses | Fair Value | |||||||||||||
| (dollars in millions) | ||||||||||||||||
| AFS debt securities: | ||||||||||||||||
| U.S. government and agency securities: | ||||||||||||||||
| U.S. Treasury securities | $ | 35,855 | $ | 42 | $ | 67 | $ | 35,830 | ||||||||
| U.S. agency securities(1) | 18,030 | 77 | 72 | 18,035 | ||||||||||||
| Total U.S. government and agency securities | 53,885 | 119 | 139 | 53,865 | ||||||||||||
| Corporate and other debt: | ||||||||||||||||
| Commercial mortgage-backed securities: | ||||||||||||||||
| Agency | 2,288 | 1 | 76 | 2,213 | ||||||||||||
| Non-agency | 1,820 | 11 | 6 | 1,825 | ||||||||||||
| Auto loan asset-backed securities | 2,433 | � | 5 | 2,428 | ||||||||||||
| Corporate bonds | 3,640 | 10 | 22 | 3,628 | ||||||||||||
| Collateralized loan obligations | 1,087 | � | 20 | 1,067 | ||||||||||||
| FFELP student loan asset-backed securities(2) | 4,169 | 18 | 8 | 4,179 | ||||||||||||
| Total corporate and other debt | 15,437 | 40 | 137 | 15,340 | ||||||||||||
| Total AFS debt securities | 69,322 | 159 | 276 | 69,205 | ||||||||||||
| AFS equity securities | 15 | � | 4 | 11 | ||||||||||||
| Total AFS securities | 69,337 | 159 | 280 | 69,216 | ||||||||||||
| HTM securities: | ||||||||||||||||
| U.S. government securities: | ||||||||||||||||
| U.S. Treasury securities | 100 | � | � | 100 | ||||||||||||
| Total HTM securities | 100 | � | � | 100 | ||||||||||||
| Total Investment securities | $ | 69,437 | $ | 159 | $ | 280 | $ | 69,316 | ||||||||
| (1) | U.S. agency securities are composed of three main categories consisting of agency-issued debt, agency mortgage pass-through pool securities and collateralized mortgage obligations. |
| (2) | Amounts are backed by a guarantee from the U.S. Department of Education of at least 95% of the principal balance and interest on such loans. |
| 177 | |
| At December�31, 2015 | ||||||||||||||||||||||||
| Less than 12 Months | 12 Months or Longer | Total | ||||||||||||||||||||||
| Fair Value | Gross Unrealized Losses | Fair Value | Gross Unrealized Losses | Fair Value | Gross Unrealized Losses | |||||||||||||||||||
| (dollars in millions) | ||||||||||||||||||||||||
| AFS debt securities: | ||||||||||||||||||||||||
| U.S. government and agency securities: | ||||||||||||||||||||||||
| U.S. Treasury securities | $ | 25,994 | $ | 126 | $ | 2,177 | $ | 17 | $ | 28,171 | $ | 143 | ||||||||||||
| U.S. agency securities | 14,242 | 135 | 639 | 21 | 14,881 | 156 | ||||||||||||||||||
| Total U.S. government and agency securities | 40,236 | 261 | 2,816 | 38 | 43,052 | 299 | ||||||||||||||||||
| Corporate and other debt: | ||||||||||||||||||||||||
| Commercial mortgage-backed securities: | ||||||||||||||||||||||||
| Agency | 1,185 | 44 | 422 | 16 | 1,607 | 60 | ||||||||||||||||||
| Non-agency | 1,479 | 21 | 305 | 4 | 1,784 | 25 | ||||||||||||||||||
| Auto loan asset-backed securities | 1,644 | 7 | 881 | 2 | 2,525 | 9 | ||||||||||||||||||
| Corporate bonds | 2,149 | 19 | 525 | 11 | 2,674 | 30 | ||||||||||||||||||
| Collateralized loan obligations | 352 | 5 | 143 | 2 | 495 | 7 | ||||||||||||||||||
| FFELP student loan asset-backed securities | 2,558 | 79 | 929 | 36 | 3,487 | 115 | ||||||||||||||||||
| Total corporate and other debt | 9,367 | 175 | 3,205 | 71 | 12,572 | 246 | ||||||||||||||||||
| Total AFS debt securities | 49,603 | 436 | 6,021 | 109 | 55,624 | 545 | ||||||||||||||||||
| AFS equity securities | 7 | 8 | � | � | 7 | 8 | ||||||||||||||||||
| Total AFS securities | 49,610 | 444 | 6,021 | 109 | 55,631 | 553 | ||||||||||||||||||
| HTM securities: | ||||||||||||||||||||||||
| U.S. government and agency securities: | ||||||||||||||||||||||||
| U.S. Treasury securities | 898 | 3 | � | � | 898 | 3 | ||||||||||||||||||
| U.S. agency securities | 3,677 | 34 | � | � | 3,677 | 34 | ||||||||||||||||||
| Total HTM securities | 4,575 | 37 | � | � | 4,575 | 37 | ||||||||||||||||||
| Total Investment securities | $ | 54,185 | $ | 481 | $ | 6,021 | $ | 109 | $ | 60,206 | $ | 590 | ||||||||||||
| | 178 |
| At December�31, 2014 | ||||||||||||||||||||||||
| Less than 12 Months | 12 Months or Longer | Total | ||||||||||||||||||||||
| Fair Value | Gross Unrealized Losses | Fair Value | Gross Unrealized Losses | Fair Value | Gross Unrealized Losses | |||||||||||||||||||
| (dollars in millions) | ||||||||||||||||||||||||
| AFS debt securities: | ||||||||||||||||||||||||
| U.S. government and agency securities: | ||||||||||||||||||||||||
| U.S. Treasury securities | $ | 11,410 | $ | 14 | $ | 5,924 | $ | 53 | $ | 17,334 | $ | 67 | ||||||||||||
| U.S. agency securities | 2,739 | 6 | 4,133 | 66 | 6,872 | 72 | ||||||||||||||||||
| Total U.S. government and agency securities | 14,149 | 20 | 10,057 | 119 | 24,206 | 139 | ||||||||||||||||||
| Corporate and other debt: | ||||||||||||||||||||||||
| Commercial mortgage-backed securities: | ||||||||||||||||||||||||
| Agency | 42 | � | 1,822 | 76 | 1,864 | 76 | ||||||||||||||||||
| Non-agency | 706 | 3 | 346 | 3 | 1,052 | 6 | ||||||||||||||||||
| Auto loan asset-backed securities | 2,034 | 5 | � | � | 2,034 | 5 | ||||||||||||||||||
| Corporate bonds | 905 | 6 | 1,299 | 16 | 2,204 | 22 | ||||||||||||||||||
| Collateralized loan obligations | � | � | 1,067 | 20 | 1,067 | 20 | ||||||||||||||||||
| FFELP student loan asset-backed securities | 1,523 | 6 | 393 | 2 | 1,916 | 8 | ||||||||||||||||||
| Total corporate and other debt | 5,210 | 20 | 4,927 | 117 | 10,137 | 137 | ||||||||||||||||||
| Total AFS debt securities | 19,359 | 40 | 14,984 | 236 | 34,343 | 276 | ||||||||||||||||||
| AFS equity securities | 11 | 4 | � | � | 11 | 4 | ||||||||||||||||||
| Total Investment securities | $ | 19,370 | $ | 44 | $ | 14,984 | $ | 236 | $ | 34,354 | $ | 280 | ||||||||||||
| 179 | |
| At December�31, 2015 | ||||||||||||
| Amortized�Cost | Fair�Value | Annualized Average� Yield | ||||||||||
| (dollars in millions) | ||||||||||||
| AFS debt securities: | ||||||||||||
| U.S. government and agency securities: | ||||||||||||
| U.S. Treasury securities: | ||||||||||||
| Due within 1 year | $ | 6,209 | $ | 6,205 | 0.7 | % | ||||||
| After 1 year through 5 years | 24,900 | 24,765 | 1.0 | % | ||||||||
| After 5 years through 10 years | 446 | 447 | 2.1 | % | ||||||||
| Total | 31,555 | 31,417 | ||||||||||
| U.S. agency securities: | ||||||||||||
| After 1 year through 5 years | 2,986 | 2,984 | 0.6 | % | ||||||||
| After 5 years through 10 years | 1,652 | 1,650 | 1.9 | % | ||||||||
| After 10 years | 16,465 | 16,342 | 1.8 | % | ||||||||
| Total | 21,103 | 20,976 | ||||||||||
| Total U.S. government and agency securities | 52,658 | 52,393 | 1.2 | % | ||||||||
| Corporate and other debt: | ||||||||||||
| Commercial mortgage-backed securities: | ||||||||||||
| Agency: | ||||||||||||
| Due within 1 year | 49 | 50 | 0.7 | % | ||||||||
| After 1 year through 5 years | 570 | 567 | 0.9 | % | ||||||||
| After 5 years through 10 years | 213 | 209 | 1.5 | % | ||||||||
| After 10 years | 1,074 | 1,021 | 1.5 | % | ||||||||
| Total | 1,906 | 1,847 | ||||||||||
| Non-agency: | ||||||||||||
| After 10 years | 2,220 | 2,198 | 1.9 | % | ||||||||
| Total | 2,220 | 2,198 | ||||||||||
| Auto loan asset-backed securities: | ||||||||||||
| Due within 1 year | 64 | 64 | 0.9 | % | ||||||||
| After 1 year through 5 years | 2,302 | 2,294 | 1.2 | % | ||||||||
| After 5 years through 10 years | 190 | 189 | 1.7 | % | ||||||||
| Total | 2,556 | 2,547 | ||||||||||
| Corporate bonds: | ||||||||||||
| Due within 1 year | 412 | 412 | 1.1 | % | ||||||||
| After 1 year through 5 years | 2,615 | 2,595 | 1.6 | % | ||||||||
| After 5 years through 10 years | 753 | 748 | 2.7 | % | ||||||||
| Total | 3,780 | 3,755 | ||||||||||
| Collateralized loan obligations: | ||||||||||||
| After 5 years through 10 years | 502 | 495 | 1.5 | % | ||||||||
| Total | 502 | 495 | ||||||||||
| | 180 |
| At December�31, 2015 | ||||||||||||
| Amortized�Cost | Fair�Value | Annualized Average� Yield | ||||||||||
| (dollars in millions) | ||||||||||||
| FFELP student loan asset-backed securities: | ||||||||||||
| After 1 year through 5 years | $ | 88 | $ | 88 | 0.6 | % | ||||||
| After 5 years through 10 years | 776 | 759 | 0.9 | % | ||||||||
| After 10 years | 2,768 | 2,670 | 0.9 | % | ||||||||
| Total | 3,632 | 3,517 | ||||||||||
| Total corporate and other debt | 14,596 | 14,359 | 1.4 | % | ||||||||
| Total AFS debt securities | 67,254 | 66,752 | 1.3 | % | ||||||||
| AFS equity securities | 15 | 7 | � | % | ||||||||
| Total AFS securities | 67,269 | 66,759 | 1.3 | % | ||||||||
| HTM securities: | ||||||||||||
| U.S. government securities: | ||||||||||||
| U.S. Treasury securities: | ||||||||||||
| After 1 year through 5 years | 1,001 | 998 | 1.0 | % | ||||||||
| Total | 1,001 | 998 | ||||||||||
| U.S. agency securities: | ||||||||||||
| After 10 years | 4,223 | 4,190 | 2.3 | % | ||||||||
| Total | 4,223 | 4,190 | ||||||||||
| Total HTM securities | 5,224 | 5,188 | 2.1 | % | ||||||||
| Total Investment securities | $ | 72,493 | $ | 71,947 | 1.3 | % | ||||||
| 2015 | 2014 | 2013 | ||||||||||
| (dollars in millions) | ||||||||||||
| Gross realized gains | $ | 116 | $ | 41 | $ | 49 | ||||||
| Gross realized (losses) | (32 | ) | (1 | ) | (4 | ) | ||||||
| Total | $ | 84 | $ | 40 | $ | 45 | ||||||
| 6. | Collateralized Transactions. |
| 181 | |
| At December�31, 2015 | ||||||||||||||||||||
| Gross Amounts(1) | Amounts�Offset in the Consolidated Statements of Financial Condition | Net�Amounts Presented in the Consolidated Statements�of Financial Condition | Financial Instruments�Not Offset in the Consolidated Statements of Financial Condition(2) | Net�Exposure | ||||||||||||||||
| (dollars in millions) | ||||||||||||||||||||
| Assets | ||||||||||||||||||||
| Securities purchased under agreements to resell | $ | 135,714 | $ | (48,057 | ) | $ | 87,657 | $ | (84,752 | ) | $ | 2,905 | ||||||||
| Securities borrowed | 147,445 | (5,029 | ) | 142,416 | (134,250 | ) | 8,166 | |||||||||||||
| Liabilities | ||||||||||||||||||||
| Securities sold under agreements to repurchase | $ | 84,749 | $ | (48,057 | ) | $ | 36,692 | $ | (31,604 | ) | $ | 5,088 | ||||||||
| Securities loaned | 24,387 | (5,029 | ) | 19,358 | (18,881 | ) | 477 | |||||||||||||
| At December�31, 2014 | ||||||||||||||||||||
| Gross Amounts(1) | Amounts�Offset in the Consolidated Statements of Financial Condition | Net�Amounts Presented in the Consolidated Statements�of Financial Condition | Financial Instruments�Not Offset in the Consolidated Statements of Financial Condition(2) | Net�Exposure | ||||||||||||||||
| (dollars in millions) | ||||||||||||||||||||
| Assets | ||||||||||||||||||||
| Securities purchased under agreements to resell | $ | 148,234 | $ | (64,946 | ) | $ | 83,288 | $ | (79,343 | ) | $ | 3,945 | ||||||||
| Securities borrowed | 145,556 | (8,848 | ) | 136,708 | (128,282 | ) | 8,426 | |||||||||||||
| Liabilities | ||||||||||||||||||||
| Securities sold under agreements to repurchase | $ | 134,895 | $ | (64,946 | ) | $ | 69,949 | $ | (56,454 | ) | $ | 13,495 | ||||||||
| Securities loaned | 34,067 | (8,848 | ) | 25,219 | (24,252 | ) | 967 | |||||||||||||
| (1) | Amounts include $2.6 billion of Securities purchased under agreements to resell, $3.0 billion of Securities borrowed and $4.9 billion of Securities sold under agreements to repurchase at December�31, 2015 and $3.9 billion of Securities purchased under agreements to resell, $4.2 billion of Securities borrowed, $15.6 billion of Securities sold under agreements to repurchase and $0.7 billion of Securities loaned at December�31, 2014, which are either not subject to master netting agreements or are subject to such agreements but the Company has not determined the agreements to be legally enforceable. |
| | 182 |
| (2) | Amounts relate to master netting agreements, that have been determined by the Company to be legally enforceable in the event of default but where certain other criteria are not met in accordance with applicable offsetting accounting guidance. |
| At December�31, 2015 | ||||||||||||||||||||
| Remaining Contractual Maturity | ||||||||||||||||||||
| Overnight and Open | Less�than 30 Days | 30-90�Days | Over 90 Days | Total | ||||||||||||||||
| (dollars in millions) | ||||||||||||||||||||
| Securities sold under agreements to repurchase(1) | $ | 20,410 | $ | 25,245 | $ | 13,221 | $ | 25,873 | $ | 84,749 | ||||||||||
| Securities loaned(1) | 12,247 | 478 | 2,156 | 9,506 | 24,387 | |||||||||||||||
| Gross amount of secured financing included in the above offsetting disclosure | $ | 32,657 | $ | 25,723 | $ | 15,377 | $ | 35,379 | $ | 109,136 | ||||||||||
| Obligation to return securities received as collateral | 19,316 | � | � | � | 19,316 | |||||||||||||||
| Total | $ | 51,973 | $ | 25,723 | $ | 15,377 | $ | 35,379 | $ | 128,452 | ||||||||||
| At December�31,� 2015 | ||||
| (dollars�in�millions) | ||||
| Securities sold under agreements to repurchase(1) | ||||
| U.S. government and agency securities | $ | 36,609 | ||
| State and municipal securities | 173 | |||
| Other sovereign government obligations | 24,820 | |||
| Asset-backed securities | 441 | |||
| Corporate and other debt | 4,020 | |||
| Corporate equities | 18,473 | |||
| Other | 213 | |||
| Total securities sold under agreements to repurchase | $ | 84,749 | ||
| Securities loaned(1) | ||||
| Other sovereign government obligations | $ | 7,336 | ||
| Corporate and other debt | 71 | |||
| Corporate equities | 16,972 | |||
| Other | 8 | |||
| Total securities loaned | $ | 24,387 | ||
| Gross amount of secured financing included in the above offsetting disclosure | $ | 109,136 | ||
| Obligation to return securities received as collateral | ||||
| Corporate equities | $ | 19,313 | ||
| Corporate and other debt | 3 | |||
| Total obligation to return securities received as collateral | $ | 19,316 | ||
| Total | $ | 128,452 | ||
| 183 | |
| (1) | Amounts are presented on a gross basis, prior to netting in the consolidated statements of financial condition. |
| | 184 |
| At December�31,� 2015 | At December�31, 2014 | |||||||
| (dollars in millions) | ||||||||
| Cash deposited with clearing organizations or segregated under federal and other regulations or requirements(1) | $ | 31,469 | $ | 40,607 | ||||
| Securities(2) | 14,390 | 14,630 | ||||||
| Total | $ | 45,859 | $ | 55,237 | ||||
| (1) | In 2015, the Company made amendments to certain arrangements by which it acts in the capacity of a clearing member to clear derivatives on behalf of customers. These amendments resulted in approximately $3.8 billion related to cash initial margin received from customers and remitted to clearing organizations or third-party custodian banks no longer qualifying for recognition in the consolidated statements of financial condition. |
| (2) | Securities deposited with clearing organizations or segregated under federal and other regulations or requirements are sourced from Securities purchased under agreements to resell and Trading assets in the consolidated statements of financial condition. |
| 7. | Loans and Allowance for Credit Losses. |
| � | Corporate .����Corporate loans primarily include commercial and industrial lending used for general corporate purposes, working capital and liquidity, event-driven loans and asset-backed lending products. Event-driven loans support client merger, acquisition, recapitalization, or project finance activities. Corporate loans are structured as revolving lines of credit, letter of credit facilities, term loans and bridge loans. Risk factors considered in determining the allowance for corporate loans include the borrower�s financial strength, seniority of the loan, collateral type, volatility of collateral value, debt cushion, covenants and counterparty type. |
| � | Consumer .����Consumer loans include unsecured loans and securities-based lending that allows clients to borrow money against the value of qualifying securities for any suitable purpose other than purchasing, trading, or carrying |
| 185 | |
| securities or refinancing margin debt. The majority of consumer loans are structured as revolving lines of credit and letter of credit facilities and are primarily offered through the Company�s Portfolio Loan Account (�PLA�) and Liquidity Access Line (�LAL�) programs. The allowance methodology for unsecured loans considers the specific attributes of the loan as well as the borrower�s source of repayment. The allowance methodology for securities-based lending considers the collateral type underlying the loan ( e.g. , diversified securities, concentrated securities or restricted stock). |
| � | Residential Real Estate .����Residential real estate loans mainly include non-conforming loans and home equity lines of credit. The allowance methodology for non-conforming residential mortgage loans considers several factors, including, but not limited to, loan-to-value ratio, FICO score, home price index and delinquency status. The methodology for home equity lines of credit considers credit limits and utilization rates in addition to the factors considered for non-conforming residential mortgages. |
| � | Wholesale Real Estate .����Wholesale real estate loans include owner-occupied loans and income-producing loans. The principal risk factors for determining the allowance for wholesale real estate loans are the underlying collateral type, loan-to-value ratio and debt service ratio. |
| At December�31, 2015 | At December�31, 2014 | |||||||||||||||||||||||
| Loans by Product Type | Loans Held for Investment | Loans�Held for Sale | Total Loans(1)(2) | Loans�Held�for Investment | Loans�Held for Sale | Total Loans(1)(2) | ||||||||||||||||||
| (dollars in millions) | ||||||||||||||||||||||||
| Corporate loans | $ | 23,554 | $ | 11,924 | $ | 35,478 | $ | 19,659 | $ | 8,200 | $ | 27,859 | ||||||||||||
| Consumer loans | 21,528 | � | 21,528 | 16,576 | � | 16,576 | ||||||||||||||||||
| Residential real estate loans | 20,863 | 104 | 20,967 | 15,735 | 114 | 15,849 | ||||||||||||||||||
| Wholesale real estate loans | 6,839 | 1,172 | 8,011 | 5,298 | 1,144 | 6,442 | ||||||||||||||||||
| Total loans, gross of allowance for loan losses | 72,784 | 13,200 | 85,984 | 57,268 | 9,458 | 66,726 | ||||||||||||||||||
| Allowance for loan losses | (225 | ) | � | (225 | ) | (149 | ) | � | (149 | ) | ||||||||||||||
| Total loans, net of allowance for loan losses | $ | 72,559 | $ | 13,200 | $ | 85,759 | $ | 57,119 | $ | 9,458 | $ | 66,577 | ||||||||||||
| (1) | Amounts include loans that are made to non-U.S. borrowers of $9,789 million and $7,017 million at December�31, 2015 and December�31, 2014, respectively. |
| (2) | Loans at fixed interest rates and floating or adjustable interest rates were $8,471 million and $77,288 million, respectively, at December�31, 2015 and $6,663 million and $59,914 million, respectively, at December�31, 2014. |
| | 186 |
| � | Pass .����A credit exposure rated pass has a continued expectation of timely repayment, all obligations of the borrower are current, and the obligor complies with material terms and conditions of the lending agreement. |
| � | Special Mention .����Extensions of credit that have potential weakness that deserve management�s close attention and, if left uncorrected, may, at some future date, result in the deterioration of the repayment prospects or collateral position. |
| � | Substandard .����Obligor has a well-defined weakness that jeopardizes the repayment of the debt and has a high probability of payment default with the distinct possibility that the Company will sustain some loss if noted deficiencies are not corrected. |
| � | Doubtful .����Inherent weakness in the exposure makes the collection or repayment in full, based on existing facts, conditions and circumstances, highly improbable, and the amount of loss is uncertain. |
| � | Loss .����Extensions of credit classified as loss are considered uncollectible and are charged off. |
| At December�31, 2015 | ||||||||||||||||||||
| Corporate | Consumer | Residential Real� Estate | Wholesale Real� Estate | Total | ||||||||||||||||
| (dollars in millions) | ||||||||||||||||||||
| Pass | $ | 22,040 | $ | 21,528 | $ | 20,828 | $ | 6,839 | $ | 71,235 | ||||||||||
| Special mention | 300 | � | � | � | 300 | |||||||||||||||
| Substandard | 1,202 | � | 35 | � | 1,237 | |||||||||||||||
| Doubtful | 12 | � | � | � | 12 | |||||||||||||||
| Loss | � | � | � | � | � | |||||||||||||||
| Total loans | $ | 23,554 | $ | 21,528 | $ | 20,863 | $ | 6,839 | $ | 72,784 | ||||||||||
| At December 31, 2014 | ||||||||||||||||||||
| Corporate | Consumer | Residential Real Estate | Wholesale Real Estate | Total | ||||||||||||||||
| (dollars in millions) | ||||||||||||||||||||
| Pass | $ | 17,847 | $ | 16,576 | $ | 15,688 | $ | 5,298 | $ | 55,409 | ||||||||||
| Special mention | 1,683 | � | � | � | 1,683 | |||||||||||||||
| Substandard | 127 | � | 47 | � | 174 | |||||||||||||||
| Doubtful | 2 | � | � | � | 2 | |||||||||||||||
| Loss | � | � | � | � | � | |||||||||||||||
| Total loans | $ | 19,659 | $ | 16,576 | $ | 15,735 | $ | 5,298 | $ | 57,268 | ||||||||||
| 187 | |
| At December�31, 2015 | At December�31, 2014 | |||||||||||||||||||||||
| Loans by Product Type | Corporate | Residential Real� Estate | Total | Corporate | Residential Real� Estate | Total | ||||||||||||||||||
| (dollars in millions) | ||||||||||||||||||||||||
| Impaired loans with allowance | $ | 39 | $ | � | $ | 39 | $ | � | $ | � | $ | � | ||||||||||||
| Impaired loans without allowance(1) | 89 | 17 | 106 | 2 | 17 | 19 | ||||||||||||||||||
| Impaired loans unpaid principal balance | 130 | 19 | 149 | 2 | 17 | 19 | ||||||||||||||||||
| Past due 90 days loans and on nonaccrual | 1 | 21 | 22 | 2 | 25 | 27 | ||||||||||||||||||
| (1) | At December�31, 2015 and December�31, 2014, no allowance was outstanding for these loans as the present value of the expected future cash flows (or, alternatively, the observable market price of the loan or the fair value of the collateral held) equaled or exceeded the carrying value. |
| At December�31, 2015 | At December�31, 2014 | |||||||||||||||||||||||||||||||
| Loans by Region | Americas | EMEA | Asia- Pacific | Total | Americas | EMEA | Asia- Pacific | Total | ||||||||||||||||||||||||
| (dollars in millions) | ||||||||||||||||||||||||||||||||
| Impaired loans | $ | 108 | $ | 12 | $ | 25 | $ | 145 | $ | 19 | $ | � | $ | � | $ | 19 | ||||||||||||||||
| Past due 90 days loans and on nonaccrual | 22 | � | � | 22 | 27 | � | � | 27 | ||||||||||||||||||||||||
| Allowance for loan losses | 183 | 34 | 8 | 225 | 121 | 20 | 8 | 149 | ||||||||||||||||||||||||
| | 188 |
| Corporate | Consumer | Residential Real� Estate | Wholesale Real�Estate | Total | ||||||||||||||||
| (dollars in millions) | ||||||||||||||||||||
| Allowance for Loan Losses. | ||||||||||||||||||||
| Balance at December�31, 2014 | $ | 118 | $ | 2 | $ | 8 | $ | 21 | $ | 149 | ||||||||||
| Gross charge-offs | � | � | (1 | ) | � | (1 | ) | |||||||||||||
| Gross recoveries | 1 | � | � | � | 1 | |||||||||||||||
| Net recoveries/(charge-offs) | 1 | � | (1 | ) | � | � | ||||||||||||||
| Provision for loan losses | 58 | 3 | 10 | 16 | 87 | |||||||||||||||
| Other(1) | (11 | ) | � | � | � | (11 | ) | |||||||||||||
| Balance at December�31, 2015 | $ | 166 | $ | 5 | $ | 17 | $ | 37 | $ | 225 | ||||||||||
| Allowance for Loan Losses by Impairment Methodology. | ||||||||||||||||||||
| Inherent | $ | 156 | $ | 5 | $ | 17 | $ | 37 | $ | 215 | ||||||||||
| Specific | 10 | � | � | � | 10 | |||||||||||||||
| Total allowance for loan losses at December�31, 2015 | $ | 166 | $ | 5 | $ | 17 | $ | 37 | $ | 225 | ||||||||||
| Loans Evaluated by Impairment Methodology(2). | ||||||||||||||||||||
| Inherent | $ | 23,426 | $ | 21,528 | $ | 20,846 | $ | 6,839 | $ | 72,639 | ||||||||||
| Specific | 128 | � | 17 | � | 145 | |||||||||||||||
| Total loans evaluated at December�31, 2015 | $ | 23,554 | $ | 21,528 | $ | 20,863 | $ | 6,839 | $ | 72,784 | ||||||||||
| Allowance for Lending Commitments. | ||||||||||||||||||||
| Balance at December�31, 2014 | $ | 147 | $ | � | $ | � | $ | 2 | $ | 149 | ||||||||||
| Provision for lending commitments | 33 | 1 | � | 2 | 36 | |||||||||||||||
| Balance at December�31, 2015 | $ | 180 | $ | 1 | $ | � | $ | 4 | $ | 185 | ||||||||||
| Allowance for Lending Commitments by Impairment Methodology. | ||||||||||||||||||||
| Inherent | $ | 173 | $ | 1 | $ | � | $ | 4 | $ | 178 | ||||||||||
| Specific | 7 | � | � | � | 7 | |||||||||||||||
| Total allowance for lending commitments at December�31, 2015 | $ | 180 | $ | 1 | $ | � | $ | 4 | $ | 185 | ||||||||||
| Lending Commitments Evaluated by Impairment Methodology(2). | ||||||||||||||||||||
| Inherent | $ | 63,873 | $ | 4,856 | $ | 312 | $ | 381 | $ | 69,422 | ||||||||||
| Specific | 126 | � | � | � | 126 | |||||||||||||||
| Total lending commitments evaluated at December�31, 2015 | $ | 63,999 | $ | 4,856 | $ | 312 | $ | 381 | $ | 69,548 | ||||||||||
| 189 | |
| Corporate | Consumer | Residential Real� Estate | Wholesale Real�Estate | Total | ||||||||||||||||
| (dollars in millions) | ||||||||||||||||||||
| Allowance for Loan Losses. | ||||||||||||||||||||
| Balance at December�31, 2013 | $ | 137 | $ | 1 | $ | 4 | $ | 14 | $ | 156 | ||||||||||
| Gross charge-offs | (3 | ) | � | � | (3 | ) | (6 | ) | ||||||||||||
| Gross recoveries | � | � | � | 1 | 1 | |||||||||||||||
| Net recoveries/(charge-offs) | (3 | ) | � | � | (2 | ) | (5 | ) | ||||||||||||
| Provision (release) for loan losses | (13 | ) | 1 | 4 | 9 | 1 | ||||||||||||||
| Other(1) | (3 | ) | � | � | � | (3 | ) | |||||||||||||
| Balance at December�31, 2014 | $ | 118 | $ | 2 | $ | 8 | $ | 21 | $ | 149 | ||||||||||
| Allowance for Loan Losses by Impairment Methodology. | ||||||||||||||||||||
| Inherent | $ | 118 | $ | 2 | $ | 8 | $ | 21 | $ | 149 | ||||||||||
| Specific | � | � | � | � | � | |||||||||||||||
| Total allowance for loan losses at December�31, 2014 | $ | 118 | $ | 2 | $ | 8 | $ | 21 | $ | 149 | ||||||||||
| Loans Evaluated by Impairment Methodology(2). | ||||||||||||||||||||
| Inherent | $ | 19,657 | $ | 16,576 | $ | 15,718 | $ | 5,298 | $ | 57,249 | ||||||||||
| Specific | 2 | � | 17 | � | 19 | |||||||||||||||
| Total loan evaluated at December�31, 2014 | $ | 19,659 | $ | 16,576 | $ | 15,735 | $ | 5,298 | $ | 57,268 | ||||||||||
| Allowance for Lending Commitments. | ||||||||||||||||||||
| Balance at December�31, 2013 | $ | 125 | $ | � | $ | � | $ | 2 | $ | 127 | ||||||||||
| Provision for lending commitments | 22 | � | � | � | 22 | |||||||||||||||
| Balance at December�31, 2014 | $ | 147 | $ | � | $ | � | $ | 2 | $ | 149 | ||||||||||
| Allowance for Lending Commitments by Impairment Methodology. | ||||||||||||||||||||
| Inherent | $ | 147 | $ | � | $ | � | $ | 2 | $ | 149 | ||||||||||
| Specific | � | � | � | � | � | |||||||||||||||
| Total allowance for lending commitments at December�31, 2014 | $ | 147 | $ | � | $ | � | $ | 2 | $ | 149 | ||||||||||
| Lending Commitments Evaluated by Impairment Methodology(2). | ||||||||||||||||||||
| Inherent | $ | 65,987 | $ | 3,484 | $ | 283 | $ | 367 | $ | 70,121 | ||||||||||
| Specific | 26 | � | � | � | 26 | |||||||||||||||
| Total lending commitments evaluated at December�31, 2014 | $ | 66,013 | $ | 3,484 | $ | 283 | $ | 367 | $ | 70,147 | ||||||||||
| (1) | Amount includes the impact related to the transfer to loans held for sale and foreign currency translation adjustments. |
| (2) | Loan balances are gross of the allowance for loan losses, and lending commitments are gross of the allowance for lending commitments. |
| | 190 |
| 8. | Equity Method Investments. |
| At December�31, | ||||||||
| 2015 | 2014 | |||||||
| (dollars in millions) | ||||||||
| Total assets | $ | 135,398 | $ | 111,053 | ||||
| Total liabilities | 132,492 | 108,263 | ||||||
| Noncontrolling interests | 29 | 37 | ||||||
| 2015 | 2014 | 2013 | ||||||||||
| (dollars in millions) | ||||||||||||
| Net revenues | $ | 2,961 | $ | 2,961 | $ | 3,305 | ||||||
| Income from continuing operations before income taxes | 845 | 908 | 1,325 | |||||||||
| Net income | 589 | 595 | 1,459 | |||||||||
| Net income applicable to MUMSS | 565 | 582 | 1,441 | |||||||||
| 9. | Goodwill and Net Intangible Assets. |
| 191 | |
| Institutional Securities | Wealth Management | Investment Management | Total | |||||||||||||
| (dollars in millions) | ||||||||||||||||
| Goodwill at December�31, 2013(1) | $ | 293 | $ | 5,533 | $ | 769 | $ | 6,595 | ||||||||
| Foreign currency translation adjustments and other | (14 | ) | � | � | (14 | ) | ||||||||||
| Goodwill acquired during the period | 7 | � | � | 7 | ||||||||||||
| Goodwill at December�31, 2014(1) | $ | 286 | $ | 5,533 | $ | 769 | $ | 6,588 | ||||||||
| Foreign currency translation adjustments and other | (15 | ) | � | � | (15 | ) | ||||||||||
| Goodwill acquired during the period | 11 | � | � | 11 | ||||||||||||
| Goodwill at December�31, 2015(1) | $ | 282 | $ | 5,533 | $ | 769 | $ | 6,584 | ||||||||
| (1) | The amount of the Company�s goodwill before accumulated impairments of $700 million, which included $673 million related to the Institutional Securities business segment and $27 million related to the Investment Management business segment, was $7,284 million and $7,288 million at December�31, 2015 and December�31, 2014, respectively. |
| Institutional Securities | Wealth Management | Investment Management | Total | |||||||||||||
| (dollars in millions) | ||||||||||||||||
| Amortizable net intangible assets at December�31, 2013 | $ | 56 | $ | 3,182 | $ | 40 | $ | 3,278 | ||||||||
| Mortgage servicing rights | � | 8 | � | 8 | ||||||||||||
| Net intangible assets at December�31, 2013 | $ | 56 | $ | 3,190 | $ | 40 | $ | 3,286 | ||||||||
| Amortizable net intangible assets at December�31, 2013 | $ | 56 | $ | 3,182 | $ | 40 | $ | 3,278 | ||||||||
| Disposal | (4 | ) | � | � | (4 | ) | ||||||||||
| Intangible assets acquired during the period | 182 | � | � | 182 | ||||||||||||
| Amortization expense | (13 | ) | (274 | ) | (10 | ) | (297 | ) | ||||||||
| Impairment losses(1) | � | (3 | ) | (3 | ) | (6 | ) | |||||||||
| Amortizable net intangible assets at December�31, 2014 | 221 | 2,905 | 27 | 3,153 | ||||||||||||
| Mortgage servicing rights | � | 6 | � | 6 | ||||||||||||
| Net intangible assets at December�31, 2014 | $ | 221 | $ | 2,911 | $ | 27 | $ | 3,159 | ||||||||
| Amortizable net intangible assets at December�31, 2014 | $ | 221 | $ | 2,905 | $ | 27 | $ | 3,153 | ||||||||
| Intangible assets acquired during the period(2) | 160 | � | � | 160 | ||||||||||||
| Amortization expense | (26 | ) | (273 | ) | (7 | ) | (306 | ) | ||||||||
| Other | (28 | ) | � | � | (28 | ) | ||||||||||
| Amortizable net intangible assets at December�31, 2015 | 327 | 2,632 | 20 | 2,979 | ||||||||||||
| Mortgage servicing rights | � | 5 | � | 5 | ||||||||||||
| Net intangible assets at December�31, 2015 | $ | 327 | $ | 2,637 | $ | 20 | $ | 2,984 | ||||||||
| (1) | Impairment losses are recorded within Other expenses in the consolidated statements of income. |
| (2) | Includes a $159 million net increase in Intangible assets related to a Commodities division transaction, which also resulted in a gain of $78 million recorded in Other revenues in the consolidated statements of income. |
| | 192 |
| At December�31, 2015 | At December�31, 2014 | |||||||||||||||
| Gross�Carrying Amount | Accumulated Amortization | Gross�Carrying Amount | Accumulated Amortization | |||||||||||||
| (dollars in millions) | ||||||||||||||||
| Trademarks | $ | 1 | $ | 0 | $ | 7 | $ | 6 | ||||||||
| Tradename | 280 | 31 | 280 | 21 | ||||||||||||
| Customer relationships | 4,059 | 1,686 | 4,048 | 1,430 | ||||||||||||
| Management contracts | 478 | 250 | 268 | 170 | ||||||||||||
| Other | 291 | 163 | 374 | 197 | ||||||||||||
| Total amortizable intangible assets | $ | 5,109 | $ | 2,130 | $ | 4,977 | $ | 1,824 | ||||||||
| 10. | D eposits. |
| At December�31,� 2015(1) | At December�31,� 2014(1) | |||||||
| (dollars in millions) | ||||||||
| Savings and demand deposits | $ | 153,346 | $ | 132,159 | ||||
| Time deposits(2) | 2,688 | 1,385 | ||||||
| Total(3) | $ | 156,034 | $ | 133,544 | ||||
| (1) | Total deposits subject to the FDIC insurance at December�31, 2015 and December�31, 2014 were $113 billion and $99 billion, respectively. Of the total time deposits subject to the FDIC insurance at December�31, 2015 and December�31, 2014, $14�million and $2�million, respectively, met or exceeded the FDIC insurance limit. |
| (2) | Certain time deposit accounts are carried at fair value under the fair value option (see Note 3). |
| (3) | The Company�s deposits were primarily held in the U.S. |
| 193 | |
| 11. | Borrowings and Other Secured Financings. |
| Parent Company | Subsidiaries | At December� 31, 2015(2)(3) | At December� 31, 2014 | |||||||||||||||||||||
| Fixed Rate | Variable Rate(1) | Fixed Rate | Variable Rate(1) | |||||||||||||||||||||
| (dollars in millions) | ||||||||||||||||||||||||
| Due in 2015 | $ | � | $ | � | $ | � | $ | � | $ | � | $ | 20,740 | ||||||||||||
| Due in 2016 | 9,883 | 8,227 | 24 | 4,262 | 22,396 | 20,643 | ||||||||||||||||||
| Due in 2017 | 14,550 | 6,611 | 13 | 1,092 | 22,266 | 24,000 | ||||||||||||||||||
| Due in 2018 | 13,118 | 3,981 | 15 | 823 | 17,937 | 17,679 | ||||||||||||||||||
| Due in 2019 | 11,219 | 6,740 | 47 | 562 | 18,568 | 17,571 | ||||||||||||||||||
| Due in 2020 | 11,289 | 4,713 | 14 | 989 | 17,005 | 8,190 | ||||||||||||||||||
| Thereafter | 45,173 | 8,586 | 308 | 1,529 | 55,596 | 43,949 | ||||||||||||||||||
| Total | $ | 105,232 | $ | 38,858 | $ | 421 | $ | 9,257 | $ | 153,768 | $ | 152,772 | ||||||||||||
| Weighted average coupon at period-end(4) | 4.5% | 1.0% | 6.1% | N/M | 4.0% | 4.2% | ||||||||||||||||||
| (1) | Variable rate borrowings bear interest based on a variety of money market indices, including LIBOR and federal funds rates. Amounts include borrowings that are equity-linked, credit-linked, commodity-linked or linked to some other index. |
| (2) | Amounts include an increase of approximately $2.7 billion at December�31, 2015 to the carrying amount of certain of the long-term borrowings associated with fair value hedges. The increase to the carrying value associated with fair value hedges by year due was approximately $0.1 billion due in 2016, $0.5 billion due in 2017, $0.3 billion due in 2018, $0.5 billion due in 2019, $0.4 billion due in 2020 and $0.9 billion due thereafter. |
| (3) | Amounts include a decrease of approximately $0.5 billion at December�31, 2015 to the carrying amounts of certain of the long-term borrowings for which the fair value option was elected (see Note 3). |
| (4) | Weighted average coupon was calculated utilizing U.S. and non-U.S. dollar interest rates and excludes financial instruments for which the fair value option was elected. Virtually all of the variable rate notes issued by subsidiaries are carried at fair value so a weighted average coupon is not meaningful. |
| At December�31,� 2015 | At December�31,� 2014 | |||||||
| (dollars in millions) | ||||||||
| Senior debt | $ | 140,494 | $ | 139,565 | ||||
| Subordinated debt | 10,404 | 8,339 | ||||||
| Junior subordinated debentures | 2,870 | 4,868 | ||||||
| Total | $ | 153,768 | $ | 152,772 | ||||
| | 194 |
| 2015 | 2014 | 2013 | ||||||||||
| Weighted average coupon of long-term borrowings at period-end(1) | 4.0% | 4.2% | 4.4% | |||||||||
| Effective average borrowing rate for long-term borrowings after swaps at period-end(1) | 2.1% | 2.3% | 2.2% | |||||||||
| 195 | |
| (1) | Included in the weighted average and effective average calculations are U.S. and non-U.S. dollar interest rates. |
| At December�31,� 2015 | At December�31,� 2014 | |||||||
| (dollars in millions) | ||||||||
| Secured financings with original maturities greater than one year | $ | 7,629 | $ | 10,346 | ||||
| Secured financings with original maturities one year or less(1) | 1,435 | 1,395 | ||||||
| Failed sales(2) | 400 | 344 | ||||||
| Total | $ | 9,464 | $ | 12,085 | ||||
| (1) | Amounts include approximately $1,401 million of variable rate financings and approximately $34 million in fixed rate financings at December�31, 2015 and approximately $1,299 million of variable rate financings and approximately $96 million in fixed rate financings at December�31, 2014. |
| (2) | For more information on failed sales, see Note 13. |
| At December�31, 2015 | At December� 31, 2014 | |||||||||||||||
| Fixed�Rate | Variable Rate(1) | Total | ||||||||||||||
| (dollars in millions) | ||||||||||||||||
| Due in 2015 | $ | � | $ | � | $ | � | $ | 3,341 | ||||||||
| Due in 2016 | � | 2,333 | 2,333 | 4,705 | ||||||||||||
| Due in 2017 | � | 2,122 | 2,122 | 881 | ||||||||||||
| Due in 2018 | � | 1,553 | 1,553 | 786 | ||||||||||||
| Due in 2019 | 1 | 1,147 | 1,148 | 194 | ||||||||||||
| Due in 2020 | 58 | 84 | 142 | 56 | ||||||||||||
| Thereafter | 84 | 247 | 331 | 383 | ||||||||||||
| Total | $ | 143 | $ | 7,486 | $ | 7,629 | $ | 10,346 | ||||||||
| Weighted average coupon rate at period-end(2) | 3.9% | 1.2% | 1.2% | 0.8% | ||||||||||||
| (1) | Variable rate borrowings bear interest based on a variety of indices, including LIBOR. Amounts include borrowings that are equity-linked, credit-linked, commodity-linked or linked to some other index. |
| (2) | Weighted average coupon was calculated utilizing U.S. and non-U.S. dollar interest rates and excludes secured financings that are linked to non-interest indices and for which fair value option was elected. |
| | 196 |
| At December� 31, 2015 | At December� 31, 2014 | |||||||
| (dollars in millions) | ||||||||
| Due in 2015 | $ | � | $ | 32 | ||||
| Due in 2016 | 69 | 90 | ||||||
| Due in 2017 | 168 | 148 | ||||||
| Due in 2018 | 1 | 14 | ||||||
| Due in 2019 | 54 | 10 | ||||||
| Due in 2020 | 104 | � | ||||||
| Thereafter | 4 | 50 | ||||||
| Total | $ | 400 | $ | 344 | ||||
| 12.����Commitments, | Guarantees and Contingencies. |
| Years to Maturity at December�31, 2015 | ||||||||||||||||||||
| Less than�1 | 1-3 | 3-5 | Over 5 | Total | ||||||||||||||||
| (dollars in millions) | ||||||||||||||||||||
| Letters of credit and other financial guarantees obtained to satisfy collateral requirements | $ | 172 | $ | 7 | $ | � | $ | 107 | $ | 286 | ||||||||||
| Investment activities | 544 | 78 | 36 | 398 | 1,056 | |||||||||||||||
| Corporate lending commitments(1) | 14,912 | 25,124 | 48,655 | 7,025 | 95,716 | |||||||||||||||
| Consumer lending commitments | 4,846 | 5 | � | 4 | 4,855 | |||||||||||||||
| Residential real estate lending commitments | 24 | 99 | 63 | 246 | 432 | |||||||||||||||
| Wholesale real estate lending commitments | 82 | 265 | 41 | 2 | 390 | |||||||||||||||
| Forward-starting reverse repurchase agreements and securities borrowing agreements(2)(3) | 33,485 | � | � | � | 33,485 | |||||||||||||||
| Total | $ | 54,065 | $ | 25,578 | $ | 48,795 | $ | 7,782 | $ | 136,220 | ||||||||||
| (1) | Due to the nature of the Company�s obligations under the commitments, these amounts include certain commitments participated to third parties of $4.2 billion. |
| (2) | The Company enters into forward-starting reverse repurchase and securities borrowing agreements that primarily settle within three business days of the trade date, and of the total amount at December�31, 2015, $25.6 billion settled within three business days. |
| (3) | The Company also has a contingent obligation to provide financing to a clearinghouse through which it clears certain transactions. The financing is required only upon the default of a clearinghouse member. The financing takes the form of a reverse repurchase facility, with a maximum amount of approximately $2.2 billion. |
| 197 | |
| At
December�31, 2015 | ||||
| (dollars�in�millions) | ||||
| 2016 | $ | 612 | ||
| 2017 | 642 | |||
| 2018 | 570 | |||
| 2019 | 485 | |||
| 2020 | 438 | |||
| Thereafter | 3,127 | |||
| | 198 |
| Maximum Potential Payout/Notional | ||||||||||||||||||||||||||||
| Years to Maturity | ||||||||||||||||||||||||||||
| Less than 1 | 1-3 | 3-5 | Over 5 | Total | Carrying Amount (Asset)/ Liability | Collateral/ Recourse | ||||||||||||||||||||||
| (dollars in millions) | ||||||||||||||||||||||||||||
| Credit derivative contracts(1) | $ | 208,694 | $ | 298,030 | $ | 149,171 | $ | 33,624 | $ | 689,519 | $ | 785 | $ | � | ||||||||||||||
| Other credit contracts | 19 | 107 | 2 | 332 | 460 | (24 | ) | � | ||||||||||||||||||||
| Non-credit derivative contracts(1) | 1,103,014 | 760,769 | 321,557 | 567,755 | 2,753,095 | 61,401 | � | |||||||||||||||||||||
| Standby letters of credit and other financial guarantees issued(2) | 822 | 1,361 | 1,174 | 5,870 | 9,227 | (175 | ) | 7,633 | ||||||||||||||||||||
| Market value guarantees | 11 | 166 | 224 | 29 | 430 | (3 | ) | 6 | ||||||||||||||||||||
| Liquidity facilities | 3,079 | � | � | � | 3,079 | (5 | ) | 4,875 | ||||||||||||||||||||
| Whole loan sales guarantees | � | � | 1 | 23,451 | 23,452 | 9 | � | |||||||||||||||||||||
| Securitization representations and warranties | � | � | � | 65,000 | 65,000 | 98 | � | |||||||||||||||||||||
| General partner guarantees | 25 | 41 | 87 | 467 | 620 | 29 | � | |||||||||||||||||||||
| (1) | Carrying amounts of derivative contracts are shown on a gross basis prior to cash collateral or counterparty netting. For further information on derivative contracts, see Note 4. |
| (2) | These amounts include certain issued standby letters of credit participated to third parties totaling $0.7 billion due to the nature of the Company�s obligations under these arrangements. |
| 199 | |
| | 200 |
| � | Trust Preferred Securities. The Company has established Morgan Stanley Capital Trusts for the limited purpose of issuing trust preferred securities to third parties and lending such proceeds to the Company in exchange for junior subordinated debentures. The Morgan Stanley Capital Trusts are SPEs, and only the Parent provides a guarantee for the trust preferred securities. The Company has directly guaranteed the repayment of the trust preferred securities to the holders in accordance with the terms thereof. See Note 11 for details on the Company�s junior subordinated debentures. |
| � | Indemnities. The Company provides standard indemnities to counterparties for certain contingent exposures and taxes, including U.S. and foreign withholding taxes, on interest and other payments made on derivatives, securities and stock lending transactions, certain annuity products and other financial arrangements. These indemnity payments could be required based on a change in the tax laws, a change in interpretation of applicable tax rulings or a change in factual circumstances. Certain contracts contain provisions that enable the Company to terminate the agreement upon the occurrence of such events. The maximum potential amount of future payments that the Company could be required to make under these indemnifications cannot be estimated. |
| � | Exchange/Clearinghouse Member Guarantees. The Company is a member of various U.S. and non-U.S. exchanges and clearinghouses that trade and clear securities and/or derivative contracts. Associated with its |
| 201 | |
| membership, the Company may be required to pay a proportionate share of the financial obligations of another member who may default on its obligations to the exchange or the clearinghouse. While the rules governing different exchange or clearinghouse memberships vary, in general the Company�s obligations under these rules would arise only if the exchange or clearinghouse had previously exhausted its resources. In addition, some clearinghouse rules require members to assume a proportionate share of losses resulting from the clearinghouse�s investment of guarantee fund contributions and initial margin, and of other losses unrelated to the default of a clearing member, if such losses exceed the specified resources allocated for such purpose by the clearinghouse. The maximum potential payout under these rules cannot be estimated. The Company has not recorded any contingent liability in its consolidated financial statements for these agreements and believes that any potential requirement to make payments under these agreements is remote. |
| | 202 |
| 203 | |
| | 204 |
| 13. | Variable Interest Entities and Securitization Activities. |
| � | Interests purchased in connection with market-making activities, securities held in its Investment securities portfolio and retained interests held as a result of securitization activities, including re-securitization transactions. |
| � | Guarantees issued and residual interests retained in connection with municipal bond securitizations. |
| � | Loans made to and investments in VIEs that hold debt, equity, real estate or other assets. |
| � | Derivatives entered into with VIEs. |
| � | Structuring of CLNs or other asset-repackaged notes designed to meet the investment objectives of clients. |
| � | Other structured transactions designed to provide tax-efficient yields to the Company or its clients. |
| 205 | |
| | 206 |
| At December�31, 2015 | At December�31, 2014 | |||||||||||||||
| VIE�Assets | VIE�Liabilities | VIE�Assets | VIE�Liabilities | |||||||||||||
| (dollars in millions) | ||||||||||||||||
| Mortgage- and asset-backed securitizations | $ | 375 | $ | 234 | $ | 563 | $ | 337 | ||||||||
| Managed real estate partnerships(1) | 38 | 1 | 288 | 4 | ||||||||||||
| Other structured financings | 787 | 13 | 928 | 80 | ||||||||||||
| Credit-linked notes and Other | 1,400 | 189 | 1,199 | � | ||||||||||||
| (1) | During 2015 and 2014, the Company deconsolidated approximately $191 million and $1.6 billion, respectively, in net assets previously attributable to nonredeemable noncontrolling interests that were primarily related to or associated with real estate funds sponsored by the Company. |
| 207 | |
| At December�31, 2015 | ||||||||||||||||||||
| Mortgage-�and Asset-Backed Securitizations | Collateralized Debt Obligations | Municipal Tender Option�Bonds | Other Structured Financings | Other | ||||||||||||||||
| (dollars in millions) | ||||||||||||||||||||
| VIE assets that the Company does not consolidate (unpaid principal balance)(1) | $ | 126,872 | $ | 8,805 | $ | 4,654 | $ | 2,201 | $ | 20,775 | ||||||||||
| Maximum exposure to loss: | ||||||||||||||||||||
| Debt and equity interests(2) | $ | 13,361 | $ | 1,259 | $ | 1 | $ | 1,129 | $ | 3,854 | ||||||||||
| Derivative and other contracts | � | � | 2,834 | � | 67 | |||||||||||||||
| Commitments, guarantees and other | 494 | 231 | � | 361 | 222 | |||||||||||||||
| Total maximum exposure to loss | $ | 13,855 | $ | 1,490 | $ | 2,835 | $ | 1,490 | $ | 4,143 | ||||||||||
| Carrying value of exposure to loss�Assets: | ||||||||||||||||||||
| Debt and equity interests(2) | $ | 13,361 | $ | 1,259 | $ | 1 | $ | 685 | $ | 3,854 | ||||||||||
| Derivative and other contracts | � | � | 5 | � | 13 | |||||||||||||||
| Total carrying value of exposure to loss�Assets | $ | 13,361 | $ | 1,259 | $ | 6 | $ | 685 | $ | 3,867 | ||||||||||
| Carrying value of exposure to loss�Liabilities: | ||||||||||||||||||||
| Derivative and other contracts | $ | � | $ | � | $ | � | $ | � | $ | 15 | ||||||||||
| Commitments, guarantees and other | � | � | � | 3 | � | |||||||||||||||
| Total carrying value of exposure to loss�Liabilities | $ | � | $ | � | $ | � | $ | 3 | $ | 15 | ||||||||||
| | 208 |
| At December�31, 2014 | ||||||||||||||||||||
| Mortgage-�
and Asset-Backed Securitizations | Collateralized Debt Obligations | Municipal Tender Option Bonds | Other Structured Financings | Other | ||||||||||||||||
| (dollars in millions) | ||||||||||||||||||||
| VIE assets that the Company does not consolidate (unpaid principal balance)(3) | $ | 174,548 | $ | 26,567 | $ | 3,449 | $ | 2,040 | $ | 19,237 | ||||||||||
| Maximum exposure to loss: | ||||||||||||||||||||
| Debt and equity interests(4) | $ | 15,028 | $ | 3,062 | $ | 13 | $ | 1,158 | $ | 3,884 | ||||||||||
| Derivative and other contracts | 15 | 2 | 2,212 | � | 164 | |||||||||||||||
| Commitments, guarantees and other | 1,054 | 432 | � | 617 | 429 | |||||||||||||||
| Total maximum exposure to loss | $ | 16,097 | $ | 3,496 | $ | 2,225 | $ | 1,775 | $ | 4,477 | ||||||||||
| Carrying value of exposure to loss�Assets: | ||||||||||||||||||||
| Debt and equity interests(4) | $ | 15,028 | $ | 3,062 | $ | 13 | $ | 741 | $ | 3,884 | ||||||||||
| Derivative and other contracts | 15 | 2 | 4 | � | 74 | |||||||||||||||
| Total carrying value of exposure to loss�Assets | $ | 15,043 | $ | 3,064 | $ | 17 | $ | 741 | $ | 3,958 | ||||||||||
| Carrying value of exposure to loss�Liabilities: | ||||||||||||||||||||
| Derivative and other contracts | $ | � | $ | � | $ | � | $ | � | $ | 57 | ||||||||||
| Commitments, guarantees and other | � | � | � | 5 | � | |||||||||||||||
| Total carrying value of exposure to loss�Liabilities | $ | � | $ | � | $ | � | $ | 5 | $ | 57 | ||||||||||
| (1) | Mortgage- and asset-backed securitizations include VIE assets as follows: $13.8 billion of residential mortgages; $57.3 billion of commercial mortgages; $13.2 billion of U.S. agency collateralized mortgage obligations; and $42.5 billion of other consumer or commercial loans. |
| (2) | Mortgage- and asset-backed securitizations include VIE debt and equity interests as follows: $1.0 billion of residential mortgages; $2.9 billion of commercial mortgages; $2.8 billion of U.S. agency collateralized mortgage obligations; and $6.7 billion of other consumer or commercial loans. |
| (3) | Mortgage- and asset-backed securitizations include VIE assets as follows: $30.8 billion of residential mortgages; $71.9 billion of commercial mortgages; $20.6 billion of U.S. agency collateralized mortgage obligations; and $51.2 billion of other consumer or commercial loans. |
| (4) | Mortgage- and asset-backed securitizations include VIE debt and equity interests as follows: $1.9 billion of residential mortgages; $2.4 billion of commercial mortgages; $4.0 billion of U.S. agency collateralized mortgage obligations; and $6.8 billion of other consumer or commercial loans. |
| 209 | |
| | 210 |
| 211 | |
| At December�31, 2015 | ||||||||||||||||
| Residential Mortgage Loans | Commercial Mortgage Loans | U.S. Agency Collateralized Mortgage Obligations | Credit- Linked Notes and�Other(1) | |||||||||||||
| (dollars in millions) | ||||||||||||||||
| SPE assets (unpaid principal balance)(2) | $ | 22,440 | $ | 72,760 | $ | 17,978 | $ | 12,235 | ||||||||
| Retained interests (fair value): | ||||||||||||||||
| Investment grade | $ | � | $ | 238 | $ | 649 | $ | � | ||||||||
| Non-investment grade | 160 | 63 | � | 1,136 | ||||||||||||
| Total retained interests (fair value) | $ | 160 | $ | 301 | $ | 649 | $ | 1,136 | ||||||||
| Interests purchased in the secondary market (fair value): | ||||||||||||||||
| Investment grade | $ | � | $ | 88 | $ | 99 | $ | � | ||||||||
| Non-investment grade | 60 | 63 | � | 10 | ||||||||||||
| Total interests purchased in the secondary market (fair value) | $ | 60 | $ | 151 | $ | 99 | $ | 10 | ||||||||
| Derivative assets (fair value) | $ | � | $ | 343 | $ | � | $ | 151 | ||||||||
| Derivative liabilities (fair value) | � | � | � | 449 | ||||||||||||
| At December 31, 2014 | ||||||||||||||||
| Residential Mortgage Loans | Commercial Mortgage Loans | U.S. Agency Collateralized Mortgage Obligations | Credit- Linked Notes and�Other(1) | |||||||||||||
| (dollars in millions) | ||||||||||||||||
| SPE assets (unpaid principal balance)(2) | $ | 26,549 | $ | 58,660 | $ | 20,826 | $ | 24,011 | ||||||||
| Retained interests (fair value): | ||||||||||||||||
| Investment grade | $ | 10 | $ | 117 | $ | 1,019 | $ | 57 | ||||||||
| Non-investment grade | 98 | 120 | � | 1,264 | ||||||||||||
| Total retained interests (fair value) | $ | 108 | $ | 237 | $ | 1,019 | $ | 1,321 | ||||||||
| Interests purchased in the secondary market (fair value): | ||||||||||||||||
| Investment grade | $ | 32 | $ | 129 | $ | 61 | $ | 423 | ||||||||
| Non-investment grade | 32 | 72 | � | 59 | ||||||||||||
| Total interests purchased in the secondary market (fair value) | $ | 64 | $ | 201 | $ | 61 | $ | 482 | ||||||||
| Derivative assets (fair value) | $ | � | $ | 495 | $ | � | $ | 138 | ||||||||
| Derivative liabilities (fair value) | � | � | � | 86 | ||||||||||||
| | 212 |
| (1) | Amounts include CLO transactions managed by unrelated third parties. |
| (2) | Amounts include assets transferred by unrelated transferors. |
| At December�31, 2015 | ||||||||||||||||
| Level�1 | Level�2 | Level�3 | Total | |||||||||||||
| (dollars in millions) | ||||||||||||||||
| Retained interests (fair value): | ||||||||||||||||
| Investment grade | $ | � | $ | 886 | $ | 1 | $ | 887 | ||||||||
| Non-investment grade | � | 17 | 1,342 | 1,359 | ||||||||||||
| Total retained interests (fair value) | $ | � | $ | 903 | $ | 1,343 | $ | 2,246 | ||||||||
| Interests purchased in the secondary market (fair value): | ||||||||||||||||
| Investment grade | $ | � | $ | 187 | $ | � | $ | 187 | ||||||||
| Non-investment grade | � | 112 | 21 | 133 | ||||||||||||
| Total interests purchased in the secondary market (fair value) | $ | � | $ | 299 | $ | 21 | $ | 320 | ||||||||
| Derivative assets (fair value) | $ | � | $ | 466 | $ | 28 | $ | 494 | ||||||||
| Derivative liabilities (fair value) | � | 110 | 339 | 449 | ||||||||||||
| At December 31, 2014 | ||||||||||||||||
| Level�1 | Level�2 | Level�3 | Total | |||||||||||||
| (dollars in millions) | ||||||||||||||||
| Retained interests (fair value): | ||||||||||||||||
| Investment grade | $ | � | $ | 1,166 | $ | 37 | $ | 1,203 | ||||||||
| Non-investment grade | � | 123 | 1,359 | 1,482 | ||||||||||||
| Total retained interests (fair value) | $ | � | $ | 1,289 | $ | 1,396 | $ | 2,685 | ||||||||
| Interests purchased in the secondary market (fair value): | ||||||||||||||||
| Investment grade | $ | � | $ | 644 | $ | 1 | $ | 645 | ||||||||
| Non-investment grade | � | 129 | 34 | 163 | ||||||||||||
| Total interests purchased in the secondary market (fair value) | $ | � | $ | 773 | $ | 35 | $ | 808 | ||||||||
| Derivative assets (fair value) | $ | � | $ | 559 | $ | 74 | $ | 633 | ||||||||
| Derivative liabilities (fair value) | � | 82 | 4 | 86 | ||||||||||||
| 2015 | 2014 | 2013 | ||||||||||
| (dollars in millions) | ||||||||||||
| Proceeds received from new securitization transactions | $ | 21,243 | $ | 20,553 | $ | 24,889 | ||||||
| Proceeds from retained interests in securitization transactions | 3,062 | 3,041 | 4,614 | |||||||||
| 213 | |
| 2015 | 2014 | 2013 | ||||||||||
| (dollars in millions) | ||||||||||||
| Proceeds from sale of corporate loans sold to those SPEs | $ | 1,110 | $ | 2,388 | $ | 2,347 | ||||||
| At�December�31,�2015 | At�December�31,�2014 | |||||||||||||||
| Carrying Value of: | Carrying Value of: | |||||||||||||||
| Assets | Liabilities | Assets | Liabilities | |||||||||||||
| (dollars in millions) | ||||||||||||||||
| Failed sales | $ | 400 | $ | 400 | $ | 352 | $ | 344 | ||||||||
| 14. | Regulatory Requirements. |
| | 214 |
| 215 | |
| At December�31, 2015 | At December�31, 2014 | |||||||||||||||||||||||
| Amount | Ratio | Minimum Regulatory Capital Ratio(1) | Amount | Ratio | Minimum Regulatory Capital Ratio(1) | |||||||||||||||||||
| (dollars in millions) | ||||||||||||||||||||||||
| Regulatory capital and capital ratios: | ||||||||||||||||||||||||
| Common Equity Tier 1 capital | $ | 59,409 | 15.5% | 4.5% | $ | 57,324 | 12.6% | 4.0% | ||||||||||||||||
| Tier 1 capital | 66,722 | 17.4% | 6.0% | 64,182 | 14.1% | 5.5% | ||||||||||||||||||
| Total capital | 79,403 | 20.7% | 8.0% | 74,972 | 16.4% | 8.0% | ||||||||||||||||||
| Tier 1 leverage(2) | � | 8.3% | 4.0% | � | 7.9% | 4.0% | ||||||||||||||||||
| Assets: | ||||||||||||||||||||||||
| Total RWAs | $ | 384,162 | N/A | N/A | $ | 456,008 | N/A | N/A | ||||||||||||||||
| Adjusted average assets(3) | 803,574 | N/A | N/A | 810,524 | N/A | N/A | ||||||||||||||||||
| (1) | Percentages represent minimum regulatory capital ratios under U.S. Basel III transitional rules. |
| (2) | Tier 1 leverage ratios are calculated under U.S. Basel III Standardized Approach transitional rules. |
| (3) | Beginning with the first quarter of 2015, in accordance with U.S. Basel III, adjusted average assets represent the denominator of the Tier�1 leverage ratio and are composed of the average daily balance of consolidated on-balance sheet assets under U.S. GAAP during the calendar quarter, adjusted for disallowed goodwill, transitional intangible assets, certain deferred tax assets, certain investments in the capital instruments of unconsolidated financial institutions and other adjustments. |
| Morgan Stanley Bank, N.A. | ||||||||||||||||||||||||
| At December�31, 2015 | At December�31, 2014 | |||||||||||||||||||||||
| U.S.�Basel�III�Transitional/ Standardized Approach | Required Capital Ratio(1) | U.S.�Basel�III�Transitional/ Basel�I�+�Basel�2.5�Approach | Required Capital Ratio(1) | |||||||||||||||||||||
| Amount | Ratio | Amount | Ratio | |||||||||||||||||||||
| (dollars in millions) | ||||||||||||||||||||||||
| Common Equity Tier 1 capital | $ | 13,333 | 15.1% | 6.5% | $ | 12,355 | 12.2% | 6.5% | ||||||||||||||||
| Tier 1 capital | 13,333 | 15.1% | 8.0% | 12,355 | 12.2% | 8.0% | ||||||||||||||||||
| Total capital | 15,097 | 17.1% | 10.0% | 14,040 | 13.9% | 10.0% | ||||||||||||||||||
| Tier 1 leverage | 13,333 | 10.2% | 5.0% | 12,355 | 10.2% | 5.0% | ||||||||||||||||||
| Morgan Stanley Private Bank, National Association | ||||||||||||||||||||||||
| At December�31, 2015 | At December�31, 2014 | |||||||||||||||||||||||
| U.S.�Basel�III�
Transitional/ Standardized Approach | Required Capital Ratio(1) | U.S.�Basel�III�
Transitional/ Basel�I�+�Basel�2.5�Approach | Required Capital Ratio(1) | |||||||||||||||||||||
| Amount | Ratio | Amount | Ratio | |||||||||||||||||||||
| (dollars in millions) | ||||||||||||||||||||||||
| Common Equity Tier 1 capital | $ | 4,197 | 26.5% | 6.5% | $ | 2,468 | 20.3% | 6.5% | ||||||||||||||||
| Tier 1 capital | 4,197 | 26.5% | 8.0% | 2,468 | 20.3% | 8.0% | ||||||||||||||||||
| Total capital | 4,225 | 26.7% | 10.0% | 2,480 | 20.4% | 10.0% | ||||||||||||||||||
| Tier 1 leverage | 4,197 | 10.5% | 5.0% | 2,468 | 9.4% | 5.0% | ||||||||||||||||||
| | 216 |
| (1) | Capital ratios that are required in order to be considered well-capitalized for U.S. regulatory purposes. |
| 217 | |
| 15. | Total Equity |
| 2015 | 2014 | |||||||
| (in millions) | ||||||||
| Shares outstanding at beginning of period | 1,951 | 1,945 | ||||||
| Treasury stock purchases(1) | (78 | ) | (46 | ) | ||||
| Other(2) | 47 | 52 | ||||||
| Shares outstanding at end of period | 1,920 | 1,951 | ||||||
| (1) | Treasury stock purchases include repurchases of common stock for employee tax withholding. |
| (2) | Other includes net shares issued to and forfeited from Employee stock trusts and issued for RSU conversions. |
| | 218 |
| Shares�Outstanding At December�31, 2015 | Liquidation Preference per Share | Carrying Value | ||||||||||||||
| Series | At December�31, 2015 | At December�31, 2014 | ||||||||||||||
| (shares in millions) | (dollars in millions) | |||||||||||||||
| A | 44,000 | $ | 25,000 | $ | 1,100 | $ | 1,100 | |||||||||
| C(1) | 519,882 | 1,000 | 408 | 408 | ||||||||||||
| E | 34,500 | 25,000 | 862 | 862 | ||||||||||||
| F | 34,000 | 25,000 | 850 | 850 | ||||||||||||
| G | 20,000 | 25,000 | 500 | 500 | ||||||||||||
| H | 52,000 | 25,000 | 1,300 | 1,300 | ||||||||||||
| I | 40,000 | 25,000 | 1,000 | 1,000 | ||||||||||||
| J | 60,000 | 25,000 | 1,500 | � | ||||||||||||
| Total | $ | 7,520 | $ | 6,020 | ||||||||||||
| (1) | Series C is comprised of the issuance of 1,160,791 shares of Series C Preferred Stock to MUFG for an aggregate purchase price of $911 million, less the redemption of 640,909 shares of Series C Preferred Stock of $503 million, which were converted to common shares of approximately $705 million. |
| Series | Issuance Date | Preferred Stock Issuance Description | Redemption Price per� Share(1) | Redeemable�on or after Date | Dividend per�Share(2) | |||||||||
| A(3) | July 2006 | 44,000,000 Depositary Shares, each representing a 1/1,000th of a share of Floating Rate Non-Cumulative Preferred Stock, $0.01 par value | $ | 25,000 | July 15, 2011 | $ | 255.56 | |||||||
| C(3)(4) | October�13,�2008 | 10% Perpetual Non-Cumulative Non-Voting Preferred Stock | 1,100 | October�15,�2011 | 25.00 | |||||||||
| E(5) | September�30,�2013 | 34,500,000 Depositary Shares, each representing a�1/1,000th interest in a share of perpetual Fixed-to-Floating Rate Non-Cumulative Preferred Stock, $0.01 par value | 25,000 | October 15, 2023 | 445.31 | |||||||||
| F(5) | December 10, 2013 | 34,000,000 Depositary Shares, each representing a 1/1,000th interest in a share of perpetual Fixed-to-Floating Rate Non-Cumulative Preferred Stock, $0.01 par value | 25,000 | January 15, 2024 | 429.69 | |||||||||
| G(5) | April 29, 2014 | 20,000,000 Depositary Shares, each representing a 1/1,000th interest in a share of perpetual 6.625% Non-Cumulative Preferred Stock, $0.01 par value | 25,000 | July 15, 2019 | 414.06 | |||||||||
| H(5)(6) | April 29, 2014 | 1,300,000 Depositary Shares, each representing a 1/25th interest in a share of perpetual Fixed-to-Floating Rate Non-Cumulative Preferred Stock, $0.01 par value | 25,000 | July 15, 2019 | 681.25 | |||||||||
| I(5) | September 18, 2014 | 40,000,000 Depositary Shares, each representing a 1/1,000th interest in a share of perpetual Fixed-to-Floating Rate Non-Cumulative Preferred Stock, $0.01 par value | 25,000 | October 15, 2024 | 398.44 | |||||||||
| J(5)(7) | March 19, 2015 | 1,500,000 Depositary Shares, each representing a 1/25th interest in a share of perpetual Fixed-to-Floating Rate Non-Cumulative Preferred Stock, $0.01 par value | 25,000 | July 15, 2020 | 693.75 | |||||||||
| (1) | The redemption price per share for Series A, E, F, G and I is equivalent to $25.00 per Depositary Share. The redemption price per share for Series H and J is equivalent to $1,000 per Depositary Share. |
| (2) | Quarterly (unless noted otherwise) dividend declared in December 2015 that was paid on January�15, 2016 to preferred shareholders of record on December�31, 2015. |
| (3) | The preferred stock is redeemable at the Company�s option, in whole or in part, on or after the redemption date. |
| (4) | Dividends on the Series C preferred stock are payable, on a non-cumulative basis, as and if declared by the Company�s Board of Directors, in cash, at the rate of 10%�per annum of the liquidation preference of $1,000 per share. |
| 219 | |
| (5) | The preferred stock is redeemable at the Company�s option (i)�in whole or in part, from time to time, on any dividend payment date on or after the redemption date or (ii)�in whole but not in part at any time within 90 days following a regulatory capital treatment event (as described in the terms of that series). |
| (6) | Dividend on Series H preferred stock is payable semiannually until July�15, 2019 and quarterly thereafter. |
| (7) | Dividend on Series J preferred stock is payable semiannually until July�15, 2020 and quarterly thereafter. In addition to the redemption price per share, the redemption price includes any declared and unpaid dividends up to, but excluding, the date fixed for redemption, without accumulation of any undeclared dividends. |
| Foreign Currency Translation Adjustments | Change in Net�Unrealized Gains�(Losses)�on AFS Securities | Pensions, Postretirement and Other | Total | |||||||||||||
| (dollars in millions) | ||||||||||||||||
| Balance at December�31, 2014 | $ | (663 | ) | $ | (73 | ) | $ | (512 | ) | $ | (1,248 | ) | ||||
| Other comprehensive income (loss) before reclassifications | (300 | ) | (193 | ) | 132 | (361 | ) | |||||||||
| Amounts reclassified from AOCI | � | (53 | ) | 6 | (47 | ) | ||||||||||
| Net other comprehensive income (loss) during the period | (300 | ) | (246 | ) | 138 | (408 | ) | |||||||||
| Balance at December�31, 2015 | $ | (963 | ) | $ | (319 | ) | $ | (374 | ) | $ | (1,656 | ) | ||||
| Foreign Currency Translation Adjustments | Change in Net�Unrealized Gains�(Losses)�on AFS Securities | Pensions, Postretirement and Other | Total | |||||||||||||
| (dollars in millions) | ||||||||||||||||
| Balance at December�31, 2013 | $ | (266 | ) | $ | (282 | ) | $ | (545 | ) | $ | (1,093 | ) | ||||
| Other comprehensive income (loss) before reclassifications | (397 | ) | 233 | 24 | (140 | ) | ||||||||||
| Amounts reclassified from AOCI | � | (24 | ) | 9 | (15 | ) | ||||||||||
| Net other comprehensive income (loss) during the period | (397 | ) | 209 | 33 | (155 | ) | ||||||||||
| Balance at December�31, 2014 | $ | (663 | ) | $ | (73 | ) | $ | (512 | ) | $ | (1,248 | ) | ||||
| Foreign Currency Translation Adjustments | Change in Net�Unrealized Gains�(Losses)�on AFS Securities | Pensions, Postretirement and Other | Total | |||||||||||||
| (dollars in millions) | ||||||||||||||||
| Balance at December�31, 2012 | $ | (123 | ) | $ | 151 | $ | (544 | ) | $ | (516 | ) | |||||
| Other comprehensive income (loss) before reclassifications | (143 | ) | (406 | ) | (16 | ) | (565 | ) | ||||||||
| Amounts reclassified from AOCI | � | (27 | ) | 15 | (12 | ) | ||||||||||
| Net other comprehensive income (loss) during the period | (143 | ) | (433 | ) | (1 | ) | (577 | ) | ||||||||
| Balance at December�31, 2013 | $ | (266 | ) | $ | (282 | ) | $ | (545 | ) | $ | (1,093 | ) | ||||
| | 220 |
| At December�31, 2015 | At December�31, 2014 | |||||||
| (dollars in millions) | ||||||||
| Net investments in non-U.S. dollar functional currency subsidiaries subject to hedges | $ | 8,170 | $ | 9,110 | ||||
| Cumulative foreign currency translation adjustments resulting from net investments in subsidiaries with a non-U.S. dollar functional currency | $ | (1,996 | ) | $ | (1,262 | ) | ||
| Cumulative foreign currency translation adjustments resulting from realized or unrealized losses on hedges, net of tax | 1,033 | 599 | ||||||
| Total cumulative foreign currency translation adjustments, net of tax | $ | (963 | ) | $ | (663 | ) | ||
| 221 | |
| 16.����Earnings | per Common Share. |
| 2015 | 2014 | 2013 | ||||||||||
| (in�millions,�except�for�per�share�data) | ||||||||||||
| Basic EPS: | ||||||||||||
| Income from continuing operations | $ | 6,295 | $ | 3,681 | $ | 3,656 | ||||||
| Income (loss) from discontinued operations | (16 | ) | (14 | ) | (43 | ) | ||||||
| Net income | 6,279 | 3,667 | 3,613 | |||||||||
| Net income applicable to redeemable noncontrolling interests | � | � | 222 | |||||||||
| Net income applicable to nonredeemable noncontrolling interests | 152 | 200 | 459 | |||||||||
| Net income applicable to Morgan Stanley | 6,127 | 3,467 | 2,932 | |||||||||
| Less: Preferred dividends | (452 | ) | (311 | ) | (120 | ) | ||||||
| Less: Wealth Management JV redemption value adjustment | � | � | (151 | ) | ||||||||
| Less: Allocation of (earnings) loss to participating RSUs(1) | (4 | ) | (4 | ) | (6 | ) | ||||||
| Earnings applicable to Morgan Stanley common shareholders | $ | 5,671 | $ | 3,152 | $ | 2,655 | ||||||
| Weighted average common shares outstanding | 1,909 | 1,924 | 1,906 | |||||||||
| Earnings per basic common share: | ||||||||||||
| Income from continuing operations | $ | 2.98 | $ | 1.65 | $ | 1.42 | ||||||
| Income (loss) from discontinued operations | (0.01 | ) | (0.01 | ) | (0.03 | ) | ||||||
| Earnings per basic common share | $ | 2.97 | $ | 1.64 | $ | 1.39 | ||||||
| Diluted EPS: | ||||||||||||
| Earnings applicable to Morgan Stanley common shareholders | $ | 5,671 | $ | 3,152 | $ | 2,655 | ||||||
| Weighted average common shares outstanding | 1,909 | 1,924 | 1,906 | |||||||||
| Effect of dilutive securities: | ||||||||||||
| Stock options and RSUs(1) | 44 | 47 | 51 | |||||||||
| Weighted average common shares outstanding and common stock equivalents | 1,953 | 1,971 | 1,957 | |||||||||
| Earnings per diluted common share: | ||||||||||||
| Income from continuing operations | $ | 2.91 | $ | 1.61 | $ | 1.38 | ||||||
| Income (loss) from discontinued operations | (0.01 | ) | (0.01 | ) | (0.02 | ) | ||||||
| Earnings per diluted common share | $ | 2.90 | $ | 1.60 | $ | 1.36 | ||||||
| (1) | RSUs that are considered participating securities participate in all of the earnings of the Company in the computation of basic EPS, and, therefore, such RSUs are not included as incremental shares in the diluted calculation. |
| 2015 | 2014 | 2013 | ||||||||||
| (shares in millions) | ||||||||||||
| Stock options | 11 | 13 | 33 | |||||||||
| RSUs and performance-based stock units | 1 | 2 | 3 | |||||||||
| Total | 12 | 15 | 36 | |||||||||
| | 222 |
| 2015 | 2014 | 2013 | ||||||||||
| (dollars in millions) | ||||||||||||
| Interest income(1): | ||||||||||||
| Trading assets(2) | $ | 2,262 | $ | 2,109 | $ | 2,292 | ||||||
| Investment securities | 876 | 613 | 447 | |||||||||
| Loans | 2,163 | 1,690 | 1,121 | |||||||||
| Interest bearing deposits with banks | 108 | 109 | 129 | |||||||||
| Securities purchased under agreements to resell and Securities borrowed(3) | (560 | ) | (298 | ) | (20 | ) | ||||||
| Customer receivables and Other(4) | 986 | 1,190 | 1,240 | |||||||||
| Total interest income | $ | 5,835 | $ | 5,413 | $ | 5,209 | ||||||
| Interest expense(1): | ||||||||||||
| Deposits | $ | 78 | $ | 106 | $ | 159 | ||||||
| Short-term borrowings | 16 | 4 | 20 | |||||||||
| Long-term borrowings | 3,481 | 3,609 | 3,758 | |||||||||
| Securities sold under agreements to repurchase and Securities loaned(5) | 1,024 | 1,216 | 1,469 | |||||||||
| Customer payables and Other(6) | (1,857 | ) | (1,257 | ) | (975 | ) | ||||||
| Total interest expense | $ | 2,742 | $ | 3,678 | $ | 4,431 | ||||||
| Net interest | $ | 3,093 | $ | 1,735 | $ | 778 | ||||||
| (1) | Interest income and expense are recorded within the consolidated statements of income depending on the nature of the instrument and related market conventions. When interest is included as a component of the instrument�s fair value, interest is included within Trading revenues or Investments revenues. Otherwise, it is included within Interest income or Interest expense. |
| (2) | Interest expense on Trading liabilities is reported as a reduction to Interest income on Trading assets. |
| (3) | Includes fees paid on Securities borrowed. |
| (4) | Includes interest from customer receivables and other interest earning assets. |
| (5) | Includes fees received on Securities loaned. |
| (6) | Includes fees received from prime brokerage customers for stock loan transactions incurred to cover customers� short positions. |
| 18.����Deferred | Compensation Plans. |
| 2015 | 2014 | 2013 | ||||||||||
| (dollars in millions) | ||||||||||||
| Restricted stock units(1) | $ | 1,080 | $ | 1,212 | $ | 1,140 | ||||||
| Stock options | (3 | ) | 5 | 15 | ||||||||
| Performance-based stock units | 26 | 45 | 29 | |||||||||
| Total | $ | 1,103 | $ | 1,262 | $ | 1,184 | ||||||
| (1) | Amounts for 2015, 2014 and 2013 include $68 million, $31 million and $25 million, respectively, related to stock-based awards that were granted in 2016, 2015 and 2014, respectively, to employees who satisfied retirement-eligible requirements under award terms that do not contain a service period. |
| 223 | |
| 2015 | ||||||||
| Number�of Shares | Weighted�Average Grant Date�Fair Value | |||||||
| (shares�in�millions) | ||||||||
| RSUs at beginning of period | 121 | $ | 25.52 | |||||
| Granted | 34 | 34.76 | ||||||
| Conversions to common stock | (47 | ) | 23.57 | |||||
| Canceled | (3 | ) | 28.72 | |||||
| RSUs at end of period(1) | 105 | 29.26 | ||||||
| (1) | At December�31, 2015, approximately 98�million RSUs with a weighted average grant date fair value of $29.17 were vested or expected to vest. |
| | 224 |
| 2015 | ||||||||
| Number�of Shares | Weighted�Average Grant Date Fair Value | |||||||
| (shares�in�millions) | ||||||||
| Unvested RSUs at beginning of period | 87 | $ | 26.44 | |||||
| Granted | 34 | 34.76 | ||||||
| Vested | (48 | ) | 27.06 | |||||
| Canceled | (3 | ) | 28.72 | |||||
| Unvested RSUs at end of period(1) | 70 | 29.91 | ||||||
| (1) | Unvested RSUs represent awards where recipients have yet to satisfy either the explicit vesting terms or retirement-eligible requirements. At December�31, 2015, approximately 63�million unvested RSUs with a weighted average grant date fair value of $29.84 were expected to vest. |
| Grant Year | Risk-Free�Interest Rate | Expected Life | Expected�Stock Price Volatility | Expected�Dividend Yield | ||||||||||||
| 2013 | 0.6 | % | 3.9�years | 32.0 | % | 0.9 | % | |||||||||
| 2015 | ||||||||
| Number�of Options | Weighted�Average Exercise� Price | |||||||
| (options�in�millions) | ||||||||
| Options outstanding at beginning of period | 19 | $ | 51.30 | |||||
| Expired | (2 | ) | 45.32 | |||||
| Options outstanding at end of period(1) | 17 | 52.26 | ||||||
| Options exercisable at end of period | 15 | 55.02 | ||||||
| (1) | At December�31, 2015, approximately 16�million options with a weighted average exercise price of $52.43 were vested. |
| 225 | |
| At December�31, 2015 | ||||||||||||||||||||||||
| Options Outstanding | Options Exercisable | |||||||||||||||||||||||
| Range of Exercise Prices | Number Outstanding | Weighted�Average Exercise Price | Average Remaining�Life (Years) | Number Exercisable | Weighted�Average Exercise Price | Average Remaining�Life (Years) | ||||||||||||||||||
| (options in millions) | ||||||||||||||||||||||||
| $22.00 � $39.99 | 6 | $ | 26.85 | 2.0 | 4 | $ | 28.13 | 2.0 | ||||||||||||||||
| $50.00 � $59.99 | 1 | 52.43 | 0.3 | 1 | 52.43 | 0.3 | ||||||||||||||||||
| $60.00 � $76.99 | 10 | 66.75 | 0.9 | 10 | 66.75 | 0.9 | ||||||||||||||||||
| Total | 17 | 15 | ||||||||||||||||||||||
| Minimum | Maximum | |||||||||||
| Grant Year | MS�Average�ROE | Multiplier | MS�Average�ROE | Multiplier | ||||||||
| 2015 | Less than 5% | 0.0 | 11.5% or more | 1.5 | ||||||||
| 2014 | Less than 5% | 0.0 | 11.5% or more | 1.5 | ||||||||
| 2013 | Less than 5% | 0.0 | 13% or more | 2.0 | ||||||||
| Minimum | Maximum | |||||||||||
| Grant Year | Relative�TSR | Multiplier | Relative�TSR | Multiplier | ||||||||
| 2015 | Less�than�-50% | 0.0 | 25%�or�more | 1.5 | ||||||||
| 2014 | Less than -50% | 0.0 | 25%�or�more | 1.5 | ||||||||
| 2013 | Less than -50% | 0.0 | 50%�or�more | 2.0 | ||||||||
| | 226 |
| Grant Year | Risk-Free�Interest Rate | Expected�Stock Price Volatility | Expected�Dividend Yield | |||||||||
| 2015 | 0.9 | % | 29.6 | % | 0.0 | % | ||||||
| 2014 | 0.8 | % | 44.2 | % | 0.0 | % | ||||||
| 2013 | 0.4 | % | 45.4 | % | 0.0 | % | ||||||
| 2015 | ||||
| Number�of�Shares | ||||
| (in millions) | ||||
| PSUs at beginning of period | 4 | |||
| Awarded | 2 | |||
| Conversions to common stock | (2 | ) | ||
| PSUs at end of period | 4 | |||
| 2015 | 2014 | 2013 | ||||||||||
| (dollars in millions) | ||||||||||||
| Deferred cash-based awards(1) | $ | 660 | $ | 1,757 | $ | 1,490 | ||||||
| Return on referenced investments | 112 | 408 | 772 | |||||||||
| Total | $ | 772 | $ | 2,165 | $ | 2,262 | ||||||
| (1) | Amounts for 2015, 2014 and 2013 include $144 million, $92 million and $78 million, respectively, related to deferred cash-based awards that were granted in 2016, 2015 and 2014, respectively, to employees who satisfied retirement-eligible requirements under award terms that do not contain a service period. |
| 227 | |
| 2016 | 2017 | Thereafter | Total | |||||||||||||
| (dollars in millions) | ||||||||||||||||
| Stock-based awards | $ | 453 | $ | 198 | $ | 162 | $ | 813 | ||||||||
| Deferred cash-based awards | 545 | 298 | 128 | 971 | ||||||||||||
| Total | $ | 998 | $ | 496 | $ | 290 | $ | 1,784 | ||||||||
| 19. | Employee Benefit Plans. |
| | 228 |
| Pension Plans | Other Postretirement Plans | |||||||||||||||||||||||
| 2015 | 2014 | 2013 | 2015 | 2014 | 2013 | |||||||||||||||||||
| (dollars in millions) | ||||||||||||||||||||||||
| Service cost, benefits earned during the period | $ | 19 | $ | 20 | $ | 23 | $ | 1 | $ | 2 | $ | 4 | ||||||||||||
| Interest cost on projected benefit obligation | 152 | 154 | 151 | 3 | 5 | 7 | ||||||||||||||||||
| Expected return on plan assets | (120 | ) | (110 | ) | (114 | ) | � | � | � | |||||||||||||||
| Net amortization of prior service credit | (1 | ) | � | � | (18 | ) | (14 | ) | (13 | ) | ||||||||||||||
| Net amortization of actuarial loss | 26 | 22 | 36 | � | � | 3 | ||||||||||||||||||
| Curtailment loss | � | 3 | � | � | � | � | ||||||||||||||||||
| Settlement loss | 2 | 2 | 1 | � | � | � | ||||||||||||||||||
| Net periodic benefit expense (income) | $ | 78 | $ | 91 | $ | 97 | $ | (14 | ) | $ | (7 | ) | $ | 1 | ||||||||||
| Pension Plans | Other Postretirement Plans | |||||||||||||||||||||||
| 2015 | 2014 | 2013 | 2015 | 2014 | 2013 | |||||||||||||||||||
| (dollars in millions) | ||||||||||||||||||||||||
| Net loss (gain) | $ | (212 | ) | $ | 18 | $ | 87 | $ | 3 | $ | 9 | $ | (52 | ) | ||||||||||
| Prior service cost (credit) | (1 | ) | 2 | 3 | 9 | (64 | ) | � | ||||||||||||||||
| Amortization of prior service credit | 1 | � | � | 18 | 14 | 13 | ||||||||||||||||||
| Amortization of net loss | (28 | ) | (27 | ) | (37 | ) | � | � | (3 | ) | ||||||||||||||
| Total recognized in other comprehensive loss (income) | $ | (240 | ) | $ | (7 | ) | $ | 53 | $ | 30 | $ | (41 | ) | $ | (42 | ) | ||||||||
| Pension Plans | Other Postretirement Plans | |||||||||||||||||||||||
| 2015 | 2014 | 2013 | 2015 | 2014 | 2013 | |||||||||||||||||||
| Discount rate(1) | 3.86 | % | 4.74 | % | 3.95 | % | 3.77 | % | 3.77 | % | 3.88 | % | ||||||||||||
| Expected long-term rate of return on plan assets | 3.59 | % | 3.75 | % | 3.73 | % | N/A | N/A | N/A | |||||||||||||||
| Rate of future compensation increases | 2.85 | % | 1.06 | % | 0.98 | % | N/A | N/A | N/A | |||||||||||||||
| (1) | The Other postretirement plans� discount rate for 2015 changed to 3.77% from 3.69% effective April�30, 2015 with the amendment and remeasurement of the Morgan Stanley Medical Plan. |
| 229 | |
| Pension Plans | Other Postretirement Plans | |||||||||||||||
| 2015 | 2014 | 2015 | 2014 | |||||||||||||
| (dollars in millions) | ||||||||||||||||
| Reconciliation of benefit obligation: | ||||||||||||||||
| Benefit obligation at beginning of year | $ | 4,007 | $ | 3,330 | $ | 75 | $ | 128 | ||||||||
| Service cost | 19 | 20 | 1 | 2 | ||||||||||||
| Interest cost | 152 | 154 | 3 | 5 | ||||||||||||
| Actuarial loss (gain)(1) | (267 | ) | 555 | 4 | 5 | |||||||||||
| Plan amendments | (1 | ) | 2 | 9 | (64 | ) | ||||||||||
| Plan curtailments | (9 | ) | (1 | ) | � | � | ||||||||||
| Plan settlements | (29 | ) | (8 | ) | � | � | ||||||||||
| Change in mortality assumptions(2) | (46 | ) | 203 | (1 | ) | 4 | ||||||||||
| Benefits paid | (194 | ) | (213 | ) | (4 | ) | (5 | ) | ||||||||
| Other, including foreign currency exchange rate changes | (28 | ) | (35 | ) | � | � | ||||||||||
| Benefit obligation at end of year | $ | 3,604 | $ | 4,007 | $ | 87 | $ | 75 | ||||||||
| Reconciliation of fair value of plan assets: | ||||||||||||||||
| Fair value of plan assets at beginning of year | $ | 3,705 | $ | 2,867 | $ | � | $ | � | ||||||||
| Actual return on plan assets | 9 | 850 | � | � | ||||||||||||
| Employer contributions(3) | 31 | 244 | 4 | 5 | ||||||||||||
| Benefits paid | (194 | ) | (213 | ) | (4 | ) | (5 | ) | ||||||||
| Plan settlements | (29 | ) | (8 | ) | � | � | ||||||||||
| Other, including foreign currency exchange rate changes | (25 | ) | (35 | ) | � | � | ||||||||||
| Fair value of plan assets at end of year | $ | 3,497 | $ | 3,705 | $ | � | $ | � | ||||||||
| Funded (unfunded) status | $ | (107 | ) | $ | (302 | ) | $ | (87 | ) | $ | (75 | ) | ||||
| (1) | Amounts primarily reflect impact of year-over-year discount rate fluctuations. |
| (2) | Amounts represent adoption of new mortality tables published by the Society of Actuaries. |
| (3) | In December 2014, an elective $200 million contribution was made to the U.S. Qualified Plan primarily to offset the increase in liability due to the plan�s adoption of new mortality tables. |
| | 230 |
| Pension Plans | Other Postretirement Plans | |||||||||||||||
| At December�31, 2015 | At December�31, 2014 | At December�31, 2015 | At December�31, 2014 | |||||||||||||
| (dollars in millions) | ||||||||||||||||
| Amounts recognized in the consolidated statements of financial condition consist of: | ||||||||||||||||
| Assets | $ | 382 | $ | 224 | $ | � | $ | � | ||||||||
| Liabilities | (489 | ) | (526 | ) | (87 | ) | (75 | ) | ||||||||
| Net amount recognized | $ | (107 | ) | $ | (302 | ) | $ | (87 | ) | $ | (75 | ) | ||||
| Amounts recognized in accumulated other comprehensive loss consist of: | ||||||||||||||||
| Prior service cost (credit) | $ | (1 | ) | $ | (1 | ) | $ | (34 | ) | $ | (61 | ) | ||||
| Net loss (gain) | 626 | 866 | (2 | ) | (5 | ) | ||||||||||
| Net loss (gain) recognized | $ | 625 | $ | 865 | $ | (36 | ) | $ | (66 | ) | ||||||
| At December�31, 2015 | At December�31, 2014 | |||||||
| (dollars in millions) | ||||||||
| Projected benefit obligation | $ | 543 | $ | 626 | ||||
| Fair value of plan assets | 54 | 100 | ||||||
| At December�31, 2015 | At December�31, 2014 | |||||||
| (dollars in millions) | ||||||||
| Accumulated benefit obligation | $ | 531 | $ | 588 | ||||
| Fair value of plan assets | 54 | 82 | ||||||
| Pension Plans | Other Postretirement Plans | |||||||||||||||
| At December�31, 2015 | At December�31, 2014 | At December�31, 2015 | At December�31, 2014 | |||||||||||||
| Discount rate | 4.27 | % | 3.86 | % | 4.13 | % | 3.69 | % | ||||||||
| Rate of future compensation increase | 3.19 | % | 2.85 | % | N/A | N/A | ||||||||||
| 231 | |
| At December�31, 2015 | At December�31, 2014 | |||||||
| Health care cost trend rate assumed for next year: | ||||||||
| Medical | 6.25% | 6.88-7.23% | ||||||
| Prescription | 11.00% | 7.87% | ||||||
| Rate to which the cost trend rate is assumed to decline (ultimate trend rate) | 4.50% | 4.50% | ||||||
| Year that the rate reaches the ultimate trend rate | 2038 | 2029 | ||||||
| One-Percentage Point�Increase | One-Percentage Point�(Decrease) | |||||||
| (dollars in millions) | ||||||||
| Total 2015 postretirement service and interest cost | N/M | N/M | ||||||
| December�31, 2015 postretirement benefit obligation | $ | 3 | $ | (3 | ) | |||
| � | Derivatives may be used only if they are deemed by the investment manager to be more attractive than a similar direct investment in the underlying cash market or if the vehicle is being used to manage risk of the portfolio. |
| � | Derivatives may not be used in a speculative manner or to leverage the portfolio under any circumstances. |
| � | Derivatives may not be used as short-term trading vehicles. The investment philosophy of the U.S. Qualified Plan is that investment activity is undertaken for long-term investment rather than short-term trading. |
| | 232 |
| � | Derivatives may be used in the management of the U.S. Qualified Plan�s portfolio only when their possible effects can be quantified, shown to enhance the risk-return profile of the portfolio, and reported in a meaningful and understandable manner. |
| 233 | |
| At December�31, 2015 | ||||||||||||||||
| Level�1 | Level�2 | Level�3 | Total | |||||||||||||
| (dollars in millions) | ||||||||||||||||
| Assets: | ||||||||||||||||
| Investments: | ||||||||||||||||
| Cash and cash equivalents(1) | $ | 28 | $ | � | $ | � | $ | 28 | ||||||||
| U.S. government and agency securities: | ||||||||||||||||
| U.S. Treasury securities | 1,398 | � | � | 1,398 | ||||||||||||
| U.S. agency securities | � | 263 | � | 263 | ||||||||||||
| Total U.S. government and agency securities | 1,398 | 263 | � | 1,661 | ||||||||||||
| Corporate and other debt: | ||||||||||||||||
| State and municipal securities | � | 2 | � | 2 | ||||||||||||
| Collateralized debt obligations | � | 22 | � | 22 | ||||||||||||
| Total corporate and other debt | � | 24 | � | 24 | ||||||||||||
| Derivative contracts | � | 224 | � | 224 | ||||||||||||
| Commingled trust funds(2) | � | 1,298 | � | 1,298 | ||||||||||||
| Foreign funds(3) | � | 338 | � | 338 | ||||||||||||
| Other investments | � | � | 35 | 35 | ||||||||||||
| Total investments | 1,426 | 2,147 | 35 | 3,608 | ||||||||||||
| Receivables: | ||||||||||||||||
| Other receivables(1) | � | 54 | � | 54 | ||||||||||||
| Total receivables | � | 54 | � | 54 | ||||||||||||
| Total assets | $ | 1,426 | $ | 2,201 | $ | 35 | $ | 3,662 | ||||||||
| Liabilities: | ||||||||||||||||
| Derivative contracts | $ | � | $ | 65 | $ | � | $ | 65 | ||||||||
| Other liabilities(1) | � | 100 | � | 100 | ||||||||||||
| Total liabilities | $ | � | $ | 165 | $ | � | $ | 165 | ||||||||
| Net pension assets | $ | 1,426 | $ | 2,036 | $ | 35 | $ | 3,497 | ||||||||
| | 234 |
| At December�31, 2014 | ||||||||||||||||
| Level 1 | Level 2 | Level�3 | Total | |||||||||||||
| (dollars in millions) | ||||||||||||||||
| Assets: | ||||||||||||||||
| Investments: | ||||||||||||||||
| Cash and cash equivalents(1) | $ | 63 | $ | � | $ | � | $ | 63 | ||||||||
| U.S. government and agency securities: | ||||||||||||||||
| U.S. Treasury securities | 1,332 | � | � | 1,332 | ||||||||||||
| U.S. agency securities | � | 265 | � | 265 | ||||||||||||
| Total U.S. government and agency securities | 1,332 | 265 | � | 1,597 | ||||||||||||
| Corporate and other debt: | ||||||||||||||||
| State and municipal securities | � | 2 | � | 2 | ||||||||||||
| Collateralized debt obligations | � | 62 | � | 62 | ||||||||||||
| Total corporate and other debt | � | 64 | � | 64 | ||||||||||||
| Derivative contracts | � | 292 | � | 292 | ||||||||||||
| Derivative-related cash collateral receivable | � | 2 | � | 2 | ||||||||||||
| Commingled trust funds(2) | � | 1,432 | � | 1,432 | ||||||||||||
| Foreign funds(3) | � | 347 | � | 347 | ||||||||||||
| Other investments | � | � | 36 | 36 | ||||||||||||
| Total investments | 1,395 | 2,402 | 36 | 3,833 | ||||||||||||
| Receivables: | ||||||||||||||||
| Other receivables(1) | � | 27 | � | 27 | ||||||||||||
| Total receivables | � | 27 | � | 27 | ||||||||||||
| Total assets | $ | 1,395 | $ | 2,429 | $ | 36 | $ | 3,860 | ||||||||
| Liabilities: | ||||||||||||||||
| Derivative contracts | $ | � | $ | 33 | $ | � | $ | 33 | ||||||||
| Derivative-related cash collateral payable | � | 2 | � | 2 | ||||||||||||
| Other liabilities(1) | � | 120 | � | 120 | ||||||||||||
| Total liabilities | $ | � | $ | 155 | $ | � | $ | 155 | ||||||||
| Net pension assets | $ | 1,395 | $ | 2,274 | $ | 36 | $ | 3,705 | ||||||||
| (1) | Cash and cash equivalents, other receivables and other liabilities are valued at their carrying value, which approximates fair value. |
| (2) | Commingled trust funds consist of investments in fixed income funds and money market funds of $1,239 million and $59 million, respectively, at December�31, 2015 and $1,280 million and $152 million, respectively, at December�31, 2014. |
| (3) | Foreign funds include investments in fixed income funds, liquidity funds and targeted cash flow funds of $149 million, $98 million and $91 million, respectively, at December�31, 2015 and $158 million, $53 million and $136 million, respectively, at December�31, 2014. |
| 235 | |
| 2015 | 2014 | |||||||
| (dollars�in�millions) | ||||||||
| Balance at beginning of period | $ | 36 | $ | 38 | ||||
| Actual return on plan assets related to assets held at end of period | (4 | ) | (5 | ) | ||||
| Actual return on plan assets related to assets sold during the year | � | � | ||||||
| Purchases, sales, other settlements and issuances, net | 3 | 3 | ||||||
| Net transfer in and/or (out) of Level 3 | � | � | ||||||
| Balance at end of period | $ | 35 | $ | 36 | ||||
| At December�31, 2015 | ||||||||
| Pension�Plans | Other�Postretirement Plans | |||||||
| (dollars in millions) | ||||||||
| 2016 | $ | 153 | $ | 5 | ||||
| 2017 | 139 | 6 | ||||||
| 2018 | 136 | 6 | ||||||
| 2019 | 141 | 6 | ||||||
| 2020 | 150 | 7 | ||||||
| 2021-2025 | 858 | 32 | ||||||
| | 236 |
| 2015 | 2014 | 2013 | ||||||||||
| (dollars in millions) | ||||||||||||
| Current: | ||||||||||||
| U.S. federal | $ | 239 | $ | (604 | ) | $ | 229 | |||||
| U.S. state and local | 144 | 260 | 164 | |||||||||
| Non-U.S.: | ||||||||||||
| U.K. | 247 | 88 | 178 | |||||||||
| Japan | 19 | 114 | 88 | |||||||||
| Hong Kong | 24 | 34 | 36 | |||||||||
| Other(1) | 333 | 258 | 301 | |||||||||
| Total | $ | 1,006 | $ | 150 | $ | 996 | ||||||
| Deferred: | ||||||||||||
| U.S. federal | $ | 1,031 | $ | (207 | ) | $ | (3 | ) | ||||
| U.S. state and local | 43 | (56 | ) | 1 | ||||||||
| Non-U.S.: | ||||||||||||
| U.K. | (56 | ) | (31 | ) | (75 | ) | ||||||
| Japan | 58 | 56 | 262 | |||||||||
| Hong Kong | 50 | 9 | (14 | ) | ||||||||
| Other(1) | 68 | (11 | ) | (265 | ) | |||||||
| Total | $ | 1,194 | $ | (240 | ) | $ | (94 | ) | ||||
| Provision for (benefit from) income taxes from continuing operations | $ | 2,200 | $ | (90 | ) | $ | 902 | |||||
| Provision for (benefit from) income taxes from discontinued operations | $ | (7 | ) | $ | (5 | ) | $ | (29 | ) | |||
| (1) | For 2015, Non-U.S. other jurisdictions included significant total tax provisions of $68 million, $62 million, $58 million, $45 million and $42 million from Mexico, Brazil, Netherlands, India and France, respectively. For 2014, Non-U.S. other jurisdictions included significant total tax provisions of $44 million, $38 million and $38 million from Brazil, India and Mexico, respectively. For 2013, Non-U.S. other jurisdictions included significant total tax provisions (benefits) of $59 million, $54 million and $(156) million from Brazil, India and Luxembourg, respectively. |
| 237 | |
| 2015 | 2014 | 2013 | ||||||||||
| U.S. federal statutory income tax rate | 35.0 | % | 35.0 | % | 35.0 | % | ||||||
| U.S. state and local income taxes, net of U.S. federal income tax benefits | 1.4 | 6.5 | 2.3 | |||||||||
| Domestic tax credits | (1.5 | ) | (5.0 | ) | (3.2 | ) | ||||||
| Tax exempt income | (0.2 | ) | (3.5 | ) | (2.5 | ) | ||||||
| Non-U.S. earnings: | ||||||||||||
| Foreign tax rate differential | (8.7 | ) | (22.5 | ) | (6.0 | ) | ||||||
| Change in reinvestment assertion | 0.2 | 1.4 | (1.4 | ) | ||||||||
| Change in foreign tax rates | � | � | 0.1 | |||||||||
| Wealth Management legal entity restructuring | � | (38.7 | ) | � | ||||||||
| Non-deductible legal expenses | � | 25.5 | 0.9 | |||||||||
| Other | (0.3 | ) | (1.2 | ) | (5.4 | ) | ||||||
| Effective income tax rate | 25.9 | % | (2.5 | )% | 19.8 | % | ||||||
| | 238 |
| At�December�31, 2015 | At�December�31, 2014 | |||||||
| (dollars in millions) | ||||||||
| Gross deferred tax assets: | ||||||||
| Tax credits and loss carryforwards | $ | 1,987 | $ | 3,833 | ||||
| Employee compensation and benefit plans | 3,514 | 3,715 | ||||||
| Valuation and liability allowances | 846 | 661 | ||||||
| Valuation of inventory, investments and receivables | 738 | 586 | ||||||
| Other | 35 | � | ||||||
| Total deferred tax assets | 7,120 | 8,795 | ||||||
| Deferred tax assets valuation allowance | 139 | 34 | ||||||
| Deferred tax assets after valuation allowance | $ | 6,981 | $ | 8,761 | ||||
| Gross deferred tax liabilities: | ||||||||
| Non-U.S. operations | $ | 269 | $ | 925 | ||||
| Fixed assets | 716 | 565 | ||||||
| Other | � | 65 | ||||||
| Total deferred tax liabilities | $ | 985 | $ | 1,555 | ||||
| Net deferred tax assets | $ | 5,996 | $ | 7,206 | ||||
| 239 | |
| Unrecognized�Tax�Benefits | ||||
| (dollars in millions) | ||||
| Balance at December�31, 2012 | $ | 4,065 | ||
| Increase based on tax positions related to the current period | 51 | |||
| Increase based on tax positions related to prior periods | 267 | |||
| Decrease based on tax positions related to prior periods | (141) | |||
| Decrease related to settlements with taxing authorities | (146) | |||
| Balance at December�31, 2013 | $ | 4,096 | ||
| Increase based on tax positions related to the current period | $ | 135 | ||
| Increase based on tax positions related to prior periods | 100 | |||
| Decrease based on tax positions related to prior periods | (2,080) | |||
| Decrease related to settlements with taxing authorities | (19) | |||
| Decrease related to a lapse of applicable statute of limitations | (4) | |||
| Balance at December�31, 2014 | $ | 2,228 | ||
| Increase based on tax positions related to the current period | $ | 230 | ||
| Increase based on tax positions related to prior periods | 114 | |||
| Decrease based on tax positions related to prior periods | (753) | |||
| Decrease related to settlements with taxing authorities | (7) | |||
| Decrease related to a lapse of applicable statute of limitations | (8) | |||
| Balance at December�31, 2015 | $ | 1,804 | ||
| | 240 |
| Jurisdiction | Tax�Year | |||
| U.S. | 1999 | |||
| New York State and New York City | 2007 | |||
| Hong Kong | 2009 | |||
| U.K. | 2010 | |||
| Japan | 2013 | |||
| 2015 | 2014 | 2013 | ||||||||||
| (dollars in millions) | ||||||||||||
| U.S. | $ | 5,360 | $ | 1,805 | $ | 1,738 | ||||||
| Non-U.S.(1) | 3,135 | 1,786 | 2,820 | |||||||||
| $ | 8,495 | $ | 3,591 | $ | 4,558 | |||||||
| (1) | Non-U.S. income is defined as income generated from operations located outside the U.S. |
| 241 | |
| 2015 | ||||||||||||||||||||
| Institutional Securities | Wealth Management | Investment Management | Intersegment Eliminations | Total | ||||||||||||||||
| (dollars in millions) | ||||||||||||||||||||
| Total non-interest revenues | $ | 17,800 | $ | 12,144 | $ | 2,331 | $ | (213 | ) | $ | 32,062 | |||||||||
| Interest income | 3,190 | 3,105 | 2 | (462 | ) | 5,835 | ||||||||||||||
| Interest expense | 3,037 | 149 | 18 | (462 | ) | 2,742 | ||||||||||||||
| Net interest | 153 | 2,956 | (16 | ) | � | 3,093 | ||||||||||||||
| Net revenues | $ | 17,953 | $ | 15,100 | $ | 2,315 | $ | (213 | ) | $ | 35,155 | |||||||||
| Income from continuing operations before income taxes | $ | 4,671 | $ | 3,332 | $ | 492 | $ | � | $ | 8,495 | ||||||||||
| Provision for income taxes(1) | 825 | 1,247 | 128 | � | 2,200 | |||||||||||||||
| Income from continuing operations | 3,846 | 2,085 | 364 | � | 6,295 | |||||||||||||||
| Discontinued operations: | ||||||||||||||||||||
| Income (loss) from discontinued operations before income taxes | (24 | ) | � | 1 | � | (23 | ) | |||||||||||||
| Provision for (benefit from) income taxes | (7 | ) | � | � | � | (7 | ) | |||||||||||||
| Income (loss) from discontinued operations | (17 | ) | � | 1 | � | (16 | ) | |||||||||||||
| Net income | 3,829 | 2,085 | 365 | � | 6,279 | |||||||||||||||
| Net income applicable to nonredeemable noncontrolling interests | 133 | � | 19 | � | 152 | |||||||||||||||
| Net income applicable to Morgan Stanley | $ | 3,696 | $ | 2,085 | $ | 346 | $ | � | $ | 6,127 | ||||||||||
| | 242 |
| 2014 | ||||||||||||||||||||
| Institutional Securities(2) | Wealth Management | Investment Management | Intersegment Eliminations | Total | ||||||||||||||||
| (dollars in millions) | ||||||||||||||||||||
| Total non-interest revenues(3)(4) | $ | 17,463 | $ | 12,549 | $ | 2,728 | $ | (200 | ) | $ | 32,540 | |||||||||
| Interest income | 3,389 | 2,516 | 2 | (494 | ) | 5,413 | ||||||||||||||
| Interest expense | 3,981 | 177 | 18 | (498 | ) | 3,678 | ||||||||||||||
| Net interest | (592 | ) | 2,339 | (16 | ) | 4 | 1,735 | |||||||||||||
| Net revenues | $ | 16,871 | $ | 14,888 | $ | 2,712 | $ | (196 | ) | $ | 34,275 | |||||||||
| Income (loss) from continuing operations before income taxes | $ | (58 | ) | $ | 2,985 | $ | 664 | $ | � | $ | 3,591 | |||||||||
| Provision for (benefit from) income taxes(5) | (90 | ) | (207 | ) | 207 | � | (90 | ) | ||||||||||||
| Income from continuing operations | 32 | 3,192 | 457 | � | 3,681 | |||||||||||||||
| Discontinued operations: | ||||||||||||||||||||
| Income (loss) from discontinued operations before income taxes | (26 | ) | � | 7 | � | (19 | ) | |||||||||||||
| Provision for (benefit from) income taxes | (7 | ) | � | 2 | � | (5 | ) | |||||||||||||
| Income (loss) from discontinued operations | (19 | ) | � | 5 | � | (14 | ) | |||||||||||||
| Net income | 13 | 3,192 | 462 | � | 3,667 | |||||||||||||||
| Net income applicable to nonredeemable noncontrolling interests | 109 | � | 91 | � | 200 | |||||||||||||||
| Net income (loss) applicable to Morgan Stanley | $ | (96 | ) | $ | 3,192 | $ | 371 | $ | � | $ | 3,467 | |||||||||
| 2013 | ||||||||||||||||||||
| Institutional Securities | Wealth Management | Investment Management | Intersegment Eliminations | Total | ||||||||||||||||
| (dollars in millions) | ||||||||||||||||||||
| Total non-interest revenues | $ | 16,620 | $ | 12,268 | $ | 3,060 | $ | (233 | ) | $ | 31,715 | |||||||||
| Interest income | 3,572 | 2,100 | 9 | (472 | ) | 5,209 | ||||||||||||||
| Interest expense | 4,673 | 225 | 10 | (477 | ) | 4,431 | ||||||||||||||
| Net interest | (1,101 | ) | 1,875 | (1 | ) | 5 | 778 | |||||||||||||
| Net revenues | $ | 15,519 | $ | 14,143 | $ | 3,059 | $ | (228 | ) | $ | 32,493 | |||||||||
| Income from continuing operations before income taxes | $ | 946 | $ | 2,604 | $ | 1,008 | $ | � | $ | 4,558 | ||||||||||
| Provision for (benefit from) income taxes(6) | (315 | ) | 910 | 307 | � | 902 | ||||||||||||||
| Income from continuing operations | 1,261 | 1,694 | 701 | � | 3,656 | |||||||||||||||
| Discontinued operations: | ||||||||||||||||||||
| Income (loss) from discontinued operations | (81 | ) | (1 | ) | 9 | 1 | (72 | ) | ||||||||||||
| Provision for (benefit from) income taxes | (29 | ) | � | � | � | (29 | ) | |||||||||||||
| Income (loss) from discontinued operations | (52 | ) | (1 | ) | 9 | 1 | (43 | ) | ||||||||||||
| Net income | 1,209 | 1,693 | 710 | 1 | 3,613 | |||||||||||||||
| Net income applicable to redeemable noncontrolling interests | 1 | 221 | � | � | 222 | |||||||||||||||
| Net income applicable to nonredeemable noncontrolling interests | 277 | � | 182 | � | 459 | |||||||||||||||
| Net income applicable to Morgan Stanley | $ | 931 | $ | 1,472 | $ | 528 | $ | 1 | $ | 2,932 | ||||||||||
| 243 | |
| (1) | The Company�s effective tax rate from continuing operations for 2015 included net discrete tax benefits of $564 million attributable to the Institutional Securities business segment (see Note 20). |
| (2) | The Institutional Securities business segment Net loss in 2014 was primarily driven by higher legal expenses (see Note 12). |
| (3) | In September 2014, the Company sold a retail property space resulting in a gain on sale of $141 million (within Institutional Securities $84 million, Wealth Management $40 million and Investment Management $17 million), which was included within Other revenues on the consolidated statements of income. |
| (4) | On July�1, 2014, the Company completed the sale of its ownership stake in TransMontaigne Inc. The gain on sale, which was included in continuing operations, was approximately $112 million within the Institutional Securities business segment for 2014. |
| (5) | The Company�s effective tax rate from continuing operations for 2014 included net discrete tax benefits of $1,390 million and $839 million attributable to the Wealth Management and Institutional Securities business segments, respectively (see Note 20). |
| (6) | The Company�s effective tax rate from continuing operations for 2013 included net discrete tax benefits of $407 million attributable to the Institutional Securities business segment (see Note 20). |
| Institutional Securities | Wealth Management | Investment Management(1) | Total(2) | |||||||||||||
| (dollars in millions) | ||||||||||||||||
| At December�31, 2015 | $ | 602,714 | $ | 179,708 | $ | 5,043 | $ | 787,465 | ||||||||
| At December�31, 2014 | $ | 630,341 | $ | 165,147 | $ | 6,022 | $ | 801,510 | ||||||||
| (1) | During 2015 and 2014, the Company deconsolidated approximately $244 million and $1.6 billion, respectively, in net assets previously attributable to nonredeemable noncontrolling interests that were primarily related to or associated with real estate funds sponsored by the Company (see Note 13). |
| (2) | Corporate assets have been fully allocated to the business segments. |
| � | Institutional Securities: advisory and equity underwriting�client location, debt underwriting�revenue recording location, sales and trading�trading desk location. |
| � | Wealth Management: Wealth Management representatives operate in the Americas. |
| � | Investment Management: client location, except for Merchant Banking and Real Estate Investing businesses, which are based on asset location. |
| 2015 | 2014 | 2013 | ||||||||||
| (dollars in millions) | ||||||||||||
| Americas | $ | 25,080 | $ | 25,140 | $ | 23,358 | ||||||
| EMEA | 5,353 | 4,772 | 4,542 | |||||||||
| Asia-Pacific | 4,722 | 4,363 | 4,593 | |||||||||
| Net revenues | $ | 35,155 | $ | 34,275 | $ | 32,493 | ||||||
| At December�31,�2015 | At December�31,�2014 | |||||||
| (dollars in millions) | ||||||||
| Americas | $ | 569,369 | $ | 622,556 | ||||
| EMEA | 146,177 | 104,152 | ||||||
| Asia-Pacific | 71,919 | 74,802 | ||||||
| Total | $ | 787,465 | $ | 801,510 | ||||
| | 244 |
| 22. | Parent Company. |
| 2015 | 2014 | 2013 | ||||||||||
| Revenues: | ||||||||||||
| Dividends from non-bank subsidiaries | $ | 4,942 | $ | 2,641 | $ | 1,113 | ||||||
| Trading | 574 | 601 | (635 | ) | ||||||||
| Investments | � | (1 | ) | � | ||||||||
| Other | 53 | 10 | 27 | |||||||||
| Total non-interest revenues | 5,569 | 3,251 | 505 | |||||||||
| Interest income | 3,055 | 2,594 | 2,783 | |||||||||
| Interest expense | 4,073 | 3,970 | 4,053 | |||||||||
| Net interest | (1,018 | ) | (1,376 | ) | (1,270 | ) | ||||||
| Net revenues | 4,551 | 1,875 | (765 | ) | ||||||||
| Non-interest expenses: | ||||||||||||
| Non-interest expenses | (195 | ) | 214 | 185 | ||||||||
| Income (loss) before income taxes | 4,746 | 1,661 | (950 | ) | ||||||||
| Provision for (benefit from) income taxes | (83 | ) | (423 | ) | (354 | ) | ||||||
| Net income (loss) before undistributed gain of subsidiaries | 4,829 | 2,084 | (596 | ) | ||||||||
| Undistributed gain of subsidiaries | 1,298 | 1,383 | 3,528 | |||||||||
| Net income | 6,127 | 3,467 | 2,932 | |||||||||
| Other comprehensive income (loss), net of tax: | ||||||||||||
| Foreign currency translation adjustments | (300 | ) | (397 | ) | (143 | ) | ||||||
| Change in net unrealized gains (losses) on AFS securities | (246 | ) | 209 | (433 | ) | |||||||
| Pensions, postretirement and other | 138 | 33 | (1 | ) | ||||||||
| Comprehensive income | $ | 5,719 | $ | 3,312 | $ | 2,355 | ||||||
| Net income | $ | 6,127 | $ | 3,467 | $ | 2,932 | ||||||
| Preferred stock dividends and other | 456 | 315 | 277 | |||||||||
| Earnings applicable to Morgan Stanley common shareholders | $ | 5,671 | $ | 3,152 | $ | 2,655 | ||||||
| 245 | |
| December�31, 2015 | December�31, 2014 | |||||||
| Assets | ||||||||
| Cash and due from banks | $ | 5,169 | $ | 5,068 | ||||
| Deposits with banking subsidiaries | 4,311 | 4,556 | ||||||
| Interest bearing deposits with banks | 2,421 | 1,126 | ||||||
| Trading assets, at fair value | 354 | 5,014 | ||||||
| Securities purchased under agreement to resell with affiliates | 47,060 | 41,601 | ||||||
| Advances to subsidiaries: | ||||||||
| Bank and bank holding company | 18,380 | 19,982 | ||||||
| Non-bank | 106,192 | 112,863 | ||||||
| Equity investments in subsidiaries: | ||||||||
| Bank and bank holding company | 25,787 | 24,573 | ||||||
| Non-bank | 34,927 | 34,649 | ||||||
| Other assets | 6,259 | 7,805 | ||||||
| Total assets | $ | 250,860 | $ | 257,237 | ||||
| Liabilities | ||||||||
| Short-term borrowings | $ | 40 | $ | 695 | ||||
| Trading liabilities, at fair value | 138 | 4,042 | ||||||
| Payables to subsidiaries | 29,220 | 35,517 | ||||||
| Other liabilities and accrued expenses | 2,189 | 2,342 | ||||||
| Long-term borrowings | 144,091 | 143,741 | ||||||
| Total liabilities | 175,678 | 186,337 | ||||||
| Equity | ||||||||
| Preferred stock (see Note 15) | 7,520 | 6,020 | ||||||
| Common stock, $0.01 par value: | ||||||||
| Shares authorized: 3,500,000,000 at December�31, 2015 and December�31, 2014; | ||||||||
| Shares issued: 2,038,893,979 at December�31, 2015 and December�31, 2014; | ||||||||
| Shares outstanding: 1,920,024,027 and 1,950,980,142 at December�31, 2015 and December�31, 2014, respectively | 20 | 20 | ||||||
| Additional paid-in capital | 24,153 | 24,249 | ||||||
| Retained earnings | 49,204 | 44,625 | ||||||
| Employee stock trusts | 2,409 | 2,127 | ||||||
| Accumulated other comprehensive loss | (1,656) | (1,248) | ||||||
| Common stock held in treasury, at cost, $0.01 par value: | ||||||||
| Shares outstanding: 118,869,952 and 87,913,837 at December�31, 2015 and December�31, 2014, respectively | (4,059) | (2,766) | ||||||
| Common stock issued to employee stock trusts | (2,409) | (2,127) | ||||||
| Total shareholders� equity | 75,182 | 70,900 | ||||||
| Total liabilities and equity | $ | 250,860 | $ | 257,237 | ||||
| | 246 |
| 2015 | 2014 | 2013 | ||||||||||
| CASH FLOWS FROM OPERATING ACTIVITIES | ||||||||||||
| Net income | $ | 6,127 | $ | 3,467 | $ | 2,932 | ||||||
| Adjustments to reconcile net income to net cash provided by (used for) operating activities: | ||||||||||||
| Deferred income taxes | 63 | 98 | (303) | |||||||||
| Compensation payable in common stock and options | 1,104 | 1,260 | 1,180 | |||||||||
| Amortization | (83) | (182) | (47) | |||||||||
| Undistributed gain of subsidiaries | (1,298) | (1,383) | (3,528) | |||||||||
| Changes in assets and liabilities: | ||||||||||||
| Trading assets, net of Trading liabilities | (2,958) | 2,307 | (7,332) | |||||||||
| Other assets | 1,474 | (490) | (165) | |||||||||
| Other liabilities and accrued expenses | (1,711) | 488 | (4,192) | |||||||||
| Net cash provided by (used for) operating activities | 2,718 | 5,565 | (11,455) | |||||||||
| CASH FLOWS FROM INVESTING ACTIVITIES | ||||||||||||
| Advances to and investments in subsidiaries | 1,364 | (7,790) | 7,458 | |||||||||
| Securities purchased under agreement to resell with affiliates | (5,459) | (7,853) | 14,745 | |||||||||
| Net cash provided by (used for) investing activities | (4,095) | (15,643) | 22,203 | |||||||||
| CASH FLOWS FROM FINANCING ACTIVITIES | ||||||||||||
| Net proceeds from (payments for) short-term borrowings | (655) | 189 | 279 | |||||||||
| Proceeds from: | ||||||||||||
| Excess tax benefits associated with stock-based awards | 211 | 101 | 10 | |||||||||
| Issuance of preferred stock, net of issuance costs | 1,493 | 2,782 | 1,696 | |||||||||
| Issuance of long-term borrowings | 28,575 | 33,031 | 22,944 | |||||||||
| Payments for: | ||||||||||||
| Long-term borrowings | (22,803) | (28,917) | (31,928) | |||||||||
| Repurchases of common stock and employee tax withholdings | (2,773) | (1,458) | (691) | |||||||||
| Cash dividends | (1,455) | (904) | (475) | |||||||||
| Net cash provided by (used for) financing activities | 2,593 | 4,824 | (8,165) | |||||||||
| Effect of exchange rate changes on cash and cash equivalents | (65) | (208) | (100) | |||||||||
| Net increase (decrease) in cash and cash equivalents | 1,151 | (5,462) | 2,483 | |||||||||
| Cash and cash equivalents, at beginning of period | 10,750 | 16,212 | 13,729 | |||||||||
| Cash and cash equivalents, at end of period | $ | 11,901 | $ | 10,750 | $ | 16,212 | ||||||
| Cash and cash equivalents include: | ||||||||||||
| Cash and due from banks | $5,169 | $ | 5,068 | $ | 2,296 | |||||||
| Deposits with banking subsidiaries | 4,311 | 4,556 | 7,070 | |||||||||
| Interest bearing deposits with banks | 2,421 | 1,126 | 6,846 | |||||||||
| Cash and cash equivalents, at end of period | $ | 11,901 | $ | 10,750 | $ | 16,212 | ||||||
| 247 | |
| At December�31, 2015 | At December�31, 2014 | |||||||
| (dollars in millions) | ||||||||
| Senior debt | $ | 130,817 | $ | 130,533 | ||||
| Subordinated debt | 13,274 | 13,208 | ||||||
| Total | $ | 144,091 | $ | 143,741 | ||||
| | 248 |
| 23. | Quarterly Results (Unaudited). |
| 2015 Quarter | 2014 Quarter | |||||||||||||||||||||||||||||||
| First(1) | Second | Third | Fourth(2) | First | Second(3) | Third(4) | Fourth(5) | |||||||||||||||||||||||||
| (dollars in millions, except per share data) | ||||||||||||||||||||||||||||||||
| Total non-interest revenues | $ | 9,311 | $ | 9,045 | $ | 7,005 | $ | 6,701 | $ | 8,688 | $ | 8,341 | $ | 8,350 | $ | 7,161 | ||||||||||||||||
| Net interest | 596 | 698 | 762 | 1,037 | 308 | 267 | 557 | 603 | ||||||||||||||||||||||||
| Net revenues | 9,907 | 9,743 | 7,767 | 7,738 | 8,996 | 8,608 | 8,907 | 7,764 | ||||||||||||||||||||||||
| Total non-interest expenses | 7,052 | 7,016 | 6,293 | 6,299 | 6,626 | 6,676 | 6,687 | 10,695 | ||||||||||||||||||||||||
| Income (loss) from continuing operations before income taxes | 2,855 | 2,727 | 1,474 | 1,439 | 2,370 | 1,932 | 2,220 | (2,931) | ||||||||||||||||||||||||
| Provision for (benefit from) income taxes | 387 | 894 | 423 | 496 | 785 | 15 | 463 | (1,353) | ||||||||||||||||||||||||
| Income (loss) from continuing operations | 2,468 | 1,833 | 1,051 | 943 | 1,585 | 1,917 | 1,757 | (1,578) | ||||||||||||||||||||||||
| Discontinued operations: | ||||||||||||||||||||||||||||||||
| Income (loss) from discontinued operations before income taxes | (8) | (2) | (4) | (10) | (2) | (1) | (8) | (8) | ||||||||||||||||||||||||
| Provision for (benefit from) income taxes | (3) | � | (2) | (3) | (1) | (1) | (3) | � | ||||||||||||||||||||||||
| Income (loss) from discontinued operations | (5) | (2) | (2) | (7) | (1) | � | (5) | (8) | ||||||||||||||||||||||||
| Net income (loss) | 2,463 | 1,831 | 1,049 | 936 | 1,584 | 1,917 | 1,752 | (1,586) | ||||||||||||||||||||||||
| Net income applicable to nonredeemable noncontrolling interests | 69 | 24 | 31 | 28 | 79 | 18 | 59 | 44 | ||||||||||||||||||||||||
| Net income (loss) applicable to Morgan Stanley | $ | 2,394 | $ | 1,807 | $ | 1,018 | $ | 908 | $ | 1,505 | $ | 1,899 | $ | 1,693 | $ | (1,630) | ||||||||||||||||
| Preferred stock dividends and other | 80 | 142 | 79 | 155 | 56 | 79 | 64 | 119 | ||||||||||||||||||||||||
| Earnings (loss) applicable to Morgan Stanley common shareholders | $ | 2,314 | $ | 1,665 | $ | 939 | $ | 753 | $ | 1,449 | $ | 1,820 | $ | 1,629 | $ | (1,749) | ||||||||||||||||
| Earnings (loss) per basic common share(6): | ||||||||||||||||||||||||||||||||
| Income (loss) from continuing operations | $ | 1.21 | $ | 0.87 | $ | 0.49 | $ | 0.40 | $ | 0.75 | $ | 0.94 | $ | 0.85 | $ | (0.91) | ||||||||||||||||
| Income (loss) from discontinued operations | (0.01) | � | � | � | � | � | � | � | ||||||||||||||||||||||||
| Earnings (loss) per basic common share | $ | 1.20 | $ | 0.87 | $ | 0.49 | $ | 0.40 | $ | 0.75 | $ | 0.94 | $ | 0.85 | $ | (0.91) | ||||||||||||||||
| Earnings (loss) per diluted common share(6): | ||||||||||||||||||||||||||||||||
| Income (loss) from continuing operations | $ | 1.18 | $ | 0.85 | $ | 0.48 | $ | 0.39 | $ | 0.74 | $ | 0.92 | $ | 0.83 | $ | (0.91) | ||||||||||||||||
| Income (loss) from discontinued operations | � | � | � | � | � | � | � | � | ||||||||||||||||||||||||
| Earnings (loss) per diluted common share | $ | 1.18 | $ | 0.85 | $ | 0.48 | $ | 0.39 | $ | 0.74 | $ | 0.92 | $ | 0.83 | $ | (0.91) | ||||||||||||||||
| Dividends declared per common share(7) | $ | 0.10 | $ | 0.15 | $ | 0.15 | $ | 0.15 | $ | 0.05 | $ | 0.10 | $ | 0.10 | $ | 0.10 | ||||||||||||||||
| Book value per common share | $ | 33.80 | $ | 34.52 | $ | 34.97 | $ | 35.24 | $ | 32.38 | $ | 33.46 | $ | 34.16 | $ | 33.25 | ||||||||||||||||
| (1) | The first quarter of 2015 included net discrete tax benefits of $564 million, primarily associated with the repatriation of non-U.S. earnings at a cost lower than originally estimated due to an internal restructuring to simplify the Company�s legal entity organization in the U.K. (see Note 20). |
| (2) | During the fourth quarter of 2015, the Company incurred specific severance costs of approximately $155 million, which is included in Compensation and benefits expenses in the consolidated statements of income, associated with the Company�s restructuring actions, which were recorded in the business segments, approximately, as follows: Institutional Securities: $125 million, Wealth Management: $20 million and Investment Management: $10 million. |
| (3) | The second quarter of 2014 included net discrete tax benefits of $609 million, principally associated with the remeasurement of reserves and related interest due to new information regarding the status of a multi-year tax authority examination (see Note 20). |
| (4) | The third quarter of 2014 included net discrete tax benefits of $237 million, primarily associated with the repatriation of non-U.S. earnings at a cost lower than originally estimated (see Note 20). The third quarter of 2014 also included a gain on sale of a retail property space of $141 million, which was included within Other revenues in the consolidated statements of income and a gain on sale of its ownership stake in TransMontaigne Inc. |
| (5) | The fourth quarter of 2014 included: an increase of legal reserves of approximately $3.1 billion (see Note 12); net discrete tax benefits of $1,380 million, primarily due to the release of a deferred tax liability as a result of a legal entity restructuring, partially offset by approximately $900 million of tax provision from non-deductible expenses for litigation and regulatory matters (see Note 20); compensation expense deferral adjustments of $1.1 billion (see Note 18); and a charge of approximately $468 million related to the implementation of FVA (see Note 2), which was reflected as a reduction of the Institutional Securities business segment Trading revenues. |
| (6) | Summation of the quarters� earnings per common share may not equal the annual amounts due to the averaging effect of the number of shares and share equivalents throughout the year. |
| (7) | Beginning with the dividend declared on April�20, 2015, the Company increased the quarterly common stock dividend to $0.15 per share from $0.10 per share. |
| 249 | |
| 24. | Subsequent Events. |
| | 250 |
| 2015 | ||||||||||||
| Average Daily Balance | Interest | Average Rate | ||||||||||
| (dollars in millions) | ||||||||||||
| Assets | ||||||||||||
| Interest earning assets: | ||||||||||||
| Trading assets(1): | ||||||||||||
| U.S. | $ | 100,066 | $ | 1,874 | 1.9% | |||||||
| Non-U.S. | 108,664 | 388 | 0.4 | |||||||||
| Investment securities: | ||||||||||||
| U.S. | 67,993 | 876 | 1.3 | |||||||||
| Loans: | ||||||||||||
| U.S. | 74,868 | 2,130 | 2.8 | |||||||||
| Non-U.S. | 242 | 33 | 13.6 | |||||||||
| Interest bearing deposits with banks: | ||||||||||||
| U.S. | 25,531 | 77 | 0.3 | |||||||||
| Non-U.S. | 1,119 | 31 | 2.8 | |||||||||
| Securities purchased under agreements to resell and Securities borrowed(2): | ||||||||||||
| U.S. | 172,481 | (618 | ) | (0.4) | ||||||||
| Non-U.S. | 80,490 | 58 | 0.1 | |||||||||
| Customer receivables and Other(3): | ||||||||||||
| U.S. | 53,887 | 857 | 1.6 | |||||||||
| Non-U.S. | 26,836 | 129 | 0.5 | |||||||||
| Tota l | $ | 712,177 | $ | 5,835 | 0.8% | |||||||
| Non-interest earning assets | 119,647 | |||||||||||
| Total assets | $ | 831,824 | ||||||||||
| Liabilities and Equity | ||||||||||||
| Interest bearing liabilities: | ||||||||||||
| Deposits: | ||||||||||||
| U.S. | $ | 139,242 | $ | 65 | �% | |||||||
| Non-U.S. | 2,260 | 13 | 0.6 | |||||||||
| Short-term borrowings(4): | ||||||||||||
| U.S. | 1,162 | 1 | 0.1 | |||||||||
| Non-U.S. | 1,025 | 15 | 1.5 | |||||||||
| Long-term borrowings(4): | ||||||||||||
| U.S. | 150,005 | 3,448 | 2.3 | |||||||||
| Non-U.S. | 7,589 | 33 | 0.4 | |||||||||
| Trading liabilities(1): | ||||||||||||
| U.S. | 31,993 | � | � | |||||||||
| Non-U.S. | 52,083 | � | � | |||||||||
| Securities sold under agreements to repurchase and Securities loaned(5): | ||||||||||||
| U.S. | 51,115 | 437 | 0.9 | |||||||||
| Non-U.S. | 34,306 | 587 | 1.7 | |||||||||
| Customer payables and Other(6): | ||||||||||||
| U.S. | 117,358 | (1,529 | ) | (1.3) | ||||||||
| Non-U.S. | 63,759 | (328 | ) | (0.5) | ||||||||
| Total | $ | 651,897 | $ | 2,742 | 0.4 | |||||||
| Non-interest bearing liabilities and equity | 179,927 | |||||||||||
| Total liabilities and equity | $ | 831,824 | ||||||||||
| Net interest income and net interest rate spread | $ | 3,093 | 0.4% | |||||||||
| 251 | |
| 2014 | ||||||||||||
| Average Weekly Balance | Interest | Average Rate | ||||||||||
| (dollars in millions) | ||||||||||||
| Assets | ||||||||||||
| Interest earning assets: | ||||||||||||
| Trading assets(1): | ||||||||||||
| U.S. | $ | 104,640 | $ | 1,643 | 1.6 | % | ||||||
| Non-U.S. | 113,580 | 466 | 0.4 | |||||||||
| Investment securities: | ||||||||||||
| U.S. | 62,240 | 613 | 1.0 | |||||||||
| Loans: | ||||||||||||
| U.S. | 53,210 | 1,639 | 3.1 | |||||||||
| Non-U.S. | 357 | 51 | 14.3 | |||||||||
| Interest bearing deposits with banks: | ||||||||||||
| U.S. | 29,273 | 73 | 0.2 | |||||||||
| Non-U.S. | 2,953 | 36 | 1.2 | |||||||||
| Securities purchased under agreements to resell and Securities borrowed(2): | ||||||||||||
| U.S. | 177,444 | (507) | (0.3) | |||||||||
| Non-U.S. | 77,139 | 209 | 0.3 | |||||||||
| Customer receivables and Other(3): | ||||||||||||
| U.S. | 73,244 | 655 | 0.9 | |||||||||
| Non-U.S. | 18,635 | 535 | 2.9 | |||||||||
| Total | $ | 712,715 | $ | 5,413 | 0.8 | % | ||||||
| Non-interest earning assets | 114,558 | |||||||||||
| Total assets | $ | 827,273 | ||||||||||
| Liabilities and Equity | ||||||||||||
| Interest bearing liabilities: | ||||||||||||
| Deposits: | ||||||||||||
| U.S. | $ | 118,580 | $ | 94 | 0.1 | % | ||||||
| Non-U.S. | 1,239 | 12 | 1.0 | |||||||||
| Short-term borrowings(4): | ||||||||||||
| U.S. | 1,356 | � | � | |||||||||
| Non-U.S. | 568 | 4 | 0.7 | |||||||||
| Long-term borrowings(4): | ||||||||||||
| U.S. | 143,118 | 3,572 | 2.5 | |||||||||
| Non-U.S. | 8,771 | 37 | 0.4 | |||||||||
| Trading liabilities(1): | ||||||||||||
| U.S. | 25,587 | � | � | |||||||||
| Non-U.S. | 54,112 | � | � | |||||||||
| Securities sold under agreements to repurchase and Securities loaned(5): | ||||||||||||
| U.S. | 86,063 | 548 | 0.6 | |||||||||
| Non-U.S. | 50,843 | 668 | 1.3 | |||||||||
| Customer payables and Other(6): | ||||||||||||
| U.S. | 119,153 | (1,366) | (1.1) | |||||||||
| Non-U.S. | 49,555 | 109 | 0.2 | |||||||||
| Total | $ | 658,945 | $ | 3,678 | 0.6 | |||||||
| Non-interest bearing liabilities and equity | 168,328 | |||||||||||
| Total liabilities and equity | $ | 827,273 | ||||||||||
| Net interest income and net interest rate spread | $ | 1,735 | 0.2 | % | ||||||||
| | 252 |
| 2013 | ||||||||||||
| Average Weekly Balance | Interest | Average Rate | ||||||||||
| (dollars in millions) | ||||||||||||
| Assets | ||||||||||||
| Interest earning assets: | ||||||||||||
| Trading assets(1): | ||||||||||||
| U.S. | $ | 119,549 | $ | 1,948 | 1.6 | % | ||||||
| Non-U.S. | 103,774 | 344 | 0.3 | |||||||||
| Investment securities: | ||||||||||||
| U.S. | 44,112 | 447 | 1.0 | |||||||||
| Loans: | ||||||||||||
| U.S. | 33,939 | 1,052 | 3.1 | |||||||||
| Non-U.S. | 489 | 69 | 14.1 | |||||||||
| Interest bearing deposits with banks: | ||||||||||||
| U.S. | 34,636 | 86 | 0.2 | |||||||||
| Non-U.S. | 7,609 | 43 | 0.6 | |||||||||
| Securities purchased under agreements to resell and Securities borrowed(2): | ||||||||||||
| U.S. | 203,742 | (217) | (0.1) | |||||||||
| Non-U.S. | 77,713 | 197 | 0.3 | |||||||||
| Customer receivables and Other(3): | ||||||||||||
| U.S. | 62,028 | 751 | 1.2 | |||||||||
| Non-U.S. | 19,077 | 489 | 2.6 | |||||||||
| Total | $ | 706,668 | $ | 5,209 | 0.7 | % | ||||||
| Non-interest earning assets | 121,793 | |||||||||||
| Total assets | $ | 828,461 | ||||||||||
| Liabilities and Equity | ||||||||||||
| Interest bearing liabilities: | ||||||||||||
| Deposits: | ||||||||||||
| U.S. | $ | 91,713 | $ | 159 | 0.2 | % | ||||||
| Non-U.S. | 260 | � | � | |||||||||
| Short-term borrowings(4): | ||||||||||||
| U.S. | 964 | 2 | 0.2 | |||||||||
| Non-U.S. | 1,063 | 18 | 1.7 | |||||||||
| Long-term borrowings(4): | ||||||||||||
| U.S. | 152,532 | 3,696 | 2.4 | |||||||||
| Non-U.S. | 9,857 | 62 | 0.6 | |||||||||
| Trading liabilities(1): | ||||||||||||
| U.S. | 31,861 | � | � | |||||||||
| Non-U.S. | 59,200 | � | � | |||||||||
| Securities sold under agreements to repurchase and Securities loaned(5): | ||||||||||||
| U.S. | 108,896 | 681 | 0.6 | |||||||||
| Non-U.S. | 66,697 | 788 | 1.2 | |||||||||
| Customer payables and Other(6): | ||||||||||||
| U.S. | 98,335 | (1,117) | (1.1) | |||||||||
| Non-U.S. | 37,679 | 142 | 0.4 | |||||||||
| Total | $ | 659,057 | $ | 4,431 | 0.7 | |||||||
| Non-interest bearing liabilities and equity | 169,404 | |||||||||||
| Total liabilities and equity | $ | 828,461 | ||||||||||
| Net interest income and net interest rate spread | $ | 778 | � | % | ||||||||
| (1) | Interest expense on Trading liabilities is reported as a reduction of Interest income on Trading assets. |
| (2) | Includes fees paid on securities borrowed. |
| (3) | Includes interest from customer receivables and other interest earning assets. |
| (4) | The Company also issues structured notes that have coupon or repayment terms linked to the performance of debt or equity securities, indices, currencies or commodities, which are recorded within Trading revenues (see Note 3). |
| (5) | Includes fees received on Securities loaned. |
| (6) | Includes fees received from prime brokerage customers for stock loan transactions incurred to cover customers� short positions. |
| 253 | |
| 2015�versus�2014 | ||||||||||||
| Increase�(Decrease)�due�to�Change�in: | ||||||||||||
| Volume | Rate | Net Change | ||||||||||
| (dollars in millions) | ||||||||||||
| Interest earning assets | ||||||||||||
| Trading assets: | ||||||||||||
| U.S. | $ | (72) | $ | 303 | $ | 231 | ||||||
| Non-U.S. | (20) | (58) | (78) | |||||||||
| Investment securities: | ||||||||||||
| U.S. | 57 | 206 | 263 | |||||||||
| Loans: | ||||||||||||
| U.S. | 667 | (176) | 491 | |||||||||
| Non-U.S. | (16) | (2) | (18) | |||||||||
| Interest bearing deposits with banks: | ||||||||||||
| U.S. | (9) | 13 | 4 | |||||||||
| Non-U.S. | (22) | 17 | (5) | |||||||||
| Securities purchased under agreements to resell and Securities borrowed: | ||||||||||||
| U.S. | 14 | (125) | (111) | |||||||||
| Non-U.S. | 9 | (160) | (151) | |||||||||
| Customer receivables and Other: | ||||||||||||
| U.S. | (173) | 375 | 202 | |||||||||
| Non-U.S. | 235 | (641) | (406) | |||||||||
| Change in interest income | $ | 670 | $ | (248) | $ | 422 | ||||||
| Interest bearing liabilities | ||||||||||||
| Deposits: | ||||||||||||
| U.S. | $ | 16 | $ | (45) | $ | (29) | ||||||
| Non-U.S. | 10 | (9) | 1 | |||||||||
| Short-term borrowings: | ||||||||||||
| U.S. | � | 1 | 1 | |||||||||
| Non-U.S. | 3 | 8 | 11 | |||||||||
| Long-term borrowings: | ||||||||||||
| U.S. | 172 | (296) | (124) | |||||||||
| Non-U.S. | (5) | 1 | (4) | |||||||||
| Securities sold under agreements to repurchase and Securities loaned: | ||||||||||||
| U.S. | (223) | 112 | (111) | |||||||||
| Non-U.S. | (217) | 136 | (81) | |||||||||
| Customer payables and Other: | ||||||||||||
| U.S. | 21 | (184) | (163) | |||||||||
| Non-U.S. | 31 | (468) | (437) | |||||||||
| Change in interest expense | $ | (192) | $ | (744) | $ | (936) | ||||||
| Change in net interest income | $ | 862 | $ | 496 | $ | 1,358 | ||||||
| | 254 |
| 2014�versus�2013 | ||||||||||||
| Increase�(Decrease)�due�to�Change�in: | ||||||||||||
| Volume | Rate | Net Change | ||||||||||
| (dollars in millions) | ||||||||||||
| Interest earning assets | ||||||||||||
| Trading assets: | ||||||||||||
| U.S. | $ | (243) | $ | (62) | $ | (305) | ||||||
| Non-U.S. | 33 | 89 | 122 | |||||||||
| Investment securities: | ||||||||||||
| U.S. | 184 | (18) | 166 | |||||||||
| Loans: | ||||||||||||
| U.S. | 597 | (10) | 587 | |||||||||
| Non-U.S. | (19) | 1 | (18) | |||||||||
| Interest bearing deposits with banks: | ||||||||||||
| U.S. | (13) | � | (13) | |||||||||
| Non-U.S. | (26) | 19 | (7) | |||||||||
| Securities purchased under agreements to resell and Securities borrowed: | ||||||||||||
| U.S. | 28 | (318) | (290) | |||||||||
| Non-U.S. | (1) | 13 | 12 | |||||||||
| Customer receivables and Other: | ||||||||||||
| U.S. | 136 | (232) | (96) | |||||||||
| Non-U.S. | (11) | 57 | 46 | |||||||||
| Change in interest income | $ | 665 | $ | (461) | $ | 204 | ||||||
| Interest bearing liabilities | ||||||||||||
| Deposits: | ||||||||||||
| U.S. | $ | 47 | $ | (112) | $ | (65) | ||||||
| Non-U.S. | � | 12 | 12 | |||||||||
| Short-term borrowings: | ||||||||||||
| U.S. | 1 | (3) | (2) | |||||||||
| Non-U.S. | (8) | (6) | (14) | |||||||||
| Long-term borrowings: | ||||||||||||
| U.S. | (228) | 104 | (124) | |||||||||
| Non-U.S. | (7) | (18) | (25) | |||||||||
| Securities sold under agreements to repurchase and Securities loaned: | ||||||||||||
| U.S. | (143) | 10 | (133) | |||||||||
| Non-U.S. | (187) | 67 | (120) | |||||||||
| Customer payables and Other: | ||||||||||||
| U.S. | (236) | (13) | (249) | |||||||||
| Non-U.S. | 45 | (78) | (33) | |||||||||
| Change in interest expense | $ | (716) | $ | (37) | $ | (753) | ||||||
| Change in net interest income | $ | 1,381 | $ | (424) | $ | 957 | ||||||
| 255 | |
| Average Deposits(1) | ||||||||||||||||||||||||
| 2015 | 2014 | 2013 | ||||||||||||||||||||||
| Average Amount(1) | Average Rate | Average Amount(1) | Average Rate | Average Amount(1) | Average Rate | |||||||||||||||||||
| (dollars in millions) | ||||||||||||||||||||||||
| Deposits(2): | ||||||||||||||||||||||||
| Savings deposits | $ | 139,169 | 0.1% | $ | 118,086 | 0.1% | $ | 90,447 | 0.1% | |||||||||||||||
| Time deposits | 2,333 | 0.6% | 1,733 | 0.7% | 1,526 | 3.9% | ||||||||||||||||||
| Total | $ | 141,502 | 0.6% | $ | 119,819 | 0.1% | $ | 91,973 | 0.2% | |||||||||||||||
| (1) | In 2015, the Company calculated its average balances based on daily amounts. In 2014 and 2013, the Company calculated its average balances based upon weekly amounts, except where weekly balances were unavailable, month-end balances were used. |
| (2) | The Company�s deposits were primarily held in U.S. offices. |
| 2015 | 2014 | 2013 | ||||||||||
| Net income to average assets | 0.7% | 0.4% | 0.4% | |||||||||
| Return on average common equity(1) | 8.5% | 4.8% | 4.3% | |||||||||
| Return on total equity(2) | 8.3% | 4.9% | 4.6% | |||||||||
| Dividend payout ratio(3) | 5.2% | 21.9% | 14.7% | |||||||||
| Total average common equity to average assets | 8.0% | 7.9% | 7.5% | |||||||||
| Total average equity to average assets | 8.9% | 8.5% | 7.7% | |||||||||
| (1) | Percentage is based on net income applicable to Morgan Stanley less preferred dividends as a percentage of average common equity. |
| (2) | Percentage is based on net income as a percentage of average total equity. |
| (3) | Percentage is based on dividends declared per common share as a percentage of net income per diluted share. |
| 2015 | 2014 | 2013 | ||||||||||
| (dollars in millions) | ||||||||||||
| Securities sold under repurchase agreements: | ||||||||||||
| Period-end balance | $ | 36,692 | $ | 69,949 | $ | 145,676 | ||||||
| Average balance(1)(2) | 61,338 | 103,640 | 136,151 | |||||||||
| Maximum balance at any month-end | 81,346 | 129,265 | 145,676 | |||||||||
| Weighted average interest rate during the period(3) | 0.9% | 0.8% | 0.7% | |||||||||
| Weighted average interest rate on period-end balance(4) | 0.8% | 0.7% | 0.4% | |||||||||
| Securities loaned: | ||||||||||||
| Period-end balance | $ | 19,358 | $ | 25,219 | $ | 32,799 | ||||||
| Average balance(1)(2) | 24,083 | 33,266 | 39,442 | |||||||||
| Maximum balance at any month-end | 29,674 | 35,700 | 44,182 | |||||||||
| Weighted average interest rate during the period(3) | 2.1% | 1.3% | 1.2% | |||||||||
| Weighted average interest rate on period-end balance(4) | 2.4% | 1.6% | 1.2% | |||||||||
| (1) | In 2015, the Company calculated its average balances based upon daily amounts. In 2014 and 2013, the Company calculated its average balances based upon weekly amounts, except where weekly balances were unavailable, month-end balances were used. |
| (2) | Securities sold under agreements to repurchase and Securities loaned period-end balances at December�31, 2015 were lower than the annual average balances during 2015. The balances moved in line with client financing and with general movements in firm inventory. |
| (3) | The approximated weighted average interest rate was calculated using (a)�interest expense incurred on all securities sold under repurchase agreements and securities loaned transactions, whether or not such transactions were reported in the consolidated statements of financial condition and (b)�average balances that were reported on a net basis where certain criteria were met in accordance with applicable offsetting guidance. In addition, securities-for-securities transactions in which the Company was the borrower were not included in the average balances since they were not reported in the consolidated statements of financial condition. |
| | 256 |
| (4) | The approximated weighted average interest rate was calculated using (a)�interest expense incurred on all securities sold under repurchase agreements and securities loaned transactions, whether or not such transactions were reported in the consolidated statements of financial condition and (b)�period-end balances that were reported on a net basis where certain criteria were met in accordance with applicable offsetting guidance. In addition, securities-for-securities transactions in which the Company was the borrower were not included in the period-end balances since they were not reported in the consolidated statements of financial condition. |
| At December 31, 2015 | ||||||||||||||||||||
| Country | Banks | Governments | Non-banking Financial Institutions | Other | Total | |||||||||||||||
| (dollars in millions) | ||||||||||||||||||||
| United Kingdom | $ | 9,556 | $ | 36 | $ | 53,039 | $ | 11,273 | $ | 73,904 | ||||||||||
| Japan | 6,784 | 9,903 | 18,432 | 9,076 | 44,195 | |||||||||||||||
| France | 15,321 | 18 | 7,217 | 6,087 | 28,643 | |||||||||||||||
| Cayman Islands | 349 | � | 19,582 | 4,848 | 24,779 | |||||||||||||||
| Germany | 5,089 | 6,516 | 4,240 | 6,158 | 22,003 | |||||||||||||||
| Ireland | 411 | 3 | 7,058 | 5,387 | 12,859 | |||||||||||||||
| Switzerland | 1,430 | 501 | 719 | 7,794 | 10,444 | |||||||||||||||
| Canada | 2,667 | 2,328 | 3,068 | 2,354 | 10,417 | |||||||||||||||
| India | 2,514 | 355 | 770 | 5,620 | 9,259 | |||||||||||||||
| Singapore | 2,185 | 5,980 | 36 | 770 | 8,971 | |||||||||||||||
| Netherlands | 669 | � | 4,244 | 3,542 | 8,455 | |||||||||||||||
| China | 1,999 | 1,134 | 914 | 4,431 | 8,478 | |||||||||||||||
| At December�31, 2014 | ||||||||||||||||||||
| Country | Banks | Governments | Non-banking Financial Institutions | Other | Total | |||||||||||||||
| (dollars in millions) | ||||||||||||||||||||
| United Kingdom | $ | 8,514 | $ | 948 | $ | 50,855 | $ | 9,170 | $ | 69,487 | ||||||||||
| Cayman Islands | 144 | � | 38,223 | 5,249 | 43,616 | |||||||||||||||
| Japan | 14,860 | 5,645 | 15,814 | 7,162 | 43,481 | |||||||||||||||
| France | 18,838 | 218 | 2,349 | 5,591 | 26,996 | |||||||||||||||
| Germany | 6,650 | 6,679 | 3,991 | 3,304 | 20,624 | |||||||||||||||
| Singapore | 2,117 | 7,761 | 18 | 788 | 10,684 | |||||||||||||||
| China | 1,738 | 3,259 | 64 | 5,546 | 10,607 | |||||||||||||||
| Canada | 2,741 | 286 | 4,261 | 2,694 | 9,982 | |||||||||||||||
| South Korea | 149 | 6,081 | 721 | 3,012 | 9,963 | |||||||||||||||
| Ireland | 304 | 20 | 5,793 | 3,203 | 9,320 | |||||||||||||||
| Netherlands | 910 | � | 3,509 | 3,890 | 8,309 | |||||||||||||||
| 257 | |
| At December 31, 2013 | ||||||||||||||||||||
| Country | Banks | Governments | Non-banking Financial Institutions | Other | Total | |||||||||||||||
| (dollars in millions) | ||||||||||||||||||||
| United Kingdom | $ | 11,874 | $ | 911 | $ | 45,787 | $ | 11,807 | $ | 70,379 | ||||||||||
| Japan | 27,251 | 3,622 | 12,285 | 14,141 | 57,299 | |||||||||||||||
| Cayman Islands | 1 | � | 38,476 | 6,565 | 45,042 | |||||||||||||||
| Germany | 8,844 | 10,312 | 4,985 | 5,628 | 29,769 | |||||||||||||||
| France | 22,408 | 264 | 2,194 | 4,053 | 28,919 | |||||||||||||||
| Canada | 2,988 | 2,012 | 4,878 | 2,230 | 12,108 | |||||||||||||||
| Netherlands | 1,474 | � | 6,111 | 3,904 | 11,489 | |||||||||||||||
| South Korea | 65 | 4,307 | 368 | 3,008 | 7,748 | |||||||||||||||
| | 258 |
| Item�9. | Changes in and Disagreements with Accountants on Accounting and Financial Disclosure. |
| Item�9A. | Controls and Procedures. |
| � | Pertain to the maintenance of records that, in reasonable detail, accurately and fairly reflect the transactions and dispositions of the assets of the Company; |
| � | Provide reasonable assurance that transactions are recorded as necessary to permit preparation of financial statements in accordance with generally accepted accounting principles in the United States, and that our receipts and expenditures are being made only in accordance with authorizations of the Company�s management and directors; and |
| � | Provide reasonable assurance regarding prevention or timely detection of unauthorized acquisition, use or disposition of our assets that could have a material effect on our financial statements. |
| 259 | |
| Item�9B. | Other Information. |
| 261 | |
| Item�10. | Directors, Executive Officers and Corporate Governance. |
| Item�11. | Executive Compensation. |
| Item�12. | Security Ownership of Certain Beneficial Owners and Management and Related Stockholder Matters. |
| Item�13. | Certain Relationships and Related Transactions, and Director Independence. |
| Item�14. | Principal Accounting Fees and Services. |
| | 262 |
| Item�15. | Exhibits, Financial Statement Schedules. |
| � | The consolidated financial statements required to be filed in this Annual Report on Form 10-K are included in Part II, Item�8 hereof. |
| � | An exhibit index has been filed as part of this report beginning on page E-1 and is incorporated herein by reference. |
| 263 | |
| M ORGAN S TANLEY ( REGISTRANT ) | ||
| By: | /s/����J AMES P. G ORMAN | |
| (James P. Gorman) | ||
| Chairman of the Board and Chief Executive Officer | ||
| Signature | Title | |
| / S /����J AMES P. G ORMAN (James P. Gorman) | Chairman of the Board and Chief Executive Officer (Principal Executive Officer) | |
| / S /����J ONATHAN P RUZAN (Jonathan Pruzan) | Executive Vice President and Chief Financial Officer (Principal Financial Officer) | |
| / S /����P AUL C. W IRTH (Paul C. Wirth) | Deputy Chief Financial Officer (Principal Accounting Officer) | |
| / S /����E RSKINE B. B OWLES (Erskine B. Bowles) | Director | |
| / S /����A LISTAIR D ARLING (Alistair Darling) | Director | |
| / S /����T HOMAS H. G LOCER (Thomas H. Glocer) | Director | |
| / S /����R OBERT H. H ERZ (Robert H. Herz) | Director | |
| / S /����N OBUYUKI H IRANO (Nobuyuki Hirano) | Director | |
| / S /����K LAUS K LEINFELD (Klaus Kleinfeld) | Director | |
| S-1 | |
| Signature | Title | |
| / S /����J AMI M ISCIK (Jami Miscik) | Director | |
| / S /����D ONALD T. N ICOLAISEN (Donald T. Nicolaisen) | Director | |
| / S /����H UTHAM S. O LAYAN (Hutham S. Olayan) | Director | |
| / S /����J AMES W. O WENS (James W. Owens) | Director | |
| / S /����R YOSUKE T AMAKOSHI (Ryosuke Tamakoshi) | Director | |
| / S /����P ERRY M. T RAQUINA (Perry M. Traquina) | Director | |
| / S /����L AURA D� ANDREA T YSON (Laura D�Andrea Tyson) | Director | |
| / S /����R AYFORD W ILKINS , J R . (Rayford Wilkins, Jr.) | Director | |
| | S-2 |
Table of Contents Exhibit Index Certain of the following exhibits, as indicated
parenthetically, were previously filed as exhibits to registration statements filed by Morgan Stanley or its predecessor companies under the Securities Act or to reports or registration statements filed by Morgan Stanley or its predecessor companies
under the Exchange Act and are hereby incorporated by reference to such statements or reports. Morgan Stanley�s Exchange Act file number is 1-11758. The Exchange Act file number of Morgan Stanley Group
Inc., a predecessor company (�MSG�), was 1-9085. 1 | Exhibit No. | Description | |
| 2.1 | Integration and Investment Agreement dated as of March 30, 2010 by and between Mitsubishi UFJ Financial Group, Inc. and Morgan Stanley (Exhibit 2.2 to Morgan Stanley�s Quarterly Report on Form 10-Q for the quarter ended June 30, 2011). | |
| 3.1* | Amended and Restated Certificate of Incorporation of Morgan Stanley, as amended to date. | |
| 3.2 | Amended and Restated Bylaws of Morgan Stanley, as amended to date (Exhibit 3.1 to Morgan Stanley�s Current Report on Form 8-K dated October 29, 2015). | |
| 4.1 | Indenture dated as of February 24, 1993 between Morgan Stanley and The Bank of New York, as trustee (Exhibit 4 to Morgan Stanley�s Registration Statement on Form S-3 (No. 33-57202)). | |
| 4.2 | Amended and Restated Senior Indenture dated as of May 1, 1999 between Morgan Stanley and The Bank of New York, as trustee (Exhibit 4-e to Morgan Stanley�s Registration Statement on Form�S-3/A (No. 333-75289) as amended by Fourth Supplemental Senior Indenture dated as of October 8, 2007 (Exhibit 4.3 to Morgan Stanley�s Annual Report on Form 10-K for the fiscal year ended November 30, 2007). | |
| 4.3 | Senior Indenture dated as of November 1, 2004 between Morgan Stanley and The Bank of New York, as trustee (Exhibit 4-f to Morgan Stanley�s Registration Statement on Form S-3/A (No. 333-117752), as amended by First Supplemental Senior Indenture dated as of September 4, 2007 (Exhibit 4.5 to Morgan Stanley�s Annual Report on Form 10-K for the fiscal year ended November 30, 2007), Second Supplemental Senior Indenture dated as of January 4, 2008 (Exhibit 4.1 to Morgan Stanley�s Current Report on Form 8-K dated January 4, 2008), Third Supplemental Senior Indenture dated as of September 10, 2008 (Exhibit 4 to Morgan Stanley�s Quarterly Report on Form 10-Q for the quarter ended August 31, 2008), Fourth Supplemental Senior Indenture dated as of December 1, 2008 (Exhibit 4.1 to Morgan Stanley�s Current Report on Form 8-K dated December 1, 2008), Fifth Supplemental Senior Indenture dated as of April 1, 2009 (Exhibit 4 to Morgan Stanley�s Quarterly Report on Form 10-Q for the quarter ended March 31, 2009), Sixth Supplemental Senior Indenture dated as of September 16, 2011 (Exhibit 4.1 to Morgan Stanley�s Quarterly Report on Form 10-Q for the quarter ended September 30, 2011), Seventh Supplemental Senior Indenture dated as of November 21, 2011 (Exhibit 4.4 to Morgan Stanley�s Annual Report on Form 10-K for the year ended December 31, 2011), Eighth Supplemental Senior Indenture dated as of May 4, 2012 (Exhibit�4.1 to Morgan Stanley�s Quarterly Report on Form 10-Q for the quarter ended June 30, 2012), and Ninth Supplemental Senior Indenture dated as of March 10, 2014 (Exhibit 4.1 to Morgan Stanley�s Quarterly Report on Form 10-Q for the quarter ended March 31, 2014). | |
| 4.4 | The Unit Agreement Without Holders� Obligations, dated as of August 29, 2008, between Morgan Stanley and The Bank of New York Mellon, as Unit Agent, as Trustee and Paying Agent under the Senior Indenture referred to therein and as Warrant Agent under the Warrant Agreement referred to therein (Exhibit 4.1 to Morgan Stanley�s Current Report on Form 8-K dated August 29, 2008). | |
| (1) | For purposes of this Exhibit Index, references to �The Bank of New York� mean in some instances the entity successor to JPMorgan Chase Bank, N.A. or J.P. Morgan Trust Company, National Association; references to �JPMorgan Chase Bank, N.A.� mean the entity formerly known as The Chase Manhattan Bank, in some instances as the successor to Chemical Bank; references to �J.P. Morgan Trust Company, N.A.� mean the entity formerly known as Bank One Trust Company, N.A., as successor to The First National Bank of Chicago. |
| E-1 | |
| Exhibit No. | Description | |
| 4.5 | Amended and Restated Subordinated Indenture dated as of May 1, 1999 between Morgan Stanley and The Bank of New York, as trustee (Exhibit 4-f to Morgan Stanley�s Registration Statement on Form�S-3/A (No. 333-75289)). | |
| 4.6 | Subordinated Indenture dated as of October 1, 2004 between Morgan Stanley and The Bank of New�York, as trustee (Exhibit 4-g to Morgan Stanley�s Registration Statement on Form S-3/A (No.�333-117752)). | |
| 4.7 | Junior Subordinated Indenture dated as of March 1, 1998 between Morgan Stanley and The Bank of New York, as trustee (Exhibit 4.1 to Morgan Stanley�s Quarterly Report on Form 10-Q for the quarter ended February 28, 1998). | |
| 4.8 | Junior Subordinated Indenture dated as of October 1, 2004 between Morgan Stanley and The Bank of New York, as trustee (Exhibit 4-ww to Morgan Stanley�s Registration Statement on Form S-3/A (No.�333-117752)). | |
| 4.9 | Junior Subordinated Indenture dated as of October 12, 2006 between Morgan Stanley and The Bank of New York, as trustee (Exhibit 4.1 to Morgan Stanley�s Current Report on Form 8-K dated October�12, 2006). | |
| 4.10 | Deposit Agreement dated as of July 6, 2006 among Morgan Stanley, JPMorgan Chase Bank, N.A. and the holders from time to time of the depositary receipts described therein (Exhibit 4.3 to Morgan Stanley�s Quarterly Report on Form 10-Q for the quarter ended May 31, 2006). | |
| 4.11 | Form of Deposit Agreement among Morgan Stanley, JPMorgan Chase Bank, N.A. and the holders from time to time of the depositary receipts representing interests in the Series A Preferred Stock described therein (Exhibit 2.4 to Morgan Stanley�s Registration Statement on Form 8-A dated July 5, 2006). | |
| 4.12 | Depositary Receipt for Depositary Shares, representing Floating Rate Non-Cumulative Preferred Stock, Series A (included in Exhibit 4.11 hereto). | |
| 4.13 | Form of Deposit Agreement among Morgan Stanley, The Bank of New York Mellon and the holders from time to time of the depositary receipts representing interests in the Series E Preferred Stock described therein (Exhibit 2.6 to Morgan Stanley�s Registration Statement on Form 8-A dated September 27, 2013). | |
| 4.14 | Depositary Receipt for Depositary Shares, representing Fixed-to-Floating Rate Non-Cumulative Preferred Stock, Series E (included in Exhibit 4.13 hereto). | |
| 4.15 | Form of Deposit Agreement among Morgan Stanley, The Bank of New York Mellon and the holders from time to time of the depositary receipts representing interests in the Series F Preferred stock described therein (Exhibit 2.4 to Morgan Stanley�s Registration Statement on Form 8-A dated December 9, 2013). | |
| 4.16 | Depositary Receipt for Depositary Shares, representing Fixed-to-Floating Rate Non-Cumulative Preferred Stock, Series F (included in Exhibit 4.15 hereto). | |
| 4.17 | Form of Deposit Agreement among Morgan Stanley, The Bank of New York Mellon and the holders from time to time of the depositary receipts representing interests in the Series G Preferred stock described therein (Exhibit 2.4 to Morgan Stanley�s Registration Statement on Form 8-A dated April�28, 2014). | |
| 4.18 | Depositary Receipt for Depositary Shares, representing 6.625% Non-Cumulative Preferred Stock, Series G (included in Exhibit 4.17 hereto). | |
| 4.19 | Form of Deposit Agreement among Morgan Stanley, The Bank of New York Mellon and the holders from time to time of the depositary receipts representing interests in the Series H Preferred stock described therein (Exhibit 4.6 to Morgan Stanley�s Current Report on Form 8-K dated April 29, 2014). | |
| | E-2 |
| Exhibit No. | Description | |
| 4.20 | Depositary Receipt for Depositary Shares, representing Fixed-to-Floating Rate Non-Cumulative Preferred Stock, Series H (included in Exhibit 4.19 hereto). | |
| 4.21 | Form of Deposit Agreement among Morgan Stanley, The Bank of New York Mellon and the holders from time to time of the depositary receipts representing interests in the Series I Preferred stock described therein (Exhibit 2.4 to Morgan Stanley�s Registration Statement on Form 8-A dated September 17, 2014). | |
| 4.22 | Depositary Receipt for Depositary Shares, representing Fixed-to-Floating Rate Non-Cumulative Preferred Stock, Series I (included in Exhibit 4.21 hereto). | |
| 4.23 | Form of Deposit Agreement among Morgan Stanley, The Bank of New York Mellon and the holders from time to time of the depositary receipts representing interests in the Series J Preferred Stock described therein (Exhibit 4.3 to Morgan Stanley�s Current Report on Form 8-K dated March 18, 2015). | |
| 4.24 | Depositary Receipt for Depositary Shares, representing Fixed-to-Floating Rate Non-Cumulative Preferred Stock, Series J (included in Exhibit 4.23 hereto). | |
| 4.25 | Amended and Restated Trust Agreement of Morgan Stanley Capital Trust III dated as of February 27, 2003 among Morgan Stanley, as depositor, The Bank of New York, as property trustee, The Bank of New York (Delaware), as Delaware trustee, and the administrators named therein (Exhibit 4 to Morgan Stanley�s Quarterly Report on Form 10-Q for the quarter ended February 28, 2003). | |
| 4.26 | Amended and Restated Trust Agreement of Morgan Stanley Capital Trust IV dated as of April 21, 2003 among Morgan Stanley, as depositor, The Bank of New York, as property trustee, The Bank of New York (Delaware), as Delaware Trustee and the administrators named therein (Exhibit 4 to Morgan Stanley�s Quarterly Report on Form 10-Q for the quarter ended May 31, 2003). | |
| 4.27 | Amended and Restated Trust Agreement of Morgan Stanley Capital Trust V dated as of July 16, 2003 among Morgan Stanley, as depositor, The Bank of New York, as property trustee, The Bank of New York (Delaware), as Delaware trustee and the administrators named therein (Exhibit 4 to Morgan Stanley�s Quarterly Report on Form 10-Q for the quarter ended August 31, 2003). | |
| 4.28 | Amended and Restated Trust Agreement of Morgan Stanley Capital Trust VIII dated as of April 26, 2007 among Morgan Stanley, as depositor, The Bank of New York, as property trustee, The Bank of New York (Delaware), as Delaware trustee and the administrators named therein (Exhibit 4.3 to Morgan Stanley�s Current Report on Form 8-K dated April 26, 2007). | |
| 4.29 | Instruments defining the Rights of Security Holders, Including Indentures�Except as set forth in Exhibits 4.1 through 4.18 above, the instruments defining the rights of holders of long-term debt securities of Morgan Stanley and its subsidiaries are omitted pursuant to Section (b)(4)(iii) of Item 601 of Regulation S-K. Morgan Stanley hereby agrees to furnish copies of these instruments to the SEC upon request. | |
| 10.1 | Amended and Restated Trust Agreement dated as of October 18, 2011 by and between Morgan Stanley and State Street Bank and Trust Company (Exhibit 10.1 to Morgan Stanley�s Annual Report on Form 10-K for the year ended December 31, 2011). | |
| 10.2 | Transaction Agreement dated as of April 21, 2011 between Morgan Stanley and Mitsubishi UFJ Financial Group, Inc. (Exhibit 10.1 to Morgan Stanley�s Current Report on Form 8-K dated April 21, 2011). | |
| 10.3 | Amended and Restated Investor Agreement dated as of June 30, 2011 by and between Morgan Stanley and Mitsubishi UFJ Financial Group, Inc. (Exhibit 10.1 to Morgan Stanley�s Current Report on Form 8-K dated June�30, 2011), as amended by Third Amendment, dated October 3, 2013 (Exhibit�10.1 to Morgan Stanley�s Quarterly Report on Form 10-Q for the quarter ended September�30, 2013). | |
| E-3 | |
| Exhibit No. | Description | |
| 10.4� | Morgan Stanley 401(k) Plan, amended and restated as of January 1, 2013 (Exhibit 10.6 to Morgan Stanley Annual Report on Form 10-K for the year ended December 31, 2012), as amended by Amendment (Exhibit 10.5 to Morgan Stanley�s Annual Report on Form 10-K for the year ended December 31, 2013), Amendment (Exhibit 10.6 to Morgan Stanley�s Annual Report on Form 10-K for the year ended December 31, 2013) and Amendment (Exhibit 10.5 to Morgan Stanley�s Annual Report on Form 10-K for the year ended December 31, 2014). | |
| 10.5�* | Amendment to Morgan Stanley 401(k) Plan, dated as of December 22, 2015. | |
| 10.6� | Tax Deferred Equity Participation Plan as amended and restated as of November 26, 2007 (Exhibit�10.9 to Morgan Stanley�s Annual Report on Form 10-K for the fiscal year ended November�30, 2007). | |
| 10.7� | Directors� Equity Capital Accumulation Plan as amended and restated as of March 22, 2012 (Exhibit�10.2 to Morgan Stanley�s Current Report on Form 8-K dated May 15, 2012). | |
| 10.8� | Employees� Equity Accumulation Plan as amended and restated as of November 26, 2007 (Exhibit�10.12 to Morgan Stanley�s Annual Report on Form 10-K for the fiscal year ended November�30, 2007). | |
| 10.9� | Employee Stock Purchase Plan as amended and restated as of February 1, 2009 (Exhibit 10.20 to Morgan Stanley�s Annual Report on Form 10-K for the fiscal year ended November 30, 2008). | |
| 10.10� | Morgan Stanley Supplemental Executive Retirement and Excess Plan, amended and restated effective December 31, 2008 (Exhibit 10.2 to Morgan Stanley�s Quarterly Report on Form 10-Q for the quarter ended March 31, 2009) as amended by Amendment (Exhibit 10.5 to Morgan Stanley�s Quarterly Report on Form 10-Q for the quarter ended June 30, 2009), Amendment (Exhibit 10.19 to Morgan Stanley�s Annual Report on Form 10-K for the year ended December 31, 2010), Amendment (Exhibit 10.3 to Morgan Stanley�s Quarterly Report on Form 10-Q for the quarter ended June 30, 2011) and Amendment (Exhibit 10.1 to Morgan Stanley�s Quarterly Report on Form 10-Q for the quarter ended September 30, 2014). | |
| 10.11� | 1995 Equity Incentive Compensation Plan (Annex A to MSG�s Proxy Statement for its 1996 Annual Meeting of Stockholders) as amended by Amendment (Exhibit 10.39 to Morgan Stanley�s Annual Report on Form 10-K for the fiscal year ended November 30, 2000), Amendment (Exhibit 10.5 to Morgan Stanley�s Quarterly Report on Form 10-Q for the quarter ended August 31, 2005), Amendment (Exhibit 10.3 to Morgan Stanley�s Quarterly Report on Form 10-Q for the quarter ended February 28, 2006), Amendment (Exhibit 10.24 to Morgan Stanley�s Annual Report on Form 10-K for the fiscal year ended November 30, 2006) and Amendment (Exhibit 10.22 to Morgan Stanley�s Annual Report on Form 10-K for the fiscal year ended November 30, 2007). | |
| 10.12� | Form of Management Committee Equity Award Certificate for Discretionary Retention Award of Stock Units and Stock Options (Exhibit 10.30 to Morgan Stanley�s Annual Report on Form 10-K for the fiscal year ended November 30, 2006). | |
| 10.13� | Form of Deferred Compensation Agreement under the Pre-Tax Incentive Program 2 (Exhibit 10.12 to MSG�s Annual Report for the fiscal year ended November 30, 1996). | |
| 10.14� | Key Employee Private Equity Recognition Plan (Exhibit 10.43 to Morgan Stanley�s Annual Report on Form 10-K for the fiscal year ended November 30, 2000). | |
| 10.15� | Morgan Stanley Financial Advisor and Investment Representative Compensation Plan as amended and restated as of November 26, 2007 (Exhibit 10.34 to Morgan Stanley�s Annual Report on Form�10-K for the fiscal year ended November 30, 2007). | |
| 10.16� | Morgan Stanley UK Share Ownership Plan (Exhibit 4.1 to Morgan Stanley�s Registration Statement on Form S-8 (No. 333-146954)). | |
| | E-4 |
| Exhibit No. | Description | |||
| 10.17� | Supplementary Deed of Participation for the Morgan Stanley UK Share Ownership Plan, dated as of November 5, 2009 (Exhibit 10.36 to Morgan Stanley�s Annual Report on Form 10-K for the year ended December 31, 2009). | |||
| 10.18� | Aircraft Time Sharing Agreement, dated as of January 1, 2010, by and between Corporate Services Support Corp. and James P. Gorman (Exhibit 10.1 to Morgan Stanley�s Quarterly Report on Form�10-Q for the quarter ended March 31, 2010). | |||
| 10.19� | Agreement between Morgan Stanley and James P. Gorman, dated August 16, 2005, and amendment dated December 17, 2008 (Exhibit 10.2 to Morgan Stanley�s Quarterly Report on Form 10-Q for the quarter ended March 31, 2010), as amended by Amendment (Exhibit 10.25 to Morgan Stanley�s Annual Report on Form�10-K for the year ended December 31, 2013). | |||
| 10.20� | Form of Restrictive Covenant Agreement (Exhibit 10 to Morgan Stanley�s Current Report on Form�8-K dated November 22, 2005). | |||
| 10.21� | Morgan Stanley Performance Formula and Provisions (Exhibit 10.2 to Morgan Stanley�s Current Report on Form 8-K dated May 14, 2013). | |||
| 10.22� | 2007 Equity Incentive Compensation Plan, as amended and restated as of March 26, 2015 (Exhibit�10.1 to Morgan Stanley�s Current Report on Form 8-K dated May 19, 2015). | |||
| 10.23� | Morgan Stanley 2006 Notional Leveraged Co-Investment Plan, as amended and restated as of November 28, 2008 (Exhibit 10.47 to Morgan Stanley�s Annual Report on Form 10-K for the fiscal year ended November�30, 2008). | |||
| 10.24� | Form of Award Certificate under the 2006 Notional Leveraged Co-Investment Plan (Exhibit 10.7 to Morgan Stanley�s Quarterly Report on Form 10-Q for the quarter ended February 29, 2008). | |||
| 10.25� | Morgan Stanley 2007 Notional Leveraged Co-Investment Plan, amended as of June 4, 2009 (Exhibit�10.6 to Morgan Stanley�s Quarterly Report on Form 10-Q for the quarter ended June 30, 2009). | |||
| 10.26� | Form of Award Certificate under the 2007 Notional Leveraged Co-Investment Plan for Certain Management Committee Members (Exhibit 10.8 to Morgan Stanley�s Quarterly Report on Form�10-Q for the quarter ended February 29, 2008). | |||
| 10.27� | Morgan Stanley Compensation Incentive Plan (Exhibit 10.54 to Morgan Stanley�s Annual Report on Form 10-K for the fiscal year ended November 30, 2008). | |||
| 10.28� | Morgan Stanley 2009 Replacement Equity Incentive Compensation Plan for Morgan Stanley Smith Barney Employees (Exhibit 4.2 to Morgan Stanley�s Registration Statement on Form S-8 (No.�333-159504)). | |||
| 10.29� | Form of Award Certificate for Special Discretionary Retention Awards of Stock Options (Exhibit�10.4 to Morgan Stanley�s Quarterly Report on Form 10-Q for the quarter ended March 31, 2011). | |||
| 10.30� | Morgan Stanley Schedule of Non-Employee Directors Annual Compensation, effective as of August�1, 2014 (Exhibit 10.2 to Morgan Stanley�s Quarterly Report on Form 10-Q for the quarter ended September 30, 2014). | |||
| 10.31� | Memorandum to Colm Kelleher Regarding Repatriation to London (Exhibit 10.4 to Morgan Stanley�s Quarterly Report on Form 10-Q for the quarter ended March 31, 2012). | |||
| 10.32� | Morgan Stanley U.S. Tax Equalization Program (Exhibit 10.5 to Morgan Stanley�s Quarterly Report on Form 10-Q for the quarter ended March 31, 2012). | |||
| E-5 | |
| Exhibit No. | Description | |||
| 10.33� | Morgan Stanley UK Limited Alternative Retirement Plan, dated as of October 8, 2009 (Exhibit 10.2 to Morgan Stanley�s Quarterly Report on Form 10-Q for the quarter ended March 31, 2013). | |||
| 10.34� | Form of Award Certificate for Discretionary Retention Awards of Stock Options (Exhibit 10.5 to Morgan Stanley�s Quarterly Report on Form 10-Q for the quarter ended March 31, 2013). | |||
| 10.35� | Form of Award Certificate for Long-Term Incentive Program Awards (Exhibit 10.6 to Morgan Stanley�s Quarterly Report on Form 10-Q for the quarter ended March 31, 2013). | |||
| 10.36� | Agreement between Morgan Stanley and Colm Kelleher, dated January 5, 2015 (Exhibit 10.1 to Morgan Stanley�s Quarterly Report on Form 10-Q for the quarter ended March 31, 2015). | |||
| 10.37� | Description of Operating Committee Medical Coverage (Exhibit 10.2 to Morgan Stanley�s Quarterly Report on Form 10-Q for the quarter ended March 31, 2015). | |||
| 10.38� | * | Form of Award Certificate for Discretionary Retention Awards of Stock Units. | ||
| 10.39� | * | Form of Award Certificate for Discretionary Retention Awards under the Morgan Stanley Compensation Incentive Plan. | ||
| 10.40� | * | Form of Award Certificate for Long-Term Incentive Program Awards. | ||
| 10.41� | * | Agreement between Morgan Stanley and Gregory J. Fleming, dated January�22, 2016. | ||
| 12 | * | Statement Re: Computation of Ratio of Earnings to Fixed Charges and Computation of Ratio of Earnings to Fixed Charges and Preferred Stock Dividends. | ||
| 21 | * | Subsidiaries of Morgan Stanley. | ||
| 23.1 | * | Consent of Deloitte & Touche LLP. | ||
| 24 | Powers of Attorney (included on signature page). | |||
| 31.1 | * | Rule 13a-14(a) Certification of Chief Executive Officer. | ||
| 31.2 | * | Rule 13a-14(a) Certification of Chief Financial Officer. | ||
| 32.1 | ** | Section 1350 Certification of Chief Executive Officer. | ||
| 32.2 | ** | Section 1350 Certification of Chief Financial Officer. | ||
| 101 | Interactive data files pursuant to Rule 405 of Regulation S-T: (i) the Consolidated Statements of Income�Twelve Months Ended December 31, 2015, December 31, 2014 and December 31, 2013, (ii) the Consolidated Statements of Comprehensive Income�Twelve Months Ended December 31, 2015, December 31, 2014 and December 31, 2013, (iii) the Consolidated Statements of Financial Condition�December 31, 2015 and December 31, 2014, (iv) the Consolidated Statements of Changes in Total Equity�Twelve Months Ended December 31, 2015, December 31, 2014 and December 31, 2013, (v) the Consolidated Statements of Cash Flows�Twelve Months Ended December 31, 2015, December 31, 2014 and December 31, 2013, and (vi) Notes to Consolidated Financial Statements. | |||
| * | Filed herewith. |
| ** | Furnished herewith. |
| � | Management contract or compensatory plan or arrangement required to be filed as an exhibit to this Form�10-K pursuant to Item�15(b). |
| | E-6 |