 (Exact name of Registrant
as specified in its charter)
(Exact name of Registrant
as specified in its charter) | Delaware (State or other jurisdiction of incorporation�or�organization) | 1585 Broadway New�York,�NY�10036 (Address�of�principal�executive�offices, including zip code) | 36-3145972 (I.R.S.�Employer�Identification�No.) | (212) 761-4000 (Registrant�s�telephone�number, including area code) | |||
| Title of each class | Name of exchange on which registered | |
| Securities registered pursuant to Section�12(b) of the Act: | ||
| Common Stock, $0.01 par value | New�York�Stock�Exchange | |
| Depositary Shares, each representing 1/1,000th interest in a share of Floating Rate Non-Cumulative Preferred Stock, Series�A, $0.01�par value | New York Stock Exchange | |
| Depositary Shares, each representing 1/1,000th interest in a share of Fixed-to-Floating Rate Non-Cumulative Preferred Stock, Series�E, $0.01�par value | New York Stock Exchange | |
| Depositary Shares, each representing 1/1,000th interest in a share of Fixed-to-Floating Rate Non-Cumulative Preferred Stock, Series�F, $0.01�par value | New York Stock Exchange | |
| Depositary Shares, each representing 1/1,000th interest in a share of 6.625% Non-Cumulative Preferred Stock, Series�G, $0.01�par value | New York Stock Exchange | |
| Depositary Shares, each representing 1/1,000th interest in a share of Fixed-to-Floating Rate Non-Cumulative Preferred Stock, Series�I, $0.01�par value | New York Stock Exchange | |
| 6 1 / 4 % Capital Securities of Morgan Stanley Capital Trust III (and Registrant�s guaranty with respect thereto) | New York Stock Exchange | |
| 6 1 / 4 % Capital Securities of Morgan Stanley Capital Trust IV (and Registrant�s guaranty with respect thereto) | New York Stock Exchange | |
| 5 3 / 4 % Capital Securities of Morgan Stanley Capital Trust V (and Registrant�s guaranty with respect thereto) | New York Stock Exchange | |
| 6.60% Capital Securities of Morgan Stanley Capital Trust VI (and Registrant�s guaranty with respect thereto) | New York Stock Exchange | |
| 6.60% Capital Securities of Morgan Stanley Capital Trust VII (and Registrant�s guaranty with respect thereto) | New York Stock Exchange | |
| 6.45% Capital Securities of Morgan Stanley Capital Trust VIII (and Registrant�s guaranty with respect thereto) | New York Stock Exchange | |
| Market Vectors ETNs due March�31, 2020 (2 issuances); Market Vectors ETNs due April�30, 2020 (2 issuances) | NYSE Arca, Inc. | |
| Morgan Stanley Cushing � MLP High Income Index ETNs due March�21, 2031 | NYSE Arca, Inc. |
| Large Accelerated Filer x Non-Accelerated�Filer � (Do not check if a smaller reporting company) | Accelerated�Filer � Smaller reporting company � |
ANNUAL REPORT ON FORM 10-K for the year ended December�31, 2014 | Table�of�Contents | Page | |||||
| Part I | ||||||
| Item�1. | Business | 1 | ||||
| Overview | 1 | |||||
| Available Information | 1 | |||||
| Business Segments | 2 | |||||
| Institutional Securities | 2 | |||||
| Wealth Management | 4 | |||||
| Investment Management | 5 | |||||
| Competition | 6 | |||||
| Supervision and Regulation | 7 | |||||
| Executive Officers of Morgan Stanley | 22 | |||||
| Item�1A. | Risk Factors | 24 | ||||
| Item 1B. | Unresolved Staff Comments | 35 | ||||
| Item 2. | Properties | 36 | ||||
| Item 3. | Legal Proceedings | 37 | ||||
| Item 4. | Mine Safety Disclosures | 49 | ||||
| Part II | ||||||
| Item 5. | Market for Registrant�s Common Equity, Related Stockholder Matters and Issuer Purchases of Equity Securities | 50 | ||||
| Item 6. | Selected Financial Data | 53 | ||||
| Item 7. | Management�s Discussion and Analysis of Financial Condition and Results of Operations | 55 | ||||
| Introduction | 55 | |||||
| Executive Summary | 57 | |||||
| Business Segments | 64 | |||||
| Accounting Developments Updates | 85 | |||||
| Other Matters | 87 | |||||
| Critical Accounting Policies | 92 | |||||
| Liquidity and Capital Resources | 96 | |||||
| Item�7A. | Quantitative and Qualitative Disclosures about Market Risk | 123 | ||||
| Item 8. | Financial Statements and Supplementary Data | 151 | ||||
| Report of Independent Registered Public Accounting Firm | 151 | |||||
| Consolidated Statements of Financial Condition | 152 | |||||
| Consolidated Statements of Income | 153 | |||||
| Consolidated Statements of Comprehensive Income | 154 | |||||
| Consolidated Statements of Cash Flows | 155 | |||||
 Table of Contents
| Table�of�Contents | Page | |||||
| Consolidated Statements of Changes in Total Equity | 156 | |||||
| Notes to Consolidated Financial Statements | 157 | |||||
| Financial Data Supplement (Unaudited) | 301 | |||||
| Item 9. | Changes in and Disagreements with Accountants on Accounting and Financial Disclosure | 309 | ||||
| Item�9A. | Controls and Procedures | 309 | ||||
| Item�9B. | Other Information | 311 | ||||
| Part�III | ||||||
| Item 10. | Directors, Executive Officers and Corporate Governance | 312 | ||||
| Item 11. | Executive Compensation | 312 | ||||
| Item 12. | Security Ownership of Certain Beneficial Owners and Management and Related Stockholder Matters | 313 | ||||
| Item 13. | Certain Relationships and Related Transactions, and Director Independence | 313 | ||||
| Item 14. | Principal Accountant Fees and Services | 313 | ||||
| Part�IV | ||||||
| Item�15. | Exhibits and Financial Statement Schedules | 314 | ||||
| Signatures | S-1 | |||||
| Exhibit Index | E-1 | |||||
Table of Contents Forward-Looking Statements We have included in or incorporated by reference into this report, and from time to time may make in our public filings, press
releases or other public statements, certain statements, including (without limitation) those under �Legal Proceedings� in Part I, Item�3, �Management�s Discussion and Analysis of Financial Condition and Results of
Operations� in Part II, Item�7 and �Quantitative and Qualitative Disclosures about Market Risk� in Part II, Item�7A, that may constitute �forward-looking statements� within the meaning of the safe harbor provisions
of the Private Securities Litigation Reform Act of 1995. In addition, our management may make forward-looking statements to analysts, investors, representatives of the media and others. These forward-looking statements are not historical facts and
represent only our beliefs regarding future events, many of which, by their nature, are inherently uncertain and beyond our control. The nature of our business makes predicting the future trends of our revenues, expenses and net income difficult. The risks and uncertainties involved in
our businesses could affect the matters referred to in such statements, and it is possible that our actual results may differ, possibly materially, from the anticipated results indicated in these forward-looking statements. Important factors that
could cause actual results to differ from those in the forward-looking statements include (without limitation): | � | the effect of economic and political conditions and geopolitical events; |
| � | the effect of market conditions, particularly in the global equity, fixed income, credit and commodities markets, including corporate and mortgage (commercial and residential) lending and commercial real estate and energy markets; |
| � | the impact of current, pending and future legislation (including the Dodd-Frank Wall Street Reform and Consumer Protection Act (the �Dodd-Frank Act�)), regulation (including capital, leverage and liquidity requirements), policies (including fiscal and monetary) and legal and regulatory actions in the United�States of America (�U.S.�) and worldwide; |
| � | the level and volatility of equity, fixed income and commodity prices (including oil prices), interest rates, currency values and other market indices; |
| � | the availability and cost of both credit and capital as well as the credit ratings assigned to our unsecured short-term and long-term debt; |
| � | investor, consumer and business sentiment and confidence in the financial markets; |
| � | the performance of our acquisitions, divestitures, joint ventures, strategic alliances or other strategic arrangements; |
| � | our reputation and the general perception of the financial services industry; |
| � | inflation, natural disasters, pandemics and acts of war or terrorism; |
| � | the actions and initiatives of current and potential competitors as well as governments, regulators and self-regulatory organizations; |
| � | the effectiveness of our risk management policies; |
| � | technological changes and risks and cybersecurity risks (including cyber attacks and business continuity risks); and |
| � | other risks and uncertainties detailed under �Business�Competition� and �Business�Supervision and Regulation� in Part I, Item�1, �Risk Factors� in Part I, Item�1A and elsewhere throughout this report. |
Table of Contents Part I | Item�1. | Business. |
| 1 | |
| | 2 |
| 3 | |
| | 4 |
| 5 | |
| | 6 |
| 7 | |
| | 8 |
| 9 | |
| | 10 |
| 11 | |
| | 12 |
| 13 | |
| | 14 |
| 15 | |
| | 16 |
| 17 | |
| | 18 |
| 19 | |
| | 20 |
| 21 | |
| | 22 |
| 23 | |
| | 24 |
| 25 | |
| | 26 |
| 27 | |
| | 28 |
| 29 | |
| | 30 |
| 31 | |
| | 32 |
| 33 | |
| | 34 |
| 35 | |
| Location | Owned/ Leased | Lease�Expiration | Approximate�Square�Footage as of December�31, 2014(A) | |||||||
| U.S. Locations | ||||||||||
| 1585 Broadway New York, New York (Global Headquarters and Institutional Securities Headquarters) | Owned | N/A | 1,332,700�square�feet | |||||||
| 2000 Westchester Avenue Purchase, New York (Wealth Management Headquarters) | Owned | N/A | 597,400�square�feet | |||||||
| 522 Fifth Avenue New York, New York (Investment Management Headquarters) | Owned | N/A | 571,800�square�feet | |||||||
| New York, New York (Several locations) | Leased | 2015���2029 | 2,346,000�square�feet | |||||||
| Brooklyn, New York (Several locations) | Leased | 2016 � 2023 | 344,100�square�feet | |||||||
| 655 Howard Avenue Somerset, New Jersey (Data Center) | Owned | N/A | 369,600�square�feet | |||||||
| International Locations | ||||||||||
| 20 Bank Street London (London Headquarters) | Leased | 2038 | 546,500�square�feet | |||||||
| 25 Cabot Square Canary Wharf London | Leased | 2020 | 454,600�square�feet | |||||||
| 1 Austin Road West Kowloon (Hong Kong Headquarters) | Leased | 2019 | 499,900�square�feet | |||||||
| Otemachi Financial City South Tower Otemachi, Chiyoda-ku (Tokyo Headquarters) | Leased | 2023 | 246,700�square feet | |||||||
| (A) | The indicated total aggregate square footage leased does not include space occupied by Morgan Stanley branch offices. |
| | 36 |
| Item�3. | Legal Proceedings. |
| 37 | |
| | 38 |
| 39 | |
| | 40 |
| 41 | |
| | 42 |
| 43 | |
| | 44 |
| 45 | |
| | 46 |
| 47 | |
| | 48 |
| 49 | |
| Item�5. | Market for Registrant�s Common Equity, Related Stockholder Matters and Issuer Purchases of Equity Securities. |
| Low Sale�Price | High Sale�Price | Dividends | ||||||||||
| 2014: | ||||||||||||
| Fourth Quarter | $ | 31.35 | $ | 39.19 | $ | 0.10 | ||||||
| Third Quarter | $ | 31.12 | $ | 36.44 | $ | 0.10 | ||||||
| Second Quarter | $ | 28.31 | $ | 32.82 | $ | 0.10 | ||||||
| First Quarter | $ | 28.78 | $ | 33.52 | $ | 0.05 | ||||||
| 2013: | ||||||||||||
| Fourth Quarter | $ | 26.41 | $ | 31.85 | $ | 0.05 | ||||||
| Third Quarter | $ | 23.83 | $ | 29.50 | $ | 0.05 | ||||||
| Second Quarter | $ | 20.16 | $ | 27.17 | $ | 0.05 | ||||||
| First Quarter | $ | 19.32 | $ | 24.47 | $ | 0.05 | ||||||
| | 50 |
| Period | Total Number of Shares Purchased | Average Price Paid�Per Share | Total Number�of Shares Purchased As�Part�of�Publicly Announced Plans or Programs(C) | Approximate�Dollar Value of Shares that May Yet Be Purchased Under the Plans�or Programs | ||||||||||||
| Month�#1�(October 1, 2014�October 31, 2014) | ||||||||||||||||
| Share Repurchase Program(A) | 1,372,885 | $ | 33.87 | 1,372,885 | $ | 534 | ||||||||||
| Employee Transactions(B) | 83,415 | $ | 34.12 | � | � | |||||||||||
| Month #2 (November 1, 2014�November 30, 2014) | ||||||||||||||||
| Share Repurchase Program(A) | 2,563,394 | $ | 35.32 | 2,563,394 | $ | 443 | ||||||||||
| Employee Transactions(B) | 71,601 | $ | 35.50 | � | � | |||||||||||
| Month #3 (December 1, 2014�December 31, 2014) | ||||||||||||||||
| Share Repurchase Program(A) | 3,628,350 | $ | 36.69 | 3,628,350 | $ | 310 | ||||||||||
| Employee Transactions(B) | 254,550 | $ | 35.87 | � | � | |||||||||||
| Total | ||||||||||||||||
| Share Repurchase Program(A) | 7,564,629 | $ | 35.71 | 7,564,629 | $ | 310 | ||||||||||
| Employee Transactions(B) | 409,566 | $ | 35.45 | � | � | |||||||||||
| (A) | The Company�s Board of Directors has authorized the repurchase of the Company�s outstanding stock under a share repurchase program (the �Share Repurchase Program�). The Share Repurchase Program is a program for capital management purposes that considers, among other things, business segment capital needs, as well as equity-based compensation and benefit plan requirements. The Share Repurchase Program has no set expiration or termination date. Share repurchases by the Company are subject to regulatory approval. In March 2014, the Company received no objection from the Federal Reserve to repurchase up to $1 billion of the Company�s outstanding common stock beginning in the second quarter of 2014 through the end of the first quarter of 2015 under the Company�s 2014 capital plan. During the quarter ended December�31, 2014, the Company repurchased approximately $271 million of the Company�s outstanding common stock as part of its Share Repurchase Program. For further information, see �Management�s Discussion and Analysis of Financial Condition and Results of Operations�Liquidity and Capital Resources�Capital Management� in Part II, Item�7. |
| (B) | Includes: (1)�shares delivered or attested in satisfaction of the exercise price and/or tax withholding obligations by holders of employee and director stock options (granted under employee and director stock compensation plans) who exercised options; (2)�shares withheld, delivered or attested (under the terms of grants under employee and director stock compensation plans) to offset tax withholding obligations that occur upon vesting and release of restricted shares; (3)�shares withheld, delivered and attested (under the terms of grants under employee and director stock compensation plans) to offset tax withholding obligations that occur upon the delivery of outstanding shares underlying restricted stock units; and (4)�shares withheld, delivered and attested (under the terms of grants under employee and director stock compensation plans) to offset the cash payment for fractional shares. The Company�s employee and director stock compensation plans provide that the value of the shares withheld, delivered or attested, shall be valued using the fair market value of the Company�s common stock on the date the relevant transaction occurs, using a valuation methodology established by the Company. |
| (C) | Share purchases under publicly announced programs are made pursuant to open-market purchases, Rule 10b5-1 plans or privately negotiated transactions (including with employee benefit plans) as market conditions warrant and at prices the Company deems appropriate and may be suspended at any time. |
| 51 | |
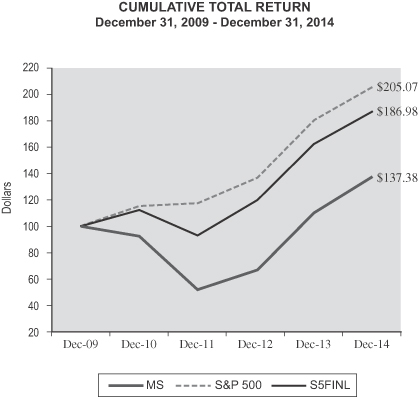
| MS | S&P 500 | S5FINL | ||||||||||
| 12/31/2009 | $ | 100.00 | $ | 100.00 | $ | 100.00 | ||||||
| 12/31/2010 | $ | 92.60 | $ | 115.06 | $ | 112.12 | ||||||
| 12/31/2011 | $ | 51.93 | $ | 117.48 | $ | 93.00 | ||||||
| 12/30/2012 | $ | 66.43 | $ | 136.27 | $ | 119.73 | ||||||
| 12/31/2013 | $ | 109.83 | $ | 180.83 | $ | 162.34 | ||||||
| 12/31/2014 | $ | 137.38 | $ | 205.07 | $ | 186.98 | ||||||
| | 52 |
| Item�6. | Selected Financial Data. |
| 2014 | 2013 | 2012 | 2011 | 2010 | ||||||||||||||||
| Income Statement Data: | ||||||||||||||||||||
| Revenues: | ||||||||||||||||||||
| Total non-interest revenues | $ | 32,540 | $ | 31,715 | $ | 26,383 | $ | 31,953 | $ | 30,407 | ||||||||||
| Interest income | 5,413 | 5,209 | 5,692 | 7,234 | 7,288 | |||||||||||||||
| Interest expense | 3,678 | 4,431 | 5,897 | 6,883 | 6,394 | |||||||||||||||
| Net interest | 1,735 | 778 | (205 | ) | 351 | 894 | ||||||||||||||
| Net revenues | 34,275 | 32,493 | 26,178 | 32,304 | 31,301 | |||||||||||||||
| Non-interest expenses: | ||||||||||||||||||||
| Compensation and benefits | 17,824 | 16,277 | 15,615 | 16,325 | 15,860 | |||||||||||||||
| Other | 12,860 | 11,658 | 9,967 | 9,792 | 9,154 | |||||||||||||||
| Total non-interest expenses | 30,684 | 27,935 | 25,582 | 26,117 | 25,014 | |||||||||||||||
| Income from continuing operations before income taxes | 3,591 | 4,558 | 596 | 6,187 | 6,287 | |||||||||||||||
| Provision for (benefit from) income taxes | (90 | ) | 902 | (161 | ) | 1,491 | 823 | |||||||||||||
| Income from continuing operations | 3,681 | 3,656 | 757 | 4,696 | 5,464 | |||||||||||||||
| Discontinued operations(1): | ||||||||||||||||||||
| Income (loss) from discontinued operations before income taxes | (19 | ) | (72 | ) | (48 | ) | (170 | ) | 600 | |||||||||||
| Provision for (benefit from) income taxes | (5 | ) | (29 | ) | (7 | ) | (119 | ) | 362 | |||||||||||
| Income (loss) from discontinued operations | (14 | ) | (43 | ) | (41 | ) | (51 | ) | 238 | |||||||||||
| Net income | 3,667 | 3,613 | 716 | 4,645 | 5,702 | |||||||||||||||
| Net income applicable to redeemable noncontrolling interests(2) | � | 222 | 124 | � | � | |||||||||||||||
| Net income applicable to nonredeemable noncontrolling interests(2) | 200 | 459 | 524 | 535 | 999 | |||||||||||||||
| Net income applicable to Morgan Stanley | $ | 3,467 | $ | 2,932 | $ | 68 | $ | 4,110 | $ | 4,703 | ||||||||||
| Preferred stock dividends and other | 315 | 277 | 98 | 2,043 | 1,109 | |||||||||||||||
| Earnings (loss) applicable to Morgan Stanley common shareholders(3) | $ | 3,152 | $ | 2,655 | $ | (30 | ) | $ | 2,067 | $ | 3,594 | |||||||||
| Amounts applicable to Morgan Stanley: | ||||||||||||||||||||
| Income from continuing operations | $ | 3,481 | $ | 2,975 | $ | 138 | $ | 4,168 | $ | 4,478 | ||||||||||
| Income (loss) from discontinued operations | (14 | ) | (43 | ) | (70 | ) | (58 | ) | 225 | |||||||||||
| Net income applicable to Morgan Stanley | $ | 3,467 | $ | 2,932 | $ | 68 | $ | 4,110 | $ | 4,703 | ||||||||||
| 53 | |
| 2014 | 2013 | 2012 | 2011 | 2010 | ||||||||||||||||
| Per Share Data: | ||||||||||||||||||||
| Earnings (loss) per basic common share(4): | ||||||||||||||||||||
| Income from continuing operations | $ | 1.65 | $ | 1.42 | $ | 0.02 | $ | 1.28 | $ | 2.49 | ||||||||||
| Income (loss) from discontinued operations | (0.01 | ) | (0.03 | ) | (0.04 | ) | (0.03 | ) | 0.15 | |||||||||||
| Earnings (loss) per basic common share | $ | 1.64 | $ | 1.39 | $ | (0.02 | ) | $ | 1.25 | $ | 2.64 | |||||||||
| Earnings (loss) per diluted common share(4): | ||||||||||||||||||||
| Income from continuing operations | $ | 1.61 | $ | 1.38 | $ | 0.02 | $ | 1.27 | $ | 2.45 | ||||||||||
| Income (loss) from discontinued operations | (0.01 | ) | (0.02 | ) | (0.04 | ) | (0.04 | ) | 0.18 | |||||||||||
| Earnings (loss) per diluted common share | $ | 1.60 | $ | 1.36 | $ | (0.02 | ) | $ | 1.23 | $ | 2.63 | |||||||||
| Book value per common share(5) | $ | 33.25 | $ | 32.24 | $ | 30.70 | $ | 31.42 | $ | 31.49 | ||||||||||
| Dividends declared per common share | 0.35 | 0.20 | 0.20 | 0.20 | 0.20 | |||||||||||||||
| Average common shares outstanding(3): | ||||||||||||||||||||
| Basic | 1,923,805,397 | 1,905,823,882 | 1,885,774,276 | 1,654,708,640 | 1,361,670,938 | |||||||||||||||
| Diluted | 1,970,535,560 | 1,956,519,738 | 1,918,811,270 | 1,675,271,669 | 1,411,268,971 | |||||||||||||||
| Balance Sheet and Other Operating Data: | ||||||||||||||||||||
| Trading assets | $ | 256,801 | $ | 280,744 | $ | 267,603 | $ | 275,353 | $ | 306,746 | ||||||||||
| Loans(6) | 66,577 | 42,874 | 29,046 | 15,369 | 10,576 | |||||||||||||||
| Total assets | 801,510 | 832,702 | 780,960 | 749,898 | 807,698 | |||||||||||||||
| Total deposits | 133,544 | 112,379 | 83,266 | 65,662 | 63,812 | |||||||||||||||
| Long-term borrowings | 152,772 | 153,575 | 169,571 | 184,234 | 192,457 | |||||||||||||||
| Morgan Stanley shareholders� equity | 70,900 | 65,921 | 62,109 | 62,049 | 57,211 | |||||||||||||||
| Return on average common equity(7) | 4.8 | % | 4.3 | % | N/M | 3.8 | % | 9.0 | % | |||||||||||
| (1) | Prior-period amounts have been recast for discontinued operations. See Note 1 to the Company�s consolidated financial statements in Item�8 for information on discontinued operations. |
| (2) | Information includes 100%, 65% and 51% ownership of the retail securities joint venture between the Company and Citigroup Inc. (the �Wealth Management JV�) effective June�28, 2013,�September�17, 2012 and May�31, 2009, respectively (see Note 3 to the Company�s consolidated financial statements in Item�8). |
| (3) | Amounts shown are used to calculate earnings (loss) per basic and diluted common share. |
| (4) | For the calculation of basic and diluted earnings (loss) per common share, see Note 16 to the Company�s consolidated financial statements in Item�8. |
| (5) | Book value per common share equals common shareholders� equity of $64,880 million at December�31, 2014, $62,701 million at December�31, 2013, $60,601 million at December�31, 2012, $60,541 million at December�31, 2011 and $47,614 million at December�31, 2010, divided by common shares outstanding of 1,951�million at December�31, 2014, 1,945�million at December�31, 2013, 1,974�million at December�31, 2012, 1,927�million at December�31, 2011 and 1,512�million at December�31, 2010. |
| (6) | Amounts include loans held for investment and loans held for sale and exclude loans at fair value which are included in Trading assets in the Company�s consolidated statements of financial condition (see Note 8 to the Company�s consolidated financial statements in Item�8). |
| (7) | The calculation of return on average common equity uses net income applicable to Morgan Stanley less preferred dividends as a percentage of average common equity. The return on average common equity is a non-generally accepted accounting principle financial measure that the Company considers to be a useful measure to the Company and investors to assess operating performance. |
| | 54 |
| Item�7. | Management�s Discussion and Analysis of Financial Condition and Results of Operations. |
| 55 | |
| | 56 |
| 2014 | 2013 | 2012 | ||||||||||
| Net revenues: | ||||||||||||
| Institutional Securities | $ | 16,871 | $ | 15,519 | $ | 11,101 | ||||||
| Wealth Management(1) | 14,888 | 14,143 | 12,947 | |||||||||
| Investment Management(1) | 2,712 | 3,059 | 2,306 | |||||||||
| Intersegment Eliminations | (196 | ) | (228 | ) | (176 | ) | ||||||
| Consolidated net revenues | $ | 34,275 | $ | 32,493 | $ | 26,178 | ||||||
| Net income | $ | 3,667 | $ | 3,613 | $ | 716 | ||||||
| Net income applicable to redeemable noncontrolling interests(2) | � | 222 | 124 | |||||||||
| Net income applicable to nonredeemable noncontrolling interests(2) | 200 | 459 | 524 | |||||||||
| Net income applicable to Morgan Stanley | $ | 3,467 | $ | 2,932 | $ | 68 | ||||||
| Income (loss) from continuing operations applicable to Morgan Stanley: | ||||||||||||
| Institutional Securities | $ | (77 | ) | $ | 983 | $ | (797 | ) | ||||
| Wealth Management(1) | 3,192 | 1,473 | 772 | |||||||||
| Investment Management(1) | 366 | 519 | 167 | |||||||||
| Intersegment Eliminations | � | � | (4 | ) | ||||||||
| Income from continuing operations applicable to Morgan Stanley | $ | 3,481 | $ | 2,975 | $ | 138 | ||||||
| Income (loss) from discontinued operations applicable to Morgan Stanley(3) | (14 | ) | (43 | ) | (70 | ) | ||||||
| Net income applicable to Morgan Stanley | $ | 3,467 | $ | 2,932 | $ | 68 | ||||||
| Preferred stock dividend and other | 315 | 277 | 98 | |||||||||
| Earnings (loss) applicable to Morgan Stanley common shareholders | $ | 3,152 | $ | 2,655 | $ | (30 | ) | |||||
| Earnings (loss) per basic common share: | ||||||||||||
| Income from continuing operations | $ | 1.65 | $ | 1.42 | $ | 0.02 | ||||||
| Income (loss) from discontinued operations(3) | (0.01 | ) | (0.03 | ) | (0.04 | ) | ||||||
| Earnings (loss) per basic common share(4) | $ | 1.64 | $ | 1.39 | $ | (0.02 | ) | |||||
| Earnings (loss) per diluted common share: | ||||||||||||
| Income from continuing operations | $ | 1.61 | $ | 1.38 | $ | 0.02 | ||||||
| Income (loss) from discontinued operations(3) | (0.01 | ) | (0.02 | ) | (0.04 | ) | ||||||
| Earnings (loss) per diluted common share(4) | $ | 1.60 | $ | 1.36 | $ | (0.02 | ) | |||||
| Regional net revenues(5): | ||||||||||||
| Americas | $ | 25,140 | $ | 23,358 | $ | 20,276 | ||||||
| EMEA | 4,772 | 4,542 | 3,078 | |||||||||
| Asia-Pacific | 4,363 | 4,593 | 2,824 | |||||||||
| Net revenues | $ | 34,275 | $ | 32,493 | $ | 26,178 | ||||||
| Pre-tax profit margin(6): | ||||||||||||
| Institutional Securities | N/M | 6 | % | N/M | ||||||||
| Wealth Management | 20 | % | 18 | % | 12 | % | ||||||
| Investment Management | 24 | % | 33 | % | 28 | % | ||||||
| Consolidated | 10 | % | 14 | % | 2 | % | ||||||
| Effective income tax rate from continuing operations(7) | (2.5 | )% | 19.8 | % | (27.0 | )% | ||||||
| 57 | |
| 2014 | 2013 | 2012 | ||||||||||
| Average common equity (dollars in billions)(8): | ||||||||||||
| Institutional Securities | $ | 32.2 | $ | 37.9 | $ | 29.0 | ||||||
| Wealth Management | 11.2 | 13.2 | 13.3 | |||||||||
| Investment Management | 2.9 | 2.8 | 2.4 | |||||||||
| Parent capital | 19.0 | 8.0 | 16.1 | |||||||||
| Consolidated average common equity | $ | 65.3 | $ | 61.9 | $ | 60.8 | ||||||
| Return on average common equity from continuing operations(9): | ||||||||||||
| Institutional Securities | N/M | 2.3 | % | N/M | ||||||||
| Wealth Management | 27.5 | % | 9.9 | % | 5.7 | % | ||||||
| Investment Management | 12.8 | % | 18.1 | % | 6.7 | % | ||||||
| Consolidated | 4.9 | % | 4.4 | % | 0.1 | % | ||||||
| Average tangible common equity (dollars in billions)(10) | $ | 55.5 | $ | 53.0 | $ | 53.9 | ||||||
| Return on average tangible common equity from continuing operations(11) | 5.7 | % | 5.1 | % | 0.1 | % | ||||||
| Selected management financial measures, excluding DVA: | ||||||||||||
| Net revenues, excluding DVA(12) | $ | 33,624 | $ | 33,174 | $ | 30,580 | ||||||
| Income from continuing operations applicable to Morgan Stanley, excluding DVA(12) | $ | 3,063 | $ | 3,427 | $ | 3,256 | ||||||
| Income per diluted common share from continuing operations, excluding DVA(12) | $ | 1.39 | $ | 1.61 | $ | 1.64 | ||||||
| Return on average common equity, excluding DVA(9) | 4.1 | % | 5.0 | % | 5.2 | % | ||||||
| Return on average tangible common equity, excluding DVA(11) | 4.9 | % | 5.8 | % | 5.9 | % | ||||||
| | 58 |
| At December�31,� 2014 | At December�31,� 2013 | |||||||
| Total loans(13) | $ | 66,577 | $ | 42,874 | ||||
| Total assets | $ | 801,510 | $ | 832,702 | ||||
| U.S. Subsidiary Banks loans(13)(14) | $ | 59,622 | $ | 35,039 | ||||
| U.S. Subsidiary Banks assets(14) | $ | 151,157 | $ | 125,341 | ||||
| Total deposits | $ | 133,544 | $ | 112,379 | ||||
| Long-term borrowings | $ | 152,772 | $ | 153,575 | ||||
| Maturities of long-term borrowings outstanding (next 12 months) | $ | 20,740 | $ | 24,193 | ||||
| Worldwide employees | 55,802 | 55,794 | ||||||
| Book value per common share(15) | $ | 33.25 | $ | 32.24 | ||||
| Tangible book value per common share(16) | $ | 28.26 | $ | 27.16 | ||||
| Global Liquidity Reserve held by bank and non-bank legal entities (dollars in billions)(17) | $ | 193 | $ | 202 | ||||
| Average Global Liquidity Reserve (dollars in billions)(17)(18): | ||||||||
| Bank legal entities | $ | 87 | $ | 75 | ||||
| Non-bank legal entities | 108 | 117 | ||||||
| Total average Global Liquidity Reserve | $ | 195 | $ | 192 | ||||
| Capital ratios(19): | ||||||||
| Common Equity Tier 1 capital ratio (Transitional/Advanced Approach in 2014) | 12.6 | % | N/A | |||||
| Tier 1 common capital ratio | N/A | 12.8 | % | |||||
| Tier 1 capital ratio (Transitional/Advanced Approach in 2014) | 14.1 | % | 15.6 | % | ||||
| Total capital ratio (Transitional/Advanced Approach in 2014) | 16.4 | % | 16.9 | % | ||||
| Tier 1 leverage ratio (Transitional/Advanced Approach in 2014)(20) | 7.9 | % | 7.6 | % | ||||
| Consolidated assets under management or supervision (dollars in billions)(1)(21): | ||||||||
| Investment Management(22) | $ | 403 | $ | 377 | ||||
| Wealth Management | 778 | 688 | ||||||
| Total | $ | 1,181 | $ | 1,065 | ||||
| (1) | On October�1, 2014, the Managed Futures business was transferred from the Company�s Wealth Management business segment to the Company�s Investment Management business segment. All prior-period amounts have been recast to conform to the current year�s presentation. |
| (2) | See Notes 2, 3 and 15 to the Company�s consolidated financial statements in Item�8 for information on redeemable and nonredeemable noncontrolling interests. |
| (3) | See Note 1 to the Company�s consolidated financial statements in Item�8 for information on discontinued operations. |
| (4) | For the calculation of basic and diluted earnings per share (�EPS�), see Note 16 to the Company�s consolidated financial statements in Item�8. |
| (5) | Regional net revenues reflect the regional view of the Company�s consolidated net revenues, on a managed basis. For a further discussion regarding the geographic methodology for net revenues, see Note 21 to the Company�s consolidated financial statements in Item�8. |
| (6) | Pre-tax profit margin is a non-generally accepted accounting principle (�non-GAAP�) financial measure that the Company considers to be a useful measure to the Company and investors to assess operating performance. Percentages represent income from continuing operations before income taxes as a percentage of net revenues. |
| (7) | For a discussion of the effective income tax rate, see �Overview of 2014 Financial Results� herein and Note 20 to the Company�s consolidated financial statements in Item�8. |
| 59 | |
| (8) | The computation of average common equity for each business segment is determined using the Company�s Required Capital framework, an internal capital adequacy measure (see �Liquidity and Capital Resources�Regulatory Requirements�Required Capital� herein). Average common equity for each business segment is a non-GAAP financial measure that the Company considers to be a useful measure to the Company and investors to assess capital adequacy. |
| (9) | The calculation of each business segment�s return on average common equity uses income from continuing operations applicable to Morgan Stanley less preferred dividends as a percentage of each business segment�s average common equity. The return on average common equity is a non-GAAP financial measure that the Company considers to be a useful measure to the Company and investors to assess operating performance. The effective tax rates used in the computation of business segments� return on average common equity were determined on a separate legal entity basis. To determine the return on consolidated average common equity, excluding the impact of DVA, also a non-GAAP financial measure, both the numerator and the denominator were adjusted to exclude the impact of DVA. The impact of DVA in 2014, 2013 and 2012 was 0.8%, (0.6)% and (5.1)%, respectively. |
| (10) | Average tangible common equity is a non-GAAP financial measure that the Company considers to be a useful measure to the Company and investors to assess capital adequacy. For a discussion of tangible common equity, see �Liquidity and Capital Resources�Capital Management� herein. |
| (11) | Return on average tangible common equity is a non-GAAP financial measure that the Company considers to be a useful measure to the Company and investors to assess capital adequacy. The calculation of return on average tangible common equity uses income from continuing operations applicable to Morgan Stanley less preferred dividends as a percentage of average tangible common equity. To determine the return on average tangible common equity, excluding the impact of DVA, also a non-GAAP financial measure, both the numerator and the denominator were adjusted to exclude the impact of DVA. The impact of DVA in 2014, 2013 and 2012 was 0.8%, (0.7)% and (5.8)%, respectively. |
| (12) | From time to time, the Company may disclose certain �non-GAAP financial measures� in the course of its earnings releases, earnings conference calls, financial presentations and otherwise. For these purposes, �U.S. GAAP� refers to accounting principles generally accepted in the U.S. The U.S. Securities and Exchange Commission (the �SEC�) defines a �non-GAAP financial measure� as a numerical measure of historical or future financial performance, financial positions, or cash flows that excludes or includes amounts or is subject to adjustments that effectively exclude, or include, amounts from the most directly comparable measure calculated and presented in accordance with U.S. GAAP. Non-GAAP financial measures disclosed by the Company are provided as additional information to investors in order to provide them with further transparency about, or as an alternative method for assessing, the Company�s financial condition and operating results. These measures are not in accordance with, or a substitute for, U.S. GAAP, and may be different from or inconsistent with non-GAAP financial measures used by other companies. Whenever the Company refers to a non-GAAP financial measure, the Company will also generally present the most directly comparable financial measure calculated and presented in accordance with U.S. GAAP, along with a reconciliation of the differences between the non-GAAP financial measure and the U.S. GAAP financial measure. |
| 2014 | 2013 | 2012 | ||||||||||
| Reconciliation of selected management financial measures from a Non-GAAP to a U.S. GAAP basis (dollars in millions, except per share amounts): | ||||||||||||
| Net revenues | ||||||||||||
| Net revenues�non-GAAP | $ | 33,624 | $ | 33,174 | $ | 30,580 | ||||||
| Impact of DVA | 651 | (681 | ) | (4,402 | ) | |||||||
| Net revenues�U.S. GAAP | $ | 34,275 | $ | 32,493 | $ | 26,178 | ||||||
| Income from continuing operations applicable to Morgan Stanley | ||||||||||||
| Income applicable to Morgan Stanley�non-GAAP | $ | 3,063 | $ | 3,427 | $ | 3,256 | ||||||
| Impact of DVA | 418 | (452 | ) | (3,118 | ) | |||||||
| Income applicable to Morgan Stanley�U.S. GAAP | $ | 3,481 | $ | 2,975 | $ | 138 | ||||||
| Earnings per diluted common share | ||||||||||||
| Income from continuing operations per diluted common share�non-GAAP | $ | 1.39 | $ | 1.61 | $ | 1.64 | ||||||
| Impact of DVA | 0.22 | (0.23 | ) | (1.62 | ) | |||||||
| Income from continuing operations per diluted common share�U.S. GAAP | $ | 1.61 | $ | 1.38 | $ | 0.02 | ||||||
| (13) | Amounts include loans held for investment and loans held for sale and exclude loans at fair value which are included in Trading assets in the Company�s consolidated statements of financial condition (see Note 8 to the Company�s consolidated financial statements in Item�8). |
| (14) | Morgan Stanley Bank, N.A. (�MSBNA�) and Morgan Stanley Private Bank, National Association (�MSPBNA�) represent the Company�s U.S. bank operating subsidiaries (�U.S. Subsidiary Banks�) and amounts exclude transactions with affiliated entities. |
| (15) | Book value per common share equals common shareholders� equity of $64,880 million at December�31, 2014 and $62,701 million at December�31, 2013 divided by common shares outstanding of 1,951�million at December�31, 2014 and 1,945�million at December�31, 2013. |
| (16) | Tangible book value per common share equals tangible common equity of $55,138 million at December�31, 2014 and $52,828 million at December�31, 2013 divided by common shares outstanding of 1,951�million at December�31, 2014 and 1,945�million at December�31, 2013. Tangible book value per common share is a non-GAAP financial measure that the Company considers to be a useful measure that the Company and investors use to assess capital adequacy. |
| (17) | Global Liquidity Reserve, which is held within the Company�s bank and non-bank legal entities, is composed of highly liquid and diversified cash and cash equivalents and unencumbered securities. Eligible unencumbered securities include U.S. government securities, |
| | 60 |
| U.S. agency securities, U.S. agency mortgage-backed securities, non-U.S. government securities and other highly liquid investment-grade securities. For a discussion of Global Liquidity Reserve, see �Liquidity and Capital Resources�Liquidity Risk Management Framework�Global Liquidity Reserve� herein. |
| (18) | The Company calculates the average Global Liquidity Reserve based upon daily amounts. |
| (19) | The Company calculates its applicable risk-based capital ratios and risk-weighted assets (�RWAs�) in accordance with the capital adequacy standards for financial holding companies adopted by the Board of Governors of the Federal Reserve System (the �Federal Reserve�). For a further discussion of the Company�s methods for calculating its risk-based capital ratios and RWAs, see �Liquidity and Capital Resources�Regulatory Requirements� herein. |
| (20) | Beginning with the first quarter of 2014, Tier 1 leverage ratio equals Tier 1 capital (calculated under U.S. Basel III Transitional rules) divided by adjusted average total assets (which reflects adjustments for disallowed goodwill, transitional intangible assets, certain deferred tax assets, certain financial equity investments and other adjustments). In 2013, Tier 1 leverage ratio equaled Tier 1 capital (calculated under U.S. Basel I) divided by adjusted average total assets (which reflects adjustments for disallowed goodwill, certain intangible assets, deferred tax assets, and financial and non-financial equity investments). |
| (21) | Revenues and expenses associated with these assets are included in the Company�s Wealth Management and Investment Management business segments. |
| (22) | Amounts exclude the Company�s Investment Management business segment�s proportionate share of assets managed by entities in which it owns a minority stake. |
| 61 | |
| | 62 |
| 63 | |
| | 64 |
| 65 | |
| | 66 |
| Institutional Securities | Wealth Management | Investment Management | Total | |||||||||||||
| (dollars�in�millions) | ||||||||||||||||
| Pro forma 2014 compensation and benefits expense(1) | $ | 6,882 | $ | 8,737 | $ | 1,068 | $ | 16,687 | ||||||||
| Fourth quarter actions: | ||||||||||||||||
| Change in 2014 level of deferrals(2) | 610 | 66 | 80 | 756 | ||||||||||||
| Acceleration of prior-year cash-based deferred awards(3) | 294 | 22 | 65 | 381 | ||||||||||||
| Fourth quarter actions total | $ | 904 | $ | 88 | $ | 145 | $ | 1,137 | ||||||||
| Actual 2014 compensation and benefits expense | $ | 7,786 | $ | 8,825 | $ | 1,213 | $ | 17,824 | ||||||||
| (1) | Pro forma 2014 represents compensation and benefits expense at pre-adjustment accrual levels ( i.e. , at an approximate average baseline 74% deferral rate and with no acceleration of cash-based award vesting that was utilized for the first three quarters of 2014). |
| (2) | Amounts reflect reduction in deferral level from an approximate average baseline of 74% to an approximate average baseline of 50%. |
| (3) | Amounts represent acceleration of vesting for certain cash-based awards. |
| 67 | |
| 2014 | 2013 | 2012 | ||||||||||
| (dollars in millions) | ||||||||||||
| Revenues: | ||||||||||||
| Investment banking | $ | 5,203 | $ | 4,377 | $ | 3,930 | ||||||
| Trading | 8,445 | 8,147 | 6,003 | |||||||||
| Investments | 240 | 707 | 219 | |||||||||
| Commissions and fees | 2,610 | 2,425 | 2,175 | |||||||||
| Asset management, distribution and administration fees | 281 | 280 | 241 | |||||||||
| Other | 684 | 684 | 279 | |||||||||
| Total non-interest revenues | 17,463 | 16,620 | 12,847 | |||||||||
| Interest income | 3,389 | 3,572 | 4,224 | |||||||||
| Interest expense | 3,981 | 4,673 | 5,970 | |||||||||
| Net interest | (592 | ) | (1,101 | ) | (1,746 | ) | ||||||
| Net revenues | 16,871 | 15,519 | 11,101 | |||||||||
| Compensation and benefits | 7,786 | 6,823 | 6,979 | |||||||||
| Non-compensation expenses | 9,143 | 7,750 | 5,734 | |||||||||
| Total non-interest expenses | 16,929 | 14,573 | 12,713 | |||||||||
| Income (loss) from continuing operations before income taxes | (58 | ) | 946 | (1,612 | ) | |||||||
| Provision for (benefit from) income taxes | (90 | ) | (315 | ) | (985 | ) | ||||||
| Income (loss) from continuing operations | 32 | 1,261 | (627 | ) | ||||||||
| Discontinued operations: | ||||||||||||
| Income (loss) from discontinued operations before income taxes | (26 | ) | (81 | ) | (158 | ) | ||||||
| Provision for (benefit from) income taxes | (7 | ) | (29 | ) | (36 | ) | ||||||
| Income (losses) from discontinued operations | (19 | ) | (52 | ) | (122 | ) | ||||||
| Net income (loss) | 13 | 1,209 | (749 | ) | ||||||||
| Net income applicable to redeemable noncontrolling interests | � | 1 | 4 | |||||||||
| Net income applicable to nonredeemable noncontrolling interests | 109 | 277 | 170 | |||||||||
| Net income (loss) applicable to Morgan Stanley | $ | (96 | ) | $ | 931 | $ | (923 | ) | ||||
| Amounts applicable to Morgan Stanley: | ||||||||||||
| Income (loss) from continuing operations | $ | (77 | ) | $ | 983 | $ | (797 | ) | ||||
| Income (loss) from discontinued operations | (19 | ) | (52 | ) | (126 | ) | ||||||
| Net income (loss) applicable to Morgan Stanley | $ | (96 | ) | $ | 931 | $ | (923 | ) | ||||
| | 68 |
| 2014 | 2013 | 2012 | ||||||||||
| (dollars�in�millions) | ||||||||||||
| Advisory revenues | $ | 1,634 | $ | 1,310 | $ | 1,369 | ||||||
| Underwriting revenues: | ||||||||||||
| Equity underwriting revenues | 1,613 | 1,262 | 892 | |||||||||
| Fixed income underwriting revenues | 1,956 | 1,805 | 1,669 | |||||||||
| Total underwriting revenues | 3,569 | 3,067 | 2,561 | |||||||||
| Total investment banking revenues | $ | 5,203 | $ | 4,377 | $ | 3,930 | ||||||
| 2014(1) | 2013(1) | 2012(1) | ||||||||||
| (dollars�in�billions) | ||||||||||||
| Announced mergers and acquisitions(2) | $ | 745 | $ | 518 | $ | 464 | ||||||
| Completed mergers and acquisitions(2) | 620 | 526 | 391 | |||||||||
| Equity and equity-related offerings(3) | 72 | 61 | 52 | |||||||||
| Fixed income offerings(4) | 260 | 289 | 277 | |||||||||
| (1) | Source: Thomson Reuters, data at January�20, 2015. Announced and completed mergers and acquisitions volumes are based on full credit to each of the advisors in a transaction. Equity and equity-related offerings and fixed income offerings are based on full credit for single book managers and equal credit for joint book managers. Transaction volumes may not be indicative of net revenues in a given period. In addition, transaction volumes for prior periods may vary from amounts previously reported due to the subsequent withdrawal or change in the value of a transaction. |
| (2) | Amounts include transactions of $100 million or more. Announced mergers and acquisitions exclude terminated transactions. |
| (3) | Amounts include Rule 144A and public common stock, convertible and rights offerings. |
| (4) | Amounts include non-convertible preferred stock, mortgage-backed and asset-backed securities and taxable municipal debt. Amounts also include publicly registered and Rule 144A issues. Amounts exclude leveraged loans and self-led issuances. |
| 69 | |
| 2014 | 2013 | 2012 | ||||||||||
| (dollars�in�millions) | ||||||||||||
| Trading(1) | $ | 8,445 | $ | 8,147 | $ | 6,003 | ||||||
| Commissions and fees | 2,610 | 2,425 | 2,175 | |||||||||
| Asset management, distribution and administration fees | 281 | 280 | 241 | |||||||||
| Net interest | (592 | ) | (1,101 | ) | (1,746 | ) | ||||||
| Total sales and trading net revenues | $ | 10,744 | $ | 9,751 | $ | 6,673 | ||||||
| 2014 | 2013 | 2012 | ||||||||||
| (dollars�in�millions) | ||||||||||||
| Equity(1) | $ | 7,135 | $ | 6,529 | $ | 4,811 | ||||||
| Fixed income and commodities(1) | 4,214 | 3,594 | 2,358 | |||||||||
| Other(2) | (605 | ) | (372 | ) | (496 | ) | ||||||
| Total sales and trading net revenues | $ | 10,744 | $ | 9,751 | $ | 6,673 | ||||||
| (1) | Results in 2014 included a charge of $468 million related to the implementation of FVA (Equity: $2 million; Fixed income and commodities: $466 million). |
| (2) | Amounts include net losses associated with costs related to the amount of liquidity held (�negative carry�), net gains (losses) on economic hedges related to the Company�s long-term borrowings, and revenues from corporate loans and lending commitments. |
| 2014 | 2013 | 2012 | ||||||||||
| (dollars�in�millions) | ||||||||||||
| Total sales and trading net revenues�non-GAAP(1) | $ | 10,093 | $ | 10,432 | $ | 11,075 | ||||||
| Impact of DVA | 651 | (681 | ) | (4,402 | ) | |||||||
| Total sales and trading net revenues(2) | $ | 10,744 | $ | 9,751 | $ | 6,673 | ||||||
| Equity sales and trading net revenues�non-GAAP(1) | $ | 6,903 | $ | 6,607 | $ | 5,941 | ||||||
| Impact of DVA | 232 | (78 | ) | (1,130 | ) | |||||||
| Equity sales and trading net revenues(2) | $ | 7,135 | $ | 6,529 | $ | 4,811 | ||||||
| Fixed income and commodities sales and trading net revenues | ||||||||||||
| �non-GAAP(1) | $ | 3,795 | $ | 4,197 | $ | 5,630 | ||||||
| Impact of DVA | 419 | (603 | ) | (3,272 | ) | |||||||
| Fixed income and commodities sales and trading net revenues(2) | $ | 4,214 | $ | 3,594 | $ | 2,358 | ||||||
| (1) | Sales and trading net revenues, including equity and fixed income and commodities sales and trading net revenues that exclude the impact of DVA, are non-GAAP financial measures that the Company considers useful for the Company and investors to allow further comparability of period-to-period operating performance. |
| (2) | Results in 2014 included a charge of $468 million related to the implementation of FVA (Equity: $2 million; Fixed income and commodities: $466 million). |
| | 70 |
| 71 | |
| | 72 |
| 73 | |
| | 74 |
| 75 | |
| 2014 | 2013(1) | 2012(1) | ||||||||||
| (dollars�in�millions) | ||||||||||||
| Revenues: | ||||||||||||
| Investment banking | $ | 791 | $ | 923 | $ | 835 | ||||||
| Trading | 957 | 1,161 | 1,041 | |||||||||
| Investments | 9 | 14 | 10 | |||||||||
| Commissions and fees | 2,127 | 2,209 | 2,087 | |||||||||
| Asset management, distribution and administration fees | 8,345 | 7,571 | 7,101 | |||||||||
| Other | 320 | 390 | 313 | |||||||||
| Total non-interest revenues | 12,549 | 12,268 | 11,387 | |||||||||
| Interest income | 2,516 | 2,100 | 1,886 | |||||||||
| Interest expense | 177 | 225 | 326 | |||||||||
| Net interest | 2,339 | 1,875 | 1,560 | |||||||||
| Net revenues | 14,888 | 14,143 | 12,947 | |||||||||
| Compensation and benefits | 8,825 | 8,265 | 7,788 | |||||||||
| Non-compensation expenses | 3,078 | 3,274 | 3,587 | |||||||||
| Total non-interest expenses | 11,903 | 11,539 | 11,375 | |||||||||
| Income from continuing operations before income taxes | 2,985 | 2,604 | 1,572 | |||||||||
| Provision for (benefit from) income taxes | (207 | ) | 910 | 538 | ||||||||
| Income from continuing operations | 3,192 | 1,694 | 1,034 | |||||||||
| Discontinued operations: | ||||||||||||
| Income (loss) from discontinued operations before income taxes | � | (1 | ) | 94 | ||||||||
| Provision for income taxes | � | � | 26 | |||||||||
| Income (loss) from discontinued operations | � | (1 | ) | 68 | ||||||||
| Net income | 3,192 | 1,693 | 1,102 | |||||||||
| Net income applicable to redeemable noncontrolling interests | � | 221 | 120 | |||||||||
| Net income applicable to nonredeemable noncontrolling interests | � | � | 167 | |||||||||
| Net income applicable to Morgan Stanley | $ | 3,192 | $ | 1,472 | $ | 815 | ||||||
| Amounts applicable to Morgan Stanley: | ||||||||||||
| Income from continuing operations | $ | 3,192 | $ | 1,473 | $ | 772 | ||||||
| Income (loss) from discontinued operations | � | (1 | ) | 43 | ||||||||
| Net income applicable to Morgan Stanley | $ | 3,192 | $ | 1,472 | $ | 815 | ||||||
| (1) | On October�1, 2014, the Managed Futures business was transferred from the Company�s Wealth Management business segment to the Company�s Investment Management business segment.�All prior-period amounts have been recast to conform to the current year�s presentation. |
| | 76 |
| 2014 | 2013(1) | 2012(1) | ||||||||||
| Annual revenues per representative (dollars in thousands)(2) | $ | 914 | $ | 863 | $ | 780 | ||||||
| Client assets per representative (dollars in millions)(3) | $ | 126 | $ | 116 | $ | 104 | ||||||
| Fee-based asset flows(4) | $ | 58.8 | $ | 51.9 | $ | 26.9 | ||||||
| At December�31, 2014 | At December�31, 2013 | |||||||
| Client assets | $ | 2,025 | $ | 1,909 | ||||
| Fee-based client assets(5) | $ | 785 | $ | 697 | ||||
| Fee-based client assets as a percentage of total client assets(5) | 39 | % | 37 | % | ||||
| Client liabilities | $ | 51 | $ | 39 | ||||
| Bank deposit program(6) | $ | 137 | $ | 134 | ||||
| Wealth Management U.S. Subsidiary Banks data(7): | ||||||||
| Investment securities portfolio | $ | 57.3 | $ | 53.4 | ||||
| Loans and lending commitments | $ | 42.7 | $ | 29.5 | ||||
| Wealth Management representatives | 16,076 | 16,456 | ||||||
| Retail locations | 622 | 649 | ||||||
| (1) | On October�1, 2014, the Managed Futures business was transferred from the Company�s Wealth Management business segment to the Company�s Investment Management business segment.�All prior-period amounts have been recast to conform to the current year�s presentation. |
| (2) | Annual revenues per representative for 2014, 2013 and 2012 equal the Company�s Wealth Management business segment�s annual revenues divided by the average representative headcount in 2014, 2013 and 2012, respectively. |
| (3) | Client assets per representative equal total period-end client assets divided by period-end representative headcount. |
| (4) | Fee-based asset flows include net new fee-based assets, net account transfers, dividends, interest and client fees and exclude cash management-related activity. |
| (5) | Fee-based client assets represent the amount of assets in client accounts where the basis of payment for services is a fee calculated on those assets. |
| (6) | Balances in the bank deposit program included deposits held by the Company�s U.S. Subsidiary Banks of $128 billion and $104 billion at December�31, 2014 and December�31, 2013, respectively, with the remainder held at Citi-affiliated FDIC-insured depositories. See�Note 3 to the Company�s consolidated financial statements in Item�8 for further discussion of the Company�s customer deposits held by Citi. |
| (7) | Wealth Management U.S. Subsidiary Banks refers to the Company�s U.S. bank operating subsidiaries MSBNA and MSPBNA. |
| 77 | |
| 2014 | 2013(1) | 2012(1) | ||||||||||
| (dollars�in�millions) | ||||||||||||
| Net revenues: | ||||||||||||
| Transactional | $ | 3,875 | $ | 4,293 | $ | 3,963 | ||||||
| Asset management | 8,345 | 7,571 | 7,101 | |||||||||
| Net interest | 2,339 | 1,875 | 1,560 | |||||||||
| Other | 329 | 404 | 323 | |||||||||
| Net revenues | $ | 14,888 | $ | 14,143 | $ | 12,947 | ||||||
| (1) | On October�1, 2014, the Managed Futures business was transferred from the Company�s Wealth Management business segment to the Company�s Investment Management business segment.�All prior-period amounts have been recast to conform to the current year�s presentation. |
| | 78 |
| 79 | |
| | 80 |
| 2014 | 2013(1) | 2012(1) | ||||||||||
| (dollars in millions) | ||||||||||||
| Revenues: | ||||||||||||
| Investment banking | $ | 5 | $ | 11 | $ | 17 | ||||||
| Trading | (19 | ) | 41 | (44 | ) | |||||||
| Investments | 587 | 1,056 | 513 | |||||||||
| Commissions and fees | � | � | (6 | ) | ||||||||
| Asset management, distribution and administration fees | 2,049 | 1,920 | 1,793 | |||||||||
| Other | 106 | 32 | 51 | |||||||||
| Total non-interest revenues | 2,728 | 3,060 | 2,324 | |||||||||
| Interest income | 2 | 9 | 10 | |||||||||
| Interest expense | 18 | 10 | 28 | |||||||||
| Net interest | (16 | ) | (1 | ) | (18 | ) | ||||||
| Net revenues | 2,712 | 3,059 | 2,306 | |||||||||
| Compensation and benefits | 1,213 | 1,189 | 848 | |||||||||
| Non-compensation expenses | 835 | 862 | 818 | |||||||||
| Total non-interest expenses | 2,048 | 2,051 | 1,666 | |||||||||
| Income from continuing operations before income taxes | 664 | 1,008 | 640 | |||||||||
| Provision for income taxes | 207 | 307 | 286 | |||||||||
| Income from continuing operations | 457 | 701 | 354 | |||||||||
| Discontinued operations: | ||||||||||||
| Income from discontinued operations before income taxes | 7 | 9 | 13 | |||||||||
| Provision for income taxes | 2 | � | 4 | |||||||||
| Income from discontinued operations | 5 | 9 | 9 | |||||||||
| Net income | 462 | 710 | 363 | |||||||||
| Net income applicable to nonredeemable noncontrolling interests | 91 | 182 | 187 | |||||||||
| Net income applicable to Morgan Stanley | $ | 371 | $ | 528 | $ | 176 | ||||||
| Amounts applicable to Morgan Stanley: | ||||||||||||
| Income from continuing operations | $ | 366 | $ | 519 | $ | 167 | ||||||
| Income from discontinued operations | 5 | 9 | 9 | |||||||||
| Net income applicable to Morgan Stanley | $ | 371 | $ | 528 | $ | 176 | ||||||
| (1) | On October�1, 2014, the Managed Futures business was transferred from the Company�s Wealth Management business segment to the Company�s Investment Management business segment. All prior-period amounts have been recast to conform to the current year�s presentation. |
| 81 | |
| At December�31, | Average for | |||||||||||||||||||
| 2014 | 2013(1) | 2014 | 2013(1) | 2012(1) | ||||||||||||||||
| (dollars in billions) | ||||||||||||||||||||
| Assets under management or supervision by asset class: | ||||||||||||||||||||
| Traditional Asset Management: | ||||||||||||||||||||
| Equity | $ | 141 | $ | 140 | $ | 145 | $ | 130 | $ | 114 | ||||||||||
| Fixed income | 65 | 60 | 63 | 61 | 59 | |||||||||||||||
| Liquidity | 128 | 112 | 119 | 104 | 87 | |||||||||||||||
| Alternatives(2) | 36 | 31 | 34 | 29 | 26 | |||||||||||||||
| Managed Futures(1) | 3 | 4 | 3 | 5 | 6 | |||||||||||||||
| Total Traditional Asset Management | 373 | 347 | 364 | 329 | 292 | |||||||||||||||
| Real Estate Investing | 20 | 21 | 21 | 20 | 19 | |||||||||||||||
| Merchant Banking | 10 | 9 | 9 | 9 | 9 | |||||||||||||||
| Total assets under management or supervision | $ | 403 | $ | 377 | $ | 394 | $ | 358 | $ | 320 | ||||||||||
| Share of minority stake assets(3) | $ | 7 | $ | 6 | $ | 7 | $ | 6 | $ | 5 | ||||||||||
| (1) | On October�1, 2014, the Managed Futures business was transferred from the Company�s Wealth Management business segment to the Company�s Investment Management business segment. All prior-period amounts have been recast to conform to the current year�s presentation. |
| (2) | The alternatives asset class includes a range of investment products such as funds of hedge funds, funds of private equity funds and funds of real estate funds. |
| (3) | Amounts represent the Company�s Investment Management business segment�s proportional share of assets managed by entities in which it owns a minority stake. |
| 2014 | 2013(1) | 2012(1) | ||||||||||
| (dollars�in�billions) | ||||||||||||
| Balance at beginning of period | $ | 377 | $ | 343 | $ | 293 | ||||||
| Net flows by asset class: | ||||||||||||
| Traditional Asset Management: | ||||||||||||
| Equity | (2 | ) | (1 | ) | (2 | ) | ||||||
| Fixed income | 5 | � | (1 | ) | ||||||||
| Liquidity | 17 | 12 | 26 | |||||||||
| Alternatives(2) | 4 | 2 | 1 | |||||||||
| Managed Futures(1) | (1 | ) | (1 | ) | � | |||||||
| Total Traditional Asset Management | 23 | 12 | 24 | |||||||||
| Real Estate Investing | (2 | ) | (1 | ) | 1 | |||||||
| Merchant Banking | 3 | 1 | � | |||||||||
| Total net flows | 24 | 12 | 25 | |||||||||
| Net market appreciation | 2 | 22 | 25 | |||||||||
| Total net increase | 26 | 34 | 50 | |||||||||
| Balance at end of period | $ | 403 | $ | 377 | $ | 343 | ||||||
| (1) | On October�1, 2014, the Managed Futures business was transferred from the Company�s Wealth Management business segment to the Company�s Investment Management business segment. All prior-period amounts have been recast to conform to the current year�s presentation. |
| (2) | The alternatives asset class includes a range of investment products such as funds of hedge funds, funds of private equity funds and funds of real estate funds. |
| | 82 |
| 83 | |
| | 84 |
| 85 | |
| | 86 |
| 87 | |
| At December�31, 2014 | At December�31, 2013 | |||||||
| (dollars�in�billions) | ||||||||
| Institutional Securities U.S. Subsidiary Banks data: | ||||||||
| Corporate lending | $ | 9.6 | $ | 8.8 | ||||
| Other lending(1): | ||||||||
| Corporate loans | 8.0 | 2.3 | ||||||
| Wholesale real estate loans | 8.6 | 1.8 | ||||||
| Wealth Management U.S. Subsidiary Banks data: | ||||||||
| Securities-based lending and other loans | $ | 21.9 | $ | 14.7 | ||||
| Residential real estate loans | 15.8 | 10.1 | ||||||
| (1) | In addition to primary corporate lending activity, the Company�s Institutional Securities business segment engages in other lending activities. These activities include commercial and residential mortgage lending, asset-backed lending, corporate loans purchased in the secondary market, financing extended to Institutional equities clients and loans to municipalities. The increase in other lending from 2013 primarily reflects growth in commercial mortgage and asset-backed loans. |
| | 88 |
| 89 | |
| | 90 |
| 91 | |
| � | Trading assets and Trading liabilities; |
| � | AFS securities; |
| � | Securities received as collateral and Obligation to return securities received as collateral; |
| � | Certain Securities purchased under agreements to resell; |
| � | Certain Deposits; |
| � | Certain Commercial paper and other short-term borrowings, primarily structured notes; |
| � | Certain Securities sold under agreements to repurchase; |
| � | Certain Other secured financings; and |
| � | Certain Long-term borrowings, primarily structured notes. |
| � | Determining when sufficient market evidence exists to indicate that FVA should be incorporated into the fair value measurements; |
| | 92 |
| � | Estimating the fair value of funding costs and benefits in the principal exit market; and |
| � | Determining the interaction between Credit Valuation Adjustment (�CVA�) and FVA, given that CVA already reflects credit spreads, which are related to and can impact funding spreads. |
| 93 | |
| | 94 |
| 95 | |
| At December�31, 2014 | ||||||||||||||||
| Institutional Securities | Wealth Management | Investment Management | Total | |||||||||||||
| (dollars in millions) | ||||||||||||||||
| Assets | ||||||||||||||||
| Cash and cash equivalents(1) | $ | 23,161 | $ | 23,363 | $ | 460 | $ | 46,984 | ||||||||
| Cash deposited with clearing organizations or segregated under federal and other regulations or requirements(2) | 37,841 | 2,766 | � | 40,607 | ||||||||||||
| Trading assets | 252,021 | 1,300 | 3,480 | 256,801 | ||||||||||||
| Investment securities(3) | 11,999 | 57,317 | � | 69,316 | ||||||||||||
| Securities received as collateral(2) | 21,316 | � | � | 21,316 | ||||||||||||
| Securities purchased under agreements to resell(2) | 73,299 | 9,989 | � | 83,288 | ||||||||||||
| Securities borrowed(2) | 136,336 | 372 | � | 136,708 | ||||||||||||
| Customer and other receivables(2) | 27,328 | 21,022 | 611 | 48,961 | ||||||||||||
| Loans, net of allowance(4) | 28,755 | 37,822 | � | 66,577 | ||||||||||||
| Other assets(5) | 18,285 | 11,196 | 1,471 | 30,952 | ||||||||||||
| Total assets(6) | $ | 630,341 | $ | 165,147 | $ | 6,022 | $ | 801,510 | ||||||||
| (1) | Cash and cash equivalents include Cash and due from banks and Interest bearing deposits with banks. |
| (2) | Certain of these assets are included in secured financing assets (see �Secured Financing� herein). |
| (3) | Investment securities include both AFS securities and HTM securities. |
| (4) | Amounts include loans held for sale and loans held for investment but exclude loans at fair value, which are included in Trading assets in the Company�s consolidated statements of financial condition (see Note 8 to the Company�s consolidated financial statements in Item�8). |
| (5) | Other assets include Other investments; Premises, equipment and software costs; Goodwill; Intangible assets; and Other assets. |
| (6) | Total assets include Global Liquidity Reserve of $193�billion at December�31, 2014. |
| | 96 |
| At December�31, 2013 | ||||||||||||||||
| Institutional Securities | Wealth Management(1) | Investment Management(1) | Total | |||||||||||||
| (dollars in millions) | ||||||||||||||||
| Assets | ||||||||||||||||
| Cash and cash equivalents(2) | $ | 30,169 | $ | 28,966 | $ | 748 | $ | 59,883 | ||||||||
| Cash deposited with clearing organizations or segregated under federal and other regulations or requirements(3) | 36,422 | 2,781 | � | 39,203 | ||||||||||||
| Trading assets | 273,959 | 2,104 | 4,681 | 280,744 | ||||||||||||
| Investment securities(4) | � | 53,430 | � | 53,430 | ||||||||||||
| Securities received as collateral(3) | 20,508 | � | � | 20,508 | ||||||||||||
| Securities purchased under agreements to resell(3) | 106,812 | 11,318 | � | 118,130 | ||||||||||||
| Securities borrowed(3) | 129,366 | 341 | � | 129,707 | ||||||||||||
| Customer and other receivables(3) | 33,927 | 22,493 | 684 | 57,104 | ||||||||||||
| Loans, net of allowance(5) | 17,890 | 24,984 | � | 42,874 | ||||||||||||
| Other assets(6) | 19,543 | 10,086 | 1,490 | 31,119 | ||||||||||||
| Total assets(7) | $ | 668,596 | $ | 156,503 | $ | 7,603 | $ | 832,702 | ||||||||
| (1) | On October�1, 2014, the Managed Futures business was transferred from the Company�s Wealth Management business segment to the Company�s Investment Management business segment. |
| (2) | Cash and cash equivalents include Cash and due from banks and Interest bearing deposits with banks. |
| (3) | Certain of these assets are included in secured financing assets (see �Secured Financing� herein). |
| (4) | Investment securities include only AFS securities. |
| (5) | Amounts include loans held for sale and loans held for investment but exclude loans at fair value, which are included in Trading assets in the Company�s consolidated statements of financial condition (see Note 8 to the Company�s consolidated financial statements in Item�8). |
| (6) | Other assets include Other investments; Premises, equipment and software costs; Goodwill; Intangible assets; and Other assets. |
| (7) | Total assets include Global Liquidity Reserve of $202�billion at December�31, 2013. |
| 97 | |
| � | Sufficient liquid assets should be maintained to cover maturing liabilities and other planned and contingent outflows; |
| � | Maturity profile of assets and liabilities should be aligned, with limited reliance on short-term funding; |
| � | Source, counterparty, currency, region, and term of funding should be diversified; and |
| � | Contingency Funding Plan (�CFP�) should anticipate, and account for, periods of limited access to funding. |
| � | No government support; |
| � | No access to equity and unsecured debt markets; |
| � | Repayment of all unsecured debt maturing within the stress horizon; |
| � | Higher haircuts and significantly lower availability of secured funding; |
| � | Additional collateral that would be required by trading counterparties, certain exchanges and clearing organizations related to credit rating downgrades; |
| � | Additional collateral that would be required due to collateral substitutions, collateral disputes and uncalled collateral; |
| | 98 |
| � | Discretionary unsecured debt buybacks; |
| � | Drawdowns on unfunded commitments provided to third parties; |
| � | Client cash withdrawals and reduction in customer short positions that fund long positions; |
| � | Limited access to the foreign exchange swap markets; and |
| � | Maturity roll-off of outstanding letters of credit with no further issuance. |
| At December�31, 2014 | At December�31, 2013 | |||||||
| (dollars�in�billions) | ||||||||
| Cash deposits with banks | $ | 12 | $ | 18 | ||||
| Cash deposits with central banks | 30 | 36 | ||||||
| Unencumbered highly liquid securities: | ||||||||
| U.S. government obligations | 76 | 84 | ||||||
| U.S. agency and agency mortgage-backed securities | 32 | 23 | ||||||
| Non-U.S. sovereign obligations(1) | 26 | 23 | ||||||
| Investments in money market funds | 1 | 1 | ||||||
| Other investment grade securities | 16 | 17 | ||||||
| Global Liquidity Reserve | $ | 193 | $ | 202 | ||||
| (1) | Non-U.S. sovereign obligations are composed of unencumbered�German, French, Dutch, U.K., Brazilian and Japanese government obligations. |
| 99 | |
| Average�Balance(1) | ||||||||||||||||
| At�December�31, 2014 | At�December�31, 2013 | 2014 | 2013 | |||||||||||||
| (dollars in billions) | ||||||||||||||||
| Bank legal entities: | ||||||||||||||||
| Domestic | $ | 83 | $ | 85 | $ | 82 | $ | 70 | ||||||||
| Foreign | 5 | 4 | 5 | 5 | ||||||||||||
| Total Bank legal entities | 88 | 89 | 87 | 75 | ||||||||||||
| Non-Bank legal entities: | ||||||||||||||||
| Domestic(2) | 70 | 80 | 76 | 83 | ||||||||||||
| Foreign | 35 | 33 | 32 | 34 | ||||||||||||
| Total Non-Bank legal entities | 105 | 113 | 108 | 117 | ||||||||||||
| Total | $ | 193 | $ | 202 | $ | 195 | $ | 192 | ||||||||
| (1) | The Company calculates the average Global Liquidity Reserve based upon daily amounts. |
| (2) | The Parent held $55 billion and $58 billion at December�31, 2014 and December�31, 2013, respectively, which averaged $57 billion and $63 billion during 2014 and 2013, respectively. |
| | 100 |
| 101 | |
| At December� 31, 2014 | At December� 31, 2013 | |||||||
| (dollars�in�millions) | ||||||||
| Commercial paper | $ | � | $ | 8 | ||||
| Other short-term borrowings | 2,261 | 2,134 | ||||||
| Total | $ | 2,261 | $ | 2,142 | ||||
| At December� 31, 2014(1) | At December� 31, 2013(1) | |||||||
| (dollars in millions) | ||||||||
| Savings and demand deposits | $ | 132,159 | $ | 109,908 | ||||
| Time deposits(2) | 1,385 | 2,471 | ||||||
| Total(3) | $ | 133,544 | $ | 112,379 | ||||
| (1) | Total deposits subject to FDIC insurance at December�31, 2014 and December�31, 2013 were $99 billion and $84 billion, respectively. |
| (2) | Certain time deposit accounts are carried at fair value under the fair value option (see Note 4 to the Company�s consolidated financial statements in Item�8). |
| (3) | At December�31, 2014 and December�31, 2013, approximately $128 billion and $104 billion, respectively, were attributed to the Company�s Wealth Management business segment. These total deposits exclude deposits held by Citi relating to the Company�s customer accounts. |
| | 102 |
| Parent | Subsidiaries | Total | ||||||||||
| (dollars�in�millions) | ||||||||||||
| Due in 2015 | $ | 17,781 | $ | 2,959 | $ | 20,740 | ||||||
| Due in 2016 | 18,963 | 1,680 | 20,643 | |||||||||
| Due in 2017 | 22,643 | 1,357 | 24,000 | |||||||||
| Due in 2018 | 16,728 | 951 | 17,679 | |||||||||
| Due in 2019 | 16,660 | 911 | 17,571 | |||||||||
| Thereafter | 50,292 | 1,847 | 52,139 | |||||||||
| Total | $ | 143,067 | $ | 9,705 | $ | 152,772 | ||||||
| 103 | |
| Parent | Morgan Stanley Bank, N.A. | |||||||||||
| Short-Term Debt | Long-Term Debt | Rating Outlook | Short-Term Debt | Long-Term Debt | Rating Outlook | |||||||
| DBRS, Inc.(1) | R-1�(middle) | A�(high) | Stable | � | � | � | ||||||
| Fitch Ratings, Inc. | F1 | A | Stable | F1 | A | Stable | ||||||
| Moody�s Investors Service(2) | P-2 | Baa2 | Positive | P-2 | A3 | Positive | ||||||
| Rating and Investment Information, Inc. | a-1 | A | Negative | � | � | � | ||||||
| Standard�& Poor�s Ratings Services(3) | A-2 | A- | Negative | A-1 | A | Stable | ||||||
| (1) | On June�12, 2014, DBRS, Inc. confirmed the ratings for the Company, including its long-term debt rating of A (high) and short-term instruments rating of R-1 (middle). The rating outlook trend on all long-term ratings was revised to Stable from Negative, while the rating outlook trend on all short-term ratings remained Stable. |
| (2) | On July�24, 2014, Moody�s Investors Service (�Moody�s�) affirmed the Company�s long-term debt rating as well as the ratings of its subsidiaries and revised its ratings outlook to Positive from Stable. |
| (3) | On November�26, 2014, Standard�& Poor�s Ratings Services (�S&P�) revised its rating outlook on the Company�s operating subsidiaries, including Morgan Stanley Bank, N.A. to Stable from Negative and affirmed its rating on Morgan Stanley Bank, N.A. short-term and long-term debt of A-1 and A, respectively. |
| | 104 |
| 105 | |
| Series | Preferred Stock Description | Quarterly Dividend Per� Share(1) | ||||
| A | Floating Rate Non-Cumulative Preferred Stock (represented by Depositary Shares, each representing a 1/1,000th interest in a share of preferred stock and each having a dividend of $0.25556) | $ | 255.56 | |||
| C | 10% Non-Cumulative Non-Voting Perpetual Preferred Stock | 25.00 | ||||
| E | Fixed-to-Floating Rate Non-Cumulative Preferred Stock (represented by Depositary Shares, each representing a 1/1,000th interest in a share of preferred stock and each having a dividend of $0.44531) | 445.31 | ||||
| F | Fixed-to-Floating Rate Non-Cumulative Preferred Stock (represented by Depositary Shares, each representing a 1/1,000th interest in a share of preferred stock and each having a dividend of $0.42969) | 429.69 | ||||
| G | 6.625% Non-Cumulative Preferred Stock (represented by Depositary Shares, each representing a 1/1,000th interest in a share and each having a dividend of $0.41406) | 414.06 | ||||
| H | Fixed-to-Floating Rate Non-Cumulative Preferred Stock (represented by Depositary Shares, each representing a 1/25th interest in a share of preferred stock and each having a dividend of $27.25)(1) | 681.25 | ||||
| I | Fixed-to-Floating Rate Non-Cumulative Preferred Stock (represented by Depositary Shares, each representing a 1/1,000th interest in a share of preferred stock and each having a dividend of $0.51797) | 517.97 | ||||
| (1) | Dividend on Series H is payable semi-annually until July�15, 2019. |
| | 106 |
| Balance at | Average Balance(1) | |||||||||||||||
| December�31, 2014 | December�31, 2013 | 2014 | 2013 | |||||||||||||
| (dollars in millions) | ||||||||||||||||
| Common equity | $ | 64,880 | $ | 62,701 | $ | 65,284 | $ | 61,895 | ||||||||
| Preferred equity | 6,020 | 3,220 | 4,774 | 1,839 | ||||||||||||
| Morgan Stanley shareholders� equity | 70,900 | 65,921 | 70,058 | 63,734 | ||||||||||||
| Junior subordinated debentures issued to capital trusts | 4,868 | 4,849 | 4,866 | 4,826 | ||||||||||||
| Less: Goodwill and net intangible assets(2) | (9,742 | ) | (9,873 | ) | (9,737 | ) | (8,900 | ) | ||||||||
| Tangible Morgan Stanley shareholders� equity(3) | $ | 66,026 | $ | 60,897 | $ | 65,187 | $ | 59,660 | ||||||||
| Common equity | $ | 64,880 | $ | 62,701 | $ | 65,284 | $ | 61,895 | ||||||||
| Less: Goodwill and net intangible assets(2) | (9,742 | ) | (9,873 | ) | (9,737 | ) | (8,900 | ) | ||||||||
| Tangible common equity(3) | $ | 55,138 | $ | 52,828 | $ | 55,547 | $ | 52,995 | ||||||||
| (1) | The Company calculates its average balances based upon month-end balances. |
| (2) | The deduction for Goodwill and net intangible assets is partially offset by mortgage servicing rights (�MSR�) (net of disallowable MSR) of $6 million and $7 million at December�31, 2014 and December�31, 2013, respectively. |
| (3) | Tangible Morgan Stanley shareholders� equity, and tangible common equity, non-GAAP financial measures, equals Morgan Stanley shareholders� equity or common equity, respectively less goodwill and net intangible assets as defined above. The Company views tangible Morgan Stanley shareholders� equity and tangible common equity as a useful measure to the Company and investors to assess capital adequacy. |
| 107 | |
| | 108 |
| Transition Period | Fully�Phased-In(1) | |||||||||
| First�Quarter of 2014 | Second�to�Fourth Quarter of 2014 | 2015�to�2017 | 2018�and�onward | |||||||
| Regulatory Capital (Numerator of risk-based capital and leverage ratios) | U.S.�Basel�III�Transitional(2) | U.S.�Basel�III | ||||||||
| RWAs (Denominator of risk-based capital ratios) | Standardized Approach(3) | U.S.�Basel�I�and�Basel� 2.5 | U.S.�Basel�III Standardized�Approach | |||||
| Advanced Approach(4) | U.S.�Basel�III�Advanced�Approach | |||||
| Denominator of leverage ratios | Tier�1�Leverage�Ratio | Adjusted� Average�On-Balance�Sheet�Assets(5) |
| Supplementary�Leverage�Ratio(6) | Adjusted�Average On-Balance�Sheet�Assets(5) and�Certain�Off-Balance Sheet Exposures |
| (1) | By the beginning of 2018, U.S. Basel III rules defining capital (numerator of capital ratios) will be fully phased in, except for the exclusion of non-qualifying trust preferred securities from Tier 2 capital, which will be fully phased-in as of January�1, 2022. In addition, the Company will also be subject to a greater than 2.5% Common Equity Tier 1 capital conservation buffer, a G-SIB capital surcharge (if adopted) and, if deployed by banking regulators, up to a 2.5% Common Equity Tier 1 countercyclical buffer, all of which will be fully phased in by the beginning of 2019. The capital conservation buffer, the G-SIB capital surcharge and, if deployed, the countercyclical buffer apply in addition to each of the Company�s Common Equity Tier 1, Tier 1 and Total capital ratios. The requirements for these additional capital buffers will be phased in beginning in 2016. |
| (2) | Beginning June�30, 2014, as a result of the Company�s and the Company�s U.S. Subsidiary Banks� completion of the Advanced Approach parallel run, the amount of expected credit loss that exceeds eligible credit reserves must be deducted 20% from Common |
| 109 | |
| Equity Tier 1 capital and 80% from Additional Tier 1 capital. Over the next several years, this deduction from Common Equity Tier 1 capital will incrementally increase and the amount deducted from Additional Tier 1 capital will correspondingly decrease, until fully phased in by the beginning of 2018. In addition, under the Advanced Approach framework, the allowance for loan losses cannot be included in Tier 2 capital. Instead, an Advanced Approach banking organization may include in Tier 2 capital any eligible credit reserves that exceed its total expected credit losses to the extent that the excess reserve amount does not exceed 0.6% of its Advanced Approach credit risk RWAs. The allowance for loan losses may continue to be included in Tier 2 capital for purposes of calculating capital ratios under U.S. Basel I as supplemented by Basel 2.5 and under the Standardized Approach, up to 1.25% of credit risk RWAs. |
| (3) | Beginning in 2015, the Company is required to calculate credit risk RWAs and market risk RWAs under the U.S. Basel III Standardized Approach. |
| (4) | Public reporting of Advanced Approach capital ratios began during the second quarter of 2014. |
| (5) | In accordance with U.S. Basel III, adjusted average assets represent the Company�s average total on-balance sheet assets minus certain amounts deducted from Tier 1 capital. |
| (6) | Beginning in 2015, the Company is required to publicly disclose its supplementary leverage ratio, which will become effective as a capital standard on January�1, 2018. |
| At December�31, 2014 | ||||||||||||
| Actual Capital Ratio | ||||||||||||
| Minimum�Regulatory Capital Ratio(1) | ||||||||||||
| U.S.�Basel�III�
Transitional/ Advanced Approach | U.S.�Basel�III�
Transitional/ U.S. Basel�I�+ Basel 2.5 Approach | 2014 | ||||||||||
| Common Equity Tier 1 capital ratio | 12.6 | % | 14.7 | % | 4.0 | % | ||||||
| Tier 1 capital ratio | 14.1 | % | 16.5 | % | 5.5 | % | ||||||
| Total capital ratio | 16.4 | % | 19.4 | % | 8.0 | % | ||||||
| Tier 1 leverage ratio(2) | 7.9 | % | 7.9 | % | 4.0 | % | ||||||
| (1) | Percentages show minimum capital ratios for calendar year 2014 under U.S. Basel III transitional provisions. |
| (2) | Tier 1 leverage ratio is defined as the ratio of Tier 1 capital to average total on-balance sheet assets minus certain amounts deducted from Tier 1 capital in accordance with U.S. Basel III rules. |
| | 110 |
| 2014 | ||||
| (dollars�in�millions) | ||||
| Common Equity Tier 1 capital: | ||||
| Tier 1 Common capital under U.S. Basel I rules at December�31, 2013 | $ | 49,917 | ||
| Change in the value of shareholders� common equity | 2,179 | |||
| New items subject to deduction and adjustments under U.S. Basel III Advanced Approach transitional rules: | ||||
| Credit spread premium over risk-free rate for derivative liabilities | (161 | ) | ||
| Expected credit loss that exceeds eligible credit reserves(1) | (10 | ) | ||
| Other new deductions and adjustments | (181 | ) | ||
| Modification of existing deductions under U.S. Basel III Advanced Approach transitional rules: | ||||
| Net goodwill | (17 | ) | ||
| Net intangible assets (other than goodwill and mortgage servicing assets) | 2,647 | |||
| Net deferred tax assets | 2,299 | |||
| Net after-tax debt valuation adjustment(2) | (1,117 | ) | ||
| Adjustments related to accumulated other comprehensive income | 184 | |||
| U.S. Basel I deductions that are no longer applicable under U.S. Basel III Advanced Approach transitional rules | 1,584 | |||
| Common Equity Tier 1 capital under U.S. Basel III Advanced Approach transitional rules at December�31, 2014 | $ | 57,324 | ||
| Additional Tier 1 capital: | ||||
| Additional Tier 1 capital under U.S. Basel I rules at December�31, 2013 | $ | 11,090 | ||
| New issuance of qualifying preferred stock | 2,800 | |||
| Modification of treatment of Additional Tier 1 capital components under U.S. Basel III Advanced Approach transitional rules: | ||||
| Trust preferred securities | (2,327 | ) | ||
| Nonredeemable noncontrolling interests | (2,105 | ) | ||
| New items subject to deduction and adjustments under U.S. Basel III Advanced Approach transitional rules: | ||||
| Net deferred tax assets | (2,318 | ) | ||
| Credit spread premium over risk-free rate for derivative liabilities | (644 | ) | ||
| Net after-tax debt valuation adjustment(2) | 630 | |||
| Expected credit loss that exceeds eligible credit reserves | (39 | ) | ||
| Other adjustments and deductions | (229 | ) | ||
| Additional Tier 1 capital at December�31, 2014 | $ | 6,858 | ||
| Tier 1 capital (Common Equity Tier 1 capital plus Additional Tier 1 capital) at December�31, 2014 | $ | 64,182 | ||
| Tier 2 capital: | ||||
| Tier 2 capital under U.S. Basel I rules at December�31, 2013 | $ | 4,993 | ||
| Change in subordinated debt | 2,780 | |||
| De-recognition of allowance for loan and lease losses under Basel III Advanced Approach transitional rules(3) | (284 | ) | ||
| New capital components subject to recognition under U.S. Basel III Advanced Approach transitional rules: | ||||
| Trust preferred securities | 2,434 | |||
| Nonredeemable noncontrolling interests | 27 | |||
| New items subject to deduction and adjustments under U.S. Basel III Advanced Approach transitional rules | (10 | ) | ||
| U.S. Basel I deductions that are no longer applicable under U.S. Basel III Advanced Approach transitional rules | 850 | |||
| Tier 2 capital at December�31, 2014 | $ | 10,790 | ||
| Total capital at December�31, 2014 | $ | 74,972 | ||
| (1) | In 2014, as a result of the Company�s and the Company�s U.S. Subsidiary Banks� completion of the Advanced Approach parallel run, the amount of expected credit loss that exceeded eligible credit reserves was deducted 20% from Common Equity Tier 1 capital and 80% |
| 111 | |
| from Additional Tier 1 capital. Over the next several years, this deduction from Common Equity Tier 1 capital will incrementally increase, and the amount deducted from Additional Tier 1 capital will correspondingly decrease, until fully phased-in by 2018. |
| (2) | The aggregate balance of net after-tax debt valuation adjustment includes an approximate $69 million reconciling adjustment related to a prior period. |
| (3) | For purposes of calculating capital ratios under the Advanced Approach, the allowance for loan losses cannot be included in Tier 2 capital. Instead, an Advanced Approach banking organization may include in Tier 2 capital any eligible credit reserves that exceed its total expected credit losses to the extent that the excess reserve amount does not exceed 0.6% of its Advanced Approach credit risk RWAs. The allowance for loan losses may continue to be included in Tier 2 capital for purposes of calculating capital ratios under U.S. Basel I and Basel 2.5 and under the Standardized Approach, up to 1.25% of credit risk RWAs. |
| 2014(1) | ||||
| (dollars�in�millions) | ||||
| Credit risk RWAs: | ||||
| Balance under U.S. Basel I rules at December�31, 2013 | $ | 256,606 | ||
| Change related to U.S. Basel III Advanced Approach transitional rules(2) | (72,792 | ) | ||
| Change related to the following items: | ||||
| Derivatives | 250 | |||
| Securities financing transactions | (6,090 | ) | ||
| Other counterparty credit risk | (264 | ) | ||
| Securitizations | (1,068 | ) | ||
| Credit valuation adjustment | (4,158 | ) | ||
| AFS debt securities | 1,264 | |||
| Loans | 7,689 | |||
| Cash | (2,245 | ) | ||
| Equity investments | 2,571 | |||
| Other credit risk(3) | 2,882 | |||
| Total change in credit risk RWAs | (71,961 | ) | ||
| Balance at December�31, 2014 | $ | 184,645 | ||
| Market risk RWAs: | ||||
| Balance under U.S. Basel 2.5 rules at December�31, 2013 | $ | 133,760 | ||
| Change related to U.S. Basel III Advanced Approach rules(2) | 12,369 | |||
| Change related to the following items: | ||||
| Regulatory VaR | (1,191 | ) | ||
| Regulatory stressed VaR | (150 | ) | ||
| Incremental risk charge | (5,289 | ) | ||
| Comprehensive risk measure | (6,768 | ) | ||
| Specific risk: | ||||
| Non-securitizations | (6,465 | ) | ||
| Securitizations | (4,903 | ) | ||
| Total change in market risk RWAs | (12,397 | ) | ||
| Balance at December�31, 2014 | $ | 121,363 | ||
| Operational risk RWAs: | ||||
| Balance under U.S. Basel I rules at December�31, 2013 | $ | N/A | ||
| Change related to U.S. Basel III Advanced Approach rules(2) | 150,000 | |||
| Balance at December�31, 2014 | $ | 150,000 | ||
| | 112 |
| (1) | The RWAs for each category in the above table reflect both on- and off-balance sheet exposures, where appropriate. |
| (2) | Represents the estimated impact of the change in methodology to present December�31, 2013 RWAs on a pro forma basis under the U.S. Basel III Advanced Approach transitional rules. |
| (3) | Amount reflects assets not in a defined category, non-material portfolios of exposures and unsettled transactions. |
| At�December�31,�2014 | At�December�31,�2013 | |||||||
| U.S. Basel III Transitional/ Advanced Approach | U.S. Basel I(1) | |||||||
| (dollars�in�millions) | ||||||||
| Common Equity Tier 1 capital: | ||||||||
| Common stock and surplus | $ | 21,503 | $ | 21,622 | ||||
| Retained earnings | 44,625 | 42,172 | ||||||
| Accumulated other comprehensive (loss) | (1,248 | ) | (1,093 | ) | ||||
| Regulatory adjustments and deductions: | ||||||||
| Less: Net goodwill | (6,612 | ) | (6,595 | ) | ||||
| Less: Net intangible assets (other than goodwill and mortgage servicing assets) | (632 | ) | (3,279 | ) | ||||
| Less: Credit spread premium over risk-free rate for derivative liabilities | (161 | ) | N/A | |||||
| Less: Net deferred tax assets | (580 | ) | (2,879 | ) | ||||
| After-tax debt valuation adjustment(2) | 158 | 1,275 | ||||||
| Adjustments related to accumulated other comprehensive income | 462 | 278 | ||||||
| Expected credit loss over eligible credit reserves(3) | (10 | ) | N/A | |||||
| Other adjustments and deductions | (181 | ) | (1,584 | ) | ||||
| Total Common Equity Tier 1 capital | $ | 57,324 | $ | 49,917 | ||||
| Additional Tier 1 capital: | ||||||||
| Preferred stock | $ | 6,020 | $ | 3,220 | ||||
| Trust preferred securities | 2,434 | 4,761 | ||||||
| Nonredeemable noncontrolling interests | 1,004 | 3,109 | ||||||
| Regulatory adjustments and deductions: | ||||||||
| Less: Net deferred tax assets | (2,318 | ) | N/A | |||||
| Less: Credit spread premium over risk-free rate for derivative liabilities | (644 | ) | N/A | |||||
| After-tax debt valuation adjustment(2) | 630 | N/A | ||||||
| Expected credit loss over eligible credit reserves | (39 | ) | N/A | |||||
| Other adjustments and deductions | (229 | ) | N/A | |||||
| Additional Tier 1 capital | $ | 6,858 | $ | 11,090 | ||||
| Total Tier 1 capital | $ | 64,182 | $ | 61,007 | ||||
| Tier 2 capital: | ||||||||
| Subordinated debt | $ | 8,339 | $ | 5,559 | ||||
| Trust preferred securities | 2,434 | N/A | ||||||
| Other qualifying amounts(3) | 27 | 284 | ||||||
| Regulatory adjustments and deductions | (10 | ) | (850 | ) | ||||
| Total Tier 2 capital | $ | 10,790 | $ | 4,993 | ||||
| Total capital | $ | 74,972 | $ | 66,000 | ||||
| 113 | |
| (1) | The standards applicable in 2013 included U.S. Basel I as supplemented by Basel 2.5. |
| (2) | The aggregate balance of net after-tax debt valuation adjustment includes an approximate $69 million reconciling adjustment related to a prior period. |
| (3) | For purposes of calculating capital ratios under the Advanced Approach, the allowance for loan losses cannot be included in Tier 2 capital. Instead, an Advanced Approach banking organization may include in Tier 2 capital any eligible credit reserves that exceed its total expected credit losses to the extent that the excess reserve amount does not exceed 0.6% of its Advanced Approach credit risk RWAs. The allowance for loan losses may continue to be included in Tier 2 capital for purposes of calculating capital ratios under U.S. Basel I and Basel 2.5 and under the Standardized Approach, up to 1.25% of credit risk RWAs. |
| At�December�31,�2014 | At�December�31,�2013 | |||||||
| U.S. Basel III Transitional/ Advanced Approach | U.S. Basel I(1) | |||||||
| (dollars�in�millions) | ||||||||
| RWAs: | ||||||||
| Credit risk | $ | 184,645 | $ | 256,606 | ||||
| Market risk | 121,363 | 133,760 | ||||||
| Operational risk | 150,000 | N/A | ||||||
| Total RWAs | $ | 456,008 | $ | 390,366 | ||||
| Capital ratios: | ||||||||
| Common Equity Tier 1 ratio/Tier 1 common capital ratio | 12.6 | % | 12.8 | % | ||||
| Tier 1 capital ratio | 14.1 | % | 15.6 | % | ||||
| Total capital ratio | 16.4 | % | 16.9 | % | ||||
| Tier 1 leverage ratio | 7.9 | % | 7.6 | % | ||||
| Adjusted average assets | $ | 810,524 | $ | 805,838 | ||||
| (1) | The standards applicable in 2013 included U.S. Basel I as supplemented by Basel 2.5. The Company�s Total capital, Tier 1 capital, Tier 1 common capital and Tier 1 leverage ratios and RWAs at December�31, 2013 were calculated under this framework. |
| At December�31, 2014 | ||||||||
| Fully�Phased-In�Basis�Pro�Forma� Estimates | ||||||||
| U.S. Basel III Advanced�Approach | U.S. Basel III Standardized�Approach | |||||||
| (dollars�in�millions) | ||||||||
| Common Equity Tier 1 capital | $ | 49,433 | $ | 49,433 | ||||
| RWAs | 463,099 | 454,968 | ||||||
| Common Equity Tier 1 capital ratio | 10.7 | % | 10.9 | % | ||||
| | 114 |
| 115 | |
| | 116 |
| December�31,�2014�(U.S.�Basel�III) | December�31,�2013�(U.S.�Basel�I�+�Basel�2.5) | |||||||||||||||
| Average Common�Equity Tier 1 Capital | Average Common Equity | Average Tier�1�Common Capital | Average Common Equity | |||||||||||||
| (dollars�in�billions) | ||||||||||||||||
| Institutional Securities | $ | 31.3 | $ | 32.2 | $ | 32.7 | $ | 37.9 | ||||||||
| Wealth Management | 5.2 | 11.2 | 4.3 | 13.2 | ||||||||||||
| Investment Management | 1.9 | 2.9 | 1.7 | 2.8 | ||||||||||||
| Parent capital | 19.2 | 19.0 | 9.0 | 8.0 | ||||||||||||
| Total | $ | 57.6 | $ | 65.3 | $ | 47.7 | $ | 61.9 | ||||||||
| 117 | |
| | 118 |
| 119 | |
| Maximum Potential Payout/Notional | Carrying Amount (Asset)/ Liability | Collateral/ Recourse | ||||||||||||||||||||||||||
| Years to Maturity | ||||||||||||||||||||||||||||
| Type of Guarantee | Less than�1 | 1-3 | 3-5 | Over�5 | Total | |||||||||||||||||||||||
| (dollars in millions) | ||||||||||||||||||||||||||||
| Credit derivative contracts(1) | $ | 188,357 | $ | 438,999 | $ | 233,886 | $ | 46,820 | $ | 908,062 | $ | (6,611 | ) | $ | � | |||||||||||||
| Other credit contracts | 51 | 539 | 1 | 620 | 1,211 | (500 | ) | � | ||||||||||||||||||||
| Non-credit derivative contracts(1) | 1,386,044 | 713,180 | 269,632 | 517,968 | 2,886,824 | 81,021 | � | |||||||||||||||||||||
| Standby letters of credit and other financial guarantees issued(2) | 607 | 1,102 | 1,056 | 5,792 | 8,557 | (223 | ) | 6,434 | ||||||||||||||||||||
| Market value guarantees | 28 | 426 | 125 | 104 | 683 | 5 | 88 | |||||||||||||||||||||
| Liquidity facilities | 2,507 | � | � | � | 2,507 | (4 | ) | 3,779 | ||||||||||||||||||||
| Whole loan sales guarantees | � | � | � | 23,605 | 23,605 | 9 | � | |||||||||||||||||||||
| Securitization representations and warranties | � | � | � | 65,520 | 65,520 | 98 | � | |||||||||||||||||||||
| General partner guarantees | 72 | � | 58 | 352 | 482 | 71 | � | |||||||||||||||||||||
| (1) | Carrying amounts of derivative contracts are shown on a gross basis prior to cash collateral or counterparty netting. For further information on derivative contracts, see Note 12 to the Company�s consolidated financial statements in Item�8. |
| (2) | Approximately $2.1�billion of standby letters of credit are also reflected in the �Commitments� table below in primary and secondary lending commitments. Standby letters of credit are recorded at fair value within Trading assets or Trading liabilities in the Company�s consolidated statements of financial condition. |
| | 120 |
| Years to Maturity | ||||||||||||||||||||
| Less than�1 | 1-3 | 3-5 | Over�5 | Total
at December�31, 2014 | ||||||||||||||||
| (dollars in millions) | ||||||||||||||||||||
| Letters of credit and other financial guarantees obtained to satisfy collateral requirements | $ | 457 | $ | 1 | $ | � | $ | 2 | $ | 460 | ||||||||||
| Investment activities | 511 | 82 | 24 | 446 | 1,063 | |||||||||||||||
| Primary lending commitments�investment grade(1) | 8,507 | 14,874 | 35,850 | 1,437 | 60,668 | |||||||||||||||
| Primary lending commitments�non-investment grade(1) | 1,101 | 5,148 | 13,062 | 2,051 | 21,362 | |||||||||||||||
| Secondary lending commitments(2) | 1 | 32 | 38 | 116 | 187 | |||||||||||||||
| Commitments for secured lending transactions | 1,194 | 534 | 181 | 919 | 2,828 | |||||||||||||||
| Forward starting reverse repurchase agreements and securities borrowing agreements(3)(4) | 42,033 | � | � | � | 42,033 | |||||||||||||||
| Commercial and residential mortgage-related commitments | 7 | 444 | 528 | 329 | 1,308 | |||||||||||||||
| Underwriting commitments | 290 | � | � | � | 290 | |||||||||||||||
| Other lending commitments | 4,284 | 1,089 | 364 | 98 | 5,835 | |||||||||||||||
| Total | $ | 58,385 | $ | 22,204 | $ | 50,047 | $ | 5,398 | $ | 136,034 | ||||||||||
| (1) | Total amount includes $49.9�billion of investment grade and $13.0�billion of non-investment grade unfunded commitments accounted for as held for investment and $8.4�billion of investment grade and $7.4�billion of non-investment grade unfunded commitments accounted for as held for sale at December�31, 2014. The remainder of these lending commitments is carried at fair value. |
| (2) | These commitments are recorded at fair value within Trading assets and Trading liabilities in the Company�s consolidated statements of financial condition (see Note 4 to the Company�s consolidated financial statements in Item�8). |
| (3) | The Company enters into forward starting reverse repurchase and securities borrowing agreements (agreements that have a trade date at or prior to December�31, 2014 and settle subsequent to period-end) that are primarily secured by collateral from U.S. government agency securities and other sovereign government obligations. These agreements primarily settle within three business days, and of the total amount at December�31, 2014, $41.2 billion settled within three business days. |
| (4) | The Company also has a contingent obligation to provide financing to a clearinghouse through which it clears certain transactions. The financing is required only upon the default of a clearinghouse member. The financing takes the form of a reverse repurchase facility, with a maximum amount of approximately $0.5 billion. |
| 121 | |
| Payments Due in: | ||||||||||||||||||||
| At December�31, 2014 | 2015 | 2016-2017 | 2018-2019 | Thereafter | Total | |||||||||||||||
| (dollars in millions) | ||||||||||||||||||||
| Long-term borrowings(1) | $ | 20,740 | $ | 44,643 | $ | 35,250 | $ | 52,139 | $ | 152,772 | ||||||||||
| Other secured financings(1) | 3,341 | 5,586 | 980 | 439 | 10,346 | |||||||||||||||
| Contractual interest payments(2) | 5,384 | 8,615 | 5,759 | 21,025 | 40,783 | |||||||||||||||
| Time deposits(3) | 1,386 | � | � | � | 1,386 | |||||||||||||||
| Operating leases�premises(4) | 599 | 1,159 | 847 | 2,588 | 5,193 | |||||||||||||||
| Operating leases�equipment(4) | 204 | 200 | 145 | 61 | 610 | |||||||||||||||
| Purchase obligations(5) | 546 | 615 | 244 | 70 | 1,475 | |||||||||||||||
| Total(6) | $ | 32,200 | $ | 60,818 | $ | 43,225 | $ | 76,322 | $ | 212,565 | ||||||||||
| (1) | See Note 11 to the Company�s consolidated financial statements in Item�8. Amounts presented for Other secured financings are financings with original maturities greater than one year. |
| (2) | Amounts represent estimated future contractual interest payments related to unsecured long-term borrowings based on applicable interest rates at December�31, 2014. Amounts include stated coupon rates, if any, on structured or index-linked notes. |
| (3) | Amounts represent contractual principal and interest payments related to time deposits primarily held at the Company�s U.S. Subsidiary Banks. |
| (4) | See Note 13 to the Company�s consolidated financial statements in Item�8. |
| (5) | Purchase obligations for goods and services include payments for, among other things, consulting, outsourcing, computer and telecommunications maintenance agreements, and certain transmission, transportation and storage contracts related to the commodities business. Purchase obligations at December�31, 2014 reflect the minimum contractual obligation under legally enforceable contracts with contract terms that are both fixed and determinable. These amounts exclude obligations for goods and services that already have been incurred and are reflected on the Company�s consolidated statement of financial condition. |
| (6) | Amounts exclude unrecognized tax benefits, as the timing and amount of future cash payments are not determinable at this time (see Note 20 to the Company�s consolidated financial statements in Item�8 for further information). |
| | 122 |
| 123 | |
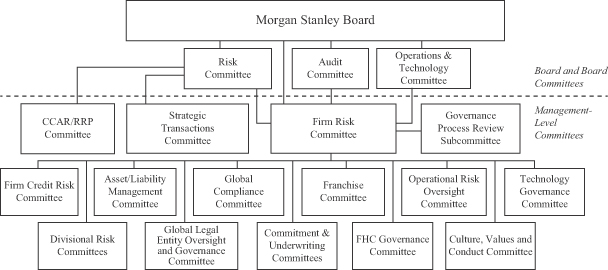 Morgan Stanley Board of
Directors. The Board has oversight for the Company�s ERM framework is responsible for helping to ensure that the Company�s risks are managed in a sound manner. The Board has authorized the committees within
the ERM framework to help facilitate its risk oversight responsibilities. As set forth in the Company�s Corporate Governance Policies, the Board also oversees, and receives reports on, the Company�s practices and procedures relating to
culture, values and conduct. Risk Committee of the
Board. The BRC is composed of non-management directors. The BRC is responsible for assisting the Board in the oversight of the Company�s global ERM framework; the major risk exposures of the Company, including
market, credit, operational, liquidity and funding, franchise and reputational risk; the Company�s risk appetite statement, including risk limits and tolerances; risk management and risk assessment guidelines; and the performance of the Chief
Risk Officer. The BRC reports to the entire Board on a regular basis and the entire Board attends quarterly BRC meetings. Audit Committee of the Board. The BAC is composed of independent directors. The BAC is responsible for oversight of
the integrity of the Company�s consolidated financial statements, the Company�s compliance with legal and regulatory requirements, the Company�s system of internal controls, the qualifications and independence of the Company�s
independent auditor, and the performance of the Company�s internal and independent auditors. In addition, the BAC assists the Board and the BRC in its oversight of certain aspects of risk management, including review of the major legal and
compliance risk exposures of the Company and the steps management has taken to monitor and control such exposures, as well as guidelines and policies that govern the process for risk assessment and risk management. The BAC reports to the entire
Board, including the BRC, on a regular basis. Operations
and Technology Committee of the Board. The BOTC is composed of non-management directors. The BOTC is responsible for reviewing the major operations and technology risk exposures of the Company, including cybersecurity
risk, and the steps management has taken to monitor and control such exposures. Additionally, the BOTC is responsible for assisting the Board in its oversight of the Company�s operations and technology strategy, including significant
investments in support of such strategy. The BOTC is also responsible for the review and approval of operations and technology policies, as well as the review of the Company�s risk management and risk assessment guidelines and policies
regarding operations and technology risk. The BOTC reports to the entire Board, including the BRC, on a regular basis.
Morgan Stanley Board of
Directors. The Board has oversight for the Company�s ERM framework is responsible for helping to ensure that the Company�s risks are managed in a sound manner. The Board has authorized the committees within
the ERM framework to help facilitate its risk oversight responsibilities. As set forth in the Company�s Corporate Governance Policies, the Board also oversees, and receives reports on, the Company�s practices and procedures relating to
culture, values and conduct. Risk Committee of the
Board. The BRC is composed of non-management directors. The BRC is responsible for assisting the Board in the oversight of the Company�s global ERM framework; the major risk exposures of the Company, including
market, credit, operational, liquidity and funding, franchise and reputational risk; the Company�s risk appetite statement, including risk limits and tolerances; risk management and risk assessment guidelines; and the performance of the Chief
Risk Officer. The BRC reports to the entire Board on a regular basis and the entire Board attends quarterly BRC meetings. Audit Committee of the Board. The BAC is composed of independent directors. The BAC is responsible for oversight of
the integrity of the Company�s consolidated financial statements, the Company�s compliance with legal and regulatory requirements, the Company�s system of internal controls, the qualifications and independence of the Company�s
independent auditor, and the performance of the Company�s internal and independent auditors. In addition, the BAC assists the Board and the BRC in its oversight of certain aspects of risk management, including review of the major legal and
compliance risk exposures of the Company and the steps management has taken to monitor and control such exposures, as well as guidelines and policies that govern the process for risk assessment and risk management. The BAC reports to the entire
Board, including the BRC, on a regular basis. Operations
and Technology Committee of the Board. The BOTC is composed of non-management directors. The BOTC is responsible for reviewing the major operations and technology risk exposures of the Company, including cybersecurity
risk, and the steps management has taken to monitor and control such exposures. Additionally, the BOTC is responsible for assisting the Board in its oversight of the Company�s operations and technology strategy, including significant
investments in support of such strategy. The BOTC is also responsible for the review and approval of operations and technology policies, as well as the review of the Company�s risk management and risk assessment guidelines and policies
regarding operations and technology risk. The BOTC reports to the entire Board, including the BRC, on a regular basis. | | 124 |
| 125 | |
| | 126 |
| 127 | |
| | 128 |
| 129 | |
| Table 1: 95% Management VaR | 95%/One-Day VaR for 2014 | 95%/One-Day VaR for 2013 | ||||||||||||||||||||||||||||||
| Market Risk Category | Period End | Average | High | Low | Period End | Average | High | Low | ||||||||||||||||||||||||
| (dollars in millions) | ||||||||||||||||||||||||||||||||
| Interest rate and credit spread | $ | 31 | $ | 31 | $ | 44 | $ | 25 | $ | 41 | $ | 45 | $ | 76 | $ | 31 | ||||||||||||||||
| Equity price | 18 | 18 | 26 | 15 | 22 | 19 | 43 | 15 | ||||||||||||||||||||||||
| Foreign exchange rate | 10 | 11 | 17 | 6 | 15 | 14 | 22 | 7 | ||||||||||||||||||||||||
| Commodity price | 15 | 17 | 24 | 12 | 15 | 21 | 31 | 15 | ||||||||||||||||||||||||
| Less: Diversification benefit(1)(2) | (30 | ) | (34 | ) | N/A | N/A | (44 | ) | (46 | ) | N/A | N/A | ||||||||||||||||||||
| Primary Risk Categories | $ | 44 | $ | 43 | $ | 53 | $ | 34 | $ | 49 | $ | 53 | $ | 78 | $ | 42 | ||||||||||||||||
| Credit Portfolio | 15 | 11 | 15 | 9 | 12 | 14 | 18 | 12 | ||||||||||||||||||||||||
| Less: Diversification benefit(1)(2) | (14 | ) | (7 | ) | N/A | N/A | (8 | ) | (8 | ) | N/A | N/A | ||||||||||||||||||||
| Total Management VaR | $ | 45 | $ | 47 | $ | 58 | $ | 38 | $ | 53 | $ | 59 | $ | 85 | $ | 47 | ||||||||||||||||
| (1) | Diversification benefit equals the difference between the total Management VaR and the sum of the component VaRs. This benefit arises because the simulated one-day losses for each of the components occur on different days; similar diversification benefits also are taken into account within each component. |
| (2) | The high and low VaR values for the total Management VaR and each of the component VaRs might have occurred on different days during the year, and therefore, the diversification benefit is not an applicable measure. |
| | 130 |
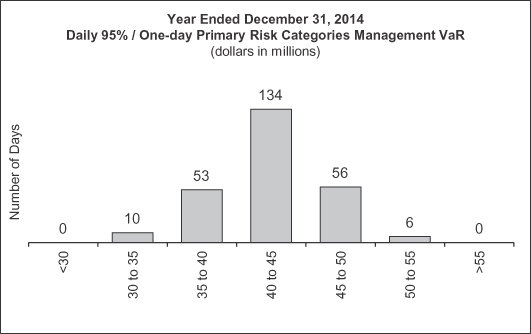
| 131 | |
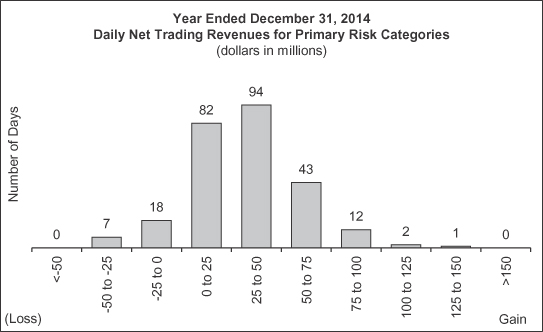
| | 132 |
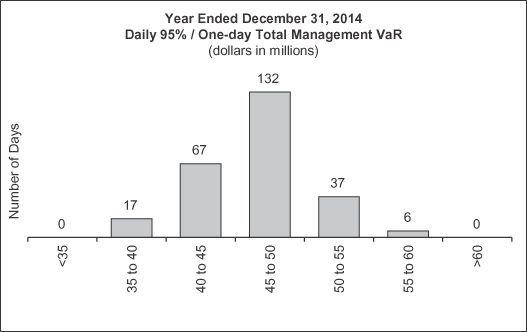
| 133 | |
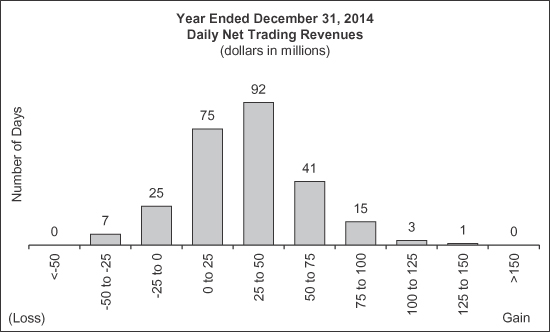 Non-trading Risks. The Company believes that sensitivity analysis is an
appropriate representation of the Company�s non-trading risks. Reflected below is this analysis covering substantially all of the non-trading risk in the Company�s portfolio. Counterparty Exposure Related to the Company�s Own Credit Spread. The credit spread risk relating to the Company�s own mark-to-market
derivative counterparty exposure is managed separately from VaR. The credit spread risk sensitivity of this exposure corresponds to an increase in value of approximately $6 million and $5 million for each 1 basis point widening in the Company�s
credit spread level for December�31, 2014 and December�31, 2013, respectively. Funding Liabilities. The credit spread risk sensitivity of the Company�s mark-to-market funding liabilities corresponded to an increase in value of approximately $10 million and $11 million for each 1 basis point
widening in the Company�s credit spread level for December�31, 2014 and December�31, 2013, respectively. Interest Rate Risk Sensitivity on Income from Continuing Operations. The Company measures the interest rate risk of certain assets and
liabilities by calculating the hypothetical sensitivity of net interest income to potential changes in the level of interest rates over the next 12 months. This
Non-trading Risks. The Company believes that sensitivity analysis is an
appropriate representation of the Company�s non-trading risks. Reflected below is this analysis covering substantially all of the non-trading risk in the Company�s portfolio. Counterparty Exposure Related to the Company�s Own Credit Spread. The credit spread risk relating to the Company�s own mark-to-market
derivative counterparty exposure is managed separately from VaR. The credit spread risk sensitivity of this exposure corresponds to an increase in value of approximately $6 million and $5 million for each 1 basis point widening in the Company�s
credit spread level for December�31, 2014 and December�31, 2013, respectively. Funding Liabilities. The credit spread risk sensitivity of the Company�s mark-to-market funding liabilities corresponded to an increase in value of approximately $10 million and $11 million for each 1 basis point
widening in the Company�s credit spread level for December�31, 2014 and December�31, 2013, respectively. Interest Rate Risk Sensitivity on Income from Continuing Operations. The Company measures the interest rate risk of certain assets and
liabilities by calculating the hypothetical sensitivity of net interest income to potential changes in the level of interest rates over the next 12 months. This | | 134 |
| +200�Basis Points | +100�Basis Points | -100�
Basis Points(1) | ||||||||||
| (dollars in millions) | ||||||||||||
| Impact on the Company�s consolidated income from continuing operations before income taxes: | ||||||||||||
| December 31, 2014 | $ | 1,117 | $ | 635 | N/M | |||||||
| December 31, 2013 | 1,102 | 642 | N/M | |||||||||
| (1) | N/M�Not Meaningful given the current low interest rate environment. |
| +200�Basis Points | +100�Basis Points | -100�Basis Points | ||||||||||
| (dollars in millions) | ||||||||||||
| Impact on the Company�s U.S. Subsidiary Banks� income from continuing operations before income taxes: | ||||||||||||
| December 31, 2014 | $ | 256 | $ | 204 | $ | (393 | ) | |||||
| December 31, 2013 | 503 | 342 | (255 | ) | ||||||||
| 10% Sensitivity | ||||||||
| Investments | At�December�31,�2014 | At�December�31,�2013 | ||||||
| (dollars in millions) | ||||||||
| Investments related to Investment Management activities: | ||||||||
| Hedge fund investments | $ | 109 | $ | 104 | ||||
| Private equity and infrastructure funds | 136 | 148 | ||||||
| Real estate funds | 150 | 158 | ||||||
| Other investments: | ||||||||
| Mitsubishi UFJ Morgan Stanley Securities Co., Ltd. | 142 | 161 | ||||||
| Other Company investments | 195 | 198 | ||||||
| 135 | |
| � | entering into swap or other derivative contracts under which counterparties have obligations to make payments to the Company; |
| � | extending credit to clients through various lending commitments; |
| � | providing short- or long-term funding that is secured by physical or financial collateral whose value may at times be insufficient to fully cover the loan repayment amount; |
| � | posting margin and/or collateral to clearinghouses, clearing agencies, exchanges, banks, securities firms and other financial counterparties; |
| � | placing funds on deposit at other financial institutions to support the Company�s clearing and settlement obligations; and |
| � | investing or trading in securities and loan pools, whereby the value of these assets may fluctuate based on realized or expected defaults on the underlying obligations or loans. |
| � | margin loans collateralized by securities; |
| � | securities-based and other forms of secured loans; and |
| � | single-family residential mortgage loans in conforming, non-conforming or home equity lines of credit (�HELOC�) form, primarily to existing Wealth Management clients. |
| | 136 |
| 137 | |
| At December�31, 2014 | ||||||||||||||||
| Institutional Securities Corporate Lending(1) | Institutional Securities Other Lending(2) | Wealth Management Lending(3) | Total(4) | |||||||||||||
| (dollars in millions) | ||||||||||||||||
| Corporate loans | $ | 7,957 | $ | 6,161 | $ | 5,423 | $ | 19,541 | ||||||||
| Consumer loans | � | � | 16,574 | 16,574 | ||||||||||||
| Residential real estate loans | � | � | 15,727 | 15,727 | ||||||||||||
| Wholesale real estate loans | � | 5,277 | � | 5,277 | ||||||||||||
| Loans held for investment, net of allowance | 7,957 | 11,438 | 37,724 | 57,119 | ||||||||||||
| Corporate loans | 7,801 | 399 | � | 8,200 | ||||||||||||
| Consumer loans | � | � | � | � | ||||||||||||
| Residential real estate loans | � | 16 | 98 | 114 | ||||||||||||
| Wholesale real estate loans | � | 1,144 | � | 1,144 | ||||||||||||
| Loans held for sale | 7,801 | 1,559 | 98 | 9,458 | ||||||||||||
| Corporate loans | 483 | 6,610 | � | 7,093 | ||||||||||||
| Consumer loans | � | � | � | � | ||||||||||||
| Residential real estate loans | � | 1,682 | � | 1,682 | ||||||||||||
| Wholesale real estate loans | � | 3,187 | � | 3,187 | ||||||||||||
| Loans held at fair value | 483 | 11,479 | � | 11,962 | ||||||||||||
| Total loans | $ | 16,241 | $ | 24,476 | $ | 37,822 | $ | 78,539 | ||||||||
| (1) | In addition to loans, at December�31, 2014, $62.9 billion of unfunded lending commitments were accounted for as held for investment, $15.8 billion of unfunded lending commitments were accounted for as held for sale and $3.3 billion of unfunded lending commitments were accounted for at fair value. |
| (2) | In addition to loans, at December�31, 2014, $2.3 billion of unfunded lending commitments were�accounted for as held for investment, $0.8 billion of unfunded lending commitments were accounted for as held for sale and $2.1 billion of unfunded lending commitments were accounted for at fair value. |
| (3) | In addition to loans, at December�31, 2014, $5.0 billion of unfunded lending commitments were accounted for as held for investment. |
| (4) | Amounts exclude customer margin loans outstanding of $29.0 billion and employee loans outstanding of $5.1 billion at December�31, 2014. See Notes 6 and 8 to the Company�s consolidated financial statements in Item�8 for further information. |
| | 138 |
| At December�31, 2013 | ||||||||||||||||
| Institutional Securities Corporate Lending(1) | Institutional Securities Other Lending(2) | Wealth Management Lending(3) | Total(4) | |||||||||||||
| (dollars in millions) | ||||||||||||||||
| Corporate loans | $ | 7,837 | $ | 1,988 | $ | 3,301 | $ | 13,126 | ||||||||
| Consumer loans | � | � | 11,576 | 11,576 | ||||||||||||
| Residential real estate loans | � | 1 | 10,001 | 10,002 | ||||||||||||
| Wholesale real estate loans | � | 1,835 | 6 | 1,841 | ||||||||||||
| Loans held for investment, net of allowance | 7,837 | 3,824 | 24,884 | 36,545 | ||||||||||||
| Corporate loans | 6,168 | � | � | 6,168 | ||||||||||||
| Consumer loans | � | � | � | � | ||||||||||||
| Residential real estate loans | � | 12 | 100 | 112 | ||||||||||||
| Wholesale real estate loans | � | 49 | � | 49 | ||||||||||||
| Loans held for sale | 6,168 | 61 | 100 | 6,329 | ||||||||||||
| Corporate loans | 2,892 | 6,882 | � | 9,774 | ||||||||||||
| Consumer loans | � | � | � | � | ||||||||||||
| Residential real estate loans | � | 1,434 | � | 1,434 | ||||||||||||
| Wholesale real estate loans | � | 1,404 | � | 1,404 | ||||||||||||
| Loans held at fair value | 2,892 | 9,720 | � | 12,612 | ||||||||||||
| Total loans | $ | 16,897 | $ | 13,605 | $ | 24,984 | $ | 55,486 | ||||||||
| (1) | In addition to loans, at December�31, 2013, $61.4 billion of unfunded lending commitments were accounted for as held for investment, $8.1 billion of unfunded lending commitments were accounted for as held for sale and $9.1 billion of unfunded lending commitments were accounted for at fair value. |
| (2) | In addition to loans, at December�31, 2013, $1.3 billion of unfunded lending commitments were�accounted for as held for investment and $0.8 billion of unfunded lending commitments were accounted for at fair value. |
| (3) | In addition to loans, at December�31, 2013, $4.5 billion of unfunded lending commitments were accounted for as held for investment. |
| (4) | Amounts exclude customer margin loans outstanding of $29.2 billion and employee loans outstanding of $5.5 billion at December�31, 2013. See Notes 6 and 8 to the Company�s consolidated financial statements in Item�8 for further information. |
| 139 | |
| At December�31, 2014 | ||||||||||||||||||||
| Years to Maturity | ||||||||||||||||||||
| Credit Rating(1) | Less�than�1 | 1-3 | 3-5 | Over 5 | Total(2)(3) | |||||||||||||||
| (dollars in millions) | ||||||||||||||||||||
| AAA | $ | 275 | $ | 74 | $ | 37 | $ | � | $ | 386 | ||||||||||
| AA | 3,760 | 2,764 | 4,580 | � | 11,104 | |||||||||||||||
| A | 2,135 | 4,534 | 12,029 | 173 | 18,871 | |||||||||||||||
| BBB | 3,350 | 9,303 | 22,424 | 1,503 | 36,580 | |||||||||||||||
| Investment grade | 9,520 | 16,675 | 39,070 | 1,676 | 66,941 | |||||||||||||||
| Non-investment�grade | 2,034 | 7,222 | 17,755 | 4,050 | 31,061 | |||||||||||||||
| Total | $ | 11,554 | $ | 23,897 | $ | 56,825 | $ | 5,726 | $ | 98,002 | ||||||||||
| (1) | Obligor credit ratings are determined by the Company�s Credit Risk Management Department. |
| (2) | For syndications led by the Company, lending commitments accepted by the borrower but not yet closed are net of the amounts agreed to by counterparties that will participate in the syndication. For syndications that the Company participates in and does not lead, lending commitments accepted by the borrower but not yet closed include only the amount that the Company expects it will be allocated from the lead syndicate bank. |
| (3) | Amounts include the fair value adjustment of ($0.3) billion related to the Company�s unfunded lending commitments. |
| At December�31, 2013(1) | ||||||||||||||||||||
| Years to Maturity | ||||||||||||||||||||
| Credit Rating(2) | Less�than�1 | 1-3 | 3-5 | Over 5 | Total(3)(4) | |||||||||||||||
| (dollars in millions) | ||||||||||||||||||||
| AAA | $ | 859 | $ | 114 | $ | 121 | $ | � | $ | 1,094 | ||||||||||
| AA | 2,718 | 1,870 | 5,556 | � | 10,144 | |||||||||||||||
| A | 3,159 | 4,230 | 11,417 | 598 | 19,404 | |||||||||||||||
| BBB | 2,486 | 10,551 | 21,530 | 752 | 35,319 | |||||||||||||||
| Investment grade | 9,222 | 16,765 | 38,624 | 1,350 | 65,961 | |||||||||||||||
| Non-investment�grade | 2,757 | 8,069 | 13,028 | 5,572 | 29,426 | |||||||||||||||
| Total | $ | 11,979 | $ | 24,834 | $ | 51,652 | $ | 6,922 | $ | 95,387 | ||||||||||
| (1) | All prior-year amounts have been recast to conform to the current year�s presentation. |
| (2) | Obligor credit ratings are determined by the Company�s Credit Risk Management Department. |
| (3) | For syndications led by the Company, lending commitments accepted by the borrower but not yet closed are net of the amounts agreed to by counterparties that will participate in the syndication. For syndications that the Company participates in and does not lead, lending |
| | 140 |
| commitments accepted by the borrower but not yet closed include only the amount that the Company expects it will be allocated from the lead syndicate bank. |
| (4) | Amounts include the fair value adjustment of ($0.1) billion related to the Company�s unfunded lending commitments. |
| Industry | At�December�31,�2014 | At�December�31,�2013(1) | ||||||
| (dollars in millions) | ||||||||
| Energy | $ | 14,056 | $ | 12,240 | ||||
| Utilities | 11,717 | 10,404 | ||||||
| Consumer discretionary | 10,214 | 10,332 | ||||||
| Healthcare | 9,707 | 10,096 | ||||||
| Funds, exchanges and other financial services(2) | 9,277 | 9,297 | ||||||
| Industrials | 9,134 | 10,976 | ||||||
| Information technology | 7,572 | 6,882 | ||||||
| Consumer staples | 7,320 | 6,964 | ||||||
| Materials | 5,259 | 4,895 | ||||||
| Real Estate | 4,616 | 4,161 | ||||||
| Telecommunications services | 4,335 | 5,684 | ||||||
| Other | 4,795 | 3,456 | ||||||
| Total | $ | 98,002 | $ | 95,387 | ||||
| (1) | All prior-year amounts have been recast to conform to the current year�s presentation. |
| (2) | Includes mutual funds, pension funds, private equity and real estate funds, exchanges and clearinghouses and diversified financial services. |
| 141 | |
| At December�31, 2014 | ||||||||||||||||||||
| Years to Maturity | ||||||||||||||||||||
| Less�than�1 | 1-3 | 3-5 | Over 5 | Total | ||||||||||||||||
| (dollars in millions) | ||||||||||||||||||||
| Corporate loans | $ | 4,231 | $ | 4,826 | $ | 1,884 | $ | 2,229 | $ | 13,170 | ||||||||||
| Residential real estate loans | � | 43 | � | 1,655 | 1,698 | |||||||||||||||
| Wholesale real estate loans | 100 | 5,060 | 2,112 | 2,336 | 9,608 | |||||||||||||||
| Total | $ | 4,331 | $ | 9,929 | $ | 3,996 | $ | 6,220 | $ | 24,476 | ||||||||||
| At December�31, 2013 | ||||||||||||||||||||
| Years to Maturity | ||||||||||||||||||||
| Less�than�1 | 1-3 | 3-5 | Over 5 | Total | ||||||||||||||||
| (dollars in millions) | ||||||||||||||||||||
| Corporate loans | $ | 3,957 | $ | 1,236 | $ | 2,455 | $ | 1,222 | $ | 8,870 | ||||||||||
| Residential real estate loans | 8 | 16 | 91 | 1,332 | 1,447 | |||||||||||||||
| Wholesale real estate loans | 174 | 909 | 885 | 1,320 | 3,288 | |||||||||||||||
| Total | $ | 4,139 | $ | 2,161 | $ | 3,431 | $ | 3,874 | $ | 13,605 | ||||||||||
| At December�31, 2014 | ||||||||||||||||||||
| Years to Maturity | ||||||||||||||||||||
| Less�than�1 | 1-3 | 3-5 | Over 5 | Total | ||||||||||||||||
| (dollars in millions) | ||||||||||||||||||||
| Securities-based lending and other loans | $ | 19,408 | $ | 1,071 | $ | 750 | $ | 768 | $ | 21,997 | ||||||||||
| Residential real estate loans | � | � | � | 15,825 | 15,825 | |||||||||||||||
| Total | $ | 19,408 | $ | 1,071 | $ | 750 | $ | 16,593 | $ | 37,822 | ||||||||||
| At December 31, 2013 | ||||||||||||||||||||
| Years to Maturity | ||||||||||||||||||||
| Less�than�1 | 1-3 | 3-5 | Over 5 | Total | ||||||||||||||||
| (dollars in millions) | ||||||||||||||||||||
| Securities-based lending and other loans | $ | 13,241 | $ | 509 | $ | 539 | $ | 594 | $ | 14,883 | ||||||||||
| Residential real estate loans | � | � | � | 10,101 | 10,101 | |||||||||||||||
| Total | $ | 13,241 | $ | 509 | $ | 539 | $ | 10,695 | $ | 24,984 | ||||||||||
| | 142 |
| 143 | |
| At December�31, 2014 | ||||||||||||||||||||
| Fair Values(1) | Notionals | |||||||||||||||||||
| Receivable | Payable | Net | Beneficiary | Guarantor | ||||||||||||||||
| (dollars in millions) | ||||||||||||||||||||
| Banks and securities firms | $ | 25,452 | $ | 25,323 | $ | 129 | $ | 712,466 | $ | 687,155 | ||||||||||
| Insurance and other financial institutions | 6,639 | 6,697 | (58 | ) | 216,489 | 217,201 | ||||||||||||||
| Non-financial entities | 91 | 89 | 2 | 5,049 | 3,706 | |||||||||||||||
| Total | $ | 32,182 | $ | 32,109 | $ | 73 | $ | 934,004 | $ | 908,062 | ||||||||||
| (1) | The Company�s CDS are classified in either Level 2 or Level 3 of the fair value hierarchy. Approximately 4% of receivable fair values and 7% of payable fair values represent Level 3 amounts (see Note 4 to the Company�s consolidated financial statements in Item�8). |
| At December�31, 2013 | ||||||||||||||||||||
| Fair Values(1) | Notionals | |||||||||||||||||||
| Receivable | Payable | Net | Beneficiary | Guarantor | ||||||||||||||||
| (dollars in millions) | ||||||||||||||||||||
| Banks and securities firms | $ | 60,728 | $ | 57,399 | $ | 3,329 | $ | 1,620,774 | $ | 1,573,217 | ||||||||||
| Insurance and other financial institutions | 7,313 | 6,908 | 405 | 278,705 | 313,897 | |||||||||||||||
| Non-financial entities | 226 | 187 | 39 | 7,922 | 6,078 | |||||||||||||||
| Total | $ | 68,267 | $ | 64,494 | $ | 3,773 | $ | 1,907,401 | $ | 1,893,192 | ||||||||||
| (1) | The Company�s CDS are classified in either Level 2 or Level 3 of the fair value hierarchy. Approximately 7% of receivable fair values and 5% of payable fair values represent Level 3 amounts (see Note 4 to the consolidated financial statements in Item�8). |
| | 144 |
| Industry | At�December�31,�2014 | At�December�31,�2013 | ||||||
| (dollars in millions) | ||||||||
| Utilities | $ | 3,797 | $ | 3,142 | ||||
| Banks and securities firms | 3,297 | 2,358 | ||||||
| Funds, exchanges and other financial services(1) | 2,321 | 2,433 | ||||||
| Industrials | 2,278 | 914 | ||||||
| Regional governments | 1,603 | 1,597 | ||||||
| Healthcare | 1,365 | 1,089 | ||||||
| Special purpose vehicles | 1,089 | 1,908 | ||||||
| Not-for-profit organizations | 905 | 672 | ||||||
| Sovereign governments | 889 | 816 | ||||||
| Real Estate | 761 | 503 | ||||||
| Consumer staples | 650 | 487 | ||||||
| Other | 3,272 | 1,695 | ||||||
| Total(2) | $ | 22,227 | $ | 17,614 | ||||
| (1) | Amounts include mutual funds, pension funds, private equity and real estate funds, exchanges and clearinghouses and diversified financial services. |
| (2) | For further information on derivative instruments and hedging activities, see Note 12 to the Company�s consolidated financial statements in Item�8. |
| 145 | |
| | 146 |
| Country | Net Inventory(1) | Net Counterparty Exposure(2)(3) | Funded Lending | Unfunded Commitments | Exposure Before Hedges | Hedges(4) | Net Exposure(5) | Increase/ (Decrease)�in� Net Exposure from December�31, 2013 | ||||||||||||||||||||||||
| (dollars in millions) | ||||||||||||||||||||||||||||||||
| United Kingdom: | ||||||||||||||||||||||||||||||||
| Sovereigns | $ | (547 | ) | $ | 110 | $ | � | $ | � | $ | (437 | ) | $ | (36 | ) | $ | (473 | ) | $ | (805 | ) | |||||||||||
| Non-sovereigns | 1,977 | 13,005 | 1,703 | 6,888 | 23,573 | (2,106 | ) | 21,467 | 3,816 | |||||||||||||||||||||||
| Subtotal | $ | 1,430 | $ | 13,115 | $ | 1,703 | $ | 6,888 | $ | 23,136 | $ | (2,142 | ) | $ | 20,994 | $ | 3,011 | |||||||||||||||
| Germany: | ||||||||||||||||||||||||||||||||
| Sovereigns | $ | 1,488 | $ | 286 | $ | � | $ | � | $ | 1,774 | $ | (1,765 | ) | $ | 9 | $ | 1,365 | |||||||||||||||
| Non-sovereigns | 682 | 2,655 | 533 | 3,786 | 7,656 | (1,813 | ) | 5,843 | (932 | ) | ||||||||||||||||||||||
| Subtotal | $ | 2,170 | $ | 2,941 | $ | 533 | $ | 3,786 | $ | 9,430 | $ | (3,578 | ) | $ | 5,852 | $ | 433 | |||||||||||||||
| Brazil: | ||||||||||||||||||||||||||||||||
| Sovereigns | $ | 3,222 | $ | � | $ | � | $ | � | $ | 3,222 | $ | � | $ | 3,222 | $ | (238 | ) | |||||||||||||||
| Non-sovereigns | 10 | 219 | 949 | 150 | 1,328 | (684 | ) | 644 | (552 | ) | ||||||||||||||||||||||
| Subtotal | $ | 3,232 | $ | 219 | $ | 949 | $ | 150 | $ | 4,550 | $ | (684 | ) | $ | 3,866 | $ | (790 | ) | ||||||||||||||
| France: | ||||||||||||||||||||||||||||||||
| Sovereigns | $ | (1,293 | ) | $ | � | $ | � | $ | � | $ | (1,293 | ) | $ | � | $ | (1,293 | ) | $ | (591 | ) | ||||||||||||
| Non-sovereigns | 482 | 2,221 | 195 | 2,890 | 5,788 | (707 | ) | 5,081 | 395 | |||||||||||||||||||||||
| Subtotal | $ | (811 | ) | $ | 2,221 | $ | 195 | $ | 2,890 | $ | 4,495 | $ | (707 | ) | $ | 3,788 | $ | (196 | ) | |||||||||||||
| China: | ||||||||||||||||||||||||||||||||
| Sovereigns | $ | 484 | $ | 130 | $ | � | $ | � | $ | 614 | $ | � | $ | 614 | $ | 147 | ||||||||||||||||
| Non-sovereigns | 1,657 | 364 | 548 | 396 | 2,965 | (44 | ) | 2,921 | 989 | |||||||||||||||||||||||
| Subtotal | $ | 2,141 | $ | 494 | $ | 548 | $ | 396 | $ | 3,579 | $ | (44 | ) | $ | 3,535 | $ | 1,136 | |||||||||||||||
| Singapore: | ||||||||||||||||||||||||||||||||
| Sovereigns | $ | 2,394 | $ | 207 | $ | � | $ | � | $ | 2,601 | $ | � | $ | 2,601 | $ | 244 | ||||||||||||||||
| Non-sovereigns | 172 | 513 | 59 | 122 | 866 | � | 866 | (33 | ) | |||||||||||||||||||||||
| Subtotal | $ | 2,566 | $ | 720 | $ | 59 | $ | 122 | $ | 3,467 | $ | � | $ | 3,467 | $ | 211 | ||||||||||||||||
| Canada: | ||||||||||||||||||||||||||||||||
| Sovereigns | $ | (169 | ) | $ | 78 | $ | � | $ | � | $ | (91 | ) | $ | � | $ | (91 | ) | $ | (1,102 | ) | ||||||||||||
| Non-sovereigns | (230 | ) | 1,837 | 188 | 1,354 | 3,149 | (86 | ) | 3,063 | (288 | ) | |||||||||||||||||||||
| Subtotal | $ | (399 | ) | $ | 1,915 | $ | 188 | $ | 1,354 | $ | 3,058 | $ | (86 | ) | $ | 2,972 | $ | (1,390 | ) | |||||||||||||
| Australia: | ||||||||||||||||||||||||||||||||
| Sovereigns | $ | (25 | ) | $ | 14 | $ | � | $ | � | $ | (11 | ) | $ | � | $ | (11 | ) | $ | 44 | |||||||||||||
| Non-sovereigns | 892 | 799 | 320 | 1,139 | 3,150 | (392 | ) | 2,758 | 65 | |||||||||||||||||||||||
| Subtotal | $ | 867 | $ | 813 | $ | 320 | $ | 1,139 | $ | 3,139 | $ | (392 | ) | $ | 2,747 | $ | 109 | |||||||||||||||
| Italy: | ||||||||||||||||||||||||||||||||
| Sovereigns | $ | 1,119 | $ | 12 | $ | � | $ | � | $ | 1,131 | $ | (101 | ) | $ | 1,030 | $ | 281 | |||||||||||||||
| Non-sovereigns | 613 | 519 | � | 683 | 1,815 | (153 | ) | 1,662 | 168 | |||||||||||||||||||||||
| Subtotal | $ | 1,732 | $ | 531 | $ | � | $ | 683 | $ | 2,946 | $ | (254 | ) | $ | 2,692 | $ | 449 | |||||||||||||||
| Netherlands: | ||||||||||||||||||||||||||||||||
| Sovereigns | $ | (180 | ) | $ | 2 | $ | � | $ | � | $ | (178 | ) | $ | (23 | ) | $ | (201 | ) | $ | 67 | ||||||||||||
| Non-sovereigns | 477 | 859 | 114 | 1,299 | 2,749 | (307 | ) | 2,442 | (452 | ) | ||||||||||||||||||||||
| Subtotal | $ | 297 | $ | 861 | $ | 114 | $ | 1,299 | $ | 2,571 | $ | (330 | ) | $ | 2,241 | $ | (385 | ) | ||||||||||||||
| 147 | |
| (1) | Net inventory represents exposure to both long and short single-name and index positions ( i.e. , bonds and equities at fair value and CDS based on notional amount assuming zero recovery adjusted for any fair value receivable or payable). As a market maker, the Company transacts in these CDS positions to facilitate client trading. At December�31, 2014, gross purchased protection, gross written protection and net exposures related to single-name and index credit derivatives for those countries were $(261.7) billion, $259.6 billion and $(0.2) billion, respectively. For a further description of the triggers for purchased credit protection and whether those triggers may limit the effectiveness of the Company�s hedges, see �Credit Exposure�Derivatives� herein. |
| (2) | Net counterparty exposure ( i.e ., repurchase transactions, securities lending and OTC derivatives) takes into consideration legally enforceable master netting agreements and collateral. |
| (3) | At December�31, 2014, the benefit of collateral received against counterparty credit exposure was $11.9 billion in the U.K., with 98% of collateral consisting of cash, U.S. and U.K. government obligations, and $14.1 billion in Germany with 98% of collateral consisting of cash and government obligations of Germany, France, Belgium and Netherlands. The benefit of collateral received against counterparty credit exposure in the other countries totaled approximately $15.4 billion, with collateral primarily consisting of cash, U.S. and Japanese government obligations. These amounts do not include collateral received on secured financing transactions. |
| (4) | Amounts represent CDS hedges (purchased and sold) on net counterparty exposure and funded lending executed by trading desks responsible for hedging counterparty and lending credit risk exposures for the Company. Based on the CDS notional amount assuming zero recovery adjusted for any fair value receivable or payable. |
| (5) | In addition, at December�31, 2014, the Company had exposure to these countries for overnight deposits with banks of approximately $5.1 billion. |
| | 148 |
| 149 | |
| | 150 |
| Item�8. | Financial Statements and Supplementary Data. |
| /s/ Deloitte & Touche LLP |
| New York, New York |
| March�2, 2015 |
| 151 |
| December�31, 2014 | December�31, 2013 | |||||||
| Assets | ||||||||
| Cash and due from banks ($45 and $544 at December�31, 2014 and December�31, 2013, respectively, related to consolidated variable interest entities, generally not available to the Company) | $ | 21,381 | $ | 16,602 | ||||
| Interest bearing deposits with banks | 25,603 | 43,281 | ||||||
| Cash deposited with clearing organizations or segregated under federal and other regulations or requirements ($149 and $117 at December 31, 2014 and December�31, 2013, respectively, related to consolidated variable interest entities, generally not available to the Company) | 40,607 | 39,203 | ||||||
| Trading assets, at fair value ($127,342 and $151,078 were pledged to various parties at December�31, 2014 and December�31, 2013, respectively) ($966 and $2,825 at December 31, 2014 and December�31, 2013, respectively, related to consolidated variable interest entities, generally not available to the Company) | 256,801 | 280,744 | ||||||
| Investment securities (includes $69,216 and $53,430 at fair value at December�31, 2014 and December�31, 2013, respectively) | 69,316 | 53,430 | ||||||
| Securities received as collateral, at fair value | 21,316 | 20,508 | ||||||
| Securities purchased under agreements to resell (includes $1,113 and $866 at fair value at December�31, 2014 and December 31, 2013, respectively) | 83,288 | 118,130 | ||||||
| Securities borrowed | 136,708 | 129,707 | ||||||
| Customer and other receivables | 48,961 | 57,104 | ||||||
| Loans: | ||||||||
| Held for investment (net of allowances of $149 and $156 at December 31, 2014 and December�31, 2013, respectively) | 57,119 | 36,545 | ||||||
| Held for sale | 9,458 | 6,329 | ||||||
| Other investments ($467 and $561 at December�31, 2014 and December�31, 2013, respectively, related to consolidated variable interest entities, generally not available to the Company) | 4,355 | 5,086 | ||||||
| Premises, equipment and software costs (net of accumulated depreciation of $6,219 and $6,420 at December�31, 2014 and December�31, 2013, respectively) ($191 and $201 at December 31, 2014 and December�31, 2013, respectively, related to consolidated variable interest entities, generally not available to the Company) | 6,108 | 6,019 | ||||||
| Goodwill | 6,588 | 6,595 | ||||||
| Intangible assets (net of accumulated amortization of $1,824 and $1,527 at December�31, 2014 and December�31, 2013, respectively) (includes $6 and $8 at fair value at December 31, 2014 and December�31, 2013, respectively) | 3,159 | 3,286 | ||||||
| Other assets ($59 and $11 at December�31, 2014 and December�31, 2013, respectively, related to consolidated variable interest entities, generally not available to the Company) | 10,742 | 10,133 | ||||||
| Total assets | $ | 801,510 | $ | 832,702 | ||||
| Liabilities | ||||||||
| Deposits (includes $0 and $185 at fair value at December�31, 2014 and December�31, 2013, respectively). | $ | 133,544 | $ | 112,379 | ||||
| Commercial paper and other short-term borrowings (includes $1,765 and $1,347 at fair value at December�31, 2014 and December 31, 2013, respectively) | 2,261 | 2,142 | ||||||
| Trading liabilities, at fair value ($1 and $33 at December�31, 2014 and December�31, 2013, respectively, related to consolidated variable interest entities, generally non-recourse to the Company) | 107,381 | 104,521 | ||||||
| Obligation to return securities received as collateral, at fair value | 25,685 | 24,568 | ||||||
| Securities sold under agreements to repurchase (includes $612 and $561 at fair value at December�31, 2014 and December�31, 2013, respectively) | 69,949 | 145,676 | ||||||
| Securities loaned | 25,219 | 32,799 | ||||||
| Other secured financings (includes $4,504 and $5,206 at fair value at December�31, 2014 and December�31, 2013, respectively) ($348 and $543 at December 31, 2014 and December 31, 2013, respectively, related to consolidated variable interest entities, generally non-recourse to the Company) | 12,085 | 14,215 | ||||||
| Customer and other payables | 181,069 | 157,125 | ||||||
| Other liabilities and accrued expenses ($72 and $76 at December�31, 2014 and December�31, 2013, respectively, related to consolidated variable interest entities, generally non-recourse to the Company) | 19,441 | 16,672 | ||||||
| Long-term borrowings (includes $31,774 and $35,637 at fair value at December�31, 2014 and December�31, 2013, respectively) | 152,772 | 153,575 | ||||||
| Total liabilities | 729,406 | 763,672 | ||||||
| Commitments and contingent liabilities (see Note 13) | ||||||||
| Equity | ||||||||
| Morgan Stanley shareholders� equity: | ||||||||
| Preferred stock (see Note 15) | 6,020 | 3,220 | ||||||
| Common stock, $0.01 par value: | ||||||||
| Shares authorized: 3,500,000,000 at December 31, 2014 and December�31, 2013; | ||||||||
| Shares issued: 2,038,893,979 at December 31, 2014 and December 31, 2013; | ||||||||
| Shares outstanding: 1,950,980,142 and 1,944,868,751 at December 31, 2014 and December�31, 2013, respectively | 20 | 20 | ||||||
| Additional paid-in capital | 24,249 | 24,570 | ||||||
| Retained earnings | 44,625 | 42,172 | ||||||
| Employee stock trusts | 2,127 | 1,718 | ||||||
| Accumulated other comprehensive loss | (1,248 | ) | (1,093 | ) | ||||
| Common stock held in treasury, at cost, $0.01 par value: | ||||||||
| Shares outstanding: 87,913,837 and 94,025,228 at December 31, 2014 and December 31, 2013, respectively | (2,766 | ) | (2,968 | ) | ||||
| Common stock issued to employee stock trusts | (2,127 | ) | (1,718 | ) | ||||
| Total Morgan Stanley shareholders� equity | 70,900 | 65,921 | ||||||
| Nonredeemable noncontrolling interests | 1,204 | 3,109 | ||||||
| Total equity | 72,104 | 69,030 | ||||||
| Total liabilities and equity | $ | 801,510 | $ | 832,702 | ||||
| | 152 |
| 2014 | 2013 | 2012 | ||||||||||
| Revenues: | ||||||||||||
| Investment banking | $ | 5,948 | $ | 5,246 | $ | 4,758 | ||||||
| Trading | 9,377 | 9,359 | 6,990 | |||||||||
| Investments | 836 | 1,777 | 742 | |||||||||
| Commissions and fees | 4,713 | 4,629 | 4,253 | |||||||||
| Asset management, distribution and administration fees | 10,570 | 9,638 | 9,008 | |||||||||
| Other | 1,096 | 1,066 | 632 | |||||||||
| Total non-interest revenues | 32,540 | 31,715 | 26,383 | |||||||||
| Interest income | 5,413 | 5,209 | 5,692 | |||||||||
| Interest expense | 3,678 | 4,431 | 5,897 | |||||||||
| Net interest | 1,735 | 778 | (205 | ) | ||||||||
| Net revenues | 34,275 | 32,493 | 26,178 | |||||||||
| Non-interest expenses: | ||||||||||||
| Compensation and benefits | 17,824 | 16,277 | 15,615 | |||||||||
| Occupancy and equipment | 1,433 | 1,499 | 1,543 | |||||||||
| Brokerage, clearing and exchange fees | 1,806 | 1,711 | 1,535 | |||||||||
| Information processing and communications | 1,635 | 1,768 | 1,912 | |||||||||
| Marketing and business development | 658 | 638 | 601 | |||||||||
| Professional services | 2,117 | 1,894 | 1,922 | |||||||||
| Other | 5,211 | 4,148 | 2,454 | |||||||||
| Total non-interest expenses | 30,684 | 27,935 | 25,582 | |||||||||
| Income from continuing operations before income taxes | 3,591 | 4,558 | 596 | |||||||||
| Provision for (benefit from) income taxes | (90 | ) | 902 | (161 | ) | |||||||
| Income from continuing operations | 3,681 | 3,656 | 757 | |||||||||
| Discontinued operations: | ||||||||||||
| Income (loss) from discontinued operations before income taxes | (19 | ) | (72 | ) | (48 | ) | ||||||
| Provision for (benefit from) income taxes | (5 | ) | (29 | ) | (7 | ) | ||||||
| Income (loss) from discontinued operations | (14 | ) | (43 | ) | (41 | ) | ||||||
| Net income | $ | 3,667 | $ | 3,613 | $ | 716 | ||||||
| Net income applicable to redeemable noncontrolling interests | � | 222 | 124 | |||||||||
| Net income applicable to nonredeemable noncontrolling interests | 200 | 459 | 524 | |||||||||
| Net income applicable to Morgan Stanley | $ | 3,467 | $ | 2,932 | $ | 68 | ||||||
| Preferred stock dividends and other | 315 | 277 | 98 | |||||||||
| Earnings (loss) applicable to Morgan Stanley common shareholders | $ | 3,152 | $ | 2,655 | $ | (30 | ) | |||||
| Amounts applicable to Morgan Stanley: | ||||||||||||
| Income from continuing operations | $ | 3,481 | $ | 2,975 | $ | 138 | ||||||
| Income (loss) from discontinued operations | (14 | ) | (43 | ) | (70 | ) | ||||||
| Net income applicable to Morgan Stanley | $ | 3,467 | $ | 2,932 | $ | 68 | ||||||
| Earnings (loss) per basic common share: | ||||||||||||
| Income from continuing operations | $ | 1.65 | $ | 1.42 | $ | 0.02 | ||||||
| Income (loss) from discontinued operations | (0.01 | ) | (0.03 | ) | (0.04 | ) | ||||||
| Earnings (loss) per basic common share | $ | 1.64 | $ | 1.39 | $ | (0.02 | ) | |||||
| Earnings (loss) per diluted common share: | ||||||||||||
| Income from continuing operations | $ | 1.61 | $ | 1.38 | $ | 0.02 | ||||||
| Income (loss) from discontinued operations | (0.01 | ) | (0.02 | ) | (0.04 | ) | ||||||
| Earnings (loss) per diluted common share | $ | 1.60 | $ | 1.36 | $ | (0.02 | ) | |||||
| Dividends declared per common share | $ | 0.35 | $ | 0.20 | $ | 0.20 | ||||||
| Average common shares outstanding: | ||||||||||||
| Basic | 1,923,805,397 | 1,905,823,882 | 1,885,774,276 | |||||||||
| Diluted | 1,970,535,560 | 1,956,519,738 | 1,918,811,270 | |||||||||
| 153 | |
| 2014 | 2013 | 2012 | ||||||||||
| Net income | $ | 3,667 | $ | 3,613 | $ | 716 | ||||||
| Other comprehensive income (loss), net of tax: | ||||||||||||
| Foreign currency translation adjustments(1) | $ | (491 | ) | $ | (348 | ) | $ | (255 | ) | |||
| Amortization of cash flow hedges(2) | 4 | 4 | 6 | |||||||||
| Change in net unrealized gains (losses) on available for sale securities(3) | 209 | (433 | ) | 28 | ||||||||
| Pension, postretirement and other related adjustments(4) | 29 | (5 | ) | (260 | ) | |||||||
| Total other comprehensive income (loss) | $ | (249 | ) | $ | (782 | ) | $ | (481 | ) | |||
| Comprehensive income (loss) | $ | 3,418 | $ | 2,831 | $ | 235 | ||||||
| Net income applicable to redeemable noncontrolling interests | � | 222 | 124 | |||||||||
| Net income applicable to nonredeemable noncontrolling interests | 200 | 459 | 524 | |||||||||
| Other comprehensive income (loss) applicable to redeemable noncontrolling interests | � | � | (2 | ) | ||||||||
| Other comprehensive income (loss) applicable to nonredeemable noncontrolling interests | (94 | ) | (205 | ) | (120 | ) | ||||||
| Comprehensive income (loss) applicable to Morgan Stanley | $ | 3,312 | $ | 2,355 | $ | (291 | ) | |||||
| (1) | Amounts include provision for income taxes of $352 million, $351 million and $120 million for 2014, 2013 and 2012, respectively. |
| (2) | Amounts include provision for income taxes of $2 million, $3 million and $3 million for 2014, 2013 and 2012, respectively. |
| (3) | Amounts include provision for (benefit from) income taxes of $142 million, $(296) million and $16 million for 2014, 2013 and 2012, respectively. |
| (4) | Amounts include provision for (benefit from) income taxes of $18 million, $8 million and $(156) million for 2014, 2013 and 2012, respectively. |
| | 154 |
| 2014 | 2013 | 2012 | ||||||||||
| CASH FLOWS FROM OPERATING ACTIVITIES | ||||||||||||
| Net income | $ | 3,667 | $ | 3,613 | $ | 716 | ||||||
| Adjustments to reconcile net income to net cash provided by (used for) operating activities: | ||||||||||||
| Deferred income taxes | (231 | ) | (117 | ) | (639 | ) | ||||||
| Income from equity method investments | (156 | ) | (451 | ) | (52 | ) | ||||||
| Compensation payable in common stock and options | 1,260 | 1,180 | 891 | |||||||||
| Depreciation and amortization | 1,161 | 1,511 | 1,581 | |||||||||
| Net gain on sale of available for sale securities | (40 | ) | (45 | ) | (78 | ) | ||||||
| Impairment charges | 111 | 198 | 271 | |||||||||
| Provision for credit losses on lending activities | 23 | 110 | 155 | |||||||||
| Other operating activities | (72 | ) | 142 | (69 | ) | |||||||
| Changes in assets and liabilities: | ||||||||||||
| Cash deposited with clearing organizations or segregated under federal and other regulations or requirements | (1,404 | ) | (8,233 | ) | (1,516 | ) | ||||||
| Trading assets, net of Trading liabilities | 20,664 | (23,054 | ) | 6,389 | ||||||||
| Securities borrowed | (7,001 | ) | (8,006 | ) | 5,373 | |||||||
| Securities loaned | (7,580 | ) | (4,050 | ) | 6,387 | |||||||
| Customer and other receivables and other assets | 3,608 | 6,774 | (10,030 | ) | ||||||||
| Customer and other payables and other liabilities | 27,971 | 26,697 | (1,283 | ) | ||||||||
| Securities purchased under agreements to resell | 34,842 | 16,282 | (4,257 | ) | ||||||||
| Securities sold under agreements to repurchase | (75,692 | ) | 23,002 | 20,920 | ||||||||
| Net cash provided by (used for) operating activities | 1,131 | 35,553 | 24,759 | |||||||||
| CASH FLOWS FROM INVESTING ACTIVITIES | ||||||||||||
| Proceeds from (payments for): | ||||||||||||
| Premises, equipment and software, net | (992 | ) | (1,316 | ) | (1,312 | ) | ||||||
| Business dispositions, net of cash disposed | 989 | 1,147 | 1,725 | |||||||||
| Loans | (20,116 | ) | (10,057 | ) | (3,486 | ) | ||||||
| Investment securities: | ||||||||||||
| Purchases | (32,623 | ) | (30,557 | ) | (24,477 | ) | ||||||
| Proceeds from sales | 12,980 | 11,425 | 10,398 | |||||||||
| Proceeds from paydowns and maturities | 4,651 | 4,757 | 4,738 | |||||||||
| Other investing activities | (213 | ) | 140 | (211 | ) | |||||||
| Net cash provided by (used for) investing activities | (35,324 | ) | (24,461 | ) | (12,625 | ) | ||||||
| CASH FLOWS FROM FINANCING ACTIVITIES | ||||||||||||
| Net proceeds from (payments for): | ||||||||||||
| Commercial paper and other short-term borrowings | 119 | 4 | (705 | ) | ||||||||
| Noncontrolling interests | (189 | ) | (557 | ) | (296 | ) | ||||||
| Other secured financings | (2,189 | ) | (10,726 | ) | (6,628 | ) | ||||||
| Deposits | 21,165 | 29,113 | 17,604 | |||||||||
| Proceeds from: | ||||||||||||
| Excess tax benefits associated with stock-based awards | 101 | 10 | 42 | |||||||||
| Derivatives financing activities | 855 | 1,003 | 243 | |||||||||
| Issuance of preferred stock, net of issuance costs | 2,782 | 1,696 | � | |||||||||
| Issuance of long-term borrowings | 36,740 | 27,939 | 23,646 | |||||||||
| Payments for: | ||||||||||||
| Long-term borrowings | (33,103 | ) | (38,742 | ) | (43,092 | ) | ||||||
| Derivatives financing activities | (776 | ) | (1,216 | ) | (125 | ) | ||||||
| Repurchases of common stock and employee tax withholdings | (1,458 | ) | (691 | ) | (227 | ) | ||||||
| Purchase of additional stake in Wealth Management JV | � | (4,725 | ) | (1,890 | ) | |||||||
| Cash dividends | (904 | ) | (475 | ) | (469 | ) | ||||||
| Net cash provided by (used for) financing activities | 23,143 | 2,633 | (11,897 | ) | ||||||||
| Effect of exchange rate changes on cash and cash equivalents | (1,804 | ) | (202 | ) | (119 | ) | ||||||
| Effect of cash and cash equivalents related to variable interest entities | (45 | ) | (544 | ) | (526 | ) | ||||||
| Net increase (decrease) in cash and cash equivalents | (12,899 | ) | 12,979 | (408 | ) | |||||||
| Cash and cash equivalents, at beginning of period | 59,883 | 46,904 | 47,312 | |||||||||
| Cash and cash equivalents, at end of period | $ | 46,984 | $ | 59,883 | $ | 46,904 | ||||||
| Cash and cash equivalents include: | ||||||||||||
| Cash and due from banks | $ | 21,381 | $ | 16,602 | $ | 20,878 | ||||||
| Interest bearing deposits with banks | 25,603 | 43,281 | 26,026 | |||||||||
| Cash and cash equivalents, at end of period | $ | 46,984 | $ | 59,883 | $ | 46,904 | ||||||
| 155 | |
| Preferred Stock | Common Stock | Additional Paid-in Capital | Retained Earnings | Employee Stock Trusts | Accumulated Other Comprehensive Income (Loss) | Common Stock Held in Treasury at Cost | Common Stock Issued to Employee Stock Trusts | Non- redeemable Non- controlling Interests | Total Equity | |||||||||||||||||||||||||||||||
| BALANCE AT DECEMBER 31, 2011 | $ | 1,508 | $ | 20 | $ | 22,836 | $ | 40,341 | $ | 3,166 | $ | (157 | ) | $ | (2,499 | ) | $ | (3,166 | ) | $ | 8,029 | $ | 70,078 | |||||||||||||||||
| Net income applicable to Morgan Stanley | � | � | � | 68 | � | � | � | � | � | 68 | ||||||||||||||||||||||||||||||
| Net income applicable to nonredeemable noncontrolling interests | � | � | � | � | � | � | � | � | 524 | 524 | ||||||||||||||||||||||||||||||
| Dividends | � | � | � | (497 | ) | � | � | � | � | � | (497 | ) | ||||||||||||||||||||||||||||
| Shares issued under employee plans and related tax effects | � | � | 662 | � | (234 | ) | � | 485 | 234 | � | 1,147 | |||||||||||||||||||||||||||||
| Repurchases of common stock and employee tax withholdings | � | � | � | � | � | � | (227 | ) | � | � | (227 | ) | ||||||||||||||||||||||||||||
| Net change in Accumulated other comprehensive income | � | � | � | � | � | (359 | ) | � | � | (120 | ) | (479 | ) | |||||||||||||||||||||||||||
| Purchase of additional stake in Wealth Management JV | � | � | (107 | ) | � | � | � | � | � | (1,718 | ) | (1,825 | ) | |||||||||||||||||||||||||||
| Reclassification to redeemable noncontrolling interests | � | � | � | � | � | � | � | � | (4,288 | ) | (4,288 | ) | ||||||||||||||||||||||||||||
| Other net increases | � | � | 35 | � | � | � | � | � | 892 | 927 | ||||||||||||||||||||||||||||||
| BALANCE AT DECEMBER 31, 2012 | 1,508 | 20 | 23,426 | 39,912 | 2,932 | (516 | ) | (2,241 | ) | (2,932 | ) | 3,319 | 65,428 | |||||||||||||||||||||||||||
| Net income applicable to Morgan Stanley | � | � | � | 2,932 | � | � | � | � | � | 2,932 | ||||||||||||||||||||||||||||||
| Net income applicable to nonredeemable noncontrolling interests | � | � | � | � | � | � | � | � | 459 | 459 | ||||||||||||||||||||||||||||||
| Dividends | � | � | � | (521 | ) | � | � | � | � | � | (521 | ) | ||||||||||||||||||||||||||||
| Shares issued under employee plans and related tax effects | � | � | 1,160 | � | (1,214 | ) | � | (36 | ) | 1,214 | � | 1,124 | ||||||||||||||||||||||||||||
| Repurchases of common stock and employee tax withholdings | � | � | � | � | � | � | (691 | ) | � | � | (691 | ) | ||||||||||||||||||||||||||||
| Net change in Accumulated other comprehensive income | � | � | � | � | � | (577 | ) | � | � | (205 | ) | (782 | ) | |||||||||||||||||||||||||||
| Issuance of preferred stock | 1,712 | � | (16 | ) | � | � | � | � | � | � | 1,696 | |||||||||||||||||||||||||||||
| Wealth Management JV redemption value adjustment | � | � | � | (151 | ) | � | � | � | � | � | (151 | ) | ||||||||||||||||||||||||||||
| Other net decreases | � | � | � | � | � | � | � | � | (464 | ) | (464 | ) | ||||||||||||||||||||||||||||
| BALANCE AT DECEMBER 31, 2013 | 3,220 | 20 | 24,570 | 42,172 | 1,718 | (1,093 | ) | (2,968 | ) | (1,718 | ) | 3,109 | 69,030 | |||||||||||||||||||||||||||
| Net income applicable to Morgan Stanley | � | � | � | 3,467 | � | � | � | � | � | 3,467 | ||||||||||||||||||||||||||||||
| Net income applicable to nonredeemable noncontrolling interests | � | � | � | � | � | � | � | � | 200 | 200 | ||||||||||||||||||||||||||||||
| Dividends | � | � | � | (1,014 | ) | � | � | � | � | � | (1,014 | ) | ||||||||||||||||||||||||||||
| Shares issued under employee plans and related tax effects | � | � | (294 | ) | � | 409 | � | 1,660 | (409 | ) | � | 1,366 | ||||||||||||||||||||||||||||
| Repurchases of common stock and employee tax withholdings | � | � | � | � | � | � | (1,458 | ) | � | � | (1,458 | ) | ||||||||||||||||||||||||||||
| Net change in Accumulated other comprehensive income | � | � | � | � | � | (155 | ) | � | � | (94 | ) | (249 | ) | |||||||||||||||||||||||||||
| Issuance of preferred stock | 2,800 | � | (18 | ) | � | � | � | � | � | � | 2,782 | |||||||||||||||||||||||||||||
| Deconsolidation of certain legal entities associated with a real estate fund | � | � | � | � | � | � | � | � | (1,606 | ) | (1,606 | ) | ||||||||||||||||||||||||||||
| Other net decreases | � | � | (9 | ) | � | � | � | � | � | (405 | ) | (414 | ) | |||||||||||||||||||||||||||
| BALANCE AT DECEMBER 31, 2014 | $ | 6,020 | $ | 20 | $ | 24,249 | $ | 44,625 | $ | 2,127 | $ | (1,248 | ) | $ | (2,766 | ) | $ | (2,127 | ) | $ | 1,204 | $ | 72,104 | |||||||||||||||||
| | 156 |
| 157 | |
| | 158 |
| 159 | |
| | 160 |
| � | Level 1�Valuations based on quoted prices in active markets for identical assets or liabilities that the Company has the ability to access. Valuation adjustments and block discounts are not applied to Level 1 instruments. Since valuations are based on quoted prices that are readily and regularly available in an active market, valuation of these products does not entail a significant degree of judgment. |
| � | Level 2�Valuations based on one or more quoted prices in markets that are not active or for which all significant inputs are observable, either directly or indirectly. |
| � | Level 3�Valuations based on inputs that are unobservable and significant to the overall fair value measurement. |
| 161 | |
| | 162 |
| 163 | |
| | 164 |
| 165 | |
| | 166 |
| 167 | |
| | 168 |
| 169 | |
| | 170 |
| 171 | |
| | 172 |
| � | U.S. Treasury Securities .����U.S. Treasury securities are valued using quoted market prices. Valuation adjustments are not applied. Accordingly, U.S. Treasury securities are generally categorized in Level�1 of the fair value hierarchy. |
| 173 | |
| � | U.S. Agency Securities .����U.S. agency securities are composed of three main categories consisting of agency-issued debt, agency mortgage pass-through pool securities and collateralized mortgage obligations. Non-callable agency-issued debt securities are generally valued using quoted market prices. Callable agency-issued debt securities are valued by benchmarking model-derived prices to quoted market prices and trade data for identical or comparable securities. The fair value of agency�mortgage pass-through pool securities is model-driven based on spreads of the comparable To-be-announced security. Collateralized mortgage obligations are valued using quoted market prices and trade data adjusted by subsequent changes in related indices for identical or comparable securities. Actively traded non-callable agency-issued debt securities are generally categorized in Level 1 of the fair value hierarchy. Callable agency-issued debt securities, agency mortgage pass-through pool securities and collateralized mortgage obligations are generally categorized in Level 2 of the fair value hierarchy. |
| � | Foreign sovereign government obligations are valued using quoted prices in active markets when available. These bonds are generally categorized in Level 1 of the fair value hierarchy. If the market is less active or prices are dispersed, these bonds are categorized in Level 2 of the fair value hierarchy. In instances where the inputs are unobservable, these bonds are categorized in Level 3 of the fair value hierarchy. |
| � | State and Municipal Securities .����The fair value of state and municipal securities is determined using recently executed transactions, market price quotations and pricing models that factor in, where applicable, interest rates, bond or credit default swap spreads and volatility. These bonds are generally categorized in Level 2 of the fair value hierarchy. |
| � | Residential Mortgage-Backed Securities (�RMBS�), Commercial Mortgage-Backed Securities (�CMBS�) and other Asset-Backed Securities (�ABS�) .����RMBS, CMBS and other ABS may be valued based on price or spread data obtained from observed transactions or independent external parties such as vendors or brokers. When position-specific external price data are not observable, the fair value determination may require benchmarking to similar instruments, and/or analyzing expected credit losses, default and recovery rates, and/or applying discounted cash flow techniques. In evaluating the fair value of each security, the Company considers security collateral-specific attributes, including payment priority, credit enhancement levels, type of collateral, delinquency rates and loss severity. In addition, for RMBS borrowers, Fair Isaac Corporation (�FICO�) scores and the level of documentation for the loan are considered. Market standard models, such as Intex, Trepp or others, may be deployed to model the specific collateral composition and cash flow structure of each transaction. Key inputs to these models are market spreads, forecasted credit losses, and default and prepayment rates for each asset category. Valuation levels of RMBS and CMBS indices are used as an additional data point for benchmarking purposes or to price outright index positions. |
| � | Corporate Bonds .����The fair value of corporate bonds is determined using recently executed transactions, market price quotations (where observable), bond spreads, credit default swap spreads, at the money volatility and/or volatility skew obtained from independent external parties such as vendors and brokers |
| | 174 |
| adjusted for any basis difference between cash and derivative instruments. The spread data used are for the same maturity as the bond. If the spread data do not reference the issuer, then data that reference a comparable issuer are used. When position-specific external price data are not observable, fair value is determined based on either benchmarking to similar instruments or cash flow models with yield curves, bond or single-name credit default swap spreads and recovery rates as significant inputs. Corporate bonds are generally categorized in Level 2 of the fair value hierarchy; in instances where prices, spreads or any of the other aforementioned key inputs are unobservable, they are categorized in Level 3 of the fair value hierarchy. |
| � | Collateralized Debt and Loan Obligations .����The Company holds cash collateralized debt obligations (�CDOs�)/collateralized loan obligations (�CLOs�) that typically reference a tranche of an underlying synthetic portfolio of single name credit default swaps collateralized by corporate bonds (�credit-linked notes�) or cash portfolio of asset-backed securities/loans (�asset-backed CDOs/CLOs�). Credit correlation, a primary input used to determine the fair value of credit-linked notes, is usually unobservable and derived using a benchmarking technique. The other credit-linked note model inputs such as credit spreads, including collateral spreads, and interest rates are typically observable. Asset-backed CDOs/CLOs are valued based on an evaluation of the market and model input parameters sourced from similar positions as indicated by primary and secondary market activity. Each asset-backed CDO/CLO position is evaluated independently taking into consideration available comparable market levels, underlying collateral performance and pricing, deal structures, and liquidity. Cash CDOs/CLOs are categorized in Level 2 of the fair value hierarchy when either the credit correlation input is insignificant or comparable market transactions are observable. In instances where the credit correlation input is deemed to be significant or comparable market transactions are unobservable, cash CDOs/CLOs are categorized in Level 3 of the fair value hierarchy. |
| � | Corporate Loans and Lending Commitments .����The fair value of corporate loans is determined using recently executed transactions, market price quotations (where observable), implied yields from comparable debt, and market observable credit default swap spread levels obtained from independent external parties such as vendors and brokers adjusted for any basis difference between cash and derivative instruments, along with proprietary valuation models and default recovery analysis where such transactions and quotations are unobservable. The fair value of�contingent corporate lending commitments is determined by using executed transactions on comparable loans and the anticipated market price based on pricing indications from syndicate banks and customers. The valuation of loans and lending commitments also takes into account fee income that is considered an attribute of the contract. Corporate loans and lending commitments are categorized in Level 2 of the fair value hierarchy except in instances where prices or significant spread inputs are unobservable, in which case they are categorized in Level 3 of the fair value hierarchy. |
| � | Mortgage Loans .����Mortgage loans are valued using observable prices based on transactional data or third-party pricing for identical or comparable instruments, when available. Where position-specific external prices are not observable, the Company estimates fair value based on benchmarking to prices and rates observed in the primary market for similar loan or borrower types or based on the present value of expected future cash flows using its best estimates of the key assumptions, including forecasted credit losses, prepayment rates, forward yield curves and discount rates commensurate with the risks involved or a methodology that utilizes the capital structure and credit spreads of recent comparable securitization transactions. Mortgage loans valued based on observable market data for identical or comparable instruments are categorized in Level 2 of the fair value hierarchy. Where observable prices are not available, due to the subjectivity involved in the comparability assessment related to mortgage loan vintage, geographical concentration, prepayment speed and projected loss assumptions, mortgage loans |
| 175 | |
| are categorized in Level�3 of the fair value hierarchy. Mortgage loans are presented within Loans and lending commitments in the fair value hierarchy table. |
| � | Auction Rate Securities (�ARS�) .����The Company primarily holds investments in�Student Loan Auction Rate Securities (�SLARS�)�and Municipal Auction Rate Securities (�MARS�),�which are floating rate instruments for which the rates reset through periodic auctions. SLARS are�ABS backed by pools of student loans. MARS are municipal bonds often wrapped by municipal bond insurance. The fair value of ARS is primarily determined using recently executed transactions and market price quotations, obtained from independent external parties such as vendors and brokers, where available.�The Company uses an internally developed methodology to discount for the lack of liquidity and non-performance risk where independent external market data are not available. |
| � | Exchange-Traded Equity Securities .����Exchange-traded equity securities are generally valued based on quoted prices from the exchange. To the extent these securities are actively traded, valuation adjustments are not applied, and they are categorized in Level 1 of the fair value hierarchy; otherwise, they are categorized in Level 2 or Level 3 of the fair value hierarchy. |
| � | Unlisted Equity Securities .����Unlisted equity securities are valued based on an assessment of each underlying security, considering rounds of financing and third-party transactions, discounted cash flow analyses and market-based information, including comparable company transactions, trading multiples and changes in market outlook, among other factors. These securities are generally categorized in Level 3 of the fair value hierarchy. |
| � | Fund Units .����Listed fund units are generally marked to the exchange-traded price or net asset value (�NAV�) and are categorized in Level 1 of the fair value hierarchy if actively traded on an exchange or in Level 2 of the fair value hierarchy if trading is not active. Unlisted fund units are generally marked to NAV and categorized as Level 2; however, positions that are not redeemable at the measurement date or in the near future are categorized in Level 3 of the fair value hierarchy. |
| � | Listed Derivative Contracts .����Listed derivatives that are actively traded are valued based on quoted prices from the exchange and are categorized in Level 1 of the fair value hierarchy. Listed derivatives that are not actively traded are valued using the same approaches as those applied to OTC derivatives; they are generally categorized in Level 2 of the fair value hierarchy. |
| � | OTC Derivative Contracts .����OTC derivative contracts include forward, swap and option contracts related to interest rates, foreign currencies, credit standing of reference entities, equity prices or commodity prices. |
| | 176 |
| � | The Company�s investments include direct investments in equity securities as well as investments in private equity funds, real estate funds and hedge funds, which include investments made in connection |
| 177 | |
| with certain employee deferred compensation plans. Direct investments are presented in the fair value hierarchy table as Principal investments and Other. Initially, the transaction price is generally considered by the Company as the exit price and is the Company�s best estimate of fair value. |
| � | The Company trades various physical commodities, including crude oil and refined products, natural gas, base and precious metals, and agricultural products. Fair value for physical commodities is determined using observable inputs, including broker quotations and published indices. Physical commodities are categorized in Level 2 of the fair value hierarchy; in instances where significant inputs are unobservable, they are categorized in Level 3 of the fair value hierarchy. |
| � | AFS Securities .����The Company�s AFS securities are composed of�U.S. government and agency securities ( e.g ., U.S. Treasury securities, agency-issued debt, agency mortgage pass-through securities and collateralized mortgage obligations), CMBS, Federal Family Education Loan Program (�FFELP�) student loan asset-backed securities, auto loan asset-backed securities, corporate bonds, collateralized loan obligations and actively traded equity securities. Actively traded U.S. Treasury securities, non-callable agency-issued debt securities and equity securities are generally categorized in Level 1 of the fair value hierarchy. Callable agency-issued debt securities, agency mortgage pass-through securities, collateralized mortgage obligations, CMBS, FFELP student loan asset-backed securities, auto loan asset-backed securities, corporate bonds and collateralized loan obligations are generally categorized in Level 2 of the fair value hierarchy. For further information on AFS securities, see Note 5. |
| � | Time Deposits .����The fair value of certificates of deposit is determined using third-party quotations. These deposits are generally categorized in Level 2 of the fair value hierarchy. |
| � | Structured Notes .����The Company issues structured notes that have coupon or repayment terms linked to the performance of debt or equity securities, indices, currencies or commodities. Fair value of structured |
| | 178 |
| notes is determined using valuation models for the derivative and debt portions of the notes. These models incorporate observable inputs referencing identical or comparable securities, including prices to which the notes are linked, interest rate yield curves, option volatility and currency, and commodity or equity prices. Independent, external and traded prices for the notes are considered as well. The impact of the Company�s own credit spreads is also included based on the Company�s observed secondary bond market spreads. Most structured notes are categorized in Level 2 of the fair value hierarchy. |
| � | The fair value of a reverse repurchase agreement or repurchase agreement is computed using a�standard cash flow discounting methodology. The inputs to the valuation include�contractual cash flows and collateral funding spreads,�which are estimated using�various benchmarks,�interest rate yield curves and�option volatilities. In instances where the unobservable inputs are deemed significant, reverse repurchase agreements and repurchase agreements are categorized in Level 3 of the fair value hierarchy; otherwise, they are categorized in Level�2 of the fair value hierarchy. |
| 179 | |
| Quoted�Prices in Active�Markets�for Identical Assets (Level 1) | Significant Observable Inputs (Level 2) | Significant Unobservable Inputs (Level 3) | Counterparty and Cash Collateral Netting | Balance�at December�31, 2014 | ||||||||||||||||
| (dollars in millions) | ||||||||||||||||||||
| Assets at Fair Value | ||||||||||||||||||||
| Trading assets: | ||||||||||||||||||||
| U.S. government and agency securities: | ||||||||||||||||||||
| U.S. Treasury securities | $ | 16,961 | $ | � | $ | � | $ | � | $ | 16,961 | ||||||||||
| U.S. agency securities | 850 | 18,193 | � | � | 19,043 | |||||||||||||||
| Total U.S. government and agency securities | 17,811 | 18,193 | � | � | 36,004 | |||||||||||||||
| Other sovereign government obligations | 15,149 | 7,888 | 41 | � | 23,078 | |||||||||||||||
| Corporate and other debt: | ||||||||||||||||||||
| State and municipal securities | � | 2,049 | � | � | 2,049 | |||||||||||||||
| Residential mortgage-backed securities | � | 1,991 | 175 | � | 2,166 | |||||||||||||||
| Commercial mortgage-backed securities | � | 1,484 | 96 | � | 1,580 | |||||||||||||||
| Asset-backed securities | � | 583 | 76 | � | 659 | |||||||||||||||
| Corporate bonds | � | 15,800 | 386 | � | 16,186 | |||||||||||||||
| Collateralized debt and loan obligations | � | 741 | 1,152 | � | 1,893 | |||||||||||||||
| Loans and lending commitments | � | 6,088 | 5,874 | � | 11,962 | |||||||||||||||
| Other debt | � | 2,167 | 285 | � | 2,452 | |||||||||||||||
| Total corporate and other debt | � | 30,903 | 8,044 | � | 38,947 | |||||||||||||||
| Corporate equities(1) | 112,490 | 1,357 | 272 | � | 114,119 | |||||||||||||||
| Derivative and other contracts: | ||||||||||||||||||||
| Interest rate contracts | 663 | 495,026 | 2,484 | � | 498,173 | |||||||||||||||
| Credit contracts | � | 30,813 | 1,369 | � | 32,182 | |||||||||||||||
| Foreign exchange contracts | 83 | 72,769 | 249 | � | 73,101 | |||||||||||||||
| Equity contracts | 571 | 46,024 | 1,529 | � | 48,124 | |||||||||||||||
| Commodity contracts | 4,105 | 18,042 | 2,268 | � | 24,415 | |||||||||||||||
| Other | � | 376 | � | � | 376 | |||||||||||||||
| Netting(2) | (4,910 | ) | (564,127 | ) | (4,220 | ) | (66,720 | ) | (639,977 | ) | ||||||||||
| Total derivative and other contracts | 512 | 98,923 | 3,679 | (66,720 | ) | 36,394 | ||||||||||||||
| Investments: | ||||||||||||||||||||
| Private equity funds | � | � | 2,569 | � | 2,569 | |||||||||||||||
| Real estate funds | � | 7 | 1,746 | � | 1,753 | |||||||||||||||
| Hedge funds | � | 344 | 343 | � | 687 | |||||||||||||||
| Principal investments | 58 | 3 | 835 | � | 896 | |||||||||||||||
| Other | 225 | 198 | 323 | � | 746 | |||||||||||||||
| Total investments | 283 | 552 | 5,816 | � | 6,651 | |||||||||||||||
| Physical commodities | � | 1,608 | � | � | 1,608 | |||||||||||||||
| Total trading assets | 146,245 | 159,424 | 17,852 | (66,720 | ) | 256,801 | ||||||||||||||
| AFS securities | 37,200 | 32,016 | � | � | 69,216 | |||||||||||||||
| Securities received as collateral | 21,265 | 51 | � | � | 21,316 | |||||||||||||||
| Securities purchased under agreements to resell | � | 1,113 | � | � | 1,113 | |||||||||||||||
| Intangible assets(3) | � | � | 6 | � | 6 | |||||||||||||||
| Total assets measured at fair value | $ | 204,710 | $ | 192,604 | $ | 17,858 | $ | (66,720 | ) | $ | 348,452 | |||||||||
| | 180 |
| Quoted�Prices in Active�Markets�for Identical Assets (Level 1) | Significant Observable Inputs (Level 2) | Significant Unobservable Inputs (Level 3) | Counterparty and Cash Collateral Netting | Balance�at December�31, 2014 | ||||||||||||||||
| (dollars in millions) | ||||||||||||||||||||
| Liabilities at Fair Value | ||||||||||||||||||||
| Commercial�paper and other short-term borrowings | $ | � | $ | 1,765 | $ | � | $ | � | $ | 1,765 | ||||||||||
| Trading liabilities: | ||||||||||||||||||||
| U.S. government and agency securities: | ||||||||||||||||||||
| U.S. Treasury securities | 14,199 | � | � | � | 14,199 | |||||||||||||||
| U.S. agency securities | 1,274 | 85 | � | � | 1,359 | |||||||||||||||
| Total U.S. government and agency securities | 15,473 | 85 | � | � | 15,558 | |||||||||||||||
| Other sovereign government obligations | 11,653 | 2,109 | � | � | 13,762 | |||||||||||||||
| Corporate and other debt: | ||||||||||||||||||||
| State and municipal securities | � | 1 | � | � | 1 | |||||||||||||||
| Corporate bonds | � | 5,943 | 78 | � | 6,021 | |||||||||||||||
| Unfunded lending commitments | � | 10 | 5 | � | 15 | |||||||||||||||
| Other debt | � | 63 | 38 | � | 101 | |||||||||||||||
| Total corporate and other debt | � | 6,017 | 121 | � | 6,138 | |||||||||||||||
| Corporate equities(1) | 31,340 | 326 | 45 | � | 31,711 | |||||||||||||||
| Derivative and other contracts: | ||||||||||||||||||||
| Interest rate contracts | 602 | 469,319 | 2,657 | � | 472,578 | |||||||||||||||
| Credit contracts | � | 29,997 | 2,112 | � | 32,109 | |||||||||||||||
| Foreign exchange contracts | 21 | 72,233 | 98 | � | 72,352 | |||||||||||||||
| Equity contracts | 416 | 52,247 | 2,909 | � | 55,572 | |||||||||||||||
| Commodity contracts | 4,817 | 15,584 | 1,122 | � | 21,523 | |||||||||||||||
| Other | � | 172 | � | � | 172 | |||||||||||||||
| Netting(2) | (4,910 | ) | (564,127 | ) | (4,220 | ) | (40,837 | ) | (614,094 | ) | ||||||||||
| Total derivative and other contracts | 946 | 75,425 | 4,678 | (40,837 | ) | 40,212 | ||||||||||||||
| Total trading liabilities | 59,412 | 83,962 | 4,844 | (40,837 | ) | 107,381 | ||||||||||||||
| Obligation to return securities received as collateral | 25,629 | 56 | � | � | 25,685 | |||||||||||||||
| Securities sold under agreements to repurchase | � | 459 | 153 | � | 612 | |||||||||||||||
| Other secured financings | � | 4,355 | 149 | � | 4,504 | |||||||||||||||
| Long-term borrowings | � | 29,840 | 1,934 | � | 31,774 | |||||||||||||||
| Total liabilities measured at fair value | $ | 85,041 | $ | 120,437 | $ | 7,080 | $ | (40,837 | ) | $ | 171,721 | |||||||||
| (1) | The Company holds or sells short for trading purposes equity securities issued by entities in diverse industries and of varying size. |
| (2) | For positions with the same counterparty that cross over the levels of the fair value hierarchy, both counterparty netting and cash collateral netting are included in the column titled �Counterparty and Cash Collateral Netting.� For contracts with the same counterparty, counterparty netting among positions classified within the same level is included within that level. For further information on derivative instruments and hedging activities, see Note 12. |
| (3) | Amount represents mortgage servicing rights (�MSRs�) accounted for at fair value. |
| 181 | |
| Quoted Prices in Active�Markets�for Identical Assets (Level 1) | Significant Observable Inputs (Level 2) | Significant Unobservable Inputs (Level 3) | Counterparty and Cash Collateral Netting | Balance�at December�31, 2013 | ||||||||||||||||
| (dollars in millions) | ||||||||||||||||||||
| Assets at Fair Value | ||||||||||||||||||||
| Trading assets: | ||||||||||||||||||||
| U.S. government and agency securities: | ||||||||||||||||||||
| U.S. Treasury securities | $ | 32,083 | $ | � | $ | � | $ | � | $ | 32,083 | ||||||||||
| U.S. agency securities | 1,216 | 17,720 | � | � | 18,936 | |||||||||||||||
| Total U.S. government and agency securities | 33,299 | 17,720 | � | � | 51,019 | |||||||||||||||
| Other sovereign government obligations | 25,363 | 6,610 | 27 | � | 32,000 | |||||||||||||||
| Corporate and other debt: | ||||||||||||||||||||
| State and municipal securities | � | 1,615 | � | � | 1,615 | |||||||||||||||
| Residential mortgage-backed securities | � | 2,029 | 47 | � | 2,076 | |||||||||||||||
| Commercial mortgage-backed securities | � | 1,534 | 108 | � | 1,642 | |||||||||||||||
| Asset-backed securities | � | 878 | 103 | � | 981 | |||||||||||||||
| Corporate bonds | � | 16,592 | 522 | � | 17,114 | |||||||||||||||
| Collateralized debt and loan obligations | � | 802 | 1,468 | � | 2,270 | |||||||||||||||
| Loans and lending commitments | � | 7,483 | 5,129 | � | 12,612 | |||||||||||||||
| Other debt | � | 6,365 | 27 | � | 6,392 | |||||||||||||||
| Total corporate and other debt | � | 37,298 | 7,404 | � | 44,702 | |||||||||||||||
| Corporate equities(1) | 107,818 | 1,206 | 190 | � | 109,214 | |||||||||||||||
| Derivative and other contracts: | ||||||||||||||||||||
| Interest rate contracts | 750 | 526,127 | 2,475 | � | 529,352 | |||||||||||||||
| Credit contracts | � | 42,258 | 2,088 | � | 44,346 | |||||||||||||||
| Foreign exchange contracts | 52 | 61,570 | 179 | � | 61,801 | |||||||||||||||
| Equity contracts | 1,215 | 51,656 | 1,234 | � | 54,105 | |||||||||||||||
| Commodity contracts | 2,396 | 8,595 | 2,380 | � | 13,371 | |||||||||||||||
| Other | � | 43 | � | � | 43 | |||||||||||||||
| Netting(2) | (3,836 | ) | (606,878 | ) | (4,931 | ) | (54,906 | ) | (670,551 | ) | ||||||||||
| Total derivative and other contracts | 577 | 83,371 | 3,425 | (54,906 | ) | 32,467 | ||||||||||||||
| Investments: | ||||||||||||||||||||
| Private equity funds | � | � | 2,531 | � | 2,531 | |||||||||||||||
| Real estate funds | � | 6 | 1,637 | � | 1,643 | |||||||||||||||
| Hedge funds | � | 377 | 432 | � | 809 | |||||||||||||||
| Principal investments | 43 | 42 | 2,160 | � | 2,245 | |||||||||||||||
| Other | 202 | 45 | 538 | � | 785 | |||||||||||||||
| Total investments | 245 | 470 | 7,298 | � | 8,013 | |||||||||||||||
| Physical commodities | � | 3,329 | � | � | 3,329 | |||||||||||||||
| Total trading assets | 167,302 | 150,004 | 18,344 | (54,906 | ) | 280,744 | ||||||||||||||
| AFS securities | 24,412 | 29,018 | � | � | 53,430 | |||||||||||||||
| Securities received as collateral | 20,497 | 11 | � | � | 20,508 | |||||||||||||||
| Securities purchased under agreements to resell | � | 866 | � | � | 866 | |||||||||||||||
| Intangible assets(3) | � | � | 8 | � | 8 | |||||||||||||||
| Total assets measured at fair value | $ | 212,211 | $ | 179,899 | $ | 18,352 | $ | (54,906 | ) | $ | 355,556 | |||||||||
| | 182 |
| Quoted Prices in Active�Markets�for Identical Assets (Level 1) | Significant Observable Inputs (Level 2) | Significant Unobservable Inputs (Level 3) | Counterparty and Cash Collateral Netting | Balance�at December�31, 2013 | ||||||||||||||||
| (dollars in millions) | ||||||||||||||||||||
| Liabilities at Fair Value | ||||||||||||||||||||
| Deposits | $ | � | $ | 185 | $ | � | $ | � | $ | 185 | ||||||||||
| Commercial�paper and other short-term borrowings | � | 1,346 | 1 | � | 1,347 | |||||||||||||||
| Trading liabilities: | ||||||||||||||||||||
| U.S. government and agency securities: | ||||||||||||||||||||
| U.S. Treasury securities | 15,963 | � | � | � | 15,963 | |||||||||||||||
| U.S. agency securities | 2,593 | 116 | � | � | 2,709 | |||||||||||||||
| Total U.S. government and agency securities | 18,556 | 116 | � | � | 18,672 | |||||||||||||||
| Other sovereign government obligations | 14,717 | 2,473 | � | � | 17,190 | |||||||||||||||
| Corporate and other debt: | ||||||||||||||||||||
| State and municipal securities | � | 15 | � | � | 15 | |||||||||||||||
| Corporate bonds | � | 5,033 | 22 | � | 5,055 | |||||||||||||||
| Collateralized debt and loan obligations | � | 3 | � | � | 3 | |||||||||||||||
| Unfunded lending commitments | � | 127 | 2 | � | 129 | |||||||||||||||
| Other debt | � | 1,144 | 48 | � | 1,192 | |||||||||||||||
| Total corporate and other debt | � | 6,322 | 72 | � | 6,394 | |||||||||||||||
| Corporate equities(1) | 27,983 | 513 | 8 | � | 28,504 | |||||||||||||||
| Derivative and other contracts: | ||||||||||||||||||||
| Interest rate contracts | 675 | 504,292 | 2,362 | � | 507,329 | |||||||||||||||
| Credit contracts | � | 40,391 | 2,235 | � | 42,626 | |||||||||||||||
| Foreign exchange contracts | 23 | 61,925 | 111 | � | 62,059 | |||||||||||||||
| Equity contracts | 1,033 | 57,797 | 2,065 | � | 60,895 | |||||||||||||||
| Commodity contracts | 2,637 | 8,749 | 1,500 | � | 12,886 | |||||||||||||||
| Other | � | 72 | 4 | � | 76 | |||||||||||||||
| Netting(2) | (3,836 | ) | (606,878 | ) | (4,931 | ) | (36,465 | ) | (652,110 | ) | ||||||||||
| Total derivative and other contracts | 532 | 66,348 | 3,346 | (36,465 | ) | 33,761 | ||||||||||||||
| Total trading liabilities | 61,788 | 75,772 | 3,426 | (36,465 | ) | 104,521 | ||||||||||||||
| Obligation to return securities received as collateral | 24,549 | 19 | � | � | 24,568 | |||||||||||||||
| Securities sold under agreements to repurchase | � | 407 | 154 | � | 561 | |||||||||||||||
| Other secured financings | � | 4,928 | 278 | � | 5,206 | |||||||||||||||
| Long-term borrowings | � | 33,750 | 1,887 | � | 35,637 | |||||||||||||||
| Total liabilities measured at fair value | $ | 86,337 | $ | 116,407 | $ | 5,746 | $ | (36,465 | ) | $ | 172,025 | |||||||||
| (1) | The Company holds or sells short for trading purposes equity securities issued by entities in diverse industries and of varying size. |
| (2) | For positions with the same counterparty that cross over the levels of the fair value hierarchy, both counterparty netting and cash collateral netting are included in the column titled �Counterparty and Cash Collateral Netting.� For contracts with the same counterparty, counterparty netting among positions classified within the same level is included within that level. For further information on derivative instruments and hedging activities, see Note 12. |
| (3) | Amount represents MSRs accounted for at fair value. |
| 183 | |
| | 184 |
| Beginning Balance at December�31, 2013 | Total Realized and�Unrealized Gains�(Losses)(1) | Purchases | Sales | Issuances | Settlements | Net�Transfers | Ending Balance�at December�31, 2014 | Unrealized Gains�(Losses) for Level 3 Assets/ Liabilities Outstanding�at December�31, 2014(2) | ||||||||||||||||||||||||||||
| (dollars in millions) | ||||||||||||||||||||||||||||||||||||
| Assets at Fair Value | ||||||||||||||||||||||||||||||||||||
| Trading assets: | ||||||||||||||||||||||||||||||||||||
| Other sovereign government obligations | $ | 27 | $ | 1 | $ | 48 | $ | (34 | ) | $ | � | $ | � | $ | (1 | ) | $ | 41 | $ | � | ||||||||||||||||
| Corporate and other debt: | ||||||||||||||||||||||||||||||||||||
| Residential mortgage-backed securities | 47 | 9 | 105 | (14 | ) | � | � | 28 | 175 | 4 | ||||||||||||||||||||||||||
| Commercial mortgage-backed securities | 108 | 65 | 16 | (102 | ) | � | � | 9 | 96 | 45 | ||||||||||||||||||||||||||
| Asset-backed securities | 103 | 3 | 66 | (96 | ) | � | � | � | 76 | 9 | ||||||||||||||||||||||||||
| Corporate bonds | 522 | 86 | 106 | (306 | ) | � | � | (22 | ) | 386 | 66 | |||||||||||||||||||||||||
| Collateralized debt and loan obligations | 1,468 | 142 | 644 | (964 | ) | � | (143 | ) | 5 | 1,152 | 27 | |||||||||||||||||||||||||
| Loans and lending commitments | 5,129 | (87 | ) | 3,784 | (415 | ) | � | (2,552 | ) | 15 | 5,874 | (191 | ) | |||||||||||||||||||||||
| Other debt | 27 | 21 | 274 | (35 | ) | � | (2 | ) | � | 285 | 20 | |||||||||||||||||||||||||
| Total corporate and other debt | 7,404 | 239 | 4,995 | (1,932 | ) | � | (2,697 | ) | 35 | 8,044 | (20 | ) | ||||||||||||||||||||||||
| Corporate equities | 190 | 20 | 146 | (102 | ) | � | � | 18 | 272 | (3 | ) | |||||||||||||||||||||||||
| Net derivative and other contracts(3)(4): | ||||||||||||||||||||||||||||||||||||
| Interest rate contracts | 113 | (258 | ) | 18 | � | (14 | ) | (43 | ) | 11 | (173 | ) | (349 | ) | ||||||||||||||||||||||
| Credit contracts | (147 | ) | (408 | ) | 68 | � | (179 | ) | (15 | ) | (62 | ) | (743 | ) | (474 | ) | ||||||||||||||||||||
| Foreign exchange contracts | 68 | (13 | ) | 7 | � | � | 108 | (19 | ) | 151 | (17 | ) | ||||||||||||||||||||||||
| Equity contracts | (831 | ) | (367 | ) | 339 | (2 | ) | (562 | ) | (46 | ) | 89 | (1,380 | ) | (440 | ) | ||||||||||||||||||||
| Commodity contracts | 880 | 158 | 287 | � | (52 | ) | (127 | ) | � | 1,146 | 72 | |||||||||||||||||||||||||
| Other | (4 | ) | � | � | � | � | 4 | � | � | � | ||||||||||||||||||||||||||
| Total net derivative and other contracts | 79 | (888 | ) | 719 | (2 | ) | (807 | ) | (119 | ) | 19 | (999 | ) | (1,208 | ) | |||||||||||||||||||||
| Investments: | ||||||||||||||||||||||||||||||||||||
| Private equity funds | 2,531 | 414 | 231 | (608 | ) | � | � | 1 | 2,569 | 343 | ||||||||||||||||||||||||||
| Real estate funds | 1,637 | 228 | 174 | (293 | ) | � | � | � | 1,746 | 293 | ||||||||||||||||||||||||||
| Hedge funds | 432 | 23 | 38 | (69 | ) | � | � | (81 | ) | 343 | 16 | |||||||||||||||||||||||||
| Principal investments | 2,160 | 53 | 36 | (181 | ) | � | (1,258 | ) | 25 | 835 | 49 | |||||||||||||||||||||||||
| Other | 538 | 17 | 17 | (29 | ) | � | � | (220 | ) | 323 | 24 | |||||||||||||||||||||||||
| Total investments | 7,298 | 735 | 496 | (1,180 | ) | � | (1,258 | ) | (275 | ) | 5,816 | 725 | ||||||||||||||||||||||||
| Intangible assets | 8 | � | � | � | � | (2 | ) | � | 6 | (1 | ) | |||||||||||||||||||||||||
| Liabilities at Fair Value | ||||||||||||||||||||||||||||||||||||
| Commercial paper and other short-term borrowings | $ | 1 | $ | � | $ | � | $ | � | $ | � | $ | (1 | ) | $ | � | $ | � | $ | � | |||||||||||||||||
| Trading liabilities: | ||||||||||||||||||||||||||||||||||||
| Corporate and other debt: | ||||||||||||||||||||||||||||||||||||
| Corporate bonds | 22 | 1 | (46 | ) | 117 | � | � | (14 | ) | 78 | 2 | |||||||||||||||||||||||||
| Unfunded lending commitments | 2 | (3 | ) | � | � | � | � | � | 5 | (3 | ) | |||||||||||||||||||||||||
| Other debt | 48 | 7 | (8 | ) | � | � | � | 5 | 38 | (2 | ) | |||||||||||||||||||||||||
| Total corporate and other debt | 72 | 5 | (54 | ) | 117 | � | � | (9 | ) | 121 | (3 | ) | ||||||||||||||||||||||||
| Corporate equities | 8 | � | (3 | ) | 39 | � | � | 1 | 45 | � | ||||||||||||||||||||||||||
| Securities sold under agreements to repurchase | 154 | 1 | � | � | � | � | � | 153 | 1 | |||||||||||||||||||||||||||
| Other secured financings | 278 | (9 | ) | � | � | 21 | (201 | ) | 42 | 149 | (6 | ) | ||||||||||||||||||||||||
| Long-term borrowings | 1,887 | 109 | � | � | 791 | (391 | ) | (244 | ) | 1,934 | 102 | |||||||||||||||||||||||||
| (1) | Total realized and unrealized gains (losses) are primarily included in Trading revenues in the Company�s consolidated statements of income except for $735�million related to Trading assets�Investments, which is included in Investments revenues. |
| (2) | Amounts represent unrealized gains (losses) for 2014 related to assets and liabilities still outstanding at December�31, 2014. |
| (3) | Net derivative and other contracts represent Trading assets�Derivative and other contracts net of Trading liabilities�Derivative and other contracts. For further information on derivative instruments and hedging activities, see Note 12. |
| (4) | During the fourth quarter of 2014, the Company incurred a charge of approximately $468 million related to the implementation of FVA, which was recognized in Trading revenues (see Note 2). |
| 185 | |
| Beginning Balance at December�31, 2012 | Total Realized and�Unrealized Gains�(Losses)(1) | Purchases | Sales | Issuances | Settlements | Net�Transfers | Ending Balance�at December�31, 2013 | Unrealized Gains (Losses) for Level 3 Assets/ Liabilities Outstanding�at December�31, 2013(2) | ||||||||||||||||||||||||||||
| (dollars in millions) | ||||||||||||||||||||||||||||||||||||
| Assets at Fair Value | ||||||||||||||||||||||||||||||||||||
| Trading assets: | ||||||||||||||||||||||||||||||||||||
| Other sovereign government obligations | $ | 6 | $ | (18 | ) | $ | 41 | $ | (7 | ) | $ | � | $ | � | $ | 5 | $ | 27 | $ | (18 | ) | |||||||||||||||
| Corporate and other debt: | ||||||||||||||||||||||||||||||||||||
| Residential mortgage-backed securities | 45 | 25 | 54 | (51 | ) | � | � | (26 | ) | 47 | (6 | ) | ||||||||||||||||||||||||
| Commercial mortgage-backed securities | 232 | 13 | 57 | (187 | ) | � | (7 | ) | � | 108 | 4 | |||||||||||||||||||||||||
| Asset-backed securities | 109 | � | 6 | (12 | ) | � | � | � | 103 | � | ||||||||||||||||||||||||||
| Corporate bonds | 660 | (20 | ) | 324 | (371 | ) | � | (19 | ) | (52 | ) | 522 | (55 | ) | ||||||||||||||||||||||
| Collateralized debt and loan obligations | 1,951 | 363 | 742 | (960 | ) | � | (626 | ) | (2 | ) | 1,468 | 131 | ||||||||||||||||||||||||
| Loans and lending commitments | 4,694 | (130 | ) | 3,744 | (448 | ) | � | (3,096 | ) | 365 | 5,129 | (199 | ) | |||||||||||||||||||||||
| Other debt | 45 | (1 | ) | 20 | (36 | ) | � | � | (1 | ) | 27 | (2 | ) | |||||||||||||||||||||||
| Total corporate and other debt | 7,736 | 250 | 4,947 | (2,065 | ) | � | (3,748 | ) | 284 | 7,404 | (127 | ) | ||||||||||||||||||||||||
| Corporate equities | 288 | (63 | ) | 113 | (127 | ) | � | � | (21 | ) | 190 | (72 | ) | |||||||||||||||||||||||
| Net derivative and other contracts(3): | ||||||||||||||||||||||||||||||||||||
| Interest rate contracts | (82 | ) | 28 | 6 | � | (34 | ) | 135 | 60 | 113 | 36 | |||||||||||||||||||||||||
| Credit contracts | 1,822 | (1,674 | ) | 266 | � | (703 | ) | (295 | ) | 437 | (147 | ) | (1,723 | ) | ||||||||||||||||||||||
| Foreign exchange contracts | (359 | ) | 130 | � | � | � | 281 | 16 | 68 | 124 | ||||||||||||||||||||||||||
| Equity contracts | (1,144 | ) | 463 | 170 | (74 | ) | (318 | ) | (11 | ) | 83 | (831 | ) | 61 | ||||||||||||||||||||||
| Commodity contracts | 709 | 200 | 41 | � | (36 | ) | (29 | ) | (5 | ) | 880 | 174 | ||||||||||||||||||||||||
| Other | (7 | ) | (6 | ) | � | � | � | 9 | � | (4 | ) | (7 | ) | |||||||||||||||||||||||
| Total net derivative and other contracts | 939 | (859 | ) | 483 | (74 | ) | (1,091 | ) | 90 | 591 | 79 | (1,335 | ) | |||||||||||||||||||||||
| Investments: | ||||||||||||||||||||||||||||||||||||
| Private equity funds | 2,179 | 704 | 212 | (564 | ) | � | � | � | 2,531 | 657 | ||||||||||||||||||||||||||
| Real estate funds | 1,370 | 413 | 103 | (249 | ) | � | � | � | 1,637 | 625 | ||||||||||||||||||||||||||
| Hedge funds | 552 | 10 | 62 | (163 | ) | � | � | (29 | ) | 432 | 10 | |||||||||||||||||||||||||
| Principal investments | 2,833 | 110 | 111 | (445 | ) | � | � | (449 | ) | 2,160 | 3 | |||||||||||||||||||||||||
| Other | 486 | 76 | 13 | (36 | ) | � | � | (1 | ) | 538 | 77 | |||||||||||||||||||||||||
| Total investments | 7,420 | 1,313 | 501 | (1,457 | ) | � | � | (479 | ) | 7,298 | 1,372 | |||||||||||||||||||||||||
| Intangible assets | 7 | 9 | � | � | � | (8 | ) | � | 8 | 3 | ||||||||||||||||||||||||||
| Liabilities at Fair Value | ||||||||||||||||||||||||||||||||||||
| Commercial paper and other short-term borrowings | $ | 19 | $ | � | $ | � | $ | � | $ | � | $ | (1 | ) | $ | (17 | ) | $ | 1 | $ | � | ||||||||||||||||
| Trading liabilities: | ||||||||||||||||||||||||||||||||||||
| Corporate and other debt: | ||||||||||||||||||||||||||||||||||||
| Residential mortgage-backed securities | 4 | 4 | � | � | � | � | � | � | 4 | |||||||||||||||||||||||||||
| Corporate bonds | 177 | 28 | (64 | ) | 43 | � | � | (106 | ) | 22 | 28 | |||||||||||||||||||||||||
| Unfunded lending commitments | 46 | 44 | � | � | � | � | � | 2 | 44 | |||||||||||||||||||||||||||
| Other debt | 49 | 2 | � | 5 | � | (6 | ) | 2 | 48 | 2 | ||||||||||||||||||||||||||
| Total corporate and other debt | 276 | 78 | (64 | ) | 48 | � | (6 | ) | (104 | ) | 72 | 78 | ||||||||||||||||||||||||
| Corporate equities | 5 | 1 | (26 | ) | 29 | � | � | 1 | 8 | 3 | ||||||||||||||||||||||||||
| Securities sold under agreements to repurchase | 151 | (3 | ) | � | � | � | � | � | 154 | (3 | ) | |||||||||||||||||||||||||
| Other secured financings | 406 | 11 | � | � | 19 | (136 | ) | � | 278 | 4 | ||||||||||||||||||||||||||
| Long-term borrowings | 2,789 | (162 | ) | � | � | 877 | (606 | ) | (1,335 | ) | 1,887 | (138 | ) | |||||||||||||||||||||||
| (1) | Total realized and unrealized gains (losses) are primarily included in Trading revenues in the Company�s consolidated statements of income except for $1,313 million related to Trading assets�Investments, which is included in Investments revenues. |
| (2) | Amounts represent unrealized gains (losses) for 2013 related to assets and liabilities still outstanding at December�31, 2013. |
| (3) | Net derivative and other contracts represent Trading assets�Derivative and other contracts, net of Trading liabilities�Derivative and other contracts. For further information on derivative instruments and hedging activities, see Note 12. |
| | 186 |
| Beginning Balance at December�31, 2011 | Total�Realized and�Unrealized Gains�(Losses)(1) | Purchases | Sales | Issuances | Settlements | Net Transfers | Ending Balance�at December�31, 2012 | Unrealized Gains (Losses) for Level 3 Assets/ Liabilities Outstanding�at December�31, 2012(2) | ||||||||||||||||||||||||||||
| (dollars in millions) | ||||||||||||||||||||||||||||||||||||
| Assets at Fair Value | ||||||||||||||||||||||||||||||||||||
| Trading assets: | ||||||||||||||||||||||||||||||||||||
| U.S. agency securities | $ | 8 | $ | � | $ | � | $ | (7 | ) | $ | � | $ | � | $ | (1 | ) | $ | � | $ | � | ||||||||||||||||
| Other sovereign government obligations | 119 | � | 12 | (125 | ) | � | � | � | 6 | (9 | ) | |||||||||||||||||||||||||
| Corporate and other debt: | ||||||||||||||||||||||||||||||||||||
| Residential mortgage-backed securities | 494 | (9 | ) | 32 | (285 | ) | � | � | (187 | ) | 45 | (26 | ) | |||||||||||||||||||||||
| Commercial mortgage-backed securities | 134 | 32 | 218 | (49 | ) | � | (100 | ) | (3 | ) | 232 | 28 | ||||||||||||||||||||||||
| Asset-backed securities | 31 | 1 | 109 | (32 | ) | � | � | � | 109 | (1 | ) | |||||||||||||||||||||||||
| Corporate bonds | 675 | 22 | 447 | (450 | ) | � | � | (34 | ) | 660 | (7 | ) | ||||||||||||||||||||||||
| Collateralized debt and loan obligations | 980 | 216 | 1,178 | (384 | ) | � | � | (39 | ) | 1,951 | 142 | |||||||||||||||||||||||||
| Loans and lending commitments | 9,590 | 37 | 2,648 | (2,095 | ) | � | (4,316 | ) | (1,170 | ) | 4,694 | (91 | ) | |||||||||||||||||||||||
| Other debt | 128 | 2 | � | (95 | ) | � | � | 10 | 45 | (6 | ) | |||||||||||||||||||||||||
| Total corporate and other debt | 12,032 | 301 | 4,632 | (3,390 | ) | � | (4,416 | ) | (1,423 | ) | 7,736 | 39 | ||||||||||||||||||||||||
| Corporate equities | 417 | (59 | ) | 134 | (172 | ) | � | � | (32 | ) | 288 | (83 | ) | |||||||||||||||||||||||
| Net derivative and other contracts(3): | ||||||||||||||||||||||||||||||||||||
| Interest rate contracts | 420 | (275 | ) | 28 | � | (7 | ) | (217 | ) | (31 | ) | (82 | ) | 297 | ||||||||||||||||||||||
| Credit contracts | 5,814 | (2,799 | ) | 112 | � | (502 | ) | (961 | ) | 158 | 1,822 | (3,216 | ) | |||||||||||||||||||||||
| Foreign exchange contracts | 43 | (279 | ) | � | � | � | 19 | (142 | ) | (359 | ) | (225 | ) | |||||||||||||||||||||||
| Equity contracts | (1,234 | ) | 390 | 202 | (9 | ) | (112 | ) | (210 | ) | (171 | ) | (1,144 | ) | 241 | |||||||||||||||||||||
| Commodity contracts | 570 | 114 | 16 | � | (41 | ) | (20 | ) | 70 | 709 | 222 | |||||||||||||||||||||||||
| Other | (1,090 | ) | 57 | � | � | � | 236 | 790 | (7 | ) | 53 | |||||||||||||||||||||||||
| Total net derivative and other contracts | 4,523 | (2,792 | ) | 358 | (9 | ) | (662 | ) | (1,153 | ) | 674 | 939 | (2,628 | ) | ||||||||||||||||||||||
| Investments: | ||||||||||||||||||||||||||||||||||||
| Private equity funds | 1,936 | 228 | 308 | (294 | ) | � | � | 1 | 2,179 | 147 | ||||||||||||||||||||||||||
| Real estate funds | 1,213 | 149 | 143 | (136 | ) | � | � | 1 | 1,370 | 229 | ||||||||||||||||||||||||||
| Hedge funds | 696 | 61 | 81 | (151 | ) | � | � | (135 | ) | 552 | 51 | |||||||||||||||||||||||||
| Principal investments | 2,937 | 130 | 160 | (419 | ) | � | � | 25 | 2,833 | 93 | ||||||||||||||||||||||||||
| Other | 501 | (45 | ) | 158 | (70 | ) | � | � | (58 | ) | 486 | (48 | ) | |||||||||||||||||||||||
| Total investments | 7,283 | 523 | 850 | (1,070 | ) | � | � | (166 | ) | 7,420 | 472 | |||||||||||||||||||||||||
| Physical commodities | 46 | � | � | � | � | (46 | ) | � | � | � | ||||||||||||||||||||||||||
| Intangible assets | 133 | (39 | ) | � | (83 | ) | � | (4 | ) | � | 7 | (7 | ) | |||||||||||||||||||||||
| Liabilities at Fair Value | ||||||||||||||||||||||||||||||||||||
| Commercial paper and other short-term borrowings | $ | 2 | $ | (5 | ) | $ | � | $ | � | $ | 3 | $ | (3 | ) | $ | 12 | $ | 19 | $ | (4 | ) | |||||||||||||||
| Trading liabilities: | ||||||||||||||||||||||||||||||||||||
| Other sovereign government obligations | 8 | � | (8 | ) | � | � | � | � | � | � | ||||||||||||||||||||||||||
| Corporate and other debt: | ||||||||||||||||||||||||||||||||||||
| Residential mortgage-backed securities | 355 | (4 | ) | (355 | ) | � | � | � | � | 4 | (4 | ) | ||||||||||||||||||||||||
| Corporate bonds | 219 | (15 | ) | (129 | ) | 110 | � | � | (38 | ) | 177 | (23 | ) | |||||||||||||||||||||||
| Unfunded lending commitments | 85 | 39 | � | � | � | � | � | 46 | 39 | |||||||||||||||||||||||||||
| Other debt | 73 | 9 | (1 | ) | 36 | � | (55 | ) | 5 | 49 | 11 | |||||||||||||||||||||||||
| Total corporate and other debt | 732 | 29 | (485 | ) | 146 | � | (55 | ) | (33 | ) | 276 | 23 | ||||||||||||||||||||||||
| Corporate equities | 1 | (1 | ) | (21 | ) | 22 | � | � | 2 | 5 | (3 | ) | ||||||||||||||||||||||||
| Securities sold under agreements to repurchase | 340 | (14 | ) | � | � | � | � | (203 | ) | 151 | (14 | ) | ||||||||||||||||||||||||
| Other secured financings | 570 | (69 | ) | � | � | 21 | (232 | ) | (22 | ) | 406 | (67 | ) | |||||||||||||||||||||||
| Long-term borrowings | 1,603 | (651 | ) | � | � | 1,050 | (279 | ) | (236 | ) | 2,789 | (652 | ) | |||||||||||||||||||||||
| 187 | |
| (1) | Total realized and unrealized gains (losses) are primarily included in Trading revenues in the Company�s consolidated statements of income except for $523 million related to Trading assets�Investments, which is included in Investments revenues. |
| (2) | Amounts represent unrealized gains (losses) for 2012 related to assets and liabilities still outstanding at December�31, 2012. |
| (3) | Net derivative and other contracts represent Trading assets�Derivative and other contracts, net of Trading liabilities�Derivative and other contracts. For further information on derivative instruments and hedging activities, see Note 12. |
| | 188 |
| Balance
at December�31, 2014 (dollars in millions) | Valuation Technique(s) | Significant Unobservable Input(s) / Sensitivity�of�the�Fair�Value�to�Changes in the Unobservable Inputs | Range(1) | Averages(2) | ||||||||||||||||
| Assets | ||||||||||||||||||||
| Trading assets: | ||||||||||||||||||||
| Corporate and other debt: | ||||||||||||||||||||
| Residential mortgage-backed securities | $ | 175 | Comparable pricing | Comparable bond price / (A) | 3�to�90 | points | 15 | points | ||||||||||||
| Commercial mortgage-backed securities | 96 | Comparable pricing | Comparable bond price / (A) | 0�to�7 | points | 1 | points | |||||||||||||
| Asset-backed securities | 76 | Comparable pricing | Comparable bond price / (A) | 0�to�62 | points | 23 | points | |||||||||||||
| Corporate bonds | 386 | Comparable pricing | Comparable bond price / (A) | 1�to�160 | points | 90 | points | |||||||||||||
| Collateralized debt and loan obligations | 1,152 | Comparable pricing(3) | Comparable bond price / (A) | 20�to�100 | points | 66 | points | |||||||||||||
| Correlation model | Credit correlation / (B) | 47 to 65 | % | 56 | % | |||||||||||||||
| Loans and lending commitments | 5,874 | Corporate loan model | Credit spread / (C) | 36�to�753 | basis�points | 373 | basis�points | |||||||||||||
| Margin loan model | Credit spread / (C)(D) | 150�to�451 | basis�points | 216 | basis�points | |||||||||||||||
| Volatility skew / (C)(D) | 3 to 37 | % | 21 | % | ||||||||||||||||
| Discount rate / (C)(D) | 2 to 3 | % | 3 | % | ||||||||||||||||
| Option model | Volatility skew / (C) | -1 | % | -1 | % | |||||||||||||||
| Comparable pricing(3) | Comparable loan price / (A) | 15�to�105 | points | 89 | points | |||||||||||||||
| Other debt | 285 | Comparable pricing(3) | Comparable loan price / (A) | 0�to�75 | points | 39 | points | |||||||||||||
| Comparable pricing | Comparable bond price / (A) | 15 | points | 15 | points | |||||||||||||||
| Option model | At the money volatility / (A) | 15�to�54 | % | 15 | % | |||||||||||||||
| Corporate equities(4) | 272 | Net asset value | Discount to net asset value / (C) | 0 to 71 | % | 36 | % | |||||||||||||
| Comparable pricing | Comparable price / (A) | 83 to 96 | % | 85 | % | |||||||||||||||
| Comparable pricing(3) | Comparable equity price / (A) | 100 | % | 100 | % | |||||||||||||||
| Market approach | EBITDA multiple / (A)(D) | 6�to�9 | times | 8 | times | |||||||||||||||
| Price / Book ratio / (A)(D) | 0 | times | 0 | times | ||||||||||||||||
| Net derivative and other contracts(5): | ||||||||||||||||||||
| Interest rate contracts | (173 | ) | Option model | Interest rate volatility concentration liquidity multiple / (C)(D) | 0�to�3 | times | 2 | times | ||||||||||||
| Interest rate�Foreign exchange correlation / (A)(D) | 28 to 62 | % | 44% /�42%(6) | |||||||||||||||||
| Interest rate volatility skew / (A)(D) | 38�to�104 | % | 86% / 60%(6) | |||||||||||||||||
| Interest rate quanto correlation / (A)(D) | -9 to 35 | % | 6% / -6%(6) | |||||||||||||||||
| Interest rate curve correlation / (A)(D) | 44 to 87 | % | 73% / 80%(6) | |||||||||||||||||
| Inflation volatility / (A)(D) | 69 to 71 | % | 70% / 71%(6) | |||||||||||||||||
| Interest rate�Inflation correlation / (A)(D) | -44�to�-40 | % | -42% / -43%(6) | |||||||||||||||||
| Credit contracts | (743 | ) | Comparable pricing | Cash synthetic basis / (C)(D) | 5�to�13 | points | 9 | points | ||||||||||||
| Comparable bond price / (C)(D) | 0�to�55 | points | 18 | points | ||||||||||||||||
| Correlation model(3) | Credit correlation / (B) | 42 to 95 | % | 63 | % | |||||||||||||||
| 189 | |
| Balance
at December�31, 2014 (dollars in millions) | Valuation Technique(s) | Significant Unobservable Input(s) / Sensitivity�of�the�Fair�Value�to�Changes in the Unobservable Inputs | Range(1) | Averages(2) | ||||||||||||||||
| Foreign exchange contracts(7) | 151 | Option model | Interest rate quanto correlation / (A)(D) | -9�to�35 | % | 6% / -6%(6) | ||||||||||||||
| Interest rate�Credit spread correlation / (A)(D) | -54�to�-2 | % | -17% / -11%(6) | |||||||||||||||||
| Interest rate curve correlation / (A)(D) | 44�to 87 | % | 73% / 80%(6) | |||||||||||||||||
| Interest rate�Foreign exchange correlation / (A)(D) | 28�to�62 | % | 44% / 42%(6) | |||||||||||||||||
| Interest rate curve / (A)(D) | 0 to 2 | % | 1% / 1%(6) | |||||||||||||||||
| Equity contracts(7) | (1,380 | ) | Option model | At the money volatility / (A)(D) | 14 to 51 | % | 29 | % | ||||||||||||
| Volatility skew / (A)(D) | -2 to 0 | % | -1 | % | ||||||||||||||||
| Equity�Equity correlation / (C)(D) | 40 to 99 | % | 72 | % | ||||||||||||||||
| Equity�Foreign exchange correlation / (C)(D) | -50�to�10 | % | -16 | % | ||||||||||||||||
| Equity�Interest rate correlation / (C)(D) | -18�to�81 | % | 26%�/�11%(6) | |||||||||||||||||
| Commodity contracts | 1,146 | Option model | Forward power price / (C)(D) | $5�to�$106 | per | $ | 38 | per | ||||||||||||
| Megawatt�hour | Megawatt hour | |||||||||||||||||||
| Commodity volatility / (A)(D) | 11 to 90 | % | 19 | % | ||||||||||||||||
| Cross commodity correlation / (C)(D) | 33�to�100 | % | 93 | % | ||||||||||||||||
| Investments(4): | ||||||||||||||||||||
| Principal investments | 835 | Discounted cash flow | Implied weighted average cost of capital / (C)(D) | 11 | % | 11 | % | |||||||||||||
| Exit multiple / (A)(D) | 10 | times | 10 | times | ||||||||||||||||
| Discounted cash flow | Equity discount rate / (C) | 25 | % | 25 | % | |||||||||||||||
| Market approach(3) | EBITDA multiple / (A)(D) | 4�to�14 | times | 10 | times | |||||||||||||||
| Price / Earnings ratio / (A)(D) | 23 | times | 23 | times | ||||||||||||||||
| Forward capacity price / (A)(D) | $5 to $7 | $7 | ||||||||||||||||||
| Comparable pricing | Comparable equity price / (A) | 64�to�100 | % | 95 | % | |||||||||||||||
| Other | 323 | Discounted cash flow | Implied weighted average cost of capital / (C)(D) | 10 to 13 | % | 11 | % | |||||||||||||
| Exit multiple / (A)(D) | 6�to�9 | times | 9 | times | ||||||||||||||||
| Market approach | EBITDA multiple / (A)(D) | 9�to�13 | times | 10 | times | |||||||||||||||
| Comparable pricing(3) | Comparable equity price / (A) | 100 | % | 100 | % | |||||||||||||||
| Liabilities | ||||||||||||||||||||
| Corporate and other debt: | ||||||||||||||||||||
| Corporate bonds | $ | 78 | Option model | Volatility skew / (C)(D) | -1 | % | -1 | % | ||||||||||||
| At the money volatility / (C)(D) | 10 | % | 10 | % | ||||||||||||||||
| Securities sold under agreements to repurchase | 153 | Discounted cash flow | Funding spread / (A) | 75�to�91 | basis�points | 86 | basis�points | |||||||||||||
| Other secured financings | 149 | Comparable pricing | Comparable bond price / (A) | 99�to�101 | points | 100 | points | |||||||||||||
| Discounted cash flow(3) | Funding spread / (A) | | 82�to�98 | basis�points | 95 | basis�points | ||||||||||||||
| Long-term borrowings | 1,934 | Option model(3) | At the money volatility / (C)(D) | 18 to 32 | % | 27 | % | |||||||||||||
| Volatility skew / (A)(D) | -1 to 0 | % | 0 | % | ||||||||||||||||
| Equity�Equity correlation / (A)(D) | 40 to 90 | % | 68 | % | ||||||||||||||||
| Equity�Foreign exchange correlation / (C)(D) | -73�to�30 | % | -32 | % | ||||||||||||||||
| Option model | Equity alpha / (A) | 0 to 94 | % | 67 | % | |||||||||||||||
| Correlation model | Credit correlation / (B) | 48 to 65 | % | 51 | % | |||||||||||||||
| | 190 |
| (1) | The ranges of significant unobservable inputs are represented in points, percentages, basis points, times or megawatt hours.�Points are a percentage of par; for example, 90 points would be 90% of par. A basis point equals 1/100th of 1%; for example, 753 basis points would equal 7.53%. |
| (2) | Amounts represent weighted averages except where simple averages and the median of the inputs are provided (see footnote 6 below). Weighted averages are calculated by weighting each input by the fair value of the respective financial instruments except for collateralized debt and loan obligations, principal investments, other debt, corporate bonds, long-term borrowings and derivative instruments where some or all inputs are weighted by risk. |
| (3) | This is the predominant valuation technique for this major asset or liability class. |
| (4) | Investments in funds measured using an unadjusted NAV are excluded. |
| (5) | Credit Valuation Adjustment (�CVA�) and FVA are included in the balance, but excluded from the Valuation Technique(s) and Significant Unobservable Input(s) in the table above. CVA is deemed to be a Level 3 input when the underlying counterparty credit curve is unobservable. FVA is deemed to be a Level 3 input in its entirety given the lack of observability of funding spreads in the principal market. |
| (6) | The data structure of the significant unobservable inputs used in valuing Interest rate contracts, Foreign exchange contracts and certain Equity contracts may be in a multi-dimensional form, such as a curve or surface, with risk distributed across the structure. Therefore, a simple average and median, together with the range of data inputs, may be more appropriate measurements than a single point weighted average. |
| (7) | Includes derivative contracts with multiple risks ( i.e., hybrid products). |
| (A) | Significant increase (decrease) in the unobservable input in isolation would result in a significantly higher (lower) fair value measurement. |
| (B) | Significant changes in credit correlation may result in a significantly higher or lower fair value measurement. Increasing (decreasing) correlation drives a redistribution of risk within the capital structure such that junior tranches become less (more) risky and senior tranches become more (less) risky. |
| (C) | Significant increase (decrease) in the unobservable input in isolation would result in a significantly lower (higher) fair value measurement. |
| (D) | There are no predictable relationships between the significant unobservable inputs. |
| 191 | |
| Balance
at December�31, 2013 (dollars in millions) | Valuation Technique(s) | Significant�Unobservable�Input(s)�/ Sensitivity�of�the�Fair�Value�to�Changes in the Unobservable Inputs | Range(1) | Averages(2) | ||||||||||||||||
| Assets | ||||||||||||||||||||
| Trading assets: | ||||||||||||||||||||
| Corporate and other debt: | ||||||||||||||||||||
| Commercial mortgage-backed securities | $ | 108 | Comparable�pricing | Comparable bond price / (A) | 40�to�93 | points | 78 | points | ||||||||||||
| Asset-backed securities | 103 | Discounted�cash flow | Discount rate / (C) | 18 | % | 18 | % | |||||||||||||
| Corporate bonds | 522 | Comparable�pricing | Comparable bond price / (A) | 1�to�159�p | oints | 85 | points | |||||||||||||
| Collateralized debt and loan obligations | 1,468 | Comparable�pricing(3) | Comparable bond price / (A) | 18�to�99 | points | 73 | points | |||||||||||||
| Correlation�model | Credit correlation / (B) | 29�to�59 | % | 43 | % | |||||||||||||||
| Loans and lending commitments | 5,129 | Corporate�loan�model | Credit spread / (C) | 28�to�487 | basis�points | 249 | basis�points | |||||||||||||
| Margin�loan�model | Credit spread / (C)(D) | 10�to�265 | basis�points | 135 | basis�points | |||||||||||||||
| Volatility skew / (C)(D) | 3�to�40 | % | 14 | % | ||||||||||||||||
| Comparable bond price / (A)(D) | 80�to�120 | points | 100 | points | ||||||||||||||||
| Option�model | Volatility skew / (C) | -1 to 0 | % | 0 | % | |||||||||||||||
| Comparable�pricing(3) | Comparable loan price / (A) | 10�to�100 | points | 76 | points | |||||||||||||||
| Corporate equities(4) | 190 | Net�asset�value(3) | Discount to net asset value / (C) | 0�to�85 | % | 43 | % | |||||||||||||
| Comparable�pricing | Comparable equity price / (A) | 100 | % | 100 | % | |||||||||||||||
| Comparable�pricing | Comparable price / (A) | 100 | % | 100 | % | |||||||||||||||
| Market approach | EBITDA multiple / (A)(D) | 5�to�9 | times | 6 | times | |||||||||||||||
| Price / Book ratio / (A)(D) | 0�to�1 | times | 1 | times | ||||||||||||||||
| Net derivative and other contracts(5): | ||||||||||||||||||||
| Interest rate contracts | 113 | Option�model | Interest rate volatility concentration liquidity multiple / (C)(D) | 0�to�6 | times | 2 | times | |||||||||||||
| Comparable bond price / (A)(D) | 5�to�100 | points | | 58�points | /�65�points(6) | |||||||||||||||
| Interest rate�Foreign exchange correlation / (A)(D) | 3�to�63 | % | 43%�/�48�%(6) | |||||||||||||||||
| Interest rate volatility skew / (A)(D) | 24�to�50 | % | 33%�/�28%(6) | |||||||||||||||||
| Interest rate quanto correlation / (A)(D) | -11�to�34 | % | 8%�/�5%(6) | |||||||||||||||||
| Interest rate curve correlation / (A)(D) | 46�to�92 | % | 74%�/�80%(6) | |||||||||||||||||
| Inflation volatility / (A)(D) | 77�to�86 | % | 81%�/�80%(6) | |||||||||||||||||
| Credit contracts | (147 | ) | Comparable�pricing | Cash synthetic basis / (C)(D) | 2�to�5 | points | 4 | points | ||||||||||||
| Comparable bond price / (C)(D) | 0�to�75 | points | 27 | points | ||||||||||||||||
| Correlation�model(3) | Credit correlation / (B) | 19�to�96 | % | 56 | % | |||||||||||||||
| Foreign exchange contracts(7) | 68 | Option�model | Comparable bond price / (A)(D) | 5�to�100 | points | 58�points | /�65�points(6) | |||||||||||||
| Interest rate quanto correlation / (A)(D) | -11�to�34 | % | 8%�/�5%(6) | |||||||||||||||||
| Interest rate curve correlation / (A)(D) | 46�to�92 | % | 74%�/�80%(6) | |||||||||||||||||
| Interest rate�Foreign exchange correlation / (A)(D) | 3�to�63 | % | 43%�/�48%(6) | |||||||||||||||||
| Interest rate volatility skew / (A)(D) | 24�to�50 | % | 33%�/�28%(6) | |||||||||||||||||
| Interest rate curve / (A)(D) | 0 to 1 | % | 1%�/�0%(6) | |||||||||||||||||
| Equity contracts(7) | (831 | ) | Option�model | At the money volatility / (A)(D) | 20�to�53 | % | 31 | % | ||||||||||||
| Volatility skew / (A)(D) | -3 to 0 | % | -1 | % | ||||||||||||||||
| Equity�Equity correlation / (C)(D) | 40�to�99 | % | 69 | % | ||||||||||||||||
| Equity�Foreign exchange correlation / (C)(D) | -50�to�9 | % | -20 | % | ||||||||||||||||
| Equity�Interest rate correlation / (C)(D) | -4�to�70 | % | 39%�/�40%(6) | |||||||||||||||||
| Commodity contracts | 880 | Option�model | Forward power price / (C)(D) | $14�to�$91 | per | $40 | per | |||||||||||||
| Megawatt�hour | Megawatt�hour | |||||||||||||||||||
| Commodity volatility / (A)(D) | 11�to�30 | % | 14 | % | ||||||||||||||||
| Cross commodity correlation / (C)(D) | 34�to�99 | % | 93 | % | ||||||||||||||||
| | 192 |
| Balance at December 31, 2013 (dollars in millions) | Valuation Technique(s) | Significant�Unobservable�Input(s)�/ Sensitivity�of�the�Fair�Value�to�Changes in the Unobservable Inputs | Range(1) | Averages(2) | ||||||||||||||||||||
| Investments(4): | ||||||||||||||||||||||||
| Principal investments | 2,160 | Discounted cash flow | Implied weighted average cost of capital / (C)(D) | 12 | % | 12 | % | |||||||||||||||||
| Exit multiple / (A)(D) | 9 | times | 9 | times | ||||||||||||||||||||
| Discounted�cash�flow(3) | Capitalization rate / (C)(D) | 5 to 13 | % | 7 | % | |||||||||||||||||||
| Equity discount rate / (C)(D) | 10 to 30 | % | 21 | % | ||||||||||||||||||||
| Market approach | EBITDA multiple / (A) | 5�to�6 | times | 5 | times | |||||||||||||||||||
| Other | 538 | Discounted cash flow | Implied weighted average cost of capital / (C)(D) | 7 to 10 | % | 8 | % | |||||||||||||||||
| Exit multiple / (A)(D) | 7�to�9 | times | 9 | times | ||||||||||||||||||||
| Market approach(3) | EBITDA multiple / (A) | 8�to�14 | times | 10 | times | |||||||||||||||||||
| Liabilities | ||||||||||||||||||||||||
| Securities sold under agreements to repurchase | $ | 154 | Discounted cash flow | Funding spread / (A) | 92�to�97 | basis�points | 95 | basis�points | ||||||||||||||||
| Other secured financings | 278 | Comparable pricing(3) | Comparable bond price / (A) | 99�to�102 | points | 101 | points | |||||||||||||||||
| Discounted cash flow | Funding spread / (A) | 97 | basis�points | 97 | basis�points | |||||||||||||||||||
| Long-term borrowings | 1,887 | Option model | At the money volatility / (C)(D) | 20 to 33 | % | 26 | % | |||||||||||||||||
| Volatility skew / (A)(D) | -2 to 0 | % | 0 | % | ||||||||||||||||||||
| Equity�Equity correlation / (A)(D) | 50 to 70 | % | 69 | % | ||||||||||||||||||||
| Equity�Foreign exchange correlation / (C)(D) | -60 to 0 | % | -23 | % | ||||||||||||||||||||
| (1) | The ranges of significant unobservable inputs are represented in points, percentages, basis points, times or megawatt hours.�Points are a percentage of par; for example, 93 points would be 93% of par. A basis point equals 1/100th of 1%; for example, 487 basis points would equal 4.87%. |
| (2) | Amounts represent weighted averages except where simple averages and the median of the inputs are provided (see footnote 6 below). Weighted averages are calculated by weighting each input by the fair value of the respective financial instruments except for long-term borrowings and derivative instruments where inputs are weighted by risk. |
| (3) | This is the predominant valuation technique for this major asset or liability class. |
| (4) | Investments in funds measured using an unadjusted NAV are excluded. |
| (5) | CVA is included in the balance, but excluded from the Valuation Technique(s) and Significant Unobservable Input(s) in the table above. CVA is deemed to be a Level 3 input when the underlying counterparty credit curve is unobservable. |
| (6) | The data structure of the significant unobservable inputs used in valuing Interest rate contracts, Foreign exchange contracts and certain Equity contracts may be in a multi-dimensional form, such as a curve or surface, with risk distributed across the structure. Therefore, a simple average and median, together with the range of data inputs, may be more appropriate measurements than a single point weighted average. |
| (7) | Includes derivative contracts with multiple risks ( i.e., hybrid products). |
| (A) | Significant increase (decrease) in the unobservable input in isolation would result in a significantly higher (lower) fair value measurement. |
| (B) | Significant changes in credit correlation may result in a significantly higher or lower fair value measurement. Increasing (decreasing) correlation drives a redistribution of risk within the capital structure such that junior tranches become less (more) risky and senior tranches become more (less) risky. |
| (C) | Significant increase (decrease) in the unobservable input in isolation would result in a significantly lower (higher) fair value measurement. |
| (D) | There are no predictable relationships between the significant unobservable inputs. |
| � | Capitalization rate�the ratio between net operating income produced by an asset and its market value at the projected disposition date. |
| � | Cash synthetic basis �the measure of the price differential between cash financial instruments (�cash instruments�) and their synthetic derivative-based equivalents (�synthetic instruments�). The range disclosed in the table above signifies the number of points by which the synthetic bond equivalent price is higher than the quoted price of the underlying cash bonds. |
| 193 | |
| � | Comparable bond price �a pricing input used when prices for the identical instrument are not available. Significant subjectivity may be involved when fair value is determined using pricing data available for comparable instruments. Valuation using comparable instruments can be done by calculating an implied yield (or spread over a liquid benchmark) from the price of a comparable bond, then adjusting that yield (or spread) to derive a value for the bond. The adjustment to yield (or spread) should account for relevant differences in the bonds such as maturity or credit quality. Alternatively, a price-to-price basis can be assumed between the comparable instrument and bond being valued in order to establish the value of the bond. Additionally, as the probability of default increases for a given bond ( i.e. , as the bond becomes more distressed), the valuation of that bond will increasingly reflect its expected recovery level assuming default. The decision to use price-to-price or yield/spread comparisons largely reflects trading market convention for the financial instruments in question. Price-to-price comparisons are primarily employed for RMBS, CMBS, ABS, CDOs, CLOs, Other debt, interest rate contracts, foreign exchange contracts, Other secured financings and distressed corporate bonds. Implied yield (or spread over a liquid benchmark) is utilized predominately for non-distressed corporate bonds, loans and credit contracts. |
| � | Comparable equity price� a price derived from equity raises, share buybacks and external bid levels, etc.�A discount or premium may be included in the fair value estimate. |
| � | Correlation� a pricing input where the payoff is driven by more than one underlying risk. Correlation is a measure of the relationship between the movements of two variables ( i.e ., how the change in one variable influences a change in the other variable). Credit correlation, for example, is the factor that describes the relationship between the probability of individual entities to default on obligations and the joint probability of multiple entities to default on obligations. |
| � | Credit spread �the difference in yield between different securities due to differences in credit quality. The credit spread reflects the additional net yield an investor can earn from a security with more credit risk relative to one with less credit risk. The credit spread of a particular security is often quoted in relation to the yield on a credit risk-free benchmark security or reference rate, typically either U.S. Treasury or London Interbank Offered Rate (�LIBOR�). |
| � | EBITDA multiple/Exit multiple �the ratio of the Enterprise Value to EBITDA, where the Enterprise Value is the aggregate value of equity and debt minus cash and cash equivalents. The EBITDA multiple reflects the value of the company in terms of its full-year EBITDA, whereas the exit multiple reflects the value of the company in terms of its full-year expected EBITDA at exit. Either multiple allows comparison between companies from an operational perspective as the effect of capital structure, taxation and depreciation/amortization is excluded. |
| � | Equity alpha� a parameter used in the modeling of equity hybrid prices. |
| � | Funding spread �the difference between the general collateral rate (which refers to the rate applicable to a broad class of U.S. Treasury issuances) and the specific collateral rate (which refers to the rate applicable to a specific type of security pledged as collateral, such as a municipal bond). Repurchase agreements and certain other secured financings are discounted based on collateral curves. The curves are constructed as spreads over the corresponding overnight indexed swap (�OIS�) or LIBOR curves, with the short end of the curve representing spreads over the corresponding OIS curves and the long end of the curve representing spreads over LIBOR. |
| � | Implied weighted average cost of capital (�WACC�) �the WACC implied by the current value of equity in a discounted cash flow model. The model assumes that the cash flow assumptions, including projections, are fully reflected in the current equity value, while the debt to equity ratio is held constant. The WACC theoretically represents the required rate of return to debt and equity investors. |
Table of Contents MORGAN STANLEY NOTES TO CONSOLIDATED FINANCIAL STATEMENTS�(Continued) | � | Interest rate curve �the term structure of interest rates (relationship between interest rates and the time to maturity) and a market�s measure of future interest rates at the time of observation. An interest rate curve is used to set interest rate and foreign exchange derivative cash flows and is a pricing input used in the discounting of any OTC derivative cash flow. |
| � | Price / Book ratio �the ratio used to compare a stock�s market value with its book value. The ratio is calculated by dividing the current closing price of the stock by the latest book value per share. This multiple allows comparison between companies from an operational perspective. |
| � | Price / Earnings ratio �the ratio used to measure a company�s equity value in relation to its earnings. The ratio is calculated by dividing the equity value per share by the latest historical or forward-looking earnings per share. The ratio results in a standardized metric that allows comparison between companies, after also considering the effects of different leverage ratios and taxation rates. |
| � | Volatility �the measure of the variability in possible returns for an instrument given how much that instrument changes in value over time. Volatility is a pricing input for options and, generally, the lower the volatility, the less risky the option. The level of volatility used in the valuation of a particular option depends on a number of factors, including the nature of the risk underlying that option ( e.g. , the volatility of a particular underlying equity security may be significantly different from that of a particular underlying commodity index), the tenor and the strike price of the option. |
| � | Volatility skew�the measure of the difference in implied volatility for options with identical underliers and expiry dates but with different strikes. The implied volatility for an option with a strike price that is above or below the current price of an underlying asset will typically deviate from the implied volatility for an option with a strike price equal to the current price of that same underlying asset. |
| At December�31, 2014 | At December�31, 2013 | |||||||||||||||
| Fair�Value | Unfunded Commitment | Fair�Value | Unfunded Commitment | |||||||||||||
| (dollars in millions) | ||||||||||||||||
| Private equity funds | $ | 2,569 | $ | 613 | $ | 2,531 | $ | 559 | ||||||||
| Real estate funds | 1,753 | 112 | 1,643 | 124 | ||||||||||||
| Hedge funds(1): | ||||||||||||||||
| Long-short equity hedge funds | 433 | � | 469 | � | ||||||||||||
| Fixed income/credit-related hedge funds | 76 | � | 82 | � | ||||||||||||
| Event-driven hedge funds | 39 | � | 38 | � | ||||||||||||
| Multi-strategy hedge funds | 139 | 3 | 220 | 3 | ||||||||||||
| Total | $ | 5,009 | $ | 728 | $ | 4,983 | $ | 686 | ||||||||
| (1) | Fixed income/credit-related hedge funds, event-driven hedge funds and multi-strategy hedge funds are redeemable at least on a three-month period basis, primarily with a notice period of 90 days or less. At December�31, 2014, approximately 36% of the fair value amount of long-short equity hedge funds was redeemable at least quarterly, 47% is redeemable every six months and 17% of these funds have a redemption frequency of greater than six months. At December�31, 2013, approximately 42% of the fair value amount of long-short equity hedge funds was redeemable at least quarterly, 42% is redeemable every six months and 16% of these funds have a redemption frequency of greater than six months. The notice period for long-short equity hedge funds at December�31, 2014 and December�31, 2013 was primarily greater than six months. |
| 195 | |
| � | Long-Short Equity Hedge Funds. Amount includes investments in hedge funds that invest, long or short, in equities. Equity value and growth hedge funds purchase stocks perceived to be undervalued and sell stocks perceived to be overvalued. Investments representing approximately 10% of the fair value of the investments in this category cannot be redeemed currently because the investments include certain initial period lock-up restrictions. The remaining restriction period for these investments subject to lock-up restrictions was primarily less than one year at December�31, 2014. Investments representing approximately 21% of the fair value of the investments in long-short equity hedge funds cannot be redeemed currently because an exit restriction has been imposed by the hedge fund manager. The restriction period for these investments subject to an exit restriction was primarily indefinite at December�31, 2014. |
| � | Fixed Income/Credit-Related Hedge Funds. Amount includes investments in hedge funds that employ long-short, distressed or relative value strategies in order to benefit from investments in undervalued or overvalued securities that are primarily debt or credit related. Investments representing approximately 10% of the fair value of the investments in this category cannot be redeemed currently because the investments include certain initial period lock-up restrictions. The remaining restriction period for these investments subject to lock-up restrictions was primarily over three years at December�31, 2014. |
| � | Event-Driven Hedge Funds. Amount includes investments in hedge funds that invest in event-driven situations such as mergers, hostile takeovers, reorganizations or leveraged buyouts. This may involve the simultaneous purchase of stock in companies being acquired and the sale of stock in its acquirer, with the expectation to profit from the spread between the current market price and the ultimate purchase price of the target company. At December�31, 2014, there were no restrictions on redemptions. |
| � | Multi-strategy Hedge Funds. Amount includes investments in hedge funds that pursue multiple strategies to realize short- and long-term gains. Management of the hedge funds has the ability to overweight or underweight different strategies to best capitalize on current investment opportunities. At |
| | 196 |
| December�31, 2014, investments representing approximately 28% of the fair value of the investments in this category cannot be redeemed currently because the investments include certain initial period lock-up restrictions. The remaining restriction period for these investments subject to lock-up restrictions was primarily over three years at December�31, 2014. Investments representing approximately 27% of the fair value of the investments in multi-strategy hedge funds cannot be redeemed currently because an exit restriction has been imposed by the hedge fund manager. The restriction period for these investments subject to an exit restriction was indefinite at December�31, 2014. |
| Trading Revenues | Interest Income (Expense) | Gains�(Losses) Included�in Net�Revenues | ||||||||||
| (dollars in millions) | ||||||||||||
| Year Ended December�31, 2014 | ||||||||||||
| Securities purchased under agreements to resell | $ | (4 | ) | $ | 9 | $ | 5 | |||||
| Commercial paper and other short-term borrowings(1) | (136 | ) | 1 | (135 | ) | |||||||
| Securities sold under agreements to repurchase | (5 | ) | (6 | ) | (11 | ) | ||||||
| Long-term borrowings(1) | 1,867 | (638 | ) | 1,229 | ||||||||
| Year Ended December�31, 2013 | ||||||||||||
| Securities purchased under agreements to resell | $ | (1 | ) | $ | 6 | $ | 5 | |||||
| Deposits | 52 | (60 | ) | (8 | ) | |||||||
| Commercial paper and other short-term borrowings(1) | 181 | (8 | ) | 173 | ||||||||
| Securities sold under agreements to repurchase | (3 | ) | (6 | ) | (9 | ) | ||||||
| Long-term borrowings(1) | 664 | (971 | ) | (307 | ) | |||||||
| Year Ended December�31, 2012 | ||||||||||||
| Securities purchased under agreements to resell | $ | 8 | $ | 5 | $ | 13 | ||||||
| Deposits | 57 | (86 | ) | (29 | ) | |||||||
| Commercial paper and other short-term borrowings(1) | (31 | ) | � | (31 | ) | |||||||
| Securities sold under agreements to repurchase | (15 | ) | (4 | ) | (19 | ) | ||||||
| Long-term borrowings(1) | (5,687 | ) | (1,321 | ) | (7,008 | ) | ||||||
| (1) | Of the total gains (losses) recorded in Trading revenues for short-term and long-term borrowings for 2014, 2013 and 2012, $651 million, $(681) million and $(4,402) million, respectively, are attributable to changes in the credit quality of the Company and other credit factors, and the respective remainder is attributable to changes in foreign currency rates or interest rates or movements in the reference price or index for structured notes before the impact of related hedges. |
| 197 | |
| Short-Term and Long-Term Borrowings | ||||||||
| Business Unit | At�December�31, 2014 | At�December�31, 2013 | ||||||
| (dollars in millions) | ||||||||
| Equity | $ | 17,253 | $ | 17,945 | ||||
| Interest rates | 13,545 | 15,933 | ||||||
| Credit and foreign exchange | 2,105 | 2,561 | ||||||
| Commodities | 636 | 545 | ||||||
| Total | $ | 33,539 | $ | 36,984 | ||||
| 2014 | 2013 | 2012 | ||||||||||
| (dollars in millions) | ||||||||||||
| Short-term and long-term borrowings(1) | $ | 651 | $ | (681 | ) | $ | (4,402 | ) | ||||
| Loans and other debt(2) | 179 | 137 | 340 | |||||||||
| Unfunded lending commitments(3) | 30 | 255 | 1,026 | |||||||||
| (1) | The change in the fair value of short-term and long-term borrowings (primarily structured notes) includes an adjustment to reflect the change in credit quality of the Company based upon observations of the Company�s secondary bond market spreads and changes in other credit factors. |
| (2) | Loans and other debt instrument-specific credit gains (losses) were determined by excluding the non-credit components of gains and losses, such as those due to changes in interest rates. |
| (3) | Gains (losses) on unfunded lending commitments were generally determined based on the differential between estimated expected client yields and contractual yields at each respective period-end. |
| Contractual Principal Amount Exceeds Fair Value | ||||||||
| At�December�31, 2014 | At�December�31, 2013 | |||||||
| (dollars in millions) | ||||||||
| Short-term and long-term borrowings(1) | $ | (670 | ) | $ | (2,409 | ) | ||
| Loans and other debt(2) | 14,990 | 17,248 | ||||||
| Loans 90 or more days past due and/or on nonaccrual status(2)(3) | 12,916 | 15,113 | ||||||
| | 198 |
| (1) | Short-term and long-term borrowings do not include structured notes where the repayment of the initial principal amount fluctuates based on changes in the reference price or index. |
| (2) | The majority of the difference between principal and fair value amounts for loans and other debt emanates from the Company�s distressed debt trading business, which purchases distressed debt at amounts well below par. |
| (3) | The aggregate fair value of loans that were in nonaccrual status, which includes all loans 90 or more days past due, was $1,367 million and $1,205 million at December�31, 2014 and December�31, 2013, respectively. The aggregate fair value of loans that were 90 or more days past due was $643 million and $655 million at December�31, 2014 and December�31, 2013, respectively. |
| Fair Value Measurements Using: | ||||||||||||||||||||
| Carrying�Value at�December�31, 2014 | Quoted�Prices�in Active�Markets�for Identical Assets (Level�1) | Significant Observable Inputs (Level 2) | Significant Unobservable Inputs (Level�3) | Total Gains (Losses)�for 2014(1) | ||||||||||||||||
| (dollars in millions) | ||||||||||||||||||||
| Loans(2) | $ | 3,336 | $ | � | $ | 2,386 | $ | 950 | $ | (165 | ) | |||||||||
| Other investments(3) | 46 | � | � | 46 | (38 | ) | ||||||||||||||
| Premises, equipment and software costs(4) | � | � | � | � | (58 | ) | ||||||||||||||
| Intangible assets(3) | 46 | � | � | 46 | (6 | ) | ||||||||||||||
| Other assets(4) | � | � | � | � | (9 | ) | ||||||||||||||
| Total | $ | 3,428 | $ | � | $ | 2,386 | $ | 1,042 | $ | (276 | ) | |||||||||
| (1) | Changes in the fair value of Loans and losses related to Other investments are recorded within Other revenues, whereas losses related to Premises, equipment and software costs, Intangible assets and Other assets are recorded within Other expenses in the Company�s consolidated statements of income. |
| (2) | Non-recurring changes in the fair value of loans held for investment or held for sale were calculated using recently executed transactions; market price quotations; valuation models that incorporate market observable inputs where possible, such as comparable loan or debt prices and credit default swap spread levels adjusted for any basis difference between cash and derivative instruments; or default recovery analysis where such transactions and quotations are unobservable. |
| (3) | Losses related to Other investments and Intangible assets were determined primarily using discounted cash flow models and methodologies that incorporate multiples of certain comparable companies. |
| (4) | Losses related to Premises, equipment and software costs and Other assets were determined primarily using a default recovery analysis. |
| 199 | |
| Fair Value Measurements Using: | ||||||||||||||||||||
| Carrying�Value at�December�31, 2013 | Quoted Prices in Active Markets for�Identical�Assets (Level�1) | Significant Observable Inputs (Level 2) | Significant Unobservable Inputs (Level 3) | Total Gains (Losses)�for 2013(1) | ||||||||||||||||
| (dollars in millions) | ||||||||||||||||||||
| Loans(2) | $ | 1,822 | $ | � | $ | 1,616 | $ | 206 | $ | (71 | ) | |||||||||
| Other investments(3) | 46 | � | � | 46 | (38 | ) | ||||||||||||||
| Premises, equipment and software costs(4) | 8 | � | � | 8 | (133 | ) | ||||||||||||||
| Intangible assets(3) | 92 | � | � | 92 | (44 | ) | ||||||||||||||
| Total | $ | 1,968 | $ | � | $ | 1,616 | $ | 352 | $ | (286 | ) | |||||||||
| (1) | Change in the fair value of Loans and losses related to Other investments are recorded within Other revenues, whereas losses related to Premises, equipment and software costs and Intangible assets are recorded within Other expenses in the Company�s consolidated statements of income. |
| (2) | Non-recurring changes in the fair value of loans held for investment or held for sale were calculated using recently executed transactions; market price quotations; valuation models that incorporate market observable inputs where possible, such as comparable loan or debt prices and credit default swap spread levels adjusted for any basis difference between cash and derivative instruments; or default recovery analysis where such transactions and quotations are unobservable. |
| (3) | Losses related to Other investments and Intangible assets were determined primarily using discounted cash flow models. |
| (4) | Losses related to Premises, equipment and software costs were determined primarily using discounted cash flow models or a default recovery analysis. |
| Fair Value Measurements Using: | ||||||||||||||||||||
| Carrying�Value at�December�31, 2012 | Quoted Prices in Active�Markets�for Identical Assets (Level�1) | Significant Observable Inputs (Level 2) | Significant Unobservable Inputs (Level 3) | Total Gains (Losses)�for 2012(1) | ||||||||||||||||
| (dollars in millions) | ||||||||||||||||||||
| Loans(2) | $ | 1,821 | $ | � | $ | 277 | $ | 1,544 | $ | (60 | ) | |||||||||
| Other investments(3) | 90 | � | � | 90 | (37 | ) | ||||||||||||||
| Premises, equipment and software costs(4) | 33 | � | � | 33 | (170 | ) | ||||||||||||||
| Intangible assets(3) | � | � | � | � | (4 | ) | ||||||||||||||
| Total | $ | 1,944 | $ | � | $ | 277 | $ | 1,667 | $ | (271 | ) | |||||||||
| (1) | Changes in the fair value of Loans and losses related to Other investments are recorded within Other revenues, whereas losses related to Premises, equipment and software costs and Intangible assets are recorded within Other expenses in the Company�s consolidated statements of income. |
| (2) | Non-recurring changes in the fair value of loans held for investment or held for sale were calculated using recently executed transactions; market price quotations; valuation models that incorporate market observable inputs where possible, such as comparable loan or debt |
| | 200 |
| prices and credit default swap spread levels adjusted for any basis difference between cash and derivative instruments; or default recovery analysis where such transactions and quotations are unobservable. |
| (3) | Losses related to Other investments and Intangible assets were determined primarily using discounted cash flow models. |
| (4) | Losses related to Premises, equipment and software coats were determined using discounted cash flow models and primarily represented the write-off of the carrying value of certain premises and software that were abandoned during 2012 in association with the Wealth Management JV integration. |
| 201 | |
| At December�31, 2014 | Fair Value Measurements Using: | |||||||||||||||||||
| Carrying�Value | Fair Value | Quoted�Prices�in Active�Markets�for Identical Assets (Level 1) | Significant Observable Inputs (Level 2) | Significant Unobservable Inputs (Level 3) | ||||||||||||||||
| (dollars in millions) | ||||||||||||||||||||
| Financial Assets: | ||||||||||||||||||||
| Cash and due from banks | $ | 21,381 | $ | 21,381 | $ | 21,381 | $ | � | $ | � | ||||||||||
| Interest bearing deposits with banks | 25,603 | 25,603 | 25,603 | � | � | |||||||||||||||
| Cash deposited with clearing organizations or segregated under federal and other regulations or requirements | 40,607 | 40,607 | 40,607 | � | � | |||||||||||||||
| Investment securities�HTM securities | 100 | 100 | 100 | � | � | |||||||||||||||
| Securities purchased under agreements to resell | 82,175 | 82,165 | � | 81,981 | 184 | |||||||||||||||
| Securities borrowed | 136,708 | 136,708 | � | 136,696 | 12 | |||||||||||||||
| Customer and other receivables(1) | 45,116 | 45,028 | � | 39,945 | 5,083 | |||||||||||||||
| Loans(2) | 66,577 | 67,800 | � | 18,212 | 49,588 | |||||||||||||||
| Financial Liabilities: | ||||||||||||||||||||
| Deposits | $ | 133,544 | $ | 133,572 | $ | � | $ | 133,572 | $ | � | ||||||||||
| Commercial paper and other short-term borrowings | 496 | 496 | � | 496 | � | |||||||||||||||
| Securities sold under agreements to repurchase | 69,337 | 69,433 | � | 63,921 | 5,512 | |||||||||||||||
| Securities loaned | 25,219 | 25,244 | � | 24,740 | 504 | |||||||||||||||
| Other secured financings | 7,581 | 7,881 | � | 5,465 | 2,416 | |||||||||||||||
| Customer and other payables(1) | 178,373 | 178,373 | � | 178,373 | � | |||||||||||||||
| Long-term borrowings | 120,998 | 124,961 | � | 124,150 | 811 | |||||||||||||||
| (1) | Accrued interest, fees, and dividend receivables and payables where carrying value approximates fair value have been excluded. |
| (2) | Amounts include all loans measured at fair value on a non-recurring basis. |
| | 202 |
| At December�31, 2013 | Fair Value Measurements Using: | |||||||||||||||||||
| Carrying�Value | Fair Value | Quoted�Prices�in Active�Markets�for Identical Assets (Level 1) | Significant Observable Inputs (Level 2) | Significant Unobservable Inputs (Level 3) | ||||||||||||||||
| (dollars in millions) | ||||||||||||||||||||
| Financial Assets: | ||||||||||||||||||||
| Cash and due from banks | $ | 16,602 | $ | 16,602 | $ | 16,602 | $ | � | $ | � | ||||||||||
| Interest bearing deposits with banks | 43,281 | 43,281 | 43,281 | � | � | |||||||||||||||
| Cash deposited with clearing organizations or segregated under federal and other regulations or requirements | 39,203 | 39,203 | 39,203 | � | � | |||||||||||||||
| Securities purchased under agreements to resell | 117,264 | 117,263 | � | 116,584 | 679 | |||||||||||||||
| Securities borrowed | 129,707 | 129,705 | � | 129,374 | 331 | |||||||||||||||
| Customer and other receivables(1) | 53,112 | 53,031 | � | 47,525 | 5,506 | |||||||||||||||
| Loans(2) | 42,874 | 42,765 | � | 11,288 | 31,477 | |||||||||||||||
| Financial Liabilities: | ||||||||||||||||||||
| Deposits | $ | 112,194 | $ | 112,273 | $ | � | $ | 112,273 | $ | � | ||||||||||
| Commercial paper and other short-term borrowings | 795 | 795 | � | 787 | 8 | |||||||||||||||
| Securities sold under agreements to repurchase | 145,115 | 145,157 | � | 138,161 | 6,996 | |||||||||||||||
| Securities loaned | 32,799 | 32,826 | � | 31,731 | 1,095 | |||||||||||||||
| Other secured financings | 9,009 | 9,034 | � | 5,845 | 3,189 | |||||||||||||||
| Customer and other payables(1) | 154,654 | 154,654 | � | 154,654 | � | |||||||||||||||
| Long-term borrowings | 117,938 | 123,133 | � | 122,099 | 1,034 | |||||||||||||||
| (1) | Accrued interest, fees, and dividend receivables and payables where carrying value approximates fair value have been excluded. |
| (2) | Amounts include all loans measured at fair value on a non-recurring basis. |
| 203 | |
| At December�31, 2014 | ||||||||||||||||||||
| Amortized Cost | Gross Unrealized Gains | Gross Unrealized Losses | Other-than- Temporary Impairment | Fair Value | ||||||||||||||||
| (dollars in millions) | ||||||||||||||||||||
| AFS debt securities: | ||||||||||||||||||||
| U.S. government and agency securities: | ||||||||||||||||||||
| U.S. Treasury securities | $ | 35,855 | $ | 42 | $ | 67 | $ | � | $ | 35,830 | ||||||||||
| U.S. agency securities(1) | 18,030 | 77 | 72 | � | 18,035 | |||||||||||||||
| Total U.S. government and agency securities | 53,885 | 119 | 139 | � | 53,865 | |||||||||||||||
| Corporate and other debt: | ||||||||||||||||||||
| Commercial mortgage-backed securities: | ||||||||||||||||||||
| Agency | 2,288 | 1 | 76 | � | 2,213 | |||||||||||||||
| Non-agency | 1,820 | 11 | 6 | � | 1,825 | |||||||||||||||
| Auto loan asset-backed securities | 2,433 | � | 5 | � | 2,428 | |||||||||||||||
| Corporate bonds | 3,640 | 10 | 22 | � | 3,628 | |||||||||||||||
| Collateralized loan obligations | 1,087 | � | 20 | � | 1,067 | |||||||||||||||
| FFELP student loan asset-backed securities(2) | 4,169 | 18 | 8 | � | 4,179 | |||||||||||||||
| Total corporate and other debt | 15,437 | 40 | 137 | � | 15,340 | |||||||||||||||
| Total AFS debt securities | 69,322 | 159 | 276 | � | 69,205 | |||||||||||||||
| AFS equity securities | 15 | � | 4 | � | 11 | |||||||||||||||
| Total AFS securities | 69,337 | 159 | 280 | � | 69,216 | |||||||||||||||
| HTM securities: | ||||||||||||||||||||
| U.S. government securities: | ||||||||||||||||||||
| U.S. Treasury securities | 100 | � | � | � | 100 | |||||||||||||||
| Total HTM securities | 100 | � | � | � | 100 | |||||||||||||||
| Total Investment securities | $ | 69,437 | $ | 159 | $ | 280 | $ | � | $ | 69,316 | ||||||||||
| | 204 |
| At December�31, 2013 | ||||||||||||||||||||
| Amortized Cost | Gross Unrealized Gains | Gross Unrealized Losses | Other-than- Temporary Impairment | Fair Value | ||||||||||||||||
| (dollars in millions) | ||||||||||||||||||||
| AFS debt securities: | ||||||||||||||||||||
| U.S. government and agency securities: | ||||||||||||||||||||
| U.S. Treasury securities | $ | 24,486 | $ | 51 | $ | 139 | $ | � | $ | 24,398 | ||||||||||
| U.S. agency securities(1) | 15,813 | 26 | 234 | � | 15,605 | |||||||||||||||
| Total U.S. government and agency securities | 40,299 | 77 | 373 | � | 40,003 | |||||||||||||||
| Corporate and other debt: | ||||||||||||||||||||
| Commercial mortgage-backed securities: | ||||||||||||||||||||
| Agency | 2,482 | � | 84 | � | 2,398 | |||||||||||||||
| Non-agency | 1,333 | 1 | 18 | � | 1,316 | |||||||||||||||
| Auto loan asset-backed securities | 2,041 | 2 | 1 | � | 2,042 | |||||||||||||||
| Corporate bonds | 3,415 | 3 | 61 | � | 3,357 | |||||||||||||||
| Collateralized loan obligations | 1,087 | � | 20 | � | 1,067 | |||||||||||||||
| FFELP student loan asset-backed securities(2) | 3,230 | 12 | 8 | � | 3,234 | |||||||||||||||
| Total corporate and other debt | 13,588 | 18 | 192 | � | 13,414 | |||||||||||||||
| Total AFS debt securities | 53,887 | 95 | 565 | � | 53,417 | |||||||||||||||
| AFS equity securities | 15 | � | 2 | � | 13 | |||||||||||||||
| Total Investment securities | $ | 53,902 | $ | 95 | $ | 567 | $ | � | $ | 53,430 | ||||||||||
| (1) | U.S. agency securities are composed of three main categories consisting of agency-issued debt, agency mortgage pass-through pool securities and collateralized mortgage obligations. |
| (2) | Amounts are backed by a guarantee from the U.S. Department of Education of at least 95% of the principal balance and interest on such loans. |
| 205 | |
| Less than 12 Months | 12 Months or Longer | Total | ||||||||||||||||||||||
| At December�31, 2014 | Fair�Value | Gross Unrealized Losses | Fair�Value | Gross Unrealized Losses | Fair�Value | Gross Unrealized Losses | ||||||||||||||||||
| (dollars in millions) | ||||||||||||||||||||||||
| AFS debt securities: | ||||||||||||||||||||||||
| U.S. government and agency securities: | ||||||||||||||||||||||||
| U.S. Treasury securities | $ | 11,410 | $ | 14 | $ | 5,924 | $ | 53 | $ | 17,334 | $ | 67 | ||||||||||||
| U.S. agency securities | 2,739 | 6 | 4,133 | 66 | 6,872 | 72 | ||||||||||||||||||
| Total U.S. government and agency securities | 14,149 | 20 | 10,057 | 119 | 24,206 | 139 | ||||||||||||||||||
| Corporate and other debt: | ||||||||||||||||||||||||
| Commercial mortgage-backed securities: | ||||||||||||||||||||||||
| Agency | 42 | � | 1,822 | 76 | 1,864 | 76 | ||||||||||||||||||
| Non-agency | 706 | 3 | 346 | 3 | 1,052 | 6 | ||||||||||||||||||
| Auto loan asset-backed securities | 2,034 | 5 | � | � | 2,034 | 5 | ||||||||||||||||||
| Corporate bonds | 905 | 6 | 1,299 | 16 | 2,204 | 22 | ||||||||||||||||||
| Collateralized loan obligations | � | � | 1,067 | 20 | 1,067 | 20 | ||||||||||||||||||
| FFELP student loan asset-backed securities | 1,523 | 6 | 393 | 2 | 1,916 | 8 | ||||||||||||||||||
| Total corporate and other debt | 5,210 | 20 | 4,927 | 117 | 10,137 | 137 | ||||||||||||||||||
| Total AFS debt securities | 19,359 | 40 | 14,984 | 236 | 34,343 | 276 | ||||||||||||||||||
| AFS equity securities | 11 | 4 | � | � | 11 | 4 | ||||||||||||||||||
| Total Investment securities | $ | 19,370 | $ | 44 | $ | 14,984 | $ | 236 | $ | 34,354 | $ | 280 | ||||||||||||
| | 206 |
| Less than 12 Months | 12 Months or Longer | Total | ||||||||||||||||||||||
| At December�31, 2013 | Fair�Value | Gross Unrealized Losses | Fair�Value | Gross Unrealized Losses | Fair�Value | Gross Unrealized Losses | ||||||||||||||||||
| (dollars in millions) | ||||||||||||||||||||||||
| AFS debt securities: | ||||||||||||||||||||||||
| U.S. government and agency securities: | ||||||||||||||||||||||||
| U.S. Treasury securities | $ | 13,266 | $ | 139 | $ | � | $ | � | $ | 13,266 | $ | 139 | ||||||||||||
| U.S. agency securities | 8,438 | 211 | 651 | 23 | 9,089 | 234 | ||||||||||||||||||
| Total U.S. government and agency securities | 21,704 | 350 | 651 | 23 | 22,355 | 373 | ||||||||||||||||||
| Corporate and other debt: | ||||||||||||||||||||||||
| Commercial mortgage-backed securities: | ||||||||||||||||||||||||
| Agency | 958 | 15 | 1,270 | 69 | 2,228 | 84 | ||||||||||||||||||
| Non-agency | 841 | 16 | 86 | 2 | 927 | 18 | ||||||||||||||||||
| Auto loan asset-backed securities | 557 | 1 | 85 | � | 642 | 1 | ||||||||||||||||||
| Corporate bonds | 2,350 | 52 | 383 | 9 | 2,733 | 61 | ||||||||||||||||||
| Collateralized loan obligations | 1,067 | 20 | � | � | 1,067 | 20 | ||||||||||||||||||
| FFELP student loan asset-backed securities | 1,388 | 7 | 76 | 1 | 1,464 | 8 | ||||||||||||||||||
| Total corporate and other debt | 7,161 | 111 | 1,900 | 81 | 9,061 | 192 | ||||||||||||||||||
| Total AFS debt securities | 28,865 | 461 | 2,551 | 104 | 31,416 | 565 | ||||||||||||||||||
| AFS equity securities | 13 | 2 | � | � | 13 | 2 | ||||||||||||||||||
| Total Investment securities | $ | 28,878 | $ | 463 | $ | 2,551 | $ | 104 | $ | 31,429 | $ | 567 | ||||||||||||
| 207 | |
| At December�31, 2014 | Amortized�Cost | Fair�Value | Annualized Average�Yield | |||||||||
| (dollars in millions) | ||||||||||||
| AFS debt securities: | ||||||||||||
| U.S. government and agency securities: | ||||||||||||
| U.S. Treasury securities: | ||||||||||||
| Due within 1 year | $ | 1,254 | $ | 1,255 | 0.4 | % | ||||||
| After 1 year through 5 years | 33,218 | 33,197 | 0.8 | % | ||||||||
| After 5 years through 10 years | 1,383 | 1,378 | 1.7 | % | ||||||||
| Total | 35,855 | 35,830 | ||||||||||
| U.S. agency securities: | ||||||||||||
| After 1 year through 5 years | 1,457 | 1,458 | 0.9 | % | ||||||||
| After 5 years through 10 years | 1,797 | 1,803 | 1.3 | % | ||||||||
| After 10 years | 14,776 | 14,774 | 1.6 | % | ||||||||
| Total | 18,030 | 18,035 | ||||||||||
| Total U.S. government and agency securities | 53,885 | 53,865 | 1.1 | % | ||||||||
| Corporate and other debt: | ||||||||||||
| Commercial mortgage-backed securities: | ||||||||||||
| Agency: | ||||||||||||
| Due within 1 year | 59 | 59 | 0.5 | % | ||||||||
| After 1 year through 5 years | 609 | 606 | 1.0 | % | ||||||||
| After 5 years through 10 years | 400 | 396 | 1.1 | % | ||||||||
| After 10 years | 1,220 | 1,152 | 1.5 | % | ||||||||
| Total | 2,288 | 2,213 | ||||||||||
| Non-agency: | ||||||||||||
| After 10 years | 1,820 | 1,825 | 1.6 | % | ||||||||
| Total | 1,820 | 1,825 | ||||||||||
| Auto loan asset-backed securities: | ||||||||||||
| Due within 1 year | 17 | 17 | 0.7 | % | ||||||||
| After 1 year through 5 years | 2,319 | 2,314 | 0.9 | % | ||||||||
| After 5 years through 10 years | 97 | 97 | 1.4 | % | ||||||||
| Total | 2,433 | 2,428 | ||||||||||
| Corporate bonds: | ||||||||||||
| Due within 1 year | 224 | 224 | 0.8 | % | ||||||||
| After 1 year through 5 years | 2,911 | 2,898 | 1.4 | % | ||||||||
| After 5 years through 10 years | 505 | 506 | 2.7 | % | ||||||||
| Total | 3,640 | 3,628 | ||||||||||
| Collateralized loan obligations: | ||||||||||||
| After 10 years | 1,087 | 1,067 | 1.4 | % | ||||||||
| Total | 1,087 | 1,067 | ||||||||||
| | 208 |
| At December�31, 2014 | Amortized�Cost | Fair�Value | Annualized Average�Yield | |||||||||
| (dollars in millions) | ||||||||||||
| FFELP student loan asset-backed securities: | ||||||||||||
| After 1 year through 5 years | 116 | 116 | 0.7 | % | ||||||||
| After 5 years through 10 years | 609 | 609 | 0.8 | % | ||||||||
| After 10 years | 3,444 | 3,454 | 0.9 | % | ||||||||
| Total | 4,169 | 4,179 | ||||||||||
| Total corporate and other debt | 15,437 | 15,340 | 1.2 | % | ||||||||
| Total AFS debt securities | 69,322 | 69,205 | 1.1 | % | ||||||||
| AFS equity securities | 15 | 11 | 0.0 | % | ||||||||
| Total AFS securities | 69,337 | 69,216 | 1.1 | % | ||||||||
| HTM securities: | ||||||||||||
| U.S. government securities: | ||||||||||||
| U.S. Treasury securities: | ||||||||||||
| After 1 year through 5 years | 100 | 100 | 1.7 | % | ||||||||
| Total HTM securities | 100 | 100 | 1.7 | % | ||||||||
| Total Investment securities | $ | 69,437 | $ | 69,316 | 1.1 | % | ||||||
| 2014 | 2013 | 2012 | ||||||||||
| (dollars in millions) | ||||||||||||
| Gross realized gains | $ | 41 | $ | 49 | $ | 88 | ||||||
| Gross realized losses | $ | 1 | $ | 4 | $ | 10 | ||||||
| 209 | |
| At December�31, 2014 | ||||||||||||||||||||
| Gross Amounts(1) | Amounts�Offset in the Consolidated Statements of Financial Condition(2) | Net�Amounts Presented in the Consolidated Statements�of Financial Condition | Financial Instruments�Not Offset in the Consolidated Statements of Financial Condition(3) | Net�Exposure | ||||||||||||||||
| (dollars in millions) | ||||||||||||||||||||
| Assets | ||||||||||||||||||||
| Securities purchased under agreements to resell | $ | 148,234 | $ | (64,946 | ) | $ | 83,288 | $ | (79,343 | ) | $ | 3,945 | ||||||||
| Securities borrowed | 145,556 | (8,848 | ) | 136,708 | (128,282 | ) | 8,426 | |||||||||||||
| Liabilities | ||||||||||||||||||||
| Securities sold under agreements to repurchase | $ | 134,895 | $ | (64,946 | ) | $ | 69,949 | $ | (56,454 | ) | $ | 13,495 | ||||||||
| Securities loaned | 34,067 | (8,848 | ) | 25,219 | (24,252 | ) | 967 | |||||||||||||
| (1) | Amounts include $3.9 billion of Securities purchased under agreements to resell, $4.2 billion of Securities borrowed, $15.6 billion of Securities sold under agreements to repurchase and $0.7 billion of Securities loaned, which are either not subject to master netting agreements or collateral agreements or are subject to such agreements but the Company has not determined the agreements to be legally enforceable. |
| (2) | Amounts relate to master netting agreements and collateral agreements, which have been determined by the Company to be legally enforceable in the event of default and where certain other criteria are met in accordance with applicable offsetting accounting guidance. |
| (3) | Amounts relate to master netting agreements and collateral agreements, which have been determined by the Company to be legally enforceable in the event of default but where certain other criteria are not met in accordance with applicable offsetting accounting guidance. |
| At December�31, 2013 | ||||||||||||||||||||
| Gross Amounts(1) | Amounts�Offset in the Consolidated Statements of Financial Condition(2) | Net�Amounts Presented in the Consolidated Statements�of Financial Condition | Financial Instruments�Not Offset in the Consolidated Statements of Financial Condition(3) | Net�Exposure | ||||||||||||||||
| (dollars in millions) | ||||||||||||||||||||
| Assets | ||||||||||||||||||||
| Securities purchased under agreements to resell | $ | 183,015 | $ | (64,885 | ) | $ | 118,130 | $ | (106,828 | ) | $ | 11,302 | ||||||||
| Securities borrowed | 137,082 | (7,375 | ) | 129,707 | (113,339 | ) | 16,368 | |||||||||||||
| Liabilities | ||||||||||||||||||||
| Securities sold under agreements to repurchase | $ | 210,561 | $ | (64,885 | ) | $ | 145,676 | $ | (111,599 | ) | $ | 34,077 | ||||||||
| Securities loaned | 40,174 | (7,375 | ) | 32,799 | (32,543 | ) | 256 | |||||||||||||
| (1) | Amounts include $11.1 billion of Securities purchased under agreements to resell, $13.2�billion of Securities borrowed and $33.3�billion of Securities sold under agreements to repurchase, which are either not subject to master netting agreements or collateral agreements or are subject to such agreements but the Company has not determined the agreements to be legally enforceable. |
| | 210 |
| (2) | Amounts relate to master netting agreements and collateral agreements, which have been determined by the Company to be legally enforceable in the event of default and where certain other criteria are met in accordance with applicable offsetting accounting guidance. |
| (3) | Amounts relate to master netting agreements and collateral agreements, which have been determined by the Company to be legally enforceable in the event of default but where certain other criteria are not met in accordance with applicable offsetting accounting guidance. |
| At December� 31, 2014 | At December� 31, 2013 | |||||||
| (dollars in millions) | ||||||||
| Trading assets: | ||||||||
| U.S. government and agency securities | $ | 11,769 | $ | 16,292 | ||||
| Other sovereign government obligations | 6,084 | 5,748 | ||||||
| Corporate and other debt | 6,061 | 7,388 | ||||||
| Corporate equities | 7,421 | 8,713 | ||||||
| Total | $ | 31,335 | $ | 38,141 | ||||
| 211 | |
| At December� 31, 2014 | At December� 31, 2013 | |||||||
| (dollars in millions) | ||||||||
| Cash deposited with clearing organizations or segregated under federal and other regulations or requirements | $ | 40,607 | $ | 39,203 | ||||
| Securities(1) | 14,630 | 15,586 | ||||||
| Total | $ | 55,237 | $ | 54,789 | ||||
| (1) | Securities deposited with clearing organizations or segregated under federal and other regulations or requirements are sourced from Securities purchased under agreements to resell and Trading assets in the Company�s consolidated statements of financial condition. |
| | 212 |
| � | Interests purchased in connection with market-making activities, securities held in its AFS securities portfolio and retained interests held as a result of securitization activities, including re-securitization transactions. |
| � | Guarantees issued and residual interests retained in connection with municipal bond securitizations. |
| � | Servicing of residential and commercial mortgage loans held by VIEs. |
| � | Loans made to and investments in VIEs that hold debt, equity, real estate or other assets. |
| � | Derivatives entered into with VIEs. |
| � | Structuring of credit-linked notes (�CLN�) or other asset-repackaged notes designed to meet the investment objectives of clients. |
| � | Other structured transactions designed to provide tax-efficient yields to the Company or its clients. |
| 213 | |
| At December�31, 2014 | ||||||||||||||||
| Mortgage-�
and Asset-Backed Securitizations | Managed Real�Estate Partnerships(1) | Other Structured Financings | Other | |||||||||||||
| (dollars in millions) | ||||||||||||||||
| VIE assets | $ | 563 | $ | 288 | $ | 928 | $ | 1,199 | ||||||||
| VIE liabilities | $ | 337 | $ | 4 | $ | 80 | $ | � | ||||||||
| (1) | On April�1, 2014, the Company deconsolidated approximately $1.6 billion in total assets that were related to certain legal entities associated with a real estate fund sponsored by the Company. |
| At December�31, 2013 | ||||||||||||||||
| Mortgage-�
and Asset-Backed Securitizations | Managed Real Estate Partnerships | Other Structured Financings | Other | |||||||||||||
| (dollars in millions) | ||||||||||||||||
| VIE assets | $ | 643 | $ | 2,313 | $ | 1,202 | $ | 1,294 | ||||||||
| VIE liabilities | $ | 368 | $ | 42 | $ | 67 | $ | 175 | ||||||||
| | 214 |
| At December�31, 2014 | ||||||||||||||||||||
| Mortgage-�
and Asset-Backed Securitizations | Collateralized Debt Obligations | Municipal Tender Option Bonds | Other Structured Financings | Other | ||||||||||||||||
| (dollars in millions) | ||||||||||||||||||||
| VIE assets that the Company does not consolidate (unpaid principal balance)(1) | $ | 174,548 | $ | 26,567 | $ | 3,449 | $ | 2,040 | $ | 19,237 | ||||||||||
| Maximum exposure to loss: | ||||||||||||||||||||
| Debt and equity interests(2) | $ | 15,028 | $ | 3,062 | $ | 13 | $ | 1,158 | $ | 3,884 | ||||||||||
| Derivative and other contracts | 15 | 2 | 2,212 | � | 164 | |||||||||||||||
| Commitments, guarantees and other | 1,054 | 432 | � | 617 | 429 | |||||||||||||||
| Total maximum exposure to loss | $ | 16,097 | $ | 3,496 | $ | 2,225 | $ | 1,775 | $ | 4,477 | ||||||||||
| Carrying value of exposure to loss�Assets: | ||||||||||||||||||||
| Debt and equity interests(2) | $ | 15,028 | $ | 3,062 | $ | 13 | $ | 741 | $ | 3,884 | ||||||||||
| Derivative and other contracts | 15 | 2 | 4 | � | 74 | |||||||||||||||
| Total carrying value of exposure to loss�Assets | $ | 15,043 | $ | 3,064 | $ | 17 | $ | 741 | $ | 3,958 | ||||||||||
| Carrying value of exposure to loss�Liabilities: | ||||||||||||||||||||
| Derivative and other contracts | $ | � | $ | � | $ | � | $ | � | $ | 57 | ||||||||||
| Commitments, guarantees and other | � | � | � | 5 | � | |||||||||||||||
| Total carrying value of exposure to loss�Liabilities | $ | � | $ | � | $ | � | $ | 5 | $ | 57 | ||||||||||
| (1) | Mortgage- and asset-backed securitizations include VIE assets as follows: $30.8 billion of residential mortgages; $71.9 billion of commercial mortgages; $20.6 billion of U.S. agency collateralized mortgage obligations; and $51.2 billion of other consumer or commercial loans. |
| (2) | Mortgage- and asset-backed securitizations include VIE debt and equity interests as follows: $1.9 billion of residential mortgages; $2.4 billion of commercial mortgages; $4.0 billion of U.S. agency collateralized mortgage obligations; and $6.8 billion of other consumer or commercial loans. |
| 215 | |
| At December�31, 2013 | ||||||||||||||||||||
| Mortgage-�
and Asset-Backed Securitizations | Collateralized Debt Obligations | Municipal Tender Option Bonds | Other Structured Financings | Other | ||||||||||||||||
| (dollars in millions) | ||||||||||||||||||||
| VIE assets that the Company does not consolidate (unpaid principal balance)(1) | $ | 177,153 | $ | 29,513 | $ | 3,079 | $ | 1,874 | $ | 10,119 | ||||||||||
| Maximum exposure to loss: | ||||||||||||||||||||
| Debt and equity interests(2) | $ | 13,514 | $ | 2,498 | $ | 31 | $ | 1,142 | $ | 3,693 | ||||||||||
| Derivative and other contracts | 15 | 23 | 1,935 | � | 146 | |||||||||||||||
| Commitments, guarantees and other | � | 272 | � | 649 | 527 | |||||||||||||||
| Total maximum exposure to loss | $ | 13,529 | $ | 2,793 | $ | 1,966 | $ | 1,791 | $ | 4,366 | ||||||||||
| Carrying value of exposure to loss�Assets: | ||||||||||||||||||||
| Debt and equity interests(2) | $ | 13,514 | $ | 2,498 | $ | 31 | $ | 731 | $ | 3,693 | ||||||||||
| Derivative and other contracts | 15 | 3 | 4 | � | 53 | |||||||||||||||
| Total carrying value of exposure to loss�Assets | $ | 13,529 | $ | 2,501 | $ | 35 | $ | 731 | $ | 3,746 | ||||||||||
| Carrying value of exposure to loss�Liabilities: | ||||||||||||||||||||
| Derivative and other contracts | $ | � | $ | 2 | $ | � | $ | � | $ | 57 | ||||||||||
| Commitments, guarantees and other | � | � | � | 7 | � | |||||||||||||||
| Total carrying value of exposure to loss�Liabilities | $ | � | $ | 2 | $ | � | $ | 7 | $ | 57 | ||||||||||
| (1) | Mortgage- and asset-backed securitizations include VIE assets as follows: $16.9 billion of residential mortgages; $78.4 billion of commercial mortgages; $31.5 billion of U.S. agency collateralized mortgage obligations; and $50.4 billion of other consumer or commercial loans. |
| (2) | Mortgage- and asset-backed securitizations include VIE debt and equity interests as follows: $1.3 billion of residential mortgages; $2.0�billion of commercial mortgages; $5.3 billion of U.S. agency collateralized mortgage obligations; and $4.9 billion of other consumer or commercial loans. |
| | 216 |
| 217 | |
| | 218 |
| At December�31, 2014 | ||||||||||||||||
| Residential Mortgage Loans | Commercial Mortgage Loans | U.S. Agency Collateralized Mortgage Obligations | Credit- Linked Notes and�Other(1) | |||||||||||||
| (dollars in millions) | ||||||||||||||||
| SPE assets (unpaid principal balance)(2) | $ | 26,549 | $ | 58,660 | $ | 20,826 | $ | 24,011 | ||||||||
| Retained interests (fair value): | ||||||||||||||||
| Investment grade | $ | 10 | $ | 117 | $ | 1,019 | $ | 57 | ||||||||
| Non-investment grade | 98 | 120 | � | 1,264 | ||||||||||||
| Total retained interests (fair value) | $ | 108 | $ | 237 | $ | 1,019 | $ | 1,321 | ||||||||
| Interests purchased in the secondary market (fair value): | ||||||||||||||||
| Investment grade | $ | 32 | $ | 129 | $ | 61 | $ | 423 | ||||||||
| Non-investment grade | 32 | 72 | � | 59 | ||||||||||||
| Total interests purchased in the secondary market (fair�value) | $ | 64 | $ | 201 | $ | 61 | $ | 482 | ||||||||
| Derivative assets (fair value) | $ | � | $ | 495 | $ | � | $ | 138 | ||||||||
| Derivative liabilities (fair value) | $ | � | $ | � | $ | � | $ | 86 | ||||||||
| (1) | Amounts include CLO transactions managed by unrelated third parties. |
| (2) | Amounts include assets transferred by unrelated transferors. |
| 219 | |
| At December�31, 2014 | ||||||||||||||||
| Level�1 | Level�2 | Level�3 | Total | |||||||||||||
| (dollars in millions) | ||||||||||||||||
| Retained interests (fair value): | ||||||||||||||||
| Investment grade | $ | � | $ | 1,166 | $ | 37 | $ | 1,203 | ||||||||
| Non-investment grade | � | 123 | 1,359 | 1,482 | ||||||||||||
| Total retained interests (fair value) | $ | � | $ | 1,289 | $ | 1,396 | $ | 2,685 | ||||||||
| Interests purchased in the secondary market (fair value): | ||||||||||||||||
| Investment grade | $ | � | $ | 644 | $ | 1 | $ | 645 | ||||||||
| Non-investment grade | � | 129 | 34 | 163 | ||||||||||||
| Total interests purchased in the secondary market (fair�value) | $ | � | $ | 773 | $ | 35 | $ | 808 | ||||||||
| Derivative assets (fair value) | $ | � | $ | 559 | $ | 74 | $ | 633 | ||||||||
| Derivative liabilities (fair value) | $ | � | $ | 82 | $ | 4 | $ | 86 | ||||||||
| At December�31, 2013 | ||||||||||||||||
| Residential Mortgage Loans | Commercial Mortgage Loans | U.S. Agency Collateralized Mortgage Obligations | Credit- Linked Notes and�Other(1) | |||||||||||||
| (dollars in millions) | ||||||||||||||||
| SPE assets (unpaid principal balance)(2) | $ | 29,723 | $ | 60,698 | $ | 19,155 | $ | 19,921 | ||||||||
| Retained interests (fair value): | ||||||||||||||||
| Investment grade | $ | 1 | $ | 102 | $ | 524 | $ | 178 | ||||||||
| Non-investment grade | 136 | 95 | � | 1,436 | ||||||||||||
| Total retained interests (fair value) | $ | 137 | $ | 197 | $ | 524 | $ | 1,614 | ||||||||
| Interests purchased in the secondary market (fair value): | ||||||||||||||||
| Investment grade | $ | 14 | $ | 170 | $ | 21 | $ | 405 | ||||||||
| Non-investment grade | 41 | 97 | � | 82 | ||||||||||||
| Total interests purchased in the secondary market (fair�value) | $ | 55 | $ | 267 | $ | 21 | $ | 487 | ||||||||
| Derivative assets (fair value) | $ | 1 | $ | 672 | $ | � | $ | 121 | ||||||||
| Derivative liabilities (fair value) | $ | � | $ | 1 | $ | � | $ | 120 | ||||||||
| (1) | Amounts include CLO transactions managed by unrelated third parties. |
| (2) | Amounts include assets transferred by unrelated transferors. |
| | 220 |
| At December�31, 2013 | ||||||||||||||||
| Level�1 | Level�2 | Level�3 | Total | |||||||||||||
| (dollars in millions) | ||||||||||||||||
| Retained interests (fair value): | ||||||||||||||||
| Investment grade | $ | � | $ | 637 | $ | 168 | $ | 805 | ||||||||
| Non-investment grade | � | 164 | 1,503 | 1,667 | ||||||||||||
| Total retained interests (fair value) | $ | � | $ | 801 | $ | 1,671 | $ | 2,472 | ||||||||
| Interests purchased in the secondary market (fair value): | ||||||||||||||||
| Investment grade | $ | � | $ | 602 | $ | 8 | $ | 610 | ||||||||
| Non-investment grade | � | 182 | 38 | 220 | ||||||||||||
| Total interests purchased in the secondary market (fair value) | $ | � | $ | 784 | $ | 46 | $ | 830 | ||||||||
| Derivative assets (fair value) | $ | � | $ | 615 | $ | 179 | $ | 794 | ||||||||
| Derivative liabilities (fair value) | $ | � | $ | 110 | $ | 11 | $ | 121 | ||||||||
| 221 | |
| At�December�31,�2014 | At�December�31,�2013 | |||||||||||||||
| Carrying Value of | Carrying Value of | |||||||||||||||
| Assets | Liabilities | Assets | Liabilities | |||||||||||||
| (dollars in millions) | ||||||||||||||||
| Credit-linked notes | $ | 47 | $ | 39 | $ | 48 | $ | 41 | ||||||||
| Equity-linked transactions | 16 | 16 | 40 | 35 | ||||||||||||
| Other | 289 | 289 | 157 | 156 | ||||||||||||
| At December�31, 2014 | ||||||||||||
| Residential Mortgage Unconsolidated SPEs | Residential Mortgage Consolidated SPEs | Commercial Mortgage Unconsolidated SPEs | ||||||||||
| (dollars in millions) | ||||||||||||
| Assets serviced (unpaid principal balance) | $ | � | $ | 431 | $ | � | ||||||
| Amounts past due 90 days or greater (unpaid principal balance)(1) | $ | � | $ | 29 | $ | � | ||||||
| Percentage of amounts past due 90 days or greater(1) | � | 6.7 | % | � | ||||||||
| Credit losses | $ | � | $ | 4 | $ | � | ||||||
| (1) | Amounts include loans that are at least 90 days contractually delinquent, loans for which the borrower has filed for bankruptcy, loans in foreclosure and real estate owned. |
| | 222 |
| At December�31, 2013 | ||||||||||||
| Residential Mortgage Unconsolidated SPEs | Residential Mortgage Consolidated SPEs | Commercial Mortgage Unconsolidated SPEs | ||||||||||
| (dollars in millions) | ||||||||||||
| Assets serviced (unpaid principal balance) | $ | 785 | $ | 775 | $ | 4,114 | ||||||
| Amounts past due 90�days or greater (unpaid principal balance)(1) | $ | 66 | $ | 44 | $ | � | ||||||
| Percentage of amounts past due 90 days or greater(1) | 8.5 | % | 5.6 | % | � | |||||||
| Credit losses | $ | 1 | $ | 17 | $ | � | ||||||
| (1) | Amounts include loans that are at least 90 days contractually delinquent, loans for which the borrower has filed for bankruptcy, loans in foreclosure and real estate owned. |
| � | Corporate .����Corporate loans primarily include commercial and industrial lending used for general corporate purposes, working capital and liquidity, �event-driven� loans and asset-backed lending products. �Event-driven� loans support client merger, acquisition or recapitalization activities. Corporate lending is structured as revolving lines of credit, letter of credit facilities, term loans and bridge loans. Risk factors considered in determining the allowance for corporate loans include the borrower�s financial strength, seniority of the loan, collateral type, volatility of collateral value, debt cushion, covenants and counterparty type. |
| � | Consumer .����Consumer loans include unsecured loans and securities-based lending that allows clients to borrow money against the value of qualifying securities for any suitable purpose other than purchasing, trading, or carrying securities or refinancing margin debt. The majority of consumer loans are structured as revolving lines of credit and letter of credit facilities and are primarily offered through the Company�s Portfolio Loan Account (�PLA�) program. The allowance methodology for unsecured loans considers the specific attributes of the loan as well as the borrower�s source of repayment. The allowance methodology for securities-based lending considers the collateral type underlying the loan ( e.g. , diversified securities, concentrated securities or restricted stock). |
| � | Residential Real Estate .����Residential real estate loans mainly include non-conforming loans and home equity lines of credit. The allowance methodology for non-conforming residential mortgage loans considers several factors, including, but not limited to, loan-to-value ratio, FICO score, home price index, and delinquency status. The methodology for home equity lines of credit considers credit limits and utilization rates in addition to the factors considered for non-conforming residential mortgages. |
| � | Wholesale Real Estate .����Wholesale real estate loans include owner-occupied loans and income-producing loans. The principal risk factors for determining the allowance for wholesale real estate loans are the underlying collateral type, loan-to-value ratio and debt service ratio. |
| 223 | |
| December�31, 2014 | December�31, 2013 | |||||||||||||||||||||||
| Loans by Product Type | Loans�Held for Investment | Loans�Held for Sale | Total Loans(1)(2) | Loans�
Held for Investment | Loans�Held for Sale | Total Loans(1)(2) | ||||||||||||||||||
| (dollars in millions) | ||||||||||||||||||||||||
| Corporate loans | $ | 19,659 | $ | 8,200 | $ | 27,859 | $ | 13,263 | $ | 6,168 | $ | 19,431 | ||||||||||||
| Consumer loans | 16,576 | � | 16,576 | 11,577 | � | 11,577 | ||||||||||||||||||
| Residential real estate loans | 15,735 | 114 | 15,849 | 10,006 | 112 | 10,118 | ||||||||||||||||||
| Wholesale real estate loans | 5,298 | 1,144 | 6,442 | 1,855 | 49 | 1,904 | ||||||||||||||||||
| Total loans, gross of allowance for loan losses | 57,268 | 9,458 | 66,726 | 36,701 | 6,329 | 43,030 | ||||||||||||||||||
| Allowance for loan losses | (149 | ) | � | (149 | ) | (156 | ) | � | (156 | ) | ||||||||||||||
| Total loans, net of allowance for loan losses | $ | 57,119 | $ | 9,458 | $ | 66,577 | $ | 36,545 | $ | 6,329 | $ | 42,874 | ||||||||||||
| (1) | Amounts include loans that are made to non-U.S. borrowers of $7,017 million and $4,729 million at December�31, 2014 and December�31, 2013, respectively. |
| (2) | At December�31, 2014, loans at fixed interest rates and floating or adjustable interest rates were $6,663 million and $59,914 million, respectively. At December�31, 2013, loans at fixed interest rates and floating or adjustable interest rates were $6,318 million and $36,556�million, respectively. |
| | 224 |
| � | Pass .����A credit exposure rated pass has a continued expectation of timely repayment, all obligations of the borrower are current, and the obligor complies with material terms and conditions of the lending agreement. |
| � | Special Mention .����Extensions of credit that have potential weakness that deserve management�s close attention, and if left uncorrected may, at some future date, result in the deterioration of the repayment prospects or collateral position. |
| � | Substandard .����Obligor has a well-defined weakness that jeopardizes the repayment of the debt and has a high probability of payment default with the distinct possibility that the Company will sustain some loss if noted deficiencies are not corrected. |
| � | Doubtful .����Inherent weakness in the exposure makes the collection or repayment in full, based on existing facts, conditions and circumstances, highly improbable, and the amount of loss is uncertain. |
| � | Loss .����Extensions of credit classified as loss are considered uncollectible and are charged off. |
| December�31, 2014 | ||||||||||||||||||||
| Loans by Credit Quality Indicators | Corporate | Consumer | Residential Real� Estate | Wholesale Real� Estate | Total | |||||||||||||||
| (dollars in millions) | ||||||||||||||||||||
| Pass | $ | 17,847 | $ | 16,576 | $ | 15,688 | $ | 5,298 | $ | 55,409 | ||||||||||
| Special mention | 1,683 | � | � | � | 1,683 | |||||||||||||||
| Substandard | 127 | � | 47 | � | 174 | |||||||||||||||
| Doubtful | 2 | � | � | � | 2 | |||||||||||||||
| Loss | � | � | � | � | � | |||||||||||||||
| Total loans | $ | 19,659 | $ | 16,576 | $ | 15,735 | $ | 5,298 | $ | 57,268 | ||||||||||
| December 31, 2013 | ||||||||||||||||||||
| Loans by Credit Quality Indicators | Corporate | Consumer | Residential Real Estate | Wholesale Real Estate | Total | |||||||||||||||
| (dollars in millions) | ||||||||||||||||||||
| Pass | $ | 12,893 | $ | 11,577 | $ | 9,992 | $ | 1,829 | $ | 36,291 | ||||||||||
| Special mention | 189 | � | � | 16 | 205 | |||||||||||||||
| Substandard | 174 | � | 14 | � | 188 | |||||||||||||||
| Doubtful | 7 | � | � | 10 | 17 | |||||||||||||||
| Loss | � | � | � | � | � | |||||||||||||||
| Total loans | $ | 13,263 | $ | 11,577 | $ | 10,006 | $ | 1,855 | $ | 36,701 | ||||||||||
| 225 | |
| December�31, 2014 | ||||||||||||||||||||
| Loans by Product Type | Corporate | Consumer | Residential Real� Estate | Wholesale Real� Estate | Total | |||||||||||||||
| (dollars in millions) | ||||||||||||||||||||
| Impaired loans with allowance | $ | � | $ | � | $ | � | $ | � | $ | � | ||||||||||
| Impaired loans without allowance(1) | 2 | � | 17 | � | 19 | |||||||||||||||
| Impaired loans unpaid principal balance | 2 | � | 17 | � | 19 | |||||||||||||||
| Past due 90 days loans and on nonaccrual | 2 | � | 25 | � | 27 | |||||||||||||||
| December�31, 2013 | ||||||||||||||||||||
| Loans by Product Type | Corporate | Consumer | Residential Real� Estate | Wholesale Real� Estate | Total | |||||||||||||||
| (dollars in millions) | ||||||||||||||||||||
| Impaired loans with allowance | $ | 63 | $ | � | $ | � | $ | 10 | $ | 73 | ||||||||||
| Impaired loans without allowance(1) | 6 | � | 11 | � | 17 | |||||||||||||||
| Impaired loans unpaid principal balance | 69 | � | 11 | 10 | 90 | |||||||||||||||
| Past due 90 days loans and on nonaccrual | 7 | � | 11 | 10 | 28 | |||||||||||||||
| December�31, 2014 | ||||||||||||||||
| Loans by Region | Americas | EMEA | Asia-Pacific | Total | ||||||||||||
| (dollars in millions) | ||||||||||||||||
| Impaired loans | $ | 19 | $ | � | $ | � | $ | 19 | ||||||||
| Past due 90 days loans and on nonaccrual | 27 | � | � | 27 | ||||||||||||
| Allowance for loan losses | 121 | 20 | 8 | 149 | ||||||||||||
| December�31, 2013 | ||||||||||||||||
| Loans by Region | Americas | EMEA | Asia-Pacific | Total | ||||||||||||
| (dollars in millions) | ||||||||||||||||
| Impaired loans | $ | 90 | $ | � | $ | � | $ | 90 | ||||||||
| Past due 90 days loans and on nonaccrual | 28 | � | � | 28 | ||||||||||||
| Allowance for loan losses | 123 | 28 | 5 | 156 | ||||||||||||
| (1) | At December�31, 2014 and December�31, 2013, no allowance was outstanding for these loans as the fair value of the collateral held exceeded or equaled the carrying value. |
| | 226 |
| Corporate | Consumer | Residential Real�Estate | Wholesale Real�Estate | Total | ||||||||||||||||
| (dollars in millions) | ||||||||||||||||||||
| Allowance for loan losses: | ||||||||||||||||||||
| Balance at December 31, 2013 | $ | 137 | $ | 1 | $ | 4 | $ | 14 | $ | 156 | ||||||||||
| Gross charge-offs | (3 | ) | � | � | (3 | ) | (6 | ) | ||||||||||||
| Gross recoveries | � | � | � | 1 | 1 | |||||||||||||||
| Net charge-offs | (3 | ) | � | � | (2 | ) | (5 | ) | ||||||||||||
| Provision (release) for loan losses(1) | (13 | ) | 1 | 4 | 9 | 1 | ||||||||||||||
| Other | (3 | ) | � | � | � | (3 | ) | |||||||||||||
| Balance at December 31, 2014 | $ | 118 | $ | 2 | $ | 8 | $ | 21 | $ | 149 | ||||||||||
| Allowance for loan losses by impairment methodology: | ||||||||||||||||||||
| Inherent | $ | 118 | $ | 2 | $ | 8 | $ | 21 | $ | 149 | ||||||||||
| Specific | � | � | � | � | � | |||||||||||||||
| Total allowance for loan losses at December�31, 2014 | $ | 118 | $ | 2 | $ | 8 | $ | 21 | $ | 149 | ||||||||||
| Loans evaluated by impairment methodology(2): | ||||||||||||||||||||
| Inherent | $ | 19,657 | $ | 16,576 | $ | 15,718 | $ | 5,298 | $ | 57,249 | ||||||||||
| Specific | 2 | � | 17 | � | 19 | |||||||||||||||
| Total loans evaluated at December 31, 2014 | $ | 19,659 | $ | 16,576 | $ | 15,735 | $ | 5,298 | $ | 57,268 | ||||||||||
| Allowance for lending-related commitments: | ||||||||||||||||||||
| Balance at December 31, 2013 | $ | 125 | $ | � | $ | � | $ | 2 | $ | 127 | ||||||||||
| Provision for lending-related commitments(3) | 22 | � | � | � | 22 | |||||||||||||||
| Balance at December 31, 2014 | $ | 147 | $ | � | $ | � | $ | 2 | $ | 149 | ||||||||||
| Allowance for lending-related commitments by impairment methodology: | ||||||||||||||||||||
| Inherent | $ | 147 | $ | � | $ | � | $ | 2 | $ | 149 | ||||||||||
| Specific | � | � | � | � | � | |||||||||||||||
| Total allowance for lending-related commitments at December 31, 2014 | $ | 147 | $ | � | $ | � | $ | 2 | $ | 149 | ||||||||||
| Lending-related commitments evaluated by impairment methodology(2): | ||||||||||||||||||||
| Inherent | $ | 65,987 | $ | 3,484 | $ | 283 | $ | 367 | $ | 70,121 | ||||||||||
| Specific | 26 | � | � | � | 26 | |||||||||||||||
| Total lending-related commitments evaluated at December 31, 2014 | $ | 66,013 | $ | 3,484 | $ | 283 | $ | 367 | $ | 70,147 | ||||||||||
| (1) | The Company recorded a provision of $1 million for loan losses within Other revenues in 2014. |
| (2) | Balances are gross of the allowance for loan losses. |
| (3) | The Company recorded a provision of $22 million for lending-related commitments within Other non-interest expenses in 2014. |
| 227 | |
| Corporate | Consumer | Residential Real�Estate | Wholesale Real�Estate | Total | ||||||||||||||||
| (dollars in millions) | ||||||||||||||||||||
| Allowance for loan losses: | ||||||||||||||||||||
| Balance at December 31, 2012 | $ | 96 | $ | 3 | $ | 5 | $ | 2 | $ | 106 | ||||||||||
| Gross charge-offs | (13 | ) | � | (2 | ) | � | (15 | ) | ||||||||||||
| Gross recoveries | � | � | � | � | � | |||||||||||||||
| Net charge-offs | (13 | ) | � | (2 | ) | � | (15 | ) | ||||||||||||
| Provision (release) for loan losses(1) | 54 | (2 | ) | 1 | 12 | 65 | ||||||||||||||
| Balance at December 31, 2013 | $ | 137 | $ | 1 | $ | 4 | $ | 14 | $ | 156 | ||||||||||
| Allowance for loan losses by impairment methodology: | ||||||||||||||||||||
| Inherent | $ | 126 | $ | 1 | $ | 4 | $ | 10 | $ | 141 | ||||||||||
| Specific | 11 | � | � | 4 | 15 | |||||||||||||||
| Total allowance for loan losses at December 31, 2013 | $ | 137 | $ | 1 | $ | 4 | $ | 14 | $ | 156 | ||||||||||
| Loans evaluated by impairment methodology(2): | ||||||||||||||||||||
| Inherent | $ | 13,194 | $ | 11,577 | $ | 9,995 | $ | 1,845 | $ | 36,611 | ||||||||||
| Specific | 69 | � | 11 | 10 | 90 | |||||||||||||||
| Total loan evaluated at December 31, 2013 | $ | 13,263 | $ | 11,577 | $ | 10,006 | $ | 1,855 | $ | 36,701 | ||||||||||
| Allowance for lending-related commitments: | ||||||||||||||||||||
| Balance at December 31, 2012 | $ | 91 | $ | � | $ | � | $ | 1 | $ | 92 | ||||||||||
| Provision for lending-related commitments(3) | 44 | � | � | 1 | 45 | |||||||||||||||
| Other | (10 | ) | � | � | � | (10 | ) | |||||||||||||
| Balance at December 31, 2013 | $ | 125 | $ | � | $ | � | $ | 2 | $ | 127 | ||||||||||
| Allowance for lending-related commitments by impairment methodology: | ||||||||||||||||||||
| Inherent | $ | 125 | $ | � | $ | � | $ | 2 | $ | 127 | ||||||||||
| Specific | � | � | � | � | � | |||||||||||||||
| Total allowance for lending-related commitments at December 31, 2013 | $ | 125 | $ | � | $ | � | $ | 2 | $ | 127 | ||||||||||
| Lending-related commitments evaluated by impairment methodology(2): | ||||||||||||||||||||
| Inherent | $ | 63,427 | $ | 2,151 | $ | 1,423 | $ | 207 | $ | 67,208 | ||||||||||
| Specific | � | � | � | � | � | |||||||||||||||
| Total lending-related commitments evaluated at December 31, 2013 | $ | 63,427 | $ | 2,151 | $ | 1,423 | $ | 207 | $ | 67,208 | ||||||||||
| (1) | The Company recorded a provision of $65 million for loan losses within Other revenues in 2013. |
| (2) | Balances are gross of the allowance for loan losses. |
| (3) | The Company recorded a provision of $45 million for lending-related commitments within Other non-interest expenses in 2013. |
| | 228 |
| Institutional Securities | Wealth Management(1) | Investment Management(1) | Total | |||||||||||||
| (dollars in millions) | ||||||||||||||||
| Goodwill at December�31, 2012(2) | $ | 337 | $ | 5,544 | $ | 769 | $ | 6,650 | ||||||||
| Foreign currency translation adjustments and other | (27 | ) | � | � | (27 | ) | ||||||||||
| Goodwill disposed of during the period(3)(4) | (17 | ) | (11 | ) | � | (28 | ) | |||||||||
| Goodwill at December�31, 2013(2) | $ | 293 | $ | 5,533 | $ | 769 | $ | 6,595 | ||||||||
| Foreign currency translation adjustments and other | (14 | ) | � | � | (14 | ) | ||||||||||
| Goodwill acquired during the period(5) | 7 | � | � | 7 | ||||||||||||
| Goodwill at December�31, 2014(2) | $ | 286 | $ | 5,533 | $ | 769 | $ | 6,588 | ||||||||
| (1) | On October�1, 2014, the Managed Futures business was transferred from the Company�s Wealth Management business segment to the Company�s Investment Management business segment. All prior-period amounts have been recast to conform to the current year�s presentation. |
| (2) | The amount of the Company�s goodwill before accumulated impairments of $700 million, which included $673 million related to the Company�s Institutional Securities business segment and $27 million related to the Company�s Investment Management business segment, was $7,288 million and $7,295 million at December�31, 2014 and December�31, 2013, respectively. |
| (3) | In 2011, the Company announced that it had reached an agreement with the employees of its in-house quantitative proprietary trading unit, Process Driven Trading (�PDT�), within the Company�s Institutional Securities business segment, whereby PDT employees acquired certain assets from the Company and launched an independent advisory firm. This transaction closed on January�1, 2013. |
| 229 | |
| (4) | The Company�s Wealth Management business segment sold the U.K. operations of the Global Stock Plan Services business on May�31, 2013. |
| (5) | On October�1, 2014, the Company completed the acquisition of NaturEner USA, LLC (�NaturEner�), a developer and operator of wind power generation projects, in exchange for the forgiveness of a loan, which resulted in the recognition of goodwill of approximately $7 million. The Company is still finalizing the fair value of the intangible assets and goodwill. When finalized, the amount of intangible assets and acquisition-related goodwill could change. |
| Institutional Securities | Wealth Management(1) | Investment Management(1) | Total | |||||||||||||
| (dollars in millions) | ||||||||||||||||
| Amortizable net intangible assets at December�31, 2012 | $ | 175 | $ | 3,531 | $ | 70 | $ | 3,776 | ||||||||
| Mortgage servicing rights | � | 7 | � | 7 | ||||||||||||
| Net intangible assets at December�31, 2012 | $ | 175 | $ | 3,538 | $ | 70 | $ | 3,783 | ||||||||
| Amortizable net intangible assets at December�31, 2012 | $ | 175 | $ | 3,531 | $ | 70 | $ | 3,776 | ||||||||
| Foreign currency translation adjustments and other | � | (1 | ) | � | (1 | ) | ||||||||||
| Amortization expense(2) | (117 | ) | (322 | ) | (14 | ) | (453 | ) | ||||||||
| Impairment losses(3)(4) | (2 | ) | (26 | ) | (16 | ) | (44 | ) | ||||||||
| Amortizable net intangible assets at December�31, 2013 | 56 | 3,182 | 40 | 3,278 | ||||||||||||
| Mortgage servicing rights | � | 8 | � | 8 | ||||||||||||
| Net intangible assets at December�31, 2013 | $ | 56 | $ | 3,190 | $ | 40 | $ | 3,286 | ||||||||
| Amortizable net intangible assets at December�31, 2013 | $ | 56 | $ | 3,182 | $ | 40 | $ | 3,278 | ||||||||
| Disposal | (4 | ) | � | � | (4 | ) | ||||||||||
| Intangible assets acquired during the period(5) | 182 | � | � | 182 | ||||||||||||
| Amortization expense | (13 | ) | (274 | ) | (10 | ) | (297 | ) | ||||||||
| Impairment losses(3) | � | (3 | ) | (3 | ) | (6 | ) | |||||||||
| Amortizable net intangible assets at December�31, 2014 | 221 | 2,905 | 27 | 3,153 | ||||||||||||
| Mortgage servicing rights | � | 6 | � | 6 | ||||||||||||
| Net intangible assets at December�31, 2014 | $ | 221 | $ | 2,911 | $ | 27 | $ | 3,159 | ||||||||
| (1) | On October�1, 2014, the Managed Futures business was transferred from the Company�s Wealth Management business segment to the Company�s Investment Management business segment. All prior-period amounts have been recast to conform to the current year�s presentation. |
| (2) | The Company�s Institutional Securities business segment activity primarily represents accelerated recovery of related intangible costs. |
| (3) | Impairment losses are recorded within Other expenses in the Company�s consolidated statements of income. |
| (4) | The Company�s Wealth Management business segment activity primarily represents an impairment charge related to management contracts associated with alternative investment funds. |
| (5) | On October 1, 2014, the Company completed the acquisition of NaturEner in exchange for the forgiveness of a loan, which resulted in the recognition of intangible assets of approximately $182 million. The Company is still finalizing the fair value of the intangible assets and goodwill. When finalized, the amount of intangible assets and acquisition-related goodwill could change. |
| | 230 |
| At December�31, 2014 | At December�31, 2013 | |||||||||||||||
| Gross Carrying Amount | Accumulated Amortization | Gross Carrying Amount | Accumulated Amortization | |||||||||||||
| (dollars in millions) | ||||||||||||||||
| Amortizable intangible assets: | ||||||||||||||||
| Trademarks | $ | 7 | $ | 6 | $ | 7 | $ | 3 | ||||||||
| Tradename | 280 | 21 | 280 | 12 | ||||||||||||
| Customer relationships | 4,048 | 1,430 | 4,058 | 1,177 | ||||||||||||
| Management contracts | 268 | 170 | 268 | 146 | ||||||||||||
| Other(1) | 374 | 197 | 192 | 189 | ||||||||||||
| Total amortizable intangible assets | $ | 4,977 | $ | 1,824 | $ | 4,805 | $ | 1,527 | ||||||||
| (1) | Amounts include intangible assets related to the acquisition of NaturEner on October�1, 2014. |
| At December� 31, 2014(1) | At December� 31, 2013(1) | |||||||
| (dollars in millions) | ||||||||
| Savings and demand deposits(2) | $ | 132,159 | $ | 109,908 | ||||
| Time deposits(3)(4) | 1,385 | 2,471 | ||||||
| Total | $ | 133,544 | $ | 112,379 | ||||
| (1) | Total deposits subject to the Federal Deposit Insurance Corporation (the �FDIC�) insurance at December�31, 2014 and December�31, 2013 were $99 billion and $84 billion, respectively. |
| (2) | There were no non-interest bearing deposits at December�31, 2014 and December�31, 2013. |
| (3) | Certain time deposit accounts are carried at fair value under the fair value option (see Note 4). |
| (4) | The amount of U.S. time deposits that met or exceeded the FDIC insurance limit was not significant at December�31, 2014 and December�31, 2013. |
| 231 | |
| At December� 31, 2014 | At December� 31, 2013 | |||||||
| (dollars in millions) | ||||||||
| Commercial paper(1) | $ | � | $ | 8 | ||||
| Other short-term borrowings(2)(3)(4) | 2,261 | 2,134 | ||||||
| Total | $ | 2,261 | $ | 2,142 | ||||
| (1) | Average weekly balance for Commercial paper was $1 million and $155 million at December�31, 2014 and December�31, 2013, respectively. |
| (2) | Average weekly balance for Other short-term borrowings was $1,923 million and $1,872 million at December�31, 2014 and December�31, 2013, respectively. |
| (3) | These borrowings included bank loans, bank notes and structured notes with original maturities of 12 months or less. |
| (4) | Certain structured short-term borrowings are carried at fair value under the fair value option (see Note 4). |
| Parent Company | Subsidiaries | At December� 31, 2014(3)(4) | At December� 31, 2013 | |||||||||||||||||||||
| Fixed Rate | Variable Rate(1)(2) | Fixed Rate | Variable Rate(1)(2) | |||||||||||||||||||||
| Due in 2014 | $ | � | $ | � | $ | � | $ | � | $ | � | $ | 24,193 | ||||||||||||
| Due in 2015 | 12,331 | 5,450 | 16 | 2,943 | 20,740 | 21,090 | ||||||||||||||||||
| Due in 2016 | 10,648 | 8,315 | 35 | 1,645 | 20,643 | 23,144 | ||||||||||||||||||
| Due in 2017 | 15,348 | 7,295 | 16 | 1,341 | 24,000 | 26,295 | ||||||||||||||||||
| Due in 2018 | 12,998 | 3,730 | 16 | 935 | 17,679 | 15,308 | ||||||||||||||||||
| Due in 2019 | 11,350 | 5,310 | 17 | 894 | 17,571 | 8,744 | ||||||||||||||||||
| Thereafter | 43,765 | 6,527 | 385 | 1,462 | 52,139 | 34,801 | ||||||||||||||||||
| Total | $ | 106,440 | $ | 36,627 | $ | 485 | $ | 9,220 | $ | 152,772 | $ | 153,575 | ||||||||||||
| Weighted average coupon at period-end(5) | 4.7 | % | 1.0 | % | 6.5 | % | 0.7 | % | 4.2 | % | 4.4 | % | ||||||||||||
| (1) | Variable rate borrowings bear interest based on a variety of money market indices, including LIBOR and Federal Funds rates. |
| (2) | Amounts include borrowings that are equity-linked, credit-linked, commodity-linked or linked to some other index. |
| (3) | Amounts include an increase of approximately $3.3 billion at December�31, 2014 to the carrying amount of certain of the Company�s long-term borrowings associated with fair value hedges. The increase to the carrying value associated with fair value hedges by year due was approximately $0.1 billion due in 2015, $0.3 billion due in 2016, $0.7 billion due in 2017, $0.4 billion due in 2018, $0.5 billion due in 2019 and $1.3 billion due thereafter. |
| (4) | Amounts include an increase of approximately $0.7 billion at December�31, 2014 to the carrying amounts of certain of the Company�s long-term borrowings for which the fair value option was elected (see Note 4). |
| (5) | Weighted average coupon was calculated utilizing U.S. and non-U.S. dollar interest rates and excludes financial instruments for which the fair value option was elected. |
| | 232 |
| At�December�31, 2014 | At�December�31, 2013 | |||||||
| (dollars in millions) | ||||||||
| Senior debt | $ | 139,565 | $ | 139,451 | ||||
| Subordinated debt | 8,339 | 9,275 | ||||||
| Junior subordinated debentures | 4,868 | 4,849 | ||||||
| Total | $ | 152,772 | $ | 153,575 | ||||
| 233 | |
| 2014 | 2013 | 2012 | ||||||||||
| Weighted average coupon of long-term borrowings at period-end(1) | 4.2 | % | 4.4 | % | 4.4 | % | ||||||
| Effective average borrowing rate for long-term borrowings after swaps at period-end(1) | 2.3 | % | 2.2 | % | 2.3 | % | ||||||
| (1) | Included in the weighted average and effective average calculations are U.S. and non-U.S. dollar interest rates. |
| At December� 31, 2014 | At December� 31, 2013 | |||||||
| (dollars in millions) | ||||||||
| Secured financings with original maturities greater than one year | $ | 10,346 | $ | 9,750 | ||||
| Secured financings with original maturities one year or less(1) | 1,395 | 4,233 | ||||||
| Failed sales(2) | 344 | 232 | ||||||
| Total(3) | $ | 12,085 | $ | 14,215 | ||||
| (1) | Amounts include approximately $1,299 million of variable rate financings and approximately $96 million in fixed rate financings at December�31, 2014 and approximately $3,899 million of variable rate financings and approximately $334 million in fixed rate financings at December�31, 2013. |
| (2) | For more information on failed sales, see Note 7. |
| (3) | Amounts include $4,504 million and $5,206 million at fair value at December�31, 2014 and December�31, 2013, respectively. |
| | 234 |
| Fixed Rate | Variable Rate(1)(2) | At December�31, 2014 | At December�31, 2013 | |||||||||||||
| (dollars in millions) | ||||||||||||||||
| Due in 2014 | $ | � | $ | � | $ | � | $ | 3,500 | ||||||||
| Due in 2015 | 27 | 3,314 | 3,341 | 1,906 | ||||||||||||
| Due in 2016 | � | 4,705 | 4,705 | 2,942 | ||||||||||||
| Due in 2017 | 263 | 618 | 881 | 160 | ||||||||||||
| Due in 2018 | � | 786 | 786 | 675 | ||||||||||||
| Due in 2019 | 118 | 76 | 194 | � | ||||||||||||
| Thereafter | 123 | 316 | 439 | 567 | ||||||||||||
| Total | $ | 531 | $ | 9,815 | $ | 10,346 | $ | 9,750 | ||||||||
| Weighted average coupon rate at period-end(3) | 3.4 | % | 0.6 | % | 0.8 | % | 1.4 | % | ||||||||
| (1) | Variable rate borrowings bear interest based on a variety of indices, including LIBOR. |
| (2) | Amounts include borrowings that are equity-linked, credit-linked, commodity-linked or linked to some other index. |
| (3) | Weighted average coupon was calculated utilizing U.S. and non-U.S. dollar interest rates and excludes secured financings that are linked to non-interest indices. |
| At December�31, 2014 | At December�31, 2013 | |||||||
| (dollars in millions) | ||||||||
| Due in 2014 | $ | � | $ | 100 | ||||
| Due in 2015 | 32 | 57 | ||||||
| Due in 2016 | 90 | 36 | ||||||
| Due in 2017 | 148 | 24 | ||||||
| Due in 2018 | 14 | � | ||||||
| Due in 2019 | 10 | 3 | ||||||
| Thereafter | 50 | 12 | ||||||
| Total | $ | 344 | $ | 232 | ||||
| 235 | |
| At December�31, 2014 | ||||||||||||||||||||||||
| Gross�Amounts(1) | Amounts�Offset in the Consolidated Statements�of Financial Condition(2) | Net�Amounts Presented�in�the Consolidated Statements� of Financial Condition | Amounts�Not�Offset�in�the Consolidated�Statements�of� Financial Condition(3) | Net�Exposure | ||||||||||||||||||||
| Financial Instruments Collateral | Other Cash Collateral | |||||||||||||||||||||||
| (dollars in millions) | ||||||||||||||||||||||||
| Derivative assets | ||||||||||||||||||||||||
| Bilateral OTC | $ | 427,079 | $ | (396,582 | ) | $ | 30,497 | $ | (9,844 | ) | $ | (19 | ) | $ | 20,634 | |||||||||
| Cleared OTC(4) | 217,169 | (215,576 | ) | 1,593 | � | � | 1,593 | |||||||||||||||||
| Exchange traded | 32,123 | (27,819 | ) | 4,304 | � | � | 4,304 | |||||||||||||||||
| Total derivative assets | $ | 676,371 | $ | (639,977 | ) | $ | 36,394 | $ | (9,844 | ) | $ | (19 | ) | $ | 26,531 | |||||||||
| Derivative liabilities | ||||||||||||||||||||||||
| Bilateral OTC | $ | 410,003 | $ | (375,095 | ) | $ | 34,908 | $ | (11,192 | ) | $ | (179 | ) | $ | 23,537 | |||||||||
| Cleared OTC(4) | 211,695 | (211,180 | ) | 515 | � | (6 | ) | 509 | ||||||||||||||||
| Exchange traded | 32,608 | (27,819 | ) | 4,789 | (726 | ) | � | 4,063 | ||||||||||||||||
| Total derivative liabilities | $ | 654,306 | $ | (614,094 | ) | $ | 40,212 | $ | (11,918 | ) | $ | (185 | ) | $ | 28,109 | |||||||||
| (1) | Amounts include $6.5 billion of derivative assets and $6.9 billion of derivative liabilities, which are either not subject to master netting agreements or collateral agreements or are subject to such agreements but the Company has not determined the agreements to be legally enforceable. See also �Fair Value and Notional of Derivative Instruments� for additional disclosure about gross fair values and notionals for derivative instruments by risk type. |
| (2) | Amounts relate to master netting agreements and collateral agreements, which have been determined by the Company to be legally enforceable in the event of default and where certain other criteria are met in accordance with applicable offsetting accounting guidance. |
| (3) | Amounts relate to master netting agreements and collateral agreements, which have been determined by the Company to be legally enforceable in the event of default but where certain other criteria are not met in accordance with applicable offsetting accounting guidance. |
| (4) | Amounts include OTC derivatives that are centrally cleared in accordance with certain regulatory requirements. |
| | 236 |
| At December�31, 2013 | ||||||||||||||||||||||||
| Gross�Amounts(1) | Amounts�Offset in the Consolidated Statements�of Financial Condition(2) | Net�Amounts Presented�in�the Consolidated Statements� of Financial Condition | Amounts�Not�Offset�in�the Consolidated�Statements�of Financial� Condition(3) | Net Exposure | ||||||||||||||||||||
| Financial Instruments Collateral | Other�Cash Collateral | |||||||||||||||||||||||
| (dollars in millions) | ||||||||||||||||||||||||
| Derivative assets | ||||||||||||||||||||||||
| Bilateral OTC | $ | 404,352 | $ | (378,459 | ) | $ | 25,893 | $ | (8,785 | ) | $ | (132 | ) | $ | 16,976 | |||||||||
| Cleared OTC(4) | 267,057 | (266,419 | ) | 638 | � | � | 638 | |||||||||||||||||
| Exchange traded | 31,609 | (25,673 | ) | 5,936 | � | � | 5,936 | |||||||||||||||||
| Total derivative assets | $ | 703,018 | $ | (670,551 | ) | $ | 32,467 | $ | (8,785 | ) | $ | (132 | ) | $ | 23,550 | |||||||||
| Derivative liabilities | ||||||||||||||||||||||||
| Bilateral OTC | $ | 386,199 | $ | (361,059 | ) | $ | 25,140 | $ | (5,365 | ) | $ | (136 | ) | $ | 19,639 | |||||||||
| Cleared OTC(4) | 266,559 | (265,378 | ) | 1,181 | � | (372 | ) | 809 | ||||||||||||||||
| Exchange traded | 33,113 | (25,673 | ) | 7,440 | (651 | ) | � | 6,789 | ||||||||||||||||
| Total derivative liabilities | $ | 685,871 | $ | (652,110 | ) | $ | 33,761 | $ | (6,016 | ) | $ | (508 | ) | $ | 27,237 | |||||||||
| (1) | Amounts include $8.7 billion of derivative assets and $7.3 billion of derivative liabilities, which are either not subject to master netting agreements or collateral agreements or are subject to such agreements but the Company has not determined the agreements to be legally enforceable. See also �Fair Value and Notional of Derivative Instruments� for additional disclosure about gross fair values and notionals for derivative instruments by risk type. |
| (2) | Amounts relate to master netting agreements and collateral agreements, which have been determined by the Company to be legally enforceable in the event of default and where certain other criteria are met in accordance with applicable offsetting accounting guidance. |
| (3) | Amounts relate to master netting agreements and collateral agreements, which have been determined by the Company to be legally enforceable in the event of default but where certain other criteria are not met in accordance with applicable offsetting accounting guidance. |
| (4) | Amounts include OTC derivatives that are centrally cleared in accordance with certain regulatory requirements. |
| 237 | |
| Years to Maturity | Cross- Maturity�and Cash�Collateral Netting(3) | Net�
Exposure Post-cash Collateral | Net�
Exposure Post- collateral | |||||||||||||||||||||||||
| Credit Rating(2) | Less�than�1 | 1-3 | 3-5 | Over 5 | ||||||||||||||||||||||||
| (dollars in millions) | ||||||||||||||||||||||||||||
| AAA | $ | 499 | $ | 246 | $ | 1,313 | $ | 4,281 | $ | (5,009 | ) | $ | 1,330 | $ | 1,035 | |||||||||||||
| AA | 2,679 | 2,811 | 2,704 | 14,137 | (15,415 | ) | 6,916 | 4,719 | ||||||||||||||||||||
| A | 11,733 | 10,833 | 7,585 | 23,968 | (43,644 | ) | 10,475 | 6,520 | ||||||||||||||||||||
| BBB | 5,119 | 3,753 | 2,592 | 13,132 | (15,844 | ) | 8,752 | 6,035 | ||||||||||||||||||||
| Non-investment grade | 3,196 | 3,089 | 1,541 | 2,499 | (5,727 | ) | 4,598 | 3,918 | ||||||||||||||||||||
| Total | $ | 23,226 | $ | 20,732 | $ | 15,735 | $ | 58,017 | $ | (85,639 | ) | $ | 32,071 | $ | 22,227 | |||||||||||||
| (1) | Fair values shown represent the Company�s net exposure to counterparties related to the Company�s OTC derivative products. Amounts include centrally cleared OTC derivatives. The table does not include exchange-traded derivatives and the effect of any related hedges utilized by the Company. |
| (2) | Obligor credit ratings are determined by the Company�s Credit Risk Management Department. |
| (3) | Amounts represent the netting of receivable balances with payable balances for the same counterparty across maturity categories. Receivable and payable balances with the same counterparty in the same maturity category are netted within such maturity category, where appropriate. Cash collateral received is netted on a counterparty basis, provided legal right of offset exists. |
| Years to Maturity | Cross- Maturity and Cash Collateral Netting(3) | Net�Exposure Post-cash Collateral | Net�Exposure Post-collateral | |||||||||||||||||||||||||
| Credit Rating(2) | Less�than�1 | 1-3 | 3-5 | Over 5 | ||||||||||||||||||||||||
| (dollars in millions) | ||||||||||||||||||||||||||||
| AAA | $ | 300 | $ | 752 | $ | 1,073 | $ | 3,664 | $ | (3,721 | ) | $ | 2,068 | $ | 1,673 | |||||||||||||
| AA | 2,687 | 3,145 | 3,377 | 9,791 | (13,515 | ) | 5,485 | 3,927 | ||||||||||||||||||||
| A | 7,382 | 8,428 | 9,643 | 17,184 | (35,644 | ) | 6,993 | 4,970 | ||||||||||||||||||||
| BBB | 2,617 | 3,916 | 3,228 | 13,693 | (16,191 | ) | 7,263 | 4,870 | ||||||||||||||||||||
| Non-investment grade | 2,053 | 2,980 | 1,372 | 2,922 | (4,737 | ) | 4,590 | 2,174 | ||||||||||||||||||||
| Total | $ | 15,039 | $ | 19,221 | $ | 18,693 | $ | 47,254 | $ | (73,808 | ) | $ | 26,399 | $ | 17,614 | |||||||||||||
| (1) | Fair values shown represent the Company�s net exposure to counterparties related to the Company�s OTC derivative products. Amounts include centrally cleared OTC derivatives. The table does not include exchange-traded derivatives and the effect of any related hedges utilized by the Company. |
| (2) | Obligor credit ratings are determined by the Company�s Credit Risk Management Department. |
| (3) | Amounts represent the netting of receivable balances with payable balances for the same counterparty across maturity categories. Receivable and payable balances with the same counterparty in the same maturity category are netted within such maturity category, where appropriate. Cash collateral received is netted on a counterparty basis, provided legal right of offset exists. |
| | 238 |
| 239 | |
| Derivative Assets at December�31, 2014 | ||||||||||||||||||||||||||||||||
| Fair Value | Notional | |||||||||||||||||||||||||||||||
| Bilateral OTC | Cleared OTC(1) | Exchange Traded | Total | Bilateral�OTC | Cleared OTC(1) | Exchange Traded | Total | |||||||||||||||||||||||||
| (dollars in millions) | ||||||||||||||||||||||||||||||||
| Derivatives designated as accounting hedges: | ||||||||||||||||||||||||||||||||
| Interest rate contracts | $ | 3,947 | $ | 1,053 | $ | � | $ | 5,000 | $ | 44,324 | $ | 27,692 | $ | � | $ | 72,016 | ||||||||||||||||
| Foreign exchange contracts | 498 | 6 | � | 504 | 9,362 | 261 | � | 9,623 | ||||||||||||||||||||||||
| Total derivatives designated as accounting hedges | 4,445 | 1,059 | � | 5,504 | 53,686 | 27,953 | � | 81,639 | ||||||||||||||||||||||||
| Derivatives not designated as accounting hedges(2): | ||||||||||||||||||||||||||||||||
| Interest rate contracts | 281,214 | 211,552 | 407 | 493,173 | 4,854,953 | 9,187,454 | 1,467,056 | 15,509,463 | ||||||||||||||||||||||||
| Credit contracts | 27,776 | 4,406 | � | 32,182 | 806,441 | 167,390 | � | 973,831 | ||||||||||||||||||||||||
| Foreign exchange contracts | 72,362 | 152 | 83 | 72,597 | 1,955,343 | 11,538 | 9,663 | 1,976,544 | ||||||||||||||||||||||||
| Equity contracts | 23,208 | � | 24,916 | 48,124 | 299,363 | � | 271,164 | 570,527 | ||||||||||||||||||||||||
| Commodity contracts | 17,698 | � | 6,717 | 24,415 | 115,792 | � | 156,440 | 272,232 | ||||||||||||||||||||||||
| Other | 376 | � | � | 376 | 5,179 | � | � | 5,179 | ||||||||||||||||||||||||
| Total derivatives not designated as accounting hedges | 422,634 | 216,110 | 32,123 | 670,867 | 8,037,071 | 9,366,382 | 1,904,323 | 19,307,776 | ||||||||||||||||||||||||
| Total derivatives | $ | 427,079 | $ | 217,169 | $ | 32,123 | $ | 676,371 | $ | 8,090,757 | $ | 9,394,335 | $ | 1,904,323 | $ | 19,389,415 | ||||||||||||||||
| Cash collateral netting | (58,541 | ) | (4,654 | ) | � | (63,195 | ) | � | � | � | � | |||||||||||||||||||||
| Counterparty netting | (338,041 | ) | (210,922 | ) | (27,819 | ) | (576,782 | ) | � | � | � | � | ||||||||||||||||||||
| Total derivative assets | $ | 30,497 | $ | 1,593 | $ | 4,304 | $ | 36,394 | $ | 8,090,757 | $ | 9,394,335 | $ | 1,904,323 | $ | 19,389,415 | ||||||||||||||||
| | 240 |
| Derivative Liabilities
at December�31, 2014 | ||||||||||||||||||||||||||||||||
| Fair Value | Notional | |||||||||||||||||||||||||||||||
| Bilateral OTC | Cleared OTC(1) | Exchange Traded | Total | Bilateral OTC | Cleared OTC(1) | Exchange Traded | Total | |||||||||||||||||||||||||
| (dollars in millions) | ||||||||||||||||||||||||||||||||
| Derivatives designated as accounting hedges: | ||||||||||||||||||||||||||||||||
| Interest rate contracts | $ | 125 | $ | 99 | $ | � | $ | 224 | $ | 2,024 | $ | 7,588 | $ | � | $ | 9,612 | ||||||||||||||||
| Foreign exchange contracts | 5 | 1 | � | 6 | 1,491 | 121 | � | 1,612 | ||||||||||||||||||||||||
| Total derivatives designated as accounting hedges | 130 | 100 | � | 230 | 3,515 | 7,709 | � | 11,224 | ||||||||||||||||||||||||
| Derivatives not designated as accounting hedges(2): | ||||||||||||||||||||||||||||||||
| Interest rate contracts | 264,579 | 207,482 | 293 | 472,354 | 4,615,886 | 9,138,417 | 1,714,021 | 15,468,324 | ||||||||||||||||||||||||
| Credit contracts | 28,165 | 3,944 | � | 32,109 | 714,181 | 154,054 | � | 868,235 | ||||||||||||||||||||||||
| Foreign exchange contracts | 72,156 | 169 | 21 | 72,346 | 1,947,178 | 11,477 | 1,761 | 1,960,416 | ||||||||||||||||||||||||
| Equity contracts | 30,061 | � | 25,511 | 55,572 | 339,884 | � | 302,205 | 642,089 | ||||||||||||||||||||||||
| Commodity contracts | 14,740 | � | 6,783 | 21,523 | 93,019 | � | 132,136 | 225,155 | ||||||||||||||||||||||||
| Other | 172 | � | � | 172 | 5,478 | � | � | 5,478 | ||||||||||||||||||||||||
| Total derivatives not designated as accounting hedges | 409,873 | 211,595 | 32,608 | 654,076 | 7,715,626 | 9,303,948 | 2,150,123 | 19,169,697 | ||||||||||||||||||||||||
| Total derivatives | $ | 410,003 | $ | 211,695 | $ | 32,608 | $ | 654,306 | $ | 7,719,141 | $ | 9,311,657 | $ | 2,150,123 | $ | 19,180,921 | ||||||||||||||||
| Cash collateral netting | (37,054 | ) | (258 | ) | � | (37,312 | ) | � | � | � | � | |||||||||||||||||||||
| Counterparty netting | (338,041 | ) | (210,922 | ) | (27,819 | ) | (576,782 | ) | � | � | � | � | ||||||||||||||||||||
| Total derivative liabilities | $ | 34,908 | $ | 515 | $ | 4,789 | $ | 40,212 | $ | 7,719,141 | $ | 9,311,657 | $ | 2,150,123 | $ | 19,180,921 | ||||||||||||||||
| (1) | Amounts include OTC derivatives that are centrally cleared in accordance with certain regulatory requirements. |
| (2) | Notional amounts include gross notionals related to open long and short futures contracts of $685 billion and $1,122 billion, respectively. The unsettled fair value on these futures contracts (excluded from the table above) of $472 million and $21 million is included in Customer and other receivables and Customer and other payables, respectively, in the Company�s consolidated statements of financial condition. |
| 241 | |
| Derivative Assets at December�31, 2013 | ||||||||||||||||||||||||||||||||
| Fair Value | Notional | |||||||||||||||||||||||||||||||
| Bilateral OTC | Cleared OTC(1) | Exchange Traded | Total | Bilateral OTC | Cleared OTC(1) | Exchange Traded | Total | |||||||||||||||||||||||||
| (dollars in millions) | ||||||||||||||||||||||||||||||||
| Derivatives designated as accounting hedges: | ||||||||||||||||||||||||||||||||
| Interest rate contracts | $ | 4,729 | $ | 287 | $ | � | $ | 5,016 | $ | 54,696 | $ | 14,685 | $ | � | $ | 69,381 | ||||||||||||||||
| Foreign exchange contracts | 236 | � | � | 236 | 6,694 | � | � | 6,694 | ||||||||||||||||||||||||
| Total derivatives designated as accounting hedges | 4,965 | 287 | � | 5,252 | 61,390 | 14,685 | � | 76,075 | ||||||||||||||||||||||||
| Derivatives not designated as accounting hedges(2): | ||||||||||||||||||||||||||||||||
| Interest rate contracts | 262,697 | 261,348 | 291 | 524,336 | 6,206,450 | 11,854,610 | 856,137 | 18,917,197 | ||||||||||||||||||||||||
| Credit contracts | 39,054 | 5,292 | � | 44,346 | 1,244,004 | 240,781 | � | 1,484,785 | ||||||||||||||||||||||||
| Foreign exchange contracts | 61,383 | 130 | 52 | 61,565 | 1,818,429 | 9,634 | 9,783 | 1,837,846 | ||||||||||||||||||||||||
| Equity contracts | 26,104 | � | 28,001 | 54,105 | 294,524 | � | 437,842 | 732,366 | ||||||||||||||||||||||||
| Commodity contracts | 10,106 | � | 3,265 | 13,371 | 144,981 | � | 139,433 | 284,414 | ||||||||||||||||||||||||
| Other | 43 | � | � | 43 | 3,198 | � | � | 3,198 | ||||||||||||||||||||||||
| Total derivatives not designated as accounting hedges | 399,387 | 266,770 | 31,609 | 697,766 | 9,711,586 | 12,105,025 | 1,443,195 | 23,259,806 | ||||||||||||||||||||||||
| Total derivatives | $ | 404,352 | $ | 267,057 | $ | 31,609 | $ | 703,018 | $ | 9,772,976 | $ | 12,119,710 | $ | 1,443,195 | $ | 23,335,881 | ||||||||||||||||
| Cash collateral netting | (48,540 | ) | (3,462 | ) | � | (52,002 | ) | � | � | � | � | |||||||||||||||||||||
| Counterparty netting | (329,919 | ) | (262,957 | ) | (25,673 | ) | (618,549 | ) | � | � | � | � | ||||||||||||||||||||
| Total derivative assets | $ | 25,893 | $ | 638 | $ | 5,936 | $ | 32,467 | $ | 9,772,976 | $ | 12,119,710 | $ | 1,443,195 | $ | 23,335,881 | ||||||||||||||||
| Derivative Liabilities
at December�31, 2013 | ||||||||||||||||||||||||||||||||
| Fair Value | Notional | |||||||||||||||||||||||||||||||
| Bilateral OTC | Cleared OTC(1) | Exchange Traded | Total | Bilateral OTC | Cleared OTC(1) | Exchange Traded | Total | |||||||||||||||||||||||||
| (dollars in millions) | ||||||||||||||||||||||||||||||||
| Derivatives designated as accounting hedges: | ||||||||||||||||||||||||||||||||
| Interest rate contracts | $ | 570 | $ | 614 | $ | � | $ | 1,184 | $ | 2,642 | $ | 12,667 | $ | � | $ | 15,309 | ||||||||||||||||
| Foreign exchange contracts | 258 | 5 | � | 263 | 5,970 | 503 | � | 6,473 | ||||||||||||||||||||||||
| Total derivatives designated as accounting hedges | 828 | 619 | � | 1,447 | 8,612 | 13,170 | � | 21,782 | ||||||||||||||||||||||||
| Derivatives not designated as accounting hedges(2): | ||||||||||||||||||||||||||||||||
| Interest rate contracts | 244,906 | 261,011 | 228 | 506,145 | 6,035,757 | 11,954,325 | 1,067,894 | 19,057,976 | ||||||||||||||||||||||||
| Credit contracts | 37,835 | 4,791 | � | 42,626 | 1,099,483 | 213,900 | � | 1,313,383 | ||||||||||||||||||||||||
| Foreign exchange contracts | 61,635 | 138 | 23 | 61,796 | 1,897,400 | 10,505 | 3,106 | 1,911,011 | ||||||||||||||||||||||||
| Equity contracts | 31,483 | � | 29,412 | 60,895 | 341,232 | � | 464,622 | 805,854 | ||||||||||||||||||||||||
| Commodity contracts | 9,436 | � | 3,450 | 12,886 | 138,784 | � | 120,556 | 259,340 | ||||||||||||||||||||||||
| Other | 76 | � | � | 76 | 4,659 | � | � | 4,659 | ||||||||||||||||||||||||
| Total derivatives not designated as accounting hedges | 385,371 | 265,940 | 33,113 | 684,424 | 9,517,315 | 12,178,730 | 1,656,178 | 23,352,223 | ||||||||||||||||||||||||
| Total derivatives | $ | 386,199 | $ | 266,559 | $ | 33,113 | $ | 685,871 | $ | 9,525,927 | $ | 12,191,900 | $ | 1,656,178 | $ | 23,374,005 | ||||||||||||||||
| Cash collateral netting | (31,139 | ) | (2,422 | ) | � | (33,561 | ) | � | � | � | � | |||||||||||||||||||||
| Counterparty netting | (329,920 | ) | (262,956 | ) | (25,673 | ) | (618,549 | ) | � | � | � | � | ||||||||||||||||||||
| Total derivative liabilities | $ | 25,140 | $ | 1,181 | $ | 7,440 | $ | 33,761 | $ | 9,525,927 | $ | 12,191,900 | $ | 1,656,178 | $ | 23,374,005 | ||||||||||||||||
| | 242 |
| (1) | Amounts include OTC derivatives that are centrally cleared in accordance with certain regulatory requirements. |
| (2) | Notional amounts include gross notionals related to open long and short futures contracts of $426 billion and $729 billion, respectively. The unsettled fair value on these futures contracts (excluded from the table above) of $879 million and $27 million is included in Customer and other receivables and Customer and other payables, respectively, in the Company�s consolidated statements of financial condition. |
| Gains (Losses) Recognized | ||||||||||||
| Product Type | 2014 | 2013 | 2012 | |||||||||
| (dollars in millions) | ||||||||||||
| Derivatives | $ | 1,462 | $ | (4,332 | ) | $ | 29 | |||||
| Borrowings | (173 | ) | 5,604 | 703 | ||||||||
| Total | $ | 1,289 | $ | 1,272 | $ | 732 | ||||||
| Gains�(Losses) Recognized in OCI�(effective�portion) | ||||||||||||
| Product Type | 2014 | 2013 | 2012(1) | |||||||||
| (dollars in millions) | ||||||||||||
| Foreign exchange contracts(2) | $ | 606 | $ | 448 | $ | 102 | ||||||
| Total | $ | 606 | $ | 448 | $ | 102 | ||||||
| (1) | A gain of $77 million, net of tax, related to net investment hedges was reclassified from other comprehensive income (�OCI�) into income during 2012. The amount primarily related to the reversal of amounts recorded in cumulative other comprehensive income due to the incorrect application of hedge accounting on certain derivative contracts (see above for further information). |
| (2) | Losses of $186 million, $154 million and $235 million related to the forward points on the hedging instruments were excluded from hedge effectiveness testing and recognized in interest income during 2014, 2013 and 2012, respectively. |
Table of Contents MORGAN STANLEY NOTES TO CONSOLIDATED FINANCIAL STATEMENTS�(Continued) The table below summarizes gains (losses) on derivative instruments not designated as accounting hedges
for 2014, 2013 and 2012: | Gains�(Losses) Recognized�in�Income(1)(2) | ||||||||||||
| Product Type | 2014 | 2013 | 2012 | |||||||||
| (dollars in millions) | ||||||||||||
| Interest rate contracts | $ | (1,549 | ) | $ | (608 | ) | $ | 2,930 | ||||
| Credit contracts | (142 | ) | 74 | (722 | ) | |||||||
| Foreign exchange contracts | 1,597 | 4,546 | (340 | ) | ||||||||
| Equity contracts | (3,027 | ) | (9,193 | ) | (1,794 | ) | ||||||
| Commodity contracts | 1,816 | 772 | 387 | |||||||||
| Other contracts | 123 | (90 | ) | 1 | ||||||||
| Total derivative instruments | $ | (1,182 | ) | $ | (4,499 | ) | $ | 462 | ||||
| (1) | Gains (losses) on derivative contracts not designated as hedges are primarily included in Trading revenues in the Company�s consolidated statements of income. |
| (2) | Gains (losses) associated with certain derivative contracts that have physically settled are excluded from the table above. Gains (losses) on these contracts are reflected with the associated cash instruments, which are also included in Trading revenues in the Company�s consolidated statements of income. |
| | 244 |
| At December�31, 2014 | ||||||||||||||||
| Maximum Potential Payout/Notional | ||||||||||||||||
| Protection Sold | Protection Purchased | |||||||||||||||
| Notional | Fair�Value (Asset)/Liability | Notional | Fair�Value (Asset)/Liability | |||||||||||||
| (dollars in millions) | ||||||||||||||||
| Single name credit default swaps | $ | 535,415 | $ | (2,479 | ) | $ | 509,872 | $ | 1,641 | |||||||
| Index and basket credit default swaps | 276,465 | (1,777 | ) | 229,789 | 1,563 | |||||||||||
| Tranched index and basket credit default swaps | 96,182 | (2,355 | ) | 194,343 | 3,334 | |||||||||||
| Total | $ | 908,062 | $ | (6,611 | ) | $ | 934,004 | $ | 6,538 | |||||||
| At December�31, 2013 | ||||||||||||||||
| Maximum Potential Payout/Notional | ||||||||||||||||
| Protection Sold | Protection Purchased | |||||||||||||||
| Notional | Fair�Value (Asset)/Liability | Notional | Fair�Value (Asset)/Liability | |||||||||||||
| (dollars in millions) | ||||||||||||||||
| Single name credit default swaps | $ | 799,838 | $ | (9,349 | ) | $ | 758,536 | $ | 8,564 | |||||||
| Index and basket credit default swaps | 454,355 | (3,756 | ) | 361,961 | 2,827 | |||||||||||
| Tranched index and basket credit default swaps | 146,597 | (3,889 | ) | 276,881 | 3,883 | |||||||||||
| Total | $ | 1,400,790 | $ | (16,994 | ) | $ | 1,397,378 | $ | 15,274 | |||||||
| 245 | |
| At December�31, 2014 | ||||||||||||||||||||||||
| Maximum Potential Payout/Notional | Fair
Value (Asset)/ Liability(1)(2) | |||||||||||||||||||||||
| Years to Maturity | ||||||||||||||||||||||||
| Credit Ratings of the Reference Obligation | Less�than�1 | 1-3 | 3-5 | Over 5 | Total | |||||||||||||||||||
| (dollars in millions) | ||||||||||||||||||||||||
| Single name credit default swaps: | ||||||||||||||||||||||||
| AAA | $ | 2,385 | $ | 9,400 | $ | 6,147 | $ | 692 | $ | 18,624 | $ | (113 | ) | |||||||||||
| AA | 9,080 | 23,701 | 14,769 | 3,318 | 50,868 | (688 | ) | |||||||||||||||||
| A | 22,861 | 52,291 | 22,083 | 2,944 | 100,179 | (1,962 | ) | |||||||||||||||||
| BBB | 48,547 | 114,384 | 60,629 | 13,536 | 237,096 | (1,489 | ) | |||||||||||||||||
| Non-investment grade | 29,857 | 66,066 | 29,011 | 3,714 | 128,648 | 1,773 | ||||||||||||||||||
| Total | 112,730 | 265,842 | 132,639 | 24,204 | 535,415 | (2,479 | ) | |||||||||||||||||
| Index and basket credit default swaps(3): | ||||||||||||||||||||||||
| AAA | 17,625 | 31,124 | 7,265 | 1,883 | 57,897 | (985 | ) | |||||||||||||||||
| AA | 704 | 6,512 | 716 | 2,864 | 10,796 | (270 | ) | |||||||||||||||||
| A | 1,283 | 6,841 | 10,154 | 30 | 18,308 | (465 | ) | |||||||||||||||||
| BBB | 30,265 | 40,575 | 60,141 | 7,730 | 138,711 | (2,904 | ) | |||||||||||||||||
| Non-investment grade | 25,750 | 88,105 | 22,971 | 10,109 | 146,935 | 492 | ||||||||||||||||||
| Total | 75,627 | 173,157 | 101,247 | 22,616 | 372,647 | (4,132 | ) | |||||||||||||||||
| Total credit default swaps sold | $ | 188,357 | $ | 438,999 | $ | 233,886 | $ | 46,820 | $ | 908,062 | $ | (6,611 | ) | |||||||||||
| Other credit contracts(4)(5) | $ | 51 | $ | 539 | $ | 1 | $ | 620 | $ | 1,211 | $ | (500 | ) | |||||||||||
| Total credit derivatives and other credit contracts | $ | 188,408 | $ | 439,538 | $ | 233,887 | $ | 47,440 | $ | 909,273 | $ | (7,111 | ) | |||||||||||
| (1) | Fair value amounts are shown on a gross basis prior to cash collateral or counterparty netting. |
| (2) | Fair value amounts of certain credit default swaps where the Company sold protection have an asset carrying value because credit spreads of the underlying reference entity or entities tightened during the term of the contracts. |
| (3) | Credit ratings are calculated internally. |
| (4) | Other credit contracts include CLNs, CDOs and credit default swaps that are considered hybrid instruments. |
| (5) | Fair value amounts shown represent the fair value of the hybrid instruments. |
| | 246 |
| At December�31, 2013 | ||||||||||||||||||||||||
| Maximum Potential Payout/Notional | Fair
Value (Asset)/ Liability(1)(2) | |||||||||||||||||||||||
| Years to Maturity | ||||||||||||||||||||||||
| Credit Ratings of the Reference Obligation | Less�than�1 | 1-3 | 3-5 | Over 5 | Total | |||||||||||||||||||
| (dollars in millions) | ||||||||||||||||||||||||
| Single name credit default swaps: | ||||||||||||||||||||||||
| AAA | $ | 1,546 | $ | 8,661 | $ | 12,128 | $ | 1,282 | $ | 23,617 | $ | (145 | ) | |||||||||||
| AA | 9,443 | 24,158 | 25,310 | 4,317 | 63,228 | (845 | ) | |||||||||||||||||
| A | 45,663 | 53,755 | 44,428 | 4,666 | 148,512 | (2,704 | ) | |||||||||||||||||
| BBB | 103,143 | 122,382 | 112,950 | 20,491 | 358,966 | (4,294 | ) | |||||||||||||||||
| Non-investment grade | 60,254 | 77,393 | 61,088 | 6,780 | 205,515 | (1,361 | ) | |||||||||||||||||
| Total | 220,049 | 286,349 | 255,904 | 37,536 | 799,838 | (9,349 | ) | |||||||||||||||||
| Index and basket credit default swaps(3): | ||||||||||||||||||||||||
| AAA | 14,890 | 40,522 | 30,613 | 2,184 | 88,209 | (1,679 | ) | |||||||||||||||||
| AA | 3,751 | 4,127 | 4,593 | 6,006 | 18,477 | (275 | ) | |||||||||||||||||
| A | 2,064 | 2,263 | 11,633 | 36 | 15,996 | (418 | ) | |||||||||||||||||
| BBB | 5,974 | 29,709 | 74,982 | 3,847 | 114,512 | (2,220 | ) | |||||||||||||||||
| Non-investment grade | 67,108 | 157,149 | 122,516 | 16,985 | 363,758 | (3,053 | ) | |||||||||||||||||
| Total | 93,787 | 233,770 | 244,337 | 29,058 | 600,952 | (7,645 | ) | |||||||||||||||||
| Total credit default swaps sold | $ | 313,836 | $ | 520,119 | $ | 500,241 | $ | 66,594 | $ | 1,400,790 | $ | (16,994 | ) | |||||||||||
| Other credit contracts(4)(5) | $ | 75 | $ | 441 | $ | 529 | $ | 816 | $ | 1,861 | $ | (457 | ) | |||||||||||
| Total credit derivatives and other credit contracts | $ | 313,911 | $ | 520,560 | $ | 500,770 | $ | 67,410 | $ | 1,402,651 | $ | (17,451 | ) | |||||||||||
| (1) | Fair value amounts are shown on a gross basis prior to cash collateral or counterparty netting. |
| (2) | Fair value amounts of certain credit default swaps where the Company sold protection have an asset carrying value because credit spreads of the underlying reference entity or entities tightened during the term of the contracts. |
| (3) | Credit ratings are calculated internally. |
| (4) | Other credit contracts include CLNs, CDOs and credit default swaps that are considered hybrid instruments. |
| (5) | Fair value amounts shown represent the fair value of the hybrid instruments. |
| 247 | |
| | 248 |
| Years to Maturity | Total at December�31, 2014 | |||||||||||||||||||
| Less than�1 | 1-3 | 3-5 | Over�5 | |||||||||||||||||
| (dollars in millions) | ||||||||||||||||||||
| Letters of credit and other financial guarantees obtained to satisfy collateral requirements | $ | 457 | $ | 1 | $ | � | $ | 2 | $ | 460 | ||||||||||
| Investment activities | 511 | 82 | 24 | 446 | 1,063 | |||||||||||||||
| Primary lending commitments�investment grade(1) | 8,507 | 14,874 | 35,850 | 1,437 | 60,668 | |||||||||||||||
| Primary lending commitments�non-investment grade(1) | 1,101 | 5,148 | 13,062 | 2,051 | 21,362 | |||||||||||||||
| Secondary lending commitments(2) | 1 | 32 | 38 | 116 | 187 | |||||||||||||||
| Commitments for secured lending transactions | 1,194 | 534 | 181 | 919 | 2,828 | |||||||||||||||
| Forward starting reverse repurchase agreements and securities borrowing agreements(3)(4) | 42,033 | � | � | � | 42,033 | |||||||||||||||
| Commercial and residential mortgage-related commitments | 7 | 444 | 528 | 329 | 1,308 | |||||||||||||||
| Underwriting commitments | 290 | � | � | � | 290 | |||||||||||||||
| Other lending commitments | 4,284 | 1,089 | 364 | 98 | 5,835 | |||||||||||||||
| Total | $ | 58,385 | $ | 22,204 | $ | 50,047 | $ | 5,398 | $ | 136,034 | ||||||||||
| (1) | Total amount includes $49.9�billion of investment grade and $13.0�billion of non-investment grade unfunded commitments accounted for as held for investment and $8.4�billion of investment grade and $7.4�billion of non-investment grade unfunded commitments accounted for as held for sale at December�31, 2014. The remainder of these lending commitments is carried at fair value. |
| (2) | These commitments are recorded at fair value within Trading assets and Trading liabilities in the Company�s consolidated statements of financial condition (see Note 4). |
| (3) | The Company enters into forward starting reverse repurchase and securities borrowing agreements (agreements that have a trade date at or prior to December�31, 2014 and settle subsequent to period-end) that are primarily secured by collateral from U.S. government agency securities and other sovereign government obligations. These agreements primarily settle within three business days, and of the total amount at December�31, 2014, $41.2�billion settled within three business days. |
| (4) | The Company also has a contingent obligation to provide financing to a clearinghouse through which it clears certain transactions. The financing is required only upon the default of a clearinghouse member. The financing takes the form of a reverse repurchase facility, with a maximum amount of approximately $0.5�billion. |
| 249 | |
| Year Ended | Operating Premises Leases | |||
| (dollars�in�millions) | ||||
| 2015 | $ | 599 | ||
| 2016 | 601 | |||
| 2017 | 558 | |||
| 2018 | 465 | |||
| 2019 | 382 | |||
| Thereafter | 2,588 | |||
| | 250 |
| Year Ended | Operating Equipment� Leases | |||
| (dollars�in�millions) | ||||
| 2015 | $ | 204 | ||
| 2016 | 104 | |||
| 2017 | 96 | |||
| 2018 | 90 | |||
| 2019 | 55 | |||
| Thereafter | 61 | |||
| Maximum Potential Payout/Notional | Carrying Amount (Asset)/ Liability | Collateral/ Recourse | ||||||||||||||||||||||||||
| Years to Maturity | ||||||||||||||||||||||||||||
| Type of Guarantee | Less than�1 | 1-3 | 3-5 | Over�5 | Total | |||||||||||||||||||||||
| (dollars in millions) | ||||||||||||||||||||||||||||
| Credit derivative contracts(1) | $ | 188,357 | $ | 438,999 | $ | 233,886 | $ | 46,820 | $ | 908,062 | $ | (6,611 | ) | $ | � | |||||||||||||
| Other credit contracts | 51 | 539 | 1 | 620 | 1,211 | (500 | ) | � | ||||||||||||||||||||
| Non-credit derivative contracts(1) | 1,386,044 | 713,180 | 269,632 | 517,968 | 2,886,824 | 81,021 | � | |||||||||||||||||||||
| Standby letters of credit and other financial guarantees issued(2) | 607 | 1,102 | 1,056 | 5,792 | 8,557 | (223 | ) | 6,434 | ||||||||||||||||||||
| Market value guarantees | 28 | 426 | 125 | 104 | 683 | 5 | 88 | |||||||||||||||||||||
| Liquidity facilities | 2,507 | � | � | � | 2,507 | (4 | ) | 3,779 | ||||||||||||||||||||
| Whole loan sales guarantees | � | � | � | 23,605 | 23,605 | 9 | � | |||||||||||||||||||||
| Securitization representations and warranties | � | � | � | 65,520 | 65,520 | 98 | � | |||||||||||||||||||||
| General partner guarantees | 72 | � | 58 | 352 | 482 | 71 | � | |||||||||||||||||||||
| (1) | Carrying amounts of derivative contracts are shown on a gross basis prior to cash collateral or counterparty netting. For further information on derivative contracts, see Note 12. |
| (2) | Approximately $2.1�billion of standby letters of credit are also reflected in the �Commitments� table above in primary and secondary lending commitments. Standby letters of credit are recorded at fair value within Trading assets or Trading liabilities in the Company�s consolidated statements of financial condition. |
| 251 | |
| | 252 |
| 253 | |
| � | Trust Preferred Securities .����The Company has established�Morgan Stanley Capital Trusts for the limited purpose of issuing�trust preferred securities to third parties and lending such proceeds to the Company in exchange for junior subordinated debentures. The Morgan Stanley Capital Trusts are special purpose entities and only the Parent provides a guarantee for the trust preferred securities. The Company has directly guaranteed the repayment of the trust preferred securities to the holders in accordance with the terms thereof. See Note 11 for details on the Company�s junior subordinated debentures. |
| � | Indemnities .����The Company provides standard indemnities to counterparties for certain contingent exposures and taxes, including U.S. and foreign withholding taxes, on interest and other payments made on derivatives, securities and stock lending transactions, certain annuity products and other financial arrangements. These indemnity payments could be required based on a change in the tax laws, a change in interpretation of applicable tax rulings or a change in factual circumstances. Certain contracts contain provisions that enable the Company to terminate the agreement upon the occurrence of such events. The maximum potential amount of future payments that the Company could be required to make under these indemnifications cannot be estimated. |
| � | Exchange/Clearinghouse Member Guarantees .����The Company is a member of various U.S. and non-U.S. exchanges and clearinghouses that trade and clear securities and/or derivative contracts. Associated with its membership, the Company may be required to pay a proportionate share of the financial obligations of another member who may default on its obligations to the exchange or the clearinghouse. While the rules governing different exchange or clearinghouse memberships vary, in general the Company�s obligations under these rules would arise only if the exchange or clearinghouse had previously exhausted its resources. In addition, some clearinghouse rules require members to assume a proportionate share of losses resulting from the clearinghouse�s investment of guarantee fund contributions and initial margin, and of other losses unrelated to the default of a clearing member, if such losses exceed the specified resources allocated for such purpose by the clearinghouse. The maximum potential payout under these rules cannot be estimated. The Company has not recorded any contingent liability in its consolidated financial statements for these agreements and believes that any potential requirement to make payments under these agreements is remote. |
| � | Merger and Acquisition Guarantees .����The Company may, from time to time, in its role as investment banking advisor be required to provide guarantees in connection with certain European merger and acquisition transactions. If required by the regulating authorities, the Company provides a guarantee that the acquirer in the merger and acquisition transaction has or will have sufficient funds to complete the transaction and would then be required to make the acquisition payments in the event the acquirer�s funds are insufficient at the completion date of the transaction. These arrangements generally cover the time frame from the transaction offer date to its closing date and, therefore, are generally short term in nature. The maximum potential amount of future payments that the Company could be required to make cannot be estimated. The Company believes the likelihood of any payment by the Company under these arrangements is remote given the level of the Company�s due diligence associated with its role as investment banking advisor. |
| | 254 |
| 255 | |
| | 256 |
| 257 | |
| | 258 |
| 259 | |
| | 260 |
| At December�31, 2014 | At December�31, 2013 | |||||||||||||||||||||||
| U.S. Basel
III Transitional/ Advanced Approach | Minimum Regulatory Capital Ratio(1) | U.S. Basel I(2) | Minimum Regulatory Capital Ratio(3) | |||||||||||||||||||||
| Amount | Ratio | Amount | Ratio | |||||||||||||||||||||
| (dollars in millions) | ||||||||||||||||||||||||
| Regulatory capital and capital ratios: | ||||||||||||||||||||||||
| Common Equity Tier 1 capital/Tier 1 common capital | $ | 57,324 | 12.6 | % | 4.0 | % | $ | 49,917 | 12.8 | % | N/A | |||||||||||||
| Tier 1 capital | 64,182 | 14.1 | % | 5.5 | % | 61,007 | 15.6 | % | 4.0 | % | ||||||||||||||
| Total capital | 74,972 | 16.4 | % | 8.0 | % | 66,000 | 16.9 | % | 8.0 | % | ||||||||||||||
| Tier 1 leverage | � | 7.9 | % | 4.0 | % | � | 7.6 | % | 4.0 | % | ||||||||||||||
| Assets: | ||||||||||||||||||||||||
| RWAs | $ | 456,008 | � | N/A | $ | 390,366 | � | N/A | ||||||||||||||||
| Adjusted average assets | 810,524 | � | N/A | 805,838 | � | N/A | ||||||||||||||||||
| (1) | Percentages represent minimum regulatory capital ratios under U.S. Basel III. |
| (2) | The standards applicable in 2013 included U.S. Basel I as supplemented by Basel 2.5. The Company�s Tier 1 and total risk-based capital ratios, Tier 1 leverage ratio and RWAs at December�31, 2013 were calculated under this framework. |
| (3) | Percentages represent minimum regulatory capital ratios under U.S. Basel I as supplemented by Basel 2.5. |
| At December�31, 2014 | At December�31, 2013 | |||||||||||||||||||||
| U.S.�Basel�III�Transitional/ Basel�I�+�Basel�2.5� Approach | Required Capital� Ratio(1) | U.S. Basel I(2)(3) | Required Capital� Ratio(1) | |||||||||||||||||||
| Amount | Ratio | Amount | Ratio | |||||||||||||||||||
| (dollars�in�millions) | ||||||||||||||||||||||
| Common Equity Tier 1 capital | $12,355 | 12.2 | % | 6.5 | % | N/A | N/A | N/A | ||||||||||||||
| Tier 1 capital | $12,355 | 12.2 | % | 8.0 | % | $ | 11,086 | 14.6 | % | 6.0 | % | |||||||||||
| Total capital | $14,040 | 13.9 | % | 10.0 | % | $ | 12,749 | 16.8 | % | 10.0 | % | |||||||||||
| Tier 1 leverage | $12,355 | 10.2 | % | 5.0 | % | $ | 11,086 | 10.8 | % | 5.0 | % | |||||||||||
| (1) | Capital ratios required to be considered well-capitalized for U.S. regulatory purposes. |
| (2) | The standards applicable in 2013 included U.S. Basel I as supplemented by Basel 2.5. The Company�s U.S. Subsidiary Banks� Tier 1 and total risk-based capital ratios, Tier 1 leverage ratio and RWAs at December�31, 2013 were calculated under this framework. |
| (3) | MSBNA ratios have been restated to reflect certain amendments to its regulatory reports. |
| 261 | |
| At December�31, 2014 | At December�31, 2013 | |||||||||||||||||||||||
| U.S.�Basel�III�Transitional/ Basel�I�+�Basel�2.5� Approach | Required Capital� Ratio(1) | U.S. Basel I(2) | Required Capital� Ratio(1) | |||||||||||||||||||||
| Amount | Ratio | Amount | Ratio | |||||||||||||||||||||
| (dollars�in�millions) | ||||||||||||||||||||||||
| Common Equity Tier 1 capital | $ | 2,468 | 20.3 | % | 6.5 | % | N/A | N/A | N/A | |||||||||||||||
| Tier 1 capital | $ | 2,468 | 20.3 | % | 8.0 | % | $ | 2,177 | 26.5 | % | 6.0 | % | ||||||||||||
| Total capital | $ | 2,480 | 20.4 | % | 10.0 | % | $ | 2,184 | 26.6 | % | 10.0 | % | ||||||||||||
| Tier 1 leverage | $ | 2,468 | 9.4 | % | 5.0 | % | $ | 2,177 | 9.7 | % | 5.0 | % | ||||||||||||
| (1) | Capital ratios required to be considered well-capitalized for U.S. regulatory purposes. |
| (2) | The standards applicable in 2013 included U.S. Basel I as supplemented by Basel 2.5. The Company�s U.S. Subsidiary Banks� Tier 1 and total risk-based capital ratios, Tier 1 leverage ratio and RWAs at December�31, 2013 were calculated under this framework. |
| | 262 |
| 2014 | 2013 | |||||||
| Shares outstanding at beginning of period | 1,945 | 1,974 | ||||||
| Treasury stock purchases(1) | (46 | ) | (27 | ) | ||||
| Other(2) | 52 | (2 | ) | |||||
| Shares outstanding at end of period | 1,951 | 1,945 | ||||||
| (1) | Treasury stock purchases include repurchases of common stock for employee tax withholding. |
| (2) | Other includes net shares issued to and forfeited from Employee stock trusts and issued for RSU conversions. |
| 263 | |
| Shares Outstanding�at December 31, 2014 | Liquidation Preference per Share | Carrying Value | ||||||||||||||
| Series | At December�31, 2014 | At December�31, 2013 | ||||||||||||||
| (shares in millions) | (dollars in millions) | |||||||||||||||
| A | 44,000 | $ | 25,000 | $ | 1,100 | $ | 1,100 | |||||||||
| C | 519,882 | 1,000 | 408 | 408 | ||||||||||||
| E | 34,500 | 25,000 | 862 | 862 | ||||||||||||
| F | 34,000 | 25,000 | 850 | 850 | ||||||||||||
| G | 20,000 | 25,000 | 500 | � | ||||||||||||
| H | 52,000 | 25,000 | 1,300 | � | ||||||||||||
| I | 40,000 | 25,000 | 1,000 | � | ||||||||||||
| Total | $ | 6,020 | $ | 3,220 | ||||||||||||
| | 264 |
| 265 | |
| Foreign Currency Translation Adjustments | Net Change�in Cash�Flow Hedges | Change in Net�Unrealized Gains�(Losses)�on AFS Securities | Pension, Postretirement and�Other�Related Adjustments | Total | ||||||||||||||||
| Balance at December�31, 2013 | $ | (266 | ) | $ | (1 | ) | $ | (282 | ) | $ | (544 | ) | $ | (1,093 | ) | |||||
| Other comprehensive income before reclassifications | (397 | ) | � | 233 | 24 | (140 | ) | |||||||||||||
| Amounts reclassified from AOCI | � | 4 | (24 | ) | 5 | (15 | ) | |||||||||||||
| Net other comprehensive income during the period | (397 | ) | 4 | 209 | 29 | (155 | ) | |||||||||||||
| Balance at December�31, 2014 | $ | (663 | ) | $ | 3 | $ | (73 | ) | $ | (515 | ) | $ | (1,248 | ) | ||||||
| Foreign Currency Translation Adjustments | Net Change in Cash�Flow Hedges | Change in Net�Unrealized Gains�(Losses)�on AFS�Securities | Pension, Postretirement and�Other�Related Adjustments | Total | ||||||||||||||||
| Balance at December�31, 2012 | $ | (123 | ) | $ | (5 | ) | $ | 151 | $ | (539 | ) | $ | (516 | ) | ||||||
| Other comprehensive income (loss) before reclassifications | (143 | ) | � | (406 | ) | (16 | ) | (565 | ) | |||||||||||
| Amounts reclassified from AOCI | � | 4 | (27 | ) | 11 | (12 | ) | |||||||||||||
| Net other comprehensive income (loss) during the period | (143 | ) | 4 | (433 | ) | (5 | ) | (577 | ) | |||||||||||
| Balance at December�31, 2013 | $ | (266 | ) | $ | (1 | ) | $ | (282 | ) | $ | (544 | ) | $ | (1,093 | ) | |||||
| | 266 |
| At December�31, 2014 | At December�31, 2013 | |||||||
| (dollars in millions) | ||||||||
| Net investments in non-U.S. dollar functional currency subsidiaries subject to hedges | $ | 9,110 | $ | 11,708 | ||||
| Cumulative foreign currency translation adjustments resulting from net investments in subsidiaries with a non-U.S. dollar functional currency | $ | (1,262 | ) | $ | (259 | ) | ||
| Cumulative foreign currency translation adjustments resulting from realized or unrealized losses on hedges, net of tax | 599 | (7 | ) | |||||
| Total cumulative foreign currency translation adjustments, net of tax | $ | (663 | ) | $ | (266 | ) | ||
| 267 | |
| 2014 | 2013 | 2012 | ||||||||||
| Basic EPS: | ||||||||||||
| Income from continuing operations | $ | 3,681 | $ | 3,656 | $ | 757 | ||||||
| Income (loss) from discontinued operations | (14 | ) | (43 | ) | (41 | ) | ||||||
| Net income | 3,667 | 3,613 | 716 | |||||||||
| Net income applicable to redeemable noncontrolling interests | � | 222 | 124 | |||||||||
| Net income applicable to nonredeemable noncontrolling interests | 200 | 459 | 524 | |||||||||
| Net income applicable to Morgan Stanley | 3,467 | 2,932 | 68 | |||||||||
| Less: Preferred dividends (Series A Preferred Stock) | (45 | ) | (44 | ) | (44 | ) | ||||||
| Less: Preferred dividends (Series C Preferred Stock) | (52 | ) | (52 | ) | (52 | ) | ||||||
| Less: Preferred dividends (Series E Preferred Stock) | (61 | ) | (18 | ) | � | |||||||
| Less: Preferred dividends (Series F Preferred Stock) | (58 | ) | (6 | ) | � | |||||||
| Less: Preferred dividends (Series G Preferred Stock) | (24 | ) | � | � | ||||||||
| Less: Preferred dividends (Series H Preferred Stock) | (50 | ) | � | � | ||||||||
| Less: Preferred dividends (Series I Preferred Stock) | (21 | ) | � | � | ||||||||
| Less: Wealth Management JV redemption value adjustment (see Note 3) | � | (151 | ) | � | ||||||||
| Less: Allocation of (earnings) loss to participating RSUs(1): | ||||||||||||
| From continuing operations | (4 | ) | (6 | ) | (2 | ) | ||||||
| Earnings (loss) applicable to Morgan Stanley common shareholders | $ | 3,152 | $ | 2,655 | $ | (30 | ) | |||||
| Weighted average common shares outstanding | 1,924 | 1,906 | 1,886 | |||||||||
| Earnings (loss) per basic common share: | ||||||||||||
| Income from continuing operations | $ | 1.65 | $ | 1.42 | $ | 0.02 | ||||||
| Income (loss) from discontinued operations | (0.01 | ) | (0.03 | ) | (0.04 | ) | ||||||
| Earnings (loss) per basic common share | $ | 1.64 | $ | 1.39 | $ | (0.02 | ) | |||||
| Diluted EPS: | ||||||||||||
| Earnings (loss) applicable to Morgan Stanley common shareholders | $ | 3,152 | $ | 2,655 | $ | (30 | ) | |||||
| Weighted average common shares outstanding | 1,924 | 1,906 | 1,886 | |||||||||
| Effect of dilutive securities: | ||||||||||||
| Stock options and RSUs(1) | 47 | 51 | 33 | |||||||||
| Weighted average common shares outstanding and common stock equivalents | 1,971 | 1,957 | 1,919 | |||||||||
| Earnings (loss) per diluted common share: | ||||||||||||
| Income from continuing operations | $ | 1.61 | $ | 1.38 | $ | 0.02 | ||||||
| Income (loss) from discontinued operations | (0.01 | ) | (0.02 | ) | (0.04 | ) | ||||||
| Earnings (loss) per diluted common share | $ | 1.60 | $ | 1.36 | $ | (0.02 | ) | |||||
| (1) | RSUs that are considered participating securities participate in all of the earnings of the Company in the computation of basic EPS, and, therefore, such RSUs are not included as incremental shares in the diluted calculation. |
| | 268 |
| Number of Antidilutive Securities Outstanding at End of Period: | 2014 | 2013 | 2012 | |||||||||
| (shares in millions) | ||||||||||||
| RSUs and performance-based stock units | 2 | 3 | 8 | |||||||||
| Stock options | 13 | 33 | 42 | |||||||||
| Total | 15 | 36 | 50 | |||||||||
| 2014 | 2013 | 2012 | ||||||||||
| (dollars�in�millions) | ||||||||||||
| Interest income(1): | ||||||||||||
| Trading assets(2) | $ | 2,109 | $ | 2,292 | $ | 2,736 | ||||||
| Investment securities | 613 | 447 | 343 | |||||||||
| Loans | 1,690 | 1,121 | 643 | |||||||||
| Interest bearing deposits with banks | 109 | 129 | 124 | |||||||||
| Securities purchased under agreements to resell and Securities borrowed(3) | (298 | ) | (20 | ) | 364 | |||||||
| Customer receivables and Other(4) | 1,190 | 1,240 | 1,482 | |||||||||
| Total interest income | $ | 5,413 | $ | 5,209 | $ | 5,692 | ||||||
| Interest expense(1): | ||||||||||||
| Deposits | $ | 106 | $ | 159 | $ | 181 | ||||||
| Commercial paper and other short-term borrowings | 4 | 20 | 38 | |||||||||
| Long-term borrowings | 3,609 | 3,758 | 4,622 | |||||||||
| Securities sold under agreements to repurchase and Securities loaned(5) | 1,216 | 1,469 | 1,805 | |||||||||
| Customer payables and Other(6) | (1,257 | ) | (975 | ) | (749 | ) | ||||||
| Total interest expense | $ | 3,678 | $ | 4,431 | $ | 5,897 | ||||||
| Net interest | $ | 1,735 | $ | 778 | $ | (205 | ) | |||||
| (1) | Interest income and expense are recorded within the Company�s consolidated statements of income depending on the nature of the instrument and related market conventions. When interest is included as a component of the instrument�s fair value, interest is included within Trading revenues or Investments revenues. Otherwise, it is included within Interest income or Interest expense. |
| (2) | Interest expense on Trading liabilities is reported as a reduction to Interest income on Trading assets. |
| (3) | Includes fees paid on securities borrowed. |
| (4) | Includes interest from customer receivables and other interest earning assets. |
| (5) | Includes fees received on securities loaned. |
| (6) | Includes fees received from prime brokerage customers for stock loan transactions incurred to cover customers� short positions. |
| 269 | |
| 2014 | 2013 | 2012 | ||||||||||
| (dollars�in�millions) | ||||||||||||
| Restricted stock units(1) | $ | 1,212 | $ | 1,140 | $ | 864 | ||||||
| Stock options | 5 | 15 | 4 | |||||||||
| Performance-based stock units | 45 | 29 | 29 | |||||||||
| Total | $ | 1,262 | $ | 1,184 | $ | 897 | ||||||
| (1) | Amounts for 2014, 2013 and 2012 include $31 million, $25 million and $31 million, respectively, related to stock-based awards that were granted in 2015, 2014 and 2013, respectively, to employees who satisfied retirement-eligible requirements under award terms that do not contain a service period. |
| | 270 |
| 2014 | ||||||||
| Number�of Shares | Weighted�Average Grant Date Fair Value | |||||||
| RSUs at beginning of period | 132 | $ | 22.41 | |||||
| Granted | 42 | 32.58 | ||||||
| Conversions to common stock | (48 | ) | 23.26 | |||||
| Canceled | (5 | ) | 25.04 | |||||
| RSUs at end of period(1) | 121 | $ | 25.52 | |||||
| (1) | At December�31, 2014, approximately 116�million RSUs with a weighted average grant date fair value of $25.45 were vested or expected to vest. |
| 2014 | ||||||||
| Number�of Shares | Weighted�Average Grant Date Fair Value | |||||||
| Unvested RSUs at beginning of period | 98 | $ | 22.29 | |||||
| Granted | 42 | 32.58 | ||||||
| Vested | (48 | ) | 23.51 | |||||
| Canceled | (5 | ) | 25.04 | |||||
| Unvested RSUs at end of period(1) | 87 | $ | 26.44 | |||||
| (1) | Unvested RSUs represent awards where recipients have yet to satisfy either the explicit vesting terms or retirement-eligible requirements. At December�31, 2014, approximately 82�million unvested RSUs with a weighted average grant date fair value of $26.39 were expected to vest. |
| 271 | |
| Grant Year | Risk-Free�Interest Rate | Expected Life | Expected�Stock Price Volatility | Expected�Dividend Yield | ||||||||||||
| 2013 | 0.6 | % | 3.9�years | 32.0 | % | 0.9 | % | |||||||||
| 2014 | ||||||||
| Number�of Options | Weighted Average Exercise�Price | |||||||
| Options outstanding at beginning of period | 33 | $ | 49.40 | |||||
| Canceled | (14 | ) | 47.29 | |||||
| Options outstanding at end of period(1) | 19 | $ | 51.30 | |||||
| Options exercisable at end of period | 17 | $ | 53.86 | |||||
| (1) | At December�31, 2014, approximately 18�million options with a weighted average exercise price of $51.74 were vested. |
| At December�31, 2014 | Options Outstanding | Options Exercisable | ||||||||||||||||||||||
| Range�of�Exercise�Prices | Number Outstanding | Weighted�Average Exercise Price | Average Remaining�Life (Years) | Number Exercisable | Weighted�Average Exercise Price | Average Remaining�Life (Years) | ||||||||||||||||||
| $22.00���$39.99 | 6 | $ | 26.98 | 3.0 | 4 | $ | 28.37 | 3.0 | ||||||||||||||||
| $40.00���$49.99 | 2 | 43.62 | 0.2 | 2 | 43.62 | 0.2 | ||||||||||||||||||
| $50.00���$59.99 | 1 | 52.23 | 1.2 | 1 | 52.23 | 1.2 | ||||||||||||||||||
| $60.00���$76.99 | 10 | 66.75 | 1.9 | 10 | 66.75 | 1.9 | ||||||||||||||||||
| Total | 19 | 17 | ||||||||||||||||||||||
| | 272 |
| Minimum | Maximum | |||||||||||
| Grant Year | MS�Average�ROE | Multiplier | MS�Average�ROE | Multiplier | ||||||||
| 2014 | Less�than�5% | 0.0 | 11.5%�or�more | 1.5 | ||||||||
| 2013 | Less�than�5% | 0.0 | 13%�or�more | 2.0 | ||||||||
| 2012 | Less�than�6% | 0.0 | 12%�or�more | 1.5 | ||||||||
| Minimum | Maximum | |||||||||||
| Grant Year | TSR | Multiplier | TSR | Multiplier | ||||||||
| 2014 | Below | Down�to�0.0 | Above | Up�to�1.5 | ||||||||
| 2013 | Below | Down to 0.0 | Above | Up to 2.0 | ||||||||
| 2012 | Below | Down to 0.0 | Above | Up to 1.5 | ||||||||
| Grant Year | Risk-Free�Interest Rate | Expected�Stock Price Volatility | Expected�Dividend Yield | |||||||||
| 2014 | 0.8 | % | 44.2 | % | 0.0 | % | ||||||
| 2013 | 0.4 | % | 45.4 | % | 0.0 | % | ||||||
| 2012 | 0.4 | % | 56.0 | % | 1.1 | % | ||||||
| 273 | |
| 2014 | ||||
| Number�of�Shares | ||||
| (in millions) | ||||
| PSUs at beginning of period | 4 | |||
| Awarded | 2 | |||
| Conversions to Common Stock | (1 | ) | ||
| Canceled | (1 | ) | ||
| PSUs at end of period | 4 | |||
| 2014 | 2013 | 2012 | ||||||||||
| (dollars�in�millions) | ||||||||||||
| Deferred cash-based awards(1) | $ | 1,757 | $ | 1,490 | $ | 1,815 | ||||||
| Return on referenced investments | 408 | 772 | 435 | |||||||||
| Total | $ | 2,165 | $ | 2,262 | $ | 2,250 | ||||||
| (1) | Amounts for 2014, 2013 and 2012 include $92 million, $78 million and $93 million, respectively, related to deferred cash-based awards that were granted in 2015, 2014 and 2013, respectively, to employees who satisfied retirement-eligible requirements under award terms that do not contain a service period. |
| | 274 |
| 2015 | 2016 | Thereafter | Total | |||||||||||||
| (dollars�in�millions) | ||||||||||||||||
| Stock-based awards | $ | 577 | $ | 262 | $ | 215 | $ | 1,054 | ||||||||
| Deferred cash-based awards | 410 | 225 | 99 | 734 | ||||||||||||
| Total | $ | 987 | $ | 487 | $ | 314 | $ | 1,788 | ||||||||
| 275 | |
| Pension | Postretirement | |||||||||||||||||||||||
| 2014 | 2013 | 2012 | 2014 | 2013 | 2012 | |||||||||||||||||||
| (dollars�in�millions) | ||||||||||||||||||||||||
| Service cost, benefits earned during the period | $ | 20 | $ | 23 | $ | 26 | $ | 2 | $ | 4 | $ | 4 | ||||||||||||
| Interest cost on projected benefit obligation | 154 | 151 | 156 | 5 | 7 | 7 | ||||||||||||||||||
| Expected return on plan assets | (110 | ) | (114 | ) | (110 | ) | � | � | � | |||||||||||||||
| Net amortization of prior service credit | � | � | � | (14 | ) | (13 | ) | (14 | ) | |||||||||||||||
| Net amortization of actuarial loss | 22 | 36 | 27 | � | 3 | 2 | ||||||||||||||||||
| Curtailment loss | 3 | � | � | � | � | � | ||||||||||||||||||
| Settlement loss | 2 | 1 | � | � | � | � | ||||||||||||||||||
| Net periodic benefit expense (income) | $ | 91 | $ | 97 | $ | 99 | $ | (7 | ) | $ | 1 | $ | (1 | ) | ||||||||||
| Pension | Postretirement | |||||||||||||||||||||||
| 2014 | 2013 | 2012 | 2014 | 2013 | 2012 | |||||||||||||||||||
| (dollars�in�millions) | ||||||||||||||||||||||||
| Net loss (gain) | $ | 18 | $ | 87 | $ | 416 | $ | 9 | $ | (52 | ) | $ | 16 | |||||||||||
| Prior service cost | 2 | 3 | 3 | (64 | ) | � | � | |||||||||||||||||
| Amortization of prior service credit | � | � | � | 14 | 13 | 14 | ||||||||||||||||||
| Amortization of net loss | (27 | ) | (37 | ) | (27 | ) | � | (3 | ) | (2 | ) | |||||||||||||
| Total recognized in other comprehensive loss (income) | $ | (7 | ) | $ | 53 | $ | 392 | $ | (41 | ) | $ | (42 | ) | $ | 28 | |||||||||
| Pension | Postretirement | |||||||||||||||||||||||
| 2014 | 2013 | 2012 | 2014 | 2013 | 2012 | |||||||||||||||||||
| Discount rate(1) | 4.74 | % | 3.95 | % | 4.57 | % | 3.77 | % | 3.88 | % | 4.56 | % | ||||||||||||
| Expected long-term rate of return on plan assets | 3.75 | 3.73 | 3.78 | N/A | N/A | N/A | ||||||||||||||||||
| Rate of future compensation increases | 1.06 | 0.98 | 2.14 | N/A | N/A | N/A | ||||||||||||||||||
| (1) | The Postretirement discount rate for 2014 changed to 3.77% from 4.75% effective October�31, 2014 with the amendment and remeasurement of the Morgan Stanley Medical Plan. |
| | 276 |
| Pension | Postretirement | |||||||||||||||
| 2014 | 2013 | 2014 | 2013 | |||||||||||||
| (dollars�in�millions) | ||||||||||||||||
| Reconciliation of benefit obligation: | ||||||||||||||||
| Benefit obligation at beginning of year | $ | 3,330 | $ | 3,883 | $ | 128 | $ | 174 | ||||||||
| Service cost | 20 | 23 | 2 | 4 | ||||||||||||
| Interest cost | 154 | 151 | 5 | 7 | ||||||||||||
| Actuarial loss (gain) | 555 | (537 | ) | 5 | (52 | ) | ||||||||||
| Plan amendments | 2 | 2 | (64 | ) | � | |||||||||||
| Plan curtailments | (1 | ) | � | � | � | |||||||||||
| Plan settlements | (8 | ) | (7 | ) | � | � | ||||||||||
| Change in mortality assumptions(1) | 203 | � | 4 | � | ||||||||||||
| Benefits paid | (213 | ) | (186 | ) | (5 | ) | (6 | ) | ||||||||
| Other, including foreign currency exchange rate changes | (35 | ) | 1 | � | 1 | |||||||||||
| Benefit obligation at end of year | $ | 4,007 | $ | 3,330 | $ | 75 | $ | 128 | ||||||||
| Reconciliation of fair value of plan assets: | ||||||||||||||||
| Fair value of plan assets at beginning of year | $ | 2,867 | $ | 3,519 | $ | � | $ | � | ||||||||
| Actual return on plan assets | 850 | (512 | ) | � | � | |||||||||||
| Employer contributions(2) | 244 | 42 | 5 | 6 | ||||||||||||
| Benefits paid | (213 | ) | (186 | ) | (5 | ) | (6 | ) | ||||||||
| Plan settlements | (8 | ) | (7 | ) | � | � | ||||||||||
| Other, including foreign currency exchange rate changes | (35 | ) | 11 | � | � | |||||||||||
| Fair value of plan assets at end of year | $ | 3,705 | $ | 2,867 | $ | � | $ | � | ||||||||
| Funded (unfunded) status | $ | (302 | ) | $ | (463 | ) | $ | (75 | ) | $ | (128 | ) | ||||
| (1) | Amounts represent adoption of new mortality tables published by the Society of Actuaries in October 2014. |
| (2) | In December 2014, an elective $200 million contribution was made to the U.S. Qualified Plan primarily to offset the increase in liability due to the Plan�s adoption of new mortality tables. |
| 277 | |
| Pension | Postretirement | |||||||||||||||
| December�31, 2014 | December�31, 2013 | December�31, 2014 | December�31, 2013 | |||||||||||||
| (dollars�in�millions) | ||||||||||||||||
| Amounts recognized in the Company�s consolidated statements of financial condition consist of: | ||||||||||||||||
| Assets | $ | 224 | $ | 60 | $ | � | $ | � | ||||||||
| Liabilities | (526 | ) | (523 | ) | (75 | ) | (128 | ) | ||||||||
| Net amount recognized | $ | (302 | ) | $ | (463 | ) | $ | (75 | ) | $ | (128 | ) | ||||
| Amounts recognized in accumulated other comprehensive loss consist of: | ||||||||||||||||
| Prior service cost (credit) | $ | (1 | ) | $ | 1 | $ | (61 | ) | $ | (11 | ) | |||||
| Net loss (gain) | 866 | 871 | (5 | ) | (14 | ) | ||||||||||
| Net loss (gain) recognized | $ | 865 | $ | 872 | $ | (66 | ) | $ | (25 | ) | ||||||
| December�31, 2014 | December�31, 2013 | |||||||
| (dollars�in�millions) | ||||||||
| Projected benefit obligation | $ | 626 | $ | 3,127 | ||||
| Fair value of plan assets | 100 | 2,603 | ||||||
| December�31, 2014 | December�31, 2013 | |||||||
| (dollars�in�millions) | ||||||||
| Accumulated benefit obligation | $ | 588 | $ | 3,089 | ||||
| Fair value of plan assets | 82 | 2,586 | ||||||
| Pension | Postretirement | |||||||||||||||
| December�31, 2014 | December�31, 2013 | December�31, 2014 | December�31, 2013 | |||||||||||||
| Discount rate | 3.86 | % | 4.74 | % | 3.69 | % | 4.75 | % | ||||||||
| Rate of future compensation increase | 2.85 | 1.06 | N/A | N/A | ||||||||||||
| | 278 |
| At�December�31, 2014 | At�December�31, 2013 | |||||||
| Health care cost trend rate assumed for next year: | ||||||||
| Medical | 6.88-7.23% | 6.90-7.38% | ||||||
| Prescription | 7.87% | 8.25% | ||||||
| Rate to which the cost trend rate is assumed to decline (ultimate trend rate) | 4.50% | 4.50% | ||||||
| Year that the rate reaches the ultimate trend rate | 2029 | 2029 | ||||||
| � | Derivatives may be used only if they are deemed by the investment manager to be more attractive than a similar direct investment in the underlying cash market or if the vehicle is being used to manage risk of the portfolio. |
| � | Derivatives may not be used in a speculative manner or to leverage the portfolio under any circumstances. |
| � | Derivatives may not be used as short-term trading vehicles. The investment philosophy of the U.S. Qualified Plan is that investment activity is undertaken for long-term investment rather than short-term trading. |
| � | Derivatives may be used in the management of the U.S. Qualified Plan�s portfolio only when their possible effects can be quantified, shown to enhance the risk-return profile of the portfolio, and reported in a meaningful and understandable manner. |
| 279 | |
| | 280 |
| Quoted�Prices�in Active�Markets�for Identical Assets (Level 1) | Significant Observable�Inputs (Level 2) | Significant Unobservable Inputs�(Level�3) | Total | |||||||||||||
| (dollars�in�millions) | ||||||||||||||||
| Assets: | ||||||||||||||||
| Investments: | ||||||||||||||||
| Cash and cash equivalents(1) | $ | 63 | $ | � | $ | � | $ | 63 | ||||||||
| U.S. government and agency securities: | ||||||||||||||||
| U.S. Treasury securities | 1,332 | � | � | 1,332 | ||||||||||||
| U.S. agency securities | � | 265 | � | 265 | ||||||||||||
| Total U.S. government and agency securities | 1,332 | 265 | � | 1,597 | ||||||||||||
| Corporate and other debt: | ||||||||||||||||
| State and municipal securities | � | 2 | � | 2 | ||||||||||||
| Collateralized debt obligations | � | 62 | � | 62 | ||||||||||||
| Total corporate and other debt | � | 64 | � | 64 | ||||||||||||
| Derivative contracts(2) | � | 292 | � | 292 | ||||||||||||
| Derivative-related cash collateral receivable | � | 2 | � | 2 | ||||||||||||
| Commingled trust funds(3) | � | 1,432 | � | 1,432 | ||||||||||||
| Foreign funds(4) | � | 347 | � | 347 | ||||||||||||
| Other investments | � | � | 36 | 36 | ||||||||||||
| Total investments | 1,395 | 2,402 | 36 | 3,833 | ||||||||||||
| Receivables: | ||||||||||||||||
| Other receivables(1) | � | 27 | � | 27 | ||||||||||||
| Total receivables | � | 27 | � | 27 | ||||||||||||
| Total assets | $ | 1,395 | $ | 2,429 | $ | 36 | $ | 3,860 | ||||||||
| Liabilities: | ||||||||||||||||
| Derivative contracts(5) | $ | � | $ | 33 | $ | � | $ | 33 | ||||||||
| Derivative-related cash collateral payable | � | 2 | � | 2 | ||||||||||||
| Other liabilities(1) | � | 120 | � | 120 | ||||||||||||
| Total liabilities | $ | � | $ | 155 | $ | � | $ | 155 | ||||||||
| Net pension assets | $ | 1,395 | $ | 2,274 | $ | 36 | $ | 3,705 | ||||||||
| (1) | Cash and cash equivalents, other receivables and other liabilities are valued at their carrying value, which approximates fair value. |
| (2) | Derivative contracts in an asset position consist of investments in interest rate swaps of $292 million. |
| (3) | Commingled trust funds consist of investments in fixed income funds and money market funds of $1,280 million and $152 million, respectively. |
| (4) | Foreign funds include investments in fixed income funds, targeted cash flow funds and liquidity funds of $158 million, $136 million and $53 million, respectively. |
| (5) | Derivative contracts in a liability position consist of investments in interest rate swaps of $33 million. |
| 281 | |
| Quoted�Prices�in Active Markets for Identical Assets (Level 1) | Significant Observable�Inputs (Level 2) | Significant Unobservable Inputs�(Level�3) | Total | |||||||||||||
| (dollars�in�millions) | ||||||||||||||||
| Assets: | ||||||||||||||||
| Investments: | ||||||||||||||||
| Cash and cash equivalents(1) | $ | 91 | $ | � | $ | � | $ | 91 | ||||||||
| U.S. government and agency securities: | ||||||||||||||||
| U.S. Treasury securities | 1,047 | � | � | 1,047 | ||||||||||||
| U.S. agency securities | � | 204 | � | 204 | ||||||||||||
| Total U.S. government and agency securities | 1,047 | 204 | � | 1,251 | ||||||||||||
| Corporate and other debt: | ||||||||||||||||
| State and municipal securities | � | 2 | � | 2 | ||||||||||||
| Collateralized debt obligations | � | 76 | � | 76 | ||||||||||||
| Total corporate and other debt | � | 78 | � | 78 | ||||||||||||
| Derivative contracts(2) | � | 122 | � | 122 | ||||||||||||
| Derivative-related cash collateral receivable | � | 37 | � | 37 | ||||||||||||
| Commingled trust funds(3) | � | 1,004 | � | 1,004 | ||||||||||||
| Foreign funds(4) | 21 | 291 | � | 312 | ||||||||||||
| Other investments | � | 10 | 38 | 48 | ||||||||||||
| Total investments | 1,159 | 1,746 | 38 | 2,943 | ||||||||||||
| Receivables: | ||||||||||||||||
| Other receivables(1) | � | 20 | � | 20 | ||||||||||||
| Total receivables | � | 20 | � | 20 | ||||||||||||
| Total assets | $ | 1,159 | $ | 1,766 | $ | 38 | $ | 2,963 | ||||||||
| Liabilities: | ||||||||||||||||
| Derivative contracts(5) | $ | � | $ | 92 | $ | � | $ | 92 | ||||||||
| Derivative-related cash collateral payable | � | 2 | � | 2 | ||||||||||||
| Other liabilities(1) | � | 2 | � | 2 | ||||||||||||
| Total liabilities | $ | � | $ | 96 | $ | � | $ | 96 | ||||||||
| Net pension assets | $ | 1,159 | $ | 1,670 | $ | 38 | $ | 2,867 | ||||||||
| (1) | Cash and cash equivalents, other receivables and other liabilities are valued at their carrying value, which approximates fair value. |
| (2) | Derivative contracts in an asset position consist of investments in interest rate swaps of $122 million. |
| (3) | Commingled trust funds consist of investments in fixed income funds of $1,004 million. |
| (4) | Foreign funds include investments in fixed income funds, targeted cash flow funds, liquidity funds, corporate equity funds and diversified funds of $157 million, $77 million, $56 million, $21 million and $1 million, respectively. |
| (5) | Derivative contracts in a liability position consist of investments in interest rate swaps of $92 million. |
| | 282 |
| Beginning Balance at January�1, 2014 | Actual Return on Plan Assets Related to Assets Still Held at December�31, 2014 | Actual Return on� Plan Assets�Related to Assets Sold during 2014 | Purchases, Sales, Other Settlements and�Issuances, net | Net�Transfers In�and/or�(Out) of Level 3 | Ending Balance at�December� 31, 2014 | |||||||||||||||||||
| (dollars�in�millions) | ||||||||||||||||||||||||
| Investments | ||||||||||||||||||||||||
| Other investments | $ | 38 | $ | (5 | ) | $ | � | $ | 3 | $ | � | $ | 36 | |||||||||||
| Total investments | $ | 38 | $ | (5 | ) | $ | � | $ | 3 | $ | � | $ | 36 | |||||||||||
| Beginning Balance at January�1, 2013 | Actual Return on Plan Assets Related to Assets Still Held at December�31, 2013 | Actual Return on Plan Assets�Related to�Assets�Sold during 2013 | Purchases, Sales, Other Settlements and�Issuances, net | Net�Transfers In�and/or�(Out) of Level 3 | Ending Balance at�December� 31, 2013 | |||||||||||||||||||
| (dollars�in�millions) | ||||||||||||||||||||||||
| Investments | ||||||||||||||||||||||||
| Other investments | $ | 30 | $ | 2 | $ | � | $ | 4 | $ | 2 | $ | 38 | ||||||||||||
| Total investments | $ | 30 | $ | 2 | $ | � | $ | 4 | $ | 2 | $ | 38 | ||||||||||||
| Pension | Postretirement | |||||||
| (dollars�in�millions) | ||||||||
| 2015 | $ | 132 | $ | 4 | ||||
| 2016 | 133 | 5 | ||||||
| 2017 | 143 | 5 | ||||||
| 2018 | 141 | 5 | ||||||
| 2019 | 145 | 5 | ||||||
| 2020-2024 | 854 | 28 | ||||||
| 283 | |
| 2014 | 2013 | 2012 | ||||||||||
| (dollars�in�millions) | ||||||||||||
| Current: | ||||||||||||
| U.S. federal | $ | (604 | ) | $ | 229 | $ | (102 | ) | ||||
| U.S. state and local | 260 | 164 | 140 | |||||||||
| Non-U.S.: | ||||||||||||
| United Kingdom | 88 | 178 | (16 | ) | ||||||||
| Japan | 114 | 88 | 90 | |||||||||
| Hong Kong | 34 | 36 | 16 | |||||||||
| Other(1) | 258 | 301 | 355 | |||||||||
| $ | 150 | $ | 996 | $ | 483 | |||||||
| Deferred: | ||||||||||||
| U.S. federal | $ | (207 | ) | $ | (3 | ) | $ | (748 | ) | |||
| U.S. state and local | (56 | ) | 1 | (64 | ) | |||||||
| Non-U.S.: | ||||||||||||
| United Kingdom | (31 | ) | (75 | ) | 77 | |||||||
| Japan | 56 | 262 | 170 | |||||||||
| Hong Kong | 9 | (14 | ) | 35 | ||||||||
| Other(1) | (11 | ) | (265 | ) | (114 | ) | ||||||
| $ | (240 | ) | $ | (94 | ) | $ | (644 | ) | ||||
| Provision for (benefit from) income taxes from continuing operations | $ | (90 | ) | $ | 902 | $ | (161 | ) | ||||
| Provision for (benefit from) income taxes from discontinued operations | $ | (5 | ) | $ | (29 | ) | $ | (7 | ) | |||
| | 284 |
| (1) | For 2014 Non-U.S. other jurisdictions included significant total tax provisions of $44 million, $38 million, and $38 million from Brazil, India, and Mexico, respectively. For 2013 Non-U.S. other jurisdictions included significant total tax provisions (benefits) of $59 million, $54 million, and $(156) million from Brazil, India, and Luxembourg, respectively. For 2012 Non-U.S. other jurisdictions included significant total tax provisions (benefits) of $43 million, $36 million, $36 million, $33 million, $32 million, and $(31) million from India, Brazil, Spain, Canada, Singapore, and Netherlands, respectively. |
| 2014 | 2013 | 2012(1) | ||||||||||
| U.S. federal statutory income tax rate | 35.0 | % | 35.0 | % | 35.0 | % | ||||||
| U.S. state and local income taxes, net of U.S. federal income tax benefits | 6.5 | 2.3 | 7.5 | |||||||||
| Domestic tax credits | (5.0 | ) | (3.2 | ) | (29.0 | ) | ||||||
| Tax exempt income | (3.5 | ) | (2.5 | ) | (26.0 | ) | ||||||
| Non-U.S. earnings: | ||||||||||||
| Foreign Tax Rate Differential | (22.5 | ) | (6.0 | ) | (12.2 | ) | ||||||
| Change in Reinvestment Assertion | 1.4 | (1.4 | ) | 4.2 | ||||||||
| Change in Foreign Tax Rates | � | 0.1 | (0.2 | ) | ||||||||
| Wealth Management Legal Entity Restructuring | (38.7 | ) | � | � | ||||||||
| Non-deductible legal expenses | 25.5 | 0.9 | 0.7 | |||||||||
| Other | (1.2 | ) | (5.4 | ) | (7.0 | ) | ||||||
| Effective income tax rate | (2.5 | )% | 19.8 | % | (27.0 | )% | ||||||
| (1) | 2012 percentages are reflective of the lower level of income from continuing operations before income taxes on a comparative basis due to the change in the fair value of certain of the Company�s long-term and short-term borrowings resulting from fluctuations in its credit spreads and other credit factors. |
| 285 | |
| December�31, 2014 | December�31, 2013 | |||||||
| (dollars�in�millions) | ||||||||
| Gross deferred tax assets: | ||||||||
| Tax credits and loss carryforwards | $ | 3,833 | $ | 5,130 | ||||
| Employee compensation and benefit plans | 3,715 | 2,417 | ||||||
| Valuation and liability allowances | 661 | 1,122 | ||||||
| Valuation of inventory, investments and receivables | 586 | 418 | ||||||
| Total deferred tax assets | 8,795 | 9,087 | ||||||
| Deferred tax assets valuation allowance(1) | 34 | 38 | ||||||
| Deferred tax assets after valuation allowance | $ | 8,761 | $ | 9,049 | ||||
| Gross deferred tax liabilities: | ||||||||
| Non-U.S. operations | $ | 925 | $ | 1,293 | ||||
| Fixed assets | 565 | 275 | ||||||
| Other | 65 | 253 | ||||||
| Total deferred tax liabilities | $ | 1,555 | $ | 1,821 | ||||
| Net deferred tax assets | $ | 7,206 | $ | 7,228 | ||||
| (1) | The valuation allowance reduces the benefit of certain separate Company federal net operating loss and state capital loss carryforwards to the amount that will more likely than not be realized. During 2014, the valuation allowance was decreased by $4 million related to the ability to utilize certain state capital losses. |
| | 286 |
| 2014 | 2013 | 2012 | ||||||||||
| (dollars in millions) | ||||||||||||
| U.S. | $ | 1,805 | $ | 1,738 | $ | (1,165 | ) | |||||
| Non-U.S.(1) | 1,786 | 2,820 | 1,761 | |||||||||
| $ | 3,591 | $ | 4,558 | $ | 596 | |||||||
| (1) | Non-U.S. income is defined as income generated from operations located outside the U.S. |
| 287 | |
| Unrecognized Tax Benefits | ||||
| Balance at December�31, 2011 | $ | 4,045 | ||
| Increase based on tax positions related to the current period | 299 | |||
| Increase based on tax positions related to prior periods | 127 | |||
| Decreases based on tax positions related to prior periods | (21 | ) | ||
| Decreases related to settlements with taxing authorities | (260 | ) | ||
| Decreases related to a lapse of applicable statute of limitations | (125 | ) | ||
| Balance at December�31, 2012 | $ | 4,065 | ||
| Increase based on tax positions related to the current period | $ | 51 | ||
| Increase based on tax positions related to prior periods | 267 | |||
| Decreases based on tax positions related to prior periods | (141 | ) | ||
| Decreases related to settlements with taxing authorities | (146 | ) | ||
| Balance at December�31, 2013 | $ | 4,096 | ||
| Increase based on tax positions related to the current period | $ | 135 | ||
| Increase based on tax positions related to prior periods | 100 | |||
| Decreases based on tax positions related to prior periods | (2,080 | ) | ||
| Decreases related to settlements with taxing authorities | (19 | ) | ||
| Decreases related to a lapse of applicable statute of limitations | (4 | ) | ||
| Balance at December�31, 2014 | $ | 2,228 | ||
| | 288 |
| Jurisdiction | Tax�Year | |||
| U.S. | 1999 | |||
| New York State and City | 2007 | |||
| Hong Kong | 2007 | |||
| U.K. | 2010 | |||
| Japan | 2012 | |||
| 289 | |
| 2014 | Institutional Securities(1) | Wealth Management(2) | Investment Management(2) | Intersegment Eliminations | Total | |||||||||||||||
| (dollars in millions) | ||||||||||||||||||||
| Total non-interest revenues | $ | 17,463 | $ | 12,549 | $ | 2,728 | $ | (200 | ) | $ | 32,540 | |||||||||
| Interest income | 3,389 | 2,516 | 2 | (494 | ) | 5,413 | ||||||||||||||
| Interest expense | 3,981 | 177 | 18 | (498 | ) | 3,678 | ||||||||||||||
| Net interest | (592 | ) | 2,339 | (16 | ) | 4 | 1,735 | |||||||||||||
| Net revenues | $ | 16,871 | $ | 14,888 | $ | 2,712 | $ | (196 | ) | $ | 34,275 | |||||||||
| Income (loss) from continuing operations before income taxes | $ | (58 | ) | $ | 2,985 | $ | 664 | $ | � | $ | 3,591 | |||||||||
| Provision for (benefit from) income taxes(3) | (90 | ) | (207 | ) | 207 | � | (90 | ) | ||||||||||||
| Income from continuing operations | 32 | 3,192 | 457 | � | 3,681 | |||||||||||||||
| Discontinued operations(4): | ||||||||||||||||||||
| Income (loss) from discontinued operations before income taxes | (26 | ) | � | 7 | � | (19 | ) | |||||||||||||
| Provision for (benefit from) income taxes | (7 | ) | � | 2 | � | (5 | ) | |||||||||||||
| Income (loss) from discontinued operations | (19 | ) | � | 5 | � | (14 | ) | |||||||||||||
| Net income | 13 | 3,192 | 462 | � | 3,667 | |||||||||||||||
| Net income applicable to nonredeemable noncontrolling interests | 109 | � | 91 | � | 200 | |||||||||||||||
| Net income (loss) applicable to Morgan Stanley | $ | (96 | ) | $ | 3,192 | $ | 371 | $ | � | $ | 3,467 | |||||||||
| | 290 |
| 2013 | Institutional Securities | Wealth Management(2) | Investment Management(2) | Intersegment Eliminations | Total | |||||||||||||||
| (dollars in millions) | ||||||||||||||||||||
| Total non-interest revenues | $ | 16,620 | $ | 12,268 | $ | 3,060 | $ | (233 | ) | $ | 31,715 | |||||||||
| Interest income | 3,572 | 2,100 | 9 | (472 | ) | 5,209 | ||||||||||||||
| Interest expense | 4,673 | 225 | 10 | (477 | ) | 4,431 | ||||||||||||||
| Net interest | (1,101 | ) | 1,875 | (1 | ) | 5 | 778 | |||||||||||||
| Net revenues | $ | 15,519 | $ | 14,143 | $ | 3,059 | $ | (228 | ) | $ | 32,493 | |||||||||
| Income from continuing operations before income taxes | $ | 946 | $ | 2,604 | $ | 1,008 | $ | � | $ | 4,558 | ||||||||||
| Provision for (benefit from) income taxes | (315 | ) | 910 | 307 | � | 902 | ||||||||||||||
| Income from continuing operations | 1,261 | 1,694 | 701 | � | 3,656 | |||||||||||||||
| Discontinued operations(4): | ||||||||||||||||||||
| Income (loss) from discontinued operations before income taxes | (81 | ) | (1 | ) | 9 | 1 | (72 | ) | ||||||||||||
| Provision for (benefit from) income taxes | (29 | ) | � | � | � | (29 | ) | |||||||||||||
| Income (loss) from discontinued operations | (52 | ) | (1 | ) | 9 | 1 | (43 | ) | ||||||||||||
| Net income | 1,209 | 1,693 | 710 | 1 | 3,613 | |||||||||||||||
| Net income applicable to redeemable noncontrolling interests | 1 | 221 | � | � | 222 | |||||||||||||||
| Net income applicable to nonredeemable noncontrolling interests | 277 | � | 182 | � | 459 | |||||||||||||||
| Net income applicable to Morgan Stanley | $ | 931 | $ | 1,472 | $ | 528 | $ | 1 | $ | 2,932 | ||||||||||
| 291 | |
| 2012 | Institutional Securities(6) | Wealth Management(2)(6) | Investment Management(2) | Intersegment Eliminations | Total | |||||||||||||||
| (dollars in millions) | ||||||||||||||||||||
| Total non-interest revenues | $ | 12,847 | $ | 11,387 | $ | 2,324 | $ | (175 | ) | $ | 26,383 | |||||||||
| Interest income | 4,224 | 1,886 | 10 | (428 | ) | 5,692 | ||||||||||||||
| Interest expense | 5,970 | 326 | 28 | (427 | ) | 5,897 | ||||||||||||||
| Net interest | (1,746 | ) | 1,560 | (18 | ) | (1 | ) | (205 | ) | |||||||||||
| Net revenues | $ | 11,101 | $ | 12,947 | $ | 2,306 | $ | (176 | ) | $ | 26,178 | |||||||||
| Income (loss) from continuing operations before�income taxes | $ | (1,612 | ) | $ | 1,572 | $ | 640 | $ | (4 | ) | $ | 596 | ||||||||
| Provision for (benefit from) income taxes(5) | (985 | ) | 538 | 286 | � | (161 | ) | |||||||||||||
| Income (loss) from continuing operations | (627 | ) | 1,034 | 354 | (4 | ) | 757 | |||||||||||||
| Discontinued operations(4): | ||||||||||||||||||||
| Income (loss) from discontinued operations | (158 | ) | 94 | 13 | 3 | (48 | ) | |||||||||||||
| Provision for (benefit from) income taxes | (36 | ) | 26 | 4 | (1 | ) | (7 | ) | ||||||||||||
| Income (loss) from discontinued operations | (122 | ) | 68 | 9 | 4 | (41 | ) | |||||||||||||
| Net income (loss) | (749 | ) | 1,102 | 363 | � | 716 | ||||||||||||||
| Net income applicable to redeemable noncontrolling interests | 4 | 120 | � | � | 124 | |||||||||||||||
| Net income applicable to nonredeemable noncontrolling interests | 170 | 167 | 187 | � | 524 | |||||||||||||||
| Net income (loss) applicable to Morgan Stanley | $ | (923 | ) | $ | 815 | $ | 176 | $ | � | $ | 68 | |||||||||
| (1) | The Company�s Institutional Securities business segment Net loss in 2014 was primarily driven by higher legal expenses (see Notes 13 and�25). |
| (2) | On October�1, 2014, the Managed Futures business was transferred from the Company�s Wealth Management business segment to the Company�s Investment Management business segment. All prior-period amounts have been recast to conform to the current year�s presentation. |
| (3) | Amounts include discrete net tax benefits of $1,390 million and $839 million attributable to the Company�s Wealth Management and Institutional Securities business segments, respectively (see Note 20). |
| (4) | See Note 1 for discussion of discontinued operations. |
| (5) | Results for 2012 included an out-of-period net tax provision of $107 million, attributable to the Company�s Investment Management business segment, related to the overstatement of deferred tax assets associated with partnership investments in prior years and an out-of-period net tax provision of $50 million, attributable to the Company�s Institutional Securities business segment, related to the overstatement of deferred tax assets associated with repatriated earnings of a foreign subsidiary recorded in prior years (see Note 20). |
| (6) | On January�1, 2013, the International Wealth Management business was transferred from the Company�s Wealth Management business segment to the Equity division within the Company�s Institutional Securities business segment. Accordingly, prior-period amounts have been recast to reflect the International Wealth Management business as part of the Company�s Institutional Securities business segment. |
| Total Assets(1) | Institutional Securities | Wealth Management(2) | Investment Management(2)(3) | Total | ||||||||||||
| (dollars in millions) | ||||||||||||||||
| At December�31, 2014 | $ | 630,341 | $ | 165,147 | $ | 6,022 | $ | 801,510 | ||||||||
| At December�31, 2013 | $ | 668,596 | $ | 156,503 | $ | 7,603 | $ | 832,702 | ||||||||
| (1) | Corporate assets have been fully allocated to the Company�s business segments. |
| (2) | On October�1, 2014, the Managed Futures business was transferred from the Company�s Wealth Management business segment to the Company�s Investment Management business segment. All prior-period amounts have been recast to conform to the current year�s presentation. |
| (3) | On April�1, 2014, the Company deconsolidated approximately $1.6 billion in total assets that were related to certain legal entities associated with a real estate fund sponsored by the Company (see Note 7). |
| | 292 |
| � | Institutional Securities: advisory and equity underwriting�client location, debt underwriting�revenue recording location, sales�and trading�trading desk location. |
| � | Wealth Management: wealth management representatives operate in the Americas. |
| � | Investment Management: client location, except for Merchant Banking and Real Estate Investing businesses, which are based on asset location. |
| Net Revenues | 2014 | 2013 | 2012 | |||||||||
| (dollars�in�millions) | ||||||||||||
| Americas | $ | 25,140 | $ | 23,358 | $ | 20,276 | ||||||
| EMEA | 4,772 | 4,542 | 3,078 | |||||||||
| Asia-Pacific | 4,363 | 4,593 | 2,824 | |||||||||
| Net revenues | $ | 34,275 | $ | 32,493 | $ | 26,178 | ||||||
| Total Assets | At�December�31, 2014 | At�December�31, 2013 | ||||||
| (dollars�in�millions) | ||||||||
| Americas | $ | 622,556 | $ | 632,255 | ||||
| EMEA | 104,152 | 123,008 | ||||||
| Asia-Pacific | 74,802 | 77,439 | ||||||
| Total | $ | 801,510 | $ | 832,702 | ||||
| Book Value(1) | ||||||||||||
| Percent Ownership | December�31, 2014 | December�31, 2013 | ||||||||||
| (dollars in millions) | ||||||||||||
| Mitsubishi UFJ Morgan Stanley Securities Co., Ltd. | 40 | % | $ | 1,415 | $ | 1,610 | ||||||
| Lansdowne Partners(2) | 19.5 | % | 182 | 221 | ||||||||
| Avenue Capital Group(2)(3) | � | 220 | 198 | |||||||||
| (1) | Book value of these investees exceeds the Company�s share of net assets, reflecting equity method intangible assets and equity method goodwill. |
| 293 | |
| (2) | The Company�s ownership interest represents limited partnership interests. The Company is deemed to have significant influence in these limited partnerships, as the Company�s limited partnership interests were above the 3% to 5% threshold for interests that should be accounted for under the equity method. |
| (3) | The Company�s ownership interest represents limited partnership interests in a number of different entities within the Avenue Capital Group. |
| At December�31, | ||||||||
| 2014 | 2013 | |||||||
| (dollars in millions) | ||||||||
| Total assets | $ | 111,053 | $ | 118,108 | ||||
| Total liabilities | 108,263 | 114,648 | ||||||
| Noncontrolling interests | 37 | 13 | ||||||
| 2014 | 2013 | 2012 | ||||||||||
| (dollars in millions) | ||||||||||||
| Net revenues | $ | 2,961 | $ | 3,305 | $ | 2,365 | ||||||
| Income from continuing operations before income taxes | 908 | 1,325 | 333 | |||||||||
| Net income | 595 | 1,459 | 405 | |||||||||
| Net income applicable to MUMSS | 582 | 1,441 | 397 | |||||||||
| | 294 |
| December�31, 2014 | December�31, 2013 | |||||||
| Assets | ||||||||
| Cash and due from banks | $ | 5,068 | $ | 2,296 | ||||
| Deposits with banking subsidiaries | 4,556 | 7,070 | ||||||
| Interest bearing deposits with banks | 1,126 | 6,846 | ||||||
| Trading assets, at fair value | 5,014 | 9,704 | ||||||
| Securities purchased under agreement to resell with affiliates | 41,601 | 33,748 | ||||||
| Advances to subsidiaries: | ||||||||
| Bank and bank holding company | 19,982 | 17,015 | ||||||
| Non-bank | 112,863 | 114,833 | ||||||
| Equity investments in subsidiaries: | ||||||||
| Bank and bank holding company | 24,573 | 24,144 | ||||||
| Non-bank | 34,649 | 34,968 | ||||||
| Other assets | 7,805 | 7,508 | ||||||
| Total assets | $ | 257,237 | $ | 258,132 | ||||
| Liabilities | ||||||||
| Short-term borrowings | $ | 695 | $ | 506 | ||||
| Trading liabilities, at fair value | 4,042 | 1,135 | ||||||
| Payables to subsidiaries | 35,517 | 43,420 | ||||||
| Other liabilities and accrued expenses | 2,342 | 3,312 | ||||||
| Long-term borrowings | 143,741 | 143,838 | ||||||
| Total liabilities | 186,337 | 192,211 | ||||||
| Commitments and contingent liabilities | ||||||||
| Equity | ||||||||
| Preferred stock (see Note 15) | 6,020 | 3,220 | ||||||
| Common stock, $0.01 par value: | ||||||||
| Shares authorized: 3,500,000,000 at December 31, 2014 and December 31, 2013; | ||||||||
| Shares issued: 2,038,893,979 at December 31, 2014 and December 31, 2013; | ||||||||
| Shares outstanding: 1,950,980,142 and 1,944,868,751 at December 31, 2014 and December 31, 2013, respectively | 20 | 20 | ||||||
| Additional paid-in capital | 24,249 | 24,570 | ||||||
| Retained earnings | 44,625 | 42,172 | ||||||
| Employee stock trusts | 2,127 | 1,718 | ||||||
| Accumulated other comprehensive loss | (1,248 | ) | (1,093 | ) | ||||
| Common stock held in treasury, at cost, $0.01 par value: | ||||||||
| Shares outstanding: 87,913,837 and 94,025,228 at December 31, 2014 and December 31, 2013, respectively | (2,766 | ) | (2,968 | ) | ||||
| Common stock issued to employee stock trusts | (2,127 | ) | (1,718 | ) | ||||
| Total shareholders� equity | 70,900 | 65,921 | ||||||
| Total liabilities and equity | $ | 257,237 | $ | 258,132 | ||||
| 295 | |
| 2014 | 2013 | 2012 | ||||||||||
| Revenues: | ||||||||||||
| Dividends from non-bank subsidiaries | $ | 2,641 | $ | 1,113 | $ | 545 | ||||||
| Trading | 601 | (635 | ) | (3,400 | ) | |||||||
| Investments | (1 | ) | � | 2 | ||||||||
| Other | 10 | 27 | 36 | |||||||||
| Total non-interest revenues | 3,251 | 505 | (2,817 | ) | ||||||||
| Interest income | 2,594 | 2,783 | 3,316 | |||||||||
| Interest expense | 3,970 | 4,053 | 5,190 | |||||||||
| Net interest | (1,376 | ) | (1,270 | ) | (1,874 | ) | ||||||
| Net revenues | 1,875 | (765 | ) | (4,691 | ) | |||||||
| Non-interest expenses: | ||||||||||||
| Non-interest expenses | 214 | 185 | 114 | |||||||||
| Income (loss) before provision for (benefit from) income taxes | 1,661 | (950 | ) | (4,805 | ) | |||||||
| Provision for (benefit from) income taxes | (423 | ) | (354 | ) | (1,088 | ) | ||||||
| Net income (loss) before undistributed gain (loss) subsidiaries | 2,084 | (596 | ) | (3,717 | ) | |||||||
| Undistributed gain of subsidiaries | 1,383 | 3,528 | 3,785 | |||||||||
| Net income | 3,467 | 2,932 | 68 | |||||||||
| Other comprehensive income (loss), net of tax: | ||||||||||||
| Foreign currency translation adjustments | (397 | ) | (143 | ) | (128 | ) | ||||||
| Amortization of cash flow hedges | 4 | 4 | 6 | |||||||||
| Change in net unrealized gains (losses) on available for sale securities | 209 | (433 | ) | 28 | ||||||||
| Pension, postretirement and other related adjustments | 29 | (5 | ) | (265 | ) | |||||||
| Comprehensive income (loss) | $ | 3,312 | $ | 2,355 | $ | (291 | ) | |||||
| Net income | $ | 3,467 | $ | 2,932 | $ | 68 | ||||||
| Preferred stock dividends and other | 315 | 277 | 98 | |||||||||
| Earnings (loss) applicable to Morgan Stanley common shareholders | $ | 3,152 | $ | 2,655 | $ | (30 | ) | |||||
| | 296 |
| 2014 | 2013 | 2012 | ||||||||||
| CASH FLOWS FROM OPERATING ACTIVITIES | ||||||||||||
| Net income | $ | 3,467 | $ | 2,932 | $ | 68 | ||||||
| Adjustments to reconcile net income to net cash provided by (used for) operating activities: | ||||||||||||
| Deferred income taxes | 98 | (303 | ) | (1,653 | ) | |||||||
| Compensation payable in common stock and options | 1,260 | 1,180 | 891 | |||||||||
| Amortization | (182 | ) | (47 | ) | 23 | |||||||
| Undistributed gain of subsidiaries | (1,383 | ) | (3,528 | ) | (3,785 | ) | ||||||
| Other operating activities | � | � | (29 | ) | ||||||||
| Changes in assets and liabilities: | ||||||||||||
| Trading assets, net of Trading liabilities | 2,307 | (7,332 | ) | 9,587 | ||||||||
| Other assets | (490 | ) | (165 | ) | 1,235 | |||||||
| Other liabilities and accrued expenses | 488 | (4,192 | ) | 6,637 | ||||||||
| Net cash provided by (used for) operating activities | 5,565 | (11,455 | ) | 12,974 | ||||||||
| CASH FLOWS FROM INVESTING ACTIVITIES | ||||||||||||
| Advances to and investments in subsidiaries | (7,790 | ) | 7,458 | 6,461 | ||||||||
| Securities purchased under agreement to resell with affiliates | (7,853 | ) | 14,745 | 1,864 | ||||||||
| Net cash provided by (used for) investing activities | (15,643 | ) | 22,203 | 8,325 | ||||||||
| CASH FLOWS FROM FINANCING ACTIVITIES | ||||||||||||
| Net proceeds from (payments for) short-term borrowings | 189 | 279 | (872 | ) | ||||||||
| Proceeds from: | ||||||||||||
| Excess tax benefits associated with stock-based awards | 101 | 10 | 42 | |||||||||
| Issuance of preferred stock, net of issuance costs | 2,782 | 1,696 | � | |||||||||
| Issuance of long-term borrowings | 33,031 | 22,944 | 20,582 | |||||||||
| Payments for: | ||||||||||||
| Long-term borrowings | (28,917 | ) | (31,928 | ) | (41,914 | ) | ||||||
| Repurchases of common stock and employee tax withholdings | (1,458 | ) | (691 | ) | (227 | ) | ||||||
| Cash dividends | (904 | ) | (475 | ) | (469 | ) | ||||||
| Net cash provided by (used for) financing activities | 4,824 | (8,165 | ) | (22,858 | ) | |||||||
| Effect of exchange rate changes on cash and cash equivalents | (208 | ) | (100 | ) | (32 | ) | ||||||
| Net increase (decrease) in cash and cash equivalents | (5,462 | ) | 2,483 | (1,591 | ) | |||||||
| Cash and cash equivalents, at beginning of period | 16,212 | 13,729 | 15,320 | |||||||||
| Cash and cash equivalents, at end of period | $ | 10,750 | $ | 16,212 | $ | 13,729 | ||||||
| Cash and cash equivalents include: | ||||||||||||
| Cash and due from banks | $ | 5,068 | $ | 2,296 | $ | 1,342 | ||||||
| Deposits with banking subsidiaries | 4,556 | 7,070 | 8,222 | |||||||||
| Interest bearing deposits with banks | 1,126 | 6,846 | 4,165 | |||||||||
| Cash and cash equivalents, at end of period | $ | 10,750 | $ | 16,212 | $ | 13,729 | ||||||
| 297 | |
| | 298 |
| 2014 Quarter | 2013 Quarter | |||||||||||||||||||||||||||||||
| First | Second(1) | Third(2) | Fourth(3) | First | Second | Third | Fourth(4) | |||||||||||||||||||||||||
| (dollars in millions, except per share data) | ||||||||||||||||||||||||||||||||
| Total non-interest revenues | $ | 8,688 | $ | 8,341 | $ | 8,350 | $ | 7,161 | $ | 7,990 | $ | 8,316 | $ | 7,846 | $ | 7,563 | ||||||||||||||||
| Net interest | 308 | 267 | 557 | 603 | 182 | 204 | 110 | 282 | ||||||||||||||||||||||||
| Net revenues | 8,996 | 8,608 | 8,907 | 7,764 | 8,172 | 8,520 | 7,956 | 7,845 | ||||||||||||||||||||||||
| Total non-interest expenses | 6,626 | 6,676 | 6,687 | 10,695 | 6,572 | 6,725 | 6,591 | 8,047 | ||||||||||||||||||||||||
| Income (loss) from continuing operations before income taxes | 2,370 | 1,932 | 2,220 | (2,931 | ) | 1,600 | 1,795 | 1,365 | (202 | ) | ||||||||||||||||||||||
| Provision for (benefit from) income taxes | 785 | 15 | 463 | (1,353 | ) | 350 | 575 | 363 | (386 | ) | ||||||||||||||||||||||
| Income (loss) from continuing operations | 1,585 | 1,917 | 1,757 | (1,578 | ) | 1,250 | 1,220 | 1,002 | 184 | |||||||||||||||||||||||
| Discontinued operations(5): | ||||||||||||||||||||||||||||||||
| Income (loss) from discontinued operations | (2 | ) | (1 | ) | (8 | ) | (8 | ) | (30 | ) | (42 | ) | 14 | (14 | ) | |||||||||||||||||
| Provision for (benefit from) income taxes | (1 | ) | (1 | ) | (3 | ) | � | (11 | ) | (13 | ) | (2 | ) | (3 | ) | |||||||||||||||||
| Net income (loss) from discontinued operations | (1 | ) | � | (5 | ) | (8 | ) | (19 | ) | (29 | ) | 16 | (11 | ) | ||||||||||||||||||
| Net income (loss) | 1,584 | 1,917 | 1,752 | (1,586 | ) | 1,231 | 1,191 | 1,018 | 173 | |||||||||||||||||||||||
| Net income applicable to redeemable noncontrolling interests | � | � | � | � | 122 | 100 | � | � | ||||||||||||||||||||||||
| Net income applicable to nonredeemable noncontrolling interests | 79 | 18 | 59 | 44 | 147 | 111 | 112 | 89 | ||||||||||||||||||||||||
| Net income (loss) applicable to Morgan Stanley | $ | 1,505 | $ | 1,899 | $ | 1,693 | $ | (1,630 | ) | $ | 962 | $ | 980 | $ | 906 | $ | 84 | |||||||||||||||
| Preferred stock dividends and other | 56 | 79 | 64 | 119 | 26 | 177 | 26 | 48 | ||||||||||||||||||||||||
| Earnings (loss) applicable to Morgan Stanley common shareholders | $ | 1,449 | $ | 1,820 | $ | 1,629 | $ | (1,749 | ) | $ | 936 | $ | 803 | $ | 880 | $ | 36 | |||||||||||||||
| Earnings (loss) per basic common share(6): | ||||||||||||||||||||||||||||||||
| Income (loss) from continuing operations | $ | 0.75 | $ | 0.94 | $ | 0.85 | $ | (0.91 | ) | $ | 0.50 | $ | 0.44 | $ | 0.45 | $ | 0.02 | |||||||||||||||
| Net income (loss) from discontinued operations | � | � | � | � | (0.01 | ) | (0.02 | ) | 0.01 | � | ||||||||||||||||||||||
| Earnings (loss) per basic common share | $ | 0.75 | $ | 0.94 | $ | 0.85 | $ | (0.91 | ) | $ | 0.49 | $ | 0.42 | $ | 0.46 | $ | 0.02 | |||||||||||||||
| Earnings (loss) per diluted common share(6): | ||||||||||||||||||||||||||||||||
| Income (loss) from continuing operations | $ | 0.74 | $ | 0.92 | $ | 0.83 | $ | (0.91 | ) | $ | 0.49 | $ | 0.43 | $ | 0.44 | $ | 0.02 | |||||||||||||||
| Net income (loss) from discontinued operations | � | � | � | � | (0.01 | ) | (0.02 | ) | 0.01 | � | ||||||||||||||||||||||
| Earnings (loss) per diluted common share | $ | 0.74 | $ | 0.92 | $ | 0.83 | $ | (0.91 | ) | $ | 0.48 | $ | 0.41 | $ | 0.45 | $ | 0.02 | |||||||||||||||
| Dividends declared per common share(7) | $ | 0.05 | $ | 0.10 | $ | 0.10 | $ | 0.10 | $ | 0.05 | $ | 0.05 | $ | 0.05 | $ | 0.05 | ||||||||||||||||
| Book value per common share | $ | 32.38 | $ | 33.46 | $ | 34.16 | $ | 33.25 | $ | 31.21 | $ | 31.48 | $ | 32.13 | $ | 32.24 | ||||||||||||||||
| (1) | The second quarter of 2014 included a discrete net tax benefit of $609 million, principally associated with remeasurement of reserves and related interest due to new information regarding the status of a multi-year tax authority examination (see Note 20). |
| (2) | The third quarter of 2014 included a discrete net tax benefit of $237 million, primarily associated with the repatriation of non-U.S. earnings at a cost lower than originally estimated (see Note 20). The third quarter of 2014 also included a gain on sale of a retail property space of $141 million, which was included within Other revenues in the Company�s consolidated statement of income and a gain on sale of its ownership stake in TransMontaigne Inc. |
| (3) | The fourth quarter of�2014 included: an increase of legal reserves of approximately $3.1 billion (see Notes 13 and 25); a discrete net tax benefit of $1,380 million recognized in Provision for (benefit from) income taxes primarily due to the release of a deferred tax liability as a result of an internal Wealth Management business segment restructuring to simplify the Company�s legal entity organization, partially offset by approximately $900 million of tax provision due to the impact of the non-deductible expenses related to litigation and regulatory matters (see Note 20); compensation expense deferral adjustments of $1.1 billion (see Note 18); and a charge of approximately $468 million related to the implementation of FVA (see Note 2), which�was reflected as a reduction of the Company�s Institutional Securities business segment Trading revenues. |
| (4) | The fourth quarter of 2013 included a discrete tax benefit of $192 million, consisting of $100 million related to remeasurement of reserves and related interest and $92 million related to the establishment of a previously unrecognized deferred tax asset associated with the reorganization of certain non-U.S. legal entities (see Note 20). The fourth quarter of 2013 also included litigation expenses of $1.4�billion related to settlements and reserve additions (see Note 13). |
| 299 | |
| (5) | See Note 1 for more information on discontinued operations. |
| (6) | Summation of the quarters� earnings per common share may not equal the annual amounts due to the averaging effect of the number of shares and share equivalents throughout the year. |
| (7) | Beginning with the dividend declared on April�17, 2014, the Company increased the quarterly common stock dividend to $0.10 per share from $0.05 per share. |
| | 300 |
| 2014 | ||||||||||||
| Average Weekly Balance | Interest | Average Rate | ||||||||||
| (dollars in millions) | ||||||||||||
| Assets | ||||||||||||
| Interest earning assets: | ||||||||||||
| Trading assets(1): | ||||||||||||
| U.S. | $ | 104,640 | $ | 1,643 | 1.6 | % | ||||||
| Non-U.S. | 113,580 | 466 | 0.4 | |||||||||
| Investment securities: | ||||||||||||
| U.S. | 62,240 | 613 | 1.0 | |||||||||
| Loans: | ||||||||||||
| U.S. | 53,210 | 1,639 | 3.1 | |||||||||
| Non-U.S. | 357 | 51 | 14.3 | |||||||||
| Interest bearing deposits with banks: | ||||||||||||
| U.S. | 29,273 | 73 | 0.2 | |||||||||
| Non-U.S. | 2,953 | 36 | 1.2 | |||||||||
| Securities purchased under agreements to resell and Securities borrowed(2): | ||||||||||||
| U.S. | 177,444 | (507 | ) | (0.3 | ) | |||||||
| Non-U.S. | 77,139 | 209 | 0.3 | |||||||||
| Customer receivables and Other(3): | ||||||||||||
| U.S. | 73,244 | 655 | 0.9 | |||||||||
| Non-U.S. | 18,635 | 535 | 2.9 | |||||||||
| Total | $ | 712,715 | $ | 5,413 | 0.8 | % | ||||||
| Non-interest earning assets | 114,558 | |||||||||||
| Total assets | $ | 827,273 | ||||||||||
| Liabilities and Equity | ||||||||||||
| Interest bearing liabilities: | ||||||||||||
| Deposits: | ||||||||||||
| U.S. | $ | 118,580 | $ | 94 | 0.1 | % | ||||||
| Non-U.S. | 1,239 | 12 | 1.0 | |||||||||
| Commercial paper and other short-term borrowings(4): | ||||||||||||
| U.S. | 1,356 | � | � | |||||||||
| Non-U.S. | 568 | 4 | 0.7 | |||||||||
| Long-term borrowings(4): | ||||||||||||
| U.S. | 143,118 | 3,572 | 2.5 | |||||||||
| Non-U.S. | 8,771 | 37 | 0.4 | |||||||||
| Trading liabilities(1): | ||||||||||||
| U.S. | 25,587 | � | � | |||||||||
| Non-U.S. | 54,112 | � | � | |||||||||
| Securities sold under agreements to repurchase and Securities loaned(5): | ||||||||||||
| U.S. | 86,063 | 548 | 0.6 | |||||||||
| Non-U.S. | 50,843 | 668 | 1.3 | |||||||||
| Customer payables and Other(6): | ||||||||||||
| U.S. | 119,153 | (1,366 | ) | (1.1 | ) | |||||||
| Non-U.S. | 49,555 | 109 | 0.2 | |||||||||
| Total | $ | 658,945 | $ | 3,678 | 0.6 | |||||||
| Non-interest bearing liabilities and equity | 168,328 | |||||||||||
| Total liabilities and equity | $ | 827,273 | ||||||||||
| Net interest income and net interest rate spread | $ | 1,735 | 0.2 | % | ||||||||
| 301 | |
| 2013 | ||||||||||||
| Average Weekly Balance | Interest | Average Rate | ||||||||||
| (dollars in millions) | ||||||||||||
| Assets | ||||||||||||
| Interest earning assets: | ||||||||||||
| Trading assets(1): | ||||||||||||
| U.S. | $ | 119,549 | $ | 1,948 | 1.6 | % | ||||||
| Non-U.S. | 103,774 | 344 | 0.3 | |||||||||
| Investment securities: | ||||||||||||
| U.S. | 44,112 | 447 | 1.0 | |||||||||
| Loans: | ||||||||||||
| U.S. | 33,939 | 1,052 | 3.1 | |||||||||
| Non-U.S. | 489 | 69 | 14.1 | |||||||||
| Interest bearing deposits with banks: | ||||||||||||
| U.S. | 34,636 | 86 | 0.2 | |||||||||
| Non-U.S. | 7,609 | 43 | 0.6 | |||||||||
| Securities purchased under agreements to resell and Securities borrowed(2): | ||||||||||||
| U.S. | 203,742 | (217 | ) | (0.1 | ) | |||||||
| Non-U.S. | 77,713 | 197 | 0.3 | |||||||||
| Customer receivables and Other(3): | ||||||||||||
| U.S. | 62,028 | 751 | 1.2 | |||||||||
| Non-U.S. | 19,077 | 489 | 2.6 | |||||||||
| Total | $ | 706,668 | $ | 5,209 | 0.7 | % | ||||||
| Non-interest earning assets | 121,793 | |||||||||||
| Total assets | $ | 828,461 | ||||||||||
| Liabilities and Equity | ||||||||||||
| Interest bearing liabilities: | ||||||||||||
| Deposits: | ||||||||||||
| U.S. | $ | 91,713 | $ | 159 | 0.2 | % | ||||||
| Non-U.S. | 260 | � | � | |||||||||
| Commercial paper and other short-term borrowings(4): | ||||||||||||
| U.S. | 964 | 2 | 0.2 | |||||||||
| Non-U.S. | 1,063 | 18 | 1.7 | |||||||||
| Long-term borrowings(4): | ||||||||||||
| U.S. | 152,532 | 3,696 | 2.4 | |||||||||
| Non-U.S. | 9,857 | 62 | 0.6 | |||||||||
| Trading liabilities(1): | ||||||||||||
| U.S. | 31,861 | � | � | |||||||||
| Non-U.S. | 59,200 | � | � | |||||||||
| Securities sold under agreements to repurchase and Securities loaned(5): | ||||||||||||
| U.S. | 108,896 | 681 | 0.6 | |||||||||
| Non-U.S. | 66,697 | 788 | 1.2 | |||||||||
| Customer payables and Other(6): | ||||||||||||
| U.S. | 98,335 | (1,117 | ) | (1.1 | ) | |||||||
| Non-U.S. | 37,679 | 142 | 0.4 | |||||||||
| Total | $ | 659,057 | $ | 4,431 | 0.7 | |||||||
| Non-interest bearing liabilities and equity | 169,404 | |||||||||||
| Total liabilities and equity | $ | 828,461 | ||||||||||
| Net interest income and net interest rate spread | $ | 778 | � | % | ||||||||
| | 302 |
| 2012 | ||||||||||||
| Average Weekly Balance | Interest | Average Rate | ||||||||||
| (dollars in millions) | ||||||||||||
| Assets | ||||||||||||
| Interest earning assets: | ||||||||||||
| Trading assets(1): | ||||||||||||
| U.S. | $ | 133,615 | $ | 2,247 | 1.7 | % | ||||||
| Non-U.S. | 82,019 | $ | 489 | 0.6 | ||||||||
| Investment securities: | ||||||||||||
| U.S. | 35,141 | $ | 343 | 1.0 | ||||||||
| Loans: | ||||||||||||
| U.S. | 20,996 | $ | 597 | 2.8 | ||||||||
| Non-U.S. | 363 | $ | 46 | 12.7 | ||||||||
| Interest bearing deposits with banks: | ||||||||||||
| U.S. | 25,905 | $ | 58 | 0.2 | ||||||||
| Non-U.S. | 10,612 | $ | 66 | 0.6 | ||||||||
| Securities purchased under agreements to resell and Securities borrowed(2): | ||||||||||||
| U.S. | 189,186 | $ | (315 | ) | (0.2 | ) | ||||||
| Non-U.S. | 91,851 | $ | 679 | 0.7 | ||||||||
| Customer receivables and Other(3): | ||||||||||||
| U.S. | 54,651 | $ | 471 | 0.9 | ||||||||
| Non-U.S. | 15,404 | $ | 1,011 | 6.6 | ||||||||
| Total | $ | 659,743 | $ | 5,692 | 0.9 | % | ||||||
| Non-interest earning assets | 122,428 | |||||||||||
| Total assets | $ | 782,171 | ||||||||||
| Liabilities and Equity | ||||||||||||
| Interest bearing liabilities: | ||||||||||||
| Deposits: | ||||||||||||
| U.S. | $ | 69,265 | $ | 181 | 0.3 | % | ||||||
| Non-U.S. | 165 | $ | � | � | ||||||||
| Commercial paper and other short-term borrowings(4): | ||||||||||||
| U.S. | 557 | $ | 5 | 0.9 | ||||||||
| Non-U.S. | 1,383 | $ | 33 | 2.4 | ||||||||
| Long-term borrowings(4): | ||||||||||||
| U.S. | 163,961 | $ | 4,544 | 2.8 | ||||||||
| Non-U.S. | 7,552 | $ | 78 | 1.0 | ||||||||
| Trading liabilities(1): | ||||||||||||
| U.S. | 38,125 | $ | � | � | ||||||||
| Non-U.S. | 51,834 | $ | � | � | ||||||||
| Securities sold under agreements to repurchase and Securities loaned(5): | ||||||||||||
| U.S. | 101,210 | $ | 522 | 0.5 | ||||||||
| Non-U.S. | 59,932 | $ | 1,283 | 2.1 | ||||||||
| Customer payables and Other(6): | ||||||||||||
| U.S. | 82,881 | $ | (1,475 | ) | (1.8 | ) | ||||||
| Non-U.S. | 33,992 | $ | 726 | 2.1 | ||||||||
| Total | $ | 610,857 | $ | 5,897 | 1.0 | |||||||
| Non-interest bearing liabilities and equity | 171,314 | |||||||||||
| Total liabilities and equity | $ | 782,171 | ||||||||||
| Net interest income and net interest rate spread | $ | (205 | ) | (0.1 | )% | |||||||
| (1) | Interest expense on Trading liabilities is reported as a reduction of Interest income on Trading assets. |
| (2) | Includes fees paid on securities borrowed. |
| (3) | Includes interest from customer receivables and other interest earning assets. |
| (4) | The Company also issues structured notes that have coupon or repayment terms linked to the performance of debt or equity securities, indices, currencies or commodities, which are recorded within Trading revenues (see Note 4). |
| (5) | Includes fees received on securities loaned. |
| (6) | Includes fees received from prime brokerage customers for stock loan transactions incurred to cover customers� short positions. |
| 303 | |
| 2014�versus�2013 | ||||||||||||
| Increase�(decrease)�due�to�change�in: | ||||||||||||
| Volume | Rate | Net�Change | ||||||||||
| (dollars in millions) | ||||||||||||
| Interest earning assets | ||||||||||||
| Trading assets: | ||||||||||||
| U.S. | $ | (243 | ) | $ | (62 | ) | $ | (305 | ) | |||
| Non-U.S. | 33 | 89 | 122 | |||||||||
| Investment securities: | ||||||||||||
| U.S. | 184 | (18 | ) | 166 | ||||||||
| Loans: | ||||||||||||
| U.S. | 597 | (10 | ) | 587 | ||||||||
| Non-U.S. | (19 | ) | 1 | (18 | ) | |||||||
| Interest bearing deposits with banks: | ||||||||||||
| U.S. | (13 | ) | � | (13 | ) | |||||||
| Non-U.S. | (26 | ) | 19 | (7 | ) | |||||||
| Securities purchased under agreements to resell and Securities borrowed: | ||||||||||||
| U.S. | 28 | (318 | ) | (290 | ) | |||||||
| Non-U.S. | (1 | ) | 13 | 12 | ||||||||
| Customer receivables and Other: | ||||||||||||
| U.S. | 136 | (232 | ) | (96 | ) | |||||||
| Non-U.S. | (11 | ) | 57 | 46 | ||||||||
| Change in interest income | $ | 665 | $ | (461 | ) | $ | 204 | |||||
| Interest bearing liabilities | ||||||||||||
| Deposits: | ||||||||||||
| U.S. | $ | 47 | $ | (112 | ) | $ | (65 | ) | ||||
| Non-U.S. | � | 12 | 12 | |||||||||
| Commercial paper and other short-term borrowings: | ||||||||||||
| U.S. | 1 | (3 | ) | (2 | ) | |||||||
| Non-U.S. | (8 | ) | (6 | ) | (14 | ) | ||||||
| Long-term borrowings: | ||||||||||||
| U.S. | (228 | ) | 104 | (124 | ) | |||||||
| Non-U.S. | (7 | ) | (18 | ) | (25 | ) | ||||||
| Securities sold under agreements to repurchase and Securities loaned: | ||||||||||||
| U.S. | (143 | ) | 10 | (133 | ) | |||||||
| Non-U.S. | (187 | ) | 67 | (120 | ) | |||||||
| Customer payables and Other: | ||||||||||||
| U.S. | (236 | ) | (13 | ) | (249 | ) | ||||||
| Non-U.S. | 45 | (78 | ) | (33 | ) | |||||||
| Change in interest expense | $ | (716 | ) | $ | (37 | ) | $ | (753 | ) | |||
| Change in net interest income | $ | 1,381 | $ | (424 | ) | $ | 957 | |||||
| | 304 |
| 2013�versus�2012 | ||||||||||||
| Increase�(decrease)�due�to�change�in: | ||||||||||||
| Volume | Rate | Net�Change | ||||||||||
| (dollars in millions) | ||||||||||||
| Interest earning assets | ||||||||||||
| Trading assets: | ||||||||||||
| U.S. | $ | (237 | ) | $ | (62 | ) | $ | (299 | ) | |||
| Non-U.S. | 130 | (275 | ) | (145 | ) | |||||||
| Investment securities: | ||||||||||||
| U.S. | 88 | 16 | 104 | |||||||||
| Loans: | ||||||||||||
| U.S. | 368 | 87 | 455 | |||||||||
| Non-U.S. | 16 | 7 | 23 | |||||||||
| Interest bearing deposits with banks: | ||||||||||||
| U.S. | 20 | 8 | 28 | |||||||||
| Non-U.S. | (19 | ) | (4 | ) | (23 | ) | ||||||
| Securities purchased under agreements to resell and Securities borrowed: | ||||||||||||
| U.S. | (24 | ) | 122 | 98 | ||||||||
| Non-U.S. | (105 | ) | (377 | ) | (482 | ) | ||||||
| Customer receivables and Other: | ||||||||||||
| U.S. | 64 | 216 | 280 | |||||||||
| Non-U.S. | 241 | (763 | ) | (522 | ) | |||||||
| Change in interest income | $ | 542 | $ | (1,025 | ) | $ | (483 | ) | ||||
| Interest bearing liabilities | ||||||||||||
| Deposits: | ||||||||||||
| U.S. | $ | 59 | $ | (81 | ) | $ | (22 | ) | ||||
| Commercial paper and other short-term borrowings: | ||||||||||||
| U.S. | 4 | (7 | ) | (3 | ) | |||||||
| Non-U.S. | (8 | ) | (7 | ) | (15 | ) | ||||||
| Long-term borrowings: | ||||||||||||
| U.S. | (317 | ) | (531 | ) | (848 | ) | ||||||
| Non-U.S. | 24 | (40 | ) | (16 | ) | |||||||
| Securities sold under agreements to repurchase and Securities loaned: | ||||||||||||
| U.S. | 40 | 119 | 159 | |||||||||
| Non-U.S. | 145 | (640 | ) | (495 | ) | |||||||
| Customer payables and Other: | ||||||||||||
| U.S. | (276 | ) | 634 | 358 | ||||||||
| Non-U.S. | 79 | (663 | ) | (584 | ) | |||||||
| Change in interest expense | $ | (250 | ) | $ | (1,216 | ) | $ | (1,466 | ) | |||
| Change in net interest income | $ | 792 | $ | 191 | $ | 983 | ||||||
| 305 | |
| Average Deposits(1) | ||||||||||||||||||||||||
| 2014 | 2013 | 2012 | ||||||||||||||||||||||
| Average Amount(1) | Average Rate | Average Amount(1) | Average Rate | Average Amount(1) | Average Rate | |||||||||||||||||||
| (dollars in�millions) | ||||||||||||||||||||||||
| Deposits(2): | ||||||||||||||||||||||||
| Savings deposits | $ | 118,086 | 0.1 | % | $ | 90,447 | 0.1 | % | $ | 66,073 | 0.1 | % | ||||||||||||
| Time deposits | 1,733 | 0.7 | % | 1,526 | 3.9 | % | 3,357 | 2.6 | % | |||||||||||||||
| Total | $ | 119,819 | 0.1 | % | $ | 91,973 | 0.2 | % | $ | 69,430 | 0.3 | % | ||||||||||||
| (1) | The Company calculates its average balances based upon weekly amounts, except where weekly balances are unavailable, month-end balances are used. |
| (2) | Deposits are primarily located in U.S. offices. |
| 2014 | 2013 | 2012 | ||||||||||
| Net income to average assets | 0.4 | % | 0.4 | % | N/M | |||||||
| Return on average common equity(1) | 4.8 | % | 4.3 | % | N/M | |||||||
| Return on total equity(2) | 4.9 | % | 4.6 | % | 0.1 | % | ||||||
| Dividend payout ratio(3) | 21.9 | % | 14.7 | % | N/M | |||||||
| Total average common equity to average assets | 7.9 | % | 7.5 | % | 7.8 | % | ||||||
| Total average equity to average assets | 8.5 | % | 7.7 | % | 8.0 | % | ||||||
| (1) | Percentage is based on net income applicable to Morgan Stanley less preferred dividends as a percentage of average common equity. |
| (2) | Percentage is based on net income as a percentage of average total equity. |
| (3) | Percentage is based on dividends declared per common share as a percentage of net income per diluted share. |
| 2014 | 2013 | 2012 | ||||||||||
| (dollars in millions) | ||||||||||||
| Securities sold under repurchase agreements: | ||||||||||||
| Period-end balance | $ | 69,949 | $ | 145,676 | $ | 122,674 | ||||||
| Average balance(1)(2) | 103,640 | 136,151 | 125,465 | |||||||||
| Maximum balance at any month-end | 129,265 | 145,676 | 139,962 | |||||||||
| Weighted average interest rate during the period(3) | 0.8 | % | 0.7 | % | 0.9 | % | ||||||
| Weighted average interest rate on period-end balance(4) | 0.7 | % | 0.4 | % | 0.8 | % | ||||||
| Securities loaned: | ||||||||||||
| Period-end balance | $ | 25,219 | $ | 32,799 | $ | 36,849 | ||||||
| Average balance(1)(2) | 33,266 | 39,442 | 35,677 | |||||||||
| Maximum balance at any month-end | 35,700 | 44,182 | 39,881 | |||||||||
| Weighted average interest rate during the period(3) | 1.3 | % | 1.2 | % | 1.9 | % | ||||||
| Weighted average interest rate on period-end balance(4) | 1.6 | % | 1.2 | % | 1.5 | % | ||||||
| (1) | The Company calculates its average balances based upon weekly amounts, except where weekly balances are unavailable, month-end balances are used. |
| (2) | In 2014, period-end balance was lower than the annual average balance primarily due to a decrease in the Company�s assets. |
| (3) | The approximated weighted average interest rate was calculated using (a)�interest expense incurred on all securities sold under repurchase agreements and securities loaned transactions, whether or not such transactions were reported on the Company�s consolidated |
| | 306 |
| statements of financial condition and (b)�average balances that were reported on a net basis where certain criteria were met in accordance with applicable offsetting guidance. In addition, securities-for-securities transactions in which the Company was the borrower were not included in the average balances since they were not reported on the Company�s consolidated statements of financial condition. |
| (4) | The approximated weighted average interest rate was calculated using (a)�interest expense for all securities sold under repurchase agreements and securities loaned transactions, whether or not such transactions were reported in the Company�s consolidated statements of financial condition and (b)�period-end balances that were reported on a net basis where certain criteria were met in accordance with applicable offsetting guidance. In addition, securities-for-securities transactions in which the Company was the borrower were not included in the period-end balances since they were not reported in the Company�s consolidated statements of financial condition. |
| At December 31, 2014 | ||||||||||||||||
| Country | Banks | Governments | Other(1) | Total | ||||||||||||
| (dollars in millions) | ||||||||||||||||
| United Kingdom | $ | 8,514 | $ | 948 | $ | 60,025 | $ | 69,487 | ||||||||
| Cayman Islands | 144 | � | 43,472 | 43,616 | ||||||||||||
| Japan | 14,860 | 5,645 | 22,976 | 43,481 | ||||||||||||
| France | 18,838 | 218 | 7,940 | 26,996 | ||||||||||||
| Germany | 6,650 | 6,679 | 7,295 | 20,624 | ||||||||||||
| Singapore | 2,117 | 7,761 | 806 | 10,684 | ||||||||||||
| China | 1,738 | 3,259 | 5,610 | 10,607 | ||||||||||||
| Canada | 2,741 | 286 | 6,955 | 9,982 | ||||||||||||
| South Korea | 149 | 6,081 | 3,733 | 9,963 | ||||||||||||
| Ireland | 304 | 20 | 8,996 | 9,320 | ||||||||||||
| Netherlands | 910 | � | 7,399 | 8,309 | ||||||||||||
| At December 31, 2013 | ||||||||||||||||
| Country | Banks | Governments | Other(1) | Total | ||||||||||||
| (dollars in millions) | ||||||||||||||||
| United Kingdom | $ | 11,874 | $ | 911 | $ | 57,594 | $ | 70,379 | ||||||||
| Japan | 27,251 | 3,622 | 26,426 | 57,299 | ||||||||||||
| Cayman Islands | 1 | � | 45,041 | 45,042 | ||||||||||||
| Germany | 8,844 | 10,312 | 10,613 | 29,769 | ||||||||||||
| France | 22,408 | 264 | 6,247 | 28,919 | ||||||||||||
| Canada | 2,988 | 2,012 | 7,108 | 12,108 | ||||||||||||
| Netherlands | 1,474 | � | 10,015 | 11,489 | ||||||||||||
| South Korea | 65 | 4,307 | 3,376 | 7,748 | ||||||||||||
| 307 | |
| At December 31, 2012 | ||||||||||||||||
| Country | Banks | Governments | Other(1) | Total | ||||||||||||
| (dollars in millions) | ||||||||||||||||
| United Kingdom | $ | 17,504 | $ | 6 | $ | 100,090 | $ | 117,600 | ||||||||
| Cayman Islands | 5 | 10 | 41,628 | 41,643 | ||||||||||||
| France | 28,699 | 149 | 3,915 | 32,763 | ||||||||||||
| Japan | 24,935 | 148 | 2,967 | 28,050 | ||||||||||||
| Germany | 15,084 | 3,014 | 4,192 | 22,290 | ||||||||||||
| Netherlands | 1,700 | � | 10,920 | 12,620 | ||||||||||||
| Canada | 6,651 | 1,310 | 2,893 | 10,854 | ||||||||||||
| South Korea | 32 | 6,812 | 2,311 | 9,155 | ||||||||||||
| Switzerland | 3,319 | 242 | 5,483 | 9,044 | ||||||||||||
| Luxemburg | 221 | 223 | 7,952 | 8,396 | ||||||||||||
| (1) | Other includes Non-banking financial institutions and others in 2014, 2013 and 2012. |
| | 308 |
| Item�9. | Changes in and Disagreements with Accountants on Accounting and Financial Disclosure. |
| Item�9A. | Controls and Procedures. |
| � | Pertain to the maintenance of records that, in reasonable detail, accurately and fairly reflect the transactions and dispositions of the assets of the Company; |
| � | Provide reasonable assurance that transactions are recorded as necessary to permit preparation of financial statements in accordance with generally accepted accounting principles in the United States, and that our receipts and expenditures are being made only in accordance with authorizations of the Company�s management and directors; and |
| � | Provide reasonable assurance regarding prevention or timely detection of unauthorized acquisition, use or disposition of our assets that could have a material effect on our financial statements. |
| 309 | |
| 310 |
| Item�9B. | Other Information. |
| 311 | |
| Item�10. | Directors, Executive Officers and Corporate Governance. |
| � | �Item 1�Election of Directors�Director Nominees� |
| � | �Corporate Governance�Board Meetings and Committees� |
| � | �Beneficial Ownership of Company Common Stock�Section 16(a) Beneficial Ownership Reporting Compliance� |
| Item�11. | Executive Compensation. |
| � | �Corporate Governance�Director Compensation� |
| � | �Executive Compensation� |
| | 312 |
| Item�12. | Security Ownership of Certain Beneficial Owners and Management and Related Stockholder Matters. |
| Item�13. | Certain Relationships and Related Transactions, and Director Independence. |
| � | �Corporate Governance�Related Person Transactions Policy� |
| � | �Corporate Governance�Certain Transactions� |
| � | �Corporate Governance�Director Independence� |
| Item�14. | Principal Accountant Fees and Services. |
| � | �Item 2�Ratification of Appointment of Morgan Stanley�s Independent Auditor� (excluding the information under the subheading �Audit Committee Report�) |
| | 313 |
| Item�15. | Exhibits and Financial Statement Schedules. |
| � | The consolidated financial statements required to be filed in this Annual Report on Form 10-K are included in Part II, Item�8 hereof. |
| � | An exhibit index has been filed as part of this report beginning on page E-1 and is incorporated herein by reference. |
| 314 | |
| M ORGAN S TANLEY ( REGISTRANT ) | ||
| By: | /s/�����J AMES P. G ORMAN | |
| (James P. Gorman) | ||
| Chairman of the Board and Chief Executive Officer | ||
| Signature | Title | |
| / S /����J AMES P. G ORMAN (James P. Gorman) | Chairman of the Board and Chief Executive Officer (Principal Executive Officer) | |
| / S /����R UTH P ORAT (Ruth Porat) | Executive Vice President and Chief Financial Officer (Principal Financial Officer) | |
| / S /����P AUL C. W IRTH (Paul C. Wirth) | Deputy Chief Financial Officer (Principal Accounting Officer) | |
| / S /����E RSKINE B. B OWLES (Erskine B. Bowles) | Director | |
| / S /����H OWARD J. D AVIES (Howard J. Davies) | Director | |
| / S /����T HOMAS H. G LOCER (Thomas H. Glocer) | Director | |
| / S /����R OBERT H. H ERZ (Robert H. Herz) | Director | |
| / S /����C. R OBERT K IDDER (C. Robert Kidder) | Director | |
| S-1 |
Table of Contents| Signature | Title | |
| / S /����K LAUS K LEINFELD (Klaus Kleinfeld) | Director | |
| / S /����J AMI M ISCIK (Jami Miscik) | Director | |
| / S /����D ONALD T. N ICOLAISEN (Donald T. Nicolaisen) | Director | |
| / S /����H UTHAM S. O LAYAN (Hutham S. Olayan) | Director | |
| / S /����J AMES W. O WENS (James W. Owens) | Director | |
| / S /����R YOSUKE T AMAKOSHI (Ryosuke Tamakoshi) | Director | |
| / S /����M ASAAKI T ANAKA (Masaaki Tanaka) | Director | |
| / S /����L AURA D� ANDREA T YSON (Laura D�Andrea Tyson) | Director | |
| / S /����R AYFORD W ILKINS , J R . (Rayford Wilkins, Jr.) | Director | |
| | S-2 |
Table of Contents Exhibit Index Certain of the following exhibits, as indicated parenthetically, were
previously filed as exhibits to registration statements filed by Morgan Stanley or its predecessor companies under the Securities Act or to reports or registration statements filed by Morgan Stanley or its predecessor companies under the Exchange
Act and are hereby incorporated by reference to such statements or reports. Morgan Stanley�s Exchange Act file number is 1-11758. The Exchange Act file number of Morgan Stanley Group Inc., a predecessor
company (�MSG�), was 1-9085. 1 | Exhibit No. | Description | |
| 2.1 | Amended and Restated Joint Venture Contribution and Formation Agreement dated as of May 29, 2009 by and among Citigroup Inc. and Morgan Stanley and Morgan Stanley Smith Barney Holdings LLC (Exhibit 10.1 to Morgan Stanley�s Current Report on Form 8-K dated May 29, 2009). | |
| 2.2 | Integration and Investment Agreement dated as of March 30, 2010 by and between Mitsubishi UFJ Financial Group, Inc. and Morgan Stanley (Exhibit 2.2 to Morgan Stanley�s Quarterly Report on Form 10-Q for the quarter ended June 30, 2011). | |
| 3.1 | Amended and Restated Certificate of Incorporation of Morgan Stanley, as amended to date (Exhibit 3 to Morgan Stanley�s Quarterly Report on Form 10-Q for the quarter ended June 30, 2009), as amended by the Certificate of Elimination of Series B Non-Cumulative Non-Voting Perpetual Convertible Preferred Stock (Exhibit 3.1 Morgan Stanley�s Current Report on Form 8-K dated July 20, 2011), as amended by the Certificate of Merger of Domestic Corporations dated December 29, 2011 (Exhibit 3.3 to Morgan Stanley�s Annual Report on Form 10-K for the year ended December 31, 2012), as amended by the Certificate of Designation of Preferences and Rights of the Fixed-to-Floating Rate Non-Cumulative Preferred Stock, Series E (Exhibit 2.5 to Morgan Stanley�s Registration Statement on Form 8-A dated September 27, 2013), as amended by the Certificate of Designation of Preferences and Rights of the Fixed-to-Floating Rate Non-Cumulative Preferred Stock, Series F (Exhibit 2.3 to Morgan Stanley�s Registration Statement on Form 8-A dated December 9, 2013), as amended by the Certificate of Designation of Preferences and Rights of the 6.625% Non-Cumulative Preferred Stock, Series G (Exhibit 2.3 to Morgan Stanley�s Registration Statement on Form 8-A dated April 28, 2014), as amended by the Certificate of Designation of Preferences and Rights of the Fixed-to-Floating Rate Non- Cumulative Preferred Stock, Series H (Exhibits 3.2 and 4.2 to Morgan Stanley�s Registration Statement on Form 8-K dated April 29, 2014), as amended by the Certificate of Designation of Preferences and Rights of the Fixed-to-Floating Rate Non-Cumulative Preferred Stock, Series I (Exhibit 2.3 to Morgan Stanley�s Registration Statement on Form 8-A dated September 17, 2014). | |
| 3.2 | Amended and Restated Bylaws of Morgan Stanley, as amended to date (Exhibit 3.1 to Morgan Stanley�s Current Report on Form 8-K dated March 9, 2010). | |
| 4.1 | Indenture dated as of February�24, 1993 between Morgan Stanley and The Bank of New York, as trustee (Exhibit 4 to Morgan Stanley�s Registration Statement on Form S-3 (No. 33-57202)). | |
| 4.2 | Amended and Restated Senior Indenture dated as of May�1, 1999 between Morgan Stanley and The Bank of New York, as trustee (Exhibit 4-e to Morgan Stanley�s Registration Statement on Form�S-3/A (No. 333-75289) as amended by Fourth Supplemental Senior Indenture dated as of October 8, 2007 (Exhibit 4.3 to Morgan Stanley�s Annual Report on Form 10-K for the fiscal year ended November 30, 2007). | |
| (1) | For purposes of this Exhibit Index, references to �The Bank of New York� mean in some instances the entity successor to JPMorgan Chase Bank, N.A. or J.P. Morgan Trust Company, National Association; references to �JPMorgan Chase Bank, N.A.� mean the entity formerly known as The Chase Manhattan Bank, in some instances as the successor to Chemical Bank; references to �J.P. Morgan Trust Company, N.A.� mean the entity formerly known as Bank One Trust Company, N.A., as successor to The First National Bank of Chicago. |
| E-1 | |
| Exhibit No. | Description | |
| 4.3 | Senior Indenture dated as of November�1, 2004 between Morgan Stanley and The Bank of New York, as trustee (Exhibit 4-f to Morgan Stanley�s Registration Statement on Form S-3/A (No.�333-117752), as amended by First Supplemental Senior Indenture dated as of September 4, 2007 (Exhibit 4.5 to Morgan Stanley�s Annual Report on Form 10-K for the fiscal year ended November 30, 2007), Second Supplemental Senior Indenture dated as of January 4, 2008 (Exhibit 4.1 to Morgan Stanley�s Current Report on Form 8-K dated January 4, 2008), Third Supplemental Senior Indenture dated as of September 10, 2008 (Exhibit 4 to Morgan Stanley�s Quarterly Report on Form 10-Q for the quarter ended August 31, 2008), Fourth Supplemental Senior Indenture dated as of December 1, 2008. | |
| (Exhibit�4.1 to Morgan Stanley�s Current Report on Form 8-K dated December 1, 2008), Fifth Supplemental Senior Indenture dated as of April 1, 2009 (Exhibit 4 to Morgan Stanley�s Quarterly Report on Form 10-Q for the quarter ended March 31, 2009), Sixth Supplemental Senior Indenture dated as of September 16, 2011 (Exhibit 4.1 to Morgan Stanley�s Quarterly Report on Form 10-Q for the quarter ended September 30, 2011), Seventh Supplemental Senior Indenture dated as of November�21, 2011 (Exhibit 4.4 to Morgan Stanley�s Annual Report on Form 10-K for the year ended December 31, 2011), Eighth Supplemental Senior Indenture dated as of May 4, 2012 (Exhibit�4.1 to Morgan Stanley�s Quarterly Report on Form 10-Q for the quarter ended June 30, 2012), and Ninth Supplemental Senior Indenture dated as of March 10, 2014 (Exhibit 4.1 to Morgan Stanley�s Quarterly Report on Form 10-Q for the quarter ended March 31, 2014). | ||
| 4.4 | The Unit Agreement Without Holders� Obligations, dated as of August 29, 2008, between Morgan Stanley and The Bank of New York Mellon, as Unit Agent, as Trustee and Paying Agent under the Senior Indenture referred to therein and as Warrant Agent under the Warrant Agreement referred to therein (Exhibit 4.1 to Morgan Stanley�s Current Report on Form 8-K dated August 29, 2008). | |
| 4.5 | Amended and Restated Subordinated Indenture dated as of May�1, 1999 between Morgan Stanley and The Bank of New York, as trustee (Exhibit 4-f to Morgan Stanley�s Registration Statement on Form�S-3/A (No. 333-75289)). | |
| 4.6 | Subordinated Indenture dated as of October�1, 2004 between Morgan Stanley and The Bank of New�York, as trustee (Exhibit 4-g to Morgan Stanley�s Registration Statement on Form S-3/A (No.�333-117752)). | |
| 4.7 | Junior Subordinated Indenture dated as of March�1, 1998 between Morgan Stanley and The Bank of New York, as trustee (Exhibit 4.1 to Morgan Stanley�s Quarterly Report on Form 10-Q for the quarter ended February�28, 1998). | |
| 4.8 | Junior Subordinated Indenture dated as of October�1, 2004 between Morgan Stanley and The Bank of New York, as trustee (Exhibit 4-ww to Morgan Stanley�s Registration Statement on Form S-3/A (No.�333-117752)). | |
| 4.9 | Junior Subordinated Indenture dated as of October�12, 2006 between Morgan Stanley and The Bank of New York, as trustee (Exhibit 4.1 to Morgan Stanley�s Current Report on Form 8-K dated October�12, 2006). | |
| 4.10 | Deposit Agreement dated as of July�6, 2006 among Morgan Stanley, JPMorgan Chase Bank, N.A. and the holders from time to time of the depositary receipts described therein (Exhibit 4.3 to Morgan Stanley�s Quarterly Report on Form 10-Q for the quarter ended May�31, 2006). | |
| 4.11 | Depositary Receipt for Depositary Shares, representing Floating Rate Non-Cumulative Preferred Stock, Series A (included in Exhibit 4.10 hereto). | |
| 4.12 | Amended and Restated Trust Agreement of Morgan Stanley Capital Trust III dated as of February 27, 2003 among Morgan Stanley, as depositor, The Bank of New York, as property trustee, The Bank of New York (Delaware), as Delaware trustee, and the administrators named therein (Exhibit 4 to Morgan Stanley�s Quarterly Report on Form 10-Q for the quarter ended February 28, 2003). | |
| | E-2 |
| Exhibit No. | Description | |
| 4.13 | Amended and Restated Trust Agreement of Morgan Stanley Capital Trust IV dated as of April 21, 2003 among Morgan Stanley, as depositor, The Bank of New York, as property trustee, The Bank of New York (Delaware), as Delaware Trustee and the administrators named therein (Exhibit 4 to Morgan Stanley�s Quarterly Report on Form 10-Q for the quarter ended May 31, 2003). | |
| 4.14 | Amended and Restated Trust Agreement of Morgan Stanley Capital Trust V dated as of July 16, 2003 among Morgan Stanley, as depositor, The Bank of New York, as property trustee, The Bank of New�York (Delaware), as Delaware trustee and the administrators named therein (Exhibit 4 to Morgan Stanley�s Quarterly Report on Form 10-Q for the quarter ended August 31, 2003). | |
| 4.15 | Amended and Restated Trust Agreement of Morgan Stanley Capital Trust VI dated as of January 26, 2006 among Morgan Stanley, as depositor, The Bank of New York, as property trustee, The Bank of New York (Delaware), as Delaware trustee and the administrators named therein (Exhibit 4 to Morgan Stanley�s Quarterly Report on Form 10-Q for the quarter ended February 28, 2006). | |
| 4.16 | Amended and Restated Trust Agreement of Morgan Stanley Capital Trust VII dated as of October 12, 2006 among Morgan Stanley, as depositor, The Bank of New York, as property trustee, The Bank of New York (Delaware), as Delaware trustee and the administrators named therein (Exhibit 4.3 to Morgan Stanley�s Current Report on Form 8-K dated October 12, 2006). | |
| 4.17 | Amended and Restated Trust Agreement of Morgan Stanley Capital Trust VIII dated as of April 26, 2007 among Morgan Stanley, as depositor, The Bank of New York, as property trustee, The Bank of New York (Delaware), as Delaware trustee and the administrators named therein (Exhibit 4.3 to Morgan Stanley�s Current Report on Form 8-K dated April 26, 2007). | |
| 4.18 | Instruments defining the Rights of Security Holders, Including Indentures�Except as set forth in Exhibits 4.1 through 4.17 above, the instruments defining the rights of holders of long-term debt securities of Morgan Stanley and its subsidiaries are omitted pursuant to Section (b)(4)(iii) of Item�601 of Regulation S-K. Morgan Stanley hereby agrees to furnish copies of these instruments to the SEC upon request. | |
| 10.1 | Amended and Restated Trust Agreement dated as of October 18, 2011 by and between Morgan Stanley and State Street Bank and Trust Company (Exhibit 10.1 to Morgan Stanley�s Annual Report on Form 10-K for the year ended December 31, 2011). | |
| 10.2 | Transaction Agreement dated as of April 21, 2011 between Morgan Stanley and Mitsubishi UFJ Financial Group, Inc. (Exhibit 10.1 to Morgan Stanley�s Current Report on Form 8-K dated April 21, 2011). | |
| 10.3 | Amended and Restated Investor Agreement dated as of June 30, 2011 by and between Morgan Stanley and Mitsubishi UFJ Financial Group, Inc. (Exhibit 10.1 to Morgan Stanley�s Current Report on Form 8-K dated June 30, 2011), as amended by Third Amendment, dated October 3, 2013 (Exhibit�10.1 to Morgan Stanley�s Quarterly Report on Form 10-Q for the quarter ended September�30, 2013). | |
| 10.4� | Morgan Stanley 401(k) Plan, amended and restated as of January 1, 2013 (Exhibit 10.6 to Morgan Stanley Annual Report on Form 10-K for the year ended December 31, 2012), as amended by Amendment (Exhibit 10. 5 to Morgan Stanley�s Annual Report on Form 10-K for the year ended December 31, 2013) and Amendment (Exhibit 10.6 to Morgan Stanley�s Annual Report on Form 10-K for the year ended December 31, 2013). | |
| 10.5�* | Amendment to Morgan Stanley 401(k) Plan, dated as of December 19, 2014. | |
| 10.6� | Tax Deferred Equity Participation Plan as amended and restated as of November 26, 2007 (Exhibit�10.9 to Morgan Stanley�s Annual Report on Form 10-K for the fiscal year ended November�30, 2007). | |
| 10.7� | Directors� Equity Capital Accumulation Plan as amended and restated as of March 22, 2012 (Exhibit�10.2 to Morgan Stanley�s Current Report on Form 8-K dated May 15, 2012). | |
| E-3 | |
| Exhibit No. | Description | |
| 10.8� | Select Employees� Capital Accumulation Program as amended and restated as of May 7, 2008 (Exhibit 10.1 to Morgan Stanley�s Quarterly Report on Form 10-Q for the quarter ended May 31, 2008). | |
| 10.9� | Form of Term Sheet under the Select Employees� Capital Accumulation Program (Exhibit 10.9 to Morgan Stanley�s Quarterly Report on Form 10-Q for the quarter ended February�29, 2008). | |
| 10.10� | Employees� Equity Accumulation Plan as amended and restated as of November 26, 2007 (Exhibit�10.12 to Morgan Stanley�s Annual Report on Form 10-K for the fiscal year ended November�30, 2007). | |
| 10.11� | Employee Stock Purchase Plan as amended and restated as of February�1, 2009 (Exhibit 10.20 to Morgan Stanley�s Annual Report on Form 10-K for the fiscal year ended November�30, 2008). | |
| 10.12� | Morgan Stanley Supplemental Executive Retirement and Excess Plan, amended and restated effective December 31, 2008 (Exhibit 10.2 to Morgan Stanley�s Quarterly Report on Form 10-Q for the quarter ended March 31, 2009) as amended by Amendment (Exhibit 10.5 to Morgan Stanley�s Quarterly Report on Form 10-Q for the quarter ended June 30, 2009), Amendment (Exhibit 10.19 to Morgan Stanley�s Annual Report on Form 10-K for the year ended December 31, 2010), Amendment (Exhibit 10.3 to Morgan Stanley�s Quarterly Report on Form 10-Q for the quarter ended June�30, 2011) and Amendment (Exhibit�10.1 to Morgan Stanley�s Quarterly Report on Form 10-Q for the quarter ended September 30, 2014). | |
| 10.13� | 1995 Equity Incentive Compensation Plan (Annex A to MSG�s Proxy Statement for its 1996 Annual Meeting of Stockholders) as amended by Amendment (Exhibit 10.39 to Morgan Stanley�s Annual Report on Form 10-K for the fiscal year ended November 30, 2000), Amendment (Exhibit 10.5 to Morgan Stanley�s Quarterly Report on Form 10-Q for the quarter ended August 31, 2005), Amendment (Exhibit 10.3 to Morgan Stanley�s Quarterly Report on Form 10-Q for the quarter ended February 28, 2006), Amendment (Exhibit 10.24 to Morgan Stanley�s Annual Report on Form 10-K for the fiscal year ended November 30, 2006) and Amendment (Exhibit 10.22 to Morgan Stanley�s Annual Report on Form 10-K for the fiscal year ended November 30, 2007). | |
| 10.14� | Form of Management Committee Equity Award Certificate for Discretionary Retention Award of Stock Units and Stock Options (Exhibit 10.30 to Morgan Stanley�s Annual Report on Form 10-K for the fiscal year ended November 30, 2006). | |
| 10.15� | Form of Deferred Compensation Agreement under the Pre-Tax Incentive Program 2 (Exhibit 10.12 to MSG�s Annual Report for the fiscal year ended November 30, 1996). | |
| 10.16� | Key Employee Private Equity Recognition Plan (Exhibit 10.43 to Morgan Stanley�s Annual Report on Form 10-K for the fiscal year ended November 30, 2000). | |
| 10.17� | Morgan Stanley Financial Advisor and Investment Representative Compensation Plan as amended and restated as of November 26, 2007 (Exhibit 10.34 to Morgan Stanley�s Annual Report on Form�10-K for the fiscal year ended November 30, 2007). | |
| 10.18� | Morgan Stanley UK Share Ownership Plan (Exhibit 4.1 to Morgan Stanley�s Registration Statement on Form S-8 (No. 333-146954)). | |
| 10.19� | Supplementary Deed of Participation for the Morgan Stanley UK Share Ownership Plan, dated as of November 5, 2009 (Exhibit 10.36 to Morgan Stanley�s Annual Report on Form 10-K for the year ended December 31, 2009). | |
| 10.20� | Aircraft Time Sharing Agreement, dated as of January 1, 2010, by and between�Corporate Services�Support Corp.�and James P. Gorman (Exhibit 10.1 to Morgan Stanley�s Quarterly Report on Form�10-Q for the quarter ended March 31, 2010). | |
| | E-4 |
| Exhibit No. | Description | |
| 10.21� | Agreement between Morgan Stanley and James P. Gorman, dated August 16, 2005, and amendment dated December 17, 2008 (Exhibit 10.2 to Morgan Stanley�s Quarterly Report on Form 10-Q for the quarter ended March 31, 2010), as amended by Amendment (Exhibit 10.25 to Morgan Stanley�s Annual Report on Form 10-K for the year ended December 31 2013). | |
| 10.22� | Agreement between Morgan Stanley and Gregory J. Fleming, dated February 3, 2010 (Exhibit 10.5 to Morgan Stanley�s Quarterly Report on Form 10-Q for the quarter ended March 31, 2011). | |
| 10.23� | Form of Restrictive Covenant Agreement (Exhibit 10 to Morgan Stanley�s Current Report on Form�8-K dated November�22, 2005). | |
| 10.24� | Morgan Stanley Performance Formula and Provisions (Exhibit 10.2 to Morgan Stanley�s Current Report on Form 8-K dated May 14, 2013). | |
| 10.25� | 2007 Equity Incentive Compensation Plan, as amended and restated as of March 21, 2013 (Exhibit�10.1 to Morgan Stanley�s Current Report on Form 8-K dated May 14, 2013). | |
| 10.26� | Morgan Stanley 2006 Notional Leveraged Co-Investment Plan, as amended and restated as of November 28, 2008 (Exhibit 10.47 to Morgan Stanley�s Annual Report on Form 10-K for the fiscal year ended November 30, 2008). | |
| 10.27� | Form of Award Certificate under the 2006 Notional Leveraged Co-Investment Plan (Exhibit 10.7 to Morgan Stanley�s Quarterly Report on Form 10-Q for the quarter ended February�29, 2008). | |
| 10.28� | Morgan Stanley 2007 Notional Leveraged Co-Investment Plan, amended as of June 4, 2009 (Exhibit�10.6 to Morgan Stanley�s Quarterly Report on Form 10-Q for the quarter ended June 30, 2009). | |
| 10.29� | Form of Award Certificate under the 2007 Notional Leveraged Co-Investment Plan for Certain Management Committee Members (Exhibit 10.8 to Morgan Stanley�s Quarterly Report on Form�10-Q for the quarter ended February�29, 2008). | |
| 10.30� | Morgan Stanley Compensation Incentive Plan (Exhibit 10.54 to Morgan Stanley�s Annual Report on Form 10-K for the fiscal year ended November 30, 2008). | |
| 10.31� | Morgan Stanley 2009 Replacement Equity Incentive Compensation Plan for Morgan Stanley Smith Barney Employees (Exhibit 4.2 to Morgan Stanley�s Registration Statement on Form S-8 (No.�333-159504)). | |
| 10.32� | Form of Award Certificate for Special Discretionary Retention Awards of Stock Options (Exhibit�10.4 to Morgan Stanley�s Quarterly Report on Form�10-Q for the quarter ended March 31, 2011). | |
| 10.33� | Morgan Stanley Schedule of Non-Employee Directors Annual Compensation, effective as of August�1,�2014 (Exhibit 10.2 to Morgan Stanley�s Quarterly Report on Form 10-Q for the quarter ended September�30, 2014). | |
| 10.34� | Form of Award Certificate for Discretionary Retention Awards of Stock Units (Exhibit 10.1 to Morgan Stanley�s Quarterly Report on Form 10-Q for the quarter ended March 31, 2012). | |
| 10.35� | Form of Award Certificate for Discretionary Retention Awards under the Morgan Stanley Compensation Incentive Plan Deferred Bonus Program (Exhibit 10.2 to Morgan Stanley�s Quarterly Report on Form 10-Q for the quarter ended March 31, 2012). | |
| 10.36� | Form of Award Certificate for Performance Stock Units (Exhibit 10.3 to Morgan Stanley�s Quarterly Report on Form 10-Q for the quarter ended March 31, 2012). | |
| 10.37� | Memorandum to Colm Kelleher Regarding Repatriation to London (Exhibit 10.4 to Morgan Stanley�s Quarterly Report on Form 10-Q for the quarter ended March 31, 2012). | |
| 10.38� | Morgan Stanley U.S. Tax Equalization Program (Exhibit 10.5 to Morgan Stanley�s Quarterly Report on Form 10-Q for the quarter ended March�31, 2012). | |
| E-5 | |
| Exhibit No. | Description | |||
| 10.39� | Morgan Stanley UK Limited Alternative Retirement Plan, dated as of October 8, 2009 (Exhibit 10.2 to Morgan Stanley�s Quarterly Report on Form 10-Q for the quarter ended March 31, 2013). | |||
| 10.40� | Form of Award Certificate for Discretionary Retention Awards under the Morgan Stanley Compensation Incentive Plan (Exhibit 10.3 to Morgan Stanley�s Quarterly Report on Form 10-Q for the quarter ended March 31, 2013). | |||
| 10.41� | Form of Award Certificate for Discretionary Retention Awards under the Morgan Stanley Compensation Incentive Plan (Exhibit 10.1 to Morgan Stanley�s Quarterly Report on Form 10-Q for the quarter ended March 31, 2014). | |||
| 10.42� | Form of Award Certificate for Discretionary Retention Awards of Stock Units (Exhibit 10.4 to Morgan Stanley�s Quarterly Report on Form 10-Q for the quarter ended March 31, 2013). | |||
| 10.43� | Form of Award Certificate for Discretionary Retention Awards of Stock Units (Exhibit 10.2 to Morgan Stanley�s Quarterly Report on Form 10-Q for the quarter ended March 31, 2014). | |||
| 10.44� | Form of Award Certificate for Discretionary Retention Awards of Stock Options (Exhibit 10.5 to Morgan Stanley�s Quarterly Report on Form 10-Q for the quarter ended March 31, 2013). | |||
| 10.45� | Form of Award Certificate for Long-Term Incentive Program Awards (Exhibit 10.6 to Morgan Stanley�s Quarterly Report on Form 10-Q for the quarter ended March 31, 2013). | |||
| 10.46� | Form of Award Certificate for Long-Term Incentive Program Awards (Exhibit 10.3 to Morgan Stanley�s Quarterly Report on Form 10-Q for the quarter ended March 31, 2014). | |||
| 12 | * | Statement Re: Computation of Ratio of Earnings to Fixed Charges and Computation of Ratio of Earnings to Fixed Charges and Preferred Stock Dividends. | ||
| 21 | * | Subsidiaries of Morgan Stanley. | ||
| 23.1 | * | Consent of Deloitte & Touche LLP. | ||
| 24 | Powers of Attorney (included on signature page). | |||
| 31.1 | * | Rule 13a-14(a) Certification of Chief Executive Officer. | ||
| 31.2 | * | Rule 13a-14(a) Certification of Chief Financial Officer. | ||
| 32.1 | ** | Section 1350 Certification of Chief Executive Officer. | ||
| 32.2 | ** | Section 1350 Certification of Chief Financial Officer. | ||
| 101 | Interactive data files pursuant to Rule 405 of Regulation S-T: (i)�the Consolidated Statements of Financial Condition�December 31, 2014 and December 31, 2013, (ii)�the Consolidated Statements of Income�Twelve Months Ended December 31, 2014, December 31, 2013 and December 31, 2012, (iii)�the Consolidated Statements of Comprehensive Income�Twelve Months Ended December 31, 2014, December 31, 2013 and December 31, 2012, (iv)�the Consolidated Statements of Cash Flows�Twelve Months Ended December 31, 2014, December 31, 2013 and December 31, 2012, (v)�the Consolidated Statements of Changes in Total Equity�Twelve Months Ended December 31, 2014, December 31, 2013, and December 31, 2012, and (vi)�Notes to Consolidated Financial Statements. | |||
| * | Filed herewith. |
| ** | Furnished herewith. |
| � | Management contract or compensatory plan or arrangement required to be filed as an exhibit to this Form�10-K pursuant to Item�15(b). |
| | E-6 |