 (Exact name of Registrant
as specified in its charter)
(Exact name of Registrant
as specified in its charter) | Delaware (State or other jurisdiction of incorporation�or�organization) | 1585 Broadway New�York,�NY�10036 (Address�of�principal�executive�offices, including zip code) | 36-3145972 (I.R.S.�Employer�Identification�No.) | (212) 761-4000 (Registrant�s�telephone�number, including area code) | |||
| Title of each class | Name of exchange on which registered | |
| Securities registered pursuant to Section�12(b) of the Act: | ||
| Common Stock, $0.01 par value | New�York�Stock�Exchange | |
| Depositary Shares, each representing 1/1,000th interest in a share of Floating Rate Non-Cumulative Preferred Stock, Series�A, $0.01�par value | New York Stock Exchange | |
| Depositary Shares, each representing 1/1,000th interest in a share of Fixed-to-Floating Rate Non-Cumulative Preferred Stock, Series�E, $0.01�par value | New York Stock Exchange | |
| Depositary Shares, each representing 1/1,000th interest in a share of Fixed-to-Floating Rate Non-Cumulative Preferred Stock, Series�F, $0.01�par value | New York Stock Exchange | |
| 6 1 / 4 % Capital Securities of Morgan Stanley Capital Trust III (and Registrant�s guaranty with respect thereto) | New York Stock Exchange | |
| 6 1 / 4 % Capital Securities of Morgan Stanley Capital Trust IV (and Registrant�s guaranty with respect thereto) | New York Stock Exchange | |
| 5 3 / 4 % Capital Securities of Morgan Stanley Capital Trust V (and Registrant�s guaranty with respect thereto) | New York Stock Exchange | |
| 6.60% Capital Securities of Morgan Stanley Capital Trust VI (and Registrant�s guaranty with respect thereto) | New York Stock Exchange | |
| 6.60% Capital Securities of Morgan Stanley Capital Trust VII (and Registrant�s guaranty with respect thereto) | New York Stock Exchange | |
| 6.45% Capital Securities of Morgan Stanley Capital Trust VIII (and Registrant�s guaranty with respect thereto) | New York Stock Exchange | |
| Market Vectors ETNs due March�31, 2020 (2 issuances); Market Vectors ETNs due April�30, 2020 (2 issuances) | NYSE Arca, Inc. | |
| Morgan Stanley Cushing � MLP High Income Index ETNs due March�21, 2031 | NYSE Arca, Inc. | |
| Morgan Stanley S&P 500 Crude Oil Linked ETNs due July�1, 2031 | NYSE Arca, Inc. | |
| Large Accelerated Filer x Non-Accelerated�Filer � (Do not check if a smaller reporting company) | Accelerated�Filer � Smaller reporting company � |
ANNUAL REPORT ON FORM 10-K for the year ended December�31, 2013 | Table�of�Contents | Page | |||||
| Part I | ||||||
| Item�1. | Business | 1 | ||||
| Overview | 1 | |||||
| Available Information | 1 | |||||
| Business Segments | 2 | |||||
| Institutional Securities | 2 | |||||
| Wealth Management | 4 | |||||
| Investment Management | 5 | |||||
| Competition | 6 | |||||
| Supervision and Regulation | 7 | |||||
| Executive Officers of Morgan Stanley | 21 | |||||
| Item�1A. | Risk Factors | 22 | ||||
| Item 1B. | Unresolved Staff Comments | 33 | ||||
| Item 2. | Properties | 34 | ||||
| Item 3. | Legal Proceedings | 35 | ||||
| Item 4. | Mine Safety Disclosures | 46 | ||||
| Part II | ||||||
| Item 5. | Market for Registrant�s Common Equity, Related Stockholder Matters and Issuer Purchases of Equity Securities | 47 | ||||
| Item 6. | Selected Financial Data | 50 | ||||
| Item 7. | Management�s Discussion and Analysis of Financial Condition and Results of Operations | 52 | ||||
| Introduction | 52 | |||||
| Executive Summary | 54 | |||||
| Business Segments | 63 | |||||
| Accounting Developments | 83 | |||||
| Other Matters | 85 | |||||
| Critical Accounting Policies | 88 | |||||
| Liquidity and Capital Resources | 92 | |||||
| Item�7A. | Quantitative and Qualitative Disclosures about Market Risk | 111 | ||||
| Item 8. | Financial Statements and Supplementary Data | 136 | ||||
| Report of Independent Registered Public Accounting Firm | 136 | |||||
| Consolidated Statements of Financial Condition | 137 | |||||
| Consolidated Statements of Income | 138 | |||||
| Consolidated Statements of Comprehensive Income | 139 | |||||
| Consolidated Statements of Cash Flows | 140 | |||||
| Consolidated Statements of Changes in Total Equity | 141 | |||||
 Table of Contents
| Table�of�Contents | Page | |||||
| Notes to Consolidated Financial Statements | 142 | |||||
| Financial Data Supplement (Unaudited) | 285 | |||||
| Item 9. | Changes in and Disagreements with Accountants on Accounting and Financial Disclosure | 293 | ||||
| Item�9A. | Controls and Procedures | 293 | ||||
| Item�9B. | Other Information | 295 | ||||
| Part�III | ||||||
| Item 10. | Directors, Executive Officers and Corporate Governance | 296 | ||||
| Item 11. | Executive Compensation | 296 | ||||
| Item 12. | Security Ownership of Certain Beneficial Owners and Management and Related Stockholder Matters | 297 | ||||
| Item 13. | Certain Relationships and Related Transactions, and Director Independence | 298 | ||||
| Item 14. | Principal Accountant Fees and Services | 298 | ||||
| Part�IV | ||||||
| Item�15. | Exhibits and Financial Statement Schedules | 299 | ||||
| Signatures | S-1 | |||||
| Exhibit Index | E-1 | |||||
Table of Contents Forward-Looking Statements We have included in or incorporated by reference into this report, and from time to time may make in our public filings, press
releases or other public statements, certain statements, including (without limitation) those under �Legal Proceedings� in Part I, Item�3, �Management�s Discussion and Analysis of Financial Condition and Results of
Operations� in Part II, Item�7 and �Quantitative and Qualitative Disclosures about Market Risk� in Part II, Item�7A, that may constitute �forward-looking statements� within the meaning of the safe harbor provisions
of the Private Securities Litigation Reform Act of 1995. In addition, our management may make forward-looking statements to analysts, investors, representatives of the media and others. These forward-looking statements are not historical facts and
represent only our beliefs regarding future events, many of which, by their nature, are inherently uncertain and beyond our control. The nature of our business makes predicting the future trends of our revenues, expenses and net income difficult. The risks and uncertainties involved in
our businesses could affect the matters referred to in such statements, and it is possible that our actual results may differ, possibly materially, from the anticipated results indicated in these forward-looking statements. Important factors that
could cause actual results to differ from those in the forward-looking statements include (without limitation): | � | the effect of economic and political conditions and geopolitical events; |
| � | the effect of market conditions, particularly in the global equity, fixed income, credit and commodities markets, including corporate and mortgage (commercial and residential) lending and commercial real estate markets; |
| � | the impact of current, pending and future legislation (including the Dodd-Frank Wall Street Reform and Consumer Protection Act (the �Dodd-Frank Act�)), regulation (including capital, leverage and liquidity requirements), policies (including fiscal and monetary) and legal and regulatory actions in the United States (�U.S.�) and worldwide; |
| � | the level and volatility of equity, fixed income and commodity prices, interest rates, currency values and other market indices; |
| � | the availability and cost of both credit and capital as well as the credit ratings assigned to our unsecured short-term and long-term debt; |
| � | investor, consumer and business sentiment and confidence in the financial markets; |
| � | the performance of our acquisitions, divestitures, joint ventures, strategic alliances or other strategic arrangements; |
| � | our reputation; |
| � | inflation, natural disasters and acts of war or terrorism; |
| � | the actions and initiatives of current and potential competitors as well as governments, regulators and self-regulatory organizations; |
| � | the effectiveness of our risk management policies; |
| � | technological changes and risks, including cybersecurity risks; and |
| � | other risks and uncertainties detailed under �Business�Competition� and �Business�Supervision and Regulation� in Part I, Item�1, �Risk Factors� in Part I, Item�1A and elsewhere throughout this report. |
Table of Contents Part I | Item�1. | Business. |
| 1 | |
| | 2 |
| 3 | |
| | 4 |
| 5 | |
| | 6 |
| 7 | |
| | 8 |
| 9 | |
| | 10 |
| 11 | |
| | 12 |
| 13 | |
| | 14 |
| 15 | |
| | 16 |
| 17 | |
| | 18 |
| 19 | |
| | 20 |
| 21 | |
| | 22 |
| 23 | |
| | 24 |
| 25 | |
| | 26 |
| 27 | |
| | 28 |
| 29 | |
| | 30 |
| 31 | |
| | 32 |
| 33 | |
| Item�2. | Properties. |
| Location | Owned/ Leased | Lease�Expiration | Approximate�Square�Footage as of December�31, 2013(A) | |||||||
| U.S. Locations | ||||||||||
| 1585 Broadway New York, New York (Global Headquarters and Institutional Securities Headquarters) | Owned | N/A | 1,346,500�square�feet | |||||||
| 2000 Westchester Avenue Purchase, New York (Wealth Management Headquarters) | Owned | N/A | 597,400�square�feet | |||||||
| 522 Fifth Avenue New York, New York (Investment Management Headquarters) | Owned | N/A | 581,250�square�feet | |||||||
| New York, New York (Several locations) | Leased | 2014���2029 | | 2,394,600�square�feet | | |||||
| Brooklyn, New York (Several locations) | Leased | 2014 � 2023 | 344,100�square�feet | |||||||
| Jersey City, New Jersey (Several locations) | Leased | 2014 | 369,200�square�feet | |||||||
| International Locations | ||||||||||
| 20 Bank Street London (London Headquarters) | Leased | 2038 | 546,500�square�feet | |||||||
| Canary Wharf London | Leased(B) | 2020 | 454,600�square�feet | |||||||
| 1 Austin Road West Kowloon (Hong Kong Headquarters) | Leased | 2019 | 572,600�square�feet | |||||||
| Sapporo�s Yebisu Garden Place Ebisu, Shibuya-ku | Leased | 2013 | (C) | 300,700�square�feet | ||||||
| Otemachi Financial City South Tower Otemachi, Chiyoda-ku (Tokyo Headquarters) | Leased | 2028 | (C) | 246,700�square feet | ||||||
| (A) | The indicated total aggregate square footage leased does not include space occupied by Morgan Stanley branch offices. |
| (B) | The Company holds the freehold interest in the land and building. |
| (C) | The Company began relocating its Tokyo headquarters from Yebisu Garden Place to Otemachi Financial City South Tower beginning in December 2013. The relocation will be complete by March�31, 2014. |
Table of Contents| Item�3. | Legal Proceedings. |
Table of Contents through certificates. These matters include, but are not limited to, investigations related to the Company�s due diligence on the loans that it purchased for securitization, the
Company�s communications with ratings agencies, the Company�s disclosures to investors, and the Company�s handling of servicing and foreclosure related issues. On January�30, 2014, the Company reached an agreement in principle with
the Staff of the Enforcement Division of the U.S. Securities and Exchange Commission (the �SEC�) to resolve an investigation related to certain subprime RMBS transactions sponsored and underwritten by the Company in 2007. Pursuant to the
agreement in principle, the Company would be charged with violating Sections�17(a)(2) and 17(a)(3) of the Securities Act, and the Company would pay disgorgement and penalties in an amount of $275 million and would neither admit nor deny the
SEC�s findings. The SEC has not yet presented the proposed settlement to the Commission and no assurance can be given that it will be accepted. Class Actions. Beginning in December 2007, several purported class action complaints were filed in the
United�States District Court for the Southern District of New York (the �SDNY�) asserting claims on behalf of participants in the Company�s 401(k) plan and employee stock ownership plan against the Company and other parties,
including certain present and former directors and officers, under the Employee Retirement Income Security Act of 1974 (�ERISA�). In February 2008, these actions were consolidated in a single proceeding, styled In re Morgan Stanley
ERISA Litigation . The consolidated complaint relates in large part to the Company�s subprime and other mortgage related losses, but also includes allegations regarding the Company�s disclosures, internal controls, accounting and other
matters. On March�16, 2011, a purported class action, styled Coulter v. Morgan Stanley�& Co. Incorporated et al. , was filed in the SDNY asserting claims on behalf of participants in the Company�s 401(k) plan and employee
stock ownership plan against the Company and certain current and former officers and directors for breach of fiduciary duties under ERISA. The complaint alleges, among other things, that defendants knew or should have known that from January�2,
2008 to December�31, 2008, the plans� investment in Company stock was imprudent given the extraordinary risks faced by the Company and its common stock during that period. On March�28, 2013, the court granted defendants� motions
to dismiss both actions. Plaintiffs filed notices of appeal on June�27, 2013 in the United States Court of Appeals for the Second Circuit (the �Second Circuit�) in both matters, which have been consolidated on appeal. On February�12, 2008, a purported class action, styled Joel
Stratte-McClure, et al. v. Morgan�Stanley, et al. , was filed in the SDNY against the Company and certain present and former executives asserting claims on behalf of a purported class of persons and entities who purchased shares of the
Company�s common stock during the period June�20, 2007 to December�19, 2007 and who suffered damages as a result of such purchases. The allegations in the amended complaint related in large part to the Company�s subprime and
other mortgage related losses, and also included allegations regarding the Company�s disclosures, internal controls, accounting and other matters. On August�8, 2011, defendants filed a motion to dismiss the second amended complaint, which
was granted on January�18, 2013. On May�29, 2013, the plaintiffs filed an appeal in the Second Circuit, which appeal is pending. On May�7, 2009, the Company was named as a defendant in a purported class action lawsuit brought under Sections 11, 12 and 15 of the Securities Act
of 1933, as amended (the �Securities Act�), which is now styled In re Morgan Stanley Mortgage Pass-Through Certificates Litigation and is pending in the SDNY. The third amended complaint, filed on September�30, 2011, alleges,
among other things, that the registration statements and offering documents related to the offerings of certain mortgage pass-through certificates in 2006 contained false and misleading information concerning the pools of residential loans that
backed these securitizations. The plaintiffs seek, among other relief, class certification, unspecified compensatory and rescissionary damages, costs, interest and fees. On January�31, 2013, plaintiffs filed a fourth amended complaint, in which
they purport to represent investors who purchased approximately $7.82 billion in mortgage pass-through certificates issued in 2006 by 13 trusts. On August�30, 2013, plaintiffs filed a motion for class certification. On May�14, 2009, the Company was named as one of several underwriter
defendants in a purported class action lawsuit brought under Sections 11, 12 and 15 of the Securities Act which is now styled In re IndyMac Mortgage-Backed Securities Litigation and is pending in the SDNY. The claims against the Company
relate to offerings of mortgage pass-through certificates issued by several trusts sponsored by affiliates of IndyMac Bancorp during 36 Table of Contents 2006 and 2007. Plaintiff alleges, among other things, that the registration statements and offering documents related to the offerings of certain mortgage pass-through certificates contained
false and misleading information concerning the pools of residential loans that backed these securitizations. The plaintiffs seek, among other relief, class certification, unspecified compensatory and rescissionary damages, costs, interest and fees.
The amount of the certificates underwritten by the Company at issue in the litigation was approximately $1.68 billion. On August�17, 2012, the court granted class certification with respect to one offering underwritten by the Company. On
August�30, 2013, plaintiffs filed a motion to expand the certified class to include additional offerings. IndyMac Bank, which was the sponsor of these securitizations, filed for bankruptcy on July�31, 2008, and the Company�s ability
to be indemnified by IndyMac Bank is limited. On October 25,
2010, the Company, certain affiliates and Pinnacle Performance Limited, a special purpose vehicle (�SPV�), were named as defendants in a purported class action related to securities issued by the SPV in Singapore, commonly referred to as
Pinnacle Notes. The case is styled Ge Dandong, et al. v. Pinnacle Performance Ltd., et al. and is pending in the SDNY. An amended complaint was filed on October 22, 2012.�The court denied defendants� motion to dismiss the amended
complaint on August 22, 2013 and granted class certification on October 17, 2013.�On October 30, 2013, defendants filed a petition for permission to appeal the court�s decision granting class certification.�On January 31, 2014,
plaintiffs filed a second amended complaint.�The second amended complaint alleges that the defendants engaged in a fraudulent scheme to defraud investors by structuring the Pinnacle Notes to fail and benefited subsequently from the
securities� failure.�In addition, the second amended complaint alleges that the securities� offering materials contained material misstatements or omissions regarding the securities� underlying assets and the alleged conflicts of
interest between the defendants and the investors.�The second amended complaint asserts common law claims of fraud, aiding and abetting fraud, fraudulent inducement, aiding and abetting fraudulent inducement, and breach of the implied covenant
of good faith and fair dealing.�Plaintiffs seek damages of approximately $138.7 million, rescission, punitive damages, and interest. Other Litigation. On December�23, 2009, the Federal Home Loan Bank of Seattle filed a complaint�against the
Company and another defendant in�the Superior Court of the State of Washington, styled Federal Home Loan Bank of Seattle v. Morgan Stanley�& Co. Inc., et al. The amended complaint, filed on September�28, 2010, alleges
that defendants made untrue statements and material omissions in the sale to plaintiff of certain mortgage pass-through certificates backed by securitization trusts containing residential mortgage loans. The total amount of certificates allegedly
sold to plaintiff by the Company was approximately $233 million.�The complaint raises claims under the Washington State Securities Act and seeks, among other things,�to rescind�the plaintiff�s purchase of such
certificates.�On October�18, 2010, defendants filed a motion to dismiss the action. By orders dated�June 23, 2011 and July�18, 2011,�the court denied defendants� omnibus�motion to dismiss plaintiff�s amended
complaint and on�August 15, 2011, the court denied the Company�s individual motion to dismiss the amended complaint. On March�15, 2010, the Federal Home Loan Bank of San Francisco filed two complaints against the Company and other defendants in�the Superior
Court of the State of California. These actions are styled Federal Home Loan Bank of San Francisco�v. Credit Suisse Securities (USA) LLC, et al. ,�and Federal Home Loan Bank of San�Francisco�v. Deutsche Bank Securities
Inc.�et al. , respectively. Amended complaints were filed on June�10, 2010. The amended complaints allege that defendants made untrue statements and material omissions in connection with the sale to plaintiff of�a number
of�mortgage pass-through certificates backed by securitization trusts containing residential mortgage loans. The amount of certificates allegedly sold to plaintiff by the Company in these cases was approximately $704 million and $276 million,
respectively. The complaints raise claims under both the federal securities laws and California law and seek, among other things,�to rescind�the plaintiff�s purchase of such certificates.�On August�11, 2011, plaintiff�s
Securities Act claims were dismissed with prejudice. The defendants filed answers to the amended complaints on October�7, 2011. On February�9, 2012, defendants� demurrers with respect to all other claims were overruled. On
December�20, 2013, plaintiff�s negligent misrepresentation claims were dismissed with prejudice. A bellwether trial is currently scheduled to begin in September 2014. The Company is not a defendant in connection with the securitizations at
issue in that trial. 37 Table of Contents On July�15, 2010, The Charles Schwab Corp. filed a complaint against the Company and other defendants
in�the Superior Court of the State of California, styled The Charles Schwab Corp. v. BNP Paribas Securities Corp., et al . The complaint alleges that defendants made untrue statements and material omissions in the sale to one of
plaintiff�s subsidiaries of�a number of�mortgage pass-through certificates backed by securitization trusts containing residential mortgage loans. The�total amount of certificates allegedly sold to plaintiff�s subsidiary by
the Company was�approximately $180 million.�The complaint raises claims under both the federal securities laws and California law and seeks, among other things,�to rescind�the plaintiff�s purchase of such
certificates.�Plaintiff filed an amended complaint on August�2, 2010. On September�22, 2011, defendants filed demurrers to the amended complaint. On October�13, 2011, plaintiff voluntarily dismissed its claims brought under the
Securities Act. On January�27, 2012, the court, in a ruling from the bench, substantially overruled defendants� demurrers. On March�5, 2012, the plaintiff filed a second amended complaint. On April�10, 2012, the Company filed a
demurrer to certain causes of action in the second amended complaint, which the court overruled on July�24, 2012. The Company filed its answer to the second amended complaint on August�3, 2012. An initial trial of certain of
plaintiff�s claims is scheduled to begin in July 2015. On
July�15, 2010, China Development Industrial Bank (�CDIB�) filed a complaint against the Company, which is styled China Development Industrial Bank v. Morgan Stanley�& Co. Incorporated and is pending in the Supreme
Court of NY. The Complaint relates to a $275 million credit default swap referencing the super senior portion of the STACK 2006-1 CDO. The complaint asserts claims for common law fraud, fraudulent inducement and fraudulent concealment and alleges
that the Company misrepresented the risks of the STACK 2006-1 CDO to CDIB, and that the Company knew that the assets backing the CDO were of poor quality when it entered into the credit default swap with CDIB. The complaint seeks compensatory
damages related to the approximately $228 million that CDIB alleges it has already lost under the credit default swap, rescission of CDIB�s obligation to pay an additional $12 million, punitive damages, equitable relief, fees and costs. On
March�10, 2011, the Company filed its answer to the complaint. On October�15, 2010,�the Federal Home Loan Bank of Chicago filed a complaint�against the Company and other defendants
in�the�Circuit Court of the State of Illinois, styled Federal Home Loan Bank of�Chicago�v.�Bank of America Funding Corporation�et al . The complaint alleges that defendants made untrue statements and material
omissions in the sale to plaintiff of�a number of�mortgage pass-through certificates backed by securitization trusts containing residential mortgage loans and asserts claims under Illinois law.�The�total amount of certificates
allegedly sold to plaintiff by the Company at issue in the action was�approximately $203 million. The complaint seeks, among other things,�to rescind�the plaintiff�s purchase of such certificates. On March�24, 2011, the
court presiding over Federal Home Loan Bank of�Chicago�v.�Bank of America Funding Corporation�et al. granted plaintiff leave to file an amended complaint. The Company filed its answer on December�21, 2012. On
December�13, 2013, the court entered an order dismissing all claims related to one of the securitizations at issue. On April�20, 2011, the Federal Home Loan Bank of Boston filed a complaint�against the Company and other defendants in�the Superior Court of
the Commonwealth of Massachusetts styled Federal Home Loan Bank of Boston v. Ally Financial, Inc. F/K/A GMAC LLC et al .�An amended complaint was filed on June�19, 2012 and alleges that defendants made untrue statements and material
omissions in the sale to plaintiff of certain mortgage pass-through certificates backed by securitization trusts containing residential mortgage loans. The total amount of certificates allegedly issued by the Company or sold to plaintiff by the
Company was approximately $385 million.�The amended complaint raises claims under�the Massachusetts Uniform Securities Act, the Massachusetts Consumer Protection Act and common law�and seeks, among other things, to rescind the
plaintiff�s purchase of such certificates. On May�26, 2011, defendants removed the case to the United States District Court for the District of Massachusetts. On October�11, 2012, defendants filed motions to dismiss the amended
complaint, which was granted in part and denied in part on September�30, 2013. The defendants filed an answer to the amended complaint on December�16, 2013. On�July 5,�2011,�Allstate Insurance Company and certain
of�its affiliated entities�filed a complaint�against the Company�in�the Supreme Court of NY, styled Allstate Insurance Company, et al. v. Morgan Stanley, et al . An amended complaint was filed on September�9,
2011 and alleges that defendants made untrue statements and 38 Table of Contents material omissions in the sale to plaintiff of certain mortgage pass-through certificates backed by securitization trusts containing residential mortgage loans. The total amount of certificates
allegedly issued and/or sold to plaintiffs by the Company was approximately $104 million.�The complaint raises common law claims of fraud,�fraudulent inducement, aiding and abetting fraud and negligent misrepresentation and seeks, among
other things,�compensatory and/or rescissionary damages�associated with�plaintiffs� purchases of such certificates. On March�15, 2013, the court denied in substantial part the defendants� motion to dismiss the amended
complaint, which order the Company appealed on April�11, 2013. On May�3, 2013, the Company filed its answer to the amended complaint. On July�18, 2011, the Western and Southern Life Insurance Company and certain affiliated companies filed a complaint�against the Company and
other defendants in�the Court of Common Pleas in Ohio, styled Western and Southern Life Insurance Company, et al. v. Morgan Stanley Mortgage Capital Inc., et al .�An amended complaint was filed on April�2, 2012 and alleges that
defendants made untrue statements and material omissions in the sale to plaintiffs of certain mortgage pass-through certificates backed by securitization trusts containing residential mortgage loans. The amount of the certificates allegedly sold to
plaintiffs by the Company was approximately $153 million.�The amended complaint raises claims under�the Ohio Securities Act, federal securities laws, and common law and seeks, among other things, to rescind the plaintiffs� purchases
of such certificates. The Company filed its answer on August�17, 2012. Trial is currently scheduled to begin in May 2015. On November�4, 2011, the Federal Deposit Insurance Corporation (�FDIC�), as receiver for Franklin Bank S.S.B, filed two complaints against
the Company in the District Court of the State of Texas. Each was styled Federal Deposit Insurance Corporation, as Receiver for Franklin Bank S.S.B v. Morgan Stanley�& Company LLC F/K/A Morgan Stanley�& Co. Inc. and alleged
that the Company made untrue statements and material omissions in connection with the sale to plaintiff of�mortgage pass-through certificates backed by securitization trusts containing residential mortgage loans. The amount of certificates
allegedly underwritten and sold to plaintiff by the Company in these cases was approximately $67 million and $35 million, respectively. The complaints each raised claims under both federal securities law and the Texas Securities Act and each seeks,
among other things,�compensatory damages associated with plaintiff�s purchase of such certificates. On March�20, 2012, the Company filed answers to the complaints in both cases. On June�7, 2012, the two cases were consolidated.
On January�10, 2013, the Company filed a motion for summary judgment and special exceptions with respect to plaintiff�s claims. On February�6, 2013, the FDIC filed an amended consolidated complaint. On February�25, 2013, the
Company filed a motion for summary judgment and special exceptions, which motion was denied in substantial part on April�26, 2013. On May�3, 2013, the FDIC filed a second amended consolidated complaint. Trial is currently scheduled to
begin in November 2014. On January�20, 2012, Sealink Funding
Limited filed a complaint�against the Company in the Supreme Court of NY, styled Sealink Funding Limited v. Morgan Stanley, et al .�Plaintiff purports to be the assignee of claims of certain special purpose vehicles
(�SPVs�) formerly sponsored by SachsenLB Europe. An amended complaint was filed on May�21, 2012 and alleges that defendants made untrue statements and material omissions in the sale to the SPVs of certain mortgage pass-through
certificates backed by securitization trusts containing residential mortgage loans. The total amount of certificates allegedly issued by the Company and/or sold by the Company was approximately $507 million.�The amended complaint raises common
law claims of fraud,�fraudulent inducement, and aiding and abetting fraud and seeks, among other things,�compensatory and/or rescissionary damages�as well as punitive damages associated with�plaintiffs� purchases of such
certificates. On March�20, 2013, plaintiff filed a second amended complaint. On May�3, 2013, the Company filed a motion to dismiss the second amended complaint. On January�25, 2012, Dexia SA/NV and certain of its affiliated entities
filed a complaint�against the Company�in the Supreme Court of NY, styled Dexia SA/NV et al. v. Morgan Stanley, et al .�An amended complaint was filed on May�24, 2012 and alleges that defendants made untrue statements and
material omissions in the sale to plaintiffs of certain mortgage pass-through certificates backed by securitization trusts containing residential mortgage loans. The total amount of certificates allegedly issued by the Company and/or sold to
plaintiffs by the 39 Table of Contents Company was approximately $626 million.�The amended complaint raises common law claims of fraud,�fraudulent inducement, and aiding and abetting fraud and seeks, among other
things,�compensatory and/or rescissionary damages�as well as punitive damages associated with�plaintiffs� purchases of such certificates. On October�16, 2013, the court granted the defendants� motion to dismiss the
amended complaint. On November�18, 2013, plaintiffs filed a notice of appeal of the dismissal and a motion to renew their opposition to defendants� motion to dismiss. On April�25, 2012, The Prudential Insurance Company of America and
certain affiliates filed a complaint against the Company and certain affiliates in the Superior Court of the State of New Jersey, styled The Prudential Insurance Company of America, et al. v. Morgan Stanley, et al. The complaint
alleges that defendants made untrue statements and material omissions in connection with the sale to plaintiffs of certain mortgage pass-through certificates backed by securitization trusts containing residential mortgage loans. The total amount of
certificates allegedly sponsored, underwritten and/or sold by the Company is approximately $1 billion. The complaint raises claims under the New Jersey Uniform Securities Law, as well as common law claims of negligent misrepresentation, fraud and
tortious interference with contract and seeks, among other things, compensatory damages, punitive damages, rescission and rescissionary damages associated with plaintiffs� purchases of such certificates. On October�16, 2012, plaintiffs
filed an amended complaint which, among other things, increases the total amount of the certificates at issue by approximately $80 million, adds causes of action for fraudulent inducement, equitable fraud, aiding and abetting fraud, and violations
of the New Jersey RICO statute, and includes a claim for treble damages. On March�15, 2013, the court denied the defendants� motion to dismiss the amended complaint. On April�26, 2013, the defendants filed an answer to the amended
complaint. On August�7, 2012, U.S. Bank, in its capacity as
Trustee, filed a complaint on behalf of Morgan Stanley Mortgage Loan Trust 2006-4SL and Mortgage Pass-Through Certificates, Series 2006-4SL (together, the �Trust�) against the Company. The matter is styled Morgan Stanley Mortgage Loan
Trust 2006-4SL, et al. v. Morgan Stanley Mortgage Capital Inc. and is pending in the Supreme Court of NY. The complaint asserts claims for breach of contract and alleges, among other things, that the loans in the Trust, which had an original
principal balance of approximately $303 million, breached various representations and warranties. The complaint seeks, among other relief, rescission of the mortgage loan purchase agreement underlying the transaction, specific performance and
unspecified damages and interest. On October�8, 2012, the Company filed a motion to dismiss the complaint. On August�8, 2012, U.S. Bank, in its capacity as Trustee, filed a complaint on behalf of Morgan Stanley Mortgage Loan Trust 2006-14SL, Mortgage Pass-Through Certificates, Series 2006-14SL, Morgan
Stanley Mortgage Loan Trust 2007-4SL and Mortgage Pass-Through Certificates, Series 2007-4SL against the Company. The complaint is styled Morgan Stanley Mortgage Loan Trust 2006-14SL, et al. v. Morgan Stanley Mortgage Capital Holdings LLC, as
successor in interest to Morgan Stanley Mortgage Capital Inc . and is pending in the Supreme Court of NY. The complaint asserts claims for breach of contract and alleges, among other things, that the loans in the trusts, which had original
principal balances of approximately $354 million and $305 million respectively, breached various representations and warranties. The complaint seeks, among other relief, rescission of the mortgage loan purchase agreements underlying the
transactions, specific performance and unspecified damages and interest. On October�9, 2012, the Company filed a motion to dismiss the complaint. On August�16, 2013, the court granted in part and denied in part the Company�s motion to
dismiss the complaint. On September�17, 2013, the Company filed its answer to the complaint. On September�26, 2013, and October�7, 2013, the Company and the plaintiffs, respectively, filed notices of appeal with respect to the
court�s August�16, 2013 decision. On August�10,
2012, the FDIC, as receiver for Colonial Bank, filed a complaint against the Company in the Circuit Court of Montgomery, Alabama styled Federal Deposit Insurance Corporation as Receiver for Colonial Bank v. Citigroup Mortgage Loan Trust Inc. et
al ..�The complaint alleges that the Company made untrue statements and material omissions in connection with the sale to Colonial Bank of a mortgage pass-through certificate backed by a securitization trust containing residential loans. The
complaint raises claims under federal 40 Table of Contents securities law and the Alabama Securities Act and seeks, among other things, compensatory damages.�The total amount of the certificate allegedly sponsored, underwritten and/or sold by the
Company to Colonial Bank was approximately $65 million.�On September�13, 2013, the plaintiff filed an amended complaint. Defendants filed a motion to dismiss the amended complaint on November�12, 2013. On September�28, 2012, U.S. Bank, in its capacity as Trustee, filed a
complaint on behalf of Morgan Stanley Mortgage Loan Trust 2006-13ARX against the Company styled Morgan Stanley Mortgage Loan Trust 2006-13ARX v. Morgan Stanley Mortgage Capital Holdings LLC, as successor in interest to Morgan Stanley Mortgage
Capital Inc., pending in the Supreme Court of NY. U.S. Bank filed an amended complaint on January�17, 2013, which asserts claims for breach of contract and alleges, among other things, that the loans in the trust, which had an original
principal balance of approximately $609 million, breached various representations and warranties. The amended complaint seeks, among other relief, declaratory judgment relief, specific performance and unspecified damages and interest. On
March�18, 2013, the Company filed a motion to dismiss the complaint. On October�22, 2012,�Asset Management Fund d/b/a AMF Funds and certain of its affiliated funds�filed a complaint against the Company�in the Supreme Court of NY, styled Asset
Management Fund d/b/a AMF Funds et al v. Morgan Stanley et al. The complaint alleges that defendants made material misrepresentations and omissions in the�sale to plaintiffs�of certain mortgage pass-through certificates backed by
securitization trusts containing residential mortgage loans. The total amount of certificates allegedly sponsored, underwritten and/or sold by the Company to plaintiffs was approximately $122 million.�The complaint asserts causes of action
against the Company for, among other things, common law fraud, fraudulent concealment, aiding and abetting fraud, and negligent misrepresentation, and seeks, among other things,�monetary and punitive damages. On December�3, 2012, the
Company filed a motion to dismiss the complaint. On July�18, 2013, the court dismissed claims with respect to seven certificates purchased by the plaintiff. The remaining claims relate to certificates with an original balance of $10.6 million.
On September�12, 2013, plaintiffs filed a notice of appeal concerning the court�s decision granting in part and denying in part the defendants� motion to dismiss. Defendants filed a notice of cross-appeal on September�26, 2013. On December�14, 2012, Royal Park Investments SA/NV filed a
complaint against the Company, certain affiliates, and other defendants in the Supreme Court of NY, styled Royal Park Investments SA/NV v. Merrill Lynch et al. The complaint alleges that defendants made material misrepresentations and
omissions in the sale to plaintiff of certain mortgage pass-through certificates backed by securitization trusts containing residential mortgage loans totaling approximately $628 million.�On March�15, 2013, defendants filed a motion to
dismiss the complaint. On June�17, 2013, the court signed a joint proposed order and stipulation allowing plaintiffs to replead their complaint and defendants to withdraw their motion to dismiss without prejudice. On October�24, 2013,
plaintiff filed a new complaint against the Company in the Supreme Court of NY, styled Royal Park Investments SA/NV v. Morgan Stanley et al. The new complaint alleges that defendants made material misrepresentations and omissions in the sale
to plaintiff of certain mortgage pass-through certificates backed by securitization trusts containing residential mortgage loans.�The total amount of certificates allegedly sponsored, underwritten and/or sold by the Company to plaintiff was
approximately $597 million.�The complaint raises common law claims of fraud, fraudulent inducement, negligent misrepresentation, and aiding and abetting fraud and seeks, among other things, compensatory and punitive damages. On February 3,
2014, the Company filed a motion to dismiss the complaint. On
January�10, 2013,�U.S. Bank, in its capacity as Trustee, filed a complaint on behalf of Morgan Stanley Mortgage Loan Trust 2006-10SL and Mortgage Pass-Through Certificates, Series 2006-10SL against the Company. The�complaint is styled Morgan Stanley Mortgage Loan Trust 2006-10SL, et al. v. Morgan Stanley Mortgage Capital Holdings LLC, as successor in interest to Morgan Stanley Mortgage Capital Inc. and is pending in the Supreme Court of NY. The�complaint asserts
claims for breach of contract and alleges, among other things, that the loans in the trust, which had an original principal balance of approximately $300 million, breached various representations and warranties. The�complaint seeks, among other
relief, an order requiring the Company to comply with the loan breach remedy procedures in the transaction documents, unspecified damages, and interest. On March�11, 2013, the Company filed a motion to dismiss the complaint. 41 Table of Contents On January�31, 2013, HSH Nordbank AG and certain affiliates filed a complaint against the Company,
certain affiliates, and other defendants in the Supreme Court of NY, styled HSH Nordbank AG et al. v. Morgan Stanley et al. The complaint alleges that defendants made material misrepresentations and omissions in the sale to plaintiffs of
certain mortgage pass-through certificates backed by securitization trusts containing residential mortgage loans. The total amount of certificates allegedly sponsored, underwritten and/or sold by the Company to plaintiff was approximately $524
million.�The complaint alleges causes of action against the Company for common law fraud, fraudulent concealment, aiding and abetting fraud, negligent misrepresentation, and rescission and seeks, among other things, compensatory and punitive
damages. On April�12, 2013, defendants filed a motion to dismiss the complaint. On February�14, 2013, Bank Hapoalim B.M. filed a complaint against the Company and certain affiliates in the Supreme Court of NY, styled Bank Hapoalim B.M. v. Morgan Stanley et al. The
complaint alleges that defendants made material misrepresentations and omissions in the sale to plaintiff of certain mortgage pass-through certificates backed by securitization trusts containing residential mortgage loans.�The total amount of
certificates allegedly sponsored, underwritten and/or sold by the Company to plaintiff was approximately $141 million.�The complaint alleges causes of action against the Company for common law fraud, fraudulent concealment, aiding and abetting
fraud, and negligent misrepresentation, and seeks, among other things, compensatory and punitive damages. On April�26, 2013, defendants filed a motion to dismiss the complaint. On March�7, 2013, the Federal Housing Finance Agency filed a summons with notice on behalf of the trustee of the Saxon
Asset Securities Trust, Series 2007-1, against the Company and an affiliate.�The matter is styled Federal Housing Finance Agency, as Conservator for the Federal Home Loan Mortgage Corporation, on behalf of the Trustee of the Saxon Asset
Securities Trust, Series 2007-1 v. Saxon Funding Management LLC and Morgan Stanley and is pending in the Supreme Court of NY.�The notice asserts claims for breach of contract and alleges, among other things, that the loans in the trust,
which had an original principal balance of approximately $593 million, breached various representations and warranties. The notice seeks, among other relief, specific performance of the loan breach remedy procedures in the transaction documents,
unspecified damages, indemnity, and interest. On May�3,
2013, plaintiffs in Deutsche Zentral-Genossenschaftsbank AG et al. v. Morgan Stanley et al. filed a complaint against the Company, certain affiliates, and other defendants in the Supreme Court of NY. The complaint alleges that defendants made
material misrepresentations and omissions in the sale to plaintiffs of certain mortgage pass-through certificates backed by securitization trusts containing residential mortgage loans. The total amount of certificates allegedly sponsored,
underwritten and/or sold by the Company to plaintiff was approximately $694 million. The complaint alleges causes of action against the Company for common law fraud, fraudulent concealment, aiding and abetting fraud, negligent misrepresentation, and
rescission and seeks, among other things, compensatory and punitive damages. On July�12, 2013, defendants filed a motion to dismiss the complaint. On May�17, 2013, plaintiff in IKB International S.A. in Liquidation, et al. v. Morgan Stanley, et al. filed a complaint against the Company
and certain affiliates in the Supreme Court of NY. The complaint alleges that defendants made material misrepresentations and omissions in the sale to plaintiff of certain mortgage pass-through certificates backed by securitization trusts containing
residential mortgage loans. The total amount of certificates allegedly sponsored, underwritten and/or sold by the Company to plaintiff was approximately $132�million. The complaint alleges causes of action against the Company for common law
fraud, fraudulent concealment, aiding and abetting fraud, and negligent misrepresentation, and seeks, among other things, compensatory and punitive damages. On July�26, 2013, defendants filed a motion to dismiss the complaint. On July�2, 2013, the trustee, Deutsche Bank became the named plaintiff
in Federal Housing Finance Agency, as Conservator for the Federal Home Loan Mortgage Corporation, on behalf of the Trustee of the Morgan Stanley ABS Capital I Inc. Trust, Series 2007-NC1 (MSAC 2007-NC1) v. Morgan Stanley ABS Capital I Inc. ,
and filed a complaint in the Supreme Court of NY under the caption Deutsche Bank National Trust Company, as Trustee for the Morgan Stanley ABS Capital I Inc. Trust, Series 2007-NC1 v. Morgan Stanley ABS Capital I, Inc. On 42 Table of Contents February�3, 2014, the plaintiff filed an amended complaint, which asserts claims for breach of contract and breach of the implied covenant of good faith and fair dealing and alleges, among
other things, that the loans in the trust, which had an original principal balance of approximately $1.25 billion, breached various representations and warranties. The amended complaint seeks, among other relief, specific performance of the loan
breach remedy procedures in the transaction documents, unspecified damages, rescission and interest. On July�8, 2013, plaintiff filed a complaint in Morgan Stanley Mortgage Loan Trust 2007-2AX, by U.S. Bank National Association, solely in its capacity as Trustee v. Morgan Stanley Mortgage Capital
Holdings LLC, as successor-by-merger to Morgan Stanley Mortgage Capital Inc ., and Greenpoint Mortgage Funding, Inc. The complaint, filed in the Supreme Court of NY, asserts claims for breach of contract and alleges, among other things,
that the loans in the Trust, which had an original principal balance of approximately $650 million, breached various representations and warranties. The complaint seeks, among other relief, specific performance of the loan breach remedy procedures
in the transaction documents, unspecified damages and interest. On August�22, 2013, the Company a filed a motion to dismiss the complaint. On August�5, 2013, Landesbank Baden-W�rttemberg and two affiliates filed a complaint against the Company and certain affiliates in the Supreme
Court of NY styled Landesbank Baden-W�rttemberg et al. v. Morgan Stanley et al. The complaint alleges that defendants made material misrepresentations and omissions in the sale to plaintiffs of certain mortgage pass-through
certificates backed by securitization trusts containing residential mortgage loans.�The total amount of certificates allegedly sponsored, underwritten and/or sold by the Company to plaintiffs was approximately $50 million.�The complaint
alleges causes of action against the Company for, among other things, common law fraud, fraudulent concealment, aiding and abetting fraud, negligent misrepresentation, and rescission based upon mutual mistake, and seeks, among other things,
rescission, compensatory damages, and punitive damages.�On October�4, 2013, defendants filed a motion to dismiss the complaint. On August�16, 2013, plaintiffs in National Credit Union Administration Board v. Morgan Stanley�& Co. Incorporated, et al. filed a
complaint against the Company and certain affiliates in the United States District Court for the District of Kansas. The complaint alleges that defendants made untrue statements of material fact or omitted to state material facts in the sale to
plaintiffs of certain mortgage pass-through certificates issued by securitization trusts containing residential mortgage loans. The total amount of certificates allegedly sponsored, underwritten and/or sold by the Company to plaintiffs was
approximately $567 million. The complaint alleges causes of action against the Company for violations of Section�11 and Section�12(a)(2) of the Securities Act of 1933, violations of the California Corporate Securities Law of 1968, and
violations of the Kansas Blue Sky Law and seeks, among other things, rescissionary and compensatory damages. The defendants filed a motion to dismiss the complaint on November�4, 2013. On December�27, 2013, the court granted the motion to
dismiss in substantial part. The surviving claims relate to one certificate purchased by the plaintiff for approximately $17 million. On August�26, 2013, a complaint was filed against the Company and certain affiliates in the Supreme Court of NY, styled Phoenix Light SF Limited
et al v. Morgan Stanley et al . The complaint alleges that defendants made untrue statements and material omissions in the sale to plaintiffs, or their assignors, of certain mortgage pass-through certificates backed by securitization trusts
containing residential mortgage loans. The total amount of certificates allegedly issued by the Company and/or sold to plaintiffs or their assignors by the Company was approximately $344 million. The complaint raises common law claims of fraud,
fraudulent inducement, aiding and abetting fraud, negligent misrepresentation and rescission based on mutual mistake and seeks, among other things, compensatory damages, punitive damages or alternatively rescission or rescissionary damages
associated with the purchase of such certificates. The defendants filed a motion to dismiss on December�13, 2013. On September�23, 2013, plaintiffs in National Credit Union Administration Board v. Morgan Stanley�& Co. Inc., et al. filed a
complaint against the Company and certain affiliates in the SDNY. The complaint alleges that defendants made untrue statements of material fact or omitted to state material facts in the sale to plaintiffs of certain mortgage pass-through
certificates issued by securitization trusts containing residential mortgage loans. The total amount of certificates allegedly sponsored, underwritten and/or sold by the Company to plaintiffs was 43 Table of Contents approximately $417 million. The complaint alleges causes of action against the Company for violations of Section�11 and Section�12(a)(2) of the Securities Act of 1933, violations of the
Texas Securities Act, and violations of the Illinois Securities Law of 1953 and seeks, among other things, rescissionary and compensatory damages. The defendants filed a motion to dismiss the complaint on November�13, 2013. On January�22,
2014, the court granted defendants� motion to dismiss with respect to claims arising under the Securities Act of 1933 and denied defendants� motion to dismiss with respect to claims arising under Texas Securities Act and the Illinois
Securities Law of 1953. On November�6, 2013, Deutsche Bank,
in its capacity as trustee, became the named plaintiff in Federal Housing Finance Agency, as Conservator for the Federal Home Loan Mortgage Corporation, on behalf of the Trustee of the Morgan Stanley ABS Capital I Inc. Trust, Series 2007-NC3
(MSAC 2007-NC3) v. Morgan Stanley Mortgage Capital Holdings LLC , and filed a complaint in the Supreme Court of NY under the caption Deutsche Bank National Trust Company, solely in its capacity as Trustee for Morgan Stanley ABS Capital I Inc.
Trust, Series 2007-NC3 v. Morgan Stanley Mortgage Capital Holdings LLC, as Successor-by-Merger to Morgan Stanley Mortgage Capital Inc. The complaint asserts claims for breach of contract and breach of the implied covenant of good faith and fair
dealing and alleges, among other things, that the loans in the trust, which had an original principal balance of approximately $1.3 billion, breached various representations and warranties. The complaint seeks, among other relief, specific
performance of the loan breach remedy procedures in the transaction documents, unspecified damages, rescission, interest and costs. On December�16, 2013, the Company filed a motion to dismiss the complaint. On December�24, 2013, Commerzbank AG London Branch filed a summons with
notice against the Company and others in the Supreme Court of NY, styled Commerzbank AG London Branch v. UBS AG et al. Plaintiff purports to be the assignee of claims of certain other entities. The notice alleges that defendants made material
misrepresentations and omissions in the sale to plaintiff�s assignors of certain mortgage pass-through certificates backed by securitization trusts containing residential mortgage loans. The total amount of certificates allegedly sponsored,
underwritten and/or sold by the Company to plaintiffs was approximately $207 million. The notice identifies causes of action against the Company for, among other things, common-law fraud, fraudulent inducement, aiding and abetting fraud, civil
conspiracy, tortious interference and unjust enrichment. The notice identifies the relief sought to include, among other things, monetary damages of at least approximately $207 million and punitive damages. On December�30, 2013, Wilmington Trust Company, in its capacity as
trustee for Morgan Stanley Mortgage Loan Trust 2007-12, filed a complaint against the Company. The matter is styled Wilmington Trust Company v. Morgan Stanley Mortgage Capital Holdings LLC et al. and is pending in the Supreme Court of NY. The
complaint asserts claims for breach of contract and alleges, among other things, that the loans in the trust, which had an original principal balance of approximately $516 million, breached various representations and warranties. The complaint
seeks, among other relief, unspecified damages, interest and costs. On January�15, 2014, the FDIC, as receiver for United Western Bank filed a complaint against the Company and others in the District Court of the
State of Colorado, styled Federal Deposit Insurance Corporation, as Receiver for United Western Bank v. Banc of America Funding Corp., et al. The complaint alleges that the Company made untrue statements and material omissions in connection
with the sale to United Western Bank of�mortgage pass-through certificates backed by securitization trusts containing residential mortgage loans. The amount of certificates allegedly sponsored, underwritten and/or sold to United Western Bank by
the Company was approximately $75 million. The complaint raises claims under both federal securities law and the Colorado Securities Act and seeks, among other things,�compensatory damages associated with plaintiff�s purchase of such
certificates. Other
Matters. On a case-by-case basis the Company has entered into agreements to toll the statute of limitations applicable to potential civil claims related to RMBS, CDOs and other mortgage-related products and services
when the Company has concluded that it is in its interest to do so. 44 Table of Contents On October�18, 2011, the Company received a letter from Gibbs�& Bruns LLP (the �Law
Firm�), which is purportedly representing a group of investment advisers and holders of mortgage pass-through certificates issued by RMBS trusts that were sponsored or underwritten by the Company. The letter asserted that the Law Firm�s
clients collectively hold 25% or more of the voting rights in 17 RMBS trusts sponsored or underwritten by the Company and that these trusts have an aggregate outstanding balance exceeding $6 billion. The letter alleged generally that large numbers
of mortgages in these trusts were sold or deposited into the trusts based on false and/or fraudulent representations and warranties by the mortgage originators, sellers and/or depositors. The letter also alleged generally that there is evidence
suggesting that the Company has failed prudently to service mortgage loans in these trusts. On January�31, 2012, the Law Firm announced that its clients hold over 25% of the voting rights in 69 RMBS trusts securing over $25 billion of RMBS
sponsored or underwritten by the Company, and that its clients had issued instructions to the trustees of these trusts to open investigations into allegedly ineligible mortgages held by these trusts. The Law Firm�s press release also indicated
that the Law Firm�s clients anticipate that they may provide additional instructions to the trustees, as needed, to further the investigations. On September�19, 2012, the Company received two purported Notices of Non-Performance from the
Law Firm purportedly on behalf of the holders of significant voting rights in various trusts securing over $28 billion of residential mortgage backed securities sponsored or underwritten by the Company. The Notice purports to identify certain
covenants in Pooling and Servicing Agreements (�PSAs�) that the holders allege that the Servicer and Master Servicer failed to perform, and alleges that each of these failures has materially affected the rights of certificateholders and
constitutes an ongoing event of default under the relevant PSAs. On November�2, 2012, the Company responded to the letters, denying the allegations therein. Commercial Mortgage Related Matter. On January�25, 2011, the Company was named as a defendant in The
Bank of New York Mellon Trust, National Association v. Morgan Stanley Mortgage Capital, Inc., a litigation pending in the SDNY. The suit, brought by the trustee of a series of commercial mortgage pass-through certificates, alleges that the
Company breached certain representations and warranties with respect to an $81 million commercial mortgage loan that was originated and transferred to the trust by the Company. The complaint seeks, among other things, to have the Company repurchase
the loan and pay additional monetary damages. On June�27, 2011, the court denied the Company�s motion to dismiss, but directed the filing of an amended complaint. On July�29, 2011, the Company filed its answer to the first amended
complaint. On June�20, 2013, the court granted in part and denied in part the Company�s motion for summary judgment, and denied the plaintiff�s motion for summary judgment. On October�30, 2013, the Company filed a supplemental
motion for summary judgment. Matters Related to the CDS
Market. On July�1, 2013, the European Commission
(�EC�) issued a Statement of Objections (�SO�) addressed to twelve financial firms (including the Company), the International Swaps and Derivatives Association, Inc. (�ISDA�) and Markit Group Limited
(�Markit�) and various affiliates alleging that, between 2006 and 2009, the recipients breached European Union competition law by taking and refusing to take certain actions in an effort to prevent the development of exchange traded credit
default swap (�CDS�) products. The SO indicates that the EC plans to impose remedial measures and fines on the recipients. The Company and the other recipients filed a response to the SO on January�21, 2014. The Company and others
have also responded to an investigation by the Antitrust Division of the United States Department of Justice related to the CDS market. Beginning in May�2013, twelve financial firms (including the Company), as well as ISDA and Markit, were named as defendants in multiple purported
antitrust class actions now consolidated into a single proceeding in the SDNY styled In Re: Credit Default Swaps Antitrust Litigation . Plaintiffs allege that defendants violated United States antitrust laws from 2008 to present in connection
with their alleged efforts to prevent the development of exchange traded CDS products. The complaints seek, among other relief, certification of a class of plaintiffs who purchased CDS from defendants in the United States, treble damages and
injunctive relief. | 45 | |
| | 46 |
| Item�5. | Market for Registrant�s Common Equity, Related Stockholder Matters and Issuer Purchases of Equity Securities. |
| Low Sale�Price | High Sale�Price | Dividends | ||||||||||
| 2013: | ||||||||||||
| Fourth Quarter | $ | 26.41 | $ | 31.85 | $ | 0.05 | ||||||
| Third Quarter | $ | 23.83 | $ | 29.50 | $ | 0.05 | ||||||
| Second Quarter | $ | 20.16 | $ | 27.17 | $ | 0.05 | ||||||
| First Quarter | $ | 19.32 | $ | 24.47 | $ | 0.05 | ||||||
| 2012: | ||||||||||||
| Fourth Quarter | $ | 13.49 | $ | 19.45 | $ | 0.05 | ||||||
| Third Quarter | $ | 12.29 | $ | 18.50 | $ | 0.05 | ||||||
| Second Quarter | $ | 12.26 | $ | 20.05 | $ | 0.05 | ||||||
| First Quarter | $ | 13.49 | $ | 21.19 | $ | 0.05 | ||||||
| 47 | |
| Period | Total Number of Shares Purchased | Average Price Paid�Per Share | Total Number�of Shares Purchased As�Part�of�Publicly Announced Plans or Programs(C) | Approximate�Dollar Value of Shares that May Yet Be Purchased Under the Plans�or Programs | ||||||||||||
| Month�#1�(October 1, 2013�October 31, 2013) | ||||||||||||||||
| Share Repurchase Program(A) | 1,495,000 | $ | 29.26 | 1,495,000 | $ | 1,394 | ||||||||||
| Employee Transactions(B) | 172,249 | $ | 27.46 | � | � | |||||||||||
| Month #2 (November 1, 2013�November 30, 2013) | ||||||||||||||||
| Share Repurchase Program(A) | 4,038,832 | $ | 29.65 | 4,038,832 | $ | 1,274 | ||||||||||
| Employee Transactions(B) | 56,206 | $ | 30.10 | � | � | |||||||||||
| Month #3 (December 1, 2013�December 31, 2013) | ||||||||||||||||
| Share Repurchase Program(A) | 2,087,000 | $ | 30.81 | 2,087,000 | $ | 1,210 | ||||||||||
| Employee Transactions(B) | 170,552 | $ | 31.19 | � | � | |||||||||||
| Total | ||||||||||||||||
| Share Repurchase Program(A) | 7,620,832 | $ | 29.89 | 7,620,832 | $ | 1,210 | ||||||||||
| Employee Transactions(B) | 399,007 | $ | 29.43 | � | � | |||||||||||
| (A) | On December�19, 2006, the Company announced that its Board of Directors authorized the repurchase of up to $6 billion of the Company�s outstanding stock under a share repurchase program (the �Share Repurchase Program�). The Share Repurchase Program is a program for capital management purposes that considers, among other things, business segment capital needs, as well as equity-based compensation and benefit plan requirements. The Share Repurchase Program has no set expiration or termination date. Share repurchases by the Company are subject to regulatory approval. In July 2013, the Company received no objection from the Federal Reserve to repurchase up to $500 million of the Company�s outstanding common stock under rules permitting annual capital distributions (12�Code of Federal Regulations�225.8, Capital Planning ), of which approximately $150�million as of December�31, 2013 may yet be purchased until March�31, 2014. For further information, see �Liquidity and Capital Resources�Capital Management� in Part I, Item�2. |
| (B) | Includes: (1)�shares delivered or attested in satisfaction of the exercise price and/or tax withholding obligations by holders of employee and director stock options (granted under employee and director stock compensation plans) who exercised options; (2)�shares withheld, delivered or attested (under the terms of grants under employee and director stock compensation plans) to offset tax withholding obligations that occur upon vesting and release of restricted shares; (3)�shares withheld, delivered and attested (under the terms of grants under employee and director stock compensation plans) to offset tax withholding obligations that occur upon the delivery of outstanding shares underlying restricted stock units; and (4)�shares withheld, delivered and attested (under the terms of grants under employee and director stock compensation plans) to offset the cash payment for fractional shares. The Company�s employee and director stock compensation plans provide that the value of the shares withheld, delivered or attested, shall be valued using the fair market value of the Company�s common stock on the date the relevant transaction occurs, using a valuation methodology established by the Company. |
| (C) | Share purchases under publicly announced programs are made pursuant to open-market purchases, Rule 10b5-1 plans or privately negotiated transactions (including with employee benefit plans) as market conditions warrant and at prices the Company deems appropriate. |
Table of Contents Stock performance graph. The following graph compares the cumulative total shareholder return
(rounded to the nearest whole dollar) of the Company�s common stock, the S&P 500 Stock Index (�S&P 500�) and the S&P 500 Financials Index (�S5FINL�) for the last five years. The graph assumes a $100 investment at
the closing price on December�31, 2008 and reinvestment of dividends on the respective dividend payment dates without commissions. This graph does not forecast future performance of the Company�s common stock. 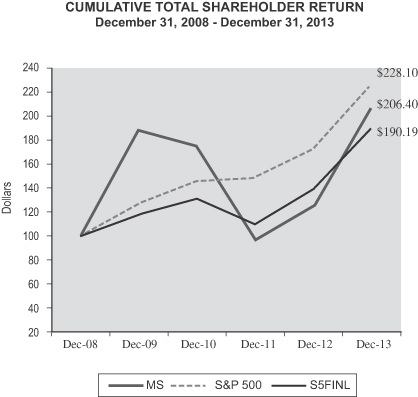
| MS | S&P 500 | S5FINL | ||||||||||
| 12/31/2008 | $ | 100.00 | $ | 100.00 | $ | 100.00 | ||||||
| 12/31/2009 | $ | 187.93 | $ | 126.45 | $ | 117.15 | ||||||
| 12/31/2010 | $ | 174.03 | $ | 145.49 | $ | 131.36 | ||||||
| 12/31/2011 | $ | 97.59 | $ | 148.55 | $ | 108.95 | ||||||
| 12/30/2012 | $ | 124.84 | $ | 172.31 | $ | 140.27 | ||||||
| 12/31/2013 | $ | 206.40 | $ | 228.10 | $ | 190.19 | ||||||
| 49 | |
| Item�6. | Selected Financial Data. |
| 2013 | 2012 | 2011 | 2010 | 2009 | ||||||||||||||||
| Income Statement Data: | ||||||||||||||||||||
| Revenues: | ||||||||||||||||||||
| Investment banking | $ | 5,246 | $ | 4,758 | $ | 4,991 | $ | 5,122 | $ | 5,020 | ||||||||||
| Trading | 9,359 | 6,990 | 12,384 | 9,393 | 7,723 | |||||||||||||||
| Investments | 1,777 | 742 | 573 | 1,825 | (1,034 | ) | ||||||||||||||
| Commissions and fees | 4,629 | 4,253 | 5,343 | 4,909 | 4,210 | |||||||||||||||
| Asset management, distribution and administration fees | 9,638 | 9,008 | 8,409 | 7,843 | 5,802 | |||||||||||||||
| Other | 990 | 556 | 176 | 1,235 | 672 | |||||||||||||||
| Total non-interest revenues | 31,639 | 26,307 | 31,876 | 30,327 | 22,393 | |||||||||||||||
| Interest income | 5,209 | 5,692 | 7,234 | 7,288 | 7,468 | |||||||||||||||
| Interest expense | 4,431 | 5,897 | 6,883 | 6,394 | 6,678 | |||||||||||||||
| Net interest | 778 | (205 | ) | 351 | 894 | 790 | ||||||||||||||
| Net revenues | 32,417 | 26,102 | 32,227 | 31,221 | 23,183 | |||||||||||||||
| Non-interest expenses: | ||||||||||||||||||||
| Compensation and benefits | 16,277 | 15,615 | 16,325 | 15,860 | 14,287 | |||||||||||||||
| Other | 11,658 | 9,967 | 9,792 | 9,154 | 7,753 | |||||||||||||||
| Total non-interest expenses | 27,935 | 25,582 | 26,117 | 25,014 | 22,040 | |||||||||||||||
| Income from continuing operations before income taxes | 4,482 | 520 | 6,110 | 6,207 | 1,143 | |||||||||||||||
| Provision for (benefit from) income taxes | 826 | (237 | ) | 1,414 | 743 | (298 | ) | |||||||||||||
| Income from continuing operations | 3,656 | 757 | 4,696 | 5,464 | 1,441 | |||||||||||||||
| Discontinued operations(1): | ||||||||||||||||||||
| Gain (loss) from discontinued operations | (72 | ) | (48 | ) | (170 | ) | 600 | (127 | ) | |||||||||||
| Provision for (benefit from) income taxes | (29 | ) | (7 | ) | (119 | ) | 362 | (92 | ) | |||||||||||
| Net gain (loss) from discontinued operations | (43 | ) | (41 | ) | (51 | ) | 238 | (35 | ) | |||||||||||
| Net income | 3,613 | 716 | 4,645 | 5,702 | 1,406 | |||||||||||||||
| Net income applicable to redeemable noncontrolling interests(2) | 222 | 124 | � | � | � | |||||||||||||||
| Net income applicable to nonredeemable noncontrolling interests(2) | 459 | 524 | 535 | 999 | 60 | |||||||||||||||
| Net income applicable to Morgan Stanley | $ | 2,932 | $ | 68 | $ | 4,110 | $ | 4,703 | $ | 1,346 | ||||||||||
| Preferred stock dividends | 277 | 98 | 2,043 | 1,109 | 2,253 | |||||||||||||||
| Earnings (loss) applicable to Morgan Stanley common shareholders(3) | $ | 2,655 | $ | (30 | ) | $ | 2,067 | $ | 3,594 | $ | (907 | ) | ||||||||
| Amounts applicable to Morgan Stanley: | ||||||||||||||||||||
| Income from continuing operations | $ | 2,975 | $ | 138 | $ | 4,168 | $ | 4,478 | $ | 1,404 | ||||||||||
| Net gain (loss) from discontinued operations | (43 | ) | (70 | ) | (58 | ) | 225 | (58 | ) | |||||||||||
| Net income applicable to Morgan Stanley | $ | 2,932 | $ | 68 | $ | 4,110 | $ | 4,703 | $ | 1,346 | ||||||||||
Table of Contents| 2013 | 2012 | 2011 | 2010 | 2009 | ||||||||||||||||
| Per Share Data: | ||||||||||||||||||||
| Earnings (loss) per basic common share(4): | ||||||||||||||||||||
| Income (loss) from continuing operations | $ | 1.42 | $ | 0.02 | $ | 1.28 | $ | 2.49 | $ | (0.72 | ) | |||||||||
| Net gain (loss) from discontinued operations | (0.03 | ) | (0.04 | ) | (0.03 | ) | 0.15 | (0.05 | ) | |||||||||||
| Earnings (loss) per basic common share | $ | 1.39 | $ | (0.02 | ) | $ | 1.25 | $ | 2.64 | $ | (0.77 | ) | ||||||||
| Earnings (loss) per diluted common share(4): | ||||||||||||||||||||
| Income (loss) from continuing operations | $ | 1.38 | $ | 0.02 | $ | 1.27 | $ | 2.45 | $ | (0.72 | ) | |||||||||
| Net gain (loss) from discontinued operations | (0.02 | ) | (0.04 | ) | (0.04 | ) | 0.18 | (0.05 | ) | |||||||||||
| Earnings (loss) per diluted common share | $ | 1.36 | $ | (0.02 | ) | $ | 1.23 | $ | 2.63 | $ | (0.77 | ) | ||||||||
| Book value per common share(5) | $ | 32.24 | $ | 30.70 | $ | 31.42 | $ | 31.49 | $ | 27.26 | ||||||||||
| Dividends declared per common share | $ | 0.20 | $ | 0.20 | $ | 0.20 | $ | 0.20 | $ | 0.17 | ||||||||||
| Balance Sheet and Other Operating Data: | ||||||||||||||||||||
| Total assets | $ | 832,702 | $ | 780,960 | $ | 749,898 | $ | 807,698 | $ | 771,462 | ||||||||||
| Total deposits | 112,379 | 83,266 | 65,662 | 63,812 | 62,215 | |||||||||||||||
| Long-term borrowings | 153,575 | 169,571 | 184,234 | 192,457 | 193,374 | |||||||||||||||
| Morgan Stanley shareholders� equity | 65,921 | 62,109 | 62,049 | 57,211 | 46,688 | |||||||||||||||
| Return on average common equity(6) | 4.3 | % | N/M | 3.8 | % | 9.0 | % | N/M | ||||||||||||
| Average common shares outstanding(3): | ||||||||||||||||||||
| Basic | 1,905,823,882 | 1,885,774,276 | 1,654,708,640 | 1,361,670,938 | 1,185,414,871 | |||||||||||||||
| Diluted | 1,956,519,738 | 1,918,811,270 | 1,675,271,669 | 1,411,268,971 | 1,185,414,871 | |||||||||||||||
| (1) | Prior-period amounts have been recast for discontinued operations. See Note 1 to the consolidated financial statements in Item�8 for information on discontinued operations. |
| (2) | Information includes 100%, 65% and 51% ownership of the retail securities joint venture between the Company and Citigroup Inc. (the �Wealth Management JV�) effective June�28, 2013,�September�17, 2012 and May�31, 2009, respectively (see Note 3 to the consolidated financial statements in Item�8). |
| (3) | Amounts shown are used to calculate earnings per basic and diluted common share. |
| (4) | For the calculation of basic and diluted earnings per common share, see Note 16 to the consolidated financial statements in Item�8. |
| (5) | Book value per common share equals common shareholders� equity of $62,701 million at December�31, 2013, $60,601 million at December�31, 2012, $60,541 million at December�31, 2011, $47,614 million at December�31, 2010 and $37,091 million at December�31, 2009, divided by common shares outstanding of 1,945�million at December�31, 2013, 1,974�million at December�31, 2012, 1,927�million at December�31, 2011, 1,512�million at December�31, 2010 and 1,361�million at December�31, 2009. |
| (6) | The calculation of return on average common equity uses net income applicable to Morgan Stanley less preferred dividends as a percentage of average common equity. The return on average common equity is a non-generally accepted accounting principle financial measure that the Company considers to be a useful measure to the Company and investors to assess operating performance. |
| 51 | |
| Item�7. | Management�s Discussion and Analysis of Financial Condition and Results of Operations. |
Table of Contents The discussion of the Company�s results of operations below may contain forward-looking statements.
These statements, which reflect management�s beliefs and expectations, are subject to risks and uncertainties that may cause actual results to differ materially. For a discussion of the risks and uncertainties that may affect the Company�s
future results, see �Forward-Looking Statements� immediately preceding �Business�Competition� and �Business�Supervision and Regulation� in Part I, Item�1, �Risk Factors� in Part I, Item�1A
and �Executive Summary�Significant Items� and �Other Matters� herein. | 53 | |
| 2013 | 2012 | 2011 | ||||||||||
| Net revenues: | ||||||||||||
| Institutional Securities(1) | $ | 15,443 | $ | 11,025 | $ | 17,683 | ||||||
| Wealth Management(1) | 14,214 | 13,034 | 12,772 | |||||||||
| Investment Management | 2,988 | 2,219 | 1,887 | |||||||||
| Intersegment Eliminations | (228 | ) | (176 | ) | (115 | ) | ||||||
| Consolidated net revenues | $ | 32,417 | $ | 26,102 | $ | 32,227 | ||||||
| Net income | $ | 3,613 | $ | 716 | $ | 4,645 | ||||||
| Net income applicable to redeemable noncontrolling interests(2) | 222 | 124 | � | |||||||||
| Net income applicable to nonredeemable noncontrolling interests(2) | 459 | 524 | 535 | |||||||||
| Net income applicable to Morgan Stanley | $ | 2,932 | $ | 68 | $ | 4,110 | ||||||
| Income (loss) from continuing operations applicable to Morgan Stanley: | ||||||||||||
| Institutional Securities(1) | $ | 984 | $ | (797 | ) | $ | 3,450 | |||||
| Wealth Management(1) | 1,488 | 803 | 683 | |||||||||
| Investment Management | 503 | 136 | 35 | |||||||||
| Intersegment Eliminations | � | (4 | ) | � | ||||||||
| Income from continuing operations applicable to Morgan Stanley | $ | 2,975 | $ | 138 | $ | 4,168 | ||||||
| Net gain (loss) from discontinued operations applicable to Morgan Stanley(3) | (43 | ) | (70 | ) | (58 | ) | ||||||
| Net income applicable to Morgan Stanley | $ | 2,932 | $ | 68 | $ | 4,110 | ||||||
| Preferred stock dividends | 277 | 98 | 2,043 | |||||||||
| Earnings (loss) applicable to Morgan Stanley common shareholders | $ | 2,655 | $ | (30 | ) | $ | 2,067 | |||||
| Earnings (loss) per basic common share: | ||||||||||||
| Income from continuing operations | $ | 1.42 | $ | 0.02 | $ | 1.28 | ||||||
| Net gain (loss) from discontinued operations(3) | (0.03 | ) | (0.04 | ) | (0.03 | ) | ||||||
| Earnings (loss) per basic common share(4) | $ | 1.39 | $ | (0.02 | ) | $ | 1.25 | |||||
| Earnings (loss) per diluted common share: | ||||||||||||
| Income from continuing operations | $ | 1.38 | $ | 0.02 | $ | 1.27 | ||||||
| Net gain (loss) from discontinued operations(3) | (0.02 | ) | (0.04 | ) | (0.04 | ) | ||||||
| Earnings (loss) per diluted common share(4) | $ | 1.36 | $ | (0.02 | ) | $ | 1.23 | |||||
| Regional net revenues(5): | ||||||||||||
| Americas | $ | 23,282 | $ | 20,200 | $ | 22,306 | ||||||
| Europe, Middle East and Africa | 4,542 | 3,078 | 6,619 | |||||||||
| Asia | 4,593 | 2,824 | 3,302 | |||||||||
| Net revenues | $ | 32,417 | $ | 26,102 | $ | 32,227 | ||||||
Table of Contents Financial Information and Statistical Data (dollars in millions, except where noted and per share
amounts)�(Continued). | 2013 | 2012 | 2011 | ||||||||||
| Average common equity (dollars in billions): | ||||||||||||
| Institutional Securities | $ | 37.9 | $ | 29.0 | $ | 32.7 | ||||||
| Wealth Management | 13.2 | 13.3 | 13.2 | |||||||||
| Investment Management | 2.8 | 2.4 | 2.6 | |||||||||
| Parent capital | 8.0 | 16.1 | 5.9 | |||||||||
| Consolidated average common equity | $ | 61.9 | $ | 60.8 | $ | 54.4 | ||||||
| Return on average common equity(6): | ||||||||||||
| Institutional Securities | 2.3 | % | N/M | 5.1 | % | |||||||
| Wealth Management | 10.0 | % | 6.0 | % | 3.4 | % | ||||||
| Investment Management | 17.6 | % | 5.4 | % | N/M | |||||||
| Consolidated | 4.4 | % | 0.1 | % | 4.0 | % | ||||||
| Book value per common share(7) | $ | 32.24 | $ | 30.70 | $ | 31.42 | ||||||
| Average tangible common equity (dollars in billions)(8) | $ | 53.0 | $ | 53.9 | $ | 47.5 | ||||||
| Return on average tangible common equity(9) | 5.1 | % | 0.1 | % | 4.5 | % | ||||||
| Tangible book value per common share(10) | $ | 27.16 | $ | 26.86 | $ | 27.95 | ||||||
| Effective income tax rate from continuing operations(11) | 18.4 | % | (45.6 | )% | 23.1 | % | ||||||
| Worldwide employees at December�31, 2013, 2012 and 2011 | 55,794 | 57,061 | 61,546 | |||||||||
| Global Liquidity Reserve held by bank and non-bank legal entities at December�31, 2013, 2012 and 2011 (dollars in billions)(12) | $ | 202 | $ | 182 | $ | 182 | ||||||
| Average Global Liquidity Reserve (dollars in billions)(12): | ||||||||||||
| Bank legal entities | $ | 75 | $ | 63 | $ | 64 | ||||||
| Non-bank legal entities | 117 | 113 | 113 | |||||||||
| Total average Global Liquidity Reserve | $ | 192 | $ | 176 | $ | 177 | ||||||
| Long-term borrowings at December�31, 2013, 2012 and 2011 | $ | 153,575 | $ | 169,571 | $ | 184,234 | ||||||
| Maturities of long-term borrowings outstanding at December�31, 2013, 2012 and 2011 (next 12 months) | $ | 24,193 | $ | 25,303 | $ | 35,082 | ||||||
| Capital ratios at December�31, 2013, 2012 and 2011: | ||||||||||||
| Total capital ratio(13) | 16.9 | % | 18.5 | % | 17.5 | % | ||||||
| Tier 1 common capital ratio(13) | 12.8 | % | 14.6 | % | 12.6 | % | ||||||
| Tier 1 capital ratio(13) | 15.7 | % | 17.7 | % | 16.2 | % | ||||||
| Tier 1 leverage ratio(14) | 7.6 | % | 7.1 | % | 6.6 | % | ||||||
| Consolidated assets under management or supervision at December�31, 2013, 2012 and 2011 (dollars in billions)(15): | ||||||||||||
| Investment Management(16) | $ | 373 | $ | 338 | $ | 287 | ||||||
| Wealth Management(1)(17) | 692 | 551 | 472 | |||||||||
| Total | $ | 1,065 | $ | 889 | $ | 759 | ||||||
| 55 | |
| 2013 | 2012 | 2011 | ||||||||||
| Institutional Securities(1): | ||||||||||||
| Pre-tax profit margin(18) | 6 | % | N/M | 26 | % | |||||||
| Wealth Management(1)(17): | ||||||||||||
| Wealth Management representatives at December�31, 2013, 2012 and 2011(19) | 16,456 | 16,352 | 17,033 | |||||||||
| Annual revenues per representative (dollars in thousands)(20) | $ | 867 | $ | 786 | $ | 731 | ||||||
| Assets by client segment at December�31, 2013, 2012 and 2011 (dollars in billions): | ||||||||||||
| $10 million or more | $ | 678 | $ | 538 | $ | 468 | ||||||
| $1 million to $10 million | 776 | 699 | 682 | |||||||||
| Subtotal $1 million or more | 1,454 | 1,237 | 1,150 | |||||||||
| $100,000 to $1 million | 414 | 414 | 375 | |||||||||
| Less than $100,000 | 41 | 45 | 41 | |||||||||
| Total client assets | $ | 1,909 | $ | 1,696 | $ | 1,566 | ||||||
| Fee-based client assets as a percentage of total client assets(21) | 37 | % | 33 | % | 30 | % | ||||||
| Client assets per representative(22) | $ | 116 | $ | 104 | $ | 92 | ||||||
| Fee-based client asset flows (dollars in billions)(23) | $ | 51.9 | $ | 26.9 | $ | 47.0 | ||||||
| Bank deposits at December�31, 2013, 2012 and 2011 (dollars in billions)(24) | $ | 134 | $ | 131 | $ | 111 | ||||||
| Retail locations at December�31, 2013, 2012 and 2011 | 649 | 694 | 734 | |||||||||
| Pre-tax profit margin(18) | 18 | % | 12 | % | 10 | % | ||||||
| Investment Management: | ||||||||||||
| Pre-tax profit margin(18) | 33 | % | 27 | % | 13 | % | ||||||
| Selected management financial measures, excluding DVA: | ||||||||||||
| Net revenues, excluding DVA(25) | $ | 33,098 | $ | 30,504 | $ | 28,546 | ||||||
| Income from continuing operations applicable to Morgan Stanley, excluding DVA(25) | $ | 3,427 | $ | 3,256 | $ | 1,893 | ||||||
| Income per diluted common share from continuing operations, excluding DVA(25) | $ | 1.61 | $ | 1.64 | $ | (0.08 | ) | |||||
| Return on average common equity, excluding DVA(6) | 5.0 | % | 5.2 | % | N/M | |||||||
| Return on average tangible common equity, excluding DVA(9) | 5.8 | % | 5.9 | % | N/M | |||||||
| (1) | On January�1, 2013, the International Wealth Management business was transferred from the Wealth Management business segment to the Equity division within the Institutional Securities business segment. Accordingly, all results and statistical data have been recast for all periods to reflect the International Wealth Management business as part of the Institutional Securities business segment. |
| (2) | See Notes 2, 3 and 15 to the consolidated financial statements in Item�8 for information on redeemable and nonredeemable noncontrolling interests. |
| (3) | See Note 1 to the consolidated financial statements in Item�8 for information on discontinued operations. |
| (4) | For the calculation of basic and diluted earnings per share (�EPS�), see Note 16 to the consolidated financial statements in Item�8. |
| (5) | Regional net revenues reflect the regional view of the Company�s consolidated net revenues, on a managed basis. For further discussion regarding the geographic methodology for net revenues, see Note 21 to the consolidated financial statements in Item�8. |
| (6) | The calculation of each business segment�s return on average common equity uses income from continuing operations applicable to Morgan Stanley less preferred dividends as a percentage of each business segment�s average common equity. The return on average common equity is a non-generally accepted accounting principle (�non-GAAP�) financial measure that the Company considers to be a useful measure to the Company and investors to assess operating performance. The computation of average common equity for each business segment is determined using the Company�s Required Capital framework (�Required Capital Framework�), an internal capital adequacy measure (see �Liquidity and Capital Resources�Regulatory Requirements�Required Capital� herein). The effective tax rates used in the computation of business segments� return on average common equity were determined on a separate legal entity basis. To |
Table of Contents| determine the return on consolidated average common equity, excluding the impact of DVA, also a non-GAAP financial measure, both the numerator and the denominator were adjusted to exclude the impact of DVA. The impact of DVA in 2013, 2012 and 2011 was (0.6)%, (5.1)% and 4.2%, respectively. |
| (7) | Book value per common share equals common shareholders� equity of $62,701 million at December�31, 2013, $60,601 million at December�31, 2012 and $60,541 million at December�31, 2011 divided by common shares outstanding of 1,945�million at December�31, 2013, 1,974�million at December�31, 2012 and 1,927�million at December�31, 2011. Book value per common share in 2011 was reduced by approximately $2.61 per share as a result of the Mitsubishi UFJ Financial Group, Inc. (�MUFG�) stock conversion (see �Significant Items�MUFG Stock Conversion� herein). |
| (8) | Average tangible common equity is a non-GAAP financial measure that the Company considers to be a useful measure that the Company and investors use to assess capital adequacy. For a discussion of tangible common equity, see �Liquidity and Capital Resources�Capital Management� herein. |
| (9) | Return on average tangible common equity is a non-GAAP financial measure that the Company considers to be a useful measure that the Company and investors use to assess capital adequacy. The calculation of return on average tangible common equity uses income from continuing operations applicable to Morgan Stanley less preferred dividends as a percentage of average tangible common equity. To determine the return on average tangible common equity, excluding the impact of DVA, also a non-GAAP financial measure, both the numerator and the denominator were adjusted to exclude the impact of DVA. The impact of DVA in 2013, 2012 and 2011 was (0.7)%, (5.8)% and 4.8%, respectively. |
| (10) | Tangible book value per common share equals tangible common equity of $52,828 million at December�31, 2013, $53,014 million at December�31, 2012 and $53,850 million at December�31, 2011 divided by common shares outstanding of 1,945�million at December�31, 2013, 1,974�million at December�31, 2012 and 1,927�million at December�31, 2011. Tangible book value per common share is a non-GAAP financial measure that the Company considers to be a useful measure that the Company and investors use to assess capital adequacy. |
| (11) | For a discussion of the effective income tax rate, see �Overview of 2013 Financial Results� and �Significant Items�Income Tax Items� herein. |
| (12) | For a discussion of Global Liquidity Reserve, see �Liquidity and Capital Resources�Liquidity Risk Management Framework�Global Liquidity Reserve� herein. |
| (13) | As of December�31, 2013, the Company calculated its Total, Tier�1 and Tier�1 common capital ratios and risk-weighted assets (�RWAs�) in accordance with the capital adequacy standards for financial holding companies adopted by the Board of Governors of the Federal Reserve System (the �Federal Reserve�). These standards are based upon a framework described in the International Convergence of Capital Measurement and Capital Standards, July 1988, as amended, also referred to as Basel I. On January�1, 2013, the U.S. banking regulators� rules to implement the Basel Committee on Banking Supervision�s market risk capital framework amendment, commonly referred to as �Basel 2.5�, became effective, which increased the capital requirements for securitizations and correlation trading within the Company�s trading book, as well as incorporated add-ons for stressed Value-at-Risk (�VaR�) and incremental risk requirements (�market risk capital framework amendment�). The Company�s Total, Tier 1 and Tier 1 common capital ratios and RWAs for 2013 were calculated under this revised framework. The Company�s Total, Tier 1 and Tier 1 common capital ratios and RWAs for prior periods have not been recalculated under this revised framework. For a discussion of Total, Tier�1 and Tier�1 common capital ratios, see �Liquidity and Capital Resources�Regulatory Requirements� herein. |
| (14) | For a discussion of Tier 1 leverage ratio, see �Liquidity and Capital Resources�Regulatory Requirements� herein. |
| (15) | Revenues and expenses associated with these assets are included in the Company�s Wealth Management and Investment Management business segments. |
| (16) | Amounts exclude the Investment Management business segment�s proportionate share of assets managed by entities in which it owns a minority stake. |
| (17) | Prior-period amounts have been recast to exclude Quilter�& Co. Ltd. (�Quilter�). See Note 1 to the consolidated financial statements in Item�8 for information on discontinued operations. |
| (18) | Pre-tax profit margin is a non-GAAP financial measure that the Company considers to be a useful measure that the Company and investors use to assess operating performance. Percentages represent income from continuing operations before income taxes as a percentage of net revenues. |
| (19) | At December�31, 2013, 2012 and 2011, global representatives for the Company were 16,784, 16,780 and 17,512, which include approximately 328, 428 and 479 representatives associated with the International Wealth Management business, the results of which are reported in the Institutional Securities business segment, respectively. |
| (20) | Annual revenues per representative in 2013, 2012 and 2011 equal Wealth Management business segment�s annual revenues divided by the average representative headcount in 2013, 2012 and 2011, respectively. |
| (21) | Fee-based client assets represent the amount of assets in client accounts where the basis of payment for services is a fee calculated on those assets. Effective in 2013, client assets also include certain additional non-custodied assets as a result of the completion of the purchase of the remaining interest in the retail securities joint venture between the Company and Citigroup Inc. (�Citi�) (the �Wealth Management JV�) platform conversion. |
| (22) | Client assets per representative equal total period-end client assets divided by period-end representative headcount. |
| (23) | Beginning January�1, 2013, the Company enhanced its definition of fee-based asset flows. Fee-based asset flows have been recast for all periods to include dividends, interest and client fees and to exclude cash management related activity. |
| (24) | Approximately $104 billion, $72�billion and $56 billion of the bank deposit balances at December�31, 2013, 2012 and 2011, respectively, are held at Company-affiliated depositories with the remainder held at Citi affiliated depositories. The Company considers the remaining deposits held with Citi affiliated depositories a non-GAAP measure, which the Company and investors use to assess deposits in the |
| 57 | |
| Wealth Management business segment. The deposit balances are held at certain of the Company�s Federal Deposit Insurance Corporation (the �FDIC�) insured depository institutions for the benefit of the Company�s clients through their accounts. For additional information regarding deposits, see Notes 3, 10 and 25 to the consolidated financial statements in Item�8 and �Liquidity and Capital Resources�Funding Management�Deposits� herein. |
| (25) | From time to time, the Company may disclose certain �non-GAAP financial measures� in the course of its earnings releases, earnings conference calls, financial presentations and otherwise. For these purposes, �GAAP� refers to generally accepted accounting principles in the U.S. The U.S. Securities and Exchange Commission defines a �non-GAAP financial measure� as a numerical measure of historical or future financial performance, financial positions, or cash flows that excludes or includes amounts or is subject to adjustments that effectively exclude, or include, amounts from the most directly comparable measure calculated and presented in accordance with GAAP. Non-GAAP financial measures disclosed by the Company are provided as additional information to investors in order to provide them with further transparency about, or an alternative method for assessing, our financial condition and operating results. These measures are not in accordance with, or a substitute for, GAAP, and may be different from or inconsistent with non-GAAP financial measures used by other companies. Whenever the Company refers to a non-GAAP financial measure, the Company will also generally present the most directly comparable financial measure calculated and presented in accordance with GAAP, along with a reconciliation of the differences between the non-GAAP financial measure and the GAAP financial measure. |
| 2013 | 2012 | 2011 | ||||||||||
| Reconciliation of Selected Management Financial Measures from a Non-GAAP to a GAAP Basis (dollars in millions, except per share amounts): | ||||||||||||
| Net revenues | ||||||||||||
| Net revenues�non-GAAP | $ | 33,098 | $ | 30,504 | $ | 28,546 | ||||||
| Impact of DVA | (681 | ) | (4,402 | ) | 3,681 | |||||||
| Net revenues�GAAP | $ | 32,417 | $ | 26,102 | $ | 32,227 | ||||||
| Income (loss) from continuing operations applicable to Morgan Stanley | ||||||||||||
| Income applicable to Morgan Stanley�non-GAAP | $ | 3,427 | $ | 3,256 | $ | 1,893 | ||||||
| Impact of DVA | (452 | ) | (3,118 | ) | 2,275 | |||||||
| Income applicable to Morgan Stanley�GAAP | $ | 2,975 | $ | 138 | $ | 4,168 | ||||||
| Earnings (loss) per diluted common share | ||||||||||||
| Income from continuing operations per diluted common share�non-GAAP | $ | 1.61 | $ | 1.64 | $ | (0.08 | ) | |||||
| Impact of DVA | (0.23 | ) | (1.62 | ) | 1.35 | |||||||
| Income from continuing operations per diluted common share�GAAP | $ | 1.38 | $ | 0.02 | $ | 1.27 | ||||||
| Average diluted shares�non-GAAP (in millions) | 1,957 | 1,919 | 1,655 | |||||||||
| Impact of DVA (in millions) | � | � | 20 | |||||||||
| Average diluted shares�GAAP (in millions) | 1,957 | 1,919 | 1,675 | |||||||||
Table of Contents Global Market and Economic Conditions. During 2013, global market and economic conditions showed improvement from
2012, though significant uncertainty remained. Investor sentiment was boosted by encouraging signs of improvement in the global economy during the second half of 2013. The U.S. economy continued its moderate growth pace, but while as a whole the
recession in the euro-area came to an end, significant pockets of slow or negative growth remained in Europe. During 2013, global market and economic conditions were also challenged by investor concerns about the U.S. longer-term budget outlook and
the scaling back of monetary stimulus, the remaining European sovereign debt issues and slowing economic growth in emerging markets. Shorter-term concerns over the U.S. budget standoff were resolved in late 2013 as Congress came to a tentative
agreement on federal government funding for the next two fiscal years. The agreement was in response to a shut-down of the U.S. federal government that lasted for 16 days during October 2013. Elsewhere, especially in parts of Europe, growth remains
stymied by fiscal and longer-term structural issues in the economy. In the U.S., major equity market indices ended the year significantly higher compared with year-end 2012. The U.S. economy continued its moderate growth
pace in 2013. Labor market conditions improved as the unemployment rate declined to 6.7% at December�31, 2013 from 7.9% at December�31, 2012. Consumer spending and business investment advanced during 2013. The housing market generally
strengthened in 2013, although rising mortgage rates have resulted in recent softness in housing starts and home sales. Apart from fluctuations due to changes in energy prices, inflation has been running below the Federal Reserve�s longer-run
objective, but longer-term inflation expectations have remained stable. The Federal Open Market Committee (�FOMC�) of the Federal Reserve kept key interest rates at historically low levels. At December�31, 2013, the federal funds
target rate remained between 0.0% and 0.25%, and the discount rate remained at 0.75%. Earlier in 2013 concerns about the Federal Reserve�s plan to scale back its monetary stimulus plan caused investors to sell off holdings. Subsequently, the
FOMC announced in December that it would be decreasing its purchases of Treasury and mortgage-backed securities in January 2014. The continuing U.S. recovery, though tepid, is also relieving some of the pressure on the federal budget experienced
during the past several years. In Europe, major equity market
indices finished 2013 higher compared with year-end 2012. Euro-area gross domestic product started to grow in the second quarter of 2013, and the European Central Bank (�ECB�) views this as a gradual recovery in economic conditions, albeit
with significant downside risks. The euro-area unemployment rate increased to 12.0% at December�31, 2013 from 11.9% at 2012 year-end. At December�31, 2013, Bank of England�s benchmark interest rate was 0.5%, which was unchanged from
December�31, 2012. To stimulate economic activity in Europe, during 2013 the ECB lowered the benchmark interest rate from 0.75% to 0.25% and indicated it will keep open its special liquidity facilities until at least the middle of 2014. Major equity market indices in Asia ended the year higher, with
the notable exception of the Shanghai Stock Exchange Composite Index in China. Japan�s economic activity grew moderately during 2013, primarily resulting from a series of economic stimulus packages announced by the Japanese government and the
Bank of Japan (�BOJ�) in early 2013. The BOJ maintained its monetary stimulus plan during the remainder of 2013. The pace of China�s economic growth slowed during 2013, though China�s overall growth was still strong compared with
the U.S., Europe and Japan. During 2013, the Chinese government began to implement reforms to restructure its economy away from reliance on exports and investments and toward more sustainable growth driven by domestic consumption. Overview of 2013 Financial Results. Consolidated Results .����The Company recorded net
income applicable to Morgan Stanley of $2,932 million on net revenues of $32,417 million in 2013 compared with net income applicable to Morgan Stanley of $68 million on net revenues of $26,102 million in 2012. Net revenues in 2013 included negative revenues due to the impact of DVA of
$681 million compared with negative revenues of $4,402 million in 2012. Non-interest expenses increased 9% to $27,935 million in 2013 compared with $25,582 million in 2012. Compensation expenses increased 4% to $16,277 million in 2013 | 59 | |
Table of Contents higher balances in the bank deposit program and growth in loans and lending commitments in Portfolio Loan Account (�PLA�) securities-based lending products. In addition, interest
expense declined in 2013 due to the Company�s redemption of all Class�A Preferred Interests owned by Citi and its affiliates, in connection with the Company�s acquisition of 100% ownership of the Wealth Management JV effective at the
end of the second quarter of 2013. Total client asset balances were $1,909 billion at December�31, 2013 and client assets in fee-based accounts were $697 billion, or 37% of total client assets. Fee-based client asset flows for 2013 were $51.9
billion compared with $26.9 billion in 2012. Prior period amounts have been recast to reflect the transfer of the International Wealth Management business from the Wealth Management business segment to the Institutional Securities business segment
and for the Company�s enhanced definition of fee-based asset flows (see �Business Segments� herein). Compensation and benefits expenses increased 6% from 2012 to $8,271 million in 2013, primarily due to higher compensable revenues.
Non-compensation expenses decreased 8% from 2012 to $3,314 million in 2013, primarily driven by the absence of platform integration costs and non-recurring technology write-offs, partially offset by an impairment expense of $36 million related to
certain intangible assets (management contracts) associated with alternative investment funds in 2013. Investment Management. Income from continuing operations before taxes was $984 million in 2013 compared with $590 million in 2012. Net revenues were $2,988 million in 2013
compared with $2,219 million in 2012. The increase in net revenues reflected higher net investment gains predominantly within the Company�s Merchant Banking and Real Estate Investing businesses and higher gains on certain investments associated
with the Company�s employee deferred compensation and co-investment plans. Results in 2013 also included an additional allocation of fund income to the Company as general partner, upon exceeding cumulative fund performance thresholds
(�carried interest�). Non-interest expenses were $2,004 million in 2013 compared with $1,629 million in 2012. Compensation and benefits expenses increased 41% to $1,183 million in 2013, primarily due to higher net revenues.
Non-compensation expenses increased 4% to $821 million in 2013, primarily due to higher brokerage and clearing and professional services expenses, partially offset by lower information processing expenses. Significant Items. Litigation. The Company incurred litigation
expenses of approximately $1,952 million in 2013, $513 million in 2012 and $151 million in 2011. The litigation expenses incurred in 2013 were primarily due to settlements and reserve additions related to residential mortgage-backed securities and
credit crisis-related matters (see �Contingencies�Legal� in Note 13 to the consolidated financial statements in Item 8). Litigation expenses are included in Other expenses in the consolidated statements of income. The Company expects
future litigation expenses in general to continue to be elevated, and the changes in expenses from period to period may fluctuate significantly, given the current environment regarding financial crisis-related government investigations and private
litigation affecting global financial services firms, including the Company. Investment Gains .����The Company�s Investments revenues increased to $1,777 million in 2013 compared with $742 million in 2012. Of this increase, $543 million related to
higher net investment gains and to a lesser extent the benefit of carried interest within the Company�s Merchant Banking and Real Estate Investing businesses in the Investment Management business segment. In addition, the increase includes a
gain on the disposition of an investment in an insurance broker in 2013 in the Institutional Securities business segment. Japanese Securities Joint Venture. During 2013, 2012 and 2011, the Company recorded income (loss) of $570 million, $152
million and $(783) million, respectively, within Other revenues in the consolidated statements of income, arising from the Company�s 40% stake in MUMSS. Net income applicable to nonredeemable noncontrolling interests associated with MUFG�s
interest in Morgan Stanley MUFG Securities Co., Ltd. (�MSMS�) was $259 million, $163 million and $1 million for 2013, 2012 and 2011, respectively (see Note 22 to the consolidated financial statements in Item�8). In June 2013, MUMSS paid a dividend of approximately $287 million, of which
the Company received approximately $115 million for its proportionate share of MUMSS. | 61 | |
| 2013 | 2012 | 2011 | ||||||||||
| (dollars in millions) | ||||||||||||
| Other sales and trading: | ||||||||||||
| Gains (losses) on loans and lending commitments and Net interest(1) | $ | 596 | $ | 1,650 | $ | (699 | ) | |||||
| Gains (losses) on hedges | (156 | ) | (910 | ) | 68 | |||||||
| Total Other sales and trading revenues | $ | 440 | $ | 740 | $ | (631 | ) | |||||
| Other revenues: | ||||||||||||
| Provision for loan losses | $ | (46 | ) | $ | (85 | ) | $ | (6 | ) | |||
| Losses on loans held for sale | (68 | ) | (54 | ) | � | |||||||
| Total Other revenues | $ | (114 | ) | $ | (139 | ) | $ | (6 | ) | |||
| Other expenses: Provision for unfunded commitments | (45 | ) | (71 | ) | (18 | ) | ||||||
| Total | $ | 281 | $ | 530 | $ | (655 | ) | |||||
| (1) | Effective April 2012, the Company began accounting for all new originated loans and lending commitments as either held for investment or held for sale. |
Table of Contents Available for Sale Securities. During 2013, 2012 and 2011, the available for
sale portfolio held within the Wealth Management business segment reported unrealized gains (losses) of $(433) million, $28 million and $87 million, net of tax, respectively, that were included in Accumulated other comprehensive income. The
unrealized losses were primarily due to changes in interest rates. The securities in the Company�s available for sale portfolio with an unrealized loss were not other-than-temporarily impaired at December�31, 2013, 2012 and 2011. For more
information, see Notes 2 and 5 to the consolidated financial statements in Item�8. Monoline Insurers .����The results for 2011 included losses of $1,838 million related to the Company�s counterparty credit exposures to Monoline Insurers
(�Monolines�), principally MBIA Insurance Corporation (�MBIA�). During 2011, the Company announced a comprehensive settlement with MBIA. The settlement terminated outstanding credit default swap (�CDS�) protection purchased from MBIA on commercial
mortgage-backed securities and resolved pending litigation between the two parties for consideration of a net cash payment to the Company. MUFG Stock Conversion. On June�30, 2011, the Company�s outstanding Series B Preferred Stock owned by MUFG with a
face value of $7.8 billion (carrying value $8.1 billion) and a 10% dividend was converted into 385,464,097 shares of the Company�s common stock, including approximately 75�million shares resulting from the adjustment to the conversion
ratio pursuant to the transaction agreement. As a result of the adjustment to the conversion ratio, the Company incurred a one-time, non-cash negative adjustment of approximately $1.7 billion in its calculation of basic and diluted earnings per
share during 2011. European Peripheral
Countries .����On December�22, 2011, the Company entered into agreements to restructure�certain derivative transactions that decreased its exposure to obligors in Greece, Ireland, Italy, Portugal and Spain (the
�European Peripherals�).�As a result, the Company�s results in 2011 included interest rate product revenues of approximately $600 million related primarily to the release of credit valuation adjustments associated with the
transactions, reported within Trading revenues in the consolidated statement of income. Huaxin Securities Joint Venture. In June 2011, the Company�and Huaxin Securities Co.,�Ltd. (also known as China Fortune Securities Co.,�Ltd.) jointly announced
the operational commencement of their securities joint venture in China.�During 2011, the Company recorded initial costs of $130 million related to the formation of this joint venture in Other expenses in the consolidated statement of income. Business Segments. Substantially all of the Company�s operating revenues and operating
expenses are allocated to its business segments. Certain revenues and expenses have been allocated to each business segment, generally in proportion to its respective net revenues, non-interest expenses or other relevant measures. As a result of treating certain intersegment transactions as transactions
with external parties, the Company includes an Intersegment Eliminations category to reconcile the business segment results to the Company�s consolidated results. Intersegment Eliminations also reflect the effect of fees paid by the
Institutional Securities business segment to the Wealth Management business segment related to the bank deposit program. On January�1, 2013, the International Wealth Management business was transferred from the Wealth Management business segment to the Equity division
within the Institutional Securities business segment. Accordingly, all results and statistical data have been recast for all periods to reflect the International Wealth Management business as part of the Institutional Securities business segment. | 63 | |
Table of Contents on that exchange or clearinghouse. Additionally, there are certain investments related to assets held by consolidated real estate funds, which are primarily related to holders of noncontrolling
interests. Commissions and
Fees. Commission and fee revenues primarily arise from agency transactions in listed and over-the-counter (�OTC�) equity securities, services related to sales and trading activities, and sales of mutual funds,
futures, insurance products and options. Asset Management,
Distribution and Administration Fees. Asset management, distribution and administration fees include fees associated with the management and supervision of assets, account services and administration, performance-based
fees relating to certain funds, separately managed accounts, shareholder servicing and the distribution of certain open-ended mutual funds. Asset management, distribution and administration fees in the Wealth Management business segment also include revenues from individual investors electing
a fee-based pricing arrangement and fees for investment management. Mutual fund distribution fees in the Wealth Management business segment are based on either the average daily fund net asset balances or average daily aggregate net fund sales and
are affected by changes in the overall level and mix of assets under management or supervision. Asset management fees in the Investment Management business segment arise from investment management services the Company provides to investment vehicles pursuant to various contractual arrangements. The
Company receives fees primarily based upon mutual fund daily average net assets or based on monthly or quarterly invested equity for other vehicles. Performance-based fees in the Investment Management business segment are earned on certain funds as
a percentage of appreciation earned by those funds and, in certain cases, are based upon the achievement of performance criteria. These fees are normally earned annually and are recognized on a monthly or quarterly basis. Net Interest. Interest income and Interest
expense are a function of the level and mix of total assets and liabilities, including trading assets and trading liabilities; securities available for sale; securities borrowed or purchased under agreements to resell; securities loaned or sold
under agreements to repurchase; loans; deposits; commercial paper and other short-term borrowings; long-term borrowings; trading strategies; customer activity in the Company�s prime brokerage business; and the prevailing level, term structure
and volatility of interest rates. Certain Securities purchased under agreements to resell (�reverse repurchase agreements�) and Securities sold under agreements to repurchase (�repurchase agreements�) and Securities borrowed and
Securities loaned transactions may be entered into with different customers using the same underlying securities, thereby generating a spread between the interest revenues on the reverse repurchase agreements or securities borrowed transactions and
the interest expense on the repurchase agreements or securities loaned transactions. Lending Activities. The Company provides loans to a variety of customers, from large corporate and institutional clients to high net worth individuals, primarily through its U.S. bank subsidiaries, Morgan Stanley Bank, N.A.
(�MSBNA�) and Morgan Stanley Private Bank, National Association (�MSPBNA�). The Company�s lending activities in the Institutional Securities business segment primarily include corporate lending activities, in which the
Company provides loans or lending commitments to selected corporate clients. In addition to corporate lending activity, the Institutional Securities business segment engages to a lesser extent in other lending activity, including corporate loans
purchased and sold in the secondary market. The Company�s lending activities in the Wealth Management business segment principally include margin loans collateralized by securities, securities-based lending that allows clients to borrow money
against the value of qualifying securities in PLAs and residential mortgage lending. The Company�s lending activities have grown during 2013 and 2012 and the Company expects this trend to continue. For a further discussion of the Company�s
credit risks, see �Quantitative and Qualitative Disclosures about Market Risk�Risk Management�Credit Risk� in Item�7A. See also Notes 8 and 13 to the consolidated financial statements in Item�8 for additional
information about the Company�s financing receivables and lending commitments, respectively. | 65 | |
| 2013 | 2012(1) | 2011(1) | ||||||||||
| (dollars in millions) | ||||||||||||
| Revenues: | ||||||||||||
| Investment banking | $ | 4,377 | $ | 3,930 | $ | 4,240 | ||||||
| Trading | 8,147 | 6,002 | 11,425 | |||||||||
| Investments | 707 | 219 | 239 | |||||||||
| Commissions and fees | 2,425 | 2,176 | 2,849 | |||||||||
| Asset management, distribution and administration fees | 280 | 242 | 206 | |||||||||
| Other | 608 | 203 | (236 | ) | ||||||||
| Total non-interest revenues | 16,544 | 12,772 | 18,723 | |||||||||
| Interest income | 3,572 | 4,224 | 5,860 | |||||||||
| Interest expense | 4,673 | 5,971 | 6,900 | |||||||||
| Net interest | (1,101 | ) | (1,747 | ) | (1,040 | ) | ||||||
| Net revenues | 15,443 | 11,025 | 17,683 | |||||||||
| Compensation and benefits | 6,823 | 6,978 | 7,567 | |||||||||
| Non-compensation expenses | 7,751 | 5,735 | 5,566 | |||||||||
| Total non-interest expenses | 14,574 | 12,713 | 13,133 | |||||||||
| Income (loss) from continuing operations before income taxes | 869 | (1,688 | ) | 4,550 | ||||||||
| Provision for (benefit from) income taxes | (393 | ) | (1,061 | ) | 880 | |||||||
| Income (loss) from continuing operations | 1,262 | (627 | ) | 3,670 | ||||||||
| Discontinued operations: | ||||||||||||
| Gain (loss) from discontinued operations | (81 | ) | (158 | ) | (216 | ) | ||||||
| Provision for (benefit from) income taxes | (29 | ) | (36 | ) | (110 | ) | ||||||
| Net gains (losses) on discontinued operations | (52 | ) | (122 | ) | (106 | ) | ||||||
| Net income (loss) | 1,210 | (749 | ) | 3,564 | ||||||||
| Net income applicable to redeemable noncontrolling interests | 1 | 4 | � | |||||||||
| Net income applicable to nonredeemable noncontrolling interests | 277 | 170 | 220 | |||||||||
| Net income (loss) applicable to Morgan Stanley | $ | 932 | $ | (923 | ) | $ | 3,344 | |||||
| Amounts applicable to Morgan Stanley: | ||||||||||||
| Income (loss) from continuing operations | $ | 984 | $ | (797 | ) | $ | 3,450 | |||||
| Net gains (losses) from discontinued operations | (52 | ) | (126 | ) | (106 | ) | ||||||
| Net income (loss) applicable to Morgan Stanley | $ | 932 | $ | (923 | ) | $ | 3,344 | |||||
| (1) | Prior-period amounts have been recast to reflect the transfer of the International Wealth Management business from the Wealth Management business segment to the Institutional Securities business segment. |
Table of Contents Investment banking revenues were as follows: | 2013 | 2012 | 2011 | ||||||||||
| (dollars�in�millions) | ||||||||||||
| Advisory revenues | $ | 1,310 | $ | 1,369 | $ | 1,737 | ||||||
| Underwriting revenues: | ||||||||||||
| Equity underwriting revenues | 1,262 | 892 | 1,144 | |||||||||
| Fixed income underwriting revenues | 1,805 | 1,669 | 1,359 | |||||||||
| Total underwriting revenues | 3,067 | 2,561 | 2,503 | |||||||||
| Total investment banking revenues | $ | 4,377 | $ | 3,930 | $ | 4,240 | ||||||
| 2013(1) | 2012(1) | 2011(1) | ||||||||||
| (dollars�in�billions) | ||||||||||||
| Announced mergers and acquisitions(2) | $ | 520 | $ | 464 | $ | 510 | ||||||
| Completed mergers and acquisitions(2) | 508 | 391 | 657 | |||||||||
| Equity and equity-related offerings(3) | 61 | 52 | 47 | |||||||||
| Fixed income offerings(4) | 287 | 284 | 231 | |||||||||
| (1) | Source: Thomson Reuters, data at January�14, 2014. Announced and completed mergers and acquisitions volumes are based on full credit to each of the advisors in a transaction. Equity and equity-related offerings and fixed income offerings are based on full credit for single book managers and equal credit for joint book managers. Transaction volumes may not be indicative of net revenues in a given period. In addition, transaction volumes for prior periods may vary from amounts previously reported due to the subsequent withdrawal or change in the value of a transaction. |
| (2) | Amounts include transactions of $100 million or more. Announced mergers and acquisitions exclude terminated transactions. |
| (3) | Amounts include Rule 144A and public common stock, convertible and rights offerings. |
| (4) | Amounts include non-convertible preferred stock, mortgage-backed and asset-backed securities and taxable municipal debt. Amounts also include publicly registered and Rule 144A issues. Amounts exclude leveraged loans and self-led issuances. |
| 67 | |
| 2013 | 2012(1) | 2011(1) | ||||||||||
| (dollars�in�millions) | ||||||||||||
| Trading | $ | 8,147 | $ | 6,002 | $ | 11,425 | ||||||
| Commissions and fees | 2,425 | 2,176 | 2,849 | |||||||||
| Asset management, distribution and administration fees | 280 | 242 | 206 | |||||||||
| Net interest | (1,101 | ) | (1,747 | ) | (1,040 | ) | ||||||
| Total sales and trading net revenues | $ | 9,751 | $ | 6,673 | $ | 13,440 | ||||||
| (1) | All prior-year amounts have been recast to conform to the current year�s presentation. For further information, see �Business Segments� herein and Note 1 to the consolidated financial statements in Item�8. |
| 2013 | 2012(1) | 2011(1) | ||||||||||
| (dollars�in�millions) | ||||||||||||
| Equity | $ | 6,529 | $ | 4,811 | $ | 7,263 | ||||||
| Fixed income and commodities | 3,594 | 2,358 | 7,506 | |||||||||
| Other(2) | (372 | ) | (496 | ) | (1,329 | ) | ||||||
| Total sales and trading net revenues | $ | 9,751 | $ | 6,673 | $ | 13,440 | ||||||
| (1) | All prior-year amounts have been recast to conform to the current year�s presentation. For further information, see �Business Segments� herein and Note 1 to the consolidated financial statements in Item�8. |
| (2) | Other sales and trading net revenues include net losses associated with costs related to the amount of liquidity held (�negative carry�), net gains (losses) on economic hedges related to the Company�s long-term debt and net gains (losses) from certain loans and lending commitments and related hedges associated with the Company�s lending activities. |
| 2013 | 2012(1) | 2011(1) | ||||||||||
| (dollars�in�millions) | ||||||||||||
| Total sales and trading net revenues�non-GAAP(2) | $ | 10,432 | $ | 11,075 | $ | 9,759 | ||||||
| Impact of DVA | (681 | ) | (4,402 | ) | 3,681 | |||||||
| Total sales and trading net revenues | $ | 9,751 | $ | 6,673 | $ | 13,440 | ||||||
| Equity sales and trading net revenues�non-GAAP(2) | $ | 6,607 | $ | 5,941 | $ | 6,644 | ||||||
| Impact of DVA | (78 | ) | (1,130 | ) | 619 | |||||||
| Equity sales and trading net revenues | $ | 6,529 | $ | 4,811 | $ | 7,263 | ||||||
| Fixed income and commodities sales and trading net revenues | ||||||||||||
| �non-GAAP(2) | $ | 4,197 | $ | 5,630 | $ | 4,444 | ||||||
| Impact of DVA | (603 | ) | (3,272 | ) | 3,062 | |||||||
| Fixed income and commodities sales and trading net revenues | $ | 3,594 | $ | 2,358 | $ | 7,506 | ||||||
| (1) | All prior-year amounts have been recast to conform to the current year�s presentation. For further information, see �Business Segments� herein and Note 1 to the consolidated financial statements in Item�8. |
| (2) | Sales and trading net revenues, including fixed income and commodities and equity sales and trading net revenues that exclude the impact of DVA, are non-GAAP financial measures that the Company considers useful for the Company and investors to allow further comparability of period-to-period operating performance. |
Table of Contents 2013 Compared with 2012. Investment Banking. Investment banking
revenues in 2013 increased 11% from 2012, reflecting higher revenues from equity and fixed income underwriting transactions, partially offset by lower advisory revenues. Overall, underwriting revenues of $3,067 million increased 20% from 2012.
Equity underwriting revenues increased 41% to $1,262 million in 2013, largely driven by increased client activity across Europe, Asia and the Americas. Fixed income underwriting revenues were $1,805 million in 2013, an increase of 8% from 2012,
reflecting a continued favorable debt underwriting environment. Advisory revenues from merger, acquisition and restructuring transactions (�M&A�) were $1,310 million in 2013, a decrease of 4% from 2012, reflective of the lower level of
deal activity in 2013. Industry-wide announced M&A activity for 2013 was relatively flat compared with 2012, with increases in the Americas offset by decreases in Europe, Middle East and Africa. Sales and Trading Net Revenues. Total
sales and trading net revenues increased to $9,751 million in 2013 from $6,673 million in 2012, reflecting higher revenues in equity and fixed income sales and trading net revenues and lower losses in other sales and trading net revenues. Equity. Equity sales and trading
net revenues increased to $6,529 million in 2013 from $4,811 million in 2012. The results in equity sales and trading net revenues included negative revenue due to the impact of DVA of $78 million in 2013 compared with negative revenue of $1,130
million in 2012. Equity sales and trading net revenues, excluding the impact of DVA, increased 11% to $6,607 million in 2013 from 2012, reflecting strong performance across most products and regions, from higher client activity with particular
strength in prime brokerage. In 2013, equity sales and trading
net revenues also reflected gains of $37 million related to changes in the fair value of net derivative contracts attributable to the tightening of counterparties� CDS spreads and other factors compared with gains of $68 million in 2012. The
Company also recorded losses of $15 million in 2013 related to changes in the fair value of net derivative contracts attributable to the tightening of the Company�s CDS spreads and other factors compared with losses of $243 million in 2012. The
gains and losses on CDS spreads and other factors include gains and losses on related hedging instruments. Fixed Income and Commodities. Fixed income and commodities sales and trading net revenues were $3,594 million in 2013 compared with net revenues of $2,358 million in 2012.
Results in 2013 included negative revenue of $603 million due to the impact of DVA compared with negative revenue of $3,272 million in 2012. Fixed income product net revenues, excluding the impact of DVA, in 2013 decreased 26% over 2012, primarily
reflecting lower levels of client activity across most products and significant revenue declines in interest rate products. Commodity net revenues, excluding the impact of DVA, in 2013 decreased 38% over 2012, primarily reflecting lower levels of
client activity across energy markets. In 2013, fixed income and
commodities sales and trading net revenues reflected gains of $127 million related to changes in the fair value of net derivative contracts attributable to the tightening of counterparties� CDS spreads and other factors compared with losses of
$128 million in 2012 due to the widening of such spreads and other factors. The Company also recorded losses of $114�million in 2013 related to changes in the fair value of net derivative contracts attributable to the tightening of the
Company�s CDS spreads and other factors compared with losses of $482 million in 2012. The gains and losses on CDS spreads and other factors include gains and losses on related hedging instruments. Other. In addition to the equity and fixed
income and commodities sales and trading net revenues discussed above, sales and trading net revenues included other trading revenues, consisting of costs related to negative carry, gains (losses) on economic hedges related to the Company�s
long-term debt and certain activities associated with the Company�s corporate lending activities. Effective April�1, 2012, the Company began accounting for all new corporate loans and lending commitments as either held for investment or
held for sale. Other sales and trading net losses were $372
million in 2013 compared with net losses of $496 million in 2012. The results in both periods included net losses related to negative carry and losses on economic hedges and other | 69 | |
Table of Contents Company also recorded losses of $243 million in 2012 related to changes in the fair value of net derivative contracts attributable to the tightening of the Company�s CDS spreads and other
credit factors compared with gains of $182 million in 2011 due to the widening of such spreads and other credit factors. The gains and losses on CDS spreads and other credit factors include gains and losses on related hedging instruments. Fixed Income and Commodities. Fixed
income and commodities sales and trading net revenues were $2,358 million in 2012 compared with net revenues of $7,506 million in 2011. Results in 2012 included negative revenue of $3,272 million due to the impact of DVA, compared with positive
revenue of $3,062 million in 2011 due to the impact of DVA. Fixed income product net revenues, excluding the impact of DVA, in 2012 increased 45% over 2011, reflecting higher results in interest rate, foreign exchange and credit products, including
higher levels of client activity in securitized products, with results in 2011 being negatively impacted by losses of $1,838 million from Monolines, including a loss approximating $1.7 billion in the fourth quarter of 2011 from the Company�s
comprehensive settlement with MBIA (see �Executive Summary�Significant Items�Monoline Insurers� herein for further information). The results in 2011 also included interest rate product revenues of approximately $600 million,
primarily related to the release of credit valuation adjustments upon the restructuring of certain derivative transactions that decreased the Company�s exposure to the European Peripherals (see �Executive Summary�Significant
Items�European Peripheral Countries� herein for further information). Commodity net revenues, excluding the impact of DVA, decreased 20% in 2012 due to a difficult market environment. Results in the fourth quarter of 2011 included a loss
of approximately $108 million upon application of the overnight indexed swap (�OIS�) curve to certain fixed income products (see Note 4 to the consolidated financial statements in Item�8). In 2012, fixed income and commodities sales and trading net revenues
reflected losses of $128 million related to changes in the fair value of net derivative contracts attributable to the widening of counterparties� CDS spreads and other credit factors compared with losses of $1,249 million, including Monolines,
in 2011. The Company also recorded losses of $482�million in 2012 related to changes in the fair value of net derivative contracts attributable to the tightening of the Company�s CDS spreads and other credit factors compared with gains of
$746 million in 2011 due to the widening of such spreads and other credit factors. The gains and losses on CDS spreads and other factors include gains and losses on related hedging instruments. Other. Other sales and trading net losses were
$496 million in 2012 compared with net losses of $1,329 million in 2011. The results in both years included losses related to negative carry. The 2012 results included losses on economic hedges related to the Company�s long-term debt compared
with gains in 2011. Results in 2012 were partially offset by net gains of $740 million associated with loans and lending commitments. Results in 2011 included net losses of approximately $631 million associated with loans and lending commitments.
The results in 2012 also included net investment gains in the Company�s deferred compensation and co-investment plans compared with net losses in 2011. Net Interest. Net interest expense increased to $1,747 million in 2012 from $1,040 million in 2011, primarily due to lower
revenues from securities purchased under agreements to resell and securities borrowed transactions. Investments. Net investment gains of $219 million were recognized in 2012 compared with net investment gains of $239 million in 2011. The gains in 2012 and 2011
primarily included mark-to-market gains on principal investments in real estate funds and net gains from investments associated with the Company�s deferred compensation and co-investment plans. Other. Other revenues of $203 million
were recognized in 2012 compared with other losses of $236 million in 2011. The results in 2012 included income of $152 million, arising from the Company�s 40% stake in MUMSS. The results in 2011 included pre-tax losses of $783 million arising
from the Company�s 40% stake in MUMSS (see �Executive Summary�Significant Items�Japanese Securities Joint Venture� herein). The gains in 2012 were partially offset by increases in the provision for loan losses. The results
in both periods also included gains from the Company�s retirement of certain of its debt. | 71 | |
Table of Contents WEALTH MANAGEMENT INCOME STATEMENT INFORMATION | 2013 | 2012(1) | 2011(1) | ||||||||||
| (dollars�in�millions) | ||||||||||||
| Revenues: | ||||||||||||
| Investment banking | $ | 923 | $ | 835 | $ | 738 | ||||||
| Trading | 1,161 | 1,043 | 988 | |||||||||
| Investments | 14 | 10 | 4 | |||||||||
| Commissions and fees | 2,209 | 2,080 | 2,495 | |||||||||
| Asset management, distribution and administration fees | 7,638 | 7,190 | 6,709 | |||||||||
| Other | 389 | 309 | 406 | |||||||||
| Total non-interest revenues | 12,334 | 11,467 | 11,340 | |||||||||
| Interest income | 2,100 | 1,886 | 1,719 | |||||||||
| Interest expense | 220 | 319 | 287 | |||||||||
| Net interest | 1,880 | 1,567 | 1,432 | |||||||||
| Net revenues | 14,214 | 13,034 | 12,772 | |||||||||
| Compensation and benefits | 8,271 | 7,796 | 7,910 | |||||||||
| Non-compensation expenses | 3,314 | 3,616 | 3,555 | |||||||||
| Total non-interest expenses | 11,585 | 11,412 | 11,465 | |||||||||
| Income from continuing operations before income taxes | 2,629 | 1,622 | 1,307 | |||||||||
| Provision for income taxes | 920 | 557 | 461 | |||||||||
| Income from continuing operations | 1,709 | 1,065 | 846 | |||||||||
| Discontinued operations: | ||||||||||||
| Income (loss) from discontinued operations | (1 | ) | 94 | 21 | ||||||||
| Provision for income taxes | � | 26 | 7 | |||||||||
| Net gain (loss) from discontinued operations | (1 | ) | 68 | 14 | ||||||||
| Net income | 1,708 | 1,133 | 860 | |||||||||
| Net income applicable to redeemable noncontrolling interests | 221 | 120 | � | |||||||||
| Net income applicable to nonredeemable noncontrolling interests | � | 167 | 170 | |||||||||
| Net income applicable to Morgan Stanley | $ | 1,487 | $ | 846 | $ | 690 | ||||||
| Amounts applicable to Morgan Stanley: | ||||||||||||
| Income from continuing operations | $ | 1,488 | $ | 803 | $ | 683 | ||||||
| Net gain (loss) from discontinued operations | (1 | ) | 43 | 7 | ||||||||
| Net income applicable to Morgan Stanley | $ | 1,487 | $ | 846 | $ | 690 | ||||||
| (1) | Prior-period amounts have been recast to reflect the transfer of the International Wealth Management business from the Wealth Management business segment to the Institutional Securities business segment. |
Table of Contents Net Revenues. The Wealth Management business segment�s net
revenues are composed of Transactional, Asset management, Net interest and Other revenues. Transactional revenues include Investment banking, Trading, and Commissions and fees. Asset management revenues include Asset management, distribution and
administration fees, and referral fees related to the bank deposit program. Net interest revenues include net interest revenues related to the bank deposit program, interest on securities available for sale and all other net interest revenues. Other
revenues include revenues from available for sale securities, customer account services fees, other miscellaneous revenues and revenues from Investments. | 2013 | 2012(1) | 2011(1) | ||||||||||
| (dollars�in�millions) | ||||||||||||
| Net revenues: | ||||||||||||
| Transactional | $ | 4,293 | $ | 3,958 | $ | 4,221 | ||||||
| Asset management | 7,638 | 7,190 | 6,709 | |||||||||
| Net interest | 1,880 | 1,567 | 1,432 | |||||||||
| Other | 403 | 319 | 410 | |||||||||
| Net revenues | $ | 14,214 | $ | 13,034 | $ | 12,772 | ||||||
| (1) | Prior-period amounts have been recast to reflect the transfer of the International Wealth Management business from the Wealth Management business segment to the Institutional Securities business segment. |
Table of Contents Asset Management. Asset Management, Distribution and Administration
Fees. See �Business Segments�Net Revenues� herein for information about the composition of Asset management, distribution and administration fees. Asset management, distribution and administration fees increased 6% from 2012 to $7,638 million in 2013, primarily due to
higher fee-based revenues, partially offset by lower revenues from referral fees from the bank deposit program. The referral fees for deposits placed with Citi-affiliated depository institutions declined to $240 million in 2013 from $383 million in
2012. Lower revenues from the bank deposit program and the decrease in referral fees are both due to the ongoing transfer of deposits to the Company from Citi. Balances in the bank deposit program increased to $134 billion at December�31, 2013 from $131 billion at December�31, 2012, which includes
deposits held by Company-affiliated FDIC-insured depository institutions of $104 billion at December�31, 2013 and $72 billion at December�31, 2012. As a result of the Company�s 100% ownership of the Wealth Management JV, the deposits
held in non-affiliated depositories will transfer to the Company-affiliated depositories on an agreed-upon basis through June 2015. Client assets in fee-based accounts increased to $697 billion and represented 37% of total client assets at December�31, 2013 compared with $554
billion and 33% at December�31, 2012, respectively. Total client asset balances increased to $1,909 billion at December�31, 2013 from $1,696 billion at December�31, 2012, primarily due to the impact of market conditions and higher
fee-based client asset flows.�Client asset balances in households with assets greater than $1 million increased to $1,454 billion at December�31, 2013 from $1,237 billion at December�31, 2012. Effective from the quarter ended
March�31, 2013, client assets also include certain additional non-custodied assets as a result of the completion of the Wealth Management JV platform conversion. Fee-based client asset flows for 2013 were $51.9 billion compared with $26.9
billion in 2012. Beginning January�1, 2013, the Company
enhanced its definition of fee-based asset flows. Fee-based asset flows have been recast for all periods to include dividends, interest and client fees and to exclude cash management related activity. Net Interest. Interest income and Interest expense are a function of the level and mix of
total assets and liabilities. Net interest is driven by securities-based lending, mortgage lending, margin loans, securities borrowed and securities loaned transactions and bank deposit program activity. Net interest increased 20% to $1,880 million in 2013 from 2012, primarily due
to higher balances in the bank deposit program and growth in loans and lending commitments in PLA securities-based lending products. In addition, interest expense declined in 2013 due to the Company�s redemption of all the Class�A
Preferred Interests owned by Citi and its affiliates, in connection with the Company�s acquisition of 100% ownership of the Wealth Management JV effective at the end of the second quarter of 2013. The loans and lending commitments in the
Company�s Wealth Management business segment have grown in 2013, and the Company expects this trend to continue.�See �Business Segments�Lending Activities� herein and �Quantitative and Qualitative Disclosures about
Market Risk�Credit Risk� in Item�7A. Other. Other revenues were $389 million in 2013, an increase of
26% from 2012, primarily due to a gain on sale of the global stock plan business and realized gains on securities available for sale. Non-interest Expenses. Non-interest expenses increased 2% in 2013 from 2012. Compensation and benefits expenses increased 6% in 2013 from 2012, primarily due to higher
compensable revenues. Non-compensation expenses decreased 8% in 2013 from 2012, primarily driven by the absence of platform integration costs and non-recurring technology | 75 | |
Table of Contents due to non-recurring costs related to Wealth Management JV integration (see �Executive Summary�Significant Items�Wealth Management JV� herein). Professional services expenses
decreased 7% in 2012 from 2011, primarily due to lower technology consulting costs. Discontinued Operations. On April�2, 2012, the Company completed the sale of Quilter, its retail wealth management business in the�U.K., resulting in a pre-tax gain of $108 million for the year ended December�31,
2012 in the Wealth Management business segment. The results of Quilter are reported as discontinued operations for all periods presented. See Note 1 to the consolidated financial statements in Item�8. | 77 | |
| 2013 | 2012 | 2011 | ||||||||||
| (dollars�in�millions) | ||||||||||||
| Revenues: | ||||||||||||
| Investment banking | $ | 11 | $ | 17 | $ | 13 | ||||||
| Trading | 41 | (45 | ) | (22 | ) | |||||||
| Investments | 1,056 | 513 | 330 | |||||||||
| Asset management, distribution and administration fees | 1,853 | 1,703 | 1,582 | |||||||||
| Other | 33 | 55 | 25 | |||||||||
| Total non-interest revenues | 2,994 | 2,243 | 1,928 | |||||||||
| Interest income | 9 | 10 | 10 | |||||||||
| Interest expense | 15 | 34 | 51 | |||||||||
| Net interest | (6 | ) | (24 | ) | (41 | ) | ||||||
| Net revenues | 2,988 | 2,219 | 1,887 | |||||||||
| Compensation and benefits | 1,183 | 841 | 848 | |||||||||
| Non-compensation expenses | 821 | 788 | 786 | |||||||||
| Total non-interest expenses | 2,004 | 1,629 | 1,634 | |||||||||
| Income from continuing operations before income taxes | 984 | 590 | 253 | |||||||||
| Provision for income taxes | 299 | 267 | 73 | |||||||||
| Income from continuing operations | 685 | 323 | 180 | |||||||||
| Discontinued operations: | ||||||||||||
| Gain from discontinued operations | 9 | 13 | 24 | |||||||||
| Provision for (benefit from) income taxes | � | 4 | (17 | ) | ||||||||
| Net gain from discontinued operations | 9 | 9 | 41 | |||||||||
| Net income | 694 | 332 | 221 | |||||||||
| Net income applicable to nonredeemable noncontrolling interests | 182 | 187 | 145 | |||||||||
| Net income applicable to Morgan Stanley | $ | 512 | $ | 145 | $ | 76 | ||||||
| Amounts applicable to Morgan Stanley: | ||||||||||||
| Income from continuing operations | $ | 503 | $ | 136 | $ | 35 | ||||||
| Net gain from discontinued operations | 9 | 9 | 41 | |||||||||
| Net income applicable to Morgan Stanley | $ | 512 | $ | 145 | $ | 76 | ||||||
Table of Contents Statistical Data. The Investment Management business segment�s period-end and average
assets under management or supervision were as follows: | At December� 31, | Average�for | |||||||||||||||||||
| 2013 | 2012 | 2013 | 2012 | 2011 | ||||||||||||||||
| (dollars�in�billions) | ||||||||||||||||||||
| Assets under management or supervision by asset class: | ||||||||||||||||||||
| Traditional Asset Management: | ||||||||||||||||||||
| Equity | $ | 140 | $ | 120 | $ | 130 | $ | 114 | $ | 112 | ||||||||||
| Fixed income | 60 | 62 | 61 | 59 | 60 | |||||||||||||||
| Liquidity | 112 | 100 | 104 | 87 | 66 | |||||||||||||||
| Alternatives(1) | 31 | 27 | 29 | 26 | 18 | |||||||||||||||
| Total Traditional Asset Management | 343 | 309 | 324 | 286 | 256 | |||||||||||||||
| Real Estate Investing | 21 | 20 | 20 | 19 | 17 | |||||||||||||||
| Merchant Banking: | ||||||||||||||||||||
| Private Equity | 9 | 9 | 9 | 9 | 9 | |||||||||||||||
| FrontPoint(2) | � | � | � | � | 1 | |||||||||||||||
| Total Merchant Banking | 9 | 9 | 9 | 9 | 10 | |||||||||||||||
| Total assets under management or supervision | $ | 373 | $ | 338 | $ | 353 | $ | 314 | $ | 283 | ||||||||||
| Share of minority stake assets(2)(3) | $ | 6 | $ | 5 | $ | 6 | $ | 5 | $ | 7 | ||||||||||
| (1) | The alternatives asset class includes a range of investment products such as funds of hedge funds, funds of private equity funds and funds of real estate funds. |
| (2) | On March�1, 2011, the Company and the principals of FrontPoint Partners LLC (�FrontPoint�) completed a transaction whereby FrontPoint senior management and portfolio managers own a majority equity stake in FrontPoint, and the Company retains a minority stake. At December�31, 2011, the assets under management attributed to FrontPoint are represented within the share of minority stake assets. |
| (3) | Amounts represent the Investment Management business segment�s proportional share of assets managed by entities in which it owns a minority stake. |
| 79 | |
| 2013 | 2012 | 2011 | ||||||||||
| (dollars�in�billions) | ||||||||||||
| Balance at beginning of period | $ | 338 | $ | 287 | $ | 272 | ||||||
| Net flows by asset class: | ||||||||||||
| Traditional Asset Management: | ||||||||||||
| Equity | (1 | ) | (2 | ) | 4 | |||||||
| Fixed income(1) | � | (1 | ) | (6 | ) | |||||||
| Liquidity | 12 | 26 | 20 | |||||||||
| Alternatives(2) | 2 | 1 | 8 | |||||||||
| Total Traditional Asset Management | 13 | 24 | 26 | |||||||||
| Real Estate Investing | (1 | ) | 1 | 1 | ||||||||
| Merchant Banking: | ||||||||||||
| Private Equity | 1 | � | � | |||||||||
| FrontPoint(3) | � | � | (1 | ) | ||||||||
| Total Merchant Banking | 1 | � | (1 | ) | ||||||||
| Total net flows | 13 | 25 | 26 | |||||||||
| Net market appreciation (depreciation) | 22 | 26 | (7 | ) | ||||||||
| Decrease due to FrontPoint transaction | � | � | (4 | ) | ||||||||
| Total net increase | 35 | 51 | 15 | |||||||||
| Balance at end of period | $ | 373 | $ | 338 | $ | 287 | ||||||
| (1) | Fixed income outflows for 2011 include $1.3 billion due to the revised treatment of assets under management previously reported as a net flow. |
| (2) | The alternatives asset class includes a range of investment products such as funds of hedge funds, funds of private equity funds and funds of real estate funds. |
| (3) | The amount in 2011 includes two months of net flows related to FrontPoint. |
Table of Contents Company�s Merchant Banking and Real Estate Investing businesses and higher gains on certain investments associated with the Company�s employee deferred compensation and co-investment
plans. Results in 2013 also included the benefit of carried interest. Asset Management, Distribution and Administration Fees. �See Business Segments�Net Revenues� herein for information about the composition of Asset
management, distribution and administration fees. Asset management, distribution and administration fees increased 9% to $1,853 million in 2013. The increase primarily reflected higher management and
administration revenues, primarily due to higher average assets under management, as well as higher performance fees. The Company�s assets under management increased $35 billion from $338 billion at December�31, 2012 to $373 billion at December�31, 2013,
reflecting market appreciation and positive net flows. The Company recorded $22 billion in market appreciation and net inflows of $13 billion in 2013, primarily reflecting net customer inflows in liquidity funds. In 2012, the Company recorded $26
billion in market appreciation and $25 billion in net customer inflows primarily in liquidity funds. Other. Other revenues were $33 million in 2013 as compared with $55 million in 2012. The results in 2013 included higher revenues associated with the Company�s
minority investment in Avenue Capital Group, a New York-based investment manager, partially offset by lower revenues associated with the Company�s minority investment in Lansdowne Partners, a London-based investment manager. The results in 2012
included gains associated with the expiration of a lending facility to a real estate fund sponsored by the Company. Non-interest Expenses. Non-interest expenses were $2,004 million in 2013 as compared with $1,629 million in 2012. Compensation and benefits expenses increased 41% in
2013, primarily due to higher net revenues. Non-compensation expenses increased 4% in 2013, primarily due to higher brokerage and clearing and professional services expenses, partially offset by lower information processing expenses. 2012 Compared with 2011. Trading. In 2012, the Company
recognized losses of $45 million compared with losses of $22 million in 2011. Trading results in 2012 primarily reflected losses related to certain consolidated real estate funds sponsored by the Company, as well as losses on hedges on certain
investments. Trading results in 2011 primarily reflected losses related to certain investments associated with the Company�s employee deferred compensation and co-investment plans and certain consolidated real estate funds sponsored by the
Company. Investments. The
Company recorded net investment gains of $513 million in 2012 compared with gains of $330 million in 2011. The increase in 2012 was primarily related to higher net gains in the Company�s Merchant Banking business, as well as higher net
investment gains associated with certain consolidated real estate funds sponsored by the Company. Asset Management, Distribution and Administration Fees. Asset management, distribution and administration fees increased 8% to $1,703 million in 2012. The increase in
2012 primarily reflected higher management and administration revenues and higher performance fees. The Company�s assets under management increased $51 billion from $287 billion at December�31, 2011 to $338 billion at December�31, 2012, reflecting $26 billion in market appreciation and
net customer inflows of $25 billion primarily in liquidity funds. In 2011, net inflows of $26 billion primarily reflected the sweep of the Wealth Management JV client cash balances of approximately $19 billion into Morgan Stanley managed liquidity
funds and inflows of $8 billion into alternatives funds, partially offset by outflows of $6 billion in fixed income products. 81 Table of Contents Other. Other revenues were $55 million in 2012 as compared with $25
million in 2011. The results in 2012 included gains associated with the expiration of a lending facility to a real estate fund sponsored by the Company. The results in 2012 also included lower revenues associated with the Company�s minority
investments in Avenue Capital Group and Lansdowne Partners. The results in 2011 were partially offset by a $27 million writedown in the Company�s minority investment in FrontPoint. Non-interest Expenses. Non-interest expenses were $1,629 million in 2012 as compared with
$1,634 million in 2011. Compensation and benefits expenses decreased 1% in 2012. Non-compensation expenses were relatively unchanged in 2012 compared with 2011. Income Tax Items. In 2012, the Company recognized in income from continuing operations an out-of-period net tax provision of $107 million, attributable to the Investment
Management business segment, primarily related to the overstatement of deferred tax assets associated with partnership investments in prior years. The Company has evaluated the effects of the understatement of the income tax provision both
qualitatively and quantitatively and concluded that it did not have a material impact on any prior annual or quarterly consolidated financial statements. Discontinued Operations. In the fourth quarter of 2011, the Company classified a real estate property management company as held for sale within the Investment Management business
segment. The transaction closed during the first quarter of 2012. The results of this company are reported as discontinued operations for all periods presented. For further information on discontinued operations, see Note 1 to the consolidated financial statements in Item�8. Nonredeemable Noncontrolling Interests. Nonredeemable noncontrolling interests are primarily
related to the consolidation of certain real estate funds sponsored by the Company. Investment gains associated with these consolidated funds were $151 million, $225 million and $180 million in 2013, 2012 and 2011, respectively. 82 Table of Contents Accounting Developments. Reclassification of Residential Real Estate Collateralized Consumer
Mortgage Loans upon Foreclosure. In January 2014, the
Financial Accounting Standards Board (the �FASB�) issued an accounting update clarifying when an in-substance repossession or foreclosure occurs; that is, when a creditor should be considered to have received physical possession of
residential real estate property collateralizing a consumer mortgage loan such that the loan receivable should be derecognized and the real estate property recognized. This guidance is effective for the Company beginning January�1, 2015. This
guidance can be applied using either a modified retrospective transition method or a prospective transition method. This guidance is not expected to have a material impact on the Company�s consolidated financial statements. Accounting for Investments in Qualified Affordable Housing Projects. In January 2014, the FASB issued an accounting update
providing guidance on accounting for investments by a reporting entity in flow-through limited liability entities that manage or invest in affordable housing projects that qualify for the low-income housing tax credit. The amendments permit
reporting entities to make an accounting policy election to account for their investments in qualified affordable housing projects using the proportional amortization method if certain conditions are met. Under the proportional amortization method,
an entity amortizes the initial cost of the investment in proportion to the tax credits and other tax benefits received and recognizes the net investment performance in the income statement as a component of income tax expense (benefit). This
guidance is effective for the Company retrospectively beginning January�1, 2015. Early adoption is permitted. The Company is currently evaluating the potential impact of adopting this accounting update. Presentation of an Unrecognized Tax Benefit When a Net Operating Loss
Carryforward, a Similar Tax Loss, or a Tax Credit Carryforward Exists. In July 2013, the FASB issued an accounting update providing guidance on the financial statement presentation of an unrecognized tax benefit when a net operating loss carryforward, similar tax loss, or
tax credit carryforward exists. This guidance requires an unrecognized tax benefit, or a portion of an unrecognized tax benefit, to be presented in the financial statements as a reduction to a deferred tax asset for a net operating loss
carryforward, a similar tax loss, or a tax credit carryforward if such settlement is required or expected in the event the uncertain tax position is disallowed. This guidance is effective for the Company beginning January�1, 2014. This guidance
is expected to be applied prospectively to all unrecognized tax benefits that exist at the effective date. The adoption of this accounting guidance is not expected to have a material impact on the Company�s consolidated financial statements. Amendments to the Scope, Measurement, and Disclosure
Requirements of an Investment Company. In June 2013, the
FASB issued an accounting update that modifies the criteria used in defining an investment company under GAAP and sets forth certain measurement and disclosure requirements. This update requires an investment company to measure noncontrolling
interests in another investment company at fair value and requires an entity to disclose the fact that it is an investment company, and provide information about changes, if any, in its status as an investment company. An entity will also need to
include disclosures around financial support that has been provided or is contractually required to be provided to any of its investees. This guidance is effective for the Company prospectively beginning January�1, 2014. The adoption of this
accounting guidance did not have a material impact on the Company�s consolidated financial statements. Parent�s Accounting for the Cumulative Translation Adjustment upon Derecognition of Certain Subsidiaries or Groups of Assets within a Foreign Entity or of an Investment in a Foreign Entity. In March 2013, the FASB issued an accounting update
requiring the parent entity to release any related cumulative translation adjustment into net income when the parent ceases to have a controlling financial interest 83 Table of Contents in a subsidiary that is a foreign entity. When the parent ceases to have a controlling financial interest in a subsidiary or group of assets that is a business within a foreign entity, the
related cumulative translation adjustment would be released into net income only if the sale or transfer results in the complete or substantially complete liquidation of the foreign entity in which the subsidiary or group of assets had resided. This
guidance is effective for the Company prospectively beginning on January�1, 2014. The adoption of this accounting guidance did not have a material impact on the Company�s consolidated financial statements. Obligations Resulting from Joint and Several Liability Arrangements for
Which the Total Amount of the Obligation Is Fixed at the Reporting Date. In February 2013, the FASB issued an accounting update that requires an entity to measure obligations resulting from joint and several liability arrangements for which the total amount of the obligation
is fixed at the reporting date, as the sum of the amount the reporting entity agreed to pay and any additional amount the reporting entity expects to pay on behalf of its co-obligors. This update also requires additional disclosures about those
obligations. This guidance is effective for the Company retrospectively beginning on January�1, 2014. The adoption of this accounting guidance is not expected to have a material impact on the Company�s consolidated financial statements. 84 Table of Contents Other Matters. Legal Matters. On February�4, 2014, and subsequent to the release of the Company�s 2013 earnings on January�17, 2014, legal reserves were increased, which
increased Other expenses within the Institutional Securities business segment in the fourth quarter and year ended December�31, 2013 by $150 million related to the settlement with the Federal Housing Finance Agency (see
�Contingencies�Legal� in Note 13 to the consolidated financial statements in Item 8). This decreased diluted EPS and diluted EPS from continuing operations by $0.05 in the fourth quarter and year ended December�31, 2013. Real Estate. The Company acts as the general partner for various real estate funds and
also invests in certain of these funds as a limited partner. The Company�s real estate investments at December�31, 2013 and December�31, 2012 are described below. Such amounts exclude investments associated with certain employee
deferred compensation and co-investment plans. At
December�31, 2013 and December�31, 2012, the consolidated statements of financial condition included amounts representing real estate investment assets of consolidated subsidiaries of approximately $2.2 billion, including noncontrolling
interests of approximately $1.8 billion in both periods, for a net amount of $0.5 billion and $0.4 billion, respectively. This net presentation is a non-GAAP financial measure that the Company considers to be a useful measure for the Company and
investors to use in assessing the Company�s net exposure. In addition, the Company has contractual capital commitments, guarantees, lending facilities and counterparty arrangements with respect to real estate investments of $0.3 billion at
December�31, 2013. In addition to the Company�s real
estate investments, the Company engages in various real estate-related activities, including origination of loans secured by commercial and residential properties. The Company also securitizes and trades in a wide range of commercial and residential
real estate and real estate-related whole loans, mortgages and other real estate. In connection with these activities, the Company has provided, or otherwise agreed to be responsible for, representations and warranties. Under certain circumstances,
the Company may be required to repurchase such assets or make other payments related to such assets if such representations and warranties were breached. The Company continues to monitor its real estate-related activities in order to manage its
exposures and potential liability from these markets and businesses. See �Legal Proceedings�Residential Mortgage and Credit Crisis Related Matters� in Part I, Item�3 and Note 13 to the consolidated financial statements in
Item�8 for further information. Japanese Securities Joint
Venture. The Company holds a 40% voting interest and MUFG
holds a 60% voting interest in MUMSS, while the Company holds a 51% voting interest and MUFG holds a 49% voting interest in MSMS. The Company consolidates MSMS in its consolidated financial statements and accounts for its interest in MUMSS as an
equity method investment within the Institutional Securities business segment (see Note 22 to the consolidated financial statements in Item�8). During 2013, 2012 and 2011, the Company recorded income (loss) of $570 million, $152 million and
$(783) million, respectively, within Other revenues in the consolidated statements of income, arising from the Company�s 40% stake in MUMSS. In order to enhance the risk management at MUMSS, during 2011, the Company entered into a transaction with MUMSS whereby the risk associated with the
fixed income trading positions that previously caused the majority of the aforementioned MUMSS losses in 2011 was transferred to MSMS. In return for entering into the transaction, the Company received total consideration of $659 million, which
represented the estimated fair value of the fixed income trading positions transferred. To the extent that losses incurred by MUMSS result in a requirement to restore its capital, MUFG is solely responsible for providing this additional capital to a minimum level, whereas the Company is not
obligated to | 85 | |
Table of Contents Regulatory Outlook. The Dodd-Frank Act was enacted on July�21, 2010. While certain portions
of the Dodd-Frank Act became effective immediately, most other portions are effective following transition periods or through numerous rulemakings by multiple governmental agencies, and although a large number of rules have been proposed, many are
still subject to final rulemaking or transition periods. U.S. regulators also plan to propose additional regulations to implement the Dodd-Frank Act. Accordingly, it remains difficult to assess fully the impact that the Dodd-Frank Act will have on
the Company and on the financial services industry generally. In addition, various international developments, such as the adoption of or further revisions to risk-based capital, leverage and liquidity standards by the Basel Committee, including
Basel III, and the implementation of those standards in jurisdictions in which the Company operates, will continue to impact the Company in the coming years. At the end of 2013, the U.S. regulators adopted the final Volcker Rule regulations. Banking entities, including the Company, generally have until
July�21, 2015 to bring all of their activities and investments into conformance with the Volcker Rule, subject to possible extensions. The Company is continuing its review of activities that may be affected by the Volcker Rule, including its
trading operations and asset management activities, and is taking steps to establish the necessary compliance programs to comply with the Volcker Rule. Given the complexity of the new framework, the full impact of the Volcker Rule is still
uncertain, and will ultimately depend on the interpretation and implementation by the five regulatory agencies responsible for its oversight. It is likely that 2014 and subsequent years will see further material changes in the way major financial institutions are regulated in both the U.S. and
other markets in which the Company operates, although it remains difficult to predict the exact impact these changes will have on the Company�s business, financial condition, results of operations and cash flows for a particular future period.
See also �Business�Supervision and Regulation� in Part I, Item�1. | 87 | |
| � | Trading assets and Trading liabilities; |
| � | Securities available for sale; |
| � | Securities received as collateral and Obligation to return securities received as collateral; |
| � | Certain Securities purchased under agreements to resell; |
| � | Certain Deposits; |
| � | Certain Commercial paper and other short-term borrowings, primarily structured notes; |
| � | Certain Securities sold under agreements to repurchase; |
| � | Certain Other secured financings; and |
| � | Certain Long-term borrowings, primarily structured notes. |
Table of Contents See Note 4 to the consolidated financial statements in Item�8 for further information on assets and
liabilities that are measured at fair value on a non-recurring basis. Fair Value Control Processes . The Company employs control processes to validate the fair value of its financial instruments, including those derived from
pricing models. These control processes are designed to ensure that the values used for financial reporting are based on observable inputs wherever possible. In the event that observable inputs are not available, the control processes are designed
to assure that the valuation approach utilized is appropriate and consistently applied and that the assumptions are reasonable. See Note 2 to the consolidated financial statements in Item�8 for additional information regarding the Company�s valuation policies, processes
and procedures. Goodwill and Intangible Assets. Goodwill. The Company
tests goodwill for impairment on an annual basis on July�1 and on an interim basis when certain events or circumstances exist. The Company tests for impairment at the reporting unit level, which is generally at the level of or one level below
its business segments. Goodwill no longer retains its association with a particular acquisition once it has been assigned to a reporting unit. As such, all the activities of a reporting unit, whether acquired or organically developed, are available
to support the value of the goodwill. For both the annual and interim tests, the Company has the option to first assess qualitative factors to determine whether the existence of events or circumstances leads to a determination that it is more likely
than not that the fair value of a reporting unit is less than its carrying amount. If after assessing the totality of events or circumstances, the Company determines it is more likely than not that the fair value of a reporting unit is greater than
its carrying amount, then performing the two-step impairment test is not required. However, if the Company concludes otherwise, then it is required to perform the first step of the two-step impairment test. Goodwill impairment is determined by
comparing the estimated fair value of a reporting unit with its respective carrying value. If the estimated fair value exceeds the carrying value, goodwill at the reporting unit level is not deemed to be impaired. If the estimated fair value is
below carrying value, however, further analysis is required to determine the amount of the impairment. Additionally, if the carrying value of a reporting unit is zero or a negative value and it is determined that it is more likely than not the
goodwill is impaired, further analysis is required. The estimated fair value of the reporting units is derived based on valuation techniques the Company believes market participants would use for each of the reporting units. The estimated fair value
is generally determined by utilizing a discounted cash flow methodology or methodologies that incorporate price-to-book and price-to-earnings multiples of certain comparable companies. At each annual goodwill impairment testing date, each of the
Company�s reporting units with goodwill had a fair value that was substantially in excess of its carrying value. Intangible Assets . Amortizable intangible assets are amortized over their estimated useful lives and are
reviewed for impairment on an interim basis when certain events or circumstances exist. An impairment exists when the carrying amount of the intangible asset exceeds its fair value. An impairment loss will be recognized only if the carrying amount
of the intangible asset is not recoverable and exceeds its fair value. The carrying amount of the intangible asset is not recoverable if it exceeds the sum of the expected undiscounted cash flows. For both goodwill and intangible assets, to the extent an impairment loss is
recognized, the loss establishes the new cost basis of the asset. Subsequent reversal of impairment losses is not permitted. For amortizable intangible assets, the new cost basis is amortized over the remaining useful life of that asset. Adverse
market or economic events could result in impairment charges in future periods. See Notes 4 and 9 to the consolidated financial statements in Item�8 for additional information about goodwill and intangible assets. 89 Table of Contents Legal and Regulatory Contingencies. In the normal course of business, the Company has been named, from time to time, as a defendant in various legal actions,
including arbitrations, class actions and other litigation, arising in connection with its activities as a global diversified financial services institution. Certain of the actual or threatened legal actions include claims for substantial compensatory and/or punitive damages or claims for indeterminate amounts
of damages. In some cases, the entities that would otherwise be the primary defendants in such cases are bankrupt or in financial distress. The Company is also involved, from time to time, in other reviews, investigations and proceedings (both formal and informal) by governmental and
self-regulatory agencies regarding the Company�s business, and involving, among other matters, sales and trading activities, financial products or offerings sponsored, underwritten or sold by the Company, and accounting and operational matters,
certain of which may result in adverse judgments, settlements, fines, penalties, injunctions or other relief. Accruals for litigation and regulatory proceedings are generally determined on a case-by-case basis. Where available information indicates that it is probable a liability had been incurred at the date of
the consolidated financial statements and the Company can reasonably estimate the amount of that loss, the Company accrues the estimated loss by a charge to income. In many proceedings, however, it is inherently difficult to determine whether any
loss is probable or even possible or to estimate the amount of any loss. For certain legal proceedings and investigations, the Company can estimate possible losses, additional losses, ranges of loss or ranges of additional loss in excess of amounts
accrued. For certain other legal proceedings and investigations, the Company cannot reasonably estimate such losses, particularly for proceedings and investigations where the factual record is being developed or contested or where plaintiffs or
government entities seek substantial or indeterminate damages, restitution, disgorgement or penalties. Numerous issues may need to be resolved, including through potentially lengthy discovery and determination of important factual matters,
determination of issues related to class certification and the calculation of damages or other relief, and by addressing novel or unsettled legal questions relevant to the proceedings or investigations in question, before a loss or additional loss
or range of loss or additional loss can be reasonably estimated for a proceeding or investigation. Significant judgment is required in deciding when and if to make these accruals and the actual cost of a legal claim or regulatory fine/penalty may ultimately be materially different from the recorded
accruals. See Note 13 to the consolidated financial statements in
Item�8 for additional information on legal proceedings. Income Taxes. The Company is subject to the income and indirect tax laws of the U.S., its states and municipalities and those of the foreign jurisdictions in which the
Company has significant business operations. These tax laws are complex and subject to different interpretations by the taxpayer and the relevant governmental taxing authorities. The Company must make judgments and interpretations about the
application of these inherently complex tax laws when determining the provision for income taxes and the expense for indirect taxes and must also make estimates about when certain items affect taxable income in the various tax jurisdictions.
Disputes over interpretations of the tax laws may be settled with the taxing authority upon examination or audit. The Company periodically evaluates the likelihood of assessments in each taxing jurisdiction resulting from current and subsequent
years� examinations, and unrecognized tax benefits related to potential losses that may arise from tax audits are established in accordance with the guidance on accounting for unrecognized tax benefits. Once established, unrecognized tax
benefits are adjusted when there is more information available or when an event occurs requiring a change. The Company�s provision for income taxes is composed of current and deferred taxes. Current income taxes approximate taxes to be paid or refunded for the current period. The Company�s deferred
income taxes reflect the net tax effects of temporary differences between the financial reporting and tax bases of assets and liabilities and are measured using the applicable enacted tax rates and laws that will be in effect when such differences
are 90 Table of Contents expected to reverse. The Company�s deferred tax balances also include deferred assets related to tax attributes carryforwards, such as net operating losses and tax credits that will be
realized through reduction of future tax liabilities and, in some cases, are subject to expiration if not utilized within certain periods. The Company performs regular reviews to ascertain whether deferred tax assets are realizable. These reviews
include management�s estimates and assumptions regarding future taxable income and incorporate various tax planning strategies, including strategies that may be available to utilize net operating losses before they expire. Once the deferred tax
asset balances have been determined, the Company may record a valuation allowance against the deferred tax asset balances to reflect the amount of these balances (net of valuation allowance) that the Company estimates it is more likely than not to
realize at a future date. Both current and deferred income taxes could reflect adjustments related to the Company�s unrecognized tax benefits. Significant judgment is required in estimating the consolidated provision for (benefit from) income taxes, current and deferred tax balances (including
valuation allowance, if any), accrued interest or penalties and uncertain tax positions. Revisions in our estimates and/or the actual costs of a tax assessment may ultimately be materially different from the recorded accruals and unrecognized tax
benefits, if any. See Note 2 to the consolidated financial
statements in Item�8 for additional information on the Company�s significant assumptions, judgments and interpretations associated with the accounting for income taxes and Note�20 to the consolidated financial statements in
Item�8 for additional information on the Company�s tax examinations. | 91 | |
| At December�31, 2013 | ||||||||||||||||
| Institutional Securities | Wealth Management | Investment Management | Total | |||||||||||||
| (dollars�in�millions) | ||||||||||||||||
| Assets | ||||||||||||||||
| Cash and cash equivalents(1) | $ | 30,169 | $ | 28,967 | $ | 747 | $ | 59,883 | ||||||||
| Cash deposited with clearing organizations or segregated under federal and other regulations or requirements(2) | 36,422 | 2,781 | � | 39,203 | ||||||||||||
| Trading assets | 273,959 | 2,104 | 4,681 | 280,744 | ||||||||||||
| Securities available for sale | � | 53,430 | � | 53,430 | ||||||||||||
| Securities received as collateral(2) | 20,508 | � | � | 20,508 | ||||||||||||
| Federal funds sold and securities purchased under agreements to resell(2) | 106,812 | 11,318 | � | 118,130 | ||||||||||||
| Securities borrowed(2) | 129,366 | 341 | � | 129,707 | ||||||||||||
| Customer and other receivables(2) | 33,927 | 22,493 | 684 | 57,104 | ||||||||||||
| Loans, net of allowance | 17,890 | 24,984 | � | 42,874 | ||||||||||||
| Other assets(3) | 19,543 | 10,293 | 1,283 | 31,119 | ||||||||||||
| Total assets(4) | $ | 668,596 | $ | 156,711 | $ | 7,395 | $ | 832,702 | ||||||||
Table of Contents| At�December�31,�2012 | ||||||||||||||||
| Institutional Securities(5) | Wealth Management(5) | Investment Management | Total | |||||||||||||
| (dollars�in�millions) | ||||||||||||||||
| Assets | ||||||||||||||||
| Cash and cash equivalents(1) | $ | 33,370 | $ | 12,714 | $ | 820 | $ | 46,904 | ||||||||
| Cash deposited with clearing organizations or segregated under federal and other regulations or requirements(2) | 26,116 | 4,854 | � | 30,970 | ||||||||||||
| Trading assets | 260,885 | 2,285 | 4,433 | 267,603 | ||||||||||||
| Securities available for sale | � | 39,869 | � | 39,869 | ||||||||||||
| Securities received as collateral(2) | 14,278 | � | � | 14,278 | ||||||||||||
| Federal funds sold and securities purchased under agreements to resell(2) | 120,957 | 13,455 | � | 134,412 | ||||||||||||
| Securities borrowed(2) | 121,302 | 399 | � | 121,701 | ||||||||||||
| Customer and other receivables(2) | 39,362 | 24,161 | 765 | 64,288 | ||||||||||||
| Loans, net of allowance | 12,078 | 16,968 | � | 29,046 | ||||||||||||
| Other assets(3) | 19,701 | 10,860 | 1,328 | 31,889 | ||||||||||||
| Total assets(4) | $ | 648,049 | $ | 125,565 | $ | 7,346 | $ | 780,960 | ||||||||
| (1) | Cash and cash equivalents include Cash and due from banks and Interest bearing deposits with banks. |
| (2) | Certain of these assets are included in secured financing assets (see �Secured Financing� herein). |
| (3) | Other assets include Other investments; Premises, equipment and software costs; Goodwill; Intangible assets; and Other assets. |
| (4) | Total assets include Global Liquidity Reserves of $202 billion and $182 billion at December�31, 2013 and December�31, 2012, respectively. The Global Liquidity Reserve at December�31, 2013 was higher than the preceding year, primarily due to approximately $26 billion of deposits relating to customer accounts that were transferred to the Company�s depository institutions from Citi during 2013 (see Note 3 to the consolidated financial statements in Item�8). |
| (5) | On January�1, 2013, the International Wealth Management business was transferred from the Wealth Management business segment to the Equity division within the Institutional Securities business segment. Accordingly, prior-period amounts have been recast to reflect the International Wealth Management business as part of the Institutional Securities business segment. |
| 93 | |
| � | Sufficient liquid assets should be maintained to cover maturing liabilities and other planned and contingent outflows; |
| � | Maturity profile of assets and liabilities should be aligned, with limited reliance on short-term funding; |
| � | Source, counterparty, currency, region, and term of funding should be diversified; and |
| � | Limited access to funding should be anticipated through the Contingency Funding Plan (�CFP�). |
| � | No government support; |
| � | No access to equity and unsecured debt markets; |
| � | Repayment of all unsecured debt maturing within the stress horizon; |
| � | Higher haircuts and significantly lower availability of secured funding; |
| � | Additional collateral that would be required by trading counterparties, certain exchanges and clearing organizations related to credit rating downgrades; |
Table of Contents| � | Additional collateral that would be required due to collateral substitutions, collateral disputes and uncalled collateral; |
| � | Discretionary unsecured debt buybacks; |
| � | Drawdowns on unfunded commitments provided to third parties; |
| � | Client cash withdrawals and reduction in customer short positions that fund long positions; |
| � | Limited access to the foreign exchange swap markets; |
| � | Return of securities borrowed on an uncollateralized basis; and |
| � | Maturity roll-off of outstanding letters of credit with no further issuance. |
| At December� 31, 2013 | ||||
| (dollars�in�billions) | ||||
| Cash deposits with banks | $ | 18 | ||
| Cash deposits with central banks | 36 | |||
| Unencumbered highly liquid securities: | ||||
| U.S. government obligations | 84 | |||
| U.S. agency and agency mortgage-backed securities | 23 | |||
| Non-U.S. sovereign obligations(1) | 23 | |||
| Investments in money market funds | 1 | |||
| Other investment grade securities | 17 | |||
| Global Liquidity Reserve | $ | 202 | ||
| (1) | Non-U.S. sovereign obligations are composed of unencumbered�German, French, Dutch, U.K., Brazilian and Japanese government obligations. |
| 95 | |
| At�December�31, 2013 | Average�Balance(1) 2013 | |||||||
| (dollars in billions) | ||||||||
| Bank legal entities: | ||||||||
| Domestic | $ | 85 | $ | 70 | ||||
| Foreign | 4 | 5 | ||||||
| Total Bank legal entities | 89 | 75 | ||||||
| Non-Bank legal entities: | ||||||||
| Domestic(2) | 80 | 83 | ||||||
| Foreign | 33 | 34 | ||||||
| Total Non-Bank legal entities | 113 | 117 | ||||||
| Total | $ | 202 | $ | 192 | ||||
| (1) | The Company calculates the average Global Liquidity Reserve based upon daily amounts. |
| (2) | The Parent held $58 billion at December�31, 2013, which averaged $63 billion during 2013. |
Table of Contents different methodology for calculating net cash outflows during the 30-day stress period as well as a shorter, two-year phase-in period that ends on December�31, 2016. The Company continues
to evaluate the U.S. LCR proposal and its potential impact on the Company�s current liquidity and funding requirements. Funding Management. The Company manages its funding in a manner that reduces the risk of disruption to the Company�s operations. The Company pursues a strategy of
diversification of secured and unsecured funding sources (by product, by investor and by region) and attempts to ensure that the tenor of the Company�s liabilities equals or exceeds the expected holding period of the assets being financed. The Company funds its balance sheet on a global basis through
diverse sources. These sources may include the Company�s equity capital, long-term debt, repurchase agreements, securities lending, deposits, commercial paper, letters of credit and lines of credit. The Company has active financing programs for
both standard and structured products targeting global investors and currencies. Secured Financing. A substantial portion of the Company�s total assets consists of liquid marketable securities and arises principally from its Institutional
Securities business segment�s sales and trading activities. The liquid nature of these assets provides the Company with flexibility in funding these assets with secured financing. The Company�s goal is to achieve an optimal mix of durable
secured and unsecured financing. Secured financing investors�principally focus�on�the quality of the eligible collateral posted. Accordingly, the Company actively manages its secured financing book based on the quality of the assets
being funded. The Company utilizes shorter-term secured financing
only for highly liquid assets and has established longer tenor limits for less liquid asset classes, for which funding may be at risk in the event of a market disruption. The Company defines highly liquid assets as those that are consistent with the
standards of the Global Liquidity Reserve, and less liquid assets as those that do not meet these standards. At December�31, 2013, the weighted average maturity of the Company�s secured financing against less liquid assets was greater than
120 days. To further minimize the refinancing risk of secured financing for less liquid assets, the Company has established concentration limits to diversify its investor base and reduce the amount of monthly maturities for secured financing of less
liquid assets. Furthermore, the Company obtains spare capacity, or term secured funding liabilities in excess of less liquid inventory, as an additional risk mitigant to replace maturing trades in the event that secured financing markets or our
ability to access them become limited. Finally, in addition to the above risk management framework, the Company holds a portion of its Global Liquidity Reserve against the potential disruption to its secured financing capabilities. Unsecured Financing .����The Company views
long-term debt and deposits as stable sources of funding. Unencumbered securities and non-security assets are financed with a combination of long- and short-term debt and deposits.�The Company�s�unsecured financings include structured
borrowings, whose payments and redemption values are�based�on the performance of certain underlying assets, including equity, credit, foreign exchange, interest rates and commodities. When appropriate, the Company may use derivative
products to conduct asset and liability management and to make adjustments to the Company�s interest rate and structured borrowings risk profile (see Note 12 to the consolidated financial statements in Item�8). Short-Term Borrowings. The
Company�s unsecured short-term borrowings consist of commercial paper, bank loans, bank notes and structured notes with maturities of 12 months or less at issuance. | 97 | |
| At December�31, 2013 | At December�31, 2012 | |||||||
| (dollars�in�millions) | ||||||||
| Commercial paper | $ | 8 | $ | 306 | ||||
| Other short-term borrowings | 2,134 | 1,832 | ||||||
| Total | $ | 2,142 | $ | 2,138 | ||||
| At December�31, 2013(1) | At December�31, 2012(1) | |||||||
| (dollars in millions) | ||||||||
| Savings and demand deposits(2) | $ | 109,908 | $ | 80,058 | ||||
| Time deposits(3) | 2,471 | 3,208 | ||||||
| Total | $ | 112,379 | $ | 83,266 | ||||
| (1) | Total deposits subject to FDIC insurance at December�31, 2013 and December�31, 2012 were $84 billion and $62 billion, respectively. |
| (2) | There were no non-interest bearing deposits at December�31, 2013. Amounts include non-interest bearing deposits of $1,037 million at December�31, 2012. |
| (3) | Certain time deposit accounts are carried at fair value under the fair value option (see Note 4 to the consolidated financial statements in Item�8). |
Table of Contents Long-term borrowings at December�31, 2013 consisted of the following: | Parent | Subsidiaries | Total | ||||||||||
| (dollars�in�millions) | ||||||||||||
| Due in 2014 | $ | 22,495 | $ | 1,698 | $ | 24,193 | ||||||
| Due in 2015 | 19,722 | 1,368 | 21,090 | |||||||||
| Due in 2016 | 21,142 | 2,002 | 23,144 | |||||||||
| Due in 2017 | 24,458 | 1,837 | 26,295 | |||||||||
| Due in 2018 | 13,575 | 1,733 | 15,308 | |||||||||
| Thereafter | 41,913 | 1,632 | 43,545 | |||||||||
| Total | $ | 143,305 | $ | 10,270 | $ | 153,575 | ||||||
| 99 | |
| Parent | Morgan Stanley Bank, N.A. | |||||||||||
| Short-Term Debt | Long-Term Debt | Rating Outlook | Short-Term Debt | Long-Term Debt | Rating Outlook | |||||||
| DBRS, Inc. | R-1�(middle) | A�(high) | Negative | � | � | � | ||||||
| Fitch Ratings, Inc. | F1 | A | Stable | F1 | A | Stable | ||||||
| Moody�s Investor Services, Inc.(1) | P-2 | Baa2 | Stable | P-2 | A3 | Stable | ||||||
| Rating and Investment Information, Inc. | a-1 | A | Negative | � | � | � | ||||||
| Standard�& Poor�s Financial Services LLC(2) | A-2 | A- | Negative | A-1 | A | Negative | ||||||
| (1) | On August�22, 2013, Moody�s placed the senior and subordinated debt ratings of the holding companies for the six largest U.S. banks on review as it continued to consider reducing its government (or systemic) support assumptions to reflect the impact of U.S. bank resolution policies. As part of this review, Moody�s placed the Company�s �Baa1� long-term senior, �Baa2� long-term subordinated and �P-2� short-term on review for downgrade. On November�14, 2013, Moody�s downgraded the Company�s long-term debt rating one-notch from �Baa1� to �Baa2� and left the short-term rating unchanged at �P-2�. A stable outlook was assigned to the Parent�s rating outlook. |
| (2) | On June�11, 2013, Standard�& Poor�s Financial Services LLC (�S&P�) announced that it continues to assess the degree to which it factors extraordinary government support into its ratings on non-operating bank holding companies and was factoring that assessment into the negative outlooks on the non-operating bank holding companies of the eight U.S. bank groups that S&P classifies as having high systematic importance. S&P�s negative outlook for the Company�s issuer credit ratings reflects not only S&P�s continued assessment of extraordinary government support, but also the impact that recently finalized regulations, particularly the Volcker Rule, could have on the Company�s business. |
Table of Contents repurchase program is for capital management purposes and considers, among other things, business segment capital needs as well as equity-based compensation and benefit plan requirements. Share
repurchases by the Company are subject to regulatory approval. In
July 2013, the Company received no objection from the Federal Reserve to repurchase through March�31, 2014, up to $500 million of the Company�s outstanding common stock under rules relating to annual capital distributions (Title 12 of the
Code of Federal Regulations, Section�225.8, Capital Planning ). Share repurchases are made pursuant to the share repurchase program previously authorized by the Company�s Board of Directors and are exercised from time to time at
prices the Company deems appropriate subject to various factors, including the Company�s capital position and market conditions. The share repurchases may be effected through open market purchases or privately negotiated transactions, including
through Rule 10b5-1 plans, and may be suspended at any time (see also �Market for Registrant�s Common Equity, Related Stockholder Matters and Issuer Purchases of Equity Securities� in Item�5). During 2013, the Company repurchased
approximately $350 million of the Company�s outstanding common stock as part of its share repurchase program. Series E Preferred Stock .����On September�30, 2013, the Company issued�34,500,000 Depositary Shares, for an aggregate price of�$862�million. Each Depositary
Share represents a 1/1,000th interest in a share of perpetual Series E Fixed-to-Floating Rate Non-Cumulative Preferred Stock, $0.01 par value�(�Series E Preferred Stock�). The Series E Preferred Stock is redeemable at the
Company�s option, (i)�in whole or in part, from time to time, on any dividend payment date on or after October�15, 2023 or (ii)�in whole but not in part at any time within 90 days following a regulatory capital treatment event
(as described in the terms of that series), in each case at a redemption price of $25,000 per share (equivalent to $25.00 per Depositary Share). The Series E Preferred Stock also has a preference over the Company�s common stock upon
liquidation. The Series E Preferred Stock offering (net of related issuance costs) resulted in proceeds of approximately $854 million (see Note 15 to the consolidated financial statements in Item 8). Series F Preferred Stock .����On December�10,
2013, the Company issued�34,000,000 Depositary Shares, for an aggregate price of�$850�million. Each Depositary Share represents a 1/1,000th interest in a share of perpetual Series F Fixed-to-Floating Rate Non-Cumulative Preferred
Stock, $0.01 par value�(�Series F Preferred Stock�). The Series F Preferred Stock is redeemable at the Company�s option, (i)�in whole or in part, from time to time, on any dividend payment date on or after January�15,
2024 or (ii)�in whole but not in part at any time within 90 days following a regulatory capital treatment event (as described in the terms of that series), in each case at a redemption price of $25,000 per share (equivalent to $25.00 per
Depositary Share). The Series F Preferred Stock also has a preference over the Company�s common stock upon liquidation. The Series F Preferred Stock offering (net of related issuance costs) resulted in proceeds of approximately $842 million
(see Note 15 to the consolidated financial statements in Item 8). The Board of Directors determines the declaration and payment of dividends on a quarterly basis. In January 2014, the Company announced that its Board of
Directors declared a quarterly dividend per common share of $0.05. In December 2013, the Company also announced that the Board of Directors declared a quarterly dividend of $255.56 per share of Series A Floating Rate Non-Cumulative Preferred Stock
(represented by Depositary Shares, each representing a 1/1,000th interest in a share of preferred stock and each having a dividend of $0.25556), a quarterly dividend of $25.00 per share of Series C Non-Cumulative Non-Voting Perpetual Preferred
Stock, a quarterly dividend of $519.53 per share of Series E Fixed-to-Floating Rate Non-Cumulative Perpetual Preferred Stock and the initial quarterly dividend of $167.10 per share of Series F Fixed-to-Floating Rate Non-Cumulative Perpetual
Preferred Stock. | 101 | |
| Balance at | Average�Balance(1) | |||||||||||
| December�31, 2013 | December�31, 2012 | 2013 | ||||||||||
| (dollars in millions) | ||||||||||||
| Common equity | $ | 62,701 | $ | 60,601 | $ | 61,895 | ||||||
| Preferred equity | 3,220 | 1,508 | 1,839 | |||||||||
| Morgan Stanley shareholders� equity | 65,921 | 62,109 | 63,734 | |||||||||
| Junior subordinated debentures issued to capital trusts | 4,849 | 4,827 | 4,826 | |||||||||
| Less: Goodwill and net intangible assets(2) | (9,873 | ) | (7,587 | ) | (8,900 | ) | ||||||
| Tangible Morgan Stanley shareholders� equity | $ | 60,897 | $ | 59,349 | $ | 59,660 | ||||||
| Common equity | $ | 62,701 | $ | 60,601 | $ | 61,895 | ||||||
| Less: Goodwill and net intangible assets(2) | (9,873 | ) | (7,587 | ) | (8,900 | ) | ||||||
| Tangible common equity(3) | $ | 52,828 | $ | 53,014 | $ | 52,995 | ||||||
| (1) | The Company calculates its average balances based upon month-end balances. |
| (2) | The goodwill and net intangible assets deduction exclude mortgage servicing rights (net of disallowable mortgage servicing rights) of $7 million and $6 million at December�31, 2013 and December�31, 2012, respectively, and include only the Company�s share of the Wealth Management JV�s goodwill and intangible assets at each respective period (100% at December�31, 2013 and 65% at December�31, 2012) (see Note 3 to the consolidated financial statements in Item 8). The increase in goodwill and net intangible assets at December�31, 2013 from December�31, 2012 is primarily due to the purchase of the remaining 35% interest in the Wealth Management JV. |
| (3) | Tangible common equity, a non-GAAP financial measure, equals common equity less goodwill and net intangible assets as defined above. The Company views tangible common equity as a useful measure to investors because it is a commonly utilized metric and reflects the common equity deployed in the Company�s businesses. |
Table of Contents Basel II standards over the next several years. On January�1, 2013, the U.S. banking regulators� rules to implement the Basel Committee�s�market risk capital framework
amendment,�commonly�referred to as �Basel 2.5�, became effective, which increased the capital requirements for securitizations�and correlation trading within the Company�s trading book,�as�well as incorporated
add-ons for stressed VaR�and incremental�risk requirements (�market risk capital framework amendment�).�The Company�s Total, Tier 1 and Tier 1 common capital ratios and�RWAs�subsequent to the Basel 2.5
effective date�were calculated�under this revised framework.�The Company�s Total, Tier 1 and Tier 1 common capital ratios and RWAs prior to the Basel 2.5 effective date have not been recalculated under�the revised
framework.�RWAs reflect both on- and off-balance sheet risk of the Company. The risk capital calculations will evolve over time as the Company enhances its risk management methodology and incorporates improvements in modeling techniques while
maintaining compliance with the regulatory requirements and interpretations. Market RWAs reflect�capital charges attributable to the risk of loss resulting from adverse changes in market prices and other factors.�For a further discussion of the Company�s�market
risks and models such as the VaR model, see �Quantitative and Qualitative Disclosures about Market Risk� in Item�7A. Credit RWAs reflect capital charges attributable to the risk of loss arising from a borrower or counterparty failing to meet its financial obligations.
For a further discussion of the Company�s credit risks, see �Quantitative and Qualitative Disclosures about Market Risk�Credit Risk� in Item�7A. Existing Regulatory Capital Framework. Under the Federal Reserve�s existing regulatory capital framework,
total allowable capital is composed of Tier 1 capital, which includes Tier 1 common capital, and Tier 2 capital. Tier 1 common capital is defined as Tier 1 capital less qualifying�perpetual preferred stock and qualifying restricted core capital
elements (qualifying trust preferred securities and noncontrolling interests). Tier 1 capital consists predominantly of common shareholders� equity as well as qualifying preferred stock and qualifying restricted core capital elements less
goodwill, non-servicing intangible assets (excluding allowable mortgage servicing rights), net deferred tax assets (recoverable in excess of one year), an after-tax debt valuation adjustment and certain other deductions, including equity
investments. The debt valuation adjustment in the table below represents the cumulative change in fair value of certain long-term and short-term borrowings that was attributable to the Company�s own instrument-specific credit spreads and is
included in retained earnings. For a further discussion of fair value, see Note 4 to the consolidated financial statements in Item�8. At December�31, 2013, the Company�s capital levels calculated under Basel I, inclusive of the market risk capital framework amendment, were in
excess of well-capitalized levels with ratios of Tier�1 capital to RWAs of 15.7% and total capital to RWAs of 16.9% (6% and 10% being well-capitalized for regulatory purposes, respectively). The Company�s ratio of Tier 1
common�capital to RWAs�was 12.8% (5% under stressed conditions is the current minimum Tier 1 common ratio under the Federal Reserve�s Comprehensive Capital Analysis and Review (�CCAR�) framework). Financial holding
companies, including the Company, are subject to a Tier 1 leverage ratio defined by the Federal Reserve. Consistent with the Federal Reserve�s definition, the Company calculated its Tier 1 leverage ratio as Tier 1 capital divided by adjusted
average total assets (which reflects adjustments for disallowed goodwill, certain intangible assets, deferred tax assets, and financial and non-financial equity investments). The adjusted average total assets are derived using weekly balances for
the period. At December�31, 2013, the Company was in compliance with the Federal Reserve�s Tier 1 leverage requirement with a Tier 1 leverage ratio of 7.6% (5% is the current well-capitalized standard for regulatory purposes). | 103 | |
| At December�31, 2013 | At December�31, 2012 | |||||||
| (dollars�in�millions) | ||||||||
| Allowable capital | ||||||||
| Common shareholders� equity | $ | 62,701 | $ | 60,601 | ||||
| Less: Goodwill | (6,595 | ) | (6,650 | ) | ||||
| Less: Non-servicing intangible assets | (3,279 | ) | (3,777 | ) | ||||
| Less: Net deferred tax assets | (2,879 | ) | (4,785 | ) | ||||
| After-tax debt valuation adjustment | 1,275 | 823 | ||||||
| Other deductions | (1,306 | ) | (1,418 | ) | ||||
| Tier 1 common capital | 49,917 | 44,794 | ||||||
| Qualifying preferred stock | 3,220 | 1,508 | ||||||
| Qualifying restricted core capital elements | 7,870 | 8,058 | ||||||
| Tier 1 capital | 61,007 | 54,360 | ||||||
| Qualifying subordinated debt and restricted core capital elements | 5,559 | 2,783 | ||||||
| Other qualifying amounts | 284 | 197 | ||||||
| Other deductions | (850 | ) | (714 | ) | ||||
| Tier 2 capital | 4,993 | 2,266 | ||||||
| Total allowable capital | $ | 66,000 | $ | 56,626 | ||||
| Risk-weighted assets(1) | ||||||||
| Market risk | $ | 133,760 | $ | 54,042 | ||||
| Credit risk | 255,915 | 252,704 | ||||||
| Total | $ | 389,675 | $ | 306,746 | ||||
| Capital ratios | ||||||||
| Total capital ratio(1) | 16.9 | % | 18.5 | % | ||||
| Tier 1 common capital ratio(1) | 12.8 | % | 14.6 | % | ||||
| Tier 1 capital ratio(1) | 15.7 | % | 17.7 | % | ||||
| Tier 1 leverage ratio | 7.6 | % | 7.1 | % | ||||
| (1) | Effective January�1, 2013, in accordance with the U.S. banking regulators� rules the Company implemented the Basel Committee�s market risk capital framework amendment, commonly referred to as �Basel 2.5�, which increased the capital requirement for securitizations and correlation trading within the Company�s trading book as well as incorporated add-ons for stressed VaR�and incremental risk requirements. Under the market risk capital framework amendment, total RWAs would have been approximately $424 billion at December�31, 2012. At December�31, 2012, the capital ratios would have been approximately as follows: Total capital ratio 13.4%, Tier 1 common capital ratio 10.6% and Tier 1 capital ratio 12.8%. |
Table of Contents annual supervisory stress test conducted by the Federal Reserve. The capital planning and stress testing requirements for large bank holding companies form part of the Federal Reserve�s
annual CCAR process. The Company submitted its 2013 annual
capital plan to the Federal Reserve in January 2013. In March 2013, the Federal Reserve published a summary of the supervisory stress test results of each company subject to the final rule, including the Company.�The Company received no
objection to its 2013 capital plan, including the acquisition of the remaining 35% interest in the Wealth Management JV, which was completed on June�28, 2013. In September 2013, the Federal Reserve issued an interim final rule
specifying how large bank holding companies, including the Company, should incorporate the U.S. Basel III capital standards into their 2014 capital plans and 2014 Dodd-Frank Act stress test results. Among other things, the interim final rule
requires large bank holding companies to project both Tier 1 Common capital ratio using the methodology currently in effect under existing capital guidelines and Common Equity Tier 1 ratio under the U.S. Basel III capital standards after giving
effect to phase-in provisions. As part of the 2014 CCAR process,
eight bank holding companies, including the Company, are required to factor in its stress test scenarios the default of its largest counterparty across its derivatives and securities financing transactions. The Company expects that by March 31,
2014, the Federal Reserve will either object or provide notice of non-objection to the Company�s 2014 capital plan that was submitted to the Federal Reserve on January 6, 2014. The Dodd-Frank Act also requires a national bank with total consolidated assets of more than $10 billion to conduct an annual
company-run stress test. Beginning in 2012, the OCC�s implementing regulation requires national banks with $50 billion or more in average total consolidated assets, including MSBNA, to conduct its Dodd-Frank Act stress test. MSBNA submitted its
company-run stress test results to the OCC and the Federal Reserve on January 6, 2014. The OCC�s regulation also requires a national bank with more than $10 billion but less than $50 billion in average total consolidated assets, including
MSPBNA, to submit the results of its Dodd-Frank Act stress test by March�31, 2014. However, MSPBNA was given an exemption by the OCC for the 2014 Dodd-Frank Act stress test. Basel Capital Framework. In December 2010, the Basel Committee reached an agreement on Basel III. In
July 2013, the U.S. banking regulators promulgated final rules to implement many aspects of Basel III (the �U.S. Basel III final rule�). The Company became subject to the U.S. Basel III final rule beginning on January�1, 2014. Certain
requirements in the U.S. Basel III final rule, including the minimum risk-based capital ratios and new capital buffers, will commence or be phased in over several years. The U.S. Basel III final rule contains new capital standards that raise
capital requirements, strengthen counterparty credit risk capital requirements, introduce a leverage ratio as a supplemental measure to the risk-based ratio and replace the use of externally developed credit ratings with alternatives such as the
Organisation for Economic Co-operation and Development�s country risk classifications. Under the U.S. Basel III final rule, the Company is subject, on a fully phased in basis, to a minimum Common Equity Tier 1 risk-based capital ratio of 4.5%,
a minimum Tier 1 risk-based capital ratio of 6% and a minimum total risk-based capital ratio of 8%. The Company is also subject to a 2.5% Common Equity Tier 1 capital conservation buffer and, if deployed, up to a 2.5% Common Equity Tier 1
countercyclical buffer on a fully phased-in basis by 2019. Failure to maintain such buffers will result in restrictions on the Company�s ability to make capital distributions, including the payment of dividends and the repurchase of stock, and
to pay discretionary bonuses to executive officers. In addition, certain new items will be deducted from Common Equity Tier 1 capital and certain existing deductions will be modified. The majority of these capital deductions is subject to a phase-in
schedule and will be fully phased in by 2018. Under the U.S. Basel III final rule, unrealized gains and losses on available-for-sale securities will be reflected in Common Equity Tier 1 capital, subject to a phase-in schedule. Pursuant to the U.S. Basel III final rule, existing trust preferred
securities will be fully phased out of the Company�s Tier 1 capital by January�1, 2016. Thereafter, existing trust preferred securities that do not satisfy the | 105 | |
Table of Contents The U.S. banking regulators have also proposed a rule to implement enhanced supplementary leverage standards
for certain large bank holding companies and their insured depository institution subsidiaries, including the Company and the Subsidiary Banks. Under this proposal, a covered bank holding company would need to maintain a leverage buffer of Tier 1
capital of greater than 2% in addition to the 3% minimum (for a total of greater than 5%), in order to avoid limitations on capital distributions, including dividends and stock repurchases, and discretionary bonus payments to executive officers.
This proposal would further establish a �well-capitalized� threshold based on a supplementary leverage ratio of 6% for insured depository institution subsidiaries, including the Subsidiary Banks. If this proposal is adopted, its
requirements would become effective on January�1, 2018 with public disclosure beginning in 2015. Based on a preliminary analysis of the proposed standards, the Company expects to meet the supplementary leverage ratio of greater than 5% in 2015.
As the enhanced supplementary leverage standards are currently proposals, and may change based on final rules issued by the U.S. banking regulators, the Company�s expectations are subject to risks and uncertainties that may affect future
results of the Company. Further, the expectations should not be taken as a projection of what the Company�s supplemental leverage ratios or earnings or assets will actually be at future dates. For a discussion of risks and uncertainties that
may affect the future results of the Company, see �Risk Factors� in Part I, Item 1A. Required Capital. The Company�s required capital (�Required Capital�) estimation is based on the Required Capital Framework, an internal capital adequacy measure. This framework is a risk-based
use-of-capital measure, which is compared with the Company�s regulatory capital to ensure the Company maintains an amount of going concern capital after absorbing potential losses from extreme stress events where applicable, at a point in time.
The Company defines the difference between its regulatory capital and aggregate Required Capital as Parent capital. Average Tier 1 common capital, aggregate Required Capital and Parent capital for 2013 were approximately $47.7 billion, $38.7 billion
and $9.0 billion, respectively. The Company generally holds Parent capital for prospective regulatory requirements, organic growth, acquisitions and other capital needs. Tier 1 common capital and common equity attribution to the business segments
is based on capital usage calculated by the Required Capital Framework. In principle, each business segment is capitalized as if it were an independent operating entity with limited diversification benefit between the business segments. Required
Capital is assessed at each business segment and further attributed to product lines. This process is intended to align capital with the risks in each business segment in order to allow senior management to evaluate returns on a risk-adjusted basis.
The Required Capital Framework will evolve over time in response to changes in the business and regulatory environment and to incorporate enhancements in modeling techniques. The Company will continue to evaluate the framework with respect to the
impact of future regulatory requirements, as appropriate. The
following table presents the business segments� and Parent�s average Tier 1 common capital and average common equity for 2013 and 2012: | 2013 | 2012 | |||||||||||||||
| Average Tier�1�Common Capital | Average Common Equity | Average Tier�1�Common Capital | Average Common Equity | |||||||||||||
| (dollars�in�billions) | ||||||||||||||||
| Institutional Securities | $ | 32.7 | $ | 37.9 | $ | 22.3 | $ | 29.0 | ||||||||
| Wealth Management | 4.3 | 13.2 | 3.7 | 13.3 | ||||||||||||
| Investment Management | 1.7 | 2.8 | 1.3 | 2.4 | ||||||||||||
| Parent capital(1) | 9.0 | 8.0 | 15.5 | 16.1 | ||||||||||||
| Total | $ | 47.7 | $ | 61.9 | $ | 42.8 | $ | 60.8 | ||||||||
| (1) | Effective January 2013, the Company updated its Required Capital Framework methodology to coincide with the regulatory changes that became effective in 2013. As a result of this update to the methodology, the majority of which was driven by the implementation of the market risk capital framework amendment, average Institutional Securities capital increased and average Parent capital decreased, partially offset by accretion of net income at December�31, 2013. |
| 107 | |
| Maximum Potential Payout/Notional | Carrying Amount (Asset)/ Liability | Collateral/ Recourse | ||||||||||||||||||||||||||
| Years�to�Maturity | ||||||||||||||||||||||||||||
| Type of Guarantee | Less than�1 | 1-3 | 3-5 | Over�5 | Total | |||||||||||||||||||||||
| (dollars in millions) | ||||||||||||||||||||||||||||
| Credit derivative contracts(1) | $ | 313,836 | $ | 520,119 | $ | 500,241 | $ | 66,594 | $ | 1,400,790 | $ | (16,994 | ) | $ | � | |||||||||||||
| Other credit contracts | 75 | 441 | 529 | 816 | 1,861 | (457 | ) | � | ||||||||||||||||||||
| Non-credit derivative contracts(1) | 1,249,932 | 794,776 | 353,559 | 474,921 | 2,873,188 | 54,098 | � | |||||||||||||||||||||
| Standby letters of credit and other financial guarantees issued(2)(3) | 1,024 | 812 | 1,205 | 5,652 | 8,693 | (208 | ) | 7,016 | ||||||||||||||||||||
| Market value guarantees | � | 112 | 83 | 515 | 710 | 7 | 106 | |||||||||||||||||||||
| Liquidity facilities | 2,328 | � | � | � | 2,328 | (4 | ) | 3,042 | ||||||||||||||||||||
| Whole loan sales representations and warranties | � | � | � | 23,755 | 23,755 | 56 | � | |||||||||||||||||||||
| Securitization representations and warranties | � | � | � | 67,249 | 67,249 | 82 | � | |||||||||||||||||||||
| General partner guarantees | 42 | 41 | 62 | 301 | 446 | 73 | � | |||||||||||||||||||||
Table of Contents| (1) | Carrying amounts of derivative contracts are shown on a gross basis prior to cash collateral or counterparty netting. For further information on derivative contracts, see Note 12 to the consolidated financial statements in Item�8. |
| (2) | Approximately $2.0�billion of standby letters of credit are also reflected in the �Commitments� table below in primary and secondary lending commitments. Standby letters of credit are recorded at fair value within Trading assets or Trading liabilities in the consolidated statements of financial condition. |
| (3) | Amounts include guarantees issued by consolidated real estate funds sponsored by the Company of approximately $13.8�million. These guarantees relate to obligations of the fund�s investee entities, including guarantees related to capital expenditures and principal and interest debt payments. |
| Years�to�Maturity | Total�at December�31, 2013 | |||||||||||||||||||
| Less than�1 | 1-3 | 3-5 | Over�5 | |||||||||||||||||
| (dollars in millions) | ||||||||||||||||||||
| Letters of credit and other financial guarantees obtained to satisfy collateral requirements | $ | 389 | $ | 1 | $ | � | $ | 1 | $ | 391 | ||||||||||
| Investment activities | 518 | 70 | 30 | 447 | 1,065 | |||||||||||||||
| Primary lending commitments�investment grade(1) | 7,695 | 14,674 | 36,224 | 798 | 59,391 | |||||||||||||||
| Primary lending commitments�non-investment grade(1) | 1,657 | 5,402 | 10,066 | 2,119 | 19,244 | |||||||||||||||
| Secondary lending commitments(2) | 44 | 38 | 10 | 72 | 164 | |||||||||||||||
| Commitments for secured lending transactions | 1,094 | 166 | � | � | 1,260 | |||||||||||||||
| Forward starting reverse repurchase agreements and securities borrowing agreements(3)(4) | 44,890 | � | � | � | 44,890 | |||||||||||||||
| Commercial and residential mortgage-related commitments | 1,199 | 48 | 301 | 313 | 1,861 | |||||||||||||||
| Underwriting commitments | 588 | � | � | � | 588 | |||||||||||||||
| Other lending commitments | 2,660 | 340 | 193 | 128 | 3,321 | |||||||||||||||
| Total | $ | 60,734 | $ | 20,739 | $ | 46,824 | $ | 3,878 | $ | 132,175 | ||||||||||
| (1) | This amount includes $49.4 billion of investment grade and $12 billion of non-investment grade unfunded commitments accounted for as held for investment and $3.5 billion of investment grade and $4.6 billion of non-investment grade unfunded commitments accounted for as held for sale at December�31, 2013. The remainder of these lending commitments is carried at fair value. |
| (2) | These commitments are recorded at fair value within Trading assets and Trading liabilities in the consolidated statements of financial condition (see Note 4 to the consolidated financial statements in Item�8). |
| (3) | The Company enters into forward starting reverse repurchase and securities borrowing agreements (agreements that have a trade date at or prior to December�31, 2013 and settle subsequent to period-end) that are primarily secured by collateral from U.S. government agency |
| 109 | |
| securities and other sovereign government obligations. These agreements primarily settle within three business days, and of the total amount at December�31, 2013, $42.9 billion settled within three business days. |
| (4) | The Company also has a contingent obligation to provide financing to a clearinghouse through which it clears certain transactions. The financing is required only upon the default of a clearinghouse member. The financing takes the form of a reverse repurchase facility, with a maximum amount of approximately $1.1 billion. |
| Payments Due in: | ||||||||||||||||||||
| At December�31, 2013 | 2014 | 2015-2016 | 2017-2018 | Thereafter | Total | |||||||||||||||
| (dollars in millions) | ||||||||||||||||||||
| Long-term borrowings(1) | $ | 24,193 | $ | 44,234 | $ | 41,603 | $ | 43,545 | $ | 153,575 | ||||||||||
| Other secured financings(1) | 3,500 | 4,848 | 835 | 567 | 9,750 | |||||||||||||||
| Contractual interest payments(2) | 5,458 | 8,994 | 5,819 | 19,673 | 39,944 | |||||||||||||||
| Time deposits(3) | 2,432 | 51 | � | � | 2,483 | |||||||||||||||
| Operating leases�office facilities(4) | 672 | 1,277 | 1,035 | 2,712 | 5,696 | |||||||||||||||
| Operating leases�equipment(4) | 239 | 241 | 163 | 98 | 741 | |||||||||||||||
| Purchase obligations(5) | 634 | 597 | 301 | 125 | 1,657 | |||||||||||||||
| Total(6) | $ | 37,128 | $ | 60,242 | $ | 49,756 | $ | 66,720 | $ | 213,846 | ||||||||||
| (1) | See Note 11 to the consolidated financial statements in Item�8. Amounts presented for Other secured financings are financings with original maturities greater than one year. |
| (2) | Amounts represent estimated future contractual interest payments related to unsecured long-term borrowings based on applicable interest rates at December�31, 2013. Amounts include stated coupon rates, if any, on structured or index-linked notes. |
| (3) | Amounts represent contractual principal and interest payments related to time deposits primarily held at the Subsidiary Banks. |
| (4) | See Note 13 to the consolidated financial statements in Item�8. |
| (5) | Purchase obligations for goods and services include payments for, among other things, consulting, outsourcing, computer and telecommunications maintenance agreements and certain transmission, transportation and storage contracts related to the commodities business. Purchase obligations at December�31, 2013 reflect the minimum contractual obligation under legally enforceable contracts with contract terms that are both fixed and determinable. These amounts exclude obligations for goods and services that already have been incurred and are reflected on the Company�s consolidated statement of financial condition. |
| (6) | Amounts exclude unrecognized tax benefits, as the timing and amount of future cash payments are not determinable at this time (see Note 20 to the consolidated financial statements in Item�8 for further information). |
Table of Contents Item��7A.����Quantitative and Qualitative
Disclosures about Market Risk. Risk Management. Overview. Management believes effective risk management is vital to the success of the
Company�s business activities. Accordingly, the Company employs an enterprise risk management (�ERM�) framework to integrate the diverse roles of risk management into a holistic enterprise structure and to facilitate the incorporation
of risk evaluation into decision-making processes across the Company. The Company has policies and procedures in place to identify, assess, monitor and manage the significant risks involved in the activities of its Institutional Securities, Wealth
Management and Investment Management business segments as well as at the holding company level. Principal risks involved in the Company�s business activities include market, credit, capital and liquidity, operational, legal and regulatory risk. The cornerstone of the Company�s risk management philosophy
is the execution of risk-adjusted returns through prudent risk-taking that protects the Company�s capital base and franchise. Five key principles underlie this philosophy: comprehensiveness, independence, accountability, defined risk tolerance
and transparency. The fast-paced, complex, and constantly evolving nature of global financial markets requires that the Company maintain a risk management culture that is incisive, knowledgeable about specialized products and markets, and subject to
ongoing review and enhancement. To help ensure the efficacy of risk management, which is an essential component of the Company�s reputation, senior management requires thorough and frequent communication and the appropriate escalation of risk
matters. Risk Governance Structure. Risk management at the Company requires independent company-level oversight,
accountability of the Company�s business segments, and effective communication of risk matters to senior management and across the Company. The nature of the Company�s risks, coupled with its risk management philosophy, informs the
Company�s risk governance structure. The Company�s risk governance structure is comprised of the Board of Directors; the Risk Committee of the Board (�BRC�), the Audit Committee of the Board (�BAC�), and the Operations
and Technology Committee of the Board (�BOTC�); the Firm Risk Committee (�FRC�); functional risk and control committees; senior management oversight (including the Chief Executive Officer, Chief Risk Officer, Chief Financial
Officer, Chief Legal Officer and Chief Compliance Officer); the Internal Audit Department and risk managers, committees, and groups within and across the Company�s business segments. A risk governance structure composed of independent but
complementary entities facilitates efficient and comprehensive supervision of the Company�s risk exposures and processes. Morgan Stanley Board of Directors. The Board of Directors has oversight for the Company�s ERM framework and is
responsible for helping to ensure that the Company�s risks are managed in a sound manner. The Board has authorized the committees within the ERM framework to help facilitate its risk oversight responsibilities. Risk Committee of the Board. The BRC is
composed of non-management directors. The BRC is responsible for assisting the Board in the oversight of the Company�s risk governance structure; the Company�s risk management and risk assessment guidelines and policies regarding major
market, credit, liquidity and funding and reputational risk; the Company�s risk tolerance; and the performance of the Chief Risk Officer. The BRC reports to the full Board on a regular basis. Audit Committee of the Board. The BAC is
composed of independent directors. The BAC is responsible for oversight of the integrity of the Company�s consolidated financial statements, the Company�s compliance with legal and regulatory requirements, the Company�s system of
internal controls, the qualifications and independence of the Company�s independent auditor, and the performance of the Company�s internal and independent auditors. In addition, the BAC assists the Board in its oversight of certain aspects
of risk | 111 | |
Table of Contents Independent Risk Management Functions. The independent risk management
functions (Market Risk, Credit Risk Management, Operational Risk, Corporate Treasury and Bank Resource Management departments) are independent of the Company�s business units. These groups assist senior management and the FRC in monitoring and
controlling the Company�s risk through a number of control processes. Each function maintains its own risk governance structure with specified individuals and committees responsible for aspects of managing risk. Further discussion about the
responsibilities of the risk management functions may be found below under �Market Risk�, �Credit Risk�, and �Operational Risk� and in �Management�s Discussion and Analysis of Financial Condition and Results
of Operations�Liquidity and Capital Resources� in Part II, Item�7. Control Groups. The Company control groups include the Legal and Compliance Division, Finance, the Tax Department, the Operations Division, the Technology and Data
Division, and the Human Resources Department. The Company control groups coordinate with the business segment control groups to review the risk monitoring and risk management policies and procedures relating to, among other things, controls over
financial reporting and disclosure; the business segment�s market, credit and operational risk profile; liquidity risks; sales practices; reputational, legal enforceability, compliance and regulatory risk; and operational and technological
risks. Participation by the senior officers of the Company and business segment control groups helps ensure that risk policies and procedures, exceptions to risk limits, new products and business ventures, and transactions with risk elements undergo
thorough review. Divisional Risk
Committees. Each business segment has a risk committee that is responsible for helping to ensure that the business segment, as applicable, adheres to established limits for market, credit, operational and other risks;
implements risk measurement, monitoring, and management policies and procedures that are consistent with the risk framework established by the FRC; and reviews, on a periodic basis, its aggregate risk exposures, risk exception experience, and the
efficacy of its risk identification, measurement, monitoring and management policies and procedures, and related controls. Employees. All employees have accountability for risk management.�The Company strives to establish a culture of
effective risk management through training and development programs, policies, procedures, and defined roles and responsibilities within the Company.�The actions and conduct of each employee are essential to risk management. The Company�s
Code of Conduct (the �Code�) has been established to provide a framework and standards for employee conduct that further reinforces the Company�s commitment to integrity and high ethical standards.�Every new hire and every
employee annually must certify to their understanding of and adherence to the Code. The employee annual review process includes evaluation of adherence to the Code. The Global Incentive Compensation Discretion Policy sets forth standards that
specifically provide that managers must consider whether the employee effectively managed and supervised the risk control practices of his/her employee reports during the performance year. The Company has several mutually reinforcing processes to
identify incidents of employee conduct that may have an impact on employment status, current year compensation or prior year compensation. The Company�s clawback and cancellation provisions permit recovery of deferred incentive compensation
where, for example, there is a failure to appropriately manage or monitor an employee who engaged in conduct detrimental to the Company or conduct constituting �cause� for termination. Stress Value-at-Risk. The Company frequently enhances its market and credit risk management
framework to address severe stresses that are observed in global markets during economic downturns. During 2013, the Company expanded and improved its risk measurement processes, including stress tests and scenario analysis, and further refined its
market and credit risk limit framework. Stress Value-at-Risk (�S-VaR�), a proprietary methodology that comprehensively measures the Company�s market and credit risks, was further refined and continues to be an important metric used in
establishing the Company�s risk appetite and its capital allocation framework. S-VaR simulates many stress scenarios based on more than 25 years of historical data and attempts to capture the different liquidities of various types of general
and specific risks. Additionally, S-VaR captures event and default risks that are particularly relevant for credit portfolios. | 113 | |
| | 114 |
| 115 | |
| | 116 |
| Table 1: 95% Management VaR | 95%/One-Day VaR for 2013 | 95%/One-Day VaR for 2012 | ||||||||||||||||||||||||||||||
| Market Risk Category | Period End | Average | High | Low | Period End | Average | High | Low | ||||||||||||||||||||||||
| (dollars in millions) | ||||||||||||||||||||||||||||||||
| Interest rate and credit spread | $ | 41 | $ | 45 | $ | 76 | $ | 31 | $ | 56 | $ | 56 | $ | 87 | $ | 33 | ||||||||||||||||
| Equity price | 22 | 19 | 43 | 15 | 21 | 26 | 39 | 18 | ||||||||||||||||||||||||
| Foreign exchange rate | 15 | 14 | 22 | 7 | 10 | 13 | 23 | 7 | ||||||||||||||||||||||||
| Commodity price | 15 | 21 | 31 | 15 | 20 | 24 | 32 | 18 | ||||||||||||||||||||||||
| Less: Diversification benefit(1)(2) | (44 | ) | (46 | ) | N/A | N/A | (40 | ) | (55 | ) | N/A | N/A | ||||||||||||||||||||
| Primary Risk Categories | $ | 49 | $ | 53 | $ | 78 | $ | 42 | $ | 67 | $ | 64 | $ | 98 | $ | 52 | ||||||||||||||||
| Credit Portfolio | 12 | 14 | 18 | 12 | 19 | 26 | 50 | 18 | ||||||||||||||||||||||||
| Less: Diversification benefit(1)(2) | (8 | ) | (8 | ) | N/A | N/A | (11 | ) | (17 | ) | N/A | N/A | ||||||||||||||||||||
| Total Management VaR | $ | 53 | $ | 59 | $ | 85 | $ | 47 | $ | 75 | $ | 73 | $ | 107 | $ | 57 | ||||||||||||||||
| (1) | Diversification benefit equals the difference between the total Management VaR and the sum of the component VaRs. This benefit arises because the simulated one-day losses for each of the components occur on different days; similar diversification benefits also are taken into account within each component. |
| (2) | N/A�Not Applicable. The high and low VaR values for the total Management VaR and each of the component VaRs might have occurred on different days during the year, and therefore the diversification benefit is not an applicable measure. |
| 117 | |
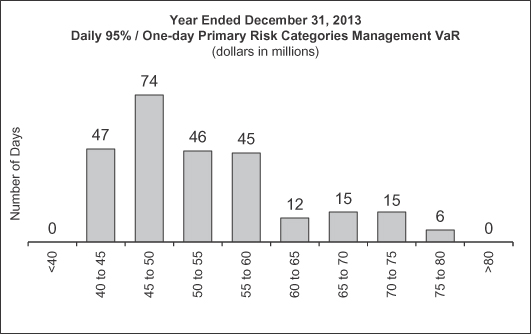
| | 118 |
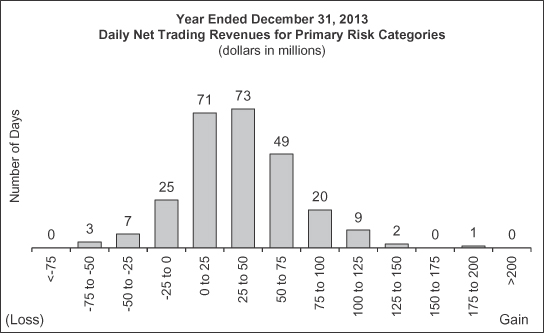
| 119 | |
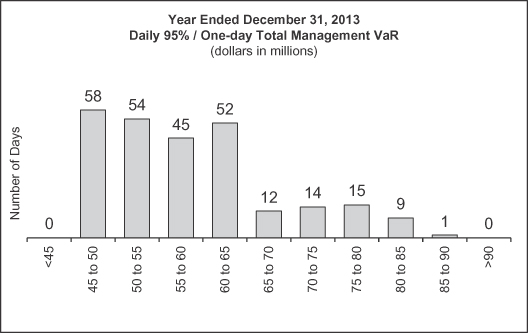 120 Table of Contents The histogram below shows the distribution of daily net trading revenues for the Company�s Trading
businesses for 2013. This excludes non-trading revenues of these businesses and revenues associated with the Company�s own credit risk. During 2013, the Company experienced net trading losses on 33 days, of which 1 day was in excess of the
95%/one-day Management VaR.
120 Table of Contents The histogram below shows the distribution of daily net trading revenues for the Company�s Trading
businesses for 2013. This excludes non-trading revenues of these businesses and revenues associated with the Company�s own credit risk. During 2013, the Company experienced net trading losses on 33 days, of which 1 day was in excess of the
95%/one-day Management VaR. 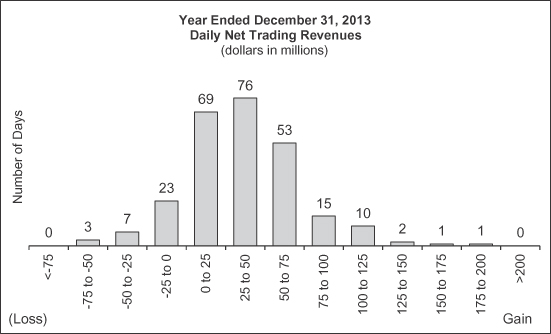 Non-Trading Risks. The Company believes that sensitivity analysis is an
appropriate representation of the Company�s non-trading risks. Reflected below is this analysis, which covers substantially all of the non-trading risk in the Company�s portfolio. Counterparty Exposure Related to the Company�s Own Spread. The credit spread risk relating to the Company�s own mark-to-market
derivative counterparty exposure is managed separately from VaR. The credit spread risk sensitivity of this exposure corresponds to an increase in value of approximately $5 million and $6 million for each 1 basis point widening in the Company�s
credit spread level for December�31, 2013 and December�31, 2012, respectively. Funding Liabilities. The credit spread risk sensitivity of the Company�s mark-to-market funding liabilities corresponded to an increase in value of approximately $11 million and $13 million for each 1 basis point
widening in the Company�s credit spread level for December�31, 2013 and December�31, 2012, respectively. Interest Rate Risk Sensitivity on Income from Continuing Operations. The Company measures the interest rate risk of certain assets and
liabilities by calculating the hypothetical sensitivity of net interest income to potential changes in the level of interest rates over the next 12�months. This sensitivity analysis includes positions that are mark-to-market, as well as
positions that are accounted for on an accrual basis. For interest rate derivatives that are perfect economic hedges to non-mark-to-market assets or liabilities, the disclosed sensitivities include only the impact of the coupon accrual mismatch.
Non-Trading Risks. The Company believes that sensitivity analysis is an
appropriate representation of the Company�s non-trading risks. Reflected below is this analysis, which covers substantially all of the non-trading risk in the Company�s portfolio. Counterparty Exposure Related to the Company�s Own Spread. The credit spread risk relating to the Company�s own mark-to-market
derivative counterparty exposure is managed separately from VaR. The credit spread risk sensitivity of this exposure corresponds to an increase in value of approximately $5 million and $6 million for each 1 basis point widening in the Company�s
credit spread level for December�31, 2013 and December�31, 2012, respectively. Funding Liabilities. The credit spread risk sensitivity of the Company�s mark-to-market funding liabilities corresponded to an increase in value of approximately $11 million and $13 million for each 1 basis point
widening in the Company�s credit spread level for December�31, 2013 and December�31, 2012, respectively. Interest Rate Risk Sensitivity on Income from Continuing Operations. The Company measures the interest rate risk of certain assets and
liabilities by calculating the hypothetical sensitivity of net interest income to potential changes in the level of interest rates over the next 12�months. This sensitivity analysis includes positions that are mark-to-market, as well as
positions that are accounted for on an accrual basis. For interest rate derivatives that are perfect economic hedges to non-mark-to-market assets or liabilities, the disclosed sensitivities include only the impact of the coupon accrual mismatch. | 121 | |
| December�31, 2013 | December�31, 2012 | |||||||||||||||
| +100�Basis Points | +200�Basis Points | +100�Basis Points | +200�Basis Points | |||||||||||||
| (dollars in millions) | ||||||||||||||||
| Impact on income from continuing operations before income taxes | $ | 642 | $ | 1,102 | $ | 749 | $ | 1,140 | ||||||||
| 10% Sensitivity | ||||||||
| Investments | December�31,�2013 | December�31,�2012 | ||||||
| (dollars in millions) | ||||||||
| Investments related to Investment Management activities: | ||||||||
| Hedge fund investments | $ | 104 | $ | 120 | ||||
| Private equity and infrastructure funds | 148 | 125 | ||||||
| Real estate funds | 158 | 138 | ||||||
| Other investments: | ||||||||
| Mitsubishi UFJ Morgan Stanley Securities Co., Ltd. | 161 | 143 | ||||||
| Other Company investments | 198 | 292 | ||||||
| � | entering into swap or other derivative contracts under which counterparties have obligations to make payments to the Company; |
| � | extending credit to clients through various lending commitments; |
| � | providing short- or long-term funding that is secured by physical or financial collateral whose value may at times be insufficient to fully cover the loan repayment amount; |
| � | posting margin and/or collateral to clearinghouses, clearing agencies, exchanges, banks, securities firms and other financial counterparties; and |
| � | investing or trading in securities and loan pools, whereby the value of these assets may fluctuate based on realized or expected defaults on the underlying obligations or loans. |
Table of Contents The Company incurs credit risk in the Wealth Management business segment primarily through lending to
individuals and entities, including, but not limited to, the following: | � | margin loans collateralized by securities; |
| � | securities-based and other loans predominantly collateralized by securities; and |
| � | single-family residential prime mortgage loans in conforming, non-conforming or home equity lines of credit (�HELOC�) form. |
| 123 | |
| Institutional Securities Corporate Lending(1) | Institutional Securities Other Lending(2) | Wealth Management Lending(3) | Total(4) | |||||||||||||
| (dollars in millions) | ||||||||||||||||
| Corporate loans | $ | 7,837 | $ | 1,988 | $ | 3,301 | $ | 13,126 | ||||||||
| Consumer loans | � | � | 11,576 | 11,576 | ||||||||||||
| Residential real estate loans | � | 1 | 10,001 | 10,002 | ||||||||||||
| Wholesale real estate loans | � | 1,835 | 6 | 1,841 | ||||||||||||
| Loans held for investment, net of allowance | 7,837 | 3,824 | 24,884 | 36,545 | ||||||||||||
| Corporate loans | 6,168 | � | � | 6,168 | ||||||||||||
| Consumer loans | � | � | � | � | ||||||||||||
| Residential real estate loans | � | 12 | 100 | 112 | ||||||||||||
| Wholesale real estate loans | � | 49 | � | 49 | ||||||||||||
| Loans held for sale | 6,168 | 61 | 100 | 6,329 | ||||||||||||
| Corporate loans | 2,892 | 6,882 | � | 9,774 | ||||||||||||
| Consumer loans | � | � | � | � | ||||||||||||
| Residential real estate loans | � | 1,434 | � | 1,434 | ||||||||||||
| Wholesale real estate loans | � | 1,404 | � | 1,404 | ||||||||||||
| Loans held at fair value | 2,892 | 9,720 | � | 12,612 | ||||||||||||
| Total loans | $ | 16,897 | $ | 13,605 | $ | 24,984 | $ | 55,486 | ||||||||
| (1) | In addition to loans, at December�31, 2013, $61.4 billion of unfunded lending commitments were accounted for as held for investment, $8.1 billion of unfunded lending commitments were accounted for as held for sale and $9.1 billion of unfunded lending commitments were accounted for at fair value. |
| (2) | In addition to loans, at December�31, 2013, $1.3 billion of unfunded lending commitments were�accounted for as held for investment and $0.8 billion of unfunded lending commitments were accounted for at fair value. |
| (3) | In addition to loans, at December�31, 2013, $4.5 billion of unfunded lending commitments were accounted for as held for investment. |
| (4) | The above table excludes customer margin loans outstanding of $29.2 billion and employee loans outstanding of $5.6 billion at December�31, 2013. See Notes 6 and 8 to the consolidated financial statements in Item�8 for further information. |
Table of Contents Institutional Securities Corporate Lending Activities. In connection
with certain of its Institutional Securities business segment activities, the Company provides loans or lending commitments to select corporate clients. These loans and lending commitments have varying terms; may be senior or subordinated; may be
secured or unsecured; are generally contingent upon representations, warranties and contractual conditions applicable to the borrower; and may be syndicated, traded or hedged by the Company. The Company�s corporate lending credit exposure is primarily from loan and lending commitments used for general corporate
purposes, working capital and liquidity purposes and typically consist of revolving lines of credit, letter of credit facilities and term loans. In addition, the Company provides �event-driven� loans and lending commitments associated with
a particular event or transaction, such as to support client merger, acquisition or recapitalization activities. The Company�s �event-driven� loans and lending commitments typically consist of revolving lines of credit, term loans and
bridge loans. Corporate lending commitments may not be indicative
of the Company�s actual funding requirements, as the commitment may expire unused or the borrower may not fully utilize the commitment or the Company�s portion of the commitment may be reduced through the syndication or sales process. Such
syndications or sales may involve third-party institutional investors where the Company may have a custodial relationship, such as prime brokerage clients. The Company may hedge and/or sell its exposures in connection with loans and lending commitments. Additionally, the Company may mitigate credit risk by
requiring borrowers to pledge collateral and include financial covenants in lending commitments. In the consolidated statements of financial condition these loans are carried at either fair value with changes in fair value recorded in earnings; held
for investment, which are recorded at amortized cost; or held for sale, which are recorded at lower of cost or fair value. The table below presents the Company�s credit exposure from its corporate lending positions and lending commitments, which are measured in accordance
with the Company�s internal risk management standards at December�31, 2013. The �total corporate lending exposure� column includes funded and unfunded lending commitments. Lending commitments represent legally binding obligations
to provide funding to clients for all lending transactions. Since commitments associated with these business activities may expire unused or may not be utilized to full capacity, they do not necessarily reflect the actual future cash funding
requirements. Corporate Lending Commitments and
Funded Loans at December�31, 2013 | Years to Maturity | Total Corporate Lending Exposure(2) | |||||||||||||||||||
| Credit Rating(1) | Less�than�1 | 1-3 | 3-5 | Over 5 | ||||||||||||||||
| (dollars in millions) | ||||||||||||||||||||
| AAA | $ | 859 | $ | 114 | $ | 121 | $ | � | $ | 1,094 | ||||||||||
| AA | 2,719 | 1,870 | 5,556 | � | 10,145 | |||||||||||||||
| A | 2,935 | 4,230 | 11,642 | 570 | 19,377 | |||||||||||||||
| BBB | 2,391 | 10,535 | 21,330 | 1,004 | 35,260 | |||||||||||||||
| Investment grade | 8,904 | 16,749 | 38,649 | 1,574 | 65,876 | |||||||||||||||
| Non-investment�grade | 2,712 | 8,024 | 12,794 | 3,627 | 27,157 | |||||||||||||||
| Total | $ | 11,616 | $ | 24,773 | $ | 51,443 | $ | 5,201 | $ | 93,033 | ||||||||||
| (1) | Obligor credit ratings are determined by the Credit Risk Management Department. |
| (2) | Total corporate lending exposure represents the Company�s potential loss assuming the market price of funded loans and lending commitments was zero. |
| 125 | |
| Industry | Corporate�Lending�Exposure | |||
| (dollars in millions) | ||||
| Energy | $ | 12,240 | ||
| Utilities | 10,410 | |||
| Healthcare | 10,095 | |||
| Consumer discretionary | 9,981 | |||
| Industrials | 9,514 | |||
| Funds, exchanges and other financial services(1) | 7,190 | |||
| Consumer staples | 6,788 | |||
| Information technology | 6,526 | |||
| Telecommunications services | 5,658 | |||
| Materials | 4,867 | |||
| Real Estate | 4,171 | |||
| Other | 5,593 | |||
| Total | $ | 93,033 | ||
| (1) | Includes mutual funds, pension funds, private equity and real estate funds, exchanges and clearinghouses and diversified financial services. |
Table of Contents At December�31, 2013, Institutional Securities Other lending activities by remaining contract maturity
were as follows: | Years to Maturity | Total�Institutional Securities�Other Lending�Activities | |||||||||||||||||||
| Less�than�1 | 1-3 | 3-5 | Over 5 | |||||||||||||||||
| (dollars in millions) | ||||||||||||||||||||
| Corporate loans | $ | 3,957 | $ | 1,236 | $ | 2,455 | $ | 1,222 | $ | 8,870 | ||||||||||
| Consumer loans | � | � | � | � | � | |||||||||||||||
| Residential real estate loans | 8 | 16 | 91 | 1,332 | 1,447 | |||||||||||||||
| Wholesale real estate loans | 174 | 909 | 885 | 1,320 | 3,288 | |||||||||||||||
| Total | $ | 4,139 | $ | 2,161 | $ | 3,431 | $ | 3,874 | $ | 13,605 | ||||||||||
| Years to Maturity | Total�Wealth Management Lending�Activities | |||||||||||||||||||
| Less�than�1 | 1-3 | 3-5 | Over 5 | |||||||||||||||||
| (dollars in millions) | ||||||||||||||||||||
| Securities-based lending and other loans | $ | 13,241 | $ | 509 | $ | 539 | $ | 594 | $ | 14,883 | ||||||||||
| Residential real estate loans | � | � | � | 10,101 | 10,101 | |||||||||||||||
| Total | $ | 13,241 | $ | 509 | $ | 539 | $ | 10,695 | $ | 24,984 | ||||||||||
| 127 | |
Table of Contents The following table summarizes the key characteristics of the Company�s credit derivative portfolio by
counterparty at December�31, 2013 and December�31, 2012. The fair values shown are before the application of any counterparty or cash collateral netting. For additional credit exposure information on the Company�s credit derivative
portfolio, see Note 12 to the consolidated financial statements in Item�8. | At December�31, 2013 | ||||||||||||||||||||
| Fair Values(1) | Notionals | |||||||||||||||||||
| Receivable | Payable | Net | Beneficiary | Guarantor | ||||||||||||||||
| (dollars in millions) | ||||||||||||||||||||
| Banks and securities firms | $ | 36,316 | $ | 35,005 | $ | 1,311 | $ | 1,126,688 | $ | 1,093,906 | ||||||||||
| Insurance and other financial institutions | 7,877 | 7,515 | 362 | 265,958 | 302,835 | |||||||||||||||
| Non-financial entities | 153 | 106 | 47 | 4,732 | 4,049 | |||||||||||||||
| Total | $ | 44,346 | $ | 42,626 | $ | 1,720 | $ | 1,397,378 | $ | 1,400,790 | ||||||||||
| (1) | The Company�s CDS are classified in both Level 2 and Level 3 of the fair value hierarchy. Approximately 5% of receivable fair values and 5% of payable fair values represent Level 3 amounts (see Note 4 to the consolidated financial statements in Item�8). |
| At December�31, 2012 | ||||||||||||||||||||
| Fair Values(1) | Notionals | |||||||||||||||||||
| Receivable | Payable | Net | Beneficiary | Guarantor | ||||||||||||||||
| (dollars in millions) | ||||||||||||||||||||
| Banks and securities firms | $ | 60,728 | $ | 57,399 | $ | 3,329 | $ | 1,620,774 | $ | 1,573,217 | ||||||||||
| Insurance and other financial institutions | 7,313 | 6,908 | 405 | 278,705 | 313,897 | |||||||||||||||
| Non-financial entities | 226 | 187 | 39 | 7,922 | 6,078 | |||||||||||||||
| Total | $ | 68,267 | $ | 64,494 | $ | 3,773 | $ | 1,907,401 | $ | 1,893,192 | ||||||||||
| (1) | The Company�s CDS are classified in both Level 2 and Level 3 of the fair value hierarchy. Approximately 7% of receivable fair values and 5% of payable fair values represent Level 3 amounts (see Note 4 to the consolidated financial statements in Item�8). |
| 129 | |
Table of Contents The Company�s sovereign exposures consist of financial instruments entered into with sovereign and
local governments. Its non-sovereign exposures consist of exposures to primarily corporations and financial institutions. The following table shows the Company�s five largest non-U.S. country risk net exposures except for select European
countries (see the table in �Country Risk Exposure�Select European Countries� herein) at December�31, 2013. Index credit derivatives are included in the Company�s country risk exposure tables. Each reference entity within an
index is allocated to that reference entity�s country of risk.�Index exposures are allocated to the underlying reference entities in proportion to the notional weighting of each reference entity in the index, adjusted for any fair value
receivable/payable for that reference entity. Where credit risk crosses multiple jurisdictions, for example, a CDS purchased from an issuer in a specific country that references bonds issued by an entity in a different country, the fair value of the
CDS is reflected in the Net Counterparty Exposure column based on the country of the CDS issuer. Further, the notional amount of the CDS adjusted for the fair value of the receivable/payable is reflected in the Net Inventory column based on the
country of the underlying reference entity. | Country | Net Inventory(1) | Net Counterparty Exposure(2)(3) | Funded Lending | Unfunded Commitments | Exposure Before Hedges | Hedges(4) | Net Exposure(5) | |||||||||||||||||||||
| (dollars in millions) | ||||||||||||||||||||||||||||
| United Kingdom: | ||||||||||||||||||||||||||||
| Sovereigns | $ | 404 | $ | 1 | $ | � | $ | � | $ | 405 | $ | (74 | ) | $ | 331 | |||||||||||||
| Non-sovereigns | 2,030 | 11,828 | 1,260 | 5,382 | 20,500 | (2,848 | ) | 17,652 | ||||||||||||||||||||
| Subtotal | $ | 2,434 | $ | 11,829 | $ | 1,260 | $ | 5,382 | $ | 20,905 | $ | (2,922 | ) | $ | 17,983 | |||||||||||||
| Japan: | ||||||||||||||||||||||||||||
| Sovereigns | $ | 9,000 | $ | 88 | $ | � | $ | � | $ | 9,088 | $ | (10 | ) | $ | 9,078 | |||||||||||||
| Non-sovereigns | 784 | 2,350 | 26 | � | 3,160 | (50 | ) | 3,110 | ||||||||||||||||||||
| Subtotal | $ | 9,784 | $ | 2,438 | $ | 26 | $ | � | $ | 12,248 | $ | (60 | ) | $ | 12,188 | |||||||||||||
| Germany: | ||||||||||||||||||||||||||||
| Sovereigns | $ | (607 | ) | $ | 748 | $ | � | $ | � | $ | 141 | $ | (1,497 | ) | $ | (1,356 | ) | |||||||||||
| Non-sovereigns | 83 | 4,194 | 263 | 4,152 | 8,692 | (1,917 | ) | 6,775 | ||||||||||||||||||||
| Subtotal | $ | (524 | ) | $ | 4,942 | $ | 263 | $ | 4,152 | $ | 8,833 | $ | (3,414 | ) | $ | 5,419 | ||||||||||||
| Brazil: | ||||||||||||||||||||||||||||
| Sovereigns | $ | 3,460 | $ | � | $ | � | $ | � | $ | 3,460 | $ | � | $ | 3,460 | ||||||||||||||
| Non-sovereigns | 60 | 159 | 1,073 | 213 | 1,505 | (309 | ) | 1,196 | ||||||||||||||||||||
| Subtotal | $ | 3,520 | $ | 159 | $ | 1,073 | $ | 213 | $ | 4,965 | $ | (309 | ) | $ | 4,656 | |||||||||||||
| Canada: | ||||||||||||||||||||||||||||
| Sovereigns | $ | 723 | $ | 287 | $ | � | $ | � | $ | 1,010 | $ | � | $ | 1,010 | ||||||||||||||
| Non-sovereigns | 866 | 1,236 | 102 | 1,391 | 3,595 | (242 | ) | 3,353 | ||||||||||||||||||||
| Subtotal | $ | 1,589 | $ | 1,523 | $ | 102 | $ | 1,391 | $ | 4,605 | $ | (242 | ) | $ | 4,363 | |||||||||||||
| (1) | Net inventory represents exposure to both long and short single-name and index positions ( i.e. , bonds and equities at fair value and CDS based on notional amount assuming zero recovery adjusted for any fair value receivable or payable). As a market maker, the Company transacts in these CDS positions to facilitate client trading. At December�31, 2013, gross purchased protection, gross written protection and net exposures related to single-name and index credit derivatives for those countries were $(189.9) billion, $189.0 billion and $(0.9) billion, respectively. For a further description of the triggers for purchased credit protection and whether those triggers may limit the effectiveness of the Company�s hedges, see �Credit Exposure�Derivatives� herein. |
| (2) | Net counterparty exposure ( i.e ., repurchase transactions, securities lending and OTC derivatives) takes into consideration legally enforceable master netting agreements and collateral. |
| (3) | At December�31, 2013, the benefit of collateral received against counterparty credit exposure was $7.8 billion in the U.K., with 98% of collateral consisting of cash, U.S. and U.K. government obligations, and $11.1 billion in Germany with 96% of collateral consisting of cash and government obligations of France, Belgium and Netherlands. The benefit of collateral received against counterparty credit exposure in the three other countries totaled approximately $3.9 billion, with collateral primarily consisting of cash, U.S. and Japanese government obligations. These amounts do not include collateral received on secured financing transactions. |
| 131 | |
| (4) | Represents CDS hedges (purchased and sold) on net counterparty exposure and funded lending executed by trading desks responsible for hedging counterparty and lending credit risk exposures for the Company. Based on the CDS notional amount assuming zero recovery adjusted for any fair value receivable or payable. |
| (5) | In addition, at December�31, 2013, the Company had exposure to these countries for overnight deposits with banks of approximately $10.4 billion. |
| Country | Net Inventory(1) | Net Counterparty Exposure(2)(3) | Funded Lending | Unfunded Commitments | CDS Adjustment(4) | Exposure Before Hedges | Hedges(5) | Net Exposure | ||||||||||||||||||||||||
| (dollars in millions) | ||||||||||||||||||||||||||||||||
| Greece: | ||||||||||||||||||||||||||||||||
| Sovereigns | $ | 8 | $ | 7 | $ | � | $ | � | $ | � | $ | 15 | $ | � | $ | 15 | ||||||||||||||||
| Non-sovereigns | 118 | 3 | � | � | � | 121 | (4 | ) | 117 | |||||||||||||||||||||||
| Subtotal | $ | 126 | $ | 10 | $ | � | $ | � | $ | � | $ | 136 | $ | (4 | ) | $ | 132 | |||||||||||||||
| Ireland: | ||||||||||||||||||||||||||||||||
| Sovereigns | $ | 5 | $ | 1 | $ | � | $ | � | $ | 5 | $ | 11 | $ | � | $ | 11 | ||||||||||||||||
| Non-sovereigns | 239 | 51 | � | � | 13 | 303 | (8 | ) | 295 | |||||||||||||||||||||||
| Subtotal | $ | 244 | $ | 52 | $ | � | $ | � | $ | 18 | $ | 314 | $ | (8 | ) | $ | 306 | |||||||||||||||
| Italy: | ||||||||||||||||||||||||||||||||
| Sovereigns | $ | 752 | $ | 221 | $ | � | $ | � | $ | 713 | $ | 1,686 | $ | (225 | ) | $ | 1,461 | |||||||||||||||
| Non-sovereigns | 182 | 849 | � | 706 | 115 | 1,852 | (243 | ) | 1,609 | |||||||||||||||||||||||
| Subtotal | $ | 934 | $ | 1,070 | $ | � | $ | 706 | $ | 828 | $ | 3,538 | $ | (468 | ) | $ | 3,070 | |||||||||||||||
| Spain: | ||||||||||||||||||||||||||||||||
| Sovereigns | $ | 938 | $ | � | $ | � | $ | � | $ | 16 | $ | 954 | $ | � | $ | 954 | ||||||||||||||||
| Non-sovereigns | 235 | 128 | 120 | 976 | 14 | 1,473 | (234 | ) | 1,239 | |||||||||||||||||||||||
| Subtotal | $ | 1,173 | $ | 128 | $ | 120 | $ | 976 | $ | 30 | $ | 2,427 | $ | (234 | ) | $ | 2,193 | |||||||||||||||
| Portugal: | ||||||||||||||||||||||||||||||||
| Sovereigns | $ | (222 | ) | $ | � | $ | � | $ | � | $ | 47 | $ | (175 | ) | $ | � | $ | (175 | ) | |||||||||||||
| Non-sovereigns | (77 | ) | 27 | 103 | � | 32 | 85 | (9 | ) | 76 | ||||||||||||||||||||||
| Subtotal | $ | (299 | ) | $ | 27 | $ | 103 | $ | � | $ | 79 | $ | (90 | ) | $ | (9 | ) | $ | (99 | ) | ||||||||||||
| Sovereigns | $ | 1,481 | $ | 229 | $ | � | $ | � | $ | 781 | $ | 2,491 | $ | (225 | ) | $ | 2,266 | |||||||||||||||
| Non-sovereigns | 697 | 1,058 | 223 | 1,682 | 174 | 3,834 | (498 | ) | 3,336 | |||||||||||||||||||||||
| Total European Peripherals(6) | $ | 2,178 | $ | 1,287 | $ | 223 | $ | 1,682 | $ | 955 | $ | 6,325 | $ | (723 | ) | $ | 5,602 | |||||||||||||||
| (1) | Net inventory represents exposure to both long and short single-name and index positions ( i.e. , bonds and equities at fair value and CDS based on notional amount assuming zero recovery adjusted for any fair value receivable or payable). As a market maker, the Company transacts in these CDS positions to facilitate client trading. At December�31, 2013, gross purchased protection, gross written protection and net exposures related to single-name and index credit derivatives for the European Peripherals were $(114.6) billion, $114.0 billion and $(0.5) billion, respectively. For a further description of the triggers for purchased credit protection and whether those triggers may limit the effectiveness of the Company�s hedges, see �Credit Exposure�Derivatives� herein. |
| (2) | Net counterparty exposure ( i.e ., repurchase transactions, securities lending and OTC derivatives) takes into consideration legally enforceable master netting agreements and collateral. |
| (3) | At December�31, 2013, the benefit of collateral received against counterparty credit exposure was $3.7 billion in the European Peripherals with 93% of collateral consisting of cash and German government obligations. These amounts do not include collateral received on secured financing transactions. |
Table of Contents| (4) | CDS adjustment represents credit protection purchased from European Peripherals� banks on European Peripherals� sovereign and financial institution risk. Based on the CDS notional amount assuming zero recovery adjusted for any fair value receivable or payable. |
| (5) | Represents CDS hedges (purchased and sold) on net counterparty exposure and funded lending executed by trading desks responsible for hedging counterparty and lending credit risk exposures for the Company. Based on the CDS notional amount assuming zero recovery adjusted for any fair value receivable or payable. |
| (6) | In addition, at December�31, 2013, the Company had European Peripherals exposure for overnight deposits with banks of approximately $111 million. |
| Industry | OTC�Derivative�Products(1) | |||
| (dollars�in�millions) | ||||
| Utilities | $ | 3,142 | ||
| Banks and securities firms | 2,358 | |||
| Funds, exchanges and other financial services(2) | 2,433 | |||
| Special purpose vehicles | 1,908 | |||
| Regional governments | 1,597 | |||
| Healthcare | 1,089 | |||
| Industrials | 914 | |||
| Sovereign governments | 816 | |||
| Not-for-profit organizations | 672 | |||
| Insurance | 538 | |||
| Real Estate | 503 | |||
| Consumer staples | 487 | |||
| Other | 1,157 | |||
| Total | $ | 17,614 | ||
| (1) | For further information on derivative instruments and hedging activities, see Note 12 to the consolidated financial statements in Item�8. |
| (2) | Includes mutual funds, pension funds, private equity and real estate funds, exchanges and clearinghouses and diversified financial services. |
| 133 | |
Table of Contents unenforceable. The Company is generally subject to extensive regulation in the different jurisdictions in which it conducts its business (see also �Business�Supervision and
Regulation� in Part I, Item�1 and �Risk Factors� in Part I, Item�1A). The Company has established procedures based on legal and regulatory requirements on a worldwide basis that are designed to foster compliance with
applicable statutory and regulatory requirements. The Company, principally through the Legal and Compliance Division, also has established procedures that are designed to require that the Company�s policies relating to business conduct, ethics
and practices are followed globally. In connection with its businesses, the Company has and continuously develops various procedures addressing issues such as regulatory capital requirements, sales and trading practices, new products, information
barriers, potential conflicts of interest, structured transactions, use and safekeeping of customer funds and securities, lending and credit granting, anti-money laundering, privacy and recordkeeping. In addition, the Company has established
procedures to mitigate the risk that a counterparty�s performance obligations will be unenforceable, including consideration of counterparty legal authority and capacity, adequacy of legal documentation, the permissibility of a transaction
under applicable law and whether applicable bankruptcy or insolvency laws limit or alter contractual remedies. The legal and regulatory focus on the financial services industry presents a continuing business challenge for the Company. | 135 | |
| Item�8. | Financial Statements and Supplementary Data. |
| /s/ Deloitte & Touche LLP |
| New York, New York |
| February 25, 2014 |
| 136 |
| December�31, 2013 | December�31, 2012 | |||||||
| Assets | ||||||||
| Cash and due from banks ($544 and $526 at December�31, 2013 and December�31, 2012, respectively, related to consolidated variable interest entities generally not available to the Company) | $ | 16,602 | $ | 20,878 | ||||
| Interest bearing deposits with banks | 43,281 | 26,026 | ||||||
| Cash deposited with clearing organizations or segregated under federal and other regulations or requirements | 39,203 | 30,970 | ||||||
| Trading assets, at fair value (approximately $151,078 and $147,348 were pledged to various parties at December�31, 2013 and December�31, 2012, respectively; $2,825 and $3,505 related to consolidated variable interest entities, generally not available to the Company at December 31, 2013 and December�31, 2012, respectively) | 280,744 | 267,603 | ||||||
| Securities available for sale, at fair value | 53,430 | 39,869 | ||||||
| Securities received as collateral, at fair value | 20,508 | 14,278 | ||||||
| Federal funds sold and securities purchased under agreements to resell (includes $866 and $621 at fair value at December�31, 2013 and December 31, 2012, respectively) | 118,130 | 134,412 | ||||||
| Securities borrowed | 129,707 | 121,701 | ||||||
| Customer and other receivables | 57,104 | 64,288 | ||||||
| Loans: | ||||||||
| Held for investment (net of allowances of $156 and $106 at December 31, 2013 and December�31, 2012, respectively) | 36,545 | 23,917 | ||||||
| Held for sale | 6,329 | 5,129 | ||||||
| Other investments | 5,086 | 4,999 | ||||||
| Premises, equipment and software costs (net of accumulated depreciation of $6,420 and $5,525 at December�31, 2013 and December�31, 2012, respectively) ($201 and $224 at December 31, 2013 and December�31, 2012, respectively, related to consolidated variable interest entities, generally not available to the Company) | 6,019 | 5,946 | ||||||
| Goodwill | 6,595 | 6,650 | ||||||
| Intangible assets (net of accumulated amortization of $1,703 and $1,250 at December�31, 2013 and December�31, 2012, respectively) (includes $8 and $7 at fair value at December 31, 2013 and December�31, 2012, respectively) | 3,286 | 3,783 | ||||||
| Other assets ($11 and $593 at December�31, 2013 and December�31, 2012, respectively, related to consolidated variable interest entities, generally not available to the Company) | 10,133 | 10,511 | ||||||
| Total assets | $ | 832,702 | $ | 780,960 | ||||
| Liabilities | ||||||||
| Deposits (includes $185 and $1,485 at fair value at December�31, 2013 and December�31, 2012, respectively) | $ | 112,379 | $ | 83,266 | ||||
| Commercial paper and other short-term borrowings (includes $1,347 and $725 at fair value at December�31, 2013 and December 31, 2012, respectively) | 2,142 | 2,138 | ||||||
| Trading liabilities, at fair value | 104,521 | 120,122 | ||||||
| Obligation to return securities received as collateral, at fair value | 24,568 | 18,226 | ||||||
| Securities sold under agreements to repurchase (includes $561 and $363 at fair value at December�31, 2013 and December�31, 2012, respectively) | 145,676 | 122,674 | ||||||
| Securities loaned | 32,799 | 36,849 | ||||||
| Other secured financings (includes $5,206 and $9,466 at fair value at December�31, 2013 and December�31, 2012, respectively) ($543 and $976 at December 31, 2013 and December 31, 2012, respectively, related to consolidated variable interest entities and are non-recourse to the Company) | 14,215 | 15,727 | ||||||
| Customer and other payables | 157,125 | 127,722 | ||||||
| Other liabilities and accrued expenses ($76 and $117 at December�31, 2013 and December�31, 2012, respectively, related to consolidated variable interest entities and are non-recourse to the Company) | 16,672 | 14,928 | ||||||
| Long-term borrowings (includes $35,637 and $44,044 at fair value at December�31, 2013 and December�31, 2012, respectively) | 153,575 | 169,571 | ||||||
| Total liabilities | 763,672 | 711,223 | ||||||
| Commitments and contingent liabilities (see Note 13) | ||||||||
| Redeemable noncontrolling interests (see Notes 3 and 15) | � | 4,309 | ||||||
| Equity | ||||||||
| Morgan Stanley shareholders� equity: | ||||||||
| Preferred stock (see Note 15) | 3,220 | 1,508 | ||||||
| Common stock, $0.01 par value: | ||||||||
| Shares authorized: 3,500,000,000 at December 31, 2013 and December�31, 2012; | ||||||||
| Shares issued: 2,038,893,979 at December 31, 2013 and December 31, 2012; | ||||||||
| Shares outstanding: 1,944,868,751 at December 31, 2013 and 1,974,042,123 at December 31, 2012 | 20 | 20 | ||||||
| Additional Paid-in capital | 24,570 | 23,426 | ||||||
| Retained earnings | 42,172 | 39,912 | ||||||
| Employee stock trusts | 1,718 | 2,932 | ||||||
| Accumulated other comprehensive loss | (1,093 | ) | (516 | ) | ||||
| Common stock held in treasury, at cost, $0.01 par value; 94,025,228 shares at December 31, 2013 and 64,851,856 shares at December 31, 2012 | (2,968 | ) | (2,241 | ) | ||||
| Common stock issued to employee stock trusts | (1,718 | ) | (2,932 | ) | ||||
| Total Morgan Stanley shareholders� equity | 65,921 | 62,109 | ||||||
| Nonredeemable noncontrolling interests | 3,109 | 3,319 | ||||||
| Total equity | 69,030 | 65,428 | ||||||
| Total liabilities, redeemable noncontrolling interests and equity | $ | 832,702 | $ | 780,960 | ||||
| 137 | |
| 2013 | 2012 | 2011 | ||||||||||
| Revenues: | ||||||||||||
| Investment banking | $ | 5,246 | $ | 4,758 | $ | 4,991 | ||||||
| Trading | 9,359 | 6,990 | 12,384 | |||||||||
| Investments | 1,777 | 742 | 573 | |||||||||
| Commissions and fees | 4,629 | 4,253 | 5,343 | |||||||||
| Asset management, distribution and administration fees | 9,638 | 9,008 | 8,409 | |||||||||
| Other | 990 | 556 | 176 | |||||||||
| Total non-interest revenues | 31,639 | 26,307 | 31,876 | |||||||||
| Interest income | 5,209 | 5,692 | 7,234 | |||||||||
| Interest expense | 4,431 | 5,897 | 6,883 | |||||||||
| Net interest | 778 | (205 | ) | 351 | ||||||||
| Net revenues | 32,417 | 26,102 | 32,227 | |||||||||
| Non-interest expenses: | ||||||||||||
| Compensation and benefits | 16,277 | 15,615 | 16,325 | |||||||||
| Occupancy and equipment | 1,499 | 1,543 | 1,544 | |||||||||
| Brokerage, clearing and exchange fees | 1,711 | 1,535 | 1,633 | |||||||||
| Information processing and communications | 1,768 | 1,912 | 1,808 | |||||||||
| Marketing and business development | 638 | 601 | 594 | |||||||||
| Professional services | 1,894 | 1,922 | 1,793 | |||||||||
| Other | 4,148 | 2,454 | 2,420 | |||||||||
| Total non-interest expenses | 27,935 | 25,582 | 26,117 | |||||||||
| Income from continuing operations before income taxes | 4,482 | 520 | 6,110 | |||||||||
| Provision for (benefit from) income taxes | 826 | (237 | ) | 1,414 | ||||||||
| Income from continuing operations | 3,656 | 757 | 4,696 | |||||||||
| Discontinued operations: | ||||||||||||
| Gain (loss) from discontinued operations | (72 | ) | (48 | ) | (170 | ) | ||||||
| Provision for (benefit from) income taxes | (29 | ) | (7 | ) | (119 | ) | ||||||
| Net gain (loss) from discontinued operations | (43 | ) | (41 | ) | (51 | ) | ||||||
| Net income | $ | 3,613 | $ | 716 | $ | 4,645 | ||||||
| Net income applicable to redeemable noncontrolling interests | 222 | 124 | � | |||||||||
| Net income applicable to nonredeemable noncontrolling interests | 459 | 524 | 535 | |||||||||
| Net income applicable to Morgan Stanley | $ | 2,932 | $ | 68 | $ | 4,110 | ||||||
| Preferred stock dividends | 277 | 98 | 2,043 | |||||||||
| Earnings (loss) applicable to Morgan Stanley common shareholders | $ | 2,655 | $ | (30 | ) | $ | 2,067 | |||||
| Amounts applicable to Morgan Stanley: | ||||||||||||
| Income from continuing operations | $ | 2,975 | $ | 138 | $ | 4,168 | ||||||
| Net loss from discontinued operations | (43 | ) | (70 | ) | (58 | ) | ||||||
| Net income applicable to Morgan Stanley | $ | 2,932 | $ | 68 | $ | 4,110 | ||||||
| Earnings (loss) per basic common share: | ||||||||||||
| Income from continuing operations | $ | 1.42 | $ | 0.02 | $ | 1.28 | ||||||
| Net loss from discontinued operations | (0.03 | ) | (0.04 | ) | (0.03 | ) | ||||||
| Earnings (loss) per basic common share | $ | 1.39 | $ | (0.02 | ) | $ | 1.25 | |||||
| Earnings (loss) per diluted common share: | ||||||||||||
| Income from continuing operations | $ | 1.38 | $ | 0.02 | $ | 1.27 | ||||||
| Net loss from discontinued operations | (0.02 | ) | (0.04 | ) | (0.04 | ) | ||||||
| Earnings (loss) per diluted common share | $ | 1.36 | $ | (0.02 | ) | $ | 1.23 | |||||
| Dividends declared per common share | $ | 0.20 | $ | 0.20 | $ | 0.20 | ||||||
| Average common shares outstanding: | ||||||||||||
| Basic | 1,905,823,882 | 1,885,774,276 | 1,654,708,640 | |||||||||
| Diluted | 1,956,519,738 | 1,918,811,270 | 1,675,271,669 | |||||||||
| | 138 |
| 2013 | 2012 | 2011 | ||||||||||
| Net income | $ | 3,613 | $ | 716 | $ | 4,645 | ||||||
| Other comprehensive income (loss), net of tax: | ||||||||||||
| Foreign currency translation adjustments(1) | $ | (348 | ) | $ | (255 | ) | $ | 35 | ||||
| Amortization of cash flow hedges(2) | 4 | 6 | 7 | |||||||||
| Change in net unrealized gains (losses) on securities available for sale(3) | (433 | ) | 28 | 87 | ||||||||
| Pension, postretirement and other related adjustments(4) | (5 | ) | (260 | ) | 251 | |||||||
| Total other comprehensive income (loss) | $ | (782 | ) | $ | (481 | ) | $ | 380 | ||||
| Comprehensive income | $ | 2,831 | $ | 235 | $ | 5,025 | ||||||
| Net income applicable to redeemable noncontrolling interests | 222 | 124 | � | |||||||||
| Net income applicable to nonredeemable noncontrolling interests | 459 | 524 | 535 | |||||||||
| Other comprehensive income (loss) applicable to redeemable noncontrolling interests | � | (2 | ) | � | ||||||||
| Other comprehensive income (loss) applicable to nonredeemable noncontrolling interests | (205 | ) | (120 | ) | 70 | |||||||
| Comprehensive income (loss) applicable to Morgan Stanley | $ | 2,355 | $ | (291 | ) | $ | 4,420 | |||||
| (1) | Amounts are net of provision for income taxes of $351 million, $120 million and $86 million for 2013, 2012 and 2011, respectively. |
| (2) | Amounts are net of provision for income taxes of $3 million, $3 million and $6 million for 2013, 2012 and 2011, respectively. |
| (3) | Amounts are net of provision for (benefit from) income taxes of $(296) million, $16 million and $63 million for 2013, 2012 and 2011, respectively. |
| (4) | Amounts are net of provision for (benefit from) income taxes of $8 million, $(156) million and $153 million for 2013, 2012 and 2011, respectively. |
| 139 | |
| 2013 | 2012 | 2011 | ||||||||||
| CASH FLOWS FROM OPERATING ACTIVITIES | ||||||||||||
| Net income | $ | 3,613 | $ | 716 | $ | 4,645 | ||||||
| Adjustments to reconcile net income to net cash provided by operating activities: | ||||||||||||
| Deferred income taxes | (117 | ) | (639 | ) | 413 | |||||||
| (Income) loss on equity method investees | (375 | ) | 23 | 995 | ||||||||
| Compensation payable in common stock and options | 1,180 | 891 | 1,300 | |||||||||
| Depreciation and amortization | 1,511 | 1,581 | 1,404 | |||||||||
| Net gain on business dispositions | (34 | ) | (156 | ) | (24 | ) | ||||||
| Net gain on sale of securities available for sale | (45 | ) | (78 | ) | (143 | ) | ||||||
| Impairment charges | 198 | 271 | 159 | |||||||||
| Provision for credit losses on lending activities | 110 | 155 | (113 | ) | ||||||||
| Other non-cash adjustments to net income | 100 | 12 | (131 | ) | ||||||||
| Changes in assets and liabilities: | ||||||||||||
| Cash deposited with clearing organizations or segregated under federal and other regulations or requirements | (8,233 | ) | (1,516 | ) | (10,274 | ) | ||||||
| Trading assets, net of Trading liabilities | (23,054 | ) | 6,389 | 29,913 | ||||||||
| Securities borrowed | (8,006 | ) | 5,373 | 11,656 | ||||||||
| Securities loaned | (4,050 | ) | 6,387 | 1,368 | ||||||||
| Customer and other receivables and other assets | 6,774 | (10,030 | ) | 5,899 | ||||||||
| Customer and other payables and other liabilities | 26,697 | (1,283 | ) | (6,985 | ) | |||||||
| Federal funds sold and securities purchased under agreements to resell | 16,282 | (4,257 | ) | 18,098 | ||||||||
| Securities sold under agreements to repurchase | 23,002 | 20,920 | (42,798 | ) | ||||||||
| Net cash provided by operating activities | 35,553 | 24,759 | 15,382 | |||||||||
| CASH FLOWS FROM INVESTING ACTIVITIES | ||||||||||||
| Proceeds from (payments for): | ||||||||||||
| Premises, equipment and software | (1,316 | ) | (1,312 | ) | (1,304 | ) | ||||||
| Business dispositions, net of cash disposed | 1,147 | 1,725 | � | |||||||||
| Japanese securities joint venture with MUFG | � | � | (129 | ) | ||||||||
| Loans | (10,057 | ) | (3,486 | ) | (9,208 | ) | ||||||
| Purchases of securities available for sale | (30,557 | ) | (24,477 | ) | (20,601 | ) | ||||||
| Sales of securities available for sale | 11,425 | 10,398 | 17,064 | |||||||||
| Maturities and redemptions of securities available for sale | 4,757 | 4,738 | 2,934 | |||||||||
| Other investing activities | 140 | (211 | ) | 510 | ||||||||
| Net cash used for investing activities | (24,461 | ) | (12,625 | ) | (10,734 | ) | ||||||
| CASH FLOWS FROM FINANCING ACTIVITIES | ||||||||||||
| Net proceeds from (payments for): | ||||||||||||
| Commercial paper and other short-term borrowings | 4 | (705 | ) | (413 | ) | |||||||
| Noncontrolling interests | (557 | ) | (296 | ) | (791 | ) | ||||||
| Other secured financings | (10,726 | ) | (6,628 | ) | 1,867 | |||||||
| Deposits | 29,113 | 17,604 | 1,850 | |||||||||
| Proceeds from: | ||||||||||||
| Excess tax benefits associated with stock-based awards | 10 | 42 | � | |||||||||
| Derivatives financing activities | 1,003 | 243 | 129 | |||||||||
| Issuance of preferred stock, net of issuance costs | 1,696 | � | � | |||||||||
| Issuance of long-term borrowings | 27,939 | 23,646 | 32,725 | |||||||||
| Payments for: | ||||||||||||
| Long-term borrowings | (38,742 | ) | (43,092 | ) | (39,232 | ) | ||||||
| Derivatives financing activities | (1,216 | ) | (125 | ) | (132 | ) | ||||||
| Repurchases of common stock | (691 | ) | (227 | ) | (317 | ) | ||||||
| Purchase of additional stake in Wealth Management JV | (4,725 | ) | (1,890 | ) | � | |||||||
| Cash dividends | (475 | ) | (469 | ) | (834 | ) | ||||||
| Net cash provided by (used for) financing activities | 2,633 | (11,897 | ) | (5,148 | ) | |||||||
| Effect of exchange rate changes on cash and cash equivalents | (202 | ) | (119 | ) | (314 | ) | ||||||
| Effect of cash and cash equivalents related to variable interest entities | (544 | ) | (526 | ) | 511 | |||||||
| Net increase (decrease) in cash and cash equivalents | 12,979 | (408 | ) | (303 | ) | |||||||
| Cash and cash equivalents, at beginning of period | 46,904 | 47,312 | 47,615 | |||||||||
| Cash and cash equivalents, at end of period | $ | 59,883 | $ | 46,904 | $ | 47,312 | ||||||
| Cash and cash equivalents include: | ||||||||||||
| Cash and due from banks | $ | 16,602 | $ | 20,878 | $ | 13,165 | ||||||
| Interest bearing deposits with banks | 43,281 | 26,026 | 34,147 | |||||||||
| Cash and cash equivalents, at end of period | $ | 59,883 | $ | 46,904 | $ | 47,312 | ||||||
| | 140 |
| Preferred Stock | Common Stock | Paid-in Capital | Retained Earnings | Employee Stock Trusts | Accumulated Other Comprehensive Income (Loss) | Common Stock Held in Treasury at Cost | Common Stock Issued to Employee Stock Trusts | Non- redeemable Non- controlling Interests | Total Equity | |||||||||||||||||||||||||||||||
| BALANCE AT DECEMBER 31, 2010 | $ | 9,597 | $ | 16 | $ | 13,521 | $ | 38,603 | $ | 3,465 | $ | (467 | ) | $ | (4,059 | ) | $ | (3,465 | ) | $ | 8,196 | $ | 65,407 | |||||||||||||||||
| Net income applicable to Morgan Stanley | � | � | � | 4,110 | � | � | � | � | � | 4,110 | ||||||||||||||||||||||||||||||
| Net income applicable to nonredeemable noncontrolling interests | � | � | � | � | � | � | � | � | 535 | 535 | ||||||||||||||||||||||||||||||
| Dividends | � | � | � | (646 | ) | � | � | � | � | � | (646 | ) | ||||||||||||||||||||||||||||
| Shares issued under employee plans and related tax effects | � | � | (642 | ) | � | (299 | ) | � | 1,877 | 299 | � | 1,235 | ||||||||||||||||||||||||||||
| Repurchases of common stock | � | � | � | � | � | � | (317 | ) | � | � | (317 | ) | ||||||||||||||||||||||||||||
| Net change in Accumulated other comprehensive income | � | � | � | � | � | 310 | � | � | 70 | 380 | ||||||||||||||||||||||||||||||
| Other increase in equity method investments | � | � | 146 | � | � | � | � | � | � | 146 | ||||||||||||||||||||||||||||||
| MUFG stock conversion | (8,089 | ) | 4 | 9,811 | (1,726 | ) | � | � | � | � | � | � | ||||||||||||||||||||||||||||
| Other net decreases | � | � | � | � | � | � | � | � | (772 | ) | (772 | ) | ||||||||||||||||||||||||||||
| BALANCE AT DECEMBER 31, 2011 | 1,508 | 20 | 22,836 | 40,341 | 3,166 | (157 | ) | (2,499 | ) | (3,166 | ) | 8,029 | 70,078 | |||||||||||||||||||||||||||
| Net income applicable to Morgan Stanley | � | � | � | 68 | � | � | � | � | � | 68 | ||||||||||||||||||||||||||||||
| Net income applicable to nonredeemable noncontrolling interests | � | � | � | � | � | � | � | � | 524 | 524 | ||||||||||||||||||||||||||||||
| Dividends | � | � | � | (497 | ) | � | � | � | � | � | (497 | ) | ||||||||||||||||||||||||||||
| Shares issued under employee plans and related tax effects | � | � | 662 | � | (234 | ) | � | 485 | 234 | � | 1,147 | |||||||||||||||||||||||||||||
| Repurchases of common stock | � | � | � | � | � | � | (227 | ) | � | � | (227 | ) | ||||||||||||||||||||||||||||
| Net change in Accumulated other comprehensive income | � | � | � | � | � | (359 | ) | � | � | (120 | ) | (479 | ) | |||||||||||||||||||||||||||
| Purchase of additional stake in Wealth Management JV | � | � | (107 | ) | � | � | � | � | � | (1,718 | ) | (1,825 | ) | |||||||||||||||||||||||||||
| Reclassification to redeemable noncontrolling interests | � | � | � | � | � | � | � | � | (4,288 | ) | (4,288 | ) | ||||||||||||||||||||||||||||
| Other net increases | � | � | 35 | � | � | � | � | � | 892 | 927 | ||||||||||||||||||||||||||||||
| BALANCE AT DECEMBER 31, 2012 | 1,508 | 20 | 23,426 | 39,912 | 2,932 | (516 | ) | (2,241 | ) | (2,932 | ) | 3,319 | 65,428 | |||||||||||||||||||||||||||
| Net income applicable to Morgan Stanley | � | � | � | 2,932 | � | � | � | � | � | 2,932 | ||||||||||||||||||||||||||||||
| Net income applicable to nonredeemable noncontrolling interests | � | � | � | � | � | � | � | � | 459 | 459 | ||||||||||||||||||||||||||||||
| Dividends | � | � | � | (521 | ) | � | � | � | � | � | (521 | ) | ||||||||||||||||||||||||||||
| Shares issued under employee plans and related tax effects | � | � | 1,160 | � | (1,214 | ) | � | (36 | ) | 1,214 | � | 1,124 | ||||||||||||||||||||||||||||
| Repurchases of common stock | � | � | � | � | � | � | (691 | ) | � | � | (691 | ) | ||||||||||||||||||||||||||||
| Net change in Accumulated other comprehensive income | � | � | � | � | � | (577 | ) | � | � | (205 | ) | (782 | ) | |||||||||||||||||||||||||||
| Issuance of preferred stock | 1,712 | � | (16 | ) | � | � | � | � | � | � | 1,696 | |||||||||||||||||||||||||||||
| Wealth Management JV redemption value adjustment | � | � | � | (151 | ) | � | � | � | � | � | (151 | ) | ||||||||||||||||||||||||||||
| Other net decreases | � | � | � | � | � | � | � | � | (464 | ) | (464 | ) | ||||||||||||||||||||||||||||
| BALANCE AT DECEMBER 31, 2013 | $ | 3,220 | $ | 20 | $ | 24,570 | $ | 42,172 | $ | 1,718 | $ | (1,093 | ) | $ | (2,968 | ) | $ | (1,718 | ) | $ | 3,109 | $ | 69,030 | |||||||||||||||||
Table of Contents MORGAN STANLEY NOTES TO CONSOLIDATED FINANCIAL
STATEMENTS 1.����Introduction and
Basis of Presentation. The
Company. Morgan Stanley, a financial holding company, is a global financial services firm that maintains significant market positions in each of its business segments�Institutional Securities, Wealth Management
and Investment Management. The Company, through its subsidiaries and affiliates, provides a wide variety of products and services to a large and diversified group of clients and customers, including corporations, governments, financial institutions
and individuals. Unless the context otherwise requires, the terms �Morgan Stanley� or the �Company� mean Morgan Stanley (the �Parent�) together with its consolidated subsidiaries. Effective with the quarter ended June�30, 2013, the Global Wealth
Management Group and Asset Management business segments were re-titled Wealth Management and Investment Management, respectively. A summary of the activities of each of the Company�s business segments is as follows: Institutional Securities provides financial advisory and capital raising services, including: advice on
mergers and acquisitions, restructurings, real estate and project finance; corporate lending; sales, trading, financing and market-making activities in equity and fixed income securities and related products, including foreign exchange and
commodities; and investment activities. Wealth Management provides brokerage and investment advisory services to individual investors and small-to-medium sized businesses
and institutions covering various investment alternatives; financial and wealth planning services; annuity and other insurance products; credit and other lending products; cash management services; retirement services; and engages in fixed income
trading, which primarily facilitates clients� trading or investments in such securities. Investment Management provides a broad array of investment strategies that span the risk/return spectrum across geographies, asset classes and public and private markets to a diverse group of
clients across the institutional and intermediary channels as well as high net worth clients. Discontinued Operations. Quilter. On April�2, 2012, the Company completed the sale of Quilter�& Co. Ltd. (�Quilter�), its retail wealth management business in the�United
Kingdom (�U.K.�).�Net revenues for Quilter were $148 million and $134 million for 2012 and 2011, respectively. Net pre-tax gains (losses) were $(1) million, $97 million and $21 million for 2013, 2012 and 2011, respectively, and
included a gain of approximately $108 million in 2012 in connection with the sale of Quilter. The results of Quilter are reported as discontinued operations within the Wealth Management business segment for all periods presented. Saxon. On October�24, 2011, the Company
announced that it had reached an agreement to sell Saxon, a provider of servicing and subservicing of residential mortgage loans, to Ocwen Financial Corporation. The transaction, which was restructured as a sale of Saxon�s assets during the
first quarter of 2012, was substantially completed in the second quarter of 2012. Net revenues for Saxon were $79 million and $28 million for 2012 and 2011, respectively, and pre-tax losses were $64 million, $187 million and $194 million for 2013,
2012 and 2011, respectively. Revenues included a pre-tax gain of approximately $51 million in 2012, primarily resulting from the subsequent increase in fair value of Saxon, which had incurred impairment losses of $98 million in the quarter ended
December�31, 2011. Pre-tax loss in 2012 included a provision of approximately $115 million related to a settlement with the Board of Governors of the Federal Reserve System (the �Federal Reserve�) concerning the independent
foreclosure review related to Saxon. The results of Saxon are reported as discontinued operations within the Institutional Securities business segment for all periods presented. | | 142 |
Table of Contents MORGAN STANLEY NOTES TO CONSOLIDATED FINANCIAL STATEMENTS�(Continued) economic performance, the Company consolidates those entities it controls either through a majority voting interest or otherwise. For VIEs ( i.e. , entities that do not meet these criteria),
the Company consolidates those entities where the Company has the power to make the decisions that most significantly affect the economic performance of the VIE and has the obligation to absorb losses or the right to receive benefits that could
potentially be significant to the VIE, except for certain VIEs that are money market funds, are investment companies or are entities qualifying for accounting purposes as investment companies. Generally, the Company consolidates those entities when
it absorbs a majority of the expected losses or a majority of the expected residual returns, or both, of the entities. For investments in entities in which the Company does not have a controlling financial interest but has significant influence over operating and financial
decisions, the Company generally applies the equity method of accounting with net gains and losses recorded within Other revenues. Where the Company has elected to measure certain eligible investments at fair value in accordance with the fair value
option, net gains and losses are recorded within Investments revenues (see Note 4). Equity and partnership interests held by entities qualifying for accounting purposes as investment companies are carried at fair value. The Company�s significant regulated U.S. and international subsidiaries
include Morgan Stanley�& Co. LLC (�MS&Co.�), Morgan Stanley Smith Barney LLC (�MSSB LLC�), Morgan Stanley�& Co. International plc (�MSIP�), Morgan Stanley MUFG Securities Co., Ltd.
(�MSMS�), Morgan Stanley Bank, N.A. (�MSBNA�) and Morgan Stanley Private Bank, National Association (�MSPBNA�). Income Statement Presentation. The Company, through its subsidiaries and affiliates, provides a wide variety of
products and services to a large and diversified group of clients and customers, including corporations, governments, financial institutions and individuals. In connection with the delivery of the various products and services to clients, the
Company manages its revenues and related expenses in the aggregate. As such, when assessing the performance of its businesses, primarily in its Institutional Securities business segment, the Company considers its trading, investment banking,
commissions and fees, and interest income, along with the associated interest expense, as one integrated activity. 2.����Significant Accounting Policies. Revenue Recognition. Investment Banking. Underwriting revenues and advisory fees from mergers, acquisitions and restructuring transactions are recorded when services for the transactions are
determined to be substantially completed, generally as set forth under the terms of the engagement. Transaction-related expenses, primarily consisting of legal, travel and other costs directly associated with the transaction, are deferred and
recognized in the same period as the related investment banking transaction revenues. Underwriting revenues are presented net of related expenses. Non-reimbursed expenses associated with advisory transactions are recorded within Non-interest
expenses. Commissions and
fees. Commission and fee revenues primarily arise from agency transactions in listed and over-the-counter (�OTC�) equity securities; services related to sales and trading activities; and sales of mutual funds,
futures, insurance products and options. Commission and fee revenues are recognized in the accounts on trade date. Asset Management, Distribution and Administration Fees. Asset management, distribution and administration fees are recognized over the relevant contract period. Sales
commissions paid by the Company in connection with the sale of certain classes of shares of its open-end mutual fund products are accounted for as deferred | | 144 |
Table of Contents MORGAN STANLEY NOTES TO CONSOLIDATED FINANCIAL STATEMENTS�(Continued) certain securities purchased under agreements to resell, certain loans and lending commitments, certain equity method investments, certain securities sold under agreements to repurchase, certain
structured notes, certain time deposits and certain other secured financings. Fair Value Measurement�Definition and Hierarchy .����Fair value is defined as the price that would be received to sell an asset or paid to transfer a liability ( i.e. ,
the �exit price�) in an orderly transaction between market participants at the measurement date. In determining fair value, the Company uses various valuation approaches and establishes a hierarchy for inputs used in measuring fair value that maximizes the use of relevant observable inputs and
minimizes the use of unobservable inputs by requiring that the most observable inputs be used when available. Observable inputs are inputs that market participants would use in pricing the asset or liability that were developed based on market data
obtained from sources independent of the Company. Unobservable inputs are inputs that reflect the Company�s assumptions about the assumptions other market participants would use in pricing the asset or liability that were developed based on the
best information available in the circumstances. The hierarchy is broken down into three levels based on the observability of inputs as follows: | � | Level 1�Valuations based on quoted prices in active markets for identical assets or liabilities that the Company has the ability to access. Valuation adjustments and block discounts are not applied to Level 1 instruments. Since valuations are based on quoted prices that are readily and regularly available in an active market, valuation of these products does not entail a significant degree of judgment. |
| � | Level 2�Valuations based on one or more quoted prices in markets that are not active or for which all significant inputs are observable, either directly or indirectly. |
| � | Level 3�Valuations based on inputs that are unobservable and significant to the overall fair value measurement. |
| | 146 |
| 147 | |
| | 148 |
| 149 | |
| | 150 |
| 151 | |
| | 152 |
| 153 | |
| | 154 |
| 155 | |
| | 156 |
| � | U.S. Treasury Securities .����U.S. Treasury securities are valued using quoted market prices. Valuation adjustments are not applied. Accordingly, U.S. Treasury securities are generally categorized in Level�1 of the fair value hierarchy. |
| � | U.S. Agency Securities .����U.S. agency securities are composed of three main categories consisting of agency-issued debt, agency mortgage pass-through pool securities and collateralized mortgage obligations. Non-callable agency-issued debt securities are generally valued using quoted market prices. Callable agency-issued debt securities are valued by benchmarking model-derived prices to quoted market prices and trade data for identical or comparable securities. The fair value of agency�mortgage |
| 157 | |
| pass-through pool securities is model-driven based on spreads of the comparable To-be-announced security. Collateralized mortgage obligations are valued using quoted market prices and trade data adjusted by subsequent changes in related indices for identical or comparable securities. Actively traded non-callable agency-issued debt securities are generally categorized in Level 1 of the fair value hierarchy. Callable agency-issued debt securities, agency mortgage pass-through pool securities and collateralized mortgage obligations are generally categorized in Level 2 of the fair value hierarchy. |
| � | Foreign sovereign government obligations are valued using quoted prices in active markets when available. These bonds are generally categorized in Level 1 of the fair value hierarchy. If the market is less active or prices are dispersed, these bonds are categorized in Level 2 of the fair value hierarchy. In instances where the inputs are unobservable, these bonds are categorized in Level 3 of the fair value hierarchy. |
| � | State and Municipal Securities .����The fair value of state and municipal securities is determined using recently executed transactions, market price quotations and pricing models that factor in, where applicable, interest rates, bond or credit default swap spreads and volatility. These bonds are generally categorized in Level 2 of the fair value hierarchy. |
| � | Residential Mortgage-Backed Securities (�RMBS�), Commercial Mortgage-Backed Securities (�CMBS�) and other Asset-Backed Securities (�ABS�) .����RMBS, CMBS and other ABS may be valued based on price or spread data obtained from observed transactions or independent external parties such as vendors or brokers. When position-specific external price data are not observable, the fair value determination may require benchmarking to similar instruments and/or analyzing expected credit losses, default and recovery rates, and/or applying discounted cash flow techniques. In evaluating the fair value of each security, the Company considers security collateral-specific attributes, including payment priority, credit enhancement levels, type of collateral, delinquency rates and loss severity. In addition, for RMBS borrowers, Fair Isaac Corporation (�FICO�) scores and the level of documentation for the loan are also considered. Market standard models, such as Intex, Trepp or others, may be deployed to model the specific collateral composition and cash flow structure of each transaction. Key inputs to these models are market spreads, forecasted credit losses, and default and prepayment rates for each asset category. Valuation levels of RMBS and CMBS indices are also used as an additional data point for benchmarking purposes or to price outright index positions. |
| � | Corporate Bonds .����The fair value of corporate bonds is determined using recently executed transactions, market price quotations (where observable), bond spreads, credit default swap spreads, at the money volatility and/or volatility skew obtained from independent external parties such as vendors and brokers adjusted for any basis difference between cash and derivative instruments. The spread data used are for the same maturity as the bond. If the spread data do not reference the issuer, then data that reference a comparable issuer are used. When position-specific external price data are not observable, fair value is determined based on either benchmarking to similar instruments or cash flow models with yield curves, bond or single-name credit default swap spreads and recovery rates as significant inputs. Corporate bonds are generally categorized in Level 2 of the fair value hierarchy; in instances where prices, spreads or any of the other aforementioned key inputs are unobservable, they are categorized in Level 3 of the fair value hierarchy. |
| | 158 |
| � | Collateralized Debt and Loan Obligations .����The Company holds cash collateralized debt obligations (�CDOs�)/collateralized loan obligations (�CLOs�) that typically reference a tranche of an underlying synthetic portfolio of single name credit default swaps collateralized by corporate bonds (�credit-linked notes�) or cash portfolio of asset-backed securities/loans (�asset-backed CDOs/CLOs�). Credit correlation, a primary input used to determine the fair value of credit-linked notes, is usually unobservable and derived using a benchmarking technique. The other credit-linked note model inputs such as credit spreads, including collateral spreads, and interest rates are typically observable. Asset-backed CDOs/CLOs are valued based on an evaluation of the market and model input parameters sourced from similar positions as indicated by primary and secondary market activity. Each asset-backed CDO/CLO position is evaluated independently taking into consideration available comparable market levels, underlying collateral performance and pricing, and deal structures, as well as liquidity. Cash CDOs/CLOs are categorized in Level 2 of the fair value hierarchy when either the credit correlation input is insignificant or comparable market transactions are observable. In instances where the credit correlation input is deemed to be significant or comparable market transactions are unobservable, cash CDOs/CLOs are categorized in Level 3 of the fair value hierarchy. |
| � | Corporate Loans and Lending Commitments .����The fair value of corporate loans is determined using recently executed transactions, market price quotations (where observable), implied yields from comparable debt, and market observable credit default swap spread levels obtained from independent external parties such as vendors and brokers adjusted for any basis difference between cash and derivative instruments, along with proprietary valuation models and default recovery analysis where such transactions and quotations are unobservable. The fair value of�contingent corporate lending commitments is determined by using executed transactions on comparable loans and the anticipated market price based on pricing indications from syndicate banks and customers. The valuation of loans and lending commitments also takes into account fee income that is considered an attribute of the contract. Corporate loans and lending commitments are categorized in Level 2 of the fair value hierarchy except in instances where prices or significant spread inputs are unobservable, in which case they are categorized in Level 3 of the fair value hierarchy. |
| � | Mortgage Loans .����Mortgage loans are valued using observable prices based on transactional data or third-party pricing for identical or comparable instruments, when available. Where position-specific external prices are not observable, the Company estimates fair value based on benchmarking to prices and rates observed in the primary market for similar loan or borrower types or based on the present value of expected future cash flows using its best estimates of the key assumptions, including forecasted credit losses, prepayment rates, forward yield curves and discount rates commensurate with the risks involved or a methodology that utilizes the capital structure and credit spreads of recent comparable securitization transactions. Mortgage loans valued based on observable market data for identical or comparable instruments are categorized in Level 2 of the fair value hierarchy. Where observable prices are not available, due to the subjectivity involved in the comparability assessment related to mortgage loan vintage, geographical concentration, prepayment speed and projected loss assumptions, mortgage loans are categorized in Level�3 of the fair value hierarchy. Mortgage loans are presented within Loans and lending commitments in the fair value hierarchy table. |
| � | Auction Rate Securities (�ARS�) .����The Company primarily holds investments in�Student Loan Auction Rate Securities (�SLARS�)�and Municipal Auction Rate Securities (�MARS�), which are floating rate instruments for which the rates reset through periodic auctions. SLARS are�ABS backed by pools of student loans. MARS are municipal bonds often wrapped by municipal bond insurance. The fair value of ARS is primarily determined using recently executed transactions and market price quotations, obtained from independent external parties such as vendors and brokers, where available. The Company uses an |
| 159 | |
| internally developed methodology to discount for the lack of liquidity and non-performance risk where independent external market data are not available. |
| � | Exchange-Traded Equity Securities .����Exchange-traded equity securities are generally valued based on quoted prices from the exchange. To the extent these securities are actively traded, valuation adjustments are not applied, and they are categorized in Level 1 of the fair value hierarchy; otherwise, they are categorized in Level 2 or Level 3 of the fair value hierarchy. |
| � | Unlisted Equity Securities .����Unlisted equity securities are valued based on an assessment of each underlying security, considering rounds of financing and third-party transactions, discounted cash flow analyses and market-based information, including comparable company transactions, trading multiples and changes in market outlook, among other factors. These securities are generally categorized in Level 3 of the fair value hierarchy. |
| � | Fund Units .����Listed fund units are generally marked to the exchange-traded price or net asset value (�NAV�) and are categorized in Level 1 of the fair value hierarchy if actively traded on an exchange or in Level 2 of the fair value hierarchy if trading is not active. Unlisted fund units are generally marked to NAV and categorized as Level 2; however, positions that are not redeemable at the measurement date or in the near future are categorized in Level 3 of the fair value hierarchy. |
| � | Listed Derivative Contracts .����Listed derivatives that are actively traded are valued based on quoted prices from the exchange and are categorized in Level 1 of the fair value hierarchy. Listed derivatives that are not actively traded are valued using the same approaches as those applied to OTC derivatives; they are generally categorized in Level 2 of the fair value hierarchy. |
| � | OTC Derivative Contracts .����OTC derivative contracts include forward, swap and option contracts related to interest rates, foreign currencies, credit standing of reference entities, equity prices or commodity prices. |
| | 160 |
| � | The Company�s investments include direct investments in equity securities as well as investments in private equity funds, real estate funds and hedge funds, which include investments made in connection with certain employee deferred compensation plans. Direct investments are presented in the fair value hierarchy table as Principal investments and Other. Initially, the transaction price is generally considered by the Company as the exit price and is the Company�s best estimate of fair value. |
| 161 | |
| � | The Company trades various physical commodities, including crude oil and refined products, natural gas, base and precious metals, and agricultural products. Fair value for physical commodities is determined using observable inputs, including broker quotations and published indices. Physical commodities are categorized in Level 2 of the fair value hierarchy; in instances where significant inputs are unobservable, they are categorized in Level 3 of the fair value hierarchy. |
| � | Securities available for sale are composed of�U.S. government and agency securities ( e.g ., U.S. Treasury securities, agency-issued debt, agency mortgage pass-through securities and collateralized mortgage obligations), CMBS, Federal Family Education Loan Program (�FFELP�) student loan asset-backed securities, auto loan asset-backed securities, corporate bonds, collateralized loan obligations, and equity securities. Actively traded U.S. Treasury securities, non-callable agency-issued debt securities and equity securities are generally categorized in Level 1 of the fair value hierarchy. Callable agency-issued debt securities, agency mortgage pass-through securities, collateralized mortgage obligations, CMBS, FFELP student loan asset-backed securities, auto loan asset-backed securities, corporate bonds and collateralized loan obligations are generally categorized in Level 2 of the fair value hierarchy. For further information on securities available for sale, see Note 5. |
| � | Time Deposits .����The fair value of certificates of deposit is determined using third-party quotations. These deposits are generally categorized in Level 2 of the fair value hierarchy. |
| � | Structured Notes .����The Company issues structured notes that have coupon or repayment terms linked to the performance of debt or equity securities, indices, currencies or commodities. Fair value of structured notes is determined using valuation models for the derivative and debt portions of the notes. These models incorporate observable inputs referencing identical or comparable securities, including prices to which the notes are linked, interest rate yield curves, option volatility and currency, and commodity or equity prices. Independent, external and traded prices for the notes are considered as well. The impact of the Company�s own credit spreads is also included based on the Company�s observed secondary bond market spreads. Most structured notes are categorized in Level 2 of the fair value hierarchy. |
| � | The fair value of a reverse repurchase agreement or repurchase agreement is computed using a�standard cash flow discounting methodology. The inputs to the valuation include�contractual cash flows and collateral funding spreads,�which are estimated using�various benchmarks,�interest rate yield curves and�option volatilities. In instances where the unobservable inputs are deemed significant, reverse repurchase agreements and repurchase agreements are categorized in Level 3 of the fair value hierarchy; otherwise, they are categorized in Level�2 of the fair value hierarchy. |
| | 162 |
| Quoted�Prices�in Active�Markets�for Identical Assets (Level 1) | Significant Observable Inputs (Level 2) | Significant Unobservable Inputs (Level 3) | Counterparty and Cash Collateral Netting | Balance�at December�31, 2013 | ||||||||||||||||
| (dollars in millions) | ||||||||||||||||||||
| Assets at Fair Value | ||||||||||||||||||||
| Trading assets: | ||||||||||||||||||||
| U.S. government and agency securities: | ||||||||||||||||||||
| U.S. Treasury securities | $ | 32,083 | $ | � | $ | � | $ | � | $ | 32,083 | ||||||||||
| U.S. agency securities | 1,216 | 17,720 | � | � | 18,936 | |||||||||||||||
| Total U.S. government and agency securities | 33,299 | 17,720 | � | � | 51,019 | |||||||||||||||
| Other sovereign government obligations | 25,363 | 6,610 | 27 | � | 32,000 | |||||||||||||||
| Corporate and other debt: | ||||||||||||||||||||
| State and municipal securities | � | 1,615 | � | � | 1,615 | |||||||||||||||
| Residential mortgage-backed securities | � | 2,029 | 47 | � | 2,076 | |||||||||||||||
| Commercial mortgage-backed securities | � | 1,534 | 108 | � | 1,642 | |||||||||||||||
| Asset-backed securities | � | 878 | 103 | � | 981 | |||||||||||||||
| Corporate bonds | � | 16,592 | 522 | � | 17,114 | |||||||||||||||
| Collateralized debt and loan obligations | � | 802 | 1,468 | � | 2,270 | |||||||||||||||
| Loans and lending commitments | � | 7,483 | 5,129 | � | 12,612 | |||||||||||||||
| Other debt | � | 6,365 | 27 | � | 6,392 | |||||||||||||||
| Total corporate and other debt | � | 37,298 | 7,404 | � | 44,702 | |||||||||||||||
| Corporate equities(1) | 107,818 | 1,206 | 190 | � | 109,214 | |||||||||||||||
| Derivative and other contracts: | ||||||||||||||||||||
| Interest rate contracts | 750 | 526,127 | 2,475 | � | 529,352 | |||||||||||||||
| Credit contracts | � | 42,258 | 2,088 | � | 44,346 | |||||||||||||||
| Foreign exchange contracts | 52 | 61,570 | 179 | � | 61,801 | |||||||||||||||
| Equity contracts | 1,215 | 51,656 | 1,234 | � | 54,105 | |||||||||||||||
| Commodity contracts | 2,396 | 8,595 | 2,380 | � | 13,371 | |||||||||||||||
| Other | � | 43 | � | � | 43 | |||||||||||||||
| Netting(2) | (3,836 | ) | (606,878 | ) | (4,931 | ) | (54,906 | ) | (670,551 | ) | ||||||||||
| Total derivative and other contracts | 577 | 83,371 | 3,425 | (54,906 | ) | 32,467 | ||||||||||||||
| Investments: | ||||||||||||||||||||
| Private equity funds | � | � | 2,531 | � | 2,531 | |||||||||||||||
| Real estate funds | � | 6 | 1,637 | � | 1,643 | |||||||||||||||
| Hedge funds | � | 377 | 432 | � | 809 | |||||||||||||||
| Principal investments | 43 | 42 | 2,160 | � | 2,245 | |||||||||||||||
| Other | 202 | 45 | 538 | � | 785 | |||||||||||||||
| Total investments | 245 | 470 | 7,298 | � | 8,013 | |||||||||||||||
| Physical commodities | � | 3,329 | � | � | 3,329 | |||||||||||||||
| Total trading assets | 167,302 | 150,004 | 18,344 | (54,906 | ) | 280,744 | ||||||||||||||
| Securities available for sale | 24,412 | 29,018 | � | � | 53,430 | |||||||||||||||
| Securities received as collateral | 20,497 | 11 | � | � | 20,508 | |||||||||||||||
| Federal funds sold and securities purchased under agreements to resell | � | 866 | � | � | 866 | |||||||||||||||
| Intangible assets(3) | � | � | 8 | � | 8 | |||||||||||||||
| Total assets measured at fair value | $ | 212,211 | $ | 179,899 | $ | 18,352 | $ | (54,906 | ) | $ | 355,556 | |||||||||
| 163 | |
| Quoted�Prices�in Active�Markets�for Identical Assets (Level 1) | Significant Observable Inputs (Level 2) | Significant Unobservable Inputs (Level 3) | Counterparty and Cash Collateral Netting | Balance�at December�31, 2013 | ||||||||||||||||
| (dollars in millions) | ||||||||||||||||||||
| Liabilities at Fair Value | ||||||||||||||||||||
| Deposits | $ | � | $ | 185 | $ | � | $ | � | $ | 185 | ||||||||||
| Commercial�paper and other short-term borrowings | � | 1,346 | 1 | � | 1,347 | |||||||||||||||
| Trading liabilities: | ||||||||||||||||||||
| U.S. government and agency securities: | ||||||||||||||||||||
| U.S. Treasury securities | 15,963 | � | � | � | 15,963 | |||||||||||||||
| U.S. agency securities | 2,593 | 116 | � | � | 2,709 | |||||||||||||||
| Total U.S. government and agency securities | 18,556 | 116 | � | � | 18,672 | |||||||||||||||
| Other sovereign government obligations | 14,717 | 2,473 | � | � | 17,190 | |||||||||||||||
| Corporate and other debt: | ||||||||||||||||||||
| State and municipal securities | � | 15 | � | � | 15 | |||||||||||||||
| Corporate bonds | � | 5,033 | 22 | � | 5,055 | |||||||||||||||
| Collateralized debt and loan obligations | � | 3 | � | � | 3 | |||||||||||||||
| Unfunded lending commitments | � | 127 | 2 | � | 129 | |||||||||||||||
| Other debt | � | 1,144 | 48 | � | 1,192 | |||||||||||||||
| Total corporate and other debt | � | 6,322 | 72 | � | 6,394 | |||||||||||||||
| Corporate equities(1) | 27,983 | 513 | 8 | � | 28,504 | |||||||||||||||
| Derivative and other contracts: | ||||||||||||||||||||
| Interest rate contracts | 675 | 504,292 | 2,362 | � | 507,329 | |||||||||||||||
| Credit contracts | � | 40,391 | 2,235 | � | 42,626 | |||||||||||||||
| Foreign exchange contracts | 23 | 61,925 | 111 | � | 62,059 | |||||||||||||||
| Equity contracts | 1,033 | 57,797 | 2,065 | � | 60,895 | |||||||||||||||
| Commodity contracts | 2,637 | 8,749 | 1,500 | � | 12,886 | |||||||||||||||
| Other | � | 72 | 4 | � | 76 | |||||||||||||||
| Netting(2) | (3,836 | ) | (606,878 | ) | (4,931 | ) | (36,465 | ) | (652,110 | ) | ||||||||||
| Total derivative and other contracts | 532 | 66,348 | 3,346 | (36,465 | ) | 33,761 | ||||||||||||||
| Total trading liabilities | 61,788 | 75,772 | 3,426 | (36,465 | ) | 104,521 | ||||||||||||||
| Obligation to return securities received as collateral | 24,549 | 19 | � | � | 24,568 | |||||||||||||||
| Securities sold under agreements to repurchase | � | 407 | 154 | � | 561 | |||||||||||||||
| Other secured financings | � | 4,928 | 278 | � | 5,206 | |||||||||||||||
| Long-term borrowings | � | 33,750 | 1,887 | � | 35,637 | |||||||||||||||
| Total liabilities measured at fair value | $ | 86,337 | $ | 116,407 | $ | 5,746 | $ | (36,465 | ) | $ | 172,025 | |||||||||
| (1) | The Company holds or sells short for trading purposes equity securities issued by entities in diverse industries and of varying size. |
| (2) | For positions with the same counterparty that cross over the levels of the fair value hierarchy, both counterparty netting and cash collateral netting are included in the column titled �Counterparty and Cash Collateral Netting.� For contracts with the same counterparty, counterparty netting among positions classified within the same level is included within that level. For further information on derivative instruments and hedging activities, see Note 12. |
| (3) | Amount represents mortgage servicing rights (�MSR�) accounted for at fair value. See Note 7 for further information on MSRs. |
| | 164 |
| Quoted�Prices�in Active�Markets�for Identical Assets (Level 1) | Significant Observable Inputs (Level 2) | Significant Unobservable Inputs (Level 3) | Counterparty and Cash Collateral Netting | Balance�at December�31, 2012 | ||||||||||||||||
| (dollars in millions) | ||||||||||||||||||||
| Assets at Fair Value | ||||||||||||||||||||
| Trading assets: | ||||||||||||||||||||
| U.S. government and agency securities: | ||||||||||||||||||||
| U.S. Treasury securities | $ | 24,662 | $ | 14 | $ | � | $ | � | $ | 24,676 | ||||||||||
| U.S. agency securities | 1,451 | 27,888 | � | � | 29,339 | |||||||||||||||
| Total U.S. government and agency securities | 26,113 | 27,902 | � | � | 54,015 | |||||||||||||||
| Other sovereign government obligations | 37,669 | 5,487 | 6 | � | 43,162 | |||||||||||||||
| Corporate and other debt: | ||||||||||||||||||||
| State and municipal securities | � | 1,558 | � | � | 1,558 | |||||||||||||||
| Residential mortgage-backed securities | � | 1,439 | 45 | � | 1,484 | |||||||||||||||
| Commercial mortgage-backed securities | � | 1,347 | 232 | � | 1,579 | |||||||||||||||
| Asset-backed securities | � | 915 | 109 | � | 1,024 | |||||||||||||||
| Corporate bonds | � | 18,403 | 660 | � | 19,063 | |||||||||||||||
| Collateralized debt and loan obligations | � | 685 | 1,951 | � | 2,636 | |||||||||||||||
| Loans and lending commitments | � | 12,617 | 4,694 | � | 17,311 | |||||||||||||||
| Other debt | � | 4,457 | 45 | � | 4,502 | |||||||||||||||
| Total corporate and other debt | � | 41,421 | 7,736 | � | 49,157 | |||||||||||||||
| Corporate equities(1) | 68,072 | 1,067 | 288 | � | 69,427 | |||||||||||||||
| Derivative and other contracts: | ||||||||||||||||||||
| Interest rate contracts | 446 | 819,581 | 3,774 | � | 823,801 | |||||||||||||||
| Credit contracts | � | 63,234 | 5,033 | � | 68,267 | |||||||||||||||
| Foreign exchange contracts | 34 | 52,729 | 31 | � | 52,794 | |||||||||||||||
| Equity contracts | 760 | 37,074 | 766 | � | 38,600 | |||||||||||||||
| Commodity contracts | 4,082 | 14,256 | 2,308 | � | 20,646 | |||||||||||||||
| Other | � | 143 | � | � | 143 | |||||||||||||||
| Netting(2) | (4,740 | ) | (883,733 | ) | (6,947 | ) | (72,634 | ) | (968,054 | ) | ||||||||||
| Total derivative and other contracts | 582 | 103,284 | 4,965 | (72,634 | ) | 36,197 | ||||||||||||||
| Investments: | ||||||||||||||||||||
| Private equity funds | � | � | 2,179 | � | 2,179 | |||||||||||||||
| Real estate funds | � | 6 | 1,370 | � | 1,376 | |||||||||||||||
| Hedge funds | � | 382 | 552 | � | 934 | |||||||||||||||
| Principal investments | 185 | 83 | 2,833 | � | 3,101 | |||||||||||||||
| Other | 199 | 71 | 486 | � | 756 | |||||||||||||||
| Total investments | 384 | 542 | 7,420 | � | 8,346 | |||||||||||||||
| Physical commodities | � | 7,299 | � | � | 7,299 | |||||||||||||||
| Total trading assets | 132,820 | 187,002 | 20,415 | (72,634 | ) | 267,603 | ||||||||||||||
| Securities available for sale | 14,466 | 25,403 | � | � | 39,869 | |||||||||||||||
| Securities received as collateral | 14,232 | 46 | � | � | 14,278 | |||||||||||||||
| Federal funds sold and securities purchased under agreements to resell | � | 621 | � | � | 621 | |||||||||||||||
| Intangible assets(3) | � | � | 7 | � | 7 | |||||||||||||||
| Total assets measured at fair value | $ | 161,518 | $ | 213,072 | $ | 20,422 | $ | (72,634 | ) | $ | 322,378 | |||||||||
| 165 | |
| Quoted�Prices�in Active�Markets�for Identical Assets (Level 1) | Significant Observable Inputs (Level 2) | Significant Unobservable Inputs (Level 3) | Counterparty and Cash Collateral Netting | Balance�at December�31, 2012 | ||||||||||||||||
| (dollars in millions) | ||||||||||||||||||||
| Liabilities at Fair Value | ||||||||||||||||||||
| Deposits | $ | � | $ | 1,485 | $ | � | $ | � | $ | 1,485 | ||||||||||
| Commercial�paper and other short-term borrowings | � | 706 | 19 | � | 725 | |||||||||||||||
| Trading liabilities: | ||||||||||||||||||||
| U.S. government and agency securities: | ||||||||||||||||||||
| U.S. Treasury securities | 20,098 | 21 | � | � | 20,119 | |||||||||||||||
| U.S. agency securities | 1,394 | 107 | � | � | 1,501 | |||||||||||||||
| Total U.S. government and agency securities | 21,492 | 128 | � | � | 21,620 | |||||||||||||||
| Other sovereign government obligations | 27,583 | 2,031 | � | � | 29,614 | |||||||||||||||
| Corporate and other debt: | ||||||||||||||||||||
| State and municipal securities | � | 47 | � | � | 47 | |||||||||||||||
| Residential mortgage-backed securities | � | � | 4 | � | 4 | |||||||||||||||
| Corporate bonds | � | 3,942 | 177 | � | 4,119 | |||||||||||||||
| Collateralized debt and loan obligations | � | 328 | � | � | 328 | |||||||||||||||
| Unfunded lending commitments | � | 305 | 46 | � | 351 | |||||||||||||||
| Other debt | � | 156 | 49 | � | 205 | |||||||||||||||
| Total corporate and other debt | � | 4,778 | 276 | � | 5,054 | |||||||||||||||
| Corporate equities(1) | 25,216 | 1,655 | 5 | � | 26,876 | |||||||||||||||
| Derivative and other contracts: | ||||||||||||||||||||
| Interest rate contracts | 533 | 789,715 | 3,856 | � | 794,104 | |||||||||||||||
| Credit contracts | � | 61,283 | 3,211 | � | 64,494 | |||||||||||||||
| Foreign exchange contracts | 2 | 56,021 | 390 | � | 56,413 | |||||||||||||||
| Equity contracts | 748 | 39,212 | 1,910 | � | 41,870 | |||||||||||||||
| Commodity contracts | 4,530 | 15,702 | 1,599 | � | 21,831 | |||||||||||||||
| Other | � | 54 | 7 | � | 61 | |||||||||||||||
| Netting(2) | (4,740 | ) | (883,733 | ) | (6,947 | ) | (46,395 | ) | (941,815 | ) | ||||||||||
| Total derivative and other contracts | 1,073 | 78,254 | 4,026 | (46,395 | ) | 36,958 | ||||||||||||||
| Total trading liabilities | 75,364 | 86,846 | 4,307 | (46,395 | ) | 120,122 | ||||||||||||||
| Obligation to return securities received as collateral | 18,179 | 47 | � | � | 18,226 | |||||||||||||||
| Securities sold under agreements to repurchase | � | 212 | 151 | � | 363 | |||||||||||||||
| Other secured financings | � | 9,060 | 406 | � | 9,466 | |||||||||||||||
| Long-term borrowings | � | 41,255 | 2,789 | � | 44,044 | |||||||||||||||
| Total liabilities measured at fair value | $ | 93,543 | $ | 139,611 | $ | 7,672 | $ | (46,395 | ) | $ | 194,431 | |||||||||
| (1) | The Company holds or sells short for trading purposes equity securities issued by entities in diverse industries and of varying size. |
| (2) | For positions with the same counterparty that cross over the levels of the fair value hierarchy, both counterparty netting and cash collateral netting are included in the column titled �Counterparty and Cash Collateral Netting.� For contracts with the same counterparty, counterparty netting among positions classified within the same level is included within that level. For further information on derivative instruments and hedging activities, see Note 12. |
| (3) | Amount represents MSRs accounted for at fair value. See Note 7 for further information on MSRs. |
| | 166 |
| 167 | |
| Beginning Balance at December�31, 2012 | Total Realized and�Unrealized Gains�(Losses)(1) | Purchases | Sales | Issuances | Settlements | Net�Transfers | Ending Balance�at December�31, 2013 | Unrealized Gains�(Losses) for Level 3 Assets/ Liabilities Outstanding�at December�31, 2013(2) | ||||||||||||||||||||||||||||
| (dollars in millions) | ||||||||||||||||||||||||||||||||||||
| Assets at Fair Value | ||||||||||||||||||||||||||||||||||||
| Trading assets: | ||||||||||||||||||||||||||||||||||||
| Other sovereign government obligations | $ | 6 | $ | (18 | ) | $ | 41 | $ | (7 | ) | $ | � | $ | � | $ | 5 | $ | 27 | $ | (18 | ) | |||||||||||||||
| Corporate and other debt: | ||||||||||||||||||||||||||||||||||||
| Residential mortgage-backed securities | 45 | 25 | 54 | (51 | ) | � | � | (26 | ) | 47 | (6 | ) | ||||||||||||||||||||||||
| Commercial mortgage-backed securities | 232 | 13 | 57 | (187 | ) | � | (7 | ) | � | 108 | 4 | |||||||||||||||||||||||||
| Asset-backed securities | 109 | � | 6 | (12 | ) | � | � | � | 103 | � | ||||||||||||||||||||||||||
| Corporate bonds | 660 | (20 | ) | 324 | (371 | ) | � | (19 | ) | (52 | ) | 522 | (55 | ) | ||||||||||||||||||||||
| Collateralized debt and loan obligations | 1,951 | 363 | 742 | (960 | ) | � | (626 | ) | (2 | ) | 1,468 | 131 | ||||||||||||||||||||||||
| Loans and lending commitments | 4,694 | (130 | ) | 3,744 | (448 | ) | � | (3,096 | ) | 365 | 5,129 | (199 | ) | |||||||||||||||||||||||
| Other debt | 45 | (1 | ) | 20 | (36 | ) | � | � | (1 | ) | 27 | (2 | ) | |||||||||||||||||||||||
| Total corporate and other debt | 7,736 | 250 | 4,947 | (2,065 | ) | � | (3,748 | ) | 284 | 7,404 | (127 | ) | ||||||||||||||||||||||||
| Corporate equities | 288 | (63 | ) | 113 | (127 | ) | � | � | (21 | ) | 190 | (72 | ) | |||||||||||||||||||||||
| Net derivative and other contracts(3): | ||||||||||||||||||||||||||||||||||||
| Interest rate contracts | (82 | ) | 28 | 6 | � | (34 | ) | 135 | 60 | 113 | 36 | |||||||||||||||||||||||||
| Credit contracts | 1,822 | (1,674 | ) | 266 | � | (703 | ) | (295 | ) | 437 | (147 | ) | (1,723 | ) | ||||||||||||||||||||||
| Foreign exchange contracts | (359 | ) | 130 | � | � | � | 281 | 16 | 68 | 124 | ||||||||||||||||||||||||||
| Equity contracts | (1,144 | ) | 463 | 170 | (74 | ) | (318 | ) | (11 | ) | 83 | (831 | ) | 61 | ||||||||||||||||||||||
| Commodity contracts | 709 | 200 | 41 | � | (36 | ) | (29 | ) | (5 | ) | 880 | 174 | ||||||||||||||||||||||||
| Other | (7 | ) | (6 | ) | � | � | � | 9 | � | (4 | ) | (7 | ) | |||||||||||||||||||||||
| Total net derivative and other contracts | 939 | (859 | ) | 483 | (74 | ) | (1,091 | ) | 90 | 591 | 79 | (1,335 | ) | |||||||||||||||||||||||
| Investments: | ||||||||||||||||||||||||||||||||||||
| Private equity funds | 2,179 | 704 | 212 | (564 | ) | � | � | � | 2,531 | 657 | ||||||||||||||||||||||||||
| Real estate funds | 1,370 | 413 | 103 | (249 | ) | � | � | � | 1,637 | 625 | ||||||||||||||||||||||||||
| Hedge funds | 552 | 10 | 62 | (163 | ) | � | � | (29 | ) | 432 | 10 | |||||||||||||||||||||||||
| Principal investments | 2,833 | 110 | 111 | (445 | ) | � | � | (449 | ) | 2,160 | 3 | |||||||||||||||||||||||||
| Other | 486 | 76 | 13 | (36 | ) | � | � | (1 | ) | 538 | 77 | |||||||||||||||||||||||||
| Total investments | 7,420 | 1,313 | 501 | (1,457 | ) | � | � | (479 | ) | 7,298 | 1,372 | |||||||||||||||||||||||||
| Intangible assets | 7 | 9 | � | � | � | (8 | ) | � | 8 | 3 | ||||||||||||||||||||||||||
| Liabilities at Fair Value | ||||||||||||||||||||||||||||||||||||
| Commercial paper and other short-term borrowings | $ | 19 | $ | � | $ | � | $ | � | $ | � | $ | (1 | ) | $ | (17 | ) | $ | 1 | $ | � | ||||||||||||||||
| Trading liabilities: | ||||||||||||||||||||||||||||||||||||
| Corporate and other debt: | ||||||||||||||||||||||||||||||||||||
| Residential mortgage-backed securities | 4 | 4 | � | � | � | � | � | � | 4 | |||||||||||||||||||||||||||
| Corporate bonds | 177 | 28 | (64 | ) | 43 | � | � | (106 | ) | 22 | 28 | |||||||||||||||||||||||||
| Unfunded lending commitments | 46 | 44 | � | � | � | � | � | 2 | 44 | |||||||||||||||||||||||||||
| Other debt | 49 | 2 | � | 5 | � | (6 | ) | 2 | 48 | 2 | ||||||||||||||||||||||||||
| Total corporate and other debt | 276 | 78 | (64 | ) | 48 | � | (6 | ) | (104 | ) | 72 | 78 | ||||||||||||||||||||||||
| Corporate equities | 5 | 1 | (26 | ) | 29 | � | � | 1 | 8 | 3 | ||||||||||||||||||||||||||
| Securities sold under agreements to repurchase | 151 | (3 | ) | � | � | � | � | � | 154 | (3 | ) | |||||||||||||||||||||||||
| Other secured financings | 406 | 11 | � | � | 19 | (136 | ) | � | 278 | 4 | ||||||||||||||||||||||||||
| Long-term borrowings | 2,789 | (162 | ) | � | � | 877 | (606 | ) | (1,335 | ) | 1,887 | (138 | ) | |||||||||||||||||||||||
| (1) | Total realized and unrealized gains (losses) are primarily included in Trading revenues in the consolidated statements of income except for $1,313 million related to Trading assets�Investments, which is included in Investments revenues. |
| (2) | Amounts represent unrealized gains (losses) for 2013 related to assets and liabilities still outstanding at December�31, 2013. |
| (3) | Net derivative and other contracts represent Trading assets�Derivative and other contracts net of Trading liabilities�Derivative and other contracts. For further information on derivative instruments and hedging activities, see Note 12. |
| | 168 |
| Beginning Balance at December�31, 2011 | Total�
Realized and Unrealized Gains (Losses)(1) | Purchases | Sales | Issuances | Settlements | Net�Transfers | Ending Balance�at December�31, 2012 | Unrealized Gains (Losses) for Level 3 Assets/Liabilities Outstanding�at December�31, 2012(2) | ||||||||||||||||||||||||||||
| (dollars in millions) | ||||||||||||||||||||||||||||||||||||
| Assets at Fair Value | ||||||||||||||||||||||||||||||||||||
| Trading assets: | ||||||||||||||||||||||||||||||||||||
| U.S. agency securities | $ | 8 | $ | � | $ | � | $ | (7 | ) | $ | � | $ | � | $ | (1 | ) | $ | � | $ | � | ||||||||||||||||
| Other sovereign government obligations | 119 | � | 12 | (125 | ) | � | � | � | 6 | (9 | ) | |||||||||||||||||||||||||
| Corporate and other debt: | ||||||||||||||||||||||||||||||||||||
| Residential mortgage-backed securities | 494 | (9 | ) | 32 | (285 | ) | � | � | (187 | ) | 45 | (26 | ) | |||||||||||||||||||||||
| Commercial mortgage-backed securities | 134 | 32 | 218 | (49 | ) | � | (100 | ) | (3 | ) | 232 | 28 | ||||||||||||||||||||||||
| Asset-backed securities | 31 | 1 | 109 | (32 | ) | � | � | � | 109 | (1 | ) | |||||||||||||||||||||||||
| Corporate bonds | 675 | 22 | 447 | (450 | ) | � | � | (34 | ) | 660 | (7 | ) | ||||||||||||||||||||||||
| Collateralized debt and loan obligations | 980 | 216 | 1,178 | (384 | ) | � | � | (39 | ) | 1,951 | 142 | |||||||||||||||||||||||||
| Loans and lending commitments | 9,590 | 37 | 2,648 | (2,095 | ) | � | (4,316 | ) | (1,170 | ) | 4,694 | (91 | ) | |||||||||||||||||||||||
| Other debt | 128 | 2 | � | (95 | ) | � | � | 10 | 45 | (6 | ) | |||||||||||||||||||||||||
| Total corporate and other debt | 12,032 | 301 | 4,632 | (3,390 | ) | � | (4,416 | ) | (1,423 | ) | 7,736 | 39 | ||||||||||||||||||||||||
| Corporate equities | 417 | (59 | ) | 134 | (172 | ) | � | � | (32 | ) | 288 | (83 | ) | |||||||||||||||||||||||
| Net derivative and other contracts(3): | ||||||||||||||||||||||||||||||||||||
| Interest rate contracts | 420 | (275 | ) | 28 | � | (7 | ) | (217 | ) | (31 | ) | (82 | ) | 297 | ||||||||||||||||||||||
| Credit contracts | 5,814 | (2,799 | ) | 112 | � | (502 | ) | (961 | ) | 158 | 1,822 | (3,216 | ) | |||||||||||||||||||||||
| Foreign exchange contracts | 43 | (279 | ) | � | � | � | 19 | (142 | ) | (359 | ) | (225 | ) | |||||||||||||||||||||||
| Equity contracts | (1,234 | ) | 390 | 202 | (9 | ) | (112 | ) | (210 | ) | (171 | ) | (1,144 | ) | 241 | |||||||||||||||||||||
| Commodity contracts | 570 | 114 | 16 | � | (41 | ) | (20 | ) | 70 | 709 | 222 | |||||||||||||||||||||||||
| Other | (1,090 | ) | 57 | � | � | � | 236 | 790 | (7 | ) | 53 | |||||||||||||||||||||||||
| Total net derivative and other contracts | 4,523 | (2,792 | ) | 358 | (9 | ) | (662 | ) | (1,153 | ) | 674 | 939 | (2,628 | ) | ||||||||||||||||||||||
| Investments: | ||||||||||||||||||||||||||||||||||||
| Private equity funds | 1,936 | 228 | 308 | (294 | ) | � | � | 1 | 2,179 | 147 | ||||||||||||||||||||||||||
| Real estate funds | 1,213 | 149 | 143 | (136 | ) | � | � | 1 | 1,370 | 229 | ||||||||||||||||||||||||||
| Hedge funds | 696 | 61 | 81 | (151 | ) | � | � | (135 | ) | 552 | 51 | |||||||||||||||||||||||||
| Principal investments | 2,937 | 130 | 160 | (419 | ) | � | � | 25 | 2,833 | 93 | ||||||||||||||||||||||||||
| Other | 501 | (45 | ) | 158 | (70 | ) | � | � | (58 | ) | 486 | (48 | ) | |||||||||||||||||||||||
| Total investments | 7,283 | 523 | 850 | (1,070 | ) | � | � | (166 | ) | 7,420 | 472 | |||||||||||||||||||||||||
| Physical commodities | 46 | � | � | � | � | (46 | ) | � | � | � | ||||||||||||||||||||||||||
| Intangible assets | 133 | (39 | ) | � | (83 | ) | � | (4 | ) | � | 7 | (7 | ) | |||||||||||||||||||||||
| Liabilities at Fair Value | ||||||||||||||||||||||||||||||||||||
| Commercial paper and other short-term borrowings | $ | 2 | $ | (5 | ) | $ | � | $ | � | $ | 3 | $ | (3 | ) | $ | 12 | $ | 19 | $ | (4 | ) | |||||||||||||||
| Trading liabilities: | ||||||||||||||||||||||||||||||||||||
| Other sovereign government obligations | 8 | � | (8 | ) | � | � | � | � | � | � | ||||||||||||||||||||||||||
| Corporate and other debt: | ||||||||||||||||||||||||||||||||||||
| Residential mortgage-backed securities | 355 | (4 | ) | (355 | ) | � | � | � | � | 4 | (4 | ) | ||||||||||||||||||||||||
| Corporate bonds | 219 | (15 | ) | (129 | ) | 110 | � | � | (38 | ) | 177 | (23 | ) | |||||||||||||||||||||||
| Unfunded lending commitments | 85 | 39 | � | � | � | � | � | 46 | 39 | |||||||||||||||||||||||||||
| Other debt | 73 | 9 | (1 | ) | 36 | � | (55 | ) | 5 | 49 | 11 | |||||||||||||||||||||||||
| Total corporate and other debt | 732 | 29 | (485 | ) | 146 | � | (55 | ) | (33 | ) | 276 | 23 | ||||||||||||||||||||||||
| Corporate equities | 1 | (1 | ) | (21 | ) | 22 | � | � | 2 | 5 | (3 | ) | ||||||||||||||||||||||||
| Securities sold under agreements to repurchase | 340 | (14 | ) | � | � | � | � | (203 | ) | 151 | (14 | ) | ||||||||||||||||||||||||
| Other secured financings | 570 | (69 | ) | � | � | 21 | (232 | ) | (22 | ) | 406 | (67 | ) | |||||||||||||||||||||||
| Long-term borrowings | 1,603 | (651 | ) | � | � | 1,050 | (279 | ) | (236 | ) | 2,789 | (652 | ) | |||||||||||||||||||||||
| 169 | |
| (1) | Total realized and unrealized gains (losses) are primarily included in Trading revenues in the consolidated statements of income except for $523 million related to Trading assets�Investments, which is included in Investments revenues. |
| (2) | Amounts represent unrealized gains (losses) for 2012 related to assets and liabilities still outstanding at December�31, 2012. |
| (3) | Net derivative and other contracts represent Trading assets�Derivative and other contracts, net of Trading liabilities�Derivative and other contracts. For further information on derivative instruments and hedging activities, see Note 12. |
| | 170 |
| Beginning Balance at December�31, 2010 | Total�Realized and�Unrealized Gains�(Losses)(1) | Purchases | Sales | Issuances | Settlements | Net Transfers | Ending Balance�at December�31, 2011 | Unrealized Gains (Losses) for Level 3 Assets/ Liabilities Outstanding�at December�31, 2011(2) | ||||||||||||||||||||||||||||
| (dollars in millions) | ||||||||||||||||||||||||||||||||||||
| Assets at Fair Value | ||||||||||||||||||||||||||||||||||||
| Trading assets: | ||||||||||||||||||||||||||||||||||||
| U.S. agency securities | $ | 13 | $ | � | $ | 66 | $ | (68 | ) | $ | � | $ | � | $ | (3 | ) | $ | 8 | $ | � | ||||||||||||||||
| Other sovereign government obligations | 73 | (4 | ) | 56 | (2 | ) | � | � | (4 | ) | 119 | (2 | ) | |||||||||||||||||||||||
| Corporate and other debt: | ||||||||||||||||||||||||||||||||||||
| State and municipal securities | 110 | (1 | ) | � | (96 | ) | � | � | (13 | ) | � | � | ||||||||||||||||||||||||
| Residential mortgage-backed securities | 319 | (61 | ) | 382 | (221 | ) | � | (1 | ) | 76 | 494 | (59 | ) | |||||||||||||||||||||||
| Commercial mortgage-backed securities | 188 | 12 | 75 | (90 | ) | � | � | (51 | ) | 134 | (18 | ) | ||||||||||||||||||||||||
| Asset-backed securities | 13 | 4 | 13 | (19 | ) | � | � | 20 | 31 | 2 | ||||||||||||||||||||||||||
| Corporate bonds | 1,368 | (136 | ) | 467 | (661 | ) | � | � | (363 | ) | 675 | (20 | ) | |||||||||||||||||||||||
| Collateralized debt and loan obligations | 1,659 | 109 | 613 | (1,296 | ) | � | (55 | ) | (50 | ) | 980 | (84 | ) | |||||||||||||||||||||||
| Loans and lending commitments | 11,666 | (251 | ) | 2,932 | (1,241 | ) | � | (2,900 | ) | (616 | ) | 9,590 | (431 | ) | ||||||||||||||||||||||
| Other debt | 193 | 42 | 14 | (76 | ) | � | (11 | ) | (34 | ) | 128 | � | ||||||||||||||||||||||||
| Total corporate and other debt | 15,516 | (282 | ) | 4,496 | (3,700 | ) | � | (2,967 | ) | (1,031 | ) | 12,032 | (610 | ) | ||||||||||||||||||||||
| Corporate equities | 484 | (46 | ) | 416 | (360 | ) | � | � | (77 | ) | 417 | 16 | ||||||||||||||||||||||||
| Net derivative and other contracts(3): | ||||||||||||||||||||||||||||||||||||
| Interest rate contracts | 424 | 628 | 45 | � | (714 | ) | (150 | ) | 187 | 420 | 522 | |||||||||||||||||||||||||
| Credit contracts | 6,594 | 319 | 1,199 | � | (277 | ) | (2,165 | ) | 144 | 5,814 | 1,818 | |||||||||||||||||||||||||
| Foreign exchange contracts | 46 | (35 | ) | 2 | � | � | 28 | 2 | 43 | (13 | ) | |||||||||||||||||||||||||
| Equity contracts | (762 | ) | 592 | 214 | (133 | ) | (1,329 | ) | 136 | 48 | (1,234 | ) | 564 | |||||||||||||||||||||||
| Commodity contracts | 188 | 708 | 52 | � | � | (433 | ) | 55 | 570 | 689 | ||||||||||||||||||||||||||
| Other | (913 | ) | (552 | ) | 1 | � | (118 | ) | 405 | 87 | (1,090 | ) | (536 | ) | ||||||||||||||||||||||
| Total net derivative and other contracts | 5,577 | 1,660 | 1,513 | (133 | ) | (2,438 | ) | (2,179 | ) | 523 | 4,523 | 3,044 | ||||||||||||||||||||||||
| Investments: | ||||||||||||||||||||||||||||||||||||
| Private equity funds | 1,986 | 159 | 245 | (513 | ) | � | � | 59 | 1,936 | 85 | ||||||||||||||||||||||||||
| Real estate funds | 1,176 | 21 | 196 | (171 | ) | � | � | (9 | ) | 1,213 | 251 | |||||||||||||||||||||||||
| Hedge funds | 901 | (20 | ) | 169 | (380 | ) | � | � | 26 | 696 | (31 | ) | ||||||||||||||||||||||||
| Principal investments | 3,131 | 288 | 368 | (819 | ) | � | � | (31 | ) | 2,937 | 87 | |||||||||||||||||||||||||
| Other | 560 | 38 | 8 | (34 | ) | � | � | (71 | ) | 501 | 23 | |||||||||||||||||||||||||
| Total investments | 7,754 | 486 | 986 | (1,917 | ) | � | � | (26 | ) | 7,283 | 415 | |||||||||||||||||||||||||
| Physical commodities | � | (47 | ) | 771 | � | � | (673 | ) | (5 | ) | 46 | 1 | ||||||||||||||||||||||||
| Securities received as collateral | 1 | � | � | (1 | ) | � | � | � | � | � | ||||||||||||||||||||||||||
| Intangible assets | 157 | (25 | ) | 6 | (1 | ) | � | (4 | ) | � | 133 | (27 | ) | |||||||||||||||||||||||
| Liabilities at Fair Value | ||||||||||||||||||||||||||||||||||||
| Deposits | $ | 16 | $ | 2 | $ | � | $ | � | $ | � | $ | (14 | ) | $ | � | $ | � | $ | � | |||||||||||||||||
| Commercial paper and other short-term borrowings | 2 | � | � | � | � | � | � | 2 | � | |||||||||||||||||||||||||||
| Trading liabilities: | ||||||||||||||||||||||||||||||||||||
| Other sovereign government obligations | � | 1 | � | 9 | � | � | � | 8 | � | |||||||||||||||||||||||||||
| Corporate and other debt: | ||||||||||||||||||||||||||||||||||||
| Residential mortgage-backed securities | � | (8 | ) | � | 347 | � | � | � | 355 | (8 | ) | |||||||||||||||||||||||||
| Corporate bonds | 44 | 37 | (407 | ) | 694 | � | � | (75 | ) | 219 | 51 | |||||||||||||||||||||||||
| Unfunded lending commitments | 263 | 178 | � | � | � | � | � | 85 | 178 | |||||||||||||||||||||||||||
| Other debt | 194 | 123 | (12 | ) | 22 | � | (2 | ) | (6 | ) | 73 | 12 | ||||||||||||||||||||||||
| Total corporate and other debt | 501 | 330 | (419 | ) | 1,063 | � | (2 | ) | (81 | ) | 732 | 233 | ||||||||||||||||||||||||
| Corporate equities | 15 | (1 | ) | (15 | ) | 5 | � | � | (5 | ) | 1 | � | ||||||||||||||||||||||||
| Obligation to return securities received as collateral | 1 | � | (1 | ) | � | � | � | � | � | � | ||||||||||||||||||||||||||
| Securities sold under agreements to repurchase | 351 | 11 | � | � | � | � | � | 340 | 11 | |||||||||||||||||||||||||||
| Other secured financings | 1,016 | 27 | � | � | 154 | (267 | ) | (306 | ) | 570 | 13 | |||||||||||||||||||||||||
| Long-term borrowings | 1,316 | 39 | � | � | 769 | (377 | ) | (66 | ) | 1,603 | 32 | |||||||||||||||||||||||||
| (1) | Total realized and unrealized gains (losses) are primarily included in Trading revenues in the consolidated statements of income except for $486 million related to Trading assets�Investments, which is included in Investments revenues. |
| 171 | |
| (2) | Amounts represent unrealized gains (losses) for 2011 related to assets and liabilities still outstanding at December�31, 2011. |
| (3) | Net derivative and other contracts represent Trading assets�Derivative and other contracts, net of Trading liabilities�Derivative and other contracts. For further information on derivative instruments and hedging activities, see Note 12. |
| | 172 |
| Balance�at December� 31, 2013 (dollars� in millions) | Valuation Technique(s) | Significant�Unobservable�Input(s)�/ Sensitivity�of�the�Fair�Value�to�Changes in the Unobservable Inputs | Range(1) | Averages(2) | ||||||||||||||||||
| Assets | ||||||||||||||||||||||
| Trading assets: | ||||||||||||||||||||||
| Corporate and other debt: | ||||||||||||||||||||||
| Commercial mortgage-backed securities | $ | 108 | Comparable�pricing | Comparable�bond�price�/ (A) | 40�to�93 | points | 78 | points | ||||||||||||||
| Asset-backed securities | 103 | Discounted�cash�flow | Discount rate / (C) | 18 | % | 18 | % | |||||||||||||||
| Corporate bonds | 522 | Comparable pricing | Comparable�bond�price�/ (A) | 1�to�159 | points | 85 | points | |||||||||||||||
| Collateralized debt and loan obligations | 1,468 | Comparable�pricing(6) | Comparable�bond�price�/ (A) | 18�to�99 | points | 73 | points | |||||||||||||||
| Correlation model | Credit correlation / (B) | 29 to 59 | % | 43 | % | |||||||||||||||||
| Loans and lending commitments | 5,129 | Corporate�loan�model | Credit spread / (C) | 28�to�487 | basis�points | 249 | basis�points | |||||||||||||||
| Margin loan model | Credit spread / (C)(D) | 10 to 265 | basis points | 135 | basis points | |||||||||||||||||
| Volatility skew / (C)(D) | 3 to 40 | % | 14 | % | ||||||||||||||||||
| Comparable�bond�price�/ (A)(D) | 80�to�120 | points | 100 | points | ||||||||||||||||||
| Option model | Volatility skew / (C) | -1 to 0 | % | 0 | % | |||||||||||||||||
| Comparable�pricing(6) | Comparable�loan�price�/ (A) | 10 to 100 | points | 76 | points | |||||||||||||||||
| Corporate equities(3) | 190 | Net asset value(6) | Discount�to�net�asset�value�/�(C) | 0 to 85 | % | 43 | % | |||||||||||||||
| Comparable pricing | Comparable�equity�price�/�(A) | 0 to 100 | % | 47 | % | |||||||||||||||||
| Comparable pricing | Comparable price / (A) | 0 to 100 | points | 50 | points | |||||||||||||||||
| Market approach | EBITDA multiple / (A)(D) | 5 to 9 | times | 6 | times | |||||||||||||||||
| Price/Book ratio / (A)(D) | 0 to 1 | times | 1 | times | ||||||||||||||||||
| Net derivative and other contracts: | ||||||||||||||||||||||
| Interest rate contracts | 113 | Option model | Interest�rate�volatility�concentration liquidity multiple / (C)(D) | 0 to 6 | times | 2 | times | |||||||||||||||
| Comparable bond price / (A)(D) | 5 to 100 | points | 58 | points�/�65�points�(4) | ||||||||||||||||||
| Interest rate�Foreign exchange correlation / (A)(D) | 3 to 63 | % | 43 | %�/ 48%(4) | ||||||||||||||||||
| Interest rate volatility skew / (A)(D) | 24 to 50 | % | 33 | %�/ 28%(4) | ||||||||||||||||||
| Interest rate quanto correlation / (A)(D) | -11 to 34 | % | 8 | %�/ 5%(4) | ||||||||||||||||||
| Interest rate curve correlation / (A)(D) | 46 to 92 | % | 74 | %�/ 80%(4) | ||||||||||||||||||
| Inflation volatility / (A)(D) | 77 to 86 | % | 81 | %�/ 80%(4) | ||||||||||||||||||
| Credit contracts | (147) | Comparable pricing | Cash synthetic basis / (C)(D) | 2 to 5 | points | 4 | points | |||||||||||||||
| Comparable bond price / (C)(D) | 0 to 75 | points | 27 | points | ||||||||||||||||||
| Correlation model(6) | Credit correlation / (B) | 19 to 96 | % | 56 | % | |||||||||||||||||
| Foreign exchange contracts(5) | 68 | Option model | Comparable bond price / (A)(D) | 5 to 100 | points | 58 | points�/�65�points�(4) | |||||||||||||||
| Interest�rate�quanto�correlation / (A)(D) | -11 to 34 | % | 8 | %�/ 5%(4) | ||||||||||||||||||
| Interest rate curve correlation / (A)(D) | 46�to�92 | % | 74 | %�/�80%(4) | ||||||||||||||||||
| Interest rate�Foreign exchange correlation / (A)(D) | 3 to 63 | % | 43 | %�/ 48%(4) | ||||||||||||||||||
| Interest rate volatility skew / (A)(D) | 24 to 50 | % | 33 | %�/ 28%(4) | ||||||||||||||||||
| Interest rate curve / (A)(D) | 0 to 1 | % | 1 | %�/ 0%(4) | ||||||||||||||||||
| Equity contracts(5) | (831) | Option model | At the money volatility / (A)(D) | 20 to 53 | % | 31 | % | |||||||||||||||
| Volatility skew / (A)(D) | -3 to 0 | % | -1 | % | ||||||||||||||||||
| Equity�Equity correlation / (C)(D) | 40 to 99 | % | 69 | % | ||||||||||||||||||
| Equity�Foreign exchange correlation / (C)(D) | -50 to 9 | % | -20 | % | ||||||||||||||||||
| Equity�Interest rate correlation / (C)(D) | -4 to 70 | % | 39 | % / 40%(4) | ||||||||||||||||||
| 173 | |
| Balance�at December� 31, 2013 (dollars� in millions) | Valuation Technique(s) | Significant�Unobservable�Input(s)�/ Sensitivity�of�the�Fair�Value�to�Changes in the Unobservable Inputs | Range(1) | Averages(2) | ||||||||||||||||||
| Commodity contracts | 880 | Option model | Forward power price / (C)(D) | $14�to�$91 | per | $ | 40 | per | ||||||||||||||
| Megawatt hour | Megawatt�hour | |||||||||||||||||||||
| Commodity volatility / (A)(D) | 11 to 30 | % | 14 | % | ||||||||||||||||||
| Cross commodity correlation / (C)(D) | 34 to 99 | % | 93 | % | ||||||||||||||||||
| Investments(3): | ||||||||||||||||||||||
| Principal investments | 2,160 | Discounted cash flow | Implied weighted average cost of capital / (C)(D) | 12 | % | 12 | % | |||||||||||||||
| Exit multiple / (A)(D) | 9 | times | 9 | times | ||||||||||||||||||
| Discounted cash flow(6) | Capitalization rate / (C)(D) | 5 to 13 | % | 7 | % | |||||||||||||||||
| Equity discount rate / (C)(D) | 10 to 30 | % | 21 | % | ||||||||||||||||||
| Market approach | EBITDA multiple / (A) | 5 to 6 | times | 5 | times | |||||||||||||||||
| Other | 538 | Discounted cash flow | Implied weighted average cost of capital / (C)(D) | 7 to 10 | % | 8 | % | |||||||||||||||
| Exit multiple / (A)(D) | 7 to 9 | times | 9 | times | ||||||||||||||||||
| Market approach(6) | EBITDA multiple / (A) | 8 to 14 | times | 10 | times | |||||||||||||||||
| Liabilities | ||||||||||||||||||||||
| Securities sold under agreements to repurchase | $ | 154 | Discounted cash flow | Funding spread / (A) | 92 to 97 | basis�points | 95 | basis�points | ||||||||||||||
| Other secured financings | 278 | Comparable�pricing(6) | Comparable bond price / (A) | 99�to�102 | points | 101 | points | |||||||||||||||
| Discounted cash flow | Funding spread / (A) | 97 | basis�points | 97 | basis�points | |||||||||||||||||
| Long-term borrowings | 1,887 | Option model | At the money volatility / (C)(D) | 20 to 33 | % | 26 | % | |||||||||||||||
| Volatility skew / (A)(D) | -2 to 0 | % | 0 | % | ||||||||||||||||||
| Equity�Equity correlation /(A)(D) | 50 to 70 | % | 69 | % | ||||||||||||||||||
| Equity�Foreign�exchange�correlation / (C)(D) | -60 to 0 | % | -23 | % | ||||||||||||||||||
| (1) | The ranges of significant unobservable inputs are represented in points, percentages, basis points, times or megawatt hours.�Points are a percentage of par; for example, 93 points would be 93% of par. A basis point equals 1/100th of 1%; for example, 487 basis points would equal 4.87%. |
| (2) | Amounts represent weighted averages except where simple averages and the median of the inputs are provided (see footnote 4 below). Weighted averages are calculated by weighting each input by the fair value of the respective financial instruments except for long-term borrowings and derivative instruments where inputs are weighted by risk. |
| (3) | Investments in funds measured using an unadjusted NAV are excluded. |
| (4) | The data structure of the significant unobservable inputs used in valuing Interest rate contracts, Foreign exchange contracts and certain Equity contracts may be in a multi-dimensional form, such as a curve or surface, with risk distributed across the structure. Therefore, a simple average and median, together with the range of data inputs, may be more appropriate measurements than a single point weighted average. |
| (5) | Includes derivative contracts with multiple risks ( i.e., hybrid products). |
| (6) | This is the predominant valuation technique for this major asset or liability class. |
| (A) | Significant increase (decrease) in the unobservable input in isolation would result in a significantly higher (lower) fair value measurement. |
| (B) | Significant changes in credit correlation may result in a significantly higher or lower fair value measurement. Increasing (decreasing) correlation drives a redistribution of risk within the capital structure such that junior tranches become less (more) risky and senior tranches become more (less) risky. |
| (C) | Significant increase (decrease) in the unobservable input in isolation would result in a significantly lower (higher) fair value measurement. |
| (D) | There are no predictable relationships between the significant unobservable inputs. |
| | 174 |
| Balance�at December� 31, 2012 (dollars in millions) | Valuation Technique(s) | Significant�Unobservable�Input(s)�/ Sensitivity�of�the�Fair�Value�to�Changes in the Unobservable Inputs | Range(1) | Weighted Average | ||||||||||||||||||||
| Assets | ||||||||||||||||||||||||
| Trading assets: | ||||||||||||||||||||||||
| Corporate and other debt: | ||||||||||||||||||||||||
| Commercial mortgage-backed securities | $ | 232 | Comparable�pricing | Comparable�bond�price�/�(A) | 46�to�100 | points | 76 | points | ||||||||||||||||
| Asset-backed securities | 109 | Discounted�cash�flow | Discount rate / (C) | 21 | % | 21 | % | |||||||||||||||||
| Corporate bonds | 660 | Comparable pricing | Comparable�bond�price�/�(A) | 0 to 143 | points | 24 | points | |||||||||||||||||
| Collateralized debt and loan obligations | 1,951 | Comparable pricing | Comparable�bond�price�/�(A) | 15 to 88 | points | 59 | points | |||||||||||||||||
| Correlation model | Credit correlation / (B) | 15 to 45 | % | 40 | % | |||||||||||||||||||
| Loans and lending commitments | 4,694 | Corporate�loan�model | Credit spread / (C) | 17�to�1,004 | basis�points | 281 | basis�points | |||||||||||||||||
| Comparable pricing | Comparable�bond�price�/�(A) | 80 to 120 | points | 104 | points | |||||||||||||||||||
| Comparable pricing | Comparable loan price /�(A) | 55 to 100 | points | 88 | points | |||||||||||||||||||
| Corporate equities(2) | 288 | Net asset value | Discount�to�net�asset�value�/�(C) | 0 to 37 | % | 8 | % | |||||||||||||||||
| Comparable pricing | Discount to comparable equity price / (C) | 0 to 27 | points | 14 | points | |||||||||||||||||||
| Market approach | EBITDA multiple / (A) | 6 | times | 6 | times | |||||||||||||||||||
| Net derivative and other contracts: | ||||||||||||||||||||||||
| Interest rate contracts | (82 | ) | Option model | Interest rate volatility concentration liquidity multiple / (C)(D) | 0 to 8 | times | See (3) | |||||||||||||||||
| Comparable bond price / (A)(D) | 5 to 98 | points | ||||||||||||||||||||||
| Interest rate�Foreign exchange correlation / (A)(D) | 2 to 63 | % | ||||||||||||||||||||||
| Interest rate volatility skew / (A)(D) | 9 to 95 | % | ||||||||||||||||||||||
| Interest rate quanto correlation / (A)(D) | -53 to 33 | % | ||||||||||||||||||||||
| Interest rate curve correlation / (A)(D) | 48 to 99 | % | ||||||||||||||||||||||
| Inflation volatility / (A)(D) | 49 to 100 | % | ||||||||||||||||||||||
| Discounted cash flow | Forward commercial paper rate-LIBOR basis / (A) | -18 to 95 | basis points | |||||||||||||||||||||
| Credit contracts | 1,822 | Comparable pricing | Cash synthetic basis / (C) | 2 to 14 | points | See (4) | ||||||||||||||||||
| Comparable bond price / (C) | 0 to 80 | points | ||||||||||||||||||||||
| Correlation model | Credit correlation / (B) | 14 to 94 | % | |||||||||||||||||||||
| Foreign exchange contracts(5) | (359 | ) | Option model | Comparable�bond�price�/ (A)(D) | 5 to 98 | points | See (6) | |||||||||||||||||
| Interest rate quanto correlation / (A)(D) | -53 to 33 | % | ||||||||||||||||||||||
| Interest rate�Credit spread correlation / (A)(D) | -59 to 65 | % | ||||||||||||||||||||||
| Interest rate�Foreign exchange correlation / (A)(D) | 2 to 63 | % | ||||||||||||||||||||||
| Interest rate volatility skew / (A)(D) | 9 to 95 | % | ||||||||||||||||||||||
| Equity contracts(5) | (1,144 | ) | Option model | At the money volatility / (C)(D) | 7 to 24 | % | See (7) | |||||||||||||||||
| Volatility skew / (C)(D) | -2 to 0 | % | ||||||||||||||||||||||
| Equity�Equity correlation / (C)(D) | 40 to 96 | % | ||||||||||||||||||||||
| Equity�Foreign exchange correlation / (C)(D) | -70 to 38 | % | ||||||||||||||||||||||
| Equity�Interest rate correlation / (C)(D) | 18 to 65 | % | ||||||||||||||||||||||
| 175 | |
| Balance�at December� 31, 2012 (dollars� in millions) | Valuation Technique(s) | Significant�Unobservable�Input(s)�/ Sensitivity�of�the�Fair�Value�to�Changes in the Unobservable Inputs | Range(1) | Weighted Average | ||||||||||||||||||||||||
| Commodity contracts | 709 | Option model | Forward power price / (C)(D) | $28�to�$84 | per | |||||||||||||||||||||||
| Megawatt hour | ||||||||||||||||||||||||||||
| Commodity volatility / (A)(D) | 17 to 29 | % | ||||||||||||||||||||||||||
| Cross commodity correlation / (C)(D) | 43 | to | 97 | % | ||||||||||||||||||||||||
| Investments(2): | ||||||||||||||||||||||||||||
| Principal investments | 2,833 | Discounted cash flow | Implied weighted average cost of capital / (C)(D) | 8 to 15 | % | 9 | % | |||||||||||||||||||||
| Exit multiple / (A)(D) | 5 to 10 | times | 9 | times | ||||||||||||||||||||||||
| Discounted cash flow | Capitalization rate / (C)(D) | 6 to 10 | % | 7 | % | |||||||||||||||||||||||
| Equity discount rate / (C)(D) | 15 to 35 | % | 23 | % | ||||||||||||||||||||||||
| Market approach | EBITDA multiple / (A) | 3 to 17 | times | 10 | times | |||||||||||||||||||||||
| Other | 486 | Discounted cash flow | Implied weighted average cost of capital / (C)(D) | 11 | % | 11 | % | |||||||||||||||||||||
| Exit multiple / (A)(D) | 6 | times | 6 | times | ||||||||||||||||||||||||
| Market approach | EBITDA multiple / (A) | 6 to 8 | times | 7 | times | |||||||||||||||||||||||
| Liabilities | ||||||||||||||||||||||||||||
| Trading liabilities: | ||||||||||||||||||||||||||||
| Corporate and other debt: | ||||||||||||||||||||||||||||
| Corporate bonds | $ | 177 | Comparable pricing | Comparable�bond�price�/�(A) | 0 to 150 | points | 50 | points | ||||||||||||||||||||
| Securities sold under agreements to repurchase | 151 | Discounted cash flow | Funding spread / (A) | 110 to 184 | basis�points | 166 | basis�points | |||||||||||||||||||||
| Other secured financings | 406 | Comparable pricing | Comparable�bond�price�/�(A) | 55 to 139 | points | 102 | points | |||||||||||||||||||||
| Discounted cash flow | Funding spread / (A) | 183 to 186 | basis�points | 184 | basis�points | |||||||||||||||||||||||
| Long-term borrowings | 2,789 | Option model | At�the�money�volatility�/�(A)(D) | 20 to 24 | % | 24 | % | |||||||||||||||||||||
| Volatility skew / (A)(D) | -1 to 0 | % | 0 | % | ||||||||||||||||||||||||
| Equity�Equity correlation / (A)(D) | 50 to 90 | % | 77 | % | ||||||||||||||||||||||||
| Equity�Foreign exchange correlation / (A)(D) | -70 to 36 | % | -15 | % | ||||||||||||||||||||||||
| (1) | The ranges of significant unobservable inputs are represented in points, percentages, basis points, times or megawatt hours.�Points are a percentage of par; for example, 100 points would be 100% of par. A basis point equals 1/100th of 1%; for example, 1,004 basis points would equal 10.04%. |
| (2) | Investments in funds measured using an unadjusted NAV are excluded. |
| (3) | See Note 4 to the consolidated financial statements for the year ended December�31, 2012 included in the Form 10-K for a qualitative discussion of the wide unobservable input ranges for comparable bond prices, interest rate volatility skew, interest rate quanto correlation and forward commercial paper rate�LIBOR basis. |
| (4) | See Note 4 to the consolidated financial statements for the year ended December�31, 2012 included in the Form 10-K for a qualitative discussion of the wide unobservable input ranges for comparable bond prices and credit correlation. |
| (5) | Includes derivative contracts with multiple risks ( i.e ., hybrid products). |
| (6) | See Note 4 to the consolidated financial statements for the year ended December�31, 2012 included in the Form 10-K for a qualitative discussion of the wide unobservable input ranges for comparable bond prices, interest rate quanto correlation, interest rate-credit spread correlation and interest rate volatility skew. |
| (7) | See Note 4 to the consolidated financial statements for the year ended December�31, 2012 included in the Form 10-K for a qualitative discussion of the wide unobservable input range for equity-foreign exchange correlation. |
| (A) | Significant increase (decrease) in the unobservable input in isolation would result in a significantly higher (lower) fair value measurement. |
| (B) | Significant changes in credit correlation may result in a significantly higher or lower fair value measurement. Increasing (decreasing) correlation drives a redistribution of risk within the capital structure such that junior tranches become less (more) risky and senior tranches become more (less) risky. |
| (C) | Significant increase (decrease) in the unobservable input in isolation would result in a significantly lower (higher) fair value measurement. |
| (D) | There are no predictable relationships between the significant unobservable inputs. |
| | 176 |
| � | Comparable bond price �a pricing input used when prices for the identical instrument are not available. Significant subjectivity may be involved when fair value is determined using pricing data available for comparable instruments. Valuation using comparable instruments can be done by calculating an implied yield (or spread over a liquid benchmark) from the price of a comparable bond, then adjusting that yield (or spread) to derive a value for the bond. The adjustment to yield (or spread) should account for relevant differences in the bonds such as maturity or credit quality. Alternatively, a price-to-price basis can be assumed between the comparable instrument and bond being valued in order to establish the value of the bond. Additionally, as the probability of default increases for a given bond ( i.e. , as the bond becomes more distressed), the valuation of that bond will increasingly reflect its expected recovery level assuming default. The decision to use price-to-price or yield/spread comparisons largely reflects trading market convention for the financial instruments in question. Price-to-price comparisons are primarily employed for CMBS, CDOs, CLOs, mortgage loans and distressed corporate bonds. Implied yield (or spread over a liquid benchmark) is utilized predominately for non-distressed corporate bonds, loans and credit contracts. |
| � | Correlation �a pricing input where the payoff is driven by more than one underlying risk. Correlation is a measure of the relationship between the movements of two variables ( i.e ., how the change in one variable influences a change in the other variable). Credit correlation, for example, is the factor that describes the relationship between the probability of individual entities to default on obligations and the joint probability of multiple entities to default on obligations. |
| � | Credit spread �the difference in yield between different securities due to differences in credit quality. The credit spread reflects the additional net yield an investor can earn from a security with more credit risk relative to one with less credit risk. The credit spread of a particular security is often quoted in relation to the yield on a credit risk-free benchmark security or reference rate, typically either U.S. Treasury or LIBOR. |
| � | Volatility skew� the measure of the difference in implied volatility for options with identical underliers and expiry dates but with different strikes. The implied volatility for an option with a strike price that is above or below the current price of an underlying asset will typically deviate from the implied volatility for an option with a strike price equal to the current price of that same underlying asset. |
| � | EBITDA multiple / Exit multiple �is the Enterprise Value to EBITDA ratio, where the Enterprise Value is the aggregate value of equity and debt minus cash and cash equivalents. The EBITDA multiple reflects the value of the company in terms of its full-year EBITDA, whereas the exit multiple reflects the value of the company in terms of its full-year expected EBITDA at exit. Either multiple allows comparison between companies from an operational perspective as the effect of capital structure, taxation and depreciation/amortization is excluded. |
| � | Price / Book ratio �the ratio used to compare a stock�s market value to its book value. It is calculated by dividing the current closing price of the stock by the latest book value per share. This multiple allows comparison between companies from an operational perspective. |
| � | Volatility �the measure of the variability in possible returns for an instrument given how much that instrument changes in value over time. Volatility is a pricing input for options and, generally, the lower the volatility, the less risky the option. The level of volatility used in the valuation of a particular option depends on a number of factors, including the nature of the risk underlying that option ( e.g. , the volatility |
| 177 | |
| of a particular underlying equity security may be significantly different from that of a particular underlying commodity index), the tenor and the strike price of the option. |
| � | Forward commercial paper rate�LIBOR basis� the basis added to the LIBOR rate when the commercial paper yield is expressed as a spread over the LIBOR rate. The basis to LIBOR is dependent on a number of factors, including, but not limited to, collateralization of the commercial paper, credit rating of the issuer, and the supply of commercial paper. The basis may become negative, i.e ., the return for highly rated commercial paper, such as asset-backed commercial paper, may be less than LIBOR. |
| � | Cash synthetic basis �the measure of the price differential between cash financial instruments (�cash instruments�) and their synthetic derivative-based equivalents (�synthetic instruments�). The range disclosed in the table above signifies the number of points by which the synthetic bond equivalent price is higher than the quoted price of the underlying cash bonds. |
| � | Interest rate curve �the term structure of interest rates (relationship between interest rates and the time to maturity) and a market�s measure of future interest rates at the time of observation. An interest rate curve is used to set interest rate derivative cash flows and is a pricing input used in the discounting of any OTC derivative cash flow. |
| � | Implied weighted average cost of capital (�WACC�) �the WACC implied by the current value of equity in a discounted cash flow model. The model assumes that the cash flow assumptions, including projections, are fully reflected in the current equity value while the debt to equity ratio is held constant. The WACC theoretically represents the required rate of return to debt and equity investors, respectively. |
| � | Capitalization rate �the ratio between net operating income produced by an asset and its market value at the projected disposition date. |
| � | Funding spread �the difference between the general collateral rate (which refers to the rate applicable to a broad class of U.S. Treasury issuances) and the specific collateral rate (which refers to the rate applicable to a specific type of security pledged as collateral, such as a municipal bond). Repurchase agreements are discounted based on collateral curves. The curves are constructed as spreads over the corresponding OIS/LIBOR curves, with the short end of the curve representing spreads over the corresponding OIS curves and the long end of the curve representing spreads over LIBOR. |
| | 178 |
| At December�31, 2013 | At December�31, 2012 | |||||||||||||||
| Fair�Value | Unfunded Commitment | Fair�Value | Unfunded Commitment | |||||||||||||
| (dollars in millions) | ||||||||||||||||
| Private equity funds | $ | 2,531 | $ | 559 | $ | 2,179 | $ | 644 | ||||||||
| Real estate funds | 1,643 | 124 | 1,376 | 221 | ||||||||||||
| Hedge funds(1): | ||||||||||||||||
| Long-short equity hedge funds | 469 | � | 475 | � | ||||||||||||
| Fixed income/credit-related hedge funds | 82 | � | 86 | � | ||||||||||||
| Event-driven hedge funds | 38 | � | 52 | � | ||||||||||||
| Multi-strategy hedge funds | 220 | 3 | 321 | 3 | ||||||||||||
| Total | $ | 4,983 | $ | 686 | $ | 4,489 | $ | 868 | ||||||||
| (1) | Fixed income/credit-related hedge funds, event-driven hedge funds, and multi-strategy hedge funds are redeemable at least on a three-month period basis primarily with a notice period of 90 days or less. At December�31, 2013, approximately 42% of the fair value amount of long-short equity hedge funds is redeemable at least quarterly, 42% is redeemable every six months and 16% of these funds have a redemption frequency of greater than six months. The notice period for long-short equity hedge funds at December�31, 2013 is primarily greater than six months. At December�31, 2012, approximately 36% of the fair value amount of long-short equity hedge funds is redeemable at least quarterly, 38% is redeemable every six months and 26% of these funds have a redemption frequency of greater than six months. The notice period for long-short equity hedge funds at December�31, 2012 is primarily greater than six months. |
| 179 | |
| � | Long-Short Equity Hedge Funds. Amount includes investments in hedge funds that invest, long or short, in equities. Equity value and growth hedge funds purchase stocks perceived to be undervalued and sell stocks perceived to be overvalued. Investments representing approximately 12% of the fair value of the investments in this category cannot be redeemed currently because the investments include certain initial period lock-up restrictions. The remaining restriction period for these investments subject to lock-up restrictions was primarily two years or less at December�31, 2013. Investments representing approximately 19% of the fair value of the investments in long-short equity hedge funds cannot be redeemed currently because an exit restriction has been imposed by the hedge fund manager. The restriction period for these investments subject to an exit restriction was primarily indefinite at December�31, 2013. |
| � | Fixed Income/Credit-Related Hedge Funds. Amount includes investments in hedge funds that employ long-short, distressed or relative value strategies in order to benefit from investments in undervalued or overvalued securities that are primarily debt or credit related. Investments representing approximately 7% of the fair value of the investments in this category cannot be redeemed currently because the investments include certain initial period lock-up restrictions. The remaining restriction period for these investments subject to lock-up restrictions was primarily over three years at December�31, 2013. |
| � | Event-Driven Hedge Funds. Amount includes investments in hedge funds that invest in event-driven situations such as mergers, hostile takeovers, reorganizations, or leveraged buyouts. This may involve the simultaneous purchase of stock in companies being acquired and the sale of stock in its acquirer, with the expectation to profit from the spread between the current market price and the ultimate purchase price of the target company. At December�31, 2013, there were no restrictions on redemptions. |
| � | Multi-strategy Hedge Funds. Amount includes investments in hedge funds that pursue multiple strategies to realize short- and long-term gains. Management of the hedge funds has the ability to overweight or underweight different strategies to best capitalize on current investment opportunities. At December�31, 2013, investments representing approximately 50% of the fair value of the investments in this category cannot be redeemed currently because the investments include certain initial period lock-up restrictions. The remaining restriction period for these investments subject to lock-up restrictions was primarily two years or less at December�31, 2013. Investments representing approximately 8% of the fair value of the investments in multi-strategy hedge funds cannot be redeemed currently because an exit restriction has been imposed by the hedge fund manager. The restriction period for these investments subject to an exit restriction was indefinite at December�31, 2013. |
| | 180 |
| Trading | Interest Income (Expense) | Gains�(Losses) Included�in Net Revenues | ||||||||||
| (dollars in millions) | ||||||||||||
| Year Ended December�31, 2013 | ||||||||||||
| Federal funds sold and securities purchased under agreements to resell | $ | (1 | ) | $ | 6 | $ | 5 | |||||
| Deposits | 52 | (60 | ) | (8 | ) | |||||||
| Commercial paper and other short-term borrowings(1) | 181 | (8 | ) | 173 | ||||||||
| Securities sold under agreements to repurchase | (3 | ) | (6 | ) | (9 | ) | ||||||
| Long-term borrowings(1) | 664 | (971 | ) | (307 | ) | |||||||
| Year Ended December�31, 2012 | ||||||||||||
| Federal funds sold and securities purchased under agreements to resell | $ | 8 | $ | 5 | $ | 13 | ||||||
| Deposits | 57 | (86 | ) | (29 | ) | |||||||
| Commercial paper and other short-term borrowings(1) | (31 | ) | � | (31 | ) | |||||||
| Securities sold under agreements to repurchase | (15 | ) | (4 | ) | (19 | ) | ||||||
| Long-term borrowings(1) | (5,687 | ) | (1,321 | ) | (7,008 | ) | ||||||
| Year Ended December�31, 2011 | ||||||||||||
| Federal funds sold and securities purchased under agreements to resell | $ | 12 | $ | � | $ | 12 | ||||||
| Deposits | 66 | (117 | ) | (51 | ) | |||||||
| Commercial paper and other short-term borrowings(1) | 567 | � | 567 | |||||||||
| Securities sold under agreements to repurchase | 3 | (7 | ) | (4 | ) | |||||||
| Long-term borrowings(1) | 4,204 | (1,075 | ) | 3,129 | ||||||||
| (1) | Of the total gains (losses) recorded in Trading revenues for short-term and long-term borrowings for 2013, 2012 and 2011, $(681) million, $(4,402) million and $3,681 million, respectively, are attributable to changes in the credit quality of the Company, and the respective remainder is attributable to changes in foreign currency rates or interest rates or movements in the reference price or index for structured notes before the impact of related hedges. |
| 181 | |
| Short-Term�and�
Long-Term Borrowings | ||||||||
| Business Unit | At�December�31, 2013 | At�December�31, 2012 | ||||||
| (dollars in millions) | ||||||||
| Interest rates | $ | 15,933 | $ | 23,330 | ||||
| Equity | 17,945 | 17,326 | ||||||
| Credit and foreign exchange | 2,561 | 3,337 | ||||||
| Commodities | 545 | 776 | ||||||
| Total | $ | 36,984 | $ | 44,769 | ||||
| 2013 | 2012 | 2011 | ||||||||||
| (dollars in millions) | ||||||||||||
| Short-term and long-term borrowings(1) | $ | (681 | ) | $ | (4,402 | ) | $ | 3,681 | ||||
| Loans(2) | 137 | 340 | (585 | ) | ||||||||
| Unfunded lending commitments(3) | 255 | 1,026 | (787 | ) | ||||||||
| (1) | The change in the fair value of short-term and long-term borrowings (primarily structured notes) includes an adjustment to reflect the change in credit quality of the Company based upon observations of the Company�s secondary bond market spreads. |
| (2) | Instrument-specific credit gains (losses) were determined by excluding the non-credit components of gains and losses, such as those due to changes in interest rates. |
| (3) | Gains (losses) were generally determined based on the differential between estimated expected client yields and contractual yields at each respective period-end. |
| Contractual Principal Amount Exceeds Fair Value | ||||||||
| At�December�31, 2013 | At�December�31, 2012 | |||||||
| (dollars in millions) | ||||||||
| Short-term and long-term borrowings(1) | $ | (2,409 | ) | $ | (436 | ) | ||
| Loans(2) | 17,248 | 25,249 | ||||||
| Loans 90 or more days past due and/or on nonaccrual status(2)(3) | 15,113 | 20,456 | ||||||
| (1) | These amounts do not include structured notes where the repayment of the initial principal amount fluctuates based on changes in the reference price or index. |
| (2) | The majority of this difference between principal and fair value amounts emanates from the Company�s distressed debt trading business, which purchases distressed debt at amounts well below par. |
| (3) | The aggregate fair value of loans that were in nonaccrual status, which includes all loans 90 or more days past due, was $1,205 million and $1,360 million at December�31, 2013 and December�31, 2012, respectively. The aggregate fair value of loans that were 90 or more days past due was $655 million and $840 million at December�31, 2013 and December�31, 2012, respectively. |
| | 182 |
| Fair Value Measurements Using: | ||||||||||||||||||||
| Carrying�Value at�December�31, 2013 | Quoted�Prices�in Active�Markets�for Identical�Assets (Level 1) | Significant Observable�Inputs (Level 2) | Significant Unobservable Inputs (Level 3) | Total Gains (Losses)�for 2013(1) | ||||||||||||||||
| (dollars in millions) | ||||||||||||||||||||
| Loans(2) | $ | 1,822 | $ | � | $ | 1,616 | $ | 206 | $ | (71 | ) | |||||||||
| Other investments(3) | 46 | � | � | 46 | (38 | ) | ||||||||||||||
| Premises, equipment and software costs(3) | 8 | � | � | 8 | (133 | ) | ||||||||||||||
| Intangible assets(3) | 92 | � | � | 92 | (44 | ) | ||||||||||||||
| Total | $ | 1,968 | $ | � | $ | 1,616 | $ | 352 | $ | (286 | ) | |||||||||
| (1) | Fair value adjustments related to Loans and losses related to Other investments are recorded within Other revenues whereas losses related to Premises, equipment and software costs and Intangible assets are recorded within Other expenses in the consolidated statements of income. |
| (2) | Non-recurring changes in the fair value of loans held for investment or held for sale were calculated using recently executed transactions; market price quotations; valuation models that incorporate market observable inputs where possible, such as comparable loan or debt prices and credit default swap spread levels adjusted for any basis difference between cash and derivative instruments; or default recovery analysis where such transactions and quotations are unobservable. |
| (3) | Losses recorded were determined primarily using discounted cash flow models. |
| Fair Value Measurements Using: | ||||||||||||||||||||
| Carrying�Value at�December�31, 2012 | Quoted�Prices�in Active Markets for�Identical�Assets (Level 1) | Significant Observable�Inputs (Level 2) | Significant Unobservable Inputs (Level 3) | Total Gains (Losses)�for 2012(1) | ||||||||||||||||
| (dollars in millions) | ||||||||||||||||||||
| Loans(2) | $ | 1,821 | $ | � | $ | 277 | $ | 1,544 | $ | (60 | ) | |||||||||
| Other investments(3) | 90 | � | � | 90 | (37 | ) | ||||||||||||||
| Premises, equipment and software costs(4) | 33 | � | � | 33 | (170 | ) | ||||||||||||||
| Intangible assets(3) | � | � | � | � | (4 | ) | ||||||||||||||
| Total | $ | 1,944 | $ | � | $ | 277 | $ | 1,667 | $ | (271 | ) | |||||||||
| 183 | |
| (1) | Losses are recorded within Other expenses in the consolidated statements of income except for fair value adjustments related to Loans and losses related to Other investments, which are included in Other revenues. |
| (2) | Non-recurring changes in the fair value of loans held for investment or held for sale were calculated using recently executed transactions; market price quotations; valuation models that incorporate market observable inputs where possible, such as comparable loan or debt prices and credit default swap spread levels adjusted for any basis difference between cash and derivative instruments; or default recovery analysis where such transactions and quotations are unobservable. |
| (3) | Losses recorded were determined primarily using discounted cash flow models. |
| (4) | Losses were determined using discounted cash flow models and primarily represented the write-off of the carrying value of certain premises and software that were abandoned during 2012 in association with the Wealth Management JV integration. |
| Fair Value Measurements Using: | ||||||||||||||||||||
| Carrying�Value at�December�31, 2011 | Quoted�Prices�in Active�Markets�for Identical�Assets (Level 1) | Significant Observable�Inputs (Level 2) | Significant Unobservable Inputs (Level 3) | Total Gains (Losses)�for 2011(1) | ||||||||||||||||
| (dollars in millions) | ||||||||||||||||||||
| Loans(2) | $ | 70 | $ | � | $ | � | $ | 70 | $ | 5 | ||||||||||
| Other investments(3) | 71 | � | � | 71 | (52 | ) | ||||||||||||||
| Premises, equipment and software costs(4) | 4 | � | � | 4 | (7 | ) | ||||||||||||||
| Intangible assets(3) | � | � | � | � | (7 | ) | ||||||||||||||
| Total | $ | 145 | $ | � | $ | � | $ | 145 | $ | (61 | ) | |||||||||
| (1) | Losses are recorded within Other expenses in the consolidated statements of income except for fair value adjustments related to Loans and losses related to Other investments, which are included in Other revenues. |
| (2) | Non-recurring changes in the fair value of loans held for investment were calculated using valuation models that incorporate market observable inputs or default recovery analyses or collateral appraisal values where such inputs were unobservable; or discounted cash flow techniques. |
| (3) | Losses recorded were determined primarily using discounted cash flow models. |
| (4) | Losses were determined primarily using discounted cash flow models or a valuation technique incorporating an observable market index. |
| | 184 |
| 185 | |
| At December�31, 2013 | Fair Value Measurements Using: | |||||||||||||||||||
| Carrying�Value | Fair Value | Quoted�Prices�in Active�Markets�for Identical�Assets (Level 1) | Significant Observable Inputs (Level 2) | Significant Unobservable Inputs (Level 3) | ||||||||||||||||
| (dollars in millions) | ||||||||||||||||||||
| Financial Assets: | ||||||||||||||||||||
| Cash and due from banks | $ | 16,602 | $ | 16,602 | $ | 16,602 | $ | � | $ | � | ||||||||||
| Interest bearing deposits with banks | 43,281 | 43,281 | 43,281 | � | � | |||||||||||||||
| Cash deposited with clearing organizations or segregated under federal and other regulations or requirements | 39,203 | 39,203 | 39,203 | � | � | |||||||||||||||
| Federal funds sold and securities purchased under agreements to resell | 117,264 | 117,263 | � | 116,584 | 679 | |||||||||||||||
| Securities borrowed | 129,707 | 129,705 | � | 129,374 | 331 | |||||||||||||||
| Customer and other receivables(1) | 53,112 | 53,031 | � | 47,525 | 5,506 | |||||||||||||||
| Loans(2) | 42,874 | 42,765 | � | 11,288 | 31,477 | |||||||||||||||
| Financial Liabilities: | ||||||||||||||||||||
| Deposits | $ | 112,194 | $ | 112,273 | $ | � | $ | 112,273 | $ | � | ||||||||||
| Commercial paper and other short-term borrowings | 795 | 795 | � | 787 | 8 | |||||||||||||||
| Securities sold under agreements to repurchase | 145,115 | 145,157 | � | 138,161 | 6,996 | |||||||||||||||
| Securities loaned | 32,799 | 32,826 | � | 31,731 | 1,095 | |||||||||||||||
| Other secured financings | 9,009 | 9,034 | � | 5,845 | 3,189 | |||||||||||||||
| Customer and other payables(1) | 154,654 | 154,654 | � | 154,654 | � | |||||||||||||||
| Long-term borrowings | 117,938 | 123,133 | � | 122,099 | 1,034 | |||||||||||||||
| (1) | Accrued interest, fees and dividend receivables and payables where carrying value approximates fair value have been excluded. |
| (2) | Includes all loans measured at fair value on a non-recurring basis. |
| | 186 |
| At December�31, 2012 | Fair Value Measurements Using: | |||||||||||||||||||
| Carrying�Value | Fair Value | Quoted�Prices�in Active�Markets�for Identical�Assets (Level 1) | Significant Observable Inputs (Level 2) | Significant Unobservable Inputs (Level 3) | ||||||||||||||||
| (dollars in millions) | ||||||||||||||||||||
| Financial Assets: | ||||||||||||||||||||
| Cash and due from banks | $ | 20,878 | $ | 20,878 | $ | 20,878 | $ | � | $ | � | ||||||||||
| Interest bearing deposits with banks | 26,026 | 26,026 | 26,026 | � | � | |||||||||||||||
| Cash deposited with clearing organizations or segregated under federal and other regulations or requirements | 30,970 | 30,970 | 30,970 | � | � | |||||||||||||||
| Federal funds sold and securities purchased under agreements to resell | 133,791 | 133,792 | � | 133,035 | 757 | |||||||||||||||
| Securities borrowed | 121,701 | 121,705 | � | 121,691 | 14 | |||||||||||||||
| Customer and other receivables(1) | 59,702 | 59,634 | � | 53,532 | 6,102 | |||||||||||||||
| Loans(2) | 29,046 | 27,263 | � | 5,307 | 21,956 | |||||||||||||||
| Financial Liabilities: | ||||||||||||||||||||
| Deposits | $ | 81,781 | $ | 81,781 | $ | � | $ | 81,781 | $ | � | ||||||||||
| Commercial paper and other short-term borrowings | 1,413 | 1,413 | � | 1,107 | 306 | |||||||||||||||
| Securities sold under agreements to repurchase | 122,311 | 122,389 | � | 111,722 | 10,667 | |||||||||||||||
| Securities loaned | 36,849 | 37,163 | � | 35,978 | 1,185 | |||||||||||||||
| Other secured financings | 6,261 | 6,276 | � | 3,649 | 2,627 | |||||||||||||||
| Customer and other payables(1) | 125,037 | 125,037 | � | 125,037 | � | |||||||||||||||
| Long-term borrowings | 125,527 | 126,683 | � | 116,511 | 10,172 | |||||||||||||||
| (1) | Accrued interest, fees and dividend receivables and payables where carrying value approximates fair value have been excluded. |
| (2) | Includes all loans measured at fair value on a non-recurring basis. |
| 187 | |
| At December�31, 2013 | ||||||||||||||||||||
| Amortized Cost | Gross Unrealized Gains | Gross Unrealized Losses | Other-than- Temporary Impairment | Fair Value | ||||||||||||||||
| (dollars in millions) | ||||||||||||||||||||
| Debt securities available for sale: | ||||||||||||||||||||
| U.S. government and agency securities: | ||||||||||||||||||||
| U.S. Treasury securities | $ | 24,486 | $ | 51 | $ | 139 | $ | � | $ | 24,398 | ||||||||||
| U.S. agency securities | 15,813 | 26 | 234 | � | 15,605 | |||||||||||||||
| Total U.S. government and agency securities | 40,299 | 77 | 373 | � | 40,003 | |||||||||||||||
| Corporate and other debt: | ||||||||||||||||||||
| Commercial mortgage-backed securities: | ||||||||||||||||||||
| Agency | 2,482 | � | 84 | � | 2,398 | |||||||||||||||
| Non-Agency | 1,333 | 1 | 18 | � | 1,316 | |||||||||||||||
| Auto loan asset-backed securities | 2,041 | 2 | 1 | � | 2,042 | |||||||||||||||
| Corporate bonds | 3,415 | 3 | 61 | � | 3,357 | |||||||||||||||
| Collateralized loan obligations | 1,087 | � | 20 | � | 1,067 | |||||||||||||||
| FFELP student loan asset-backed securities(1) | 3,230 | 12 | 8 | � | 3,234 | |||||||||||||||
| Total Corporate and other debt | 13,588 | 18 | 192 | � | 13,414 | |||||||||||||||
| Total debt securities available for sale | 53,887 | 95 | 565 | � | 53,417 | |||||||||||||||
| Equity securities available for sale | 15 | � | 2 | � | 13 | |||||||||||||||
| Total | $ | 53,902 | $ | 95 | $ | 567 | $ | � | $ | 53,430 | ||||||||||
| At December 31, 2012 | ||||||||||||||||||||
| Amortized Cost | Gross Unrealized Gains | Gross Unrealized Losses | Other-than- Temporary Impairment | Fair Value | ||||||||||||||||
| (dollars in millions) | ||||||||||||||||||||
| Debt securities available for sale: | ||||||||||||||||||||
| U.S. government and agency securities: | ||||||||||||||||||||
| U.S. Treasury securities | $ | 14,351 | $ | 109 | $ | 2 | $ | � | $ | 14,458 | ||||||||||
| U.S. agency securities | 15,330 | 122 | 3 | � | 15,449 | |||||||||||||||
| Total U.S. government and agency securities | 29,681 | 231 | 5 | � | 29,907 | |||||||||||||||
| Corporate and other debt: | ||||||||||||||||||||
| Commercial mortgage-backed securities: | ||||||||||||||||||||
| Agency | 2,197 | 6 | 4 | � | 2,199 | |||||||||||||||
| Non-Agency | 160 | � | � | � | 160 | |||||||||||||||
| Auto loan asset-backed securities | 1,993 | 4 | 1 | � | 1,996 | |||||||||||||||
| Corporate bonds | 2,891 | 13 | 3 | � | 2,901 | |||||||||||||||
| FFELP student loan asset-backed securities(1) | 2,675 | 23 | � | � | 2,698 | |||||||||||||||
| Total Corporate and other debt | 9,916 | 46 | 8 | � | 9,954 | |||||||||||||||
| Total debt securities available for sale | 39,597 | 277 | 13 | � | 39,861 | |||||||||||||||
| Equity securities available for sale | 15 | � | 7 | � | 8 | |||||||||||||||
| Total | $ | 39,612 | $ | 277 | $ | 20 | $ | � | $ | 39,869 | ||||||||||
| (1) | Amounts are backed by a guarantee from the U.S. Department of Education of at least 95% of the principal balance and interest on such loans. |
| | 188 |
| Less than 12 Months | 12 Months or Longer | Total | ||||||||||||||||||||||
| At December�31, 2013 | Fair�Value | Gross Unrealized Losses | Fair�Value | Gross Unrealized Losses | Fair�Value | Gross Unrealized Losses | ||||||||||||||||||
| (dollars in millions) | ||||||||||||||||||||||||
| Debt securities available for sale: | ||||||||||||||||||||||||
| U.S. government and agency securities: | ||||||||||||||||||||||||
| U.S. Treasury securities | $ | 13,266 | $ | 139 | $ | � | $ | � | $ | 13,266 | $ | 139 | ||||||||||||
| U.S. agency securities | 8,438 | 211 | 651 | 23 | 9,089 | 234 | ||||||||||||||||||
| Total U.S. government and agency securities | 21,704 | 350 | 651 | 23 | 22,355 | 373 | ||||||||||||||||||
| Corporate and other debt: | ||||||||||||||||||||||||
| Commercial mortgage-backed securities: | ||||||||||||||||||||||||
| Agency | 958 | 15 | 1,270 | 69 | 2,228 | 84 | ||||||||||||||||||
| Non-Agency | 841 | 16 | 86 | 2 | 927 | 18 | ||||||||||||||||||
| Auto loan asset-backed securities | 557 | 1 | 85 | � | 642 | 1 | ||||||||||||||||||
| Corporate bonds | 2,350 | 52 | 383 | 9 | 2,733 | 61 | ||||||||||||||||||
| Collateralized loan obligations | 1,067 | 20 | � | � | 1,067 | 20 | ||||||||||||||||||
| FFELP student loan asset-backed securities | 1,388 | 7 | 76 | 1 | 1,464 | 8 | ||||||||||||||||||
| Total Corporate and other debt | 7,161 | 111 | 1,900 | 81 | 9,061 | 192 | ||||||||||||||||||
| Total debt securities available for sale | 28,865 | 461 | 2,551 | 104 | 31,416 | 565 | ||||||||||||||||||
| Equity securities available for sale | 13 | 2 | � | � | 13 | 2 | ||||||||||||||||||
| Total | $ | 28,878 | $ | 463 | $ | 2,551 | $ | 104 | $ | 31,429 | $ | 567 | ||||||||||||
| 189 | |
| Less than 12 Months | 12 Months or Longer | Total | ||||||||||||||||||||||
| At December�31, 2012 | Fair�Value | Gross Unrealized Losses | Fair Value | Gross Unrealized Losses | Fair Value | Gross Unrealized Losses | ||||||||||||||||||
| (dollars in millions) | ||||||||||||||||||||||||
| Debt securities available for sale: | ||||||||||||||||||||||||
| U.S. government and agency securities: | ||||||||||||||||||||||||
| U.S. Treasury securities | $ | 1,012 | $ | 2 | $ | � | $ | � | $ | 1,012 | $ | 2 | ||||||||||||
| U.S. agency securities | 1,534 | 3 | 27 | � | 1,561 | 3 | ||||||||||||||||||
| Total U.S. government and agency securities | 2,546 | 5 | 27 | � | 2,573 | 5 | ||||||||||||||||||
| Corporate and other debt: | ||||||||||||||||||||||||
| Commercial mortgage-backed securities: | ||||||||||||||||||||||||
| Agency | 1,057 | 4 | � | � | 1,057 | 4 | ||||||||||||||||||
| Auto loan asset-backed securities | 710 | 1 | � | � | 710 | 1 | ||||||||||||||||||
| Corporate bonds | 934 | 3 | � | � | 934 | 3 | ||||||||||||||||||
| Total Corporate and other debt | 2,701 | 8 | � | � | 2,701 | 8 | ||||||||||||||||||
| Total debt securities available for sale | 5,247 | 13 | 27 | � | 5,274 | 13 | ||||||||||||||||||
| Equity securities available for sale | 8 | 7 | � | � | 8 | 7 | ||||||||||||||||||
| Total | $ | 5,255 | $ | 20 | $ | 27 | $ | � | $ | 5,282 | $ | 20 | ||||||||||||
| | 190 |
| At December�31, 2013 | Amortized�Cost | Fair�Value | Annualized Average�Yield | |||||||||
| (dollars�in�millions) | ||||||||||||
| U.S. government and agency securities: | ||||||||||||
| U.S. Treasury securities: | ||||||||||||
| Due within 1 year | $ | 1,759 | $ | 1,767 | 0.7 | % | ||||||
| After 1 year through 5 years | 21,594 | 21,514 | 0.7 | % | ||||||||
| After 5 years through 10 years | 1,133 | 1,117 | 2.2 | % | ||||||||
| Total | 24,486 | 24,398 | ||||||||||
| U.S. agency securities: | ||||||||||||
| After 1 year through 5 years | 111 | 111 | 1.2 | % | ||||||||
| After 5 years through 10 years | 2,202 | 2,199 | 1.2 | % | ||||||||
| After 10 years | 13,500 | 13,295 | 1.3 | % | ||||||||
| Total | 15,813 | 15,605 | ||||||||||
| Total U.S. government and agency securities | 40,299 | 40,003 | 0.9 | % | ||||||||
| Corporate and other debt: | ||||||||||||
| Commercial mortgage-backed securities: | ||||||||||||
| Agency: | ||||||||||||
| After 1 year through 5 years | 533 | 528 | 0.9 | % | ||||||||
| After 5 years through 10 years | 645 | 634 | 0.9 | % | ||||||||
| After 10 years | 1,304 | 1,236 | 1.5 | % | ||||||||
| Total | 2,482 | 2,398 | ||||||||||
| Non-Agency: | ||||||||||||
| After 10 years | 1,333 | 1,316 | 1.6 | % | ||||||||
| Total | 1,333 | 1,316 | ||||||||||
| Auto loan asset-backed securities: | ||||||||||||
| Due within 1 year | 9 | 9 | 0.5 | % | ||||||||
| After 1 year through 5 years | 1,985 | 1,985 | 0.7 | % | ||||||||
| After 5 years through 10 years | 47 | 48 | 1.3 | % | ||||||||
| Total | 2,041 | 2,042 | ||||||||||
| Corporate bonds: | ||||||||||||
| Due within 1 year | 60 | 60 | 0.6 | % | ||||||||
| After 1 year through 5 years | 2,613 | 2,582 | 1.2 | % | ||||||||
| After 5 years through 10 years | 742 | 715 | 2.3 | % | ||||||||
| Total | 3,415 | 3,357 | ||||||||||
| Collateralized loan obligations: | ||||||||||||
| After 10 years | 1,087 | 1,067 | 1.4 | % | ||||||||
| Total | 1,087 | 1,067 | ||||||||||
| FFELP student loan asset-backed securities: | ||||||||||||
| After 1 year through 5 years | 87 | 87 | 0.7 | % | ||||||||
| After 5 years through 10 years | 576 | 576 | 0.9 | % | ||||||||
| After 10 years | 2,567 | 2,571 | 1.0 | % | ||||||||
| Total | 3,230 | 3,234 | ||||||||||
| Total Corporate and other debt | 13,588 | 13,414 | 1.2 | % | ||||||||
| Total debt securities available for sale | $ | 53,887 | $ | 53,417 | 1.0 | % | ||||||
| 191 | |
| 2013 | 2012 | 2011 | ||||||||||
| (dollars in millions) | ||||||||||||
| Gross realized gains | $ | 49 | $ | 88 | $ | 145 | ||||||
| Gross realized losses | $ | 4 | $ | 10 | $ | 2 | ||||||
| At�December�31,�2013 | ||||||||||||||||||||
| Gross Amounts(1) | Amounts�Offset in�the Consolidated Statements� of Financial Condition(2) | Net�
Amounts Presented in�the Consolidated Statements�of Financial Condition | Financial Instruments�Not Offset�in�the Consolidated Statements� of Financial Condition(3) | Net�Exposure | ||||||||||||||||
| (dollars�in�millions) | ||||||||||||||||||||
| Assets | ||||||||||||||||||||
| Federal funds sold and securities purchased under agreements to resell | $ | 183,015 | $ | (64,885 | ) | $ | 118,130 | $ | (106,828 | ) | $ | 11,302 | ||||||||
| Securities borrowed | 137,082 | (7,375 | ) | 129,707 | (113,339 | ) | 16,368 | |||||||||||||
| Liabilities | ||||||||||||||||||||
| Securities sold under agreements to repurchase | $ | 210,561 | $ | (64,885 | ) | $ | 145,676 | $ | (111,599 | ) | $ | 34,077 | ||||||||
| Securities loaned | 40,174 | (7,375 | ) | 32,799 | (32,543 | ) | 256 | |||||||||||||
| | 192 |
| (1) | Amounts include $11.1 billion of Federal funds sold and securities purchased under agreements to resell, $13.2 billion of Securities borrowed and $33.3 billion of Securities sold under agreements to repurchase, which are either not subject to master netting agreements or collateral agreements or are subject to such agreements but the Company has not determined the agreements to be legally enforceable. |
| (2) | Amounts relate to master netting agreements and collateral agreements, which have been determined by the Company to be legally enforceable in the event of default and where certain other criteria are met in accordance with applicable offsetting accounting guidance. |
| (3) | Amounts relate to master netting agreements and collateral agreements, which have been determined by the Company to be legally enforceable in the event of default but where certain other criteria are not met in accordance with applicable offsetting accounting guidance. |
| At�December�31,�2012 | ||||||||||||||||||||
| Gross Amounts(1) | Amounts�Offset in�the Consolidated Statements� of Financial Condition(2) | Net�
Amounts Presented in�the Consolidated Statements�of Financial Condition | Financial Instruments�Not Offset�in�the Consolidated Statements� of Financial Condition(3) | Net�Exposure | ||||||||||||||||
| (dollars�in�millions) | ||||||||||||||||||||
| Assets | ||||||||||||||||||||
| Federal funds sold and securities purchased under agreements to resell | $ | 203,448 | $ | (69,036 | ) | $ | 134,412 | $ | (126,303 | ) | $ | 8,109 | ||||||||
| Securities borrowed | 127,002 | (5,301 | ) | 121,701 | (105,849 | ) | 15,852 | |||||||||||||
| Liabilities | ||||||||||||||||||||
| Securities sold under agreements to repurchase | $ | 191,710 | $ | (69,036 | ) | $ | 122,674 | $ | (103,521 | ) | $ | 19,153 | ||||||||
| Securities loaned | 42,150 | (5,301 | ) | 36,849 | (30,395 | ) | 6,454 | |||||||||||||
| (1) | Amounts include $7.4 billion of Federal funds sold and securities purchased under agreements to resell, $8.6 billion of Securities borrowed, $17.5 billion of Securities sold under agreements to repurchase and $0.6 billion of Securities loaned, which are either not subject to master netting agreements or collateral agreements or are subject to such agreements but the Company has not determined the agreements to be legally enforceable. |
| (2) | Amounts relate to master netting agreements and collateral agreements, which have been determined by the Company to be legally enforceable in the event of default and where certain other criteria are met in accordance with applicable offsetting accounting guidance. |
| (3) | Amounts relate to master netting agreements and collateral agreements, which have been determined by the Company to be legally enforceable in the event of default but where certain other criteria are not met in accordance with applicable offsetting accounting guidance. |
| 193 | |
| At December�31, 2013 | At December� 31, 2012 | |||||||
| (dollars�in�millions) | ||||||||
| Trading assets: | ||||||||
| U.S. government and agency securities | $ | 21,589 | $ | 15,273 | ||||
| Other sovereign government obligations | 5,748 | 3,278 | ||||||
| Corporate and other debt | 7,388 | 11,980 | ||||||
| Corporate equities | 8,713 | 26,377 | ||||||
| Total | $ | 43,438 | $ | 56,908 | ||||
| | 194 |
| At December�31, 2013 | At December�31, 2012 | |||||||
| (dollars�in�millions) | ||||||||
| Cash deposited with clearing organizations or segregated under federal and other regulations or requirements | $ | 39,203 | $ | 30,970 | ||||
| Securities(1) | 15,586 | 13,424 | ||||||
| Total | $ | 54,789 | $ | 44,394 | ||||
| (1) | Securities deposited with clearing organizations or segregated under federal and other regulations or requirements are sourced from Federal funds sold and securities purchased under agreements to resell and Trading assets in the consolidated statements of financial condition. |
| � | Interests purchased in connection with market-making activities, securities held in its available for sale portfolio and retained interests held as a result of securitization activities, including re-securitization transactions. |
| � | Guarantees issued and residual interests retained in connection with municipal bond securitizations. |
| � | Servicing of residential and commercial mortgage loans held by VIEs. |
| � | Loans made to and investments in VIEs that hold debt, equity, real estate or other assets. |
| � | Derivatives entered into with VIEs. |
| � | Structuring of credit-linked notes (�CLN�) or other asset-repackaged notes designed to meet the investment objectives of clients. |
| � | Other structured transactions designed to provide tax-efficient yields to the Company or its clients. |
| 195 | |
| | 196 |
| At�December�31, 2013 | ||||||||||||||||||||
| Mortgage�and Asset-Backed Securitizations | Collateralized Debt Obligations | Managed Real�Estate Partnerships | Other Structured Financings | Other | ||||||||||||||||
| (dollars in millions) | ||||||||||||||||||||
| VIE assets | $ | 643 | $ | � | $ | 2,313 | $ | 1,202 | $ | 1,294 | ||||||||||
| VIE liabilities | $ | 368 | $ | � | $ | 42 | $ | 67 | $ | 175 | ||||||||||
| At�December�31, 2012 | ||||||||||||||||||||
| Mortgage�and Asset-Backed Securitizations | Collateralized Debt Obligations | Managed Real�Estate Partnerships | Other Structured Financings | Other | ||||||||||||||||
| (dollars in millions) | ||||||||||||||||||||
| VIE assets | $ | 978 | $ | 52 | $ | 2,394 | $ | 983 | $ | 1,676 | ||||||||||
| VIE liabilities | $ | 646 | $ | 16 | $ | 83 | $ | 65 | $ | 313 | ||||||||||
| 197 | |
| At December�31, 2013 | ||||||||||||||||||||
| Mortgage and Asset-Backed Securitizations | Collateralized Debt Obligations | Municipal Tender Option Bonds | Other Structured Financings | Other | ||||||||||||||||
| (dollars�in�millions) | ||||||||||||||||||||
| VIE assets that the Company does not consolidate (unpaid principal balance)(1) | $ | 177,153 | $ | 29,513 | $ | 3,079 | $ | 1,874 | $ | 10,119 | ||||||||||
| Maximum exposure to loss: | ||||||||||||||||||||
| Debt and equity interests(2) | $ | 13,514 | $ | 2,498 | $ | 31 | $ | 1,142 | $ | 3,693 | ||||||||||
| Derivative and other contracts | 15 | 23 | 1,935 | � | 146 | |||||||||||||||
| Commitments, guarantees and other | � | 272 | � | 649 | 527 | |||||||||||||||
| Total maximum exposure to loss | $ | 13,529 | $ | 2,793 | $ | 1,966 | $ | 1,791 | $ | 4,366 | ||||||||||
| Carrying value of exposure to loss�Assets: | ||||||||||||||||||||
| Debt and equity interests(2) | $ | 13,514 | $ | 2,498 | $ | 31 | $ | 731 | $ | 3,693 | ||||||||||
| Derivative and other contracts | 15 | 3 | 4 | � | 53 | |||||||||||||||
| Total carrying value of exposure to loss�Assets | $ | 13,529 | $ | 2,501 | $ | 35 | $ | 731 | $ | 3,746 | ||||||||||
| Carrying value of exposure to loss�Liabilities: | ||||||||||||||||||||
| Derivative and other contracts | $ | � | $ | 2 | $ | � | $ | � | $ | 57 | ||||||||||
| Commitments, guarantees and other | � | � | � | 7 | � | |||||||||||||||
| Total carrying value of exposure to loss�Liabilities | $ | � | $ | 2 | $ | � | $ | 7 | $ | 57 | ||||||||||
| (1) | Mortgage and asset-backed securitizations include VIE assets as follows: $16.9 billion of residential mortgages; $78.4 billion of commercial mortgages; $31.5 billion of U.S. agency collateralized mortgage obligations; and $50.4 billion of other consumer or commercial loans. |
| (2) | Mortgage and asset-backed securitizations include VIE debt and equity interests as follows: $1.3 billion of residential mortgages; $2.0 billion of commercial mortgages; $5.3 billion of U.S. agency collateralized mortgage obligations; and $4.9 billion of other consumer or commercial loans. |
| | 198 |
| At December�31, 2012 | ||||||||||||||||||||
| Mortgage�and Asset-Backed Securitizations | Collateralized Debt Obligations | Municipal Tender Option Bonds | Other Structured Financings | Other | ||||||||||||||||
| (dollars�in�millions) | ||||||||||||||||||||
| VIE assets that the Company does not consolidate (unpaid principal balance)(1) | $ | 251,689 | $ | 13,178 | $ | 3,390 | $ | 1,811 | $ | 14,029 | ||||||||||
| Maximum exposure to loss: | ||||||||||||||||||||
| Debt and equity interests(2) | $ | 22,280 | $ | 1,173 | $ | � | $ | 1,053 | $ | 3,387 | ||||||||||
| Derivative and other contracts | 154 | 51 | 2,158 | � | 562 | |||||||||||||||
| Commitments, guarantees and other | 66 | � | � | 679 | 384 | |||||||||||||||
| Total maximum exposure to loss | $ | 22,500 | $ | 1,224 | $ | 2,158 | $ | 1,732 | $ | 4,333 | ||||||||||
| Carrying value of exposure to loss�Assets: | ||||||||||||||||||||
| Debt and equity interests(2) | $ | 22,280 | $ | 1,173 | $ | � | $ | 663 | $ | 3,387 | ||||||||||
| Derivative and other contracts | 156 | 8 | 4 | � | 174 | |||||||||||||||
| Total carrying value of exposure to loss�Assets | $ | 22,436 | $ | 1,181 | $ | 4 | $ | 663 | $ | 3,561 | ||||||||||
| Carrying value of exposure to loss�Liabilities: | ||||||||||||||||||||
| Derivative and other contracts | $ | 11 | $ | 2 | $ | � | $ | � | $ | 172 | ||||||||||
| Commitments, guarantees and other | � | � | � | 12 | � | |||||||||||||||
| Total carrying value of exposure to loss�Liabilities | $ | 11 | $ | 2 | $ | � | $ | 12 | $ | 172 | ||||||||||
| (1) | Mortgage and asset-backed securitizations include VIE assets as follows: $18.3 billion of residential mortgages; $53.8 billion of commercial mortgages; $126.3 billion of U.S. agency collateralized mortgage obligations; and $53.3 billion of other consumer or commercial loans. |
| (2) | Mortgage and asset-backed securitizations include VIE debt and equity interests as follows: $1.0 billion of residential mortgages; $1.5 billion of commercial mortgages; $14.8 billion of U.S. agency collateralized mortgage obligations; and $5.0 billion of other consumer or commercial loans. |
| 199 | |
| | 200 |
| 201 | |
| At December�31, 2013 | ||||||||||||||||||
| Residential Mortgage Loans | Commercial Mortgage Loans | U.S. Agency Collateralized Mortgage Obligations | Credit- Linked Notes and�Other | |||||||||||||||
| (dollars in millions) | ||||||||||||||||||
| SPE assets (unpaid principal balance)(1) | $ | 29,723 | $ | 60,698 | $ | 19,155 | $ | 11,736 | ||||||||||
| Retained interests (fair value): | ||||||||||||||||||
| Investment grade | $ | 1 | $ | 102 | $ | 524 | $ | � | ||||||||||
| Non-investment grade | 136 | 95 | � | 1,319 | ||||||||||||||
| Total retained interests (fair value) | $ | 137 | $ | 197 | $ | 524 | $ | 1,319 | ||||||||||
| Interests purchased in the secondary market (fair value): | ||||||||||||||||||
| Investment grade | $ | 14 | $ | 170 | $ | 21 | $ | 350 | ||||||||||
| Non-investment grade | 41 | 97 | � | 68 | ||||||||||||||
| Total interests purchased in the secondary market (fair�value) | $ | 55 | $ | 267 | $ | 21 | $ | 418 | ||||||||||
| Derivative assets (fair value) | $ | 1 | $ | 672 | $ | � | $ | 121 | ||||||||||
| Derivative liabilities (fair value) | $ | � | $ | 1 | $ | � | $ | 120 | ||||||||||
| (1) | Amounts include assets transferred by unrelated transferors. |
| | 202 |
| At December�31, 2013 | ||||||||||||||||||
| Level�1 | Level�2 | Level�3 | Total | |||||||||||||||
| (dollars in millions) | ||||||||||||||||||
| Retained interests (fair value): | ||||||||||||||||||
| Investment grade | $ | � | $ | 626 | $ | 1 | $ | 627 | ||||||||||
| Non-investment grade | � | 164 | 1,386 | 1,550 | ||||||||||||||
| Total retained interests (fair value) | $ | � | $ | 790 | $ | 1,387 | $ | 2,177 | ||||||||||
| Interests purchased in the secondary market (fair value): | ||||||||||||||||||
| Investment grade | $ | � | $ | 547 | $ | 8 | $ | 555 | ||||||||||
| Non-investment grade | � | 182 | 24 | 206 | ||||||||||||||
| Total interests purchased in the secondary market (fair value) | $ | � | $ | 729 | $ | 32 | $ | 761 | ||||||||||
| Derivative assets (fair value) | $ | � | $ | 615 | $ | 179 | $ | 794 | ||||||||||
| Derivative liabilities (fair value) | $ | � | $ | 110 | $ | 11 | $ | 121 | ||||||||||
| At December�31, 2012 | ||||||||||||||||||
| Residential Mortgage Loans | Commercial Mortgage Loans | U.S. Agency Collateralized Mortgage Obligations | Credit- Linked Notes and�Other | |||||||||||||||
| (dollars in millions) | ||||||||||||||||||
| SPE assets (unpaid principal balance)(1) | $ | 36,750 | $ | 70,824 | $ | 17,787 | $ | 14,701 | ||||||||||
| Retained interests (fair value): | ||||||||||||||||||
| Investment grade | $ | 1 | $ | 77 | $ | 1,468 | $ | � | ||||||||||
| Non-investment grade | 54 | 109 | � | 1,503 | ||||||||||||||
| Total retained interests (fair value) | $ | 55 | $ | 186 | $ | 1,468 | $ | 1,503 | ||||||||||
| Interests purchased in the secondary market (fair value): | ||||||||||||||||||
| Investment grade | $ | 11 | $ | 124 | $ | 99 | $ | 389 | ||||||||||
| Non-investment grade | 113 | 34 | � | 31 | ||||||||||||||
| Total interests purchased in the secondary market (fair�value) | $ | 124 | $ | 158 | $ | 99 | $ | 420 | ||||||||||
| Derivative assets (fair value) | $ | 2 | $ | 948 | $ | � | $ | 177 | ||||||||||
| Derivative liabilities (fair value) | $ | 22 | $ | � | $ | � | $ | 303 | ||||||||||
| (1) | Amounts include assets transferred by unrelated transferors. |
| 203 | |
| At December�31, 2012 | ||||||||||||||||||
| Level�1 | Level�2 | Level�3 | Total | |||||||||||||||
| (dollars in millions) | ||||||||||||||||||
| Retained interests (fair value): | ||||||||||||||||||
| Investment grade | $ | � | $ | 1,476 | $ | 70 | $ | 1,546 | ||||||||||
| Non-investment grade | � | 84 | 1,582 | 1,666 | ||||||||||||||
| Total retained interests (fair value) | $ | � | $ | 1,560 | $ | 1,652 | $ | 3,212 | ||||||||||
| Interests purchased in the secondary market (fair value): | ||||||||||||||||||
| Investment grade | $ | � | $ | 617 | $ | 6 | $ | 623 | ||||||||||
| Non-investment grade | � | 139 | 39 | 178 | ||||||||||||||
| Total interests purchased in the secondary market (fair value) | $ | � | $ | 756 | $ | 45 | $ | 801 | ||||||||||
| Derivative assets (fair value) | $ | � | $ | 774 | $ | 353 | $ | 1,127 | ||||||||||
| Derivative liabilities (fair value) | $ | � | $ | 295 | $ | 30 | $ | 325 | ||||||||||
| | 204 |
| At�December�31,�2013 | At�December�31,�2012 | |||||||||||||||
| Carrying Value of | Carrying Value of | |||||||||||||||
| Assets | Liabilities | Assets | Liabilities | |||||||||||||
| (dollars in millions) | ||||||||||||||||
| Credit-linked notes | $ | 48 | $ | 41 | $ | 283 | $ | 222 | ||||||||
| Equity-linked transactions | 40 | 35 | 422 | 405 | ||||||||||||
| Other | 157 | 156 | 29 | 28 | ||||||||||||
| At December�31, 2013 | ||||||||||||||
| Residential Mortgage Unconsolidated SPEs | Residential Mortgage Consolidated SPEs | Commercial Mortgage Unconsolidated SPEs | ||||||||||||
| (dollars in millions) | ||||||||||||||
| Assets serviced (unpaid principal balance) | $ | 785 | $ | 775 | $ | 4,114 | ||||||||
| Amounts past due 90 days or greater (unpaid principal balance)(1) | $ | 66 | $ | 44 | $ | � | ||||||||
| Percentage of amounts past due 90 days or greater(1) | 8.5 | % | 5.6 | % | � | |||||||||
| Credit losses | $ | 1 | $ | 17 | $ | � | ||||||||
| (1) | Amounts include loans that are at least 90 days contractually delinquent, loans for which the borrower has filed for bankruptcy, loans in foreclosure and real estate owned. |
| 205 | |
| At December�31, 2012 | ||||||||||||||
| Residential Mortgage Unconsolidated SPEs | Residential Mortgage Consolidated SPEs | Commercial Mortgage Unconsolidated SPEs | ||||||||||||
| (dollars in millions) | ||||||||||||||
| Assets serviced (unpaid principal balance) | $ | 821 | $ | 1,141 | $ | 4,760 | ||||||||
| Amounts past due 90 days or greater (unpaid principal balance)(1) | $ | 86 | $ | 43 | $ | � | ||||||||
| Percentage of amounts past due 90 days or greater(1) | 10.4 | % | 3.8 | % | � | |||||||||
| Credit losses | $ | 3 | $ | 2 | $ | � | ||||||||
| (1) | Amounts include loans that are at least 90 days contractually delinquent, loans for which the borrower has filed for bankruptcy, loans in foreclosure and real estate owned. |
| � | Corporate . Corporate loans primarily include commercial and industrial lending used for general corporate purposes, working capital and liquidity, �event-driven� loans and lending commitments and asset-backed lending products. �Event-driven� loans support client merger, acquisition or recapitalization activities. Corporate lending is structured as revolving lines of credit, letter of credit facilities, term loans and bridge loans. Risk factors considered in determining the allowance for corporate loans include the borrower�s financial strength, seniority of the loan, collateral type, volatility of collateral value, debt cushion, covenants, counterparty type and, for lending commitments, the probability of drawdown. |
| � | Consumer . Consumer loans include unsecured loans and securities-based lending that allows clients to borrow money against the value of qualifying securities for any suitable purpose other than purchasing, trading, or carrying securities or refinancing margin debt. The majority of consumer loans are structured as revolving lines of credit and letter of credit facilities and are primarily offered through the Company�s Portfolio Loan Account program. The allowance methodology for unsecured loans considers the specific attributes of the loan as well as the borrower�s source of repayment. The allowance methodology for securities-based lending considers the collateral type underlying the loan ( e.g. , diversified securities, concentrated securities or restricted stock). |
| � | Residential Real Estate . Residential real estate loans mainly include non-conforming loans and home equity lines of credit. The allowance methodology for non-conforming residential mortgage loans considers several factors, including, but not limited to, loan-to-value ratio, FICO score, home price index, and delinquency status. The methodology for home equity lines of credit considers credit limits and utilization rates in addition to the factors considered for non-conforming residential mortgages. |
| � | Wholesale Real Estate . Wholesale real estate loans include owner-occupied loans and income-producing loans. The principal risk factors for determining the allowance for wholesale real estate loans are the underlying collateral type, loan-to-value ratio and debt service ratio. |
| | 206 |
| December�31, 2013 | December�31, 2012 | |||||||||||||||||||||||
| Loans by Product Type | Loans�Held For Investment | Loans�Held For Sale | Total�Loans | Loans�Held For Investment | Loans�Held For Sale | Total�Loans | ||||||||||||||||||
| (dollars in millions) | ||||||||||||||||||||||||
| Corporate loans | $ | 13,263 | $ | 6,168 | $ | 19,431 | $ | 9,449 | $ | 4,987 | $ | 14,436 | ||||||||||||
| Consumer loans | 11,577 | � | 11,577 | 7,618 | � | 7,618 | ||||||||||||||||||
| Residential real estate loans | 10,006 | 112 | 10,118 | 6,630 | 142 | 6,772 | ||||||||||||||||||
| Wholesale real estate loans | 1,855 | 49 | 1,904 | 326 | � | 326 | ||||||||||||||||||
| Total loans, gross of allowance for loan losses | 36,701 | 6,329 | 43,030 | 24,023 | 5,129 | 29,152 | ||||||||||||||||||
| Allowance for loan losses | (156 | ) | � | (156 | ) | (106 | ) | � | (106 | ) | ||||||||||||||
| Total loans, net of allowance for loan losses(1)(2) | $ | 36,545 | $ | 6,329 | $ | 42,874 | $ | 23,917 | $ | 5,129 | $ | 29,046 | ||||||||||||
| (1) | Amounts include loans that are made to foreign borrowers of $4,729 million and $4,531 million at December�31, 2013 and December�31, 2012, respectively. |
| (2) | See Note 13 for further information related to unfunded lending commitments. |
| � | Pass . A credit exposure rated pass has a continued expectation of timely repayment, all obligations of the borrower are current, and the obligor complies with material terms and conditions of the lending agreement. |
| 207 | |
| � | Special Mention . Extensions of credit that have potential weakness that deserve management�s close attention, and if left uncorrected may, at some future date, result in the deterioration of the repayment prospects or collateral position. |
| � | Substandard . Obligor has a well-defined weakness that jeopardizes the repayment of the debt and has a high probability of payment default with the distinct possibility that the Company will sustain some loss if noted deficiencies are not corrected. |
| � | Doubtful . Inherent weakness in the exposure makes the collection or repayment in full, based on existing facts, conditions and circumstances, highly improbable, and the amount of loss is uncertain. |
| � | Loss . Extensions of credit classified as loss are considered uncollectible and are charged off. |
| December�31, 2013 | ||||||||||||||||||||
| Loans by Credit Quality Indicators | Corporate | Consumer | Residential Real� Estate | Wholesale Real� Estate | Total | |||||||||||||||
| (dollars in millions) | ||||||||||||||||||||
| Pass | $ | 12,893 | $ | 11,577 | $ | 9,992 | $ | 1,829 | $ | 36,291 | ||||||||||
| Special Mention | 189 | � | � | 16 | 205 | |||||||||||||||
| Substandard | 174 | � | 14 | � | 188 | |||||||||||||||
| Doubtful | 7 | � | � | 10 | 17 | |||||||||||||||
| Loss | � | � | � | � | � | |||||||||||||||
| Total loans | $ | 13,263 | $ | 11,577 | $ | 10,006 | $ | 1,855 | $ | 36,701 | ||||||||||
| December 31, 2012 | ||||||||||||||||||||
| Loans by Credit Quality Indicators | Corporate | Consumer | Residential Real Estate | Wholesale Real� Estate | Total | |||||||||||||||
| (dollars in millions) | ||||||||||||||||||||
| Pass | $ | 9,410 | $ | 7,618 | $ | 6,629 | $ | 302 | $ | 23,959 | ||||||||||
| Special Mention | 6 | � | � | 24 | 30 | |||||||||||||||
| Substandard | 7 | � | 1 | � | 8 | |||||||||||||||
| Doubtful | 26 | � | � | � | 26 | |||||||||||||||
| Loss | � | � | � | � | � | |||||||||||||||
| Total loans | $ | 9,449 | $ | 7,618 | $ | 6,630 | $ | 326 | $ | 24,023 | ||||||||||
| | 208 |
| December�31, 2013 | ||||||||||||||||||||
| Loans by Product Type | Corporate | Consumer | Residential Real Estate | Wholesale Real� Estate | Total | |||||||||||||||
| (dollars in millions) | ||||||||||||||||||||
| Impaired loans with allowance | $ | 63 | $ | � | $ | � | $ | 10 | $ | 73 | ||||||||||
| Impaired loans without allowance(1) | 6 | � | 11 | � | 17 | |||||||||||||||
| Impaired loans unpaid principal balance | 69 | � | 11 | 10 | 90 | |||||||||||||||
| Past due 90 days loans and on nonaccrual | 7 | � | 11 | 10 | 28 | |||||||||||||||
| December�31, 2012 | ||||||||||||||||||||
| Loans by Product Type | Corporate | Consumer | Residential Real� Estate | Wholesale Real� Estate | Total | |||||||||||||||
| (dollars in millions) | ||||||||||||||||||||
| Impaired loans with allowance | $ | 19 | $ | � | $ | 1 | $ | � | $ | 20 | ||||||||||
| Impaired loans without allowance(1) | 14 | � | � | � | 14 | |||||||||||||||
| Impaired loans unpaid principal balance | 33 | � | 1 | � | 34 | |||||||||||||||
| Past due 90 days loans and on nonaccrual | 25 | � | 1 | � | 26 | |||||||||||||||
| December�31, 2013 | ||||||||||||||||||||
| Loans by Region | Americas | EMEA | Asia | Others | Total | |||||||||||||||
| (dollars in millions) | ||||||||||||||||||||
| Impaired loans | $ | 90 | $ | � | $ | � | $ | � | $ | 90 | ||||||||||
| Past due 90 days loans and on nonaccrual | 28 | � | � | � | 28 | |||||||||||||||
| Allowance for loan losses | 123 | 28 | 3 | 2 | 156 | |||||||||||||||
| December�31, 2012 | ||||||||||||||||||||
| Loans by Region | Americas | EMEA | Asia | Others | Total | |||||||||||||||
| (dollars in millions) | ||||||||||||||||||||
| Impaired loans | $ | 34 | $ | � | $ | � | $ | � | $ | 34 | ||||||||||
| Past due 90 days loans and on nonaccrual | 26 | � | � | � | 26 | |||||||||||||||
| Allowance for loan losses | 52 | 52 | 2 | � | 106 | |||||||||||||||
| (1) | At December 31, 2013 and 2012, no allowance was outstanding for these loans as the fair value of the collateral held exceeded or�equaled the carrying value. |
| 209 | |
| Corporate | Consumer | Residential Real�Estate | Wholesale Real�Estate | Total | ||||||||||||||||
| (dollars in millions) | ||||||||||||||||||||
| Allowance for loan losses: | ||||||||||||||||||||
| Balance at December 31, 2012 | $ | 96 | $ | 3 | $ | 5 | $ | 2 | $ | 106 | ||||||||||
| Gross charge-offs | (13 | ) | � | (2 | ) | � | (15 | ) | ||||||||||||
| Gross recoveries | � | � | � | � | � | |||||||||||||||
| Net charge-offs | (13 | ) | � | (2 | ) | � | (15 | ) | ||||||||||||
| Provision for loan losses(1) | 54 | (2 | ) | 1 | 12 | 65 | ||||||||||||||
| Balance at December 31, 2013 | $ | 137 | $ | 1 | $ | 4 | $ | 14 | $ | 156 | ||||||||||
| Allowance for loan losses by impairment methodology: | ||||||||||||||||||||
| Inherent | $ | 126 | $ | 1 | $ | 4 | $ | 10 | $ | 141 | ||||||||||
| Specific | 11 | � | � | 4 | 15 | |||||||||||||||
| Total allowance for loan losses at December 31, 2013 | $ | 137 | $ | 1 | $ | 4 | $ | 14 | $ | 156 | ||||||||||
| Loans evaluated by impairment methodology(2): | ||||||||||||||||||||
| Inherent | $ | 13,194 | $ | 11,577 | $ | 9,995 | $ | 1,845 | $ | 36,611 | ||||||||||
| Specific | 69 | � | 11 | 10 | 90 | |||||||||||||||
| Total loans evaluated at December�31, 2013 | $ | 13,263 | $ | 11,577 | $ | 10,006 | $ | 1,855 | $ | 36,701 | ||||||||||
| Allowance for lending-related commitments: | ||||||||||||||||||||
| Balance at December 31, 2012 | $ | 91 | $ | � | $ | � | $ | 1 | $ | 92 | ||||||||||
| Provision for lending-related commitments(3) | 44 | � | � | 1 | 45 | |||||||||||||||
| Other | (10 | ) | � | � | � | (10 | ) | |||||||||||||
| Balance at December�31, 2013 | $ | 125 | $ | � | $ | � | $ | 2 | $ | 127 | ||||||||||
| Allowance for lending-related commitments by impairment methodology: | ||||||||||||||||||||
| Inherent | $ | 125 | $ | � | $ | � | $ | 2 | $ | 127 | ||||||||||
| Specific | � | � | � | � | � | |||||||||||||||
| Total allowance for lending-related commitments at December 31, 2013 | $ | 125 | $ | � | $ | � | $ | 2 | $ | 127 | ||||||||||
| Lending-related commitments evaluated by impairment methodology: | ||||||||||||||||||||
| Inherent | $ | 63,427 | $ | 2,151 | $ | 1,423 | $ | 207 | $ | 67,208 | ||||||||||
| Specific | � | � | � | � | � | |||||||||||||||
| Total lending-related commitments evaluated at December 31, 2013 | $ | 63,427 | $ | 2,151 | $ | 1,423 | $ | 207 | $ | 67,208 | ||||||||||
| (1) | The Company recorded $65 million of provision for loan losses within Other revenues for the year ended December�31, 2013. |
| (2) | Balances are gross of the allowance and represent recorded investment in the loans. |
| (3) | The Company recorded $45 million of provision for lending-related commitments within Other non-interest expenses for the year ended December�31, 2013. |
| | 210 |
| Corporate | Consumer | Residential Real�Estate | Wholesale Real�Estate | Total | ||||||||||||||||||
| (dollars in millions) | ||||||||||||||||||||||
| Allowance for loan losses: | ||||||||||||||||||||||
| Balance at December 31, 2011 | $ | 14 | $ | 1 | $ | 1 | $ | 1 | $ | 17 | ||||||||||||
| Gross charge-offs | (11 | ) | � | � | � | (11 | ) | |||||||||||||||
| Gross recoveries | � | � | � | 13 | 13 | |||||||||||||||||
| Net charge-offs | (11 | ) | � | � | 13 | 2 | ||||||||||||||||
| Provision for loan losses(1) | 93 | 2 | 4 | (12 | ) | 87 | ||||||||||||||||
| Balance at December 31, 2012 | $ | 96 | $ | 3 | $ | 5 | $ | 2 | $ | 106 | ||||||||||||
| Allowance for loan losses by impairment methodology: | ||||||||||||||||||||||
| Inherent | $ | 94 | $ | 3 | $ | 5 | $ | 2 | $ | 104 | ||||||||||||
| Specific | 2 | � | � | � | 2 | |||||||||||||||||
| Total allowance for loan losses at December 31, 2012 | $ | 96 | $ | 3 | $ | 5 | $ | 2 | $ | 106 | ||||||||||||
| Loans evaluated by impairment methodology(2): | ||||||||||||||||||||||
| Inherent | $ | 9,416 | $ | 7,618 | $ | 6,629 | $ | 326 | $ | 23,989 | ||||||||||||
| Specific | 33 | � | 1 | � | 34 | |||||||||||||||||
| Total loan evaluated at December 31, 2012 | $ | 9,449 | $ | 7,618 | $ | 6,630 | $ | 326 | $ | 24,023 | ||||||||||||
| Allowance for lending-related commitments: | ||||||||||||||||||||||
| Balance at December 31, 2011 | $ | 19 | $ | 3 | $ | � | $ | 2 | $ | 24 | ||||||||||||
| Provision for lending-related commitments(3) | 72 | (3 | ) | � | (1 | ) | 68 | |||||||||||||||
| Balance at December 31, 2012 | $ | 91 | $ | � | $ | � | $ | 1 | $ | 92 | ||||||||||||
| Allowance for lending-related commitments by impairment methodology: | ||||||||||||||||||||||
| Inherent | $ | 87 | $ | � | $ | � | $ | 1 | $ | 88 | ||||||||||||
| Specific | 4 | � | � | � | 4 | |||||||||||||||||
| Total allowance for lending-related commitments at December�31, 2012 | $ | 91 | $ | � | $ | � | $ | 1 | $ | 92 | ||||||||||||
| Lending-related commitments evaluated by impairment methodology: | ||||||||||||||||||||||
| Inherent | $ | 44,079 | $ | 1,406 | $ | 712 | $ | 101 | $ | 46,298 | ||||||||||||
| Specific | 47 | � | � | � | 47 | |||||||||||||||||
| Total lending-related commitments evaluated at December�31, 2012 | $ | 44,126 | $ | 1,406 | $ | 712 | $ | 101 | $ | 46,345 | ||||||||||||
| (1) | The Company recorded $87 million of provision for loan losses within Other revenues for the year ended December�31, 2012. |
| (2) | Balances are gross of the allowance and represent recorded investment in the loans. |
| (3) | The Company recorded $67 million of provision for lending-related commitments within Other non-interest expenses for the year ended December�31, 2012. |
| 211 | |
| | 212 |
| Institutional Securities(1) | Wealth Management(1) | Investment Management | Total | |||||||||||||
| (dollars in millions) | ||||||||||||||||
| Goodwill at December�31, 2011(2) | $ | 343 | $ | 5,603 | $ | 740 | $ | 6,686 | ||||||||
| Foreign currency translation adjustments and other | (6 | ) | 35 | � | 29 | |||||||||||
| Goodwill disposed of during the period(3) | � | (65 | ) | � | (65 | ) | ||||||||||
| Goodwill at December�31, 2012(2) | $ | 337 | $ | 5,573 | $ | 740 | $ | 6,650 | ||||||||
| Foreign currency translation adjustments and other | (27 | ) | � | � | (27 | ) | ||||||||||
| Goodwill disposed of during the period(4)(5) | (17 | ) | (11 | ) | � | (28 | ) | |||||||||
| Goodwill at December�31, 2013(2) | $ | 293 | $ | 5,562 | $ | 740 | $ | 6,595 | ||||||||
| (1) | On January�1, 2013, the International Wealth Management business was transferred from the Wealth Management business segment to the Equity division within the Institutional Securities business segment. Accordingly, prior period amounts have been recast to reflect the International Wealth Management business as part of the Institutional Securities business segment. |
| (2) | The amount of the Company�s goodwill before accumulated impairments of $700 million, which included $673 million related to the Institutional Securities business segment and $27 million related to the Investment Management business segment, was $7,295 million and $7,350 million at December�31, 2013 and December�31, 2012, respectively. |
| (3) | The Wealth Management business segment activity represents goodwill disposed of in connection with the sale of Quilter (see Note 1). |
| (4) | In 2011, the Company announced that it had reached an agreement with the employees of its in-house quantitative proprietary trading unit, Process Driven Trading (�PDT�), within the Institutional Securities business segment, whereby PDT employees will acquire certain assets from the Company and launch an independent advisory firm. This transaction closed on January�1, 2013. |
| (5) | The Wealth Management business segment sold the U.K. operations of the Global Stock Plan Services business on May�31, 2013. |
| 213 | |
| Institutional Securities | Wealth Management | Investment Management | Total | |||||||||||||
| (dollars in millions) | ||||||||||||||||
| Amortizable net intangible assets at December�31, 2011 | $ | 229 | $ | 3,641 | $ | 2 | $ | 3,872 | ||||||||
| Mortgage servicing rights (see Note 7) | 122 | 11 | � | 133 | ||||||||||||
| Indefinite-lived intangible assets (see Note 2) | � | 280 | � | 280 | ||||||||||||
| Net intangible assets at December�31, 2011 | $ | 351 | $ | 3,932 | $ | 2 | $ | 4,285 | ||||||||
| Amortizable net intangible assets at December�31, 2011 | $ | 229 | $ | 3,641 | $ | 2 | $ | 3,872 | ||||||||
| Foreign currency translation adjustments and other | 5 | 1 | � | 6 | ||||||||||||
| Amortization expense | (17 | ) | (322 | ) | (1 | ) | (340 | ) | ||||||||
| Impairment losses(1) | (4 | ) | � | � | (4 | ) | ||||||||||
| Increase due to Smith Barney tradename(2) | � | 280 | � | 280 | ||||||||||||
| Intangible assets acquired during the period | 4 | � | � | 4 | ||||||||||||
| Intangible assets disposed of during the period(3) | (42 | ) | � | � | (42 | ) | ||||||||||
| Amortizable net intangible assets at December�31, 2012 | $ | 175 | $ | 3,600 | $ | 1 | $ | 3,776 | ||||||||
| Mortgage servicing rights (see Note 7) | � | 7 | � | 7 | ||||||||||||
| Net intangible assets at December�31, 2012 | $ | 175 | $ | 3,607 | $ | 1 | $ | 3,783 | ||||||||
| Amortizable net intangible assets at December�31, 2012 | $ | 175 | $ | 3,600 | $ | 1 | $ | 3,776 | ||||||||
| Foreign currency translation adjustments and other | � | (1 | ) | � | (1 | ) | ||||||||||
| Amortization expense(4) | (117 | ) | (336 | ) | � | (453 | ) | |||||||||
| Impairment losses(1)(5) | (2 | ) | (42 | ) | � | (44 | ) | |||||||||
| Amortizable net intangible assets at December�31, 2013 | 56 | 3,221 | 1 | 3,278 | ||||||||||||
| Mortgage servicing rights (see Note 7) | � | 8 | � | 8 | ||||||||||||
| Net intangible assets at December�31, 2013 | $ | 56 | $ | 3,229 | $ | 1 | $ | 3,286 | ||||||||
| (1) | Impairment losses are recorded within Other expenses in the consolidated statements of income. |
| (2) | The Wealth Management business segment activity represents the reclassification of $280 million from an indefinite-lived to a finite-lived intangible asset (see Note 2). |
| (3) | The Institutional Securities business segment activity represents intangible assets disposed of in connection with the sale of a principal investment. |
| (4) | The Institutional Securities business segment activity primarily represents accelerated recovery of related intangible costs. |
| (5) | The Wealth Management business segment activity primarily represents an impairment charge related to management contracts associated with alternative investment funds. |
| At December�31, 2013 | At December�31, 2012 | |||||||||||||||
| Gross Carrying Amount | Accumulated Amortization | Gross Carrying Amount | Accumulated Amortization | |||||||||||||
| (dollars in millions) | ||||||||||||||||
| Amortizable intangible assets: | ||||||||||||||||
| Trademarks | $ | 7 | $ | 3 | $ | 7 | $ | 3 | ||||||||
| Tradename | 280 | 12 | 280 | 2 | ||||||||||||
| Customer relationships | 4,058 | 1,177 | 4,058 | 923 | ||||||||||||
| Management contracts | 268 | 146 | 313 | 116 | ||||||||||||
| Research | 176 | 176 | 176 | 126 | ||||||||||||
| Other | 192 | 189 | 192 | 80 | ||||||||||||
| Total amortizable intangible assets | $ | 4,981 | $ | 1,703 | $ | 5,026 | $ | 1,250 | ||||||||
| | 214 |
| At December� 31, 2013(1) | At December� 31, 2012(1) | |||||||
| (dollars in millions) | ||||||||
| Savings and demand deposits(2) | $ | 109,908 | $ | 80,058 | ||||
| Time deposits(3) | 2,471 | 3,208 | ||||||
| Total | $ | 112,379 | $ | 83,266 | ||||
| (1) | Total deposits subject to the Federal Deposit Insurance Corporation (the �FDIC�) at December�31, 2013 and December�31, 2012 were $84 billion and $62 billion, respectively. |
| (2) | Amounts include non-interest bearing deposits of $1,037 million at December�31, 2012. There were no non-interest bearing deposits at December�31, 2013. |
| (3) | Certain time deposit accounts are carried at fair value under the fair value option (see Note 4). |
| December�
31, 2013 | December�
31, 2012 | |||||||
| (dollars in millions) | ||||||||
| Commercial Paper: | ||||||||
| Balance at period-end | $ | 8 | $ | 306 | ||||
| Average balance(1) | $ | 155 | $ | 479 | ||||
| Weighted average interest rate on period-end balance(2) | 10.4 | % | 10.1 | % | ||||
| Other Short-Term Borrowings(3)(4): | ||||||||
| Balance at period-end | $ | 2,134 | $ | 1,832 | ||||
| Average balance(1) | $ | 1,872 | $ | 1,461 | ||||
| (1) | Average balances are calculated based upon weekly balances. |
| (2) | The weighted average interest rates at December�31, 2013 and 2012 were driven primarily by commercial paper issued in a foreign country in which typical funding rates are significantly higher than in the U.S. |
| (3) | These borrowings included bank loans, bank notes and structured notes with original maturities of 12 months or less. |
| (4) | Certain structured short-term borrowings are carried at fair value under the fair value option. See Note 4 for additional information. |
| 215 | |
| Parent Company | Subsidiaries | At December� 31, 2013(3)(4) | At December� 31, 2012 | |||||||||||||||||||||
| Fixed Rate | Variable Rate(1)(2) | Fixed Rate | Variable Rate(1)(2) | |||||||||||||||||||||
| Due in 2013 | $ | � | $ | � | $ | � | $ | � | $ | � | $ | 25,303 | ||||||||||||
| Due in 2014 | 11,665 | 10,830 | 18 | 1,680 | 24,193 | 21,751 | ||||||||||||||||||
| Due in 2015 | 13,962 | 5,760 | 17 | 1,351 | 21,090 | 24,653 | ||||||||||||||||||
| Due in 2016 | 11,521 | 9,621 | 43 | 1,959 | 23,144 | 19,984 | ||||||||||||||||||
| Due in 2017 | 16,227 | 8,231 | 18 | 1,819 | 26,295 | 28,137 | ||||||||||||||||||
| Due in 2018 | 10,689 | 2,886 | 18 | 1,715 | 15,308 | 7,733 | ||||||||||||||||||
| Thereafter | 34,748 | 7,165 | 440 | 1,192 | 43,545 | 42,010 | ||||||||||||||||||
| Total | $ | 98,812 | $ | 44,493 | $ | 554 | $ | 9,716 | $ | 153,575 | $ | 169,571 | ||||||||||||
| Weighted average coupon at period-end(5) | 5.1 | % | 1.0 | % | 6.5 | % | 0.7 | % | 4.4 | % | 4.4 | % | ||||||||||||
| (1) | Variable rate borrowings bear interest based on a variety of money market indices, including LIBOR and Federal Funds rates. |
| (2) | Amounts include borrowings that are equity-linked, credit-linked, commodity-linked or linked to some other index. |
| (3) | Amounts include an increase of approximately $2.2 billion at December�31, 2013, to the carrying amount of certain of the Company�s long-term borrowings associated with fair value hedges. The increase to the carrying value associated with fair value hedges by year due was approximately less than $0.1 billion due in 2014, $0.4 billion due in 2015, $0.5 billion due in 2016, $1.0 billion due in 2017, $0.3 billion due in 2018 and $(0.1) billion due thereafter. |
| (4) | Amounts include an increase of approximately $2.4 billion at December�31, 2013 to the carrying amounts of certain of the Company�s long-term borrowings for which the fair value option was elected (see Note 4). |
| (5) | Weighted average coupon was calculated utilizing U.S. and non-U.S. dollar interest rates and excludes financial instruments for which the fair value option was elected. |
| At�December�31, 2013 | At�December�31, 2012 | |||||||
| (dollars in millions) | ||||||||
| Senior debt | $ | 139,451 | $ | 158,899 | ||||
| Subordinated debt | 9,275 | 5,845 | ||||||
| Junior subordinated debentures | 4,849 | 4,827 | ||||||
| Total | $ | 153,575 | $ | 169,571 | ||||
| | 216 |
| 2013 | 2012 | 2011 | ||||||||||
| Weighted average coupon of long-term borrowings at period-end(1) | 4.4 | % | 4.4 | % | 4.0 | % | ||||||
| Effective average borrowing rate for long-term borrowings after swaps at period-end(1) | 2.2 | % | 2.3 | % | 1.9 | % | ||||||
| (1) | Included in the weighted average and effective average calculations are non-U.S. dollar interest rates. |
| 217 | |
| At December�31, 2013 | At December�31, 2012 | |||||||
| (dollars in millions) | ||||||||
| Secured financings with original maturities greater than one year | $ | 9,750 | $ | 14,431 | ||||
| Secured financings with original maturities one year or less(1) | 4,233 | 641 | ||||||
| Failed sales(2) | 232 | 655 | ||||||
| Total(3) | $ | 14,215 | $ | 15,727 | ||||
| (1) | At December�31, 2013, amount includes approximately $3,899 million of variable rate financings and approximately $334 million in fixed rate financings. |
| (2) | For more information on failed sales, see Note 7. |
| (3) | Amounts include $5,206 million and $9,466 million at fair value at December�31, 2013 and December�31, 2012, respectively. |
| Fixed Rate | Variable Rate(1)(2) | At December�31, 2013 | At December�31, 2012 | |||||||||||||
| (dollars�in�millions) | ||||||||||||||||
| Due in 2013 | $ | � | $ | � | $ | � | $ | 8,528 | ||||||||
| Due in 2014 | 466 | 3,034 | 3,500 | 2,868 | ||||||||||||
| Due in 2015 | 29 | 1,877 | 1,906 | 960 | ||||||||||||
| Due in 2016 | 216 | 2,726 | 2,942 | 429 | ||||||||||||
| Due in 2017 | � | 160 | 160 | 181 | ||||||||||||
| Due in 2018 | � | 675 | 675 | 667 | ||||||||||||
| Thereafter | 229 | 338 | 567 | 798 | ||||||||||||
| Total | $ | 940 | $ | 8,810 | $ | 9,750 | $ | 14,431 | ||||||||
| Weighted average coupon rate at period-end(3) | 2.4 | % | 1.3 | % | 1.4 | % | 1.4 | % | ||||||||
| (1) | Variable rate borrowings bear interest based on a variety of indices, including LIBOR. |
| (2) | Amounts include borrowings that are equity-linked, credit-linked, commodity-linked or linked to some other index. |
| (3) | Weighted average coupon was calculated utilizing U.S. and non-U.S. dollar interest rates and excludes secured financings that are linked to non-interest indices. |
| | 218 |
| At December�31, 2013 | At December�31, 2012 | |||||||
| (dollars�in�millions) | ||||||||
| Due in 2013 | $ | � | $ | 479 | ||||
| Due in 2014 | 100 | 17 | ||||||
| Due in 2015 | 57 | 7 | ||||||
| Due in 2016 | 36 | 136 | ||||||
| Due in 2017 | 24 | 14 | ||||||
| Due in 2018 | � | � | ||||||
| Thereafter | 15 | 2 | ||||||
| Total | $ | 232 | $ | 655 | ||||
| 219 | |
| At December�31, 2013 | ||||||||||||||||||||||||
| Gross�Amounts(1) | Amounts�Offset in�the Consolidated Statements� of Financial Condition(2) | Net�Amounts Presented�in�the Consolidated Statements� of Financial Condition | Amounts�Not�Offset�in�the Consolidated�Statements�of� Financial Condition(3) | Net�Exposure | ||||||||||||||||||||
| Financial Instruments Collateral | Other�Cash Collateral | |||||||||||||||||||||||
| (dollars in millions) | ||||||||||||||||||||||||
| Derivative assets | ||||||||||||||||||||||||
| Bilateral OTC | $ | 404,352 | $ | (378,459 | ) | $ | 25,893 | $ | (8,785 | ) | $ | (132 | ) | $ | 16,976 | |||||||||
| Cleared OTC(4) | 267,057 | (266,419 | ) | 638 | � | � | 638 | |||||||||||||||||
| Exchange traded | 31,609 | (25,673 | ) | 5,936 | � | � | 5,936 | |||||||||||||||||
| Total derivative assets | $ | 703,018 | $ | (670,551 | ) | $ | 32,467 | $ | (8,785 | ) | $ | (132 | ) | $ | 23,550 | |||||||||
| Derivative liabilities | ||||||||||||||||||||||||
| Bilateral OTC | $ | 386,199 | $ | (361,059 | ) | $ | 25,140 | $ | (5,365 | ) | $ | (136 | ) | $ | 19,639 | |||||||||
| Cleared OTC(4) | 266,559 | (265,378 | ) | 1,181 | � | (372 | ) | 809 | ||||||||||||||||
| Exchange traded | 33,113 | (25,673 | ) | 7,440 | (651 | ) | � | 6,789 | ||||||||||||||||
| Total derivative liabilities | $ | 685,871 | $ | (652,110 | ) | $ | 33,761 | $ | (6,016 | ) | $ | (508 | ) | $ | 27,237 | |||||||||
| (1) | Amounts include $8.7 billion of derivative assets and $7.3 billion of derivative liabilities, which are either not subject to master netting agreements or collateral agreements or are subject to such agreements but the Company has not determined the agreements to be legally enforceable. See also �Fair Value and Notional of Derivative Instruments� for additional disclosure about gross fair values and notionals for derivative instruments by risk type. |
| (2) | Amounts relate to master netting agreements and collateral agreements, which have been determined by the Company to be legally enforceable in the event of default and where certain other criteria are met in accordance with applicable offsetting accounting guidance. |
| (3) | Amounts relate to master netting agreements and collateral agreements, which have been determined by the Company to be legally enforceable in the event of default but where certain other criteria are not met in accordance with applicable offsetting accounting guidance. |
| (4) | Amounts include OTC derivatives that are centrally cleared in accordance with certain regulatory requirements. |
| At December�31, 2012 | ||||||||||||||||||||||||
| Gross�Amounts(1) | Amounts�Offset in�the Consolidated Statements� of Financial Condition(2) | Net�Amounts Presented�in�the Consolidated Statements� of Financial Condition | Amounts�Not�Offset�in�the Consolidated�Statements�of Financial� Condition(3) | Net Exposure | ||||||||||||||||||||
| Financial Instruments Collateral | Other�Cash Collateral | |||||||||||||||||||||||
| (dollars in millions) | ||||||||||||||||||||||||
| Derivative assets | ||||||||||||||||||||||||
| Bilateral OTC | $ | 604,713 | $ | (573,844 | ) | $ | 30,869 | $ | (7,691 | ) | $ | (232 | ) | $ | 22,946 | |||||||||
| Cleared OTC(4) | 375,233 | (374,546 | ) | 687 | � | � | 687 | |||||||||||||||||
| Exchange traded | 24,305 | (19,664 | ) | 4,641 | � | � | 4,641 | |||||||||||||||||
| Total derivative assets | $ | 1,004,251 | $ | (968,054 | ) | $ | 36,197 | $ | (7,691 | ) | $ | (232 | ) | $ | 28,274 | |||||||||
| Derivative Liabilities | ||||||||||||||||||||||||
| Bilateral OTC | $ | 578,018 | $ | (547,285 | ) | $ | 30,733 | $ | (7,871 | ) | $ | (64 | ) | $ | 22,798 | |||||||||
| Cleared OTC(4) | 374,960 | (374,866 | ) | 94 | � | (23 | ) | 71 | ||||||||||||||||
| Exchange traded | 25,795 | (19,664 | ) | 6,131 | (1,028 | ) | � | 5,103 | ||||||||||||||||
| Total derivative liabilities | $ | 978,773 | $ | (941,815 | ) | $ | 36,958 | $ | (8,899 | ) | $ | (87 | ) | $ | 27,972 | |||||||||
| | 220 |
| (1) | Amounts include $7.2 billion of derivative assets and $7.3 billion of derivative liabilities, which are either not subject to master netting agreements or collateral agreements or are subject to such agreements but the Company has not determined the agreements to be legally enforceable. See also �Fair Value and Notional of Derivative Instruments� for additional disclosure about gross fair values and notionals for derivative instruments by risk type. |
| (2) | Amounts relate to master netting agreements and collateral agreements, which have been determined by the Company to be legally enforceable in the event of default and where certain other criteria are met in accordance with applicable offsetting accounting guidance. |
| (3) | Amounts relate to master netting agreements and collateral agreements, which have been determined by the Company to be legally enforceable in the event of default but where certain other criteria are not met in accordance with applicable offsetting accounting guidance. |
| (4) | Amounts include OTC derivatives that are centrally cleared in accordance with certain regulatory requirements. |
| Years�to�Maturity | Cross- Maturity�and Cash� Collateral Netting(3) | Net�Exposure Post-Cash Collateral | Net�Exposure Post- Collateral | |||||||||||||||||||||||||
| Credit Rating(2) | Less�than�1 | 1-3 | 3-5 | Over�5 | ||||||||||||||||||||||||
| (dollars�in�millions) | ||||||||||||||||||||||||||||
| AAA | $ | 300 | $ | 752 | $ | 1,073 | $ | 3,664 | $ | (3,721 | ) | $ | 2,068 | $ | 1,673 | |||||||||||||
| AA | 2,687 | 3,145 | 3,377 | 9,791 | (13,515 | ) | 5,485 | 3,927 | ||||||||||||||||||||
| A | 7,382 | 8,428 | 9,643 | 17,184 | (35,644 | ) | 6,993 | 4,970 | ||||||||||||||||||||
| BBB | 2,617 | 3,916 | 3,228 | 13,693 | (16,191 | ) | 7,263 | 4,870 | ||||||||||||||||||||
| Non-investment grade | 2,053 | 2,980 | 1,372 | 2,922 | (4,737 | ) | 4,590 | 2,174 | ||||||||||||||||||||
| Total | $ | 15,039 | $ | 19,221 | $ | 18,693 | $ | 47,254 | $ | (73,808 | ) | $ | 26,399 | $ | 17,614 | |||||||||||||
| (1) | Fair values shown represent the Company�s net exposure to counterparties related to the Company�s OTC derivative products. Amounts include centrally cleared OTC derivatives. The table does not include exchange-traded derivatives and the effect of any related hedges utilized by the Company. |
| (2) | Obligor credit ratings are determined by the Company�s Credit Risk Management Department. |
| (3) | Amounts represent the netting of receivable balances with payable balances for the same counterparty across maturity categories. Receivable and payable balances with the same counterparty in the same maturity category are netted within such maturity category, where appropriate. Cash collateral received is netted on a counterparty basis, provided legal right of offset exists. |
| 221 | |
| Years�to�Maturity | Cross- Maturity and Cash Collateral Netting(3) | Net�Exposure Post-Cash Collateral | Net�Exposure Post-Collateral | |||||||||||||||||||||||||
| Credit Rating(2) | Less�than�1 | 1-3 | 3-5 | Over 5 | ||||||||||||||||||||||||
| (dollars in millions) | ||||||||||||||||||||||||||||
| AAA | $ | 353 | $ | 551 | $ | 1,299 | $ | 6,121 | $ | (4,851 | ) | $ | 3,473 | $ | 3,088 | |||||||||||||
| AA | 2,125 | 3,635 | 2,958 | 10,270 | (12,761 | ) | 6,227 | 4,428 | ||||||||||||||||||||
| A | 6,643 | 9,596 | 14,228 | 29,729 | (50,722 | ) | 9,474 | 7,638 | ||||||||||||||||||||
| BBB | 2,673 | 3,970 | 3,704 | 18,586 | (21,713 | ) | 7,220 | 5,754 | ||||||||||||||||||||
| Non-investment grade | 2,091 | 2,855 | 2,142 | 4,538 | (6,696 | ) | 4,930 | 2,725 | ||||||||||||||||||||
| Total | $ | 13,885 | $ | 20,607 | $ | 24,331 | $ | 69,244 | $ | (96,743 | ) | $ | 31,324 | $ | 23,633 | |||||||||||||
| (1) | Fair values shown represent the Company�s net exposure to counterparties related to the Company�s OTC derivative products. Amounts include centrally cleared OTC derivatives. The table does not include exchange-traded derivatives and the effect of any related hedges utilized by the Company. |
| (2) | Obligor credit ratings are determined by the Company�s Credit Risk Management Department. |
| (3) | Amounts represent the netting of receivable balances with payable balances for the same counterparty across maturity categories. Receivable and payable balances with the same counterparty in the same maturity category are netted within such maturity category, where appropriate. Cash collateral received is netted on a counterparty basis, provided legal right of offset exists. |
| | 222 |
| 223 | |
| Derivative Assets | ||||||||||||||||||||||||||||||||
| At December�31, 2013 | ||||||||||||||||||||||||||||||||
| Fair�Value | Notional | |||||||||||||||||||||||||||||||
| Bilateral�OTC | Cleared OTC(1) | Exchange Traded | Total | Bilateral�OTC | Cleared OTC(1) | Exchange Traded | Total | |||||||||||||||||||||||||
| (dollars in millions) | ||||||||||||||||||||||||||||||||
| Derivatives designated as accounting hedges: | ||||||||||||||||||||||||||||||||
| Interest rate contracts | $ | 4,729 | $ | 287 | $ | � | $ | 5,016 | $ | 54,696 | $ | 14,685 | $ | � | $ | 69,381 | ||||||||||||||||
| Foreign exchange contracts | 236 | � | � | 236 | 6,694 | � | � | 6,694 | ||||||||||||||||||||||||
| Total derivatives designated as accounting hedges | 4,965 | 287 | � | 5,252 | 61,390 | 14,685 | � | 76,075 | ||||||||||||||||||||||||
| Derivatives not designated as accounting hedges(2): | ||||||||||||||||||||||||||||||||
| Interest rate contracts | 262,697 | 261,348 | 291 | 524,336 | 6,206,450 | 11,854,610 | 856,137 | 18,917,197 | ||||||||||||||||||||||||
| Credit contracts | 39,054 | 5,292 | � | 44,346 | 1,244,004 | 240,781 | � | 1,484,785 | ||||||||||||||||||||||||
| Foreign exchange contracts | 61,383 | 130 | 52 | 61,565 | 1,818,429 | 9,634 | 9,783 | 1,837,846 | ||||||||||||||||||||||||
| Equity contracts | 26,104 | � | 28,001 | 54,105 | 294,524 | � | 437,842 | 732,366 | ||||||||||||||||||||||||
| Commodity contracts | 10,106 | � | 3,265 | 13,371 | 144,981 | � | 139,433 | 284,414 | ||||||||||||||||||||||||
| Other | 43 | � | � | 43 | 3,198 | � | � | 3,198 | ||||||||||||||||||||||||
| Total derivatives not designated as accounting hedges | 399,387 | 266,770 | 31,609 | 697,766 | 9,711,586 | 12,105,025 | 1,443,195 | 23,259,806 | ||||||||||||||||||||||||
| Total derivatives | $ | 404,352 | $ | 267,057 | $ | 31,609 | $ | 703,018 | $ | 9,772,976 | $ | 12,119,710 | $ | 1,443,195 | $ | 23,335,881 | ||||||||||||||||
| Cash collateral netting | (48,540 | ) | (3,462 | ) | � | (52,002 | ) | � | � | � | � | |||||||||||||||||||||
| Counterparty netting | (329,919 | ) | (262,957 | ) | (25,673 | ) | (618,549 | ) | � | � | � | � | ||||||||||||||||||||
| Total derivative assets | $ | 25,893 | $ | 638 | $ | 5,936 | $ | 32,467 | $ | 9,772,976 | $ | 12,119,710 | $ | 1,443,195 | $ | 23,335,881 | ||||||||||||||||
| | 224 |
| Derivative Liabilities | ||||||||||||||||||||||||||||||||
| At December�31, 2013 | ||||||||||||||||||||||||||||||||
| Fair Value | Notional | |||||||||||||||||||||||||||||||
| Bilateral�OTC | Cleared OTC(1) | Exchange Traded | Total | Bilateral OTC | Cleared OTC(1) | Exchange Traded | Total | |||||||||||||||||||||||||
| (dollars in millions) | ||||||||||||||||||||||||||||||||
| Derivatives designated as accounting hedges: | ||||||||||||||||||||||||||||||||
| Interest rate contracts | $ | 570 | $ | 614 | $ | � | $ | 1,184 | $ | 2,642 | $ | 12,667 | $ | � | $ | 15,309 | ||||||||||||||||
| Foreign exchange contracts | 258 | 5 | � | 263 | 5,970 | 503 | � | 6,473 | ||||||||||||||||||||||||
| Total derivatives designated as accounting hedges | 828 | 619 | � | 1,447 | 8,612 | 13,170 | � | 21,782 | ||||||||||||||||||||||||
| Derivatives not designated as accounting hedges(2): | ||||||||||||||||||||||||||||||||
| Interest rate contracts | 244,906 | 261,011 | 228 | 506,145 | 6,035,757 | 11,954,325 | 1,067,894 | 19,057,976 | ||||||||||||||||||||||||
| Credit contracts | 37,835 | 4,791 | � | 42,626 | 1,099,483 | 213,900 | � | 1,313,383 | ||||||||||||||||||||||||
| Foreign exchange contracts | 61,635 | 138 | 23 | 61,796 | 1,897,400 | 10,505 | 3,106 | 1,911,011 | ||||||||||||||||||||||||
| Equity contracts | 31,483 | � | 29,412 | 60,895 | 341,232 | � | 464,622 | 805,854 | ||||||||||||||||||||||||
| Commodity contracts | 9,436 | � | 3,450 | 12,886 | 138,784 | � | 120,556 | 259,340 | ||||||||||||||||||||||||
| Other | 76 | � | � | 76 | 4,659 | � | � | 4,659 | ||||||||||||||||||||||||
| Total derivatives not designated as accounting hedges | 385,371 | 265,940 | 33,113 | 684,424 | 9,517,315 | 12,178,730 | 1,656,178 | 23,352,223 | ||||||||||||||||||||||||
| Total derivatives | $ | 386,199 | $ | 266,559 | $ | 33,113 | $ | 685,871 | $ | 9,525,927 | $ | 12,191,900 | $ | 1,656,178 | $ | 23,374,005 | ||||||||||||||||
| Cash collateral netting | (31,139 | ) | (2,422 | ) | � | (33,561 | ) | � | � | � | � | |||||||||||||||||||||
| Counterparty netting | (329,920 | ) | (262,956 | ) | (25,673 | ) | (618,549 | ) | � | � | � | � | ||||||||||||||||||||
| Total derivative liabilities | $ | 25,140 | $ | 1,181 | $ | 7,440 | $ | 33,761 | $ | 9,525,927 | $ | 12,191,900 | $ | 1,656,178 | $ | 23,374,005 | ||||||||||||||||
| (1) | Amounts include OTC derivatives that are centrally cleared in accordance with certain regulatory requirements. |
| (2) | Notional amounts include gross notionals related to open long and short futures contracts of $426 billion and $729 billion, respectively. The unsettled fair value on these futures contracts (excluded from the table above) of $879 million and $27 million is included in Customer and other receivables and Customer and other payables, respectively, on the consolidated statements of financial condition. |
| 225 | |
| Derivative Assets | ||||||||||||||||||||||||||||||||
| At December�31, 2012 | ||||||||||||||||||||||||||||||||
| Fair Value | Notional | |||||||||||||||||||||||||||||||
| Bilateral�OTC | Cleared OTC(1) | Exchange Traded | Total | Bilateral OTC | Cleared OTC(1) | Exchange Traded | Total | |||||||||||||||||||||||||
| (dollars in millions) | ||||||||||||||||||||||||||||||||
| Derivatives designated as accounting hedges: | ||||||||||||||||||||||||||||||||
| Interest rate contracts | $ | 8,046 | $ | 301 | $ | � | $ | 8,347 | $ | 66,916 | $ | 8,199 | $ | � | $ | 75,115 | ||||||||||||||||
| Foreign exchange contracts | 367 | � | � | 367 | 10,291 | � | � | 10,291 | ||||||||||||||||||||||||
| Total derivatives designated as accounting hedges | 8,413 | 301 | � | 8,714 | 77,207 | 8,199 | � | 85,406 | ||||||||||||||||||||||||
| Derivatives not designated as accounting hedges(2): | ||||||||||||||||||||||||||||||||
| Interest rate contracts | 443,523 | 371,789 | 142 | 815,454 | 8,029,510 | 10,096,252 | 776,130 | 18,901,892 | ||||||||||||||||||||||||
| Credit contracts | 65,168 | 3,099 | � | 68,267 | 1,734,907 | 197,879 | � | 1,932,786 | ||||||||||||||||||||||||
| Foreign exchange contracts | 52,349 | 44 | 34 | 52,427 | 1,831,385 | 3,834 | 5,967 | 1,841,186 | ||||||||||||||||||||||||
| Equity contracts | 19,916 | � | 18,684 | 38,600 | 258,484 | � | 329,216 | 587,700 | ||||||||||||||||||||||||
| Commodity contracts | 15,201 | � | 5,445 | 20,646 | 164,842 | � | 176,714 | 341,556 | ||||||||||||||||||||||||
| Other | 143 | � | � | 143 | 4,908 | � | � | 4,908 | ||||||||||||||||||||||||
| Total derivatives not designated as accounting hedges | 596,300 | 374,932 | 24,305 | 995,537 | 12,024,036 | 10,297,965 | 1,288,027 | 23,610,028 | ||||||||||||||||||||||||
| Total derivatives | $ | 604,713 | $ | 375,233 | $ | 24,305 | $ | 1,004,251 | $ | 12,101,243 | $ | 10,306,164 | $ | 1,288,027 | $ | 23,695,434 | ||||||||||||||||
| Cash collateral netting | (68,024 | ) | (1,224 | ) | � | (69,248 | ) | � | � | � | � | |||||||||||||||||||||
| Counterparty netting | (505,820 | ) | (373,322 | ) | (19,664 | ) | (898,806 | ) | � | � | � | � | ||||||||||||||||||||
| Total derivative assets | $ | 30,869 | $ | 687 | $ | 4,641 | $ | 36,197 | $ | 12,101,243 | $ | 10,306,164 | $ | 1,288,027 | $ | 23,695,434 | ||||||||||||||||
| | 226 |
| Derivative Liabilities | ||||||||||||||||||||||||||||||||
| At December�31, 2012 | ||||||||||||||||||||||||||||||||
| Fair Value | Notional | |||||||||||||||||||||||||||||||
| Bilateral OTC | Cleared OTC(1) | Exchange Traded | Total | Bilateral OTC | Cleared OTC(1) | Exchange Traded | Total | |||||||||||||||||||||||||
| (dollars in millions) | ||||||||||||||||||||||||||||||||
| Derivatives designated as accounting hedges: | ||||||||||||||||||||||||||||||||
| Interest rate contracts | $ | 167 | $ | 1 | $ | � | $ | 168 | $ | 2,000 | $ | 660 | $ | � | $ | 2,660 | ||||||||||||||||
| Foreign exchange contracts | 319 | � | � | 319 | 17,156 | � | � | 17,156 | ||||||||||||||||||||||||
| Total derivatives designated as accounting hedges | 486 | 1 | � | 487 | 19,156 | 660 | � | 19,816 | ||||||||||||||||||||||||
| Derivatives not designated as accounting hedges(2): | ||||||||||||||||||||||||||||||||
| Interest rate contracts | 422,864 | 370,856 | 216 | 793,936 | 7,726,241 | 9,945,979 | 1,994,947 | 19,667,167 | ||||||||||||||||||||||||
| Credit contracts | 60,420 | 4,074 | � | 64,494 | 1,645,464 | 222,343 | � | 1,867,807 | ||||||||||||||||||||||||
| Foreign exchange contracts | 56,062 | 29 | 3 | 56,094 | 1,878,597 | 3,473 | 4,003 | 1,886,073 | ||||||||||||||||||||||||
| Equity contracts | 22,239 | � | 19,631 | 41,870 | 257,340 | � | 329,858 | 587,198 | ||||||||||||||||||||||||
| Commodity contracts | 15,886 | � | 5,945 | 21,831 | 169,189 | � | 155,912 | 325,101 | ||||||||||||||||||||||||
| Other | 61 | � | � | 61 | 5,161 | � | � | 5,161 | ||||||||||||||||||||||||
| Total derivatives not designated as accounting hedges | 577,532 | 374,959 | 25,795 | 978,286 | 11,681,992 | 10,171,795 | 2,484,720 | 24,338,507 | ||||||||||||||||||||||||
| Total derivatives | $ | 578,018 | $ | 374,960 | $ | 25,795 | $ | 978,773 | $ | 11,701,148 | $ | 10,172,455 | $ | 2,484,720 | $ | 24,358,323 | ||||||||||||||||
| Cash collateral netting | (41,465 | ) | (1,544 | ) | � | (43,009 | ) | � | � | � | � | |||||||||||||||||||||
| Counterparty netting | (505,820 | ) | (373,322 | ) | (19,664 | ) | (898,806 | ) | � | � | � | � | ||||||||||||||||||||
| Total derivative liabilities | $ | 30,733 | $ | 94 | $ | 6,131 | $ | 36,958 | $ | 11,701,148 | $ | 10,172,455 | $ | 2,484,720 | $ | 24,358,323 | ||||||||||||||||
| (1) | Amounts include OTC derivatives that are centrally cleared in accordance with certain regulatory requirements. |
| (2) | Notional amounts include gross notionals related to open long and short futures contracts of $368 billion and $1,476 billion, respectively. The unsettled fair value on these futures contracts (excluded from the table above) of $1,073 million and $24 million is included in Customer and other receivables and Customer and other payables, respectively, on the consolidated statements of financial condition. |
| Gains (Losses) Recognized | ||||||||||||
| Product Type | 2013 | 2012 | 2011 | |||||||||
| (dollars in millions) | ||||||||||||
| Derivatives | $ | (4,332 | ) | $ | 29 | $ | 3,415 | |||||
| Borrowings | 5,604 | 703 | (2,549 | ) | ||||||||
| Total | $ | 1,272 | $ | 732 | $ | 866 | ||||||
| 227 | |
| Gains�(Losses) Recognized�in OCI�(effective�portion) | ||||||||||||
| Product Type | 2013 | 2012(1) | 2011 | |||||||||
| (dollars in millions) | ||||||||||||
| Foreign exchange contracts(2) | $ | 448 | $ | 102 | $ | 180 | ||||||
| Total | $ | 448 | $ | 102 | $ | 180 | ||||||
| (1) | A gain of $77 million, net of tax, related to net investment hedges was reclassified from other comprehensive income into income during 2012. The amount primarily related to the reversal of amounts recorded in cumulative other comprehensive income due to the incorrect application�of hedge accounting on certain derivative contracts (see above for further information). |
| (2) | Losses of $154 million, $235 million and $220 million were recognized in income related to amounts excluded from hedge effectiveness testing during 2013, 2012 and 2011. |
| Gains�(Losses) Recognized�in�Income(1)(2) | ||||||||||||
| Product Type | 2013 | 2012 | 2011 | |||||||||
| (dollars in millions) | ||||||||||||
| Interest rate contracts | $ | (608 | ) | $ | 2,930 | $ | 5,538 | |||||
| Credit contracts | 74 | (722 | ) | 38 | ||||||||
| Foreign exchange contracts | 4,546 | (340 | ) | (2,982 | ) | |||||||
| Equity contracts | (9,193 | ) | (1,794 | ) | 3,880 | |||||||
| Commodity contracts | 772 | 387 | 500 | |||||||||
| Other contracts | (90 | ) | 1 | (51 | ) | |||||||
| Total derivative instruments | $ | (4,499 | ) | $ | 462 | $ | 6,923 | |||||
| (1) | Gains (losses) on derivative contracts not designated as hedges are primarily included in Trading revenues in the consolidated statements of income. |
| (2) | Gains (losses) associated with certain derivative contracts that have physically settled are excluded from the table above. Gains (losses) on these contracts are reflected with the associated cash instruments, which are also included in Trading revenues in the consolidated statements of income. |
| | 228 |
| At December�31, 2013 | ||||||||||||||||
| Maximum Potential Payout/Notional | ||||||||||||||||
| Protection Sold | Protection Purchased | |||||||||||||||
| Notional | Fair�Value (Asset)/Liability | Notional | Fair�Value (Asset)/Liability | |||||||||||||
| (dollars in millions) | ||||||||||||||||
| Single name credit default swaps | $ | 799,838 | $ | (9,349 | ) | $ | 758,536 | $ | 8,564 | |||||||
| Index and basket credit default swaps | 454,355 | (3,756 | ) | 361,961 | 2,827 | |||||||||||
| Tranched index and basket credit default swaps | 146,597 | (3,889 | ) | 276,881 | 3,883 | |||||||||||
| Total | $ | 1,400,790 | $ | (16,994 | ) | $ | 1,397,378 | $ | 15,274 | |||||||
| At December 31, 2012 | ||||||||||||||||
| Maximum Potential Payout/Notional | ||||||||||||||||
| Protection Sold | Protection Purchased | |||||||||||||||
| Notional | Fair Value (Asset)/Liability | Notional | Fair Value (Asset)/Liability | |||||||||||||
| (dollars in millions) | ||||||||||||||||
| Single name credit default swaps | $ | 1,069,474 | $ | 2,889 | $ | 1,029,543 | $ | (2,456 | ) | |||||||
| Index and basket credit default swaps | 551,630 | 5,664 | 454,800 | (5,124 | ) | |||||||||||
| Tranched index and basket credit default swaps | 272,088 | 2,330 | 423,058 | (7,076 | ) | |||||||||||
| Total | $ | 1,893,192 | $ | 10,883 | $ | 1,907,401 | $ | (14,656 | ) | |||||||
| 229 | |
| Protection Sold | ||||||||||||||||||||||||
| Maximum Potential Payout/Notional | Fair�
Value (Asset)/ Liability(1)(2) | |||||||||||||||||||||||
| Years to Maturity | ||||||||||||||||||||||||
| Credit Ratings of the Reference Obligation | Less�than�1 | 1-3 | 3-5 | Over 5 | Total | |||||||||||||||||||
| (dollars in millions) | ||||||||||||||||||||||||
| Single name credit default swaps: | ||||||||||||||||||||||||
| AAA | $ | 1,546 | $ | 8,661 | $ | 12,128 | $ | 1,282 | $ | 23,617 | $ | (145 | ) | |||||||||||
| AA | 9,443 | 24,158 | 25,310 | 4,317 | 63,228 | (845 | ) | |||||||||||||||||
| A | 45,663 | 53,755 | 44,428 | 4,666 | 148,512 | (2,704 | ) | |||||||||||||||||
| BBB | 103,143 | 122,382 | 112,950 | 20,491 | 358,966 | (4,294 | ) | |||||||||||||||||
| Non-investment grade | 60,254 | 77,393 | 61,088 | 6,780 | 205,515 | (1,361 | ) | |||||||||||||||||
| Total | 220,049 | 286,349 | 255,904 | 37,536 | 799,838 | (9,349 | ) | |||||||||||||||||
| Index and basket credit default swaps(3): | ||||||||||||||||||||||||
| AAA | 14,890 | 40,522 | 30,613 | 2,184 | 88,209 | (1,679 | ) | |||||||||||||||||
| AA | 3,751 | 4,127 | 4,593 | 6,006 | 18,477 | (275 | ) | |||||||||||||||||
| A | 2,064 | 2,263 | 11,633 | 36 | 15,996 | (418 | ) | |||||||||||||||||
| BBB | 5,974 | 29,709 | 74,982 | 3,847 | 114,512 | (2,220 | ) | |||||||||||||||||
| Non-investment grade | 67,108 | 157,149 | 122,516 | 16,985 | 363,758 | (3,053 | ) | |||||||||||||||||
| Total | 93,787 | 233,770 | 244,337 | 29,058 | 600,952 | (7,645 | ) | |||||||||||||||||
| Total credit default swaps sold | $ | 313,836 | $ | 520,119 | $ | 500,241 | $ | 66,594 | $ | 1,400,790 | $ | (16,994 | ) | |||||||||||
| Other credit contracts(4)(5) | $ | 75 | $ | 441 | $ | 529 | $ | 816 | $ | 1,861 | $ | (457 | ) | |||||||||||
| Total credit derivatives and other credit contracts | $ | 313,911 | $ | 520,560 | $ | 500,770 | $ | 67,410 | $ | 1,402,651 | $ | (17,451 | ) | |||||||||||
| (1) | Fair value amounts are shown on a gross basis prior to cash collateral or counterparty netting. |
| (2) | Fair value amounts of certain credit default swaps where the Company sold protection have an asset carrying value because credit spreads of the underlying reference entity or entities tightened during the terms of the contracts. |
| (3) | Credit ratings are calculated internally. |
| (4) | Other credit contracts include CLNs, CDOs and credit default swaps that are considered hybrid instruments. |
| (5) | Fair value amount shown represents the fair value of the hybrid instruments. |
| | 230 |
| Protection Sold | ||||||||||||||||||||||||
| Maximum Potential Payout/Notional | Fair Value (Asset)/ Liability(1)(2) | |||||||||||||||||||||||
| Years to Maturity | ||||||||||||||||||||||||
| Credit Ratings of the Reference Obligation | Less�than�1 | 1-3 | 3-5 | Over 5 | Total | |||||||||||||||||||
| (dollars in millions) | ||||||||||||||||||||||||
| Single name credit default swaps: | ||||||||||||||||||||||||
| AAA | $ | 2,368 | $ | 6,592 | $ | 19,848 | $ | 5,767 | $ | 34,575 | $ | (204 | ) | |||||||||||
| AA | 10,984 | 16,804 | 34,280 | 7,193 | 69,261 | (325 | ) | |||||||||||||||||
| A | 66,635 | 72,796 | 67,285 | 10,760 | 217,476 | (2,740 | ) | |||||||||||||||||
| BBB | 124,662 | 145,462 | 142,714 | 34,396 | 447,234 | (492 | ) | |||||||||||||||||
| Non-investment grade | 91,743 | 98,515 | 92,143 | 18,527 | 300,928 | 6,650 | ||||||||||||||||||
| Total | 296,392 | 340,169 | 356,270 | 76,643 | 1,069,474 | 2,889 | ||||||||||||||||||
| Index and basket credit default swaps(3): | ||||||||||||||||||||||||
| AAA | 18,652 | 36,005 | 45,789 | 3,240 | 103,686 | (1,377 | ) | |||||||||||||||||
| AA | 1,255 | 9,479 | 12,026 | 8,343 | 31,103 | (55 | ) | |||||||||||||||||
| A | 2,684 | 5,423 | 5,440 | 125 | 13,672 | (155 | ) | |||||||||||||||||
| BBB | 27,720 | 105,870 | 143,562 | 29,101 | 306,253 | (862 | ) | |||||||||||||||||
| Non-investment grade | 97,389 | 86,703 | 153,858 | 31,054 | 369,004 | 10,443 | ||||||||||||||||||
| Total | 147,700 | 243,480 | 360,675 | 71,863 | 823,718 | 7,994 | ||||||||||||||||||
| Total credit default swaps sold | $ | 444,092 | $ | 583,649 | $ | 716,945 | $ | 148,506 | $ | 1,893,192 | $ | 10,883 | ||||||||||||
| Other credit contracts(4)(5) | $ | 796 | $ | 125 | $ | 155 | $ | 1,323 | $ | 2,399 | $ | (745 | ) | |||||||||||
| Total credit derivatives and other credit contracts | $ | 444,888 | $ | 583,774 | $ | 717,100 | $ | 149,829 | $ | 1,895,591 | $ | 10,138 | ||||||||||||
| (1) | Fair value amounts are shown on a gross basis prior to cash collateral or counterparty netting. |
| (2) | Fair value amounts of certain credit default swaps where the Company sold protection have an asset carrying value because credit spreads of the underlying reference entity or entities tightened during the terms of the contracts. |
| (3) | Credit ratings are calculated internally. |
| (4) | Other credit contracts include CLNs, CDOs and credit default swaps that are considered hybrid instruments. |
| (5) | Fair value amount shown represents the fair value of the hybrid instruments. |
| 231 | |
| | 232 |
| Years to Maturity | Total at December�31, 2013 | |||||||||||||||||||
| Less than�1 | 1-3 | 3-5 | Over�5 | |||||||||||||||||
| (dollars in millions) | ||||||||||||||||||||
| Letters of credit and other financial guarantees obtained to satisfy collateral requirements | $ | 389 | $ | 1 | $ | � | $ | 1 | $ | 391 | ||||||||||
| Investment activities | 518 | 70 | 30 | 447 | 1,065 | |||||||||||||||
| Primary lending commitments�investment grade(1) | 7,695 | 14,674 | 36,224 | 798 | 59,391 | |||||||||||||||
| Primary lending commitments�non-investment grade(1) | 1,657 | 5,402 | 10,066 | 2,119 | 19,244 | |||||||||||||||
| Secondary lending commitments(2) | 44 | 38 | 10 | 72 | 164 | |||||||||||||||
| Commitments for secured lending transactions | 1,094 | 166 | � | � | 1,260 | |||||||||||||||
| Forward starting reverse repurchase agreements and securities borrowing agreements(3)(4) | 44,890 | � | � | � | 44,890 | |||||||||||||||
| Commercial and residential mortgage-related commitments | 1,199 | 48 | 301 | 313 | 1,861 | |||||||||||||||
| Underwriting commitments | 588 | � | � | � | 588 | |||||||||||||||
| Other lending commitments | 2,660 | 340 | 193 | 128 | 3,321 | |||||||||||||||
| Total | $ | 60,734 | $ | 20,739 | $ | 46,824 | $ | 3,878 | $ | 132,175 | ||||||||||
| (1) | This amount includes $49.4 billion of investment grade and $12 billion of non-investment grade unfunded commitments accounted for as held for investment and $3.5 billion of investment grade and $4.6 billion of non-investment grade unfunded commitments accounted for as held for sale at December�31, 2013. The remainder of these lending commitments is carried at fair value. |
| (2) | These commitments are recorded at fair value within Trading assets and Trading liabilities in the consolidated statements of financial condition (see Note 4). |
| (3) | The Company enters into forward starting reverse repurchase and securities borrowing agreements (agreements that have a trade date at or prior to December�31, 2013 and settle subsequent to period-end) that are primarily secured by collateral from U.S. government agency securities and other sovereign government obligations. These agreements primarily settle within three business days and of the total amount at December�31, 2013, $42.9 billion settled within three business days. |
| (4) | The Company also has a contingent obligation to provide financing to a clearinghouse through which it clears certain transactions. The financing is required only upon the default of a clearinghouse member. The financing takes the form of a reverse repurchase facility, with a maximum amount of approximately $1.1 billion. |
| 233 | |
| Year Ended | Operating Premises Leases | |||
| 2014 | $ | 672 | ||
| 2015 | 656 | |||
| 2016 | 621 | |||
| 2017 | 554 | |||
| 2018 | 481 | |||
| Thereafter | 2,712 | |||
| | 234 |
| Year Ended | Operating Equipment Leases | |||
| 2014 | $ | 239 | ||
| 2015 | 149 | |||
| 2016 | 92 | |||
| 2017 | 87 | |||
| 2018 | 76 | |||
| Thereafter | 98 | |||
| Maximum Potential Payout/Notional | Carrying Amount (Asset)/ Liability | Collateral/ Recourse | ||||||||||||||||||||||||||
| Years to Maturity | ||||||||||||||||||||||||||||
| Type of Guarantee | Less than�1 | 1-3 | 3-5 | Over�5 | Total | |||||||||||||||||||||||
| (dollars in millions) | ||||||||||||||||||||||||||||
| Credit derivative contracts(1) | $ | 313,836 | $ | 520,119 | $ | 500,241 | $ | 66,594 | $ | 1,400,790 | $ | (16,994 | ) | $ | � | |||||||||||||
| Other credit contracts | 75 | 441 | 529 | 816 | 1,861 | (457 | ) | � | ||||||||||||||||||||
| Non-credit derivative contracts(1) | 1,249,932 | 794,776 | 353,559 | 474,921 | 2,873,188 | 54,098 | � | |||||||||||||||||||||
| Standby letters of credit and other financial guarantees issued(2)(3) | 1,024 | 812 | 1,205 | 5,652 | 8,693 | (208 | ) | 7,016 | ||||||||||||||||||||
| Market value guarantees | � | 112 | 83 | 515 | 710 | 7 | 106 | |||||||||||||||||||||
| Liquidity facilities | 2,328 | � | � | � | 2,328 | (4 | ) | 3,042 | ||||||||||||||||||||
| Whole loan sales representations and warranties | � | � | � | 23,755 | 23,755 | 56 | � | |||||||||||||||||||||
| Securitization representations and warranties | � | � | � | 67,249 | 67,249 | 82 | � | |||||||||||||||||||||
| General partner guarantees | 42 | 41 | 62 | 301 | 446 | 73 | � | |||||||||||||||||||||
| (1) | Carrying amounts of derivative contracts are shown on a gross basis prior to cash collateral or counterparty netting. For further information on derivative contracts, see Note 12. |
| (2) | Approximately $2.0�billion of standby letters of credit are also reflected in the �Commitments� table above in primary and secondary lending commitments. Standby letters of credit are recorded at fair value within Trading assets or Trading liabilities in the consolidated statements of financial condition. |
| (3) | Amounts include guarantees issued by consolidated real estate funds sponsored by the Company of approximately $13.8 million. These guarantees relate to obligations of the fund�s investee entities, including guarantees related to capital expenditures and principal and interest debt payments. |
| 235 | |
| | 236 |
| 237 | |
| � | Trust Preferred Securities .����The Company has established�Morgan Stanley Capital Trusts for the limited purpose of issuing�trust preferred securities to third parties and lending the proceeds to the Company in exchange for junior subordinated debentures. The Company has directly guaranteed the repayment of the trust preferred securities to the holders thereof to the extent that the Company has made payments to a Morgan Stanley Capital Trust on the junior subordinated debentures. In the event that the Company does not make payments to a Morgan Stanley Capital Trust, holders of such series of trust preferred securities would not be able to rely upon the guarantee for payment of those amounts. The Company has not recorded any liability in the consolidated financial statements for these guarantees and believes that the occurrence of any events ( i.e. , non-performance on the part of the paying agent) that would trigger payments under these contracts is remote. See Note 11. |
| � | Indemnities .����The Company provides standard indemnities to counterparties for certain contingent exposures and taxes, including U.S. and foreign withholding taxes, on interest and other payments made on derivatives, securities and stock lending transactions, certain annuity products and other financial arrangements. These indemnity payments could be required based on a change in the tax laws or a change in interpretation of applicable tax rulings or a change in factual circumstances. Certain contracts contain provisions that enable the Company to terminate the agreement upon the occurrence of such events. The maximum potential amount of future payments that the Company could be required to make under these indemnifications cannot be estimated. |
| � | Exchange/Clearinghouse Member Guarantees .����The Company is a member of various U.S. and non-U.S. exchanges and clearinghouses that trade and clear securities and/or derivative contracts. Associated with its membership, the Company may be required to pay a proportionate share of the financial obligations of another member who may default on its obligations to the exchange or the clearinghouse. While the rules governing different exchange or clearinghouse memberships vary, in general the Company�s guarantee obligations would arise only if the exchange or clearinghouse had previously exhausted its resources. The maximum potential payout under these membership agreements cannot be estimated. The Company has not recorded any contingent liability in the consolidated financial statements for these agreements and believes that any potential requirement to make payments under these agreements is remote. |
| � | Merger and Acquisition Guarantees .����The Company may, from time to time, in its role as investment banking advisor be required to provide guarantees in connection with certain European merger and acquisition transactions. If required by the regulating authorities, the Company provides a guarantee that the acquirer in the merger and acquisition transaction has or will have sufficient funds to complete the transaction and would then be required to make the acquisition payments in the event the acquirer�s funds are insufficient at the completion date of the transaction. These arrangements generally cover the time frame from the transaction offer date to its closing date and, therefore, are generally short term in nature. The maximum potential amount of future payments that the Company could be required to make cannot be estimated. The Company believes the likelihood of any payment by the Company under these arrangements is remote given the level of the Company�s due diligence associated with its role as investment banking advisor. |
| | 238 |
| 239 | |
| | 240 |
| 241 | |
| | 242 |
| 243 | |
| December�31, 2013 | December�31, 2012 | |||||||||||||||
| Balance | Ratio | Balance | Ratio | |||||||||||||
| (dollars�in�millions) | ||||||||||||||||
| Tier 1 common capital(1) | $ | 49,917 | 12.8 | % | $ | 44,794 | 14.6 | % | ||||||||
| Tier 1 capital(1) | 61,007 | 15.7 | % | 54,360 | 17.7 | % | ||||||||||
| Total capital(1) | 66,000 | 16.9 | % | 56,626 | 18.5 | % | ||||||||||
| RWAs(1) | 389,675 | � | 306,746 | � | ||||||||||||
| Adjusted average total assets | 805,838 | � | 769,495 | � | ||||||||||||
| Tier 1 leverage | � | 7.6 | % | � | 7.1 | % | ||||||||||
| (1) | Effective January�1, 2013, in accordance with the U.S. banking regulators� rules the Company implemented the Basel Committee�s market risk capital framework amendment,�commonly�referred to as �Basel 2.5�, which increased the capital requirement for securitizations�and correlation trading within the Company�s trading book�as�well as incorporated add-ons for stressed VaR�and incremental�risk requirements.�Under the market risk capital framework amendment, total RWAs would have been approximately $424 billion at December�31, 2012.�At December�31, 2012, the capital ratios would have been approximately as follows: Total capital ratio 13.4%, Tier 1 common capital ratio 10.6% and Tier 1 capital ratio 12.8%. |
| | 244 |
| December�31,�2013 | December�31,�2012 | |||||||||||||||
| Amount | Ratio | Amount | Ratio | |||||||||||||
| (dollars�in�millions) | ||||||||||||||||
| Total capital (to RWAs): | ||||||||||||||||
| MSBNA(1) | $ | 12,468 | 16.5 | % | $ | 11,509 | 16.7 | % | ||||||||
| MSPBNA | $ | 2,184 | 26.6 | % | $ | 1,673 | 28.8 | % | ||||||||
| Tier 1 capital (to RWAs): | ||||||||||||||||
| MSBNA(1) | $ | 10,805 | 14.3 | % | $ | 9,918 | 14.4 | % | ||||||||
| MSPBNA | $ | 2,177 | 26.5 | % | $ | 1,665 | 28.7 | % | ||||||||
| Tier 1 leverage: | ||||||||||||||||
| MSBNA | $ | 10,805 | 10.6 | % | $ | 9,918 | 13.3 | % | ||||||||
| MSPBNA | $ | 2,177 | 9.7 | % | $ | 1,665 | 10.6 | % | ||||||||
| (1) | MSBNA�s Tier 1 capital ratio and Total capital ratio at December�31, 2012 were each reduced by approximately 50 basis points due to an approximate $2.0 billion adjustment to notional value of derivatives contracts, which resulted in an increase to MSBNA�s RWAs by such amount. |
| 245 | |
| 2013 | 2012 | |||||||
| (dollars in millions) | ||||||||
| Balance at beginning of period | $ | 4,309 | $ | � | ||||
| Reclassification from nonredeemable noncontrolling interests | � | 4,288 | ||||||
| Net income applicable to redeemable noncontrolling interests | 222 | 124 | ||||||
| Net change in AOCI | � | (2 | ) | |||||
| Distributions | (38 | ) | (97 | ) | ||||
| Other | (11 | ) | (4 | ) | ||||
| Carrying value of additional stake in Wealth Management JV purchased from Citi | (4,482 | ) | � | |||||
| Balance at end of period | $ | � | $ | 4,309 | ||||
| | 246 |
| 2013 | 2012 | 2011 | ||||||||||
| Shares outstanding at beginning of period | 1,974 | 1,927 | 1,512 | |||||||||
| Public offerings and other issuances of common stock | � | � | 385 | |||||||||
| Net impact of other share activity | (2 | ) | 60 | 41 | ||||||||
| Treasury stock purchases(1) | (27 | ) | (13 | ) | (11 | ) | ||||||
| Shares outstanding at end of period | 1,945 | 1,974 | 1,927 | |||||||||
| (1) | Treasury stock purchases include repurchases of common stock for employee tax withholding. |
| 247 | |
| Shares Outstanding�at December�31, 2013 | Liquidation Preference per Share | Carrying Value | ||||||||||||||
| Series | At December�31, 2013 | At December�31, 2012 | ||||||||||||||
| (dollars in millions) | ||||||||||||||||
| A | 44,000 | $ | 25,000 | $ | 1,100 | $ | 1,100 | |||||||||
| C | 519,882 | 1,000 | 408 | 408 | ||||||||||||
| E | 34,500 | 25,000 | 862 | � | ||||||||||||
| F | 34,000 | 25,000 | 850 | � | ||||||||||||
| Total | $ | 3,220 | $ | 1,508 | ||||||||||||
| | 248 |
| Foreign Currency Translation Adjustments | Net Change� in Cash�Flow Hedges | Change
in Net�Unrealized Gains�(Losses)� on Securities Available�for�Sale | Pension, Postretirement and�Other�Related Adjustments | Total | ||||||||||||||||
| Balance at December�31, 2012 | $ | (123 | ) | $ | (5 | ) | $ | 151 | $ | (539 | ) | $ | (516 | ) | ||||||
| Other comprehensive income (loss) before reclassifications | (143 | ) | � | (406 | ) | (16 | ) | (565 | ) | |||||||||||
| Amounts reclassified from AOCI | � | 4 | (27 | ) | 11 | (12 | ) | |||||||||||||
| Net other comprehensive income (loss) during the period | (143 | ) | 4 | (433 | ) | (5 | ) | (577 | ) | |||||||||||
| Balance at December�31, 2013 | $ | (266 | ) | $ | (1 | ) | $ | (282 | ) | $ | (544 | ) | $ | (1,093 | ) | |||||
| 249 | |
| At December� 31, 2013 | At December� 31, 2012 | |||||||||
| (dollars in millions) | ||||||||||
| Net investments in non-U.S. dollar functional currency subsidiaries subject to hedges | $ | 11,708 | $ | 13,811 | ||||||
| Cumulative foreign currency translation adjustments resulting from net investments in subsidiaries with a non-U.S. dollar functional currency | $ | (259 | ) | $ | 348 | |||||
| Cumulative foreign currency translation adjustments resulting from realized or unrealized losses on hedges, net of tax(1) | (7 | ) | (471 | ) | ||||||
| Total cumulative foreign currency translation adjustments, net of tax | $ | (266 | ) | $ | (123 | ) | ||||
| (1) | A gain of $77 million, net of tax, related to net investment hedges was reclassified from other comprehensive income into income during 2012. The amount primarily related to the reversal of amounts recorded in cumulative other comprehensive income due to the incorrect application�of hedge accounting on certain derivative contracts (see Note 12 for further information). |
| | 250 |
| 2013 | 2012 | 2011 | ||||||||||
| Basic EPS: | ||||||||||||
| Income from continuing operations | $ | 3,656 | $ | 757 | $ | 4,696 | ||||||
| Net gain (loss) from discontinued operations | (43 | ) | (41 | ) | (51 | ) | ||||||
| Net income | 3,613 | 716 | 4,645 | |||||||||
| Net income applicable to redeemable noncontrolling interests | 222 | 124 | � | |||||||||
| Net income applicable to nonredeemable noncontrolling interests | 459 | 524 | 535 | |||||||||
| Net income applicable to Morgan Stanley | 2,932 | 68 | 4,110 | |||||||||
| Less: Preferred dividends (Series A Preferred Stock) | (44 | ) | (44 | ) | (44 | ) | ||||||
| Less: Preferred dividends (Series B Preferred Stock) | � | � | (196 | ) | ||||||||
| Less: MUFG stock conversion | � | � | (1,726 | ) | ||||||||
| Less: Preferred dividends (Series C Preferred Stock) | (52 | ) | (52 | ) | (52 | ) | ||||||
| Less: Preferred dividends (Series E Preferred Stock) | (18 | ) | � | � | ||||||||
| Less: Preferred dividends (Series F Preferred Stock) | (6 | ) | � | � | ||||||||
| Less: Wealth Management JV redemption value adjustment (see Note 3) | (151 | ) | � | � | ||||||||
| Less: Allocation of (earnings) loss to participating RSUs(1): | ||||||||||||
| From continuing operations | (6 | ) | (2 | ) | (26 | ) | ||||||
| From discontinued operations | � | � | 1 | |||||||||
| Earnings (loss) applicable to Morgan Stanley common shareholders | $ | 2,655 | $ | (30 | ) | $ | 2,067 | |||||
| Weighted average common shares outstanding | 1,906 | 1,886 | 1,655 | |||||||||
| Earnings (loss) per basic common share: | ||||||||||||
| Income from continuing operations | $ | 1.42 | $ | 0.02 | $ | 1.28 | ||||||
| Net gain (loss) from discontinued operations | (0.03 | ) | (0.04 | ) | (0.03 | ) | ||||||
| Earnings (loss) per basic common share | $ | 1.39 | $ | (0.02 | ) | $ | 1.25 | |||||
| Diluted EPS: | ||||||||||||
| Earnings (loss) applicable to Morgan Stanley common shareholders | $ | 2,655 | $ | (30 | ) | $ | 2,067 | |||||
| Weighted average common shares outstanding | 1,906 | 1,886 | 1,655 | |||||||||
| Effect of dilutive securities: | ||||||||||||
| Stock options and RSUs(1) | 51 | 33 | 20 | |||||||||
| Weighted average common shares outstanding and common stock equivalents | 1,957 | 1,919 | 1,675 | |||||||||
| Earnings (loss) per diluted common share: | ||||||||||||
| Income from continuing operations | $ | 1.38 | $ | 0.02 | $ | 1.27 | ||||||
| Net gain (loss) from discontinued operations | (0.02 | ) | (0.04 | ) | (0.04 | ) | ||||||
| Earnings (loss) per diluted common share | $ | 1.36 | $ | (0.02 | ) | $ | 1.23 | |||||
| (1) | RSUs that are considered participating securities participate in all of the earnings of the Company in the computation of basic EPS, and, therefore, such RSUs are not included as incremental shares in the diluted calculation. |
| 251 | |
| Number of Antidilutive Securities Outstanding at End of Period: | 2013 | 2012 | 2011 | |||||||||
| (shares in millions) | ||||||||||||
| RSUs and performance-based stock units | 3 | 8 | 21 | |||||||||
| Stock options | 33 | 42 | 57 | |||||||||
| Total | 36 | 50 | 78 | |||||||||
| 2013 | 2012 | 2011 | ||||||||||
| (dollars�in�millions) | ||||||||||||
| Interest income(1): | ||||||||||||
| Trading assets(2) | $ | 2,292 | $ | 2,736 | $ | 3,593 | ||||||
| Securities available for sale | 447 | 343 | 348 | |||||||||
| Loans | 1,121 | 643 | 356 | |||||||||
| Interest bearing deposits with banks | 129 | 124 | 186 | |||||||||
| Federal funds sold and securities purchased under agreements to resell and Securities borrowed | (20 | ) | 364 | 886 | ||||||||
| Other | 1,240 | 1,482 | 1,865 | |||||||||
| Total interest income | $ | 5,209 | $ | 5,692 | $ | 7,234 | ||||||
| Interest expense(1): | ||||||||||||
| Deposits | $ | 159 | $ | 181 | $ | 236 | ||||||
| Commercial paper and other short-term borrowings | 20 | 38 | 41 | |||||||||
| Long-term debt | 3,758 | 4,622 | 4,912 | |||||||||
| Securities sold under agreements to repurchase and Securities loaned | 1,469 | 1,805 | 1,925 | |||||||||
| Other | (975 | ) | (749 | ) | (231 | ) | ||||||
| Total interest expense | $ | 4,431 | $ | 5,897 | $ | 6,883 | ||||||
| Net interest | $ | 778 | $ | (205 | ) | $ | 351 | |||||
| (1) | Interest income and expense are recorded within the consolidated statements of income depending on the nature of the instrument and related market conventions. When interest is included as a component of the instrument�s fair value, interest is included within Trading revenues or Investments revenues. Otherwise, it is included within Interest income or Interest expense. |
| (2) | Interest expense on Trading liabilities is reported as a reduction to Interest income on Trading assets. |
| | 252 |
| 2013 | 2012 | 2011 | ||||||||||
| (dollars�in�millions) | ||||||||||||
| Restricted stock units(1) | $ | 1,140 | $ | 864 | $ | 1,057 | ||||||
| Stock options | 15 | 4 | 24 | |||||||||
| Performance-based stock units | 29 | 29 | 32 | |||||||||
| Total(2) | $ | 1,184 | $ | 897 | $ | 1,113 | ||||||
| (1) | Amounts for 2013, 2012 and 2011 include $25 million, $31 million and $186 million, respectively, related to stock-based awards that were granted in 2014, 2013 and 2012, respectively, to employees who satisfied retirement-eligible requirements under award terms that do not contain a service period. |
| (2) | Annual expense fluctuations are primarily due to the introduction in 2012 of a new vesting requirement for certain employees who satisfy existing retirement-eligible requirements to provide a one-year advance notice of their intention to retire from the Company. As such, expense recognition for these awards begins after the grant date (see Note 2). |
| 253 | |
| 2013 | ||||||||
| Number�of Shares | Weighted�Average Grant Date Fair Value | |||||||
| RSUs at beginning of period | 122 | $ | 24.29 | |||||
| Granted | 57 | 22.72 | ||||||
| Conversions to common stock | (41 | ) | 28.51 | |||||
| Canceled | (6 | ) | 22.21 | |||||
| RSUs at end of period(1) | 132 | $ | 22.41 | |||||
| (1) | At December�31, 2013, approximately 121�million RSUs with a weighted average grant date fair value of $22.47 were vested or expected to vest. |
| 2013 | ||||||||
| Number�of Shares | Weighted�Average Grant Date Fair Value | |||||||
| Unvested RSUs at beginning of period | 83 | $ | 23.83 | |||||
| Granted | 57 | 22.72 | ||||||
| Vested | (36 | ) | 26.67 | |||||
| Canceled | (6 | ) | 22.19 | |||||
| Unvested RSUs at end of period(1) | 98 | $ | 22.29 | |||||
| (1) | Unvested RSUs represent awards where recipients have yet to satisfy either the explicit vesting terms or retirement-eligible requirements. At December�31, 2013, approximately 87�million unvested RSUs with a weighted average grant date fair value of $22.35 were expected to vest. |
| | 254 |
| Grant Year | Risk-Free�Interest Rate | Expected�Life | Expected�Stock Price Volatility | Expected�Dividend Yield | ||||||||||||
| 2013 | 0.6 | % | 3.9�years | 32.0 | % | 0.9 | % | |||||||||
| 2011 | 2.1 | % | 5.0�years | 32.7 | % | 1.5 | % | |||||||||
| 2013 | ||||||||
| Number�of Options | Weighted Average Exercise�Price | |||||||
| Options outstanding at beginning of period | 42 | $ | 48.37 | |||||
| Granted | 3 | 22.98 | ||||||
| Canceled | (12 | ) | 39.93 | |||||
| Options outstanding at end of period(1) | 33 | 49.40 | ||||||
| Options exercisable at end of period | 30 | 52.09 | ||||||
| (1) | At December�31, 2013, approximately 30�million options with a weighted average exercise price of $51.50 were vested. |
| At December�31, 2013 | Options Outstanding | Options Exercisable | ||||||||||||||||||||||
| Range�of�Exercise�Prices | Number Outstanding | Weighted�Average Exercise Price | Average Remaining�Life (Years) | Number Exercisable | Weighted�Average Exercise Price | Average Remaining�Life (Years) | ||||||||||||||||||
| $22.00 � $39.99 | 6 | $ | 26.88 | 4.0 | 3 | $ | 28.94 | 4.0 | ||||||||||||||||
| $40.00 � $49.99 | 15 | 46.51 | 0.2 | 15 | 46.51 | 0.2 | ||||||||||||||||||
| $50.00 � $59.99 | 1 | 52.08 | 2.0 | 1 | 52.08 | 2.0 | ||||||||||||||||||
| $60.00 � $76.99 | 11 | 66.75 | 2.9 | 11 | 66.75 | 2.9 | ||||||||||||||||||
| Total | 33 | 30 | ||||||||||||||||||||||
| 255 | |
| Minimum | Maximum | |||||||||||
| Grant Year | MS�Average�ROE | Multiplier | MS�Average�ROE | Multiplier | ||||||||
| 2013 | Less than 5% | 0.0 | 13% or more | 2.0 | ||||||||
| 2012 | Less than 6% | 0.0 | 12% or more | 1.5 | ||||||||
| 2011 | Less than 7.5% | 0.0 | 18% or more | 2.0 | ||||||||
| Minimum | Maximum | |||||||||||||
| Year | Metrics | TSR | Multiplier | TSR | Multiplier | |||||||||
| 2013 | Comparison of TSR | Below | Down�to�0.0 | Above | Up�to�2.0 | |||||||||
| 2012 | Comparison of TSR | Below | Down to 0.0 | Above | Up to 1.5 | |||||||||
| 2011 | Ranking within the comparison group | Rank�9�or�10 | 0.0 | Rank�1 | 2.0 | |||||||||
| Grant Year | Risk-Free�Interest Rate | Expected�Stock Price Volatility | Expected�Dividend Yield | |||||||||
| 2013 | 0.4 | % | 45.4 | % | 0.0 | % | ||||||
| 2012 | 0.4 | % | 56.0 | % | 1.1 | % | ||||||
| 2011 | 1.0 | % | 89.0 | % | 1.5 | % | ||||||
| | 256 |
| 2013 | ||||
| Number�of�Shares | ||||
| (in millions) | ||||
| PSUs at beginning of period | 5 | |||
| Granted | 1 | |||
| Canceled | (2 | ) | ||
| PSUs at end of period | 4 | |||
| 2013 | 2012 | 2011 | ||||||||||
| (dollars�in�millions) | ||||||||||||
| Deferred cash-based awards(1) | $ | 1,490 | $ | 1,815 | $ | 1,809 | ||||||
| Return on referenced investments | 772 | 435 | 132 | |||||||||
| Total | $ | 2,262 | $ | 2,250 | $ | 1,941 | ||||||
| (1) | Amounts for 2013, 2012 and 2011 include $78 million, $93 million and $113 million, respectively, related to deferred cash-based awards that were granted in 2014, 2013 and 2012, respectively, to employees who satisfied retirement-eligible requirements under award terms that do not contain a service period. |
| 257 | |
| 2014 | 2015 | Thereafter | Total | |||||||||||||
| (dollars�in�millions) | ||||||||||||||||
| Stock-based awards | $ | 749 | $ | 309 | $ | 169 | $ | 1,227 | ||||||||
| Deferred cash-based awards | 990 | 259 | 142 | 1,391 | ||||||||||||
| $ | 1,739 | $ | 568 | $ | 311 | $ | 2,618 | |||||||||
| Pension | Postretirement | |||||||||||||||||||||||
| 2013 | 2012 | 2011 | 2013 | 2012 | 2011 | |||||||||||||||||||
| (dollars�in�millions) | ||||||||||||||||||||||||
| Service cost, benefits earned during the period | $ | 23 | $ | 26 | $ | 27 | $ | 4 | $ | 4 | $ | 4 | ||||||||||||
| Interest cost on projected benefit obligation | 151 | 156 | 158 | 7 | 7 | 8 | ||||||||||||||||||
| Expected return on plan assets | (114 | ) | (110 | ) | (131 | ) | � | � | � | |||||||||||||||
| Net amortization of prior service cost (credit) | � | � | � | (13 | ) | (14 | ) | (14 | ) | |||||||||||||||
| Net amortization of actuarial loss | 36 | 27 | 17 | 3 | 2 | 2 | ||||||||||||||||||
| Settlement loss | 1 | � | 1 | � | � | � | ||||||||||||||||||
| Net periodic benefit expense (income) | $ | 97 | $ | 99 | $ | 72 | $ | 1 | $ | (1 | ) | $ | � | |||||||||||
| | 258 |
| Pension | Postretirement | |||||||||||||||||||||||
| 2013 | 2012 | 2011 | 2013 | 2012 | 2011 | |||||||||||||||||||
| (dollars�in�millions) | ||||||||||||||||||||||||
| Net loss (gain) | $ | 87 | $ | 416 | $ | (401 | ) | $ | (52 | ) | $ | 16 | $ | (5 | ) | |||||||||
| Prior service cost | 3 | 3 | 2 | � | � | � | ||||||||||||||||||
| Amortization of prior service credit | � | � | � | 13 | 14 | 14 | ||||||||||||||||||
| Amortization of net loss | (37 | ) | (27 | ) | (18 | ) | (3 | ) | (2 | ) | (2 | ) | ||||||||||||
| Total recognized in other comprehensive loss (income) | $ | 53 | $ | 392 | $ | (417 | ) | $ | (42 | ) | $ | 28 | $ | 7 | ||||||||||
| Pension | Postretirement | |||||||||||||||||||||||
| 2013 | 2012 | 2011 | 2013 | 2012 | 2011 | |||||||||||||||||||
| Discount rate | 3.95 | % | 4.57 | % | 5.44 | % | 3.88 | % | 4.56 | % | 5.41 | % | ||||||||||||
| Expected long-term rate of return on plan assets | 3.73 | 3.78 | 4.78 | N/A | N/A | N/A | ||||||||||||||||||
| Rate of future compensation increases | 0.98 | 2.14 | 2.28 | N/A | N/A | N/A | ||||||||||||||||||
| 259 | |
| Pension | Postretirement | |||||||
| (dollars�in�millions) | ||||||||
| Reconciliation of benefit obligation: | ||||||||
| Benefit obligation at December�31, 2011 | $ | 3,517 | $ | 154 | ||||
| Service cost | 26 | 4 | ||||||
| Interest cost | 156 | 7 | ||||||
| Actuarial loss | 405 | 15 | ||||||
| Plan settlements | (2 | ) | � | |||||
| Benefits paid | (147 | ) | (6 | ) | ||||
| Other, including foreign currency exchange rate changes | (72 | ) | � | |||||
| Benefit obligation at December�31, 2012 | $ | 3,883 | $ | 174 | ||||
| Service cost | 23 | 4 | ||||||
| Interest cost | 151 | 7 | ||||||
| Actuarial gain | (537 | ) | (52 | ) | ||||
| Plan amendments | 2 | � | ||||||
| Plan settlements | (7 | ) | � | |||||
| Benefits paid | (186 | ) | (6 | ) | ||||
| Other, including foreign currency exchange rate changes | 1 | 1 | ||||||
| Benefit obligation at December�31, 2013 | $ | 3,330 | $ | 128 | ||||
| Reconciliation of fair value of plan assets: | ||||||||
| Fair value of plan assets at December�31, 2011 | $ | 3,604 | $ | � | ||||
| Actual return on plan assets | 83 | � | ||||||
| Employer contributions | 42 | 6 | ||||||
| Benefits paid | (147 | ) | (6 | ) | ||||
| Plan settlements | (2 | ) | � | |||||
| Other, including foreign currency exchange rate changes | (61 | ) | � | |||||
| Fair value of plan assets at December�31, 2012 | $ | 3,519 | $ | � | ||||
| Actual return on plan assets | (512 | ) | � | |||||
| Employer contributions | 42 | 6 | ||||||
| Benefits paid | (186 | ) | (6 | ) | ||||
| Plan settlements | (7 | ) | � | |||||
| Other, including foreign currency exchange rate changes | 11 | � | ||||||
| Fair value of plan assets at December�31, 2013 | $ | 2,867 | $ | � | ||||
| | 260 |
| Pension | Postretirement | |||||||||||||||
| December�31, 2013 | December�31, 2012 | December�31, 2013 | December�31, 2012 | |||||||||||||
| (dollars�in�millions) | ||||||||||||||||
| Funded (unfunded) status | $ | (463 | ) | $ | (364 | ) | $ | (128 | ) | $ | (174 | ) | ||||
| Amounts recognized in the consolidated statements of financial condition consist of: | ||||||||||||||||
| Assets | $ | 60 | $ | 97 | $ | � | $ | � | ||||||||
| Liabilities | (523 | ) | (461 | ) | (128 | ) | (174 | ) | ||||||||
| Net amount recognized | $ | (463 | ) | $ | (364 | ) | $ | (128 | ) | $ | (174 | ) | ||||
| Amounts recognized in accumulated other comprehensive loss consist of: | ||||||||||||||||
| Prior-service cost (credit) | $ | 1 | $ | (2 | ) | $ | (11 | ) | $ | (24 | ) | |||||
| Net loss (gain) | 871 | 821 | (14 | ) | 41 | |||||||||||
| Net loss (gain) recognized | $ | 872 | $ | 819 | $ | (25 | ) | $ | 17 | |||||||
| December�31, 2013 | December�31, 2012 | |||||||
| (dollars�in�millions) | ||||||||
| Projected benefit obligation | $ | 3,127 | $ | 552 | ||||
| Fair value of plan assets | 2,603 | 90 | ||||||
| December�31, 2013 | December�31, 2012 | |||||||
| (dollars�in�millions) | ||||||||
| Accumulated benefit obligation | $ | 3,089 | $ | 527 | ||||
| Fair value of plan assets | 2,586 | 90 | ||||||
| 261 | |
| Pension | Postretirement | |||||||||||||||
| December�31, 2013 | December�31, 2012 | December�31, 2013 | December�31, 2012 | |||||||||||||
| Discount rate | 4.74 | % | 3.95 | % | 4.75 | % | 3.88 | % | ||||||||
| Rate of future compensation increase | 1.06 | 0.98 | N/A | N/A | ||||||||||||
| December�31, 2013 | December�31, 2012 | |||||||
| Health care cost trend rate assumed for next year: | ||||||||
| Medical | 6.90-7.38% | 6.93-7.53% | ||||||
| Prescription | 8.25% | 8.66% | ||||||
| Rate to which the cost trend rate is assumed to decline (ultimate trend rate) | 4.50% | 4.50% | ||||||
| Year that the rate reaches the ultimate trend rate | 2029 | 2029 | ||||||
| One-Percentage Point Increase | One-Percentage Point�(Decrease) | |||||||
| (dollars�in�millions) | ||||||||
| Effect on total postretirement service and interest cost | $ | 2 | $ | (1 | ) | |||
| Effect on postretirement benefit obligation | 19 | (11 | ) | |||||
| | 262 |
| � | Derivatives may be used only if they are deemed by the investment manager to be more attractive than a similar direct investment in the underlying cash market or if the vehicle is being used to manage risk of the portfolio. |
| � | Derivatives may not be used in a speculative manner or to leverage the portfolio under any circumstances. |
| � | Derivatives may not be used as short-term trading vehicles. The investment philosophy of the U.S. Qualified Plan is that investment activity is undertaken for long-term investment rather than short-term trading. |
| � | Derivatives may be used in the management of the U.S. Qualified Plan�s portfolio only when their possible effects can be quantified, shown to enhance the risk-return profile of the portfolio, and reported in a meaningful and understandable manner. |
| 263 | |
| Quoted�Prices�in Active�Markets�for Identical Assets (Level 1) | Significant Observable�Inputs (Level 2) | Significant Unobservable Inputs�(Level�3) | Total | |||||||||||||
| (dollars�in�millions) | ||||||||||||||||
| Assets: | ||||||||||||||||
| Investments: | ||||||||||||||||
| Cash and cash equivalents(1) | $ | 91 | $ | � | $ | � | $ | 91 | ||||||||
| U.S. government and agency securities: | ||||||||||||||||
| U.S. Treasury securities | 1,047 | � | � | 1,047 | ||||||||||||
| U.S. agency securities | � | 204 | � | 204 | ||||||||||||
| Total U.S. government and agency securities | 1,047 | 204 | � | 1,251 | ||||||||||||
| Corporate and other debt: | ||||||||||||||||
| State and municipal securities | � | 2 | � | 2 | ||||||||||||
| Collateralized debt obligations | � | 76 | � | 76 | ||||||||||||
| Total corporate and other debt | � | 78 | � | 78 | ||||||||||||
| Derivative contracts(2) | � | 122 | � | 122 | ||||||||||||
| Derivative-related cash collateral receivable | � | 37 | � | 37 | ||||||||||||
| Commingled trust funds(3) | � | 1,004 | � | 1,004 | ||||||||||||
| Foreign funds(4) | 21 | 291 | � | 312 | ||||||||||||
| Other investments | � | 10 | 38 | 48 | ||||||||||||
| Total investments | 1,159 | 1,746 | 38 | 2,943 | ||||||||||||
| Receivables: | ||||||||||||||||
| Other receivables(1) | � | 20 | � | 20 | ||||||||||||
| Total receivables | � | 20 | � | 20 | ||||||||||||
| Total assets | $ | 1,159 | $ | 1,766 | $ | 38 | $ | 2,963 | ||||||||
| Liabilities: | ||||||||||||||||
| Derivative contracts(5) | $ | � | $ | 92 | $ | � | $ | 92 | ||||||||
| Derivative-related cash collateral payable | � | 2 | � | 2 | ||||||||||||
| Other liabilities(1) | � | 2 | � | 2 | ||||||||||||
| Total liabilities | � | 96 | � | 96 | ||||||||||||
| Net pension assets | $ | 1,159 | $ | 1,670 | $ | 38 | $ | 2,867 | ||||||||
| | 264 |
| (1) | Cash and cash equivalents, other receivables and other liabilities are valued at their carrying value, which approximates fair value. |
| (2) | Derivative contracts in an asset position consist of investments in interest rate swaps of $122 million. |
| (3) | Commingled trust funds consist of investments in fixed income funds of $1,004 million. |
| (4) | Foreign funds include investments in corporate bond funds, targeted cash flow funds, liquidity funds, corporate equity funds and diversified funds of $157 million, $77 million, $56 million, $21 million and $1 million, respectively. |
| (5) | Derivative contracts in a liability position consist of investments in interest rate swaps of $92 million. |
| Quoted�Prices�in Active Markets for Identical Assets (Level 1) | Significant Observable�Inputs (Level 2) | Significant Unobservable Inputs�(Level�3) | Total | |||||||||||||
| (dollars�in�millions) | ||||||||||||||||
| Assets: | ||||||||||||||||
| Investments: | ||||||||||||||||
| Cash and cash equivalents(1) | $ | 80 | $ | � | $ | � | $ | 80 | ||||||||
| U.S. government and agency securities: | ||||||||||||||||
| U.S. Treasury securities | 1,354 | � | � | 1,354 | ||||||||||||
| U.S. agency securities | � | 241 | � | 241 | ||||||||||||
| Total U.S. government and agency securities | 1,354 | 241 | � | 1,595 | ||||||||||||
| Corporate and other debt: | ||||||||||||||||
| State and municipal securities | � | 2 | � | 2 | ||||||||||||
| Collateralized debt obligations | � | 71 | � | 71 | ||||||||||||
| Total corporate and other debt | � | 73 | � | 73 | ||||||||||||
| Corporate equities | 20 | � | � | 20 | ||||||||||||
| Derivative contracts(2) | � | 224 | � | 224 | ||||||||||||
| Derivative-related cash collateral receivable | � | 3 | � | 3 | ||||||||||||
| Commingled trust funds(3) | � | 1,275 | � | 1,275 | ||||||||||||
| Foreign funds(4) | � | 282 | � | 282 | ||||||||||||
| Other investments | � | 11 | 30 | 41 | ||||||||||||
| Total investments | 1,454 | 2,109 | 30 | 3,593 | ||||||||||||
| Receivables: | ||||||||||||||||
| Other receivables(1) | � | 71 | � | 71 | ||||||||||||
| Total receivables | � | 71 | � | 71 | ||||||||||||
| Total assets | $ | 1,454 | $ | 2,180 | $ | 30 | $ | 3,664 | ||||||||
| Liabilities: | ||||||||||||||||
| Derivative contracts(5) | $ | � | $ | 57 | $ | � | $ | 57 | ||||||||
| Derivative-related cash collateral payable | � | 28 | � | 28 | ||||||||||||
| Other liabilities(1) | � | 60 | � | 60 | ||||||||||||
| Total liabilities | � | 145 | � | 145 | ||||||||||||
| Net pension assets | $ | 1,454 | $ | 2,035 | $ | 30 | $ | 3,519 | ||||||||
| (1) | Cash and cash equivalents, other receivables and other liabilities are valued at their carrying value, which approximates fair value. |
| (2) | Derivative contracts in an asset position consist of investments in interest rate swaps of $224 million. |
| (3) | Commingled trust funds consist of investments in fixed income funds of $1,275 million. |
| (4) | Foreign funds include investments in corporate bond funds, targeted cash flow funds, liquidity funds and diversified funds of $141 million, $85 million, $55 million and $1 million, respectively. |
| (5) | Derivative contracts in a liability position consist of investments in interest rate swaps of $57 million. |
| 265 | |
| Beginning Balance at January�1, 2013 | Actual Return�on Plan Assets Related to Assets Still Held at December�31, 2013 | Actual Return on� Plan Assets�Related to Assets Sold during�2013 | Purchases, Sales, Other Settlements and�Issuances, net | Net�Transfers In�and/or�(Out) of�Level�3 | Ending Balance at�December� 31, 2013 | |||||||||||||||||||
| (dollars�in�millions) | ||||||||||||||||||||||||
| Investments | ||||||||||||||||||||||||
| Other investments | $ | 30 | $ | 2 | $ | � | $ | 4 | $ | 2 | $ | 38 | ||||||||||||
| Total investments | $ | 30 | $ | 2 | $ | � | $ | 4 | $ | 2 | $ | 38 | ||||||||||||
| Beginning Balance at January�1, 2012 | Actual Return on Plan Assets Related to Assets Still Held at December�31, 2012 | Actual Return on Plan Assets�Related to Assets Sold during 2012 | Purchases, Sales, Other Settlements and Issuances, net | Net�Transfers In�and/or�(Out) of Level 3 | Ending Balance at�December� 31, 2012 | |||||||||||||||||||
| (dollars�in�millions) | ||||||||||||||||||||||||
| Investments | ||||||||||||||||||||||||
| Other investments | $ | 26 | $ | � | $ | � | $ | 4 | $ | � | $ | 30 | ||||||||||||
| Total investments | $ | 26 | $ | � | $ | � | $ | 4 | $ | � | $ | 30 | ||||||||||||
| Pension | Postretirement | |||||||
| (dollars�in�millions) | ||||||||
| 2014 | $ | 129 | $ | 6 | ||||
| 2015 | 128 | 6 | ||||||
| 2016 | 130 | 6 | ||||||
| 2017 | 138 | 7 | ||||||
| 2018 | 137 | 7 | ||||||
| 2019-2023 | 788 | 40 | ||||||
| | 266 |
| 2013 | 2012 | 2011 | ||||||||||
| (dollars�in�millions) | ||||||||||||
| Current: | ||||||||||||
| U.S. federal | $ | 153 | $ | (178 | ) | $ | 35 | |||||
| U.S. state and local | 164 | 140 | 276 | |||||||||
| Non-U.S.: | ||||||||||||
| United Kingdom | 178 | (16 | ) | 169 | ||||||||
| Japan | 88 | 90 | 19 | |||||||||
| Hong Kong | 36 | 16 | (3 | ) | ||||||||
| Other(1) | 301 | 355 | 378 | |||||||||
| $ | 920 | $ | 407 | $ | 874 | |||||||
| Deferred: | ||||||||||||
| U.S. federal | $ | (3 | ) | $ | (748 | ) | $ | 508 | ||||
| U.S. state and local | 1 | (64 | ) | (49 | ) | |||||||
| Non-U.S.: | ||||||||||||
| United Kingdom | (75 | ) | 77 | 32 | ||||||||
| Japan | 262 | 170 | 41 | |||||||||
| Hong Kong | (14 | ) | 35 | 27 | ||||||||
| Other(1) | (265 | ) | (114 | ) | (19 | ) | ||||||
| $ | (94 | ) | $ | (644 | ) | $ | 540 | |||||
| Provision for (benefit from) income taxes from continuing operations | $ | 826 | $ | (237 | ) | $ | 1,414 | |||||
| Provision for (benefit from) income taxes from discontinued operations | $ | (29 | ) | $ | (7 | ) | $ | (119 | ) | |||
| (1) | Results for 2013 Non-U.S. other jurisdictions included significant total tax provisions (benefits) of $59 million, $54 million, and $(156) million from Brazil, India, and Luxembourg, respectively. Results for 2012 Non-U.S. other jurisdictions included significant total tax provisions (benefits) of $43 million, $36 million, $36 million, $33 million, $32 million, and $(31) million from India, Brazil, Spain, Canada, Singapore, and Netherlands, respectively. Results for 2011 Non-U.S. other jurisdictions included significant total tax provisions of $98 million, $78 million, $68 million, and $27 million from Brazil, Netherlands, Spain, and India, respectively. |
| 267 | |
| 2013 | 2012(1) | 2011 | ||||||||||
| U.S. federal statutory income tax rate | 35.0 | % | 35.0 | % | 35.0 | % | ||||||
| U.S. state and local income taxes, net of U.S. federal income tax benefits | 2.4 | 8.6 | 2.6 | |||||||||
| Domestic tax credits | (4.3 | ) | (42.7 | ) | (3.9 | ) | ||||||
| Tax exempt income | (2.5 | ) | (29.9 | ) | (0.3 | ) | ||||||
| Non-U.S. earnings: | ||||||||||||
| Foreign Tax Rate Differential | (6.1 | ) | (14.0 | ) | 0.7 | |||||||
| Change in Reinvestment Assertion | (1.4 | ) | 4.8 | (2.2 | ) | |||||||
| Change in Foreign Tax Rates | 0.1 | (0.3 | ) | 1.6 | ||||||||
| Valuation allowance | � | � | (7.3 | ) | ||||||||
| Other | (4.8 | ) | (7.1 | ) | (3.1 | ) | ||||||
| Effective income tax rate | 18.4 | % | (45.6 | )% | 23.1 | % | ||||||
| (1) | 2012 percentages are reflective of the lower level of income from continuing operations before income taxes on a comparative basis due to the change in the fair value of certain of the Company�s long-term and short-term borrowings resulting from fluctuations in its credit spreads and other credit factors. |
| | 268 |
| December�31, 2013 | December�31, 2012 | |||||||
| (dollars�in�millions) | ||||||||
| Gross deferred tax assets: | ||||||||
| Tax credits and loss carryforwards | $ | 5,130 | $ | 6,193 | ||||
| Employee compensation and benefit plans | 2,417 | 2,173 | ||||||
| Valuation and liability allowances | 1,122 | 529 | ||||||
| Valuation of inventory, investments and receivables | 418 | � | ||||||
| Other | � | 158 | ||||||
| Total deferred tax assets | 9,087 | 9,053 | ||||||
| Valuation allowance(1) | 38 | 48 | ||||||
| Deferred tax assets after valuation allowance | $ | 9,049 | $ | 9,005 | ||||
| Gross deferred tax liabilities: | ||||||||
| Non-U.S. operations | $ | 1,293 | $ | 1,253 | ||||
| Fixed assets | 275 | 115 | ||||||
| Valuation of inventory, investments and receivables | � | 351 | ||||||
| Other | 253 | � | ||||||
| Total deferred tax liabilities | $ | 1,821 | $ | 1,719 | ||||
| Net deferred tax assets | $ | 7,228 | $ | 7,286 | ||||
| (1) | The valuation allowance reduces the benefit of certain separate Company federal net operating loss and state capital loss carryforwards to the amount that will more likely than not be realized. |
| 269 | |
| 2013 | 2012 | 2011 | ||||||||||
| (dollars in millions) | ||||||||||||
| U.S. | $ | 1,662 | $ | (1,241 | ) | $ | 3,250 | |||||
| Non-U.S.(1) | 2,820 | 1,761 | 2,860 | |||||||||
| $ | 4,482 | $ | 520 | $ | 6,110 | |||||||
| (1) | Non-U.S. income is defined as income generated from operations located outside the U.S. |
| | 270 |
| Unrecognized Tax Benefits | ||||
| Balance at December�31, 2010 | $ | 3,711 | ||
| Increase based on tax positions related to the current period | 412 | |||
| Increase based on tax positions related to prior periods | 70 | |||
| Decreases based on tax positions related to prior periods | (79 | ) | ||
| Decreases related to settlements with taxing authorities | (56 | ) | ||
| Decreases related to a lapse of applicable statute of limitations | (13 | ) | ||
| Balance at December�31, 2011 | $ | 4,045 | ||
| Increase based on tax positions related to the current period | $ | 299 | ||
| Increase based on tax positions related to prior periods | 127 | |||
| Decreases based on tax positions related to prior periods | (21 | ) | ||
| Decreases related to settlements with taxing authorities | (260 | ) | ||
| Decreases related to a lapse of applicable statute of limitations | (125 | ) | ||
| Balance at December�31, 2012 | $ | 4,065 | ||
| Increase based on tax positions related to the current period | $ | 51 | ||
| Increase based on tax positions related to prior periods | 267 | |||
| Decreases based on tax positions related to prior periods | (141 | ) | ||
| Decreases related to settlements with taxing authorities | (146 | ) | ||
| Balance at December�31, 2013 | $ | 4,096 | ||
| 271 | |
| Jurisdiction | Tax�Year | |||
| United States | 1999 | |||
| New York State and City | 2007 | |||
| Hong Kong | 2007 | |||
| United Kingdom | 2010 | |||
| Japan | 2012 | |||
| | 272 |
| 2013 | Institutional Securities | Wealth Management | Investment Management | Intersegment Eliminations | Total | |||||||||||||||
| (dollars in millions) | ||||||||||||||||||||
| Total non-interest revenues | $ | 16,544 | $ | 12,334 | $ | 2,994 | $ | (233 | ) | $ | 31,639 | |||||||||
| Interest income | 3,572 | 2,100 | 9 | (472 | ) | 5,209 | ||||||||||||||
| Interest expense | 4,673 | 220 | 15 | (477 | ) | 4,431 | ||||||||||||||
| Net interest | (1,101 | ) | 1,880 | (6 | ) | 5 | 778 | |||||||||||||
| Net revenues | $ | 15,443 | $ | 14,214 | $ | 2,988 | $ | (228 | ) | $ | 32,417 | |||||||||
| Income from continuing operations before income taxes | $ | 869 | $ | 2,629 | $ | 984 | $ | � | $ | 4,482 | ||||||||||
| Provision for income taxes | (393 | ) | 920 | 299 | � | 826 | ||||||||||||||
| Income from continuing operations | 1,262 | 1,709 | 685 | � | 3,656 | |||||||||||||||
| Discontinued operations(1): | ||||||||||||||||||||
| Gain (loss) from discontinued operations | (81 | ) | (1 | ) | 9 | 1 | (72 | ) | ||||||||||||
| Provision for (benefit from) income taxes | (29 | ) | � | � | � | (29 | ) | |||||||||||||
| Net gain (loss) on discontinued operations | (52 | ) | (1 | ) | 9 | 1 | (43 | ) | ||||||||||||
| Net income | 1,210 | 1,708 | 694 | 1 | 3,613 | |||||||||||||||
| Net income applicable to redeemable noncontrolling interests | 1 | 221 | � | � | 222 | |||||||||||||||
| Net income applicable to nonredeemable noncontrolling interests | 277 | � | 182 | � | 459 | |||||||||||||||
| Net income applicable to Morgan Stanley | $ | 932 | $ | 1,487 | $ | 512 | $ | 1 | $ | 2,932 | ||||||||||
| 273 | |
| 2012 | Institutional Securities(3) | Wealth Management(3) | Investment Management | Intersegment Eliminations | Total | |||||||||||||||
| (dollars in millions) | ||||||||||||||||||||
| Total non-interest revenues | $ | 12,772 | $ | 11,467 | $ | 2,243 | $ | (175 | ) | $ | 26,307 | |||||||||
| Interest income | 4,224 | 1,886 | 10 | (428 | ) | 5,692 | ||||||||||||||
| Interest expense | 5,971 | 319 | 34 | (427 | ) | 5,897 | ||||||||||||||
| Net interest | (1,747 | ) | 1,567 | (24 | ) | (1 | ) | (205 | ) | |||||||||||
| Net revenues | $ | 11,025 | $ | 13,034 | $ | 2,219 | $ | (176 | ) | $ | 26,102 | |||||||||
| Income (loss) from continuing operations before income taxes | $ | (1,688 | ) | $ | 1,622 | $ | 590 | $ | (4 | ) | $ | 520 | ||||||||
| Provision for (benefit from) income taxes(2) | (1,061 | ) | 557 | 267 | � | (237 | ) | |||||||||||||
| Income (loss) from continuing operations | (627 | ) | 1,065 | 323 | (4 | ) | 757 | |||||||||||||
| Discontinued operations(1): | ||||||||||||||||||||
| Gain (loss) from discontinued operations | (158 | ) | 94 | 13 | 3 | (48 | ) | |||||||||||||
| Provision for (benefit from) income taxes | (36 | ) | 26 | 4 | (1 | ) | (7 | ) | ||||||||||||
| Net gain (loss) on discontinued operations | (122 | ) | 68 | 9 | 4 | (41 | ) | |||||||||||||
| Net income (loss) | (749 | ) | 1,133 | 332 | � | 716 | ||||||||||||||
| Net income applicable to redeemable noncontrolling interests | 4 | 120 | � | � | 124 | |||||||||||||||
| Net income applicable to nonredeemable noncontrolling interests | 170 | 167 | 187 | � | 524 | |||||||||||||||
| Net income (loss) applicable to Morgan Stanley | $ | (923 | ) | $ | 846 | $ | 145 | $ | � | $ | 68 | |||||||||
| | 274 |
| 2011 | Institutional Securities(3) | Wealth Management(3) | Investment Management | Intersegment Eliminations | Total | |||||||||||||||
| (dollars in millions) | ||||||||||||||||||||
| Total non-interest revenues(4) | $ | 18,723 | $ | 11,340 | $ | 1,928 | $ | (115 | ) | $ | 31,876 | |||||||||
| Interest income | 5,860 | 1,719 | 10 | (355 | ) | 7,234 | ||||||||||||||
| Interest expense | 6,900 | 287 | 51 | (355 | ) | 6,883 | ||||||||||||||
| Net interest | (1,040 | ) | 1,432 | (41 | ) | � | 351 | |||||||||||||
| Net revenues | $ | 17,683 | $ | 12,772 | $ | 1,887 | $ | (115 | ) | $ | 32,227 | |||||||||
| Income from continuing operations before�income taxes | $ | 4,550 | $ | 1,307 | $ | 253 | $ | � | $ | 6,110 | ||||||||||
| Provision for income taxes | 880 | 461 | 73 | � | 1,414 | |||||||||||||||
| Income from continuing operations | 3,670 | 846 | 180 | � | 4,696 | |||||||||||||||
| Discontinued operations(1): | ||||||||||||||||||||
| Gain (loss) from discontinued operations | (216 | ) | 21 | 24 | 1 | (170 | ) | |||||||||||||
| Provision for (benefit from) income taxes | (110 | ) | 7 | (17 | ) | 1 | (119 | ) | ||||||||||||
| Net gain (loss) from discontinued operations | (106 | ) | 14 | 41 | � | (51 | ) | |||||||||||||
| Net income | 3,564 | 860 | 221 | � | 4,645 | |||||||||||||||
| Net income applicable to nonredeemable noncontrolling interests | 220 | 170 | 145 | � | 535 | |||||||||||||||
| Net income applicable to Morgan Stanley | $ | 3,344 | $ | 690 | $ | 76 | $ | � | $ | 4,110 | ||||||||||
| (1) | See Note 1 for discussion of discontinued operations. |
| (2) | Results for 2012 included an out-of-period net tax provision of $107 million, attributable to the Investment Management business segment, related to the overstatement of deferred tax assets associated with partnership investments in prior years and an out-of-period net tax provision of $50 million, attributable to the Institutional Securities business segment, related to the overstatement of deferred tax assets associated with repatriated earnings of a foreign subsidiary recorded in prior years (see Note 20). |
| (3) | On January�1, 2013, the International Wealth Management business was transferred from the Wealth Management business segment to the Equity division within the Institutional Securities business segment. Accordingly, prior-period amounts have been recast to reflect the International Wealth Management business as part of the Institutional Securities business segment. |
| (4) | In the fourth quarter of 2011, the Company recognized a pre-tax loss of approximately $108 million, in net revenues upon application of the OIS curve within the Institutional Securities business segment (see Note 4). |
| Total Assets(1) | Institutional Securities(2) | Wealth Management(2) | Investment Management | Total | ||||||||||||
| (dollars in millions) | ||||||||||||||||
| At December�31, 2013 | $ | 668,596 | $ | 156,711 | $ | 7,395 | $ | 832,702 | ||||||||
| At December�31, 2012 | $ | 648,049 | $ | 125,565 | $ | 7,346 | $ | 780,960 | ||||||||
| (1) | Corporate assets have been fully allocated to the Company�s business segments. |
| (2) | Prior-period amounts have been recast to reflect the transfer of the International Wealth Management business from the Wealth Management business segment to the Institutional Securities business segment. |
| 275 | |
| � | Institutional Securities: advisory and equity underwriting�client location, debt underwriting�revenue recording location, sales�and trading�trading desk location. |
| � | Wealth Management: wealth management representative coverage location. |
| � | Investment Management: client location, except for Merchant Banking and Real Estate Investing businesses, which are based on asset location. |
| Net Revenues | 2013 | 2012 | 2011 | |||||||||
| (dollars�in�millions) | ||||||||||||
| Americas | $ | 23,282 | $ | 20,200 | $ | 22,306 | ||||||
| EMEA | 4,542 | 3,078 | 6,619 | |||||||||
| Asia | 4,593 | 2,824 | 3,302 | |||||||||
| Net revenues | $ | 32,417 | $ | 26,102 | $ | 32,227 | ||||||
| Total Assets | At�December�31, 2013 | At�December�31, 2012 | ||||||
| (dollars�in�millions) | ||||||||
| Americas | $ | 632,255 | $ | 587,993 | ||||
| EMEA | 123,008 | 122,152 | ||||||
| Asia | 77,439 | 70,815 | ||||||
| Total | $ | 832,702 | $ | 780,960 | ||||
| Book Value(1) | ||||||||||||
| Percent Ownership | December�31, 2013 | December�31, 2012 | ||||||||||
| (dollars in millions) | ||||||||||||
| Mitsubishi UFJ Morgan Stanley Securities Co., Ltd. | 40 | % | $ | 1,610 | $ | 1,428 | ||||||
| Lansdowne Partners(2) | 19.8 | % | 221 | 221 | ||||||||
| Avenue Capital Group(2)(3) | � | 198 | 224 | |||||||||
| | 276 |
| (1) | Book value of these investees exceeds the Company�s share of net assets, reflecting equity method intangible assets and equity method goodwill. |
| (2) | The Company�s ownership interest represents limited partnership interests. The Company is deemed to have significant influence in these limited partnerships, as the Company�s limited partnership interests were above the 3% to 5% threshold for interests that should be accounted for under the equity method. |
| (3) | The Company�s ownership interest represents limited partnership interests in a number of different entities within the Avenue Capital Group. |
| At December�31, | ||||||||
| 2013 | 2012 | |||||||
| (dollars in millions) | ||||||||
| Total assets | $ | 118,108 | $ | 141,635 | ||||
| Total liabilities | 114,648 | 138,742 | ||||||
| Noncontrolling interests | 13 | 41 | ||||||
| 2013 | 2012 | 2011 | ||||||||||
| (dollars in millions) | ||||||||||||
| Net revenues | $ | 3,305 | $ | 2,365 | $ | 735 | ||||||
| Income (loss) from continuing operations before income taxes | 1,325 | 333 | (1,746 | ) | ||||||||
| Net income (loss) | 1,459 | 405 | (1,976 | ) | ||||||||
| Net income (loss) applicable to MUMSS | 1,441 | 397 | (1,976 | ) | ||||||||
| 277 | |
| | 278 |
| December�31, 2013 | December�31, 2012 | |||||||
| Assets | ||||||||
| Cash and due from banks | $ | 2,296 | $ | 1,342 | ||||
| Deposits with banking subsidiaries | 7,070 | 8,222 | ||||||
| Interest bearing deposits with banks | 6,846 | 4,165 | ||||||
| Trading assets, at fair value | 9,704 | 2,930 | ||||||
| Securities purchased under agreement to resell with affiliate | 33,748 | 48,493 | ||||||
| Advances to subsidiaries: | ||||||||
| Bank and bank holding company | 17,015 | 16,731 | ||||||
| Non-bank | 114,833 | 115,949 | ||||||
| Equity investments in subsidiaries: | ||||||||
| Bank and bank holding company | 24,144 | 23,511 | ||||||
| Non-bank | 34,968 | 32,591 | ||||||
| Other assets | 7,508 | 7,201 | ||||||
| Total assets | $ | 258,132 | $ | 261,135 | ||||
| Liabilities | ||||||||
| Commercial paper and other short-term borrowings | $ | 506 | $ | 228 | ||||
| Trading liabilities, at fair value | 1,135 | 1,117 | ||||||
| Payables to subsidiaries | 43,420 | 36,733 | ||||||
| Other liabilities and accrued expenses | 3,312 | 3,132 | ||||||
| Long-term borrowings | 143,838 | 157,816 | ||||||
| Total liabilities | 192,211 | 199,026 | ||||||
| Commitments and contingent liabilities | ||||||||
| Equity | ||||||||
| Preferred stock (see Note 15) | 3,220 | 1,508 | ||||||
| Common stock, $0.01 par value: | ||||||||
| Shares authorized: 3,500,000,000 at December 31, 2013 and December 31, 2012; | ||||||||
| Shares issued: 2,038,893,979 at December 31, 2013 and December 31, 2012; | ||||||||
| Shares outstanding: 1,944,868,751 at December 31, 2013 and 1,974,042,123 at December 31, 2012 | 20 | 20 | ||||||
| Additional paid-in capital | 24,570 | 23,426 | ||||||
| Retained earnings | 42,172 | 39,912 | ||||||
| Employee stock trusts | 1,718 | 2,932 | ||||||
| Accumulated other comprehensive loss | (1,093 | ) | (516 | ) | ||||
| Common stock held in treasury, at cost, $0.01 par value; 94,025,228 shares at December 31, 2013 and 64,851,856 shares at December 31, 2012 | (2,968 | ) | (2,241 | ) | ||||
| Common stock issued to employee stock trusts | (1,718 | ) | (2,932 | ) | ||||
| Total shareholders� equity | 65,921 | 62,109 | ||||||
| Total liabilities and equity | $ | 258,132 | $ | 261,135 | ||||
| 279 | |
| 2013 | 2012 | 2011 | ||||||||||
| Revenues: | ||||||||||||
| Dividends from non-bank subsidiaries | $ | 1,113 | $ | 545 | $ | 7,153 | ||||||
| Trading | (635 | ) | (3,400 | ) | 4,772 | |||||||
| Investments | � | 2 | � | |||||||||
| Other | 27 | 36 | (241 | ) | ||||||||
| Total non-interest revenues | 505 | (2,817 | ) | 11,684 | ||||||||
| Interest income | 2,783 | 3,316 | 3,251 | |||||||||
| Interest expense | 4,053 | 5,190 | 5,600 | |||||||||
| Net interest | (1,270 | ) | (1,874 | ) | (2,349 | ) | ||||||
| Net revenues | (765 | ) | (4,691 | ) | 9,335 | |||||||
| Non-interest expenses: | ||||||||||||
| Non-interest expenses | 185 | 114 | 120 | |||||||||
| Income (loss) before provision for (benefit from) income taxes | (950 | ) | (4,805 | ) | 9,215 | |||||||
| Provision for (benefit from) income taxes | (354 | ) | (1,088 | ) | 1,825 | |||||||
| Net income (loss) before undistributed gain (loss) subsidiaries | (596 | ) | (3,717 | ) | 7,390 | |||||||
| Undistributed gain (loss) of subsidiaries | 3,528 | 3,785 | (3,280 | ) | ||||||||
| Net income | 2,932 | 68 | 4,110 | |||||||||
| Other comprehensive income (loss), net of tax: | ||||||||||||
| Foreign currency translation adjustments | (143 | ) | (128 | ) | (35 | ) | ||||||
| Amortization of cash flow hedges | 4 | 6 | 7 | |||||||||
| Change in net unrealized gains (losses) on securities available for sale | (433 | ) | 28 | 87 | ||||||||
| Pension, postretirement and other related adjustments | (5 | ) | (265 | ) | 251 | |||||||
| Comprehensive income (loss) | $ | 2,355 | $ | (291 | ) | $ | 4,420 | |||||
| Net income | $ | 2,932 | $ | 68 | $ | 4,110 | ||||||
| Preferred stock dividends | 277 | 98 | 2,043 | |||||||||
| Earnings (loss) applicable to Morgan Stanley common shareholders | $ | 2,655 | $ | (30 | ) | $ | 2,067 | |||||
| | 280 |
| 2013 | 2012 | 2011 | ||||||||||
| CASH FLOWS FROM OPERATING ACTIVITIES | ||||||||||||
| Net income | $ | 2,932 | $ | 68 | $ | 4,110 | ||||||
| Adjustments to reconcile net income to net cash provided by (used for) operating activities: | ||||||||||||
| Deferred income taxes | (303 | ) | (1,653 | ) | 279 | |||||||
| Compensation payable in common stock and options | 1,180 | 891 | 1,300 | |||||||||
| Amortization | (47 | ) | 23 | 22 | ||||||||
| Undistributed (gain) loss of subsidiaries | (3,528 | ) | (3,785 | ) | 3,280 | |||||||
| Other non-cash adjustments to net income | � | (29 | ) | (155 | ) | |||||||
| Change in assets and liabilities: | ||||||||||||
| Trading assets, net of Trading liabilities | (7,332 | ) | 9,587 | 81 | ||||||||
| Other assets | (165 | ) | 1,235 | 681 | ||||||||
| Other liabilities and accrued expenses | (4,192 | ) | 6,637 | (4,242 | ) | |||||||
| Net cash provided by (used for) operating activities | (11,455 | ) | 12,974 | 5,356 | ||||||||
| CASH FLOWS FROM INVESTING ACTIVITIES | ||||||||||||
| Advances to and investments in subsidiaries | 7,458 | 6,461 | 10,290 | |||||||||
| Securities purchased under agreement to resell with affiliate | 14,745 | 1,864 | (726 | ) | ||||||||
| Net cash provided by investing activities | 22,203 | 8,325 | 9,564 | |||||||||
| CASH FLOWS FROM FINANCING ACTIVITIES | ||||||||||||
| Net proceeds from (payments for) short-term borrowings | 279 | (872 | ) | (253 | ) | |||||||
| Proceeds from: | ||||||||||||
| Excess tax benefits associated with stock-based awards | 10 | 42 | � | |||||||||
| Issuance of preferred stock, net of issuance costs | 1,696 | � | � | |||||||||
| Issuance of long-term borrowings | 22,944 | 20,582 | 28,106 | |||||||||
| Payments for: | ||||||||||||
| Long-term borrowings | (31,928 | ) | (41,914 | ) | (35,805 | ) | ||||||
| Repurchases of common stock | (691 | ) | (227 | ) | (317 | ) | ||||||
| Cash dividends | (475 | ) | (469 | ) | (834 | ) | ||||||
| Net cash used for financing activities | (8,165 | ) | (22,858 | ) | (9,103 | ) | ||||||
| Effect of exchange rate changes on cash and cash equivalents | (100 | ) | (32 | ) | 113 | |||||||
| Net increase (decrease) in cash and cash equivalents | 2,483 | (1,591 | ) | 5,930 | ||||||||
| Cash and cash equivalents, at beginning of period | 13,729 | 15,320 | 9,390 | |||||||||
| Cash and cash equivalents, at end of period | $ | 16,212 | $ | 13,729 | $ | 15,320 | ||||||
| Cash and cash equivalents include: | ||||||||||||
| Cash and due from banks | $ | 2,296 | $ | 1,342 | $ | 1,804 | ||||||
| Deposits with banking subsidiaries | 7,070 | 8,222 | 10,131 | |||||||||
| Interest bearing deposits with banks | 6,846 | 4,165 | 3,385 | |||||||||
| Cash and cash equivalents, at end of period | $ | 16,212 | $ | 13,729 | $ | 15,320 | ||||||
| 281 | |
| | 282 |
| 2013 Quarter | 2012 Quarter | |||||||||||||||||||||||||||||||
| First | Second | Third | Fourth(1) | First | Second(2) | Third(3) | Fourth(3) | |||||||||||||||||||||||||
| (dollars in millions, except per share data) | ||||||||||||||||||||||||||||||||
| Total non-interest revenues | $ | 7,972 | $ | 8,297 | $ | 7,822 | $ | 7,548 | $ | 6,981 | $ | 7,100 | $ | 5,436 | $ | 6,790 | ||||||||||||||||
| Net interest | 182 | 204 | 110 | 282 | (59 | ) | (161 | ) | (158 | ) | 173 | |||||||||||||||||||||
| Net revenues | 8,154 | 8,501 | 7,932 | 7,830 | 6,922 | 6,939 | 5,278 | 6,963 | ||||||||||||||||||||||||
| Total non-interest expenses | 6,572 | 6,725 | 6,591 | 8,047 | 6,719 | 6,001 | 6,760 | 6,102 | ||||||||||||||||||||||||
| Income (loss) from continuing operations before income taxes | 1,582 | 1,776 | 1,341 | (217 | ) | 203 | 938 | (1,482 | ) | 861 | ||||||||||||||||||||||
| Provision for (benefit from) income taxes | 332 | 556 | 339 | (401 | ) | 54 | 225 | (525 | ) | 9 | ||||||||||||||||||||||
| Income (loss) from continuing operations | 1,250 | 1,220 | 1,002 | 184 | 149 | 713 | (957 | ) | 852 | |||||||||||||||||||||||
| Discontinued operations(4): | ||||||||||||||||||||||||||||||||
| Gain (loss) from discontinued operations | (30 | ) | (42 | ) | 14 | (14 | ) | 27 | 51 | (13 | ) | (113 | ) | |||||||||||||||||||
| Provision for (benefit from) income taxes | (11 | ) | (13 | ) | (2 | ) | (3 | ) | 42 | 14 | (14 | ) | (49 | ) | ||||||||||||||||||
| Net gain (loss) from discontinued operations | (19 | ) | (29 | ) | 16 | (11 | ) | (15 | ) | 37 | 1 | (64 | ) | |||||||||||||||||||
| Net income (loss) | 1,231 | 1,191 | 1,018 | 173 | 134 | 750 | (956 | ) | 788 | |||||||||||||||||||||||
| Net income applicable to redeemable noncontrolling interests | 122 | 100 | � | � | � | � | 8 | 116 | ||||||||||||||||||||||||
| Net income applicable to nonredeemable noncontrolling interests | 147 | 111 | 112 | 89 | 228 | 159 | 59 | 78 | ||||||||||||||||||||||||
| Net income (loss) applicable to Morgan Stanley | $ | 962 | $ | 980 | $ | 906 | $ | 84 | $ | (94 | ) | $ | 591 | $ | (1,023 | ) | $ | 594 | ||||||||||||||
| Preferred stock dividends | 26 | 177 | 26 | 48 | 25 | 27 | 24 | 26 | ||||||||||||||||||||||||
| Earnings (loss) applicable to Morgan Stanley common shareholders | $ | 936 | $ | 803 | $ | 880 | $ | 36 | $ | (119 | ) | $ | 564 | $ | (1,047 | ) | $ | 568 | ||||||||||||||
| Earnings (loss) per basic common share(5): | ||||||||||||||||||||||||||||||||
| Income (loss) from continuing operations | $ | 0.50 | $ | 0.44 | $ | 0.45 | $ | 0.02 | $ | (0.05 | ) | $ | 0.28 | $ | (0.55 | ) | $ | 0.34 | ||||||||||||||
| Net gain (loss) from discontinued operations | (0.01 | ) | (0.02 | ) | 0.01 | � | (0.01 | ) | 0.02 | � | (0.04 | ) | ||||||||||||||||||||
| Earnings (loss) per basic common share | $ | 0.49 | $ | 0.42 | $ | 0.46 | $ | 0.02 | $ | (0.06 | ) | $ | 0.30 | $ | (0.55 | ) | $ | 0.30 | ||||||||||||||
| Earnings (loss) per diluted common share(5): | ||||||||||||||||||||||||||||||||
| Income (loss) from continuing operations | $ | 0.49 | $ | 0.43 | $ | 0.44 | $ | 0.02 | $ | (0.05 | ) | $ | 0.28 | $ | (0.55 | ) | $ | 0.33 | ||||||||||||||
| Net gain (loss) from discontinued operations | (0.01 | ) | (0.02 | ) | 0.01 | � | (0.01 | ) | 0.01 | � | (0.04 | ) | ||||||||||||||||||||
| Earnings (loss) per diluted common share | $ | 0.48 | $ | 0.41 | $ | 0.45 | $ | 0.02 | $ | (0.06 | ) | $ | 0.29 | $ | (0.55 | ) | $ | 0.29 | ||||||||||||||
| Dividends declared per common share | $ | 0.05 | $ | 0.05 | $ | 0.05 | $ | 0.05 | $ | 0.05 | $ | 0.05 | $ | 0.05 | $ | 0.05 | ||||||||||||||||
| Book value per common share | $ | 31.21 | $ | 31.48 | $ | 32.13 | $ | 32.24 | $ | 30.74 | $ | 31.02 | $ | 30.53 | $ | 30.70 | ||||||||||||||||
| (1) | The fourth quarter of 2013 included a discrete tax benefit of $192 million, consisting of $100 million related to the remeasurement of reserves and related interest and $92 million related to the establishment of a previously unrecognized deferred tax asset associated with the reorganization of certain non-U.S. legal entities (see Note 20). The fourth quarter of 2013 included litigation expenses of $1.4 billion related to settlements and reserve additions (see Note�13). |
| (2) | The second quarter of 2012 included an out-of-period pre-tax gain of approximately $300 million related to the reversal of amounts recorded in cumulative other comprehensive income due to the incorrect application of hedge accounting on certain derivative contracts previously designated as net investment hedges of certain foreign, non-U.S. dollar denominated subsidiaries. This amount included a pre-tax gain of approximately $191 million related to the first quarter of 2012, with the remainder impacting prior periods (see Note 12). |
| (3) | The third quarter of 2012 included an out-of-period net tax provision of $82 million primarily related to the overstatement of tax benefits associated with repatriated earnings of a foreign subsidiary in prior periods, while the fourth quarter of 2012 included an out-of-period net tax provision of $75 million primarily related to the overstatement of deferred tax assets associated with partnership investments in prior periods (see Note 20). |
| (4) | See Note 1 for more information on discontinued operations. |
| (5) | Summation of the quarters� earnings per common share may not equal the annual amounts due to the averaging effect of the number of shares and share equivalents throughout the year. |
| 283 | |
| | 284 |
| 2013 | ||||||||||||
| Average Weekly Balance | Interest | Average Rate | ||||||||||
| (dollars in millions) | ||||||||||||
| Assets | ||||||||||||
| Interest earning assets: | ||||||||||||
| Trading assets(1): | ||||||||||||
| U.S. | $ | 119,549 | $ | 1,948 | 1.6 | % | ||||||
| Non-U.S. | 103,774 | 344 | 0.3 | |||||||||
| Securities available for sale: | ||||||||||||
| U.S. | 44,112 | 447 | 1.0 | |||||||||
| Loans: | ||||||||||||
| U.S. | 33,939 | 1,052 | 3.1 | |||||||||
| Non-U.S. | 489 | 69 | 14.1 | |||||||||
| Interest bearing deposits with banks: | ||||||||||||
| U.S. | 34,636 | 86 | 0.2 | |||||||||
| Non-U.S. | 7,609 | 43 | 0.6 | |||||||||
| Federal funds sold and securities purchased under agreements to resell and Securities borrowed: | ||||||||||||
| U.S. | 203,742 | (217 | ) | (0.1 | ) | |||||||
| Non-U.S. | 77,713 | 197 | 0.3 | |||||||||
| Other: | ||||||||||||
| U.S. | 62,028 | 751 | 1.2 | |||||||||
| Non-U.S. | 19,077 | 489 | 2.6 | |||||||||
| Total | $ | 706,668 | $ | 5,209 | 0.7 | % | ||||||
| Non-interest earning assets | 121,793 | |||||||||||
| Total assets | $ | 828,461 | ||||||||||
| Liabilities and Equity | ||||||||||||
| Interest bearing liabilities: | ||||||||||||
| Deposits: | ||||||||||||
| U.S. | $ | 91,713 | $ | 159 | 0.2 | % | ||||||
| Non-U.S. | 260 | � | � | |||||||||
| Commercial paper and other short-term borrowings: | ||||||||||||
| U.S. | 964 | 2 | 0.2 | |||||||||
| Non-U.S. | 1,063 | 18 | 1.7 | |||||||||
| Long-term debt: | ||||||||||||
| U.S. | 152,532 | 3,696 | 2.4 | |||||||||
| Non-U.S. | 9,857 | 62 | 0.6 | |||||||||
| Trading liabilities(1): | ||||||||||||
| U.S. | 31,861 | � | � | |||||||||
| Non-U.S. | 59,200 | � | � | |||||||||
| Securities sold under agreements to repurchase and Securities loaned: | ||||||||||||
| U.S. | 108,896 | 681 | 0.6 | |||||||||
| Non-U.S. | 66,697 | 788 | 1.2 | |||||||||
| Other: | ||||||||||||
| U.S. | 98,335 | (1,117 | ) | (1.1 | ) | |||||||
| Non-U.S. | 37,679 | 142 | 0.4 | |||||||||
| Total | $ | 659,057 | $ | 4,431 | 0.7 | |||||||
| Non-interest bearing liabilities and equity | 169,404 | |||||||||||
| Total liabilities and equity | $ | 828,461 | ||||||||||
| Net interest income and net interest rate spread | $ | 778 | � | % | ||||||||
| (1) | Interest expense on Trading liabilities is reported as a reduction of Interest income on Trading assets. |
| 285 | |
| 2012 | ||||||||||||
| Average Weekly Balance | Interest | Average Rate | ||||||||||
| (dollars in millions) | ||||||||||||
| Assets | ||||||||||||
| Interest earning assets: | ||||||||||||
| Trading assets(1): | ||||||||||||
| U.S. | $ | 133,615 | $ | 2,247 | 1.7 | % | ||||||
| Non-U.S. | 82,019 | 489 | 0.6 | |||||||||
| Securities available for sale: | ||||||||||||
| U.S. | 35,141 | 343 | 1.0 | |||||||||
| Loans: | ||||||||||||
| U.S. | 20,996 | 597 | 2.8 | |||||||||
| Non-U.S. | 363 | 46 | 12.7 | |||||||||
| Interest bearing deposits with banks: | ||||||||||||
| U.S. | 25,905 | 58 | 0.2 | |||||||||
| Non-U.S. | 10,612 | 66 | 0.6 | |||||||||
| Federal funds sold and securities purchased under agreements to resell and Securities borrowed: | ||||||||||||
| U.S. | 189,186 | (315 | ) | (0.2 | ) | |||||||
| Non-U.S. | 91,851 | 679 | 0.7 | |||||||||
| Other: | ||||||||||||
| U.S. | 54,651 | 471 | 0.9 | |||||||||
| Non-U.S. | 15,404 | 1,011 | 6.6 | |||||||||
| Total | $ | 659,743 | $ | 5,692 | 0.9 | % | ||||||
| Non-interest earning assets | 122,428 | |||||||||||
| Total assets | $ | 782,171 | ||||||||||
| Liabilities and Equity | ||||||||||||
| Interest bearing liabilities: | ||||||||||||
| Deposits: | ||||||||||||
| U.S. | $ | 69,265 | $ | 181 | 0.3 | % | ||||||
| Non-U.S. | 165 | � | � | |||||||||
| Commercial paper and other short-term borrowings: | ||||||||||||
| U.S. | 557 | 5 | 0.9 | |||||||||
| Non-U.S. | 1,383 | 33 | 2.4 | |||||||||
| Long-term debt: | ||||||||||||
| U.S. | 163,961 | 4,544 | 2.8 | |||||||||
| Non-U.S. | 7,552 | 78 | 1.0 | |||||||||
| Trading liabilities(1): | ||||||||||||
| U.S. | 38,125 | � | � | |||||||||
| Non-U.S. | 51,834 | � | � | |||||||||
| Securities sold under agreements to repurchase and Securities loaned: | ||||||||||||
| U.S. | 101,210 | 522 | 0.5 | |||||||||
| Non-U.S. | 59,932 | 1,283 | 2.1 | |||||||||
| Other: | ||||||||||||
| U.S. | 82,881 | (1,475 | ) | (1.8 | ) | |||||||
| Non-U.S. | 33,992 | 726 | 2.1 | |||||||||
| Total | $ | 610,857 | $ | 5,897 | 1.0 | |||||||
| Non-interest bearing liabilities and equity | 171,314 | |||||||||||
| Total liabilities and equity | $ | 782,171 | ||||||||||
| Net interest income and net interest rate spread | $ | (205 | ) | (0.1 | )% | |||||||
| (1) | Interest expense on Trading liabilities is reported as a reduction of Interest income on Trading assets. |
| | 286 |
| 2011 | ||||||||||||
| Average Weekly Balance | Interest | Average Rate | ||||||||||
| (dollars in millions) | ||||||||||||
| Assets | ||||||||||||
| Interest earning assets: | ||||||||||||
| Trading assets(1): | ||||||||||||
| U.S. | $ | 122,704 | $ | 2,636 | 2.1 | % | ||||||
| Non-U.S. | 114,445 | 957 | 0.8 | |||||||||
| Securities available for sale: | ||||||||||||
| U.S. | 27,712 | 348 | 1.3 | |||||||||
| Loans: | ||||||||||||
| U.S. | 12,294 | 326 | 2.7 | |||||||||
| Non-U.S. | 420 | 30 | 7.1 | |||||||||
| Interest bearing deposits with banks: | ||||||||||||
| U.S. | 41,256 | 49 | 0.1 | |||||||||
| Non-U.S. | 16,558 | 137 | 0.8 | |||||||||
| Federal funds sold and securities purchased under agreements to resell and Securities borrowed: | ||||||||||||
| U.S. | 191,843 | (79 | ) | � | ||||||||
| Non-U.S. | 110,682 | 965 | 0.9 | |||||||||
| Other: | ||||||||||||
| U.S. | 45,336 | 1,335 | 2.9 | |||||||||
| Non-U.S. | 15,454 | 530 | 3.4 | |||||||||
| Total | $ | 698,704 | $ | 7,234 | 1.0 | % | ||||||
| Non-interest earning assets | 140,131 | |||||||||||
| Total assets | $ | 838,835 | ||||||||||
| Liabilities and Equity | ||||||||||||
| Interest bearing liabilities: | ||||||||||||
| Deposits: | ||||||||||||
| U.S. | $ | 64,559 | $ | 236 | 0.4 | % | ||||||
| Non-U.S. | 91 | � | � | |||||||||
| Commercial paper and other short-term borrowings: | ||||||||||||
| U.S. | 874 | 7 | 0.8 | |||||||||
| Non-U.S. | 2,163 | 34 | 1.6 | |||||||||
| Long-term debt: | ||||||||||||
| U.S. | 184,623 | 4,880 | 2.6 | |||||||||
| Non-U.S. | 7,701 | 32 | 0.4 | |||||||||
| Trading liabilities(1): | ||||||||||||
| U.S. | 30,070 | � | � | |||||||||
| Non-U.S. | 61,313 | � | � | |||||||||
| Securities sold under agreements to repurchase and Securities loaned: | ||||||||||||
| U.S. | 110,270 | 649 | 0.6 | |||||||||
| Non-U.S. | 69,276 | 1,276 | 1.8 | |||||||||
| Other: | ||||||||||||
| U.S. | 90,193 | (1,094 | ) | (1.2 | ) | |||||||
| Non-U.S. | 38,139 | 863 | 2.3 | |||||||||
| Total | $ | 659,272 | $ | 6,883 | 1.0 | |||||||
| Non-interest bearing liabilities and equity | 179,563 | |||||||||||
| Total liabilities and equity | $ | 838,835 | ||||||||||
| Net interest income and net interest rate spread | $ | 351 | � | % | ||||||||
| (1) | Interest expense on Trading liabilities is reported as a reduction of Interest income on Trading assets. |
| 287 | |
| 2013�versus�2012 | ||||||||||||
| Increase�(decrease)�due�to�change�in: | ||||||||||||
| Volume | Rate | Net�Change | ||||||||||
| (dollars in millions) | ||||||||||||
| Interest earning assets | ||||||||||||
| Trading assets: | ||||||||||||
| U.S. | $ | (237 | ) | $ | (62 | ) | $ | (299 | ) | |||
| Non-U.S. | 130 | (275 | ) | (145 | ) | |||||||
| Securities available for sale: | ||||||||||||
| U.S. | 88 | 16 | 104 | |||||||||
| Loans: | ||||||||||||
| U.S. | 368 | 87 | 455 | |||||||||
| Non-U.S. | 16 | 7 | 23 | |||||||||
| Interest bearing deposits with banks: | ||||||||||||
| U.S. | 20 | 8 | 28 | |||||||||
| Non-U.S. | (19 | ) | (4 | ) | (23 | ) | ||||||
| Federal funds sold and securities purchased under agreements to resell and Securities borrowed: | ||||||||||||
| U.S. | (24 | ) | 122 | 98 | ||||||||
| Non-U.S. | (105 | ) | (377 | ) | (482 | ) | ||||||
| Other: | ||||||||||||
| U.S. | 64 | 216 | 280 | |||||||||
| Non-U.S. | 241 | (763 | ) | (522 | ) | |||||||
| Change in interest income | $ | 542 | $ | (1,025 | ) | $ | (483 | ) | ||||
| Interest bearing liabilities | ||||||||||||
| Deposits: | ||||||||||||
| U.S. | $ | 59 | $ | (81 | ) | $ | (22 | ) | ||||
| Commercial paper and other short-term borrowings: | ||||||||||||
| U.S. | 4 | (7 | ) | (3 | ) | |||||||
| Non-U.S. | (8 | ) | (7 | ) | (15 | ) | ||||||
| Long-term debt: | ||||||||||||
| U.S. | (317 | ) | (531 | ) | (848 | ) | ||||||
| Non-U.S. | 24 | (40 | ) | (16 | ) | |||||||
| Securities sold under agreements to repurchase and Securities loaned: | ||||||||||||
| U.S. | 40 | 119 | 159 | |||||||||
| Non-U.S. | 145 | (640 | ) | (495 | ) | |||||||
| Other: | ||||||||||||
| U.S. | (276 | ) | 634 | 358 | ||||||||
| Non-U.S. | 79 | (663 | ) | (584 | ) | |||||||
| Change in interest expense | $ | (250 | ) | $ | (1,216 | ) | $ | (1,466 | ) | |||
| Change in net interest income | $ | 792 | $ | 191 | $ | 983 | ||||||
| | 288 |
| 2012�versus�2011 | ||||||||||||
| Increase�(decrease)�due�to�change�in: | ||||||||||||
| Volume | Rate | Net�Change | ||||||||||
| (dollars in millions) | ||||||||||||
| Interest earning assets | ||||||||||||
| Trading assets: | ||||||||||||
| U.S. | $ | 234 | $ | (623 | ) | $ | (389 | ) | ||||
| Non-U.S. | (271 | ) | (197 | ) | (468 | ) | ||||||
| Securities available for sale: | ||||||||||||
| U.S. | 93 | (98 | ) | (5 | ) | |||||||
| Loans: | ||||||||||||
| U.S. | 231 | 40 | 271 | |||||||||
| Non-U.S. | (4 | ) | 20 | 16 | ||||||||
| Interest bearing deposits with banks: | ||||||||||||
| U.S. | (18 | ) | 27 | 9 | ||||||||
| Non-U.S. | (49 | ) | (22 | ) | (71 | ) | ||||||
| Federal funds sold and securities purchased under agreements to resell and Securities borrowed: | ||||||||||||
| U.S. | 1 | (237 | ) | (236 | ) | |||||||
| Non-U.S. | (164 | ) | (122 | ) | (286 | ) | ||||||
| Other: | ||||||||||||
| U.S. | 274 | (1,138 | ) | (864 | ) | |||||||
| Non-U.S. | (2 | ) | 483 | 481 | ||||||||
| Change in interest income | $ | 325 | $ | (1,867 | ) | $ | (1,542 | ) | ||||
| Interest bearing liabilities | ||||||||||||
| Deposits: | ||||||||||||
| U.S. | $ | 17 | $ | (72 | ) | $ | (55 | ) | ||||
| Commercial paper and other short-term borrowings: | ||||||||||||
| U.S. | (3 | ) | 1 | (2 | ) | |||||||
| Non-U.S. | (12 | ) | 11 | (1 | ) | |||||||
| Long-term debt: | ||||||||||||
| U.S. | (546 | ) | 210 | (336 | ) | |||||||
| Non-U.S. | (1 | ) | 47 | 46 | ||||||||
| Securities sold under agreements to repurchase and Securities loaned: | ||||||||||||
| U.S. | (53 | ) | (74 | ) | (127 | ) | ||||||
| Non-U.S. | (172 | ) | 179 | 7 | ||||||||
| Other: | ||||||||||||
| U.S. | 89 | (470 | ) | (381 | ) | |||||||
| Non-U.S. | (94 | ) | (43 | ) | (137 | ) | ||||||
| Change in interest expense | $ | (775 | ) | $ | (211 | ) | $ | (986 | ) | |||
| Change in net interest income | $ | 1,100 | $ | (1,656 | ) | $ | (556 | ) | ||||
| 289 | |
| Average Deposits(1) | ||||||||||||||||||||||||
| 2013 | 2012 | 2011 | ||||||||||||||||||||||
| Average Amount(1) | Average Rate | Average Amount(1) | Average Rate | Average Amount(1) | Average Rate | |||||||||||||||||||
| (dollars in�millions) | ||||||||||||||||||||||||
| Deposits(2): | ||||||||||||||||||||||||
| Savings deposits | $ | 90,447 | 0.1 | % | $ | 66,073 | 0.1 | % | $ | 61,258 | 0.2 | % | ||||||||||||
| Time deposits | 1,526 | 3.9 | % | 3,357 | 2.6 | % | 3,392 | 3.5 | % | |||||||||||||||
| Total | $ | 91,973 | 0.2 | % | $ | 69,430 | 0.3 | % | $ | 64,650 | 0.4 | % | ||||||||||||
| (1) | The Company calculates its average balances based upon weekly amounts, except where weekly balances are unavailable, month-end balances are used. |
| (2) | Deposits are primarily located in U.S. offices. |
| 2013 | 2012 | 2011 | ||||||||||
| Net income to average assets | 0.4 | % | N/M | 0.5 | % | |||||||
| Return on average common equity(1) | 4.3 | % | N/M | 3.8 | % | |||||||
| Return on total equity(2) | 4.6 | % | 0.1 | % | 6.9 | % | ||||||
| Dividend payout ratio(3) | 14.7 | % | N/M | 16.3 | % | |||||||
| Total average common equity to average assets | 7.5 | % | 7.8 | % | 6.5 | % | ||||||
| Total average equity to average assets | 7.7 | % | 8.0 | % | 7.1 | % | ||||||
| (1) | Percentage is based on net income applicable to Morgan Stanley less preferred dividends as a percentage of average common equity. |
| (2) | Percentage is based on net income as a percentage of average total equity. |
| (3) | Percentage is based on dividends declared per common share as a percentage of net income per diluted share. |
| 2013 | 2012 | 2011 | ||||||||||
| (dollars in millions) | ||||||||||||
| Securities sold under repurchase agreements: | ||||||||||||
| Period-end balance | $ | 145,676 | $ | 122,674 | $ | 104,800 | ||||||
| Average balance(1)(2) | 136,151 | 125,465 | 142,784 | |||||||||
| Maximum balance at any month-end | 145,676 | 139,962 | 164,511 | |||||||||
| Weighted average interest rate during the period(3) | 0.7 | % | 0.9 | % | 0.9 | % | ||||||
| Weighted average interest rate on period-end balance(4) | 0.4 | % | 0.8 | % | 0.8 | % | ||||||
| Securities loaned: | ||||||||||||
| Period-end balance | $ | 32,799 | $ | 36,849 | $ | 30,462 | ||||||
| Average balance(1) | 39,442 | 35,677 | 36,762 | |||||||||
| Maximum balance at any month-end | 44,182 | 39,881 | 50,709 | |||||||||
| Weighted average interest rate during the period(3) | 1.2 | % | 1.9 | % | 1.9 | % | ||||||
| Weighted average interest rate on period-end balance(4) | 1.2 | % | 1.5 | % | 1.8 | % | ||||||
| (1) | The Company calculates its average balances based upon weekly amounts, except where weekly balances are unavailable, month-end balances are used. |
| (2) | In 2011, the period-end balance was lower than the annual average primarily due to a decrease in the overall balance sheet during the year. |
| | 290 |
| (3) | The approximated weighted average interest rate was calculated using (a)�interest expense incurred on all securities sold under repurchase agreements and securities loaned transactions, whether or not such transactions were reported on the consolidated statements of financial condition and (b)�average balances that were reported on a net basis where certain criteria were met in accordance with applicable offsetting guidance. In addition, securities-for-securities transactions in which the Company was the borrower were not included in the average balances since they were not reported on the consolidated statements of financial condition. |
| (4) | The approximated weighted average interest rate was calculated using (a)�interest expense for all securities sold under repurchase agreements and securities loaned transactions, whether or not such transactions were reported on the consolidated statements of financial condition and (b)�period-end balances that were reported on a net basis where certain criteria were met in accordance with applicable offsetting guidance. In addition, securities-for-securities transactions in which the Company was the borrower were not included in the period-end balances since they were not reported on the consolidated statements of financial condition. |
| At December 31, 2013 | ||||||||||||||||
| Country | Banks | Governments | Other(1) | Total | ||||||||||||
| United Kingdom | $ | 11,874 | $ | 911 | $ | 57,594 | $ | 70,379 | ||||||||
| Japan | 27,251 | 3,622 | 26,426 | 57,299 | ||||||||||||
| Cayman Islands | 1 | � | 45,041 | 45,042 | ||||||||||||
| Germany | 8,844 | 10,312 | 10,613 | 29,769 | ||||||||||||
| France | 22,408 | 264 | 6,247 | 28,919 | ||||||||||||
| Canada | 2,988 | 2,012 | 7,108 | 12,108 | ||||||||||||
| Netherlands | 1,474 | � | 10,015 | 11,489 | ||||||||||||
| Korea | 65 | 4,307 | 3,376 | 7,748 | ||||||||||||
| At December�31, 2012 | ||||||||||||||||
| Country | Banks | Governments | Other | Total | ||||||||||||
| United Kingdom | $ | 17,504 | $ | 6 | $ | 100,090 | $ | 117,600 | ||||||||
| Cayman Islands | 5 | 10 | 41,628 | 41,643 | ||||||||||||
| France | 28,699 | 149 | 3,915 | 32,763 | ||||||||||||
| Japan | 24,935 | 148 | 2,967 | 28,050 | ||||||||||||
| Germany | 15,084 | 3,014 | 4,192 | 22,290 | ||||||||||||
| Netherlands | 1,700 | � | 10,920 | 12,620 | ||||||||||||
| Canada | 6,651 | 1,310 | 2,893 | 10,854 | ||||||||||||
| Korea | 32 | 6,812 | 2,311 | 9,155 | ||||||||||||
| Switzerland | 3,319 | 242 | 5,483 | 9,044 | ||||||||||||
| Luxembourg | 221 | 223 | 7,952 | 8,396 | ||||||||||||
| 291 | |
| At December�31, 2011 | ||||||||||||||||
| Country | Banks | Governments | Other | Total | ||||||||||||
| United Kingdom | $ | 13,852 | $ | 2 | $ | 89,585 | $ | 103,439 | ||||||||
| Cayman Islands | 766 | � | 31,169 | 31,935 | ||||||||||||
| France | 23,561 | 1,096 | 4,196 | 28,853 | ||||||||||||
| Japan | 23,542 | 436 | 2,821 | 26,799 | ||||||||||||
| Germany | 18,674 | 3,485 | 1,859 | 24,018 | ||||||||||||
| Netherlands | 3,508 | 23 | 8,826 | 12,357 | ||||||||||||
| Luxembourg | 1,619 | 94 | 6,137 | 7,850 | ||||||||||||
| Brazil | 149 | 3,398 | 2,165 | 5,712 | ||||||||||||
| Australia | 2,008 | 557 | 1,414 | 3,979 | ||||||||||||
| Italy | 881 | 1,463 | 539 | 2,883 | ||||||||||||
| (1) | Other includes Non-banking financial institutions and others in the 2013 presentation. |
| | 292 |
| Item�9. | Changes in and Disagreements with Accountants on Accounting and Financial Disclosure. |
| Item�9A. | Controls and Procedures. |
| � | Pertain to the maintenance of records that, in reasonable detail, accurately and fairly reflect the transactions and dispositions of the assets of the Company; |
| � | Provide reasonable assurance that transactions are recorded as necessary to permit preparation of financial statements in accordance with generally accepted accounting principles, and that our receipts and expenditures are being made only in accordance with authorizations of the Company�s management and directors; and |
| � | Provide reasonable assurance regarding prevention or timely detection of unauthorized acquisition, use or disposition of our assets that could have a material effect on our financial statements. |
| 293 | |
| 294 |
| 295 | |
| Item�10. | Directors, Executive Officers and Corporate Governance. |
| � | �Item 1�Election of Directors�Director Nominees� |
| � | �Item 1�Election of Directors�Corporate Governance�Board Meetings and Committees� |
| � | �Item 1�Election of Directors�Beneficial Ownership of Company Common Stock�Section 16(a) Beneficial Ownership Reporting Compliance� |
| Item�11. | Executive Compensation. |
| � | �Item 1�Election of Directors�Executive Compensation� |
| � | �Item 1�Election of Directors�Corporate Governance�Director Compensation� |
| | 296 |
| Item�12. | Security Ownership of Certain Beneficial Owners and Management and Related Stockholder Matters. |
| (a) | (b) | (c) | ||||||||||
| Plan Category | Number�of�securities�to�be�issued upon exercise of outstanding�options,�warrants and rights (#)(1) | Weighted-average�exercise price�of�outstanding�options, warrants and rights ($)(2) | Number�of�securities remaining�available�for future issuance under equity compensation plans�(excluding�securities reflected�in�column�(a)) (#) | |||||||||
| Equity compensation plans approved by security holders | 169,757,711 | 49.3974 | 107,080,353 | (3) | ||||||||
| Equity compensation plans not approved by security holders | 1,482,390 | � | � | (4) | ||||||||
| Total | 171,240,101 | 49.3974 | 107,080,353 | |||||||||
| (1) | Amounts include outstanding stock option, restricted stock unit and performance stock unit awards. The number of outstanding performance stock unit awards is based on the target number of units granted to senior executives. |
| (2) | Amounts reflect the weighted-average exercise price with respect to outstanding stock options and does not take into account outstanding restricted stock units and performance stock units, which do not provide for an exercise price. |
| (3) | Amount includes the following: |
| (a) | 39,182,870 shares available under the Morgan Stanley Employee Stock Purchase Plan (�ESPP�). Pursuant to this plan, which is qualified under Section�423 of the Internal Revenue Code, eligible employees were permitted to purchase shares of common stock at a discount to market price through regular payroll deduction. The Compensation, Management Development and Succession (�CMDS�) Committee approved the discontinuation of the ESPP, effective June�1, 2009, such that no further contributions to the plan will be permitted following such date, until such time as the CMDS Committee determines to recommence contributions under the plan. |
| (b) | 61,388,699 shares available under the 2007 Equity Incentive Compensation Plan. Awards may consist of stock options, stock appreciation rights, restricted stock, restricted stock units to be settled by the delivery of shares of common stock (or the value thereof), performance-based units, other awards that are valued by reference to or otherwise based on the fair market value of common stock, and other equity-based or equity-related awards approved by the CMDS Committee. |
| (c) | 5,579,314 shares available under the Employee Equity Accumulation Plan, which includes 732,857 shares available for awards of restricted stock and restricted stock units. Awards may consist of stock options, stock appreciation rights, restricted stock, restricted stock units to be settled by the delivery of shares of common stock (or the value thereof), other awards that are valued by reference to or otherwise based on the fair market value of common stock, and other equity-based or equity-related awards approved by the CMDS Committee. |
| (d) | 355,243 shares available under the Tax Deferred Equity Participation Plan. Awards consist of restricted stock units, which are settled by the delivery of shares of common stock. |
| (e) | 574,227 shares available under the Directors� Equity Capital Accumulation Plan. This plan provides for periodic awards of shares of common stock and stock units to non-employee directors and also allows non-employee directors to defer the cash fees they earn for services as a director in the form of stock units. |
| (4) | As of December�31, 2013, no shares remained available for future issuance under the Financial Advisor and Investment Representative Compensation Plan (�FAIRCP�), which was terminated effective December�31, 2011, and the Morgan Stanley 2009 Replacement Equity Incentive Compensation Plan for Morgan Stanley Smith Barney Employees (�REICP�), which was terminated effective December�31, 2012. However, awards remained outstanding under these plans as of December�31, 2013. The material features of the FAIRCP and the REICP, which were not approved by shareholders under SEC rules, are as follows: |
| (a) | FAIRCP: Financial advisors and investment representatives in the Wealth Management business segment were eligible to receive awards under FAIRCP in the form of cash, restricted stock and restricted stock units settled by the delivery of shares of common stock. |
| 297 | |
| (b) | REICP: REICP was adopted in connection with the Wealth Management JV and without stockholder approval pursuant to the employment inducement award exception under the New York Stock Exchange Corporate Governance Listing Standards. The equity awards granted pursuant to the REICP were limited to awards to induce certain Citigroup Inc. (�Citi�) employees to join the new Wealth Management JV by replacing the value of Citi awards that were forfeited in connection with the employees� transfer of employment to the Wealth Management business segment. Awards under the REICP were authorized in the form of restricted stock units, stock appreciation rights, stock options and restricted stock and other forms of stock-based awards. |
| Item�13. | Certain Relationships and Related Transactions, and Director Independence. |
| � | �Item 1�Election of Directors�Corporate Governance�Related Person Transactions Policy� |
| � | �Item 1�Election of Directors�Corporate Governance�Certain Transactions� |
| � | �Item 1�Election of Directors�Corporate Governance�Director Independence� |
| Item�14. | Principal Accountant Fees and Services. |
| � | �Item 2�Ratification of Appointment of Morgan Stanley�s Independent Auditor� (excluding the information under the subheading �Audit Committee Report�) |
| | 298 |
| Item�15. | Exhibits and Financial Statement Schedules. |
| � | The consolidated financial statements required to be filed in this Annual Report on Form 10-K are included in Part II, Item�8 hereof. |
| � | An exhibit index has been filed as part of this report beginning on page E-1 and is incorporated herein by reference. |
| 299 | |
| M ORGAN S TANLEY ( REGISTRANT ) | ||
| By: | /s/����J AMES P. G ORMAN | |
| (James P. Gorman) | ||
| Chairman of the Board and Chief Executive Officer | ||
| Signature | Title | |
| / S /����J AMES P. G ORMAN (James P. Gorman) | Chairman of the Board and Chief Executive Officer (Principal Executive Officer) | |
| / S /����R UTH P ORAT (Ruth Porat) | Executive Vice President and Chief Financial Officer (Principal Financial Officer) | |
| / S /����P AUL C. W IRTH (Paul C. Wirth) | Deputy Chief Financial Officer (Principal Accounting Officer) | |
| / S /����E RSKINE B. B OWLES (Erskine B. Bowles) | Director | |
| / S /����H OWARD J. D AVIES (Howard J. Davies) | Director | |
| / S /����T HOMAS H. G LOCER (Thomas H. Glocer) | Director | |
| / S /����R OBERT H. H ERZ (Robert H. Herz) | Director | |
| / S /����C. R OBERT K IDDER (C. Robert Kidder) | Director | |
| / S /����K LAUS K LEINFELD (Klaus Kleinfeld) | Director | |
| S-1 |
Table of Contents| Signature | Title | |
| / S /����D ONALD T. N ICOLAISEN (Donald T. Nicolaisen) | Director | |
| / S /����H UTHAM S. O LAYAN (Hutham S. Olayan) | Director | |
| / S /����J AMES W. O WENS (James W. Owens) | Director | |
| / S /����O. G RIFFITH S EXTON (O. Griffith Sexton) | Director | |
| / S /����R YOSUKE T AMAKOSHI (Ryosuke Tamakoshi) | Director | |
| / S /����M ASAAKI T ANAKA (Masaaki Tanaka) | Director | |
| / S /����L AURA D� ANDREA T YSON (Laura D�Andrea Tyson) | Director | |
| / S /����R AYFORD W ILKINS , J R . (Rayford Wilkins, Jr.) | Director | |
| | S-2 |
Table of Contents Exhibit Index Certain of the following exhibits, as indicated parenthetically, were
previously filed as exhibits to registration statements filed by Morgan Stanley or its predecessor companies under the Securities Act or to reports or registration statements filed by Morgan Stanley or its predecessor companies under the Exchange
Act and are hereby incorporated by reference to such statements or reports. Morgan Stanley�s Exchange Act file number is 1-11758. The Exchange Act file number of Morgan Stanley Group Inc., a predecessor
company (�MSG�), was 1-9085. 1 | Exhibit No. | Description | |
| 2.1 | Amended and Restated Joint Venture Contribution and Formation Agreement dated as of May 29, 2009 by and among Citigroup Inc. and Morgan Stanley and Morgan Stanley Smith Barney Holdings LLC (Exhibit 10.1 to Morgan Stanley�s Current Report on Form 8-K dated May 29, 2009). | |
| 2.2 | Integration and Investment Agreement dated as of March 30, 2010 by and between Mitsubishi UFJ Financial Group, Inc. and Morgan Stanley (Exhibit 2.2 to Morgan Stanley�s Quarterly Report on Form 10-Q for the quarter ended June 30, 2011). | |
| 3.1 | Amended and Restated Certificate of Incorporation of Morgan Stanley, as amended to date (Exhibit 3 to Morgan Stanley�s Quarterly Report on Form 10-Q for the quarter ended June 30, 2009), as amended by the Certificate of Elimination of Series B Non-Cumulative Non-Voting Perpetual Convertible Preferred Stock (Exhibit 3.1 Morgan Stanley�s Current Report on Form 8-K dated July 20, 2011), as amended by the Certificate of Merger of Domestic Corporations dated December 29, 2011 (Exhibit 3.3 to Morgan Stanley�s Annual Report on Form 10-K for the year ended December 31, 2012), as amended by the Certificate of Designation of Preferences and Rights of the Fixed-to-Floating Rate Non-Cumulative Preferred Stock, Series E (Exhibit 2.5 to Morgan Stanley�s Registration Statement on Form 8-A dated September 27, 2013), as amended by the Certificate of Designation of Preferences and Rights of the Fixed-to-Floating Rate Non-Cumulative Preferred Stock, Series F (Exhibit 2.3 to Morgan Stanley�s Registration Statement on Form 8-A dated December 9, 2013). | |
| 3.2 | Amended and Restated Bylaws of Morgan Stanley, as amended to date (Exhibit 3.1 to Morgan Stanley�s Current Report on Form 8-K dated March 9, 2010). | |
| 4.1 | Indenture dated as of February�24, 1993 between Morgan Stanley and The Bank of New York, as trustee (Exhibit 4 to Morgan Stanley�s Registration Statement on Form S-3 (No. 33-57202)). | |
| 4.2 | Amended and Restated Senior Indenture dated as of May�1, 1999 between Morgan Stanley and The Bank of New York, as trustee (Exhibit 4-e to Morgan Stanley�s Registration Statement on Form�S-3/A (No. 333-75289) as amended by Fourth Supplemental Senior Indenture dated as of October 8, 2007 (Exhibit 4.3 to Morgan Stanley�s Annual Report on Form 10-K for the fiscal year ended November 30, 2007). | |
| 4.3 | Senior Indenture dated as of November�1, 2004 between Morgan Stanley and The Bank of New York, as trustee (Exhibit 4-f to Morgan Stanley�s Registration Statement on Form S-3/A (No.�333-117752), as amended by First Supplemental Senior Indenture dated as of September 4, 2007 (Exhibit 4.5 to Morgan Stanley�s Annual Report on Form 10-K for the fiscal year ended November 30, 2007), Second Supplemental Senior Indenture dated as of January 4, 2008 (Exhibit 4.1 to Morgan Stanley�s Current Report on Form 8-K dated January 4, 2008), Third Supplemental Senior Indenture dated as of September 10, 2008 (Exhibit 4 to Morgan Stanley�s Quarterly Report on Form 10-Q for the quarter ended August 31, 2008), Fourth Supplemental Senior Indenture dated as of December 1, 2008 | |
| (1) | For purposes of this Exhibit Index, references to �The Bank of New York� mean in some instances the entity successor to JPMorgan Chase Bank, N.A. or J.P. Morgan Trust Company, National Association; references to �JPMorgan Chase Bank, N.A.� mean the entity formerly known as The Chase Manhattan Bank, in some instances as the successor to Chemical Bank; references to �J.P. Morgan Trust Company, N.A.� mean the entity formerly known as Bank One Trust Company, N.A., as successor to The First National Bank of Chicago. |
| E-1 | |
| Exhibit No. | Description | |
| (Exhibit�4.1 to Morgan Stanley�s Current Report on Form 8-K dated December 1, 2008), Fifth Supplemental Senior Indenture dated as of April 1, 2009 (Exhibit 4 to Morgan Stanley�s Quarterly Report on Form 10-Q for the quarter ended March 31, 2009), Sixth Supplemental Senior Indenture dated as of September 16, 2011 (Exhibit 4.1 to Morgan Stanley�s Quarterly Report on Form 10-Q for the quarter ended September 30, 2011), Seventh Supplemental Senior Indenture dated as of November�21, 2011 (Exhibit 4.4 to Morgan Stanley�s Annual Report on Form 10-K for the year ended December 31, 2011) and Eighth Supplemental Senior Indenture dated as of May 4, 2012 (Exhibit 4.1 to Morgan Stanley�s Quarterly Report on Form 10-Q for the quarter ended June 30, 2012). | ||
| 4.4 | The Unit Agreement Without Holders� Obligations, dated as of August 29, 2008, between Morgan Stanley and The Bank of New York Mellon, as Unit Agent, as Trustee and Paying Agent under the Senior Indenture referred to therein and as Warrant Agent under the Warrant Agreement referred to therein (Exhibit 4.1 to Morgan Stanley�s Current Report on Form 8-K dated August 29, 2008). | |
| 4.5 | Amended and Restated Subordinated Indenture dated as of May�1, 1999 between Morgan Stanley and The Bank of New York, as trustee (Exhibit 4-f to Morgan Stanley�s Registration Statement on Form�S-3/A (No. 333-75289)). | |
| 4.6 | Subordinated Indenture dated as of October�1, 2004 between Morgan Stanley and The Bank of New York, as trustee (Exhibit 4-g to Morgan Stanley�s Registration Statement on Form S-3/A (No.�333-117752)). | |
| 4.7 | Junior Subordinated Indenture dated as of March�1, 1998 between Morgan Stanley and The Bank of New York, as trustee (Exhibit 4.1 to Morgan Stanley�s Quarterly Report on Form 10-Q for the quarter ended February�28, 1998). | |
| 4.8 | Junior Subordinated Indenture dated as of October�1, 2004 between Morgan Stanley and The Bank of New York, as trustee (Exhibit 4-ww to Morgan Stanley�s Registration Statement on Form S-3/A (No.�333-117752)). | |
| 4.9 | Junior Subordinated Indenture dated as of October�12, 2006 between Morgan Stanley and The Bank of New York, as trustee (Exhibit 4.1 to Morgan Stanley�s Current Report on Form 8-K dated October�12, 2006). | |
| 4.10 | Deposit Agreement dated as of July�6, 2006 among Morgan Stanley, JPMorgan Chase Bank, N.A. and the holders from time to time of the depositary receipts described therein (Exhibit 4.3 to Morgan Stanley�s Quarterly Report on Form 10-Q for the quarter ended May�31, 2006). | |
| 4.11 | Depositary Receipt for Depositary Shares, representing Floating Rate Non-Cumulative Preferred Stock, Series A (included in Exhibit 4.10 hereto). | |
| 4.12 | Amended and Restated Trust Agreement of Morgan Stanley Capital Trust III dated as of February 27, 2003 among Morgan Stanley, as depositor, The Bank of New York, as property trustee, The Bank of New York (Delaware), as Delaware trustee, and the administrators named therein (Exhibit 4 to Morgan Stanley�s Quarterly Report on Form 10-Q for the quarter ended February 28, 2003). | |
| 4.13 | Amended and Restated Trust Agreement of Morgan Stanley Capital Trust IV dated as of April 21, 2003 among Morgan Stanley, as depositor, The Bank of New York, as property trustee, The Bank of New York (Delaware), as Delaware Trustee and the administrators named therein (Exhibit 4 to Morgan Stanley�s Quarterly Report on Form 10-Q for the quarter ended May 31, 2003). | |
| 4.14 | Amended and Restated Trust Agreement of Morgan Stanley Capital Trust V dated as of July 16, 2003 among Morgan Stanley, as depositor, The Bank of New York, as property trustee, The Bank of New York (Delaware), as Delaware trustee and the administrators named therein (Exhibit 4 to Morgan Stanley�s Quarterly Report on Form 10-Q for the quarter ended August 31, 2003). | |
| 4.15 | Amended and Restated Trust Agreement of Morgan Stanley Capital Trust VI dated as of January 26, 2006 among Morgan Stanley, as depositor, The Bank of New York, as property trustee, The Bank of New York (Delaware), as Delaware trustee and the administrators named therein (Exhibit 4 to Morgan Stanley�s Quarterly Report on Form 10-Q for the quarter ended February 28, 2006). | |
| | E-2 |
| Exhibit No. | Description | |||
| 4.16 | Amended and Restated Trust Agreement of Morgan Stanley Capital Trust VII dated as of October 12, 2006 among Morgan Stanley, as depositor, The Bank of New York, as property trustee, The Bank of New York (Delaware), as Delaware trustee and the administrators named therein (Exhibit 4.3 to Morgan Stanley�s Current Report on Form 8-K dated October 12, 2006). | |||
| 4.17 | Amended and Restated Trust Agreement of Morgan Stanley Capital Trust VIII dated as of April 26, 2007 among Morgan Stanley, as depositor, The Bank of New York, as property trustee, The Bank of New York (Delaware), as Delaware trustee and the administrators named therein (Exhibit 4.3 to Morgan Stanley�s Current Report on Form 8-K dated April 26, 2007). | |||
| 4.18 | Instruments defining the Rights of Security Holders, Including Indentures�Except as set forth in Exhibits 4.1 through 4.17 above, the instruments defining the rights of holders of long-term debt securities of Morgan Stanley and its subsidiaries are omitted pursuant to Section (b)(4)(iii) of Item�601 of Regulation S-K. Morgan Stanley hereby agrees to furnish copies of these instruments to the SEC upon request. | |||
| 10.1 | Amended and Restated Trust Agreement dated as of October 18, 2011 by and between Morgan Stanley and State Street Bank and Trust Company (Exhibit 10.1 to Morgan Stanley�s Annual Report on Form 10-K for the year ended December 31, 2011). | |||
| 10.2 | Transaction Agreement dated as of April 21, 2011 between Morgan Stanley and Mitsubishi UFJ Financial Group, Inc. (Exhibit 10.1 to Morgan Stanley�s Current Report on Form 8-K dated April 21, 2011). | |||
| 10.3 | Amended and Restated Investor Agreement dated as of June 30, 2011 by and between Morgan Stanley and Mitsubishi UFJ Financial Group, Inc. (Exhibit 10.1 to Morgan Stanley�s Current Report on Form 8-K dated June 30, 2011), as amended by Third Amendment, dated October 3, 2013 (Exhibit 10.1 to Morgan Stanley�s Quarterly Report on Form 10-Q for the quarter ended September�30, 2013). | |||
| 10.4� | Morgan Stanley 401(k) Plan, amended and restated as of January 1, 2013 (Exhibit 10.6 to Morgan Stanley Annual Report on Form 10-K for the year ended December 31, 2012). | |||
| 10.5� | * | Amendment to Morgan Stanley 401(k) Plan, dated as of December 20, 2013. | ||
| 10.6� | * | Amendment to Morgan Stanley 401(k) Savings Plan, dated as of December 20, 2013. | ||
| 10.7� | 1994 Omnibus Equity Plan as amended and restated (Exhibit 10.23 to Morgan Stanley�s Annual Report on Form 10-K for the fiscal year ended November 30, 2003) as amended by Amendment (Exhibit 10.11 to Morgan Stanley�s Annual Report on Form 10-K for the fiscal year ended November�30, 2006). | |||
| 10.8� | Tax Deferred Equity Participation Plan as amended and restated as of November 26, 2007 (Exhibit�10.9 to Morgan Stanley�s Annual Report on Form 10-K for the fiscal year ended November�30, 2007). | |||
| 10.9� | Directors� Equity Capital Accumulation Plan as amended and restated as of March 22, 2012 (Exhibit�10.2 to Morgan Stanley�s Current Report on Form 8-K dated May 15, 2012). | |||
| 10.10� | Select Employees� Capital Accumulation Program as amended and restated as of May 7, 2008 (Exhibit 10.1 to Morgan Stanley�s Quarterly Report on Form 10-Q for the quarter ended May 31, 2008). | |||
| 10.11� | Form of Term Sheet under the Select Employees� Capital Accumulation Program (Exhibit 10.9 to Morgan Stanley�s Quarterly Report on Form 10-Q for the quarter ended February�29, 2008). | |||
| 10.12� | Employees� Equity Accumulation Plan as amended and restated as of November 26, 2007 (Exhibit�10.12 to Morgan Stanley�s Annual Report on Form 10-K for the fiscal year ended November�30, 2007). | |||
| E-3 | |
| Exhibit No. | Description | |||
| 10.13� | Employee Stock Purchase Plan as amended and restated as of February�1, 2009 (Exhibit 10.20 to Morgan Stanley�s Annual Report on Form 10-K for the fiscal year ended November�30, 2008). | |||
| 10.14� | Morgan Stanley Supplemental Executive Retirement and Excess Plan, amended and restated effective December 31, 2008 (Exhibit 10.2 to Morgan Stanley�s Quarterly Report on Form 10-Q for the quarter ended March 31, 2009) as amended by Amendment (Exhibit 10.5 to Morgan Stanley�s Quarterly Report on Form 10-Q for the quarter ended June 30, 2009), Amendment (Exhibit 10.19 to Morgan Stanley�s Annual Report on Form 10-K for the year ended December 31, 2010) and Amendment (Exhibit 10.3 to Morgan Stanley�s Quarterly Report on Form 10-Q for the quarter ended June�30, 2011). | |||
| 10.15� | 1995 Equity Incentive Compensation Plan (Annex A to MSG�s Proxy Statement for its 1996 Annual Meeting of Stockholders) as amended by Amendment (Exhibit 10.39 to Morgan Stanley�s Annual Report on Form 10-K for the fiscal year ended November 30, 2000), Amendment (Exhibit 10.5 to Morgan Stanley�s Quarterly Report on Form 10-Q for the quarter ended August 31, 2005), Amendment (Exhibit 10.3 to Morgan Stanley�s Quarterly Report on Form 10-Q for the quarter ended February 28, 2006), Amendment (Exhibit 10.24 to Morgan Stanley�s Annual Report on Form 10-K for the fiscal year ended November 30, 2006) and Amendment (Exhibit 10.22 to Morgan Stanley�s Annual Report on Form 10-K for the fiscal year ended November 30, 2007). | |||
| 10.16� | Form of Equity Incentive Compensation Plan Award Certificate (Exhibit 10.1 to Morgan Stanley�s Quarterly Report on Form 10-Q for the quarter ended August�31, 2004). | |||
| 10.17� | Form of Management Committee Equity Award Certificate for Discretionary Retention Award of Stock Units and Stock Options (Exhibit 10.30 to Morgan Stanley�s Annual Report on Form 10-K for the fiscal year ended November 30, 2006). | |||
| 10.18� | Form of Deferred Compensation Agreement under the Pre-Tax Incentive Program 2 (Exhibit 10.12 to MSG�s Annual Report for the fiscal year ended November 30, 1996). | |||
| 10.19� | Key Employee Private Equity Recognition Plan (Exhibit 10.43 to Morgan Stanley�s Annual Report on Form 10-K for the fiscal year ended November 30, 2000). | |||
| 10.20� | Morgan Stanley Financial Advisor and Investment Representative Compensation Plan as amended and restated as of November 26, 2007 (Exhibit 10.34 to Morgan Stanley�s Annual Report on Form�10-K for the fiscal year ended November 30, 2007). | |||
| 10.21� | Morgan Stanley UK Share Ownership Plan (Exhibit 4.1 to Morgan Stanley�s Registration Statement on Form S-8 (No. 333-146954)). | |||
| 10.22� | Supplementary Deed of Participation for the Morgan Stanley UK Share Ownership Plan, dated as of November 5, 2009 (Exhibit 10.36 to Morgan Stanley�s Annual Report on Form 10-K for the year ended December 31, 2009). | |||
| 10.23� | Aircraft Time Sharing Agreement, dated as of January 1, 2010, by and between�Corporate Services�Support Corp.�and James P. Gorman (Exhibit 10.1 to Morgan Stanley�s Quarterly Report on Form 10-Q for the quarter ended March 31, 2010). | |||
| 10.24� | Agreement between Morgan Stanley and James P. Gorman, dated August 16, 2005, and amendment dated December 17, 2008 (Exhibit 10.2 to Morgan Stanley�s Quarterly Report on Form 10-Q for the quarter ended March 31, 2010). | |||
| 10.25� | * | Amendment to Agreement between Morgan Stanley and James P. Gorman, effective as of December�19, 2013. | ||
| 10.26� | Agreement between Morgan Stanley and Gregory J. Fleming, dated February 3, 2010 (Exhibit 10.5 to Morgan Stanley�s Quarterly Report on Form 10-Q for the quarter ended March 31, 2011). | |||
| 10.27� | Form of Restrictive Covenant Agreement (Exhibit 10 to Morgan Stanley�s Current Report on Form�8-K dated November�22, 2005). | |||
| | E-4 |
| Exhibit No. | Description | |||
| 10.28� | Morgan Stanley Performance Formula and Provisions (Exhibit 10.3 to Morgan Stanley�s Quarterly Report on Form 10-Q for the quarter ended May 31, 2006). | |||
| 10.29� | Morgan Stanley Performance Formula and Provisions (Exhibit 10.2 to Morgan Stanley�s Current Report on Form 8-K dated May 14, 2013). | |||
| 10.30� | 2007 Equity Incentive Compensation Plan, as amended and restated as of March 21, 2013 (Exhibit�10.1 to Morgan Stanley�s Current Report on Form 8-K dated May 14, 2013). | |||
| 10.31� | Morgan Stanley 2006 Notional Leveraged Co-Investment Plan, as amended and restated as of November 28, 2008 (Exhibit 10.47 to Morgan Stanley�s Annual Report on Form 10-K for the fiscal year ended November 30, 2008). | |||
| 10.32� | Form of Award Certificate under the 2006 Notional Leveraged Co-Investment Plan (Exhibit 10.7 to Morgan Stanley�s Quarterly Report on Form 10-Q for the quarter ended February�29, 2008). | |||
| 10.33� | Morgan Stanley 2007 Notional Leveraged Co-Investment Plan, amended as of June 4, 2009 (Exhibit�10.6 to Morgan Stanley�s Quarterly Report on Form 10-Q for the quarter ended June 30, 2009). | |||
| 10.34� | Form of Award Certificate under the 2007 Notional Leveraged Co-Investment Plan for Certain Management Committee Members (Exhibit 10.8 to Morgan Stanley�s Quarterly Report on Form�10-Q for the quarter ended February�29, 2008). | |||
| 10.35� | Governmental Service Amendment to Outstanding Stock Option and Stock Unit Awards (replacing and superseding in its entirety Exhibit 10.3 to Morgan Stanley�s Quarterly Report on Form 10-Q for the quarter ended May�31, 2007) (Exhibit 10.41 to Morgan Stanley�s Annual Report on Form 10-K for the fiscal year ended November�30, 2007). | |||
| 10.36� | Amendment to Outstanding Stock Option and Stock Unit Awards (Exhibit 10.53 to Morgan Stanley�s Annual Report on Form 10-K for the fiscal year ended November 30, 2008). | |||
| 10.37� | Morgan Stanley Compensation Incentive Plan (Exhibit 10.54 to Morgan Stanley�s Annual Report on Form 10-K for the fiscal year ended November 30, 2008). | |||
| 10.38� | Form of Executive Waiver (Exhibit 10.55 to Morgan Stanley�s Annual Report on Form 10-K for the fiscal year ended November 30, 2008). | |||
| 10.39� | Form of Executive Letter Agreement (Exhibit 10.56 to Morgan Stanley�s Annual Report on Form�10-K for the fiscal year ended November 30, 2008). | |||
| 10.40� | Morgan Stanley 2009 Replacement Equity Incentive Compensation Plan for Morgan Stanley Smith Barney Employees (Exhibit 4.2 to Morgan Stanley�s Registration Statement on Form S-8 (No.�333-159504)). | |||
| 10.41� | Form of Award Certificate for Discretionary Retention Awards of Stock Units (Exhibit 10.1 to Morgan Stanley�s Quarterly Report on Form�10-Q for the quarter ended March 31, 2011). | |||
| 10.42� | Form of Award Certificate for Performance Stock Units (Exhibit 10.3 to Morgan Stanley�s Quarterly Report on Form�10-Q for the quarter ended March 31, 2011). | |||
| 10.43� | Form of Award Certificate for Special Discretionary Retention Awards of Stock Options (Exhibit�10.4 to Morgan Stanley�s Quarterly Report on Form�10-Q for the quarter ended March 31, 2011). | |||
| 10.44� | Morgan Stanley Schedule of Non-Employee Directors Annual Compensation, effective as of May 17, 2011 (Exhibit 10.59 to Morgan Stanley�s Annual Report on Form 10-K for the year ended December�31, 2011). | |||
| 10.45� | Form of Award Certificate for Discretionary Retention Awards of Stock Units (Exhibit 10.1 to Morgan Stanley�s Quarterly Report on Form 10-Q for the quarter ended March 31, 2012). | |||
| 10.46� | Form of Award Certificate for Discretionary Retention Awards under the Morgan Stanley Compensation Incentive Plan Deferred Bonus Program (Exhibit 10.2 to Morgan Stanley�s Quarterly Report on Form 10-Q for the quarter ended March 31, 2012). | |||
| E-5 | |
| Exhibit No. | Description | |||
| 10.47� | Form of Award Certificate for Performance Stock Units (Exhibit 10.3 to Morgan Stanley�s Quarterly Report on Form 10-Q for the quarter ended March 31, 2012). | |||
| 10.48� | Memorandum to Colm Kelleher Regarding Repatriation to London (Exhibit 10.4 to Morgan Stanley�s Quarterly Report on Form 10-Q for the quarter ended March 31, 2012). | |||
| 10.49� | Morgan Stanley U.S. Tax Equalization Program (Exhibit 10.5 to Morgan Stanley�s Quarterly Report on Form 10-Q for the quarter ended March�31, 2012). | |||
| 10.50� | Change of Employment Status and Release Agreement between Morgan Stanley and Paul J.�Taubman, dated January 3, 2013 (Exhibit 10.1 to Morgan Stanley�s Quarterly Report on Form�10-Q for the quarter ended March 31, 2013). | |||
| 10.51� | Morgan Stanley UK Limited Alternative Retirement Plan, dated as of October 8, 2009 (Exhibit 10.2 to Morgan Stanley�s Quarterly Report on Form 10-Q for the quarter ended March 31, 2013). | |||
| 10.52� | Form of Award Certificate for Discretionary Retention Awards under the Morgan Stanley Compensation Incentive Plan (Exhibit 10.3 to Morgan Stanley�s Quarterly Report on Form 10-Q for the quarter ended March 31, 2013). | |||
| 10.53� | Form of Award Certificate for Discretionary Retention Awards of Stock Units (Exhibit 10.4 to Morgan Stanley�s Quarterly Report on Form 10-Q for the quarter ended March 31, 2013). | |||
| 10.54� | Form of Award Certificate for Discretionary Retention Awards of Stock Options (Exhibit 10.5 to Morgan Stanley�s Quarterly Report on Form 10-Q for the quarter ended March 31, 2013). | |||
| 10.55� | Form of Award Certificate for Long-Term Incentive Program Awards (Exhibit 10.6 to Morgan Stanley�s Quarterly Report on Form 10-Q for the quarter ended March 31, 2013). | |||
| 12 | * | Statement Re: Computation of Ratio of Earnings to Fixed Charges and Computation of Ratio of Earnings to Fixed Charges and Preferred Stock Dividends. | ||
| 21 | * | Subsidiaries of Morgan Stanley. | ||
| 23.1 | * | Consent of Deloitte & Touche LLP. | ||
| 24 | Powers of Attorney (included on signature page). | |||
| 31.1 | * | Rule 13a-14(a) Certification of Chief Executive Officer. | ||
| 31.2 | * | Rule 13a-14(a) Certification of Chief Financial Officer. | ||
| 32.1 | ** | Section 1350 Certification of Chief Executive Officer. | ||
| 32.2 | ** | Section 1350 Certification of Chief Financial Officer. | ||
| 101 | Interactive data files pursuant to Rule 405 of Regulation S-T: (i)�the Consolidated Statements of Financial Condition�December 31, 2013 and December 31, 2012, (ii)�the Consolidated Statements of Income�Twelve Months Ended December 31, 2013, December 31, 2012 and December 31, 2011, (iii)�the Consolidated Statements of Comprehensive Income�Twelve Months Ended December 31, 2013, December 31, 2012 and December 31, 2011, (iv)�the Consolidated Statements of Cash Flows�Twelve Months Ended December 31, 2013, December 31, 2012 and December 31, 2011, (v)�the Consolidated Statements of Changes in Total Equity�Twelve Months Ended December 31, 2013, December 31, 2012, and December 31, 2011, and (vi)�Notes to Consolidated Financial Statements. | |||
| * | Filed herewith. |
| ** | Furnished herewith. |
| � | Management contract or compensatory plan or arrangement required to be filed as an exhibit to this Form�10-K pursuant to Item�15(b). |
| | E-6 |