 (Exact name of Registrant
as specified in its charter)
(Exact name of Registrant
as specified in its charter) | Delaware (State or other jurisdiction of incorporation�or�organization) | 1585 Broadway New�York,�NY�10036 (Address�of�principal�executive�offices, including zip code) | 36-3145972 (I.R.S.�Employer�Identification�No.) | (212) 761-4000 (Registrant�s�telephone�number, including area code) | |||
| Title of each class | Name of exchange on which registered | |
| Securities registered pursuant to Section�12(b) of the Act: | ||
| Common Stock, $0.01 par value | New�York�Stock�Exchange | |
| Depositary Shares, each representing 1/1,000th interest in a share of Floating Rate Non-Cumulative Preferred Stock, Series�A, $0.01�par value | New York Stock Exchange | |
| 6 1 / 4 % Capital Securities of Morgan Stanley Capital Trust III (and Registrant�s guaranty with respect thereto) | New York Stock Exchange | |
| 6 1 / 4 % Capital Securities of Morgan Stanley Capital Trust IV (and Registrant�s guaranty with respect thereto) | New York Stock Exchange | |
| 5 3 / 4 % Capital Securities of Morgan Stanley Capital Trust V (and Registrant�s guaranty with respect thereto) | New York Stock Exchange | |
| 6.60% Capital Securities of Morgan Stanley Capital Trust VI (and Registrant�s guaranty with respect thereto) | New York Stock Exchange | |
| 6.60% Capital Securities of Morgan Stanley Capital Trust VII (and Registrant�s guaranty with respect thereto) | New York Stock Exchange | |
| 6.45% Capital Securities of Morgan Stanley Capital Trust VIII (and Registrant�s guaranty with respect thereto) | New York Stock Exchange | |
| Capital Protected Notes due September�30, 2012 | NYSE Arca, Inc. | |
| MPS SM due March�30, 2012 | NYSE Arca, Inc. | |
| Market Vectors ETNs due March�31, 2020 (2 issuances); Market Vectors ETNs due April�30, 2020 (2 issuances) | NYSE Arca, Inc. | |
| Morgan Stanley Cushing � MLP High Income Index ETNs due March�21, 2031 | NYSE Arca, Inc. | |
| Morgan Stanley S&P 500 Crude Oil Linked ETNs due July�1, 2031 | NYSE Arca, Inc. | |
| Large Accelerated Filer x Non-Accelerated�Filer � (Do not check if a smaller reporting company) | Accelerated�Filer � Smaller reporting company � |
ANNUAL REPORT ON FORM 10-K for the year ended December�31, 2011 | Table�of�Contents | Page | |||||
| Part I | ||||||
| Item�1. | Business | 1 | ||||
| Overview | 1 | |||||
| Available Information | 1 | |||||
| Business Segments | 2 | |||||
| Institutional Securities | 2 | |||||
| Global Wealth Management Group | 4 | |||||
| Asset Management | 5 | |||||
| Competition | 6 | |||||
| Supervision and Regulation | 7 | |||||
| Executive Officers of Morgan Stanley | 18 | |||||
| Item�1A. | Risk Factors | 20 | ||||
| Item 1B. | Unresolved Staff Comments | 30 | ||||
| Item 2. | Properties | 31 | ||||
| Item 3. | Legal Proceedings | 32 | ||||
| Item 4. | Mine Safety Disclosures | 40 | ||||
| Part II | ||||||
| Item 5. | Market for Registrant�s Common Equity, Related Stockholder Matters and Issuer Purchases of Equity Securities | 41 | ||||
| Item 6. | Selected Financial Data | 44 | ||||
| Item 7. | Management�s Discussion and Analysis of Financial Condition and Results of Operations | 46 | ||||
| Introduction | 46 | |||||
| Executive Summary | 47 | |||||
| Business Segments | 56 | |||||
| Accounting Developments | 75 | |||||
| Other Matters | 76 | |||||
| Critical Accounting Policies | 79 | |||||
| Liquidity and Capital Resources | 84 | |||||
| Item 7A. | Quantitative and Qualitative Disclosures about Market Risk | 100 | ||||
| Item 8. | Financial Statements and Supplementary Data | 125 | ||||
| Report of Independent Registered Public Accounting Firm | 125 | |||||
| Consolidated Statements of Financial Condition | 126 | |||||
| Consolidated Statements of Income | 128 | |||||
| Consolidated Statements of Comprehensive Income | 129 | |||||
| Consolidated Statements of Cash Flows | 130 | |||||
| Consolidated Statements of Changes in Total Equity | 131 | |||||
 Table of Contents
| Page | ||||||
| Notes to Consolidated Financial Statements | 133 | |||||
| Financial Data Supplement (Unaudited) | 261 | |||||
| Item 9. | Changes in and Disagreements with Accountants on Accounting and Financial Disclosure | 268 | ||||
| Item�9A. | Controls and Procedures | 268 | ||||
| Item�9B. | Other Information | 270 | ||||
| Part�III | ||||||
| Item 10. | Directors, Executive Officers and Corporate Governance | 271 | ||||
| Item 11. | Executive Compensation | 271 | ||||
| Item 12. | Security Ownership of Certain Beneficial Owners and Management and Related Stockholder Matters | 272 | ||||
| Item 13. | Certain Relationships and Related Transactions, and Director Independence | 272 | ||||
| Item 14. | Principal Accountant Fees and Services | 272 | ||||
| Part�IV | ||||||
| Item�15. | Exhibits and Financial Statement Schedules | 273 | ||||
| Signatures | S-1 | |||||
| Exhibit Index | E-1 | |||||
Table of Contents Forward-Looking Statements We have included in or incorporated by reference into this report, and from time to time may make in our public filings, press
releases or other public statements, certain statements, including (without limitation) those under �Legal Proceedings� in Part I, Item�3, �Management�s Discussion and Analysis of Financial Condition and Results of
Operations� in Part II, Item�7 and �Quantitative and Qualitative Disclosures about Market Risk� in Part II, Item�7A, that may constitute �forward-looking statements� within the meaning of the safe harbor provisions
of the Private Securities Litigation Reform Act of 1995. In addition, our management may make forward-looking statements to analysts, investors, representatives of the media and others. These forward-looking statements are not historical facts and
represent only our beliefs regarding future events, many of which, by their nature, are inherently uncertain and beyond our control. The nature of our business makes predicting the future trends of our revenues, expenses and net income difficult. The risks and uncertainties involved in
our businesses could affect the matters referred to in such statements, and it is possible that our actual results may differ from the anticipated results indicated in these forward-looking statements. Important factors that could cause actual
results to differ from those in the forward-looking statements include (without limitation): | � | the effect of economic and political conditions and geopolitical events; |
| � | the effect of market conditions, particularly in the global equity, fixed income, credit and commodities markets, including corporate and mortgage (commercial and residential) lending and commercial real estate markets; |
| � | the impact of current, pending and future legislation (including the Dodd-Frank Wall Street Reform and Consumer Protection Act (the �Dodd-Frank Act�)), regulation (including capital, leverage and liquidity requirements), and legal actions in the U.S. and worldwide; |
| � | the level and volatility of equity, fixed income and commodity prices, interest rates, currency values and other market indices; |
| � | the availability and cost of both credit and capital as well as the credit ratings assigned to our unsecured short-term and long-term debt; |
| � | investor sentiment and confidence in the financial markets; |
| � | the performance of our acquisitions, joint ventures, strategic alliances or other strategic arrangements; |
| � | our reputation; |
| � | inflation, natural disasters and acts of war or terrorism; |
| � | the actions and initiatives of current and potential competitors as well as governments, regulators and self-regulatory organizations; |
| � | technological changes; and |
| � | other risks and uncertainties detailed under �Business�Competition� and �Business�Supervision and Regulation� in Part I, Item�1, �Risk Factors� in Part I, Item�1A and elsewhere throughout this report. |
Table of Contents Part I | Item�1. | Business. |
| 1 | |
| | 2 |
| 3 | |
Table of Contents Products and Services. The Company�s Global Wealth Management Group provides clients with a
comprehensive array of financial solutions, including products and services from the Company, Citigroup Inc. (�Citi�) and third-party providers, such as insurance companies and mutual fund families. Global Wealth Management Group provides
brokerage and investment advisory services covering various types of investments, including equities, options, futures, foreign currencies, precious metals, fixed income securities, mutual funds, structured products, alternative investments, unit
investment trusts, managed futures, separately managed accounts and mutual fund asset allocation programs. Global Wealth Management Group also engages in fixed income principal trading, which primarily facilitates clients� trading or
investments in such securities. In addition, Global Wealth Management Group offers education savings programs, financial and wealth planning services, and annuity and other insurance products. In addition, Global Wealth Management Group offers its clients access to several cash management services through various banks
and other third parties, including deposits, debit cards, electronic bill payments and check writing, as well as lending products through affiliates such as Morgan Stanley Private Bank, National Association (�MS Private Bank�) and MSBNA,
including securities based lending, mortgage loans and home equity lines of credit. Global Wealth Management Group also provides trust and fiduciary services, offers access to cash management and commercial credit solutions to qualified small- and
medium-sized businesses in the U.S., and provides individual and corporate retirement solutions, including individual retirement accounts and 401(k) plans and U.S. and global stock plan services to corporate executives and businesses. Global Wealth Management Group provides clients a variety of ways to
establish a relationship and conduct business, including brokerage accounts with transaction-based pricing and investment advisory accounts with asset-based fee pricing. Operations and Information Technology. As a result of the MSSB joint venture, the operations and technology
supporting the Global Wealth Management Group is provided by a combination of the Company and MSSB�s Operations and Information Technology departments and by Citi. Pursuant to contractual agreements, the Company, MSSB and Citi perform various
broker-dealer related functions, such as execution and clearing of brokerage transactions, margin lending and custody of client assets. For the Company and MSSB, these activities are undertaken through their own facilities, through memberships in
various clearing and settlement organizations, and through agreements with unaffiliated third parties. Citi also provides certain other services and systems to support the Global Wealth Management Group through transition services agreements with
MSSB. Asset Management. The Company�s Asset Management business segment is one
of the largest global investment management organizations of any full-service financial services firm and offers clients a diverse array of equity, fixed income and alternative investments and merchant banking strategies. Portfolio managers located
in the U.S., Europe and Asia manage investment products ranging from money market funds to equity and fixed income strategies, alternative investment and merchant banking products in developed and emerging markets across geographies and market cap
ranges. The Company offers a range of alternative investment,
real estate investing and merchant banking products for institutional investors and high net worth individuals. The Company�s alternative investments platform includes funds of hedge funds, funds of private equity funds and portable alpha
strategies. The Company�s alternative investments platform also includes minority stakes in Lansdowne Partners, Avenue Capital Group and Traxis Partners LP. The Company�s real estate and merchant banking businesses include its real estate
investing business, private equity funds, corporate mezzanine debt investing group and infrastructure investing group. The 5 Table of Contents Company typically acts as general partner of, and investment adviser to, its alternative investment, real estate and merchant banking funds and typically commits to invest a minority of the
capital of such funds with subscribing investors contributing the majority. Institutional Investors. The Company provides investment management strategies and products to institutional investors worldwide, including corporations, pension plans, endowments, foundations, sovereign wealth funds, insurance
companies and banks through a broad range of pooled vehicles and separate accounts. Additionally, the Company provides sub-advisory services to various unaffiliated financial institutions and intermediaries. A Global Sales and Client Service team is
engaged in business development and relationship management for consultants to help serve institutional clients. Intermediary Clients and Individual Investors. The Company offers open-end and alternative investment funds and separately managed accounts to individual investors through affiliated and unaffiliated broker-dealers, banks, insurance companies,
financial planners and other intermediaries. Closed-end funds managed by the Company are available to individual investors through affiliated and unaffiliated broker-dealers. The Company also distributes mutual funds through numerous retirement plan
platforms. Internationally, the Company distributes traditional investment products to individuals outside the U.S. through non-proprietary distributors and distributes alternative investment products through affiliated broker-dealers and banks. Operations and Information Technology. The Company�s Operations and Information Technology departments provide
or oversee the process and technology platform required to support its asset management business. Support activities include transfer agency, mutual fund accounting and administration, transaction processing and certain fiduciary services on behalf
of institutional, intermediary and high net worth clients. These activities are undertaken through the Company�s own facilities, through membership in various clearing and settlement organizations, and through agreements with unaffiliated third
parties. Competition. All aspects of the Company�s businesses are highly competitive, and the
Company expects them to remain so. The Company competes in the U.S. and globally for clients, market share and human talent in all aspects of its business segments. The Company�s competitive position depends on its reputation and the quality
and consistency of its long-term investment performance. The Company�s ability to sustain or improve its competitive position also depends substantially on its ability to continue to attract and retain highly qualified employees while managing
compensation and other costs. The Company competes with commercial banks, brokerage firms, insurance companies, sponsors of mutual funds, hedge funds, energy companies and other companies offering financial services in the U.S., globally and through
the internet. Over time, certain sectors of the financial services industry have become more concentrated, as institutions involved in a broad range of financial services have been acquired by or merged into other firms or have declared bankruptcy.
Such changes could result in the Company�s remaining competitors gaining greater capital and other resources, such as the ability to offer a broader range of products and services and geographic diversity. See also �Supervision and
Regulation� and �Risk Factors� herein. Institutional Securities and Global Wealth Management Group. The Company�s competitive position for its Institutional Securities and
Global Wealth Management Group business segments depends on innovation, execution capability and relative pricing. The Company competes directly in the U.S. and globally with other securities and financial services firms and broker-dealers and with
others on a regional or product basis. 6 Table of Contents The Company�s ability to access capital at competitive rates (which is generally dependent on the
Company�s credit ratings) and to commit capital efficiently, particularly in its capital-intensive underwriting and sales, trading, financing and market-making activities, also affects its competitive position. Corporate clients may request
that the Company provide loans or lending commitments in connection with certain investment banking activities, and such requests are expected to increase in the future. It is possible that competition may become even more intense as the Company
continues to compete with financial institutions that may be larger, or better capitalized, or may have a stronger local presence and longer operating history in certain areas. Many of these firms have the ability to offer a wide range of products
and services that may enhance their competitive position and could result in pricing pressure in our businesses. The complementary trends in the financial services industry of consolidation and globalization present, among other things,
technological, risk management, regulatory and other infrastructure challenges that require effective resource allocation in order for the Company to remain competitive. The Company has experienced intense price competition in some of its
businesses in recent years. In particular, the ability to execute securities trades electronically on exchanges and through other automated trading markets has increased the pressure on trading commissions. The trend toward direct access to
automated, electronic markets will likely continue. It is possible that the Company will experience competitive pressures in these and other areas in the future as some of its competitors may seek to obtain market share by reducing prices. Asset Management. Competition in the asset management industry is affected by several factors,
including the Company�s reputation, investment objectives, quality of investment professionals, performance of investment strategies or product offerings relative to peers and an appropriate benchmark index, advertising and sales promotion
efforts, fee levels, the effectiveness of and access to distribution channels and investment pipelines, and the types and quality of products offered. The Company�s alternative investment products, such as private equity funds, real estate and
hedge funds, compete with similar products offered by both alternative and traditional asset managers. Supervision and Regulation As a major financial services firm, the Company is subject to extensive regulation by U.S. federal and state regulatory agencies and securities exchanges and by regulators and exchanges in each of the
major markets where it operates. Moreover, in response to the financial crisis, legislators and regulators, both in the U.S. and around the world, are in the process of adopting and implementing a wide range of reforms that will result in major
changes to the way the Company is regulated and conducts its business. It will take time for the comprehensive effects of these reforms to emerge and be understood. Regulatory Outlook. On July�21, 2010, President Obama signed the Dodd-Frank Act into law.
While certain portions of the Dodd-Frank Act were effective immediately, other portions will be effective only following extended transition periods. Moreover, implementation of the Dodd-Frank Act will be accomplished through numerous rulemakings by
multiple governmental agencies, only a portion of which have been completed. It remains difficult to assess fully the impact that the Dodd-Frank Act will have on the Company and on the financial services industry generally. In addition, various
international developments, such as the adoption of risk-based capital, leverage and liquidity standards by the Basel Committee on Banking Supervision (the �Basel Committee�), known as �Basel III,� will impact the Company in the
coming years. It is likely that 2012 and subsequent years will
see further material changes in the way major financial institutions are regulated in both the U.S. and other markets in which the Company operates, although it remains difficult to predict which further reform initiatives will become law, how such
reforms will be implemented or the exact impact they will have on the Company�s business, financial condition, results of operations and cash flows for a particular future period. 7 Table of Contents Financial Holding Company. The Company has operated as a bank holding company and financial holding
company under the BHC Act since September 2008. Consolidated Supervision. As a bank holding company, the Company is subject to comprehensive consolidated supervision, regulation and examination by the Federal Reserve. As a
result of the Dodd-Frank Act, the Federal Reserve also gained heightened authority to examine, prescribe regulations and take action with respect to all of the Company�s subsidiaries. In particular, as a result of the Dodd-Frank Act, the
Company is subject to (among other things) significantly revised and expanded regulation and supervision, to more intensive scrutiny of its businesses and plans for expansion of those businesses, to new activities limitations, to the Volcker Rule,
to a systemic risk regime which will impose especially high capital and liquidity requirements, and to comprehensive new derivatives regulation. In addition, the Bureau of Consumer Financial Protection has exclusive rulemaking and primary
enforcement and examination authority over the Company and its subsidiaries with respect to federal consumer financial laws, to the extent applicable. Scope of Permitted Activities. The BHC Act provides a two-year period from September�21, 2008, the date that the
Company became a bank holding company, for the Company to conform or dispose of certain nonconforming activities as defined by the BHC Act. Three one-year extensions may be granted by the Federal Reserve upon approval of the Company�s
application for each extension. The Company has received the second of these extensions with respect to certain activities relating to its real estate and other funds businesses. It has also disposed of certain nonconforming assets and conformed
certain activities to the requirements of the BHC Act. Although conformance activities continue with respect to these businesses, it is possible that the Company will be required, in 2012, to seek Federal Reserve approval for the third additional
year permitted by the BHC Act. The Federal Reserve may grant an extension if it finds that the extension will not be detrimental to the public interest. Based on the nonconforming real estate and other investments and businesses which are required
to be sold, the Company believes there would be no material adverse impact on the Company�s financial condition or operations. In addition, the Company is engaged in discussions with the Federal Reserve regarding its commodities activities, as the BHC Act also grandfathers
�activities related to the trading, sale or investment in commodities and underlying physical properties,� provided that the Company was engaged in �any of such activities as of September�30, 1997 in the United States� and
provided that certain other conditions that are within the Company�s reasonable control are satisfied. If the Federal Reserve were to determine that any of the Company�s commodities activities did not qualify for the BHC Act grandfather
exemption, then the Company would likely be required to divest any such activities that did not otherwise conform to the BHC Act by the end of any extensions of the grace period. At this time the Company does not believe, based on its interpretation
of applicable law, that any such required divestment would have a material adverse impact on its financial condition or operations. Activities Restrictions under the Volcker Rule. A section of the BHC Act added by the Dodd-Frank Act (the
�Volcker Rule�) will, over time, prohibit �banking entities,� including the Company and its affiliates, from engaging in �proprietary trading,� as defined by the regulators. The Volcker Rule�will also require
banking entities to either restructure or unwind certain investments and relationships with �hedge funds� and �private equity funds,� as such terms are defined in the Volcker Rule and by the regulators. Comments on proposed
regulations to implement the substantive Volcker Rule provisions were due by February�13, 2012. It is unclear whether final rules will be in place by July�21, 2012 when the Volcker Rule is scheduled to become effective. Banking entities will have a two-year transition period to come into full
compliance with the Volcker Rule, subject to the possibility of extensions. While full compliance with the Volcker Rule will likely only be required 8 Table of Contents by July 2014, subject to extensions, the Company�s business and operations are expected to be impacted earlier, as operating models, investments and legal structures must be reviewed and
gradually adjusted to the new legal environment. The Company continues to review its private equity fund, hedge fund and proprietary trading operations. With respect to the �proprietary trading� prohibition of the Volcker Rule, the Company
has previously announced plans to dispose of its in-house proprietary quantitative trading unit, Process-Driven Trading (�PDT�), by the end of 2012. For the year ended December�31, 2011, PDT did not have a material impact on the
Company�s financial condition, results of operations and liquidity. The Company has also previously exited other standalone proprietary trading businesses (defined as those businesses dedicated solely to investing the Company�s capital),
and the Company is continuing to liquidate legacy positions related to those businesses. There remains considerable uncertainty about the interpretation of the proposed rules, and we are unable to predict what the final version of the rules will be or the impact they may have on our
businesses. We are closely monitoring regulatory developments related to the Volcker Rule, and when the regulations are final, we will be in a position to complete a review of our relevant activities and make plans to implement compliance with the
Volcker Rule. Capital and Liquidity
Standards. The Federal Reserve establishes capital requirements for the Company and evaluates its compliance with such capital requirements. The Office of the Comptroller of the Currency (the �OCC�)
establishes similar capital requirements and standards for the Company�s national bank subsidiaries. Under current capital requirements, for the Company to remain a financial holding company, its bank subsidiaries must qualify as �well
capitalized� by maintaining a total capital ratio (total capital to risk-weighted assets) of at least 10% and a Tier 1 capital ratio of at least 6%. The capital standards applicable to the Company�s bank subsidiaries also apply directly to
the Company, as a holding company, and require it to remain �well capitalized� to maintain its status as a financial holding company. The Federal Reserve may require the Company and its peer financial holding companies to maintain
risk-based and leverage capital ratios substantially in excess of mandated minimum levels, depending upon general economic conditions and their particular condition, risk profile and growth plans. In addition, under the Federal Reserve�s
leverage rules, bank holding companies that have implemented the Federal Reserve�s risk-based capital measure for market risk, such as the Company, are subject to a Tier 1 minimum leverage ratio of 3%. The Company calculates its capital ratios and risk-weighted assets in
accordance with the capital adequacy standards for financial holding companies adopted by the Federal Reserve. These standards are based upon a framework described in the �International Convergence of Capital Measurement and Capital
Standards,� July 1988, as amended, also referred to as Basel I. In December 2007, the U.S. banking regulators published final regulations incorporating the Basel II Accord, which requires internationally active banking organizations, as well as
certain of their U.S. bank subsidiaries, to implement Basel II standards over the next several years. In July 2010, the Company began reporting its capital adequacy standards on a parallel basis to its regulators under Basel I and Basel II as part
of a phased implementation of Basel II. In June 2011, the U.S.
banking regulators published final regulations implementing a provision of the Dodd-Frank Act requiring that certain institutions supervised by the Federal Reserve, including the Company, be subject to capital requirements that are not less than the
generally applicable risk-based capital requirements.�As a result, the generally applicable capital standards, which are based on Basel I standards, but may themselves change over time, will serve as a permanent floor to minimum capital
requirements calculated under the Basel II standard the Company is currently required to implement, as well as future capital standards. In addition, when implemented, Basel III will impose a new minimum Tier 1 common equity ratio of 4.5%, a minimum Tier 1 equity ratio of 6%, and the
minimum total capital ratio will remain at 8.0% (plus a 2.5% capital conservation buffer consisting of common equity in addition to these ratios). The new capital conservation buffer will impose a common equity requirement above the new minimum that
can be depleted under stress. Basel III also introduces new liquidity measures designed to monitor banking institutions for their ability to meet short-term 9 Table of Contents cash flow needs and to address longer-term structural liquidity mismatches. The Federal Reserve is expected to propose rules implementing Basel III in the U.S. in 2012. However, many provisions,
once adopted, will be subject to extended phase-in periods. The
Federal Reserve has indicated that it intends to implement a provision under Basel III that would require global systemically important banks (�G-SIBs�), such as the Company, to hold an additional capital buffer. Although the Federal
Reserve has not yet issued a proposed rule to implement this G-SIB surcharge, in November 2011 the Financial Stability Board endorsed a Basel Committee proposal providing that the capital surcharge would range from 1% to 2.5% of risk-weighted
assets, and that the largest systemically important financial institutions could potentially be subject to a 3.5% capital surcharge. See also �Management�s Discussion and Analysis of Financial Condition and Results of Operation�Liquidity and Capital
Resources�Regulatory Requirements� in Part II, Item�7 herein. Capital Planning, Stress Tests and Dividends. U.S. banking regulators have recently imposed new capital planning and stress test requirements on large bank holding
companies, including the Company. As of December 2011, bank holding companies with $50 billion or more of consolidated assets, such as the Company, must submit annual capital plans to the Federal Reserve, taking into account the results of separate
stress tests designed by the bank holding company and the Federal Reserve. The scenario provided by the Federal Reserve in 2011 includes a sizable shortfall in U.S. economic activity and employment, accompanied by a sizeable decline in global
economic activity, sharp market price movements in European sovereign and financial sectors, among other adverse circumstances. The capital plans must include a description of all planned capital actions over a nine-quarter planning horizon,
including any issuance of a debt or equity capital instrument, any capital distribution (i.e., payments of dividends or stock repurchases), and any similar action that the Federal Reserve determines could impact the bank holding company�s
consolidated capital. The capital plans must include a discussion of how the bank holding company will maintain capital above the minimum regulatory capital ratios and above a Tier 1 common ratio of 5%, and serve as a source of strength to its
subsidiary depository institutions. Beginning in 2012, bank
holding companies subject to the capital planning requirements, including the Company, must submit their capital plans in January each year, and the Federal Reserve must object to them, in whole or in part, or provide written notice of non-objection
by March�31 each year. If the Federal Reserve objects to the capital plan, or if certain material events occur after approval of a plan, the bank holding company must submit a revised capital plan within 30 days. In addition, even with an
approved capital plan, the bank holding company must seek the approval of the Federal Reserve before taking a capital action if, among other reasons, the bank holding company would not meet its regulatory capital requirements after taking the
proposed capital action. In addition to capital planning requirements, the OCC, the Federal Reserve and the FDIC have authority to prohibit or to limit the payment of dividends by the banking organizations they supervise, including the Company,
MSBNA and other depository institution subsidiaries of the Company, if, in the banking regulator�s opinion, payment of a dividend would constitute an unsafe or unsound practice in light of the financial condition of the banking organization.
All of these policies and other requirements could influence the Company�s ability to pay dividends, or require it to provide capital assistance to MSBNA or MS Private Bank under circumstances under which the Company would not otherwise decide
to do so. See also ��Capital and Liquidity
Standards� above. Systemic Risk
Regime. The Dodd-Frank Act established a new regulatory framework applicable to financial institutions deemed to pose systemic risks. Bank holding companies with $50 billion or more in consolidated assets, such as the
Company, became automatically subject to the systemic risk regime in July 2010. A new oversight body, the Financial Stability Oversight Council (the �Council�), can recommend prudential standards, reporting and disclosure requirements to
the Federal Reserve for systemically important financial institutions, and must approve any finding by the Federal Reserve that a financial institution poses a grave threat to financial stability and must undertake mitigating actions. The Council is
also empowered to designate systemically 10 Table of Contents important payment, clearing and settlement activities of financial institutions, subjecting them to prudential supervision and regulation, and, assisted by the new Office of Financial Research
within the U.S. Department of the Treasury (�U.S. Treasury�) (established by the Dodd-Frank Act), can gather data and reports from financial institutions, including the Company. In December 2011, the Federal Reserve issued proposed rules to implement certain requirements of the systemic risk regime.
Among other provisions, the proposed rules would require systemically important financial institutions, such as the Company, to maintain a sufficient quantity of highly liquid assets to survive a projected 30-day liquidity stress event, to conduct
regular liquidity stress tests, and to implement various liquidity risk management requirements. More generally, the proposed rules would require institutions to comply with a range of corporate governance requirements, such as establishment of a
risk committee of the board of directors and appointment of a chief risk officer, both of which the Company already has. The proposed rules would also limit the aggregate exposure of each of the largest systemically important financial institutions, including the Company, to
each other such institution to 10% of the aggregate capital and surplus of each institution, and limit the aggregate exposure of such institutions to any other bank holding company with $50 billion or more of consolidated assets to 25% of each
institution�s aggregate capital and surplus. In addition, the proposed rules would create a new early remediation regime to address financial distress or material management weaknesses determined with reference to four levels of early
remediation, including heightened supervisory review, initial remediation, recovery, and resolution assessment, with specific limitations and requirements tied to each level. The proposed rules would also subject systemically important financial
institutions to regular stress tests, including institution-administered tests and separate tests conducted by the Federal Reserve, and require publication of public summaries of institutions� self-administered stress tests. The systemic risk regime also provides that, for institutions posing a grave
threat to U.S. financial stability, the Federal Reserve, upon Council vote, must limit that institution�s ability to merge, restrict its ability to offer financial products, require it to terminate activities, impose conditions on activities
or, as a last resort, require it to dispose of assets. Upon a grave threat determination by the Council, the Federal Reserve must issue rules that require financial institutions subject to the systemic risk regime to maintain a debt-to-equity ratio
of no more than 15-to-1 if the Council considers it necessary to mitigate the risk. The Federal Reserve also has the ability to establish further standards, including those regarding contingent capital, enhanced public disclosures, and limits on
short-term debt, including off-balance sheet exposures. See also
��Capital and Liquidity Standards� above and ��Orderly Liquidation Authority� below. Orderly Liquidation Authority. Under the Dodd-Frank Act, financial companies, including bank holding companies such as Morgan Stanley and certain covered subsidiaries,
can be subjected to a new orderly liquidation authority. The U.S. Treasury must first make certain extraordinary financial distress and systemic risk determinations. Absent such U.S. Treasury determinations, the Company as a bank holding company
would remain subject to the U.S. Bankruptcy Code. The orderly
liquidation authority went into effect in July 2010, and rulemaking to render it fully operative is proceeding in stages, with some implementing regulations now finalized and others planned but not yet proposed. If the Company were subjected to the
orderly liquidation authority, the FDIC would be appointed receiver, which would give the FDIC considerable rights and powers that it must exercise with the goal of liquidating and winding up the Company, including (i)�the FDIC�s right to
assign assets and liabilities and transfer some to a third party or bridge financial company without the need for creditor consent or prior court review; (ii)�the ability of the FDIC to differentiate among creditors, including by treating
junior creditors better than senior creditors, subject to a minimum recovery right to receive at least what they would have received in bankruptcy liquidation; and (iii)�the broad powers given the FDIC to administer the claims process to
determine which creditor receives what, and in which order, from assets not transferred to a third party or bridge financial institution. 11 Table of Contents U.S. Bank Subsidiaries. U.S. Banking Institutions. MSBNA,
primarily a wholesale commercial bank, offers consumer lending and commercial lending services in addition to deposit products. Certain foreign exchange activities are also conducted in MSBNA. As an FDIC-insured national bank, MSBNA is subject to
supervision, regulation and examination by the OCC. MS Private
Bank conducts certain mortgage lending activities primarily for customers of its affiliate retail broker-dealer, Morgan Stanley Smith Barney LLC (�MSSB LLC�). MS Private Bank also offers certain deposit products, as well as personal trust
and prime brokerage custody services. MS Private Bank is an FDIC-insured national bank whose activities are subject to supervision, regulation and examination by the OCC. Prompt Corrective Action. The Federal
Deposit Insurance Corporation Improvement Act of 1991 provides a framework for regulation of depository institutions and their affiliates, including parent holding companies, by their federal banking regulators. Among other things, it requires the
relevant federal banking regulator to take �prompt corrective action� with respect to a depository institution if that institution does not meet certain capital adequacy standards. Current regulations generally apply only to insured banks
and thrifts such as MSBNA or MS Private Bank and not to their parent holding companies, such as Morgan Stanley. The Federal Reserve is, however, subject to limitations, authorized to take appropriate action at the holding company level. In addition,
as described above, under the systemic risk regime, the Company will become subject to an early remediation protocol in the event of financial distress. Transactions with Affiliates. The Company�s U.S. subsidiary banks are subject to Sections 23A and 23B of the
Federal Reserve Act, which impose restrictions on any extensions of credit to, purchase of assets from, and certain other transactions with, any affiliates. These restrictions include limits on the total amount of credit exposure that they may have
to any one affiliate and to all affiliates, as well as collateral requirements, and they require all such transactions to be made on market terms. Under the Dodd-Frank Act, the affiliate transaction limits will be substantially broadened.
Implementing rulemaking is called for by July 2012. At that time, the Company�s U.S. banking subsidiaries will also become subject to more onerous lending limits. Both reforms will place limits on the Company�s U.S. banking
subsidiaries� ability to engage in derivatives, repurchase agreements and securities lending transactions with other affiliates of the Company. FDIC Regulation. An FDIC�insured depository institution is generally liable for any loss incurred or expected to
be incurred by the FDIC in connection with the failure of an insured depository institution under common control by the same bank holding company. As FDIC-insured depository institutions, MSBNA and MS Private Bank are exposed to each other�s
losses. In addition, both institutions are exposed to changes in the cost of FDIC insurance. In 2010, the FDIC adopted a restoration plan to replenish the reserve fund over a multi-year period. Under the Dodd-Frank Act, some of the restoration must
be paid for exclusively by large depository institutions, including MSBNA, and assessments are calculated using a new methodology that generally favors banks that are mostly funded by deposits. Institutional Securities and Global Wealth Management Group. Broker-Dealer
Regulation. The Company�s primary U.S. broker-dealer subsidiaries, MS&Co. and MSSB LLC, are registered broker-dealers with the SEC and in all 50 states, the District of Columbia, Puerto Rico and the U.S.
Virgin Islands, and are members of various self-regulatory organizations, including the Financial Industry Regulatory Authority, Inc. (�FINRA�), and various securities exchanges and clearing organizations. In addition, MS&Co. and MSSB
LLC are registered investment advisers with the SEC. Broker-dealers are subject to laws and regulations covering all aspects of the securities business, including sales and trading practices, securities offerings, publication of research reports,
use of customers� funds and securities, capital structure, recordkeeping and retention, and the conduct of their directors, officers, representatives and other associated persons. Broker-dealers are also regulated by securities administrators
in those states where they do business. Violations of the laws and regulations governing a broker-dealer�s actions could result in censures, fines, the 12 Table of Contents issuance of cease-and-desist orders, revocation of licenses or registrations, the suspension or expulsion from the securities industry of such broker-dealer or its officers or employees, or other
similar consequences by both federal and state securities administrators. The Dodd-Frank Act includes various provisions that affect the regulation of broker-dealer sales practices and customer relationships. For example, the SEC is authorized to adopt a fiduciary duty
applicable to broker-dealers when providing investment advice to retail customers. The Dodd-Frank Act also creates a new category of regulation for �municipal advisors,� which are subject to a fiduciary duty with respect to certain
activities. The U.S. Department of Labor is considering revisions to regulations under the Employee Retirement Income Security Act of 1974 that could subject broker-dealers to a fiduciary duty and prohibit specified transactions for a wider range of
customer interactions. These developments may impact the manner in which affected businesses are conducted, decrease profitability and increase potential liabilities. If the SEC exercises authority provided to it under the Dodd-Frank Act to prohibit
or limit the use of mandatory arbitration pre-dispute agreements between a broker-dealer and its customers, it may materially increase the Company�s litigation costs. Margin lending by broker-dealers is regulated by the Federal Reserve�s
restrictions on lending in connection with customer and proprietary purchases and short sales of securities, as well as securities borrowing and lending activities. Broker-dealers are also subject to maintenance and other margin requirements imposed
under FINRA and other self-regulatory organization rules. In many cases, the Company�s broker-dealer subsidiaries� margin policies are more stringent than these rules. As registered U.S. broker-dealers, certain subsidiaries of the Company are
subject to the SEC�s net capital rule and the net capital requirements of various exchanges, other regulatory authorities and self-regulatory organizations. Many non-U.S. regulatory authorities and exchanges also have rules relating to capital
and, in some cases, liquidity requirements that apply to the Company�s non-U.S. broker-dealer subsidiaries. These rules are generally designed to measure general financial integrity and/or liquidity and require that at least a minimum amount of
net and/or more liquid assets be maintained by the subsidiary. See also �Consolidated Supervision� and �Capital Standards� above. Rules of FINRA and other self-regulatory organizations also impose limitations and requirements on
the transfer of member organizations� assets. Compliance
with regulatory capital requirements may limit the Company�s operations requiring the intensive use of capital. Such requirements restrict the Company�s ability to withdraw capital from its broker-dealer subsidiaries, which in turn may
limit its ability to pay dividends, repay debt, or redeem or purchase shares of its own outstanding stock. Any change in such rules or the imposition of new rules affecting the scope, coverage, calculation or amount of capital requirements, or a
significant operating loss or any unusually large charge against capital, could adversely affect the Company�s ability to pay dividends or to expand or maintain present business levels. In addition, such rules may require the Company to make
substantial capital infusions into one or more of its broker-dealer subsidiaries in order for such subsidiaries to comply with such rules. MS&Co. and MSSB LLC are members of the Securities Investor Protection Corporation (�SIPC�), which provides protection for customers of
broker-dealers against losses in the event of the insolvency of a broker-dealer. SIPC protects customers� eligible securities held by a member broker-dealer up to $500,000 per customer for all accounts in the same capacity subject to a
limitation of $250,000 for claims for uninvested cash balances. To supplement this SIPC coverage, each of MS&Co. and MSSB LLC have purchased additional protection for the benefit of their customers in the form of an annual policy issued by
certain underwriters and various insurance companies that provides protection for each eligible customer above SIPC limits subject to an aggregate firmwide cap of $1 billion with no per client sublimit for securities and a $1.9 million per client
limit for the cash portion of any remaining shortfall. As noted under �Systemic Risk Regime,� the Dodd-Frank Act contains special provisions for the orderly liquidation of covered financial institutions (which could potentially include
MS&Co. and/or MSSB LLC). While these provisions are generally intended to provide customers of covered broker-dealers with protections at least as beneficial as they would enjoy in a broker-dealer liquidation proceeding under the Securities
Investor Protection Act, the details and implementation of such protections are subject to further rulemaking. 13 Table of Contents Over the past few years, the SEC has undertaken a review of a wide range of equity market structure issues.
As a part of this review, the SEC has adopted new regulations and proposed various rules regarding market transparency. A new short sale uptick rule that limits the ability to sell short securities that have experienced specified price declines is
now in effect. The SEC also adopted rules requiring broker-dealers to maintain risk management controls and supervisory procedures with respect to providing access to securities markets, which will become fully effective in 2012. In addition, in an
effort to prevent volatile trading, self-regulatory organizations have adopted trading pauses, more commonly referred to as circuit breakers, with respect to certain securities. It is possible that the SEC or self-regulatory organizations could
propose or adopt additional market structure rules in the future. The provisions, new rules and proposals discussed above could result in increased costs and could otherwise adversely affect trading volumes and other
conditions in the markets in which we operate. Regulation
of Registered Futures Activities and Certain Commodities Activities. As registered futures commission merchants, MS&Co. and MSSB LLC are subject to net capital requirements of, and their activities are regulated
by, the U.S. Commodity Futures Trading Commission (the �CFTC�) and various commodity futures exchanges. The Company�s futures and options-on-futures businesses also are regulated by the National Futures Association (�NFA�),
a registered futures association, of which MS&Co. and MSSB LLC and certain of their affiliates are members. These regulatory requirements differ for clearing and non-clearing firms, and they address obligations related to, among other things,
the registration of the futures commission merchant and certain of its associated persons, membership with the NFA, the segregation of customer funds and the holding apart of a secured amount, the use of customer funds, the receipt of an
acknowledgment of certain written risk disclosure statements, the receipt of trading authorizations, the furnishing of daily confirmations and monthly statements, recordkeeping and reporting obligations, the supervision of accounts and antifraud
prohibitions. Among other things, the NFA has rules covering a wide variety of areas such as advertising, telephone solicitations, risk disclosure, discretionary trading, disclosure of fees, minimum capital requirements, reporting and proficiency
testing. MS&Co. and MSSB LLC have affiliates that are registered as commodity trading advisors and/or commodity pool operators, or are operating under certain exemptions from such registration pursuant to CFTC rules and other guidance. Under
CFTC and NFA rules, commodity trading advisors who manage accounts and are registered with the NFA must distribute disclosure documents and maintain specified records relating to their activities, and clients and commodity pool operators have
certain responsibilities with respect to each pool they operate. For each pool, a registered commodity pool operator must prepare and distribute a disclosure document; distribute periodic account statements; prepare and distribute audited annual
financial reports; and keep specified records concerning the participants, transactions and operations of each pool, as well as records regarding transactions of the commodity pool operator and its principals. Violations of the rules of the CFTC,
the NFA or the commodity exchanges could result in remedial actions, including fines, registration restrictions or terminations, trading prohibitions or revocations of commodity exchange memberships. The Company�s commodities activities are subject to extensive and
evolving energy, commodities, environmental, health and safety and other governmental laws and regulations in the U.S. and abroad. Intensified scrutiny of certain energy markets by U.S. federal, state and local authorities in the U.S. and abroad and
by the public has resulted in increased regulatory and legal enforcement and remedial proceedings involving energy companies, including those engaged in power generation and liquid hydrocarbons trading. Terminal facilities and other assets relating
to the Company�s commodities activities also are subject to environmental laws both in the U.S. and abroad. In addition, pipeline, transport and terminal operations are subject to state laws in connection with the cleanup of hazardous
substances that may have been released at properties currently or previously owned or operated by us or locations to which we have sent wastes for disposal. See also ��Scope of Permitted Activities� above. On October�18, 2011, the CFTC adopted a position limits rule that, when
effective, would impose position limits on a trader�s positions in futures, options, and swaps on 28 energy, metals, and agricultural commodities. In 14 Table of Contents December 2011, industry organizations filed a lawsuit against the CFTC challenging the validity of the rule. This rule, if it withstands legal challenge and becomes effective, may affect trading
strategies and affect the profitability of various businesses and transactions. Derivatives Regulation. Through the Dodd-Frank Act, the Company will face a comprehensive U.S. regulatory regime for its activities in certain OTC derivatives. The
regulation of �swaps� and �security-based swaps� (collectively, �Swaps�) in the U.S. will be effected and implemented through CFTC, SEC and other agency regulations, which are currently being adopted. The Dodd-Frank Act requires central clearing of certain types of Swaps,
public and regulatory reporting, and mandatory trading on regulated exchanges or execution facilities. These requirements are subject to some exceptions and will be phased in over time. However, market participants, including the Company�s
entities engaging in Swaps, will have to centrally clear, report and trade on an exchange or execution facility certain Swap transactions that are currently uncleared, not reported publicly and executed bilaterally. The Dodd-Frank Act also requires the registration of �swap dealers�
and �major swap participants� with the CFTC and �security-based swap dealers� and �major security-based swap participants� with the SEC (collectively, �Swaps Entities�). Certain subsidiaries of the Company
will be required to register as a swap dealer and security-based swap dealer and it is possible some subsidiaries may register as a major swap participant and major security-based swap participant. Swaps Entities will be subject to a comprehensive
regulatory regime with new obligations for the Swaps activities for which they are registered, including new capital requirements, a new margin regime for uncleared Swaps and a new segregation regime for collateral of counterparties to uncleared
Swaps. Swaps Entities also will be subject to additional duties, including internal and external business conduct and documentation standards with respect to their Swaps counterparties. The specific parameters of these Swaps Entities requirements are being developed through CFTC, SEC and bank regulator
rulemakings. The impact of the regulation on Morgan Stanley entities required to register remains unclear. It is likely, however, that the Company will face increased costs due to the registration and regulatory requirements listed above. Complying
with the proposed regulation of Swaps Entities could require the Company to restructure its Swaps businesses, require extensive systems changes, require personnel changes, and raise additional potential liabilities and regulatory oversight.
Compliance with Swap-related regulatory capital requirements may require the Company to devote more capital to its Swaps business. The extraterritorial impact of the rules also remains unclear. Morgan Stanley Swap Entities will also be subject to new rules under the
Dodd-Frank Act regarding segregation of customer collateral for cleared transactions, position limits, large trader reporting regimes, compensation requirements and anti-fraud and anti-manipulation requirements related to activities in Swaps. The European Union (�E.U.�) is in the process of
amending its OTC derivatives regulations. In October 2011, the E.U. published a proposal to amend the Markets in Financial Instruments Directive and recently reached an accord to require central clearing of certain OTC derivatives. The Company
currently expects that, when the E.U. OTC derivatives regime is fully implemented, it will be similar to derivatives regulation under the Dodd-Frank Act, including with respect to the scope of derivatives covered, and mandatory clearing, reporting,
and trading requirements. It is unclear at present how the E.U. and U.S. derivatives regulation will interact. Non-U.S. Regulation. The Company�s institutional securities businesses also are regulated extensively by non-U.S. regulators, including governments, securities
exchanges, commodity exchanges, self-regulatory organizations, central banks and regulatory bodies, especially in those jurisdictions in which the Company maintains an office. Certain Morgan Stanley subsidiaries are regulated as broker-dealers under
the laws of the jurisdictions in which they operate. Subsidiaries engaged in banking and trust activities outside the U.S. are regulated by various government agencies in the particular jurisdiction where they are chartered, incorporated and/or
conduct their business activity. For instance, the U.K. Financial Services Authority (�FSA�) and several 15 Table of Contents U.K. securities and futures exchanges, including the London Stock Exchange and Euronext.liffe, regulate the Company�s activities in the U.K.; the Bundesanstalt f�r
Finanzdienstleistungsaufsicht (the Federal Financial Supervisory Authority) and the Deutsche B�rse AG regulate its activities in the Federal Republic of Germany; Eidgen�ssische Finanzmarktaufsicht (the Financial Market Supervisory
Authority) regulates its activities in Switzerland; the Financial Services Agency, the Bank of Japan, the Japanese Securities Dealers Association and several Japanese securities and futures exchanges, including the Tokyo Stock Exchange, the Osaka
Securities Exchange and the Tokyo International Financial Futures Exchange, regulate its activities in Japan; the Hong Kong Securities and Futures Commission, the Hong Kong Monetary Authority and the Hong Kong Exchanges and Clearing Limited regulate
its operations in Hong Kong; and the Monetary Authority of Singapore and the Singapore Exchange Limited regulate its business in Singapore. Asset Management. Many of the subsidiaries engaged in the Company�s asset management activities are registered as investment advisers with the SEC. Many aspects of the
Company�s asset management activities are subject to federal and state laws and regulations primarily intended to benefit the investor or client. These laws and regulations generally grant supervisory agencies and bodies broad administrative
powers, including the power to limit or restrict the Company from carrying on its asset management activities in the event that it fails to comply with such laws and regulations. Sanctions that may be imposed for such failure include the suspension
of individual employees, limitations on the Company engaging in various asset management activities for specified periods of time or specified types of clients, the revocation of registrations, other censures and significant fines. In order to
facilitate its asset management business, the Company owns a registered U.S. broker-dealer, Morgan Stanley Distribution, Inc., which acts as distributor to the Morgan Stanley mutual funds and as placement agent to certain private investment funds
managed by the Company�s asset management business segment. See also ��Institutional Securities and Global Wealth Management Group�Broker-Dealer Regulation� above. As a result of the passage of the Dodd-Frank Act, the Company�s asset management activities will be subject to certain
additional laws and regulations, including, but not limited to, additional reporting and recordkeeping requirements (including with respect to clients that are private funds), restrictions on sponsoring or investing in, or maintaining certain other
relationships with, hedge funds and private equity funds under the Volcker Rule (subject to certain limited exceptions) and certain rules and regulations regarding trading activities, including trading in derivatives markets. Many of these new
requirements may increase the expenses associated with the Company�s asset management activities and/or reduce the investment returns the Company is able to generate for its asset management clients. Many important elements of the Dodd-Frank
Act will not be known until rulemaking is finalized and certain final regulations are adopted. See also ��Activities Restrictions under the Volcker Rule� and ��Derivatives Regulation� above. The Company�s Asset Management business is also regulated outside the
U.S. For example, the FSA regulates the Company�s business in the U.K.; the Financial Services Agency regulates the Company�s business in Japan; the Securities and Exchange Board of India regulates the Company�s business in India; and
the Monetary Authority of Singapore regulates the Company�s business in Singapore. Anti-Money Laundering and Economic Sanctions. The Company�s Anti-Money Laundering (�AML�) program is coordinated on an enterprise-wide basis. In the U.S., for example, the Bank Secrecy Act, as amended by the USA PATRIOT Act of 2001,
imposes significant obligations on financial institutions to detect and deter money laundering and terrorist financing activity, including requiring banks, bank holding company subsidiaries, broker-dealers, futures commission merchants, and mutual
funds to implement AML programs, verify the identity of customers that maintain accounts, and monitor and report suspicious activity to appropriate law enforcement or regulatory authorities. Outside the U.S., applicable laws, rules and regulations
similarly require designated types of financial institutions to implement AML programs. The Company has implemented policies, procedures and internal controls that are designed to 16 Table of Contents comply with all applicable AML laws and regulations. The Company has also implemented policies, procedures, and internal controls that are designed to comply with the regulations and economic
sanctions programs administered by the U.S. Treasury�s Office of Foreign Assets Control (�OFAC�), which enforces economic and trade sanctions against targeted foreign countries, entities and individuals based on external threats to
the U.S. foreign policy, national security, or economy; by other governments; or by global or regional multilateral organizations, such as the United Nations Security Council. Anti-Corruption. The Company is subject to the Foreign Corrupt Practices Act
(�FCPA�), which prohibits offering, promising, giving, or authorizing others to give anything of value, either directly or indirectly, to a non-U.S. government official in order to influence official action or otherwise gain an unfair
business advantage, such as to obtain or retain business. The Company is also subject to applicable anti-corruption laws in the jurisdictions in which it operates, such as the U.K. Bribery Act, which became effective on July�1, 2011. The
Company has implemented policies, procedures, and internal controls that are designed to comply with such laws, rules, and regulations. Protection of Client Information. Many aspects of the Company�s business are subject to legal requirements concerning the use and protection of certain customer information, including
those adopted pursuant to the Gramm-Leach-Bliley Act and the Fair and Accurate Credit Transactions Act of 2003 in the U.S., the E.U. Data Protection Directive and various laws in Asia, including the Japanese Personal Information (Protection) Law,
the Hong Kong Personal Data (Protection) Ordinance and the Australian Privacy Act. The Company has adopted measures designed to comply with these and related applicable requirements in all relevant jurisdictions. Research. Both U.S. and non-U.S. regulators continue to focus on research conflicts of interest. Research-related regulations have been
implemented in many jurisdictions. New and revised requirements resulting from these regulations and the global research settlement with U.S. federal and state regulators (to which the Company is a party) have necessitated the development or
enhancement of corresponding policies and procedures. Compensation Practices and Other Regulation. The Company�s compensation practices are subject to oversight by the Federal Reserve. In June 2010, the Federal Reserve and other federal regulators
issued final guidance applicable to all banking organizations, including those supervised by the Federal Reserve. This guidance was promulgated in accordance with compensation principles and standards for banks and other financial companies, which
were designed to encourage the sound compensation practices established by the Financial Stability Board at the direction of the leaders of the Group of Twenty Finance Ministers and Central Bank Governors. The guidance was designed to help ensure
that incentive compensation paid by banking organizations does not encourage imprudent risk-taking that threatens the organizations� safety and soundness. The scope and content of the Federal Reserve�s policies on executive compensation
are continuing to develop and may change based on findings from its horizontal review process, and the Company expects that these policies will evolve over a number of years. In this regard, in October 2011, the Federal Reserve published its first
report detailing findings from its horizontal review process. In the report, the Federal Reserve announced its intention to implement the compensation disclosure requirements adopted in July 2011 by the Basel Committee. The Company is subject to the compensation-related provisions of the
Dodd-Frank Act, which may impact its compensation practices. Pursuant to the Dodd-Frank Act, among other things, federal regulators, including the Federal Reserve, must prescribe regulations to require covered financial institutions, including the
Company, to report the structures of all of their incentive-based compensation arrangements and prohibit incentive-based 17 Table of Contents payment arrangements that encourage inappropriate risks by providing employees, directors or principal shareholders with compensation that is excessive or that could lead to material financial
loss to the covered financial institution. In April 2011, seven federal agencies, including the Federal Reserve, jointly proposed an interagency rule implementing this requirement. The proposed rule is expected to be finalized in 2012. Further,
pursuant to Dodd-Frank, the SEC must direct listing exchanges to require companies to implement policies relating to disclosure of incentive-based compensation that is based on publicly reported financial information and the clawback of such
compensation from current or former executive officers following certain accounting restatements. In addition to the guidelines issued by the Federal Reserve and referenced above, the Company�s compensation practices may also be impacted by other regulations promulgated in accordance with the
Financial Stability Board compensation principles and standards. These standards are to be implemented by local regulators. For instance, in December 2010, the FSA published a policy statement outlining amendments to the Remuneration Code, which
governs remuneration of employees at certain banks, to address compensation-related rules under the E.U. Capital Requirements Directive. In October 2011, the FSA finalized and published additional guidance with respect to the Remuneration Code. For a discussion of certain risks relating to the Company�s
regulatory environment, see �Risk Factors� herein. Executive Officers of Morgan Stanley. The executive officers of Morgan Stanley and their ages and titles as of
February 27, 2012 are set forth below. Business experience for the past five years is provided in accordance with SEC rules. Gregory J. Fleming (49) .����Executive Vice President and President of Asset Management (since February 2010) and President of
Global Wealth Management Group of Morgan Stanley (since January 2011). President of Research of Morgan Stanley (February 2010 to January 2011). Senior Research Scholar at Yale Law School and Distinguished Visiting Fellow of the Center for the Study
of Corporate Law at Yale Law School (January 2009 to December 2009). President of Merrill Lynch�& Co., Inc. (�Merrill Lynch�) (February 2008 to January 2009). Co-President of Merrill Lynch (May 2007 to February 2008). Executive
Vice President and Co-President of the Global Markets and Investment Banking Group of Merrill Lynch (August 2003 to May 2007). James P. Gorman (53) .����Chairman of the Board of Directors (since January 2012) and Chief Executive Officer and Director of
Morgan Stanley (since January 2010) and Chairman of Morgan Stanley Smith Barney (since June 2009). Co-President (December 2007 to December 2009) and Co-Head of Strategic Planning (October 2007 to December 2009). President and Chief Operating Officer
of the Global Wealth Management Group (February 2006 to April 2008). Eric F. Grossman (45) .����Executive Vice President and Chief Legal Officer of Morgan Stanley (since January 2012). Global Head of Legal (September 2010 to January 2012). Global
Head of Litigation (January 2006 to September 2010) and General Counsel of the Americas (May 2009 to September 2010). General Counsel of Global Wealth Management Group (November 2008 to June 2009) and General Counsel of Morgan Stanley Smith Barney
(June 2009 to September 2010). Partner at the law firm of Davis Polk�& Wardwell LLP (June 2001 to December 2005). Keishi Hotsuki (49) .����Chief Risk Officer of Morgan Stanley (since May 2011). Interim Chief Risk Officer (January 2011 to May
2011) and Head of the Market Risk Department (since March 2008). Director of Mitsubishi UFJ Morgan Stanley Securities Co., Ltd. (since May 2010). Global Head of Market Risk Management at Merrill Lynch (June 2005 to September 2007). Colm Kelleher (54) .����Executive Vice President
and Co-President of Institutional Securities of Morgan Stanley (since January 2010). Chief Financial Officer and Co-Head of Strategic Planning (October 2007 to December 2009). Head of Global Capital Markets (February 2006 to October 2007). Co-Head
of Fixed Income Europe (May 2004 to February 2006). 18 Table of Contents Ruth Porat (54) .����Executive Vice President and Chief Financial Officer of
Morgan Stanley (since January 2010). Vice Chairman of Investment Banking (September 2003 to December 2009). Global Head of Financial Institutions Group (September 2006 to December 2009) and Chairman of the Financial Sponsors Group (July 2004 to
September 2006) within the Investment Banking Division. James
A. Rosenthal (58) .����Executive Vice President and Chief Operating Officer of Morgan Stanley (since January 2011). Head of Corporate Strategy (January 2010 to May 2011). Chief Operating Officer of Morgan Stanley Smith Barney
(January 2010 to August 2011). Head of Firmwide Technology and Operations (March 2008 to January 2010). Chief Financial Officer of Tishman Speyer (May 2006 to March 2008). Paul J. Taubman (51) .����Executive Vice President
and Co-President of Institutional Securities of Morgan Stanley (since January 2010). Global Head of Investment Banking (January 2008 to December 2009). Global Co-Head of Investment Banking (July 2007 to January 2008) and Global Head of Mergers and
Acquisitions (May 2005 to July 2007). 19 Table of Contents| Item�1A.����Risk | Factors. |
Table of Contents derivatives and interest rate swaps. In connection with certain OTC trading agreements and certain other agreements associated with the Institutional Securities business segment, we may be
required to provide additional collateral to certain counterparties in the event of a credit ratings downgrade. Our long-term credit ratings by Moody�s Investor Services, Inc (�Moody�s�) and Standard�& Poor�s
Ratings Services (�S&P�) are currently at different levels (commonly referred to as �split ratings�). At December�31, 2011, the amounts of additional collateral or termination payments that could be called by
counterparties under the terms of such agreements in the event of a downgrade of our long-term credit rating under various scenarios were as follows: $919 million (A3 Moody�s/A- S&P); $3,989 million (Baa1 Moody�s/ BBB+ S&P); and
$4,743 million (Baa2 Moody�s/BBB S&P). In addition, we are required to pledge additional collateral to certain exchanges and clearing organizations in the event of a credit rating downgrade. At December�31, 2011, the increased
collateral requirement at certain exchanges and clearing organizations under various scenarios was $118 million (A3 Moody�s/A- S&P); $1,183 million (Baa1 Moody�s/ BBB+ S&P); and $1,775 million (Baa2 Moody�s/BBB S&P). The rating agencies are continuing to monitor certain issuer
specific factors that are important to the determination of our credit ratings including governance, the level and quality of earnings, capital adequacy, funding and liquidity, risk appetite and management, asset quality, strategic direction, and
business mix. Additionally, the agencies will look at other industry-wide factors such as regulatory or legislative changes, macro-economic environment, and perceived levels of government support, and it is possible that they could downgrade our
ratings and those of similar institutions. See also �Management�s Discussion and Analysis of Financial Condition and Results of Operation�Liquidity and Capital Resources�Credit Ratings� in Part II, Item�7 herein. We are a holding company and depend on payments from our
subsidiaries. The parent holding company depends on
dividends, distributions and other payments from its subsidiaries to fund dividend payments and to fund all payments on its obligations, including debt obligations. Regulatory and other legal restrictions may limit our ability to transfer funds
freely, either to or from our subsidiaries. In particular, many of our subsidiaries, including our broker-dealer subsidiaries, are subject to laws, regulations and self-regulatory organization rules that authorize regulatory bodies to block or
reduce the flow of funds to the parent holding company, or that prohibit such transfers altogether in certain circumstances. These laws, regulations and rules may hinder our ability to access funds that we may need to make payments on our
obligations. Furthermore, as a bank holding company, we may become subject to a prohibition or to limitations on our ability to pay dividends or repurchase our stock. The OCC, the Federal Reserve and the FDIC have the authority, and under certain
circumstances the duty, to prohibit or to limit the payment of dividends by the banking organizations they supervise, including us and our bank holding company subsidiaries. Our liquidity and financial condition have in the past been, and in the
future could be, adversely affected by U.S. and international markets and economic conditions. Our ability to raise funding in the long-term or short-term debt capital markets or the equity markets, or to access secured lending markets, has in the past been, and could in the future be, adversely
affected by conditions in the U.S. and international markets and economy. Global market and economic conditions have been particularly disrupted and volatile in recent years and continue to be, including as a result of the sovereign debt crisis in
the E.U. In particular, our cost and availability of funding have been, and may in the future be, adversely affected by illiquid credit markets and wider credit spreads. Continued turbulence in the U.S., the E.U. and other international markets and
economies could adversely affect our liquidity and financial condition and the willingness of certain counterparties and customers to do business with us. Market Risk. Market risk refers to our exposure to adverse changes in the values of our portfolios and financial instruments due to changes in market prices or rates. For more information on how we monitor and manage
market risk, see �Quantitative and Qualitative Disclosure about Market Risk� in Part II, Item�7A herein. 21 Table of Contents Our results of operations may be materially affected by market fluctuations and by global and economic
conditions and other factors. Our results of operations
may be materially affected by market fluctuations due to global and economic conditions and other factors. Our results of operations in the past have been, and in the future may continue to be, materially affected by many factors, including the
effect of economic and political conditions and geopolitical events; the effect of market conditions, particularly in the global equity, fixed income, credit and commodities markets, including corporate and mortgage (commercial and residential)
lending and commercial real estate markets; the impact of current, pending and future legislation (including the Dodd-Frank Act), regulation (including capital, leverage and liquidity requirements), and legal actions in the U.S. and worldwide; the
level and volatility of equity, fixed income and commodity prices, interest rates, currency values and other market indices; the availability and cost of both credit and capital as well as the credit ratings assigned to our unsecured short-term and
long-term debt; investor sentiment and confidence in the financial markets; the performance of the Company�s acquisitions, joint ventures, strategic alliances or other strategic arrangements (including MSSB and with Mitsubishi UFJ Financial
Group, Inc. (�MUFG�)); our reputation; inflation, natural disasters, and acts of war or terrorism; the actions and initiatives of current and potential competitors, as well as governments, regulators and self-regulatory organizations; and
technological changes or a combination of these or other factors. In addition, legislative, legal and regulatory developments related to our businesses are likely to increase costs, thereby affecting results of operations. These factors also may
have an impact on our ability to achieve our strategic objectives. The results of our Institutional Securities business segment, particularly results relating to our involvement in primary and secondary markets for all
types of financial products, are subject to substantial fluctuations due to a variety of factors, such as those enumerated above that we cannot control or predict with great certainty. These fluctuations impact results by causing variations in new
business flows and in the fair value of securities and other financial products. Fluctuations also occur due to the level of global market activity, which, among other things, affects the size, number and timing of investment banking client
assignments and transactions and the realization of returns from our principal investments. During periods of unfavorable market or economic conditions, the level of individual investor participation in the global markets, as well as the level of
client assets, may also decrease, which would negatively impact the results of our Global Wealth Management Group business segment. In addition, fluctuations in global market activity could impact the flow of investment capital into or from assets
under management or supervision and the way customers allocate capital among money market, equity, fixed income or other investment alternatives, which could negatively impact our Asset Management business segment. We may experience declines in the value of our financial instruments
and other losses related to volatile and illiquid market conditions. Market volatility, illiquid market conditions and disruptions in the credit markets have made it extremely difficult to value certain of our securities particularly during periods of market displacement.
Subsequent valuations, in light of factors then prevailing, may result in significant changes in the values of these securities in future periods. In addition, at the time of any sales and settlements of these securities, the price we ultimately
realize will depend on the demand and liquidity in the market at that time and may be materially lower than their current fair value. Any of these factors could cause a decline in the value of our securities portfolio, which may have an adverse
effect on our results of operations in future periods. In
addition, financial markets are susceptible to severe events evidenced by rapid depreciation in asset values accompanied by a reduction in asset liquidity. Under these extreme conditions, hedging and other risk management strategies may not be as
effective at mitigating trading losses as they would be under more normal market conditions. Moreover, under these conditions market participants are particularly exposed to trading strategies employed by many market participants simultaneously and
on a large scale, such as crowded trades. Our risk management and monitoring processes seek to quantify and mitigate risk to more extreme market moves. However, severe market events have historically been difficult to predict, as seen in recent
years, and we could realize significant losses if extreme market events were to occur. 22 Table of Contents Holding large and concentrated positions may expose us to losses Concentration of risk may reduce revenues or result in losses in our
market-making, investing, block trading, underwriting and lending businesses in the event of unfavorable market movements. We commit substantial amounts of capital to these businesses, which often results in our taking large positions in the
securities of, or making large loans to, a particular issuer or issuers in a particular industry, country or region. We have incurred, and may continue to incur, significant losses in the real estate sector. We finance and acquire principal positions in a number of real estate and
real estate-related products for our own account, for investment vehicles managed by affiliates in which we also may have a significant investment, for separate accounts managed by affiliates and for major participants in the commercial and
residential real estate markets. At December�31, 2011, the consolidated statements of financial condition included amounts representing real estate investment assets of consolidated subsidiaries of approximately $2.0 billion, including
noncontrolling interests of approximately $1.6 billion. In addition, we had contractual capital commitments, guarantees, lending facilities and counterparty arrangements with respect to real estate investments of $0.8 billion at December�31,
2011. We also originate loans secured by commercial and
residential properties. Further, we securitize and trade in a wide range of commercial and residential real estate and real estate-related whole loans, mortgages and other real estate and commercial assets and products, including residential and
commercial mortgage-backed securities. These businesses have been, and may continue to be, adversely affected by the downturn in the real estate sector. In connection with these activities, we have provided, or otherwise agreed to be responsible
for, certain representations and warranties. Under certain circumstances, we may be required to repurchase such assets or make other payments related to such assets if such representations and warranties were breached. Between 2004 and
December�31, 2011, we sponsored approximately $148 billion of residential mortgage-backed securities (�RMBS�) primarily containing U.S. residential loans. Of that amount, we made representations and warranties concerning approximately
$47 billion of loans and agreed to be responsible for the representations and warranties made by third-party sellers, many of which are now insolvent, on approximately $21 billion of loans. At December�31, 2011, the current unpaid principal
balance (�UPB�) for all the residential assets subject to such representations and warranties was approximately $23.5 billion and the cumulative losses associated with U.S. RMBS were approximately $10.5 billion. We did not make, or
otherwise agree to be responsible, for the representations and warranties made by third party sellers on approximately $80 billion of residential loans that we securitized during that time period. We have not sponsored any U.S. RMBS transactions
since 2007. We have also made representations and warranties in
connection with our role as an originator of certain commercial mortgage loans that we securitized in commercial mortgage-backed securities (�CMBS�). Between 2004 and 2010, we originated approximately $44 billion and $27 billion of U.S.
and non-U.S. commercial mortgage loans, respectively, that were placed into CMBS sponsored by us. At December�31, 2011, the current UPB for all U.S. commercial mortgage loans subject to such representations and warranties was $35.2 billion. At
December�31, 2011, the current UPB when known for all non-U.S. commercial mortgage loans, subject to such representations and warranties was approximately $13.9 billion and the UPB at the time of sale when the current UPB is not known was $0.4
billion. Over the last several years, the level of litigation and
investigatory activity focused on residential mortgage and credit crisis-related matters has increased materially in the financial services industry. As a result, we have been and expect that we may continue to become, the subject of increased
claims for damages and other relief regarding residential mortgages and related securities in the future. We continue to monitor our real estate-related activities in order to manage our exposures and potential liability from these markets and
businesses. See �Legal Proceedings�Residential Mortgage and Credit Crisis Related Matters� in Part I, Item�3 herein. 23 Table of Contents Credit Risk. Credit risk refers to the risk of loss arising from borrower or counterparty
default when a borrower, counterparty or obligor does not meet its obligations. For more information on how we monitor and manage credit risk, see �Quantitative and Qualitative Disclosure about Market Risk�Risk Management�Credit
Risk� in Part II, Item�7A herein. We are exposed
to the risk that third parties that are indebted to us will not perform their obligations. We incur significant credit risk exposure through the Institutional Securities business segment. This risk may arise from a variety of business activities, including but not limited to entering into swap
or other derivative contracts under which counterparties have obligations to make payments to us; extending credit to clients through various lending commitments; providing short or long-term funding that is secured by physical or financial
collateral whose value may at times be insufficient to fully cover the loan repayment amount; and posting margin and/or collateral to clearing houses, clearing agencies, exchanges, banks, securities firms and other financial counterparties. We incur
credit risk in traded securities and loan pools whereby the value of these assets may fluctuate based on realized or expected defaults on the underlying obligations or loans. We also incur credit risk in the Global Wealth Management Group business
segment lending to individual investors, including, but not limited to, margin and non-purpose loans collateralized by securities, residential mortgage loans and home equity lines of credit. While we believe current valuations and reserves adequately address our perceived levels of risk, there is a possibility that
continued difficult economic conditions may further negatively impact our clients and our current credit exposures. In addition, as a clearing member firm, we finance our customer positions and we could be held responsible for the defaults or
misconduct of our customers. Although we regularly review our credit exposures, default risk may arise from events or circumstances that are difficult to detect or foresee. A default by another large financial institution could adversely affect
financial markets generally. The commercial soundness of
many financial institutions may be closely interrelated as a result of credit, trading, clearing or other relationships between the institutions. As a result, concerns about, or a default or threatened default by, one institution could lead to
significant market-wide liquidity and credit problems, losses or defaults by other institutions. This is sometimes referred to as �systemic risk� and may adversely affect financial intermediaries, such as clearing agencies, clearing
houses, banks, securities firms and exchanges, with which we interact on a daily basis, and therefore could adversely affect us. See also �Systemic Risk Regime� under �Business�Supervision and Regulation� in Part I,
Item�1 herein. Operational Risk. Operational risk refers to the risk of financial or other loss, or damage to
a firm�s reputation, resulting from inadequate or failed internal processes, people, resources, systems or from other internal or external events ( e.g. ,�internal or external fraud, legal and compliance risks, damage to physical
assets, security breaches, etc.). We may incur operational risk across our full scope of business activities, including revenue-generating activities ( e.g. , sales and trading), support functions ( e.g. , information technology and trade
processing) or other strategic decisions ( e.g. , the integration of MSSB or other joint ventures, acquisitions or strategic alliances). Legal and compliance risk is included in the scope of operational risk and is discussed below under
�Legal Risk.� For more information on how we monitor and manage operational risk, see �Quantitative and Qualitative Disclosures about Market Risk�Risk Management�Operational Risk� in Part II, Item�7A herein. We are subject to operational risk that could adversely
affect our businesses. Our businesses are highly
dependent on our ability to process, on a daily basis, a large number of transactions across numerous and diverse markets in many currencies. In general, the transactions we process are increasingly 24 Table of Contents complex. We perform the functions required to operate our different businesses either by ourselves or through agreements with third parties. We rely on the ability of our employees, our internal
systems and systems at technology centers operated by third parties to process a high volume of transactions. We also face the risk of operational failure or termination of any of the clearing agents, exchanges, clearing houses or other financial intermediaries we use to facilitate our securities transactions. In
the event of a breakdown or improper operation of our or a third party�s systems or improper or unauthorized action by third parties or our employees, we could suffer financial loss, an impairment to our liquidity, a disruption of our
businesses, regulatory sanctions or damage to our reputation. Our
operations rely on the secure processing, storage and transmission of confidential and other information in our computer systems and may be vulnerable to unauthorized access, mishandling or misuse, computer viruses or malware, cyber attacks and
other events that could have a security impact on such systems. If one or more of such events occur, this potentially could jeopardize our or our clients� or counterparties� personal, confidential, proprietary or other information
processed and stored in, and transmitted through, our computer systems. Furthermore, such events could cause interruptions or malfunctions in our, our clients�, our counterparties� or third parties� operations, which could result in
reputational damage, litigation or regulatory fines or penalties not covered by insurance maintained by us, and adversely affect our business, financial condition or results of operations. Despite the business contingency plans we have in place, our ability to conduct business may be adversely affected by a
disruption in the infrastructure that supports our business and the communities where we are located. This may include a disruption involving physical site access, terrorist activities, disease pandemics, catastrophic events, electrical,
environmental, communications or other services we use, our employees or third parties with whom we conduct business. Legal and Regulatory Risk. Legal and compliance risk includes the risk of exposure to fines, penalties, judgments, damages and/or settlements in connection with regulatory or legal
actions as a result of non-compliance with applicable legal or regulatory requirements or litigation. Legal risk also includes contractual and commercial risk such as the risk that a counterparty�s performance obligations will be unenforceable.
In today�s environment of rapid and possibly transformational regulatory change, we also view regulatory change as a component of legal risk. For more information on how we monitor and manage legal risk, see �Risk Management�Legal
Risk� in Part II, Item�7A herein. The financial
services industry is subject to extensive regulation, which is undergoing major changes that will impact our business. Like other major financial services firms, we are subject to extensive regulation by U.S. federal and state regulatory agencies and securities exchanges
and by regulators and exchanges in each of the major markets where we operate, and face the risk of investigations and proceedings by governmental and self-regulatory agencies in all countries in which we conduct our business. Interventions by
authorities may result in adverse judgments, settlements, fines, penalties, injunctions or other relief. In addition to the monetary consequences, these measures could, for example, impact our ability to engage in, or impose limitations on, certain
of our businesses. The number of these investigations and proceedings, as well as the amount of penalties and fines sought, has increased substantially in recent years with regard to many firms in the financial services industry, including us.
Significant regulatory action against us could materially adversely affect our business, financial condition or results of operations or cause us significant reputational harm, which could seriously harm our business. The Dodd-Frank Act also
provides a bounty to whistleblowers who present the SEC with information related to securities laws violations that leads to a successful enforcement action. As a result of this bounty, it is possible we could face an increased number of
investigations by the SEC. 25 Table of Contents In response to the financial crisis, legislators and regulators, both in the U.S. and worldwide, have
adopted, or are currently considering enacting, financial market reforms that have resulted and could result in major changes to the way our global operations are regulated. In particular, as a result of the Dodd-Frank Act, we are subject to
significantly revised and expanded regulation and supervision, to more intensive scrutiny of our businesses and any plans for expansion of those businesses, to new activities limitations, to a systemic risk regime which will impose especially high
capital and liquidity requirements, and to comprehensive new derivatives regulation. Certain portions of the Dodd-Frank Act were effective immediately, while other portions will be effective only following rulemaking and extended transition periods,
but many of these changes could in the future materially impact the profitability of our businesses, the value of assets we hold, expose us to additional costs, require changes to business practices or force us to discontinue businesses, could
adversely affect our ability to pay dividends, or could require us to raise capital, including in ways that may adversely impact our shareholders or creditors. While there continues to be uncertainty about the exact impact of these changes, we do
know that the Company will be subject to a more complex regulatory framework, and will incur costs to comply with new requirements as well as to monitor for compliance in the future. For example, the Volcker Rule provision of the Dodd-Frank Act will have an impact on us, including potentially limiting various
aspects of our business. Regulators have proposed regulations to implement the substantive Volcker Rule provisions and comments were due by February�13, 2012. It is unclear whether final rules will be in place by July�21, 2012 when the
Volcker Rule is to become effective. Even with the publication of proposed rules, however, it is still too early to determine any additional limitations on the Company beyond the restriction on standalone proprietary trading. There remains
considerable uncertainty about the interpretation of the proposed rules, and we are also unable to predict what the final version of the rules will be or the impact they may have on our businesses. We are closely monitoring regulatory developments
related to the Volcker Rule, and when the regulations are final, we will be in a position to complete a review of our relevant activities and make plans to implement compliance with the Volcker Rule. The financial services industry faces substantial litigation and is
subject to regulatory investigations, and we may face damage to our reputation and legal liability. We have been named, from time to time, as a defendant in various legal actions, including arbitrations, class actions, and other litigation, as well as investigations or proceedings brought by regulatory
agencies, arising in connection with our activities as a global diversified financial services institution. Certain of the actual or threatened legal or regulatory actions include claims for substantial compensatory and/or punitive damages, claims
for indeterminate amounts of damages, or may result in penalties, fines, or other results adverse to us. In some cases, the issuers that would otherwise be the primary defendants in such cases are bankrupt or in financial distress. Like any large
corporation, we are also subject to risk from potential employee misconduct, including non-compliance with policies and improper use or disclosure of confidential information. Substantial legal liability could materially adversely affect our business,
financial condition or results of operations or cause us significant reputational harm, which could seriously harm our business. For example, recently, the level of litigation activity focused on residential mortgage and credit crisis related
matters has increased materially in the financial services industry. As a result, we have been and expect that we may continue to become, the subject of increased claims for damages and other relief regarding residential mortgages and related
securities in the future and there can be no assurance that additional material losses will not be incurred from residential mortgage claims that have not yet been notified to us or are not yet determined to be material. For more information
regarding legal proceedings in which we are involved see �Legal Proceedings� in Part I, Item�3 herein. Our business, financial condition and results of operations could be adversely affected by governmental fiscal and monetary policies. We are affected by fiscal and monetary policies adopted
by regulatory authorities and bodies of the U.S. and other governments. For example, the actions of the Federal Reserve and international central banking authorities 26 Table of Contents directly impact our cost of funds for lending, capital raising and investment activities and may impact the value of financial instruments we hold. In addition, such changes in monetary policy
may affect the credit quality of our customers. Changes in domestic and international monetary policy are beyond our control and difficult to predict. Our commodities activities subject us to extensive regulation, potential catastrophic events and environmental risks and regulation that may expose
us to significant costs and liabilities. In connection
with the commodities activities in our Institutional Securities business segment, we engage in the production, storage, transportation, marketing and trading of several commodities, including metals (base and precious), agricultural products, crude
oil, oil products, natural gas, electric power, emission credits, coal, freight, liquefied natural gas and related products and indices. In addition, we are an electricity power marketer in the U.S. and own electricity generating facilities in the
U.S. and Europe; we own TransMontaigne Inc. and its subsidiaries, a group of companies operating in the refined petroleum products marketing and distribution business; and we own a minority interest in Heidmar Holdings LLC, which owns a group of
companies that provide international marine transportation and U.S. marine logistics services. As a result of these activities, we are subject to extensive and evolving energy, commodities, environmental, health and safety and other governmental
laws and regulations. In addition, liability may be incurred without regard to fault under certain environmental laws and regulations for the remediation of contaminated areas. Further, through these activities we are exposed to regulatory, physical
and certain indirect risks associated with climate change. Our commodities business also exposes us to the risk of unforeseen and catastrophic events, including natural disasters, leaks, spills, explosions, release of toxic substances, fires,
accidents on land and at sea, wars, and terrorist attacks that could result in personal injuries, loss of life, property damage, and suspension of operations. Although we have attempted to mitigate our pollution and other environmental risks by, among other measures, adopting appropriate policies and procedures
for power plant operations, monitoring the quality of petroleum storage facilities and transport vessels and implementing emergency response programs, these actions may not prove adequate to address every contingency. In addition, insurance covering
some of these risks may not be available, and the proceeds, if any, from insurance recovery may not be adequate to cover liabilities with respect to particular incidents. As a result, our financial condition, results of operations and cash flows may
be adversely affected by these events. We are engaged in
discussions with the Federal Reserve regarding our commodities activities, as the BHC Act provides a grandfather exemption for �activities related to the trading, sale or investment in commodities and underlying physical properties,�
provided that we were engaged in �any of such activities as of September�30, 1997 in the United States� and provided that certain other conditions that are within our reasonable control are satisfied. If the Federal Reserve were to
determine that any of our commodities activities did not qualify for the BHC Act grandfather exemption, then we would likely be required to divest any such activities that did not otherwise conform to the BHC Act by the end of any extensions of the
BHC Act grace period. See also �Scope of Permitted Activities� under �Business�Supervision and Regulation� in Part I, Item�1 herein. We also expect the other laws and regulations affecting our commodities
business to increase in both scope and complexity. During the past several years, intensified scrutiny of certain energy markets by federal, state and local authorities in the U.S. and abroad and the public has resulted in increased regulatory and
legal enforcement, litigation and remedial proceedings involving companies engaged in the activities in which we are engaged. For example, the U.S. and the E.U. have increased their focus on the energy markets which has resulted in increased
regulation of companies participating in the energy markets, including those engaged in power generation and liquid hydrocarbons trading. In addition, new regulation of OTC derivatives markets in the U.S. and similar legislation proposed or adopted
abroad will impose significant new costs and impose new requirements on our commodities derivatives activities. We may incur substantial costs or loss of revenue in complying with current or future laws and regulations and our overall businesses and
reputation may be adversely affected by the current legal environment. In addition, failure to comply with these laws and regulations may result in substantial civil and criminal fines and penalties. 27 Table of Contents A failure to address conflicts of interest appropriately could adversely affect our businesses. As a global financial services firm that provides
products and services to a large and diversified group of clients, including corporations, governments, financial institutions and individuals, we face potential conflicts of interest in the normal course of business. For example, potential
conflicts can occur when there is a divergence of interests between us and a client, among clients, or between an employee on the one hand and us or a client on the other. We have policies, procedures and controls that are designed to address
potential conflicts of interest. However, identifying and mitigating potential conflicts of interest can be complex and challenging, and can become the focus of media and regulatory scrutiny. Indeed, actions that merely appear to create a conflict
can put our reputation at risk even if the likelihood of an actual conflict has been mitigated. It is possible that potential conflicts could give rise to litigation or enforcement actions, which may lead to our clients being less willing to enter
into transactions in which a conflict may occur and could adversely affect our businesses. Our regulators have the ability to scrutinize our activities for potential conflicts of interest, including through detailed examinations of specific transactions. In addition, our status as a bank
holding company supervised by the Federal Reserve subjects us to direct Federal Reserve scrutiny with respect to transactions between our domestic subsidiary banks and their affiliates. Risk Management. Our hedging strategies and other risk management techniques may not be fully effective in mitigating our risk exposure in all market environments or
against all types of risk. We have devoted significant
resources to develop our risk management policies and procedures and expect to continue to do so in the future. Nonetheless, our hedging strategies and other risk management techniques may not be fully effective in mitigating our risk exposure in
all market environments or against all types of risk, including risks that are unidentified or unanticipated. Some of our methods of managing risk are based upon our use of observed historical market behavior. As a result, these methods may not
predict future risk exposures, which could be significantly greater than the historical measures indicate. For example, market conditions over the last several years have involved unprecedented dislocations and highlight the limitations inherent in
using historical information to manage risk. Management of market, credit, liquidity, operational, legal and regulatory risks requires, among other things, policies and procedures to record properly and verify a large number of transactions and
events, and these policies and procedures may not be fully effective. Our trading risk management strategies and techniques also seek to balance our ability to profit from trading positions with our exposure to potential losses. While we employ a
broad and diversified set of risk monitoring and risk mitigation techniques, those techniques and the judgments that accompany their application cannot anticipate every economic and financial outcome or the timing of such outcomes. We may,
therefore, incur losses in the course of our trading activities. For more information on how we monitor and manage market and certain other risks, see �Quantitative and Qualitative Disclosures about Market Risk�Risk Management�Market
Risk� in Part II, Item�7A herein. Competitive
Environment. We face strong competition from other
financial services firms, which could lead to pricing pressures that could materially adversely affect our revenue and profitability. The financial services industry and all aspects of our businesses are intensely competitive, and we expect them to remain so. We compete with commercial
banks, brokerage firms, insurance companies, sponsors of mutual funds, hedge funds, energy companies and other companies offering financial services in the U.S., globally and through the internet. We compete on the basis of several factors,
including transaction execution, capital or access to capital, products and services, innovation, reputation, risk appetite and price. Over time, certain sectors of the financial services industry have become more concentrated, as institutions
involved in a broad range of financial services have been acquired by or merged into other firms or have declared bankruptcy. Such changes 28 Table of Contents could result in our remaining competitors gaining greater capital and other resources, such as the ability to offer a broader range of products and services and geographic diversity. We have
experienced and may continue to experience pricing pressures as a result of these factors and as some of our competitors seek to increase market share by reducing prices. For more information regarding the competitive environment in which we
operate, see �Business�Competition� and �Business�Supervision and Regulation� in Part I, Item�1 herein. Automated trading markets may adversely affect our business and may increase competition. We have experienced intense price competition in some of our businesses in
recent years. In particular, the ability to execute securities trades electronically on exchanges and through other automated trading markets has increased the pressure on trading commissions. The trend toward direct access to automated, electronic
markets will likely continue. We have experienced and it is likely that we will continue to experience competitive pressures in these and other areas in the future as some of our competitors may seek to obtain market share by reducing prices. Our ability to retain and attract qualified employees is
critical to the success of our business and the failure to do so may materially adversely affect our performance. Our people are our most important resource and competition for qualified employees is intense. In order to attract and retain qualified employees, we must
compensate such employees at market levels. Typically, those levels have caused employee compensation to be our greatest expense as compensation is highly variable and changes based on business and individual performance and market conditions. If we
are unable to continue to attract and retain highly qualified employees, or do so at rates necessary to maintain our competitive position, or if compensation costs required to attract and retain employees become more expensive, our performance,
including our competitive position, could be materially adversely affected. The financial industry has and may continue to experience more stringent regulation of employee compensation, including limitations relating to incentive-based compensation,
clawback requirements and special taxation, which could have an adverse effect on our ability to hire or retain the most qualified employees. International Risk. We are subject to numerous political, economic, legal, operational, franchise and other risks as a result of our international operations which
could adversely impact our businesses in many ways. We
are subject to political, economic, legal, tax, operational, franchise and other risks that are inherent in operating in many countries, including risks of possible nationalization, expropriation, price controls, capital controls, exchange controls,
increased taxes and levies and other restrictive governmental actions, as well as the outbreak of hostilities or political and governmental instability. In many countries, the laws and regulations applicable to the securities and financial services
industries are uncertain and evolving, and it may be difficult for us to determine the exact requirements of local laws in every market. Our inability to remain in compliance with local laws in a particular market could have a significant and
negative effect not only on our business in that market but also on our reputation generally. We are also subject to the enhanced risk that transactions we structure might not be legally enforceable in all cases. Various emerging market countries have experienced severe political, economic
and financial disruptions, including significant devaluations of their currencies, capital and currency exchange controls, high rates of inflation and low or negative growth rates in their economies. Crime and corruption, as well as issues of
security and personal safety, also exist in certain of these countries. These conditions could adversely impact our businesses and increase volatility in financial markets generally. The emergence of a disease pandemic or other widespread health emergency, or concerns over the possibility of such an emergency
as well as natural disasters, terrorist activities or military actions, could create economic and financial disruptions in emerging markets and other areas throughout the world, and could lead to operational difficulties (including travel
limitations) that could impair our ability to manage our businesses around the world. 29 Table of Contents As a U.S. company, we are required to comply with the economic sanctions and embargo programs administered
by OFAC and similar multi-national bodies and governmental agencies worldwide and the FCPA. A violation of a sanction or embargo program or of the FCPA or similar laws prohibiting certain payments to governmental officials, such as the U.K. Bribery
Act, could subject us, and individual employees, to a regulatory enforcement action as well as significant civil and criminal penalties. Acquisition and Joint Venture Risk. We may be unable to fully capture the expected value from acquisitions, joint ventures, minority stakes and strategic alliances. In connection with past or future acquisitions, joint ventures (including
MSSB) or strategic alliances (including with MUFG), we face numerous risks and uncertainties combining or integrating the relevant businesses and systems, including the need to combine accounting and data processing systems and management controls
and to integrate relationships with clients, trading counterparties and business partners. In the case of joint ventures and minority stakes, we are subject to additional risks and uncertainties because we may be dependent upon, and subject to
liability, losses or reputational damage relating to, systems, controls and personnel that are not under our control. For example, the ownership arrangements relating to the Company�s joint venture in Japan with MUFG of their respective investment banking and
securities businesses are complex. MUFG and the Company have integrated their respective Japanese securities businesses by forming two joint venture companies, MUMSS and MSMS.�During the first quarter of 2011, the Company recorded a loss of
$655 million arising from its 40% stake in MUMSS related to certain fixed income trading positions at MUMSS, which is a subsidiary of MUFG that is controlled and risk managed by MUFG. While MUFG contributed $370 million in capital to MUMSS in
connection with the trading losses, additional losses could be incurred by MUMSS in the future.�See �Management�s Discussion and Analysis of Financial Condition and Results of Operations�Other Matters�Japanese Securities
Joint Venture� in Part II, Item�7 herein. In addition,
conflicts or disagreements between us and any of our joint venture partners may negatively impact the benefits to be achieved by the relevant joint venture. There is no assurance that any of our acquisitions will be successfully integrated or yield all of the positive benefits anticipated. If we are not able
to integrate successfully our past and future acquisitions, there is a risk that our results of operations, financial condition and cash flows may be materially and adversely affected. Certain of our business initiatives, including expansions of existing businesses, may bring us into contact, directly or
indirectly, with individuals and entities that are not within our traditional client and counterparty base and may expose us to new asset classes and new markets. These business activities expose us to new and enhanced risks, greater regulatory
scrutiny of these activities, increased credit-related, sovereign and operational risks, and reputational concerns regarding the manner in which these assets are being operated or held. For more information regarding the regulatory environment in which we operate, see also �Business�Supervision and
Regulation� in Part I, Item�1 herein. | Item�1B. | Unresolved Staff Comments. |
Table of Contents| Item�2.����Properties. |
| Location | Owned/ Leased | Lease�Expiration | Approximate�Square�
Footage as of December�31, 2011(A) | |||||
| U.S. Locations | ||||||||
| 1585 Broadway New York, New York (Global Headquarters and Institutional Securities Headquarters) | Owned | N/A | 1,346,500�square�feet | |||||
| 2000 Westchester Avenue Purchase, New York (Global Wealth Management Group Headquarters) | Owned | N/A | 597,400�square�feet | |||||
| 522 Fifth Avenue New York, New York (Asset Management Headquarters) | Owned | N/A | 581,250�square�feet | |||||
| New York, New York (Several locations) | Leased | 2012���2024 | 2,403,600�square�feet | |||||
| Brooklyn, New York (Several locations) | Leased | 2012 � 2023 | 530,400�square�feet | |||||
| Jersey City, New Jersey (Several locations) | Leased | 2012 � 2014 | 495,300�square�feet | |||||
| International Locations | ||||||||
| 20 Bank Street London (London Headquarters) | Leased | 2038 | 546,500�square�feet | |||||
| Canary Wharf London (Several locations) | Leased(B) | 2036 | 625,950�square�feet | |||||
| 1 Austin Road West Kowloon (Hong Kong Headquarters) | Leased | 2019 | 572,600�square feet | |||||
| Sapporo�s Yebisu Garden Place, Ebisu, Shibuya-ku (Tokyo Headquarters) | Leased | 2013 | (C) | 336,000�square feet | ||||
| (A) | The indicated total aggregate square footage leased does not include space occupied by Morgan Stanley branch offices. |
| (B) | The Company holds the freehold interest in the land and building. |
| (C) | Option to return any amount of space up to the full space with six months prior notice. |
Table of Contents Item�3.����Legal Proceedings. In addition to the matters described below, in the normal course of
business, the Company has been named, from time to time, as a defendant in various legal actions, including arbitrations, class actions and other litigation, arising in connection with its activities as a global diversified financial services
institution. Certain of the actual or threatened legal actions include claims for substantial compensatory and/or punitive damages or claims for indeterminate amounts of damages. In some cases, the entities that would otherwise be the primary
defendants in such cases are bankrupt or in financial distress. The Company is also involved, from time to time, in other reviews, investigations and proceedings (both formal and informal) by governmental and
self-regulatory agencies regarding the Company�s business, including, among other matters, accounting and operational matters, certain of which may result in adverse judgments, settlements, fines, penalties, injunctions or other relief. The Company contests liability and/or the amount of damages as
appropriate in each pending matter. Where available information indicates that it is probable a liability had been incurred at the date of the consolidated financial statements and the Company can reasonably estimate the amount of that loss, the
Company accrues the estimated loss by a charge to income. In many
proceedings, however, it is inherently difficult to determine whether any loss is probable or even possible or to estimate the amount of any loss. The Company cannot predict with certainty if, how or when such proceedings will be resolved or what
the eventual settlement, fine, penalty or other relief, if any, may be, particularly for proceedings that are in their early stages of development or where plaintiffs seek substantial or indeterminate damages. Numerous issues may need to be
resolved, including through potentially lengthy discovery and determination of important factual matters, determination of issues related to class certification and the calculation of damages, and by addressing novel or unsettled legal questions
relevant to the proceedings in question, before a loss or additional loss or range of loss or additional loss can be reasonably estimated for any proceeding. Subject to the foregoing, the Company believes, based on current knowledge and after
consultation with counsel, that the outcome of such proceedings will not have a material adverse effect on the consolidated financial condition of the Company, although the outcome of such proceedings could be material to the Company�s
operating results and cash flows for a particular period depending on, among other things, the level of the Company�s revenues or income for such period. Over the last several years, the level of litigation and investigatory activity focused on residential mortgage and credit crisis related matters has
increased materially in the financial services industry. As a result, the Company expects that it may become the subject of increased claims for damages and other relief regarding residential mortgages and related securities in the future and, while
the Company has identified below certain proceedings that the Company believes to be material, individually or collectively, there can be no assurance that additional material losses will not be incurred from residential mortgage claims that have
not yet been notified to the Company or are not yet determined to be material. Residential Mortgage and Credit Crisis Related Matters. Regulatory and Governmental Matters. The Company is responding to subpoenas and requests for information from certain regulatory and governmental entities concerning
the origination, financing, purchase, securitization and servicing of subprime and non-subprime residential mortgages and related matters such as residential mortgage backed securities (�RMBS�), collateralized debt obligations
(�CDOs�), structured investment vehicles (�SIVs�) and credit default swaps backed by or referencing mortgage pass through certificates. These matters include, but are not limited to, investigations related to the Company�s
due diligence on the loans that it purchased for securitization, the Company�s communications with ratings agencies, the Company�s disclosures to investors, and the Company�s handling of servicing and foreclosure related issues. Class Actions. Beginning in
December 2007, several purported class action complaints were filed in the United�States District Court for the Southern District of New York (the �SDNY�) asserting claims on behalf of participants in the Company�s 401(k) plan
and employee stock ownership plan against the Company and other 32 Table of Contents parties, including certain present and former directors and officers, under the Employee Retirement Income Security Act of 1974 (�ERISA�). In February 2008, these actions were
consolidated in a single proceeding, which is styled In re Morgan Stanley ERISA Litigation . The consolidated complaint relates in large part to the Company�s subprime and other mortgage related losses, but also includes allegations
regarding the Company�s disclosures, internal controls, accounting and other matters. The consolidated complaint alleges, among other things, that the Company�s common stock was not a prudent investment and that risks associated with its
common stock and its financial condition were not adequately disclosed. Plaintiffs are seeking, among other relief, class certification, unspecified compensatory damages, costs, interest and fees. On December�9, 2009, the court denied
defendants� motion to dismiss the consolidated complaint. On
March�16, 2011, a purported class action, styled Coulter v. Morgan Stanley�& Co. Incorporated et al. , was filed in the SDNY asserting claims on behalf of participants in the Company�s 401(k) plan and employee stock
ownership plan against the Company and certain current and former officers and directors for breach of fiduciary duties under ERISA. The complaint alleges, among other things, that defendants knew or should have known that from January�2, 2008
to December�31, 2008, the plans� investment in Company stock was imprudent given the extraordinary risks faced by the Company and its common stock during that period. Plaintiffs are seeking, among other relief, class certification,
unspecified compensatory damages, costs, interest and fees. On July�20, 2011, plaintiffs filed an amended complaint and on October�28, 2011, defendants filed a motion to dismiss the amended complaint. On February�12, 2008, a plaintiff filed a purported class action, which
was amended on November�24, 2008, naming the Company and certain present and former senior executives as defendants and asserting claims for violations of the securities laws. The amended complaint, which is styled Joel Stratte-McClure, et
al. v. Morgan�Stanley, et al. , is currently pending in the SDNY. Subject to certain exclusions, the amended complaint asserts claims on behalf of a purported class of persons and entities who purchased shares of the Company�s common
stock during the period June�20, 2007 to December�19, 2007 and who suffered damages as a result of such purchases. The allegations in the amended complaint relate in large part to the Company�s subprime and other mortgage related
losses, but also include allegations regarding the Company�s disclosures, internal controls, accounting and other matters. Plaintiffs are seeking, among other relief, class certification, unspecified compensatory damages, costs, interest and
fees. On April�27, 2009, the Company filed a motion to dismiss the amended complaint. On April�4, 2011, the court granted defendants� motion to dismiss and granted plaintiffs leave to file an amended complaint with respect to certain
of their allegations. On June�9, 2011, plaintiffs filed a second amended complaint in response to the court�s order of April�4, 2011. On August�8, 2011, defendants filed a motion to dismiss the second amended complaint. On May�7, 2009, the Company was named as a defendant in a
purported class action lawsuit brought under Sections 11, 12 and 15 of the Securities Act of 1933, as amended (the �Securities Act�), alleging, among other things, that the registration statements and offering documents related to the
offerings of approximately $17 billion of mortgage pass through certificates in 2006 and 2007 contained false and misleading information concerning the pools of residential loans that backed these securitizations. The plaintiffs sought, among other
relief, class certification, unspecified compensatory and rescissionary damages, costs, interest and fees. This case, which was consolidated with an earlier lawsuit and is currently styled In re Morgan Stanley Mortgage Pass-Through Certificate
Litigation , is pending in the SDNY. On August�17, 2010, the court dismissed the claims brought by the lead plaintiff, but gave a different plaintiff leave to file a second amended complaint. On September�10, 2010, that plaintiff,
together with several new plaintiffs, filed a second amended complaint which purported to assert claims against the Company and others on behalf of a class of investors who purchased approximately $4.7 billion of mortgage pass through certificates
issued in 2006 by seven trusts collectively containing residential mortgage loans. The second amended complaint asserted claims under Sections 11, 12 and 15 of the Securities Act, and alleged, among other things, that the registration statements and
offering documents related to the offerings contained false and misleading information concerning the pools of residential loans that backed these securitizations. The plaintiffs sought, among other relief, class certification, unspecified
compensatory and rescissionary damages, costs, interest and fees. On September�15, 2011, the court granted in 33 Table of Contents part and denied in part the defendants� motion to dismiss and granted the plaintiffs� request to file another amended complaint. On September�29, 2011, the defendants moved for
reconsideration of a portion of the court�s decision partially denying the motion to dismiss. On September�30, 2011, the plaintiffs filed a third amended complaint purporting to bring claims on behalf of a class of investors who purchased
approximately $2.7 billion of mortgage pass through certificates issued in 2006 by five trusts. The defendants moved to dismiss the third amended complaint on October�17, 2011. Beginning in 2007, the Company was named as a defendant in several putative
class action lawsuits brought under Sections 11 and 12 of the Securities Act, related to its role as a member of the syndicates that underwrote offerings of securities and mortgage pass through certificates for certain non-Morgan Stanley related
entities that have been exposed to subprime and other mortgage-related losses. The plaintiffs in these actions allege, among other things, that the registration statements and offering documents for the offerings at issue contained material
misstatements or omissions related to the extent to which the issuers were exposed to subprime and other mortgage-related risks and other matters and seek various forms of relief including class certification, unspecified compensatory and
rescissionary damages, costs, interest and fees. The Company�s exposure to potential losses in these cases may be impacted by various factors including, among other things, the financial condition of the entities that issued or sponsored the
securities and mortgage pass through certificates at issue, the principal amount of the offerings underwritten by the Company, the financial condition of co-defendants and the willingness and ability of the issuers (or their affiliates) to indemnify
the underwriter defendants. Some of these cases, including In Re Washington Mutual, Inc. Securities Litigation, In re: Lehman Brothers Equity/Debt Securities Litigation and In re IndyMac Mortgage-Backed Securities Litigation , relate to
issuers or sponsors (or their affiliates) that have filed for bankruptcy or have been placed into receivership. In re: Lehman Brothers Equity/Debt Securities Litigation is pending in the SDNY and relates to several offerings of debt and equity securities issued by Lehman Brothers Holdings Inc. during 2007
and 2008. The Company underwrote approximately $232 million of the principal amount of the offerings at issue. On September�23, 2011, a group of underwriter defendants, including the Company, reached an agreement in principle with the class
plaintiffs to settle the litigation. On December�15, 2011, the Court presiding over this action issued an order preliminarily approving the settlement. The settlement hearing is currently scheduled for April�12, 2012. In re IndyMac Mortgage-Backed Securities Litigation is pending in the
SDNY and relates to offerings of mortgage pass through certificates issued by seven trusts sponsored by affiliates of IndyMac Bancorp during 2006 and 2007. The Company underwrote over $1.4 billion of the principal amount of the offerings originally
at issue. On June�21, 2010, the court granted in part and denied in part the underwriter defendants� motion to dismiss the amended consolidated class action complaint. The Company underwrote approximately $46 million of the principal
amount of the offerings at issue following the court�s June�21, 2010 decision. On May�17, 2010, certain putative plaintiffs filed a motion to intervene in the litigation in order to assert claims related to additional offerings. The
principal amount of the additional offerings underwritten by the Company is approximately $1.2 billion. On June�21, 2011, the Company successfully opposed the motion to add the additional plaintiffs as to the Company. On July�20, 2011 and
July�21, 2011, certain of the additional plaintiffs filed appeals in the United States Court of Appeals for the Second Circuit. The Company is opposing the appeals. Luther, et al. v. Countrywide Financial Corporation , et al., pending
in the Superior Court of the State of California, involves claims related to the Company�s role as an underwriter of various residential mortgage backed securities offerings issued by affiliates of Countrywide Financial Corporation. The amended
complaint includes allegations that the registration statements and the offering documents contained false and misleading statements about the residential mortgage loans backing the securities.�The Company underwrote approximately $6.3 billion
of the principal amount of the offerings at issue.�On January�6, 2010, the Court dismissed the case for lack of subject matter jurisdiction. On May�18, 2011, a California court of appeals reversed the dismissal and reinstated the
complaint. On December�19, 2011, defendants moved to dismiss the complaint. On February�3, 2012, defendants moved to stay the case pending resolution of a securities class action brought by the same plaintiffs, styled Maine State
Retirement System v. Countrywide Financial Corporation, et al. , in the United States District Court for the Central District of California. 34 Table of Contents Other Litigation. On August�25, 2008, the Company and two ratings agencies were
named as defendants in a purported class action related to securities issued by a SIV called Cheyne Finance (the �Cheyne SIV�). The case is styled Abu Dhabi Commercial Bank, et al. v. Morgan Stanley�& Co. Inc., et al. and
is pending in the SDNY. The complaint alleges, among other things, that the ratings assigned to the securities issued by the SIV were false and misleading because the ratings did not accurately reflect the risks associated with the subprime RMBS
held by the SIV. On September�2, 2009, the court dismissed all of the claims against the Company except for plaintiffs� claims for common law fraud. On June�15, 2010, the court denied plaintiffs� motion for class certification.
On July�20, 2010, the court granted plaintiffs leave to replead their aiding and abetting common law fraud claims against the Company, and those claims were added in an amended complaint filed on August�5, 2010. On December�27, 2011,
the court permitted plaintiffs to reinstate their causes of action for negligent misrepresentation and breach of fiduciary duty against the Company. The Company moved to dismiss these claims on January�10, 2012. On January�5, 2012, the
court permitted plaintiffs to amend their complaint and assert a negligence claim against the Company. The amended complaint was filed on January�9, 2012 and the Company moved to dismiss the negligence claim on January�17, 2012. On
January�23, 2012, the Company moved for summary judgment with respect to the fraud and aiding and abetting fraud claims. Plaintiffs have not alleged the amount of their alleged investments, and are seeking, among other relief, unspecified
compensatory and punitive damages. There are 15 plaintiffs in this action asserting claims related to approximately $983 million of securities issued by the SIV. On September�25, 2009, the Company was named as a defendant in a lawsuit
styled Citibank, N.A. v. Morgan�Stanley�& Co. International, PLC , pending in the SDNY. The lawsuit relates to a credit default swap referencing the Capmark VI CDO, which was structured by Citibank, N.A. (�Citi N.A.�).
At issue is whether, as part of the swap agreement, Citi N.A. was obligated to obtain the Company�s prior written consent before it exercised its rights to liquidate Capmark upon the occurrence of certain contractually-defined credit events.
Citi N.A. is seeking approximately $245 million in compensatory damages plus interest and costs. On May�25, 2011, the court issued an order denying the Company�s motion for summary judgment and granting Citi N.A.�s cross motion for
summary judgment. On June�27, 2011, the court entered a final judgment against the Company for approximately $269 million plus post-judgment interest, and the Company filed a notice of appeal with the United States Court of Appeals for the
Second Circuit, which appeal is now pending. On December�14,
2009, Central Mortgage Company (�CMC�) filed a complaint against the Company, in a matter styled Central Mortgage Company v. Morgan Stanley Mortgage Capital Holdings LLC , pending in the Court of Chancery of the State of Delaware.
The complaint alleged that that Morgan Stanley Mortgage Capital Holdings LLC improperly refused to repurchase certain mortgage loans that CMC, as servicer, was required to repurchase from the Federal Home Loan Mortgage Corporation (�Freddie
Mac�) and the Federal National Mortgage Association (�Fannie Mae�). On November�4, 2011, CMC filed an amended complaint adding claims related to its purchase of servicing rights in connection with approximately $4.1 billion of
residential loans deposited into RMBS trusts sponsored by the Company. The amended complaint asserts claims for breach of contract, quasi-contract, equitable and tort claims and seeks compensatory damages and equitable remedies, including
rescission, injunctive relief, damages, restitution and disgorgement. On January�9, 2012, the Company moved to dismiss the amended complaint. 35 Table of Contents On December�23, 2009, the Federal Home Loan Bank of Seattle filed a complaint�against the Company
and another defendant in�the Superior Court of the State of Washington, styled Federal Home Loan Bank of Seattle v. Morgan Stanley�& Co. Inc., et al. An amended complaint was filed on September�28, 2010. The complaint
alleges that defendants made untrue statements and material omissions in the sale to plaintiff of certain mortgage pass through certificates backed by securitization trusts containing residential mortgage loans. The total amount of certificates
allegedly sold to plaintiff by the Company was approximately $233 million.�The complaint raises claims under the Washington State Securities Act and seeks, among other things,�to rescind�the plaintiff�s purchase of such
certificates.�On October�18, 2010, defendants filed a motion to dismiss the action. By orders dated�June 23, 2011 and July�18, 2011,�the court denied defendants� omnibus�motion to dismiss plaintiff�s amended
complaint and on�August 15, 2011, the court denied the Company�s individual motion to dismiss the amended complaint. On March�15, 2010, the Federal Home Loan Bank of San Francisco filed two complaints against the Company and other defendants in�the Superior
Court of the State of California. These actions are styled Federal Home Loan Bank of San Francisco�v. Credit Suisse Securities (USA) LLC, et al. ,�and Federal Home Loan Bank of San�Francisco�v. Deutsche Bank Securities
Inc.�et al. , respectively. Amended complaints were filed on June�10, 2010. The complaints allege that defendants made untrue statements and material omissions in connection with the sale to plaintiff of�a number of�mortgage
pass through certificates backed by securitization trusts containing residential mortgage loans. The amount of certificates allegedly sold to plaintiff by the Company in these cases was approximately $704 million and $276 million, respectively. The
complaints raise claims under both the federal securities laws and California law and seek, among other things,�to rescind�the plaintiff�s purchase of such certificates.�On April�18, 2011, defendants in these actions filed
an omnibus demurrer and motion to strike the amended complaints. On July�29, 2011 and September�8, 2011, the court presiding over both actions sustained defendants� demurrers with respect to claims brought under�the Securities
Act, and overruled defendants� demurrers with respect to all other claims. On June�10, 2010, the Company was named as a new defendant in a pre-existing purported class action related to securities issued by a SIV called Rhinebridge plc (�Rhinebridge SIV�). The
case is styled King County, Washington, et al. v. IKB Deutsche Industriebank AG, et al. and is pending in the SDNY. The complaint asserts claims for common law fraud and aiding and abetting common law fraud and alleges, among other things,
that the ratings assigned to the securities issued by the SIV were false and misleading, including because the ratings did not accurately reflect the risks associated with the subprime RMBS held by the SIV. On July�15, 2010, the Company moved
to dismiss the complaint. That motion was denied on October�29, 2010. On December�27, 2011, the court permitted plaintiffs to amend their complaint and assert causes of action for negligence, negligent misrepresentation, and breach of
fiduciary duty against the Company. The amended complaint was filed on January�10, 2012 and the Company moved to dismiss the negligence, negligent misrepresentation, and breach of fiduciary duty claims on January�31, 2012. The case is
pending before the same judge presiding over the litigation concerning the Cheyne SIV, described above. While reserving their ability to act otherwise, plaintiffs have indicated that they do not currently plan to file a motion for class
certification. Plaintiffs have not alleged the amount of their alleged investments, and are seeking, among other relief, unspecified compensatory and punitive damages. On July�9, 2010, Cambridge Place Investment Management Inc. filed a
complaint�against the Company and other defendants in�the Superior Court of the Commonwealth of Massachusetts, styled Cambridge Place Investment Management Inc. v. Morgan Stanley�& Co., Inc., et al. The complaint
asserts claims on behalf of certain clients of plaintiff�s affiliates and alleges that defendants made untrue statements and material omissions in the sale of�a number of�mortgage pass through certificates backed by securitization
trusts containing residential mortgage loans.�The�total amount of certificates allegedly issued by the Company or sold to plaintiff�s affiliates� clients by the Company was�approximately $242 million. The complaint raises
claims under�the Massachusetts Uniform Securities Act�and seeks, among other things, to rescind the plaintiff�s purchase of such certificates.�On February�11, 2011, Cambridge Place Investment Management Inc. filed a second
complaint against the Company and other defendants in the Superior Court of the Commonwealth of Massachusetts also styled Cambridge Place 36 Table of Contents Investment Management Inc. v. Morgan Stanley�& Co., Inc. et al . The complaint asserts claims on behalf of clients of plaintiff�s affiliates, and alleges that the defendants
made untrue statements and material omissions in selling certain mortgage pass through certificates backed by securitization trusts containing residential mortgage loans. The total amount of certificates allegedly issued or underwritten by the
Company or sold to plaintiff�s affiliates� clients by the Company was approximately $102 million.�The complaint raises claims under�the Massachusetts Uniform Securities Act and seeks, among other things, to rescind the
plaintiff�s purchase of such certificates. On October�14, 2011, plaintiffs filed an amended complaint in each action. On November�22, 2011, defendants filed a motion to dismiss the amended complaints. On July�15, 2010, The Charles Schwab Corp. filed a complaint against the
Company and other defendants in�the Superior Court of the State of California, styled The Charles Schwab Corp. v. BNP Paribas Securities Corp., et al . The complaint alleges that defendants made untrue statements and material omissions in
the sale to one of plaintiff�s subsidiaries of�a number of�mortgage pass through certificates backed by securitization trusts containing residential mortgage loans. The�total amount of certificates allegedly sold to
plaintiff�s subsidiary by the Company was�approximately $180 million.�The complaint raises claims under both the federal securities laws and California law and seeks, among other things,�to rescind�the plaintiff�s
purchase of such certificates.�Plaintiff filed an amended complaint on August�2, 2010. On September�22, 2011, defendants filed demurrers to the amended complaint. On October�13, 2011, plaintiff voluntarily dismissed its claims
brought under the Securities Act. On January�27, 2012, the court, in a ruling from the bench, substantially overruled defendants� demurrers. On July�15, 2010, China Development Industrial Bank (�CDIB�) filed a complaint against the Company, which is styled China Development
Industrial Bank v. Morgan Stanley�& Co. Incorporated and is pending in the Supreme Court of the State of New York, New York County. The Complaint relates to a $275 million credit default swap referencing the super senior portion of the
STACK 2006-1 CDO. The complaint asserts claims for common law fraud, fraudulent inducement and fraudulent concealment and alleges that the Company misrepresented the risks of the STACK 2006-1 CDO to CDIB, and that the Company knew that the assets
backing the CDO were of poor quality when it entered into the credit default swap with CDIB. The complaint seeks compensatory damages related to the approximately $228 million that CDIB alleges it has already lost under the credit default swap,
rescission of CDIB�s obligation to pay an additional $12 million, punitive damages, equitable relief, fees and costs. On September�30, 2010, the Company filed a motion to dismiss the complaint. On February�28, 2011, the Court denied
the Company�s motion to dismiss the complaint. On March�21, 2011, the Company appealed the order denying its motion to dismiss the complaint. On July�7, 2011, the appellate court affirmed the lower court�s decision denying the
Company�s motion to dismiss. On October�15,
2010,�the Federal Home Loan Bank of Chicago filed two complaints�against the Company and other defendants. One was filed in�the�Circuit Court of the State of Illinois and is styled Federal Home Loan Bank
of�Chicago�v.�Bank of America Funding Corporation�et al . The other was filed in�the Superior Court of the State of California and is styled Federal Home Loan Bank of Chicago v.�Bank of America
Securities�LLC, et al . The complaints allege that defendants made untrue statements and material omissions in the sale to plaintiff of�a number of�mortgage pass through certificates backed by securitization trusts containing
residential mortgage loans.�The�total amount of certificates allegedly sold to plaintiff by the Company in the two actions was�approximately $203 million and $75 million respectively.�The complaint filed in Illinois raises claims
under�Illinois law. The complaint filed in California raises claims under the federal securities laws, Illinois law and California law. Both complaints seek, among other things,�to rescind�the plaintiff�s purchase of such
certificates. On March�24, 2011, the Court presiding over Federal Home Loan Bank of�Chicago�v.�Bank of America Funding Corporation�et al. granted plaintiff leave to file an amended complaint. On May�27, 2011,
defendants filed a motion to dismiss the amended complaint, which motion is currently pending. On September�15, 2011, plaintiff filed an amended complaint in Federal Home Loan Bank of Chicago v.�Bank of America Securities�LLC, et
al . On December�1, 2011, defendants filed a demurrer to the amended complaint, which demurrer is currently pending. 37 Table of Contents On April�20, 2011, the Federal Home Loan Bank of Boston filed a complaint�against the Company and
other defendants in�the Superior Court of the Commonwealth of Massachusetts styled Federal Home Loan Bank of Boston v. Ally Financial, Inc. F/K/A GMAC LLC et al .�The complaint alleges that defendants made untrue statements and
material omissions in the sale to plaintiff of certain mortgage pass through certificates backed by securitization trusts containing residential mortgage loans. The total amount of certificates allegedly issued by the Company or sold to plaintiff by
the Company was approximately $550 million.�The complaint raises claims under�the Massachusetts Uniform Securities Act, the Massachusetts consumer protection act and common law�and seeks, among other things, to rescind the
plaintiff�s purchase of such certificates. On May�26, 2011, defendants removed the case to the United States District Court for the District of Massachusetts, and on June�22, 2011, plaintiff filed a motion to remand the case back to
state court. On�July 5,�2011,�Allstate Insurance
Company and certain of�its affiliated entities�filed a complaint�against the Company�in�New York State Supreme Court styled Allstate Insurance Company, et al. v. Morgan Stanley, et al . The complaint alleges that
defendants made untrue statements and material omissions in the sale to plaintiff of certain mortgage pass through certificates backed by securitization trusts containing residential mortgage loans. The total amount of certificates allegedly issued
and/or sold to plaintiffs by the Company was approximately $104 million.�The complaint raises common law claims of fraud,�fraudulent inducement, aiding and abetting fraud and negligent misrepresentation and seeks, among other
things,�compensatory and/or rescissionary damages�associated with�plaintiffs� purchases of such certificates. On September�9, 2011, plaintiffs filed an amended complaint. On October�14, 2011, defendants filed a motion
to dismiss the amended complaint, which motion is currently pending. On July�18, 2011, the Western and Southern Life Insurance Company and certain affiliated companies filed a complaint�against the Company and other defendants in�the Court of Common Pleas in
Ohio, styled Western and Southern Life Insurance Company, et al. v. Morgan Stanley Mortgage Capital Inc., et al .�The complaint alleges that defendants made untrue statements and material omissions in the sale to plaintiffs of certain
mortgage pass through certificates backed by securitization trusts containing residential mortgage loans. The amount of the certificates allegedly sold to plaintiffs by the Company was approximately $153 million.�The complaint raises claims
under�the Ohio Securities Act, federal securities laws, and common law and seeks, among other things, to rescind the plaintiffs� purchases of such certificates. On September�2, 2011, the Federal Housing Finance Agency
(�FHFA�), as conservator for Fannie Mae�and Freddie Mac, filed 17 complaints against numerous financial services companies, including the Company. A complaint against the Company and other defendants was filed in the Supreme Court of
the State of New York, styled Federal Housing Finance Agency, as Conservator v. Morgan Stanley et al . The complaint alleges that defendants made untrue statements and material omissions in connection with the sale to Fannie Mae and Freddie
Mac of�residential mortgage pass through certificates with an original unpaid balance of approximately $11 billion. The complaint raises claims under federal and state securities laws and common law and seeks, among other things, rescission and
compensatory and punitive damages.�On September�26, 2011, defendants removed the action to the SDNY and on October�26, 2011, the FHFA moved to remand the action back to the Supreme Court of the State of New York. On September�2, 2011, the FHFA,�as conservator�for Freddie
Mac,�also filed a complaint against the Company and other defendants in the Supreme Court of the State of New York, styled Federal Housing Finance Agency, as Conservator v.�General Electric Company et al . The complaint alleges that
defendants made untrue statements and material omissions in connection with the sale to�Freddie Mac of�residential mortgage pass through certificates with an original unpaid balance of approximately $549 million.�The complaint raises
claims under federal and state securities laws and common law and seeks, among other things, rescission and compensatory and punitive damages.�On October�6, 2011, defendants removed the action to the SDNY and on November�7, 2011, the
FHFA moved to remand the action back to the Supreme Court of the State of New York. On November�4, 2011, the Federal Deposit Insurance Corporation, as receiver for Franklin Bank S.S.B, filed two complaints against the Company in the District Court of the State of Texas. Each is
styled Federal Deposit 38 Table of Contents Insurance Corporation, as Receiver for Franklin Bank S.S.B v. Morgan Stanley�& Company LLC F/K/A Morgan Stanley�& Co. Inc. and alleges that the Company made untrue
statements and material omissions in connection with the sale to plaintiff of�mortgage pass through certificates backed by securitization trusts containing residential mortgage loans. The amount of certificates allegedly underwritten and sold
to plaintiff by the Company in these cases was approximately $67 million and $35 million, respectively. The complaints each raise claims under both federal securities law and the Texas Securities Act and each seeks, among other
things,�compensatory damages associated with plaintiff�s purchase of such certificates. On January�20, 2012, Sealink Funding Limited filed a complaint�against the Company in the Supreme Court of the State of New York styled Sealink Funding Limited v. Morgan Stanley, et
al .�Plaintiff purports to be the assignee of claims of certain special purpose vehicles (�SPVs�) formerly sponsored by SachsenLB Europe. The complaint alleges that defendants made untrue statements and material omissions in the
sale to the SPVs of certain mortgage pass through certificates backed by securitization trusts containing residential mortgage loans. The total amount of certificates allegedly issued by the Company and/or sold by the Company was approximately $556
million.�The complaint raises common law claims of fraud,�fraudulent inducement, aiding and abetting fraud and negligent misrepresentation and seeks, among other things,�compensatory and/or rescissionary damages�associated
with�plaintiffs� purchases of such certificates. On
January�25, 2012, Dexia SA/NV and certain of its affiliated entities filed a complaint�against the Company�in the Supreme Court of the State of New York styled Dexia SA/NV et al. v. Morgan Stanley, et al .�The complaint
alleges that defendants made untrue statements and material omissions in the sale to plaintiffs of certain mortgage pass through certificates backed by securitization trusts containing residential mortgage loans. The total amount of certificates
allegedly issued by the Company and/or sold to plaintiffs by the Company was approximately $680 million.�The complaint raises common law claims of fraud,�fraudulent inducement, aiding and abetting fraud and negligent misrepresentation and
seeks, among other things,�compensatory and/or rescissionary damages�associated with�plaintiffs� purchases of such certificates. On January�25, 2012, Bayerische Landesbank, New York Branch filed a complaint�against the Company�in the Supreme Court of the State of New
York styled Bayerische Landesbank, New York Branch v. Morgan Stanley, et al .�The complaint alleges that defendants made untrue statements and material omissions in the sale to plaintiff of certain mortgage pass through certificates
backed by securitization trusts containing residential mortgage loans. The total amount of certificates allegedly issued by the Company and/or sold to plaintiff by the Company was approximately $486 million.�The complaint raises common law
claims of fraud,�fraudulent inducement, aiding and abetting fraud and negligent misrepresentation and seeks, among other things,�compensatory and/or rescissionary damages�associated with�plaintiffs� purchases of such
certificates. Other Matters. On a
case-by-case basis the Company has entered into agreements to toll the statute of limitations applicable to potential civil claims related to RMBS, CDOs and other mortgage-related products and services when the Company has concluded that it is in
its interest to do so. On October�18, 2011, the
Company received a letter from Gibbs�& Bruns LLP (the �Law Firm�), which is purportedly representing a group of investment advisers and holders of mortgage pass through certificates issued by RMBS trusts that were sponsored or
underwritten by the Company. The letter asserted that the Law Firm�s clients collectively hold 25% or more of the voting rights in 17 RMBS trusts sponsored or underwritten by the Company and that these trusts have an aggregate outstanding
balance exceeding $6 billion. The letter alleged generally that large numbers of mortgages in these trusts were sold or deposited into the trusts based on false and/or fraudulent representations and warranties by the mortgage originators, sellers
and/or depositors. The letter also alleged generally that there is evidence suggesting that the Company has failed prudently to service mortgage loans in these trusts. On January�31, 2012, the Law Firm announced that its clients hold over 25%
of the voting rights in 69 RMBS trusts securing over $25 billion of RMBS sponsored or underwritten by the Company, and that its clients had issued instructions to the trustees of these trusts to open investigations into 39 Table of Contents allegedly ineligible mortgages held by these trusts. The Law Firm�s press release also indicated that the Law Firm�s clients anticipate that they may provide additional instructions to
the trustees, as needed, to further the investigations. Shareholder Derivative Matter. On February�11, 2010, a shareholder derivative complaint styled Security, Police and Fire Professionals of America Retirement Fund,
et al. v. John J. Mack et al. was filed in the Supreme Court of the State of New York. The complaint is purportedly for the benefit of the Company, and is brought against certain current and former directors and officers of the Company, to
recover damages for alleged acts of corporate waste, breaches of the duty of loyalty, and unjust enrichment based on the amount of compensation awarded to an undefined group of employees for fiscal years 2006, 2007 and 2009. The complaint seeks,
among other relief, unspecified compensatory damages, restitution and disgorgement of compensation, benefits and profits, and institution of certain corporate governance reforms. On December�9, 2010, the court granted defendants� motion to
dismiss the complaint and on February�4, 2011, plaintiffs noticed an appeal of that dismissal, which appeal is pending. China Matter. As disclosed in February 2009, the Company uncovered actions initiated by an employee based in China in an overseas real estate subsidiary that appear to
have violated the Foreign Corrupt Practices Act.�The Company terminated the employee, reported the activity to appropriate authorities and is cooperating with investigations by the United States Department of Justice and the SEC. The following matters were terminated during the quarter ended
December�31, 2011: In Re Washington Mutual, Inc.
Securities Litigation , which had been pending in the United States District Court for the Western District of Washington, involved claims under the Securities Act related to three offerings by Washington Mutual Inc. in 2006 and 2007. The Company
was one of several underwriters who participated in the offerings. The Company underwrote approximately $1.3 billion of the securities covered by the class certified by the court. On November�4, 2011, a final settlement among the parties was
approved by the court. Employees� Retirement System of
the Government of the Virgin Islands v. Morgan Stanley�& Co. Incorporated, et al. , which had been pending in the SDNY, involved claims for common law fraud and unjust enrichment against the Company related to the Libertas III CDO. On
November�3, 2011, the Court dismissed the action with prejudice. MBIA Insurance Corporation v. Morgan Stanley, et al. which had been pending in New York Supreme Court, Westchester County, involved claims for fraud, breach of contract and unjust enrichment
against the Company related to MBIA Insurance Corporation�s (�MBIA�s�) contract to insure approximately $223 million of residential mortgage pass through certificates related a second lien securitization sponsored by the Company
in June 2007. On December�13, 2011, the Company and MBIA entered into an agreement to settle this litigation and to resolve certain claims that the Company had against MBIA. | Item�4. | Mine Safety Disclosures |
Table of Contents Part II | Item�5. | Market for Registrant�s Common Equity, Related Stockholder Matters and Issuer Purchases of Equity Securities. |
| Low Sale�Price | High Sale�Price | Dividends | ||||||||||
| 2011: | ||||||||||||
| Fourth Quarter | $ | 11.58 | $ | 19.67 | $ | 0.05 | ||||||
| Third Quarter | $ | 12.49 | $ | 24.46 | $ | 0.05 | ||||||
| Second Quarter | $ | 21.76 | $ | 28.24 | $ | 0.05 | ||||||
| First Quarter | $ | 26.70 | $ | 31.04 | $ | 0.05 | ||||||
| 2010: | ||||||||||||
| Fourth Quarter | $ | 23.95 | $ | 27.77 | $ | 0.05 | ||||||
| Third Quarter | $ | 22.40 | $ | 28.05 | $ | 0.05 | ||||||
| Second Quarter | $ | 23.14 | $ | 32.29 | $ | 0.05 | ||||||
| First Quarter | $ | 26.15 | $ | 33.27 | $ | 0.05 | ||||||
Table of Contents The table below sets forth the information with respect to purchases made by or on behalf of the Company of
its common stock during the fourth quarter of the year ended December�31, 2011. Issuer Purchases of Equity Securities (dollars in millions, except per
share amounts) | Period | Total Number of Shares Purchased | Average Price Paid�Per Share | Total Number�of Shares Purchased As�Part�of�Publicly Announced Plans or Programs(C) | Approximate�Dollar Value of Shares that May Yet Be Purchased Under the Plans�or Programs | ||||||||||||
| Month�#1�(October 1, 2011�October 31, 2011) | ||||||||||||||||
| Share Repurchase Program(A) | � | � | � | $ | 1,560 | |||||||||||
| Employee Transactions(B) | 83,427 | $ | 15.16 | � | � | |||||||||||
| Month #2 (November 1, 2011�November 30, 2011) | ||||||||||||||||
| Share Repurchase Program(A) | � | � | � | $ | 1,560 | |||||||||||
| Employee Transactions(B) | 30,453 | $ | 15.91 | � | � | |||||||||||
| Month #3 (December 1, 2011�December 31, 2011) | ||||||||||||||||
| Share Repurchase Program(A) | � | � | � | $ | 1,560 | |||||||||||
| Employee Transactions(B) | 239,301 | $ | 15.12 | � | � | |||||||||||
| Total | ||||||||||||||||
| Share Repurchase Program(A) | � | � | � | $ | 1,560 | |||||||||||
| Employee Transactions(B) | 353,181 | $ | 15.20 | � | � | |||||||||||
| (A) | On December�19, 2006, the Company announced that its Board of Directors authorized the repurchase of up to $6 billion of the Company�s outstanding stock under a share repurchase program (the �Share Repurchase Program�). The Share Repurchase Program is a program for capital management purposes that considers, among other things, business segment capital needs, as well as equity-based compensation and benefit plan requirements. The Share Repurchase Program has no set expiration or termination date. Share repurchases by the Company are subject to regulatory approval. |
| (B) | Includes: (1)�shares delivered or attested in satisfaction of the exercise price and/or tax withholding obligations by holders of employee and director stock options (granted under employee and director stock compensation plans) who exercised options; (2)�shares withheld, delivered or attested (under the terms of grants under employee and director stock compensation plans) to offset tax withholding obligations that occur upon vesting and release of restricted shares; (3)�shares withheld, delivered and attested (under the terms of grants under employee and director stock compensation plans) to offset tax withholding obligations that occur upon the delivery of outstanding shares underlying restricted stock units; and (4)�shares withheld, delivered and attested (under the terms of grants under employee and director stock compensation plans) to offset the cash payment for fractional shares. The Company�s employee and director stock compensation plans provide that the value of the shares withheld, delivered or attested, shall be valued using the fair market value of the Company�s common stock on the date the relevant transaction occurs, using a valuation methodology established by the Company. |
| (C) | Share purchases under publicly announced programs are made pursuant to open-market purchases, Rule 10b5-1 plans or privately negotiated transactions (including with employee benefit plans) as market conditions warrant and at prices the Company deems appropriate. |
Table of Contents Stock performance graph. The following graph compares the cumulative total
shareholder return (rounded to the nearest whole dollar) of the Company�s common stock, the S&P 500 Stock Index (�S&P 500�) and the S&P 500 Financials Index (�S5FINL�) for the last five years. The graph assumes a
$100 investment at the closing price on December�29, 2006 and reinvestment of dividends on the respective dividend payment dates without commissions. Historical prices are adjusted to reflect the spin-off of Discover Financial Services
completed on June�30, 2007. This graph does not forecast future performance of the Company�s common stock. 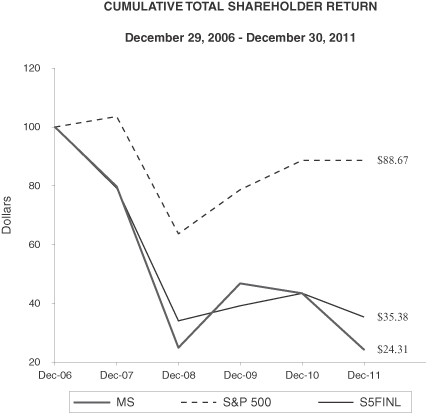
| MS | S&P 500 | S5FINL | ||||||||||
| 12/29/2006 | $ | 100.00 | $ | 100.00 | $ | 100.00 | ||||||
| 12/31/2007 | $ | 79.72 | $ | 103.53 | $ | 79.16 | ||||||
| 12/31/2008 | $ | 24.91 | $ | 63.69 | $ | 34.08 | ||||||
| 12/31/2009 | $ | 46.82 | $ | 78.62 | $ | 39.12 | ||||||
| 12/31/2010 | $ | 43.36 | $ | 88.67 | $ | 43.36 | ||||||
| 12/30/2011 | $ | 24.31 | $ | 88.67 | $ | 35.38 | ||||||
Table of Contents| Item�6. | Selected Financial Data. |
| 2011 | 2010 | 2009(1)(2) | Fiscal 2008 | Fiscal 2007 | One�Month Ended December�31, 2008(2) | |||||||||||||||||||
| Income Statement Data: | ||||||||||||||||||||||||
| Revenues: | ||||||||||||||||||||||||
| Investment banking | $ | 4,991 | $ | 5,122 | $ | 5,020 | $ | 4,057 | $ | 6,321 | $ | 196 | ||||||||||||
| Principal transactions: | ||||||||||||||||||||||||
| Trading | 12,392 | 9,406 | 7,723 | 6,083 | 1,843 | (1,491 | ) | |||||||||||||||||
| Investments | 573 | 1,825 | (1,034 | ) | (3,888 | ) | 3,328 | (205 | ) | |||||||||||||||
| Commissions and fees | 5,379 | 4,947 | 4,233 | 4,443 | 4,654 | 213 | ||||||||||||||||||
| Asset management, distribution and administration fees | 8,502 | 7,919 | 5,841 | 4,839 | 5,486 | 292 | ||||||||||||||||||
| Other | 209 | 1,271 | 707 | 3,855 | 696 | 108 | ||||||||||||||||||
| Total non-interest revenues | 32,046 | 30,490 | 22,490 | 19,389 | 22,328 | (887 | ) | |||||||||||||||||
| Interest income | 7,264 | 7,311 | 7,477 | 38,928 | 61,256 | 1,089 | ||||||||||||||||||
| Interest expense | 6,907 | 6,414 | 6,687 | 36,226 | 57,124 | 1,138 | ||||||||||||||||||
| Net interest | 357 | 897 | 790 | 2,702 | 4,132 | (49 | ) | |||||||||||||||||
| Net revenues | 32,403 | 31,387 | 23,280 | 22,091 | 26,460 | (936 | ) | |||||||||||||||||
| Non-interest expenses: | ||||||||||||||||||||||||
| Compensation and benefits | 16,403 | 15,923 | 14,331 | 11,759 | 15,981 | 578 | ||||||||||||||||||
| Other | 9,886 | 9,233 | 7,819 | 8,905 | 7,453 | 473 | ||||||||||||||||||
| Total non-interest expenses | 26,289 | 25,156 | 22,150 | 20,664 | 23,434 | 1,051 | ||||||||||||||||||
| Income (loss) from continuing operations before income taxes | 6,114 | 6,231 | 1,130 | 1,427 | 3,026 | (1,987 | ) | |||||||||||||||||
| Provision for (benefit from) income taxes | 1,418 | 754 | (297 | ) | 132 | 719 | (721 | ) | ||||||||||||||||
| Income (loss) from continuing operations | 4,696 | 5,477 | 1,427 | 1,295 | 2,307 | (1,266 | ) | |||||||||||||||||
| Discontinued operations(3): | ||||||||||||||||||||||||
| Gain (loss) from discontinued operations | (175 | ) | 577 | (114 | ) | 831 | 1,432 | (22 | ) | |||||||||||||||
| Provision for (benefit from) income taxes | (124 | ) | 352 | (93 | ) | 348 | 490 | (3 | ) | |||||||||||||||
| Net gain (loss) from discontinued operations | (51 | ) | 225 | (21 | ) | 483 | 942 | (19 | ) | |||||||||||||||
| Net income (loss) | 4,645 | 5,702 | 1,406 | 1,778 | 3,249 | (1,285 | ) | |||||||||||||||||
| Net income applicable to noncontrolling interests | 535 | 999 | 60 | 71 | 40 | 3 | ||||||||||||||||||
| Net income (loss) applicable to Morgan Stanley | $ | 4,110 | $ | 4,703 | $ | 1,346 | $ | 1,707 | $ | 3,209 | $ | (1,288 | ) | |||||||||||
| Earnings (loss) applicable to Morgan Stanley common shareholders(4) | $ | 2,067 | $ | 3,594 | $ | (907 | ) | $ | 1,495 | $ | 2,976 | $ | (1,624 | ) | ||||||||||
| Amounts applicable to Morgan Stanley: | ||||||||||||||||||||||||
| Income (loss) from continuing operations | $ | 4,161 | $ | 4,478 | $ | 1,383 | $ | 1,262 | $ | 2,269 | $ | (1,266 | ) | |||||||||||
| Net gain (loss) from discontinued operations | (51 | ) | 225 | (37 | ) | 445 | 940 | (22 | ) | |||||||||||||||
| Net income (loss) applicable to Morgan Stanley | $ | 4,110 | $ | 4,703 | $ | 1,346 | $ | 1,707 | $ | 3,209 | $ | (1,288 | ) | |||||||||||
Table of Contents| 2011 | 2010 | 2009(1)(2) | Fiscal 2008 | Fiscal 2007 | One Month Ended December 31, 2008(2) | |||||||||||||||||||
| Per Share Data: | ||||||||||||||||||||||||
| Earnings (loss) per basic common share(5): | ||||||||||||||||||||||||
| Income (loss) from continuing operations | $ | 1.28 | $ | 2.49 | $ | (0.73 | ) | $ | 1.05 | $ | 2.08 | $ | (1.60 | ) | ||||||||||
| Net gain (loss) from discontinued operations | (0.03 | ) | 0.15 | (0.04 | ) | 0.40 | 0.89 | (0.02 | ) | |||||||||||||||
| Earnings (loss) per basic common share | $ | 1.25 | $ | 2.64 | $ | (0.77 | ) | $ | 1.45 | $ | 2.97 | $ | (1.62 | ) | ||||||||||
| Earnings (loss) per diluted common share(5): | ||||||||||||||||||||||||
| Income (loss) from continuing operations | $ | 1.26 | $ | 2.45 | $ | (0.73 | ) | $ | 1.01 | $ | 2.03 | $ | (1.60 | ) | ||||||||||
| Net gain (loss) from discontinued operations | (0.03 | ) | 0.18 | (0.04 | ) | 0.38 | 0.87 | (0.02 | ) | |||||||||||||||
| Earnings (loss) per diluted common share | $ | 1.23 | $ | 2.63 | $ | (0.77 | ) | $ | 1.39 | $ | 2.90 | $ | (1.62 | ) | ||||||||||
| Book value per common share(6) | $ | 31.42 | $ | 31.49 | $ | 27.26 | $ | 30.24 | $ | 28.56 | $ | 27.53 | ||||||||||||
| Dividends declared per common share | $ | 0.20 | $ | 0.20 | $ | 0.17 | $ | 1.08 | $ | 1.08 | $ | 0.27 | ||||||||||||
| Balance Sheet and Other Operating Data: | ||||||||||||||||||||||||
| Total assets | $ | 749,898 | $ | 807,698 | $ | 771,462 | $ | 659,035 | $ | 1,045,409 | $ | 676,764 | ||||||||||||
| Total capital(7) | 211,201 | 222,757 | 213,974 | 192,297 | 191,085 | 208,008 | ||||||||||||||||||
| Long-term borrowings(7) | 149,152 | 165,546 | 167,286 | 141,466 | 159,816 | 159,255 | ||||||||||||||||||
| Morgan Stanley shareholders� equity | 62,049 | 57,211 | 46,688 | 50,831 | 31,269 | 48,753 | ||||||||||||||||||
| Return on average common shareholders� equity | 3.9 | % | 8.5 | % | N/M | 3.4 | % | 6.9 | % | N/M | ||||||||||||||
| Average common shares outstanding(4): | ||||||||||||||||||||||||
| Basic | 1,654,708,640 | 1,361,670,938 | 1,185,414,871 | 1,028,180,275 | 1,001,878,651 | 1,002,058,928 | ||||||||||||||||||
| Diluted | 1,675,271,669 | 1,411,268,971 | 1,185,414,871 | 1,073,496,349 | 1,024,836,645 | 1,002,058,928 | ||||||||||||||||||
| (1) | Information includes Morgan Stanley Smith Barney Holdings LLC effective May�31, 2009 (see Note 3 to the consolidated financial statements). |
| (2) | On December�16, 2008, the Board of Directors of the Company approved a change in the Company�s fiscal year-end from November�30 to December�31 of each year. This change to the calendar year reporting cycle began January�1, 2009. As a result of the change, the Company had a one-month transition period in December 2008. |
| (3) | Prior-period amounts have been recast for discontinued operations. See Notes 1 and 25 to the consolidated financial statements for information on discontinued operations. |
| (4) | Amounts shown are used to calculate earnings per basic and diluted common share. |
| (5) | For the calculation of basic and diluted earnings per common share, see Note 16 to the consolidated financial statements. |
| (6) | Book value per common share equals common shareholders� equity of $60,541 million at December�31, 2011, $47,614 million at December�31, 2010, $37,091 million at December�31, 2009, $31,676 million at November�30, 2008, $30,169 million at November�30, 2007 and $29,585 million at December�31, 2008, divided by common shares outstanding of 1,927�million at December�31, 2011, 1,512�million at December�31, 2010, 1,361�million at December�31, 2009, 1,048�million at November�30, 2008, 1,056�million at November�30, 2007 and 1,074�million at December�31, 2008. |
| (7) | These amounts exclude the current portion of long-term borrowings and include junior subordinated debt issued to capital trusts. |
Table of Contents| Item�7. | Management�s Discussion and Analysis of Financial Condition and Results of Operations. |
Table of Contents Executive Summary. Financial Information and Statistical Data (dollars in millions,
except where noted and per share amounts). | 2011 | 2010 | 2009(1) | ||||||||||
| Net revenues: | ||||||||||||
| Institutional Securities | $ | 17,208 | $ | 16,169 | $ | 12,742 | ||||||
| Global Wealth Management Group | 13,423 | 12,636 | 9,390 | |||||||||
| Asset Management | 1,887 | 2,685 | 1,294 | |||||||||
| Intersegment Eliminations | (115 | ) | (103 | ) | (146 | ) | ||||||
| Consolidated net revenues | $ | 32,403 | $ | 31,387 | $ | 23,280 | ||||||
| Net income | $ | 4,645 | $ | 5,702 | $ | 1,406 | ||||||
| Net income applicable to noncontrolling interests | 535 | 999 | 60 | |||||||||
| Net income applicable to Morgan Stanley | $ | 4,110 | $ | 4,703 | $ | 1,346 | ||||||
| Income (loss) from continuing operations applicable to Morgan Stanley: | ||||||||||||
| Institutional Securities | $ | 3,461 | $ | 3,766 | $ | 1,499 | ||||||
| Global Wealth Management Group | 665 | 519 | 283 | |||||||||
| Asset Management | 35 | 205 | (391 | ) | ||||||||
| Intersegment Eliminations | � | (12 | ) | (8 | ) | |||||||
| Income from continuing operations applicable to Morgan Stanley | $ | 4,161 | $ | 4,478 | $ | 1,383 | ||||||
| Amounts applicable to Morgan Stanley: | ||||||||||||
| Income from continuing operations applicable to Morgan Stanley | $ | 4,161 | $ | 4,478 | $ | 1,383 | ||||||
| Net gain (loss) from discontinued operations applicable to Morgan Stanley(2) | (51 | ) | 225 | (37 | ) | |||||||
| Net income applicable to Morgan Stanley | $ | 4,110 | $ | 4,703 | $ | 1,346 | ||||||
| Earnings (loss) applicable to Morgan Stanley common shareholders | $ | 2,067 | $ | 3,594 | $ | (907 | ) | |||||
| Earnings (loss) per basic common share: | ||||||||||||
| Income (loss) from continuing operations | $ | 1.28 | $ | 2.49 | $ | (0.73 | ) | |||||
| Net gain (loss) from discontinued operations(2) | (0.03 | ) | 0.15 | (0.04 | ) | |||||||
| Earnings (loss) per basic common share(3) | $ | 1.25 | $ | 2.64 | $ | (0.77 | ) | |||||
| Earnings (loss) per diluted common share: | ||||||||||||
| Income from continuing operations | $ | 1.26 | $ | 2.45 | $ | (0.73 | ) | |||||
| Net gain (loss) from discontinued operations(2) | (0.03 | ) | 0.18 | (0.04 | ) | |||||||
| Earnings (loss) per diluted common share(3) | $ | 1.23 | $ | 2.63 | $ | (0.77 | ) | |||||
| Regional net revenues(4): | ||||||||||||
| Americas | $ | 22,331 | $ | 21,477 | $ | 18,798 | ||||||
| Europe, Middle East and Africa | 6,761 | 5,590 | 2,486 | |||||||||
| Asia | 3,311 | 4,320 | 1,996 | |||||||||
| Net revenues | $ | 32,403 | $ | 31,387 | $ | 23,280 | ||||||
Table of Contents Financial Information and Statistical Data (dollars in millions, except where noted and per
share amounts)�(Continued). | 2011 | 2010 | 2009(1) | ||||||||||
| Average common equity (dollars in billions)(5): | ||||||||||||
| Institutional Securities | $ | 26.2 | $ | 17.7 | $ | 18.1 | ||||||
| Global Wealth Management Group | 7.6 | 6.8 | 4.6 | |||||||||
| Asset Management | 2.2 | 2.1 | 2.2 | |||||||||
| Parent capital | 18.4 | 15.5 | 8.1 | |||||||||
| Total from continuing operations | 54.4 | 42.1 | 33.0 | |||||||||
| Discontinued operations | � | 0.3 | 1.1 | |||||||||
| Consolidated average common equity | $ | 54.4 | $ | 42.4 | $ | 34.1 | ||||||
| Return on average common equity(5): | ||||||||||||
| Institutional Securities(5) | 7 | % | 19 | % | N/A | |||||||
| Global Wealth Management Group | 6 | % | 7 | % | N/A | |||||||
| Asset Management | N/M | 8 | % | N/A | ||||||||
| Consolidated | 4 | % | 9 | % | N/M | |||||||
| Book value per common share(6) | $ | 31.42 | $ | 31.49 | $ | 27.26 | ||||||
| Tangible common equity(7) | $ | 53,850 | $ | 40,667 | $ | 29,479 | ||||||
| Tangible book value per common share(8) | $ | 27.95 | $ | 26.90 | $ | 21.67 | ||||||
| Effective income tax rate provision from continuing operations(9) | 23.2 | % | 12.1 | % | (26.2 | )% | ||||||
| Worldwide employees | 61,899 | 62,542 | 60,494 | |||||||||
| Average liquidity (dollars in billions)(10): | ||||||||||||
| Parent company liquidity | $ | 78 | $ | 65 | $ | 61 | ||||||
| Bank and other subsidiaries liquidity | 99 | 94 | 93 | |||||||||
| Total liquidity | $ | 177 | $ | 159 | $ | 154 | ||||||
| Capital ratios at December�31, 2011, 2010 and 2009(11): | ||||||||||||
| Total capital ratio | 17.8 | % | 16.0 | % | 16.2 | % | ||||||
| Tier 1 common capital ratio | 13.0 | % | 10.2 | % | 8.1 | % | ||||||
| Tier 1 capital ratio | 16.6 | % | 15.5 | % | 15.2 | % | ||||||
| Tier 1 leverage ratio | 6.8 | % | 6.6 | % | 5.8 | % | ||||||
| Consolidated assets under management or supervision (dollars in billions)(12): | ||||||||||||
| Asset Management(13) | $ | 287 | $ | 272 | $ | 259 | ||||||
| Global Wealth Management Group | 494 | 477 | 379 | |||||||||
| Total | $ | 781 | $ | 749 | $ | 638 | ||||||
| Institutional Securities: | ||||||||||||
| Pre-tax profit margin(14) | 27 | % | 27 | % | 10 | % | ||||||
| Global Wealth Management Group: | ||||||||||||
| Global representatives(15) | 17,649 | 18,440 | 18,284 | |||||||||
| Annualized revenues per global representative (dollars in thousands)(15)(16) | $ | 744 | $ | 686 | $ | 664 | ||||||
| Assets by client segment (dollars in billions): | ||||||||||||
| $10 million or more | $ | 510 | $ | 522 | $ | 453 | ||||||
| $1 million to $10 million | 709 | 707 | 637 | |||||||||
| Subtotal $1 million or more | 1,219 | 1,229 | 1,090 | |||||||||
| $100,000 to $1 million | 388 | 399 | 418 | |||||||||
| Less than $100,000 | 42 | 41 | 52 | |||||||||
| Total client assets | $ | 1,649 | $ | 1,669 | $ | 1,560 | ||||||
Table of Contents Financial Information and Statistical Data (dollars in millions, except where noted and per
share amounts)�(Continued). | 2011 | 2010 | 2009(1) | ||||||||||
| Fee-based assets as a percentage of total client assets | 30 | % | 28 | % | 24 | % | ||||||
| Client assets per global representative(15)(17) | $ | 93 | $ | 91 | $ | 85 | ||||||
| Global retail net new assets (dollars in billions) | $ | 35.8 | $ | 22.9 | $ | (15.3 | ) | |||||
| Global fee-based asset flows (dollars in billions) | $ | 42.5 | $ | 32.7 | $ | 13.4 | ||||||
| Bank deposits (dollars in billions)(18) | $ | 111 | $ | 113 | $ | 112 | ||||||
| Global retail locations | 765 | 851 | 930 | |||||||||
| Pre-tax profit margin(14) | 10 | % | 9 | % | 6 | % | ||||||
| Asset Management: | ||||||||||||
| Assets under management or supervision (dollars in billions) | $ | 287 | $ | 272 | $ | 259 | ||||||
| Pre-tax profit margin(14) | 13 | % | 27 | % | N/M | |||||||
| (1) | Information includes MSSB effective from May�31, 2009 (see Note 3 to the consolidated financial statements). |
| (2) | See Notes 1 and 25 to the consolidated financial statements for information on discontinued operations. |
| (3) | For the calculation of basic and diluted earnings per share (�EPS�), see Note 16 to the consolidated financial statements. |
| (4) | Regional net revenues include the impact of the fluctuation in the Company�s credit spreads and other credit factors (�Debt-Related Credit Spreads�) on certain of the Company�s long-term and short-term borrowings, primarily structured notes, (�Borrowings�) that are accounted for at fair value. |
| (5) | Average common equity is a non-Generally Accepted Accounting Principle (�GAAP�) financial measure that the Company considers to be a useful measure to the Company and investors to assess operating performance. The computation of average common equity for each business segment is determined using the Company�s Required Capital framework (�Required Capital Framework�), an internal capital adequacy measure (see �Liquidity and Capital Resources�Required Capital� herein). The Required Capital Framework will evolve over time to respond to changes in the business and regulatory environment and to incorporate enhancements in modeling techniques. The Company continues to evaluate the framework with respect to the impact of future regulatory requirements, as appropriate (see �Liquidity and Capital Resources�Regulatory Requirements� herein for further information on risk-based capital, leverage and liquidity standards, known as �Basel III,� which were proposed by the Basel Committee on Banking Supervision (the �Basel Committee�) in December 2009). The calculation of return on average common equity uses income from continuing operations applicable to Morgan Stanley less preferred dividends as a percentage of average common equity. For 2011, the negative adjustment related to the MUFG stock conversion (see �Executive Summary�Significant Items�MUFG Stock Conversion� herein) of $1,726 million was included in the calculation of the return on average common equity. Excluding this negative adjustment, the return on average common equity for 2011 would have been 12% for the Institutional Securities business segment; 8% for the Global Wealth Management Group business segment; and 1% for the Asset Management business segment. See �Liquidity and Capital Resource�Required Capital� herein for more information on the calculation of the average common equity by business segment. The effective tax rates used in the computation of business segment return on average common equity were determined on a separate entity basis. Excluding the effects of the aggregate discrete tax benefit for 2011, the return on average common equity for the Institutional Securities business segment would have been 5%, (see �Executive Summary�Significant Items� herein). |
| (6) | Book value per common share equals common shareholders� equity of $60,541 million at December�31, 2011, $47,614 million at December�31, 2010 and $37,091 million at December�31, 2009 divided by common shares outstanding of 1,927�million at December�31, 2011, 1,512�million at December�31, 2010 and 1,361�million at December�31, 2009. Book value per common share in 2011 was reduced by approximately $2.61 per share as a result of the MUFG stock conversion (see �Significant Items�MUFG Stock Conversion� herein). Book value per common share in 2010 included a benefit of approximately $1.40 per share due to the issuance of 116�million shares of common stock in 2010 corresponding to the mandatory redemption of the junior subordinated debentures underlying $5.6 billion of equity units (see �Other Matters�Redemption of CIC Equity Units and Issuance of Common Stock� herein). |
| (7) | Tangible common equity is a non-GAAP financial measure that the Company considers to be a useful measure that the Company and investors use to assess capital adequacy. For a discussion of tangible common equity, see �Liquidity and Capital Resources�The Balance Sheet� herein. |
| (8) | Tangible book value per common share is a non-GAAP financial measure that the Company considers to be a useful measure that the Company and investors use to assess capital adequacy. Tangible book value per common share equals tangible common equity divided by period-end common shares outstanding. |
| (9) | For a discussion of the effective income tax rate, see �Executive Summary�Significant Items� herein. |
| (10) | For a discussion of average liquidity, see �Liquidity and Capital Resources�Liquidity and Trading Management�Global Liquidity Reserve� herein. |
| (11) | On December�30, 2011, the Board of Governors of the Federal Reserve System (the �Federal Reserve�) formalized regulatory definitions for Tier 1 common capital and Tier 1 common capital ratio.�The Company�s conformance to the Federal Reserve�s definition under the |
Table of Contents| final rule reduced its Tier 1 common capital and Tier 1 common ratio by approximately $4.2 billion and 132 basis points, respectively, at December�31, 2011. The Company�s Total capital ratio,�Tier 1 common�capital ratio and Tier 1 capital ratio at December�31, 2010 and 2009 have also been adjusted based on revised guidance from the Federal Reserve about the Company�s capital treatment for over-the-counter (�OTC�) derivative collateral. For a discussion of Total capital ratio, Tier 1 common capital ratio, Tier 1 capital ratio and Tier 1 leverage ratio, see �Liquidity and Capital Resources�Regulatory Requirements� herein. |
| (12) | Revenues and expenses associated with these assets are included in the Company�s Global Wealth Management Group and Asset Management business segments. |
| (13) | Amounts exclude the Asset Management business segment�s proportionate share of assets managed by entities in which it owns a minority stake. |
| (14) | Pre-tax profit margin is a non-GAAP financial measure that the Company considers to be a useful measure that the Company and investors use to assess operating performance. Percentages represent income from continuing operations before income taxes as a percentage of net revenues. |
| (15) | As the business finalizes the integration of its legacy Morgan Stanley and Smith Barney channels in 2012, it is harmonizing what were previously different job descriptions for various licensed roles involved in serving the Company�s clients. This adjustment will be reflected in the prospective reporting of global representative headcount as role definition differences are eliminated in the combined sales organization. Amounts represent global representative headcount and productivity metrics reflecting this adjustment. |
| (16) | Annualized net revenues per global representative for 2011, 2010 and 2009 equals Global Wealth Management Group�s net revenues divided by the quarterly weighted average global representative headcount for 2011, 2010 and 2009, respectively. |
| (17) | Client assets per global representative equal total period-end client assets divided by period-end global representative headcount. |
| (18) | Approximately $56�billion, $55 billion and $54 billion of the bank deposit balances at December�31, 2011, 2010 and 2009, respectively, are held at Company-affiliated depositories with the remainder held at Citigroup, Inc. (�Citi�) affiliated depositories. These deposit balances are held at certain of the Company�s Federal Deposit Insurance Corporation (the �FDIC�) insured depository institutions for the benefit of the Company�s clients through their accounts. For additional information regarding the Company�s deposits, see Note 10 to the consolidated financial statements and �Liquidity and Capital Resources�Funding Management�Deposits� herein. |
Table of Contents Ireland, Italy, Portugal and Spain (the �European Peripherals�), and the sovereign debt exposures in the European banking system. The euro area unemployment rate increased to 10.4% at
December�31, 2011 from 10.0% a year ago. At December�31, 2011, the European Central Bank�s (�ECB�) benchmark interest rate was 1.00%, and the Bank of England�s (�BOE�) benchmark interest rate was 0.50%, both
of which were unchanged from a year ago. In 2011, the BOE increased the size of its quantitative easing program by �75 billion to �275 billion in order to inject further monetary stimulus into the economy in the United Kingdom
(�U.K.�). To stabilize the European banking system during the sovereign debt crisis, the ECB initiated a number of actions during the fourth quarter of 2011. The ECB made longer-term loans available to banks in exchange for posting of
adequate collateral in October and December of 2011 for maturities up to 13 months, ensuring that European banks have unlimited financing into 2013. Starting in November 2011, the ECB also bought �40 billion in European bank bonds backed by
mortgages and other assets, known as covered bonds, a key source of funds for banks. On October�27, 2011, leaders of 17 European Union countries announced a financial relief plan that involves a write-off of certain sovereign debt by European
banks and other measures aimed to resolve the European sovereign debt crisis. In December 2011, European leaders agreed to sign an inter-government treaty that would require them to enforce stricter fiscal and financial discipline in their future
budgets. In January and February 2012, rating agencies downgraded the credit ratings for several euro-zone countries. In Asia, major stock markets closed out 2011 sharply lower compared with the beginning of the year, primarily due to investors� concerns over the
sovereign debt crisis in Europe and slowing economic growth in Asia. Japan�s economy continued to recover from the adverse impact of the earthquake and tsunami in March of 2011. In 2011, the Bank of Japan enhanced monetary easing by increasing
the size of the asset purchase program to 50 trillion yen from 40 trillion yen. Japan�s benchmark interest rate remained within a range of zero to 0.1% during 2011. China�s gross domestic product growth moderated during 2011 as import and
export growth slowed sharply after domestic tightening measures and global economic turmoil impacted consumption. To combat rising inflation, the People�s Bank of China (the �PBOC�) raised benchmark interest rates by 0.25% three times
in 2011. In December 2011, in order to stimulate the Chinese economy, the PBOC cut its bank reserve requirement by 0.5%. Overview of 2011 Financial Results. Consolidated Results .����The Company recorded net income applicable to Morgan Stanley of $4,110 million on net revenues of
$32,403 million in 2011, compared with $4,703 million of net income applicable to Morgan Stanley and net revenues of $31,387 million in 2010. Net revenues in 2011 included positive revenue of $3,681 million, or $1.34 per diluted share, due to the impact of the widening of the Company�s
Debt-Related Credit Spreads on Borrowings that are accounted for at fair value, compared with negative revenues of $873 million in 2010 due to the impact of the tightening of the Company�s Debt-Related Credit Spreads on Borrowings that were
accounted for at fair value. Results for 2011 included the settlement with MBIA Insurance Corporation (�MBIA�), which resulted in a pre-tax loss of approximately $1.7 billion. In addition, the Company recorded a pre-tax loss of
approximately $783 million arising from its 40% stake in Mitsubishi UFJ Morgan Stanley Securities Co., Ltd. (�MUMSS�). See �Executive Summary�Significant Items�Income Tax Benefits,� �Executive
Summary�Significant Items�Japanese Securities Joint Venture,� and �Executive Summary�Significant Items�Monoline Insurers,� herein. Non-interest expenses increased 5% to $26,289 million in 2011. Non-compensation
expenses increased 7% in 2011. Diluted EPS and diluted EPS from
continuing operations were $1.23 and $1.26 in 2011, respectively, compared with $2.63 and $2.45, respectively, in 2010. The earnings per share calculation for 2011 included a negative adjustment of approximately $1.7 billion, or $0.98 per diluted
share (calculated using 1.79 billion diluted average shares outstanding under the if-converted method), related to the conversion of MUFG�s outstanding Series B Non-Cumulative Non-Voting Perpetual Convertible Preferred Stock (�Series B
Preferred Stock�) into the Company�s common stock. See �Executive Summary�Significant Items�MUFG Stock Conversion� herein. 51 Table of Contents The Company�s effective tax rates from continuing operations were 23.2% and 12.1% for 2011 and 2010,
respectively. The effective tax rates included aggregate discrete tax benefits of $484 million and $997 million for 2011 and 2010, respectively. Excluding these discrete tax benefits, the effective tax rates from continuing operations in 2011 and
2010 would have been 31.1% and 28.1%, respectively. The increase in the effective tax rate is primarily reflective of the geographic mix of earnings. For further discussion of the current and prior year discrete tax benefits, see �Executive
Summary�Significant Items�Income Tax Benefits� herein. Institutional Securities .����Income from continuing operations before income taxes was $4,585 million in 2011 compared with $4,372 million in 2010. Net revenues were $17,208
million in 2011 compared with $16,169 million in 2010. Investment banking revenues for 2011 decreased 2% to $4,228 million from 2010, reflecting lower revenues from equity and fixed income underwriting transactions, partially offset by higher
advisory revenues. Investment banking revenues were also impacted by the contribution in 2010�of the majority of the�Company�s�Japanese investment banking�business as a result of a transaction with MUFG (see �Other
Matters�Japanese Securities Joint Venture� herein).�Equity sales and trading revenues increased 40% to $6,770 million in 2011. The increase was due to higher revenues, primarily reflecting higher levels of client activity, higher
average client balances and positive revenue of $619 million due to the impact of the widening of the Company�s Debt-Related Credit Spreads on Borrowings that are accounted for at fair value compared with negative revenue of approximately $121
million in 2010 due to the impact of the tightening of the Company�s Debt-Related Credits Spreads on Borrowings that were accounted for at fair value. Fixed income and commodities sales and trading revenues increased 27% to $7,507 million in
2011 compared with $5,900 million in 2010. Results in 2011 included positive revenue of $3,062 million due to the impact of the widening of the Company�s Debt-Related Credit Spreads on Borrowings that are accounted for at fair value, compared
with negative revenues of $703 million in 2010 due to the impact of the tightening of the Company�s Debt-Related Credit Spreads on Borrowings that were accounted for at fair value. Fixed income revenues were negatively impacted by losses of
$1,838 million from Monoline Insurers (�Monolines�) compared with losses of $865 million in 2010. The results in 2011 included the $1.7 billion settlement with MBIA (see �Executive Summary�Significant Items�Monoline
Insurers,� herein). The results in 2011 also included approximately $600 million primarily related to the release of credit valuation adjustments upon the restructuring of certain derivatives transactions which decreased its exposure to the
European Peripherals. Other sales and trading net losses of $1.3 billion primarily reflected losses associated with corporate lending activity and costs related to liquidity held. Principal transactions net investment gains of $239 million were
recognized in 2011 compared with net investment gains of $809 million in 2010. Other losses of $207 million were recognized in 2011 compared with other revenues of $766 million in 2010. In 2011, pre-tax losses of approximately $783 million were from
the Company�s 40% stake in MUMSS, partially offset by gains from the Company�s retirement of its debt. Non-interest expenses increased 7% and Compensation and benefits expenses increased 3% in 2011. Non-compensation expenses increased 12%
in 2011, which included a 44% increase in Other expenses. The increase in Other expenses was primarily due to the initial costs of $130 million associated with Morgan Stanley Huaxin Securities Company Limited, and a charge of $59 million due to the
bank levy on relevant liabilities and equities on the consolidated balance sheets of �U.K. Banking Groups,� at December�31, 2011 as defined under the bank levy legislation enacted by the U.K. government in July 2011 (see
�Executive Summary�Significant Items�U.K. Matters� herein for further information). Global Wealth Management Group .����Income from continuing operations before income taxes was $1,276 million in 2011 compared with $1,156 million in 2010. Net revenues were
$13,423 million in 2011 compared with $12,636 million in 2010. Investment banking revenues decreased 9% to $750 million in 2011, primarily due to lower equity and fixed income underwriting activities. Principal transactions trading revenues
decreased 14% to $1,122 million in 2011, primarily due to losses related to investments associated with certain employee deferred compensation plans and lower revenues from corporate equity and fixed income securities, government securities and
structured notes, partially offset by higher revenues from municipal securities, derivatives and unit trusts. Asset management, distribution and administration fees increased 8% to $6,884 million in 2011, primarily 52 Table of Contents due to higher fee-based revenues, partially offset by lower revenues as a result of the change in classification of the fees generated by the bank deposit program. Net interest increased 32% to
$1,483 million in 2011, primarily resulting from an increase in Interest income due to interest on the securities available for sale portfolio and mortgages and the change in classification of the fees generated by the bank deposit program. Other
revenues increased 22% to $410 million in 2011, primarily due to gains on sales of securities available for sale. Non-interest expenses increased 6% to $12,147 million in 2011. Asset Management .����Income from continuing
operations before income taxes was $253 million in 2011 compared with $718 million in 2010. Net revenues were $1,887 million in 2011 compared with $2,685 million in 2010. Principal transactions net investment gains were $330 million in 2011 compared
with gains of $996 million in 2010. The decrease in 2011 was primarily related to lower net gains in the Company�s Merchant Banking and Traditional Asset Management businesses, including certain investments associated with the Company�s
employee deferred compensation and co-investment plans, as well as lower net investment gains associated with certain consolidated real estate funds sponsored by the Company. Asset management, distribution and administration fees decreased 3% to
$1,582 million in 2011, primarily reflecting�lower performance fees and fund management and administration fees, primarily due to the absence of FrontPoint Partners LLC (�FrontPoint�) for ten months of the current year. Non-interest
expenses decreased 17% to $1,634 million in 2011, primarily reflecting a decrease in compensation expenses. Significant Items. Morgan Stanley Debt .����Net revenues reflected positive revenues of $3,681 million in 2011 and negative revenues of $873 million and $5.5 billion in 2010 and 2009, respectively,
related to the impact of changes in the Company�s Debt-Related Credit Spreads on Borrowings that are accounted for at fair value. In addition, in 2011, 2010 and 2009, the Company recorded gains (losses) of approximately $155 million, $(27) million and $491 million, respectively,
related to the Company�s retirement of its debt. The results in 2009 also reflected the amortization of the value of the de-designated hedges related to the Company�s retirement of its debt. Monoline Insurers .����The results for 2011
included losses of $1,838 million related to the Company�s counterparty credit exposures to Monolines, principally MBIA, compared with losses of $865 million in 2010 and $232 million in 2009. On December�13, 2011, the Company announced a comprehensive settlement
with MBIA. The settlement terminated outstanding credit default swap (�CDS�) protection purchased from MBIA on commercial mortgage-backed securities (�CMBS�) and resolved pending litigation between the two parties for
consideration of a net cash payment to the Company. The pre-tax loss on the settlement, which was recorded as a reduction to Fixed income and commodities revenue, approximated $1.7 billion ($1.1 billion after-tax) in the fourth quarter of 2011. The
settlement has the effect of significantly reducing risk-weighted assets under the Basel Committee�s proposed Basel III framework, thereby increasing the pro forma Tier 1 common ratio under Basel III by approximately 75 basis points by the end
of 2012. The pro forma Tier 1 common capital ratio under Basel III is a non-GAAP financial measure that the Company considers to be a useful measure that the Company and investors use to assess capital adequacy. The Basel III estimates are
preliminary and may change based on guidelines for implementation to be issued by the Federal Reserve. Under current Basel I standards, the Tier 1 common ratio was reduced by approximately 20 basis points. MUFG Stock Conversion .����On June�30, 2011,
MUFG�s outstanding Series B Preferred Stock with a face value of $7.8 billion (carrying value $8.1 billion) and a 10% dividend was converted into 385,464,097 shares of the Company�s common stock, including approximately 75�million
shares resulting from the adjustment to the conversion ratio pursuant to the transaction agreement. As a result of the adjustment to the conversion ratio, the Company incurred a one-time, non-cash negative adjustment of approximately $1.7 billion in
its calculation of basic and diluted earnings per share during 2011. As a result of the conversion, MUFG did not receive the previously declared dividend that otherwise would have been payable on July�15, 2011 with respect to the Series B
Preferred Stock. 53 Table of Contents Japanese Securities Joint Venture .����During 2011 and 2010, the Company recorded
losses of $783 million and $62 million, respectively, within Other revenues in the consolidated statements of income, arising from the Company�s 40% stake in MUMSS (see Note 24 to the consolidated financial statements). See �Other
Matters�Japanese Securities Joint Venture� herein for further information. Corporate Lending .����The Company recorded the following amounts primarily associated with loans and lending commitments carried at fair value within the Institutional
Securities business segment (see �Business Segments�Institutional Securities�Sales and Trading Revenues� herein): | 2011(1) | 2010(1) | 2009(1) | ||||||||||
| (dollars in billions) | ||||||||||||
| Gains (losses) on loans and lending commitments | $ | (0.8 | ) | $ | 0.3 | $ | 4.0 | |||||
| Gains (losses) on hedges | 0.1 | (0.7 | ) | (3.2 | ) | |||||||
| Total gains (losses) | $ | (0.7 | ) | $ | (0.4 | ) | $ | 0.8 | ||||
| (1) | Amounts include realized and unrealized gains (losses). |
| 2011 | 2010 | 2009 | ||||||||||
| (dollars in billions) | ||||||||||||
| Institutional Securities: | ||||||||||||
| Continuing operations(1) | $ | 0.6 | $ | 0.2 | $ | (0.8 | ) | |||||
| Discontinued operations(2) | � | (1.2 | ) | � | ||||||||
| Total Institutional Securities | 0.6 | (1.0 | ) | (0.8 | ) | |||||||
| Asset Management: | ||||||||||||
| Continuing operations(3) | 0.2 | 0.5 | (0.5 | ) | ||||||||
| Discontinued operations(2) | � | � | (0.6 | ) | ||||||||
| Total Asset Management | 0.2 | 0.5 | (1.1 | ) | ||||||||
| Amounts applicable to noncontrolling interests | 0.2 | 0.5 | � | |||||||||
| Total | $ | 0.6 | $ | (1.0 | ) | $ | (1.9 | ) | ||||
| (1) | Amounts for 2011 include a tax benefit related to Revel Entertainment Group, LLC (�Revel�) (see �Executive Summary�Significant Items�Income Tax Benefits� herein), and net realized and unrealized gains (losses) from the Company�s limited partnership investments in real estate funds. |
| (2) | On February�17, 2011, the Company completed the sale of Revel. The results of Revel are reported as discontinued operations within the Institutional Securities business segment for all periods presented through the date of sale. In the Asset Management business segment, the amount related to the disposition of Crescent Real Estate Equities Limited Partnership (�Crescent�), which was disposed of in the fourth quarter of 2009. See Notes 1 and 25 to the consolidated financial statements. |
| (3) | Gains (losses) related to net realized and unrealized gains (losses) from real estate limited partnership investments in the Company�s Real Estate Investing business and are reflected in Principal transactions�Investments in the consolidated statements of income. Amounts also include net gains associated with the Company�s investment in Infrastructure funds. |
Table of Contents See �Other Matters�Real Estate� herein for further information. Income Tax Benefits .����In 2011, the Company
recognized a discrete tax benefit of $447 million from the remeasurement of a deferred tax asset and the reversal of a related valuation allowance. The deferred tax asset and valuation allowance were recognized in income from discontinued operations
in 2010 in connection with the recognition of a $1.2 billion loss due to writedowns and related costs following the Company�s commitment to a plan to dispose of Revel. The Company recorded the valuation allowance because the Company did not
believe it was more likely than not that it would have sufficient future net capital gain to realize the benefit of the expected capital loss to be recognized upon the disposal of Revel. During the quarter ended March�31, 2011, the disposal of
Revel was restructured as a tax-free like kind exchange and the disposal was completed. The restructured transaction changed the character of the future taxable loss to ordinary. The Company reversed the valuation allowance because the Company
believes it is more likely than not that it will have sufficient future ordinary taxable income to recognize the recorded deferred tax asset. In accordance with the applicable accounting literature, this reversal of a previously established
valuation allowance due to a change in circumstances was recognized in income from continuing operations during the quarter ended March�31, 2011. Additionally, in 2011 the Company recognized a discrete tax benefit of $137 million related to the
reversal of U.S. deferred tax liabilities associated with prior-years� undistributed earnings of certain non-U.S. subsidiaries that were determined to be indefinitely reinvested abroad, and a discrete tax cost of $100 million related to the
remeasurement of Japan deferred tax assets as a result of a decrease in the local statutory income tax rates starting in 2012. In 2010, the Company recognized discrete tax benefits of $382 million related to the reversal of U.S. deferred tax liabilities associated with
prior-years� undistributed earnings of certain non-U.S. subsidiaries that were determined to be indefinitely reinvested abroad, $345 million associated with the remeasurement of net unrecognized tax benefits and related interest based on new
information regarding the status of federal and state examinations, and $277 million associated with the planned repatriation of non-U.S. earnings at a cost lower than originally estimated. Huaxin Securities Joint Venture .����In June 2011, the Company�and Huaxin Securities
Co.,�Ltd. (�Huaxin Securities�) (also known as China Fortune Securities Co.,�Ltd.) jointly announced the operational commencement of their securities joint venture in China. During 2011, the Company recorded initial costs of $130
million related to the formation of this joint venture in Other expenses in the consolidated statement of income. The joint venture, Morgan Stanley Huaxin Securities Company Limited, is registered and principally located in Shanghai. Huaxin Securities holds a two-thirds interest in the joint venture while�the
Company owns a one-third interest. The establishment of the joint venture allows the Company�to further build on its�established onshore businesses in China. The joint venture�s businesses include underwriting and sponsorship of
shares in the domestic China market (including A shares and foreign investment shares) as well as underwriting, sponsorship and principal trading of bonds (including government and corporate bonds). OIS Fair Value Measurement .����In the fourth
quarter of 2010, the Company began using�the overnight indexed swap (�OIS�) curve�as an input to value its�collateralized interest rate derivative contracts. During the fourth quarter of 2011, the Company recognized a
pre-tax�loss of�approximately $108 million in Principal transactions�Trading upon application of the OIS curve to certain additional fixed income products within the Institutional Securities business segment. Previously, the Company
discounted these contracts�based on the London Interbank Offered Rate (�LIBOR�). At December�31, 2011, substantially all of the Company�s collateralized derivative contracts were valued using the OIS curve. The Company
recognized a pre-tax gain of approximately $176 million in the fourth quarter of 2010 in Principal transactions�Trading upon the initial application of the OIS curve. U.K. Matters .����In July 2011, the U.K. Government
enacted legislation imposing a bank levy on relevant liabilities and equities at December�31, 2011 on the consolidated balance sheets of banks and banking groups operating in the U.K. The Company has accrued a levy charge of $59 million for the
year ended December�31, 2011. The levy is not deductible for U.K.�corporation tax purposes. During 2010, the�Company�recognized a charge�of approximately $272 million in Compensation and benefits expense relating to the U.K.
government�s payroll tax on discretionary above-base compensation. 55 Table of Contents Goodwill and Intangibles .����Impairment charges related to goodwill and
intangible assets were $7 million, $201 million and $16 million in 2011, 2010 and 2009, respectively. The impairment charges for 2010 included $193 million related to FrontPoint. See Note 9 to the consolidated financial statements. Mortgage-Related Trading .����The Company recorded
mortgage-related trading gains (losses) primarily related to commercial mortgage-backed securities, U.S. subprime mortgage proprietary trading exposures and non-subprime residential mortgages of $1.2 billion and $(0.6) billion in 2010 and 2009,
respectively. Settlement with
DFS .����On June�30, 2007, the Company completed the spin-off of its business segment Discover Financial Services (�DFS�) to its shareholders. On February�11, 2010, DFS paid the Company $775 million in
complete satisfaction of its obligations to the Company regarding the sharing of proceeds from a lawsuit against Visa and MasterCard. The payment was recorded as a gain in discontinued operations in the consolidated statement of income for 2010. Gain on Sale of Noncontrolling
Interest .����In connection with the transaction between the Company and MUFG to form a joint venture in Japan, the Company recorded an after-tax gain of $731 million from the sale of a noncontrolling interest in its Japanese
institutional securities business. This gain was recorded in Paid-in capital in the Company�s consolidated statements of financial condition at December�31, 2010 and changes in total equity for 2010. See �Other Matters�Japanese
Securities Joint Venture� herein for further information. Gain on Sale of Retail Asset Management .����On June�1, 2010, the Company completed the sale of substantially all of its
retail asset management business (�Retail Asset Management�), including Van Kampen Investments, Inc. (�Van Kampen�), to Invesco Ltd. (�Invesco�). The Company received $800 million in cash and approximately
30.9�million shares of Invesco stock upon sale, resulting in a cumulative after-tax gain of $710 million, of which $28 million and $570 million were recorded in 2011 and 2010, respectively. The remaining gain, representing tax basis benefits,
was recorded in the quarter ended December�31, 2009. The results of Retail Asset Management are reported as discontinued operations within the Asset Management business segment for all periods presented through the date of sale. The Company
recorded the 30.9�million shares as securities available for sale and subsequently sold the shares in the fourth quarter of 2010, resulting in a realized gain of approximately $102 million reported within Other revenues in the consolidated
statement of income for 2010. Sale of Stake in
CICC .����In December 2010, the Company completed the sale of its 34.3% stake in China International Capital Corporation (�CICC�) for a pre-tax gain of approximately $668 million, which is included within Other
revenues in the consolidated statements of income for 2010. See Note 24 to the consolidated financial statements. Sale of Bankruptcy Claims .����In 2009, the Company recorded a gain of $319 million related to the sale of undivided participating interests in a portion of the Company�s
claims against a derivative counterparty that filed for bankruptcy protection (see Note 18 to the consolidated financial statements). MSCI .����In�May 2009, the Company�divested all of its remaining ownership interest in MSCI Inc. (�MSCI�).
The gain on sale, net of taxes, was approximately $279 million related to the secondary offerings for 2009. The results of MSCI are reported as discontinued operations for all periods presented through the date of sale. The results of MSCI were
formerly included in the continuing operations of the Institutional Securities business segment. Business Segments. Substantially all of the Company�s operating revenues and operating expenses can be directly attributed to its business segments. Certain revenues and expenses have been allocated to each business
segment, generally in proportion to its respective revenues or other relevant measures. 56 Table of Contents As a result of treating certain intersegment transactions as transactions with external parties, the Company
includes an Intersegment Eliminations category to reconcile the business segment results to the Company�s consolidated results. Intersegment Eliminations also reflect the effect of fees paid by the Institutional Securities business segment to
the Global Wealth Management Group business segment related to the bank deposit program. The Company did not recognize any Intersegment Elimination gains or losses in 2011. Losses from continuing operations before income taxes recorded in
Intersegment Eliminations were $15 million and $11 million in 2010 and 2009, respectively. Net Revenues. Principal Transactions�Trading .����Principal transactions�Trading revenues include revenues from customers� purchases and sales of financial instruments in which
the Company acts as principal and gains and losses on the Company�s positions, as well as proprietary trading activities for its own account. Principal transactions�Trading revenues includes the realized gains and losses from sales of cash
instruments and derivative settlements, unrealized gains and losses from ongoing fair value changes of the Company�s positions related to market-making activities, and gains and losses related to investments associated with certain employee
deferred compensation plans. In many markets, the realized and unrealized gains and losses from the purchase and sale transactions will include any spreads between bids and offers. Certain fees received on loans carried at fair value and dividends
from equity securities are also recorded in this line item since they relate to market-making positions. Commissions received for purchasing and selling listed equity securities and options are recorded separately in the Commissions and fees line
item. Other cash and derivative instruments typically do not have fees associated with them and fees for related services would be recorded in Commissions and fees. Principal Transactions�Investments .����The
Company�s investments generally are held for long-term appreciation and generally are subject to significant sales restrictions. Estimates of the fair value of the investments may involve significant judgment and may fluctuate significantly
over time in light of business, market, economic and financial conditions generally or in relation to specific transactions. In some cases, such investments are required or are a necessary part of offering other products. The revenues recorded are
the result of realized gains and losses from sales and unrealized gains and losses from ongoing fair value changes of the Company�s holdings as well as from investments associated with certain employee deferred compensation plans. Typically,
there are no fee revenues from these investments. The sales restrictions on the investments relate primarily to redemption and withdrawal restrictions on investments in real estate funds, hedge funds, and private equity funds, which include
investments made in connection with certain employee deferred compensation plans (see Note 4 to the consolidated financial statements). Restrictions on interests in exchanges and clearinghouses generally include a requirement to hold those interests
for the period of time that the Company is clearing trades on that exchange or clearinghouse. Additionally, there are certain principal investments related to assets held by consolidated real estate funds, which are primarily related to holders of
noncontrolling interests. Commissions and
Fees .����Commission and fee revenues primarily arise from agency transactions in listed and OTC equity securities, services related to sales and trading activities, and sales of mutual funds, futures, insurance products and
options. Asset Management, Distribution and Administration
Fees .����Asset management, distribution and administration fees include fees associated with the management and supervision of assets, account services and administration, performance-based fees relating to certain funds,
separately managed accounts, shareholder servicing, and the distribution of certain open-ended mutual funds. Asset management, distribution and administration fees in the Global Wealth Management Group business segment also include revenues from individual investors electing a fee-based pricing arrangement and
fees for investment management. Mutual fund distribution fees in the Global Wealth Management Group business segment are based on either the average daily fund net asset balances or average daily aggregate net fund sales and are affected by changes
in the overall level and mix of assets under management or supervision. 57 Table of Contents Asset management fees in the Asset Management business segment arise from investment management services the
Company provides to investment vehicles pursuant to various contractual arrangements. The Company receives fees primarily based upon mutual fund daily average net assets or based on monthly or quarterly invested equity for other vehicles.
Performance-based fees in the Asset Management business segment are earned on certain funds as a percentage of appreciation earned by those funds and, in certain cases, are based upon the achievement of performance criteria. These fees are normally
earned annually and are recognized on a monthly or quarterly basis. Net Interest .����Interest income and Interest expense are a function of the level and mix of total assets and liabilities,
including financial instruments owned and financial instruments sold, not yet purchased, securities available for sale, securities borrowed or purchased under agreements to resell, securities loaned or sold under agreements to repurchase, loans,
deposits, commercial paper and other short-term borrowings, long-term borrowings, trading strategies, customer activity in the Company�s prime brokerage business, and the prevailing level, term structure and volatility of interest rates.
Certain Securities purchased under agreements to resell (�reverse repurchase agreements�) and Securities sold under agreements to repurchase (�repurchase agreements�) and Securities borrowed and Securities loaned transactions may
be entered into with different customers using the same underlying securities, thereby generating a spread between the interest revenue on the reverse repurchase agreements or securities borrowed transactions and the interest expense on the
repurchase agreements or securities loaned transactions. Market Making. As a market maker, the Company stands ready to buy, sell or otherwise transact with customers under a variety of market conditions and provide firm or
indicative prices in response to customer requests. The Company�s liquidity obligations can be explicit and obligatory in some cases, and in others, customers expect the Company to be willing to transact with them. In order to most effectively
fulfill its market-making function, the Company engages in activities, across all of its trading businesses, that include, but are not limited to, (i)�taking positions in anticipation of, and in response to customer demand to buy or sell,
and�depending on the liquidity of the relevant market and the size of the position�holding those positions for a period of time; (ii)�managing and assuming basis risk (risk associated with imperfect hedging) between customized
customer risks and the standardized products available in the market to hedge those risks; (iii)�building, maintaining, and re-balancing inventory, through trades with other market participants, and engaging in accumulation activities to
accommodate anticipated customer demand; (iv)�trading in the market to remain current on pricing and trends; and (v)�engaging in other activities to provide efficiency and liquidity for markets. Interest income and expense are also
impacted by market-making activities as debt securities held by the Company earn interest and securities are loaned, borrowed, sold with agreement to repurchase and purchased with agreement to resell. 58 Table of Contents INSTITUTIONAL SECURITIES INCOME STATEMENT INFORMATION | 2011 | 2010 | 2009 | ||||||||||
| (dollars�in�millions) | ||||||||||||
| Revenues: | ||||||||||||
| Investment banking | $ | 4,228 | $ | 4,295 | $ | 4,455 | ||||||
| Principal transactions: | ||||||||||||
| Trading | 11,299 | 8,154 | 6,592 | |||||||||
| Investments | 239 | 809 | (864 | ) | ||||||||
| Commissions and fees | 2,610 | 2,274 | 2,152 | |||||||||
| Asset management, distribution and administration fees | 124 | 104 | 98 | |||||||||
| Other | (207 | ) | 766 | 415 | ||||||||
| Total non-interest revenues | 18,293 | 16,402 | 12,848 | |||||||||
| Interest income | 5,740 | 5,910 | 6,373 | |||||||||
| Interest expense | 6,825 | 6,143 | 6,479 | |||||||||
| Net interest | (1,085 | ) | (233 | ) | (106 | ) | ||||||
| Net revenues | 17,208 | 16,169 | 12,742 | |||||||||
| Compensation and benefits | 7,204 | 6,971 | 7,123 | |||||||||
| Non-compensation expenses | 5,419 | 4,826 | 4,380 | |||||||||
| Total non-interest expenses | 12,623 | 11,797 | 11,503 | |||||||||
| Income from continuing operations before income taxes | 4,585 | 4,372 | 1,239 | |||||||||
| Provision for (benefit from) income taxes | 880 | 316 | (256 | ) | ||||||||
| Income from continuing operations | 3,705 | 4,056 | 1,495 | |||||||||
| Discontinued operations: | ||||||||||||
| Income (loss) from discontinued operations | (199 | ) | (1,210 | ) | 246 | |||||||
| Provision for (benefit from) income taxes | (107 | ) | 10 | 185 | ||||||||
| Net gain (losses) on discontinued operations | (92 | ) | (1,220 | ) | 61 | |||||||
| Net income | 3,613 | 2,836 | 1,556 | |||||||||
| Net income applicable to noncontrolling interests | 244 | 290 | 12 | |||||||||
| Net income applicable to Morgan Stanley | $ | 3,369 | $ | 2,546 | $ | 1,544 | ||||||
| Amounts applicable to Morgan Stanley: | ||||||||||||
| Income from continuing operations | $ | 3,461 | $ | 3,766 | $ | 1,499 | ||||||
| Net gain (losses) from discontinued operations | (92 | ) | (1,220 | ) | 45 | |||||||
| Net income applicable to Morgan Stanley | $ | 3,369 | $ | 2,546 | $ | 1,544 | ||||||
Table of Contents On February�17, 2011, the Company completed the sale of Revel. The sale price approximated the carrying
value of Revel at the time of disposal and, accordingly, the Company did not recognize any pre-tax gain or loss on the sale. The results of Revel are reported as discontinued operations within the Institutional Securities business segment for all
periods presented through the date of sale. Results for 2010 included losses of approximately $1.2 billion in connection with writedowns and related costs of such disposition. For further information on Revel, see �Executive
Summary�Significant Items�Income Tax Benefits� herein and Notes 1 and 25 to the consolidated financial statements. In the third quarter of 2010, the Company completed the disposal of CityMortgage Bank (�CMB�), a Moscow-based mortgage bank. The results of CMB
are reported as discontinued operations for all periods presented through the date of sale within the Institutional Securities business segment. In May 2009, the Company divested all of its remaining ownership in MSCI. The results of MSCI are reported as discontinued operations for all periods
presented through the date of sale within the Institutional Securities business segment. Supplemental Financial Information. Investment Banking. Investment banking revenues are composed of fees from advisory services and revenues from the underwriting of securities offerings and syndication of loans, net of syndication expenses. Investment banking revenues were as follows: | 2011 | 2010 | 2009 | ||||||||||
| (dollars�in�millions) | ||||||||||||
| Advisory revenues | $ | 1,737 | $ | 1,470 | $ | 1,488 | ||||||
| Underwriting revenues: | ||||||||||||
| Equity underwriting revenues | 1,132 | 1,454 | 1,695 | |||||||||
| Fixed income underwriting revenues | 1,359 | 1,371 | 1,272 | |||||||||
| Total underwriting revenues | 2,491 | 2,825 | 2,967 | |||||||||
| Total investment banking revenues | $ | 4,228 | $ | 4,295 | $ | 4,455 | ||||||
| 2011(1) | 2010(1) | 2009(1) | ||||||||||
| (dollars�in�billions) | ||||||||||||
| Announced mergers and acquisitions(2) | $ | 447 | $ | 534 | $ | 588 | ||||||
| Completed mergers and acquisitions(2) | 640 | 354 | 643 | |||||||||
| Equity and equity-related offerings(3) | 47 | 80 | 67 | |||||||||
| Fixed income offerings(4) | 203 | 225 | 250 | |||||||||
| (1) | Source: Thomson Reuters, data at January�17-18, 2012. Announced and completed mergers and acquisitions volumes are based on full credit to each of the advisors in a transaction. Equity and equity-related offerings and fixed income offerings are based on full credit for single book managers and equal credit for joint book managers. Transaction volumes may not be indicative of net revenues in a given period. In addition, transaction volumes for prior periods may vary from amounts previously reported due to the subsequent withdrawal or change in the value of a transaction. |
| (2) | Amounts include transactions of $100 million or more and exclude terminated transactions. |
| (3) | Amounts include Rule 144A and public common stock offerings, convertible offerings and rights offerings. |
| (4) | Amounts include non-convertible preferred stock, mortgage-backed securities, asset-backed securities and taxable municipal debt. Amounts also include publicly registered and Rule 144A issues. Amounts exclude leveraged loans and self-led issuances. |
Table of Contents Sales and Trading. Sales and trading revenues are composed of Principal
transactions�Trading revenues; Commissions and fees; Asset management, distribution and administration fees; and Net interest revenues (expenses). See �Business Segments�Net Revenues� herein for further information about what is
included in sales and trading revenues. In assessing the profitability of its sales and trading activities, the Company views these net revenues in the aggregate. In addition, decisions relating to principal transactions are based on an overall
review of aggregate revenues and costs associated with each transaction or series of transactions. This review includes, among other things, an assessment of the potential gain or loss associated with a transaction, including any associated
commissions and fees, dividends, the interest income or expense associated with financing or hedging the Company�s positions, and other related expenses. See Note 12 to the consolidated financial statements for further information related to
gains (losses) on derivative instruments. Sales and trading
revenues were as follows: | 2011 | 2010(1) | 2009(1) | ||||||||||
| (dollars�in�millions) | ||||||||||||
| Principal transactions�Trading | $ | 11,299 | $ | 8,154 | $ | 6,592 | ||||||
| Commissions and fees | 2,610 | 2,274 | 2,152 | |||||||||
| Asset management, distribution and administration fees | 124 | 104 | 98 | |||||||||
| Net interest | (1,085 | ) | (233 | ) | (106 | ) | ||||||
| Total sales and trading revenues | $ | 12,948 | $ | 10,299 | $ | 8,736 | ||||||
| (1) | All prior year amounts have been reclassified to conform to the current year�s presentation. |
| 2011 | 2010(1) | 2009(1) | ||||||||||
| (dollars�in�millions) | ||||||||||||
| Equity | $ | 6,770 | $ | 4,840 | $ | 3,690 | ||||||
| Fixed income and commodities | 7,507 | 5,900 | 4,872 | |||||||||
| Other(2) | (1,329 | ) | (441 | ) | 174 | |||||||
| Total sales and trading revenues | $ | 12,948 | $ | 10,299 | $ | 8,736 | ||||||
| (1) | All prior-year amounts have been reclassified to conform to the current year�s presentation. |
| (2) | Other sales and trading net revenues include net gains (losses) from certain loans and lending commitments and related hedges associated with the Company�s lending activities. Other sales and trading net revenues also include gains (losses) on economic hedges related to the Company�s long-term debt and net losses associated with costs related to the amount of liquidity held (�negative carry�). |
Table of Contents Sales and Trading Revenues . Total sales and
trading revenues increased to $12,948 million in 2011 from $10,299 million in 2010, reflecting higher equity and fixed income and commodities sales and trading revenues, partially offset by higher losses in other sales and trading revenues. Equity .����Equity sales and trading
revenues increased 40% to $6,770 million in 2011 from 2010, primarily due to higher revenues in the derivatives business, the Company�s electronic trading platform and prime brokerage. The increase in the derivatives business and the
Company�s electronic trading platform primarily reflected higher levels of client activity. The increase in prime brokerage net revenues was primarily due to higher average client balances. The results in equity sales and trading revenues also
included positive revenue in 2011 of $619 million due to the impact of the widening of the Company�s Debt-Related Credit Spreads on Borrowings that are accounted for at fair value compared with negative revenue of $121 million in 2010 due to
the impact of the tightening of the Company�s Debt-Related Credit Spreads on Borrowings that were accounted for at fair value. In 2011, equity sales and trading revenues also reflected unrealized losses of $38 million related to changes in the fair value of net derivative
contracts attributable to the widening of counterparties� credit default swap spreads and other credit factors compared with unrealized gains of $20 million in 2010 due to the tightening of counterparties� credit default swap spreads and
other credit factors. The Company also recorded unrealized gains of $182 million in 2011 related to changes in the fair value of net derivative contracts attributable to the widening of the Company�s credit default swap spreads and other credit
factors compared with unrealized gains of $31 million in 2010. The unrealized gains and losses on credit default swap spreads and other credit factors do not reflect any gains or losses on related hedging instruments. Fixed Income and Commodities .����Fixed income and
commodities sales and trading revenues increased 27% to $7,507 million in 2011 from $5,900 million in 2010. Results in 2011 included positive revenue of $3,062 million due to the impact of the widening of the Company�s Debt-Related Credit
Spreads on Borrowings that are accounted for at fair value, compared with negative revenues of $703 million in 2010 due to the impact of the tightening of the Company�s Debt-Related Credit Spreads on Borrowings that were accounted for at fair
value. Fixed income revenues, excluding the Company�s Debt-Related Credit Spreads on Borrowings, in 2011 decreased 30% over 2010. Results in 2011 were negatively impacted by losses of $1,838 million from Monolines compared with losses of $865
million in 2010. On December�13, 2011, the Company announced a comprehensive settlement with MBIA. The loss on the settlement was approximately $1.7 billion in the fourth quarter of 2011 (see �Executive Summary�Significant
Items�Monoline Insurers� herein for further information). The results in 2011 also reflected lower revenues in credit products due to the stressed credit environment and lower revenues in currency products, partially offset by higher
revenues in interest rate products due to higher levels of market volatility and client activity and approximately $600 million primarily related to the release of credit valuation adjustments upon the restructuring of certain derivative
transactions which decreased its exposure to the European Peripherals (see �Executive Summary�Significant Items�European Peripheral Countries� herein for further information). Commodity revenues, excluding the Company�s
Debt-Related Credit Spreads on Borrowings, decreased 18% in 2011, primarily due to lower levels of client activity, including structured transactions. Results in the fourth quarter of 2011 included a loss of approximately $108 million upon
application of the OIS curve to certain fixed income products. Results in 2010 included a gain of approximately $123 million related to a change in the fair value measurement methodology to use the OIS curve as an input to value substantially all
collateralized interest rate derivative contracts (see �Executive Summary�Significant Items�OIS Fair Value Measurement� herein and Note 4 to the consolidated financial statements). In 2011, fixed income and commodities sales and trading revenues reflected
net unrealized gains of $1,625�million related to changes in the fair value of net derivative contracts attributable to the tightening of counterparties� credit default swap spreads and other credit factors compared with unrealized gains
of $603 million in 2010. The Company also recorded unrealized gains of $1,750�million in 2011 related to changes in the fair value of net derivative contracts attributable to the widening of the Company�s credit default swap spreads and
other credit factors compared with gains of $287 million in 2010. The unrealized gains and losses on credit default swap spreads and other credit factors do not reflect any gains or losses on related hedging instruments. 62 Table of Contents Other .����In addition to the equity and fixed income and commodities sales and
trading revenues discussed above, sales and trading revenues included other trading revenues, consisting of certain activities associated with the Company�s lending activities, gains (losses) on economic hedges related to the Company�s
long-term debt and negative carry. The fair value measurement of loans and lending commitments takes into account fee income that is considered an attribute of the contract. The valuation of these commitments could change in future periods depending
on, among other things, the extent that they are renegotiated or repriced or if the associated acquisition transaction does not occur. During 2011, the Company, in accordance with its risk management practices, accounted for certain new loans and
lending commitments as held for investment. Mark-to-market valuations were not recorded for these loans and lending commitments, but they were evaluated for collectability and an allowance for credit losses was recorded. Other sales and trading also
includes costs related to negative carry. In 2011, other sales
and trading revenues reflected a net loss of $1,329 million compared with a net loss of $441 million in 2010. Results in 2011 included net losses of $620 million associated with loans and lending commitments (mark-to-market valuations and realized
losses of $688 million and gains on related hedges of $68 million). The results in 2011 also included higher net losses related to negative carry. Results in 2010 also included a gain of approximately $53 million related to the OIS curve fair value
methodology referred to above (see �Executive Summary�Significant Items�OIS Fair Value Measurement� and Note 4 to the consolidated financial statements). Net Interest .����Net interest expense increased to
$1,085 million in 2011 from $233 million in 2010 primarily due to higher interest expenses that resulted from increased interest rates associated with the Company�s long term borrowings and stock lending transactions. Principal
Transactions�Investments . See �Business Segments�Net Revenues� herein for further information on what is included in Principal transactions�Investments. Principal transaction net investment gains of $239 million were recognized in
2011 compared with net investment gains of $809�million in 2010. Results in both periods reflected gains in principal investments in real estate funds and investments associated with certain employee deferred compensation plans and
co-investment plans. The results for 2010 also reflected a gain of $313 million on a principal investment held by a consolidated investment partnership, which was sold in 2010. The portion of the gain related to third-party investors amounted to
$183 million and was recorded in the net income applicable to noncontrolling interests in the consolidated statement of income. Other . Other losses of $207 million were recognized in 2011 compared with other revenues of $766
million in 2010. The results in 2011 primarily included pre-tax losses of approximately $783 million arising from the Company�s 40% stake in MUMSS (see �Executive Summary�Significant Items�Japanese Securities Joint Venture�
herein), partially offset by gains from the Company�s retirement of its long-term debt. Results in 2010 included a pre-tax gain of $668 million from the sale of the Company�s investment in CICC, partially offset by pre-tax losses of
approximately $62 million arising from the Company�s 40% stake in MUMSS. Non-interest Expenses . Non-interest expenses increased 7% in 2011. The increase was due to higher compensation expenses and higher
non-compensation expenses. Compensation and benefits expenses increased 3% in 2011. Compensation and benefits expenses in 2010 included a non-recurring charge of approximately $269 million related to the U.K. government�s payroll tax on
discretionary above-base compensation in 2010. Brokerage, clearing and exchange fees increased 14% in 2011, primarily due to higher levels of business activity. Information processing and communications expense increased 13% in 2011, primarily due
to ongoing investments in technology. Professional services expenses decreased 9% in 2011, primarily due to lower legal fees and consulting expenses. Other expenses increased 44% in 2011, primarily due to the initial costs of $130 million associated
with Morgan Stanley Huaxin Securities Company Limited and a charge of $59 million due to the bank levy on relevant liabilities and equities on the consolidated balance sheets of �U.K. Banking Groups� at 63 Table of Contents December�31, 2011 as defined under the bank levy legislation enacted by the U.K. government in July 2011 (see �Executive Summary�Significant Items�U.K. Matters� herein
for further information). Other expenses in 2010 included $102.7 million related to the Assurance of Discontinuance between the Company and the Office of the Attorney General for the Commonwealth of Massachusetts (�Massachusetts OAG�) to
resolve the Massachusetts OAG�s investigation of the Company�s financing, purchase and securitization of certain subprime residential mortgages. 2010 Compared with 2009. Investment Banking . Investment banking revenues decreased 4% in 2010 from 2009, reflecting lower
revenues from equity underwriting and lower advisory fees from merger, acquisition and restructuring transactions, partially offset by higher revenues from fixed income underwriting. Investment banking revenues were also impacted by the contribution
in 2010�of the majority of the�Company�s�Japanese investment banking�business as a result of a transaction with MUFG (see �Other Matters�Japanese Securities Joint Venture� herein).�Overall, underwriting
revenues of $2,825 million decreased 5% from 2009. Equity underwriting revenues decreased 14% to $1,454 million, primarily due to lower market volume. Fixed income underwriting revenues increased 8% to $1,371 million, primarily due to increased
high-yield issuance volumes and higher loan syndication fees. Advisory fees from merger, acquisition and restructuring transactions were $1,470 million, a decrease of 1%�from 2009. Sales and Trading Revenues . Total sales and trading revenues
increased 18% in 2010 from 2009, reflecting higher�equity and fixed income sales and trading revenues, partially offset by losses in other sales and trading. Equity .����Equity sales and trading revenues
increased 31% to $4,840 million in 2010 from $3,690 million in 2009. Equity sales and trading revenues reflected negative revenues of approximately $121 million in 2010 due to the impact of the tightening of the Company�s Debt-Related Credit
Spreads on Borrowings that were accounted for at fair value compared with negative revenues of approximately $1,738 million in 2009. Despite solid customer flows, a challenging trading environment resulted in lower revenues in the cash and
derivatives businesses in 2010. Results in 2010 reflected higher revenues in prime brokerage due to higher client balances compared with 2009. In 2010, equity sales and trading revenues also reflected unrealized gains of approximately $20 million related to changes in the fair value of net
derivative contracts attributable to the tightening of counterparties� credit default swap spreads compared with unrealized gains of approximately $198 million in 2009. The Company also recorded unrealized gains of $31 million in 2010 related
to changes in the fair value of net derivative contracts attributable to the widening of the Company�s credit default swap spreads compared with unrealized losses of approximately $154 million in 2009 from the tightening of the Company�s
credit default swap spreads. The unrealized gains and losses on credit default swap spreads and other credit factors do not reflect any gains or losses on related hedging instruments. Fixed Income and Commodities .����Fixed income sales and trading revenues increased 21% to $5,900
million in 2010 from $4,872 million in 2009. Results in 2010 included negative revenues of approximately $703 million due to the impact of the tightening of the Company�s Debt-Related Credit Spreads on Borrowings that were accounted for at fair
value compared with negative revenues of approximately $3,321 million in 2009. Fixed income product revenues decreased 38% in 2010, reflecting lower trading results across most businesses. Results for 2010 primarily reflected solid customer flows in
interest rate, credit and currency products, which were partly offset by a challenging trading environment. Fixed income product net revenues in 2010 were also negatively impacted by losses of $865 million from Monolines compared with losses of $232
million in 2009. Results in interest rate, credit and currency products also included a gain of approximately $123 million related to a change in the fair value measurement methodology to use the OIS curve as an input to value substantially all
collateralized interest rate derivative contracts (see �Executive Summary �Significant Items�OIS Fair Value Measurement� herein and Note 4 to the consolidated financial statements). Commodity net revenues decreased 64 Table of Contents 27% in 2010, primarily due to low levels of client activity and market volatility. Results in 2009 included a gain of approximately $319 million related to the sale of undivided participating
interests in a portion of the Company�s claims against a derivative counterparty that filed for bankruptcy protection (see Note 18 to the consolidated financial statements). In 2010, fixed income sales and trading revenues reflected net unrealized
gains of $603�million related to changes in the fair value of net derivative contracts attributable to the tightening of counterparties� credit default swap spreads compared with unrealized gains of approximately $3,462 million in 2009.
The Company also recorded unrealized gains of $287 million in 2010 related to changes in the fair value of net derivative contracts attributable to the widening of the Company�s credit default swap spreads compared with unrealized losses of
approximately $1,938 million in 2009 from the tightening of the Company�s credit default swap spreads. The unrealized gains and losses on credit default swap spreads and other credit factors do not reflect any gains or losses on related hedging
instruments. Other .����In 2010, other
sales and trading net revenues reflected a net loss of $441 million compared with net gains of $174 million in 2009. Results in 2010 primarily included net losses of approximately $342 million (mark-to-market valuations and realized gains of
approximately $327 million offset by losses on related hedges of approximately $669 million) associated with loans and lending commitments and the costs related to negative carry. Results in 2009 included net gains of approximately $804 million
(mark-to-market valuations and realized gains of approximately $4,042 million, partially offset by losses on related hedges of approximately $3,238 million) associated with loans and lending commitments. Results in 2009 also included losses of $362
million, reflecting the improvement in the Company�s Debt-Related Credit Spreads on certain debt related to China Investment Corporation, Ltd.�s (�CIC�) investment in the Company. Results in 2010 also included a gain of
approximately $53 million related to the OIS curve fair value methodology referred to above (see �Executive Summary�Significant Items�OIS Fair Value Measurement� and Note 4 to the consolidated financial statements). Principal
Transactions�Investments . Principal transaction net investment gains of $809 million were recognized in 2010 compared with net investment losses of $864�million in 2009. The results for
2010 reflected a gain of $313 million on a principal investment held by a consolidated investment partnership, which was sold in 2010. The results in 2010 also reflected gains on principal investments in real estate funds and investments associated
with certain employee deferred compensation and co-investment plans compared with losses on such investments in 2009. Other. Other revenues increased 85% in 2010, primarily reflecting a pre-tax gain of $668 million from the sale of the
Company�s investment in CICC, partially offset by pre-tax losses of approximately $62 million arising from the Company�s 40% stake in MUMSS. Results in 2009 included gains of approximately $465 million from the Company�s repurchase of
its debt in the open market. Non-interest
Expenses . Non-interest expenses increased 3% in 2010, primarily due to higher non-compensation expenses, partially offset by lower compensation expense. Compensation and benefits expenses decreased
2% in 2010, primarily due to lower net revenues, excluding the impact of negative revenues related to the Company�s Debt-Related Credit Spreads. Compensation and benefits expenses in 2010 included a non-recurring charge of approximately $269
million related to the U.K. government�s payroll tax on discretionary above-base compensation. Non-compensation expenses increased 10% in 2010. Brokerage and clearing expense increased 18% in 2010, primarily due to higher levels of business
activity. Information processing and communications expense increased 11% in 2010, primarily due to ongoing investments in technology. Marketing and business development expense increased 33% in 2010, primarily due to higher levels of business
activity. Other expenses increased 17% in 2010, primarily related to higher provisions for litigation and regulatory proceedings, including $102.7 million related to the Assurance of Discontinuance between the Company and the Massachusetts OAG,
partially offset by insurance recoveries reflected in 2010. 65 Table of Contents GLOBAL WEALTH MANAGEMENT GROUP INCOME STATEMENT INFORMATION | 2011 | 2010 | 2009 | ||||||||||
| (dollars�in�millions) | ||||||||||||
| Revenues: | ||||||||||||
| Investment banking | $ | 750 | $ | 827 | $ | 596 | ||||||
| Principal transactions: | ||||||||||||
| Trading | 1,122 | 1,306 | 1,208 | |||||||||
| Investments | 4 | 19 | 3 | |||||||||
| Commissions and fees | 2,770 | 2,676 | 2,090 | |||||||||
| Asset management, distribution and administration fees | 6,884 | 6,349 | 4,583 | |||||||||
| Other | 410 | 337 | 249 | |||||||||
| Total non-interest revenues | 11,940 | 11,514 | 8,729 | |||||||||
| Interest income | 1,869 | 1,587 | 1,114 | |||||||||
| Interest expense | 386 | 465 | 453 | |||||||||
| Net interest | 1,483 | 1,122 | 661 | |||||||||
| Net revenues | 13,423 | 12,636 | 9,390 | |||||||||
| Compensation and benefits | 8,351 | 7,843 | 6,114 | |||||||||
| Non-compensation expenses | 3,796 | 3,637 | 2,717 | |||||||||
| Total non-interest expenses | 12,147 | 11,480 | 8,831 | |||||||||
| Income from continuing operations before income taxes | 1,276 | 1,156 | 559 | |||||||||
| Provision for income taxes | 465 | 336 | 178 | |||||||||
| Income from continuing operations | 811 | 820 | 381 | |||||||||
| Net income | 811 | 820 | 381 | |||||||||
| Net income applicable to noncontrolling interests | 146 | 301 | 98 | |||||||||
| Net income applicable to Morgan Stanley | $ | 665 | $ | 519 | $ | 283 | ||||||
| 2011 | 2010 | 2009 | ||||||||||
| (dollars�in�millions) | ||||||||||||
| Revenues: | ||||||||||||
| Transactional | $ | 4,642 | $ | 4,809 | $ | 3,894 | ||||||
| Asset management | 6,884 | 6,349 | 4,583 | |||||||||
| Net interest | 1,483 | 1,122 | 661 | |||||||||
| Other | 414 | 356 | 252 | |||||||||
| Net revenues | $ | 13,423 | $ | 12,636 | $ | 9,390 | ||||||
Table of Contents the Global Wealth Management Group business segment since May�31, 2009. Net income applicable to noncontrolling interests of $146 million, $301 million and $98 million in 2011, 2010 and
2009, respectively, primarily represents Citi�s interest in MSSB since May�31, 2009. 2011 Compared with 2010. Transactional. Investment Banking. Global Wealth Management Group investment banking includes revenues from the distribution of equity and fixed income securities, including initial
public offerings, secondary offerings, closed-end funds and unit trusts. Investment banking revenues decreased 9% in 2011 from 2010, primarily due to lower equity and fixed income underwriting activities. Principal
Transactions�Trading. Principal transactions�Trading includes revenues from customers� purchases and sales of financial instruments in which the Company acts as principal and gains and losses on the
Company�s inventory positions which are held primarily to facilitate customer transactions and gains and losses associated with certain employee deferred compensation plans. Principal transactions�Trading revenues decreased 14% in 2011
from 2010, primarily due to losses related to investments associated with certain employee deferred compensation plans, lower revenues from corporate equity and fixed income securities, government securities and structured notes, partially offset by
higher revenues from municipal securities, derivatives and unit trusts. Commissions and Fees. Commissions and fees revenues primarily arise from agency transactions in listed and OTC equity securities and sales of mutual funds, futures,
insurance products and options.�Commissions and fees revenues increased 4% in 2011 from 2010, primarily due to higher client activity. Asset Management. Asset Management, Distribution and Administration Fees. See �Business Segments�Net Revenues� herein
for information on what is included within Asset management, distribution and administration fees. Asset management, distribution and administration fees increased 8% in 2011 from 2010, primarily due to higher fee-based revenues, partially offset by lower revenues as a result of the change in
classification of the fees generated by the bank deposit program. From�June�2009 until April�1, 2010, revenues in the bank deposit program�were primarily included in Asset�management, distribution and administration fees.
Beginning on April�1, 2010, revenues in the bank deposit program held at the Company�s U.S. depository institutions were recorded as Interest income due to renegotiations of the revenue sharing agreement as part of the Global Wealth
Management Group business segment�s retail banking strategy. The Global Wealth Management Group business segment continues to earn referral fees for deposits placed with Citi affiliated depository institutions, and these fees continue to be
recorded in Asset management, distribution and administration fees until the legacy Smith Barney deposits are migrated to the Company�s U.S. depository institutions. The referral fees for deposits were $255 million and $382 million in 2011 and
2010, respectively. Balances in the bank deposit program
decreased to $110.6 billion at December�31, 2011 from $113.3 billion at December�31, 2010. Client assets in fee-based accounts increased to $496 billion and represented 30% of total client assets at December�31, 2011, compared with $470 billion and 28% at December�31, 2010,
respectively. Total client asset balances decreased to $1,649 billion at December�31, 2011 from $1,669 billion at December�31, 2010, primarily due to the impact of weakened market conditions, partially offset by an increase in net new
assets. Net new assets for 2011 were an inflow of $35.8 billion, compared with an inflow of $22.9 billion in 2010. Client asset balances in households with assets greater than $1 million decreased to $1,219 billion at December�31, 2011 from
$1,229 billion at December�31, 2010. Global fee-based asset net inflows increased to $42.5 billion at December�31, 2011 from $32.7 billion at December�31, 2010. 67 Table of Contents Net Interest. Interest income and Interest expense are a function of the level and mix of
total assets and liabilities, including customer bank deposits and margin loans and securities borrowed and securities loaned transactions. Net interest increased 32% in 2011 from 2010, primarily resulting from an increase in Interest income due to interest on the securities available for sale
portfolio and mortgages and the change in classification of the fees generated by the bank deposit program noted above. Other. Principal Transactions�Investments. Principal transaction net investment gains were $4 million in 2011 compared
with net investment gains of $19 million in 2010. The decrease in 2011 primarily reflected losses related to investments associated with certain employee deferred compensation plans compared with such investments in the prior year. Other. Other revenues were $410 million
in 2011, an increase of 22% from 2010, primarily due to gains on sales of securities available for sale. Non-interest Expenses . Non-interest expenses increased 6% in 2011 from 2010. Compensation and benefits expense increased 6% in 2011 from 2010,
primarily reflecting higher net revenues and support services related compensation, partially offset by lower expenses associated with certain employee deferred compensation plans. Non-compensation expenses increased 4% in 2011 from 2010. In 2011,
marketing and business development expense increased 15% from 2010, primarily due to higher costs associated with conferences and seminars. Professional services expense increased 14% in 2011 from 2010, primarily due to increased technology
consulting costs and legal fees. Information processing and communications expense increased 10% in 2011 from 2010, primarily due to higher telecommunications and data storage costs. Occupancy and equipment expense decreased 4% in 2011 from 2010,
primarily due to lower infrastructure costs and continued branch consolidation. 2010 Compared with 2009. Transactional. Investment Banking. Investment banking revenues increased 39% in 2010, primarily benefiting from a full year of MSSB revenues and higher closed-end fund activity. Principal
Transactions�Trading. Principal transactions�Trading revenues increased 8% in 2010, primarily benefiting from a full year of MSSB revenues, net gains related to investments associated with certain employee
deferred compensation plans and gains on certain investments. Commissions and fees. Commissions and fees revenues increased 28% in 2010, primarily benefiting from a full year of
MSSB revenues and higher client activity. Asset Management. Asset Management, Distribution and Administration
Fees. Asset management, distribution and administration fees increased 39% in 2010, primarily benefiting from a full year of MSSB revenues and improved market conditions. The referral fees for deposits placed with Citi
depository institutions were $382 million in 2010 and $660 million in 2009. Balances in the bank deposit program increased to $113.3 billion at December�31, 2010 from $112.5 billion at December�31, 2009. 68 Table of Contents Client assets in fee-based accounts increased to $470 billion and represented 28% of total client assets at
December�31, 2010 compared with $379 billion and 24% at December�31, 2009, respectively. Total client asset balances increased to $1,669 billion at December�31, 2010 from $1,560 billion at December�31, 2009, primarily due to
improved market conditions and an increase in net new assets.�Net new assets for 2010 were $22.9 billion. Client asset balances in households with assets greater than $1 million increased to $1,229 billion at December�31, 2010 from $1,090
billion at December�31, 2009. Global fee-based asset flows increased to $32.7 billion at December�31, 2010 from $13.4 billion at December�31, 2009. Net Interest. Net interest increased 70% in 2010, primarily resulting from an increase in
Interest income due to a full year of MSSB net interest, the securities available for sale portfolio (see �Other Matters�Securities Available for Sale� herein) and the change in classification of the fees generated by the bank deposit
program noted above, partially offset by increased funding costs. Other. Principal Transactions�Investments. Principal transaction net investment gains were $19 million in 2010 compared
with $3 million in 2009. The increase primarily reflected gains related to investments associated with certain employee deferred compensation plans compared with such investments in the prior-year period. Other. Other revenues were $337 million
in 2010, an increase of 35% from $249 million in 2009. Other revenues in 2010 primarily benefited from a full year of MSSB revenues and increases in proxy and other fee services. Non-interest
Expenses . Non-interest expenses increased 30% in 2010, primarily due to higher costs related to a full year of MSSB operating expenses and the amortization of MSSB�s intangible assets.
Compensation and benefits expense increased 28% in 2010, primarily due to a full year of MSSB operating expenses. Non-compensation expenses increased 34% in 2010. In 2010, brokerage, clearing and exchange fees expense increased 38%, information
processing and communications expense increased 41%, and other expenses increased 51%, primarily due to a full year of MSSB operating expenses. In 2010, professional services expense increased 43%, primarily due to a full year of MSSB operating
expenses and increased technology consulting costs related to the MSSB integration. 69 Table of Contents ASSET MANAGEMENT INCOME STATEMENT INFORMATION | 2011 | 2010 | 2009 | ||||||||||
| (dollars in millions) | ||||||||||||
| Revenues: | ||||||||||||
| Investment banking | $ | 13 | $ | 20 | $ | 10 | ||||||
| Principal transactions: | ||||||||||||
| Trading | (22 | ) | (49 | ) | (68 | ) | ||||||
| Investments | 330 | 996 | (173 | ) | ||||||||
| Asset management, distribution and administration fees | 1,582 | 1,630 | 1,562 | |||||||||
| Other | 25 | 164 | 46 | |||||||||
| Total non-interest revenues | 1,928 | 2,761 | 1,377 | |||||||||
| Interest income | 10 | 22 | 17 | |||||||||
| Interest expense | 51 | 98 | 100 | |||||||||
| Net interest | (41 | ) | (76 | ) | (83 | ) | ||||||
| Net revenues | 1,887 | 2,685 | 1,294 | |||||||||
| Compensation and benefits | 848 | 1,108 | 1,090 | |||||||||
| Non-compensation expenses | 786 | 859 | 861 | |||||||||
| Total non-interest expenses | 1,634 | 1,967 | 1,951 | |||||||||
| Income (loss) from continuing operations before income taxes | 253 | 718 | (657 | ) | ||||||||
| Provision for (benefit from) income taxes | 73 | 105 | (216 | ) | ||||||||
| Income (loss) from continuing operations | 180 | 613 | (441 | ) | ||||||||
| Discontinued operations: | ||||||||||||
| Gain (loss) from discontinued operations | 24 | 999 | (373 | ) | ||||||||
| Provision for (benefit from) income taxes | (17 | ) | 335 | (277 | ) | |||||||
| Net gain (loss) from discontinued operations | 41 | 664 | (96 | ) | ||||||||
| Net income (loss) | 221 | 1,277 | (537 | ) | ||||||||
| Net income (loss) applicable to noncontrolling interests | 145 | 408 | (50 | ) | ||||||||
| Net income (loss) applicable to Morgan Stanley | $ | 76 | $ | 869 | $ | (487 | ) | |||||
| Amounts applicable to Morgan Stanley: | ||||||||||||
| Income (loss) from continuing operations | $ | 35 | $ | 205 | $ | (391 | ) | |||||
| Net gain (loss) from discontinued operations | 41 | 664 | (96 | ) | ||||||||
| Net income (loss) applicable to Morgan Stanley | $ | 76 | $ | 869 | $ | (487 | ) | |||||
Table of Contents Discontinued Operations . On June�1, 2010, the
Company completed the sale of Retail Asset Management, including Van Kampen, to Invesco. The Company recorded a cumulative after-tax gain of $710 million, of which $28 million and $570 million were recorded in 2011 and 2010, respectively. The
remaining gain, representing tax basis benefits, was recorded in the quarter ended December�31, 2009. The results of Retail Asset Management are reported as discontinued operations within the Asset Management business segment for all periods
presented. See �Executive Summary�Significant Items�Gain on Sale of Retail Asset Management� for further information. In the fourth quarter of 2011, the Company classified a real estate property management company as held for sale within the Asset Management business
segment. The transaction closed during the first quarter of 2012. The results of operations are reported as discontinued operations for all periods presented. In the third quarter of 2010, the Company completed a disposal of a real estate property within the Asset Management business segment. The results of
operations are reported as discontinued operations for all periods presented. Segment Reorganization . Beginning in the quarter ended March�31, 2011, the Asset Management business segment was reorganized into three
businesses: Traditional Asset Management, Real Estate Investing and Merchant Banking. Traditional Asset Management includes Long-only, which is comprised of Equity and Fixed Income, Liquidity and the Alternative Investment Products businesses, which
include a range of alternative investment products such as funds of hedge funds, funds of private equity funds, and funds of real estate funds. Real Estate Investing was previously reported as part of Merchant Banking.�Merchant Banking includes
the Private Equity and Infrastructure business and hedge fund stake investments. The Company�s equity investment in FrontPoint, subsequent to the restructuring of that business, is included�in Merchant Banking. The results of the
FrontPoint business for all periods prior to the restructuring are also included in Merchant Banking. Statistical Data. The Asset Management business segment�s period-end and average assets under management or supervision were as follows: | At December�31, | Average�For | |||||||||||||||||||
| 2011 | 2010(1) | 2011 | 2010(1) | 2009(1) | ||||||||||||||||
| (dollars in billions) | ||||||||||||||||||||
| Assets under management or supervision by asset class: | ||||||||||||||||||||
| Traditional Asset Management: | ||||||||||||||||||||
| Equity | $ | 104 | $ | 110 | $ | 112 | $ | 97 | $ | 79 | ||||||||||
| Fixed income | 57 | 61 | 60 | 60 | 56 | |||||||||||||||
| Liquidity | 74 | 53 | 66 | 53 | 64 | |||||||||||||||
| Alternatives | 25 | 18 | 18 | 17 | 17 | |||||||||||||||
| Total Traditional Asset Management | 260 | 242 | 256 | 227 | 216 | |||||||||||||||
| Real Estate Investing | 18 | 16 | 17 | 15 | 21 | |||||||||||||||
| Merchant Banking: | ||||||||||||||||||||
| Private Equity | 9 | 9 | 9 | 9 | 8 | |||||||||||||||
| FrontPoint(2) | � | 5 | 1 | 7 | 7 | |||||||||||||||
| Total Merchant Banking | 9 | 14 | 10 | 16 | 15 | |||||||||||||||
| Total assets under management or supervision | $ | 287 | $ | 272 | $ | 283 | $ | 258 | $ | 252 | ||||||||||
| Share of minority stake assets(2)(3) | $ | 6 | $ | 7 | $ | 7 | $ | 7 | $ | 6 | ||||||||||
| (1) | All prior-year amounts have been reclassified to conform to the current year�s presentation. |
Table of Contents| (2) | On March�1, 2011, the Company and the principals of FrontPoint completed a transaction whereby FrontPoint senior management and portfolio managers own a majority equity stake in FrontPoint and the Company retains a minority stake. At December�31, 2011, the assets under management attributed to FrontPoint are represented within the share of minority stake assets. |
| (3) | Amounts represent the Asset Management business segment�s proportional share of assets managed by entities in which it owns a minority stake. |
| 2011 | 2010(1) | 2009(1) | ||||||||||
| (dollars�in�billions) | ||||||||||||
| Balance at beginning of period | $ | 272 | $ | 259 | $ | 284 | ||||||
| Net flows by asset class: | ||||||||||||
| Traditional Asset Management: | ||||||||||||
| Equity | 4 | � | (8 | ) | ||||||||
| Fixed income(2) | (6 | ) | � | (6 | ) | |||||||
| Liquidity | 20 | (6 | ) | (22 | ) | |||||||
| Alternatives | 8 | � | (1 | ) | ||||||||
| Total Traditional Asset Management | 26 | (6 | ) | (37 | ) | |||||||
| Real Estate Investing | 1 | 2 | (2 | ) | ||||||||
| Merchant Banking: | ||||||||||||
| FrontPoint(3) | (1 | ) | (2 | ) | (2 | ) | ||||||
| Total Merchant Banking | (1 | ) | (2 | ) | (2 | ) | ||||||
| Total net flows | 26 | (6 | ) | (41 | ) | |||||||
| Net market appreciation (depreciation) | (7 | ) | 19 | 16 | ||||||||
| Decrease due to FrontPoint transaction | (4 | ) | � | � | ||||||||
| Total net increase (decrease) | 15 | 13 | (25 | ) | ||||||||
| Balance at end of period | $ | 287 | $ | 272 | $ | 259 | ||||||
| (1) | All prior-year amounts have been reclassified to conform to the current year�s presentation. |
| (2) | Fixed income outflows in 2011 includes $1.3 billion due to the revised treatment of assets under management previously reported as a net flow. |
| (3) | The amount in 2011 includes two months of net flows related to FrontPoint, whereas 2010 and 2009 includes twelve months of net flows related to FrontPoint. |
Table of Contents The Company recorded principal transactions net investment gains of $330 million in 2011 compared with gains
of $996 million in 2010. The decrease in 2011 was primarily related to lower net gains in the Company�s Merchant Banking and Traditional Asset Management businesses, including certain investments associated with the Company�s employee
deferred compensation and co-investment plans, as well as lower net investment gains associated with certain consolidated real estate funds sponsored by the Company. Asset Management, Distribution and Administration
Fees . Asset management, distribution and administration fees include revenues generated from the management and supervision of assets, performance-based fees relating to certain funds, and
separately managed accounts and fees relating to the distribution of certain open-ended mutual funds. Asset management fees arise from investment management services the Company provides to investment vehicles pursuant to various contractual
arrangements. The Company receives fees primarily based upon mutual fund daily average net assets or based on monthly or quarterly invested equity for other vehicles. Performance-based fees are earned on certain funds as a percentage of appreciation
earned by those funds and, in certain cases, are based upon the achievement of performance criteria. These fees are normally earned annually and are recognized on a monthly or quarterly basis. Asset management, distribution and administration fees decreased 3% in 2011. The decrease in 2011 primarily reflected lower
performance fees and�lower fund management and administration fees, primarily due to the absence of FrontPoint for ten months of the current year, partially offset by an increase in revenue associated with higher average assets under
management. The Company�s assets under management increased
$15 billion from $272 billion at December�31, 2010 to $287 billion at December�31, 2011 reflecting net customer inflows. The Company recorded net customer inflows of $25.8 billion in 2011 compared with net outflows of $5.7 billion in 2010.
The increase in flows for 2011 primarily reflected the sweep of MSSB client cash balances of approximately $18.5 billion into Morgan Stanley managed liquidity funds and inflows of $7.9 billion into alternatives funds, partially offset by outflows of
$5.5 billion in fixed income products. Other . Other revenues were $25 million in 2011 as compared with $164 million in 2010. The
results in 2011 included revenues associated with�the Company�s minority stake investments in Lansdowne Partners (�Lansdowne�), a London-based investment manager, and Avenue Capital Group (�Avenue�), a New York-based
investment manager,�partially offset by a $27 million writedown in the Company�s minority stake investment in FrontPoint as noted above. The results in 2010 primarily reflected revenues associated with these minority stakes and a pre-tax
gain of approximately $96 million from the sale of the Company�s investment in Invesco (see Notes 5 and 19 to the consolidated financial statements). The results in 2010 also reflected gains associated with the reduction of a lending facility
to a real estate fund sponsored by the Company and impairment charges of $126 million related to FrontPoint. Non-interest Expenses . Non-interest expenses decreased 17% in 2011 from 2010, primarily reflecting a decrease in compensation expenses.
Compensation and benefits expenses decreased 23% in 2011 from 2010, primarily due to the absence of FrontPoint for ten months of the current year and decreases associated with lower net revenues. Non-compensation expenses decreased 8% in 2011
compared with the prior year, as the prior year included intangible asset impairment charges of $67 million related to certain FrontPoint management contracts. 2010 Compared with 2009. Investment Banking . Investment banking revenues doubled in 2010 from 2009, primarily reflecting
higher revenues from real estate and infrastructure products. Principal Transactions�Trading . In 2010, the Company recognized Principal transactions
trading losses of $49 million�compared with losses of $68 million in 2009. Trading results in 2010 and 2009 included losses from hedges on certain investments and long-term debt. Trading results in 2010 also included $25 million related 73 Table of Contents to�contributions to money market funds. Trading results in 2009 also included mark-to-market losses related to a lending facility to a real estate fund sponsored by the Company, partially
offset by gains of $164 million�related to structured investment vehicle positions that were previously held on the Company�s consolidated statements of financial condition. Principal Transactions�Investments . The Company recorded
principal transactions net investment gains of $996 million in 2010 compared with losses of $173 million in 2009. The results in 2010 included a gain of $444 million associated with certain consolidated real estate funds sponsored by the Company and
net investment gains in the Merchant Banking and Traditional Asset Management businesses, including certain investments associated with the Company�s employee deferred compensation and co-investment plans. The results in 2009 primarily related
to net investment losses associated with the Company�s real estate investments and losses related to certain investments associated with the Company�s employee deferred compensation and co-investment plans, partially offset by net
investment gains associated with the Company�s Merchant Banking business. Asset Management, Distribution and Administration Fees . Asset management, distribution and administration fees increased 4% in 2010 compared with
2009, primarily reflecting higher fund management and administration fees, partially offset by lower performance fees. The higher fund management and administration fees reflected an increase in average assets under management. The Company�s
assets under management increased $13 billion from December�31, 2009 to December�31, 2010, reflecting market appreciation, partially offset by net customer outflows, primarily in the Company�s money market funds. The Company recorded
net customer outflows of $5.7 billion in 2010 compared with net outflows of $41.1 billion in 2009. Other . Other revenues increased $118 million in 2010 compared with 2009. The results in 2010 included a pre-tax gain of approximately $96 million
from the sale of the Company�s investment in Invesco, as mentioned above. The increase in 2010 also reflected gains associated with the reduction of a lending facility to a real estate fund sponsored by the Company and higher revenues
associated with the Company�s minority stake investments in Avenue and Lansdowne. These increases were partially offset by impairment charges of $126 million related to FrontPoint. Non-interest Expenses . Non-interest expenses increased 1% in 2010
compared with 2009. The results in 2010 primarily reflected an increase in Compensation and benefits expense, partially offset by a decrease in Non-compensation expenses. Compensation and benefits expenses increased 2% in 2010 due to certain
international tax equalization payments and principal investment gains in the current year related to employee deferred compensation and co-investment plans. Non-compensation expenses for 2010 included intangible asset impairment charges of $67
million related to FrontPoint investment management contracts. 74 Table of Contents Accounting Developments. Reconsideration of Effective Control for Repurchase Agreements. In April 2011, the Financial Accounting Standards Board (the
�FASB�) issued accounting guidance that�removes the�requirement to consider whether sufficient collateral is held when determining whether to account�for repurchase agreements and other agreements that both entitle and
obligate the transferor to repurchase or redeem financial assets before their maturity as sales or as secured financings.�The guidance is effective for the Company prospectively for transactions beginning on January�1, 2012. The Company
does not believe the adoption of this accounting guidance will have a material impact on the Company�s consolidated financial statements. Amendments to Achieve Common Fair Value Measurement and Disclosure Requirements in U.S. GAAP and IFRS. In May 2011, the FASB issued an accounting update that clarifies existing
fair value measurement guidance and changes certain principles or requirements for measuring fair value or disclosing information about fair value measurements. This update results in common principles and requirements for measuring fair value and
for disclosing information about fair value measurement in accordance with U.S. GAAP and International Financial Reporting Standards (�IFRS�). The guidance is effective for the Company prospectively beginning on January�1, 2012. The
Company does not believe the adoption of this accounting guidance will have a material impact on the Company�s consolidated financial statements. Goodwill Impairment Test. In September 2011, the FASB issued accounting guidance that simplifies how entities test goodwill for impairment. This guidance allows entities an option
to first assess qualitative factors to determine whether it is necessary to perform the two-step quantitative goodwill impairment test. Under that option, an entity no longer would be required to calculate the fair value of a reporting unit unless
the entity determines, based on that qualitative assessment, that it is more likely than not that its fair value is less than its carrying amount. This guidance is effective for the Company prospectively beginning on January�1, 2012. The
Company does not believe the adoption of this accounting guidance will have a material impact on the Company�s consolidated financial statements. 75 Table of Contents Other Matters. Real Estate. The Company acts as the general partner for various real estate funds and also invests in certain of these funds as a limited partner. The Company�s
real estate investments at December�31, 2011 and December�31, 2010 are described below. Such amounts exclude investments associated with certain employee deferred compensation and co-investment plans. At December�31, 2011 and December�31, 2010, the consolidated
statements of financial condition included amounts representing real estate investment assets of consolidated subsidiaries of approximately $2.0 billion and $1.9 billion, respectively, including noncontrolling interests of approximately $1.6 billion
and $1.5 billion, respectively, for a net amount of $0.4 billion in both periods. This net presentation is a non-GAAP financial measure that the Company considers to be the most useful measure for the Company and investors to use in assessing the
Company�s net exposure. In addition, the Company has contractual capital commitments, guarantees, lending facilities and counterparty arrangements with respect to real estate investments of $0.8 billion at December�31, 2011. In addition to the Company�s real estate investments, the Company
engages in various real estate-related activities, including origination of loans secured by commercial and residential properties. The Company also securitizes and trades in a wide range of commercial and residential real estate and real
estate-related whole loans, mortgages and other real estate. In connection with these activities, the Company has provided, or otherwise agreed to be responsible for, representations and warranties. Under certain circumstances, the Company may be
required to repurchase such assets or make other payments related to such assets if such representations and warranties were breached. The Company continues to monitor its real estate-related activities in order to manage its exposures and potential
liability from these markets and businesses. See �Legal Proceedings�Residential Mortgage and Credit Crisis Related Matters� in Part I, Item�3. See �Executive Summary�Significant Items�Real Estate
Investments� herein and Note 13 to the consolidated financial statements for further information. Securities Available for Sale. During 2010, the Company established a portfolio of debt securities in order to manage interest rate risk. The securities have been classified as securities available for sale in accordance with
accounting guidance for investments in debt and equity securities. See Note 5 to the consolidated financial statements for further information on securities available for sale. Japanese Securities Joint Venture. On May�1, 2010, the Company and MUFG formed a joint venture in Japan of
their respective investment banking and securities businesses. MUFG and the Company have integrated their respective Japanese securities companies by forming two joint venture companies. MUFG contributed the investment banking, wholesale and retail
securities businesses conducted in Japan by Mitsubishi UFJ Securities Co., Ltd. into MUMSS. The Company contributed the investment banking operations conducted in Japan by its subsidiary, Morgan Stanley MUFG Securities, Co., Ltd. (�MSMS�),
formerly known as Morgan Stanley Japan Securities Co., Ltd., into MUMSS (MSMS, together with MUMSS, the �Joint Venture�). MSMS will�continue its sales and trading and capital markets business conducted in Japan. Following the
respective contributions to the Joint Venture and a cash payment of 23�billion yen ($247 million) from MUFG to the Company, the Company owns a 40% economic interest in the Joint Venture, and MUFG owns a 60% economic interest in the Joint
Venture. The Company holds a 40% voting interest and MUFG holds a 60% voting interest in MUMSS, while the Company holds a 51% voting interest and MUFG holds a 49% voting interest in MSMS. The Company continues to consolidate MSMS in its consolidated
financial statements and, commencing on May�1, 2010, accounted for its interest in MUMSS 76 Table of Contents as an equity method investment within the Institutional Securities business segment. During 2011 and 2010, the Company recorded losses of $783 million and $62 million, respectively, within Other
revenues in the consolidated statements of income, arising from the Company�s 40% stake in MUMSS. In order to enhance the risk management at MUMSS, during 2011, the Company entered into a transaction with MUMSS whereby the risk associated with the fixed income trading positions that previously caused
the majority of the aforementioned MUMSS losses in 2011 was transferred to MSMS (see �Executive Summary�Significant Items�Japanese Securities Joint Venture� herein for more information). In return for entering into the
transaction, the Company received total consideration of $659 million, which represented the estimated fair value of the fixed income trading positions transferred. To the extent that losses incurred by MUMSS result in a requirement to
restore its capital, MUFG is solely responsible for providing this additional capital to a minimum level and the Company is not obligated to contribute additional capital to MUMSS. Because of the losses incurred by MUMSS, MUFG contributed
approximately $370 million and $259 million of capital to MUMSS on April�22, 2011 and November�24, 2011, respectively. The MUFG capital injection improved the capital base and restored the capital adequacy ratio of MUMSS in each
case.�As a result of the capital injections, during 2011, the Company recorded increases of approximately $251 million in the carrying amount of the equity method investment in MUMSS, reflecting the Company�s 40% share of the increases in
the net asset value of MUMSS, and increases in the Company�s Paid-in capital of approximately $146 million�(after-tax). To the extent that MUMSS is required to increase its capital level due to factors other than losses, such as changes in regulatory requirements, both MUFG
and the Company are required to contribute the necessary capital based upon their economic interest as set forth above. In this context, the Company contributed $129 million and MUFG contributed $195 million of additional proportionate capital
investments on November�24, 2011 to meet an anticipated change in regulatory capital requirements of MUMSS. At December�31, 2011, the Company performed an impairment review of its equity method investment in MUMSS in view of the deterioration in the financial performance of MUMSS and the aftermath of the
earthquake in Japan on March�11, 2011. The Company recorded no other-than-temporary impairment loss in 2011. Adverse market or economic events, as well as further deterioration of economic performance, could result in impairment charges of this
investment in future periods. See Note 24 to the consolidated
financial statements and �Executive Summary�Significant Items�Japanese Securities Joint Venture� herein for further information. Redemption of CIC Equity Units and Issuance of Common Stock. In December 2007, the Company sold Equity Units that included contracts to
purchase Company common stock to a wholly owned subsidiary of CIC. The Company redeemed the junior subordinated debentures underlying the Equity Units in August 2010, and the redemption proceeds were subsequently used by the CIC subsidiary to settle
its obligation under the purchase contracts. Dividend Income. Effective January�1, 2010, the Company reclassified
dividend income associated with trading and investing activities to Principal transactions�Trading or Principal transactions�Investments depending upon the business activity. Previously, these amounts were included in Interest and
dividends on the consolidated statements of income. These reclassifications were made in connection with the Company�s conversion to a financial holding company. Prior periods have been adjusted to conform to the current presentation. 77 Table of Contents Defined Benefit Pension and Other Postretirement Plans. Expense. The Company recognizes the
compensation cost of an employee�s pension benefits (including prior-service cost) over the employee�s estimated service period. This process involves making certain estimates and assumptions, including the discount rate and the expected
long-term rate of return on plan assets. On June�1, 2010,
the defined benefit pension plan that is qualified under Section�401(a) of the Internal Revenue Code (the �U.S. Qualified Plan�) was amended to cease future benefit accruals after December�31, 2010. Any benefits earned by
participants under the U.S. Qualified Plan at December�31, 2010 were preserved and will be payable based on the U.S. Qualified Plan�s provisions. Net periodic pension expense for U.S. and non-U.S. plans was $72 million, $96 million and
$175 million for 2011, 2010 and 2009, respectively. On
October�29, 2010, the Morgan Stanley Medical Plan was amended to change eligibility requirements for a firm-provided subsidy toward the cost of retiree medical coverage after December�31, 2010. Net periodic postretirement expense for the
Morgan Stanley Medical Plan was $12 million and $26 million for 2010 and 2009, respectively. Contributions. The Company made contributions of $57 million, $72 million and $321 million to its U.S. and non-U.S. defined benefit pension plans in 2011, 2010 and
2009, respectively. These contributions were funded with cash from operations. The Company determines the amount of its pension contributions to its funded plans by considering several factors, including the level of plan assets relative to plan liabilities, the types of assets in
which the plans are invested, expected plan liquidity needs and expected future contribution requirements. The Company�s policy is to fund at least the amounts sufficient to meet minimum funding requirements under applicable employee benefit
and tax laws (for example, in the U.S., the minimum required contribution under the Employee Retirement Income Security Act of 1974, or �ERISA�). At December�31, 2011 and December�31, 2010, there were no minimum required ERISA
contributions for the U.S. Qualified Plan.�No contributions were made to the U.S. Qualified Plan for 2011 and 2010. A $278 million contribution was funded to the U.S. Qualified Plan for 2009 based on�the�service�cost earned by
the eligible employees plus a portion of the unfunded accumulated benefit obligation on a funding basis. Liabilities for benefits payable under certain postretirement and unfunded supplementary plans are accrued by the Company and are funded when
paid to the beneficiaries. See Note 21 to the consolidated
financial statements for more information on the Company�s defined benefit pension and postretirement plans. Regulatory Outlook. On July�21, 2010, President Obama signed the Dodd-Frank Act into law. While certain portions of the Dodd-Frank Act were effective immediately, other portions will be effective only following extended
transition periods. Moreover, implementation of the Dodd-Frank Act will be accomplished through numerous rulemakings by multiple governmental agencies, only a portion of which has been completed. It remains difficult to assess fully the impact that
the Dodd-Frank Act will have on the Company and on the financial services industry generally. In addition, various international developments, such as the adoption of risk-based capital, leverage and liquidity standards by the Basel Committee, known
as �Basel III,� will impact the Company in the coming years. It is likely that 2012 and subsequent years will see further material changes in the way major financial institutions are regulated in both the U.S. and other markets in which the Company operates,
although it remains difficult to predict which further reform initiatives will become law, how such reforms will be implemented or the exact impact they will have on the Company�s business, financial condition, results of operations and cash
flows for a particular future period. See also �Business�Supervision and Regulation� in Part I, Item�1. 78 Table of Contents Critical Accounting Policies. The Company�s consolidated financial statements are prepared in
accordance with accounting principles generally accepted in the U.S., which require the Company to make estimates and assumptions (see Note 1 to the consolidated financial statements). The Company believes that of its significant accounting policies
(see Note 2 to the consolidated financial statements), the following policies involve a higher degree of judgment and complexity. Fair Value. Financial Instruments Measured at Fair Value. A significant number of the Company�s financial instruments are carried at fair value. The Company makes estimates
regarding valuation of assets and liabilities measured at fair value in preparing the consolidated financial statements. These assets and liabilities include but are not limited to: | � | Financial instruments owned and Financial instruments sold, not yet purchased; |
| � | Securities available for sale; |
| � | Securities received as collateral and Obligation to return securities received as collateral; |
| � | Certain Commercial paper and other short-term borrowings, primarily structured notes; |
| � | Certain Deposits; |
| � | Certain Securities sold under agreements to repurchase; |
| � | Certain Other secured financings; and |
| � | Certain Long-term borrowings, primarily structured notes. |
Table of Contents The Company also reclassified approximately $0.8 billion of certain Corporate and other debt from Level 2 to
Level 3. The reclassifications were primarily related to corporate loans and were generally due to a reduction in market price quotations for these or comparable instruments, or a lack of available broker quotes, such that unobservable inputs had to
be utilized for the fair value measurement of these instruments. Assets and Liabilities Measured at Fair Value on a Non-recurring Basis. At December�31, 2011, certain of the
Company�s assets were measured at fair value on a non-recurring basis, primarily relating to loans, other investments, premises, equipment and software costs, and intangible assets. The Company incurs losses or gains for any adjustments of
these assets to fair value. A downturn in market conditions could result in impairment charges in future periods. For assets and liabilities measured at fair value on a non-recurring basis, fair value is determined by using various valuation approaches. The same hierarchy as described above, which maximizes the use
of observable inputs and minimizes the use of unobservable inputs by generally requiring that the observable inputs be used when available, is used in measuring fair value for these items. For further information on assets and liabilities that are measured at fair value on a non-recurring basis, see Note 4 to the
consolidated financial statements. Fair Value Control
Processes. The Company employs control processes to validate the fair value of its financial instruments, including those derived from pricing models. These control processes are designed to ensure that the values used
for financial reporting are based on observable inputs wherever possible. In the event that observable inputs are not available, the control processes are designed to assure that the valuation approach utilized is appropriate and consistently
applied and that the assumptions are reasonable. These control processes include reviews of the pricing model�s theoretical soundness and appropriateness by Company personnel with relevant expertise who are independent from the trading desks,
which include Finance, Market Risk Department and Credit Risk Management Department. These groups participate in the review and validation of the fair values generated from pricing models, as appropriate. Where a pricing model is used to determine
fair value, recently executed comparable transactions and other observable market data are considered for purposes of validating assumptions underlying the model. Consistent with market practice, the Company has individually negotiated
agreements with certain counterparties to exchange collateral (�margining�) based on the level of fair values of the derivative contracts they have executed. Through this margining process, one party or each party to a derivative contract
provides the other party with information about the fair value of the derivative contract to calculate the amount of collateral required. This sharing of fair value information provides additional support of the Company�s recorded fair value
for the relevant OTC derivative products. For certain OTC derivative products, the Company, along with other market participants, contributes derivative pricing information to aggregation services that synthesize the information and make it
accessible to subscribers. This information is then used to evaluate the fair value of these OTC derivative products. For more information regarding the Company�s risk management practices, see �Quantitative and Qualitative Disclosures
about Market Risk�Risk Management� in Part II, Item�7A herein. Goodwill and Intangible Assets. Goodwill. The Company tests goodwill for impairment on an annual basis on July�1 and on an interim basis when certain events or circumstances exist. The Company
tests for impairment at the reporting unit level, which is generally at the level of or one level below its business segments. Goodwill no longer retains its association with a particular acquisition once it has been assigned to a reporting unit. As
such, all of the activities of a reporting unit, whether acquired or organically developed, are available to support the value of the goodwill. Goodwill impairment is determined by comparing the estimated fair value of a reporting unit with its
respective carrying value. If the estimated fair value exceeds the carrying value, goodwill at the reporting unit level is not deemed to be impaired. If the estimated fair value is below carrying value, however, further analysis is required 80 Table of Contents to determine the amount of the impairment. Additionally, if the carrying value of a reporting unit is zero or a negative value and it is determined that it is more likely than not the goodwill is
impaired, further analysis is required. The estimated fair values of the reporting units are derived based on valuation techniques the Company believes market participants would use for each of the reporting units. The estimated fair values are
generally determined utilizing methodologies that incorporate price-to-book, price-to-earnings and assets under management multiples of certain comparable companies. The Company also utilizes a discounted cash flow methodology for certain reporting
units. Intangible
Assets. Amortizable intangible assets are amortized over their estimated useful lives and are reviewed for impairment on an interim basis when certain events or circumstances exist. For amortizable intangible assets,
an impairment exists when the carrying amount of the intangible asset exceeds its fair value. An impairment loss will be recognized only if the carrying amount of the intangible asset is not recoverable and exceeds its fair value. The carrying
amount of the intangible asset is not recoverable if it exceeds the sum of the expected undiscounted cash flows. Indefinite-lived intangible assets are not amortized but are reviewed annually (or more frequently when certain events or circumstances exist) for impairment. For indefinite-lived intangible assets, an
impairment exists when the carrying amount exceeds its fair value. For both goodwill and intangible assets, to the extent an impairment loss is recognized, the loss establishes the new cost basis of the asset. Subsequent
reversal of impairment losses is not permitted. For amortizable intangible assets, the new cost basis is amortized over the remaining useful life of that asset. Adverse market or economic events could result in impairment charges in future periods. See Notes 4 and 9 to the consolidated financial statements for
additional information about goodwill and intangible assets. Legal, Regulatory and Tax Contingencies. In the normal course of business, the Company has been named, from time to time, as a defendant in various legal actions, including arbitrations, class
actions and other litigation, arising in connection with its activities as a global diversified financial services institution. Certain of the actual or threatened legal actions include claims for substantial compensatory and/or punitive damages or claims for indeterminate amounts
of damages. In some cases, the entities that would otherwise be the primary defendants in such cases are bankrupt or in financial distress. The Company is also involved, from time to time, in other reviews, investigations and proceedings (both formal and informal) by governmental and
self-regulatory agencies regarding the Company�s business, including, among other matters, accounting and operational matters, certain of which may result in adverse judgments, settlements, fines, penalties, injunctions or other relief. Accruals for litigation and regulatory proceedings are generally
determined on a case-by-case basis. Where available information indicates that it is probable a liability had been incurred at the date of the consolidated financial statements and the Company can reasonably estimate the amount of that loss, the
Company accrues the estimated loss by a charge to income. In many proceedings, however, it is inherently difficult to determine whether any loss is probable or even possible or to estimate the amount of any loss. For certain legal proceedings, the
Company can estimate possible losses, additional losses, ranges of loss or ranges of additional loss in excess of amounts accrued. For certain other legal proceedings, the Company cannot reasonably estimate such losses, particularly for proceedings
that are in their early stages of development or where plaintiffs seek substantial or indeterminate damages. Numerous issues may need to be resolved, including through potentially 81 Table of Contents lengthy discovery and determination of important factual matters, and by addressing novel or unsettled legal questions relevant to the proceedings in question, before a loss or additional loss or
range of loss or additional loss can be reasonably estimated for any proceeding. The Company is subject to the income and indirect tax laws of the U.S., its states and municipalities and those of the foreign jurisdictions in which the Company has significant business operations. These
tax laws are complex and subject to different interpretations by the taxpayer and the relevant governmental taxing authorities. The Company must make judgments and interpretations about the application of these inherently complex tax laws when
determining the provision for income taxes and the expense for indirect taxes and must also make estimates about when certain items affect taxable income in the various tax jurisdictions. Disputes over interpretations of the tax laws may be settled
with the taxing authority upon examination or audit. The Company periodically evaluates the likelihood of assessments in each taxing jurisdiction resulting from current and subsequent years� examinations, and unrecognized tax benefits related
to potential losses that may arise from tax audits are established in accordance with the�guidance on accounting for unrecognized tax benefits. Once established, unrecognized tax benefits are adjusted when there is more information available or
when an event occurs requiring a change. The income of certain
foreign subsidiaries earned outside of the United States has been excluded from taxation in the U.S. as a result of a provision of U.S. tax law that defers the imposition of tax on certain active financial services income until such income is
repatriated to the United States as a dividend. This provision, which expired for taxable years beginning on or after January�1, 2012, had previously been extended by Congress on several occasions, including the most recent extension which
occurred during 2010. If this provision is not extended, the overall financial impact to the Company would depend upon the level, composition and geographic mix of future earnings but could increase the Company�s 2012 annual effective tax rate
and have an adverse impact on the Company�s net income, but not its cash flows due to utilization of tax attributes carryforwards. Significant judgment is required in making these estimates, and the actual cost of a legal claim, tax assessment or regulatory fine/penalty may ultimately
be materially different from the recorded accruals and unrecognized tax benefits, if any. See Notes 13 and 22 to the consolidated financial statements for additional information on legal proceedings and tax examinations. Special Purpose Entities and Variable Interest Entities. The Company�s involvement with special purpose entities
(�SPE�) consists primarily of the following: | � | Transferring financial assets into SPEs; |
| � | Acting as an underwriter of beneficial interests issued by securitization vehicles; |
| � | Holding one or more classes of securities issued by, or making loans to or investments in, SPEs that hold debt, equity, real estate or other assets; |
| � | Purchasing and selling (in both a market-making and a proprietary-trading capacity) securities issued by SPEs/variable interest entities (�VIE�), whether such vehicles are sponsored by the Company or not; |
| � | Entering into derivative transactions with SPEs (whether or not sponsored by the Company); |
| � | Providing warehouse financing to collateralized debt obligations and collateralized loan obligations; |
| � | Entering into derivative agreements with non-SPEs whose value is derived from securities issued by SPEs; |
| � | Servicing assets held by SPEs or holding servicing rights related to assets held by SPEs that are serviced by others under subservicing arrangements; |
| � | Serving as an asset manager to various investment funds that may invest in securities that are backed, in whole or in part, by SPEs; and |
Table of Contents| � | Structuring and/or investing in other structured transactions designed to provide enhanced, tax-efficient yields to the Company or its clients. |
Table of Contents Liquidity and Capital Resources. The Company�s senior management establishes the liquidity and capital
policies of the Company. Through various risk and control committees, the Company�s senior management reviews business performance relative to these policies, monitors the availability of alternative sources of financing, and oversees the
liquidity and interest rate and currency sensitivity of the Company�s asset and liability position. The Company�s Treasury Department, Firm Risk Committee, Asset and Liability Management Committee and other control groups assist in
evaluating, monitoring and controlling the impact that the Company�s business activities have on its consolidated statements of financial condition, liquidity and capital structure. Liquidity and capital matters are reported regularly to the
Board�s Risk Committee. The Balance Sheet. The Company actively monitors and evaluates the composition
and size of its balance sheet. A substantial portion of the Company�s total assets consists of liquid marketable securities and short-term receivables arising principally from sales and trading activities in the Institutional Securities
business segment. The liquid nature of these assets provides the Company with flexibility in managing the size of its balance sheet. The Company�s total assets decreased to $749,898 million at December�31, 2011 from $807,698 million at
December�31, 2010. The decrease in total assets was primarily due to a decrease in Financial instruments owned�Corporate equities and Corporate and other debt and Federal funds sold and securities purchased under agreements to sell and
Securities borrowed. The Company�s assets and liabilities
are primarily related to transactions attributable to sales and trading and securities financing activities. At December�31, 2011, securities financing assets and liabilities were $332 billion and $268 billion, respectively. At
December�31, 2010, securities financing assets and liabilities were $358 billion and $321 billion, respectively. Securities financing transactions include repurchase and resale agreements, securities borrowed and loaned transactions, securities
received as collateral and obligation to return securities received. Securities borrowed or purchased under agreements to resell and securities loaned or sold under agreements to repurchase are treated as collateralized financings (see Notes 2 and 6
to the consolidated financial statements). Securities sold under agreements to repurchase and Securities loaned were $135 billion at December�31, 2011 and averaged $180 billion during 2011. Securities purchased under agreements to resell and
Securities borrowed were $257 billion at December�31, 2011 and averaged $303 billion during 2011. In both cases, the period end balance was lower than the average balances for 2011 primarily, due to a decrease in the overall balance sheet
during the year. Securities financing assets and liabilities also
include matched book transactions with minimal market, credit and/or liquidity risk. Matched book transactions accommodate customers, as well as obtain securities for the settlement and financing of inventory positions. The customer receivable
portion of the securities financing transactions includes customer margin loans, collateralized by customer owned securities, and customer cash, which is segregated according to regulatory requirements. The customer payable portion of the securities
financing transactions primarily includes customer payables to the Company�s prime brokerage clients. The Company�s risk exposure on these transactions is mitigated by collateral maintenance policies that limit the Company�s credit
exposure to customers. Included within securities financing assets were $12 billion and $17 billion at December�31, 2011 and December�31, 2010, respectively, recorded in accordance with accounting guidance for the transfer of financial
assets that represented offsetting assets and liabilities for fully collateralized non-cash loan transactions. 84 Table of Contents The following table sets forth the Company�s tangible common equity at December�31, 2011 and
December�31, 2010 and average balances during 2011: | Balance at | Average�Balance(1) | |||||||||||
| December�31, 2011 | December�31, 2010 | 2011 | ||||||||||
| (dollars in millions) | ||||||||||||
| Common equity | $ | 60,541 | $ | 47,614 | $ | 54,382 | ||||||
| Preferred equity | 1,508 | 9,597 | 5,241 | |||||||||
| Morgan Stanley shareholders� equity | 62,049 | 57,211 | 59,623 | |||||||||
| Junior subordinated debentures issued to capital trusts | 4,853 | 4,817 | 4,835 | |||||||||
| Less: Goodwill and net intangible assets(2) | (6,691 | ) | (6,947 | ) | (6,836 | ) | ||||||
| Tangible Morgan Stanley shareholders� equity | $ | 60,211 | $ | 55,081 | $ | 57,622 | ||||||
| Common equity | $ | 60,541 | $ | 47,614 | $ | 54,382 | ||||||
| Less: Goodwill and net intangible assets(2) | (6,691 | ) | (6,947 | ) | (6,836 | ) | ||||||
| Tangible common equity(3) | $ | 53,850 | $ | 40,667 | $ | 47,546 | ||||||
| (1) | The Company calculates its average balances based upon month-end balances. |
| (2) | The goodwill and net intangible assets deduction exclude mortgage servicing rights (net of disallowable mortgage servicing rights) of $120 million and $141 million at December�31, 2011 and December�31, 2010, respectively, and include only the Company�s share of MSSB�s goodwill and intangible assets. |
| (3) | Tangible common equity, a non-GAAP financial measure, equals common equity less goodwill and net intangible assets as defined above. The Company views tangible common equity as a useful measure to investors because it is a commonly utilized metric and reflects the common equity deployed in the Company�s businesses. |
Table of Contents At December�31, 2011, the Company had approximately $1.6 billion remaining under its current share
repurchase program out of the $6 billion authorized by the Board of Directors in December 2006. The share repurchase program is for capital management purposes and considers, among other things, business segment capital needs as well as equity-based
compensation and benefit plan requirements. Share repurchases by the Company are subject to regulatory approval. During 2011, the Company did not repurchase common stock as part of its capital management share repurchase program (see also
�Market for Registrant�s Common Equity, Related Stockholder Matters and Issuer Purchases of Equity Securities� in Part II, Item�5). The Board of Directors determines the declaration and payment of dividends on a quarterly basis. In January 2012, the Company announced that its Board of
Directors declared a quarterly dividend per common share of $0.05. In December 2011, the Company also announced that the Board of Directors declared a quarterly dividend of $255.56 per share of Series A Floating Rate Non-Cumulative Preferred Stock
(represented by depositary shares, each representing 1/1,000th interest in a share of preferred stock and each having a dividend of $0.25556) and a quarterly dividend of $25.00 per share of Series C Non-Cumulative Non-Voting Perpetual Preferred
Stock. Required Capital. Beginning with the quarter ended June�30, 2010, the Company�s
capital estimation is based on the Required Capital Framework, an internal capital adequacy measure. This framework is a risk-based internal use of capital measure, which is compared with the Company�s regulatory capital to help ensure the
Company maintains an amount of risk-based going concern capital after absorbing potential losses from extreme stress events at a point in time. The difference between the Company�s regulatory capital and aggregate Required Capital is the
Company�s Parent capital. Average Tier 1 capital, aggregate Required capital and Parent capital for 2011 were approximately $51.2 billion, $30.9 billion and $20.3 billion, respectively. The Company generally holds Parent capital for prospective
regulatory requirements, including Basel III, organic growth, acquisitions and other capital needs. Tier 1 capital and common equity attribution to the business segments is based on capital usage calculated by Required Capital. In principle, each business segment is capitalized as if it were an
independent operating entity with limited diversification benefit between the business segments. Required Capital is assessed at each business segment and further attributed to product lines. This process is intended to align capital with the risks
in each business segment in order to allow senior management to evaluate returns on a risk-adjusted basis. The Required Capital Framework will evolve over time in response to changes in the business and regulatory environment and to incorporate
enhancements in modeling techniques. During 2012, the Company will continue to evaluate the framework with respect to the impact of future regulatory requirements, as appropriate. For a further discussion of the Company�s Tier 1 capital, see
�Regulatory Requirements� herein. The following table
presents the Company�s and business segments� average Tier 1 capital and average common equity for 2011 and 2010. | 2011 | 2010 | |||||||||||||||
| Average Tier 1 Capital | Average Common Equity | Average Tier 1 Capital | Average Common Equity | |||||||||||||
| (dollars�in�billions) | ||||||||||||||||
| Institutional Securities | $ | 26.2 | $ | 26.2 | $ | 26.0 | $ | 17.7 | ||||||||
| Global Wealth Management Group | 3.3 | 7.6 | 2.9 | 6.8 | ||||||||||||
| Asset Management | 1.4 | 2.2 | 1.9 | 2.1 | ||||||||||||
| Parent capital | 20.3 | 18.4 | 20.7 | 15.5 | ||||||||||||
| Total from continuing operations | 51.2 | 54.4 | 51.5 | 42.1 | ||||||||||||
| Discontinued operations | � | � | 0.1 | 0.3 | ||||||||||||
| Total | $ | 51.2 | $ | 54.4 | $ | 51.6 | $ | 42.4 | ||||||||
Table of Contents Capital Covenants. In October 2006 and April 2007, the Company executed replacement capital
covenants in connection with offerings by Morgan Stanley Capital Trust VII and Morgan Stanley Capital Trust VIII (the �Capital Securities�), which become effective after the scheduled redemption date in 2046. Under the terms of the
replacement capital covenants, the Company has agreed, for the benefit of certain specified holders of debt, to limitations on its ability to redeem or repurchase any of the Capital Securities for specified periods of time.�For a complete
description of the Capital Securities and the terms of the replacement capital covenants, see the Company�s Current Reports on Form 8-K dated October�12, 2006 and April�26, 2007. Liquidity Risk Management Framework. The primary goal of the Company�s liquidity risk management framework
is to ensure that the Company has access to adequate funding across a wide range of market conditions. The framework is designed to enable the Company to fulfill its financial obligations and support the execution of the Company�s business
strategies. The following principles guide the Company�s
liquidity risk management framework: | � | Sufficient liquid assets should be maintained to cover maturing liabilities; |
| � | Maturity profile of assets and liabilities should be aligned, with limited reliance on short-term funding; |
| � | Source, counterparty, currency, region, and term of funding should be diversified; and |
| � | Limited access to funding should be anticipated through the Contingency Funding Plan. |
| � | No government support; |
| � | No access to equity and unsecured debt markets; |
| � | Repayment of all unsecured debt maturing within one year; |
| � | Higher haircuts and significantly lower availability of secured funding; |
| � | Additional collateral that would be required by trading counterparties and certain exchanges and clearing organizations related to multi-notch credit rating downgrade; |
| � | Additional collateral that would be required due to collateral substitutions, collateral disputes and uncalled collateral; |
Table of Contents| � | Discretionary unsecured debt buybacks; |
| � | Drawdowns on unfunded commitments provided to third parties; |
| � | Client cash withdrawals and reduction in customer short positions that fund long positions; |
| � | Limited access to the foreign exchange swap markets; |
| � | Return of securities borrowed on an uncollateralized basis; and |
| � | Maturity roll-off of outstanding letters of credit with no further issuance. |
| At December 31, 2011 | ||||
| (dollars�in�billions) | ||||
| Cash deposits with banks | $ | 9 | ||
| Cash deposits with central banks | 31 | |||
| Unencumbered highly liquid securities: | ||||
| U.S. Government obligations | 80 | |||
| U.S. agency and agency mortgage-backed securities | 36 | |||
| Non-U.S. sovereign obligations(1) | 14 | |||
| Investments in money market funds | 1 | |||
| Other investment grade securities | 11 | |||
| Global Liquidity Reserve | $ | 182 | ||
| (1) | At December�31, 2011, approximately 93% of Non-U.S sovereign obligations were rated AAA. |
Table of Contents The currency profile of the Global Liquidity Reserve is consistent with the CFP and Liquidity Stress Tests. In addition to the Global Liquidity Reserve, the Company has
other cash and cash equivalents and other unencumbered assets that are available for monetization which are not included in the balances in the table above. Global Liquidity Reserve Held by the Parent and Operating Subsidiaries. The table below summarizes the Global Liquidity Reserve held by the Parent
and operating subsidiaries: | At December�31, 2011 | Average�Balance(1) 2011 | |||||||
| (dollars in billions) | ||||||||
| Parent | $ | 75 | $ | 78 | ||||
| Non-Bank Subsidiaries: | ||||||||
| Domestic | 18 | 12 | ||||||
| Foreign | 26 | 23 | ||||||
| Total Non-Bank Subsidiaries | 44 | 35 | ||||||
| Bank Subsidiaries: | ||||||||
| Domestic | 56 | 57 | ||||||
| Foreign | 7 | 7 | ||||||
| Total Bank Subsidiaries | 63 | 64 | ||||||
| Total | $ | 182 | $ | 177 | ||||
| (1) | The Company calculates the average Global Liquidity Reserve based upon daily amounts. |
Table of Contents The Company�s goal is to achieve an optimal mix of secured and unsecured funding while ensuring
continued growth in stable funding sources. The Institutional Securities business segment emphasizes the use of collateralized short-term borrowings to limit the growth of short-term unsecured funding, which is generally more subject to disruption
during periods of financial stress. The ability to fund less liquid assets on a secured basis may be impaired in a stress environment. To manage this risk, the Company obtains longer-term secured financing for less liquid assets and has minimal
reliance on overnight financing. At December�31, 2011, the weighted average maturity of the Company�s secured financing against less liquid�collateral was greater than 120 days.�The Company defines less liquid collateral as that
which is not consistent with the standards of the Global Liquidity Reserve.�In addition, the Company minimizes refinancing risk by diversifying across both counterparties and maturities.�The Company holds a portion of its Global Liquidity
Reserve against a potential disruption to its secured financing capabilities.�This potential disruption may be in the form of additional margin or reduced capacity to refinance maturing trades. The Company actively manages its secured financing
book in accordance with established limits on tenor by asset class and seeks to build a sufficient buffer to offset various risks discussed above. Unsecured Financing. The Company views long-term debt and deposits as stable sources of funding for core inventories
and less liquid assets. Securities inventories not financed by secured funding sources and the majority of current assets are financed with a combination of short-term funding, deposits, floating rate long-term debt and fixed rate long-term debt
swapped to a floating rate. The Company uses derivative products (primarily interest rate, currency and equity swaps) to assist in asset and liability management and to hedge interest rate risk (see Note 12 to the consolidated financial statements). Temporary Liquidity Guarantee Program
(�TLGP�). In October 2008, the Secretary of the U.S. Treasury invoked the systemic risk exception of the FDIC Improvement Act of 1991, and the FDIC announced the TLGP. Based on the Final Rule adopted on
November�21, 2008, the TLGP provides a guarantee, through the earlier of maturity or June�30, 2012, of certain senior unsecured debt issued by participating Eligible Entities (including the Company) between October�14, 2008 and
June�30, 2009. Of the $23.8 billion issued by the Company under the TLGP, $12.1 billion was still outstanding at December�31, 2011. Short-Term Borrowings. The Company�s unsecured short-term borrowings consist of commercial paper, bank loans,
bank notes and structured notes with maturities of 12 months or less at issuance. The table below summarizes the Company�s short-term unsecured borrowings: | At December�31, 2011 | At December�31, 2010 | |||||||
| (dollars�in�millions) | ||||||||
| Commercial paper(1) | $ | 978 | $ | 945 | ||||
| Other short-term borrowings | 1,865 | 2,311 | ||||||
| Total | $ | 2,843 | $ | 3,256 | ||||
| (1) | At December�31, 2011, the majority of the commercial paper balance was issued as part of client transactions and is not used for the Company�s general funding purposes. |
Table of Contents Deposits were as follows: | At December�31, 2011(1) | At December�31, 2010(1) | |||||||
| (dollars in millions) | ||||||||
| Savings and demand deposits(2) | $ | 63,029 | $ | 59,856 | ||||
| Time deposits(3) | 2,633 | 3,956 | ||||||
| Total | $ | 65,662 | $ | 63,812 | ||||
| (1) | Total deposits subject to FDIC Insurance at December�31, 2011 and December�31, 2010 were $52 billion and $48 billion, respectively. |
| (2) | Amounts include non-interest bearing deposits of $1,270 million and $30 million at December�31, 2011 and December�31, 2010, respectively. |
| (3) | Certain time deposit accounts are carried at fair value under the fair value option (see Note 4 to the consolidated financial statements). |
| Parent | Subsidiaries | Total | ||||||||||
| (dollars�in�millions) | ||||||||||||
| Due in 2012 | $ | 33,811 | $ | 1,271 | $ | 35,082 | ||||||
| Due in 2013 | 24,464 | 554 | 25,018 | |||||||||
| Due in 2014 | 20,493 | 991 | 21,484 | |||||||||
| Due in 2015 | 17,914 | 3,974 | 21,888 | |||||||||
| Due in 2016 | 17,557 | 1,470 | 19,027 | |||||||||
| Thereafter | 60,522 | 1,213 | 61,735 | |||||||||
| Total | $ | 174,761 | $ | 9,473 | $ | 184,234 | ||||||
Table of Contents The rating agencies have stated that they currently incorporate various degrees of uplift from perceived
government support in the credit ratings of systemically important banks, including the credit ratings of the Company. Rating agencies continue to monitor progress of U.S. financial reform legislation to assess whether the possibility of
extraordinary government support for the financial system in any future financial crises is negatively impacted. Legislative outcomes may lead to reduced uplift assumptions for U.S. banks and thereby place downward pressure on credit ratings. At the
same time, proposed U.S. financial reform legislation also has positive implications for credit ratings such as higher standards for capital and liquidity levels. The net result on credit ratings and the timing of any change in rating agency
assumptions on support is currently uncertain. At
February�17, 2012, the Company�s and Morgan Stanley Bank, N.A.�s senior unsecured ratings were as set forth below. The long-term credit ratings on the Company by Moody�s Investor Services, Inc (�Moody�s�) and
Standard�& Poor�s Ratings Services (�S&P�) are currently at different levels (commonly referred to as �split ratings�). | Company | Morgan Stanley Bank, N.A. | |||||||||||
| Short-Term Debt | Long-Term Debt | Rating Outlook | Short-Term Debt | Long-Term Debt | Rating Outlook | |||||||
| Dominion Bond Rating Service Limited | R-1�(middle) | A�(high) | Negative | � | � | � | ||||||
| Fitch Ratings(1) | F1 | A | Stable | F1 | A | Stable | ||||||
| Moody�s Investor Services, Inc.(2) | P-1 | A2 | Downgrade Review | P-1 | A1 | Downgrade Review | ||||||
| Rating and Investment Information, Inc. | a-1 | A+ | Negative | � | � | � | ||||||
| Standard�& Poor�s(3) | A-2 | A- | Negative | A-1 | A | Negative | ||||||
| (1) | On December�13, 2011, in the context of a global review of trading and universal banks, Fitch Ratings affirmed the Company�s and Morgan Stanley Bank, N.A.�s A/F1 long- and short-term debt ratings. A Stable Outlook was assigned. |
| (2) | On February�15, 2012, Moody�s placed the ratings of 17 banks on review for downgrade in the context of a broad review of global banks with capital markets operations. As part of this review, Moody�s placed the Company�s and Morgan Stanley Bank, N.A�s �A2/A1� long-term and �P-1� short-term ratings on review for downgrade. |
| (3) | On November�29, 2011, Standard�& Poor�s released new bank ratings for the top global banks based upon its revised methodology. The Company�s long- and short-term debt ratings were lowered one-notch from A/A-1 to A-/A-2 and Morgan Stanley Bank, N.A�s long-term debt rating was lowered from A+ to A. Morgan Stanley Bank, N.A.�s short-term debt rating was affirmed at A-1. |
Table of Contents collateralized mortgage obligations, corporate bonds and loans, municipal bonds and other types of financial assets. The Company may retain interests in the securitized financial assets as one or
more tranches of the securitization. These retained interests are included in the consolidated statements of financial condition at fair value. Any changes in the fair value of such retained interests are recognized in the consolidated statements of
income. Retained interests in securitized financial assets were approximately $2.9 billion and $5.4 billion at December�31, 2011 and December�31, 2010, respectively, substantially all of which were related to U.S. agency collateralized
mortgage obligations, commercial mortgage loan and residential mortgage loan securitization transactions. For further information about the Company�s securitization activities, see Notes 2 and 7 to the consolidated financial statements. The Company has entered into liquidity facilities with SPEs and
other counterparties, whereby the Company is required to make certain payments if losses or defaults occur. The Company often may have recourse to the underlying assets held by the SPEs in the event payments are required under such liquidity
facilities (see Note 13 to the consolidated financial statements). Asset Management Activities. As a general partner in certain private equity and real estate partnerships, the Company
receives distributions from the partnerships according to the provisions of the partnership agreements. The Company may, from time to time, be required to return all or a portion of such distributions to the limited partners in the event the limited
partners do not achieve a certain return as specified in various partnership agreements, subject to certain limitations. Guarantees. Accounting guidance for guarantees requires the Company to disclose information about its obligations
under certain guarantee arrangements. Guarantees are defined as contracts and indemnification agreements that contingently require a guarantor to make payments to the guaranteed party based on changes in an underlying measure (such as an interest or
foreign exchange rate, a security or commodity price, an index, or the occurrence or non-occurrence of a specified event) related to an asset, liability or equity security of a guaranteed party. Guarantees are also defined as contracts that
contingently require the guarantor to make payments to the guaranteed party based on another entity�s failure to perform under an agreement as well as indirect guarantees of the indebtedness of others. The table below summarizes certain information regarding the Company�s
obligations under guarantee arrangements at December�31, 2011: | Maximum Potential Payout/Notional | Carrying Amount (Asset)/ Liability | Collateral/ Recourse | ||||||||||||||||||||||||||
| Years to Maturity | ||||||||||||||||||||||||||||
| Type of Guarantee | Less than�1 | 1-3 | 3-5 | Over�5 | Total | |||||||||||||||||||||||
| (dollars in millions) | ||||||||||||||||||||||||||||
| Credit derivative contracts(1) | $ | 487,620 | $ | 828,686 | $ | 787,357 | $ | 328,741 | $ | 2,432,404 | $ | 93,629 | $ | � | ||||||||||||||
| Other credit contracts | 65 | 2,356 | 717 | 2,469 | 5,607 | (1,146 | ) | � | ||||||||||||||||||||
| Non-credit derivative contracts(1) | 1,332,802 | 835,776 | 318,162 | 309,471 | 2,796,211 | 112,936 | � | |||||||||||||||||||||
| Standby letters of credit and other�financial guarantees issued(2)(3) | 1,426 | 788 | 1,055 | 5,554 | 8,823 | (30 | ) | 5,749 | ||||||||||||||||||||
| Market value guarantees | � | 53 | 203 | 561 | 817 | 13 | 90 | |||||||||||||||||||||
| Liquidity facilities | 5,021 | 1,232 | 38 | 67 | 6,358 | � | 6,995 | |||||||||||||||||||||
| Whole loan sales representations and warranties | � | � | � | 24,557 | 24,557 | 65 | � | |||||||||||||||||||||
| Securitization representations and warranties | � | � | � | 83,544 | 83,544 | 24 | � | |||||||||||||||||||||
| General partner guarantees | 259 | 40 | 17 | 155 | 471 | 73 | � | |||||||||||||||||||||
| (1) | Carrying amounts of derivative contracts are shown on a gross basis prior to cash collateral or counterparty netting. For further information on derivative contracts, see Note 12 to the consolidated financial statements. |
| (2) | Approximately $2.4�billion of standby letters of credit are also reflected in the �Commitments� table in primary and secondary lending commitments. Standby letters of credit are recorded at fair value within Financial instruments owned or Financial instruments sold, not yet purchased in the consolidated statements of financial condition. |
Table of Contents| (3) | Amounts include guarantees issued by consolidated real estate funds sponsored by the Company of approximately $291�million. These guarantees relate to obligations of the fund�s investee entities, including guarantees related to capital expenditures and principal and interest debt payments. Accrued losses under these guarantees of approximately $55�million are reflected as a reduction of the carrying value of the related fund investments, which are reflected in Financial instruments owned�Investments on the consolidated statements of financial condition. |
| Years to Maturity | Total at December�31, 2011 | |||||||||||||||||||
| Less than�1 | 1-3 | 3-5 | Over�5 | |||||||||||||||||
| (dollars in millions) | ||||||||||||||||||||
| Letters of credit and other financial guarantees obtained to satisfy collateral requirements | $ | 1,645 | $ | 6 | $ | 6 | $ | � | $ | 1,657 | ||||||||||
| Investment activities | 1,146 | 317 | 68 | 270 | 1,801 | |||||||||||||||
| Primary lending commitments�investment grade(1)(2) | 11,581 | 10,206 | 29,417 | 440 | 51,644 | |||||||||||||||
| Primary lending commitments�non-investment grade(2) | 1,027 | 3,937 | 9,014 | 1,673 | 15,651 | |||||||||||||||
| Secondary lending commitments(3) | 90 | 305 | 23 | 130 | 548 | |||||||||||||||
| Commitments for secured lending transactions | 293 | 295 | 159 | � | 747 | |||||||||||||||
| Forward starting reverse repurchase agreements and securities borrowing agreements(4) | 40,792 | � | � | � | 40,792 | |||||||||||||||
| Commercial and residential mortgage-related commitments | 790 | 22 | 152 | 484 | 1,448 | |||||||||||||||
| Other commitments | 1,013 | 306 | 5 | � | 1,324 | |||||||||||||||
| Total | $ | 58,377 | $ | 15,394 | $ | 38,844 | $ | 2,997 | $ | 115,612 | ||||||||||
| (1) | This amount includes commitments to asset-backed commercial paper conduits of $275 million at December�31, 2011, of which $138�million have maturities of less than one year and $137 million of which have maturities of one to three years. |
| (2) | This amount includes $6.4 billion of investment grade and $1.6 billion of non-investment grade unfunded commitments accounted for as held for investment at December�31, 2011. The remainder of these lending commitments are carried at fair value. |
| (3) | These commitments are recorded at fair value within Financial instruments owned and Financial instruments sold, not yet purchased in the consolidated statements of financial condition (see Note 4 to the consolidated financial statements). |
| (4) | The Company enters into forward starting reverse repurchase and securities borrowing agreements (agreements that have a trade date at or prior to December�31, 2011 and settle subsequent to period-end) that are primarily secured by collateral from U.S. government agency securities and other sovereign government obligations. These agreements primarily settle within three business days and of the amount at December�31, 2011, $36.4 billion settled within three business days. |
Table of Contents In the normal course of business, the Company enters into various contractual obligations that may require
future cash payments. Contractual obligations include long-term borrowings, other secured financings, contractual interest payments, contractual payments on time deposits, operating leases, purchase obligations and expected contributions for pension
and postretirement plans. The Company�s future cash payments associated with certain of its obligations at December�31, 2011 are summarized below: | Payments Due in: | ||||||||||||||||||||
| At December�31, 2011 | 2012 | 2013-2014 | 2015-2016 | Thereafter | Total | |||||||||||||||
| (dollars in millions) | ||||||||||||||||||||
| Long-term borrowings(1) | $ | 35,082 | $ | 46,502 | $ | 40,915 | $ | 61,735 | $ | 184,234 | ||||||||||
| Other secured financings(1) | 8,361 | 6,114 | 1,478 | 2,743 | 18,696 | |||||||||||||||
| Contractual interest payments(2) | 6,418 | 10,830 | 7,936 | 21,659 | 46,843 | |||||||||||||||
| Contractual interest payments on time deposits(3) | 1,228 | 1,493 | � | � | 2,721 | |||||||||||||||
| Operating leases�office facilities(4) | 693 | 1,229 | 876 | 2,453 | 5,251 | |||||||||||||||
| Operating leases�equipment(4) | 210 | 429 | 158 | 162 | 959 | |||||||||||||||
| Purchase obligations(5) | 814 | 621 | 270 | 54 | 1,759 | |||||||||||||||
| Pension and postretirement plans�expected contribution(6) | 50 | � | � | � | 50 | |||||||||||||||
| Total(7) | $ | 52,856 | $ | 67,218 | $ | 51,633 | $ | 88,806 | $ | 260,513 | ||||||||||
| (1) | See Note 11 to the consolidated financial statements. Amounts presented for Other secured financings are financings with original maturities greater than one year. |
| (2) | Amounts represent estimated future contractual interest payments related to unsecured long-term borrowings based on applicable interest rates at December�31, 2011. Amounts include stated coupon rates, if any, on structured or index-linked notes. |
| (3) | Amounts represent contractual principal and interest payments related to time deposits primarily held at the Subsidiary Banks. |
| (4) | See Note 13 to the consolidated financial statements. |
| (5) | Purchase obligations for goods and services include payments for, among other things, consulting, outsourcing, printing, computer and telecommunications maintenance agreements, certain license agreements related to MSSB, and certain transmission, transportation and storage contracts related to the commodities business. Purchase obligations at December�31, 2011 reflect the minimum contractual obligation under legally enforceable contracts with contract terms that are both fixed and determinable. These amounts exclude obligations for goods and services that already have been incurred and are reflected on the Company�s consolidated statement of financial condition. |
| (6) | See Note 21 to the consolidated financial statements. |
| (7) | Amounts exclude unrecognized tax benefits, as the timing and amount of future cash payments are not determinable at this time (see Note 22 to the consolidated financial statements for further information). |
Table of Contents In June 2011, the U.S. banking regulators published final regulations implementing a provision of the
Dodd-Frank Act requiring certain institutions supervised by the Federal Reserve, including the Company, be subject to capital requirements that are not less than the generally applicable risk-based capital requirements.�As a result, the
generally applicable capital standards, which are based on Basel I standards, but may themselves change over time, will serve as a permanent floor to minimum capital requirements calculated under the Basel II standards the Company is currently
required to implement, as well as future capital standards. Basel
III contains new capital standards that raise the quality of capital and strengthen counterparty credit risk capital requirements and introduce a leverage ratio as a supplemental measure to the risk-based ratio. Basel III includes a new capital
conservation buffer, which imposes a common equity requirement above the new minimum that can be depleted under stress, subject to restrictions on capital actions, a new additional loss absorbency capital requirement for global systemically
important banks (�GSIB�) such as the Company, and a new countercyclical buffer which regulators can activate during periods of excessive credit growth in their jurisdiction. The Basel III proposals complement an earlier proposal for
revisions to the market risk framework that increases capital requirements for securitizations within the Company�s trading book. In 2011, the U.S. regulators issued proposed rules that are intended to implement certain aspects of the market
risk framework proposals. The U.S. regulators will require implementation of Basel III subject to an extended phase-in period. In December 2011, the Federal Reserve issued final rules on Capital Plans, which require large bank holding companies such as the Company to submit
capital plans on an annual basis in order�for the Federal Reserve to assess the companies� systems and processes that incorporate forward-looking projections of revenue and losses to monitor and maintain their internal capital adequacy.
The rules also�require that such companies to obtain approval from the Federal Reserve before making a capital action. Under the Basel Committee�s proposed framework, based on a preliminary analysis of the guidelines published to date and other factors, the Company
estimates its pro forma Tier 1 common ratio under Basel III will be in a range between 8% and 10% by the end of 2012. These are preliminary estimates and may change based on guidelines for implementation to be issued by the Federal Reserve. These
preliminary estimates are forward-looking and are subject to risks and uncertainties that may cause actual results to differ materially. For a discussion of risks and uncertainties that may affect the future results of the Company, please see
�Risk Factors� in Part I, Item�1A herein. In
accordance with the Federal Reserve�s new Capital Plans final rule,�Tier 1 common capital is calculated as Tier 1 capital less non-common elements in Tier 1 capital. Non-common elements include�perpetual preferred stock and related
surplus, minority interests in subsidiaries, trust preferred securities and mandatory convertible preferred securities. The Federal Reserve�will work with the other federal banking agencies to implement Basel III and to propose a Basel III Tier
1 common capital ratio as a new minimum regulatory capital ratio. The existing supervisory definition of Tier 1 common capital will remain in force under the Capital Plans final rule until the Federal Reserve adopts the Basel III Tier 1 common
ratio. Pursuant to provisions of the Dodd-Frank Act, over time,
trust preferred securities will no longer qualify as Tier 1 capital but will only qualify as Tier 2 capital. This change in regulatory capital treatment will be phased in incrementally during a transition period that will start on January�1,
2013 and end on January�1, 2016. This provision of the Dodd-Frank Act accelerates the phasing in of the disqualification of the trust preferred securities as provided for by Basel III. At December�31, 2011, the Company was in compliance with Basel I capital requirements with ratios of Tier�1 capital
to RWAs of 16.6% and total capital to RWAs of 17.8% (6% and 10% being well-capitalized for regulatory purposes, respectively). Also, the ratio of Tier 1 common�capital to RWAs�was 13.0% (5% being the minimum under the Federal
Reserve�s new capital plan framework). In addition, financial holding companies are also subject to a Tier 1 leverage ratio as defined by the Federal Reserve. The Company calculated its Tier 1 leverage ratio as Tier 1 capital divided by
adjusted average total assets (which reflects adjustments for disallowed 96 Table of Contents goodwill, certain intangible assets, deferred tax assets and financial and non-financial equity investments). The adjusted average total assets are derived using weekly balances for the year. At
December�31, 2011, the Company was in compliance with this leverage restriction, with a Tier 1 leverage ratio of 6.8% (5% being well-capitalized for regulatory purposes). The following table reconciles the Company�s total shareholders�
equity to Tier 1 common, Tier 1, Tier 2 and Total allowable capital as defined by the regulations issued by the Federal Reserve and presents the Company�s consolidated capital ratios at December�31, 2011 and December�31, 2010: | At December�31, 2011 | At December�31, 2010 | |||||||
| (dollars�in�millions) | ||||||||
| Allowable capital | ||||||||
| Common shareholders� equity | $ | 60,541 | $ | 47,614 | ||||
| Less: Goodwill | (6,686 | ) | (6,739 | ) | ||||
| Less: Non-servicing intangible assets | (4,165 | ) | (4,526 | ) | ||||
| Less: Net deferred tax assets | (4,860 | ) | (3,984 | ) | ||||
| Less: After-tax debt valuation adjustment | (2,296 | ) | (20 | ) | ||||
| Other deductions | (1,511 | ) | (1,986 | ) | ||||
| MSSB Goodwill/Intangibles-Apportionment | � | 4,317 | ||||||
| Tier 1 common capital(2) | 41,023 | 34,676 | ||||||
| Qualifying preferred stock | 1,508 | 9,597 | ||||||
| Qualifying restricted core capital elements | 9,821 | 12,924 | ||||||
| Less: MSSB Goodwill/Intangibles-Apportionment | � | (4,317 | ) | |||||
| Tier 1 capital | 52,352 | 52,880 | ||||||
| Qualifying subordinated debt and restricted core capital elements | 4,546 | 2,412 | ||||||
| Other qualifying amounts | 17 | 82 | ||||||
| Other deductions | (721 | ) | (897 | ) | ||||
| Tier 2 capital | 3,842 | 1,597 | ||||||
| Total allowable capital | $ | 56,194 | $ | 54,477 | ||||
| Total risk weighted assets(1) | $ | 315,293 | $ | 340,884 | ||||
| Capital ratios | ||||||||
| Total capital ratio(1) | 17.8 | % | 16.0 | % | ||||
| Tier 1 common capital ratio(1)(2) | 13.0 | % | 10.2 | % | ||||
| Tier 1 capital ratio(1) | 16.6 | % | 15.5 | % | ||||
| Tier 1 leverage ratio | 6.8 | % | 6.6 | % | ||||
| (1) | At December�31, 2010, the Company�s RWAs, Total capital ratio, Tier 1 common capital ratio and Tier 1 capital ratio were adjusted to $340,884 million, 16.0%, 10.2% and 15.5%, respectively, from $329,560 million, 16.5%, 10.5% and 16.1%, respectively, based on revised guidance from the Federal Reserve about the Company�s capital treatment for OTC derivatives collateral. |
| (2) | Tier 1 common capital ratio equals Tier 1 common capital divided by RWA. On December�30, 2011, the Federal Reserve formalized regulatory definitions for Tier 1 common capital and Tier 1 common capital ratio. The Federal Reserve defined Tier 1 common capital as Tier 1 capital less non-common elements in Tier 1 capital, including perpetual preferred stock and related surplus, minority interest in subsidiaries, trust preferred securities and mandatory convertible preferred securities. Previously, the Company�s definition of Tier 1 common capital included all of the items noted in the Federal Reserve�s definition, but it also included an adjustment for the portion of goodwill and non-servicing intangible assets associated with MSSB�s noncontrolling interests (i.e., Citi�s share of MSSB�s goodwill and intangibles). The Company�s conformance to the Federal Reserve�s definition under the final rule reduced its Tier 1 common capital and Tier 1 common ratio by approximately $4.2 billion and 132 basis points, respectively at December�31, 2011. |
Table of Contents Total allowable capital is composed of Tier 1 capital, which includes Tier 1 common capital, and Tier 2
capital. Tier 1 common capital is defined as Tier 1 capital less non-common elements in Tier 1 capital, including qualifying perpetual stock and qualifying restricted core capital elements, as per the Capital Plans final rule. Tier 1 capital
consists predominately of common shareholders� equity as well as qualifying preferred stock and qualifying restricted core capital elements (trust preferred securities and noncontrolling interests) less goodwill, non-servicing intangible assets
(excluding allowable mortgage servicing rights), net deferred tax assets (recoverable in excess of one year), an after-tax debt valuation adjustment and certain other deductions, including equity investments. The debt valuation adjustment in the
above table represents the cumulative change in fair value of certain long-term and short-term borrowings that was attributable to the Company�s own instrument-specific credit spreads and is included in retained earnings. For a further
discussion of fair value, see Note 4 to the consolidated financial statements. At December�31, 2011, the Company calculated its RWAs in accordance with the regulatory capital requirements of the Federal Reserve, which is consistent with guidelines described under Basel I. RWAs
reflect both on and off-balance sheet risk of the Company. The risk capital calculations will evolve over time as the Company enhances its risk management methodology and incorporates improvements in modeling techniques while maintaining compliance
with the regulatory requirements and interpretations. Market RWAs
reflect�capital charges attributable to the risk of loss resulting from adverse changes in market prices and other factors.�For a further discussion of the Company�s�market risks and Value-at-Risk (�VaR�) model, see
�Quantitative and Qualitative Disclosures about Market Risk�Risk Management� in Part II, Item�7A herein. Market RWAs incorporate two components: systematic risk and specific risk. Systematic and specific risk charges are computed
using either the Company�s VaR model or Standardized Approach in accordance with regulatory requirements. Credit RWAs reflect capital charges attributable to the risk of loss arising from a borrower or counterparty failing to meet its financial obligations. For a further discussion of the Company�s
credit risks, see �Quantitative and Qualitative Disclosures about Market Risk�Risk Management�Credit Risk� in Part II, Item�7A herein. Liquidity. The Basel Committee has developed two standards for supervisors to use in liquidity risk supervision. The first standard�s objective is to promote
the short-term resilience of the liquidity risk profile of banks and bank holding companies.�The Basel Committee developed the Liquidity Coverage Ratio (�LCR�) to ensure banks have sufficient high-quality liquid assets to cover net
outflows arising from significant stress lasting 30 calendar days.�The standard requires that the value of the ratio be no lower than 100%. The second standard�s objective is to promote resilience over a longer time horizon. The Net Stable
Funding Ratio (�NSFR�) has a time horizon of one year and builds on traditional �net liquid asset� and �cash capital� methodologies used widely by internationally active banking organizations to provide a sustainable
maturity structure of assets and liabilities. The NSFR is defined as the amount of available stable funding to the amount of required stable funding.�This ratio must be greater than 100%. After an observation period beginning in 2011, the LCR,
including any revisions, will be introduced on January�1, 2015. The NSFR, including any revisions, will move to a minimum standard by January�1, 2018. The Company will continue to monitor the development and the potential impact of these
standards. In addition, in December 2011, the Federal Reserve
issued proposed rules to implement certain requirements of the systemic risk regime, including with respect to liquidity. The proposed rules would require systemically important financial institutions, such as the Company, to maintain a sufficient
quantity of highly liquid assets to survive a projected 30-day liquidity stress event, to conduct regular liquidity stress tests, and to implement various liquidity risk management requirements. 98 Table of Contents Effects of Inflation and Changes in Foreign Exchange Rates. The Company�s assets to a large extent are liquid in nature and,
therefore, are not significantly affected by inflation, although inflation may result in increases in the Company�s expenses, which may not be readily recoverable in the price of services offered. To the extent inflation results in rising
interest rates and has other adverse effects upon the securities markets and upon the value of financial instruments, it may adversely affect the Company�s financial position and profitability. A significant portion of the Company�s business is conducted in
currencies other than the U.S. dollar, and changes in foreign exchange rates relative to the U.S. dollar can therefore affect the value of non-U.S. dollar net assets, revenues and expenses. Potential exposures as a result of these fluctuations in
currencies are closely monitored, and, where cost-justified, strategies are adopted that are designed to reduce the impact of these fluctuations on the Company�s financial performance. These strategies may include the financing of non-U.S.
dollar assets with direct or swap-based borrowings in the same currency and the use of currency forward contracts or the spot market in various hedging transactions related to net assets, revenues, expenses or cash flows. 99 Table of Contents Item�7A.����Quantitative and Qualitative Disclosures
about Market Risk. Risk Management. Overview. Management believes effective risk management is vital to the success of the Company�s business activities. Accordingly,
the Company employs an enterprise risk management (�ERM�) framework to integrate the diverse roles of the risk departments into a holistic enterprise structure and to facilitate the incorporation of risk evaluation into decision-making
processes across the Company. The Company has policies and procedures in place to identify, assess, monitor and manage the significant risks involved in the activities of its Institutional Securities, Global Wealth Management Group and Asset
Management business segments as well as at the holding company level. Principal risks involved in the Company�s business activities include market, credit, capital and liquidity, operational, legal and regulatory risk. The cornerstone of the Company�s risk management philosophy is the
execution of risk-adjusted returns through prudent risk-taking that protects the Company�s capital base and franchise. Five key principles underlie this philosophy: comprehensiveness, independence, accountability, defined risk tolerance and
transparency. The fast-paced, complex, and constantly-evolving nature of global financial markets requires that the Company maintain a risk management culture that is incisive, knowledgeable about specialized products and markets, and subject to
ongoing review and enhancement. To help ensure the efficacy of risk management, which is an essential component of the Company�s reputation, senior management requires thorough and frequent communication and the appropriate escalation of risk
matters. Risk Governance Structure. Risk management at the Company requires independent company-level oversight,
accountability of the Company�s business segments, and effective communication of risk matters to senior management and across the Company. The nature of the Company�s risks, coupled with its risk management philosophy, informs the
Company�s risk governance structure. The Company�s risk governance structure is comprised of the Board of Directors; the Risk Committee of the Board (�BRC�), the Audit Committee of the Board (�BAC�), and the Operations
and Technology Committee of the Board (�BOTC�); the Firm Risk Committee (�FRC�); senior management oversight (including the Chief Executive Officer, Chief Risk Officer, Chief Financial Officer, Chief Legal Officer and Chief
Compliance Officer); the Internal Audit Department and risk managers, committees, and groups within and across the Company�s business segments. A risk governance structure composed of independent but complementary entities facilitates efficient
and comprehensive supervision of the Company�s risk exposures and processes. Morgan Stanley Board of Directors. The Board has oversight for the Company�s ERM framework and is responsible for helping to ensure that the Company�s risks
are managed in a sound manner. The Board has authorized the committees within the ERM framework to help facilitate its risk oversight responsibilities. Risk Committee of the Board. The BRC, appointed by the Board, is composed of non-management directors. The BRC is
responsible for assisting the Board in the oversight of the Company�s risk governance structure; the Company�s risk management and risk assessment guidelines and policies regarding market, credit, and liquidity and funding risk; the
Company�s risk tolerance; and the performance of the Chief Risk Officer. The BRC reports to the full Board on a regular basis. Audit Committee of the Board. The BAC, appointed by the Board, is composed of independent directors (pursuant to the
Company�s Corporate Governance Policies and applicable New York Stock Exchange and Securities and Exchange Commission (�SEC�) rules) and is responsible for oversight of the integrity of the Company�s consolidated financial
statements, the Company�s compliance with legal and regulatory requirements, the Company�s system of internal controls, the qualifications and independence of the Company�s 100 Table of Contents independent auditor, and the performance of the Company�s internal and independent auditors. In addition, the BAC assists the Board in its oversight of certain aspects of risk management,
including review of the major franchise, reputational, legal and compliance risk exposures of the Company and the steps management has taken to monitor and control such exposures, as well as guidelines and policies that govern the process for risk
assessment and risk management. The BAC reports to the full Board on a regular basis. Operations and Technology Committee of the Board. The BOTC, established in 2011 and appointed by the Board, is responsible for assisting the Board in its oversight of
the Company�s operations and technology strategy�and significant investments in support of such strategy�and operational risks, reviewing the major operational risk exposures of the Company and the steps management has taken to
monitor and control such exposures. The BOTC is also responsible for the review and approval of operations and technology policies, as well as the review of the Company�s risk management and risk assessment guidelines and policies regarding
operational risk. The BOTC reports to the full Board on a regular basis. Firm Risk Committee. The Board has also authorized the FRC, a management committee appointed and chaired by the Chief Executive Officer, which includes the most senior
officers of the Company, including the Chief Risk Officer, Chief Legal Officer and Chief Financial Officer, to oversee Morgan Stanley�s risk management structure. The FRC�s responsibilities include oversight of the Company�s risk
management principles, procedures and limits and the monitoring of capital levels and material market, credit, liquidity and funding, legal, compliance, operational, franchise and regulatory risk matters, and other risks, as appropriate, and the
steps management has taken to monitor and manage such risks. The FRC reports to the full Board, the BAC, the BOTC and the BRC through the Company�s Chief Risk Officer and Chief Financial Officer. Chief Risk Officer. The Chief Risk
Officer, who reports to the Chief Executive Officer and the BRC, oversees compliance with Company risk limits; approves exceptions to the Company�s risk limits; reviews material market, credit and operational risks; and reviews results of risk
management processes with the Board, the BRC, the BAC, and the BOTC, as appropriate. The Chief Risk Officer also coordinates with the Compensation, Management Development and Succession Committee of the Board to evaluate whether the Company�s
compensation arrangements encourage unnecessary or excessive risk-taking, and whether risks arising from the Company�s compensation arrangements are reasonably likely to have a material adverse effect on the Company. Internal Audit Department. The Internal
Audit Department provides independent risk and control assessment and reports to the BAC and administratively to the Chief Legal Officer. The Internal Audit Department examines the Company�s operational and control environment and conducts
audits designed to cover all major risk categories. Independent Risk Management Functions. The independent risk management functions (Market Risk, Credit Risk
Management, Operational Risk and Corporate Treasury departments) are independent of the Company�s business units. These groups assist senior management and the FRC in monitoring and controlling the Company�s risk through a number of
control processes. Each function maintains its own risk governance structure with specified individuals and committees responsible for aspects of managing risk. Further discussion about the responsibilities of the risk management functions may be
found below under �Market Risk,� �Credit Risk,� and �Operational Risk� and in �Management�s Discussion and Analysis of Financial Condition and Results of Operation�Liquidity and Capital Resources� in
Part II, Item�7 herein. Control
Groups. The Company control groups include the Human Resources Department, the Legal and Compliance Division, the Operations Division, Global Technology and Data, the Tax Department and Finance. The Company control
groups coordinate with the business segment control groups to review the risk monitoring and risk management policies and procedures relating to, among other things, controls over financial reporting and disclosure; the business segment�s
market, credit and operational risk profile; sales practices; reputation; legal enforceability; and operational and technological risks. Participation by the senior officers of the Company and business segment control groups helps ensure that risk
policies and procedures, exceptions to risk limits, new products and business ventures, and transactions with risk elements undergo thorough review. 101 Table of Contents Divisional Risk Committees. Each business segment has a risk committee
that is responsible for helping to ensure that the business segment, as applicable, adheres to established limits for market, credit, operational and other risks; implements risk measurement, monitoring, and management policies and procedures that
are consistent with the risk framework established by the FRC; and reviews, on a periodic basis, its aggregate risk exposures, risk exception experience, and the efficacy of its risk identification, measurement, monitoring and management policies
and procedures, and related controls. Stress Value-at-Risk. The Company frequently enhances its market and credit
risk management framework to address severe stresses that are observed in global markets during economic downturns. During 2011, the Company expanded and improved its risk measurement processes, including stress tests and scenario analysis, and
further refined its market and credit risk limit framework. Stress Value-at-Risk (�S-VaR�), a proprietary methodology that comprehensively measures the Company�s market and credit risks, was further refined and continues to be an
important metric used in establishing the Company�s risk appetite and its capital allocation framework. S-VaR simulates many stress scenarios based on more than 25 years of historical data and attempts to capture the different liquidities of
various types of general and specific risks. Additionally, S-VaR captures event and default risks that are particularly relevant for credit portfolios. Risk Management Process. The following is a discussion of the Company�s risk management policies and procedures for its principal risks (capital and liquidity risk is
discussed in �Management�s Discussion and Analysis of Financial Condition and Results of Operations�Liquidity and Capital Resources� in Part II, Item�7 herein). The discussion focuses on the Company�s securities
activities (primarily its institutional trading activities) and corporate lending and related activities. The Company believes that these activities generate a substantial portion of its principal risks. This discussion and the estimated amounts of
the Company�s risk exposure generated by the Company�s statistical analyses are forward-looking statements. However, the analyses used to assess such risks are not predictions of future events, and actual results may vary significantly
from such analyses due to events in the markets in which the Company operates and certain other factors described below. Market Risk. Market risk refers to the risk that a change in the level of one or more market prices, rates, indices, implied volatilities (the price volatility of the underlying instrument imputed from option prices),
correlations or other market factors, such as market liquidity, will result in losses for a position or portfolio. Generally, the Company incurs market risk as a result of trading, investing and client facilitation activities, principally within the
Institutional Securities business segment where the substantial majority of the Company�s Value-at-Risk (�VaR�) for market risk exposures is generated. In addition, the Company incurs trading-related market risk within the Global
Wealth Management Group. Asset Management incurs principally Non-trading market risk primarily from capital investments in real estate funds and investments in private equity vehicles. Sound market risk management is an integral part of the Company�s culture. The various business units and trading desks
are responsible for ensuring that market risk exposures are well-managed and prudent. The control groups help ensure that these risks are measured and closely monitored and are made transparent to senior management. The Market Risk Department is
responsible for ensuring transparency of material market risks, monitoring compliance with established limits, and escalating risk concentrations to appropriate senior management. To execute these responsibilities, the Market Risk Department
monitors the Company�s risk against limits on aggregate risk exposures, performs a variety of risk analyses, routinely reports risk summaries, and maintains the Company�s VaR and scenario analysis systems. These limits are designed to
control price and market liquidity risk. Market risk is also monitored through various measures: statistically (using VaR and related analytical measures); by measures of position sensitivity; and through routine stress testing, which measures the
impact on the value of existing portfolios of specified changes in market factors, and scenario 102 Table of Contents analyses conducted by the Market Risk Department in collaboration with the business units. The material risks identified by these processes are summarized in reports produced by the Market Risk
Department that are circulated to and discussed with senior management, the FRC, the BRC, and the Board of Directors. Sales and Trading and Related Activities. Primary Market Risk Exposures and Market Risk Management. During 2011, the Company had exposures to a wide range of
interest rates, equity prices, foreign exchange rates and commodity prices�and the associated implied volatilities and spreads�related to the global markets in which it conducts its trading activities. The Company is exposed to interest rate and credit spread risk as a result of
its market-making activities and other trading in interest rate-sensitive financial instruments (e.g., risk arising from changes in the level or implied volatility of interest rates, the timing of mortgage prepayments, the shape of the yield curve
and credit spreads). The activities from which those exposures arise and the markets in which the Company is active include, but are not limited to, the following: corporate and government debt across both developed and emerging markets and
asset-backed debt (including mortgage-related securities). The
Company is exposed to equity price and implied volatility risk as a result of making markets in equity securities and derivatives and maintaining other positions (including positions in non-public entities). Positions in non-public entities may
include, but are not limited to, exposures to private equity, venture capital, private partnerships, real estate funds and other funds. Such positions are less liquid, have longer investment horizons and are more difficult to hedge than listed
equities. The Company is exposed to foreign exchange rate and
implied volatility risk as a result of making markets in foreign currencies and foreign currency derivatives, from maintaining foreign exchange positions and from holding non-U.S. dollar-denominated financial instruments. The Company is exposed to commodity price and implied volatility risk as a
result of market-making activities and maintaining positions in physical commodities (such as crude and refined oil products, natural gas, electricity, and precious and base metals) and related derivatives. Commodity exposures are subject to periods
of high price volatility as a result of changes in supply and demand. These changes can be caused by weather conditions; physical production, transportation and storage issues; or geopolitical and other events that affect the available supply and
level of demand for these commodities. The Company manages its
trading positions by employing a variety of risk mitigation strategies. These strategies include diversification of risk exposures and hedging. Hedging activities consist of the purchase or sale of positions in related securities and financial
instruments, including a variety of derivative products (e.g., futures, forwards, swaps and options). Hedging activities may not always provide effective mitigation against trading losses due to differences in the terms, specific characteristics or
other basis risks that may exist between the hedge instrument and the risk exposure that is being hedged. The Company manages the market risk associated with its trading activities on a Company-wide basis, on a worldwide trading division level and
on an individual product basis. The Company manages and monitors its market risk exposures in such a way as to maintain a portfolio that the Company believes is well-diversified in the aggregate with respect to market risk factors and that reflects
the Company�s aggregate risk tolerance as established by the Company�s senior management. Aggregate market risk limits have been approved for the Company across all divisions worldwide. Additional market risk limits are assigned to trading desks and, as appropriate, products and regions.
Trading division risk managers, desk risk managers, traders and the Market Risk Department monitor market risk measures against limits in accordance with policies set by senior management. VaR. The Company uses the statistical technique known as VaR as one of the tools used to
measure, monitor and review the market risk exposures of its trading portfolios. The Market Risk Department calculates and distributes daily VaR-based risk measures to various levels of management. 103 Table of Contents VaR Methodology, Assumptions and Limitations. The Company estimates VaR
using a model based on historical simulation for major market risk factors and Monte Carlo simulation for name-specific risk in corporate shares, bonds, loans and related derivatives. Historical simulation involves constructing a distribution of
hypothetical daily changes in the value of trading portfolios based on two sets of inputs: historical observation of daily changes in key market indices or other market risk factors; and information on the sensitivity of the portfolio values to
these market risk factor changes. The Company�s VaR model uses four years of historical data to characterize potential changes in market risk factors. The Company�s 95%/one-day VaR corresponds to the unrealized loss in portfolio value
that, based on historically observed market risk factor movements, would have been exceeded with a frequency of 5%, or five times in every 100 trading days, if the portfolio were held constant for one day. The Company�s VaR model generally takes into account linear and
non-linear exposures to equity and commodity price risk, interest rate risk, credit spread risk and foreign exchange rates. The model also takes into account linear exposures to implied volatility risks for all asset classes and non-linear exposures
to implied volatility risks for equity, commodity and foreign exchange referenced products. The VaR model also captures certain implied correlation risks associated with portfolio credit derivatives as well as certain basis risks (e.g., corporate
debt and related credit derivatives). Among their benefits, VaR
models permit estimation of a portfolio�s aggregate market risk exposure, incorporating a range of varied market risks and portfolio assets. One key element of the VaR model is that it reflects risk reduction due to portfolio diversification or
hedging activities. However, VaR risk measures should be interpreted carefully in light of the methodology�s limitations, which include but are not limited to: past changes in market risk factors may not always yield accurate predictions of the
distributions and correlations of future market movements; changes in portfolio value in response to market movements (especially for complex derivative portfolios) may differ from the responses calculated by a VaR model; VaR using a one-day time
horizon does not fully capture the market risk of positions that cannot be liquidated or hedged within one day; the historical market risk factor data used for VaR estimation may provide only limited insight into losses that could be incurred under
market conditions that are unusual relative to the historical period used in estimating the VaR; and published VaR results reflect past trading positions while future risk depends on future positions. A small proportion of market risk generated by
trading positions is not included in VaR. The modeling of the risk characteristics of some positions relies on approximations that, under certain circumstances, could produce significantly different results from those produced using more precise
measures. VaR is most appropriate as a risk measure for trading positions in liquid financial markets and will understate the risk associated with severe events, such as periods of extreme illiquidity. The Company is aware of these and other
limitations and, therefore, uses VaR as only one component in its risk management oversight process. As explained above, this process also incorporates stress testing and scenario analyses and extensive risk monitoring, analysis, and control at the
trading desk, division and Company levels. The Company�s VaR
model evolves over time in response to changes in the composition of trading portfolios and to improvements in modeling techniques and systems capabilities. The Company is committed to continuous review and enhancement of VaR methodologies and
assumptions in order to capture evolving risks associated with changes in market structure and dynamics. As part of regular process improvement, additional systematic and name-specific risk factors may be added to improve the VaR model�s
ability to more accurately estimate risks to specific asset classes or industry sectors. Additionally, the Company continues to evaluate enhancements to the VaR model to make it more responsive to more recent market conditions while maintaining a
longer-term perspective. Since the reported VaR statistics are
estimates based on historical data, VaR should not be viewed as predictive of the Company�s future revenues or financial performance or of its ability to monitor and manage risk. There can be no assurance that the Company�s actual losses
on a particular day will not exceed the VaR amounts indicated below or that such losses will not occur more than five times in 100 trading days for a 95%/one-day VaR. VaR does not predict the magnitude of losses which, should they occur, may be
significantly greater than the VaR amount. 104 Table of Contents VaR for 2011. The table below presents VaR for the Company�s
Trading portfolio, on a year-end, annual average and annual high and low basis (see Table 1 below). The VaR that would result if the Company were to adopt alternative parameters for its calculations, such as a higher confidence level for the VaR
statistic (99% rather than 95%) or a shorter historical time series of market data (one year rather than four years), are also disclosed (see Table 2 below). The Credit Portfolio VaR is disclosed as a separate category from the Primary Risk Categories. The Credit Portfolio VaR includes the mark-to-market
relationship lending exposures and associated hedges as well as counterparty credit valuation adjustments and related hedges. A key driver of the Credit Portfolio VaR in 2011 was the Company�s exposure to Monolines, principally MBIA. For
further information on the Company�s settlement with MBIA, see �Management�s Discussion and Analysis of Financial Condition and Results of Operations�Executive Summary�Significant Items�Monoline Insurers� in Part
II, Item�7 herein. Trading Risks. The table below presents the Company�s 95%/one-day Trading VaR: | Table 1: 95% VaR | 95%/One-Day VaR for 2011 | 95%/One-Day VaR for 2010 | ||||||||||||||||||||||||||||||
| Market Risk Category | Period End | Average | High | Low | Period End | Average | High | Low | ||||||||||||||||||||||||
| (dollars in millions) | ||||||||||||||||||||||||||||||||
| Interest rate and credit spread | $ | 66 | $ | 87 | $ | 137 | $ | 49 | $ | 92 | $ | 104 | $ | 127 | $ | 86 | ||||||||||||||||
| Equity price | 25 | 31 | 48 | 21 | 29 | 28 | 52 | 19 | ||||||||||||||||||||||||
| Foreign exchange rate | 18 | 17 | 27 | 8 | 20 | 24 | 50 | 9 | ||||||||||||||||||||||||
| Commodity price | 28 | 30 | 44 | 23 | 30 | 28 | 35 | 21 | ||||||||||||||||||||||||
| Less: Diversification benefit(1)(2) | (67 | ) | (63 | ) | N/A | N/A | (51 | ) | (66 | ) | N/A | N/A | ||||||||||||||||||||
| Primary Risk Categories | $ | 70 | $ | 102 | $ | 170 | $ | 60 | $ | 120 | $ | 118 | $ | 149 | $ | 98 | ||||||||||||||||
| Credit Portfolio | 52 | 97 | 124 | 49 | 74 | 67 | 79 | 54 | ||||||||||||||||||||||||
| Less: Diversification benefit(1)(2) | (35 | ) | (70 | ) | N/A | N/A | (76 | ) | (46 | ) | N/A | N/A | ||||||||||||||||||||
| Total Trading VaR | $ | 87 | $ | 129 | $ | 168 | $ | 83 | $ | 118 | $ | 139 | $ | 165 | $ | 117 | ||||||||||||||||
| (1) | Diversification benefit equals the difference between the total VaR and the sum of the component VaRs. This benefit arises because the simulated one-day losses for each of the components occur on different days; similar diversification benefits also are taken into account within each component. |
| (2) | N/A�Not Applicable. The minimum and maximum VaR values for the total VaR and each of the component VaRs might have occurred on different days during the quarter and therefore the diversification benefit is not an applicable measure. |
Table of Contents VaR Statistics under Varying Assumptions. VaR statistics are not readily comparable across firms because of
differences in the breadth of products included in each firm�s VaR model, in the statistical assumptions made when simulating changes in market risk factors, and in the methods used to approximate portfolio revaluations under the simulated
market conditions. These differences can result in materially different VaR estimates for similar portfolios. The impact varies depending on the factor history assumptions, the frequency with which the factor history is updated, and the confidence
level. As a result, VaR statistics are more reliable and relevant when used as indicators of trends in risk taking rather than as a basis for inferring differences in risk taking across firms. Table 2 presents the VaR statistics that would result if the Company were to adopt alternative parameters for its calculations,
such as the reported confidence level (95% versus 99%) for the VaR statistic or a shorter historical time series (four-year versus one-year) for market data upon which it bases its simulations. The four-year VaR measure continues to reflect the high
market volatilities experienced through 2007 and 2008, while the one-year VaR is no longer affected by these phenomena. | Table 2: 95% and 99% Average Trading VaR with Four-Year / One-Year Historical Time Series | 95%�Average�One-Day�VaR for 2011 | 99%�Average�One-Day�VaR for 2011 | ||||||||||||||
| Market Risk Category | Four-Year�Risk Factor�History | One-Year�Risk Factor�History | Four-Year�Risk Factor�History | One-Year�Risk Factor�History | ||||||||||||
| (dollars in millions) | ||||||||||||||||
| Interest rate and credit spread | $ | 87 | $ | 57 | $ | 163 | $ | 110 | ||||||||
| Equity price | 31 | 25 | 45 | 37 | ||||||||||||
| Foreign exchange rate | 17 | 15 | 28 | 26 | ||||||||||||
| Commodity price | 30 | 23 | 54 | 38 | ||||||||||||
| Less: Diversification benefit(1) | (63 | ) | (46 | ) | (111 | ) | (81 | ) | ||||||||
| Primary Risk Categories | $ | 102 | $ | 74 | $ | 179 | $ | 130 | ||||||||
| Credit Portfolio | 97 | 58 | 194 | 127 | ||||||||||||
| Less: Diversification benefit(1) | (70 | ) | (41 | ) | (124 | ) | (80 | ) | ||||||||
| Total Trading VaR | $ | 129 | $ | 91 | $ | 249 | $ | 177 | ||||||||
| (1) | Diversification benefit equals the difference between the total VaR and the sum of the component VaRs. This benefit arises because the simulated one-day losses for each of the components occur on different days; similar diversification benefits also are taken into account within each component. |
Table of Contents Primary Risk Categories. As shown in Table 1, the Company�s average 95%/one-day Primary Risk
Categories VaR for 2011 was $102 million. The histogram below presents the distribution of the Company�s daily 95%/one-day Primary Risk Categories VaR for 2011. The most frequently occurring value was between $115 million and $130 million,
while for approximately 41% of the trading days during the year, the Primary Risk Categories VaR was less than $100 million, reflecting the reduction in risk at the end of the third quarter of 2011 that continued through the fourth quarter of 2011. 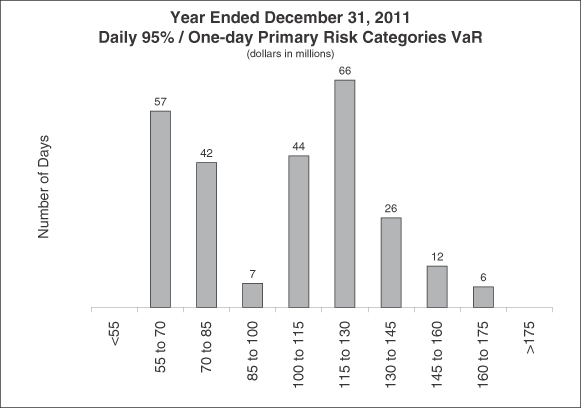 107 Table of Contents The histogram below shows the distribution of daily net trading revenue for the Company�s businesses
that comprise the Primary Risk Categories for 2011. This excludes the non-trading revenue of these businesses and the revenue associated with the Company�s own credit risk. During 2011, the Company�s businesses that comprise the Primary
Risk Categories experienced net trading losses on 49 days, 1 day of which was in excess of the 95%/one-day Primary Risk Categories VaR.
107 Table of Contents The histogram below shows the distribution of daily net trading revenue for the Company�s businesses
that comprise the Primary Risk Categories for 2011. This excludes the non-trading revenue of these businesses and the revenue associated with the Company�s own credit risk. During 2011, the Company�s businesses that comprise the Primary
Risk Categories experienced net trading losses on 49 days, 1 day of which was in excess of the 95%/one-day Primary Risk Categories VaR. 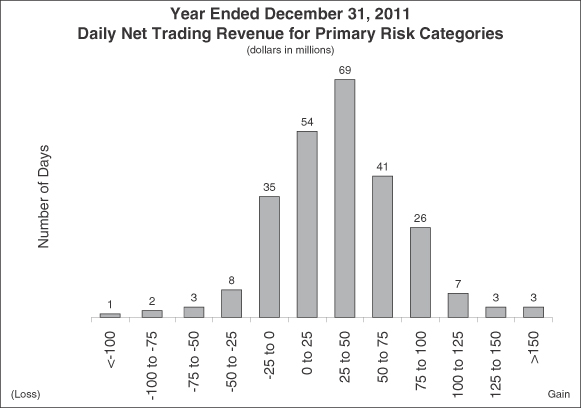 108 Table of Contents Total Trading including the Primary Risk Categories and the Credit Portfolio. As shown in Table 1, the Company�s average 95%/one-day Total Trading
VaR, which includes the Primary Risk Categories and the Credit Portfolio, for 2011 was $129 million. The histogram below presents the distribution of the Company�s daily 95%/one-day Total Trading VaR for 2011. The most frequently occurring
value was between $130 million and $145 million, while for approximately 70% of the trading days during 2011, the Total Trading VaR ranged between $115 million and $145 million.
108 Table of Contents Total Trading including the Primary Risk Categories and the Credit Portfolio. As shown in Table 1, the Company�s average 95%/one-day Total Trading
VaR, which includes the Primary Risk Categories and the Credit Portfolio, for 2011 was $129 million. The histogram below presents the distribution of the Company�s daily 95%/one-day Total Trading VaR for 2011. The most frequently occurring
value was between $130 million and $145 million, while for approximately 70% of the trading days during 2011, the Total Trading VaR ranged between $115 million and $145 million. 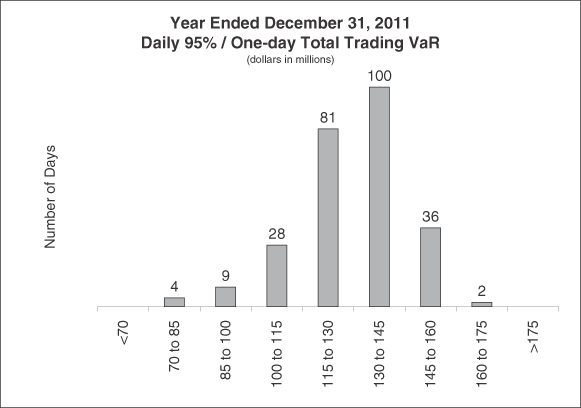 109 Table of Contents The histogram below shows the distribution of daily net trading revenue for the Company�s Trading
businesses for 2011. This excludes the non-trading revenue of these businesses and the revenue associated with the Company�s own credit risk. During 2011, the Company experienced net trading losses on 64 days, 4 days of which were in excess of
the 95%/one-day Trading VaR.
109 Table of Contents The histogram below shows the distribution of daily net trading revenue for the Company�s Trading
businesses for 2011. This excludes the non-trading revenue of these businesses and the revenue associated with the Company�s own credit risk. During 2011, the Company experienced net trading losses on 64 days, 4 days of which were in excess of
the 95%/one-day Trading VaR.  Non-Trading Risks. The Company believes that sensitivity analysis is an
appropriate representation of the Company�s non-trading risks. Reflected below is this analysis, which covers substantially all of the non-trading risk in the Company�s portfolio. Counterparty Exposure Related to the Company�s Own Spread. The credit spread risk relating to the Company�s own mark-to-market
derivative counterparty exposure corresponds to an increase in value of approximately $6 million and $8 million for each 1 basis point widening in the Company�s credit spread level for December�31, 2011 and December�31, 2010,
respectively. Funding Liabilities. The credit spread risk sensitivity of the Company�s mark-to-market
funding liabilities corresponded to an increase in value of approximately $12 million and $14 million for each 1 basis point widening in the Company�s credit spread level at December�31, 2011 and December�31, 2010, respectively. 110 Table of Contents Interest Rate Risk Sensitivity on Income from Continuing Operations. The Company measures the interest rate risk of certain assets and
liabilities by calculating the hypothetical sensitivity of net interest income to potential changes in the level of interest rates over the next twelve months. This sensitivity analysis includes positions that are mark-to-market as well as positions
that are accounted for on an accrual basis. For interest rate derivatives that are perfect economic hedges to non-mark-to-market assets or liabilities, the disclosed sensitivities include only the impact of the coupon accrual mismatch. This
treatment mitigates the effects caused by the measurement basis differences between the economic hedge and the corresponding hedged instrument. Given the currently low interest rate environment, the Company uses the following two interest rate scenarios to quantify the Company�s sensitivity:
instantaneous parallel shocks of 100 and 200 basis point increases to all points on all yield curves simultaneously. The hypothetical model does not assume any growth, change in business focus, asset pricing philosophy or asset/liability funding mix and does not capture
how the Company would respond to significant changes in market conditions. Furthermore, the model does not reflect the Company�s expectations regarding the movement of interest rates in the near term, nor the actual effect on income from
continuing operations before income taxes if such changes were to occur. On December�31, 2011, the Company modified its methodology so that the incremental impact of coupon accrual (net of funding expense) is derived explicitly from the projected cash flows over the next
twelve months. This change provides improved accuracy over the previous method of using instantaneous shocks on mark-to-market positions to estimate the net effect of accrual and funding. The impact of this change on the December�31, 2011,
consolidated results is a reduction of $32 million in interest income sensitivity for a +100 basis point scenario, and a reduction of $64 million for a +200 basis point scenario.
Non-Trading Risks. The Company believes that sensitivity analysis is an
appropriate representation of the Company�s non-trading risks. Reflected below is this analysis, which covers substantially all of the non-trading risk in the Company�s portfolio. Counterparty Exposure Related to the Company�s Own Spread. The credit spread risk relating to the Company�s own mark-to-market
derivative counterparty exposure corresponds to an increase in value of approximately $6 million and $8 million for each 1 basis point widening in the Company�s credit spread level for December�31, 2011 and December�31, 2010,
respectively. Funding Liabilities. The credit spread risk sensitivity of the Company�s mark-to-market
funding liabilities corresponded to an increase in value of approximately $12 million and $14 million for each 1 basis point widening in the Company�s credit spread level at December�31, 2011 and December�31, 2010, respectively. 110 Table of Contents Interest Rate Risk Sensitivity on Income from Continuing Operations. The Company measures the interest rate risk of certain assets and
liabilities by calculating the hypothetical sensitivity of net interest income to potential changes in the level of interest rates over the next twelve months. This sensitivity analysis includes positions that are mark-to-market as well as positions
that are accounted for on an accrual basis. For interest rate derivatives that are perfect economic hedges to non-mark-to-market assets or liabilities, the disclosed sensitivities include only the impact of the coupon accrual mismatch. This
treatment mitigates the effects caused by the measurement basis differences between the economic hedge and the corresponding hedged instrument. Given the currently low interest rate environment, the Company uses the following two interest rate scenarios to quantify the Company�s sensitivity:
instantaneous parallel shocks of 100 and 200 basis point increases to all points on all yield curves simultaneously. The hypothetical model does not assume any growth, change in business focus, asset pricing philosophy or asset/liability funding mix and does not capture
how the Company would respond to significant changes in market conditions. Furthermore, the model does not reflect the Company�s expectations regarding the movement of interest rates in the near term, nor the actual effect on income from
continuing operations before income taxes if such changes were to occur. On December�31, 2011, the Company modified its methodology so that the incremental impact of coupon accrual (net of funding expense) is derived explicitly from the projected cash flows over the next
twelve months. This change provides improved accuracy over the previous method of using instantaneous shocks on mark-to-market positions to estimate the net effect of accrual and funding. The impact of this change on the December�31, 2011,
consolidated results is a reduction of $32 million in interest income sensitivity for a +100 basis point scenario, and a reduction of $64 million for a +200 basis point scenario. | December�31,�2011 | December�31,�2010 | |||||||||||||||
| +100�Basis Points | +200�Basis Points | +100�Basis Points | +200�Basis Points | |||||||||||||
| (dollars in millions) | ||||||||||||||||
| Impact on income from continuing operations before income taxes | $ | 600 | $ | 1,080 | $ | 560 | $ | 1,084 | ||||||||
| Impact on income from continuing operations before income taxes excluding Citi�s share of MSSB(1) | 370 | 672 | 343 | 664 | ||||||||||||
| (1) | Reflects the exclusion of the portion of income from continuing operations before taxes associated with MSSB�s noncontrolling interest in the joint venture. |
| 10% Sensitivity | ||||||||
| Investments | December�31,�2011 | December�31,�2010 | ||||||
| (dollars in millions) | ||||||||
| Investments related to Asset Management activities: | ||||||||
| Hedge fund investments | $ | 141 | $ | 169 | ||||
| Private equity and infrastructure funds | 108 | 115 | ||||||
| Real estate funds | 133 | 108 | ||||||
| Other investments: | ||||||||
| Mitsubishi UFJ Morgan Stanley Securities Co., Ltd. | 144 | 179 | ||||||
| Other Company investments | 297 | 344 | ||||||
Table of Contents Credit Risk. Credit risk refers to the risk of loss arising when a borrower, counterparty
or issuer does not meet its financial obligations. The Company incurs credit risk exposure to institutions and sophisticated investors through the Institutional Securities business segment. This risk may arise from a variety of business activities,
including, but not limited to, entering into swap or other derivative contracts under which counterparties have obligations to make payments to the Company; extending credit to clients through various lending commitments; providing short- or
long-term funding that is secured by physical or financial collateral whose value may at times be insufficient to fully cover the loan repayment amount; and posting margin and/or collateral to clearing houses, clearing agencies, exchanges, banks,
securities firms and other financial counterparties. The Company incurs credit risk in traded securities and loan pools, whereby the value of these assets may fluctuate based on realized or expected defaults on the underlying obligations or loans.
The Company incurs credit risk in the Global Wealth Management Group business segment lending to individual investors, including margin loans collateralized by securities, non-purpose loans predominantly collateralized by securities, and through
single-family residential prime mortgage loans in conforming, nonconforming or home equity lines of credit (�HELOC�) form. The Company has structured its credit risk management framework to reflect that each of its businesses generates unique credit risks, and the Credit Risk
Management Department establishes company-wide practices to evaluate, monitor and control credit risk exposure both within and across business segments. The Company employs a comprehensive and global Credit Limits Framework as one of the primary
tools used to evaluate and manage credit risk levels across the Company. The Credit Limits Framework is calibrated within the Company�s risk tolerance and includes single name limits and portfolio concentration limits by country, industry and
product type. The Credit Risk Management Department is responsible for ensuring transparency of material credit risks, ensuring compliance with established limits, approving material extensions of credit, and escalating risk concentrations to
appropriate senior management. Credit risk exposure is managed by credit professionals and committees within the Credit Risk Management Department and through various risk committees, whose membership includes the Credit Risk Management Department.
The Credit Risk Management Department also works closely with the Market Risk Department and applicable business units to monitor risk exposures, including margin loans, mortgage loans, and credit sensitive, higher risk transactions. See Notes 8 and 13 to the consolidated financial statements for additional
information about the Company�s financing receivables and lending commitments, respectively. Analyzing Credit Risk. Credit risk management takes place at the transaction, obligor and portfolio levels. In order to protect the Company from losses resulting from
these activities, the Credit Risk Management Department ensures lending transactions and derivative exposures are analyzed, that the creditworthiness of the Company�s counterparties and borrowers is reviewed regularly and that credit exposure
is actively monitored and managed. The Credit Risk Management Department assigns obligor credit ratings to the Company�s counterparties and borrowers, which reflect an assessment of an obligor�s probability of default. Additionally, the
Credit Risk Management Department evaluates the relative position of the Company�s particular obligation in the borrower�s capital structure and relative recovery prospects, as well as collateral (if applicable) and other structural
elements of the particular transaction. Risk
Mitigation. The Company may seek to mitigate credit risk from its lending and trading activities in multiple ways. At the transaction level, the Company seeks to mitigate risk through management of key risk elements
such as size, tenor, financial covenants, seniority and collateral. The Company actively hedges its lending and derivatives exposure through various financial instruments that may include single name, portfolio and structured credit derivatives.
Additionally, the Company may sell, assign or sub-participate funded loans and lending commitments to other financial institutions in the primary and secondary loan market. In connection with its derivatives trading activities, the Company generally
enters into master netting agreements and collateral arrangements with counterparties. These agreements provide the Company with the ability to offset a counterparty�s rights and obligations, request additional collateral when necessary or
liquidate the collateral in the event of counterparty default. 112 Table of Contents Institutional Securities Activities. Corporate Lending. In connection with certain of its Institutional Securities business
segment activities, the Company provides loans or lending commitments (including bridge financing) to selected corporate clients. Such loans and lending commitments can generally be classified as either �relationship-driven� or
�event-driven�. These loans and lending commitments have varying terms, may be senior or subordinated, may be secured or unsecured, are generally contingent upon representations, warranties and contractual conditions applicable to the
borrower, and may be syndicated, traded or hedged by the Company. �Relationship-driven� loans and lending commitments refer to loans and lending commitments used for general corporate purposes, working capital
and liquidity purposes. Commitments associated with �relationship-driven� activities may not be indicative of the Company�s actual funding requirements, as the commitment may expire unused or the borrower may not fully utilize the
commitment. The Company may hedge its exposures in connection with �relationship-driven� transactions, and commitments may be subject to conditions including financial covenants. The Company�s �relationship-driven� loans and
lending commitments typically consist of revolving lines of credit, letter of credit facilities and certain term loans. These loans are carried either at fair value with changes in fair value recorded in earnings or amortized cost in the
consolidated statements of financial condition. �Event-driven� loans and lending commitments refer to activities associated with a particular event or transaction, such as to support client
merger, acquisition or recapitalization activities. Commitments associated with these �event-driven� activities may not be indicative of the Company�s actual funding requirements since funding is contingent upon a proposed transaction
being completed. In addition, the borrower may not fully utilize the commitment or the Company�s portion of the commitment may be reduced through the syndication or sales process. The �event-driven� loans are typically syndicated or
sold to third party institutional investors. The Company may have a custodial relationship with these institutional investors, such as, prime brokerage clients. The borrower�s ability to draw on the commitment is also subject to certain terms
and conditions, among other factors. The Company risk manages its exposures in connection with �event-driven� transactions through various means, including syndication, distribution and/or hedging. The Company�s
�event-driven� loans and lending commitments typically consist of term loans and bridge loans. These loans are carried either at fair value with changes in fair value recorded in earnings or amortized cost in the consolidated statements of
financial condition. During 2011, the Company, in accordance with
its risk management practices, accounted for certain new �relationship-driven� and �event-driven� loans and lending commitments as held for investment. The Company may account for additional new loans and lending commitments as
held for investment or held for sale in the future. 113 Table of Contents The tables below present the Company�s credit exposure from its corporate lending positions and lending
commitments at December�31, 2011 and December�31, 2010. The �total corporate lending exposure� column includes both lending commitments and funded loans. Lending commitments represent legally binding obligations to provide
funding to clients at December�31, 2011 and December�31, 2010 for both �relationship-driven� and �event-driven� lending transactions. Since commitments associated with these business activities may expire unused, they
do not necessarily reflect the actual future cash funding requirements. Corporate Lending Commitments and Funded Loans at December�31, 2011 | Years to Maturity | Total Corporate Lending Exposure(2) | Corporate Lending Exposure�at Carrying�Value | Corporate Lending Commitments(3) | |||||||||||||||||||||||||
| Credit Rating(1) | Less�than�1 | 1-3 | 3-5 | Over 5 | ||||||||||||||||||||||||
| (dollars in millions) | ||||||||||||||||||||||||||||
| AAA | $ | 779 | $ | 385 | $ | 90 | $ | � | $ | 1,254 | $ | � | $ | 1,254 | ||||||||||||||
| AA | 3,878 | 1,660 | 4,433 | 65 | 10,036 | 905 | 9,131 | |||||||||||||||||||||
| A | 5,234 | 5,378 | 8,463 | 215 | 19,290 | 2,720 | 16,570 | |||||||||||||||||||||
| BBB | 4,532 | 6,538 | 17,539 | 226 | 28,835 | 4,146 | 24,689 | |||||||||||||||||||||
| Investment�grade | 14,423 | 13,961 | 30,525 | 506 | 59,415 | 7,771 | 51,644 | |||||||||||||||||||||
| Non-investment�grade | 2,451 | 5,276 | 13,272 | 2,460 | 23,459 | 7,808 | 15,651 | |||||||||||||||||||||
| Total | $ | 16,874 | $ | 19,237 | $ | 43,797 | $ | 2,966 | $ | 82,874 | $ | 15,579 | $ | 67,295 | ||||||||||||||
| (1) | Obligor credit ratings are determined by the Credit Risk Management Department. |
| (2) | Total corporate lending exposure represents the Company�s potential loss assuming the market price of funded loans and lending commitments was zero. |
| (3) | Amounts represent the notional amount of unfunded lending commitments less the amount of commitments reflected in the Company�s consolidated statements of financial condition. For syndications led by the Company,�lending commitments accepted by the borrower but not yet closed�are net of the amounts�agreed to by counterparties that will participate in the syndication. For syndications that the Company participates in and does not lead, lending commitments accepted by the borrower but not yet closed include only the amount that the Company expects it will be allocated from the lead syndicate bank. |
| Years to Maturity | Total Corporate Lending Exposure(2) | Corporate Lending Exposure�at Carrying�Value | Corporate Lending Commitments(3) | |||||||||||||||||||||||||
| Credit Rating(1) | Less�than�1 | 1-3 | 3-5 | Over 5 | ||||||||||||||||||||||||
| (dollars in millions) | ||||||||||||||||||||||||||||
| AAA | $ | 351 | $ | 342 | $ | 50 | $ | � | $ | 743 | $ | � | $ | 743 | ||||||||||||||
| AA | 3,220 | 5,435 | 671 | 70 | 9,396 | 131 | 9,265 | |||||||||||||||||||||
| A | 2,889 | 9,030 | 3,017 | 34 | 14,970 | 1,292 | 13,678 | |||||||||||||||||||||
| BBB | 2,793 | 16,170 | 4,816 | 237 | 24,016 | 3,203 | 20,813 | |||||||||||||||||||||
| Investment grade | 9,253 | 30,977 | 8,554 | 341 | 49,125 | 4,626 | 44,499 | |||||||||||||||||||||
| Non-investment�grade | 1,740 | 6,857 | 7,642 | 4,539 | 20,778 | 6,845 | 13,933 | |||||||||||||||||||||
| Total | $ | 10,993 | $ | 37,834 | $ | 16,196 | $ | 4,880 | $ | 69,903 | $ | 11,471 | $ | 58,432 | ||||||||||||||
| (1) | Obligor credit ratings are determined by the Credit Risk Management Department. |
| (2) | Total corporate lending exposure represents the Company�s potential loss assuming the market price of funded loans and lending commitments was zero. |
| (3) | Amounts represent the notional amount of unfunded lending commitments less the amount of commitments reflected in the Company�s consolidated statements of financial condition. For syndications led by the Company,�lending commitments accepted by the borrower but not yet closed�are net of the amounts�agreed to by counterparties that will participate in the syndication. For syndications that the Company participates in and does not lead, lending commitments accepted by the borrower but not yet closed include only the amount that the Company expects it will be allocated from the lead syndicate bank. |
Table of Contents At December�31, 2011 and December�31, 2010, the aggregate amount of investment grade loans was
$7.8 billion and $4.6 billion, respectively, and the aggregate amount of non-investment grade loans was $7.8 billion and $6.8 billion, respectively. In connection with these corporate lending activities (which include corporate funded loans and
lending commitments), the Company had hedges (which include �single name,� �sector� and �index� hedges) with a notional amount of $35.8 billion and $21.0 billion related to the total corporate lending exposure of $82.9
billion and $69.9 billion at December�31, 2011 and December�31, 2010, respectively. At December�31, 2011, the Company�s corporate lending exposure carried at fair value includes $15.2 billion of funded loans and $1.3 billion of lending commitments recorded in Financial
instruments owned and Financial instruments sold, not yet purchased, respectively, in the consolidated statements of financial condition. The Company�s corporate lending exposure accounted for as held for investment includes $1.7 billion of
funded loans recorded in Loans, with an allowance for loan losses of $6 million, and $8 billion of unfunded commitments with an allowance for credit losses of $17 million recorded in Other liabilities in the consolidated statements of financial
condition at December�31, 2011.�At December�31, 2010, the Company�s corporate lending exposure carried at fair value includes $11.2 billion of funded loans and $0.5 billion of lending commitments recorded in Financial instruments
owned and Financial instruments sold, not yet purchased, respectively, in the consolidated statements of financial condition. The Company�s corporate lending exposure accounted for as held for investment includes $750 million of funded loans
recorded in Loans with an allowance for loan losses of $0.4 million in the consolidated statements of financial condition at December�31, 2010.�See Notes 8 and 13 to the consolidated financial statements for information on corporate loans
and corporate lending commitments, respectively. �Event-Driven� Loans and Lending Commitments at December�31, 2011 and December�31, 2010. Included in the total corporate lending exposure amounts in the table above
at December�31, 2011 were �event-driven� exposure of $7.2 billion composed of funded loans of $3.0 billion and lending commitments of $4.2 billion. Included in the �event-driven� exposure at December�31, 2011 were $3.8
billion of loans and lending commitments to non-investment grade borrowers. The maturity profile of the �event-driven� loans and lending commitments at December�31, 2011 was as follows: 55% will mature in less than 1 year, 9% will
mature within 1 to 3 years, 13% will mature within 3 to 5 years, and 23% will mature in over 5 years. Included in the total corporate lending exposure amounts in the table above at December�31, 2010 were �event-driven� exposure of $5.4 billion composed of funded loans of $1.3 billion and
lending commitments of $4.1 billion. Included in the $5.4 billion of �event-driven� exposure at December�31, 2010 were $4.9 billion of loans and lending commitments to non-investment grade borrowers that were closed. The maturity
profile of the �event-driven� loans and lending commitments at December�31, 2010 was as follows: 11% will mature in less than 1 year, 21% will mature within 1 to 3 years, 26% will mature within 3 to 5 years, and 43% will mature in
over 5 years. At December�31, 2011 and December�31,
2010, $301 million and $646 million of the Company�s �event-driven� loans were on a non-accrual basis, respectively. These loans primarily are those the Company originated prior to the financial crisis in 2008 and was unable to sell
or syndicate. For loans carried at fair value that are on non-accrual status, interest income is recognized on a cash basis. Activity associated with the corporate �event-driven� lending exposure during 2011 was as follows (dollars in millions): | �Event-driven� lending exposures at December�31, 2010 | $ | 5,409 | ||
| Closed commitments | 7,188 | |||
| Net reductions, primarily through syndication or sales | (5,368 | ) | ||
| Mark-to-market adjustments | (72 | ) | ||
| �Event-driven� lending exposures at December�31, 2011 | $ | 7,157 | ||
Table of Contents Other Institutional Securities Lending Activities. In addition to the
primary corporate lending activity described above, the Institutional Securities business segment engages in other lending activity. At December�31, 2011, $9.2 billion of funded loans carried at fair value were recorded in Financial instruments
owned in the consolidated statements of financial condition.�These loans include corporate loans purchased in the secondary market, commercial and residential mortgage loans, and financing extended to equities and commodities customers.�At
December�31, 2011, $2.2 billion of funded loans accounted for as held for investment are recorded in Loans with an allowance for loan losses of $8 million in the consolidated statements of financial condition.�These loans are primarily
commercial asset-backed lending. Derivative
Contracts. In the normal course of business, the Company enters into a variety of derivative contracts related to financial instruments and commodities. The Company uses these instruments for trading and hedging
purposes, as well as for asset and liability management. These instruments generally represent future commitments to swap interest payment streams, exchange currencies, or purchase or sell commodities and other financial instruments on specific
terms at specified future dates. Many of these products have maturities that do not extend beyond one year, although swaps, options and equity warrants typically have longer maturities. The Company incurs credit risk as a dealer in OTC derivatives. Credit risk with respect to derivative instruments arises from
the failure of a counterparty to perform according to the terms of the contract. The Company�s exposure to credit risk at any point in time is represented by the fair value of the derivative contracts reported as assets, net of cash collateral
received. The fair value of derivatives represents the amount at which the derivative could be exchanged in an orderly transaction between market participants and is further described in Note 2 to the consolidated financial statements. Future
changes in interest rates, foreign currency exchange rates, or the fair values of the financial instruments, commodities or indices underlying these contracts ultimately may result in cash settlements exceeding fair value amounts recognized in the
consolidated statements of financial condition. In addition to measuring and managing credit exposures referenced to the current fair value of derivative instruments, the Company also measures and manages credit exposures referenced to potential
exposure. Potential exposure is an estimate of exposure, within a specified confidence level, that could be outstanding over time based on market movements. For credit exposure information on the Company�s credit derivative and other OTC derivative products, see Note 12 to the consolidated financial
statements. Credit Derivatives. A credit derivative is a contract between a seller (guarantor) and buyer
(beneficiary) of protection against the risk of a credit event occurring on a set of debt obligations issued by a specified reference entity. The beneficiary pays a periodic premium (typically quarterly) over the life of the contract and is
protected for the period. If a credit event occurs, the guarantor is required to make payment to the beneficiary based on the terms of the credit derivative contract. Credit events include bankruptcy, dissolution or insolvency of the referenced
entity, failure to pay, obligation acceleration, repudiation and payment moratorium. Debt restructurings are also considered a credit event in some cases. In certain transactions referenced to a portfolio of referenced entities or asset-backed
securities, deductibles and caps may limit the guarantor�s obligations. The Company trades in a variety of credit derivatives and may either purchase or write protection on a single name or portfolio of referenced entities. The Company is an active market maker in the credit
derivatives markets. As a market maker, the Company works to earn a bid-offer spread on client flow business and manage any residual credit or correlation risk on a portfolio basis.�Further, the Company uses credit derivatives to manage its
exposure to residential and commercial mortgage loans and corporate lending exposures during the periods presented. The Company actively monitors its counterparty credit risk related to credit derivatives. A majority of the Company�s counterparties are banks, broker-dealers, insurance and other financial
institutions. Contracts with these counterparties do not include ratings-based termination events but do include provisions related to 116 Table of Contents counterparty rating downgrades, which may result in additional collateral being required by the Company. As with all derivative contracts, the Company considers counterparty credit risk in the
valuation of its positions and recognizes credit valuation adjustments as appropriate within Principal transactions�Trading. The Company�s exposure to Monolines was significantly reduced following a comprehensive settlement with MBIA on
December�13, 2011. For further information on the Company�s settlement with MBIA, see �Management�s Discussion and Analysis of Financial Condition and Results of Operations�Executive Summary�Significant
Items�Monoline Insurers� in Part II, Item�7 herein. The following table summarizes the key characteristics of the Company�s credit derivative portfolio by counterparty at December�31, 2011 and
December�31, 2010. The fair values shown are before the application of any counterparty or cash collateral netting. | At December�31, 2011 | ||||||||||||||||||||
| Fair Values(1) | Notionals | |||||||||||||||||||
| Receivable | Payable | Net | Beneficiary | Guarantor | ||||||||||||||||
| (dollars in millions) | ||||||||||||||||||||
| Banks and securities firms | $ | 123,821 | $ | 117,125 | $ | 6,696 | $ | 2,099,438 | $ | 2,039,555 | ||||||||||
| Insurance and other financial institutions | 13,467 | 13,334 | 133 | 326,633 | 386,720 | |||||||||||||||
| Monolines(2) | 298 | 5 | 293 | 18,647 | � | |||||||||||||||
| Non-financial entities | 1,205 | 262 | 943 | 17,543 | 6,129 | |||||||||||||||
| Total | $ | 138,791 | $ | 130,726 | $ | 8,065 | $ | 2,462,261 | $ | 2,432,404 | ||||||||||
| (1) | The Company�s credit default swaps are classified in both Level 2 and Level 3 of the fair value hierarchy. Approximately 11% of receivable fair values and 7% of payable fair values represent Level 3 amounts. |
| (2) | Credit derivatives used to hedge the Company�s credit exposure to Monolines (including derivative counterparty exposure) are included in the table based on the counterparties writing such hedges. None of these hedges are written by other Monolines. |
| At December�31, 2010 | ||||||||||||||||||||
| Fair Values(1) | Notionals(2) | |||||||||||||||||||
| Receivable | Payable | Net | Beneficiary | Guarantor | ||||||||||||||||
| (dollars in millions) | ||||||||||||||||||||
| Banks and securities firms | $ | 96,551 | $ | 86,574 | $ | 9,977 | $ | 2,037,326 | $ | 2,032,824 | ||||||||||
| Insurance and other financial institutions | 10,954 | 8,679 | 2,275 | 277,714 | 257,180 | |||||||||||||||
| Monolines | 2,370 | � | 2,370 | 25,676 | � | |||||||||||||||
| Non-financial entities | 259 | 373 | (114 | ) | 2,920 | 4,247 | ||||||||||||||
| Total | $ | 110,134 | $ | 95,626 | $ | 14,508 | $ | 2,343,636 | $ | 2,294,251 | ||||||||||
| (1) | The Company�s credit default swaps are classified in both Level 2 and Level 3 of the fair value hierarchy. Approximately 13% of receivable fair values and 8% of payable fair values represent Level 3 amounts. |
| (2) | Amounts do not include the effect of hedges of Monoline derivative counterparty exposure. |
Table of Contents businesses are primarily monitored within those respective areas in that they determine the appropriate collateral level for each strategy or position. In addition, a collateral management group
monitors collateral levels against requirements and oversees the administration of the collateral function. See Note 6 to the consolidated financial statements for additional information about the Company�s collateralized transactions. Country Risk
Exposure. Country risk exposure is the risk that events within a country, such as currency crises, regulatory changes and other political events, will adversely affect the ability of the sovereign government and/or
obligors within the country to honor their obligations to the Company.�Country risk exposure is measured in accordance with the Company�s internal risk management standards and includes obligations from sovereign governments, corporations,
clearinghouses and financial institutions. The Company actively manages country risk exposure through a comprehensive risk management framework that combines credit and market fundamentals as well as scenario analysis, and allows the Company to
effectively identify, monitor and limit country risk. Country risk exposure before and after hedges are monitored and managed, with stress testing and scenario analysis conducted on a continuous basis, to identify exposure concentrations, wrong way
risk and the impact of idiosyncratic events. In addition, indirect exposures are captured and monitored through regular stress testing and counterparty, market and systemic vulnerability analysis. The Company reduces its country risk exposure
through the effect of risk mitigants, such as netting agreements with counterparties that permit the Company to offset receivables and payables with such counterparties, obtaining collateral from counterparties, and by hedging. In addition to the Company�s country risk exposure, the Company
discloses its cross-border outstanding information in �Financial Statements and Supplementary Data�Financial Data Supplement (Unaudited)� in Part II, Item�8 herein. It is based on the Federal Financial Institutions Examination
Council�s (�FFIEC�) regulatory guidelines for reporting cross-border information and represents the amounts that the Company may not be able to obtain from a foreign country due to country-specific events, including unfavorable
economic and political conditions, economic and social instability, and changes in government policies. There can be substantial differences between the Company�s country risk exposure and cross-border risk exposure. For instance, unlike the cross-border risk exposure, the Company�s country risk
exposure includes the effect of certain risk mitigants such as obtaining collateral from counterparties. In addition, the basis for determining the domicile of the country risk exposure is different from the basis for determining the cross-border
risk exposure. Cross-border risk exposure is reported based on the country of jurisdiction for the obligor or guarantor. Besides country of jurisdiction, the Company also considers factors such as physical location of operations or assets, location
and source of cash flows/revenues, and location of collateral (if applicable) in order to determine the basis for country risk exposure. Furthermore, cross-border risk exposure only incorporates CDS where protection is purchased while country risk
exposure incorporates CDS where protection is both purchased and sold. 118 Table of Contents The Company�s sovereign exposures consist of financial instruments entered into with sovereign and
local governments. Its non-sovereign exposures comprise exposures to corporations and financial institutions. The following table shows the Company�s significant non-U.S. country risk exposure, except for select European countries (see
�Country Risk Exposure�Select European Countries� herein), at December�31, 2011. | Country | Net Inventory(1) | Net Counterparty Exposure(2) | Funded Lending | Unfunded Commitments | Exposure Before Hedges | Hedges(3) | Net Exposure(4) | |||||||||||||||||||||
| (dollars in millions) | ||||||||||||||||||||||||||||
| United Kingdom: | ||||||||||||||||||||||||||||
| Sovereigns | $ | 425 | $ | 46 | $ | � | $ | � | $ | 471 | $ | (194 | ) | $ | 277 | |||||||||||||
| Non-sovereigns | 746 | 12,617 | 3,106 | 4,112 | 20,581 | (3,414 | ) | 17,167 | ||||||||||||||||||||
| Total United Kingdom | $ | 1,171 | $ | 12,663 | $ | 3,106 | $ | 4,112 | $ | 21,052 | $ | (3,608 | ) | $ | 17,444 | |||||||||||||
| Brazil: | ||||||||||||||||||||||||||||
| Sovereigns | $ | 3,901 | $ | � | $ | � | $ | � | $ | 3,901 | $ | � | $ | 3,901 | ||||||||||||||
| Non-sovereigns | 154 | 2,173 | 198 | 375 | 2,900 | (87 | ) | 2,813 | ||||||||||||||||||||
| Total Brazil | $ | 4,055 | $ | 2,173 | $ | 198 | $ | 375 | $ | 6,801 | $ | (87 | ) | $ | 6,714 | |||||||||||||
| Germany: | ||||||||||||||||||||||||||||
| Sovereigns | $ | (459 | ) | $ | 973 | $ | � | $ | � | $ | 514 | $ | (1,350 | ) | $ | (836 | ) | |||||||||||
| Non-sovereigns | 712 | 2,343 | 573 | 3,912 | 7,540 | (2,948 | ) | 4,592 | ||||||||||||||||||||
| Total Germany | $ | 253 | $ | 3,316 | $ | 573 | $ | 3,912 | $ | 8,054 | $ | (4,298 | ) | $ | 3,756 | |||||||||||||
| Australia: | ||||||||||||||||||||||||||||
| Sovereigns | $ | (253 | ) | $ | � | $ | � | $ | � | $ | (253 | ) | $ | (20 | ) | $ | (273 | ) | ||||||||||
| Non-sovereigns | 873 | 886 | 380 | 1,019 | 3,158 | (398 | ) | 2,760 | ||||||||||||||||||||
| Total Australia | $ | 620 | $ | 886 | $ | 380 | $ | 1,019 | $ | 2,905 | $ | (418 | ) | $ | 2,487 | |||||||||||||
| Canada: | ||||||||||||||||||||||||||||
| Sovereigns | $ | (555 | ) | $ | 243 | $ | � | $ | � | $ | (312 | ) | $ | � | $ | (312 | ) | |||||||||||
| Non-sovereigns | 609 | 897 | 441 | 1,378 | 3,325 | (890 | ) | 2,435 | ||||||||||||||||||||
| Total Canada | $ | 54 | $ | 1,140 | $ | 441 | $ | 1,378 | $ | 3,013 | $ | (890 | ) | $ | 2,123 | |||||||||||||
| (1) | Net inventory representing exposure to both long and short single name positions (i.e., bonds and equities at fair value and CDS based on notional amount assuming zero recovery adjusted for any fair value receivable or payable). |
| (2) | Net counterparty exposure (i.e., repurchase transactions, securities lending and OTC derivatives) taking into consideration legally enforceable master netting agreements and collateral. |
| (3) | Represents CDS hedges on net counterparty exposure and funded lending. Based on the CDS notional amount assuming zero recovery adjusted for any fair value receivable or payable. |
| (4) | In addition, at December�31, 2011, the Company had exposure to these countries for overnight deposits with banks of approximately $4.1 billion. |
Table of Contents Country Risk Exposure�Select European Countries. In connection
with certain of its Institutional Securities business segment activities, the Company has country risk exposure to many foreign countries. During 2011, certain European countries, which include Greece, Ireland, Italy, Portugal and Spain (the
�European Peripherals�) and France, experienced varying degrees of credit deterioration due to weaknesses in their economic and fiscal situations. The following table shows the Company�s country risk exposure to European Peripherals
and France at December�31, 2011. Such country risk exposure is measured in accordance with the Company�s internal risk management standards and includes obligations from sovereign and non-sovereigns, which includes governments,
corporations, clearinghouses and financial institutions. | Country | Net Inventory(1) | Net Counterparty Exposure(2) | Funded Lending | Unfunded Commitments | CDS Adjustment(3) | Exposure Before Hedges | Hedges(4) | Net Exposure | ||||||||||||||||||||||||
| (dollars in millions) | ||||||||||||||||||||||||||||||||
| Greece: | ||||||||||||||||||||||||||||||||
| Sovereigns | $ | (8 | ) | $ | 20 | $ | � | $ | � | $ | 23 | $ | 35 | $ | 1 | $ | 36 | |||||||||||||||
| Non-sovereigns | 53 | 7 | 142 | � | � | 202 | (78 | ) | 124 | |||||||||||||||||||||||
| Total Greece | $ | 45 | $ | 27 | $ | 142 | $ | � | $ | 23 | $ | 237 | $ | (77 | ) | $ | 160 | |||||||||||||||
| Ireland: | ||||||||||||||||||||||||||||||||
| Sovereigns | $ | 78 | $ | 1 | $ | � | $ | � | $ | 4 | $ | 83 | $ | (2 | ) | $ | 81 | |||||||||||||||
| Non-sovereigns | 102 | 41 | � | � | 15 | 158 | (16 | ) | 142 | |||||||||||||||||||||||
| Total Ireland | $ | 180 | $ | 42 | $ | � | $ | � | $ | 19 | $ | 241 | $ | (18 | ) | $ | 223 | |||||||||||||||
| Italy(6): | ||||||||||||||||||||||||||||||||
| Sovereigns | $ | (29 | ) | $ | 4,202 | $ | � | $ | � | $ | 412 | $ | 4,585 | $ | (786 | ) | $ | 3,799 | ||||||||||||||
| Non-sovereigns | 197 | 689 | 255 | 363 | 179 | 1,683 | (581 | ) | 1,102 | |||||||||||||||||||||||
| Total Italy(6) | $ | 168 | $ | 4,891 | $ | 255 | $ | 363 | $ | 591 | $ | 6,268 | $ | (1,367 | ) | $ | 4,901 | |||||||||||||||
| Spain: | ||||||||||||||||||||||||||||||||
| Sovereigns | $ | (366 | ) | $ | 11 | $ | � | $ | � | $ | 504 | $ | 149 | $ | (37 | ) | $ | 112 | ||||||||||||||
| Non-sovereigns | 225 | 397 | 311 | 424 | 218 | 1,575 | (297 | ) | 1,278 | |||||||||||||||||||||||
| Total Spain | $ | (141 | ) | $ | 408 | $ | 311 | $ | 424 | $ | 722 | $ | 1,724 | $ | (334 | ) | $ | 1,390 | ||||||||||||||
| Portugal: | ||||||||||||||||||||||||||||||||
| Sovereigns | $ | (435 | ) | $ | 97 | $ | � | $ | � | $ | 23 | $ | (315 | ) | $ | (96 | ) | $ | (411 | ) | ||||||||||||
| Non-sovereigns | 7 | 90 | 126 | � | 47 | 270 | (98 | ) | 172 | |||||||||||||||||||||||
| Total Portugal | $ | (428 | ) | $ | 187 | $ | 126 | $ | � | $ | 70 | $ | (45 | ) | $ | (194 | ) | $ | (239 | ) | ||||||||||||
| Sovereigns | $ | (760 | ) | $ | 4,331 | $ | � | $ | � | $ | 966 | $ | 4,537 | $ | (920 | ) | $ | 3,617 | ||||||||||||||
| Non-sovereigns | 584 | 1,224 | 834 | 787 | 459 | 3,888 | (1,070 | ) | 2,818 | |||||||||||||||||||||||
| Total European Peripherals(5)(6) | $ | (176 | ) | $ | 5,555 | $ | 834 | $ | 787 | $ | 1,425 | $ | 8,425 | $ | (1,990 | ) | $ | 6,435 | ||||||||||||||
| France(5): | ||||||||||||||||||||||||||||||||
| Sovereigns | $ | (1,796 | ) | $ | 234 | $ | � | $ | � | $ | 100 | $ | (1,462 | ) | $ | (228 | ) | $ | (1,690 | ) | ||||||||||||
| Non-sovereigns | 85 | 2,246 | 416 | 1,657 | 390 | 4,794 | (1,390 | ) | 3,404 | |||||||||||||||||||||||
| Total�France(5) | $ | (1,711 | ) | $ | 2,480 | $ | 416 | $ | 1,657 | $ | 490 | $ | 3,332 | $ | (1,618 | ) | $ | 1,714 | ||||||||||||||
| (1) | Net inventory representing exposure to both long and short single name positions (i.e., bonds and equities at fair value and CDS based on notional amount assuming zero recovery adjusted for any fair value receivable or payable). |
| (2) | Net counterparty exposure (i.e., repurchase transactions, securities lending and OTC derivatives) taking into consideration legally enforceable master netting agreements and collateral. |
| (3) | CDS adjustment represents credit protection purchased from European peripheral banks on European peripheral sovereign and financial institution risk, or French banks on French sovereign and financial institution risk. Based on the CDS notional amount assuming zero recovery adjusted for any fair value receivable or payable. |
| (4) | Represents CDS hedges on net counterparty exposure and funded lending. Based on the CDS notional amount assuming zero recovery adjusted for any fair value receivable or payable. |
Table of Contents| (5) | In addition, at December�31, 2011, the Company had European Peripherals and French exposure for overnight deposits with banks of approximately $448 million and $15 million, respectively. |
| (6) | On December�22, 2011, the Company executed certain derivative restructuring amendments which settled on January�3, 2012. Upon settlement of the amendments, the exposure before hedges and net exposure for Italy decreased to $2,887 million and $1,522 million, respectively, and the exposure before hedges and net exposure for European Peripherals decreased to $5,044 million and $3,056 million, respectively. |
| Industry | Corporate�Lending�Exposure | |||
| (dollars in millions) | ||||
| Energy | $ | 9,202 | ||
| Utilities | 8,952 | |||
| Funds, exchanges and other financial services(1) | 7,140 | |||
| Chemicals, metals, mining and other materials | 4,855 | |||
| Capital goods | 4,692 | |||
| Food, beverage and tobacco | 4,557 | |||
| Pharmaceuticals | 4,270 | |||
| Media-related entities | 4,212 | |||
| Telecommunications services | 4,162 | |||
| Other | 30,832 | |||
| Total | $ | 82,874 | ||
| Industry | OTC�Derivative�Products(2) | |||
| (dollars in millions) | ||||
| Sovereign governments | $ | 5,625 | ||
| Banks | 4,835 | |||
| Utilities | 4,146 | |||
| Funds, exchanges and other financial services(1) | 4,018 | |||
| Regional governments | 3,031 | |||
| Other | 13,394 | |||
| Total | $ | 35,049 | ||
| (1) | Includes mutual funds, pension funds, private equity and real estate funds, exchanges and clearinghouses and diversified financial services. |
| (2) | For further information on derivative instruments and hedging activities, see Note 12 to the consolidated financial statements. |
Table of Contents case of concentrated positions, appropriate liquidity of the underlying collateral or potential hedging strategies to reduce risk. Additionally, transactions relating to concentrated or
restricted positions require a review of any legal impediments to liquidation of the underlying collateral. Underlying collateral for margin loans is reviewed with respect to the liquidity of the proposed collateral positions, valuation of
securities, historic trading range, volatility analysis and an evaluation of industry concentrations. The Company, through agreements with Citi relating to the formation of MSSB, retains certain credit risk for margin and non-purpose loans that are held at Citigroup Global Markets Inc. in its capacity as
clearing broker for certain MSSB clients. The related loans are generally subject to the same oversight as similar margin and non-purpose loans held by the Company and its subsidiaries. Non-purpose securities-based lending�allows�clients to borrow money against the value of qualifying
securities�for any suitable purpose other than purchasing, trading, or carrying margin stock or refinancing margin debt.�Similar to margin lending, non-purpose securities-based loans are structured as demand facilities. This lending
activity has primarily been conducted through the Portfolio Loan Account (�PLA�) product platform. The Company�establishes�approved lines�and advance rates against qualifying securities and monitors�limits daily and,
pursuant to such guidelines, requires customers to deposit additional collateral, or reduce�debt�positions, when necessary.�Factors considered in the review of�non-purpose securities-based lending�are amount of the
loan,�the degree of concentrated or restricted positions, and the overall evaluation of the portfolio to ensure proper diversification, and, in the case of concentrated positions, appropriate liquidity of the underlying collateral or potential
hedging strategies. Underlying collateral for�non-purpose securities-based loans is reviewed with respect to the liquidity of the proposed collateral positions, valuation of securities, historic trading range, volatility analysis and an
evaluation of industry concentrations. An additional non-purpose
lending platform, Tailored Lending (�TL�), provides lending to high net worth clients of MSSB, predominantly collateralized by securities. In addition to review of collateral security, credit assessment for the platform also incorporates a
comprehensive analysis of the obligor�s financial profile and overall creditworthiness. Consequently, TL advance rates are generally higher than those offered in the PLA platform and TL facilities may be offered on a committed basis. The Global Wealth Management Group business segment also
provides�structured credit facilities to high net worth individuals and their�small and medium-sized domestic businesses, with a suite of products that includes working capital lines of credit, revolving lines of credit, standby letters of
credit, term loans and�commercial real estate mortgages. Decisions to extend credit are based on an analysis�of the borrower, the guarantor, the collateral, cash flow, liquidity, leverage and credit history. With respect to first mortgages and second mortgages, including HELOC loans,
a loan evaluation process is adopted within a framework of credit underwriting policies and collateral valuation.�The Company�s underwriting policy is designed to ensure that all borrowers pass an assessment of capacity and willingness to
pay, which includes an analysis of applicable industry standard credit scoring models (e.g., FICO scores), debt ratios and reserves of the borrower. Loan-to-collateral value ratios are determined based on independent third-party property
appraisal/valuations, and security lien position is established through title/ownership reports. Historically, all mortgages were originated to be sold or securitized. Eligible conforming loans are currently�held for sale, while most
non-conforming and HELOC loans�are held for investment in the Company�s portfolio. In certain instances, the Company enters into reverse repurchase agreements and securities borrowed transactions to acquire securities to cover short positions, to settle other securities obligations and
to accommodate customers� needs. The Company also engages in securities financing transactions for customers through margin lending. In addition, the Global Wealth Management Group business segment has employee loans that are granted primarily
in conjunction with a program established by the Company to retain and recruit certain employees. These loans, recorded in Receivables�Fees, interest and other in the consolidated statements of financial condition, are full 122 Table of Contents recourse, require periodic payments and have repayment terms ranging from four to 12 years. The Company establishes a reserve for loan amounts it does not consider recoverable from terminated
employees, which is recorded in Compensation and benefits expense. At December�31, 2011, Global Wealth Management Group had $11.4 billion of loans held for investment with an allowance for loan losses of $3 million
and $114 million of loans held for sale classified in Loans in the consolidated statements of financial condition. See Notes 2, 6 and 8 to the consolidated financial statements for additional information about the Company�s allowance for loan losses, collateralized transactions and financing receivables,
respectively. Operational Risk. Operational risk refers to the risk of financial or other loss, or potential
damage to a firm�s reputation, resulting from inadequate or failed internal processes, people, systems, or from external events (e.g., fraud, legal and compliance risks or damage to physical assets). The Company may incur operational risk
across the full scope of its business activities, including revenue generating activities (e.g., sales and trading) and control groups (e.g., information technology and trade processing). Legal and compliance risk is included in the scope of
operational risk and is discussed below under �Legal and Regulatory Risk.� The Company has established an operational risk framework to identify, measure, monitor and control risk across the Company. Effective operational risk management is essential to reducing the impact of
operational risk incidents and mitigating legal, regulatory and reputational risks. The framework is continually evolving to account for changes in the Company and in response to the changing regulatory and business environment. The Company has
implemented operational risk data and assessment systems to monitor and analyze internal and external operational risk events, business environment and internal control factors and perform scenario analysis. The collected data elements are
incorporated in the operational risk capital model. The model encompasses both quantitative and qualitative elements. Internal loss data and scenario analysis results are direct inputs to the capital model while external operational incidents,
business environment internal control factors and metrics are indirect inputs to the model. Primary responsibility for the management of operational risk is with the business segments, the control groups and the business managers therein. The business managers generally maintain processes and
controls designed to identify, assess, manage, mitigate and report operational risk. Each business segment has a designated operational risk coordinator. The operational risk coordinator regularly reviews operational risk issues and reports to
senior management within each business. Each control group also has a designated operational risk coordinator and a forum for discussing operational risk matters with senior management. Oversight of operational risk is provided by regional risk
committees and senior management. In the event of a merger, joint venture, divestiture, reorganization, or creation of a new legal entity, a new product or a business activity, operational risks are considered, and any necessary changes in processes
or controls are implemented. Enterprise Operational Risk and
Control (�EORC�) and the independent Operational Risk Department (�ORD�) work with the business segments and control groups to help ensure a transparent, consistent and comprehensive program for managing operational risk within
each area and across the Company globally. ORD is responsible for the design, ownership and independent validation of the operational risk framework, analysis of operational risk data and senior governance reporting. EORC is responsible for the
execution of the operational risk framework including, but not limited to facilitating, collecting and validating operational risk data. Business Continuity Management is responsible for identifying key risks and threats to the Company�s resiliency and planning to ensure a recovery
strategy and required resources are in place for the resumption of critical business functions following a disaster or other business interruption. Disaster recovery plans are in place for critical facilities and resources on a company-wide basis,
and redundancies are built into the systems as deemed 123 Table of Contents appropriate. The key components of the Company�s disaster recovery plans include: crisis management; business recovery plans; applications/data recovery; work area recovery; and other
elements addressing management, analysis, training and testing. The Company maintains an information security program that coordinates the management of information security risks and satisfies regulatory requirements.
Information security policies are designed to protect the Company�s information assets against unauthorized disclosure, modification or misuse. These policies cover a broad range of areas, including: application entitlements, data protection,
incident response, Internet and electronic communications, remote access and portable devices. The Company has also established policies, procedures and technologies to protect its computers and other assets from unauthorized access. The Company utilizes the services of external vendors in connection with the
Company�s ongoing operations. These may include, for example, outsourced processing and support functions and consulting and other professional services. The Company manages its exposures to the quality of these services through a variety of
means, including service level and other contractual agreements, and ongoing monitoring of the vendors� performance. It is anticipated that the use of these services will continue and possibly increase in the future. The Supplier Risk
Management program is responsible for the policies, procedures, organizations, governance and supporting technology to ensure adequate risk management controls between the Company and its third-party suppliers as it relates to information security,
disaster recoverability, and other key areas. The program ensures Company compliance with regulatory requirements. Legal and Regulatory Risk. Legal risk includes the risk of exposure to fines, penalties, judgments, damages and/or settlements in connection with regulatory or legal actions as a result of non-compliance with applicable legal and
regulatory requirements and standards. Legal risk also includes contractual and commercial risk such as the risk that a counterparty�s performance obligations will be unenforceable. The Company is generally subject to extensive regulation in
the different jurisdictions in which it conducts its business (see also �Business�Supervision and Regulation� in Part I, Item�1 and �Risk Factors� in Part I, Item�1A). The Company has established procedures based
on legal and regulatory requirements on a worldwide basis that are designed to foster compliance with applicable statutory and regulatory requirements. The Company, principally through the Legal and Compliance Division, also has established
procedures that are designed to require that the Company�s policies relating to conduct, ethics and business practices are followed globally. In connection with its businesses, the Company has and continuously develops various procedures
addressing issues such as regulatory capital requirements, sales and trading practices, new products, potential conflicts of interest, structured transactions, use and safekeeping of customer funds and securities, credit granting, money laundering,
privacy and recordkeeping. In addition, the Company has established procedures to mitigate the risk that a counterparty�s performance obligations will be unenforceable, including consideration of counterparty legal authority and capacity,
adequacy of legal documentation, the permissibility of a transaction under applicable law and whether applicable bankruptcy or insolvency laws limit or alter contractual remedies. The legal and regulatory focus on the financial services industry
presents a continuing business challenge for the Company. 124 Table of Contents| Item�8. | Financial Statements and Supplementary Data. |
| /s/ Deloitte & Touche LLP |
| New York, New York |
| February�27, 2012 |
| December�31, 2011 | December�31, 2010 | |||||||
| Assets | ||||||||
| Cash and due from banks ($511 and $297 at December�31, 2011 and December�31, 2010, respectively, related to consolidated variable interest entities generally not available to the Company) | $ | 13,165 | $ | 7,341 | ||||
| Interest bearing deposits with banks | 34,147 | 40,274 | ||||||
| Cash deposited with clearing organizations or segregated under federal and other regulations or requirements | 29,454 | 19,180 | ||||||
| Financial instruments owned, at fair value (approximately $140,749 and $129,969 were pledged to various parties at December�31, 2011 and December�31, 2010, respectively): | ||||||||
| U.S. government and agency securities | 63,449 | 48,446 | ||||||
| Other sovereign government obligations | 29,059 | 33,908 | ||||||
| Corporate and other debt ($3,007 and $3,816 at December�31, 2011 and December�31, 2010, respectively, related to consolidated variable interest entities, generally not available to the Company) | 68,923 | 88,154 | ||||||
| Corporate equities ($0 and $625 at December�31, 2011 and December�31, 2010, respectively, related to consolidated variable interest entities, generally not available to the Company) | 47,966 | 68,416 | ||||||
| Derivative and other contracts | 48,064 | 51,292 | ||||||
| Investments ($1,666 and $1,873 at December�31, 2011 and December�31, 2010, respectively, related to consolidated variable interest entities, generally not available to the Company) | 8,195 | 9,752 | ||||||
| Physical commodities | 9,697 | 6,778 | ||||||
| Total financial instruments owned, at fair value | 275,353 | 306,746 | ||||||
| Securities available for sale, at fair value | 30,495 | 29,649 | ||||||
| Securities received as collateral, at fair value | 11,651 | 16,537 | ||||||
| Federal funds sold and securities purchased under agreements to resell (includes $112 and $0 at fair value at December�31, 2011 and December�31, 2010, respectively) | 130,155 | 148,253 | ||||||
| Securities borrowed | 127,074 | 138,730 | ||||||
| Receivables: | ||||||||
| Customers | 33,977 | 35,258 | ||||||
| Brokers, dealers and clearing organizations | 5,248 | 9,102 | ||||||
| Fees, interest and other | 9,444 | 9,790 | ||||||
| Loans (net of allowances of $17 and $82 at December�31, 2011 and December�31, 2010, respectively) | 15,369 | 10,576 | ||||||
| Other investments | 4,832 | 5,412 | ||||||
| Premises, equipment and software costs (net of accumulated depreciation of $4,852 and $4,476 at December�31, 2011 and December�31, 2010, respectively) ($234 and $321 at December�31, 2011 and December�31, 2010, respectively, related to consolidated variable interest entities, generally not available to the Company) | 6,457 | 6,154 | ||||||
| Goodwill | 6,686 | 6,739 | ||||||
| Intangible assets (net of accumulated amortization of $910 and $605 at December�31, 2011 and December�31, 2010, respectively) (includes $133 and $157 at fair value at December�31, 2011 and December�31, 2010, respectively) | 4,285 | 4,667 | ||||||
| Other assets ($446 and $118 at December�31, 2011 and December�31, 2010, respectively, related to consolidated variable interest entities, generally not available to the Company) | 12,106 | 13,290 | ||||||
| Total assets | $ | 749,898 | $ | 807,698 | ||||
| | 126 |
| December�31, 2011 | December�31, 2010 | |||||||
| Liabilities and Equity | ||||||||
| Deposits (includes $2,101 and $3,027 at fair value at December�31, 2011 and December�31, 2010, respectively) | $ | 65,662 | $ | 63,812 | ||||
| Commercial paper and other short-term borrowings (includes $1,339 and $1,799 at fair value at December�31, 2011 and December�31, 2010, respectively) | 2,843 | 3,256 | ||||||
| Financial instruments sold, not yet purchased, at fair value: | ||||||||
| U.S. government and agency securities | 19,630 | 27,948 | ||||||
| Other sovereign government obligations | 17,141 | 22,250 | ||||||
| Corporate and other debt | 8,410 | 10,918 | ||||||
| Corporate equities | 24,497 | 19,838 | ||||||
| Derivative and other contracts | 46,453 | 47,802 | ||||||
| Physical commodities | 16 | � | ||||||
| Total financial instruments sold, not yet purchased, at fair value | 116,147 | 128,756 | ||||||
| Obligation to return securities received as collateral, at fair value | 15,394 | 21,163 | ||||||
| Securities sold under agreements to repurchase (includes $348 and $849 at fair value at December�31, 2011 and December�31, 2010, respectively ) | 104,800 | 147,598 | ||||||
| Securities loaned | 30,462 | 29,094 | ||||||
| Other secured financings (includes $14,594 and $8,490 at fair value at December�31, 2011 and December�31, 2010, respectively) ($2,316 and $2,656 at December�31, 2011 and December�31, 2010, respectively, related to consolidated variable interest entities and are non-recourse to the Company) | 20,719 | 10,453 | ||||||
| Payables: | ||||||||
| Customers | 117,241 | 123,249 | ||||||
| Brokers, dealers and clearing organizations | 4,082 | 3,363 | ||||||
| Interest and dividends | 2,292 | 2,572 | ||||||
| Other liabilities and accrued expenses ($121 and $117 at December�31, 2011 and December�31, 2010, respectively, related to consolidated variable interest entities and are non-recourse to the Company) | 15,944 | 16,518 | ||||||
| Long-term borrowings (includes $39,663 and $42,709 at fair value at December�31, 2011 and December�31, 2010, respectively) | 184,234 | 192,457 | ||||||
| 679,820 | 742,291 | |||||||
| Commitments and contingent liabilities (see Note 13) | ||||||||
| Equity | ||||||||
| Morgan Stanley shareholders� equity: | ||||||||
| Preferred stock | 1,508 | 9,597 | ||||||
| Common stock, $0.01 par value; | ||||||||
| Shares authorized: 3,500,000,000 at December�31, 2011 and December�31, 2010; Shares issued: 1,989,377,171 at December�31, 2011 and 1,603,913,074 at December�31, 2010; Shares outstanding: 1,926,986,130 at December�31, 2011 and 1,512,022,095 at December�31, 2010 | 20 | 16 | ||||||
| Paid-in capital | 22,836 | 13,521 | ||||||
| Retained earnings | 40,341 | 38,603 | ||||||
| Employee stock trust | 3,166 | 3,465 | ||||||
| Accumulated other comprehensive loss | (157 | ) | (467 | ) | ||||
| Common stock held in treasury, at cost, $0.01 par value; 62,391,041 shares at December�31, 2011 and 91,890,979 shares at December�31, 2010 | (2,499 | ) | (4,059 | ) | ||||
| Common stock issued to employee trust | (3,166 | ) | (3,465 | ) | ||||
| Total Morgan Stanley shareholders� equity | 62,049 | 57,211 | ||||||
| Noncontrolling interests | 8,029 | 8,196 | ||||||
| Total equity | 70,078 | 65,407 | ||||||
| Total liabilities and equity | $ | 749,898 | $ | 807,698 | ||||
| 127 | |
| 2011 | 2010 | 2009 | ||||||||||
| Investment banking | $ | 4,991 | $ | 5,122 | $ | 5,020 | ||||||
| Principal transactions: | ||||||||||||
| Trading | 12,392 | 9,406 | 7,723 | |||||||||
| Investments | 573 | 1,825 | (1,034 | ) | ||||||||
| Commissions and fees | 5,379 | 4,947 | 4,233 | |||||||||
| Asset management, distribution and administration fees | 8,502 | 7,919 | 5,841 | |||||||||
| Other | 209 | 1,271 | 707 | |||||||||
| Total non-interest revenues | 32,046 | 30,490 | 22,490 | |||||||||
| Interest income | 7,264 | 7,311 | 7,477 | |||||||||
| Interest expense | 6,907 | 6,414 | 6,687 | |||||||||
| Net interest | 357 | 897 | 790 | |||||||||
| Net revenues | 32,403 | 31,387 | 23,280 | |||||||||
| Non-interest expenses: | ||||||||||||
| Compensation and benefits | 16,403 | 15,923 | 14,331 | |||||||||
| Occupancy and equipment | 1,564 | 1,560 | 1,540 | |||||||||
| Brokerage, clearing and exchange fees | 1,652 | 1,431 | 1,190 | |||||||||
| Information processing and communications | 1,815 | 1,648 | 1,363 | |||||||||
| Marketing and business development | 602 | 576 | 500 | |||||||||
| Professional services | 1,803 | 1,818 | 1,577 | |||||||||
| Other | 2,450 | 2,200 | 1,649 | |||||||||
| Total non-interest expenses | 26,289 | 25,156 | 22,150 | |||||||||
| Income from continuing operations before income taxes | 6,114 | 6,231 | 1,130 | |||||||||
| Provision for (benefit from) income taxes | 1,418 | 754 | (297 | ) | ||||||||
| Income from continuing operations | 4,696 | 5,477 | 1,427 | |||||||||
| Discontinued operations: | ||||||||||||
| Gain (loss) from discontinued operations | (175 | ) | 577 | (114 | ) | |||||||
| Provision for (benefit from) income taxes | (124 | ) | 352 | (93 | ) | |||||||
| Net gain (loss) from discontinued operations | (51 | ) | 225 | (21 | ) | |||||||
| Net income | $ | 4,645 | $ | 5,702 | $ | 1,406 | ||||||
| Net income applicable to noncontrolling interests | 535 | 999 | 60 | |||||||||
| Net income applicable to Morgan Stanley | $ | 4,110 | $ | 4,703 | $ | 1,346 | ||||||
| Earnings (loss) applicable to Morgan Stanley common shareholders | $ | 2,067 | $ | 3,594 | $ | (907 | ) | |||||
| Amounts applicable to Morgan Stanley: | ||||||||||||
| Income from continuing operations | $ | 4,161 | $ | 4,478 | $ | 1,383 | ||||||
| Net gain (loss) from discontinued operations | (51 | ) | 225 | (37 | ) | |||||||
| Net income applicable to Morgan Stanley | $ | 4,110 | $ | 4,703 | $ | 1,346 | ||||||
| Earnings (loss) per basic common share: | ||||||||||||
| Income (loss) from continuing operations | $ | 1.28 | $ | 2.49 | $ | (0.73 | ) | |||||
| Net gain (loss) from discontinued operations | (0.03 | ) | 0.15 | (0.04 | ) | |||||||
| Earnings (loss) per basic common share | $ | 1.25 | $ | 2.64 | $ | (0.77 | ) | |||||
| Earnings (loss) per diluted common share: | ||||||||||||
| Income (loss) from continuing operations | $ | 1.26 | $ | 2.45 | $ | (0.73 | ) | |||||
| Net gain (loss) from discontinued operations | (0.03 | ) | 0.18 | (0.04 | ) | |||||||
| Earnings (loss) per diluted common share | $ | 1.23 | $ | 2.63 | $ | (0.77 | ) | |||||
| Average common shares outstanding: | ||||||||||||
| Basic | 1,654,708,640 | 1,361,670,938 | 1,185,414,871 | |||||||||
| Diluted | 1,675,271,669 | 1,411,268,971 | 1,185,414,871 | |||||||||
| | 128 |
| 2011 | 2010 | 2009 | ||||||||||
| Net income | $ | 4,645 | $ | 5,702 | $ | 1,406 | ||||||
| Other comprehensive income, net of tax: | ||||||||||||
| Foreign currency translation adjustments(1) | 35 | 221 | 112 | |||||||||
| Amortization of cash flow hedges(2) | 7 | 9 | 13 | |||||||||
| Net unrealized gain on Securities available for sale(3) | 87 | 36 | � | |||||||||
| Pension, postretirement and other related adjustments(4) | 251 | (20 | ) | (273 | ) | |||||||
| Comprehensive income | $ | 5,025 | $ | 5,948 | $ | 1,258 | ||||||
| Net income applicable to noncontrolling interests | 535 | 999 | 60 | |||||||||
| Other comprehensive income (loss) applicable to noncontrolling interests | 70 | 153 | (8 | ) | ||||||||
| Comprehensive income applicable to Morgan Stanley | $ | 4,420 | $ | 4,796 | $ | 1,206 | ||||||
| (1) | Amounts are net of provision for (benefit from) income taxes of $86 million, $(222) million and $(335) million for 2011, 2010 and 2009, respectively. |
| (2) | Amounts are net of provision for income taxes of $6 million, $6 million and $8 million for 2011, 2010 and 2009, respectively. |
| (3) | Amounts are net of provision for income taxes of $63 million and $25 million for 2011 and 2010, respectively. |
| (4) | Amounts are net of provision for (benefit from) income taxes of $153 million, $(10) million and $(161) million for 2011, 2010 and 2009, respectively. |
| 129 | |
| 2011 | 2010 | 2009 | ||||||||||
| CASH FLOWS FROM OPERATING ACTIVITIES | ||||||||||||
| Net income | $ | 4,645 | $ | 5,702 | $ | 1,406 | ||||||
| Adjustments to reconcile net income to net cash provided by (used for) operating activities: | ||||||||||||
| Deferred income taxes | 413 | (129 | ) | (932 | ) | |||||||
| Loss on equity method investees | 995 | 37 | 49 | |||||||||
| Compensation payable in common stock and options | 1,300 | 1,260 | 1,265 | |||||||||
| Depreciation and amortization | 1,404 | 1,419 | 1,224 | |||||||||
| Gain on business dispositions | (24 | ) | (570 | ) | (606 | ) | ||||||
| Gain on sale of stake in China International Capital Corporation Limited | � | (668 | ) | � | ||||||||
| Gains on curtailments of pension and postretirement plans | � | (54 | ) | � | ||||||||
| Gain on sale of securities available for sale | (143 | ) | (102 | ) | � | |||||||
| (Gain) loss on retirement of long-term debt | (155 | ) | 27 | (491 | ) | |||||||
| Insurance reimbursement | � | (76 | ) | � | ||||||||
| Loss on assets held for sale | � | 1,190 | � | |||||||||
| Impairment charges and other-than-temporary impairment charges | 159 | 201 | 823 | |||||||||
| Changes in assets and liabilities: | ||||||||||||
| Cash deposited with clearing organizations or segregated under federal and other regulations or requirements | (10,274 | ) | 4,532 | 211 | ||||||||
| Financial instruments owned, net of financial instruments sold, not yet purchased | 25,484 | 19,169 | (26,130 | ) | ||||||||
| Securities borrowed | 11,656 | 28,771 | (79,449 | ) | ||||||||
| Securities loaned | 1,368 | 2,848 | 11,666 | |||||||||
| Receivables, loans and other assets | 1,519 | (9,568 | ) | (2,445 | ) | |||||||
| Payables and other liabilities | (6,963 | ) | 697 | 769 | ||||||||
| Federal funds sold and securities purchased under agreements to resell | 18,098 | (5,045 | ) | (20,499 | ) | |||||||
| Securities sold under agreements to repurchase | (42,798 | ) | (9,334 | ) | 67,188 | |||||||
| Net cash provided by (used for) operating activities | 6,684 | 40,307 | (45,951 | ) | ||||||||
| CASH FLOWS FROM INVESTING ACTIVITIES | ||||||||||||
| Net proceeds from (payments for): | ||||||||||||
| Premises, equipment and software costs | (1,304 | ) | (1,201 | ) | (2,877 | ) | ||||||
| Business acquisitions, net of cash acquired | � | (1,042 | ) | (2,160 | ) | |||||||
| Business dispositions, net of cash disposed | � | 840 | 565 | |||||||||
| Sale of stake in China International Capital Corporation Limited | � | 989 | � | |||||||||
| Japanese securities joint venture with MUFG | (129 | ) | 247 | � | ||||||||
| Purchases of securities available for sale | (20,601 | ) | (29,989 | ) | � | |||||||
| Sales, maturities and redemptions of securities available for sale | 19,998 | 999 | � | |||||||||
| Net cash provided by (used for) investing activities | (2,036 | ) | (29,157 | ) | (4,472 | ) | ||||||
| CASH FLOWS FROM FINANCING ACTIVITIES | ||||||||||||
| Net proceeds from (payments for): | ||||||||||||
| Commercial paper and other short-term borrowings | (413 | ) | 878 | (7,724 | ) | |||||||
| Distributions related to noncontrolling interests | (791 | ) | (332 | ) | � | |||||||
| Derivatives financing activities | (3 | ) | (85 | ) | (85 | ) | ||||||
| Other secured financings | 1,867 | (751 | ) | (4,437 | ) | |||||||
| Deposits | 1,850 | 1,597 | 10,860 | |||||||||
| Net proceeds from: | ||||||||||||
| Excess tax benefits associated with stock-based awards | � | 5 | 102 | |||||||||
| Public offerings and other issuances of common stock | � | 5,581 | 6,255 | |||||||||
| Issuance of long-term borrowings | 32,725 | 32,523 | 43,960 | |||||||||
| Payments for: | ||||||||||||
| Long-term borrowings | (39,232 | ) | (28,201 | ) | (33,175 | ) | ||||||
| Series D Preferred Stock and Warrant | � | � | (10,950 | ) | ||||||||
| Redemption of junior subordinated debentures related to China Investment Corporation Ltd. | � | (5,579 | ) | � | ||||||||
| Repurchases of common stock for employee tax withholding | (317 | ) | (317 | ) | (50 | ) | ||||||
| Cash dividends | (834 | ) | (1,156 | ) | (1,732 | ) | ||||||
| Net cash provided by (used for) financing activities | (5,148 | ) | 4,163 | 3,024 | ||||||||
| Effect of exchange rate changes on cash and cash equivalents | (314 | ) | 14 | 720 | ||||||||
| Effect of cash and cash equivalents related to variable interest entities | 511 | 297 | � | |||||||||
| Net increase in cash and cash equivalents | (303 | ) | 15,624 | (46,679 | ) | |||||||
| Cash and cash equivalents, at beginning of period | 47,615 | 31,991 | 78,670 | |||||||||
| Cash and cash equivalents, at end of period | $ | 47,312 | $ | 47,615 | $ | 31,991 | ||||||
| Cash and cash equivalents include: | ||||||||||||
| Cash and due from banks | $ | 13,165 | $ | 7,341 | $ | 6,988 | ||||||
| Interest bearing deposits with banks | 34,147 | 40,274 | 25,003 | |||||||||
| Cash and cash equivalents, at end of period | $ | 47,312 | $ | 47,615 | $ | 31,991 | ||||||
| | 130 |
| Preferred Stock | Common Stock | Paid-in Capital | Retained Earnings | Employee Stock Trust | Accumulated Other Comprehensive Income (Loss) | Common Stock Held in Treasury at�Cost | Common Stock Issued to Employee Trust | Non- controlling Interests | Total Equity | |||||||||||||||||||||||||||||||
| BALANCE AT DECEMBER 31, 2008 | $ | 19,168 | $ | 12 | $ | 459 | $ | 36,154 | $ | 4,312 | $ | (420 | ) | $ | (6,620 | ) | $ | (4,312 | ) | $ | 703 | $ | 49,456 | |||||||||||||||||
| Net income | � | � | � | 1,346 | � | � | � | � | 60 | 1,406 | ||||||||||||||||||||||||||||||
| Dividends | � | � | � | (1,310 | ) | � | � | � | � | (23 | ) | (1,333 | ) | |||||||||||||||||||||||||||
| Shares issued under employee plans and related tax effects | � | � | 485 | � | (248 | ) | � | 631 | 248 | � | 1,116 | |||||||||||||||||||||||||||||
| Repurchases of common stock | � | � | � | � | � | � | (50 | ) | � | � | (50 | ) | ||||||||||||||||||||||||||||
| Morgan Stanley public offerings of common stock | � | 3 | 6,209 | � | � | � | � | � | � | 6,212 | ||||||||||||||||||||||||||||||
| Series C Preferred Stock extinguished and exchanged for common stock | (503 | ) | � | 705 | (202 | ) | � | � | � | � | � | � | ||||||||||||||||||||||||||||
| Series D Preferred Stock and Warrant | (9,068 | ) | � | (950 | ) | (932 | ) | � | � | � | � | � | (10,950 | ) | ||||||||||||||||||||||||||
| Gain on Morgan Stanley Smith Barney transaction | � | � | 1,711 | � | � | � | � | � | � | 1,711 | ||||||||||||||||||||||||||||||
| Net change in cash flow hedges | � | � | � | � | � | 13 | � | � | � | 13 | ||||||||||||||||||||||||||||||
| Pension and postretirement adjustments | � | � | � | � | � | (269 | ) | � | � | (4 | ) | (273 | ) | |||||||||||||||||||||||||||
| Foreign currency translation adjustments | � | � | � | � | � | 116 | � | � | (4 | ) | 112 | |||||||||||||||||||||||||||||
| Increase in noncontrolling interests related to Morgan Stanley Smith Barney transaction | � | � | � | � | � | � | � | � | 4,825 | 4,825 | ||||||||||||||||||||||||||||||
| Other increases in noncontrolling interests | � | � | � | � | � | � | � | � | 535 | 535 | ||||||||||||||||||||||||||||||
| BALANCE AT DECEMBER 31, 2009 | 9,597 | 15 | 8,619 | 35,056 | 4,064 | (560 | ) | (6,039 | ) | (4,064 | ) | 6,092 | 52,780 | |||||||||||||||||||||||||||
| Net income | � | � | � | 4,703 | � | � | � | � | 999 | 5,702 | ||||||||||||||||||||||||||||||
| Dividends | � | � | � | (1,156 | ) | � | � | � | � | � | (1,156 | ) | ||||||||||||||||||||||||||||
| Shares issued under employee plans and related tax effects | � | � | (1,407 | ) | � | (599 | ) | � | 2,297 | 599 | � | 890 | ||||||||||||||||||||||||||||
| Repurchases of common stock | � | � | � | � | � | � | (317 | ) | � | � | (317 | ) | ||||||||||||||||||||||||||||
| Net change in cash flow hedges | � | � | � | � | � | 9 | � | � | � | 9 | ||||||||||||||||||||||||||||||
| Pension and postretirement adjustments | � | � | � | � | � | (18 | ) | � | � | (2 | ) | (20 | ) | |||||||||||||||||||||||||||
| Foreign currency translation adjustments | � | � | � | � | � | 66 | � | � | 155 | 221 | ||||||||||||||||||||||||||||||
| Gain on Japanese securities joint venture with MUFG | � | � | 731 | � | � | � | � | � | � | 731 | ||||||||||||||||||||||||||||||
| Change in net unrealized gains on securities available for sale | � | � | � | � | � | 36 | � | � | � | 36 | ||||||||||||||||||||||||||||||
| Redemption of CIC equity units and issuance of common stock | � | 1 | 5,578 | � | � | � | � | � | � | 5,579 | ||||||||||||||||||||||||||||||
| Increase in noncontrolling interests related to Japanese securities joint venture with MUFG | � | � | � | � | � | � | � | � | 1,130 | 1,130 | ||||||||||||||||||||||||||||||
| Other decreases in noncontrolling interests | � | � | � | � | � | � | � | � | (178 | ) | (178 | ) | ||||||||||||||||||||||||||||
| BALANCE AT DECEMBER 31, 2010 | $ | 9,597 | $ | 16 | $ | 13,521 | $ | 38,603 | $ | 3,465 | $ | (467 | ) | $ | (4,059 | ) | $ | (3,465 | ) | $ | 8,196 | $ | 65,407 | |||||||||||||||||
| 131 | |
| Preferred Stock | Common Stock | Paid-in Capital | Retained Earnings | Employee Stock Trust | Accumulated Other Comprehensive Income (Loss) | Common Stock Held in Treasury at Cost | Common Stock Issued to Employee Trust | Non- controlling Interests | Total Equity | |||||||||||||||||||||||||||||||
| BALANCE AT DECEMBER 31, 2010 | $ | 9,597 | $ | 16 | $ | 13,521 | $ | 38,603 | $ | 3,465 | $ | (467 | ) | $ | (4,059 | ) | $ | (3,465 | ) | $ | 8,196 | $ | 65,407 | |||||||||||||||||
| Net income | � | � | � | 4,110 | � | � | � | � | 535 | 4,645 | ||||||||||||||||||||||||||||||
| Dividends | � | � | � | (646 | ) | � | � | � | � | � | (646 | ) | ||||||||||||||||||||||||||||
| Shares issued under employee plans and related tax effects | � | � | (642 | ) | � | (299 | ) | � | 1,877 | 299 | � | 1,235 | ||||||||||||||||||||||||||||
| Repurchases of common stock | � | � | � | � | � | � | (317 | ) | � | � | (317 | ) | ||||||||||||||||||||||||||||
| Net change in cash flow hedges | � | � | � | � | � | 7 | � | � | � | 7 | ||||||||||||||||||||||||||||||
| Pension, postretirement and other related adjustments | � | � | � | � | � | 251 | � | � | � | 251 | ||||||||||||||||||||||||||||||
| Foreign currency translation adjustments | � | � | � | � | � | (35 | ) | � | � | 70 | 35 | |||||||||||||||||||||||||||||
| Change in net unrealized gains on securities available for sale | � | � | � | � | � | 87 | � | � | � | 87 | ||||||||||||||||||||||||||||||
| Other increase in equity method investments | � | � | 146 | � | � | � | � | � | � | 146 | ||||||||||||||||||||||||||||||
| MUFG stock conversion | (8,089 | ) | 4 | 9,811 | (1,726 | ) | � | � | � | � | � | � | ||||||||||||||||||||||||||||
| Other decreases in noncontrolling interests | � | � | � | � | � | � | � | � | (772 | ) | (772 | ) | ||||||||||||||||||||||||||||
| BALANCE AT DECEMBER 31, 2011 | $ | 1,508 | $ | 20 | $ | 22,836 | $ | 40,341 | $ | 3,166 | $ | (157 | ) | $ | (2,499 | ) | $ | (3,166 | ) | $ | 8,029 | $ | 70,078 | |||||||||||||||||
| | 132 |
Table of Contents MORGAN STANLEY NOTES TO CONSOLIDATED FINANCIAL STATEMENTS�(Continued) Revel Entertainment Group, LLC. On March�31, 2010, the Board of
Directors authorized a plan of disposal by sale for Revel Entertainment Group, LLC (�Revel�), a development stage enterprise and subsidiary of the Company that was primarily associated with a development property in Atlantic City, New
Jersey. On February�17, 2011, the Company completed the sale of Revel. The Company did not retain any stake or ongoing involvement. The sale price approximated the carrying value of Revel and, accordingly, the Company did not recognize any
pre-tax gain or loss in 2011 on the sale. Total assets of Revel included in the Company�s consolidated statement of financial condition at December�31, 2010 approximated $28 million. The results of Revel are reported as discontinued
operations within the Institutional Securities business segment for all periods presented through the date of sale. Amounts for 2010 included losses of $1.2 billion in connection with such disposition. See Note 22 for additional information about an
income tax benefit related to Revel. CityMortgage
Bank. In the third quarter of 2010, the Company completed the disposal of CityMortgage Bank (�CMB�), a Moscow-based mortgage bank. The results of CMB are reported as discontinued operations for all periods
presented through the date of sale within the Institutional Securities business segment. Other. In the third quarter of 2010, the Company completed a disposal of a real estate property within the Asset Management business segment. The results of operations are
reported as discontinued operations for all periods presented through the date of sale. 2009. MSCI Inc. In May 2009, the Company divested all of its remaining ownership interest in MSCI Inc. (�MSCI�). The
results of MSCI are reported as discontinued operations through the date of sale within the Institutional Securities business segment. Crescent. Discontinued operations in 2009 include operating results related to the disposition of Crescent Real Estate
Equities Limited Partnership (�Crescent�), a former real estate subsidiary of the Company. The Company completed the disposition of Crescent in the fourth quarter of 2009, whereby the Company transferred its ownership interest in Crescent
to Crescent�s primary creditor in exchange for full release of liability on the related loans. The results of Crescent are reported as discontinued operations within the Asset Management business segment. Discover. On June�30, 2007, the Company
completed the spin-off of its business segment Discover Financial Services (�DFS�) to its shareholders. On February�11, 2010, DFS paid the Company $775 million in complete satisfaction of its obligations to the Company regarding the
sharing of proceeds from a lawsuit against Visa and MasterCard. The payment was recorded as a gain in discontinued operations for 2010. Prior period amounts have been recast for discontinued operations. See Note 25 for additional information on discontinued operations. Basis of Financial Information. The
consolidated financial statements are prepared in accordance with accounting principles generally accepted in the United States of America (�U.S.�), which require the Company to make estimates and assumptions regarding the valuations of
certain financial instruments, the valuation of goodwill and intangible assets, compensation, deferred tax assets, the outcome of litigation and tax matters, and other matters that affect the consolidated financial statements and related
disclosures. The Company believes that the estimates utilized in the preparation of the consolidated financial statements are prudent and reasonable. Actual results could differ materially from these estimates. At December�31, 2011, the Company had approximately $5.6 billion in
Financial instruments owned�Corporate and other debt, $3.8 billion of physical commodities within�Financial instruments owned�Physical | | 134 |
| 135 | |
| | 136 |
| � | Level 1�Valuations based on quoted prices in active markets for identical assets or liabilities that the Company has the ability to access. Valuation adjustments and block discounts are not applied to Level 1 instruments. Since valuations are based on quoted prices that are readily and regularly available in an active market, valuation of these products does not entail a significant degree of judgment. |
| � | Level 2�Valuations based on one or more quoted prices in markets that are not active or for which all significant inputs are observable, either directly or indirectly. |
| 137 | |
| � | Level 3�Valuations based on inputs that are unobservable and significant to the overall fair value measurement. |
| | 138 |
| 139 | |
| | 140 |
| 141 | |
| | 142 |
| 143 | |
| | 144 |
| 145 | |
| Total fair value of consideration transferred | $ | 6,087 | ||
| Total fair value of noncontrolling interest | 3,973 | |||
| Total fair value of Smith Barney(1) | 10,060 | |||
| Total fair value of net assets acquired | 4,852 | |||
| Acquisition-related goodwill(2) | $ | 5,208 | ||
| (1) | Total fair value of Smith Barney is inclusive of control premium. |
| | 146 |
| (2) | Goodwill is recorded within the Global Wealth Management Group business segment. Approximately $963 million of goodwill is deductible for tax purposes. |
| At May�31, 2009 | ||||
| (dollars�in�millions) | ||||
| Assets | ||||
| Cash and due from banks | $ | 920 | ||
| Financial instruments owned | 33 | |||
| Receivables | 1,667 | |||
| Intangible assets | 4,480 | |||
| Other assets | 881 | |||
| Total assets acquired | $ | 7,981 | ||
| Liabilities | ||||
| Financial instrument sold, not yet purchased | $ | 11 | ||
| Long-term borrowings | 2,320 | |||
| Other liabilities and accrued expenses | 798 | |||
| Total liabilities assumed | $ | 3,129 | ||
| Net assets acquired | $ | 4,852 | ||
| At�May�31,�2009 | Estimated�Useful�Life | |||||||
| (dollars�in�millions) | (in years) | |||||||
| Customer relationships | $ | 4,000 | 16 | |||||
| Research | 176 | 5 | ||||||
| Intangible lease asset | 24 | 1-10 | ||||||
| Total | $ | 4,200 | ||||||
| 147 | |
| Total fair value of consideration transferred | $ | 300 | ||
| Total fair value of noncontrolling interest | 289 | |||
| Total fair value of Citi Managed Futures | 589 | |||
| Total fair value of net assets acquired | 453 | |||
| Acquisition-related goodwill(1) | $ | 136 | ||
| (1) | Goodwill is recorded within the Global Wealth Management Group business segment. Approximately $4 million of goodwill is deductible for tax purposes. |
| At July�31, 2009 | ||||
| (dollars�in�millions) | ||||
| Assets | ||||
| Financial instruments owned | $ | 83 | ||
| Receivables | 86 | |||
| Intangible assets | 275 | |||
| Other assets | 11 | |||
| Total assets acquired | $ | 455 | ||
| Liabilities | ||||
| Other liabilities and accrued expenses | $ | 2 | ||
| Total liabilities assumed | $ | 2 | ||
| Net assets acquired | $ | 453 | ||
| | 148 |
| 2009 | ||||
| (unaudited) | ||||
| Net revenues | $ | 26,086 | ||
| Total non-interest expenses | 24,600 | |||
| Income from continuing operations before income taxes | 1,486 | |||
| Benefit from income taxes | (228 | ) | ||
| Income from continuing operations | 1,714 | |||
| Discontinued operations: | ||||
| Loss from discontinued operations | (114 | ) | ||
| Benefit from income taxes | (93 | ) | ||
| Net loss from discontinued operations | (21 | ) | ||
| Net income | 1,693 | |||
| Net income applicable to noncontrolling interests | 234 | |||
| Net income applicable to Morgan Stanley | $ | 1,459 | ||
| Loss applicable to Morgan Stanley common shareholders | $ | (794 | ) | |
| Loss per basic common share: | ||||
| Loss from continuing operations | $ | (0.63 | ) | |
| Net loss from discontinued operations | (0.04 | ) | ||
| Loss per basic common share | $ | (0.67 | ) | |
| Loss per diluted common share: | ||||
| Loss from continuing operations | $ | (0.63 | ) | |
| Net loss from discontinued operations | (0.04 | ) | ||
| Loss per diluted common share | $ | (0.67 | ) | |
| 149 | |
| � | U.S. Treasury Securities .����U.S. Treasury securities are valued using quoted market prices. Valuation adjustments are not applied. Accordingly, U.S. Treasury securities are generally categorized in Level�1 of the fair value hierarchy. |
| � | U.S. Agency Securities. U.S. agency securities are composed of three main categories consisting of agency-issued debt, agency mortgage pass-through pool securities and collateralized mortgage obligations. Non-callable agency-issued debt securities are generally valued using quoted market prices. Callable agency-issued debt securities are valued by benchmarking model-derived prices to quoted market prices and trade data for identical or comparable securities. The fair value of agency�mortgage pass-through pool securities is model-driven based on spreads of the comparable To-be-announced (�TBA�) security. Collateralized mortgage obligations are valued using quoted market prices and trade data adjusted by subsequent changes in related indices for identical or comparable securities. Actively traded non-callable agency-issued debt securities are generally categorized in Level 1 of the fair value hierarchy. Callable agency-issued debt securities, agency mortgage pass-through pool securities and collateralized mortgage obligations are generally categorized in Level 2 of the fair value hierarchy. |
| � | Foreign sovereign government obligations are valued using quoted prices in active markets when available. To the extent quoted prices are not available, fair value is determined based on a valuation model that has as inputs interest rate yield curves, cross-currency basis index spreads, and country credit spreads for structures similar to the bond in terms of issuer, maturity and seniority. These bonds are generally categorized in Level 1 or Level 2 of the fair value hierarchy. |
| � | State and Municipal Securities .����The fair value of state and municipal securities is determined using recently executed transactions, market price quotations and pricing models that factor in, where applicable, interest rates, bond or credit default swap spreads and volatility. These bonds are generally categorized in Level 2 of the fair value hierarchy. |
| � | Residential Mortgage-Backed Securities (�RMBS�), Commercial Mortgage-Backed Securities (�CMBS�) and other Asset-Backed Securities (�ABS�) .����RMBS, CMBS and other ABS may be valued based on price or spread data obtained from observed transactions or independent external parties such as vendors or brokers. When position-specific external price data are not observable, the fair value determination may require benchmarking to similar instruments and/or analyzing expected credit losses, default and recovery rates. In evaluating the fair value of each security, the Company considers security collateral-specific attributes, including payment priority, credit enhancement levels, type of collateral, delinquency rates and loss severity. In addition, for RMBS borrowers, Fair Isaac Corporation (�FICO�) scores and the level of documentation for the loan are also considered. Market standard models, such as Intex, Trepp or others, may be deployed to model the specific collateral composition and cash flow structure of each transaction. Key inputs to these models are market spreads, forecasted credit losses, default and prepayment rates for each asset category. Valuation levels of RMBS and CMBS indices are also used as an additional data point for benchmarking purposes or to price outright index positions. |
| | 150 |
| � | Corporate Bonds .����The fair value of corporate bonds is determined using recently executed transactions, market price quotations (where observable), bond spreads or credit default swap spreads obtained from independent external parties such as vendors and brokers adjusted for any basis difference between cash and derivative instruments. The spread data used are for the same maturity as the bond. If the spread data do not reference the issuer, then data that reference a comparable issuer are used. When position-specific external price data are not observable, fair value is determined based on either benchmarking to similar instruments or cash flow models with yield curves, bond or single name credit default swap spreads and recovery rates as significant inputs. Corporate bonds are generally categorized in Level 2 of the fair value hierarchy; in instances where prices, spreads or any of the other aforementioned key inputs are unobservable, they are categorized in Level 3 of the fair value hierarchy. |
| � | Collateralized Debt Obligations (�CDO�) .����The Company holds cash CDOs that typically reference a tranche of an underlying synthetic portfolio of single name credit default swaps. The collateral is usually ABS or other corporate bonds. Credit correlation, a primary input used to determine the fair value of a cash CDO, is usually unobservable and derived using a benchmarking technique. The other model inputs such as credit spreads, including collateral spreads, and interest rates are typically observable. CDOs are categorized in Level 2 of the fair value hierarchy when the credit correlation input is insignificant. In instances where the credit correlation input is deemed to be significant, these instruments are categorized in Level 3 of the fair value hierarchy. |
| � | Corporate Loans and Lending Commitments .����The fair value of corporate loans is determined using recently executed transactions, market price quotations (where observable), implied yields from comparable debt, and market observable credit default swap spread levels obtained from independent external parties such as vendors and brokers adjusted for any basis difference between cash and derivative instruments, along with proprietary valuation models and default recovery analysis where such transactions and quotations are unobservable. The fair value of�contingent corporate lending commitments is determined by using executed transactions on comparable loans and the anticipated market price based on pricing indications from syndicate banks and customers. The valuation of loans and lending commitments also takes into account fee income that is considered an attribute of the contract. Corporate loans and lending commitments are categorized in Level 2 of the fair value hierarchy except in instances where prices or significant spread inputs are unobservable, in which case they are categorized in Level 3 of the fair value hierarchy. |
| � | Mortgage Loans .����Mortgage loans are valued using observable prices based on transactional data or third party pricing for identical or comparable instruments, when available. Where position-specific external prices are not observable, the Company estimates fair value based on benchmarking to prices and rates observed in the primary market for similar loan or borrower types or based on the present value of expected future cash flows using its best estimates of the key assumptions, including forecasted credit losses, prepayment rates, forward yield curves and discount rates commensurate with the risks involved or a methodology that utilizes the capital structure and credit spreads of recent comparable securitization transactions. Mortgage loans valued based on observable market data for identical or comparable instruments are categorized in Level 2 of the fair value hierarchy. Where observable prices are not available, due to the subjectivity involved in the comparability assessment related to mortgage loan vintage, geographical concentration, prepayment speed and projected loss assumptions, mortgage loans are categorized in Level�3 of the fair value hierarchy. |
| 151 | |
| � | Auction Rate Securities (�ARS�) .����The Company primarily holds investments in�Student Loan Auction Rate Securities (�SLARS�)�and Municipal Auction Rate Securities (�MARS�)�with interest rates that are reset through periodic auctions. SLARS are�ABS backed by pools of student loans. MARS are municipal bonds often wrapped by municipal bond insurance. ARS were historically traded and valued as floating rate notes, priced at par due to the auction mechanism. Beginning in fiscal 2008, uncertainties in the credit markets have resulted in auctions failing for certain types of ARS. Once the auctions failed, ARS could no longer be valued using observations of auction market prices. Accordingly, the fair value of ARS is�determined using independent external market data where available and an internally developed methodology to discount for the lack of liquidity and non-performance risk. |
| � | Exchange-Traded Equity Securities .����Exchange-traded equity securities are generally valued based on quoted prices from the exchange. To the extent these securities are actively traded, valuation adjustments are not applied, and they are categorized in Level 1 of the fair value hierarchy; otherwise, they are categorized in Level 2 or Level 3 of the fair value hierarchy. |
| � | Listed Derivative Contracts .����Listed derivatives that are actively traded are valued based on quoted prices from the exchange and are categorized in Level 1 of the fair value hierarchy. Listed derivatives that are not actively traded are valued using the same approaches as those applied to OTC derivatives; they are generally categorized in Level 2 of the fair value hierarchy. |
| � | OTC Derivative Contracts .����OTC derivative contracts include forward, swap and option contracts related to interest rates, foreign currencies, credit standing of reference entities, equity prices or commodity prices. |
| | 152 |
| � | Collateralized Derivative Contracts .����In the fourth quarter of 2010, the Company began using the overnight indexed swap (�OIS�) curve as an input to value its collateralized interest rate derivative contracts. During the fourth quarter of 2011, the Company recognized a pre-tax loss of approximately $108 million in Principal transactions�Trading upon application of the OIS curve to certain additional fixed income products within the Institutional Securities business segment. Previously, the Company discounted these contracts based on London Interbank Offered Rate (�LIBOR�). At December�31, 2011, substantially all of the Company�s collateralized derivative contracts were valued using the OIS curve. |
| � | The Company�s investments include direct investments in equity securities as well as investments in private equity funds, real estate funds and hedge funds, which include investments made in connection with certain employee deferred compensation plans. Direct investments are presented in the fair value hierarchy table as Principal investments and Other. Initially, the transaction price is generally considered by the Company as the exit price and is the Company�s best estimate of fair value. |
| 153 | |
| � | The Company trades various physical commodities, including crude oil and refined products, natural gas, base and precious metals and agricultural products. Fair value for physical commodities is determined using observable inputs, including broker quotations and published indices. Physical commodities are categorized in Level 2 of the fair value hierarchy; in instances where significant inputs are unobservable, they are categorized in Level 3 of the fair value hierarchy. |
| � | Securities available for sale are composed of�U.S. government and agency securities (e.g., U.S. Treasury securities, agency-issued debt, agency mortgage pass-through securities and collateralized mortgage obligations), Federal Family Education Loan Program (�FFELP�) student loan asset-backed securities and equity securities. Actively traded U.S. Treasury securities, non-callable agency-issued debt securities and equity securities are generally categorized in Level 1 of the fair value hierarchy. Callable agency-issued debt securities, agency mortgage pass-through securities, collateralized mortgage obligations and FFELP student loan asset-backed securities are generally categorized in Level 2 of the fair value hierarchy. For further information on securities available for sale, see Note 5. |
| � | Time Deposits .����The fair value of certificates of deposit is determined using third-party quotations. These deposits are generally categorized in Level 2 of the fair value hierarchy. |
| � | Structured Notes .����The Company issues structured notes that have coupon or repayment terms linked to the performance of debt or equity securities, indices, currencies or commodities. Fair value of structured notes is determined using valuation models for the derivative and debt portions of the notes. These models incorporate observable inputs referencing identical or comparable securities, including prices that the notes are linked to, interest rate yield curves, option volatility and currency, commodity or equity rates. Independent, external and traded prices for the notes are also considered. The impact of the Company�s own credit spreads is also included based on the Company�s observed secondary bond market spreads. Most structured notes are categorized in Level 2 of the fair value hierarchy. |
| | 154 |
| � | The fair value of a reverse repurchase agreement or repurchase agreement is computed using a�standard cash flow discounting methodology. The inputs to the valuation include�contractual cash flows and collateral funding spreads,�which are estimated using�various benchmarks,�interest rate yield curves and�option volatilities. In instances where the unobservable inputs are deemed significant, reverse repurchase agreements and repurchase agreements are categorized in Level 3 of the fair value hierarchy; otherwise, they are categorized in Level�2 of the fair value hierarchy. |
| Quoted�Prices�in Active�Markets�for Identical�Assets (Level 1) | Significant Observable Inputs (Level 2) | Significant Unobservable Inputs (Level 3) | Counterparty and�Cash Collateral Netting | Balance�at December�31, 2011 | ||||||||||||||||
| (dollars in millions) | ||||||||||||||||||||
| Assets | ||||||||||||||||||||
| Financial instruments owned: | ||||||||||||||||||||
| U.S. government and agency securities: | ||||||||||||||||||||
| U.S. Treasury securities | $ | 38,769 | $ | 1 | $ | � | $ | � | $ | 38,770 | ||||||||||
| U.S. agency securities | 4,332 | 20,339 | 8 | � | 24,679 | |||||||||||||||
| Total U.S. government and agency securities | 43,101 | 20,340 | 8 | � | 63,449 | |||||||||||||||
| Other sovereign government obligations | 22,650 | 6,290 | 119 | � | 29,059 | |||||||||||||||
| Corporate and other debt: | ||||||||||||||||||||
| State and municipal securities | � | 2,261 | � | � | 2,261 | |||||||||||||||
| Residential mortgage-backed securities | � | 1,304 | 494 | � | 1,798 | |||||||||||||||
| Commercial mortgage-backed securities | � | 1,686 | 134 | � | 1,820 | |||||||||||||||
| Asset-backed securities | � | 937 | 31 | � | 968 | |||||||||||||||
| Corporate bonds | � | 25,873 | 675 | � | 26,548 | |||||||||||||||
| Collateralized debt obligations | � | 1,711 | 980 | � | 2,691 | |||||||||||||||
| Loans and lending commitments | � | 14,854 | 9,590 | � | 24,444 | |||||||||||||||
| Other debt | � | 8,265 | 128 | � | 8,393 | |||||||||||||||
| Total corporate and other debt | � | 56,891 | 12,032 | � | 68,923 | |||||||||||||||
| Corporate equities(1) | 45,173 | 2,376 | 417 | � | 47,966 | |||||||||||||||
| Derivative and other contracts: | ||||||||||||||||||||
| Interest rate contracts | 1,493 | 906,082 | 5,301 | � | 912,876 | |||||||||||||||
| Credit contracts | � | 123,689 | 15,102 | � | 138,791 | |||||||||||||||
| Foreign exchange contracts | � | 61,770 | 573 | � | 62,343 | |||||||||||||||
| Equity contracts | 929 | 44,558 | 800 | � | 46,287 | |||||||||||||||
| Commodity contracts | 6,356 | 31,246 | 2,176 | � | 39,778 | |||||||||||||||
| Other | � | 292 | 306 | � | 598 | |||||||||||||||
| Netting(2) | (7,596 | ) | (1,045,912 | ) | (11,837 | ) | (87,264 | ) | (1,152,609 | ) | ||||||||||
| Total derivative and other contracts | 1,182 | 121,725 | 12,421 | (87,264 | ) | 48,064 | ||||||||||||||
| 155 | |
| Quoted�Prices�in Active�Markets�for Identical�Assets (Level 1) | Significant Observable Inputs (Level 2) | Significant Unobservable Inputs (Level 3) | Counterparty and�Cash Collateral Netting | Balance�at December�31, 2011 | ||||||||||||||||
| (dollars in millions) | ||||||||||||||||||||
| Investments: | ||||||||||||||||||||
| Private equity funds | � | 7 | 1,936 | � | 1,943 | |||||||||||||||
| Real estate funds | � | 5 | 1,213 | � | 1,218 | |||||||||||||||
| Hedge funds | � | 473 | 696 | � | 1,169 | |||||||||||||||
| Principal investments | 161 | 104 | 2,937 | � | 3,202 | |||||||||||||||
| Other | 141 | 21 | 501 | � | 663 | |||||||||||||||
| Total investments | 302 | 610 | 7,283 | � | 8,195 | |||||||||||||||
| Physical commodities | � | 9,651 | 46 | � | 9,697 | |||||||||||||||
| Total financial instruments owned | 112,408 | 217,883 | 32,326 | (87,264 | ) | 275,353 | ||||||||||||||
| Securities available for sale | 13,437 | 17,058 | � | � | 30,495 | |||||||||||||||
| Securities received as collateral | 11,530 | 121 | � | � | 11,651 | |||||||||||||||
| Federal funds sold and securities purchased under agreements to resell | � | 112 | � | � | 112 | |||||||||||||||
| Intangible assets(3) | � | � | 133 | � | 133 | |||||||||||||||
| Liabilities | ||||||||||||||||||||
| Deposits | $ | � | $ | 2,101 | $ | � | $ | � | $ | 2,101 | ||||||||||
| Commercial�paper and other short-term borrowings | � | 1,337 | 2 | � | 1,339 | |||||||||||||||
| Financial instruments sold, not yet purchased: | ||||||||||||||||||||
| U.S. government and agency securities: | ||||||||||||||||||||
| U.S. Treasury securities | 17,776 | � | � | � | 17,776 | |||||||||||||||
| U.S. agency securities | 1,748 | 106 | � | � | 1,854 | |||||||||||||||
| Total U.S. government and agency securities | 19,524 | 106 | � | � | 19,630 | |||||||||||||||
| Other sovereign government obligations | 14,981 | 2,152 | 8 | � | 17,141 | |||||||||||||||
| Corporate and other debt: | ||||||||||||||||||||
| State and municipal securities | � | 3 | � | � | 3 | |||||||||||||||
| Residential mortgage-backed securities | � | � | 355 | � | 355 | |||||||||||||||
| Commercial mortgage-backed securities | � | 14 | � | � | 14 | |||||||||||||||
| Corporate bonds | � | 6,217 | 219 | � | 6,436 | |||||||||||||||
| Collateralized debt obligations | � | 3 | � | � | 3 | |||||||||||||||
| Unfunded lending commitments | � | 1,284 | 85 | � | 1,369 | |||||||||||||||
| Other debt | � | 157 | 73 | � | 230 | |||||||||||||||
| Total corporate and other debt | � | 7,678 | 732 | � | 8,410 | |||||||||||||||
| | 156 |
| Quoted�Prices�in Active�Markets�for Identical�Assets (Level 1) | Significant Observable Inputs (Level 2) | Significant Unobservable Inputs (Level 3) | Counterparty and�Cash Collateral Netting | Balance�at December�31, 2011 | ||||||||||||||||
| (dollars in millions) | ||||||||||||||||||||
| Corporate equities(1) | 24,347 | 149 | 1 | � | 24,497 | |||||||||||||||
| Derivative and other contracts: | ||||||||||||||||||||
| Interest rate contracts | 1,680 | 873,466 | 4,881 | � | 880,027 | |||||||||||||||
| Credit contracts | � | 121,438 | 9,288 | � | 130,726 | |||||||||||||||
| Foreign exchange contracts | � | 64,218 | 530 | � | 64,748 | |||||||||||||||
| Equity contracts | 877 | 45,375 | 2,034 | � | 48,286 | |||||||||||||||
| Commodity contracts | 7,144 | 31,248 | 1,606 | � | 39,998 | |||||||||||||||
| Other | � | 879 | 1,396 | � | 2,275 | |||||||||||||||
| Netting(2) | (7,596 | ) | (1,045,912 | ) | (11,837 | ) | (54,262 | ) | (1,119,607 | ) | ||||||||||
| Total derivative and other contracts | 2,105 | 90,712 | 7,898 | (54,262 | ) | 46,453 | ||||||||||||||
| Physical commodities | � | 16 | � | � | 16 | |||||||||||||||
| Total financial instruments sold, not yet purchased | 60,957 | 100,813 | 8,639 | (54,262 | ) | 116,147 | ||||||||||||||
| Obligation to return securities received as collateral | 15,267 | 127 | � | � | 15,394 | |||||||||||||||
| Securities sold under agreements to repurchase | � | 8 | 340 | � | 348 | |||||||||||||||
| Other secured financings | � | 14,024 | 570 | � | 14,594 | |||||||||||||||
| Long-term borrowings | 10 | 38,050 | 1,603 | � | 39,663 | |||||||||||||||
| (1) | The Company holds or sells short for trading purposes equity securities issued by entities in diverse industries and of varying size. |
| (2) | For positions with the same counterparty that cross over the levels of the fair value hierarchy, both counterparty netting and cash collateral netting are included in the column titled �Counterparty and Cash Collateral Netting.� For contracts with the same counterparty, counterparty netting among positions classified within the same level is included within that level. For further information on derivative instruments and hedging activities, see Note 12. |
| (3) | Amount represents mortgage servicing rights (�MSR�) accounted for at fair value. See Note 7 for further information on MSRs. |
| 157 | |
| Quoted�Prices�in Active�Markets�for Identical�Assets (Level 1) | Significant Observable Inputs (Level 2) | Significant Unobservable Inputs (Level 3) | Counterparty and�Cash Collateral Netting | Balance�at December�31, 2010 | ||||||||||||||||
| (dollars in millions) | ||||||||||||||||||||
| Assets | ||||||||||||||||||||
| Financial instruments owned: | ||||||||||||||||||||
| U.S. government and agency securities: | ||||||||||||||||||||
| U.S. Treasury securities | $ | 19,226 | $ | � | $ | � | $ | � | $ | 19,226 | ||||||||||
| U.S. agency securities | 3,827 | 25,380 | 13 | � | 29,220 | |||||||||||||||
| Total U.S. government and agency securities | 23,053 | 25,380 | 13 | � | 48,446 | |||||||||||||||
| Other sovereign government obligations | 25,334 | 8,501 | 73 | � | 33,908 | |||||||||||||||
| Corporate and other debt: | ||||||||||||||||||||
| State and municipal securities | � | 3,229 | 110 | � | 3,339 | |||||||||||||||
| Residential mortgage-backed securities | � | 3,690 | 319 | � | 4,009 | |||||||||||||||
| Commercial mortgage-backed securities | � | 2,692 | 188 | � | 2,880 | |||||||||||||||
| Asset-backed securities | � | 2,322 | 13 | � | 2,335 | |||||||||||||||
| Corporate bonds | � | 39,569 | 1,368 | � | 40,937 | |||||||||||||||
| Collateralized debt obligations | � | 2,305 | 1,659 | � | 3,964 | |||||||||||||||
| Loans and lending commitments | � | 15,308 | 11,666 | � | 26,974 | |||||||||||||||
| Other debt | � | 3,523 | 193 | � | 3,716 | |||||||||||||||
| Total corporate and other debt | � | 72,638 | 15,516 | � | 88,154 | |||||||||||||||
| Corporate equities(1) | 65,009 | 2,923 | 484 | � | 68,416 | |||||||||||||||
| Derivative and other contracts: | ||||||||||||||||||||
| Interest rate contracts | 3,985 | 616,016 | 966 | � | 620,967 | |||||||||||||||
| Credit contracts | � | 95,818 | 14,316 | � | 110,134 | |||||||||||||||
| Foreign exchange contracts | 1 | 61,556 | 431 | � | 61,988 | |||||||||||||||
| Equity contracts | 2,176 | 36,612 | 1,058 | � | 39,846 | |||||||||||||||
| Commodity contracts | 5,464 | 57,528 | 1,160 | � | 64,152 | |||||||||||||||
| Other | � | 108 | 135 | � | 243 | |||||||||||||||
| Netting(2) | (8,551 | ) | (761,939 | ) | (7,168 | ) | (68,380 | ) | (846,038 | ) | ||||||||||
| Total derivative and other contracts | 3,075 | 105,699 | 10,898 | (68,380 | ) | 51,292 | ||||||||||||||
| Investments: | ||||||||||||||||||||
| Private equity funds | � | � | 1,986 | � | 1,986 | |||||||||||||||
| Real estate funds | � | 8 | 1,176 | � | 1,184 | |||||||||||||||
| Hedge funds | � | 736 | 901 | � | 1,637 | |||||||||||||||
| Principal investments | 286 | 486 | 3,131 | � | 3,903 | |||||||||||||||
| Other(3) | 403 | 79 | 560 | � | 1,042 | |||||||||||||||
| Total investments | 689 | 1,309 | 7,754 | � | 9,752 | |||||||||||||||
| Physical commodities | � | 6,778 | � | � | 6,778 | |||||||||||||||
| Total financial instruments owned | 117,160 | 223,228 | 34,738 | (68,380 | ) | 306,746 | ||||||||||||||
| | 158 |
| Quoted�Prices�in Active�Markets�for Identical�Assets (Level 1) | Significant Observable Inputs (Level 2) | Significant Unobservable Inputs (Level 3) | Counterparty and�Cash Collateral Netting | Balance�at December�31, 2010 | ||||||||||||||||
| (dollars in millions) | ||||||||||||||||||||
| Securities available for sale: | ||||||||||||||||||||
| U.S. government and agency securities | 20,792 | 8,857 | � | � | 29,649 | |||||||||||||||
| Securities received as collateral | 15,646 | 890 | 1 | � | 16,537 | |||||||||||||||
| Intangible assets(4) | � | � | 157 | � | 157 | |||||||||||||||
| Liabilities | ||||||||||||||||||||
| Deposits | $ | � | $ | 3,011 | $ | 16 | $ | � | $ | 3,027 | ||||||||||
| Commercial�paper and other short-term borrowings | � | 1,797 | 2 | � | 1,799 | |||||||||||||||
| Financial instruments sold, not yet purchased: | ||||||||||||||||||||
| U.S. government and agency securities: | ||||||||||||||||||||
| U.S. Treasury securities | 25,225 | � | � | � | 25,225 | |||||||||||||||
| U.S. agency securities | 2,656 | 67 | � | � | 2,723 | |||||||||||||||
| Total U.S. government and agency securities | 27,881 | 67 | � | � | 27,948 | |||||||||||||||
| Other sovereign government obligations | 19,708 | 2,542 | � | � | 22,250 | |||||||||||||||
| Corporate and other debt: | ||||||||||||||||||||
| State and municipal securities | � | 11 | � | � | 11 | |||||||||||||||
| Asset-backed securities | � | 12 | � | � | 12 | |||||||||||||||
| Corporate bonds | � | 9,100 | 44 | � | 9,144 | |||||||||||||||
| Collateralized debt obligations | � | 2 | � | � | 2 | |||||||||||||||
| Unfunded lending commitments | � | 464 | 263 | � | 727 | |||||||||||||||
| Other debt | � | 828 | 194 | � | 1,022 | |||||||||||||||
| Total corporate and other debt | � | 10,417 | 501 | � | 10,918 | |||||||||||||||
| Corporate equities(1) | 19,696 | 127 | 15 | � | 19,838 | |||||||||||||||
| Derivative and other contracts: | ||||||||||||||||||||
| Interest rate contracts | 3,883 | 591,378 | 542 | � | 595,803 | |||||||||||||||
| Credit contracts | � | 87,904 | 7,722 | � | 95,626 | |||||||||||||||
| Foreign exchange contracts | 2 | 64,301 | 385 | � | 64,688 | |||||||||||||||
| Equity contracts | 2,098 | 42,242 | 1,820 | � | 46,160 | |||||||||||||||
| Commodity contracts | 5,871 | 58,885 | 972 | � | 65,728 | |||||||||||||||
| Other | � | 520 | 1,048 | � | 1,568 | |||||||||||||||
| Netting(2) | (8,551 | ) | (761,939 | ) | (7,168 | ) | (44,113 | ) | (821,771 | ) | ||||||||||
| Total derivative and other contracts | 3,303 | 83,291 | 5,321 | (44,113 | ) | 47,802 | ||||||||||||||
| Total financial instruments sold, not yet purchased | 70,588 | 96,444 | 5,837 | (44,113 | ) | 128,756 | ||||||||||||||
| Obligation to return securities received as collateral | 20,272 | 890 | 1 | � | 21,163 | |||||||||||||||
| Securities sold under agreements to repurchase | � | 498 | 351 | � | 849 | |||||||||||||||
| Other secured financings | � | 7,474 | 1,016 | � | 8,490 | |||||||||||||||
| Long-term borrowings | � | 41,393 | 1,316 | � | 42,709 | |||||||||||||||
| (1) | The Company holds or sells short for trading purposes equity securities issued by entities in diverse industries and of varying size. |
| 159 | |
| (2) | For positions with the same counterparty that cross over the levels of the fair value hierarchy, both counterparty netting and cash collateral netting are included in the column titled �Counterparty and Cash Collateral Netting.� For contracts with the same counterparty, counterparty netting among positions classified within the same level is included within that level. For further information on derivative instruments and hedging activities, see Note 12. |
| (3) | In June 2010, the Company voluntarily contributed $25 million to certain other investments in funds that it manages in connection with upcoming rule changes regarding net asset value disclosures for money market funds. Based on current liquidity and fund performance, the Company does not expect to provide additional voluntary support to non-consolidated funds that it manages. |
| (4) | Amount represents MSRs accounted for at fair value. See Note 7 for further information on MSRs. |
| | 160 |
| Beginning Balance at December�31, 2010 | Total�Realized and�Unrealized Gains�(Losses)(1) | Purchases | Sales | Issuances | Settlements | Net�Transfers | Ending Balance�at December�31, 2011 | Unrealized Gains�(Losses) for�Level�3 Assets/ Liabilities Outstanding� at December�31, 2011(2) | ||||||||||||||||||||||||||||
| (dollars in millions) | ||||||||||||||||||||||||||||||||||||
| Assets | ||||||||||||||||||||||||||||||||||||
| Financial instruments owned: | ||||||||||||||||||||||||||||||||||||
| U.S. agency securities | $ | 13 | $ | � | $ | 66 | $ | (68 | ) | $ | � | $ | � | $ | (3 | ) | $ | 8 | $ | � | ||||||||||||||||
| Other sovereign government obligations | 73 | (4 | ) | 56 | (2 | ) | � | � | (4 | ) | 119 | (2 | ) | |||||||||||||||||||||||
| Corporate and other debt: | ||||||||||||||||||||||||||||||||||||
| State and municipal securities | 110 | (1 | ) | � | (96 | ) | � | � | (13 | ) | � | � | ||||||||||||||||||||||||
| Residential mortgage-backed securities | 319 | (61 | ) | 382 | (221 | ) | � | (1 | ) | 76 | 494 | (59 | ) | |||||||||||||||||||||||
| Commercial mortgage-backed securities | 188 | 12 | 75 | (90 | ) | � | � | (51 | ) | 134 | (18 | ) | ||||||||||||||||||||||||
| Asset-backed securities | 13 | 4 | 13 | (19 | ) | � | � | 20 | 31 | 2 | ||||||||||||||||||||||||||
| Corporate bonds | 1,368 | (136 | ) | 467 | (661 | ) | � | � | (363 | ) | 675 | (20 | ) | |||||||||||||||||||||||
| Collateralized debt obligations | 1,659 | 109 | 613 | (1,296 | ) | � | (55 | ) | (50 | ) | 980 | (84 | ) | |||||||||||||||||||||||
| Loans and lending commitments | 11,666 | (251 | ) | 2,932 | (1,241 | ) | � | (2,900 | ) | (616 | ) | 9,590 | (431 | ) | ||||||||||||||||||||||
| Other debt | 193 | 42 | 14 | (76 | ) | � | (11 | ) | (34 | ) | 128 | � | ||||||||||||||||||||||||
| Total corporate and other debt | 15,516 | (282 | ) | 4,496 | (3,700 | ) | � | (2,967 | ) | (1,031 | ) | 12,032 | (610 | ) | ||||||||||||||||||||||
| Corporate equities | 484 | (46 | ) | 416 | (360 | ) | � | � | (77 | ) | 417 | 16 | ||||||||||||||||||||||||
| Net derivative and other contracts(3): | ||||||||||||||||||||||||||||||||||||
| Interest rate contracts | 424 | 628 | 45 | � | (714 | ) | (150 | ) | 187 | 420 | 522 | |||||||||||||||||||||||||
| Credit contracts | 6,594 | 319 | 1,199 | � | (277 | ) | (2,165 | ) | 144 | 5,814 | 1,818 | |||||||||||||||||||||||||
| Foreign exchange contracts | 46 | (35 | ) | 2 | � | � | 28 | 2 | 43 | (13 | ) | |||||||||||||||||||||||||
| Equity contracts | (762 | ) | 592 | 214 | (133 | ) | (1,329 | ) | 136 | 48 | (1,234 | ) | 564 | |||||||||||||||||||||||
| Commodity contracts | 188 | 708 | 52 | � | � | (433 | ) | 55 | 570 | 689 | ||||||||||||||||||||||||||
| Other | (913 | ) | (552 | ) | 1 | � | (118 | ) | 405 | 87 | (1,090 | ) | (536 | ) | ||||||||||||||||||||||
| Total net derivative and other contracts | 5,577 | 1,660 | 1,513 | (133 | ) | (2,438 | ) | (2,179 | ) | 523 | 4,523 | 3,044 | ||||||||||||||||||||||||
| 161 | |
| Beginning Balance at December�31, 2010 | Total�Realized and�Unrealized Gains�(Losses)�(1) | Purchases | Sales | Issuances | Settlements | Net�Transfers | Ending Balance�at December�31, 2011 | Unrealized Gains�(Losses) for�Level�3 Assets/ Liabilities Outstanding� at December�31, 2011(2) | ||||||||||||||||||||||||||||
| (dollars in millions) | ||||||||||||||||||||||||||||||||||||
| Investments: | ||||||||||||||||||||||||||||||||||||
| Private equity funds | 1,986 | 159 | 245 | (513 | ) | � | � | 59 | 1,936 | 85 | ||||||||||||||||||||||||||
| Real estate funds | 1,176 | 21 | 196 | (171 | ) | � | � | (9 | ) | 1,213 | 251 | |||||||||||||||||||||||||
| Hedge funds | 901 | (20 | ) | 169 | (380 | ) | � | � | 26 | 696 | (31 | ) | ||||||||||||||||||||||||
| Principal investments | 3,131 | 288 | 368 | (819 | ) | � | � | (31 | ) | 2,937 | 87 | |||||||||||||||||||||||||
| Other | 560 | 38 | 8 | (34 | ) | � | � | (71 | ) | 501 | 23 | |||||||||||||||||||||||||
| Total investments | 7,754 | 486 | 986 | (1,917 | ) | � | � | (26 | ) | 7,283 | 415 | |||||||||||||||||||||||||
| Physical commodities | � | (47 | ) | 771 | � | � | (673 | ) | (5 | ) | 46 | 1 | ||||||||||||||||||||||||
| Securities received as collateral | 1 | � | � | (1 | ) | � | � | � | � | � | ||||||||||||||||||||||||||
| Intangible assets | 157 | (25 | ) | 6 | (1 | ) | � | (4 | ) | � | 133 | (27 | ) | |||||||||||||||||||||||
| Liabilities | ||||||||||||||||||||||||||||||||||||
| Deposits | $ | 16 | $ | 2 | $ | � | $ | � | $ | � | $ | (14 | ) | $ | � | $ | � | $ | � | |||||||||||||||||
| Commercial paper and other short-term borrowings | 2 | � | � | � | � | � | � | 2 | � | |||||||||||||||||||||||||||
| Financial instruments sold, not yet purchased: | ||||||||||||||||||||||||||||||||||||
| Other sovereign government obligations | � | 1 | � | 9 | � | � | � | 8 | � | |||||||||||||||||||||||||||
| Corporate and other debt: | ||||||||||||||||||||||||||||||||||||
| Residential mortgage-backed securities | � | (8 | ) | � | 347 | � | � | � | 355 | (8 | ) | |||||||||||||||||||||||||
| Corporate bonds | 44 | 37 | (407 | ) | 694 | � | � | (75 | ) | 219 | 51 | |||||||||||||||||||||||||
| Unfunded lending commitments | 263 | 178 | � | � | � | � | � | 85 | 178 | |||||||||||||||||||||||||||
| Other debt | 194 | 123 | (12 | ) | 22 | � | (2 | ) | (6 | ) | 73 | 12 | ||||||||||||||||||||||||
| Total corporate and other debt | 501 | 330 | (419 | ) | 1,063 | � | (2 | ) | (81 | ) | 732 | 233 | ||||||||||||||||||||||||
| Corporate equities | 15 | (1 | ) | (15 | ) | 5 | � | � | (5 | ) | 1 | � | ||||||||||||||||||||||||
| Obligation to return securities received as collateral | 1 | � | (1 | ) | � | � | � | � | � | � | ||||||||||||||||||||||||||
| Securities sold under agreements to repurchase | 351 | 11 | � | � | � | � | � | 340 | 11 | |||||||||||||||||||||||||||
| Other secured financings | 1,016 | 27 | � | � | 154 | (267 | ) | (306 | ) | 570 | 13 | |||||||||||||||||||||||||
| Long-term borrowings | 1,316 | 39 | � | � | 769 | (377 | ) | (66 | ) | 1,603 | 32 | |||||||||||||||||||||||||
| (1) | Total realized and unrealized gains (losses) are primarily included in Principal transactions�Trading in the consolidated statements of income except for $486 million related to Financial instruments owned�Investments, which is included in Principal transactions�Investments. |
| (2) | Amounts represent unrealized gains (losses) for 2011 related to assets and liabilities still outstanding at December�31, 2011. |
| (3) | Net derivative and other contracts represent Financial instruments owned�Derivative and other contracts net of Financial instruments sold, not yet purchased�Derivative and other contracts. For further information on derivative instruments and hedging activities, see Note 12. |
| | 162 |
| Beginning Balance at December�31, 2009 | Total�Realized and�Unrealized Gains�(Losses)(1) | Purchases, Sales,� Other Settlements and Issuances,� net | Net Transfers | Ending Balance�at December�31, 2010 | Unrealized Gains (Losses) for Level 3 Assets/ Liabilities Outstanding�at December�31, 2010(2) | |||||||||||||||||||
| (dollars in millions) | ||||||||||||||||||||||||
| Assets | ||||||||||||||||||||||||
| Financial instruments owned: | ||||||||||||||||||||||||
| U.S. agency securities | $ | 36 | $ | (1 | ) | $ | 13 | $ | (35 | ) | $ | 13 | $ | (1 | ) | |||||||||
| Other sovereign government obligations | 3 | 5 | 66 | (1 | ) | 73 | 5 | |||||||||||||||||
| Corporate and other debt: | ||||||||||||||||||||||||
| State and municipal securities | 713 | (11 | ) | (533 | ) | (59 | ) | 110 | (12 | ) | ||||||||||||||
| Residential mortgage-backed securities | 818 | 12 | (607 | ) | 96 | 319 | (2 | ) | ||||||||||||||||
| Commercial mortgage-backed securities | 1,573 | 35 | (1,054 | ) | (366 | ) | 188 | (61 | ) | |||||||||||||||
| Asset-backed securities | 591 | 10 | (436 | ) | (152 | ) | 13 | 7 | ||||||||||||||||
| Corporate bonds | 1,038 | (84 | ) | 403 | 11 | 1,368 | 41 | |||||||||||||||||
| Collateralized debt obligations | 1,553 | 368 | (259 | ) | (3 | ) | 1,659 | 189 | ||||||||||||||||
| Loans and lending commitments | 12,506 | 203 | (376 | ) | (667 | ) | 11,666 | 214 | ||||||||||||||||
| Other debt | 1,662 | 44 | (92 | ) | (1,421 | ) | 193 | 49 | ||||||||||||||||
| Total corporate and other debt | 20,454 | 577 | (2,954 | ) | (2,561 | ) | 15,516 | 425 | ||||||||||||||||
| Corporate equities | 536 | 118 | (189 | ) | 19 | 484 | 59 | |||||||||||||||||
| Net derivative and other contracts(3): | ||||||||||||||||||||||||
| Interest rate contracts | 387 | 238 | (178 | ) | (23 | ) | 424 | 260 | ||||||||||||||||
| Credit contracts | 8,824 | (1,179 | ) | 128 | (1,179 | ) | 6,594 | 58 | ||||||||||||||||
| Foreign exchange rate contracts | 254 | (77 | ) | 33 | (164 | ) | 46 | (109 | ) | |||||||||||||||
| Equity contracts | (689 | ) | (131 | ) | (146 | ) | 204 | (762 | ) | (143 | ) | |||||||||||||
| Commodity contracts | 7 | 121 | 60 | � | 188 | 268 | ||||||||||||||||||
| Other | (437 | ) | (266 | ) | (220 | ) | 10 | (913 | ) | (284 | ) | |||||||||||||
| Total net derivative and other contracts | 8,346 | (1,294 | ) | (323 | ) | (1,152 | ) | 5,577 | 50 | |||||||||||||||
| 163 | |
| Beginning Balance at December�31, 2009 | Total�Realized and�Unrealized Gains�(Losses)(1) | Purchases, Sales,� Other Settlements and Issuances,� net | Net Transfers | Ending Balance�at December�31, 2010 | Unrealized Gains (Losses) for Level 3 Assets/ Liabilities Outstanding�at December�31, 2010(2) | |||||||||||||||||||
| (dollars in millions) | ||||||||||||||||||||||||
| Investments: | ||||||||||||||||||||||||
| Private equity funds | 1,296 | 496 | 202 | (8 | ) | 1,986 | 462 | |||||||||||||||||
| Real estate funds | 833 | 251 | 89 | 3 | 1,176 | 399 | ||||||||||||||||||
| Hedge funds | 1,708 | (161 | ) | (327 | ) | (319 | ) | 901 | (160 | ) | ||||||||||||||
| Principal investments | 3,195 | 470 | 229 | (763 | ) | 3,131 | 412 | |||||||||||||||||
| Other | 581 | 109 | (129 | ) | (1 | ) | 560 | 49 | ||||||||||||||||
| Total investments | 7,613 | 1,165 | 64 | (1,088 | ) | 7,754 | 1,162 | |||||||||||||||||
| Securities received as collateral | 23 | � | (22 | ) | � | 1 | � | |||||||||||||||||
| Intangible assets | 137 | 43 | (23 | ) | � | 157 | 23 | |||||||||||||||||
| Liabilities | ||||||||||||||||||||||||
| Deposits | $ | 24 | $ | � | $ | � | $ | (8) | $ | 16 | $ | � | ||||||||||||
| Commercial paper and other short-term borrowings | � | � | 2 | � | 2 | � | ||||||||||||||||||
| Financial instruments sold, not yet purchased: | ||||||||||||||||||||||||
| Corporate and other debt: | ||||||||||||||||||||||||
| Asset-backed securities | 4 | � | (4 | ) | � | � | � | |||||||||||||||||
| Corporate bonds | 29 | (15 | ) | 13 | (13 | ) | 44 | (9 | ) | |||||||||||||||
| Collateralized debt obligations | 3 | � | (3 | ) | � | � | � | |||||||||||||||||
| Unfunded lending commitments | 252 | (4 | ) | 7 | � | 263 | (2 | ) | ||||||||||||||||
| Other debt | 431 | 65 | (161 | ) | (11 | ) | 194 | 62 | ||||||||||||||||
| Total corporate and other debt | 719 | 46 | (148 | ) | (24 | ) | 501 | 51 | ||||||||||||||||
| Corporate equities | 4 | 17 | 54 | (26 | ) | 15 | 9 | |||||||||||||||||
| Obligation to return securities received as collateral | 23 | � | (22 | ) | � | 1 | � | |||||||||||||||||
| Securities sold under agreements to repurchase | � | (1 | ) | 350 | � | 351 | (1 | ) | ||||||||||||||||
| Other secured financings | 1,532 | (44 | ) | (612 | ) | 52 | 1,016 | (44 | ) | |||||||||||||||
| Long-term borrowings | 6,865 | 66 | (5,175 | ) | (308 | ) | 1,316 | (84 | ) | |||||||||||||||
| (1) | Total realized and unrealized gains (losses) are primarily included in Principal transactions�Trading in the consolidated statements of income except for $1,165 million related to Financial instruments owned�Investments, which is included in Principal transactions�Investments. |
| (2) | Amounts represent unrealized gains (losses) for 2010 related to assets and liabilities still outstanding at December�31, 2010. |
| (3) | Net derivative and other contracts represent Financial instruments owned�Derivative and other contracts net of Financial instruments sold, not yet purchased�Derivative and other contracts. For further information on derivative instruments and hedging activities, see Note 12. |
| | 164 |
| 165 | |
| Beginning Balance at December�31, 2008 | Total�Realized and Unrealized Gains (Losses)(1) | Purchases, Sales,� Other Settlements and� Issuances, net | Net Transfers | Ending Balance�at December�31, 2009 | Unrealized Gains (Losses) for Level 3 Assets/Liabilities Outstanding�at December�31, 2009(2) | |||||||||||||||||||
| (dollars in millions) | ||||||||||||||||||||||||
| Assets | ||||||||||||||||||||||||
| Financial instruments owned: | ||||||||||||||||||||||||
| U.S. agency securities | $ | 127 | $ | (2 | ) | $ | (56 | ) | $ | (33 | ) | $ | 36 | $ | � | |||||||||
| Other sovereign government obligations | 1 | (3 | ) | 1 | 4 | 3 | � | |||||||||||||||||
| Corporate and other debt: | ||||||||||||||||||||||||
| State and municipal securities | 2,065 | 2 | (413 | ) | (941 | ) | 713 | (26 | ) | |||||||||||||||
| Residential mortgage-backed securities | 1,197 | (79 | ) | (125 | ) | (175 | ) | 818 | (52 | ) | ||||||||||||||
| Commercial mortgage-backed securities | 3,017 | (654 | ) | (314 | ) | (476 | ) | 1,573 | (662 | ) | ||||||||||||||
| Asset-backed securities | 1,013 | 91 | (468 | ) | (45 | ) | 591 | (12 | ) | |||||||||||||||
| Corporate bonds | 2,753 | (184 | ) | (917 | ) | (614 | ) | 1,038 | 33 | |||||||||||||||
| Collateralized debt obligations | 946 | 630 | 30 | (53 | ) | 1,553 | 418 | |||||||||||||||||
| Loans and lending commitments | 20,180 | (1,225 | ) | (5,898 | ) | (551 | ) | 12,506 | (763 | ) | ||||||||||||||
| Other debt | 3,747 | 985 | (2,386 | ) | (684 | ) | 1,662 | 775 | ||||||||||||||||
| Total corporate and other debt | 34,918 | (434 | ) | (10,491 | ) | (3,539 | ) | 20,454 | (289 | ) | ||||||||||||||
| Corporate equities | 976 | 121 | (691 | ) | 130 | 536 | (227 | ) | ||||||||||||||||
| Net derivative and other contracts(3) | 23,382 | (4,316 | ) | (956 | ) | (9,764 | ) | 8,346 | (3,037 | ) | ||||||||||||||
| Investments | 9,698 | (1,418 | ) | 82 | (749 | ) | 7,613 | (1,317 | ) | |||||||||||||||
| Securities received as collateral | 30 | � | (7 | ) | � | 23 | � | |||||||||||||||||
| Intangible assets | 184 | (44 | ) | (3 | ) | � | 137 | (44 | ) | |||||||||||||||
| Liabilities | ||||||||||||||||||||||||
| Deposits | $ | � | $ | (2 | ) | $ | � | $ | 22 | $ | 24 | $ | (2 | ) | ||||||||||
| Financial instruments sold, not yet purchased: | ||||||||||||||||||||||||
| Other sovereign government obligations | � | � | (10 | ) | 10 | � | � | |||||||||||||||||
| Corporate and other debt: | ||||||||||||||||||||||||
| Commercial mortgage-backed securities | 13 | � | (13 | ) | � | � | � | |||||||||||||||||
| Asset-backed securities | 4 | � | � | � | 4 | � | ||||||||||||||||||
| Corporate bonds | 395 | (22 | ) | (291 | ) | (97 | ) | 29 | (30 | ) | ||||||||||||||
| Collateralized debt obligations | � | � | 3 | � | 3 | � | ||||||||||||||||||
| Unfunded lending commitments | 24 | (12 | ) | 216 | � | 252 | (12 | ) | ||||||||||||||||
| Other debt | 3,372 | (13 | ) | (2,291 | ) | (663 | ) | 431 | (196 | ) | ||||||||||||||
| Total corporate and other debt | 3,808 | (47 | ) | (2,376 | ) | (760 | ) | 719 | (238 | ) | ||||||||||||||
| Corporate equities | 27 | (6 | ) | (90 | ) | 61 | 4 | (1 | ) | |||||||||||||||
| Obligation to return securities received as collateral | 30 | � | (7 | ) | � | 23 | � | |||||||||||||||||
| Other secured financings | 6,148 | 396 | (3,757 | ) | (463 | ) | 1,532 | (50 | ) | |||||||||||||||
| Long-term borrowings | 5,473 | (450 | ) | 267 | 675 | 6,865 | (450 | ) | ||||||||||||||||
| | 166 |
| (1) | Total realized and unrealized gains (losses) are primarily included in Principal transactions�Trading in the consolidated statements of income except for $(1,418) million related to Financial instruments owned�Investments, which is included in Principal transactions�Investments. |
| (2) | Amounts represent unrealized gains (losses) for 2009 related to assets and liabilities still outstanding at December�31, 2009. |
| (3) | Net derivative and other contracts represent Financial instruments owned�Derivative and other contracts net of Financial instruments sold, not yet purchased�Derivative and other contracts. For further information on derivative instruments and hedging activities, see Note 12. |
| 167 | |
| At December�31, 2011 | At December�31, 2010 | |||||||||||||||
| Fair Value | Unfunded Commitment | Fair Value | Unfunded Commitment | |||||||||||||
| (dollars in millions) | ||||||||||||||||
| Private equity funds | $ | 1,906 | $ | 938 | $ | 1,947 | $ | 1,047 | ||||||||
| Real estate funds | 1,188 | 448 | 1,154 | 500 | ||||||||||||
| Hedge funds(1): | ||||||||||||||||
| Long-short equity hedge funds | 545 | 5 | 1,046 | 4 | ||||||||||||
| Fixed income/credit-related hedge funds | 124 | � | 305 | � | ||||||||||||
| Event-driven hedge funds | 163 | � | 143 | � | ||||||||||||
| Multi-strategy hedge funds | 335 | � | 140 | � | ||||||||||||
| Total | $ | 4,261 | $ | 1,391 | $ | 4,735 | $ | 1,551 | ||||||||
| (1) | Fixed income/credit-related hedge funds, event-driven hedge funds, and multi-strategy hedge funds are redeemable at least on a six-month period basis primarily with a notice period of 90 days or less. At December�31, 2011, approximately 38% of the fair value amount of long-short equity hedge funds is redeemable at least quarterly, 32% is redeemable every six months and 30% of these funds have a redemption frequency of greater than six months. The notice period for long-short equity hedge funds at December�31, 2011 is primarily greater than six months. At December�31, 2010, approximately 49% of the fair value amount of long-short equity hedge funds is redeemable at least quarterly, 24% is redeemable every six months and 27% of these funds have a redemption frequency of greater than six months. The notice period for long-short equity hedge funds at December�31, 2010 is primarily greater than 90 days. |
| � | Long-short Equity Hedge Funds. Amount includes investments in hedge funds that invest, long or short, in equities. Equity value and growth hedge funds purchase stocks perceived to be undervalued and sell |
| | 168 |
| stocks perceived to be overvalued. Investments representing approximately 9% of the fair value of the investments in this category cannot be redeemed currently because the investments include certain initial period lock-up restrictions. The remaining restriction period for these investments subject to lock-up restrictions ranged from three years or less at December�31, 2011. Investments representing approximately 29% of the fair value of the investments in long-short equity hedge funds cannot be redeemed currently because an exit restriction has been imposed by the hedge fund manager. The restriction period for these investments subject to an exit restriction was primarily two years or less at December�31, 2011. |
| � | Fixed Income/Credit-Related Hedge Funds. Amount includes investments in hedge funds that employ long-short, distressed or relative value strategies in order to benefit from investments in undervalued or overvalued securities that are primarily debt or credit related. At December�31, 2011, investments representing approximately 47% of the fair value of the investments in fixed income/credit-related hedge funds cannot be redeemed currently because the investments include certain initial period lock-up restrictions. The remaining restriction period for these investments subject to lock-up restrictions was one year or less at December�31, 2011. |
| � | Event-Driven Hedge Funds. Amount includes investments in hedge funds that invest in event-driven situations such as mergers, hostile takeovers, reorganizations, or leveraged buyouts. This may involve the simultaneous purchase of stock in companies being acquired and the sale of stock in its acquirer, hoping to profit from the spread between the current market price and the ultimate purchase price of the target company. At December�31, 2011, there were no restrictions on redemptions. |
| � | Multi-strategy Hedge Funds. Amount includes investments in hedge funds that pursue multiple strategies to realize short- and long-term gains. Management of the hedge funds has the ability to overweight or underweight different strategies to best capitalize on current investment opportunities. At December�31, 2011, investments representing approximately 74% of the fair value of the investments in this category cannot be redeemed currently because the investments include certain initial period lock-up restrictions. The remaining restriction period for these investments subject to lock-up restrictions was primarily three years or more at December�31, 2011. |
| 169 | |
| Principal Transactions- Trading | Interest Expense | Gains�(Losses) Included�in Net Revenues | ||||||||||
| (dollars in millions) | ||||||||||||
| Year Ended December�31, 2011 | ||||||||||||
| Deposits | $ | 66 | $ | (117 | ) | $ | (51 | ) | ||||
| Federal funds sold and securities purchased under agreements to resell | 12 | � | 12 | |||||||||
| Commercial paper and other short-term borrowings | 567 | � | 567 | |||||||||
| Securities sold under agreements to repurchase | 3 | (7 | ) | (4 | ) | |||||||
| Long-term borrowings | 4,204 | (1,075 | ) | 3,129 | ||||||||
| Year Ended December�31, 2010 | ||||||||||||
| Deposits | $ | 2 | $ | (173 | ) | $ | (171 | ) | ||||
| Commercial paper and other short-term borrowings | (8 | ) | � | (8 | ) | |||||||
| Securities sold under agreements to repurchase | 9 | (1 | ) | 8 | ||||||||
| Long-term borrowings | (872 | ) | (849 | ) | (1,721 | ) | ||||||
| Year Ended December�31, 2009 | ||||||||||||
| Deposits | $ | (81 | ) | $ | (321 | ) | $ | (402 | ) | |||
| Commercial paper and other short-term borrowings | (176 | ) | � | (176 | ) | |||||||
| Long-term borrowings | (7,660 | ) | (983 | ) | (8,643 | ) | ||||||
| 2011 | 2010 | 2009 | ||||||||||
| (dollars in millions) | ||||||||||||
| Short-term and long-term borrowings(1) | $ | 3,681 | $ | (873 | ) | $ | (5,510 | ) | ||||
| Loans(2) | (585 | ) | 448 | 4,139 | ||||||||
| Unfunded lending commitments(3) | (787 | ) | (148 | ) | (8 | ) | ||||||
| (1) | The change in the fair value of short-term and long-term borrowings (primarily structured notes) includes an adjustment to reflect the change in credit quality of the Company based upon observations of the Company�s secondary bond market spreads. |
| | 170 |
| (2) | Instrument-specific credit gains (losses) were determined by excluding the non-credit components of gains and losses, such as those due to changes in interest rates. |
| (3) | Gains (losses) were generally determined based on the differential between estimated expected client yields and contractual yields at each respective period end. |
| Contractual�Principal�Amount Exceeds Fair Value | ||||||||
| At December 31, 2011 | At December 31, 2010 | |||||||
| (dollars in billions) | ||||||||
| Short-term and long-term borrowings(1) | $ | 2.5 | $ | 0.6 | ||||
| Loans(2) | 27.2 | 24.3 | ||||||
| Loans 90 or more days past due and/or on non-accrual status(2)(3) | 22.1 | 21.2 | ||||||
| (1) | These amounts do not include structured notes where the repayment of the initial principal amount fluctuates based on changes in the reference price or index. |
| (2) | The majority of this difference between principal and fair value amounts emanates from the Company�s distressed debt trading business, which purchases distressed debt at amounts well below par. |
| (3) | The aggregate fair value of loans that were in non-accrual status, which includes all loans 90 or more days past due, was $2.0 billion and $2.2 billion at December�31, 2011 and December�31, 2010, respectively. The aggregate fair value of loans that were 90 or more days past due was $1.5 billion and $2.0 billion at December�31, 2011 and December�31, 2010, respectively. |
| Fair Value Measurements Using: | ||||||||||||||||||||
| Carrying�Value At�December�31, 2011 | Quoted�Prices�in Active�Markets�for Identical�Assets (Level 1) | Significant Observable�Inputs (Level 2) | Significant Unobservable Inputs (Level�3) | Total Gains (Losses)�for 2011(1) | ||||||||||||||||
| (dollars in millions) | ||||||||||||||||||||
| Loans(2) | $ | 70 | $ | � | $ | � | $ | 70 | $ | 5 | ||||||||||
| Other investments(3) | 71 | � | � | 71 | (52 | ) | ||||||||||||||
| Premises, equipment and software costs(3) | 4 | � | � | 4 | (7 | ) | ||||||||||||||
| Intangible assets(4) | � | � | � | � | (7 | ) | ||||||||||||||
| Total | $ | 145 | $ | � | $ | � | $ | 145 | $ | (61 | ) | |||||||||
| (1) | Losses are recorded within Other expenses in the consolidated statement of income except for fair value adjustments related to Loans and losses related to Other investments, which are included in Other revenues. |
| 171 | |
| (2) | Non-recurring changes in fair value for loans held for investment were calculated based upon the fair value of the underlying collateral. The fair value of the collateral was determined using internal expected recovery models. The non-recurring change in fair value for mortgage loans held for sale is based upon a valuation model incorporating market observable inputs. |
| (3) | Losses recorded were determined primarily using discounted cash flow models. |
| (4) | Losses were determined primarily using discounted cash flow models or a valuation technique incorporating an observable market index. |
| Fair Value Measurements Using: | ||||||||||||||||||||
| Carrying Value At�December�31, 2010 | Quoted�Prices�in Active�Markets�for Identical�Assets (Level 1) | Significant Observable�Inputs (Level 2) | Significant Unobservable Inputs (Level�3) | Total Gains (Losses)�for 2010(1) | ||||||||||||||||
| (dollars in millions) | ||||||||||||||||||||
| Loans(2) | $ | 680 | $ | � | $ | 151 | $ | 529 | $ | (12 | ) | |||||||||
| Other investments(3) | 88 | � | � | 88 | (19 | ) | ||||||||||||||
| Goodwill(4) | � | � | � | � | (27 | ) | ||||||||||||||
| Intangible assets(5) | 3 | � | � | 3 | (174 | ) | ||||||||||||||
| Total | $ | 771 | $ | � | $ | 151 | $ | 620 | $ | (232 | ) | |||||||||
| (1) | Losses related to Loans, impairments related to Other investments and losses related to Goodwill and certain Intangibles associated with the disposition of FrontPoint Partners LLC (�FrontPoint�) are included in Other revenues in the consolidated statements of income (see Notes 19 and 24 for further information on FrontPoint). Remaining losses were included in Other expenses in the consolidated statements of income. |
| (2) | Non-recurring changes in fair value for loans held for investment were calculated based upon the fair value of the underlying collateral. The fair value of the collateral was determined using internal expected recovery models. The non-recurring change in fair value for mortgage loans held for sale is based upon a valuation model incorporating market observable inputs. |
| (3) | Losses recorded were determined primarily using discounted cash flow models. |
| (4) | Loss relates to FrontPoint, determined primarily using discounted cash flow models (see Notes 19 and 24 for further information on FrontPoint). |
| (5) | Losses primarily related to investment management contracts, including contracts associated with FrontPoint, and were determined primarily using discounted cash flow models. |
| | 172 |
| Fair Value Measurements Using: | ||||||||||||||||||||
| Carrying Value At�December�31, 2009 | Quoted Prices in Active�Markets�for Identical Assets (Level 1) | Significant Observable�Inputs (Level 2) | Significant Unobservable Inputs (Level�3) | Total Gains (Losses)�for 2009(1) | ||||||||||||||||
| (dollars in millions) | ||||||||||||||||||||
| Loans(2) | $ | 739 | $ | � | $ | � | $ | 739 | $ | (269 | ) | |||||||||
| Other investments(3) | 66 | � | � | 66 | (39 | ) | ||||||||||||||
| Premises, equipment and software costs(3) | 8 | � | � | 8 | (5 | ) | ||||||||||||||
| Intangible assets(3) | 3 | � | � | 3 | (4 | ) | ||||||||||||||
| Total | $ | 816 | $ | � | $ | � | $ | 816 | $ | (317 | ) | |||||||||
| (1) | Losses are recorded within Other expenses in the consolidated statements of income except for fair value adjustments related to Loans and losses related to Other investments, which are included in Other revenues. |
| (2) | Losses for loans held for investment and held for sale were calculated based upon the fair value of the underlying collateral. The fair value of the collateral was determined using internal expected recovery models. |
| (3) | Losses recorded were determined primarily using discounted cash flow models. |
| 173 | |
| At December�31, 2011 | ||||||||||||||||||||
| Amortized Cost | Gross Unrealized Gains | Gross Unrealized Losses | Other-than- Temporary Impairment | Fair�Value | ||||||||||||||||
| (dollars in millions) | ||||||||||||||||||||
| Debt securities available for sale: | ||||||||||||||||||||
| U.S. government and agency securities: | ||||||||||||||||||||
| U.S. Treasury securities | $ | 13,240 | $ | 182 | $ | � | $ | � | $ | 13,422 | ||||||||||
| U.S. agency securities | 16,083 | 54 | 20 | � | 16,117 | |||||||||||||||
| Corporate and other debt(1) | 944 | � | 3 | � | 941 | |||||||||||||||
| Total debt securities available for sale | 30,267 | 236 | 23 | � | 30,480 | |||||||||||||||
| Equity securities available for sale | 15 | � | � | � | 15 | |||||||||||||||
| Total | $ | 30,282 | $ | 236 | $ | 23 | $ | � | $ | 30,495 | ||||||||||
| (1) | Amounts represent FFELP student loan asset-backed securities, which are backed by a guarantee from the U.S. Department of Education. |
| At December�31, 2010 | ||||||||||||||||||||
| Amortized Cost | Gross Unrealized Gains | Gross Unrealized Losses | Other-than- Temporary Impairment | Fair Value | ||||||||||||||||
| (dollars in millions) | ||||||||||||||||||||
| Debt securities available for sale: | ||||||||||||||||||||
| U.S. government and agency securities: | ||||||||||||||||||||
| U.S. Treasury securities | $ | 18,812 | $ | 199 | $ | 34 | $ | � | $ | 18,977 | ||||||||||
| U.S. agency securities | 10,774 | 16 | 118 | � | 10,672 | |||||||||||||||
| Total | $ | 29,586 | $ | 215 | $ | 152 | $ | � | $ | 29,649 | ||||||||||
| Less than 12 Months | 12 Months or Longer | Total | ||||||||||||||||||||||
| At December�31, 2011 | Fair�Value | Gross Unrealized Losses | Fair�Value | Gross Unrealized Losses | Fair�Value | Gross Unrealized Losses | ||||||||||||||||||
| (dollars in millions) | ||||||||||||||||||||||||
| Debt securities available for sale: | ||||||||||||||||||||||||
| U.S. government and agency securities: | ||||||||||||||||||||||||
| U.S. agency securities | $ | 6,250 | $ | 15 | $ | 1,492 | $ | 5 | $ | 7,742 | $ | 20 | ||||||||||||
| Corporate and other debt | 679 | 3 | � | � | 679 | 3 | ||||||||||||||||||
| Total | $ | 6,929 | $ | 18 | $ | 1,492 | $ | 5 | $ | 8,421 | $ | 23 | ||||||||||||
| | 174 |
| Less than 12 Months | 12�Months�or�Longer | Total | ||||||||||||||||||||||
| At December�31, 2010 | Fair�Value | Gross Unrealized Losses | Fair�Value | Gross Unrealized Losses | Fair�Value | Gross Unrealized Losses | ||||||||||||||||||
| (dollars in millions) | ||||||||||||||||||||||||
| Debt securities available for sale: | ||||||||||||||||||||||||
| U.S. government and agency securities: | ||||||||||||||||||||||||
| U.S. Treasury securities | $ | 1,960 | $ | 34 | $ | � | $ | � | $ | 1,960 | $ | 34 | ||||||||||||
| U.S. agency securities | 7,736 | 118 | � | � | 7,736 | 118 | ||||||||||||||||||
| Total | $ | 9,696 | $ | 152 | $ | � | $ | � | $ | 9,696 | $ | 152 | ||||||||||||
| December�31, 2011 | Amortized�Cost | Fair�Value | Annualized Average�Yield | |||||||||
| (dollars in millions) | ||||||||||||
| U.S. government and agency securities: | ||||||||||||
| U.S. Treasury securities: | ||||||||||||
| Due within 1 year | $ | 1,248 | $ | 1,262 | 1.4 | % | ||||||
| After 1 year but through 5 years | 10,636 | 10,782 | 1.0 | % | ||||||||
| After 5 years | 1,356 | 1,378 | 1.4 | % | ||||||||
| Total | 13,240 | 13,422 | ||||||||||
| U.S. agency securities: | ||||||||||||
| After 5 years | 16,083 | 16,117 | 1.1 | % | ||||||||
| Total | 16,083 | 16,117 | ||||||||||
| Total U.S. government and agency securities | 29,323 | 29,539 | 1.1 | % | ||||||||
| Corporate and other debt: | ||||||||||||
| After 5 years | 944 | 941 | 1.1 | % | ||||||||
| Total Corporate and other debt | 944 | 941 | ||||||||||
| Total debt securities available for sale | $ | 30,267 | $ | 30,480 | 1.1 | % | ||||||
| 175 | |
| 2011 | 2010 | |||||||
| (dollars�in�millions) | ||||||||
| Gross realized gains | $ | 145 | $ | 102 | ||||
| Gross realized losses | $ | 2 | $ | � | ||||
| Proceeds of sales of securities available for sale | $ | 17,085 | $ | 670 | ||||
| | 176 |
| At December�31, 2011 | At December� 31, 2010 | |||||||
| (dollars in millions) | ||||||||
| Financial instruments owned: | ||||||||
| U.S. government and agency securities | $ | 9,263 | $ | 11,513 | ||||
| Other sovereign government obligations | 4,047 | 8,741 | ||||||
| Corporate and other debt | 17,024 | 12,333 | ||||||
| Corporate equities | 21,664 | 21,919 | ||||||
| Total | $ | 51,998 | $ | 54,506 | ||||
| 177 | |
| At December�31, 2011 | At December�31, 2010 | |||||||
| (dollars in millions) | ||||||||
| Cash deposited with clearing organizations or segregated under federal and other regulations or requirements | $ | 29,454 | $ | 19,180 | ||||
| Securities(1) | 15,120 | 18,935 | ||||||
| Total | $ | 44,574 | $ | 38,115 | ||||
| (1) | Securities deposited with clearing organizations or segregated under federal and other regulations or requirements are sourced from Federal funds sold and securities purchased under agreements to resell and Financial instruments owned in the consolidated statements of financial condition. |
| � | Interests purchased in connection with market-making and retained interests held as a result of securitization activities, including re-securitization transactions. |
| � | Guarantees issued and residual interests retained in connection with municipal bond securitizations. |
| � | Servicing residential and commercial mortgage loans held by VIEs. |
| � | Loans and investments made to VIEs that hold debt, equity, real estate or other assets. |
| � | Derivatives entered into with VIEs. |
| � | Structuring of credit-linked notes (�CLN�) or other asset-repackaged notes designed to meet the investment objectives of clients. |
| � | Other structured transactions designed to provide tax-efficient yields to the Company or its clients. |
| | 178 |
| 179 | |
| At December�31, 2011 | ||||||||||||||||||||
| Mortgage and Asset-backed Securitizations | Collateralized Debt Obligations | Managed Real�Estate Partnerships | Other Structured Financings | Other | ||||||||||||||||
| (dollars in millions) | ||||||||||||||||||||
| VIE assets | $ | 2,414 | $ | 102 | $ | 2,207 | $ | 918 | $ | 1,937 | ||||||||||
| VIE liabilities | $ | 1,699 | $ | 69 | $ | 102 | $ | 2,576 | $ | 556 | ||||||||||
| At December�31, 2010 | ||||||||||||||||||||
| Mortgage and Asset-Backed Securitizations | Collateralized Debt Obligations | Managed Real Estate Partnerships | Other Structured Financings | Other | ||||||||||||||||
| (dollars in millions) | ||||||||||||||||||||
| VIE assets | $ | 3,362 | $ | 129 | $ | 2,032 | $ | 643 | $ | 2,584 | ||||||||||
| VIE liabilities | $ | 2,544 | $ | 68 | $ | 108 | $ | 2,571 | $ | 1,219 | ||||||||||
| | 180 |
| At December�31, 2011 | ||||||||||||||||||||
| Mortgage and Asset-Backed Securitizations | Collateralized Debt Obligations | Municipal Tender Option Bonds | Other Structured Financings | Other | ||||||||||||||||
| (dollars in millions) | ||||||||||||||||||||
| VIE assets that the Company does not consolidate (unpaid principal balance)(1) | $ | 119,999 | $ | 7,593 | $ | 6,833 | $ | 1,944 | $ | 20,997 | ||||||||||
| Maximum exposure to loss: | ||||||||||||||||||||
| Debt and equity interests(2) | $ | 3,848 | $ | 491 | $ | 201 | $ | 978 | $ | 2,413 | ||||||||||
| Derivative and other contracts | 103 | 843 | 4,141 | � | 1,209 | |||||||||||||||
| Commitments, guarantees and other | 208 | � | � | 804 | 561 | |||||||||||||||
| Total maximum exposure to loss | $ | 4,159 | $ | 1,334 | $ | 4,342 | $ | 1,782 | $ | 4,183 | ||||||||||
| Carrying value of exposure to loss�Assets: | ||||||||||||||||||||
| Debt and equity interests(2) | $ | 3,848 | $ | 491 | $ | 201 | $ | 640 | $ | 2,413 | ||||||||||
| Derivative and other contracts | 101 | 657 | 24 | � | 338 | |||||||||||||||
| Total carrying value of exposure to loss�Assets | $ | 3,949 | $ | 1,148 | $ | 225 | $ | 640 | $ | 2,751 | ||||||||||
| Carrying value of exposure to loss�Liabilities: | ||||||||||||||||||||
| Derivative and other contracts | $ | 13 | $ | 159 | $ | � | $ | � | $ | 114 | ||||||||||
| Commitments, guarantees and other | � | � | � | 14 | 176 | |||||||||||||||
| Total carrying value of exposure to loss�Liabilities | $ | 13 | $ | 159 | $ | � | $ | 14 | $ | 290 | ||||||||||
| (1) | Mortgage and asset-backed securitizations include VIE assets as follows: $9.0 billion of residential mortgages; $81.7 billion of commercial mortgages; $19.3 billion of U.S. agency collateralized mortgage obligations; and $10.0 billion of other consumer or commercial loans. |
| (2) | Mortgage and asset-backed securitizations include VIE debt and equity interests as follows: $0.6 billion of residential mortgages; $1.1 billion of commercial mortgages; $1.6 billion of U.S. agency collateralized mortgage obligations; and $0.5 billion of other consumer or commercial loans. |
| 181 | |
| At December�31, 2010 | ||||||||||||||||||||
| Mortgage and Asset-Backed Securitizations | Collateralized Debt Obligations | Municipal Tender Option Bonds | Other Structured Financings | Other | ||||||||||||||||
| (dollars in millions) | ||||||||||||||||||||
| VIE assets that the Company does not consolidate (unpaid principal balance)(1) | $ | 172,711 | $ | 38,332 | $ | 7,431 | $ | 2,037 | $ | 11,262 | ||||||||||
| Maximum exposure to loss: | ||||||||||||||||||||
| Debt and equity interests(2) | $ | 8,129 | $ | 1,330 | $ | 78 | $ | 1,062 | $ | 2,678 | ||||||||||
| Derivative and other contracts | 113 | 942 | 4,709 | � | 2,079 | |||||||||||||||
| Commitments, guarantees and other | � | � | � | 791 | 446 | |||||||||||||||
| Total maximum exposure to loss | $ | 8,242 | $ | 2,272 | $ | 4,787 | $ | 1,853 | $ | 5,203 | ||||||||||
| Carrying value of exposure to loss�Assets: | ||||||||||||||||||||
| Debt and equity interests(2) | $ | 8,129 | $ | 1,330 | $ | 78 | $ | 779 | $ | 2,678 | ||||||||||
| Derivative and other contracts | 113 | 753 | � | � | 551 | |||||||||||||||
| Total carrying value of exposure to loss�Assets | $ | 8,242 | $ | 2,083 | $ | 78 | $ | 779 | $ | 3,229 | ||||||||||
| Carrying value of exposure to loss�Liabilities: | ||||||||||||||||||||
| Derivative and other contracts | $ | 15 | $ | 123 | $ | � | $ | � | $ | 23 | ||||||||||
| Commitments, guarantees and other | � | � | � | 44 | 261 | |||||||||||||||
| Total carrying value of exposure to loss�Liabilities | $ | 15 | $ | 123 | $ | � | $ | 44 | $ | 284 | ||||||||||
| (1) | Mortgage and asset-backed securitizations include VIE assets as follows: $34.9 billion of residential mortgages; $94.0 billion of commercial mortgages; $28.8 billion of U.S. agency collateralized mortgage obligations; and $15.0 billion of other consumer or commercial loans. |
| (2) | Mortgage and asset-backed securitizations include VIE debt and equity interests as follows: $1.9 billion of residential mortgages; $2.1 billion of commercial mortgages; $3.0 billion of U.S. agency collateralized mortgage obligations; and $1.1 billion of other consumer or commercial loans. |
| | 182 |
| 183 | |
| | 184 |
| At December�31, 2011 | ||||||||||||||||
| Residential Mortgage Loans | Commercial Mortgage Loans | U.S. Agency Collateralized Mortgage Obligations | Credit- Linked Notes and�Other | |||||||||||||
| (dollars in millions) | ||||||||||||||||
| SPE assets (unpaid principal balance)(1) | $ | 41,977 | $ | 85,333 | $ | 33,728 | $ | 14,315 | ||||||||
| Retained interests (fair value): | ||||||||||||||||
| Investment grade | $ | 14 | $ | 22 | $ | 1,151 | $ | 2 | ||||||||
| Non-investment grade | 106 | 44 | � | 1,545 | ||||||||||||
| Total retained interests (fair value) | $ | 120 | $ | 66 | $ | 1,151 | $ | 1,547 | ||||||||
| Interests purchased in the secondary market (fair value): | ||||||||||||||||
| Investment grade | $ | 45 | $ | 164 | $ | 20 | $ | 411 | ||||||||
| Non-investment grade | 149 | 82 | � | 11 | ||||||||||||
| Total interests purchased in the secondary market (fair�value) | $ | 194 | $ | 246 | $ | 20 | $ | 422 | ||||||||
| Derivative assets (fair value) | $ | 18 | $ | 1,200 | $ | � | $ | 223 | ||||||||
| Derivative liabilities (fair value) | $ | 30 | $ | 31 | $ | � | $ | 510 | ||||||||
| (1) | Amounts include assets transferred by unrelated transferors. |
| 185 | |
| At December�31, 2011 | ||||||||||||||||
| Level�1 | Level�2 | Level�3 | Total | |||||||||||||
| (dollars in millions) | ||||||||||||||||
| Retained interests (fair value): | ||||||||||||||||
| Investment grade | $ | � | $ | 1,186 | $ | 3 | $ | 1,189 | ||||||||
| Non-investment grade | � | 74 | 1,621 | 1,695 | ||||||||||||
| Total retained interests (fair value) | $ | � | $ | 1,260 | $ | 1,624 | $ | 2,884 | ||||||||
| Interests purchased in the secondary market (fair value): | ||||||||||||||||
| Investment grade | $ | � | $ | 638 | $ | 2 | $ | 640 | ||||||||
| Non-investment grade | � | 126 | 116 | 242 | ||||||||||||
| Total interests purchased in the secondary market (fair value) | $ | � | $ | 764 | $ | 118 | $ | 882 | ||||||||
| Derivative assets (fair value) | $ | � | $ | 869 | $ | 572 | $ | 1,441 | ||||||||
| Derivative liabilities (fair value) | $ | � | $ | 541 | $ | 30 | $ | 571 | ||||||||
| At December�31, 2010 | ||||||||||||||||
| Residential Mortgage Loans | Commercial Mortgage Loans | U.S. Agency Collateralized Mortgage Obligations | Credit- Linked Notes and�Other | |||||||||||||
| (dollars in millions) | ||||||||||||||||
| SPE assets (unpaid principal balance)(1) | $ | 48,947 | $ | 85,974 | $ | 29,748 | $ | 11,462 | ||||||||
| Retained interests (fair value): | ||||||||||||||||
| Investment grade | $ | 46 | $ | 64 | $ | 2,636 | $ | 8 | ||||||||
| Non-investment grade | 206 | 81 | � | 2,327 | ||||||||||||
| Total retained interests (fair value) | $ | 252 | $ | 145 | $ | 2,636 | $ | 2,335 | ||||||||
| Interests purchased in the secondary market (fair value): | ||||||||||||||||
| Investment grade | $ | 118 | $ | 643 | $ | 155 | $ | 21 | ||||||||
| Non-investment grade | 205 | 55 | � | 11 | ||||||||||||
| Total interests purchased in the secondary market (fair�value) | $ | 323 | $ | 698 | $ | 155 | $ | 32 | ||||||||
| Derivative assets (fair value) | $ | 75 | $ | 955 | $ | � | $ | 78 | ||||||||
| Derivative liabilities (fair value) | $ | 29 | $ | 80 | $ | � | $ | 314 | ||||||||
| (1) | Amounts include assets transferred by unrelated transferors. |
| | 186 |
| At December�31, 2010 | ||||||||||||||||
| Level�1 | Level�2 | Level�3 | Total | |||||||||||||
| (dollars in millions) | ||||||||||||||||
| Retained interests (fair value): | ||||||||||||||||
| Investment grade | $ | � | $ | 2,732 | $ | 22 | $ | 2,754 | ||||||||
| Non-investment grade | � | 241 | 2,373 | 2,614 | ||||||||||||
| Total retained interests (fair value) | $ | � | $ | 2,973 | $ | 2,395 | $ | 5,368 | ||||||||
| Interests purchased in the secondary market (fair value): | ||||||||||||||||
| Investment grade | $ | � | $ | 929 | $ | 8 | $ | 937 | ||||||||
| Non-investment grade | � | 255 | 16 | 271 | ||||||||||||
| Total interests purchased in the secondary market (fair value) | $ | � | $ | 1,184 | $ | 24 | $ | 1,208 | ||||||||
| Derivative assets (fair value) | $ | � | $ | 887 | $ | 221 | $ | 1,108 | ||||||||
| Derivative liabilities (fair value) | $ | � | $ | 360 | $ | 63 | $ | 423 | ||||||||
| 187 | |
| At�December�31,�2011 | At�December�31,�2010 | |||||||||||||||
| Carrying Value of | Carrying Value of | |||||||||||||||
| Assets | Liabilities | Assets | Liabilities | |||||||||||||
| (dollars in millions) | ||||||||||||||||
| Commercial mortgage loans | $ | 121 | $ | 121 | $ | 128 | $ | 124 | ||||||||
| Credit-linked notes | 383 | 339 | 784 | 781 | ||||||||||||
| Equity-linked transactions | 1,243 | 1,214 | 1,618 | 1,583 | ||||||||||||
| Other | 75 | 74 | 62 | 61 | ||||||||||||
| At December�31, 2011 | ||||||||||||||||
| Residential Mortgage Unconsolidated SPEs | Residential Mortgage Consolidated SPEs | Commercial Mortgage Unconsolidated SPEs | Commercial Mortgage Consolidated SPEs | |||||||||||||
| (dollars in millions) | ||||||||||||||||
| Assets serviced (unpaid principal balance) | $ | 9,821 | $ | 2,180 | $ | 5,750 | $ | 1,596 | ||||||||
| Amounts past due 90 days or greater | ||||||||||||||||
| (unpaid principal balance)(1) | $ | 3,087 | $ | 354 | $ | � | $ | � | ||||||||
| Percentage of amounts past due 90 days or greater(1) | 31.4 | % | 16.2 | % | � | � | ||||||||||
| Credit losses | $ | 631 | $ | 81 | $ | � | $ | � | ||||||||
| (1) | Amount includes loans that are at least 90 days contractually delinquent, loans for which the borrower has filed for bankruptcy, loans in foreclosure and real estate owned. |
| | 188 |
| At December�31, 2010 | ||||||||||||||||
| Residential Mortgage Unconsolidated SPEs | Residential Mortgage Consolidated SPEs | Commercial Mortgage Unconsolidated SPEs | Commercial Mortgage Consolidated SPEs | |||||||||||||
| (dollars in millions) | ||||||||||||||||
| Assets serviced (unpaid principal balance) | $ | 10,616 | $ | 2,357 | $ | 7,108 | $ | 2,097 | ||||||||
| Amounts past due 90 days or greater (unpaid principal balance)(1) | $ | 3,861 | $ | 446 | $ | � | $ | � | ||||||||
| Percentage of amounts past due 90 days or greater(1) | 36.4 | % | 18.9 | % | � | � | ||||||||||
| Credit losses | $ | 1,098 | $ | 35 | $ | � | $ | � | ||||||||
| (1) | Amount includes loans that are at least 90 days contractually delinquent, loans for which the borrower has filed for bankruptcy, loans in foreclosure and real estate owned. |
| � | Commercial and Industrial . Commercial and industrial loans include commercial lending, corporate lending and commercial asset-backed lending products. Risk factors considered in determining the allowance for commercial and industrial loans include the borrower�s financial strength, seniority of the loan, collateral type, volatility of collateral value, debt cushion, covenants and (for unsecured loans) counterparty type. |
| � | Consumer . Consumer loans include unsecured loans and non-purpose securities-based lending that allows clients to borrow money against the value of qualifying securities for any suitable purpose other than purchasing, trading, or carrying marketable securities or refinancing margin debt. The allowance methodology for unsecured loans considers the specific attributes of the loan as well as borrower�s source of repayment. The allowance methodology for non-purpose securities-based lending considers the collateral type underlying the loan ( e.g. , diversified securities, concentrated securities, or restricted stock). |
| � | Real Estate�Residential . Residential real estate loans include home equity lines of credit and non-conforming loans. The allowance methodology for nonconforming residential mortgage loans considers several factors, including but not limited to loan-to-value ratio, a FICO score, home price index, and delinquency status. The methodology for home equity loans considers credit limits and utilization rates in addition to the factors considered for nonconforming residential mortgages. |
| � | Real Estate�Wholesale . Wholesale real estate loans include owner-occupied loans and income-producing loans. The principal risk factor for determining the allowance for wholesale real estate loans is the underlying collateral type, which is affected by the time period to liquidate the collateral and the volatility in collateral values. |
| 189 | |
| At December� 31, 2011 | At December� 31, 2010 | |||||||
| (dollars in millions) | ||||||||
| Commercial and industrial | $ | 5,083 | $ | 4,054 | ||||
| Consumer loans | 5,170 | 3,974 | ||||||
| Residential real estate loans | 4,674 | 1,915 | ||||||
| Wholesale real estate loans | 328 | 468 | ||||||
| Total loans held for investment(1) | $ | 15,255 | $ | 10,411 | ||||
| (1) | Amounts are net of allowances of $17 million and $82 million at December�31, 2011 and December�31, 2010, respectively. |
| � | Pass . A credit exposure rated pass has a continued expectation of timely repayment, all obligations of the borrower are current, and the obligor complies with material terms and conditions of the lending agreement. |
| � | Special Mention . Extensions of credit that have potential weakness that deserve management�s close attention and if left uncorrected may, at some future date, result in the deterioration of the repayment prospects for the credit. These potential weaknesses may be due to circumstances such as the borrower experiencing negative operating trends, having an ill-proportioned balance sheet, experiencing problems with management or labor relations, experiencing pending litigation, or there are concerns about the condition or control over collateral. |
| � | Substandard . Obligor has a well-defined weakness that jeopardizes the repayment of the debt and has a high probability of payment default with the distinct possibility that the Company will sustain some loss if noted deficiencies are not corrected. Indicators of a substandard loan include that the obligor is experiencing current or anticipated unprofitable operations, inadequate fixed charge coverage, and inadequate liquidity to support operations or meet obligations when they come due or marginal capitalization. |
| | 190 |
| � | Doubtful . Inherent weakness in the exposure makes the collection or repayment in full, based on existing facts, conditions and circumstances, highly improbable, but the amount of loss is uncertain. The obligor may demonstrate inadequate liquidity, insufficient capital or lack of necessary resources to continue as a going concern or may be in default. |
| � | Loss . Extensions of credit classified as loss are considered uncollectible and are charged off. |
| 191 | |
| Institutional Securities | Global Wealth Management Group | Asset Management | Total | |||||||||||||
| (dollars in millions) | ||||||||||||||||
| Goodwill at December�31, 2009(1) | $ | 373 | $ | 5,618 | $ | 1,171 | $ | 7,162 | ||||||||
| Foreign currency translation adjustments and other | 10 | (2 | ) | � | 8 | |||||||||||
| Goodwill disposed of during the period(2) | � | � | (404 | ) | (404 | ) | ||||||||||
| Impairment losses(3) | � | � | (27 | ) | (27 | ) | ||||||||||
| Goodwill at December�31, 2010(4) | $ | 383 | $ | 5,616 | $ | 740 | $ | 6,739 | ||||||||
| Foreign currency translation adjustments and other | (53 | ) | � | � | (53 | ) | ||||||||||
| Goodwill at December�31, 2011(4) | $ | 330 | $ | 5,616 | $ | 740 | $ | 6,686 | ||||||||
| (1) | The Asset Management business segment amount at December�31, 2009 included approximately $404 million related to Retail Asset Management. |
| (2) | The Asset Management activity represents goodwill disposed of in connection with the sale of Retail Asset Management (see Notes 1 and 25) |
| (3) | The Asset Management activity represents impairment losses related to FrontPoint (see Note 24 for further information on FrontPoint). |
| (4) | The amount of the Company�s goodwill before accumulated impairments of $700 million, which included $673 million related to the Institutional Securities business segment and $27 million related to the Asset Management business segment, was $7,386 million and $7,439 million at December�31, 2011 and December�31, 2010, respectively. |
| | 192 |
| Institutional Securities | Global Wealth Management Group | Asset Management | Total | |||||||||||||
| (dollars in millions) | ||||||||||||||||
| Amortizable net intangible assets at December�31, 2009 | $ | 161 | $ | 4,292 | $ | 184 | $ | 4,637 | ||||||||
| Mortgage servicing rights (see Note 7) | 135 | 2 | � | 137 | ||||||||||||
| Indefinite-lived intangible assets (see Note 3) | � | 280 | � | 280 | ||||||||||||
| Net intangible assets at December�31, 2009 | $ | 296 | $ | 4,574 | $ | 184 | $ | 5,054 | ||||||||
| Amortizable net intangible assets at December�31, 2009 | $ | 161 | $ | 4,292 | $ | 184 | $ | 4,637 | ||||||||
| Foreign currency translation adjustments and other | 6 | 1 | � | 7 | ||||||||||||
| Amortization expense | (23 | ) | (324 | ) | (9 | ) | (356 | ) | ||||||||
| Impairment losses(1) | (4 | ) | (4 | ) | (166 | ) | (174 | ) | ||||||||
| Intangible assets acquired during the year(2) | 122 | � | � | 122 | ||||||||||||
| Intangible assets disposed of during the period | � | (2 | ) | (4 | ) | (6 | ) | |||||||||
| Amortizable net intangible assets at December�31, 2010 | $ | 262 | 3,963 | 5 | 4,230 | |||||||||||
| Mortgage servicing rights (see Note 7) | 151 | 6 | � | 157 | ||||||||||||
| Indefinite-lived intangible assets (see Note 3) | � | 280 | � | 280 | ||||||||||||
| Net intangible assets at December�31, 2010 | $ | 413 | $ | 4,249 | $ | 5 | $ | 4,667 | ||||||||
| Amortizable net intangible assets at December�31, 2010 | $ | 262 | $ | 3,963 | $ | 5 | $ | 4,230 | ||||||||
| Foreign currency translation adjustments and other | (10 | ) | � | � | (10 | ) | ||||||||||
| Amortization expense | (23 | ) | (322 | ) | � | (345 | ) | |||||||||
| Impairment losses(1) | (4 | ) | � | (3 | ) | (7 | ) | |||||||||
| Intangible assets acquired during the period | 5 | � | � | 5 | ||||||||||||
| Intangible assets disposed of during the period | (1 | ) | � | � | (1 | ) | ||||||||||
| Amortizable net intangible assets at December�31, 2011 | 229 | 3,641 | 2 | 3,872 | ||||||||||||
| Mortgage servicing rights (see Note 7) | 122 | 11 | � | 133 | ||||||||||||
| Indefinite-lived intangible assets (see Note 3) | � | 280 | � | 280 | ||||||||||||
| Net intangible assets at December�31, 2011 | $ | 351 | $ | 3,932 | $ | 2 | $ | 4,285 | ||||||||
| (1) | Impairment losses are recorded within Other expenses and Other revenues in the consolidated statements of income. The Asset Management business segment activity represents losses primarily related to investment management contracts that were determined using discounted cash flow models (see Note 19). |
| (2) | The Institutional Securities business segment activity primarily represents certain reinsurance licenses and a management contract. |
| 193 | |
| At December�31, 2011 | At December�31, 2010 | |||||||||||||||
| Gross Carrying Amount | Accumulated Amortization | Gross Carrying Amount | Accumulated Amortization | |||||||||||||
| (dollars in millions) | ||||||||||||||||
| Amortizable intangible assets: | ||||||||||||||||
| Trademarks | $ | 59 | $ | 13 | $ | 63 | $ | 13 | ||||||||
| Customer relationships | 4,063 | 673 | 4,059 | 415 | ||||||||||||
| Management contracts | 313 | 80 | 347 | 75 | ||||||||||||
| Research | 176 | 91 | 176 | 56 | ||||||||||||
| Other | 171 | 53 | 190 | 46 | ||||||||||||
| Total amortizable intangible assets | $ | 4,782 | $ | 910 | $ | 4,835 | $ | 605 | ||||||||
| At December�31, 2011(1) | At December�31, 2010(1) | |||||||
| (dollars in millions) | ||||||||
| Savings and demand deposits(2) | $ | 63,029 | $ | 59,856 | ||||
| Time deposits(3) | 2,633 | 3,956 | ||||||
| Total | $ | 65,662 | $ | 63,812 | ||||
| (1) | Total deposits subject to Federal Deposit Insurance Corporation (the �FDIC�) at December�31, 2011 and December�31, 2010 were $52 billion and $48 billion, respectively. |
| (2) | Amounts include non-interest bearing deposits of $1,270 million and $30 million at December�31, 2011 and December�31, 2010, respectively. |
| (3) | Certain time deposit accounts are carried at fair value under the fair value option (see Note 4). |
| Year | ||||
| 2012(1) | $ | 62,865 | ||
| 2013 | 1,332 | |||
| 2014 | 195 | |||
| 2015 | � | |||
| 2016 | � | |||
| (1) | Amount includes approximately $62 billion of savings deposits, which have no stated maturity and approximately $1 billion of time deposits. |
| | 194 |
| December�31, 2011 | December�31, 2010 | |||||||
| (dollars in millions) | ||||||||
| Commercial Paper(1): | ||||||||
| Balance at period-end | $ | 978 | $ | 945 | ||||
| Average balance(2) | $ | 899 | $ | 866 | ||||
| Weighted average interest rate on period-end balance | 2.7 | % | 2.5 | % | ||||
| Other Short-Term Borrowings(3)(4): | ||||||||
| Balance at period-end | $ | 1,865 | $ | 2,311 | ||||
| Average balance(2) | $ | 2,276 | $ | 2,697 | ||||
| (1) | At December�31, 2011, the majority of the commercial paper balance was issued as part of client transactions and is not used for the Company�s general funding purposes. |
| (2) | Average balances are calculated based upon weekly balances. |
| (3) | These borrowings included bank loans, bank notes and structured notes with original maturities of 12 months or less. |
| (4) | Certain structured short-term borrowings are carried at fair value under the fair value option. See Note 4 for additional information. |
| Parent Company | Subsidiaries | At December� 31, 2011(3)(4)(5) | At December�31, 2010(3) | |||||||||||||||||||||
| Fixed Rate | Variable Rate(1)(2) | Fixed Rate | Variable Rate(1)(2) | |||||||||||||||||||||
| Due in 2011 | $ | � | $ | � | $ | � | $ | � | $ | � | $ | 26,911 | ||||||||||||
| Due in 2012 | 13,556 | 20,255 | 30 | 1,241 | 35,082 | 37,865 | ||||||||||||||||||
| Due in 2013 | 6,105 | 18,359 | 16 | 538 | 25,018 | 25,478 | ||||||||||||||||||
| Due in 2014 | 12,158 | 8,335 | 16 | 975 | 21,484 | 17,703 | ||||||||||||||||||
| Due in 2015 | 13,309 | 4,605 | 16 | 3,958 | 21,888 | 21,026 | ||||||||||||||||||
| Due in 2016 | 9,696 | 7,861 | 80 | 1,390 | 19,027 | 9,096 | ||||||||||||||||||
| Thereafter | 43,324 | 17,198 | 299 | 914 | 61,735 | 54,378 | ||||||||||||||||||
| Total | $ | 98,148 | $ | 76,613 | $ | 457 | $ | 9,016 | $ | 184,234 | $ | 192,457 | ||||||||||||
| Weighted average coupon at period-end(6) | 5.1 | % | 1.6 | % | 6.5 | % | 4.5 | % | 4.0 | % | 3.8 | % | ||||||||||||
| (1) | Floating rate borrowings bear interest based on a variety of money market indices, including LIBOR and Federal Funds rates. |
| (2) | Amounts include borrowings that are equity-linked, credit-linked, commodity-linked or linked to some other index. |
| (3) | Amounts include long-term borrowings issued under the Temporary Liquidity Guarantee Program (�TLGP�). |
| (4) | Amounts include an increase of approximately $6.3 billion at December�31, 2011, to the carrying amount of certain of the Company�s long-term borrowings associated with fair value hedges. The increase to the carrying value associated with fair value hedges by year due was approximately less than $0.1 billion due in 2012, $0.3 billion due in 2013, $0.5 billion due in 2014, $0.8 billion due in 2015, $0.7 billion due in 2016 and $4.0 billion due thereafter. |
| (5) | Amounts include a decrease of approximately $2.5 billion at December�31, 2011 to the carrying amounts of certain of the Company�s long-term borrowings for which the fair value option was elected (see Note 4). |
| (6) | Weighted average coupon was calculated utilizing U.S. and non-U.S. dollar interest rates and excludes financial instruments for which the fair value option was elected. |
| 195 | |
| At December�31, | ||||||||
| 2011 | 2010 | |||||||
| (dollars in millions) | ||||||||
| Senior debt | $ | 175,471 | $ | 183,514 | ||||
| Subordinated debt | 3,910 | 4,126 | ||||||
| Junior subordinated debentures | 4,853 | 4,817 | ||||||
| Total | $ | 184,234 | $ | 192,457 | ||||
| | 196 |
| 2011 | 2010 | 2009 | ||||||||||
| Weighted average coupon of long-term borrowings at period-end(1) | 4.0 | % | 3.6 | % | 3.7 | % | ||||||
| Effective average borrowing rate for long-term borrowings after swaps at period-end(1) | 1.9 | % | 2.4 | % | 2.3 | % | ||||||
| (1) | Included in the weighted average and effective average calculations are non-U.S. dollar interest rates. |
| At December�31, 2011 | At December�31, 2010 | |||||||
| (dollars in millions) | ||||||||
| Secured financings with original maturities greater than one year | $ | 18,696 | $ | 7,398 | ||||
| Secured financings with original maturities one year or less(1) | 275 | 506 | ||||||
| Failed sales(2) | 1,748 | 2,549 | ||||||
| Total(3) | $ | 20,719 | $ | 10,453 | ||||
| (1) | At December�31, 2011, amount included approximately $275 million of variable rate financings. |
| (2) | For more information on failed sales, see Note 7. |
| (3) | Amounts include $14,594 million at fair value at December�31, 2011 and $8,490 million at fair value at December�31, 2010. |
| 197 | |
| Fixed Rate | Variable Rate(1)(2) | At December�31, 2011 | At December�31, 2010 | |||||||||||||
| (dollars in millions) | ||||||||||||||||
| Due in 2011 | $ | � | $ | � | $ | � | $ | 3,207 | ||||||||
| Due in 2012 | 1,106 | 6,755 | 7,861 | 100 | ||||||||||||
| Due in 2013 | 2,000 | 2,849 | 4,849 | 534 | ||||||||||||
| Due in 2014 | � | 1,765 | 1,765 | 14 | ||||||||||||
| Due in 2015 | 29 | 1,065 | 1,094 | 577 | ||||||||||||
| Due in 2016 | � | 384 | 384 | 24 | ||||||||||||
| Thereafter | 1,034 | 1,709 | 2,743 | 2,942 | ||||||||||||
| Total | $ | 4,169 | $ | 14,527 | $ | 18,696 | $ | 7,398 | ||||||||
| Weighted average coupon rate at period-end(3) | 2.0 | % | 1.4 | % | 1.7 | % | 1.7 | % | ||||||||
| (1) | Variable rate borrowings bear interest based on a variety of indices including LIBOR. |
| (2) | Amounts include borrowings that are equity-linked, credit-linked, commodity-linked or linked to some other index. |
| (3) | Weighted average coupon was calculated utilizing U.S. and non-U.S. dollar interest rates and excludes secured financings that are linked to non-interest indices. |
| At December�31, 2011 | At December�31, 2010 | |||||||
| (dollars in millions) | ||||||||
| Due in 2011 | $ | � | $ | 50 | ||||
| Due in 2012 | 784 | 182 | ||||||
| Due in 2013 | 785 | 1,687 | ||||||
| Due in 2014 | 5 | 382 | ||||||
| Due in 2015 | 29 | 23 | ||||||
| Due in 2016 | 127 | 169 | ||||||
| Thereafter | 18 | 56 | ||||||
| Total | $ | 1,748 | $ | 2,549 | ||||
| | 198 |
| At December�31, 2011 | At December�31, 2010 | |||||||||||||||
| Assets | Liabilities | Assets | Liabilities | |||||||||||||
| (dollars in millions) | ||||||||||||||||
| Exchange traded derivative products | $ | 4,103 | $ | 4,969 | $ | 6,099 | $ | 8,553 | ||||||||
| OTC derivative products | 43,961 | 41,484 | 45,193 | 39,249 | ||||||||||||
| Total | $ | 48,064 | $ | 46,453 | $ | 51,292 | $ | 47,802 | ||||||||
| Cross- Maturity and Cash Collateral Netting(3) | Net Exposure Post-Cash Collateral | Net Exposure Post- Collateral | ||||||||||||||||||||||||||
| Years to Maturity | ||||||||||||||||||||||||||||
| Credit Rating(2) | Less�than�1 | 1-3 | 3-5 | Over 5 | ||||||||||||||||||||||||
| (dollars in millions) | ||||||||||||||||||||||||||||
| AAA | $ | 621 | $ | 1,615 | $ | 1,586 | $ | 10,375 | $ | (7,513 | ) | $ | 6,684 | $ | 6,389 | |||||||||||||
| AA | 5,578 | 7,547 | 5,972 | 21,068 | (31,074 | ) | 9,091 | 7,048 | ||||||||||||||||||||
| A | 7,576 | 5,538 | 10,224 | 27,417 | (41,608 | ) | 9,147 | 7,117 | ||||||||||||||||||||
| BBB | 4,437 | 4,448 | 3,231 | 17,758 | (17,932 | ) | 11,942 | 10,337 | ||||||||||||||||||||
| Non-investment grade | 2,819 | 2,949 | 2,703 | 5,084 | (6,458 | ) | 7,097 | 4,158 | ||||||||||||||||||||
| Total | $ | 21,031 | $ | 22,097 | $ | 23,716 | $ | 81,702 | $ | (104,585 | ) | $ | 43,961 | $ | 35,049 | |||||||||||||
| (1) | Fair values shown represent the Company�s net exposure to counterparties related to the Company�s OTC derivative products. Amounts include centrally cleared OTC derivatives. The table does not include listed derivatives and the effect of any related hedges utilized by the Company. |
| (2) | Obligor credit ratings are determined by the Company�s Credit Risk Management Department. |
| (3) | Amounts represent the netting of receivable balances with payable balances for the same counterparty across maturity categories. Receivable and payable balances with the same counterparty in the same maturity category are netted within such maturity category, where appropriate. Cash collateral received is netted on a counterparty basis, provided legal right of offset exists. |
| 199 | |
| Years to Maturity | Cross-Maturity and Cash�Collateral Netting(3) | Net�Exposure Post-Cash Collateral | Net�Exposure Post- Collateral | |||||||||||||||||||||||||
| Credit Rating(2) | Less�than�1 | 1 - 3 | 3 - 5 | Over 5 | ||||||||||||||||||||||||
| (dollars in millions) | ||||||||||||||||||||||||||||
| AAA | $ | 802 | $ | 2,005 | $ | 1,242 | $ | 8,823 | $ | (5,906 | ) | $ | 6,966 | $ | 6,683 | |||||||||||||
| AA | 6,601 | 6,760 | 5,589 | 17,844 | (27,801 | ) | 8,993 | 7,877 | ||||||||||||||||||||
| A | 8,655 | 8,710 | 6,507 | 26,492 | (36,397 | ) | 13,967 | 12,383 | ||||||||||||||||||||
| BBB | 2,982 | 4,109 | 2,124 | 7,347 | (9,034 | ) | 7,528 | 6,001 | ||||||||||||||||||||
| Non-investment grade | 2,628 | 3,231 | 1,779 | 4,456 | (4,355 | ) | 7,739 | 5,348 | ||||||||||||||||||||
| Total | $ | 21,668 | $ | 24,815 | $ | 17,241 | $ | 64,962 | $ | (83,493 | ) | $ | 45,193 | $ | 38,292 | |||||||||||||
| (1) | Fair values shown represent the Company�s net exposure to counterparties related to the Company�s OTC derivative products. Amounts include centrally cleared OTC derivatives. The table does not include listed derivatives and the effect of any related hedges utilized by the Company. |
| (2) | Obligor credit ratings are determined by the Company�s Credit Risk Management Department. |
| (3) | Amounts represent the netting of receivable balances with payable balances for the same counterparty across maturity categories. Receivable and payable balances with the same counterparty in the same maturity category are netted within such maturity category, where appropriate. Cash collateral received is netted on a counterparty basis, provided legal right of offset exists. |
| | 200 |
| Assets at December 31, 2011 | Liabilities�at December 31, 2011 | |||||||||||||||
| Fair�Value | Notional | Fair�Value | Notional | |||||||||||||
| (dollars in millions) | ||||||||||||||||
| Derivatives designated as accounting hedges: | ||||||||||||||||
| Interest rate contracts | $ | 8,151 | $ | 71,706 | $ | � | $ | � | ||||||||
| Foreign exchange contracts | 348 | 12,222 | 57 | 7,111 | ||||||||||||
| Total derivatives designated as accounting hedges | 8,499 | 83,928 | 57 | 7,111 | ||||||||||||
| Derivatives not designated as accounting hedges(1): | ||||||||||||||||
| Interest rate contracts | 904,725 | 21,099,876 | 880,027 | 21,005,733 | ||||||||||||
| Credit contracts | 138,791 | 2,466,623 | 130,726 | 2,428,042 | ||||||||||||
| Foreign exchange contracts | 61,995 | 1,582,364 | 64,691 | 1,604,493 | ||||||||||||
| Equity contracts | 46,287 | 603,290 | 48,286 | 595,146 | ||||||||||||
| Commodity contracts | 39,778 | 411,661 | 39,998 | 374,594 | ||||||||||||
| Other | 598 | 11,662 | 2,275 | 24,905 | ||||||||||||
| Total derivatives not designated as accounting hedges | 1,192,174 | 26,175,476 | 1,166,003 | 26,032,913 | ||||||||||||
| Total derivatives | $ | 1,200,673 | $ | 26,259,404 | $ | 1,166,060 | $ | 26,040,024 | ||||||||
| Cash collateral netting | (77,938 | ) | � | (44,936 | ) | � | ||||||||||
| Counterparty netting | (1,074,671 | ) | � | (1,074,671 | ) | � | ||||||||||
| Total derivatives | $ | 48,064 | $ | 26,259,404 | $ | 46,453 | $ | 26,040,024 | ||||||||
| (1) | Notional amounts include net notionals related to long and short futures contracts of $77 billion and $66 billion, respectively. The variation margin on these futures contracts (excluded from the table above) of $605 million and $37 million is included in Receivables�Brokers, dealers and clearing organizations and Payables�Brokers, dealers and clearing organizations, respectively, on the consolidated statements of financial condition. |
| 201 | |
| Assets at December 31, 2010 | Liabilities�at December 31, 2010 | |||||||||||||||
| Fair�Value | Notional | Fair�Value | Notional | |||||||||||||
| (dollars in millions) | ||||||||||||||||
| Derivatives designated as accounting hedges: | ||||||||||||||||
| Interest rate contracts | $ | 5,250 | $ | 68,212 | $ | 177 | $ | 7,989 | ||||||||
| Foreign exchange contracts | 64 | 5,119 | 420 | 14,408 | ||||||||||||
| Total derivatives designated as accounting hedges | 5,314 | 73,331 | 597 | 22,397 | ||||||||||||
| Derivatives not designated as accounting hedges(1): | ||||||||||||||||
| Interest rate contracts | 615,717 | 16,305,214 | 595,626 | 16,267,730 | ||||||||||||
| Credit contracts | 110,134 | 2,398,676 | 95,626 | 2,239,211 | ||||||||||||
| Foreign exchange contracts | 61,924 | 1,418,488 | 64,268 | 1,431,651 | ||||||||||||
| Equity contracts | 39,846 | 571,767 | 46,160 | 568,399 | ||||||||||||
| Commodity contracts | 64,152 | 420,534 | 65,728 | 414,535 | ||||||||||||
| Other | 243 | 6,635 | 1,568 | 16,910 | ||||||||||||
| Total derivatives not designated as accounting hedges | 892,016 | 21,121,314 | 868,976 | 20,938,436 | ||||||||||||
| Total derivatives | $ | 897,330 | $ | 21,194,645 | $ | 869,573 | $ | 20,960,833 | ||||||||
| Cash collateral netting | (61,856 | ) | � | (37,589 | ) | � | ||||||||||
| Counterparty netting | (784,182 | ) | � | (784,182 | ) | � | ||||||||||
| Total derivatives | $ | 51,292 | $ | 21,194,645 | $ | 47,802 | $ | 20,960,833 | ||||||||
| (1) | Notional amounts include net notionals related to long and short futures contracts of $71 billion and $76 billion, respectively. The variation margin on these futures contracts (excluded from the table above) of $387 million and $1 million is included in Receivables�Brokers, dealers and clearing organizations and Payables�Brokers, dealers and clearing organizations, respectively, on the consolidated statements of financial condition. |
| Gains (Losses) Recognized | ||||||||||||
| Product Type | 2011 | 2010 | 2009 | |||||||||
| (dollars�in�millions) | ||||||||||||
| Derivatives | $ | 3,415 | $ | 1,257 | $ | (2,696 | ) | |||||
| Borrowings | (2,549 | ) | (604 | ) | 3,013 | |||||||
| Total | $ | 866 | $ | 653 | $ | 317 | ||||||
| | 202 |
| Gains (Losses) Recognized in OCI�(effective�portion) | ||||||||||||
| Product Type | 2011 | 2010 | 2009 | |||||||||
| (dollars�in�millions) | ||||||||||||
| Foreign exchange contracts(1) | $ | 180 | $ | (285 | ) | $ | (278 | ) | ||||
| Debt instruments | � | � | (192 | ) | ||||||||
| Total | $ | 180 | $ | (285 | ) | $ | (470 | ) | ||||
| (1) | Losses of $220 million, $147 million and $151 million were recognized in income related to amounts excluded from hedge effectiveness testing during 2011, 2010 and 2009, respectively. |
| Gains (Losses) Recognized in Income(1)(2) | ||||||||||||
| Product Type | 2011 | 2010 | 2009 | |||||||||
| (dollars in millions) | ||||||||||||
| Interest rate contracts | $ | 5,538 | $ | 544 | $ | 3,515 | ||||||
| Credit contracts | 38 | (533 | ) | (2,579 | ) | |||||||
| Foreign exchange contracts | (2,982 | ) | 146 | 469 | ||||||||
| Equity contracts | 3,880 | (2,772 | ) | (9,125 | ) | |||||||
| Commodity contracts | 500 | 597 | 1,748 | |||||||||
| Other contracts | (51 | ) | (160 | ) | 680 | |||||||
| Total derivative instruments | $ | 6,923 | $ | (2,178 | ) | $ | (5,292 | ) | ||||
| (1) | Gains (losses) on derivative contracts not designated as hedges are primarily included in Principal transactions�Trading. |
| (2) | Gains (losses) associated with certain derivative contracts that have physically settled are excluded from the table above. Gains (losses) on these contracts are reflected with the associated cash instruments, which are also included in Principal transactions�Trading. |
| 203 | |
| At December�31, 2011 | ||||||||||||||||
| Maximum Potential Payout/Notional | ||||||||||||||||
| Protection Sold | Protection Purchased | |||||||||||||||
| Notional | Fair�Value (Asset)/Liability | Notional | Fair Value (Asset)/Liability | |||||||||||||
| (dollars in millions) | ||||||||||||||||
| Single name credit default swaps | $ | 1,325,045 | $ | 47,045 | $ | 1,315,333 | $ | (45,345 | ) | |||||||
| Index and basket credit default swaps | 787,228 | 29,475 | 601,452 | (24,373 | ) | |||||||||||
| Tranched index and basket credit default swaps | 320,131 | 17,109 | 545,476 | (31,976 | ) | |||||||||||
| Total | $ | 2,432,404 | $ | 93,629 | $ | 2,462,261 | $ | (101,694 | ) | |||||||
| At December�31, 2010 | ||||||||||||||||
| Maximum Potential Payout/Notional | ||||||||||||||||
| Protection Sold | Protection Purchased | |||||||||||||||
| Notional | Fair�Value (Asset)/Liability | Notional | Fair Value (Asset)/Liability | |||||||||||||
| (dollars in millions) | ||||||||||||||||
| Single name credit default swaps | $ | 1,329,150 | $ | 10,681 | $ | 1,316,610 | $ | (18,481 | ) | |||||||
| Index and basket credit default swaps | 683,593 | 10,380 | 500,781 | (6,764 | ) | |||||||||||
| Tranched index and basket credit default swaps | 281,508 | 4,171 | 526,245 | (14,496 | ) | |||||||||||
| Total | $ | 2,294,251 | $ | 25,232 | $ | 2,343,636 | $ | (39,741 | ) | |||||||
| | 204 |
| Protection Sold | ||||||||||||||||||||||||
| Maximum Potential Payout/Notional | Fair
Value (Asset)/ Liability(1)(2) | |||||||||||||||||||||||
| Years to Maturity | ||||||||||||||||||||||||
| Credit Ratings of the Reference Obligation | Less�than�1 | 1-3 | 3-5 | Over 5 | Total | |||||||||||||||||||
| (dollars in millions) | ||||||||||||||||||||||||
| Single name credit default swaps: | ||||||||||||||||||||||||
| AAA | $ | 1,290 | $ | 5,681 | $ | 24,087 | $ | 12,942 | $ | 44,000 | $ | 1,536 | ||||||||||||
| AA | 12,416 | 22,043 | 23,341 | 10,986 | 68,786 | 1,597 | ||||||||||||||||||
| A | 67,344 | 124,445 | 85,543 | 47,640 | 324,972 | 8,683 | ||||||||||||||||||
| BBB | 131,588 | 218,262 | 115,320 | 64,347 | 529,517 | 4,789 | ||||||||||||||||||
| Non-investment grade | 94,105 | 133,867 | 82,163 | 47,635 | 357,770 | 30,440 | ||||||||||||||||||
| Total | 306,743 | 504,298 | 330,454 | 183,550 | 1,325,045 | 47,045 | ||||||||||||||||||
| Index and basket credit default swaps(3): | ||||||||||||||||||||||||
| AAA | 48,115 | 49,997 | 33,584 | 19,110 | 150,806 | (907 | ) | |||||||||||||||||
| AA | 6,584 | 15,349 | 9,498 | 15,745 | 47,176 | 1,053 | ||||||||||||||||||
| A | 5,202 | 18,996 | 17,396 | 12,286 | 53,880 | 2,470 | ||||||||||||||||||
| BBB | 8,525 | 99,004 | 235,888 | 32,057 | 375,474 | 8,365 | ||||||||||||||||||
| Non-investment grade | 112,451 | 141,042 | 160,537 | 65,993 | 480,023 | 35,603 | ||||||||||||||||||
| Total | 180,877 | 324,388 | 456,903 | 145,191 | 1,107,359 | 46,584 | ||||||||||||||||||
| Total credit default swaps sold | $ | 487,620 | $ | 828,686 | $ | 787,357 | $ | 328,741 | $ | 2,432,404 | $ | 93,629 | ||||||||||||
| Other credit contracts(4)(5) | $ | 65 | $ | 2,356 | $ | 717 | $ | 2,469 | $ | 5,607 | $ | (1,146 | ) | |||||||||||
| Total credit derivatives and other credit contracts | $ | 487,685 | $ | 831,042 | $ | 788,074 | $ | 331,210 | $ | 2,438,011 | $ | 92,483 | ||||||||||||
| (1) | Fair value amounts are shown on a gross basis prior to cash collateral or counterparty netting. |
| (2) | Fair value amounts of certain credit default swaps where the Company sold protection have an asset carrying value because credit spreads of the underlying reference entity or entities tightened during the terms of the contracts. |
| (3) | Credit ratings are calculated internally. |
| (4) | Other credit contracts include CLNs, CDOs and credit default swaps that are considered hybrid instruments. |
| (5) | Fair value amount shown represents the fair value of the hybrid instruments. |
| 205 | |
| Protection Sold | ||||||||||||||||||||||||
| Maximum Potential Payout/Notional | Fair
Value (Asset)/ Liability(1)(2) | |||||||||||||||||||||||
| Years to Maturity | ||||||||||||||||||||||||
| Credit Ratings of the Reference Obligation | Less�than�1 | 1-3 | 3-5 | Over 5 | Total | |||||||||||||||||||
| (dollars in millions) | ||||||||||||||||||||||||
| Single name credit default swaps: | ||||||||||||||||||||||||
| AAA | $ | 2,747 | $ | 7,232 | $ | 13,927 | $ | 22,648 | $ | 46,554 | $ | 3,193 | ||||||||||||
| AA | 13,364 | 44,700 | 35,030 | 33,538 | 126,632 | 4,260 | ||||||||||||||||||
| A | 47,756 | 131,464 | 79,900 | 50,227 | 309,347 | (940 | ) | |||||||||||||||||
| BBB | 74,961 | 191,046 | 115,460 | 76,544 | 458,011 | (2,816 | ) | |||||||||||||||||
| Non-investment grade | 70,691 | 173,778 | 84,605 | 59,532 | 388,606 | 6,984 | ||||||||||||||||||
| Total | 209,519 | 548,220 | 328,922 | 242,489 | 1,329,150 | 10,681 | ||||||||||||||||||
| Index and basket credit default swaps(3): | ||||||||||||||||||||||||
| AAA | 17,437 | 67,165 | 26,172 | 26,966 | 137,740 | (1,569 | ) | |||||||||||||||||
| AA | 974 | 3,012 | 695 | 18,236 | 22,917 | 305 | ||||||||||||||||||
| A | 447 | 9,432 | 44,104 | 4,902 | 58,885 | 2,291 | ||||||||||||||||||
| BBB | 24,311 | 80,314 | 176,252 | 69,218 | 350,095 | (278 | ) | |||||||||||||||||
| Non-investment grade | 53,771 | 139,875 | 95,796 | 106,022 | 395,464 | 13,802 | ||||||||||||||||||
| Total | 96,940 | 299,798 | 343,019 | 225,344 | 965,101 | 14,551 | ||||||||||||||||||
| Total credit default swaps sold | $ | 306,459 | $ | 848,018 | $ | 671,941 | $ | 467,833 | $ | 2,294,251 | $ | 25,232 | ||||||||||||
| Other credit contracts(4)(5) | $ | 61 | $ | 1,416 | $ | 822 | $ | 3,856 | $ | 6,155 | $ | (1,198 | ) | |||||||||||
| Total credit derivatives and other credit contracts | $ | 306,520 | $ | 849,434 | $ | 672,763 | $ | 471,689 | $ | 2,300,406 | $ | 24,034 | ||||||||||||
| (1) | Fair value amounts are shown on a gross basis prior to cash collateral or counterparty netting. |
| (2) | Fair value amounts of certain credit default swaps where the Company sold protection have an asset carrying value because credit spreads of the underlying reference entity or entities tightened during the terms of the contracts. |
| (3) | Credit ratings are calculated internally. |
| (4) | Other credit contracts include CLNs, CDOs and credit default swaps that are considered hybrid instruments. |
| (5) | Fair value amount shown represents the fair value of the hybrid instruments. |
| | 206 |
| 207 | |
| Years to Maturity | ||||||||||||||||||||
| Less than�1 | 1-3 | 3-5 | Over�5 | Total at December�31, 2011 | ||||||||||||||||
| (dollars in millions) | ||||||||||||||||||||
| Letters of credit and other financial guarantees obtained to satisfy collateral requirements | $ | 1,645 | $ | 6 | $ | 6 | $ | � | $ | 1,657 | ||||||||||
| Investment activities | 1,146 | 317 | 68 | 270 | 1,801 | |||||||||||||||
| Primary lending commitments�investment grade(1)(2) | 11,581 | 10,206 | 29,417 | 440 | 51,644 | |||||||||||||||
| Primary lending commitments�non-investment grade(2) | 1,027 | 3,937 | 9,014 | 1,673 | 15,651 | |||||||||||||||
| Secondary lending commitments(3) | 90 | 305 | 23 | 130 | 548 | |||||||||||||||
| Commitments for secured lending transactions | 293 | 295 | 159 | � | 747 | |||||||||||||||
| Forward starting reverse repurchase agreements and securities borrowing agreements(4) | 40,792 | � | � | � | 40,792 | |||||||||||||||
| Commercial and residential mortgage-related commitments | 790 | 22 | 152 | 484 | 1,448 | |||||||||||||||
| Other commitments | 1,013 | 306 | 5 | � | 1,324 | |||||||||||||||
| Total | $ | 58,377 | $ | 15,394 | $ | 38,844 | $ | 2,997 | $ | 115,612 | ||||||||||
| (1) | This amount includes commitments to asset-backed commercial paper conduits of $275 million at December�31, 2011, of which $138�million have maturities of less than one year and $137 million of which have maturities of one to three years. |
| (2) | This amount includes $6.4 billion of investment grade and $1.6 billion of non-investment grade unfunded commitments accounted for as held for investment at December�31, 2011. The remainder of these lending commitments are carried at fair value. |
| (3) | These commitments are recorded at fair value within Financial instruments owned and Financial instruments sold, not yet purchased in the consolidated statements of financial condition (see Note 4). |
| (4) | The Company enters into forward starting reverse repurchase and securities borrowing agreements (agreements that have a trade date at or prior to December�31, 2011 and settle subsequent to period-end) that are primarily secured by collateral from U.S. government agency securities and other sovereign government obligations. These agreements primarily settle within three business days and of the amount at December�31, 2011, $36.4�billion settled within three business days. |
| | 208 |
| Year Ended | Operating Premises Leases | |||
| 2012 | $ | 693 | ||
| 2013 | 649 | |||
| 2014 | 580 | |||
| 2015 | 470 | |||
| 2016 | 406 | |||
| Thereafter | 2,453 | |||
| 209 | |
| Year Ended | Operating Equipment Leases | |||
| 2012 | $ | 210 | ||
| 2013 | 259 | |||
| 2014 | 170 | |||
| 2015 | 104 | |||
| 2016 | 54 | |||
| Thereafter | 162 | |||
| Maximum Potential Payout/Notional | Carrying Amount (Asset)/ Liability | Collateral/ Recourse | ||||||||||||||||||||||||||
| Years to Maturity | ||||||||||||||||||||||||||||
| Type of Guarantee | Less than�1 | 1-3 | 3-5 | Over�5 | Total | |||||||||||||||||||||||
| (dollars in millions) | ||||||||||||||||||||||||||||
| Credit derivative contracts(1) | $ | 487,620 | $ | 828,686 | $ | 787,357 | $ | 328,741 | $ | 2,432,404 | $ | 93,629 | $ | � | ||||||||||||||
| Other credit contracts | 65 | 2,356 | 717 | 2,469 | 5,607 | (1,146 | ) | � | ||||||||||||||||||||
| Non-credit derivative contracts(1) | 1,332,802 | 835,776 | 318,162 | 309,471 | 2,796,211 | 112,936 | � | |||||||||||||||||||||
| Standby letters of credit and other financial guarantees issued(2)(3) | 1,426 | 788 | 1,055 | 5,554 | 8,823 | (30 | ) | 5,749 | ||||||||||||||||||||
| Market value guarantees | � | 53 | 203 | 561 | 817 | 13 | 90 | |||||||||||||||||||||
| Liquidity facilities | 5,021 | 1,232 | 38 | 67 | 6,358 | � | 6,995 | |||||||||||||||||||||
| Whole loan sales representations and warranties | � | � | � | 24,557 | 24,557 | 65 | � | |||||||||||||||||||||
| Securitization representations and warranties | � | � | � | 83,544 | 83,544 | 24 | � | |||||||||||||||||||||
| General partner guarantees | 259 | 40 | 17 | 155 | 471 | 73 | � | |||||||||||||||||||||
| (1) | Carrying amounts of derivative contracts are shown on a gross basis prior to cash collateral or counterparty netting. For further information on derivative contracts, see Note 12. |
| (2) | Approximately $2.4�billion of standby letters of credit are also reflected in the �Commitments� table in primary and secondary lending commitments. Standby letters of credit are recorded at fair value within Financial instruments owned or Financial instruments sold, not yet purchased in the consolidated statements of financial condition. |
| | 210 |
| (3) | Amounts include guarantees issued by consolidated real estate funds sponsored by the Company of approximately $291 million. These guarantees relate to obligations of the fund�s investee entities, including guarantees related to capital expenditures and principal and interest debt payments. Accrued losses under these guarantees of approximately $55 million are reflected as a reduction of the carrying value of the related fund investments, which are reflected in Financial instruments owned�Investments on the consolidated statement of financial condition. |
| 211 | |
| | 212 |
| � | Trust Preferred Securities .����The Company has established�Morgan Stanley Capital Trusts for the limited purpose of issuing�trust preferred securities to third parties and lending the proceeds to the Company in exchange for junior subordinated debentures. The Company has directly guaranteed the repayment of the trust preferred securities to the holders thereof to the extent that the Company has made payments to a Morgan Stanley Capital Trust on the junior subordinated debentures. In the event that the Company does not make payments to a Morgan Stanley Capital Trust, holders of such series of trust preferred securities would not be able to rely upon the guarantee for payment of those amounts. The Company has not recorded any liability in the consolidated financial statements for these guarantees and believes that the occurrence of any events ( i.e ., non-performance on the part of the paying agent) that would trigger payments under these contracts is remote. See Note 15 for details on the Company�s junior subordinated debentures. |
| � | Indemnities .����The Company provides standard indemnities to counterparties for certain contingent exposures and taxes, including U.S. and foreign withholding taxes, on interest and other payments made on derivatives, securities and stock lending transactions, certain annuity products and other financial arrangements. These indemnity payments could be required based on a change in the tax laws or change in interpretation of applicable tax rulings or a change in factual circumstances. Certain contracts contain provisions that enable the Company to terminate the agreement upon the occurrence of such events. The maximum potential amount of future payments that the Company could be required to make under these indemnifications cannot be estimated. |
| � | Exchange/Clearinghouse Member Guarantees .����The Company is a member of various U.S. and non-U.S. exchanges and clearinghouses that trade and clear securities and/or derivative contracts. Associated with its membership, the Company may be required to pay a proportionate share of the financial obligations of another member who may default on its obligations to the exchange or the clearinghouse. While the rules governing different exchange or clearinghouse memberships vary, in general the Company�s guarantee obligations would arise only if the exchange or clearinghouse had previously exhausted its resources. The maximum potential payout under these membership agreements cannot be estimated. The Company has not recorded any contingent liability in the consolidated financial statements for these agreements and believes that any potential requirement to make payments under these agreements is remote. |
| � | Merger and Acquisition Guarantees .����The Company may, from time to time, in its role as investment banking advisor be required to provide guarantees in connection with certain European merger and acquisition transactions. If required by the regulating authorities, the Company provides a guarantee that |
| 213 | |
| the acquirer in the merger and acquisition transaction has or will have sufficient funds to complete the transaction and would then be required to make the acquisition payments in the event the acquirer�s funds are insufficient at the completion date of the transaction. These arrangements generally cover the time frame from the transaction offer date to its closing date and, therefore, are generally short term in nature. The maximum potential amount of future payments that the Company could be required to make cannot be estimated. The Company believes the likelihood of any payment by the Company under these arrangements is remote given the level of the Company�s due diligence associated with its role as investment banking advisor. |
| � | Guarantees on Morgan Stanley Stable Value Program .����On September�30, 2009, the Company entered into an agreement with the investment manager for the Stable Value Program (�SVP�), a fund within the Company�s 401(k) plan, and certain other third parties.�Under the agreement,�the Company�contributed $20 million to the�SVP on�October 15, 2009 and recorded the contribution in Compensation and benefits�expense. Additionally,�the�Company�may have a future obligation to make a�payment of $40 million to the SVP following the third anniversary of the agreement, after which the SVP would be wound down over a period of time.�The future obligation is contingent upon whether the market-to-book value ratio of the portion of the SVP that is subject to certain book-value stabilizing contracts has fallen below a�specific threshold and�the Company and the other parties to the agreement�all decline to make payments to restore the SVP to such threshold as of the third anniversary of the agreement.�The Company has not recorded a liability for this guarantee in the consolidated financial statements. |
| | 214 |
| 215 | |
| | 216 |
| 217 | |
| December�31, 2011 | December�31, 2010 | |||||||||||||||
| Balance | Ratio | Balance | Ratio | |||||||||||||
| (dollars�in�millions) | ||||||||||||||||
| Tier 1 common capital(1)(2) | $ | 41,023 | 13.0 | % | $ | 34,676 | 10.2 | % | ||||||||
| Tier 1 capital(1) | 52,352 | 16.6 | % | 52,880 | 15.5 | % | ||||||||||
| Total capital(1) | 56,194 | 17.8 | % | 54,477 | 16.0 | % | ||||||||||
| RWAs(1) | 315,293 | � | 340,884 | � | ||||||||||||
| Adjusted average assets | 770,815 | � | 802,283 | � | ||||||||||||
| Tier 1 leverage | � | 6.8 | % | � | 6.6 | % | ||||||||||
| (1) | At December�31, 2010, the Company�s RWAs, Total capital ratio, Tier 1 common capital ratio and Tier 1 capital ratio were adjusted to $340,884 million, 16.0%, 10.2% and 15.5%, respectively, from $329,560 million, 16.5%, 10.5% and 16.1%, respectively, based on revised guidance from the Federal Reserve about the Company�s capital treatment for OTC derivative collateral. |
| (2) | On December�30, 2011, the final rule issued by Federal Reserve adopting amendments to Regulation Y became effective. In the final rule, the Federal Reserve formalized regulatory definitions for Tier 1 common capital and the Tier 1 common capital ratio. The Federal Reserve defined Tier 1 common capital as Tier 1 capital less non-common elements in Tier 1 capital, including perpetual preferred stock and related surplus, minority interest in subsidiaries, trust preferred securities and mandatory convertible preferred securities. Previously, the Company�s definition of Tier 1 common capital included all of the items noted in the Federal Reserve�s definition, but it also included an adjustment for the portion of goodwill and non-servicing intangible assets associated with MSSB�s noncontrolling interests (i.e., Citi�s share of MSSB�s goodwill and intangibles). The Company�s conformance to the Federal Reserve�s definition under the final rule reduced the Tier 1 common capital and the Tier 1 common capital ratio by approximately $4.2 billion and 132 basis points, respectively at December�31, 2011. |
| | 218 |
| December�31, 2011 | December�31, 2010 | |||||||||||||||
| Amount | Ratio | Amount | Ratio | |||||||||||||
| (dollars�in�millions) | ||||||||||||||||
| Total capital (to RWAs) : | ||||||||||||||||
| Morgan Stanley Bank, N.A. | $ | 10,222 | 17.8 | % | $ | 9,568 | 18.6 | % | ||||||||
| Morgan Stanley Private Bank, National Association | $ | 1,279 | 31.8 | % | $ | 909 | 37.4 | % | ||||||||
| Tier I capital (to RWAs) : | ||||||||||||||||
| Morgan Stanley Bank, N.A. | $ | 8,703 | 15.1 | % | $ | 8,069 | 15.7 | % | ||||||||
| Morgan Stanley Private Bank, National Association | $ | 1,277 | 31.7 | % | $ | 909 | 37.4 | % | ||||||||
| Leverage ratio : | ||||||||||||||||
| Morgan Stanley Bank, N.A. | $ | 8,703 | 13.2 | % | $ | 8,069 | 12.1 | % | ||||||||
| Morgan Stanley Private Bank, National Association | $ | 1,277 | 10.2 | % | $ | 909 | 12.4 | % | ||||||||
| 219 | |
| 2011 | 2010 | 2009 | ||||||||||
| Shares outstanding at beginning of period | 1,512 | 1,361 | 1,074 | |||||||||
| Public offerings and other issuances of common stock | 385 | 116 | 276 | |||||||||
| Net impact of stock option exercises and other share issuances | 41 | 46 | 13 | |||||||||
| Treasury stock purchases(1) | (11 | ) | (11 | ) | (2 | ) | ||||||
| Shares outstanding at end of period | 1,927 | 1,512 | 1,361 | |||||||||
| (1) | Treasury stock purchases include repurchases of common stock for employee tax withholding. |
| | 220 |
| 221 | |
| | 222 |
| Dividend Rate (Annual) | Shares Outstanding at�December 31, 2011 | Carrying Value | ||||||||||||||||||
| Series | Liquidation Preference per Share | At December�31, 2011 | At December�31, 2010 | |||||||||||||||||
| (dollars in millions) | ||||||||||||||||||||
| A | N/A | 44,000 | $ | 25,000 | $ | 1,100 | $ | 1,100 | ||||||||||||
| B | � | � | � | � | 8,089 | |||||||||||||||
| C | 10.0 | % | 519,882 | 1,000 | 408 | 408 | ||||||||||||||
| Total | $ | 1,508 | $ | 9,597 | ||||||||||||||||
| 223 | |
| At December�31, 2011 | At December�31, 2010 | |||||||
| Foreign currency translation adjustments, net of tax | $ | 5 | $ | 40 | ||||
| Amortization expense related to terminated cash flow hedges, net of tax | (11 | ) | (18 | ) | ||||
| Pension, postretirement and other related adjustments, net of tax | (274 | ) | (525 | ) | ||||
| Net unrealized gain on securities available for sale, net of tax | 123 | 36 | ||||||
| Accumulated other comprehensive loss, net of tax | $ | (157 | ) | $ | (467 | ) | ||
| | 224 |
| At December�31, 2011 | At December�31, 2010 | |||||||
| (dollars in millions) | ||||||||
| Net investments in non-U.S. dollar functional currency subsidiaries designated in hedges | $ | 12,325 | $ | 10,990 | ||||
| Cumulative foreign currency translation adjustments resulting from net investments in subsidiaries with a non-U.S. dollar functional currency | $ | 581 | $ | 544 | ||||
| Cumulative foreign currency translation adjustments resulting from realized or unrealized losses on hedges, net of tax | (576 | ) | (504 | ) | ||||
| Total cumulative foreign currency translation adjustments, net of tax | $ | 5 | $ | 40 | ||||
| Year Ended December�31, | ||||||||
| 2011 | 2010 | |||||||
| (dollars�in�millions) | ||||||||
| Net income applicable to Morgan Stanley | $ | 4,110 | $ | 4,703 | ||||
| Transfers from the noncontrolling interests: | ||||||||
| Increase in paid-in capital in connection with the MUFG transaction (see Note 24) | � | 731 | ||||||
| Net transfers from noncontrolling interests | � | 731 | ||||||
| Change from net income applicable to Morgan Stanley and transfers from noncontrolling interests | $ | 4,110 | $ | 5,434 | ||||
| 225 | |
| 2011 | 2010 | 2009 | ||||||||||
| Basic EPS: | ||||||||||||
| Income from continuing operations | $ | 4,696 | $ | 5,477 | $ | 1,427 | ||||||
| Net gain (loss) from discontinued operations | (51 | ) | 225 | (21 | ) | |||||||
| Net income | 4,645 | 5,702 | 1,406 | |||||||||
| Net income applicable to noncontrolling interests | 535 | 999 | 60 | |||||||||
| Net income applicable to Morgan Stanley | 4,110 | 4,703 | 1,346 | |||||||||
| Less: Preferred dividends (Series A Preferred Stock) | (44 | ) | (45 | ) | (45 | ) | ||||||
| Less: Preferred dividends (Series B Preferred Stock) | (196 | ) | (784 | ) | (784 | ) | ||||||
| Less: MUFG stock conversion | (1,726 | ) | � | � | ||||||||
| Less: Preferred dividends (Series C Preferred Stock) | (52 | ) | (52 | ) | (68 | ) | ||||||
| Less: Partial redemption of Series C Preferred Stock | � | � | (202 | ) | ||||||||
| Less: Preferred dividends (Series D Preferred Stock) | � | � | (212 | ) | ||||||||
| Less: Amortization and acceleration of issuance discount for Series D Preferred Stock(1) | � | � | (932 | ) | ||||||||
| Less: Allocation of earnings to participating RSUs(2): | ||||||||||||
| From continuing operations | (26 | ) | (108 | ) | (10 | ) | ||||||
| From discontinued operations | 1 | (7 | ) | � | ||||||||
| Less: Allocation of undistributed earnings to Equity Units(1): | ||||||||||||
| From continuing operations | � | (102 | ) | � | ||||||||
| From discontinued operations | � | (11 | ) | � | ||||||||
| Earnings (loss) applicable to Morgan Stanley common shareholders | $ | 2,067 | $ | 3,594 | $ | (907 | ) | |||||
| Weighted average common shares outstanding | 1,655 | 1,362 | 1,185 | |||||||||
| Earnings (loss) per basic common share: | ||||||||||||
| Income (loss) from continuing operations | $ | 1.28 | $ | 2.49 | $ | (0.73 | ) | |||||
| Net gain (loss) from discontinued operations | (0.03 | ) | 0.15 | (0.04 | ) | |||||||
| Earnings (loss) per basic common share | $ | 1.25 | $ | 2.64 | $ | (0.77 | ) | |||||
| | 226 |
| 2011 | 2010 | 2009 | ||||||||||
| Diluted EPS: | ||||||||||||
| Earnings (loss) applicable to Morgan Stanley common shareholders | $ | 2,067 | $ | 3,594 | $ | (907 | ) | |||||
| Impact on income of assumed conversions: | ||||||||||||
| Assumed conversion of Equity Units(1)(3) | ||||||||||||
| From continuing operations | � | 76 | � | |||||||||
| From discontinued operations | � | 40 | � | |||||||||
| Earnings (loss) applicable to common shareholders plus assumed conversions | $ | 2,067 | $ | 3,710 | $ | (907 | ) | |||||
| Weighted average common shares outstanding | 1,655 | 1,362 | 1,185 | |||||||||
| Effect of dilutive securities: | ||||||||||||
| Stock options and RSUs(2) | 20 | 5 | � | |||||||||
| Equity Units(1)(3) | � | 44 | � | |||||||||
| Weighted average common shares outstanding and common stock equivalents | 1,675 | 1,411 | 1,185 | |||||||||
| Earnings (loss) per diluted common share: | ||||||||||||
| Income (loss) from continuing operations | $ | 1.26 | $ | 2.45 | $ | (0.73 | ) | |||||
| Net income (loss) from discontinued operations | (0.03 | ) | 0.18 | (0.04 | ) | |||||||
| Earnings (loss) per diluted common share | $ | 1.23 | $ | 2.63 | $ | (0.77 | ) | |||||
| (1) | See Note 15 for further information on Equity Units. |
| (2) | RSUs that are considered participating securities participate in all of the earnings of the Company in the computation of basic EPS, and therefore, such RSUs are not included as incremental shares in the diluted calculation. |
| (3) | Prior to the quarter ended June�30, 2010, the Company included the Equity Units in the diluted EPS calculation using the more dilutive of the two-class method or the treasury stock method.�The Equity Units participated in substantially all of the earnings of the Company (i.e., any earnings above $0.27 per quarter) in basic EPS (assuming a full distribution of earnings of the Company), and therefore, the Equity Units generally would not have been included as incremental shares in the diluted calculation under the treasury stock method.�Beginning in the quarter ended June�30, 2010, and prior to the redemption of the junior subordinated debentures underlying the Equity Units and issuance of common stock in the third quarter of 2010, the Company included the Equity Units in the diluted EPS calculation using the more dilutive of the two-class method or the if-converted method. See Note 2 on the Company�s method for calculating EPS. |
| Number of Antidilutive Securities Outstanding at End of Period: | 2011 | 2010 | 2009 | |||||||||
| (shares in millions) | ||||||||||||
| RSUs and PSUs | 21 | 38 | 62 | |||||||||
| Stock options | 57 | 67 | 82 | |||||||||
| Equity Units(1) | � | � | 116 | |||||||||
| Series B Preferred Stock | � | 311 | 311 | |||||||||
| Total | 78 | 416 | 571 | |||||||||
| (1) | See Notes 2 and 15 for additional information on the Equity Units regarding the change in methodology to the if-converted method and the redemption of the junior subordinated debentures underlying the Equity Units and issuance of common stock. |
| 227 | |
| 2011 | 2010 | 2009 | ||||||||||
| (dollars�in�millions) | ||||||||||||
| Interest income(1): | ||||||||||||
| Financial instruments owned(2) | $ | 3,593 | $ | 3,931 | $ | 4,931 | ||||||
| Securities available for sale | 348 | 215 | � | |||||||||
| Loans | 356 | 315 | 229 | |||||||||
| Interest bearing deposits with banks | 186 | 155 | 241 | |||||||||
| Federal funds sold and securities purchased under agreements to resell and Securities borrowed | 886 | 769 | 859 | |||||||||
| Other | 1,895 | 1,926 | 1,217 | |||||||||
| Total Interest income | $ | 7,264 | $ | 7,311 | $ | 7,477 | ||||||
| Interest expense(1): | ||||||||||||
| Deposits | $ | 236 | $ | 310 | $ | 782 | ||||||
| Commercial paper and other short-term borrowings | 41 | 28 | 51 | |||||||||
| Long-term debt | 4,912 | 4,592 | 4,898 | |||||||||
| Securities sold under agreements to repurchase and Securities loaned | 1,925 | 1,591 | 1,374 | |||||||||
| Other | (207 | ) | (107 | ) | (418 | ) | ||||||
| Total Interest expense | $ | 6,907 | $ | 6,414 | $ | 6,687 | ||||||
| Net interest | $ | 357 | $ | 897 | $ | 790 | ||||||
| (1) | Interest income and expense are recorded within the consolidated statements of income depending on the nature of the instrument and related market conventions. When interest is included as a component of the instrument�s fair value, interest is included within Principal transactions�Trading revenues or Principal transactions�Investments revenues. Otherwise, it is included within Interest income or Interest expense. |
| (2) | Interest expense on Financial instruments sold, not yet purchased is reported as a reduction to Interest income. |
| | 228 |
| 2011 | 2010 | 2009 | ||||||||||
| (dollars in millions) | ||||||||||||
| Gain on China International Capital Corporation Ltd. (see Note 24) | $ | � | $ | 668 | $ | � | ||||||
| Gain on sale of Invesco shares (see Note 1) | � | 102 | � | |||||||||
| FrontPoint impairment charges (see Note 24) | (30 | ) | (126 | ) | � | |||||||
| Gain (loss) on retirement of long-term debt (see Note 11) | 155 | (27 | ) | 491 | ||||||||
| Other(1) | 84 | 654 | 216 | |||||||||
| Total | $ | 209 | $ | 1,271 | $ | 707 | ||||||
| (1) | Other revenues in 2011 and 2010 included pre-tax losses of approximately $783 million and $62 million, respectively, arising from the Company�s 40% stake in Mitsubishi UFJ Morgan Stanley Securities Co., Ltd. (�MUMSS�) (see Note 24). |
| 2011 | 2010 | 2009 | ||||||||||
| (dollars�in�millions) | ||||||||||||
| Deferred stock | $ | 1,057 | $ | 1,075 | $ | 1,120 | ||||||
| Stock options | 24 | 1 | 17 | |||||||||
| Performance-based stock units | 32 | 39 | � | |||||||||
| Employee Stock Purchase Plan(1) | � | � | 4 | |||||||||
| Total(2) | $ | 1,113 | $ | 1,115 | $ | 1,141 | ||||||
| (1) | The Company discontinued the Employee Stock Purchase Plan effective June�1, 2009. |
| (2) | Amounts for 2011, 2010 and 2009 include $186 million, $222 million and $198 million, respectively, primarily related to equity awards that were granted in 2012, 2011 and 2010, respectively, to employees who are retirement-eligible under the award terms. |
| 229 | |
| 2011 | ||||||||
| Number�of Shares | Weighted�Average Grant Date Fair Value | |||||||
| RSUs at beginning of period | 109 | $ | 32.10 | |||||
| Granted | 41 | 28.94 | ||||||
| Conversions to common stock | (33 | ) | 39.58 | |||||
| Canceled | (6 | ) | 29.63 | |||||
| RSUs at end of period(1) | 111 | $ | 28.82 | |||||
| (1) | At December�31, 2011, approximately 104�million RSUs with a weighted average grant date fair value of $28.89 were vested or expected to vest. |
| | 230 |
| 2011 | ||||||||
| Number�of Shares | Weighted�Average Grant�Date�Fair Value | |||||||
| Unvested RSUs at beginning of period | 76 | $ | 30.29 | |||||
| Granted | 41 | 28.94 | ||||||
| Vested | (33 | ) | 33.30 | |||||
| Canceled | (6 | ) | 29.60 | |||||
| Unvested RSUs at end of period(1) | 78 | $ | 28.32 | |||||
| (1) | Unvested RSUs represent awards where recipients have yet to satisfy either the explicit vesting terms or retirement-eligible requirements. At December�31, 2011, approximately 70�million unvested RSUs with a weighted average grant date fair value of $28.37 were expected to vest. |
| Grant Year | Risk-Free�Interest Rate | Expected�Life | Expected�Stock Price Volatility | Expected�Dividend Yield | ||||||||||||
| 2011 | 2.1 | % | 5.0�years | 32.7 | % | 1.5 | % | |||||||||
| 231 | |
| 2011 | ||||||||
| Number�of Options | Weighted Average Exercise�Price | |||||||
| Options outstanding at beginning of period | 67 | $ | 50.35 | |||||
| Granted | 4 | 30.01 | ||||||
| Canceled | (14 | ) | 54.32 | |||||
| Options outstanding at end of period(1) | 57 | 48.15 | ||||||
| Options exercisable at end of period | 53 | 49.33 | ||||||
| (1) | At December�31, 2011, approximately 56�million awards with a weighted average exercise price of $48.46 were vested or expected to vest. |
| At December�31, 2011 | Options Outstanding | Options Exercisable | ||||||||||||||||||||||
| Range�of�Exercise�Prices | Number Outstanding | Weighted�Average Exercise Price | Average Remaining�Life (Years) | Number Exercisable | Weighted�Average Exercise Price | Average Remaining Life�(Years) | ||||||||||||||||||
| $28.00 � $39.99 | 14 | $ | 34.71 | 2.2 | 10 | $ | 36.22 | 1.0 | ||||||||||||||||
| $40.00 � $49.99 | 30 | 47.21 | 1.3 | 30 | 47.21 | 1.3 | ||||||||||||||||||
| $50.00 � $59.99 | 1 | 52.09 | 4.0 | 1 | 52.09 | 4.0 | ||||||||||||||||||
| $60.00 � $76.99 | 12 | 66.75 | 4.9 | 12 | 66.75 | 4.9 | ||||||||||||||||||
| Total | 57 | 53 | ||||||||||||||||||||||
| | 232 |
| Grant Year | Risk-Free�Interest Rate | Expected�Stock Price Volatility | Expected�Dividend Yield | |||||||||
| 2011 | 1.0 | % | 89.0 | % | 1.5 | % | ||||||
| 2010 | 1.5 | % | 89.9 | % | 0.7 | % | ||||||
| 233 | |
| Pensions | Postretirement | |||||||||||||||||||||||
| 2011 | 2010 | 2009 | 2011 | 2010 | 2009 | |||||||||||||||||||
| (dollars�in�millions) | ||||||||||||||||||||||||
| Service cost, benefits earned during the period | $ | 27 | $ | 99 | $ | 116 | $ | 4 | $ | 7 | $ | 12 | ||||||||||||
| Interest cost on projected benefit obligation | 158 | 152 | 152 | 8 | 11 | 12 | ||||||||||||||||||
| Expected return on plan assets | (131 | ) | (128 | ) | (125 | ) | � | � | � | |||||||||||||||
| Net amortization of prior service costs | � | (4 | ) | (9 | ) | (14 | ) | (3 | ) | (1 | ) | |||||||||||||
| Net amortization of actuarial loss | 17 | 24 | 41 | 2 | 1 | 3 | ||||||||||||||||||
| Curtailment gain | � | (50 | ) | � | � | (4 | ) | � | ||||||||||||||||
| Settlement loss | 1 | 3 | � | � | � | � | ||||||||||||||||||
| Net periodic benefit expense | $ | 72 | $ | 96 | $ | 175 | $ | � | $ | 12 | $ | 26 | ||||||||||||
| Pension | Postretirement | |||||||||||||||||||||||
| 2011 | 2010 | 2009 | 2011 | 2010 | 2009 | |||||||||||||||||||
| (dollars�in�millions) | ||||||||||||||||||||||||
| Net loss (gain) | $ | (401 | ) | $ | 34 | $ | 509 | $ | (5 | ) | $ | 2 | $ | (25 | ) | |||||||||
| Prior service cost (credit) | 2 | � | (16 | ) | � | (54 | ) | � | ||||||||||||||||
| Amortization of prior service credit | � | 54 | 9 | 14 | 7 | 1 | ||||||||||||||||||
| Amortization of net loss | (18 | ) | (27 | ) | (41 | ) | (2 | ) | (1 | ) | (3 | ) | ||||||||||||
| Total recognized in other comprehensive loss (income) | $ | (417 | ) | $ | 61 | $ | 461 | $ | 7 | $ | (46 | ) | $ | (27 | ) | |||||||||
| | 234 |
| Pensions | Postretirement | |||||||||||||||||||||||
| 2011 | 2010 | 2009 | 2011 | 2010 | 2009 | |||||||||||||||||||
| Discount rate | 5.44 | % | 5.91 | % | 5.75 | % | 5.41 | % | 6.00/5.35% | 5.78 | % | |||||||||||||
| Expected long-term rate of return on plan assets | 4.78 | 4.78 | 5.21 | N/A | N/A | N/A | ||||||||||||||||||
| Rate of future compensation increases | 2.28 | 5.13 | 5.12 | N/A | N/A | N/A | ||||||||||||||||||
| 235 | |
| Pension | Postretirement | |||||||
| (dollars�in�millions) | ||||||||
| Reconciliation of benefit obligation: | ||||||||
| Benefit obligation at December�31, 2009 | $ | 2,630 | $ | 203 | ||||
| Service cost | 99 | 7 | ||||||
| Interest cost | 152 | 11 | ||||||
| Actuarial loss | 264 | 2 | ||||||
| Plan amendments | (1 | ) | (54 | ) | ||||
| Plan curtailments | (82 | ) | � | |||||
| Plan settlements | (11 | ) | � | |||||
| Benefits paid | (100 | ) | (14 | ) | ||||
| Other, including foreign currency exchange rate changes | 2 | � | ||||||
| Benefit obligation at December�31, 2010 | $ | 2,953 | $ | 155 | ||||
| Service cost | 27 | 4 | ||||||
| Interest cost | 158 | 8 | ||||||
| Actuarial loss (gain) | 490 | (4 | ) | |||||
| Plan amendments | 4 | � | ||||||
| Plan settlements | (16 | ) | � | |||||
| Benefits paid | (98 | ) | (9 | ) | ||||
| Other, including foreign currency exchange rate changes | (1 | ) | � | |||||
| Benefit obligation at December�31, 2011 | $ | 3,517 | $ | 154 | ||||
| Reconciliation of fair value of plan assets: | ||||||||
| Fair value of plan assets at December�31, 2009 | $ | 2,406 | $ | � | ||||
| Actual return on plan assets | 276 | � | ||||||
| Employer contributions | 72 | 14 | ||||||
| Benefits paid | (100 | ) | (14 | ) | ||||
| Plan settlements | (11 | ) | � | |||||
| Other, including foreign currency exchange rates changes | (1 | ) | � | |||||
| Fair value of plan assets at December�31, 2010 | $ | 2,642 | $ | � | ||||
| Actual return on plan assets | 1,024 | � | ||||||
| Employer contributions | 57 | 9 | ||||||
| Benefits paid | (98 | ) | (9 | ) | ||||
| Plan settlements | (16 | ) | � | |||||
| Other, including foreign currency exchange rates changes | (5 | ) | � | |||||
| Fair value of plan assets at December�31, 2011 | $ | 3,604 | $ | � | ||||
| | 236 |
| Pension | Postretirement | |||||||||||||||
| December�31, 2011 | December�31, 2010 | December�31, 2011 | December�31, 2010 | |||||||||||||
| (dollars�in�millions) | ||||||||||||||||
| Funded (unfunded) status | $ | 87 | $ | (311 | ) | $ | (154 | ) | $ | (155 | ) | |||||
| Amounts recognized in the consolidated statements of financial condition consist of: | ||||||||||||||||
| Assets | $ | 495 | $ | 54 | $ | � | $ | � | ||||||||
| Liabilities | (408 | ) | (365 | ) | (154 | ) | (155 | ) | ||||||||
| Net amount recognized | $ | 87 | $ | (311 | ) | $ | (154 | ) | $ | (155 | ) | |||||
| Amounts recognized in accumulated other comprehensive loss consist of: | ||||||||||||||||
| Prior service credit | $ | (5 | ) | $ | (7 | ) | $ | (38 | ) | $ | (52 | ) | ||||
| Net loss | 432 | 851 | 27 | 34 | ||||||||||||
| Net loss (gain) recognized | $ | 427 | $ | 844 | $ | (11 | ) | $ | (18 | ) | ||||||
| December�31, 2011 | December�31, 2010 | |||||||
| (dollars�in�millions) | ||||||||
| Projected benefit obligation | $ | 567 | $ | 498 | ||||
| Fair value of plan assets | 159 | 133 | ||||||
| December�31, 2011 | December�31, 2010 | |||||||
| (dollars�in�millions) | ||||||||
| Accumulated benefit obligation | $ | 450 | $ | 400 | ||||
| Fair value of plan assets | 85 | 72 | ||||||
| 237 | |
| Pension | Postretirement | |||||||||||||||
| December�31, 2011 | December�31, 2010 | December�31, 2011 | December�31, 2010 | |||||||||||||
| Discount rate | 4.57 | % | 5.44 | % | 4.56 | % | 5.41 | % | ||||||||
| Rate of future compensation increase | 2.14 | 2.43 | N/A | N/A | ||||||||||||
| December�31, 2011 | December�31, 2010 | |||||||
| Health care cost trend rate assumed for next year: | ||||||||
| Medical | 6.95-7.68% | 6.98-7.84% | ||||||
| Prescription | 9.08% | 9.53% | ||||||
| Rate to which the cost trend rate is assumed to decline (ultimate trend rate) | 4.50% | 4.50% | ||||||
| Year that the rate reaches the ultimate trend rate | 2029 | 2029 | ||||||
| One-Percentage Point Increase | One-Percentage Point�(Decrease) | |||||||
| (dollars�in�millions) | ||||||||
| Effect on total postretirement service and interest cost | $ | 2 | $ | (2 | ) | |||
| Effect on postretirement benefit obligation | 22 | (17 | ) | |||||
| | 238 |
| � | Derivatives may be used only if they are deemed by the investment manager to be more attractive than a similar direct investment in the underlying cash market or if the vehicle is being used to manage risk of the portfolio. |
| � | Derivatives may not be used in a speculative manner or to leverage the portfolio under any circumstances. |
| � | Derivatives may not be used as short-term trading vehicles. The investment philosophy of the U.S. Qualified Plan is that investment activity is undertaken for long-term investment rather than short-term trading. |
| � | Derivatives may only be used in the management of the U.S. Qualified Plan�s portfolio when their possible effects can be quantified, shown to enhance the risk-return profile of the portfolio, and reported in a meaningful and understandable manner. |
| 239 | |
| Quoted�Prices�in Active�Markets�for Identical Assets (Level 1) | Significant Observable�Inputs (Level�2) | Significant Unobservable Inputs�(Level�3) | Total | |||||||||||||
| (dollars�in�millions) | ||||||||||||||||
| Assets: | ||||||||||||||||
| Investments: | ||||||||||||||||
| Cash and cash equivalents(1) | $ | 11 | $ | � | $ | � | $ | 11 | ||||||||
| U.S. government and agency securities: | ||||||||||||||||
| U.S. Treasury securities | 1,295 | � | � | 1,295 | ||||||||||||
| U.S. agency securities | � | 245 | � | 245 | ||||||||||||
| Total U.S. government and agency securities | 1,295 | 245 | � | 1,540 | ||||||||||||
| Other sovereign government obligations | 16 | 48 | � | 64 | ||||||||||||
| Corporate and other debt: | ||||||||||||||||
| State and municipal securities | � | 2 | � | 2 | ||||||||||||
| Corporate bonds | � | 142 | � | 142 | ||||||||||||
| Collateralized debt obligations | � | 88 | � | 88 | ||||||||||||
| Total corporate and other debt | � | 232 | � | 232 | ||||||||||||
| Corporate equities | 6 | � | � | 6 | ||||||||||||
| Derivative and other contracts(2) | � | 230 | � | 230 | ||||||||||||
| Derivative-related cash collateral | � | 1 | � | 1 | ||||||||||||
| Commingled trust funds(3) | � | 1,339 | � | 1,339 | ||||||||||||
| Foreign funds(4) | � | 273 | � | 273 | ||||||||||||
| Other investments | � | 13 | 26 | 39 | ||||||||||||
| Total investments | 1,328 | 2,381 | 26 | 3,735 | ||||||||||||
| Receivables: | ||||||||||||||||
| Other receivables(1) | � | 14 | � | 14 | ||||||||||||
| Total receivables | � | 14 | � | 14 | ||||||||||||
| Total assets | $ | 1,328 | $ | 2,395 | $ | 26 | $ | 3,749 | ||||||||
| Liabilities: | ||||||||||||||||
| Derivative and other contracts(5) | $ | � | $ | 130 | $ | � | $ | 130 | ||||||||
| Other liabilities(1) | � | 15 | � | 15 | ||||||||||||
| Total liabilities | � | 145 | � | 145 | ||||||||||||
| Net pension assets | $ | 1,328 | $ | 2,250 | $ | 26 | $ | 3,604 | ||||||||
Table of Contents MORGAN STANLEY NOTES TO CONSOLIDATED FINANCIAL STATEMENTS�(Continued) | (1) | Cash and cash equivalents, other receivables and other liabilities are valued at cost, which approximates fair value. |
| (2) | Derivative contracts in an asset position include investments in interest rate swaps of $230 million. |
| (3) | Commingled trust funds include investments in cash funds and fixed income funds of $39 million and $1,300 million, respectively. |
| (4) | Foreign funds include investments in equity funds, bond funds, targeted cash flow funds and diversified funds of $17 million, $124 million, $131 million and $1 million, respectively. |
| (5) | Derivative and other contracts in a liability position include investments in inflation swaps and interest rate swaps of $9 million and $121 million, respectively. |
| Quoted�Prices�in Active�Markets�for Identical Assets (Level 1) | Significant Observable�Inputs (Level 2) | Significant Unobservable Inputs�(Level�3) | Total | |||||||||||||
| (dollars�in�millions) | ||||||||||||||||
| Assets: | ||||||||||||||||
| Investments: | ||||||||||||||||
| Cash and cash equivalents(1) | $ | 10 | $ | � | $ | � | $ | 10 | ||||||||
| U.S. government and agency securities: | ||||||||||||||||
| U.S. Treasury securities | 822 | � | � | 822 | ||||||||||||
| U.S. agency securities | 367 | 28 | � | 395 | ||||||||||||
| Total U.S. government and agency securities | 1,189 | 28 | � | 1,217 | ||||||||||||
| Other sovereign government obligations | 27 | 7 | � | 34 | ||||||||||||
| Corporate and other debt: | ||||||||||||||||
| State and municipal securities | � | 12 | � | 12 | ||||||||||||
| Asset-backed securities | � | 4 | � | 4 | ||||||||||||
| Corporate bonds | � | 392 | � | 392 | ||||||||||||
| Collateralized debt obligations | � | 13 | � | 13 | ||||||||||||
| Total corporate and other debt | � | 421 | � | 421 | ||||||||||||
| Corporate equities | 6 | � | � | 6 | ||||||||||||
| Derivative and other contracts(2) | � | 71 | � | 71 | ||||||||||||
| Derivative-related cash collateral | � | 98 | � | 98 | ||||||||||||
| Commingled trust funds(3) | � | 677 | � | 677 | ||||||||||||
| Foreign funds(4) | � | 206 | � | 206 | ||||||||||||
| Other investments | � | 25 | 23 | 48 | ||||||||||||
| Total investments | 1,232 | 1,533 | 23 | 2,788 | ||||||||||||
| Receivables: | ||||||||||||||||
| Securities purchased under agreements to resell(1) | � | 68 | � | 68 | ||||||||||||
| Other receivables(1) | � | 12 | � | 12 | ||||||||||||
| Total receivables | � | 80 | � | 80 | ||||||||||||
| Total assets | $ | 1,232 | $ | 1,613 | $ | 23 | $ | 2,868 | ||||||||
| Liabilities: | ||||||||||||||||
| Derivative and other contracts(5) | $ | 1 | $ | 156 | $ | � | $ | 157 | ||||||||
| Other liabilities(1) | � | 69 | � | 69 | ||||||||||||
| Total liabilities | 1 | 225 | � | 226 | ||||||||||||
| Net pension assets | $ | 1,231 | $ | 1,388 | $ | 23 | $ | 2,642 | ||||||||
| 241 | |
| (1) | Cash and cash equivalents, securities purchased under agreements to resell, other receivables and other liabilities are valued at cost, which approximates fair value. |
| (2) | Derivative and other contracts in an asset position include investments in interest rate swaps of $71 million. |
| (3) | Commingled trust funds include investments in cash funds and fixed income funds of $58 million and $619 million, respectively. |
| (4) | Foreign funds include investments in equity funds, bond funds and targeted cash flow funds of $19 million, $92 million and $95 million, respectively. |
| (5) | Derivative and other contracts in a liability position include investments in listed derivatives and interest rate swaps of $1 million and $156 million, respectively. |
| Beginning Balance at January�1, 2011 | Actual Return�on Plan�Assets Related to Assets Still Held at December�31, 2011 | Actual Return on�Plan Assets�Related to Assets Sold during 2011 | Purchases, Sales, Other Settlements and Issuances, net | Net�Transfers In�and/or�(Out) of�Level 3 | Ending Balance at�December�31, 2011 | |||||||||||||||||||
| (dollars�in�millions) | ||||||||||||||||||||||||
| Investments | ||||||||||||||||||||||||
| Other investments | $ | 23 | $ | (1 | ) | $ | � | $ | 4 | $ | � | $ | 26 | |||||||||||
| Total investments | $ | 23 | $ | (1 | ) | $ | � | $ | 4 | $ | � | $ | 26 | |||||||||||
| Beginning Balance at January�1, 2010 | Actual Return�on Plan�Assets Related to Assets Still Held at December�31, 2010 | Actual Return on�Plan Assets�Related to Assets Sold during 2010 | Purchases, Sales, Other Settlements and Issuances, net | Net�Transfers In�and/or�(Out) of Level 3 | Ending Balance at�December�31, 2010 | |||||||||||||||||||
| (dollars�in�millions) | ||||||||||||||||||||||||
| Investments | ||||||||||||||||||||||||
| Commingled trust funds | $ | 12 | $ | � | $ | � | $ | (12 | ) | $ | � | $ | � | |||||||||||
| Other investments | 2 | � | � | 21 | � | 23 | ||||||||||||||||||
| Total investments | $ | 14 | $ | � | $ | � | $ | 9 | $ | � | $ | 23 | ||||||||||||
| Pension | Postretirement | |||||||
| (dollars�in�millions) | ||||||||
| 2012 | $ | 127 | $ | 7 | ||||
| 2013 | 127 | 7 | ||||||
| 2014 | 129 | 7 | ||||||
| 2015 | 129 | 8 | ||||||
| 2016 | 131 | 8 | ||||||
| 2017-2021 | 726 | 46 | ||||||
| | 242 |
| 243 | |
| 2011 | 2010 | 2009 | ||||||||||
| (dollars�in�millions) | ||||||||||||
| Current: | ||||||||||||
| U.S. federal | $ | 35 | $ | 212 | $ | 160 | ||||||
| U.S. state and local | 276 | 162 | 45 | |||||||||
| Non-U.S. | 568 | 850 | 340 | |||||||||
| $ | 879 | $ | 1,224 | $ | 545 | |||||||
| Deferred: | ||||||||||||
| U.S. federal | $ | 511 | $ | (854 | ) | $ | (399 | ) | ||||
| U.S. state and local | (49 | ) | 346 | (373 | ) | |||||||
| Non-U.S. | 77 | 38 | (70 | ) | ||||||||
| $ | 539 | $ | (470 | ) | $ | (842 | ) | |||||
| Provision for (benefit from) income taxes from continuing operations | $ | 1,418 | $ | 754 | $ | (297 | ) | |||||
| Provision for (benefit from) income taxes from discontinuing operations | $ | (124 | ) | $ | 352 | $ | (93 | ) | ||||
| 2011 | 2010 | 2009 | ||||||||||
| U.S. federal statutory income tax rate | 35.0 | % | 35.0 | % | 35.0 | % | ||||||
| U.S. state and local income taxes, net of U.S. federal income tax benefits | 2.6 | 6.2 | (18.8 | ) | ||||||||
| Non-U.S. earnings | 0.1 | (19.7 | ) | (23.1 | ) | |||||||
| Domestic tax credits | (3.8 | ) | (3.7 | ) | (17.1 | ) | ||||||
| Tax exempt income | (0.3 | ) | (1.8 | ) | (5.2 | ) | ||||||
| Valuation allowance | (7.3 | ) | � | � | ||||||||
| Other | (3.1 | ) | (3.9 | ) | 3.0 | |||||||
| Effective income tax rate(1) | 23.2 | % | 12.1 | % | (26.2 | )% | ||||||
| (1) | Results for 2011 included discrete tax benefits of $447 million from the remeasurement of a deferred tax asset and the reversal of a related valuation allowance, $137 million related to the reversal of U.S. deferred tax liabilities associated with prior-years� undistributed earnings of certain non-U.S. subsidiaries that were determined to be indefinitely reinvested abroad, and a discrete tax cost of $100 million related to the remeasurement of Japan deferred tax assets as a result of a decrease in the local statutory income tax rates starting in 2012. Excluding the discrete tax benefits noted above, the effective tax rate from continuing operations in 2011 would have been 31.1%. For additional discussion related to the disposition of Revel, see below. Results for 2010 included discrete tax benefits of $382 million related to the reversal of U.S. deferred tax liabilities associated with prior-years� undistributed earnings of certain non-U.S. subsidiaries that were determined to be indefinitely reinvested abroad, $345 million associated with the remeasurement of net unrecognized tax benefits and related interest based on new information regarding the status of federal and state examinations, and $277 million associated with the planned repatriation of non-U.S. earnings at a cost lower than originally estimated. Excluding the discrete tax benefits noted above, the effective tax rate from continuing operations in 2010 would have been 28.1%. Results for 2009 included a discrete tax benefit of $331 million resulting from the cost of anticipated repatriation of non-U.S. earnings at lower than previously estimated tax rates. Excluding this discrete tax benefit, the annual effective tax rate from continuing operations for 2009 would have been 3.1%. |
| | 244 |
| December�31, 2011 | December�31, 2010 | |||||||
| (dollars�in�millions) | ||||||||
| Deferred tax assets: | ||||||||
| Tax credits and loss carryforwards | $ | 6,254 | $ | 6,219 | ||||
| Employee compensation and benefit plans | 2,455 | 2,887 | ||||||
| Valuation and liability allowances | 428 | 331 | ||||||
| Valuation of inventory, investments and receivables | � | 205 | ||||||
| Deferred expenses | 65 | 54 | ||||||
| Other | � | 316 | ||||||
| Total deferred tax assets | 9,202 | 10,012 | ||||||
| Valuation allowance(1) | 60 | 655 | ||||||
| Deferred tax assets after valuation allowance | $ | 9,142 | $ | 9,357 | ||||
| Deferred tax liabilities: | ||||||||
| Non-U.S. operations | $ | 1,343 | $ | 1,349 | ||||
| Fixed assets | 97 | 180 | ||||||
| Prepaid commissions | � | 16 | ||||||
| Valuation of inventory, investments and receivables | 569 | � | ||||||
| Other | 222 | � | ||||||
| Total deferred tax liabilities | $ | 2,231 | $ | 1,545 | ||||
| Net deferred tax assets | $ | 6,911 | $ | 7,812 | ||||
| (1) | The valuation allowance reduces the benefit of certain separate Company federal, state and foreign net operating loss carryforwards and book writedowns to the amount that will more likely than not be realized. |
| 245 | |
| 2011 | 2010 | 2009 | ||||||||||
| (dollars in millions) | ||||||||||||
| U.S. | $ | 3,255 | $ | 3,584 | $ | (1,299 | ) | |||||
| Non-U.S.(1) | 2,859 | 2,647 | 2,429 | |||||||||
| $ | 6,114 | $ | 6,231 | $ | 1,130 | |||||||
| (1) | Non-U.S. income is defined as income generated from operations located outside the U.S. |
| | 246 |
| Unrecognized Tax Benefits | ||||
| Balance at December�31, 2008 | $ | 3,466 | ||
| Increase based on tax positions related to the current period | 688 | |||
| Increase based on tax positions related to prior periods | 33 | |||
| Decreases based on tax positions related to prior periods | (74 | ) | ||
| Decreases related to settlements with taxing authorities | � | |||
| Decreases related to a lapse of applicable statute of limitations | (61 | ) | ||
| Balance at December�31, 2009 | $ | 4,052 | ||
| Increase based on tax positions related to the current period | 478 | |||
| Increase based on tax positions related to prior periods | 479 | |||
| Decreases based on tax positions related to prior periods | (881 | ) | ||
| Decreases related to settlements with taxing authorities | (356 | ) | ||
| Decreases related to a lapse of applicable statute of limitations | (61 | ) | ||
| Balance at December�31, 2010 | $ | 3,711 | ||
| Increase based on tax positions related to the current period | 412 | |||
| Increase based on tax positions related to prior periods | 70 | |||
| Decreases based on tax positions related to prior periods | (79 | ) | ||
| Decreases related to settlements with taxing authorities | (56 | ) | ||
| Decreases related to a lapse of applicable statute of limitations | (13 | ) | ||
| Balance at December�31, 2011 | $ | 4,045 | ||
| 247 | |
| Jurisdiction | Tax�Year | |||
| United States | 1999 | |||
| New York State and City | 2007 | |||
| Hong Kong | 2005 | |||
| Japan | 2007 | |||
| United Kingdom | 2008 | |||
| | 248 |
| 2011 | Institutional Securities | Global�Wealth Management Group | Asset Management | Intersegment Eliminations | Total | |||||||||||||||
| (dollars in millions) | ||||||||||||||||||||
| Total non-interest revenues(1) | $ | 18,293 | $ | 11,940 | $ | 1,928 | $ | (115 | ) | $ | 32,046 | |||||||||
| Net interest | (1,085 | ) | 1,483 | (41 | ) | � | 357 | |||||||||||||
| Net revenues | $ | 17,208 | $ | 13,423 | $ | 1,887 | $ | (115 | ) | $ | 32,403 | |||||||||
| Income from continuing operations before�income taxes | $ | 4,585 | $ | 1,276 | $ | 253 | $ | � | $ | 6,114 | ||||||||||
| Provision for income taxes | 880 | 465 | 73 | � | 1,418 | |||||||||||||||
| Income from continuing operations | 3,705 | 811 | 180 | � | 4,696 | |||||||||||||||
| Discontinued operations(2): | ||||||||||||||||||||
| Gain (loss) from discontinued operations | (199 | ) | � | 24 | � | (175 | ) | |||||||||||||
| Benefit from income taxes | (107 | ) | � | (17 | ) | � | (124 | ) | ||||||||||||
| Net gain (loss) on discontinued operations | (92 | ) | � | 41 | � | (51 | ) | |||||||||||||
| Net income | 3,613 | 811 | 221 | � | 4,645 | |||||||||||||||
| Net income applicable to noncontrolling interests | 244 | 146 | 145 | � | 535 | |||||||||||||||
| Net income applicable to Morgan Stanley | $ | 3,369 | $ | 665 | $ | 76 | $ | � | $ | 4,110 | ||||||||||
| 2010 | Institutional Securities | Global�Wealth Management Group | Asset Management | Discover | Intersegment Eliminations | Total | ||||||||||||||||||
| (dollars in millions) | ||||||||||||||||||||||||
| Total non-interest revenues(1) | $ | 16,402 | $ | 11,514 | $ | 2,761 | $ | � | $ | (187 | ) | $ | 30,490 | |||||||||||
| Net interest | (233 | ) | 1,122 | (76 | ) | � | 84 | 897 | ||||||||||||||||
| Net revenues | $ | 16,169 | $ | 12,636 | $ | 2,685 | $ | � | $ | (103 | ) | $ | 31,387 | |||||||||||
| Income from continuing operations before income taxes | $ | 4,372 | $ | 1,156 | $ | 718 | $ | � | $ | (15 | ) | $ | 6,231 | |||||||||||
| Provision for (benefit from) income taxes | 316 | 336 | 105 | � | (3 | ) | 754 | |||||||||||||||||
| Income from continuing operations | 4,056 | 820 | 613 | � | (12 | ) | 5,477 | |||||||||||||||||
| Discontinued operations(2): | ||||||||||||||||||||||||
| Gain (loss) from discontinued operations | (1,210 | ) | � | 999 | 775 | 13 | 577 | |||||||||||||||||
| Provision for income taxes | 10 | � | 335 | � | 7 | 352 | ||||||||||||||||||
| Net gain (loss) on discontinued operations(3) | (1,220 | ) | � | 664 | 775 | 6 | 225 | |||||||||||||||||
| Net income | 2,836 | 820 | 1,277 | 775 | (6 | ) | 5,702 | |||||||||||||||||
| Net income applicable to noncontrolling interests | 290 | 301 | 408 | � | � | 999 | ||||||||||||||||||
| Net income (loss) applicable to Morgan Stanley | $ | 2,546 | $ | 519 | $ | 869 | $ | 775 | $ | (6 | ) | $ | 4,703 | |||||||||||
| 249 | |
| 2009 | Institutional Securities | Global�Wealth Management Group | Asset Management | Intersegment Eliminations | Total | |||||||||||||||
| (dollars in millions) | ||||||||||||||||||||
| Total non-interest revenues | $ | 12,848 | $ | 8,729 | $ | 1,377 | $ | (464 | ) | $ | 22,490 | |||||||||
| Net interest | (106 | ) | 661 | (83 | ) | 318 | 790 | |||||||||||||
| Net revenues | $ | 12,742 | $ | 9,390 | $ | 1,294 | $ | (146 | ) | $ | 23,280 | |||||||||
| Income (loss) from continuing operations before�income taxes | $ | 1,239 | $ | 559 | $ | (657 | ) | $ | (11 | ) | $ | 1,130 | ||||||||
| Provision for (benefit from) income taxes | (256 | ) | 178 | (216 | ) | (3 | ) | (297 | ) | |||||||||||
| Income (loss) from continuing operations | 1,495 | 381 | (441 | ) | (8 | ) | 1,427 | |||||||||||||
| Discontinued operations(2): | ||||||||||||||||||||
| Gain (loss) from discontinued operations | 246 | � | (373 | ) | 13 | (114 | ) | |||||||||||||
| Provision for (benefit from) income taxes | 185 | � | (277 | ) | (1 | ) | (93 | ) | ||||||||||||
| Net gain (loss) from discontinued operations(3) | 61 | � | (96 | ) | 14 | (21 | ) | |||||||||||||
| Net income (loss) | 1,556 | 381 | (537 | ) | 6 | 1,406 | ||||||||||||||
| Net income applicable to noncontrolling interests | 12 | 98 | (50 | ) | � | 60 | ||||||||||||||
| Net income (loss) applicable to Morgan Stanley | $ | 1,544 | $ | 283 | $ | (487 | ) | $ | 6 | $ | 1,346 | |||||||||
| (1) | In the fourth quarter of 2011 and 2010, the Company recognized a pre-tax loss of approximately $108 million and a pre-tax gain of approximately $176 million, respectively, in net revenues upon application of the OIS curve within the Institutional Securities business segment (see Note 4). |
| (2) | See Notes 1 and 25 for discussion of discontinued operations. |
| (3) | Amounts for 2010 included a loss of $1.2 billion related to the disposition of Revel included within the Institutional Securities business segment, a gain of approximately $570 million related to the Company�s sale of Retail Asset Management within the Asset Management business segment and a gain of $775 million related to the legal settlement with DFS. Amounts for 2009 included net gains of $499 million related to MSCI secondary offerings within the Institutional Securities business segment. |
| Net Interest | Institutional Securities | Global�Wealth Management Group | Asset Management | Intersegment Eliminations | Total | |||||||||||||||
| (dollars in millions) | ||||||||||||||||||||
| 2011 | ||||||||||||||||||||
| Interest income | $ | 5,740 | $ | 1,869 | $ | 10 | $ | (355 | ) | $ | 7,264 | |||||||||
| Interest expense | 6,825 | 386 | 51 | (355 | ) | 6,907 | ||||||||||||||
| Net interest | $ | (1,085 | ) | $ | 1,483 | $ | (41 | ) | $ | � | $ | 357 | ||||||||
| 2010 | ||||||||||||||||||||
| Interest income | $ | 5,910 | $ | 1,587 | $ | 22 | $ | (208 | ) | $ | 7,311 | |||||||||
| Interest expense | 6,143 | 465 | 98 | (292 | ) | 6,414 | ||||||||||||||
| Net interest | $ | (233 | ) | $ | 1,122 | $ | (76 | ) | $ | 84 | $ | 897 | ||||||||
| 2009 | ||||||||||||||||||||
| Interest income | $ | 6,373 | $ | 1,114 | $ | 17 | $ | (27 | ) | $ | 7,477 | |||||||||
| Interest expense | 6,479 | 453 | 100 | (345 | ) | 6,687 | ||||||||||||||
| Net interest | $ | (106 | ) | $ | 661 | $ | (83 | ) | $ | 318 | $ | 790 | ||||||||
| | 250 |
| Total Assets(1) | Institutional Securities | Global�Wealth Management Group | Asset Management | Total | ||||||||||||
| (dollars in millions) | ||||||||||||||||
| At December�31, 2011 | $ | 641,456 | $ | 101,427 | $ | 7,015 | $ | 749,898 | ||||||||
| At December�31, 2010 | $ | 698,453 | $ | 101,058 | $ | 8,187 | $ | 807,698 | ||||||||
| (1) | Corporate assets have been fully allocated to the Company�s business segments. |
| � | Institutional Securities: advisory and equity underwriting�client location, debt underwriting�revenue recording location, sales�and trading�trading desk location. |
| � | Global Wealth Management Group: global representative coverage location. |
| � | Asset Management: client location, except for Merchant Banking and Real Estate Investing businesses, which are based on asset location. |
| Net Revenues | 2011 | 2010 | 2009(1) | |||||||||
| (dollars�in�millions) | ||||||||||||
| Americas | $ | 22,331 | $ | 21,477 | $ | 18,798 | ||||||
| Europe, Middle East, and Africa | 6,761 | 5,590 | 2,486 | |||||||||
| Asia | 3,311 | 4,320 | 1,996 | |||||||||
| Net revenues | $ | 32,403 | $ | 31,387 | $ | 23,280 | ||||||
| (1) | Certain reclassifications have been made to prior-period amounts to conform to the current year�s presentation. |
| Total Assets | At�December�31, 2011 | At�December�31, 2010 | ||||||
| (dollars�in�millions) | ||||||||
| Americas | $ | 558,765 | $ | 582,928 | ||||
| Europe, Middle East, and Africa | 134,190 | 153,656 | ||||||
| Asia | 56,943 | 71,114 | ||||||
| Total | $ | 749,898 | $ | 807,698 | ||||
| 251 | |
| Book Value(1) | ||||||||||||
| Percent Ownership | December�31, 2011 | December�31, 2010 | ||||||||||
| (dollars in millions) | ||||||||||||
| Mitsubishi UFJ Morgan Stanley Securities Co., Ltd. | 40 | % | $ | 1,444 | $ | 1,794 | ||||||
| Lansdowne Partners(2) | 19.8 | % | 276 | 284 | ||||||||
| Avenue Capital Group(2)(3) | � | 237 | 275 | |||||||||
| (1) | Book value of these investees exceeds the Company�s share of net assets, reflecting intangible assets and equity method goodwill. |
| (2) | The Company�s ownership interest represents limited partnership interests. The Company is deemed to have significant influence in these limited partnerships, as the Company�s limited partnership interests were above the 3% to 5% threshold for interests that should be accounted for under the equity method. |
| (3) | The Company�s ownership interest represents limited partnerships interests in a number of different entities within the Avenue Capital Group. |
| | 252 |
| At December�31, | ||||||||
| 2011 | 2010 | |||||||
| (dollars in millions) | ||||||||
| Total assets | $ | 158,363 | $ | 217,585 | ||||
| Total liabilities | 155,555 | 213,735 | ||||||
| Noncontrolling interests | 22 | 131 | ||||||
| At December 31, | ||||||||||||
| 2011 | 2010 | 2009(1) | ||||||||||
| (dollars in millions) | ||||||||||||
| Net revenues | $ | 735 | $ | 1,073 | N/A | |||||||
| Loss from continuing operations before income taxes | (1,746 | ) | (253 | ) | N/A | |||||||
| Net loss | (1,976 | ) | (156 | ) | N/A | |||||||
| Net loss applicable to MUMSS | (1,976 | ) | (144 | ) | N/A | |||||||
| N/A�Not | Applicable. |
| (1) | The Company accounted for MUMSS as an equity method investment beginning May�1, 2010. |
| 253 | |
| 2011 | 2010 | 2009 | ||||||||||
| (dollars�in�millions) | ||||||||||||
| Net revenues(1): | ||||||||||||
| Revel | $ | � | $ | � | $ | (6 | ) | |||||
| Crescent | � | � | 161 | |||||||||
| Retail Asset Management | 11 | 1,221 | 628 | |||||||||
| MSCI | � | � | 651 | |||||||||
| CMB | 3 | 60 | (71 | ) | ||||||||
| Saxon | 28 | 197 | 112 | |||||||||
| Other | 24 | 41 | 48 | |||||||||
| $ | 66 | $ | 1,519 | $ | 1,523 | |||||||
| Pre-tax gain (loss) on discontinued operations(1): | ||||||||||||
| Revel(2) | $ | (10 | ) | $ | (1,208 | ) | $ | (15 | ) | |||
| Crescent(3) | 15 | 2 | (613 | ) | ||||||||
| Retail Asset Management(4) | 14 | 994 | 268 | |||||||||
| MSCI(5) | � | � | 537 | |||||||||
| DFS(6) | � | 775 | � | |||||||||
| CMB | 4 | 40 | (87 | ) | ||||||||
| Saxon(7) | (194 | ) | (34 | ) | (151 | ) | ||||||
| Other | (4 | ) | 8 | (53 | ) | |||||||
| $ | (175 | ) | $ | 577 | $ | (114 | ) | |||||
| (1) | Amounts included eliminations of intersegment activity. |
| (2) | Amount included a loss of approximately $1.2 billion in 2010 in connection with the disposition of Revel. |
| (3) | Amount included a gain on disposition of approximately $126 million in 2009. |
| (4) | Amount included a pre-tax gain of approximately $853 million in 2010 in connection with the sale of Retail Asset Management. |
| (5) | Amount included a pre-tax gain on MSCI secondary offerings of $499 million in 2009. |
| (6) | Amount relates to the legal settlement with DFS in 2010. |
| (7) | Amount included a loss of approximately $98 million in 2011 in connection with the planned disposition of Saxon. |
| | 254 |
| December�31, 2011 | December�31, 2010 | |||||||
| Assets: | ||||||||
| Cash and due from banks | $ | 11,935 | $ | 5,672 | ||||
| Interest bearing deposits with banks | 3,385 | 3,718 | ||||||
| Financial instruments owned | 12,747 | 13,374 | ||||||
| Securities purchased under agreement to resell with affiliate | 50,356 | 49,631 | ||||||
| Advances to subsidiaries: | ||||||||
| Bank and bank holding company | 18,325 | 18,371 | ||||||
| Non-bank | 129,751 | 141,659 | ||||||
| Investment in subsidiaries, at equity: | ||||||||
| Bank and bank holding company | 19,899 | 6,129 | ||||||
| Non-bank | 26,201 | 43,607 | ||||||
| Other assets | 6,845 | 7,568 | ||||||
| Total assets | $ | 279,444 | $ | 289,729 | ||||
| Liabilities and Shareholders� Equity: | ||||||||
| Commercial paper and other short-term borrowings | $ | 1,100 | $ | 1,353 | ||||
| Financial instruments sold, not yet purchased | 1,861 | 1,614 | ||||||
| Payables to subsidiaries | 35,159 | 42,816 | ||||||
| Other liabilities and accrued expenses | 4,123 | 2,819 | ||||||
| Long-term borrowings | 175,152 | 183,916 | ||||||
| 217,395 | 232,518 | |||||||
| Commitments and contingent liabilities | ||||||||
| Shareholders� equity: | ||||||||
| Preferred stock | 1,508 | 9,597 | ||||||
| Common stock, $0.01 par value; | ||||||||
| Shares authorized: 3,500,000,000 in 2011 and 2010; | ||||||||
| Shares issued: 1,989,377,171 in 2011 and 1,603,913,074 in 2010; | ||||||||
| Shares outstanding: 1,926,986,130 in 2011 and 1,512,022,095 in 2010 | 20 | 16 | ||||||
| Paid-in capital | 22,836 | 13,521 | ||||||
| Retained earnings | 40,341 | 38,603 | ||||||
| Employee stock trust | 3,166 | 3,465 | ||||||
| Accumulated other comprehensive loss | (157 | ) | (467 | ) | ||||
| Common stock held in treasury, at cost, $0.01 par value; 62,391,041 shares in 2011 and 91,890,979 shares in 2010 | (2,499 | ) | (4,059 | ) | ||||
| Common stock issued to employee trust | (3,166 | ) | (3,465 | ) | ||||
| Total shareholders� equity | 62,049 | 57,211 | ||||||
| Total liabilities and shareholders� equity | $ | 279,444 | $ | 289,729 | ||||
| 255 | |
| 2011 | 2010 | 2009 | ||||||||||
| Revenues: | ||||||||||||
| Dividends from non-bank subsidiary | $ | 7,153 | $ | 2,537 | $ | 6,117 | ||||||
| Undistributed gain (loss) of subsidiaries | (3,280 | ) | 5,708 | (307 | ) | |||||||
| Principal transactions | 4,772 | 628 | (5,592 | ) | ||||||||
| Other | (241 | ) | (307 | ) | 412 | |||||||
| Total non-interest revenues | 8,404 | 8,566 | 630 | |||||||||
| Interest income | 3,251 | 3,305 | 4,432 | |||||||||
| Interest expense | 5,600 | 5,351 | 6,153 | |||||||||
| Net interest | (2,349 | ) | (2,046 | ) | (1,721 | ) | ||||||
| Net revenues | 6,055 | 6,520 | (1,091 | ) | ||||||||
| Non-interest expenses: | ||||||||||||
| Non-interest expenses | 120 | 230 | 346 | |||||||||
| Income (loss) before income tax provision (benefit) | 5,935 | 6,290 | (1,437 | ) | ||||||||
| Provision for (benefit from) income taxes | 1,825 | 1,587 | (2,783 | ) | ||||||||
| Net income | 4,110 | 4,703 | 1,346 | |||||||||
| Other comprehensive income (loss), net of tax: | ||||||||||||
| Foreign currency translation adjustments | (35 | ) | 66 | 116 | ||||||||
| Amortization of cash flow hedges | 7 | 9 | 13 | |||||||||
| Net unrealized gain on Securities available for sale | 87 | 36 | � | |||||||||
| Pension, postretirement and other related adjustments | 251 | (18 | ) | (269 | ) | |||||||
| Comprehensive income | $ | 4,420 | $ | 4,796 | $ | 1,206 | ||||||
| Net income | $ | 4,110 | $ | 4,703 | $ | 1,346 | ||||||
| Earnings (loss) applicable to Morgan Stanley common shareholders | $ | 2,067 | $ | 3,594 | $ | (907 | ) | |||||
| | 256 |
| 2011 | 2010 | 2009 | ||||||||||
| Cash flows from operating activities: | ||||||||||||
| Net income | $ | 4,110 | $ | 4,703 | $ | 1,346 | ||||||
| Adjustments to reconcile net income to net cash provided by (used for) operating activities: | ||||||||||||
| Compensation payable in common stock and stock options | 1,300 | 1,260 | 1,265 | |||||||||
| Undistributed (gain) loss of subsidiaries | 3,280 | (5,708 | ) | 307 | ||||||||
| Gain on business dispositions | � | � | (606 | ) | ||||||||
| (Gain) loss on retirement of long-term debt | (155 | ) | 27 | (491 | ) | |||||||
| Change in assets and liabilities: | ||||||||||||
| Financial instruments owned, net of financial instruments sold, not yet purchased | 103 | (11,848 | ) | 5,505 | ||||||||
| Other assets | 960 | 929 | (5,036 | ) | ||||||||
| Other liabilities and accrued expenses | (4,242 | ) | 15,072 | (10,134 | ) | |||||||
| Net cash provided by (used for) operating activities | 5,356 | 4,435 | (7,844 | ) | ||||||||
| Cash flows from investing activities: | ||||||||||||
| Advances to and investments in subsidiaries | 10,290 | (9,552 | ) | 13,375 | ||||||||
| Securities purchased under agreement to resell with affiliate | (726 | ) | (1,545 | ) | (29,255 | ) | ||||||
| Business dispositions, net of cash disposed | � | � | 565 | |||||||||
| Net cash provided by (used for) investing activities | 9,564 | (11,097 | ) | (15,315 | ) | |||||||
| Cash flows from financing activities: | ||||||||||||
| Net proceeds from (payments for) short-term borrowings | (253 | ) | 202 | (5,743 | ) | |||||||
| Excess tax benefits associated with stock-based awards | � | 5 | 102 | |||||||||
| Net proceeds from: | ||||||||||||
| Public offerings and other issuances of common stock | � | 5,581 | 6,255 | |||||||||
| Issuance of long-term borrowings | 28,106 | 26,683 | 30,112 | |||||||||
| Payments for: | ||||||||||||
| Series D Preferred Stock and Warrant | � | � | (10,950 | ) | ||||||||
| Redemption of junior subordinated debentures related to China Investment Corporation Ltd. | � | (5,579 | ) | � | ||||||||
| Repurchases of common stock for employee tax withholding | (317 | ) | (317 | ) | (50 | ) | ||||||
| Long-term borrowings | (35,805 | ) | (25,349 | ) | (23,824 | ) | ||||||
| Cash dividends | (834 | ) | (1,156 | ) | (1,732 | ) | ||||||
| Net cash provided by (used for) financing activities | (9,103 | ) | 70 | (5,830 | ) | |||||||
| Effect of exchange rate changes on cash and cash equivalents | 113 | (817 | ) | 549 | ||||||||
| Net increase (decrease) in cash and cash equivalents | 5,930 | (7,409 | ) | (28,440 | ) | |||||||
| Cash and cash equivalents, at beginning of period | 9,390 | 16,799 | 45,239 | |||||||||
| Cash and cash equivalents, at end of period | $ | 15,320 | $ | 9,390 | $ | 16,799 | ||||||
| Cash and cash equivalents include: | ||||||||||||
| Cash and due from banks | $ | 11,935 | $ | 5,672 | $ | 13,262 | ||||||
| Interest bearing deposits with banks | 3,385 | 3,718 | 3,537 | |||||||||
| Cash and cash equivalents, at end of period | $ | 15,320 | $ | 9,390 | $ | 16,799 | ||||||
| 257 | |
Table of Contents MORGAN STANLEY NOTES TO CONSOLIDATED FINANCIAL STATEMENTS�(Continued) 27.����Quarterly Results (unaudited). | 2011 Quarter | 2010 Quarter | |||||||||||||||||||||||||||||||
| First | Second | Third | Fourth | First | Second | Third | Fourth | |||||||||||||||||||||||||
| (dollars in millions, except per share data) | ||||||||||||||||||||||||||||||||
| Total non-interest revenues | $ | 7,600 | $ | 9,308 | $ | 9,699 | $ | 5,439 | $ | 8,608 | $ | 7,776 | $ | 6,622 | $ | 7,484 | ||||||||||||||||
| Net interest | 7 | (66 | ) | 146 | 270 | 378 | 149 | 111 | 259 | |||||||||||||||||||||||
| Net revenues | 7,607 | 9,242 | 9,845 | 5,709 | 8,986 | 7,925 | 6,733 | 7,743 | ||||||||||||||||||||||||
| Total non-interest expenses | 6,703 | 7,266 | 6,154 | 6,166 | 6,493 | 6,200 | 5,911 | 6,552 | ||||||||||||||||||||||||
| Income (loss) from continuing operations before income taxes | 904 | 1,976 | 3,691 | (457 | ) | 2,493 | 1,725 | 822 | 1,191 | |||||||||||||||||||||||
| Provision for (benefit from) income taxes | (244 | ) | 542 | 1,416 | (296 | ) | 426 | 250 | (12 | ) | 90 | |||||||||||||||||||||
| Income (loss) from continuing operations | 1,148 | 1,434 | 2,275 | (161 | ) | 2,067 | 1,475 | 834 | 1,101 | |||||||||||||||||||||||
| Discontinued operations(1): | ||||||||||||||||||||||||||||||||
| Gain (loss) from discontinued operations | (32 | ) | (27 | ) | (12 | ) | (104 | ) | (77 | ) | 843 | (168 | ) | (22 | ) | |||||||||||||||||
| Provision for (benefit from) income taxes | (14 | ) | 1 | (30 | ) | (81 | ) | (21 | ) | 334 | 25 | 13 | ||||||||||||||||||||
| Net gain (loss) from discontinued operations | (18 | ) | (28 | ) | 18 | (23 | ) | (56 | ) | 509 | (193 | ) | (35 | ) | ||||||||||||||||||
| Net income | 1,130 | 1,406 | 2,293 | (184 | ) | 2,011 | 1,984 | 641 | 1,066 | |||||||||||||||||||||||
| Net income applicable to noncontrolling interests | 162 | 213 | 94 | 66 | 235 | 24 | 510 | 230 | ||||||||||||||||||||||||
| Net income (loss) applicable to Morgan Stanley | $ | 968 | $ | 1,193 | $ | 2,199 | $ | (250 | ) | $ | 1,776 | $ | 1,960 | $ | 131 | $ | 836 | |||||||||||||||
| Earnings (loss) applicable to Morgan Stanley common shareholders | $ | 736 | $ | (558 | ) | $ | 2,153 | $ | (275 | ) | $ | 1,412 | $ | 1,578 | $ | (91 | ) | $ | 600 | |||||||||||||
| Earnings (loss) per basic common share(2): | ||||||||||||||||||||||||||||||||
| Income (loss) from continuing operations | $ | 0.52 | $ | (0.36 | ) | $ | 1.15 | $ | (0.14 | ) | $ | 1.11 | $ | 0.85 | $ | 0.07 | $ | 0.44 | ||||||||||||||
| Net gain (loss) from discontinued operations | (0.01 | ) | (0.02 | ) | 0.01 | (0.01 | ) | (0.04 | ) | 0.35 | (0.14 | ) | (0.02 | ) | ||||||||||||||||||
| Earnings (loss) per basic common share | $ | 0.51 | $ | (0.38 | ) | $ | 1.16 | $ | (0.15 | ) | $ | 1.07 | $ | 1.20 | $ | (0.07 | ) | $ | 0.42 | |||||||||||||
| Earnings (loss) per diluted common share(2): | ||||||||||||||||||||||||||||||||
| Income (loss) from continuing operations | $ | 0.51 | $ | (0.36 | ) | $ | 1.14 | $ | (0.14 | ) | $ | 1.02 | $ | 0.81 | $ | 0.06 | $ | 0.44 | ||||||||||||||
| Net gain (loss) from discontinued operations | (0.01 | ) | (0.02 | ) | 0.01 | (0.01 | ) | (0.03 | ) | 0.28 | (0.13 | ) | (0.03 | ) | ||||||||||||||||||
| Earnings (loss) per diluted common share | $ | 0.50 | $ | (0.38 | ) | $ | 1.15 | $ | (0.15 | ) | $ | 0.99 | $ | 1.09 | $ | (0.07 | ) | $ | 0.41 | |||||||||||||
| Dividends declared to common shareholders | $ | 0.05 | $ | 0.05 | $ | 0.05 | $ | 0.05 | $ | 0.05 | $ | 0.05 | $ | 0.05 | $ | 0.05 | ||||||||||||||||
| Book value | $ | 31.45 | $ | 30.17 | $ | 31.29 | $ | 31.42 | $ | 27.65 | $ | 29.65 | $ | 31.25 | $ | 31.49 | ||||||||||||||||
| (1) | See Notes 1 and 25 for more information on discontinued operations. |
| (2) | Summation of the quarters� earnings per common share may not equal the annual amounts due to the averaging effect of the number of shares and share equivalents throughout the year. |
| 259 | |
| | 260 |
| 2011 | ||||||||||||
| Average Weekly Balance | Interest | Average Rate | ||||||||||
| (dollars in millions) | ||||||||||||
| Assets | ||||||||||||
| Interest earning assets: | ||||||||||||
| Financial instruments owned(1): | ||||||||||||
| U.S. | $ | 122,704 | $ | 2,636 | 2.1 | % | ||||||
| Non-U.S. | 114,445 | 957 | 0.8 | |||||||||
| Securities available for sale: | ||||||||||||
| U.S. | 27,712 | 348 | 1.3 | |||||||||
| Loans: | ||||||||||||
| U.S. | 12,294 | 326 | 2.7 | |||||||||
| Non-U.S. | 420 | 30 | 7.1 | |||||||||
| Interest bearing deposits with banks: | ||||||||||||
| U.S. | 41,256 | 49 | 0.1 | |||||||||
| Non-U.S. | 16,558 | 137 | 0.8 | |||||||||
| Federal funds sold and securities purchased under agreements to resell and Securities borrowed: | ||||||||||||
| U.S. | 191,843 | (79 | ) | � | ||||||||
| Non-U.S. | 110,682 | 965 | 0.9 | |||||||||
| Other: | ||||||||||||
| U.S. | 45,336 | 1,341 | 3.0 | |||||||||
| Non-U.S. | 15,454 | 554 | 3.6 | |||||||||
| Total | $ | 698,704 | $ | 7,264 | 1.0 | % | ||||||
| Non-interest earning assets | 140,131 | |||||||||||
| Total assets | $ | 838,835 | ||||||||||
| Liabilities and Equity | ||||||||||||
| Interest bearing liabilities: | ||||||||||||
| Deposits: | ||||||||||||
| U.S. | $ | 64,559 | $ | 236 | 0.4 | % | ||||||
| Non-U.S. | 91 | � | � | |||||||||
| Commercial paper and other short-term borrowings: | ||||||||||||
| U.S. | 874 | 7 | 0.8 | |||||||||
| Non-U.S. | 2,163 | 34 | 1.6 | |||||||||
| Long-term debt: | ||||||||||||
| U.S. | 184,623 | 4,880 | 2.6 | |||||||||
| Non-U.S. | 7,701 | 32 | 0.4 | |||||||||
| Financial instruments sold, not yet purchased(1): | ||||||||||||
| U.S. | 30,070 | � | � | |||||||||
| Non-U.S. | 61,313 | � | � | |||||||||
| Securities sold under agreements to repurchase and Securities loaned: | ||||||||||||
| U.S. | 110,270 | 649 | 0.6 | |||||||||
| Non-U.S. | 69,276 | 1,276 | 1.8 | |||||||||
| Other: | ||||||||||||
| U.S. | 90,193 | (1,089 | ) | (1.2 | ) | |||||||
| Non-U.S. | 38,139 | 882 | 2.3 | |||||||||
| Total | $ | 659,272 | $ | 6,907 | 1.0 | |||||||
| Non-interest bearing liabilities and equity | 179,563 | |||||||||||
| Total liabilities and equity | $ | 838,835 | ||||||||||
| Net interest income and net interest rate spread | $ | 357 | � | % | ||||||||
| (1) | Interest expense on Financial instruments sold, not yet purchased is reported as a reduction of Interest income. |
| 261 | |
| 2010 | ||||||||||||
| Average Weekly Balance | Interest | Average Rate | ||||||||||
| (dollars in millions) | ||||||||||||
| Assets | ||||||||||||
| Interest earning assets: | ||||||||||||
| Financial instruments owned(1): | ||||||||||||
| U.S. | $ | 145,449 | $ | 3,124 | 2.1 | % | ||||||
| Non-U.S. | 105,385 | 807 | 0.8 | |||||||||
| Securities available for sale: | ||||||||||||
| U.S. | 18,290 | 215 | 1.2 | |||||||||
| Loans: | ||||||||||||
| U.S. | 7,993 | 293 | 3.7 | |||||||||
| Non-U.S. | 219 | 22 | 10.0 | |||||||||
| Interest bearing deposits with banks: | ||||||||||||
| U.S. | 33,807 | 67 | 0.2 | |||||||||
| Non-U.S. | 20,897 | 88 | 0.4 | |||||||||
| Federal funds sold and securities purchased under agreements to resell and Securities borrowed: | ||||||||||||
| U.S. | 193,796 | 236 | 0.1 | |||||||||
| Non-U.S. | 111,982 | 533 | 0.5 | |||||||||
| Other: | ||||||||||||
| U.S. | 32,400 | 1,571 | 4.8 | |||||||||
| Non-U.S. | 18,091 | 355 | 2.0 | |||||||||
| Total | $ | 688,309 | $ | 7,311 | 1.1 | % | ||||||
| Non-interest earning assets | 142,761 | |||||||||||
| Total assets | $ | 831,070 | ||||||||||
| Liabilities and Equity | ||||||||||||
| Interest bearing liabilities: | ||||||||||||
| Deposits: | ||||||||||||
| U.S. | $ | 62,759 | $ | 310 | 0.5 | % | ||||||
| Non-U.S. | 70 | � | � | |||||||||
| Commercial paper and other short-term borrowings: | ||||||||||||
| U.S. | 1,599 | 11 | 0.7 | |||||||||
| Non-U.S. | 1,772 | 17 | 1.0 | |||||||||
| Long-term debt: | ||||||||||||
| U.S. | 186,374 | 4,586 | 2.5 | |||||||||
| Non-U.S. | 5,170 | 6 | 0.1 | |||||||||
| Financial instruments sold, not yet purchased(1): | ||||||||||||
| U.S. | 22,947 | � | � | |||||||||
| Non-U.S. | 58,741 | � | � | |||||||||
| Securities sold under agreements to repurchase and Securities loaned: | ||||||||||||
| U.S. | 116,090 | 725 | 0.6 | |||||||||
| Non-U.S. | 94,498 | 866 | 0.9 | |||||||||
| Other: | ||||||||||||
| U.S. | 97,585 | (497 | ) | (0.5 | ) | |||||||
| Non-U.S. | 23,852 | 390 | 1.6 | |||||||||
| Total | $ | 671,457 | $ | 6,414 | 1.0 | |||||||
| Non-interest bearing liabilities and equity | 159,613 | |||||||||||
| Total liabilities and equity | $ | 831,070 | ||||||||||
| Net interest income and net interest rate spread | $ | 897 | 0.1 | % | ||||||||
| (1) | Interest expense on Financial instruments sold, not yet purchased is reported as a reduction of Interest income. |
| | 262 |
| 2009 | ||||||||||||
| Average Weekly Balance(1) | Interest | Average Rate | ||||||||||
| (dollars in millions) | ||||||||||||
| Assets | ||||||||||||
| Interest earning assets: | ||||||||||||
| Financial instruments owned(2): | ||||||||||||
| U.S. | $ | 143,885 | $ | 4,024 | 2.8 | % | ||||||
| Non-U.S. | 77,531 | 907 | 1.2 | |||||||||
| Loans: | ||||||||||||
| U.S. | 6,339 | 207 | 3.3 | |||||||||
| Non-U.S. | 314 | 22 | 7.0 | |||||||||
| Interest bearing deposits with banks: | ||||||||||||
| U.S. | 44,523 | 149 | 0.3 | |||||||||
| Non-U.S. | 16,300 | 92 | 0.6 | |||||||||
| Federal funds sold and securities purchased under agreements to resell and Securities borrowed: | ||||||||||||
| U.S. | 176,904 | 237 | 0.1 | |||||||||
| Non-U.S. | 85,079 | 622 | 0.7 | |||||||||
| Other: | ||||||||||||
| U.S. | 27,691 | 1,224 | 4.4 | |||||||||
| Non-U.S. | 17,261 | (7 | ) | � | ||||||||
| Total | $ | 595,827 | $ | 7,477 | 1.2 | % | ||||||
| Non-interest earning assets | 145,719 | |||||||||||
| Total assets | $ | 741,546 | ||||||||||
| Liabilities and Equity | ||||||||||||
| Interest bearing liabilities: | ||||||||||||
| Deposits: | ||||||||||||
| U.S. | $ | 61,164 | $ | 782 | 1.3 | % | ||||||
| Non-U.S. | 116 | � | � | |||||||||
| Commercial paper and other short-term borrowings: | ||||||||||||
| U.S. | 2,101 | $ | 31 | 1.5 | ||||||||
| Non-U.S. | 1,276 | 20 | 1.6 | |||||||||
| Long-term debt: | ||||||||||||
| U.S. | 181,280 | 4,882 | 2.7 | |||||||||
| Non-U.S. | 3,712 | 16 | 0.4 | |||||||||
| Financial instruments sold, not yet purchased(2): | ||||||||||||
| U.S. | 29,153 | � | � | |||||||||
| Non-U.S. | 40,440 | � | � | |||||||||
| Securities sold under agreements to repurchase and Securities loaned: | ||||||||||||
| U.S. | 115,653 | 749 | 0.6 | |||||||||
| Non-U.S. | 49,222 | 625 | 1.3 | |||||||||
| Other: | ||||||||||||
| U.S. | 84,015 | (616 | ) | (0.7 | ) | |||||||
| Non-U.S. | 29,437 | 198 | 0.7 | |||||||||
| Total | $ | 597,569 | $ | 6,687 | 1.1 | |||||||
| Non-interest bearing liabilities and equity | 143,977 | |||||||||||
| Total liabilities and equity | $ | 741,546 | ||||||||||
| Net interest income and net interest rate spread | $ | 790 | 0.1 | % | ||||||||
| (1) | The Company calculates its average balances based upon weekly amounts, except where weekly balances are unavailable, month-end balances are used. |
| (2) | Interest expense on Financial instruments sold, not yet purchased is reported as a reduction of Interest income. |
| 263 | |
| 2011 versus 2010 | ||||||||||||
| Increase�(decrease)�due�to�change�in: | ||||||||||||
| Volume | Rate | Net�Change | ||||||||||
| (dollars in millions) | ||||||||||||
| Interest earning assets | ||||||||||||
| Financial instruments owned: | ||||||||||||
| U.S. | $ | (489 | ) | $ | 1 | $ | (488 | ) | ||||
| Non-U.S. | 69 | 81 | 150 | |||||||||
| Securities available for sale: | ||||||||||||
| U.S. | 111 | 22 | 133 | |||||||||
| Loans: | ||||||||||||
| U.S. | 158 | (125 | ) | 33 | ||||||||
| Non-U.S. | 20 | (12 | ) | 8 | ||||||||
| Interest bearing deposits with banks: | ||||||||||||
| U.S. | 15 | (33 | ) | (18 | ) | |||||||
| Non-U.S. | (18 | ) | 67 | 49 | ||||||||
| Federal funds sold and securities purchased under agreements to resell and Securities borrowed: | ||||||||||||
| U.S. | (2 | ) | (313 | ) | (315 | ) | ||||||
| Non-U.S. | (6 | ) | 438 | 432 | ||||||||
| Other: | ||||||||||||
| U.S. | 627 | (857 | ) | (230 | ) | |||||||
| Non-U.S. | (52 | ) | 251 | 199 | ||||||||
| Change in interest income | $ | 433 | $ | (480 | ) | $ | (47 | ) | ||||
| Interest bearing liabilities | ||||||||||||
| Deposits: | ||||||||||||
| U.S. | $ | 9 | $ | (83 | ) | $ | (74 | ) | ||||
| Commercial paper and other short-term borrowings: | ||||||||||||
| U.S. | (5 | ) | 1 | (4 | ) | |||||||
| Non-U.S. | 4 | 13 | 17 | |||||||||
| Long-term debt: | ||||||||||||
| U.S. | (43 | ) | 337 | 294 | ||||||||
| Non-U.S. | 3 | 23 | 26 | |||||||||
| Securities sold under agreements to repurchase and Securities loaned: | ||||||||||||
| U.S. | (36 | ) | (40 | ) | (76 | ) | ||||||
| Non-U.S. | (231 | ) | 641 | 410 | ||||||||
| Other: | ||||||||||||
| U.S. | 37 | (629 | ) | (592 | ) | |||||||
| Non-U.S. | 233 | 259 | 492 | |||||||||
| Change in interest expense | $ | (29 | ) | $ | 522 | $ | 493 | |||||
| Change in net interest income | $ | 462 | $ | (1,002 | ) | $ | (540 | ) | ||||
| | 264 |
| 2010 versus 2009 | ||||||||||||
| Increase�(decrease)�due�to�change�in: | ||||||||||||
| Volume | Rate | Net�Change | ||||||||||
| (dollars in millions) | ||||||||||||
| Interest earning assets | ||||||||||||
| Financial instruments owned: | ||||||||||||
| U.S. | $ | 44 | $ | (944 | ) | $ | (900 | ) | ||||
| Non-U.S. | 326 | (426 | ) | (100 | ) | |||||||
| Securities available for sale: | ||||||||||||
| U.S. | 215 | � | 215 | |||||||||
| Loans: | ||||||||||||
| U.S. | 54 | 32 | 86 | |||||||||
| Non-U.S. | (7 | ) | 7 | � | ||||||||
| Interest bearing deposits with banks: | ||||||||||||
| U.S. | (36 | ) | (46 | ) | (82 | ) | ||||||
| Non-U.S. | 26 | (30 | ) | (4 | ) | |||||||
| Federal funds sold and securities purchased under agreements to resell and Securities borrowed: | ||||||||||||
| U.S. | 23 | (24 | ) | (1 | ) | |||||||
| Non-U.S. | 197 | (286 | ) | (89 | ) | |||||||
| Other: | ||||||||||||
| U.S. | 208 | 139 | 347 | |||||||||
| Non-U.S. | � | 362 | 362 | |||||||||
| Change in interest income | $ | 1,050 | $ | (1,216 | ) | $ | (166 | ) | ||||
| Interest bearing liabilities | ||||||||||||
| Deposits: | ||||||||||||
| U.S. | $ | 20 | $ | (492 | ) | $ | (472 | ) | ||||
| Commercial paper and other short-term borrowings: | ||||||||||||
| U.S. | (7 | ) | (13 | ) | (20 | ) | ||||||
| Non-U.S. | 8 | (11 | ) | (3 | ) | |||||||
| Long-term debt: | ||||||||||||
| U.S. | 137 | (433 | ) | (296 | ) | |||||||
| Non-U.S. | 6 | (16 | ) | (10 | ) | |||||||
| Securities sold under agreements to repurchase and Securities loaned: | ||||||||||||
| U.S. | 3 | (27 | ) | (24 | ) | |||||||
| Non-U.S. | 575 | (334 | ) | 241 | ||||||||
| Other: | ||||||||||||
| U.S. | (100 | ) | 219 | 119 | ||||||||
| Non-U.S. | (37 | ) | 229 | 192 | ||||||||
| Change in interest expense | $ | 605 | $ | (878 | ) | $ | (273 | ) | ||||
| Change in net interest income | $ | 445 | $ | (338 | ) | $ | 107 | |||||
| 265 | |
| Average Deposits(1) | ||||||||||||||||||||||||
| 2011 | 2010 | 2009 | ||||||||||||||||||||||
| Average Amount(1) | Average Rate | Average Amount(1) | Average Rate | Average Amount(1) | Average Rate | |||||||||||||||||||
| (dollars in�millions) | ||||||||||||||||||||||||
| Deposits(2): | ||||||||||||||||||||||||
| Savings deposits | $ | 61,258 | 0.2 | % | $ | 58,053 | 0.2 | % | $ | 52,397 | 0.9 | % | ||||||||||||
| Time deposits | 3,392 | 3.5 | % | 4,776 | 3.7 | % | 8,883 | 3.7 | % | |||||||||||||||
| Total | $ | 64,650 | 0.4 | % | $ | 62,829 | 0.5 | % | $ | 61,280 | 1.3 | % | ||||||||||||
| (1) | The Company calculates its average balances based upon weekly amounts, except where weekly balances are unavailable, month-end balances are used. |
| (2) | Deposits are primarily located in U.S. offices. |
| 2011 | 2010 | 2009 | ||||||||||
| Net income to average assets | 0.5 | % | 0.6 | % | 0.2 | % | ||||||
| Return on common equity(1) | 3.8 | % | 8.5 | % | N/M | |||||||
| Return on total equity(2) | 6.9 | % | 9.0 | % | 2.8 | % | ||||||
| Dividend payout ratio(3) | 16.3 | % | 7.6 | % | N/M | |||||||
| Total average common equity to average assets | 6.5 | % | 5.1 | % | 4.6 | % | ||||||
| Total average equity to average assets | 7.1 | % | 6.3 | % | 6.5 | % | ||||||
| (1) | Based on net income applicable to common shareholders as a percentage of average common equity. |
| (2) | Based on net income as a percentage of average total equity. |
| (3) | Dividends declared per common share as a percentage of net income per diluted share. |
| 2011 | 2010 | 2009 | ||||||||||
| (dollars in millions) | ||||||||||||
| Securities sold under repurchase agreements(1): | ||||||||||||
| Period-end balance | $ | 104,800 | $ | 147,598 | $ | 159,401 | ||||||
| Average balance(2)(3) | 142,784 | 178,673 | 142,197 | |||||||||
| Maximum balance at any month-end | 164,511 | 216,130 | 210,482 | |||||||||
| Securities loaned(1): | ||||||||||||
| Period-end balance | $ | 30,462 | $ | 29,094 | $ | 26,246 | ||||||
| Average balance(2) | 36,762 | 31,915 | 22,679 | |||||||||
| Maximum balance at any month-end | 50,709 | 33,454 | 26,867 | |||||||||
| Commercial paper: | ||||||||||||
| Period-end balance | $ | 978 | $ | 945 | $ | 783 | ||||||
| Average balance(2) | 899 | 866 | 924 | |||||||||
| Maximum balance at any month-end | 978 | 1,098 | 5,367 | |||||||||
| Weighted average interest rate during the period | 2.1 | % | 1.7 | % | 2.4 | % | ||||||
| Weighted average interest rate on period-end balance | 2.7 | % | 2.5 | % | 0.8 | % | ||||||
| (1) | The Company considers its principal trading, investment banking, commissions and fees, and interest income, along with the associated interest expense, as one integrated activity for each of the Company�s separate businesses and, therefore, is unable to provide weighted average interest rates for Securities sold under repurchase agreements and Securities loaned. See Notes 1 and 17 of the consolidated financial statements for further information. |
| | 266 |
| (2) | The Company calculates its average balances based upon weekly amounts, except where weekly balances are unavailable, month-end balances are used. |
| (3) | In 2011, the period-end balance was lower than the annual average primarily due to a decrease in the overall balance sheet during the year. In 2010, period-end balance was lower than the annual average primarily due to the seasonal maturity of client financing activity. |
| At December�31, 2011 | ||||||||||||||||
| Country | Banks | Governments | Other | Total | ||||||||||||
| United Kingdom | $ | 13,852 | $ | 2 | $ | 89,585 | $ | 103,439 | ||||||||
| Cayman Islands | 766 | � | 31,169 | 31,935 | ||||||||||||
| France | 23,561 | 1,096 | 4,196 | 28,853 | ||||||||||||
| Japan | 23,542 | 436 | 2,821 | 26,799 | ||||||||||||
| Germany | 18,674 | 3,485 | 1,859 | 24,018 | ||||||||||||
| Netherlands | 3,508 | 23 | 8,826 | 12,357 | ||||||||||||
| Luxembourg | 1,619 | 94 | 6,137 | 7,850 | ||||||||||||
| Brazil | 149 | 3,398 | 2,165 | 5,712 | ||||||||||||
| Australia | 2,008 | 557 | 1,414 | 3,979 | ||||||||||||
| Italy | 881 | 1,463 | 539 | 2,883 | ||||||||||||
| At December�31, 2010 | ||||||||||||||||
| Country | Banks | Governments | Other | Total | ||||||||||||
| United Kingdom | $ | 8,555 | $ | 1 | $ | 38,057 | $ | 46,613 | ||||||||
| France | 32,798 | 2,543 | 3,147 | 38,488 | ||||||||||||
| Germany | 21,952 | 6,477 | 2,203 | 30,632 | ||||||||||||
| Cayman Islands | 15 | 4 | 27,550 | 27,569 | ||||||||||||
| Japan | 12,523 | 1,444 | 5,117 | 19,084 | ||||||||||||
| Netherlands | 3,818 | 61 | 8,035 | 11,914 | ||||||||||||
| Brazil | 1,006 | 748 | 6,833 | 8,587 | ||||||||||||
| Luxembourg | 2,924 | 483 | 4,811 | 8,218 | ||||||||||||
| Korea | 63 | 5,881 | 1,429 | 7,373 | ||||||||||||
| Italy | 1,660 | 1,730 | 1,229 | 4,619 | ||||||||||||
| Australia | 1,571 | 187 | 1,261 | 3,019 | ||||||||||||
| 267 | |
| Item�9. | Changes in and Disagreements with Accountants on Accounting and Financial Disclosure. |
| Item�9A. | Controls and Procedures. |
| � | Pertain to the maintenance of records that, in reasonable detail, accurately and fairly reflect the transactions and dispositions of the assets of the Company; |
| � | Provide reasonable assurance that transactions are recorded as necessary to permit preparation of financial statements in accordance with generally accepted accounting principles, and that our receipts and expenditures are being made only in accordance with authorizations of the Company�s management and directors; and |
| � | Provide reasonable assurance regarding prevention or timely detection of unauthorized acquisition, use or disposition of our assets that could have a material effect on our financial statements. |
| 268 |
| 269 |
| | 270 |
| Item�10. | Directors, Executive Officers and Corporate Governance. |
| � | �Item 1�Election of Directors�Director Nominees� |
| � | �Item 1�Election of Directors�Corporate Governance�Board Meetings and Committees� |
| � | �Item 1�Election of Directors�Beneficial Ownership of Company Common Stock�Section 16(a) Beneficial Ownership Reporting Compliance� |
| Item�11. | Executive Compensation. |
| � | �Item 1�Election of Directors�Executive Compensation� |
| � | �Item 1�Election of Directors�Corporate Governance�Director Compensation� |
| 271 | |
| Item�12. | Security Ownership of Certain Beneficial Owners and Management and Related Stockholder Matters. |
| Item�13. | Certain Relationships and Related Transactions, and Director Independence. |
| � | �Item 1�Election of Directors�Corporate Governance�Related Person Transactions Policy� |
| � | �Item 1�Election of Directors�Corporate Governance�Certain Transactions� |
| � | �Item 1�Election of Directors�Corporate Governance�Director Independence� |
| Item�14. | Principal Accountant Fees and Services. |
| � | �Item 2�Ratification of Appointment of Morgan Stanley�s Independent Auditor� (excluding the information under the subheading �Audit Committee Report�) |
| | 272 |
| Item�15. | Exhibits and Financial Statement Schedules. |
| � | The consolidated financial statements required to be filed in this Annual Report on Form 10-K are included in Part II, Item�8 hereof. |
| � | An exhibit index has been filed as part of this report beginning on page E-1 and is incorporated herein by reference. |
| 273 | |
| M ORGAN S TANLEY ( REGISTRANT ) | ||||
| By: | /s/����J AMES P. G ORMAN | |||
| (James P. Gorman) Chairman of the Board and Chief Executive Officer | ||||
| Signature | Title | |
| /s/����J AMES P. G ORMAN (James P. Gorman) | Chairman of the Board and Chief Executive Officer (Principal Executive Officer) | |
| /s/����R UTH P ORAT (Ruth Porat) | Executive Vice President and Chief Financial Officer (Principal Financial Officer) | |
| /s/����P AUL C. W IRTH (Paul C. Wirth) | Deputy Chief Financial Officer (Principal Accounting Officer) | |
| /s/����R OY J. B OSTOCK (Roy J. Bostock) | Director | |
| /s/����E RSKINE B. B OWLES (Erskine B. Bowles) | Director | |
| /s/����H OWARD J. D AVIES (Howard J. Davies) | Director | |
| /s/����J AMES H. H ANCE , J R . (James H. Hance, Jr.) | Director | |
| /s/����C. R OBERT K IDDER (C. Robert Kidder) | Director | |
| /s/����D ONALD T. N ICOLAISEN (Donald T. Nicolaisen) | Director | |
| S-1 |
Table of Contents| Signature | Title | |
| /s/����H UTHAM S. O LAYAN (Hutham S. Olayan) | Director | |
| /s/����J AMES W. O WENS (James W. Owens) | Director | |
| /s/����O. G RIFFITH S EXTON (O. Griffith Sexton) | Director | |
| /s/����R YOSUKE T AMAKOSHI (Ryosuke Tamakoshi) | Director | |
| /s/����M ASAAKI T ANAKA (Masaaki Tanaka) | Director | |
| /s/����L AURA D� ANDREA T YSON (Laura D�Andrea Tyson) | Director | |
| S-2 |
Table of Contents Exhibit Index Certain of the following exhibits, as indicated parenthetically, were
previously filed as exhibits to registration statements filed by Morgan Stanley or its predecessor companies under the Securities Act or to reports or registration statements filed by Morgan Stanley or its predecessor companies under the Exchange
Act and are hereby incorporated by reference to such statements or reports. Morgan Stanley�s Exchange Act file number is 1-11758. The Exchange Act file number of Morgan Stanley Group Inc., a predecessor company (�MSG�), was
1-9085. 1 | Exhibit No. | Description | |
| 2.1 | Amended and Restated Joint Venture Contribution and Formation Agreement dated as of May 29, 2009 by and among Citigroup Inc. and Morgan Stanley and Morgan Stanley Smith Barney Holdings LLC (Exhibit 10.1 to Morgan Stanley�s Current Report on Form 8-K dated May 29, 2009). | |
| 2.2 | Integration and Investment Agreement dated as of March 30, 2010 by and between Mitsubishi UFJ Financial Group, Inc. and Morgan Stanley (Exhibit 2.2 to Morgan Stanley�s Quarterly Report on Form 10-Q for the quarter ended June 30, 2011). | |
| 3.1 | Amended and Restated Certificate of Incorporation of Morgan Stanley, as amended to date (Exhibit 3 to Morgan Stanley�s Quarter Report on Form 10-Q for the quarter ended June 30, 2009). | |
| 3.2 | Certificate of Elimination of Series B Non-Cumulative Non-Voting Perpetual Convertible Preferred Stock (Exhibit 3.1 Morgan Stanley�s Current Report on Form 8-K dated July 20, 2011). | |
| 3.3 | Amended and Restated Bylaws of Morgan Stanley, as amended to date (Exhibit 3.1 to Morgan Stanley�s Current Report on Form 8-K dated March 9, 2010). | |
| 4.1 | Indenture dated as of February�24, 1993 between Morgan Stanley and The Bank of New York, as trustee (Exhibit 4 to Morgan Stanley�s Registration Statement on Form S-3 (No. 33-57202)). | |
| 4.2 | Amended and Restated Senior Indenture dated as of May�1, 1999 between Morgan Stanley and The Bank of New York, as trustee (Exhibit 4-e to Morgan Stanley�s Registration Statement on Form S-3/A (No. 333-75289) as amended by Fourth Supplemental Senior Indenture dated as of October 8, 2007 (Exhibit 4.3 to Morgan Stanley�s Annual Report on Form 10-K for the fiscal year ended November 30, 2007). | |
| 4.3 | Senior Indenture dated as of November�1, 2004 between Morgan Stanley and The Bank of New York, as trustee (Exhibit 4-f to Morgan Stanley�s Registration Statement on Form S-3/A (No.�333-117752), as amended by First Supplemental Senior Indenture dated as of September 4, 2007 (Exhibit 4.5 to Morgan Stanley�s Annual Report on Form 10-K for the fiscal year ended November 30, 2007), Second Supplemental Senior Indenture dated as of January 4, 2008 (Exhibit 4.1 to Morgan Stanley�s Current Report on Form 8-K dated January 4, 2008), Third Supplemental Senior Indenture dated as of September 10, 2008 (Exhibit 4 to Morgan Stanley�s Quarterly Report on Form 10-Q for the quarter ended August 31, 2008), Fourth Supplemental Senior Indenture dated as of December 1, 2008 (Exhibit 4.1 to Morgan Stanley�s Current Report on Form 8-K dated December 1, 2008) ; Fifth Supplemental Senior Indenture dated as of April 1, 2009 (Exhibit 4 to Morgan Stanley�s Quarterly Report on Form 10-Q for the quarter ended March 31, 2009) and Sixth Supplemental Senior Indenture dated as of September 16, 2011 (Exhibit 4.1 to Morgan Stanley�s Quarterly Report on Form 10-Q for the quarter ended September 30, 2011). | |
| 4.4* | Seventh Supplemental Senior Indenture dated as of November 21, 2011 between Morgan Stanley and The Bank of New York Mellon, as trustee. | |
| (1) | For purposes of this Exhibit Index, references to �The Bank of New York� mean in some instances the entity successor to JPMorgan Chase Bank, N.A. or J.P. Morgan Trust Company, National Association; references to �JPMorgan Chase Bank, N.A.� mean the entity formerly known as The Chase Manhattan Bank, in some instances as the successor to Chemical Bank; references to �J.P. Morgan Trust Company, N.A.� mean the entity formerly known as Bank One Trust Company, N.A., as successor to The First National Bank of Chicago. |
| E-1 |
Table of Contents| Exhibit No. | Description | |
| 4.5 | The Unit Agreement Without Holders� Obligations, dated as of August 29, 2008, between Morgan Stanley and The Bank of New York Mellon, as Unit Agent, as Trustee and Paying Agent under the Senior Indenture referred to therein and as Warrant Agent under the Warrant Agreement referred to therein (Exhibit 4.1 to Morgan Stanley�s Current Report on Form 8-K dated August 29, 2008). | |
| 4.6 | Amended and Restated Subordinated Indenture dated as of May�1, 1999 between Morgan Stanley and The Bank of New York, as trustee (Exhibit 4-f to Morgan Stanley�s Registration Statement on Form S-3/A (No. 333-75289)). | |
| 4.7 | Subordinated Indenture dated as of October�1, 2004 between Morgan Stanley and The Bank of New York, as trustee (Exhibit 4-g to Morgan Stanley�s Registration Statement on Form S-3/A (No.�333-117752)). | |
| 4.8 | Junior Subordinated Indenture dated as of March�1, 1998 between Morgan Stanley and The Bank of New York, as trustee (Exhibit 4.1 to Morgan Stanley�s Quarterly Report on Form 10-Q for the quarter ended February�28, 1998). | |
| 4.9 | Junior Subordinated Indenture dated as of October�1, 2004 between Morgan Stanley and The Bank of New York, as trustee (Exhibit 4-ww to Morgan Stanley�s Registration Statement on Form S-3/A (No.�333-117752)). | |
| 4.10 | Junior Subordinated Indenture dated as of October�12, 2006 between Morgan Stanley and The Bank of New York, as trustee (Exhibit 4.1 to Morgan Stanley�s Current Report on Form 8-K dated October�12, 2006). | |
| 4.11 | Deposit Agreement dated as of July�6, 2006 among Morgan Stanley, JPMorgan Chase Bank, N.A. and the holders from time to time of the depositary receipts described therein (Exhibit 4.3 to Morgan Stanley�s Quarterly Report on Form 10-Q for the quarter ended May�31, 2006). | |
| 4.12 | Depositary Receipt for Depositary Shares, representing Floating Rate Non-Cumulative Preferred Stock, Series A (included in Exhibit 4.10 hereto). | |
| 4.13 | Amended and Restated Trust Agreement of Morgan Stanley Capital Trust III dated as of February 27, 2003 among Morgan Stanley, as depositor, The Bank of New York, as property trustee, The Bank of New York (Delaware), as Delaware trustee, and the administrators named therein (Exhibit 4 to Morgan Stanley�s Quarterly Report on Form 10-Q for the quarter ended February 28, 2003). | |
| 4.14 | Amended and Restated Trust Agreement of Morgan Stanley Capital Trust IV dated as of April 21, 2003 among Morgan Stanley, as depositor, The Bank of New York, as property trustee, The Bank of New York (Delaware), as Delaware Trustee and the administrators named therein (Exhibit 4 to Morgan Stanley�s Quarterly Report on Form 10-Q for the quarter ended May 31, 2003). | |
| 4.15 | Amended and Restated Trust Agreement of Morgan Stanley Capital Trust V dated as of July 16, 2003 among Morgan Stanley, as depositor, The Bank of New York, as property trustee, The Bank of New York (Delaware), as Delaware trustee and the administrators named therein (Exhibit 4 to Morgan Stanley�s Quarterly Report on Form 10-Q for the quarter ended August 31, 2003). | |
| 4.16 | Amended and Restated Trust Agreement of Morgan Stanley Capital Trust VI dated as of January 26, 2006 among Morgan Stanley, as depositor, The Bank of New York, as property trustee, The Bank of New York (Delaware), as Delaware trustee and the administrators named therein (Exhibit 4 to Morgan Stanley�s Quarterly Report on Form 10-Q for the quarter ended February 28, 2006). | |
| 4.17 | Amended and Restated Trust Agreement of Morgan Stanley Capital Trust VII dated as of October 12, 2006 among Morgan Stanley, as depositor, The Bank of New York, as property trustee, The Bank of New York (Delaware), as Delaware trustee and the administrators named therein (Exhibit 4.3 to Morgan Stanley�s Current Report on Form 8-K dated October 12, 2006). | |
| | E-2 |
| Exhibit No. | Description | |
| 4.18 | Amended and Restated Trust Agreement of Morgan Stanley Capital Trust VIII dated as of April 26, 2007 among Morgan Stanley, as depositor, The Bank of New York, as property trustee, The Bank of New York (Delaware), as Delaware trustee and the administrators named therein (Exhibit 4.3 to Morgan Stanley�s Current Report on Form 8-K dated April 26, 2007). | |
| 4.19 | Instruments defining the Rights of Security Holders, Including Indentures�Except as set forth in Exhibits 4.1 through 4.18 above, the instruments defining the rights of holders of long-term debt securities of Morgan Stanley and its subsidiaries are omitted pursuant to Section (b)(4)(iii) of Item 601 of Regulation S-K. Morgan Stanley hereby agrees to furnish copies of these instruments to the SEC upon request. | |
| 10.1* | Amended and Restated Trust Agreement dated as of October 18, 2011 by and between Morgan Stanley and State Street Bank and Trust Company. | |
| 10.2 | Transaction Agreement dated as of October 19, 2009 between Morgan Stanley and Invesco Ltd. (Exhibit 10 to Morgan Stanley�s Quarterly Report on Form 10-Q for the quarter ended September 30, 2009). | |
| 10.3 | Letter Agreement dated as of May 28, 2010 between Morgan Stanley and Invesco Ltd. (Exhibit 2.1 to Morgan Stanley�s Current Report on Form 8-K dated May�28, 2010). | |
| 10.4 | Transaction Agreement dated as of April 21, 2011 between Morgan Stanley and Mitsubishi UFJ Financial Group, Inc. (Exhibit 10.1 to Morgan Stanley�s Current Report on Form 8-K dated April 21, 2011). | |
| 10.5 | Amended and Restated Investor Agreement dated as of June 30, 2011 by and between Morgan Stanley and Mitsubishi UFJ Financial Group, Inc.(Exhibit 10.1 to Morgan Stanley�s Current Report on Form 8-K dated June 30, 2011). | |
| 10.6� | Morgan Stanley 401(k) Plan (f/k/a the Morgan Stanley DPSP/START Plan) dated as of October 1, 2002 (Exhibit 10.17 to Morgan Stanley�s Annual Report on Form 10-K for the fiscal year ended November 30, 2002) as amended by Amendment (Exhibit 10.18 to Morgan Stanley�s Annual Report on Form 10-K for the fiscal year ended November 30, 2002), Amendment (Exhibit 10.18 to Morgan Stanley�s Annual Report on Form 10-K for the fiscal year ended November 30, 2003), Amendment (Exhibit 10.19 to Morgan Stanley�s Annual Report on Form 10-K for the fiscal year ended November 30, 2003), Amendment (Exhibit 10 to Morgan Stanley�s Quarterly Report on Form 10-Q for the quarter ended May 31, 2004), Amendment (Exhibit 10.16 to Morgan Stanley�s Annual Report on Form 10-K for the fiscal year ended November 30, 2004), Amendment (Exhibit 10.1 to Morgan Stanley�s Quarterly Report on Form 10-Q for the quarter ended February 28, 2005), Amendment (Exhibit 10.2 to Morgan Stanley�s Quarterly Report on Form 10-Q for the quarter ended February 28, 2005), Amendment (Exhibit 10.1 to Morgan Stanley�s Quarterly Report on Form 10-Q for the quarter ended May 31, 2005), Amendment (Exhibit 10.8 to Morgan Stanley�s Annual Report on Form 10-K for the fiscal year ended November 30, 2005), Amendment (Exhibit 10 to Morgan Stanley�s Quarterly Report on Form 10-Q for the quarter ended February 28, 2007), Amendment (Exhibit 10.2 to Morgan Stanley�s Quarterly Report on Form 10-Q for the quarter ended August 31, 2007), Amendment (Exhibit 10.6 to Morgan Stanley�s Annual Report on Form 10-K for the fiscal year ended November 30, 2007), Amendment (Exhibit 10.1 to Morgan Stanley�s Quarterly Report on Form 10-Q for the quarter ended August 31, 2008), Amendment (Exhibit 10.12 to Morgan Stanley�s Annual Report on Form 10-K for the fiscal year ended November 30, 2008), Amendment (Exhibit�10.1 to Morgan Stanley�s Quarterly Report on Form 10-Q for the quarter ended March�31, 2009), Amendment (Exhibit 10.2 to Morgan Stanley�s Quarterly Report on Form 10-Q for the quarter ended June�30, 2009), Amendment (Exhibit 10.9 to Morgan Stanley�s Annual Report on Form 10-K for the year ended December 31, 2009), Amendment (Exhibit 10.6 to Morgan Stanley�s Annual Report on Form 10-K for the year ended December 31, 2010) and Amendment (Exhibit 10.1 to Morgan Stanley�s Quarterly Report on Form 10-Q for the quarter ended June�30, 2011). | |
| E-3 |
Table of Contents| Exhibit No. | Description | |
| 10.7�* | Amendment to Morgan Stanley 401(k) Plan, dated as of December 23, 2011. | |
| 10.8� | Morgan Stanley 401(k) Savings Plan, dated as of July 1, 2009 (Exhibit 10.3 to Morgan Stanley�s Quarterly Report on Form 10-Q for the quarter ended June 30, 2009) as amended by Amendment (Exhibit 10.11 to Morgan Stanley�s Annual Report on Form 10-K for the year ended December 31, 2009), Amendment (Exhibit 10.8 to Morgan Stanley�s Annual Report on Form 10-K for the year ended December 31, 2010) and Amendment (Exhibit 10.2 to Morgan Stanley�s Quarterly Report on Form 10-Q for the quarter ended June�30, 2011). | |
| 10.9�* | Amendment to Morgan Stanley 401(k) Savings Plan, dated as of December 23, 2011. | |
| 10.10� | 1994 Omnibus Equity Plan as amended and restated (Exhibit 10.23 to Morgan Stanley�s Annual Report on Form 10-K for the fiscal year ended November 30, 2003) as amended by Amendment (Exhibit 10.11 to Morgan Stanley�s Annual Report on Form 10-K for the fiscal year ended November 30, 2006). | |
| 10.11� | Tax Deferred Equity Participation Plan as amended and restated as of November 26, 2007 (Exhibit 10.9 to Morgan Stanley�s Annual Report on Form 10-K for the fiscal year ended November 30, 2007). | |
| 10.12� | Directors� Equity Capital Accumulation Plan as amended through November 16, 2009 (Exhibit 10.14 to Morgan Stanley�s Annual Report on Form 10-K for the year ended December 31, 2009). | |
| 10.13� | Select Employees� Capital Accumulation Program as amended and restated as of May 7, 2008 (Exhibit 10.1 to Morgan Stanley�s Quarterly Report on Form 10-Q for the quarter ended May 31, 2008). | |
| 10.14� | Form of Term Sheet under the Select Employees� Capital Accumulation Program (Exhibit 10.9 to Morgan Stanley�s Quarterly Report on Form 10-Q for the quarter ended February�29, 2008). | |
| 10.15� | Employees� Equity Accumulation Plan as amended and restated as of November 26, 2007 (Exhibit�10.12 to Morgan Stanley�s Annual Report on Form 10-K for the fiscal year ended November 30, 2007). | |
| 10.16� | Employee Stock Purchase Plan as amended and restated as of February�1, 2009 (Exhibit 10.20 to Morgan Stanley�s Annual Report on Form 10-K for the fiscal year ended November�30, 2008). | |
| 10.17� | Form of Agreement under the Morgan Stanley & Co. Incorporated Owners� and Select Earners� Plan (Exhibit 10.1 to MSG�s Annual Report on Form 10-K for the fiscal year ended January 31, 1993). | |
| 10.18� | Form of Agreement under the Officers� and Select Earners� Plan (Exhibit 10.2 to MSG�s Annual Report on Form 10-K for the fiscal year ended January 31, 1993). | |
| 10.19� | Morgan Stanley Supplemental Executive Retirement and Excess Plan, amended and restated effective December 31, 2008 (Exhibit 10.2 to Morgan Stanley�s Quarterly Report on Form 10-Q for the quarter ended March 31, 2009) as amended by Amendment (Exhibit 10.5 to Morgan Stanley�s Quarterly Report on Form 10-Q for the quarter ended June 30, 2009), Amendment (Exhibit 10.19 to Morgan Stanley�s Annual Report on Form 10-K for the year ended December 31, 2010) and Amendment (Exhibit 10.3 to Morgan Stanley�s Quarterly Report on Form 10-Q for the quarter ended June�30, 2011). | |
| 10.20� | 1995 Equity Incentive Compensation Plan (Annex A to MSG�s Proxy Statement for its 1996 Annual Meeting of Stockholders) as amended by Amendment (Exhibit 10.39 to Morgan Stanley�s Annual Report on Form 10-K for the fiscal year ended November 30, 2000), Amendment (Exhibit 10.5 to Morgan Stanley�s Quarterly Report on Form 10-Q for the quarter ended August 31, 2005), Amendment (Exhibit 10.3 to Morgan Stanley�s Quarterly Report on Form 10-Q for the quarter ended February 28, 2006), Amendment (Exhibit 10.24 to Morgan Stanley�s Annual Report on Form 10-K for the fiscal year ended November 30, 2006) and Amendment (Exhibit 10.22 to Morgan Stanley�s Annual Report on Form 10-K for the fiscal year ended November 30, 2007). | |
| | E-4 |
| Exhibit No. | Description | |
| 10.21� | Form of Equity Incentive Compensation Plan Award Certificate (Exhibit 10.1 to Morgan Stanley�s Quarterly Report on Form 10-Q for the quarter ended August 31, 2004). | |
| 10.22� | Form of Management Committee Equity Award Certificate for Discretionary Retention Award of Stock Units and Stock Options (Exhibit 10.30 to Morgan Stanley�s Annual Report on Form 10-K for the fiscal year ended November 30, 2006). | |
| 10.23� | 1988 Capital Accumulation Plan as amended (Exhibit 10.13 to MSG�s Annual Report on Form 10-K for the fiscal year ended January 31, 1993). | |
| 10.24� | Form of Deferred Compensation Agreement under the Pre-Tax Incentive Program (Exhibit 10.12 to MSG�s Annual Report on Form 10-K for the fiscal year ended January 31, 1994). | |
| 10.25� | Form of Deferred Compensation Agreement under the Pre-Tax Incentive Program 2 (Exhibit 10.12 to MSG�s Annual Report for the fiscal year ended November 30, 1996). | |
| 10.26� | Key Employee Private Equity Recognition Plan (Exhibit 10.43 to Morgan Stanley�s Annual Report on Form 10-K for the fiscal year ended November 30, 2000). | |
| 10.27� | Morgan Stanley Branch Manager Compensation Plan as amended and restated as of November 26, 2007 (Exhibit 10.33 to Morgan Stanley�s Annual Report on Form 10-K for the fiscal year ended November 30, 2007). | |
| 10.28� | Morgan Stanley Financial Advisor and Investment Representative Compensation Plan as amended and restated as of November 26, 2007 (Exhibit 10.34 to Morgan Stanley�s Annual Report on Form 10-K for the fiscal year ended November 30, 2007). | |
| 10.29� | Morgan Stanley UK Share Ownership Plan (Exhibit 4.1 to Morgan Stanley�s Registration Statement on Form S-8 (No. 333-146954)). | |
| 10.30� | Supplementary Deed of Participation for the Morgan Stanley UK Share Ownership Plan, dated as of November 5, 2009 (Exhibit 10.36 to Morgan Stanley�s Annual Report on Form 10-K for the year ended December 31, 2009). | |
| 10.31� | Aircraft Time Sharing Agreement, dated as of January 1, 2010, by and between�Corporate Services�Support Corp.�and James P. Gorman (Exhibit 10.1 to Morgan Stanley�s Quarterly Report on Form 10-Q for the quarter ended March 31, 2010). | |
| 10.32� | Agreement between Morgan Stanley and James P. Gorman, dated August 16, 2005, and amendment to agreement dated December 17, 2008 (Exhibit 10.2 to Morgan Stanley�s Quarterly Report on Form 10-Q for the quarter ended March 31, 2010). | |
| 10.33� | Agreement between Morgan Stanley and Gregory J. Fleming, dated February 3, 2010 (Exhibit 10.5 to Morgan Stanley�s Quarterly Report on Form 10-Q for the quarter ended March 31, 2011). | |
| 10.34� | Memorandum dated as of August 21, 2007 to Walid Chammah regarding Relocation from United States to London Office (Exhibit 10.7 to Morgan Stanley�s Quarterly Report on Form 10-Q for the quarter ended March 31, 2009). | |
| 10.35� | Form of Restrictive Covenant Agreement (Exhibit 10 to Morgan Stanley�s Current Report on Form�8-K dated November�22, 2005). | |
| 10.36� | Morgan Stanley Performance Formula and Provisions (Exhibit 10.3 to Morgan Stanley�s Quarterly Report on Form 10-Q for the quarter ended May 31, 2006). | |
| 10.37� | 2007 Equity Incentive Compensation Plan, as amended and restated as of July 20, 2011 (Exhibit 10.1 to Morgan Stanley�s Quarterly Report on Form 10-Q for the quarter ended September 30, 2011). | |
| E-5 |
Table of Contents| Exhibit No. | Description | |
| 10.38� | Morgan Stanley 2006 Notional Leveraged Co-Investment Plan, as amended and restated as of November 28, 2008 (Exhibit 10.47 to Morgan Stanley�s Annual Report on Form 10-K for the fiscal year ended November 30, 2008). | |
| 10.39� | Form of Award Certificate under the 2006 Notional Leveraged Co-Investment Plan (Exhibit 10.7 to Morgan Stanley�s Quarterly Report on Form 10-Q for the quarter ended February�29, 2008). | |
| 10.40� | Morgan Stanley 2007 Notional Leveraged Co-Investment Plan, amended as of June 4, 2009 (Exhibit 10.6 to Morgan Stanley�s Quarterly Report on Form 10-Q for the quarter ended June 30, 2009). | |
| 10.41� | Form of Award Certificate under the 2007 Notional Leveraged Co-Investment Plan for Certain Management Committee Members (Exhibit 10.8 to Morgan Stanley�s Quarterly Report on Form�10-Q for the quarter ended February�29, 2008). | |
| 10.42� | Form of Award Certificate for Discretionary Retention Awards of Stock Units to Certain Management Committee Members (Exhibit 10.10 to Morgan Stanley�s Quarterly Report on Form�10-Q for the quarter ended February�29, 2008). | |
| 10.43� | Form of Award Certificate for Discretionary Retention Awards of Stock Units (Exhibit 10.8 to Morgan Stanley�s Quarterly Report on Form�10-Q for the quarter ended March 31, 2009). | |
| 10.44� | Form of Award Certificate for Discretionary Retention Awards of Stock Units (Exhibit 10.4 to Morgan Stanley�s Quarterly Report on Form�10-Q for the quarter ended March 31, 2010). | |
| 10.45� | Governmental Service Amendment to Outstanding Stock Option and Stock Unit Awards (replacing and superseding in its entirety Exhibit 10.3 to Morgan Stanley�s Quarterly Report on Form 10-Q for the quarter ended May�31, 2007) (Exhibit 10.41 to Morgan Stanley�s Annual Report on Form 10-K for the fiscal year ended November�30, 2007). | |
| 10.46� | Amendment to Outstanding Stock Option and Stock Unit Awards (Exhibit 10.53 to Morgan Stanley�s Annual Report on Form 10-K for the fiscal year ended November 30, 2008). | |
| 10.47� | Morgan Stanley Compensation Incentive Plan (Exhibit 10.54 to Morgan Stanley�s Annual Report on Form 10-K for the fiscal year ended November 30, 2008). | |
| 10.48� | Form of Award Certificate under the Morgan Stanley Compensation Incentive Plan (Exhibit 10.9 to Morgan Stanley�s Quarterly Report on Form�10-Q for the quarter ended March 31, 2009). | |
| 10.49� | Form of Award Certificate under the Morgan Stanley Compensation Incentive Plan (Exhibit 10.5 to Morgan Stanley�s Quarterly Report on Form�10-Q for the quarter ended March 31, 2010). | |
| 10.50� | Form of Executive Waiver (Exhibit 10.55 to Morgan Stanley�s Annual Report on Form 10-K for the fiscal year ended November 30, 2008). | |
| 10.51� | Form of Executive Letter Agreement (Exhibit 10.56 to Morgan Stanley�s Annual Report on Form�10-K for the fiscal year ended November 30, 2008). | |
| 10.52� | Morgan Stanley 2009 Replacement Equity Incentive Compensation Plan for Morgan Stanley Smith Barney Employees (Exhibit 4.2 to Morgan Stanley�s Registration Statement on Form S-8 (No.�333-159504)). | |
| 10.53� | Form of Award Certificate for Performance Stock Units (Exhibit 10.6 to Morgan Stanley�s Quarterly Report on Form�10-Q for the quarter ended March 31, 2010). | |
| 10.54� | Form of Award Certificate for Discretionary Retention Awards of Stock Units (Exhibit 10.1 to Morgan Stanley�s Quarterly Report on Form�10-Q for the quarter ended March 31, 2011). | |
| 10.55� | Form of Award Certificate for Awards under the Deferred Bonus Program of the Morgan Stanley Compensation Incentive Plan. (Exhibit 10.2 to Morgan Stanley�s Quarterly Report on Form�10-Q for the quarter ended March 31, 2011). | |
| | E-6 |
| Exhibit No. | Description | |
| 10.56� | Form of Award Certificate for Performance Stock Units (Exhibit 10.3 to Morgan Stanley�s Quarterly Report on Form�10-Q for the quarter ended March 31, 2011). | |
| 10.57� | Form of Award Certificate for Special Discretionary Retention Awards of Stock Options (Exhibit 10.4 to Morgan Stanley�s Quarterly Report on Form�10-Q for the quarter ended March 31, 2011). | |
| 10.58�* | Senior Advisor Arrangement with John J. Mack, effective January�1, 2012. | |
| 10.59�* | Morgan Stanley Schedule of Non-Employee Directors Annual Compensation, effective as of May 17, 2011. | |
| 10.60�* | Strategic Equity Investment Plan, amended and restated as of January 1, 2009. | |
| 12* | Statement Re: Computation of Ratio of Earnings to Fixed Charges and Computation of Ratio of Earnings to Fixed Charges and Preferred Stock Dividends. | |
| 21* | Subsidiaries of Morgan Stanley. | |
| 23.1* | Consent of Deloitte & Touche LLP. | |
| 24 | Powers of Attorney (included on signature page). | |
| 31.1* | Rule 13a-14(a) Certification of Chief Executive Officer. | |
| 31.2* | Rule 13a-14(a) Certification of Chief Financial Officer. | |
| 32.1** | Section 1350 Certification of Chief Executive Officer. | |
| 32.2** | Section 1350 Certification of Chief Financial Officer. | |
| 101 | Interactive data files pursuant to Rule 405 of Regulation S-T: (i)�the Consolidated Statements of Financial Condition�December 31, 2011 and December 31, 2010, (ii)�the Consolidated Statements of Income�Twelve Months Ended December 31, 2011, December 31, 2010 and December 31, 2009, (iii)�the Consolidated Statements of Comprehensive Income�Twelve Months Ended December 31, 2011, December 31, 2010 and December 31, 2009, (iv)�the Consolidated Statements of Cash Flows�Twelve Months Ended December 31, 2011, December 31, 2010 and December 31, 2009, (v)�the Consolidated Statements of Changes in Total Equity�Twelve Months Ended December 31, 2011, December 31, 2010, and December 31, 2009, and (vi)�Notes to Consolidated Financial Statements. | |
| * | Filed herewith. |
| ** | Furnished herewith. |
| � | Management contract or compensatory plan or arrangement required to be filed as an exhibit to this Form 10-K pursuant to Item�15(b). |
| E-7 |
