 (Exact name of Registrant as specified in its charter)
 | Delaware (State or other jurisdiction of incorporation�or�organization) | 1585 Broadway New�York,�NY�10036 (Address�of�principal�executive�offices, including zip code) | 36-3145972 (I.R.S.�Employer�Identification�No.) | (212) 761-4000 (Registrant�s�telephone�number, including area code) | |||
| Title of each class | Name of exchange on which registered | |
| Securities registered pursuant to Section�12(b) of the Act: | ||
| Common Stock, $0.01 par value | New�York�Stock�Exchange | |
| Depositary Shares, each representing 1/1,000th interest in a share of Floating Rate Non-Cumulative Preferred Stock, Series�A, $0.01 par value | New York Stock Exchange | |
| 6 1 / 4 % Capital Securities of Morgan Stanley Capital Trust III (and Registrant�s guaranty with respect thereto) | New York Stock Exchange | |
| 6 1 / 4 % Capital Securities of Morgan Stanley Capital Trust IV (and Registrant�s guaranty with respect thereto) | New York Stock Exchange | |
| 5 3 / 4 % Capital Securities of Morgan Stanley Capital Trust V (and Registrant�s guaranty with respect thereto) | New York Stock Exchange | |
| 6.60% Capital Securities of Morgan Stanley Capital Trust VI (and Registrant�s guaranty with respect thereto) | New York Stock Exchange | |
| 6.60% Capital Securities of Morgan Stanley Capital Trust VII (and Registrant�s guaranty with respect thereto) | New York Stock Exchange | |
| 6.45% Capital Securities of Morgan Stanley Capital Trust VIII (and Registrant�s guaranty with respect thereto) | New York Stock Exchange | |
| Exchangeable Notes due June�30, 2011 | NYSE Amex LLC | |
| Capital Protected Notes due March�30, 2011 (2 issuances); Capital Protected Notes due June�30, 2011; Capital Protected Notes due August�20, 2011; Capital Protected Notes due October�30, 2011; Capital Protected Notes due December�30, 2011; Capital Protected Notes due September�30, 2012 | NYSE Arca, Inc. | |
| MPS SM due March�30, 2012 | NYSE Arca, Inc. | |
| Buffered PLUS SM due March�20, 2011 | NYSE Arca, Inc. | |
| PROPELS SM due December�30, 2011 (3 issuances) | NYSE Arca, Inc. | |
| Protected Absolute Return Barrier Notes due March�20, 2011 | NYSE Arca, Inc. | |
| Strategic Total Return Securities due July�30, 2011 | NYSE Arca, Inc. | |
| Market Vectors ETNs due March�31, 2020 (2 issuances); Market Vectors ETNs due April�30, 2020 (2 issuances) | NYSE Arca, Inc. | |
| Targeted Income Strategic Total Return Securities due July�30, 2011; Targeted Income Strategic Total Return Securities due January�15, 2012 | NYSE Arca, Inc. | |
| Targeted Income Strategic Total Return Securities due October�30, 2011 | The�NASDAQ�Stock�Market�LLC | |
| Large Accelerated Filer x Non-Accelerated�Filer � (Do not check if a smaller reporting company) | Accelerated�Filer � Smaller reporting company � |
ANNUAL REPORT ON FORM 10-K for the year ended December�31, 2010 | Table�of�Contents | Page | |||||
| Part I | ||||||
| Item�1. | Business | 1 | ||||
| Overview | 1 | |||||
| Available Information | 1 | |||||
| Business Segments | 2 | |||||
| Institutional Securities | 2 | |||||
| Global Wealth Management Group | 5 | |||||
| Asset Management | 6 | |||||
| Research | 7 | |||||
| Competition | 7 | |||||
| Supervision and Regulation | 8 | |||||
| Executive Officers of Morgan Stanley | 21 | |||||
| Item�1A. | Risk Factors | 23 | ||||
| Item 1B. | Unresolved Staff Comments | 31 | ||||
| Item 2. | Properties | 32 | ||||
| Item 3. | Legal Proceedings | 33 | ||||
| Item 4. | [Removed and Reserved] | 38 | ||||
| Part II | ||||||
| Item 5. | Market for Registrant�s Common Equity, Related Stockholder Matters and Issuer Purchases of Equity Securities | 39 | ||||
| Item 6. | Selected Financial Data | 42 | ||||
| Item 7. | Management�s Discussion and Analysis of Financial Condition and Results of Operations | 44 | ||||
| Introduction | 44 | |||||
| Executive Summary | 45 | |||||
| Business Segments | 54 | |||||
| Accounting Developments | 73 | |||||
| Other Matters | 73 | |||||
| Critical Accounting Policies | 76 | |||||
| Liquidity and Capital Resources | 81 | |||||
| Item 7A. | Quantitative and Qualitative Disclosures about Market Risk | 96 | ||||
| Item 8. | Financial Statements and Supplementary Data | 119 | ||||
| Report of Independent Registered Public Accounting Firm | 119 | |||||
| Consolidated Statements of Financial Condition | 120 | |||||
| Consolidated Statements of Income | 122 | |||||
| Consolidated Statements of Comprehensive Income | 123 | |||||
| Consolidated Statements of Cash Flows | 124 | |||||
| Consolidated Statements of Changes in Total Equity | 125 | |||||
 Table of Contents
| Page | ||||||
| Notes to Consolidated Financial Statements | 127 | |||||
| Financial Data Supplement (Unaudited) | 252 | |||||
| Item 9. | Changes in and Disagreements with Accountants on Accounting and Financial Disclosure | 260 | ||||
| Item�9A. | Controls and Procedures | 260 | ||||
| Item�9B. | Other Information | 262 | ||||
| Part�III | ||||||
| Item 10. | Directors, Executive Officers and Corporate Governance | 263 | ||||
| Item 11. | Executive Compensation | 263 | ||||
| Item 12. | Security Ownership of Certain Beneficial Owners and Management and Related Stockholder Matters | 264 | ||||
| Item 13. | Certain Relationships and Related Transactions, and Director Independence | 265 | ||||
| Item 14. | Principal Accountant Fees and Services | 265 | ||||
| Part�IV | ||||||
| Item�15. | Exhibits and Financial Statement Schedules | 266 | ||||
| Signatures | S-1 | |||||
| Exhibit Index | E-1 | |||||
Table of Contents Forward-Looking Statements We have included in or incorporated by reference into this report, and from time to time may make in our public filings, press
releases or other public statements, certain statements, including (without limitation) those under �Legal Proceedings� in Part I, Item�3, �Management�s Discussion and Analysis of Financial Condition and Results of
Operations� in Part II, Item�7 and �Quantitative and Qualitative Disclosures about Market Risk� in Part II, Item�7A, that may constitute �forward-looking statements� within the meaning of the safe harbor provisions
of the Private Securities Litigation Reform Act of 1995. In addition, our management may make forward-looking statements to analysts, investors, representatives of the media and others. These forward-looking statements are not historical facts and
represent only our beliefs regarding future events, many of which, by their nature, are inherently uncertain and beyond our control. The nature of our business makes predicting the future trends of our revenues, expenses and net income difficult. The risks and uncertainties involved in
our businesses could affect the matters referred to in such statements, and it is possible that our actual results may differ from the anticipated results indicated in these forward-looking statements. Important factors that could cause actual
results to differ from those in the forward-looking statements include (without limitation): | � | the effect of political and economic conditions and geopolitical events; |
| � | the effect of market conditions, particularly in the global equity, fixed income and credit markets, including corporate and mortgage (commercial and residential) lending and commercial real estate investments; |
| � | the impact of current, pending and future legislation (including the Dodd-Frank Wall Street Reform and Consumer Protection Act (the �Dodd-Frank Act�)), regulation (including capital requirements), and legal actions in the U.S. and worldwide; |
| � | the level and volatility of equity, fixed income and commodity prices and interest rates, currency values and other market indices; |
| � | the availability and cost of both credit and capital as well as the credit ratings assigned to our unsecured short-term and long-term debt; |
| � | investor sentiment and confidence in the financial markets; |
| � | our reputation; |
| � | inflation, natural disasters and acts of war or terrorism; |
| � | the actions and initiatives of current and potential competitors; |
| � | technological changes; and |
| � | other risks and uncertainties detailed under �Competition� and �Supervision and Regulation� in Part I, Item�1, �Risk Factors� in Part I, Item�1A and elsewhere throughout this report. |
Table of Contents Part I | Item�1. | Business. |
| � | Amended and Restated Certificate of Incorporation; |
| � | Amended and Restated Bylaws; |
| � | Charters for its Audit Committee; Internal Audit Subcommittee; Compensation, Management Development and Succession Committee; Nominating and Governance Committee; and Risk Committee; |
Table of Contents| � | Corporate Governance Policies; |
| � | Policy Regarding Communication with the Board of Directors; |
| � | Policy Regarding Director Candidates Recommended by Shareholders; |
| � | Policy Regarding Corporate Political Contributions; |
| � | Policy Regarding Shareholder Rights Plan; |
| � | Code of Ethics and Business Conduct; |
| � | Code of Conduct; and |
| � | Integrity Hotline information. |
Table of Contents Investment Banking and Corporate Lending Activities. Capital Raising. The Company manages
and participates in public offerings and private placements of debt, equity and other securities worldwide. The Company is a leading underwriter of common stock, preferred stock and other equity-related securities, including convertible securities
and American Depositary Receipts (�ADRs�). The Company is also a leading underwriter of fixed income securities, including investment grade debt, non-investment grade instruments, mortgage-related and other asset-backed securities,
tax-exempt securities and commercial paper and other short-term securities. Financial Advisory Services. The Company provides corporate and other institutional clients globally with advisory services on key strategic matters, such as mergers
and acquisitions, divestitures, joint ventures, corporate restructurings, recapitalizations, spin-offs, exchange offers and leveraged buyouts and takeover defenses as well as shareholder relations. The Company also provides advice concerning rights
offerings, dividend policy, valuations, foreign exchange exposure, financial risk management strategies and financial planning. In addition, the Company furnishes advice and services regarding project financings and provides advisory services in
connection with the purchase, sale, leasing and financing of real estate. Corporate Lending. The Company provides loans or lending commitments, including bridge financing, to selected corporate clients through its subsidiaries, including
Morgan Stanley Bank, N.A (�MSBNA�). These loans and commitments have varying terms, may be senior or subordinated and/or secured or unsecured, are generally contingent upon representations, warranties and contractual conditions applicable
to the borrower, and may be syndicated, hedged or traded by the Company*. The borrowers may be rated investment grade or non-investment grade. Sales and Trading Activities. The Company conducts sales, trading, financing and market-making activities on securities and futures exchanges and in over-the-counter (�OTC�)
markets around the world. The Company�s Institutional Securities sales and trading activities include Equity Trading; Interest Rates, Credit and Currencies; Commodities; Clients and Services; and Investments. Equity Trading. The Company acts as
principal (including as a market-maker) and agent in executing transactions globally in equity and equity-related products, including common stock, ADRs, global depositary receipts and exchange-traded funds. The Company�s equity derivatives sales, trading and market-making
activities cover equity-related products globally, including equity swaps, options, warrants and futures overlying individual securities, indices and baskets of securities and other equity-related products. The Company also issues and makes a
principal market in equity-linked products to institutional and individual investors. Interest Rates, Credit and Currencies. The Company trades, invests and makes markets in fixed income securities and related products globally, including, among other
products, investment and non-investment grade corporate debt, distressed debt, bank loans, U.S. and other sovereign securities, emerging market bonds and loans, convertible bonds, collateralized debt obligations, credit, currency, interest rate and
other fixed income-linked notes, securities issued by structured investment vehicles, mortgage-related and other asset-backed securities and real estate-loan products, municipal securities, preferred stock and commercial paper, money-market and
other short-term securities. The Company is a primary dealer of U.S. federal government securities and a member of the selling groups that distribute various U.S. agency and other debt securities. The Company is also a primary dealer or market-maker
of government securities in numerous European, Asian and emerging market countries. The Company trades, invests and makes markets globally in listed futures and OTC swaps, forwards, options and other derivatives referencing, among other things, interest rates, currencies, investment
grade and non-investment grade corporate credits, loans, bonds, U.S. and other sovereign securities, emerging market bonds and loans, | * | Revenues and expenses associated with the trading of syndicated loans are included in �Sales and Trading Activities.� |
Table of Contents credit indexes, asset-backed security indexes, property indexes, mortgage-related and other asset-backed securities and real estate loan products. The Company trades, invests and makes markets in major foreign currencies,
such as the British pound, Canadian dollar, euro, Japanese yen and Swiss franc, as well as in emerging markets currencies. The Company trades these currencies on a principal basis in the spot, forward, option and futures markets. Through the use of repurchase and reverse repurchase agreements, the Company
acts as an intermediary between borrowers and lenders of short-term funds and provides funding for various inventory positions. The Company also provides financing to customers for commercial and residential real estate loan products and other
securitizable asset classes. In addition, the Company engages in principal securities lending with clients, institutional lenders and other broker-dealers. The Company advises on investment and liability strategies and assists corporations in their debt repurchases and tax planning. The Company structures
debt securities, derivatives and other instruments with risk/return factors designed to suit client objectives, including using repackaged asset and other structured vehicles through which clients can restructure asset portfolios to provide
liquidity or reconfigure risk profiles. Commodities. The Company invests and makes markets in the spot, forward, physical derivatives and futures markets in
several commodities, including metals (base and precious), agricultural products, crude oil, oil products, natural gas, electric power, emission credits, coal, freight, liquefied natural gas and related products and indices. The Company is a
market-maker in exchange-traded options and futures and OTC options and swaps on commodities, and offers counterparties hedging programs relating to production, consumption, reserve/inventory management and structured transactions, including
energy-contract securitizations and monetization. The Company is an electricity power marketer in the U.S. and owns electricity-generating facilities in the U.S. and Europe. The Company owns TransMontaigne Inc. and its subsidiaries, a group of
companies operating in the refined petroleum products marketing and distribution business, and owns a minority interest in Heidmar Holdings LLC, which owns a group of companies that provide international marine transportation and U.S. marine
logistics services. Clients and
Services. The Company provides financing services, including prime brokerage, which offers, among other services, consolidated clearance, settlement, custody, financing and portfolio reporting services to clients
trading multiple asset classes. In addition, the Company�s institutional distribution and sales activities are overseen and coordinated through Clients and Services. Investments. The Company from time to
time makes investments that represent business facilitation or other investing activities. Such investments are typically strategic investments undertaken by the Company to facilitate core business activities. From time to time, the Company may also
make investments and capital commitments to public and private companies, funds and other entities. The Company sponsors and manages investment vehicles and separate accounts for clients seeking exposure to private equity, infrastructure, mezzanine lending and real estate-related and other alternative
investments. The Company may also invest in and provide capital to such investment vehicles. See also �Asset Management� herein. Operations and Information Technology. The Company�s Operations and Information Technology departments provide the process and technology platform that supports Institutional Securities
sales and trading activity, including post-execution trade processing and related internal controls over activity from trade entry through settlement and custody, such as asset servicing. This is done for transactions in listed and OTC transactions
in commodities, equity and fixed 4 Table of Contents income securities, including both primary and secondary trading, as well as listed, OTC and structured derivatives in markets around the world. This activity is undertaken through the
Company�s own facilities, through membership in various clearing and settlement organizations, and through agreements with unaffiliated third parties. Global Wealth Management Group. The Company�s Global Wealth Management Group, which includes the Company�s 51% interest in MSSB, provides comprehensive financial services to
clients through a network of more than 18,000 global representatives in approximately 850 locations at year-end. As of December�31, 2010, the Company�s Global Wealth Management Group had $1,669 billion in client assets. Clients. Global Wealth Management Group professionals serve individual investors and small-to-medium sized businesses and institutions
with an emphasis on ultra high net worth, high net worth and affluent investors. Global representatives are located in branches across the U.S. and provide solutions designed to accommodate individual investment objectives, risk tolerance and
liquidity needs. Call centers are available to meet the needs of emerging affluent clients. Outside the U.S., Global Wealth Management Group offers financial services to clients in Europe, the Middle East, Asia, Australia and Latin America. Products and Services. The Company�s Global Wealth Management Group provides clients with a
comprehensive array of financial solutions, including products and services from the Company, Citigroup Inc. (�Citi�) and third-party providers, such as insurance companies and mutual fund families. Global Wealth Management Group provides
brokerage and investment advisory services covering various types of investments, including equities, options, futures, foreign currencies, precious metals, fixed income securities, mutual funds, structured products, alternative investments, unit
investment trusts, managed futures, separately managed accounts and mutual fund asset allocation programs. Global Wealth Management Group also engages in fixed income principal trading, which primarily facilitates clients� trading or
investments in such securities. In addition, Global Wealth Management Group offers education savings programs, financial and wealth planning services, and annuity and other insurance products. In addition, Global Wealth Management Group offers its clients access to several cash management services through various
affiliates, including deposits, debit cards, electronic bill payments and check writing, as well as lending products, including securities based lending, mortgage loans and home equity lines of credit. Global Wealth Management Group also provides
trust and fiduciary services, offers access to cash management and commercial credit solutions to qualified small- and medium-sized businesses in the U.S., and provides individual and corporate retirement solutions, including individual retirement
accounts and 401(k) plans and U.S. and global stock plan services to corporate executives and businesses. Global Wealth Management Group provides clients a variety of ways to establish a relationship and conduct business, including brokerage accounts with transaction-based pricing and investment advisory
accounts with asset-based fee pricing. Operations and
Information Technology. As a result of MSSB, most of the
operations and technology supporting the Global Wealth Management Group are provided either by the Company�s Operations and Information Technology departments or by Citi. Pursuant to contractual agreements, the Company and Citi perform various
broker-dealer related functions, such as execution and clearing of brokerage transactions, margin lending and custody of client assets. For the Company, 5 Table of Contents these activities are undertaken through its own facilities, through memberships in various clearing and settlement organizations, and through agreements with unaffiliated third parties. The
Company and Citi provide certain other services and systems to support the Global Wealth Management Group through transition services agreements with MSSB. Asset Management. The Company�s Asset Management business segment is one of the largest global investment management organizations of any full-service financial
services firm and offers clients a diverse array of equity, fixed income and alternative investments and merchant banking strategies. Portfolio managers located in the U.S., Europe and Asia manage investment products ranging from money market funds
to equity and fixed income strategies, alternative investment and merchant banking products in developed and emerging markets across geographies and market cap ranges. The Company offers a range of alternative investment, real estate investing
and merchant banking products for institutional investors and high net worth individuals. The Company�s alternative investments platform includes hedge funds, funds of hedge funds, funds of private equity funds and portable alpha strategies.
The Company�s alternative investments platform also includes minority stakes in Lansdowne Partners, Avenue Capital Group and Traxis Partners LP. The Company�s real estate and merchant banking businesses include its real estate investing
business, private equity funds, corporate mezzanine debt investing group and infrastructure investing group. The Company typically acts as general partner of, and investment adviser to, its alternative investment, real estate and merchant banking
funds and typically commits to invest a minority of the capital of such funds with subscribing investors contributing the majority. On June�1, 2010, as part of a restructuring of the Company�s Asset Management business segment, the Company sold substantially all of its retail
asset management business, including Van Kampen Investments, Inc., to Invesco Ltd. This transaction allows the Company�s Asset Management business segment to focus on its institutional and intermediary client base. Institutional Investors. The Company provides investment management strategies and products to
institutional investors worldwide, including corporations, pension plans, endowments, foundations, sovereign wealth funds, insurance companies and banks through a broad range of pooled vehicles and separate accounts. Additionally, the Company
provides sub-advisory services to various unaffiliated financial institutions and intermediaries. A Global Sales and Client Service team is engaged in business development and relationship management for consultants to help serve institutional
clients. Intermediary Clients and Individual Investors. The Company offers open-end and alternative investment funds
and separately managed accounts to individual investors through affiliated and unaffiliated broker-dealers, banks, insurance companies, financial planners and other intermediaries. Closed-end funds managed by the Company are available to individual
investors through affiliated and unaffiliated broker-dealers. The Company also distributes mutual funds through numerous retirement plan platforms. Internationally, the Company distributes traditional investment products to individuals outside the
U.S. through non-proprietary distributors and distributes alternative investment products through affiliated broker-dealers and banks. Operations and Information Technology. The Company�s Operations and Information Technology departments provide or oversee the process and technology platform required to support its asset
management business. Support activities include transfer agency, mutual fund accounting and administration, transaction processing and certain fiduciary services on 6 Table of Contents behalf of institutional, intermediary and high net worth clients. These activities are undertaken through the Company�s own facilities, through membership in various clearing and settlement
organizations, and through agreements with unaffiliated third parties. Research. The Company�s research department (�Research�) coordinates globally across all of the Company�s businesses. Research consists of economists, strategists and industry analysts who
engage in equity and fixed income research activities and produce reports and studies on the U.S. and global economy, financial markets, portfolio strategy, technical market analyses, individual companies and industry developments. Research examines
worldwide trends covering numerous industries and individual companies, the majority of which are located outside the U.S.; provides analysis and forecasts relating to economic and monetary developments that affect matters such as interest rates,
foreign currencies, securities, derivatives and economic trends; and provides analytical support and publishes reports on asset-backed securities and the markets in which such securities are traded and data are disseminated to investors through
third-party distributors, proprietary internet sites such as Client Link and the Company�s sales forces. Competition. All aspects of the Company�s businesses are highly competitive, and the Company expects them to remain so. The Company competes in the U.S. and globally for clients, market share and human talent in
all aspects of its business segments. The Company�s competitive position depends on its reputation and the quality and consistency of its long-term investment performance. The Company�s ability to sustain or improve its competitive
position also depends substantially on its ability to continue to attract and retain highly qualified employees while managing compensation and other costs. The Company competes with commercial banks, brokerage firms, insurance companies, sponsors
of mutual funds, hedge funds, energy companies and other companies offering financial services in the U.S., globally and through the internet. Over time, certain sectors of the financial services industry have become more concentrated, as
institutions involved in a broad range of financial services have been acquired by or merged into other firms or have declared bankruptcy. Such changes could result in the Company�s remaining competitors gaining greater capital and other
resources, such as the ability to offer a broader range of products and services and geographic diversity. See also �Supervision and Regulation� and �Risk Factors� herein. Institutional Securities and Global Wealth Management Group. The Company�s competitive position depends on innovation, execution capability and relative pricing. The Company competes
directly in the U.S. and globally with other securities and financial services firms and broker-dealers and with others on a regional or product basis. The Company�s ability to access capital at competitive rates (which is generally dependent on the Company�s credit ratings) and to commit
capital efficiently, particularly in its capital-intensive underwriting and sales, trading, financing and market-making activities, also affects its competitive position. Corporate clients may request that the Company provide loans or lending
commitments in connection with certain investment banking activities, and such requests are expected to increase in the future. It is possible that competition may become even more intense as the Company continues to compete with financial institutions that may be larger, or better
capitalized, or may have a stronger local presence and longer operating history in certain areas. Many of these firms have greater capital than the Company and have the ability to offer a wide range of products and services that may enhance their
competitive position and could result in pricing pressure in our businesses. The complementary trends in the financial services industry of consolidation and globalization present, among other things, technological, risk management, regulatory and
other infrastructure challenges that require effective resource allocation in order for the Company to remain competitive. 7 Table of Contents The Company has experienced intense price competition in some of its businesses in recent years. In
particular, the ability to execute securities trades electronically on exchanges and through other automated trading markets has increased the pressure on trading commissions. The trend toward direct access to automated, electronic markets will
likely continue. It is possible that the Company will experience competitive pressures in these and other areas in the future as some of its competitors may seek to obtain market share by reducing prices. Asset Management. Competition in the asset management industry is affected by several factors,
including the Company�s reputation, investment objectives, quality of investment professionals, performance of investment strategies or product offerings relative to peers and an appropriate benchmark index, advertising and sales promotion
efforts, fee levels, the effectiveness of and access to distribution channels and investment pipelines, and the types and quality of products offered. The Company�s alternative investment products, such as private equity funds, real estate and
hedge funds, compete with similar products offered by both alternative and traditional asset managers. Supervision and Regulation. As a major financial services firm, the Company is subject to extensive regulation by U.S. federal and state regulatory agencies and securities exchanges and by regulators and exchanges in each of the
major markets where it operates.�Moreover, in response to the financial crisis, legislators and regulators, both in the U.S. and around the world, are in the process of adopting and implementing a wide range of reforms that will result in major
changes to the way the Company is regulated and conducts its business. It will take some time for the comprehensive effects of these reforms to emerge and be understood. Regulatory Outlook. On July�21, 2010, President Obama signed the Dodd-Frank Act into law.
While certain portions of the Dodd-Frank Act were effective immediately, other portions will be effective only following extended transition periods. At this time, it is difficult to assess fully the impact that the Dodd-Frank Act will have on the
Company and on the financial services industry generally. Implementation of the Dodd-Frank Act will be accomplished through numerous rulemakings by multiple governmental agencies. The Dodd-Frank Act also mandates the preparation of studies on a wide
range of issues, which could lead to additional legislation or regulatory changes. In addition, legislative and regulatory initiatives continue outside the U.S. which may also affect the Company�s business and operations. For example, the Basel Committee on Banking Supervision (the
�Basel Committee�) has issued new capital, leverage and liquidity standards, known as �Basel III,� which U.S. banking regulators are expected to introduce in the U.S. The Financial Stability Board and the Basel Committee are also
developing standards designed to apply to systemically important financial institutions, such as the Company. In addition, initiatives are under way in the European Union and Japan, among other jurisdictions, that would require centralized clearing,
reporting and recordkeeping with respect to various kinds of financial transactions and other regulatory requirements that are in some cases similar to those required under the Dodd-Frank Act. It is likely that the year 2011 and subsequent years will see further material changes in the way major financial institutions
are regulated in both the U.S. and other markets in which the Company operates, though it is difficult to predict which further reform initiatives will become law, how such reforms will be implemented or the exact impact they will have on the
Company�s business, financial condition, results of operations and cash flows for a particular future period. Financial Holding Company. The Company has operated as a bank holding company and financial holding company under the BHC Act since September 2008. Effective July�22, 2010, as a bank holding company with $50 billion or more in
consolidated assets, the Company became subject to the new systemic risk regime established by the Dodd-Frank Act. It is not yet clear how the regulators will apply the heightened prudential standards on systemically important firms such as the
Company. 8 Table of Contents Consolidated Supervision. On the bank holding company level, the Company is subject to the comprehensive consolidated supervision, regulation and
examination by the Federal Reserve. As a result of the Dodd-Frank Act, the Federal Reserve also gains heightened authority to examine, prescribe regulations and take action with respect to all of the Company�s subsidiaries. In addition, a new
consumer protection agency, the Bureau of Consumer Financial Protection, will have exclusive rulemaking and primary enforcement and examination authority over the Company and its subsidiaries with respect to federal consumer financial laws to the
extent applicable. Because the Company is subject to the systemic
risk regime, it is now also subject to the expanded systemic risk powers of the Federal Reserve, including the Federal Reserve�s rulemaking in the area of heightened prudential standards and other requirements under the systemic risk regime. A
new systemic risk oversight body, the Financial Stability Oversight Council (the �Council�), can recommend prudential standards, reporting and disclosure requirements to the Federal Reserve with applicability to financial institutions such
as the Company, and must approve any finding by the Federal Reserve that a systemically important financial institution poses a grave threat to financial stability and must undertake mitigating actions. The Council is also empowered to designate
systemically important payment, clearing and settlement activities of financial institutions, subjecting them to prudential supervision and regulation, and, assisted by the new Office of Financial Research within the U.S. Department of the Treasury
(�U.S. Treasury�) (established by the Dodd-Frank Act), can gather data and reports from financial institutions, including the Company. See also ��Systemic Risk Regime� below. Scope of Permitted Activities. As a
financial holding company, Morgan Stanley is currently able to engage in any activity that is financial in nature or incidental to a financial activity, as defined in accordance with the BHC Act. Unless otherwise required by the Federal Reserve, the
Company is permitted to begin any new financial activity, and generally may acquire any company engaged in any financial activity, as long as it provides after�the�fact notice of such new activity or investment to the Federal Reserve. The Company is, however, subject to prior notice or approval
requirements of the Federal Reserve in respect of certain types of transactions, including for the acquisition of more than 5% of any class of voting stock of a U.S. depository institution or depository institution holding company, and, since July
2010, also for certain acquisitions of non-bank financial companies with $10 billion or more in total consolidated assets. The Company�s ability, as a financial holding company, to engage in certain merger transactions could also be impacted by
approval requirements on a potentially broader set of transactions that will take effect in July 2011, by a new financial stability factor the Federal Reserve must consider in approving certain transactions, and by concentration limits, to be
implemented by October 2011, limiting mergers and acquisitions resulting in control of more than 10% of all consolidated financial liabilities in the U.S. The Dodd-Frank Act will also place heightened requirements on the Company�s ability to
acquire control of a bank. The BHC Act gave the Company two years
after becoming a financial holding company to conform its existing non-financial activities and investments to the requirements of the BHC Act, with the possibility of three one-year extensions for a total grace period of up to five years. The
Company has requested and obtained an extension in order to conform a limited set of activities and make certain divestments. The BHC Act also grandfathers any �activities related to the trading, sale or investment in commodities and underlying
physical properties,� provided that the Company was engaged in �any of such activities as of September�30, 1997 in the United States� and provided that certain other conditions that are within the Company�s reasonable
control are satisfied. If the Federal Reserve were to determine that any of the Company�s commodities activities did not qualify for the BHC Act grandfather exemption, then the Company would likely be required to divest any such activities that
did not otherwise conform to the BHC Act by the end of any extensions of the grace period. The Company does not believe that any such required divestment would have a material adverse impact on its results of operations, cash flows or financial
condition. In order to maintain its status as a financial holding
company, Morgan Stanley must satisfy certain requirements, including the requirement that its depository institution subsidiaries remain well capitalized and well managed. | 9 | |
| | 10 |
Table of Contents subsidiaries, to implement Basel II standards over the next several years. The timeline set out in December 2007 for the implementation of Basel II in the U.S. may be impacted by the developments
concerning Basel III described below. Starting July 2010, the Company has been reporting on a parallel basis under the current regulatory capital regime (Basel I) and Basel II, which, as currently scheduled, will be followed by a three-year
transitional period. In addition, under a provision of the Dodd-Frank Act, capital standards generally applicable to U.S. banks will serve to establish minimum Tier 1 and total capital requirements more broadly, including for bank holding companies
such as the Company that otherwise apply different capital standards set by the Federal Reserve. In effect, those generally applicable capital standards, which are currently based on Basel I standards but may themselves change over time, would serve
as a permanent floor to minimum capital requirements calculated under the Basel II standard the Company is currently required to implement, as well as future capital standards. Basel III contains new standards that will raise the quality of capital
banking institutions must hold, strengthen the risk-weighted asset base and introduce a leverage ratio as a supplemental measure to the risk-based capital ratios. Basel III includes a new capital conservation buffer, which imposes a common equity
requirement above the new minimum that can be depleted under stress, subject to restrictions on capital distributions, and a new countercyclical buffer, which regulators can activate during periods of excessive credit growth in their jurisdiction.
The use of certain capital instruments, such as trust preferred securities, as Tier 1 capital components will be phased out. Basel III also introduces new liquidity measures designed to monitor banking institutions for their ability to meet
short-term cash flow needs and to address longer-term structural liquidity mismatches. National implementation of Basel III risk-based capital requirements, including by U.S. regulators, will begin in 2013, and many of the requirements will be subject to extended phase-in periods. Once
fully implemented, the capital requirements would include a new minimum Tier 1 common equity ratio of 4.5%, a minimum Tier 1 equity ratio of 6%, and the minimum total capital ratio which would remain at 8.0% (plus a 2.5% capital conservation buffer
consisting of common equity in addition to these ratios). Despite extended phase-in periods, the Company expects some of the new capital requirements to become relevant sooner. For example, on November�17, 2010, the Federal Reserve announced
that it will require large U.S. bank holding companies to submit capital plans that show, among other things, the ability to meet Basel III capital requirements over time, and the Company submitted its capital plan to the Federal Reserve on
January�7, 2011 in response to such requirements. The Federal Reserve will evaluate capital plans that include a request to increase common stock dividends, implement stock repurchase programs, or redeem or repurchase capital instruments. Concurrently with implementing regulations concerning Basel III,
U.S. banking regulators will implement provisions of the Dodd-Frank Act with effect on capital and related requirements, including heightened capital and liquidity requirements for financial institutions subject to the systemic risk regime,
including the Company, as well as a mandate to make capital requirements countercyclical, and for capital requirements to address risks posed by certain activities. Pursuant to a provision of the Dodd-Frank Act, over time, trust preferred securities
will no longer qualify as Tier 1 capital but will qualify only as Tier 2 capital. This change in regulatory capital treatment will be phased in incrementally during a transition period that will start on January�1, 2013 and end on
January�1, 2016. This provision of the Dodd-Frank Act is expected to accelerate the phase-in of disqualification of trust preferred securities provided for by Basel III. Bank holding companies are also subject to a Tier 1 leverage ratio as defined
by the Federal Reserve. Under Federal Reserve rules, the minimum leverage ratio is 3% for bank holding companies, including the Company, that are considered �strong� under Federal Reserve guidelines or which have implemented the Federal
Reserve�s risk-based capital measure for market risk. Basel III introduces internationally a leverage ratio that could result in more stringent capital requirements than the current minimum U.S. leverage ratio. Bank holding companies such as
the Company, over a period of time will also be required to satisfy, at a minimum, the leverage capital requirements currently in effect for U.S. banks, which will thereafter serve as an effective floor. Financial institutions subject to the
systemic risk regime under the Dodd-Frank Act, including the Company, will also be required to meet as yet unspecified heightened prudential standards, including possibly higher leverage capital requirements. 12 Table of Contents See also �Management�s Discussion and Analysis of Financial Condition and Results of
Operation�Liquidity and Capital Resources�Regulatory Requirements� in Part II, Item�7 herein. Orderly Liquidation Authority. Under the Dodd-Frank Act, financial companies, including bank holding companies such as Morgan Stanley and certain covered subsidiaries,
can be subjected to a new orderly liquidation authority. The U.S. Treasury must first make certain extraordinary financial distress and systemic risk determinations. Absent such U.S. Treasury determinations, Morgan Stanley as a bank holding company
would remain subject to the U.S. Bankruptcy Code. The orderly
liquidation authority went into effect in July 2010, but rulemaking is required to render it fully operative. If the Company were subjected to the orderly liquidation authority, the FDIC would be appointed receiver, which would give the FDIC
considerable rights and powers that it must exercise with the goal of liquidating and winding up the Company, including (i)�the FDIC�s right to assign assets and liabilities and transfer some to a third party or bridge financial company
without the need for creditor consent or prior court review; (ii)�the ability of the FDIC to differentiate among creditors in exercising its cherry-picking powers, including by treating junior creditors better than senior creditors, subject to
a minimum recovery right to receive at least what they would have received in bankruptcy liquidation; and (iii)�the broad powers given the FDIC to administer the claims process to determine which creditor receives what, and in which order, from
assets not transferred to a third party or bridge financial institution. The FDIC can provide a broad range of financial assistance for the resolution process, and, if it does so, it must ensure that unsecured creditors bear losses up to the amount they would have suffered in
liquidation (or as otherwise determined by the FDIC), and that management or board members of the financial company responsible for the failed condition are removed. Amounts owed to the U.S. are generally given priority over claims of general
creditors. In addition, to the extent the FDIC funds the liquidation of a financial company with borrowings from the U.S. Treasury, it is authorized to assess claimants that receive benefits in excess of their claims in a bankruptcy liquidation, as
well as systemically important or other large financial institutions, to repay such borrowings. A number of creditor rights in the orderly liquidation authority have been modeled after the Bankruptcy Code, and the FDIC must promulgate implementing regulation in a manner that further reduces the gap
in treatment between the two regimes and increases legal certainty. However, the orderly resolution authority is untested and differs in material respects from the Bankruptcy Code, including in the broad powers granted to the FDIC as receiver. As a
result, the Company cannot exclude the possibility that shareholders, creditors and other counterparties of the Company and similarly situated financial companies will reassess the credit risk posed by the possibility that the Company could be
subjected to the orderly liquidation authority, and could seek to be compensated for any perceived risk of greater credit losses in such event. In addition to the orderly liquidation authority, the Dodd-Frank Act also eliminates some of the regulatory authorities used in the recent financial
crisis to intervene and support individual financial institutions. As a result of these developments, credit rating agencies have announced that they would review financial institutions� ratings to potentially adjust the previously assumed
level of government support as a factor in their ratings. These developments may have potential negative implications for such institutions� ratings to the extent the credit rating agencies� assessment of the impact of systemic risk
regulation on the assumed level of government support negatively influences the Company�s credit ratings, that in turn could negatively impact the Company�s funding costs. See also �Management�s Discussion and Analysis of
Financial Condition and Results of Operation�Liquidity and Capital Resources�Credit Ratings� in Part II, Item�7 herein. Dividends. In addition to certain dividend restrictions that apply by law to certain of the Company�s
subsidiaries, as described below, the OCC, the Federal Reserve and the FDIC have authority to prohibit or to limit the payment of dividends by the banking organizations they supervise, including the Company, MSBNA and other depository institution
subsidiaries of the Company, if, in the banking regulator�s opinion, payment of a dividend would constitute an unsafe or unsound practice in light of the financial condition of the banking 13 Table of Contents organization. It is Federal Reserve policy that bank holding companies should generally pay dividends on common stock only out of income available from the past year, and only if prospective
earnings retention is consistent with the organization�s expected future needs and financial condition. It is also Federal Reserve policy that bank holding companies should not maintain dividend levels that undermine the company�s ability
to be a source of strength to its banking subsidiaries. Under the Dodd-Frank Act, all companies that own or control an insured depository institution will be required to serve as a source of strength to such institution; i.e. , be able to
provide financial assistance to such institution when it experiences financial distress. Implementing regulations must be issued by July 2012. Like the Federal Reserve policy currently in place, as well as periodic stress tests, the new statutory
source of strength requirement could influence the Company�s ability to pay dividends, or require it to provide capital assistance to MSBNA or Morgan Stanley Private Bank, National Association (�MS Private Bank�) (formerly Morgan
Stanley Trust FSB) under circumstances under which the Company would not otherwise decide to do so. See also ��Capital Standards� above. U.S. Bank Subsidiaries. U.S. Banking Institutions. MSBNA, primarily a wholesale commercial bank, offers consumer lending and commercial lending services in addition to deposit products. As an
FDIC-insured national bank, MSBNA is subject to supervision, regulation and examination by the OCC. MS Private Bank conducts certain mortgage lending activities primarily for customers of its affiliate retail broker Morgan Stanley Smith Barney LLC (�MSSB LLC�). MS Private Bank also offers
certain deposit products. It changed its charter to a national association on July�1, 2010, and is an FDIC-insured national bank whose activities are subject to supervision, regulation and examination by the OCC. Morgan Stanley Trust National Association is a non-depository national bank
whose activities are limited to fiduciary and custody activities, primarily personal trust and prime brokerage custody services. It is subject to supervision, regulation and examination by the OCC. Morgan Stanley Trust National Association is not
FDIC-insured. Prompt Corrective
Action. The Federal Deposit Insurance Corporation Improvement Act of 1991 provides a framework for regulation of depository institutions and their affiliates, including parent holding companies, by their federal
banking regulators. Among other things, it requires the relevant federal banking regulator to take �prompt corrective action� with respect to a depository institution if that institution does not meet certain capital adequacy standards.
Current regulations generally apply only to insured banks and thrifts such as MSBNA or MS Private Bank and not to their parent holding companies, such as Morgan Stanley. The Federal Reserve is, however, subject to limitations, authorized to take
appropriate action at the holding company level. In addition, under the systemic risk regime, the Company will become subject to an early remediation protocol in the event of financial distress. The Dodd-Frank Act also calls for a study on the
effectiveness of, and improvements to, the prompt corrective action regime, which may in the future result in substantial revisions to the prompt corrective action framework. Transactions with Affiliates. The
Company�s U.S. subsidiary banks are subject to Sections 23A and 23B of the Federal Reserve Act, which impose restrictions on any extensions of credit to, purchase of assets from, and certain other transactions with, any affiliates. These
restrictions include limits on the total amount of credit exposure that they may have to any one affiliate and to all affiliates, as well as collateral requirements, and they require all such transactions to be made on market terms. Under the
Dodd-Frank Act, the affiliate transaction limits will be substantially broadened. Implementing rulemaking is called for by July 2012. At that time, the Company�s U.S. banking subsidiaries will also become subject to more onerous lending limits.
Both reforms will place limits on the Company�s U.S. banking subsidiaries� ability to engage in derivatives, repurchase agreements and securities lending transactions with other affiliates of the Company. 14 Table of Contents FDIC Regulation. An FDIC�insured depository institution is
generally liable for any loss incurred or expected to be incurred by the FDIC in connection with the failure of an insured depository institution under common control by the same bank holding company. As FDIC-insured depository institutions, MSBNA
and MS Private Bank are exposed to each other�s losses. In addition, both institutions are exposed to changes in the cost of FDIC insurance. In 2010, the FDIC adopted a restoration plan to replenish the reserve fund over a multi-year period.
Under the Dodd-Frank Act, some of the restoration must be paid for exclusively by large depository institutions, including MSBNA, and assessments are calculated using a new methodology that generally favors banks that are mostly funded by deposits. Institutional Securities and Global Wealth Management Group. Broker-Dealer
Regulation. The Company�s primary U.S. broker-dealer subsidiaries, MS&Co. and MSSB LLC, are registered broker-dealers with the SEC and in all 50 states, the District of Columbia, Puerto Rico and the U.S.
Virgin Islands, and are members of various self-regulatory organizations, including the Financial Industry Regulatory Authority, Inc. (�FINRA�), and various securities exchanges and clearing organizations. In addition, MS&Co. and MSSB
LLC are registered investment advisers with the SEC. Broker-dealers are subject to laws and regulations covering all aspects of the securities business, including sales and trading practices, securities offerings, publication of research reports,
use of customers� funds and securities, capital structure, recordkeeping and retention, and the conduct of their directors, officers, representatives and other associated persons. Broker-dealers are also regulated by securities administrators
in those states where they do business. Violations of the laws and regulations governing a broker-dealer�s actions could result in censures, fines, the issuance of cease-and-desist orders, revocation of licenses or registrations, the suspension
or expulsion from the securities industry of such broker-dealer or its officers or employees, or other similar consequences by both federal and state securities administrators. The Dodd-Frank Act includes various provisions that affect the regulation of
broker-dealer sales practices and customer relationships. For example, the Dodd-Frank Act provides the SEC authority (which the SEC has not yet exercised) to adopt a fiduciary duty applicable to broker-dealers when providing personalized investment
advice to retail customers and creates a new category of regulation for �municipal advisors,� which are subject to a fiduciary duty with respect to certain activities. In addition, the U.S. Department of Labor has proposed revisions to the
regulations under the Employee Retirement Income Security Act of 1974 (�ERISA�) that, if adopted, would potentially broaden the category of conduct that could be regarded as �investment advice� under ERISA and could subject
broker-dealers to ERISA�s fiduciary duty and prohibited transaction rules with respect to a wider range of interactions with their customers. These developments may impact the manner in which affected businesses are conducted, decrease
profitability and increase potential liabilities. The Dodd-Frank Act also provides the SEC authority (which the SEC also has not exercised) to prohibit or limit the use of mandatory arbitration pre-dispute agreements between a broker-dealer and its
customers. If the SEC exercises its authority under this provision, it may materially increase litigation costs. Margin lending by broker-dealers is regulated by the Federal Reserve�s restrictions on lending in connection with customer and proprietary purchases and short sales of securities, as well as
securities borrowing and lending activities. Broker-dealers are also subject to maintenance and other margin requirements imposed under FINRA and other self-regulatory organization rules. In many cases, the Company�s broker-dealer
subsidiaries� margin policies are more stringent than these rules. As registered U.S. broker-dealers, certain subsidiaries of the Company are subject to the SEC�s net capital rule and the net capital requirements of various exchanges, other regulatory authorities
and self-regulatory organizations. Many non-U.S. regulatory authorities and exchanges also have rules relating to capital and, in some cases, liquidity requirements that apply to the Company�s non-U.S. broker-dealer subsidiaries. These rules
are generally designed to measure general financial integrity and/or liquidity and require that at least a minimum amount of net and/or more liquid assets be maintained by the subsidiary. See also �Consolidated Supervision� and
�Capital Standards� above. Rules of FINRA and other self-regulatory organizations also impose limitations and requirements on the transfer of member organizations� assets. 15 Table of Contents Compliance with regulatory capital liquidity requirements may limit the Company�s operations requiring
the intensive use of capital. Such requirements restrict the Company�s ability to withdraw capital from its broker-dealer subsidiaries, which in turn may limit its ability to pay dividends, repay debt, or redeem or purchase shares of its own
outstanding stock. Any change in such rules or the imposition of new rules affecting the scope, coverage, calculation or amount of capital liquidity requirements, or a significant operating loss or any unusually large charge against capital, could
adversely affect the Company�s ability to pay dividends or to expand or maintain present business levels. In addition, such rules may require the Company to make substantial capital liquidity infusions into one or more of its broker-dealer
subsidiaries in order for such subsidiaries to comply with such rules. MS&Co. and MSSB LLC are members of the Securities Investor Protection Corporation (�SIPC�), which provides protection for customers of broker-dealers against losses in the event of the
insolvency of a broker-dealer. SIPC protects customers� eligible securities held by a member broker-dealer up to $500,000 per customer for all accounts in the same capacity subject to a limitation of $250,000 for claims for uninvested cash
balances. To supplement this SIPC coverage, each of MS&Co. and MSSB LLC have purchased additional protection for the benefit of their customers in the form of an annual policy issued by certain underwriters and various insurance companies that
provides protection for each eligible customer above SIPC limits subject to an aggregate firmwide cap of $1 billion with no per client sublimit for securities and a $1.9 million per client limit for the cash portion of any remaining shortfall. As
noted under �Systemic Risk Regime,� the Dodd-Frank Act contains special provisions for the orderly liquidation of covered broker-dealers (which could potentially include MS&Co. and/or MSSB LLC). While these provisions are generally
intended to provide customers of covered broker-dealers with protections at least as beneficial as they would enjoy in a broker-dealer liquidation proceeding under the Securities Investor Protection Act, the details and implementation of such
protections are subject to further rulemaking. In addition, as noted under �Systemic Risk Regime,� the orderly liquidation provisions of Dodd-Frank could affect the nature, priority and enforcement process for other creditor claims against
a covered broker-dealer, which could have an impact on the manner in which creditors and potential creditors extend credit to covered broker-dealers or the amount of credit that they extend. The SEC is also undertaking a review of a wide range of equity market structure issues. As a part of this review, the SEC has
proposed various rules regarding market transparency, and has adopted rules requiring broker-dealers to maintain risk management controls and supervisory procedures with respect to providing access to securities markets. In addition, in an effort to
prevent volatile trading, self-regulatory organizations have adopted trading pauses with respect to certain securities. It is possible that the SEC or self-regulatory organizations could propose or adopt additional market structure rules in the
future. Moreover, compliance is required with respect to a new short sale uptick rule as of February�28, 2011, which will limit the ability to sell short securities that have experienced specified price declines. The provisions, new rules and proposals discussed above could result in
increased costs and could otherwise adversely affect trading volumes and other conditions in the markets in which we operate. Regulation of Registered Futures Activities. As registered futures commission merchants, MS&Co. and MSSB LLC are
subject to net capital requirements of, and their activities are regulated by, the U.S. Commodity Futures Trading Commission (the �CFTC�) and various commodity futures exchanges. The Company�s futures and options-on-futures businesses
also are regulated by the National Futures Association (�NFA�), a registered futures association, of which MS&Co. and MSSB LLC and certain of their affiliates are members. These regulatory requirements differ for clearing and
non-clearing firms, and they address obligations related to, among other things, the registration of the futures commission merchant and certain of its associated persons, membership with the NFA, the segregation of customer funds and the holding
apart of a secured amount, the receipt of an acknowledgment of certain written risk disclosure statements, the receipt of trading authorizations, the furnishing of daily confirmations and monthly statements, recordkeeping and reporting obligations,
the supervision of accounts and antifraud prohibitions. Among other things, the NFA has rules covering a wide variety of areas such as advertising, telephone solicitations, risk disclosure, discretionary trading, disclosure of 16 Table of Contents fees, minimum capital requirements, reporting and proficiency testing. MS&Co. and MSSB LLC have affiliates that are registered as commodity trading advisers and/or commodity pool operators,
or are operating under certain exemptions from such registration pursuant to CFTC rules and other guidance. Under CFTC and NFA rules, commodity trading advisers who manage accounts must distribute disclosure documents and maintain specified records
relating to their activities, and clients and commodity pool operators have certain responsibilities with respect to each pool they operate. For each pool, a commodity pool operator must prepare and distribute a disclosure document; distribute
periodic account statements; prepare and distribute audited annual financial reports; and keep specified records concerning the participants, transactions and operations of each pool, as well as records regarding transactions of the commodity pool
operator and its principals. Violations of the rules of the CFTC, the NFA or the commodity exchanges could result in remedial actions, including fines, registration restrictions or terminations, trading prohibitions or revocations of commodity
exchange memberships. Derivatives
Regulation. Through the Dodd-Frank Act, the Company will face a comprehensive U.S. regulatory regime for its activities in certain over-the-counter derivatives. The regulation of �swaps� and
�security-based swaps� (collectively, �Swaps�) in the U.S. will be effected and implemented through CFTC, SEC and other agency regulations, which are required to be adopted by July 2011. The Dodd-Frank Act requires, with limited exceptions, central clearing of
certain types of Swaps and also mandates that trading of such Swaps, with limited exceptions, be done on regulated exchanges or execution facilities. As a result, market participants, including the Company�s entities engaging in Swaps, will
have to centrally clear and trade on an exchange or execution facility certain Swap transactions that are currently uncleared and executed bilaterally. Also, the Dodd-Frank Act requires the registration of �swap dealers� and �major
swap participants� with the CFTC and �security-based swap dealers� and �major security-based swap participants� with the SEC (collectively, �Swaps Entities�). Certain subsidiaries of the Company will likely be
required to register as a swap dealer and security-based swap dealer and it is possible some may register as a major swap participant and major security-based swap participant. Swap Entities will be subject to a comprehensive regulatory regime with
respect to the Swap activities for which they are registered. For example, Swaps Entities will be subject to a capital regime, a margin regime for uncleared Swaps and a segregation regime for collateral of counterparties to uncleared Swaps. Swaps
Entities also will be subject to business conduct and documentation standards with respect to their Swaps counterparties. Furthermore, Swaps Entities will be subject to significant operational and governance requirements, including reporting and
recordkeeping, maintenance of daily trading records, creation of audit trails, monitoring procedures, risk management, conflicts of interest and the requirement to have a chief compliance officer, among others. It is currently unclear to what extent
regulation of Swaps Entities might also bring certain activities of the affiliates of such a Swaps Entity under the oversight of the Swaps Entity�s regulator. The specific parameters of these Swaps Entities requirements are being
developed through CFTC, SEC and bank regulator rulemakings. Until such time as final rules are adopted, the extent of the regulation Morgan Stanley entities required to register will face remains unclear. It is likely, however, that, regardless of
the final rules adopted, the Company will face increased costs due to the registration and regulatory requirements listed above. Complying with the proposed regulation of Swaps Entities could require the Company to restructure its Swaps businesses,
require extensive systems changes, require personnel changes, and raise additional potential liabilities and regulatory oversight. Compliance with Swap-related regulatory capital requirements may require the Company to devote more capital to its
Swaps business. The Dodd-Frank Act requires reporting of Swap transactions, both to regulators and publicly, under rules and regulations currently being proposed by the CFTC and the SEC, and the extent of these reporting requirements will not be
clear until final rules are adopted. The Dodd-Frank Act also
requires certain entities receiving customer collateral for cleared Swaps to register with the CFTC as a futures commission merchant or with the SEC as a broker, dealer or security-based swap dealer, as appropriate to the type of activity, and to
follow certain segregation requirements for customer collateral. Futures 17 Table of Contents commission merchants and broker-dealers face their own comprehensive regulatory regimes administered by the CFTC and SEC, respectively. The Dodd-Frank Act also requires adoption of rules
regarding position limits, large trader reporting regimes, CFTC whistleblower protection, compensation requirements and anti-fraud and anti-manipulation requirements related to activities in Swaps. The European Union is in the process of establishing its own set of OTC
derivatives regulations, and has published a proposal known as the European Market Infrastructure Regulation. Aspects of the regulation, including the scope of derivatives covered, and mandatory clearing and reporting requirements, are likely to be
substantially similar to derivatives regulation under the Dodd-Frank Act. It is unclear at present how European and U.S. derivatives regulation will interact. Regulation of Certain Commodities Activities. The Company�s commodities activities are subject to extensive and
evolving energy, commodities, environmental, health and safety and other governmental laws and regulations in the U.S. and abroad. Intensified scrutiny of certain energy markets by U.S. federal, state and local authorities in the U.S. and abroad and
by the public has resulted in increased regulatory and legal enforcement and remedial proceedings involving energy companies, including those engaged in power generation and liquid hydrocarbons trading. Terminal facilities and other assets relating
to the Company�s commodities activities also are subject to environmental laws both in the U.S. and abroad. In addition, pipeline, transport and terminal operations are subject to state laws in connection with the cleanup of hazardous
substances that may have been released at properties currently or previously owned or operated by us or locations to which we have sent wastes for disposal. See also ��Scope of Permitted Activities� above. The Dodd-Frank Act provides the CFTC with additional authority to adopt
position limits with respect to certain futures or options on futures, and the CFTC has proposed to adopt such limits. New position limits may affect trading strategies and affect the profitability of various businesses and transactions. Non-U.S. Regulation. The Company�s
businesses also are regulated extensively by non-U.S. regulators, including governments, securities exchanges, commodity exchanges, self-regulatory organizations, central banks and regulatory bodies, especially in those jurisdictions in which the
Company maintains an office. Certain Morgan Stanley subsidiaries are regulated as broker-dealers under the laws of the jurisdictions in which they operate. Subsidiaries engaged in banking and trust activities outside the U.S. are regulated by
various government agencies in the particular jurisdiction where they are chartered, incorporated and/or conduct their business activity. For instance, the U.K. Financial Services Authority (�FSA�) and several U.K. securities and futures
exchanges, including the London Stock Exchange and Euronext.liffe, regulate the Company�s activities in the U.K.; the Deutsche B�rse AG and the Bundesanstalt f�r Finanzdienstleistungsaufsicht (the Federal Financial Supervisory
Authority) regulate its activities in the Federal Republic of Germany; Eidgen�ssische Finanzmarktaufsicht regulates its activities in Switzerland; the Financial Services Agency, the Bank of Japan, the Japanese Securities Dealers Association
and several Japanese securities and futures exchanges, including the Tokyo Stock Exchange, the Osaka Securities Exchange and the Tokyo International Financial Futures Exchange, regulate its activities in Japan; the Hong Kong Securities and Futures
Commission and the Hong Kong Exchanges and Clearing Limited regulate its operations in Hong Kong; and the Monetary Authority of Singapore and the Singapore Exchange Limited regulate its business in Singapore. Asset Management. Many of the subsidiaries engaged in the Company�s asset management
activities are registered as investment advisers with the SEC and, in certain states, some employees or representatives of subsidiaries are registered as investment adviser representatives. Many aspects of the Company�s asset management
activities are subject to federal and state laws and regulations primarily intended to benefit the investor or client. These laws and regulations generally grant supervisory agencies and bodies broad administrative powers, including the power to
limit or restrict the Company from carrying on its asset management activities in the event that it fails to comply with such laws and regulations. Sanctions that may be imposed for such failure include the suspension of 18 Table of Contents individual employees, limitations on the Company engaging in various asset management activities for specified periods of time or specified types of clients, the revocation of registrations,
other censures and significant fines. As a result of the passage of the Dodd-Frank Act, the Company�s asset management activities will be subject to certain additional laws and regulations, including, but not limited to, additional reporting
and recordkeeping requirements, restrictions on sponsoring or investing in, or maintaining certain other relationships with, hedge funds and private equity funds under the Volcker Rule (subject to certain limited exceptions) and certain rules and
regulations regarding trading activities, including trading in derivatives markets. Many of these new requirements may increase the expenses associated with the Company�s asset management activities and/or reduce the investment returns the
Company is able to generate for its asset management clients. Many important elements of the Dodd-Frank Act will not be known until rulemaking is finalized and certain final regulations are adopted. See also ��Activities Restrictions under
the Volcker Rule� and ��Derivatives Regulation� above. The Company�s Asset Management business is also regulated outside the U.S. For example, the FSA regulates the Company�s business in the U.K.; the Financial Services Agency regulates the
Company�s business in Japan; the Securities and Exchange Board of India regulates the Company�s business in India; and the Monetary Authority of Singapore regulates the Company�s business in Singapore. Anti-Money Laundering. The Company�s Anti-Money Laundering (�AML�) program is
coordinated on an enterprise-wide basis. In the U.S., for example, the Bank Secrecy Act, as amended by the USA PATRIOT Act of 2001 (the �BSA/USA PATRIOT Act�), imposes significant obligations on financial institutions to detect and deter
money laundering and terrorist financing activity, including requiring banks, bank holding company subsidiaries, broker-dealers, futures commission merchants, and mutual funds to verify the identity of customers that maintain accounts. The BSA/USA
PATRIOT Act also mandates that financial institutions have policies, procedures and internal processes in place to monitor and report suspicious activity to appropriate law enforcement or regulatory authorities. A financial institution subject to
the BSA/USA PATRIOT Act also must designate a BSA/AML compliance officer, provide employees with training on money laundering prevention, and undergo an annual, independent audit to assess the effectiveness of its AML program. Outside the U.S.,
applicable laws, rules and regulations similarly require designated types of financial institutions to implement AML programs. The Company has implemented policies, procedures and internal controls that are designed to comply with all applicable AML
laws and regulations. The Company has also implemented policies, procedures, and internal controls that are designed to comply with the regulations and economic sanctions programs administered by the U.S. Treasury�s Office of Foreign Assets
Control (�OFAC�), which enforces economic and trade sanctions against targeted foreign countries, entities and individuals based on external threats to the U.S. foreign policy, national security, or economy, by other governments, or by
global or regional multilateral organizations. Anti-Corruption. The Company is subject to the Foreign Corrupt Practices Act (�FCPA�), which prohibits offering, promising, giving, or authorizing others to give
anything of value, either directly or indirectly, to a non-U.S. government official in order to influence official action or otherwise gain an unfair business advantage, such as to obtain or retain business. The Company is also subject to applicable
anti-corruption laws in the jurisdictions in which it operates. The Company has implemented policies, procedures, and internal controls that are designed to comply with the FCPA and other applicable anti-corruption laws, rules, and regulations in
the jurisdictions in which it operates. Protection of Client
Information. Many aspects of the Company�s business are
subject to legal requirements concerning the use and protection of certain customer information, including those adopted pursuant to the Gramm-Leach-Bliley Act and the Fair and Accurate Credit Transactions Act of 2003 in the U.S., the European Union
(�EU�) Data Protection Directive in 19 Table of Contents the EU and various laws in Asia, including the Japanese Personal Information (Protection) Law, the Hong Kong Personal Data (Protection) Ordinance and the Australian Privacy Act. The Company has
adopted measures designed to comply with these and related applicable requirements in all relevant jurisdictions. Research. Both U.S. and non-U.S. regulators continue to focus on research conflicts of interest. Research-related regulations have been implemented in many
jurisdictions. New and revised requirements resulting from these regulations and the global research settlement with U.S. federal and state regulators (to which the Company is a party) have necessitated the development or enhancement of
corresponding policies and procedures. Compensation Practices
and Other Regulation. The Company�s compensation
practices are subject to oversight by the Federal Reserve. In June 2010, the Federal Reserve and other federal regulators issued final guidance applicable to all banking organizations, including those supervised by the Federal Reserve, promulgated
in accordance with compensation principles and standards for banks and other financial companies designed to encourage sound compensation practices established by the Financial Stability Board at the direction of the leaders of the Group of Twenty
Finance Ministers and Central Bank Governors. The guidance was designed to help ensure that incentive compensation paid by banking organizations does not encourage imprudent risk-taking that threatens the organizations� safety and soundness.
The scope and content of the Federal Reserve�s policies on executive compensation are continuing to develop, and the Company expects that these policies will evolve over a number of years. The Company is subject to the compensation-related provisions of the
Dodd-Frank Act, which may impact its compensation practices. Pursuant to the Dodd-Frank Act, among other things, federal regulators, including the Federal Reserve, must prescribe regulations to require covered financial institutions, including the
Company, to report the structures of all of their incentive-based compensation arrangements and prohibit incentive-based payment arrangements that encourage inappropriate risks by providing employees, directors or principal shareholders with
excessive compensation or that could lead to material financial loss to the covered financial institution. In February 2011, the FDIC was the first federal regulator to propose an interagency rule implementing this requirement. Further, the SEC must
direct listing exchanges to require companies to implement policies relating to disclosure of incentive-based compensation that is based on publicly reported financial information and the clawback of such compensation from current or former
executive officers following certain accounting restatements. In
addition to the guidelines issued by the Federal Reserve and referenced above, the Company�s compensation practices may also be impacted by other regulations promulgated in accordance with the Financial Stability Board compensation principles
and standards. These standards are to be implemented by local regulators. For instance, in December 2010, the FSA published a policy statement outlining amendments to the Remuneration Code, which governs remuneration of employees at certain banks,
to address compensation-related rules under the EU Capital Requirements Directive. In another example, the United Kingdom has implemented a non-deductible 50% tax on certain financial institutions in respect of discretionary bonuses in excess of
�25,000 awarded during the period starting on December�9, 2009 and ending on April 5, 2010 to �relevant banking employees.� The Dodd-Frank Act also provides a bounty to whistleblowers who present the SEC with information related to securities laws violations that leads to a
successful enforcement action. The Dodd-Frank Act requires the SEC to establish a Whistleblower Office to administer the SEC�s whistleblower program, and prohibits retaliation by employers against individuals that provide the SEC with
information about potential securities violations. As a result of the potential of a bounty, it is possible the Company could face an increased number of investigations by the SEC. For a discussion of certain risks relating to the Company�s regulatory
environment, see �Risk Factors� herein. 20 Table of Contents Executive Officers of Morgan Stanley. The executive officers of Morgan Stanley and their ages and titles as of
February�28, 2011 are set forth below. Business experience for the past five years is provided in accordance with SEC rules. Francis P. Barron (59) .����Chief Legal Officer of Morgan Stanley (since September 2010). Partner at the law firm of Cravath,
Swaine�& Moore LLP (December 1985 to August 2010). Kenneth deRegt (55) .����Global Head of Fixed Income Sales and Trading (excluding Commodities) of Morgan Stanley (since January
2011). Chief Risk Officer of Morgan Stanley (February 2008 to January 2011). Managing Director of Aetos Capital, LLC, an investment management firm (December 2002 to February 2008). Gregory J. Fleming (48) .����Executive Vice President and President of Asset Management (since
February 2010) and President of Global Wealth Management of Morgan Stanley (since January 2011). President of Research of Morgan Stanley (February 2010 to January 2011). Senior Research Scholar at Yale Law School and Distinguished Visiting Fellow of
the Center for the Study of Corporate Law at Yale Law School (January 2009 to December 2009). President of Merrill Lynch�& Co., Inc. (�Merrill Lynch�) (February 2008 to January 2009). Co-President of Merrill Lynch (May 2007 to
February 2008). Executive Vice President and Co-President of the Global Markets and Investment Banking Group of Merrill Lynch (August 2003 to May 2007). James P. Gorman (52) .����President and Chief Executive Officer and Director of Morgan Stanley (since January 2010) and Chairman
of Morgan Stanley Smith Barney (since June 2009). Co-President (December 2007 to December 2009) and Co-Head of Strategic Planning (October 2007 to December 2009). President and Chief Operating Officer of the Global Wealth Management Group (February
2006 to April 2008). Head of Corporate Acquisitions Strategy�and Research at Merrill Lynch�(July 2005 to August 2005) and President of the Global Private Client business at Merrill Lynch (December 2002 to July 2005). Keishi Hotsuki (48) .����Interim Chief Risk Officer
of Morgan Stanley (since January 2011) and Head of the Market Risk Department of Morgan Stanley (since March 2008). Global Head of Market Risk Management at Merrill Lynch (June 2005 to September 2007). Director of Mitsubishi UFJ Morgan Stanley
Securities Co., Ltd. (since May 2010). Colm Kelleher
(53) .����Executive Vice President and Co-President of Institutional Securities of Morgan Stanley (since January 2010). Chief Financial Officer and Co-Head of Strategic Planning (October 2007 to December 2009). Head of Global
Capital Markets (February 2006 to October 2007). Co-Head of Fixed Income Europe (May 2004 to February 2006). John J. Mack (66) .����Executive Chairman of the Board of Directors of Morgan Stanley (since June 2005). Chief Executive Officer (June 2005 to December 2009). Chairman of Pequot
Capital Management (June 2005). Co-Chief Executive Officer of Credit Suisse Group (January 2003 to June 2004). President, Chief Executive Officer and Director of Credit Suisse First Boston (July 2001 to June 2004). President and Chief Operating
Officer of Morgan Stanley (May 1997 to March 2001). Ruth Porat
(53) .����Executive Vice President and Chief Financial Officer of Morgan Stanley (since January 2010). Vice Chairman of Investment Banking (September 2003 to December 2009). Global Head of Financial Institutions Group
(September 2006 to December 2009) and Chairman of the Financial Sponsors Group (July 2004 to September 2006) within the Investment Banking Division. James A. Rosenthal (57) .����Chief Operating Officer of Morgan Stanley (since January 2011) and Chief Operating Officer of
Morgan Stanley Smith Barney and Head of Corporate Strategy of Morgan Stanley (since January 2010). Head of Firmwide Technology and Operations (March 2008 to January 2010). Chief Financial Officer of Tishman Speyer (May 2006 to March 2008). 21 Table of Contents Paul J. Taubman (50) .����Executive Vice President and Co-President of
Institutional Securities of Morgan Stanley (since January 2010). Global Head of Investment Banking (January 2008 to December 2009). Global Co-Head of Investment Banking (July 2007 to January 2008), Global Head of Mergers and Acquisitions Department
(May 2005 to July 2007) and Global Co-Head of Mergers and Acquisitions Department (December 2003 to May 2005). 22 Table of Contents| Item�1A.����Risk | Factors. |
Table of Contents holding company, or that prohibit such transfers altogether in certain circumstances. These laws, regulations and rules may hinder our ability to access funds that we may need to make payments on
our obligations. Furthermore, as a bank holding company, we may become subject to a prohibition or to limitations on our ability to pay dividends or repurchase our stock. The OCC, the Federal Reserve and the FDIC have the authority, and under
certain circumstances the duty, to prohibit or to limit the payment of dividends by the banking organizations they supervise, including us and our bank holding company subsidiaries. Our liquidity and financial condition have in the past been, and in the future could be, adversely affected by U.S. and
international markets and economic conditions. Our ability to
raise funding in the long-term or short-term debt capital markets or the equity markets, or to access secured lending markets, has in the past been, and could in the future be, adversely affected by conditions in the U.S. and international markets
and economy. Global market and economic conditions have been particularly disrupted and volatile during the past three years, with volatility reaching unprecedented levels in the Fall of 2008 and into 2009. In particular, our cost and availability
of funding have been, and may in the future be, adversely affected by illiquid credit markets and wider credit spreads. Renewed turbulence in the U.S. and international markets and economy could adversely affect our liquidity and financial condition
and the willingness of certain counterparties and customers to do business with us. Market Risk. Market risk refers to the risk that a change in the level of one or more market prices of commodities or securities, rates, indices, implied volatilities
(the price volatility of the underlying instrument imputed from option prices), correlations or other market factors, such as liquidity, will result in losses for a position or portfolio. For more information on how we monitor and manage market
risk, see �Qualitative and Quantitative Disclosure about Market Risk� in Part II, Item�7A herein. Our results of operations may be materially affected by market fluctuations and by global and economic conditions and other factors. Our results of operations may be materially affected by market fluctuations due to global and economic conditions and other
factors. The results of operations in the past have been, and in the future may continue to be, materially affected by many factors, including the effect of political and economic conditions and geopolitical events; the effect of market conditions,
particularly in the global equity, fixed income and credit markets, including corporate and mortgage (commercial and residential) lending and commercial real estate investments; the impact of current, pending and future legislation (including the
Dodd-Frank Act), regulation (including capital requirements), and legal actions in the U.S. and worldwide; the level and volatility of equity, fixed income and commodity prices and interest rates, currency values and other market indices; the
availability and cost of both credit and capital as well as the credit ratings assigned to our unsecured short-term and long-term debt; investor sentiment and confidence in the financial markets; the performance of the Company�s acquisitions,
joint ventures, strategic alliances or other strategic arrangements (including MSSB and with Mitsubishi UFJ Financial Group, Inc.); our reputation; inflation, natural disasters, and acts of war or terrorism; the actions and initiatives of current
and potential competitors and technological changes; or a combination of these or other factors. In addition, legislative, legal and regulatory developments related to our businesses are likely to increase costs, thereby affecting results of
operations. These factors also may have an impact on our ability to achieve our strategic objectives. The results of our Institutional Securities business segment, particularly results relating to our involvement in primary and secondary markets for all types of financial products, are subject to
substantial fluctuations due to a variety of factors, such as those enumerated above that we cannot control or predict with great certainty. These fluctuations impact results by causing variations in new business flows and in the fair value of
securities and other financial products. Fluctuations also occur due to the level of global market activity, which, among other things, affects the size, number and timing of investment banking client assignments and transactions and the realization
of returns from our principal investments. During periods of unfavorable market or economic 24 Table of Contents conditions, the level of individual investor participation in the global markets, as well as the level of client assets, may also decrease, which would negatively impact the results of our Global
Wealth Management Group business segment. In addition, fluctuations in global market activity could impact the flow of investment capital into or from assets under management or supervision and the way customers allocate capital among money market,
equity, fixed income or other investment alternatives, which could negatively impact our Asset Management business segment. We may experience further writedowns of our financial instruments and other losses related to volatile and illiquid market conditions. Market volatility, illiquid market conditions and
disruptions in the credit markets have made it extremely difficult to value certain of our securities particularly during periods of market displacement. Subsequent valuations, in light of factors then prevailing, may result in significant changes
in the values of these securities in future periods. In addition, at the time of any sales and settlements of these securities, the price we ultimately realize will depend on the demand and liquidity in the market at that time and may be materially
lower than their current fair value. Any of these factors could require us to take further writedowns in the value of our securities portfolio, which may have an adverse effect on our results of operations in future periods. In addition, financial markets are susceptible to severe events evidenced by
rapid depreciation in asset values accompanied by a reduction in asset liquidity. Under these extreme conditions, hedging and other risk management strategies may not be as effective at mitigating trading losses as they would be under more normal
market conditions. Moreover, under these conditions market participants are particularly exposed to trading strategies employed by many market participants simultaneously and on a large scale, such as crowded trades. Morgan Stanley�s risk
management and monitoring processes seek to quantify and mitigate risk to more extreme market moves. Severe market events have historically been difficult to predict, however, and Morgan Stanley could realize significant losses if unprecedented
extreme market events were to occur, such as conditions in the global financial markets and global economy that prevailed from 2008 into 2009. Holding large and concentrated positions may expose us to losses. Concentration of risk may reduce revenues or result in losses in our
market-making, investing, block trading, underwriting and lending businesses in the event of unfavorable market movements. We commit substantial amounts of capital to these businesses, which often results in our taking large positions in the
securities of, or making large loans to, a particular issuer or issuers in a particular industry, country or region. We have incurred, and may continue to incur, significant losses in the real estate sector. We finance and acquire principal positions in a number of real estate and
real estate-related products for our own account, for investment vehicles managed by affiliates in which we also may have a significant investment, for separate accounts managed by affiliates and for major participants in the commercial and
residential real estate markets. We also originate loans secured by commercial and residential properties. Further, we securitize and trade in a wide range of commercial and residential real estate and real estate-related whole loans, mortgages and
other real estate and commercial assets and products, including residential and commercial mortgage-backed securities. These businesses have been, and may continue to be, adversely affected by the downturn in the real estate sector. Credit Risk. Credit risk refers to the risk of loss arising from borrower or counterparty default when a borrower, counterparty or obligor
does not meet its obligations. For more information on how we monitor and manage credit risk, see �Qualitative and Quantitative Disclosure about Market Risk�Risk Management�Credit Risk� in Part II, Item�7A herein. 25 Table of Contents We are exposed to the risk that third parties that are indebted to us will not perform their
obligations. We incur significant credit risk exposure
through the Institutional Securities business segment. This risk may arise from a variety of business activities, including but not limited to entering into swap or other derivative contracts under which counterparties have obligations to make
payments to us; extending credit to clients through various lending commitments; providing short or long-term funding that is secured by physical or financial collateral whose value may at times be insufficient to fully cover the loan repayment
amount; and posting margin and/or collateral to clearing houses, clearing agencies, exchanges, banks, securities firms and other financial counterparties. We incur credit risk in traded securities and loan pools whereby the value of these assets may
fluctuate based on realized or expected defaults on the underlying obligations or loans. We also incur credit risk in the Global Wealth Management Group business segment lending to individual investors, including, but not limited to, margin and non-purpose loans collateralized by securities,
residential mortgage loans and home equity lines of credit. While
we believe current valuations and reserves adequately address our perceived levels of risk, there is a possibility that continued difficult economic conditions may further negatively impact our clients and our current credit exposures. In addition,
as a clearing member firm, we finance our customer positions and we could be held responsible for the defaults or misconduct of our customers. Although we regularly review our credit exposures, default risk may arise from events or circumstances
that are difficult to detect or foresee. Defaults by
another large financial institution could adversely affect financial markets generally. The commercial soundness of many financial institutions may be closely interrelated as a result of credit, trading, clearing or other relationships between the institutions. As a result, concerns about,
or a default or threatened default by, one institution could lead to significant market-wide liquidity and credit problems, losses or defaults by other institutions. This is sometimes referred to as �systemic risk� and may adversely affect
financial intermediaries, such as clearing agencies, clearing houses, banks, securities firms and exchanges, with which we interact on a daily basis, and therefore could adversely affect us. Operational Risk. Operational risk refers to the risk of financial or other loss, or damage to a firm�s reputation, resulting from inadequate or failed internal
processes, people, resources, systems or from other internal or external events (e.g., internal or external fraud, legal and compliance risks, damage to physical assets, etc.). We may incur operational risk across our full scope of business
activities, including revenue-generating activities ( e.g. , sales and trading), support functions ( e.g. , information technology and trade processing) or other strategic decisions ( e.g. , the integration of MSSB or other joint
ventures, acquisitions or strategic alliances). Legal and compliance risk is included in the scope of operational risk and is discussed below under �Legal Risk.� For more information on how we monitor and manage operational risk, see
�Operational Risk� in Part II, Item�7A herein. We are subject to operational risk that could adversely affect our businesses. Our businesses are highly dependent on our ability to process, on a daily basis, a large number of transactions across numerous
and diverse markets in many currencies. In general, the transactions we process are increasingly complex. We perform the functions required to operate our different businesses either by ourselves or through agreements with third parties. We rely on
the ability of our employees, our internal systems and systems at technology centers operated by third parties to process a high volume of transactions. We also face the risk of operational failure or termination of any of the clearing agents, exchanges, clearing houses or other financial intermediaries we
use to facilitate our securities transactions. In the event of a breakdown or improper operation of our or a third party�s systems or improper action by third parties or employees, we could suffer financial loss, an impairment to our liquidity,
a disruption of our businesses, regulatory sanctions or damage to our reputation. 26 Table of Contents Our operations rely on the secure processing, storage and transmission of confidential and other information
in our computer systems and may be vulnerable to unauthorized access, mishandling or misuse, computer viruses and other events that could have a security impact on such systems. If one or more of such events occur, this potentially could jeopardize
our or our clients� or counterparties� personal, confidential, proprietary or other information processed and stored in, and transmitted through, our computer systems. Furthermore, such events could cause interruptions or malfunctions in
our, our clients�, our counterparties� or third parties� operations, which could result in reputational damage, litigation or regulatory fines or penalties not covered by insurance maintained by us, or adversely affect our business,
financial condition or results of operations. Despite the
business contingency plans we have in place, our ability to conduct business may be adversely affected by a disruption in the infrastructure that supports our business and the communities where we are located. This may include a disruption involving
physical site access, terrorist activities, disease pandemics, catastrophic events, electrical, environmental, communications or other services we use, our employees or third parties with whom we conduct business. Legal and Regulatory Risk. Legal and compliance risk includes the risk of exposure to fines, penalties,
judgments, damages and/or settlements in connection with regulatory or legal actions as a result of non-compliance with applicable legal or regulatory requirements or litigation. Legal risk also includes contractual and commercial risk such as the
risk that a counterparty�s performance obligations will be unenforceable. In today�s environment of rapid and possibly transformational regulatory change, we also view regulatory change as a component of legal risk. For more information on
how we monitor and manage legal risk, see �Risk Management�Legal Risk� in Part II, Item�7A herein. The financial services industry is subject to extensive regulation, which is undergoing major changes that will impact our business. As a major financial services firm, we are subject to
extensive regulation by U.S. federal and state regulatory agencies and securities exchanges and by regulators and exchanges in each of the major markets where we operate. We also face the risk of investigations and proceedings by governmental and
self-regulatory agencies in all countries in which we conduct our business. Interventions by authorities may result in adverse judgments, settlements, fines, penalties, injunctions or other relief. In addition to the monetary consequences, these
measures could, for example, impact our ability to engage in, or impose limitations on, certain of our businesses. The number of these investigations and proceedings, as well as the amount of penalties and fines sought, has increased substantially
in recent years with regard to many firms in the financial services industry, including us. Significant regulatory action against us could materially adversely affect our business, financial condition or results of operations or cause us significant
reputational harm, which could seriously harm our business. The Dodd-Frank Act also provides a bounty to whistleblowers who present the SEC with information related to securities laws violations that leads to a successful enforcement action. As a
result of this bounty, we may face an increased number of investigations by the SEC. In response to the financial crisis, legislators and regulators, both in the U.S. and worldwide, have adopted, or are currently considering to enact, financial market reforms that result in major changes
to the way our global operations are regulated. In particular, as a result of the Dodd-Frank Act, we are subject to significantly revised and expanded regulation and supervision, to new activities limitations, to a systemic risk regime which will
impose especially high capital and liquidity requirements, and to comprehensive new derivatives regulation. Additional restrictions on our activities would result if we were to no longer meet certain capital or management requirements at the
financial holding company level. Certain portions of the Dodd-Frank Act were effective immediately, while other portions will be effective only following extended transition periods, but many of these changes could in the future materially impact
the profitability of our businesses, the value of assets we hold, expose us to additional costs, require changes to business practices or force us to discontinue businesses, could adversely affect our ability to pay dividends, or could require us to
raise capital, including in ways that may adversely impact our shareholders or creditors. 27 Table of Contents The financial services industry faces substantial litigation and is subject to regulatory
investigations, and we may face damage to our reputation and legal liability. We have been named, from time to time, as a defendant in various legal actions, including arbitrations, class actions, and other litigation, as well as investigations or proceedings brought by regulatory
agencies, arising in connection with our activities as a global diversified financial services institution. Certain of the actual or threatened legal or regulatory actions include claims for substantial compensatory and/or punitive damages, claims
for indeterminate amounts of damages, or may result in penalties, fines, or other results adverse to us. In some cases, the issuers that would otherwise be the primary defendants in such cases are bankrupt or in financial distress. Like any large
corporation, we are also subject to risk from potential employee misconduct, including non-compliance with policies and improper use or disclosure of confidential information. Substantial legal liability could materially adversely affect our business,
financial condition or results of operations or cause us significant reputational harm, which could seriously harm our business. For example, recently, the level of litigation activity focused on residential mortgage and credit crisis related
matters has increased materially in the financial services industry. As a result, we may become the subject of increased claims for damages and other relief regarding residential mortgages and related securities in the future and there can be no
assurance that additional material losses will not be incurred from residential mortgage claims that have not yet been notified to us or are not yet determined to be material. For more information regarding legal proceedings in which we are involved
see �Legal Proceedings� in Part I, Item�3 herein. Our business, financial condition and results of operations could be adversely affected by governmental fiscal and monetary policies. We are affected by fiscal and monetary policies adopted
by regulatory authorities and bodies of the U.S. and other governments. For example, the actions of the Federal Reserve and international central banking authorities directly impact our cost of funds for lending, capital raising and investment
activities and may impact the value of financial instruments we hold. In addition, such changes in monetary policy may affect the credit quality of our customers. Changes in domestic and international monetary policy are beyond our control and
difficult to predict. Our commodities activities subject us
to extensive regulation, potential catastrophic events and environmental risks and regulation that may expose us to significant costs and liabilities. In connection with the commodities activities in our Institutional Securities business segment, we engage in the production, storage, transportation,
marketing and trading of several commodities, including metals (base and precious), agricultural products, crude oil, oil products, natural gas, electric power, emission credits, coal, freight, liquefied natural gas and related products and indices.
In addition, we are an electricity power marketer in the U.S. and own electricity generating facilities in the U.S. and Europe; we own TransMontaigne Inc. and its subsidiaries, a group of companies operating in the refined petroleum products
marketing and distribution business; and we have a noncontrolling interest in Heidmar Holdings LLC, which owns a group of companies that provide international marine transportation and U.S. marine logistics services. As a result of these activities,
we are subject to extensive and evolving energy, commodities, environmental, health and safety and other governmental laws and regulations. In addition, liability may be incurred without regard to fault under certain environmental laws and
regulations for the remediation of contaminated areas. Further, through these activities we are exposed to regulatory, physical and certain indirect risks associated with climate change. Our commodities business also exposes us to the risk of
unforeseen and catastrophic events, including natural disasters, leaks, spills, explosions, release of toxic substances, fires, accidents on land and at sea, wars, and terrorist attacks that could result in personal injuries, loss of life, property
damage, and suspension of operations. Although we have attempted
to mitigate our pollution and other environmental risks by, among other measures, adopting appropriate policies and procedures for power plant operations, monitoring the quality of petroleum storage facilities and transport vessels and implementing
emergency response programs, these actions may not prove adequate to address every contingency. In addition, insurance covering some of these risks may not be 28 Table of Contents available, and the proceeds, if any, from insurance recovery may not be adequate to cover liabilities with respect to particular incidents. As a result, our financial condition, results of
operations and cash flows may be adversely affected by these events. Under the BHC Act, there is a grandfather exemption for �activities related to the trading, sale or investment in commodities and underlying physical properties,� provided that we were engaged
in �any of such activities as of September�30, 1997 in the United States� and provided that certain other conditions are satisfied. If the Federal Reserve were to determine that any of our commodities activities did not qualify for
the BHC Act grandfather exemption, then we would likely be required to divest any such activities that did not otherwise conform to the BHC Act by the end of any extensions of the BHC Act grace period, which would terminate in all events on the
fifth anniversary of our becoming a bank holding company. We also
expect the other laws and regulations affecting our commodities business to increase in both scope and complexity. During the past several years, intensified scrutiny of certain energy markets by federal, state and local authorities in the U.S. and
abroad and the public has resulted in increased regulatory and legal enforcement, litigation and remedial proceedings involving companies engaged in the activities in which we are engaged. For example, the U.S. and the EU have increased their focus
on the energy markets which has resulted in increased regulation of companies participating in the energy markets, including those engaged in power generation and liquid hydrocarbons trading. In addition, new regulation of OTC derivatives markets in
the U.S. and similar legislation proposed or adopted abroad will impose significant new costs and impose new requirements on our commodities derivatives activities. We may incur substantial costs or loss of revenue in complying with current or
future laws and regulations and our overall businesses and reputation may be adversely affected by the current legal environment. In addition, failure to comply with these laws and regulations may result in substantial civil and criminal fines and
penalties. A failure to address conflicts of interest
appropriately could adversely affect our businesses. As
a global financial services firm that provides products and services to a large and diversified group of clients, including corporations, governments, financial institutions and individuals, we face potential conflicts of interest in the normal
course of business. For example, potential conflicts can occur when there is a divergence of interests between us and a client, among clients, or between an employee on the one hand and us or a client on the other. We have policies, procedures and
controls that are designed to address potential conflicts of interest. However, identifying and mitigating potential conflicts of interest can be complex and challenging, and can become the focus of media and regulatory scrutiny. Indeed, actions
that merely appear to create a conflict can put our reputation at risk even if the likelihood of an actual conflict has been mitigated. It is possible that potential conflicts could give rise to litigation or enforcement actions, which may lead to
our clients being less willing to enter into transactions in which a conflict may occur and could adversely affect our businesses. Our regulators have the ability to scrutinize our activities for potential conflicts of interest, including through detailed examinations of specific
transactions. In addition, our status as a bank holding company supervised by the Federal Reserve subjects us to direct Federal Reserve scrutiny with respect to transactions between our domestic subsidiary banks and their affiliates. Risk Management. Our hedging strategies and other risk management techniques may not be
fully effective in mitigating our risk exposure in all market environments or against all types of risk. We have devoted significant resources to develop our risk management policies and procedures and expect to continue to do so in the future. Nonetheless, our hedging strategies and other risk management
techniques may not be fully effective in mitigating our risk exposure in all market environments or against all types of risk, including risks that are unidentified or unanticipated. Some of our methods of managing risk are based upon our use of
observed historical market behavior. As a result, these methods may not predict future risk exposures, which could be significantly greater than the historical measures indicate. Management of market, credit, liquidity, operational, legal and
regulatory risks requires, among other things, policies and procedures to record 29 Table of Contents properly and verify a large number of transactions and events, and these policies and procedures may not be fully effective. Our trading risk management strategies and techniques also seek to
balance our ability to profit from trading positions with our exposure to potential losses. While we employ a broad and diversified set of risk monitoring and risk mitigation techniques, those techniques and the judgments that accompany their
application cannot anticipate every economic and financial outcome or the timing of such outcomes. We may, therefore, incur losses in the course of our trading activities. For more information on how we monitor and manage market and certain other
risks, see �Quantitative and Qualitative Disclosures about Market Risk�Risk Management�Market Risk� in Part II, Item�7A herein. Competitive Environment. We face strong competition from other financial services firms, which could lead to pricing pressures that could materially adversely affect our
revenue and profitability. The financial services
industry and all of our businesses are intensely competitive, and we expect them to remain so. We compete with commercial banks, brokerage firms, insurance companies, sponsors of mutual funds, hedge funds, energy companies and other companies
offering financial services in the U.S., globally and through the internet. We compete on the basis of several factors, including transaction execution, capital or access to capital, products and services, innovation, reputation, risk appetite and
price. Over time, certain sectors of the financial services industry have become more concentrated, as institutions involved in a broad range of financial services have been acquired by or merged into other firms or have declared bankruptcy. These
developments could result in our competitors gaining greater capital and other resources, such as a broader range of products and services and geographic diversity. We have experienced and may continue to experience pricing pressures as a result of
these factors and as some of our competitors seek to increase market share by reducing prices. For more information regarding the competitive environment in which we operate, see �Competition� and �Supervision and Regulation� in
Part I, Item�1 herein. Automated trading markets may
adversely affect our business and may increase competition. We have experienced intense price competition in some of our businesses in recent years. In particular, the ability to execute securities trades electronically on exchanges and through other automated
trading markets has increased the pressure on trading commissions. The trend toward direct access to automated, electronic markets will likely continue. We have experienced and it is likely that we will continue to experience competitive pressures
in these and other areas in the future as some of our competitors may seek to obtain market share by reducing prices. Our ability to retain and attract qualified employees is critical to the success of our business and the failure to do so may materially adversely
affect our performance. Our people are our most
important resource and competition for qualified employees is intense. In order to attract and retain qualified employees, we must compensate such employees at market levels. Typically, those levels have caused employee compensation to be our
greatest expense as compensation is highly variable and changes based on business and individual performance and market conditions. If we are unable to continue to attract and retain highly qualified employees, or do so at rates necessary to
maintain our competitive position, or if compensation costs required to attract and retain employees become more expensive, our performance, including our competitive position, could be materially adversely affected. The financial industry has and
may continue to experience more stringent regulation of employee compensation, or employee compensation may be made subject to special taxation (as it has already been done in some jurisdictions, including the U.K. and France), which could have an
adverse effect on our ability to hire or retain the most qualified employees. International Risk. We are subject to numerous political, economic, legal, operational, franchise and other risks as a result of our international operations which could adversely impact our businesses in many ways. We are subject to political, economic, legal,
operational, franchise and other risks that are inherent in operating in many countries, including risks of possible nationalization, expropriation, price controls, capital controls, exchange 30 Table of Contents controls and other restrictive governmental actions, as well as the outbreak of hostilities or political and governmental instability. In many countries, the laws and regulations applicable to
the securities and financial services industries are uncertain and evolving, and it may be difficult for us to determine the exact requirements of local laws in every market. Our inability to remain in compliance with local laws in a particular
market could have a significant and negative effect not only on our business in that market but also on our reputation generally. We are also subject to the enhanced risk that transactions we structure might not be legally enforceable in all cases. Various emerging market countries have experienced severe
political, economic and financial disruptions, including significant devaluations of their currencies, capital and currency exchange controls, high rates of inflation and low or negative growth rates in their economies. Crime and corruption, as well
as issues of security and personal safety, also exist in certain of these countries. These conditions could adversely impact our businesses and increase volatility in financial markets generally. The emergence of a pandemic or other widespread health emergency, or concerns
over the possibility of such an emergency as well as terrorist acts or military actions, could create economic and financial disruptions in emerging markets and other areas throughout the world, and could lead to operational difficulties (including
travel limitations) that could impair our ability to manage our businesses around the world. As a U.S. company, we are required to comply with the economic sanctions and embargo programs administered by OFAC and similar multi-national bodies and governmental agencies worldwide and the FCPA. A
violation of a sanction or embargo program or of the FCPA could subject us, and individual employees, to a regulatory enforcement action as well as significant civil and criminal penalties. Acquisition and Joint Venture Risk. We may be unable to fully capture the expected value from
acquisitions, joint ventures, minority stakes and strategic alliances. In connection with past or future acquisitions, joint ventures (including MSSB) or strategic alliances (including with Mitsubishi UFJ Financial Group, Inc.), we face numerous risks and uncertainties
combining or integrating the relevant businesses and systems, including the need to combine accounting and data processing systems and management controls and to integrate relationships with clients, trading counterparties and business partners. In
the case of joint ventures and minority stakes, we are subject to additional risks and uncertainties because we may be dependent upon, and subject to liability, losses or reputational damage relating to, systems, controls and personnel that are not
under our control. In addition, conflicts or disagreements between us and our joint venture partners may negatively impact the benefits to be achieved by the joint venture. There is no assurance that any of our acquisitions will be successfully
integrated or yield all of the positive benefits anticipated. If we are not able to integrate successfully our past and future acquisitions, there is a risk that our results of operations, financial condition and cash flows may be materially and
adversely affected. Certain of our business initiatives,
including expansions of existing businesses, may bring us into contact, directly or indirectly, with individuals and entities that are not within our traditional client and counterparty base and may expose us to new asset classes and new markets.
These business activities expose us to new and enhanced risks, greater regulatory scrutiny of these activities, increased credit-related, sovereign and operational risks, and reputational concerns regarding the manner in which these assets are being
operated or held. For more information regarding the regulatory
environment in which we operate, see also �Supervision and Regulation� in Part I, Item�1 herein. | Item�1B.����Unresolved | Staff Comments. |
Table of Contents| Item�2.����Properties. |
| Location | Owned/ Leased | Lease�Expiration | Approximate�Square�Footage as of December�31, 2010(A) | |||||||||
| U.S. Locations | ||||||||||||
| 1585 Broadway New York, New York (Global Headquarters and Institutional Securities Headquarters) | Owned | N/A | 894,600�square�feet | |||||||||
| 2000 Westchester Avenue Purchase, New York (Global Wealth Management Group Headquarters) | Owned | N/A | 597,400 square feet | |||||||||
| 522 Fifth Avenue New York, New York (Asset Management Headquarters) | Owned | N/A | 581,250 square feet | |||||||||
| New York, New York (Several locations) | Leased | 2012���2018 | 2,581,600�square�feet | |||||||||
| Brooklyn, New York (Several locations) | Leased | 2011 � 2016 | 637,300 square feet | |||||||||
| Jersey City, New Jersey (Several locations) | Leased | 2011 � 2014 | 511,695 square feet | |||||||||
| International Locations | ||||||||||||
| 20 Bank Street (London Headquarters) | Leased | 2038 | 546,400 square feet | |||||||||
| Canary Wharf (Several locations) | Leased(B) | 2036 | 625,700 square feet | |||||||||
| 1 Austin Road West Kowloon (Hong Kong Headquarters) | Leased | 2019 | 572,600 square feet | |||||||||
| Sapporo�s Yebisu Garden Place, Ebisu, Shibuya-ku (Tokyo Headquarters) | Leased | 2011 | (C) | 350,700 square feet | ||||||||
| (A) | The indicated total aggregate square footage leased does not include space occupied by Morgan Stanley branch offices. |
| (B) | The Company holds the freehold interest in the land and building. |
| (C) | Option to return any amount of space up to the full space after April 2011. |
Table of Contents| Item�3. | Legal Proceedings. |
Table of Contents parties, including certain present and former directors and officers, under the Employee Retirement Income Security Act of 1974 (�ERISA�). In February 2008, these actions were
consolidated in a single proceeding, which is styled In re Morgan Stanley ERISA Litigation . The consolidated complaint relates in large part to the Company�s subprime and other mortgage related losses, but also includes allegations
regarding the Company�s disclosures, internal controls, accounting and other matters. The consolidated complaint alleges, among other things, that the Company�s common stock was not a prudent investment and that risks associated with its
common stock and its financial condition were not adequately disclosed. Plaintiffs are seeking, among other relief, class certification, unspecified compensatory damages, costs, interest and fees. On December�9, 2009, the court denied
defendants� motion to dismiss the consolidated complaint. On
February�12, 2008, a plaintiff filed a purported class action, which was amended on November�24, 2008, naming the Company and certain present and former senior executives as defendants and asserting claims for violations of the securities
laws. The amended complaint, which is styled Joel Stratte-McClure, et al. v. Morgan�Stanley, et al. , is currently pending in the SDNY. Subject to certain exclusions, the amended complaint asserts claims on behalf of a purported class of
persons and entities who purchased shares of the Company�s common stock during the period June�20, 2007 to December�19, 2007 and who suffered damages as a result of such purchases. The allegations in the amended complaint relate in
large part to the Company�s subprime and other mortgage related losses, but also include allegations regarding the Company�s disclosures, internal controls, accounting and other matters. Plaintiffs are seeking, among other relief, class
certification, unspecified compensatory damages, costs, interest and fees. On April�27, 2009, the Company filed a motion to dismiss the amended complaint. On May�7, 2009, the Company was named as a defendant in a purported class action lawsuit brought under Sections 11, 12 and 15 of the Securities Act
of 1933, as amended (the �Securities Act�), alleging, among other things, that the registration statements and offering documents related to the offerings of approximately $17 billion of mortgage pass through certificates in 2006 and 2007
contained false and misleading information concerning the pools of residential loans that backed these securitizations. The plaintiffs sought, among other relief, class certification, unspecified compensatory and rescissionary damages, costs,
interest and fees. This case, which was consolidated with an earlier lawsuit and is currently styled In re Morgan Stanley Mortgage Pass-Through Certificate Litigation , is pending in the SDNY. On August�17, 2010, the court dismissed the
claims brought by the lead plaintiff, but gave a different plaintiff leave to file a second amended complaint. On September�10, 2010, that plaintiff, together with several new plaintiffs, filed a second amended complaint which purports to
assert claims against the Company and others on behalf of a class of investors who purchased approximately $4.7 billion of mortgage pass through certificates issued in 2006 by seven trusts collectively containing residential mortgage loans. The
second amended complaint asserts claims under Sections 11, 12 and 15 of the Securities Act, and alleges, among other things, that the registration statements and offering documents related to the offerings contained false and misleading information
concerning the pools of residential loans that backed these securitizations. The plaintiffs are seeking, among other relief, class certification, unspecified compensatory and rescissionary damages, costs, interest and fees. On October�11, 2010,
defendants filed a motion to dismiss the second amended complaint. Beginning in 2007, the Company was named as a defendant in several putative class action lawsuits brought under Sections 11 and 12 of the Securities Act,
related to its role as a member of the syndicates that underwrote offerings of securities and mortgage pass through certificates for certain non-Morgan Stanley related entities that have been exposed to subprime and other mortgage-related losses.
The plaintiffs in these actions allege, among other things, that the registration statements and offering documents for the offerings at issue contained various material misstatements or omissions related to the extent to which the issuers were
exposed to subprime and other mortgage-related risks and other matters and seek various forms of relief including class certification, unspecified compensatory and rescissionary damages, costs, interest and fees. The Company�s exposure to
potential losses in these cases may be impacted by various factors including, among other things, the financial condition of the entities that issued the securities and mortgage pass through certificates at issue, the principal amount of the
offerings underwritten by the Company, the financial condition of co-defendants and the 34 Table of Contents willingness and ability of the issuers (or their affiliates) to indemnify the underwriter defendants. Some of these cases, including In Re Washington Mutual, Inc. Securities Litigation, In re: Lehman Brothers Equity/Debt Securities Litigation and In re IndyMac Mortgage-Backed Securities Litigation , relate to issuers (or their affiliates) that have filed for bankruptcy or have been placed into receivership. In Re Washington Mutual, Inc. Securities Litigation is pending in the
United States District Court for the Western District of Washington. On October�12, 2010, the court issued an order certifying a class of plaintiffs asserting claims under the Securities Act related to three offerings by Washington Mutual Inc.
in 2006 and 2007 in which the Company participated as an underwriter. The Company underwrote approximately $1.3 billion of the securities covered by the class certified by the court. In re: Lehman Brothers Equity/Debt Securities Litigation is pending in the SDNY and relates to several offerings of debt
and equity securities issued by Lehman Brothers Holdings Inc. during 2007 and 2008. The Company underwrote approximately $232 million of the principal amount of the offerings at issue. On June�5, 2010, the underwriter defendants moved to
dismiss the amended complaint filed by the lead plaintiffs. In
re IndyMac Mortgage-Backed Securities Litigation is pending in the SDNY and relates to offerings of mortgage pass through certificates issued by seven trusts sponsored by affiliates of IndyMac Bancorp during 2006 and 2007. The Company underwrote
over $1.4 billion of the principal amount of the offerings originally at issue. On June�21, 2010, the court granted in part and denied in part the underwriter defendants� motion to dismiss the amended consolidated class action complaint.
The Company underwrote approximately $46 million of the principal amount of the offerings at issue following the court�s June�21, 2010 decision. On May�17, 2010, certain putative plaintiffs filed a motion to intervene in the
litigation in order to assert claims related to additional offerings. The Company underwrote approximately $1.2 billion of the principal amount of the additional offerings subject to the motion to intervene. The Company is opposing the motion to
intervene. On December�24, 2009, the Employees�
Retirement System of the Government of the Virgin Islands filed a purported class action against the Company on behalf of holders of approximately $250 million of AAA rated notes issued by the Libertas III CDO in March 2007. The case is styled Employees� Retirement System of the Government of the Virgin Islands v. Morgan Stanley�& Co. Incorporated, et al. and is pending in the SDNY. The complaint asserts claims for common law fraud and unjust enrichment and alleges
that the Company made misrepresentations regarding the AAA ratings of the CDO notes and the credit quality of the collateral held by the Libertas III CDO, and stood to gain if that collateral defaulted. The complaint seeks class certification,
unspecified compensatory and punitive damages, equitable relief, fees and costs. On March�19, 2010, the Company filed a motion to dismiss the complaint. Shareholder Derivative Matter. On November�15, 2007, a shareholder derivative complaint styled Steve Staehr,
Derivatively on Behalf of Morgan Stanley v. John J. Mack, et al. was filed in the SDNY asserting claims related in large part to losses caused by certain subprime-related trading positions and related matters. On July�16, 2008, the
plaintiff filed an amended complaint, which defendants moved to dismiss on September�19, 2008. The complaint seeks, among other relief, unspecified compensatory damages, restitution, and institution of certain corporate governance reforms. Other Litigation. On
August�25, 2008, the Company and two ratings agencies were named as defendants in a purported class action related to securities issued by a SIV called Cheyne Finance (the �Cheyne SIV�). The case is styled Abu Dhabi Commercial
Bank, et al. v. Morgan Stanley�& Co. Inc., et al. and is pending in the SDNY. The complaint alleges, among other things, that the ratings assigned to the securities issued by the SIV were false and misleading because the ratings did not
accurately reflect the risks associated with the subprime residential mortgage backed securities held by the SIV. On September�2, 2009, the court dismissed all of the claims against the Company except for plaintiffs� claims for common law
fraud. On June�15, 2010, the court denied plaintiffs� motion for class certification. On July�20, 2010, the Court granted plaintiffs leave to replead their aiding and abetting common law fraud claims against the Company, and those
claims were added in an amended complaint filed on August�5, 2010. Since the filing of the initial complaint, various additional plaintiffs have been added to 35 Table of Contents the case. There are currently 14 plaintiffs asserting individual claims related to securities issued by the SIV. Plaintiffs have not alleged the amount of their alleged investments, and are
seeking, among other relief, unspecified compensatory and punitive damages. On January�16, 2009, the Company was named as a defendant in an interpleader�lawsuit styled U.S. Bank, N.A. v. Barclays Bank PLC and Morgan Stanley Capital Services Inc. , which is
pending in the SDNY.�The lawsuit relates to credit default swaps between the Company and Tourmaline CDO I LTD (�Tourmaline�), in which Barclays Bank PLC (�Barclays�) is the holder of the most senior and controlling class of
notes.�At issue is whether, pursuant to the terms of the swap agreements, the Company was required to post collateral to Tourmaline, or take any other action,�after the Company�s credit ratings were downgraded in 2008 by certain
ratings agencies.�The Company and Barclays have a dispute regarding whether the Company breached any obligations under the swap agreements and, if so, whether any such breaches were cured.�The trustee for Tourmaline, interpleader plaintiff
U.S. Bank, N.A., has refrained from making any further distribution of Tourmaline�s funds pending the resolution of these issues and is seeking a judgment from the court resolving them. On January�11, 2011, the court conducted a bench
trial, but has not yet issued its ruling. As of December�31, 2010, the Company believed that it was entitled to receivables from Tourmaline in an amount equal to approximately $273 million. On September�25, 2009, the Company was named as a defendant in a lawsuit
styled Citibank, N.A. v. Morgan�Stanley�& Co. International, PLC , which is pending in the SDNY. The lawsuit relates to a credit default swap referencing the Capmark VI CDO, which was structured by Citibank, N.A.
(�Citi N.A.�). At issue is whether, as part of the swap agreement, Citi N.A. was obligated to obtain the Company�s prior written consent before it exercised its rights to liquidate Capmark upon the occurrence of certain
contractually-defined credit events. Citi N.A. is seeking approximately $245 million in compensatory damages plus interest and costs. On October�8, 2010, the court issued an order denying Citi N.A.�s motion for judgment on the pleadings as
to the Company�s counterclaim for reformation and granting Citi N.A.�s motion for judgment on the pleadings as to the Company�s counterclaim for estoppel. The Company moved for summary judgment on December�17, 2010. Citi N.A.
opposed the Company�s motion and cross moved for summary judgment on January�21, 2011. On December�23, 2009, the Federal Home Loan Bank of Seattle filed a complaint�against the Company and another defendant in�the Superior Court of the State of Washington, styled Federal
Home Loan Bank of Seattle v. Morgan Stanley�& Co. Inc., et al .�An amended complaint was filed on September�28, 2010. The complaint alleges that defendants made untrue statements and material omissions in the sale to plaintiff
of certain mortgage pass through certificates backed by securitization trusts containing residential mortgage loans. The total amount of certificates allegedly sold to plaintiff by the Company was approximately $233 million.�The complaint
raises claims under the Washington State Securities Act and seeks, among other things,�to rescind�the plaintiff�s purchase of such certificates.�On October�18, 2010, defendants filed a motion to dismiss the action. On March�15, 2010, the Federal Home Loan Bank of San
Francisco filed two complaints against the Company and other defendants in�the Superior Court of the State of California. These actions are styled Federal Home Loan Bank of San Francisco�v. Credit Suisse Securities (USA) LLC, et
al. ,�and Federal Home Loan Bank of San�Francisco�v. Deutsche Bank Securities Inc.�et al., respectively. Amended complaints were filed on June�10, 2010. The complaints allege that defendants made untrue statements
and material omissions in connection with the sale to plaintiff of�a number of�mortgage pass through certificates backed by securitization trusts containing residential mortgage loans. The amount of certificates allegedly sold to plaintiff
by the Company in these cases was approximately $704 million and $276 million, respectively. The complaints raise claims under both the federal securities laws and California law and seek, among other things,�to rescind�the
plaintiff�s purchase of such certificates.�On July�12, 2010, defendants removed these actions to the�United States District Court for the Northern District of California, and on December�20, 2010, the cases were remanded to
the state court. On June�10, 2010, the Company was named as
a new defendant in a pre-existing purported class action related to securities issued by a SIV called Rhinebridge plc (�Rhinebridge SIV�). The case is styled King County, Washington, et al. v. IKB Deutsche Industriebank AG, et
al. and is pending in the SDNY. The complaint asserts 36 Table of Contents claims for common law fraud and aiding and abetting common law fraud and alleges, among other things, that the ratings assigned to the securities issued by the SIV were false and misleading,
including because the ratings did not accurately reflect the risks associated with the subprime residential mortgage backed securities held by the SIV. On July�15, 2010, the Company moved to dismiss the complaint. That motion was denied on
October�29, 2010. The case is pending before the same judge presiding over the litigation concerning the Cheyne SIV, described above. While reserving their ability to act otherwise, plaintiffs have indicated that they do not currently plan to
file a motion for class certification. Plaintiffs have not alleged the amount of their alleged investments, and are seeking, among other relief, unspecified compensatory and punitive damages. On July�9, 2010, Cambridge Place Investment Management Inc. filed a complaint�against the Company and other
defendants in�the Superior Court of the Commonwealth of Massachusetts, styled Cambridge Place Investment Management Inc. v. Morgan Stanley�& Co., Inc., et al .�The complaint asserts claims on behalf of certain of
plaintiff�s clients and alleges that defendants made untrue statements and material omissions in the sale of�a number of�mortgage pass through certificates backed by securitization trusts containing residential mortgage
loans.�The�total amount of certificates allegedly issued by the Company or sold to plaintiff�s clients by the Company was�approximately $242 million. The complaint raises claims under�the Massachusetts Uniform Securities
Act�and seeks, among other things, to rescind the plaintiff�s purchase of such certificates.�On August�13, 2010,�defendants removed this action to the�United States District Court for the District of�Massachusetts
and on September�13, 2010, plaintiff filed a motion to remand the case to the state court. On December�28, 2010, the magistrate judge recommended that the district court grant the motion to remand. The defendants objected to the
magistrate�s report and recommendation on January�18, 2011. On July�15, 2010, The Charles Schwab Corp. filed a complaint against the Company and other defendants in�the Superior Court of the State of California, styled The Charles Schwab Corp. v. BNP
Paribas Securities Corp., et al . The complaint alleges that defendants made untrue statements and material omissions in the sale to one of plaintiff�s subsidiaries of�a number of�mortgage pass through certificates backed by
securitization trusts containing residential mortgage loans. The�total amount of certificates allegedly sold to plaintiff�s subsidiary by the Company was�approximately $180 million.�The complaint raises claims under both the
federal securities laws and California law and seeks, among other things,�to rescind�the plaintiff�s purchase of such certificates.�On�September�8, 2010,�defendants removed this action to the�United States
District Court for the Northern District of California�and on October�1, 2010, plaintiff filed a�motion to remand the case to the state court. In July�15, 2010, China Industrial Development Bank (�CIDB�) filed a complaint against the Company, which is styled China Industrial
Development Bank v. Morgan Stanley�& Co. Incorporated and is pending in the Supreme Court of the State of New York, New York County. The Complaint relates to a $275 million credit default swap referencing the super senior portion of the
STACK 2006-1 CDO. The complaint asserts claims for common law fraud, fraudulent inducement and fraudulent concealment and alleges that the Company misrepresented the risks of the STACK 2006-1 CDO to CIDB, and that the Company knew that the assets
backing the CDO were of poor quality when it entered into the credit default swap with CIDB. The complaint seeks compensatory damages related to the approximately $228 million that CIDB alleges it has already lost under the credit default swap,
rescission of CIDB�s obligation to pay an additional $12 million, punitive damages, equitable relief, fees and costs. On September�30, 2010, the Company filed a motion to dismiss the complaint. On October�15, 2010,�the Federal Home Loan Bank of Chicago filed
two complaints�against the Company and other defendants. One was filed in�the�Circuit Court of the State of Illinois and is styled Federal Home Loan Bank of�Chicago�v.�Bank of America Funding Corporation�et
al . The other was filed in�the Superior Court of the State of California and is styled Federal Home Loan Bank of Chicago v.�Bank of America Securities�LLC, et al . The complaints allege that defendants made untrue statements
and material omissions in the sale to plaintiff of�a number of�mortgage pass through certificates backed by securitization trusts containing residential mortgage loans.�The�total amount of certificates allegedly sold to plaintiff
by the Company in the two actions was�approximately $203 million and $75 million respectively.�The complaint filed in Illinois raises claims 37 Table of Contents under�Illinois law. The complaint filed in California raises claims under the federal securities laws, Illinois law and California law. Both complaints seek, among other things,�to
rescind�the plaintiff�s purchase of such certificates. The defendants removed both actions to federal court, on November�23, 2010 and November�24, 2010, respectively. On January�18, 2011, the United States District Court for
the Northern District of Illinois remanded the Illinois action to the state court. On December�23, 2010, the plaintiff filed a motion to remand the California action from the United States District Court for the Central District of California
to the state court. On December�6, 2010, MBIA Insurance
Corporation (�MBIA�) filed a complaint against the Company related to MBIA�s contract to insure approximately $223 million of residential mortgage backed securities related to a second lien residential mortgage backed securitization
sponsored by the Company in June 2007. The complaint is styled MBIA Insurance Corporation v. Morgan Stanley, et al. and is pending in New York Supreme Court, Westchester County. The complaint asserts claims for fraud, breach of contract and
unjust enrichment and alleges, among other things, that the Company misled MBIA regarding the quality of the loans contained in the securitization, that loans contained in the securitization breached various representations and warranties and that
the loans have been serviced inadequately. The complaint seeks, among other relief, compensatory and punitive damages, an order requiring the Company to comply with the loan breach remedy procedures in the transaction documents and/or to indemnify
MBIA for losses resulting from the Company�s alleged breach of the transaction documents, as well as costs, interests and fees. On February�2, 2011, the Company filed a motion to dismiss the complaint. China Matter. As disclosed in February 2009, the Company uncovered actions initiated by an
employee based in China in an overseas real estate subsidiary that appear to have violated the Foreign Corrupt Practices Act.�The Company terminated the employee, reported the activity to appropriate authorities and is cooperating with
investigations by the United States Department of Justice and the SEC. | Item�4. | [Removed and Reserved] |
Table of Contents Part II | Item�5. | Market for Registrant�s Common Equity, Related Stockholder Matters and Issuer Purchases of Equity Securities. |
| Low Sale�Price | High Sale�Price | Dividends | ||||||||||
| 2010: | ||||||||||||
| Fourth Quarter | $ | 23.95 | $ | 27.77 | $ | 0.05 | ||||||
| Third Quarter | $ | 22.40 | $ | 28.05 | $ | 0.05 | ||||||
| Second Quarter | $ | 23.14 | $ | 32.29 | $ | 0.05 | ||||||
| First Quarter | $ | 26.15 | $ | 33.27 | $ | 0.05 | ||||||
| 2009: | ||||||||||||
| Fourth Quarter | $ | 28.75 | $ | 35.78 | $ | 0.05 | ||||||
| Third Quarter | $ | 24.85 | $ | 33.33 | $ | 0.05 | ||||||
| Second Quarter | $ | 20.69 | $ | 31.99 | $ | 0.05 | ||||||
| First Quarter | $ | 13.10 | $ | 27.27 | $ | 0.05 | ||||||
Table of Contents The table below sets forth the information with respect to purchases made by or on behalf of the Company of
its common stock during the fourth quarter of the year ended December�31, 2010. Issuer Purchases of Equity Securities (dollars in millions, except per
share amounts) | Period | Total Number of Shares Purchased | Average Price Paid�Per Share | Total Number�of Shares Purchased As�Part�of�Publicly Announced Plans or Programs(C) | Approximate�Dollar Value of Shares that May Yet Be Purchased Under the Plans�or Programs | ||||||||||||
| Month�#1�(October 1, 2010�October 31, 2010) | ||||||||||||||||
| Share Repurchase Program(A) | � | � | � | $ | 1,560 | |||||||||||
| Employee Transactions (B) | 478,452 | $ | 25.28 | � | � | |||||||||||
| Month #2 (November 1, 2010�November 30, 2010) | ||||||||||||||||
| Share Repurchase Program(A) | � | � | � | $ | 1,560 | |||||||||||
| Employee Transactions (B) | 105,160 | $ | 24.95 | � | � | |||||||||||
| Month #3 (December 1, 2010�December 31, 2010) | ||||||||||||||||
| Share Repurchase Program(A) | � | � | � | $ | 1,560 | |||||||||||
| Employee Transactions(B) | 167,571 | $ | 25.53 | � | � | |||||||||||
| Total | ||||||||||||||||
| Share Repurchase Program(A) | � | � | � | $ | 1,560 | |||||||||||
| Employee Transactions(B) | 751,183 | $ | 25.29 | � | � | |||||||||||
| (A) | On December�19, 2006, the Company announced that its Board of Directors authorized the repurchase of up to $6 billion of the Company�s outstanding stock under a share repurchase program (the �Share Repurchase Program�). The Share Repurchase Program is a program for capital management purposes that considers, among other things, business segment capital needs as well as equity-based compensation and benefit plan requirements. The Share Repurchase Program has no set expiration or termination date. Share repurchases by the Company are subject to regulatory approval. |
| (B) | Includes: (1)�shares delivered or attested in satisfaction of the exercise price and/or tax withholding obligations by holders of employee and director stock options (granted under employee and director stock compensation plans) who exercised options; (2)�shares withheld, delivered or attested (under the terms of grants under employee and director stock compensation plans) to offset tax withholding obligations that occur upon vesting and release of restricted shares; and (3)�shares withheld, delivered and attested (under the terms of grants under employee and director stock compensation plans) to offset tax withholding obligations that occur upon the delivery of outstanding shares underlying restricted stock units. The Company�s employee and director stock compensation plans provide that the value of the shares withheld, delivered or attested, shall be valued using the fair market value of the Company�s common stock on the date the relevant transaction occurs, using a valuation methodology established by the Company. |
| (C) | Share purchases under publicly announced programs are made pursuant to open-market purchases, Rule 10b5-1 plans or privately negotiated transactions (including with employee benefit plans) as market conditions warrant and at prices the Company deems appropriate. |
Table of Contents Stock performance graph. The following graph compares the cumulative total
shareholder return (rounded to the nearest whole dollar) of the Company�s common stock, the S&P 500 Stock Index (�S&P 500�) and the S&P 500 Financials Index (�S5FINL�) for the last five years. The graph assumes a
$100 investment at the closing price on December�31, 2005 and reinvestment of dividends on the respective dividend payment dates without commissions. Historical prices are adjusted to reflect the spin-off of Discover Financial Services
completed on June�30, 2007. This graph does not forecast future performance of the Company�s common stock. 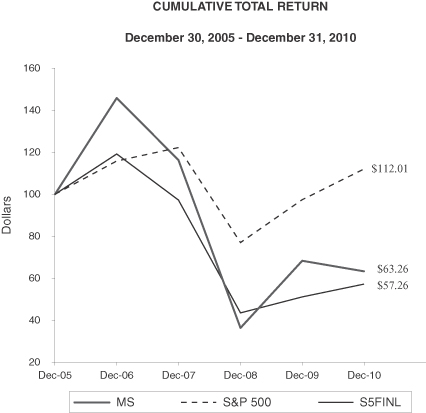
| MS | S&P 500 | S5FINL | ||||||||||
| 12/30/2005 | $ | 100.00 | $ | 100.00 | $ | 100.00 | ||||||
| 12/29/2006 | $ | 145.85 | $ | 115.78 | $ | 119.21 | ||||||
| 12/31/2007 | $ | 116.29 | $ | 122.14 | $ | 97.16 | ||||||
| 12/31/2008 | $ | 36.30 | $ | 76.96 | $ | 43.50 | ||||||
| 12/31/2009 | $ | 68.31 | $ | 97.33 | $ | 51.03 | ||||||
| 12/31/2010 | $ | 63.26 | $ | 112.01 | $ | 57.26 | ||||||
Table of Contents| Item�6. | Selected Financial Data. |
| 2010 | 2009(1)(2) | Fiscal 2008 | Fiscal 2007 | Fiscal 2006 | One Month Ended December�31, 2008(2) | |||||||||||||||||||
| Income Statement Data: | ||||||||||||||||||||||||
| Revenues: | ||||||||||||||||||||||||
| Investment banking | $ | 5,122 | $ | 5,020 | $ | 4,057 | $ | 6,321 | $ | 4,706 | $ | 196 | ||||||||||||
| Principal transactions: | ||||||||||||||||||||||||
| Trading | 9,406 | 7,722 | 6,170 | 1,723 | 10,290 | (1,491 | ) | |||||||||||||||||
| Investments | 1,825 | (1,034 | ) | (3,888 | ) | 3,328 | 1,791 | (205 | ) | |||||||||||||||
| Commissions | 4,947 | 4,233 | 4,443 | 4,654 | 3,746 | 213 | ||||||||||||||||||
| Asset management, distribution and administration fees | 7,957 | 5,884 | 4,839 | 5,486 | 4,231 | 292 | ||||||||||||||||||
| Other | 1,501 | 837 | 3,851 | 777 | 210 | 109 | ||||||||||||||||||
| Total non-interest revenues | 30,758 | 22,662 | 19,472 | 22,289 | 24,974 | (886 | ) | |||||||||||||||||
| Interest income | 7,278 | 7,477 | 38,931 | 61,420 | 44,270 | 1,089 | ||||||||||||||||||
| Interest expense | 6,414 | 6,705 | 36,263 | 57,264 | 40,904 | 1,140 | ||||||||||||||||||
| Net interest | 864 | 772 | 2,668 | 4,156 | 3,366 | (51 | ) | |||||||||||||||||
| Net revenues | 31,622 | 23,434 | 22,140 | 26,445 | 28,340 | (937 | ) | |||||||||||||||||
| Non-interest expenses: | ||||||||||||||||||||||||
| Compensation and benefits | 16,048 | 14,434 | 11,851 | 16,111 | 13,593 | 582 | ||||||||||||||||||
| Other | 9,372 | 8,017 | 9,035 | 7,573 | 6,353 | 475 | ||||||||||||||||||
| Total non-interest expenses | 25,420 | 22,451 | 20,886 | 23,684 | 19,946 | 1,057 | ||||||||||||||||||
| Income (loss) from continuing operations before income taxes | 6,202 | 983 | 1,254 | 2,761 | 8,394 | (1,994 | ) | |||||||||||||||||
| Provision for (benefit from) income taxes | 739 | (341 | ) | 16 | 573 | 2,469 | (725 | ) | ||||||||||||||||
| Income (loss) from continuing operations | 5,463 | 1,324 | 1,238 | 2,188 | 5,925 | (1,269 | ) | |||||||||||||||||
| Discontinued operations(3): | ||||||||||||||||||||||||
| Gain (loss) from discontinued operations | 606 | 33 | 1,004 | 1,697 | 2,351 | (14 | ) | |||||||||||||||||
| Provision for (benefit from) income taxes | 367 | (49 | ) | 464 | 636 | 789 | 2 | |||||||||||||||||
| Net gain (loss) from discontinued operations | 239 | 82 | 540 | 1,061 | 1,562 | (16 | ) | |||||||||||||||||
| Net income (loss) | 5,702 | 1,406 | 1,778 | 3,249 | 7,487 | (1,285 | ) | |||||||||||||||||
| Net income applicable to noncontrolling interests | 999 | 60 | 71 | 40 | 15 | 3 | ||||||||||||||||||
| Net income (loss) applicable to Morgan Stanley | $ | 4,703 | $ | 1,346 | $ | 1,707 | $ | 3,209 | $ | 7,472 | $ | (1,288 | ) | |||||||||||
| Earnings (loss) applicable to Morgan Stanley common shareholders(4) | $ | 3,594 | $ | (907 | ) | $ | 1,495 | $ | 2,976 | $ | 7,027 | $ | (1,624 | ) | ||||||||||
| Amounts applicable to Morgan Stanley: | ||||||||||||||||||||||||
| Income (loss) from continuing operations | $ | 4,464 | $ | 1,280 | $ | 1,205 | $ | 2,150 | $ | 5,913 | $ | (1,269 | ) | |||||||||||
| Net gain (loss) from discontinued operations | 239 | 66 | 502 | 1,059 | 1,559 | (19 | ) | |||||||||||||||||
| Net income (loss) applicable to Morgan Stanley | $ | 4,703 | $ | 1,346 | $ | 1,707 | $ | 3,209 | $ | 7,472 | $ | (1,288 | ) | |||||||||||
| | 42 |
| 2010 | 2009(1)(2) | Fiscal 2008 | Fiscal 2007 | Fiscal 2006 | One Month Ended December�31, 2008(2) | |||||||||||||||||||
| Per Share Data: | ||||||||||||||||||||||||
| Earnings (loss) per basic common share(5): | ||||||||||||||||||||||||
| Income (loss) from continuing operations | $ | 2.48 | $ | (0.82 | ) | $ | 1.00 | $ | 1.97 | $ | 5.50 | $ | (1.60 | ) | ||||||||||
| Net gain (loss) from discontinued operations | 0.16 | 0.05 | 0.45 | 1.00 | 1.46 | (0.02 | ) | |||||||||||||||||
| Earnings (loss) per basic common share | $ | 2.64 | $ | (0.77 | ) | $ | 1.45 | $ | 2.97 | $ | 6.96 | $ | (1.62 | ) | ||||||||||
| Earnings (loss) per diluted common share(5): | ||||||||||||||||||||||||
| Income (loss) from continuing operations | $ | 2.44 | $ | (0.82 | ) | $ | 0.95 | $ | 1.92 | $ | 5.42 | $ | (1.60 | ) | ||||||||||
| Net gain (loss) from discontinued operations | 0.19 | 0.05 | 0.44 | 0.98 | 1.43 | (0.02 | ) | |||||||||||||||||
| Earnings (loss) per diluted common share | $ | 2.63 | $ | (0.77 | ) | $ | 1.39 | $ | 2.90 | $ | 6.85 | $ | (1.62 | ) | ||||||||||
| Book value per common share(6) | $ | 31.49 | $ | 27.26 | $ | 30.24 | $ | 28.56 | $ | 32.67 | $ | 27.53 | ||||||||||||
| Dividends declared per common share | $ | 0.20 | $ | 0.17 | $ | 1.08 | $ | 1.08 | $ | 1.08 | $ | 0.27 | ||||||||||||
| Balance Sheet and Other Operating Data: | ||||||||||||||||||||||||
| Total assets | $ | 807,698 | $ | 771,462 | $ | 659,035 | $ | 1,045,409 | $ | 1,121,192 | $ | 676,764 | ||||||||||||
| Total capital(7) | 222,757 | 213,974 | 192,297 | 191,085 | 162,134 | 208,008 | ||||||||||||||||||
| Long-term borrowings(7) | 165,546 | 167,286 | 141,466 | 159,816 | 126,770 | 159,255 | ||||||||||||||||||
| Morgan Stanley shareholders� equity | 57,211 | 46,688 | 50,831 | 31,269 | 35,364 | 48,753 | ||||||||||||||||||
| Return on average common shareholders� equity | 8.5 | % | N/M | 3.2 | % | 6.5 | % | 22.0 | % | N/M | ||||||||||||||
| Average common and equivalent shares(4) | 1,361,670,938 | 1,185,414,871 | 1,028,180,275 | 1,001,878,651 | 1,010,254,255 | 1,002,058,928 | ||||||||||||||||||
| N/M�Not | Meaningful |
| (1) | Information includes Morgan Stanley Smith Barney Holdings LLC effective May�31, 2009 (see Note 3 to the consolidated financial statements). |
| (2) | On December�16, 2008, the Board of Directors of the Company approved a change in the Company�s fiscal year-end from November�30 to December�31 of each year. This change to the calendar year reporting cycle began January�1, 2009. As a result of the change, the Company had a one-month transition period in December 2008. |
| (3) | Prior period amounts have been recast for discontinued operations. See Note 1 to the consolidated financial statements for information on discontinued operations. |
| (4) | Amounts shown are used to calculate earnings per basic common share. |
| (5) | For the calculation of basic and diluted earnings per common share, see Note 16 to the consolidated financial statements. |
| (6) | Book value per common share equals common shareholders� equity of $47,614 million at December�31, 2010, $37,091 million at December�31, 2009, $31,676 million at November�30, 2008, $30,169 million at November�30, 2007, $34,264 million at November�30, 2006 and $29,585 million at December�31, 2008, divided by common shares outstanding of 1,512�million at December�31, 2010, 1,361�million at December�31, 2009, 1,048�million at November�30, 2008, 1,056�million at November�30, 2007, 1,049�million at November�30, 2006 and 1,074�million at December�31, 2008. |
| (7) | These amounts exclude the current portion of long-term borrowings and include junior subordinated debt issued to capital trusts. At November�30, 2006, capital units were included in total capital. |
| 43 | |
| Item�7. | Management�s Discussion and Analysis of Financial Condition and Results of Operations. |
Table of Contents Executive Summary. Financial Information and Statistical Data (dollars in millions,
except where noted and per share amounts). | 2010 | 2009(1) | Fiscal 2008 | One Month Ended December�31, 2008 | |||||||||||||
| Net revenues: | ||||||||||||||||
| Institutional Securities | $ | 16,366 | $ | 12,853 | $ | 14,768 | $ | (1,322 | ) | |||||||
| Global Wealth Management Group | 12,636 | 9,390 | 7,019 | 409 | ||||||||||||
| Asset Management | 2,723 | 1,337 | 547 | (9 | ) | |||||||||||
| Intersegment Eliminations | (103 | ) | (146 | ) | (194 | ) | (15 | ) | ||||||||
| Consolidated net revenues | $ | 31,622 | $ | 23,434 | $ | 22,140 | $ | (937 | ) | |||||||
| Consolidated net income (loss) | $ | 5,702 | $ | 1,406 | $ | 1,778 | $ | (1,285 | ) | |||||||
| Net income applicable to noncontrolling interests | 999 | 60 | 71 | 3 | ||||||||||||
| Net income (loss) applicable to Morgan Stanley | $ | 4,703 | $ | 1,346 | $ | 1,707 | $ | (1,288 | ) | |||||||
| Income (loss) from continuing operations applicable to Morgan Stanley: | ||||||||||||||||
| Institutional Securities | $ | 3,747 | $ | 1,393 | $ | 1,358 | $ | (1,271 | ) | |||||||
| Global Wealth Management Group | 519 | 283 | 714 | 73 | ||||||||||||
| Asset Management | 210 | (388 | ) | (856 | ) | (70 | ) | |||||||||
| Intersegment Eliminations | (12 | ) | (8 | ) | (11 | ) | (1 | ) | ||||||||
| Income (loss) from continuing operations applicable�to Morgan Stanley | $ | 4,464 | $ | 1,280 | $ | 1,205 | $ | (1,269 | ) | |||||||
| Amounts applicable to Morgan Stanley: | ||||||||||||||||
| Income (loss) from continuing operations applicable to Morgan Stanley | $ | 4,464 | $ | 1,280 | $ | 1,205 | $ | (1,269 | ) | |||||||
| Net gain (loss) from discontinued operations applicable to Morgan Stanley(2) | 239 | 66 | 502 | (19 | ) | |||||||||||
| Net income (loss) applicable to Morgan Stanley | $ | 4,703 | $ | 1,346 | $ | 1,707 | $ | (1,288 | ) | |||||||
| Earnings (loss) applicable to Morgan Stanley common shareholders | $ | 3,594 | $ | (907 | ) | $ | 1,495 | $ | (1,624 | ) | ||||||
| Earnings (loss) per basic common share: | ||||||||||||||||
| Income (loss) from continuing operations | $ | 2.48 | $ | (0.82 | ) | $ | 1.00 | $ | (1.60 | ) | ||||||
| Net gain (loss) from discontinued operations(2) | 0.16 | 0.05 | 0.45 | (0.02 | ) | |||||||||||
| Earnings (loss) per basic common share(3) | $ | 2.64 | $ | (0.77 | ) | $ | 1.45 | $ | (1.62 | ) | ||||||
| Earnings (loss) per diluted common share: | ||||||||||||||||
| Income (loss) from continuing operations | $ | 2.44 | $ | (0.82 | ) | $ | 0.95 | $ | (1.60 | ) | ||||||
| Net gain (loss) from discontinued operations(2) | 0.19 | 0.05 | 0.44 | (0.02 | ) | |||||||||||
| Earnings (loss) per diluted common share(3) | $ | 2.63 | $ | (0.77 | ) | $ | 1.39 | $ | (1.62 | ) | ||||||
| Regional net revenues(4): | ||||||||||||||||
| Americas | $ | 21,674 | $ | 18,909 | $ | 10,768 | $ | (766 | ) | |||||||
| Europe, Middle East and Africa | 5,628 | 2,529 | 8,977 | (215 | ) | |||||||||||
| Asia | 4,320 | 1,996 | 2,395 | 44 | ||||||||||||
| Consolidated net revenues | $ | 31,622 | $ | 23,434 | $ | 22,140 | $ | (937 | ) | |||||||
Table of Contents Financial
Information and Statistical Data (dollars in millions, except where noted and per share amounts)�(Continued). | 2010 | 2009(1) | Fiscal 2008 | One Month Ended December�31, 2008 | |||||||||||||
| Average common equity (dollars in billions)(5): | ||||||||||||||||
| Institutional Securities | $ | 17.7 | $ | 18.1 | $ | 22.9 | $ | 20.8 | ||||||||
| Global Wealth Management Group | 6.8 | 4.6 | 1.5 | 1.3 | ||||||||||||
| Asset Management | 2.1 | 2.2 | 3.0 | 2.4 | ||||||||||||
| Parent capital | 15.5 | 8.1 | 4.9 | 4.9 | ||||||||||||
| Total from continuing operations | 42.1 | 33.0 | 32.3 | 29.4 | ||||||||||||
| Discontinued operations | 0.3 | 1.1 | 1.3 | 1.2 | ||||||||||||
| Consolidated average common equity | $ | 42.4 | $ | 34.1 | $ | 33.6 | $ | 30.6 | ||||||||
| Return on average common equity(5): | ||||||||||||||||
| Consolidated | 9 | % | N/M | 3 | % | N/M | ||||||||||
| Institutional Securities(5) | 19 | % | N/A | N/A | N/A | |||||||||||
| Global Wealth Management Group | 7 | % | N/A | N/A | N/A | |||||||||||
| Asset Management | 9 | % | N/A | N/A | N/A | |||||||||||
| Book value per common share(6) | $ | 31.49 | $ | 27.26 | $ | 30.24 | $ | 27.53 | ||||||||
| Tangible common equity(7) | $ | 40,667 | $ | 29,479 | N/A | $ | 26,607 | |||||||||
| Tangible book value per common share(8) | $ | 26.90 | $ | 21.67 | N/A | $ | 24.76 | |||||||||
| Effective income tax rate provision (benefit) from continuing operations(9) | 11.9 | % | (34.7 | )% | 1.3 | % | 36.4 | % | ||||||||
| Worldwide employees(10) | 62,542 | 60,494 | 44,716 | 44,352 | ||||||||||||
| Average liquidity (dollars in billions)(11): | ||||||||||||||||
| Parent company liquidity | $ | 65 | $ | 61 | $ | 69 | $ | 64 | ||||||||
| Bank and other subsidiary liquidity | 94 | 93 | 69 | 78 | ||||||||||||
| Total liquidity | $ | 159 | $ | 154 | $ | 138 | $ | 142 | ||||||||
| Capital ratios at December�31, 2010 and 2009(12): | ||||||||||||||||
| Total capital ratio | 16.5 | % | 16.4 | % | N/A | N/A | ||||||||||
| Tier 1 capital ratio | 16.1 | % | 15.3 | % | N/A | N/A | ||||||||||
| Tier 1 leverage ratio | 6.6 | % | 5.8 | % | N/A | N/A | ||||||||||
| Tier 1 common ratio(12) | 10.5 | % | 8.2 | % | N/A | N/A | ||||||||||
| Consolidated assets under management or supervision (dollars in billions)(13)(14): | ||||||||||||||||
| Asset Management(15) | $ | 279 | $ | 266 | $ | 287 | $ | 290 | ||||||||
| Global Wealth Management Group | 477 | 379 | 128 | 129 | ||||||||||||
| Total | $ | 756 | $ | 645 | $ | 415 | $ | 419 | ||||||||
| Institutional Securities: | ||||||||||||||||
| Pre-tax profit margin(16) | 27 | % | 9 | % | 10 | % | N/M | |||||||||
| Global Wealth Management Group: | ||||||||||||||||
| Global representatives(17) | 18,043 | 18,135 | 8,426 | 8,356 | ||||||||||||
| Annualized net revenues per global representative (dollars in thousands)(18) | $ | 698 | $ | 666 | $ | 746 | $ | 585 | ||||||||
| Assets by client segment (dollars in billions): | ||||||||||||||||
| $10 million or more | $ | 522 | $ | 453 | $ | 152 | $ | 155 | ||||||||
| $1 million to $10 million | 707 | 637 | 197 | 196 | ||||||||||||
| Subtotal $1 million or more | 1,229 | 1,090 | 349 | 351 | ||||||||||||
| $100,000 to $1 million | 399 | 418 | 151 | 155 | ||||||||||||
| Less than $100,000 | 41 | 52 | 22 | 22 | ||||||||||||
| Corporate and other accounts(19) | � | � | 24 | 22 | ||||||||||||
| Total client assets | $ | 1,669 | $ | 1,560 | $ | 546 | $ | 550 | ||||||||
Table of Contents Financial
Information and Statistical Data (dollars in millions, except where noted and per share amounts)�(Continued). | 2010 | 2009(1) | Fiscal 2008 | One Month Ended December�31, 2008 | |||||||||||||
| Fee-based assets as a percentage of total client assets | 28 | % | 24 | % | 25 | % | 25 | % | ||||||||
| Client assets per global representative(20) | $ | 93 | $ | 86 | $ | 65 | $ | 66 | ||||||||
| Bank deposits (dollars in billions)(21) | $ | 113 | $ | 112 | $ | 36 | $ | 39 | ||||||||
| Pre-tax profit margin(16) | 9 | % | 6 | % | 16 | % | 29 | % | ||||||||
| Asset Management(13): | ||||||||||||||||
| Assets under management or supervision (dollars in billions) | $ | 279 | $ | 266 | $ | 287 | $ | 290 | ||||||||
| Pre-tax profit margin(16) | 27 | % | N/M | N/M | N/M | |||||||||||
| (1) | Information includes MSSB effective from May�31, 2009 (see Note 3 to the consolidated financial statements). |
| (2) | See Note 1 to the consolidated financial statements for information on discontinued operations. |
| (3) | For the calculation of basic and diluted earnings per share (�EPS�), see Note 16 to the consolidated financial statements. |
| (4) | In 2010, regional net revenues, primarily in the Americas, were negatively impacted by the tightening of the Company�s credit spreads, which resulted in the increase in the fair value of certain of the Company�s long-term and short-term structured notes.�In 2009, regional net revenues, primarily in Europe, Middle East and Africa, were negatively impacted by the tightening of the Company�s credit spreads. For a discussion of the Company�s methodology used to allocate revenues among the regions, see Note 23 to the consolidated financial statements. |
| (5) | The computation of average common equity for each business segment in 2010 is determined using the Company�s Required Capital framework (�Required Capital Framework�), an internal capital adequacy measure (see �Liquidity and Capital Resources�Required Capital� herein). Business segment capital prior to 2010 has not been restated under this framework. As a result, the business segments� return on average common equity from continuing operations prior to 2010 is not available. The Required Capital framework will evolve over time in response to changes in the business and regulatory environment and to incorporate enhancements in modeling techniques. The return on average common equity uses income from continuing operations applicable to Morgan Stanley less preferred dividends as a percentage of average common equity. The effective tax rates used in the computation of business segment return on average common equity were determined on a separate entity basis. Excluding the effect of the discrete tax benefits in 2010, the return on average common equity for the Institutional Securities business segment would have been 13% (see �Executive Summary�Significant Items� herein). |
| (6) | Book value per common share equals common shareholders� equity of $47,614 million at December�31, 2010, $37,091 million at December�31, 2009, $31,676 million at November�30, 2008 and $29,585 million at December�31, 2008, divided by common shares outstanding of 1,512�million at December�31, 2010, 1,361�million at December�31, 2009, 1,048�million at November�30, 2008 and 1,074�million at December�31, 2008. Book value per common share in 2010 included a benefit of approximately $1.40 per share due to the issuance of 116�million shares of common stock corresponding to the mandatory redemption of the junior subordinated debentures underlying $5.6 billion of equity units (see �Other Matters�Redemption of CIC Equity Units and Issuance of Common Stock� herein). |
| (7) | Tangible common equity is a non-Generally Accepted Accounting Principle (�GAAP�) financial measure that the Company considers to be a useful measure that the Company and investors use to assess capital adequacy. For a discussion of tangible common equity, see �Liquidity and Capital Resources�The Balance Sheet� herein. |
| (8) | Tangible book value per common share is a non-GAAP financial measure that the Company considers to be a useful measure that the Company and investors use to assess capital adequacy. Tangible book value per common share equals tangible common equity divided by period-end common shares outstanding. |
| (9) | For a discussion of the effective income tax rate, see �Executive Summary�Significant Items� herein. |
| (10) | Worldwide employees at December�31, 2010 and December�31, 2009 include additional worldwide employees of businesses contributed by Citigroup, Inc. (�Citi�) related to MSSB. |
| (11) | For a discussion of average liquidity, see �Liquidity and Capital Resources�Liquidity Management Policies�Liquidity Reserves� herein. |
| (12) | Tier 1 common ratio is a non-GAAP financial measure that the Company considers to be a useful measure that the Company and investors use to assess capital adequacy. For a discussion of total capital ratio, Tier 1 capital ratio and Tier 1 leverage ratio, see �Liquidity and Capital Resources�Regulatory Requirements� herein. For a discussion of Tier 1 common ratio, see �Liquidity and Capital Resources�The Balance Sheet� herein. |
| (13) | Amount excludes substantially all of the Company�s retail asset management business (�Retail Asset Management�) that was sold to Invesco Ltd. (�Invesco�) (see �Executive Summary�Significant Items� herein). |
| (14) | Revenues and expenses associated with these assets are included in the Company�s Asset Management and Global Wealth Management Group business segments. |
| (15) | Amounts include Asset Management�s proportionate share of assets managed by entities in which it owns a minority stake. |
Table of Contents| (16) | Pre-tax profit margin is a non-GAAP financial measure that the Company considers to be a useful measure that the Company and investors use to assess operating performance. Percentages represent income from continuing operations before income taxes as a percentage of net revenues. |
| (17) | Global representatives at December�31, 2010 and December�31, 2009 include additional global representatives of businesses contributed by Citi related to MSSB. |
| (18) | Annualized net revenues per global representative for 2010, 2009, fiscal 2008 and the one month ended December�31, 2008 equals Global Wealth Management Group�s net revenues (excluding the sale of Morgan Stanley Wealth Management S.V., S.A.U. (�MSWM S.V.�) for fiscal 2008) divided by the quarterly weighted average global representative headcount for 2010, 2009, fiscal 2008 and the one month ended December�31, 2008, respectively. |
| (19) | Beginning in 2009, amounts for Corporate and other accounts are presented in the appropriate client segment. |
| (20) | Client assets per global representative equal total period-end client assets divided by period-end global representative headcount. |
| (21) | Approximately $55�billion and $54 billion of the bank deposit balances at December�31, 2010 and December�31, 2009, respectively, are held at Company-affiliated depositories with the remainder held at Citi-affiliated depositories. These deposit balances are held at certain of the Company�s Federal Deposit Insurance Corporation (the �FDIC�) insured depository institutions for the benefit of the Company�s clients through their accounts. |
Table of Contents Overview of 2010 Financial Results. Consolidated Review .����The Company recorded net income applicable to Morgan Stanley of $4,703
million in 2010, a 249% increase from $1,346 million in 2009. Net
revenues increased 35% to $31,622 million in 2010 from $23,434 million in 2009, primarily driven by the Institutional Securities business segment and MSSB. Net revenues in 2010 included negative revenues of $873 million due to the tightening of the
Company�s credit spreads on certain of the Company�s long-term and short-term borrowings, primarily structured notes, for which the fair value option was elected, compared with negative revenues of $5,510 million in 2009 due to the
tightening of the Company�s credit spreads on such borrowings. In addition, results for 2010 included a pre-tax gain of $668 million from the sale of the Company�s investment in China International Capital Corporation Limited
(�CICC�). Non-interest expenses increased 13% to $25,420�million in 2010. Compensation and benefits expense increased 11% and non-compensation expenses increased 17%, primarily due to increased compensation costs and non-compensation
costs in the Global Wealth Management Group business segment, primarily due to MSSB. The increase was also due to a charge of $272 million related to the U.K. government�s payroll tax on discretionary bonuses reflected in 2010 compensation and
benefits expense. Diluted EPS were $2.63 in 2010 compared with $(0.77) in 2009. Diluted EPS from continuing operations were $2.44 in 2010 compared with $(0.82) in 2009. The Company�s effective income tax rate from continuing operations was
11.9% in 2010. The effective tax rate for 2010 includes tax benefits of $382 million related to the reversal of U.S. deferred tax liabilities associated with prior-years� undistributed earnings of certain non-U.S. subsidiaries that were
determined to be indefinitely reinvested abroad, $345 million associated with the remeasurement of net unrecognized tax benefits and related interest based on new information regarding the status of federal and state examinations, and $277 million
associated with the planned repatriation of non-U.S. earnings at a cost lower than originally estimated. Excluding the benefits noted above, the effective tax rate from continuing operations in 2010 would have been 28.0%. The annual effective tax
rate in 2010 is reflective of the geographic mix of earnings. The
Company�s effective income tax rate from continuing operations was a benefit of 34.7% in 2009. The effective tax rate for 2009 includes a tax benefit of $331 million resulting from the cost of anticipated repatriation of non-U.S. earnings at
lower than previously estimated tax rates. Excluding this benefit, the annual effective tax rate from continuing operations for 2009 would have been a benefit of 1.0%. The annual effective tax rate in 2009 is reflective of the geographic mix of
earnings and includes tax benefits associated with the anticipated use of domestic tax credits and the utilization of state net operating losses. Discontinued operations for 2010 included: a loss of $1.2 billion due to a writedown and related costs associated with the planned disposition of Revel
Entertainment Group, LLC (�Revel�), a development stage enterprise and subsidiary of the Company that is primarily associated with a development property in Atlantic City, New Jersey; a gain of $775 million related to a legal settlement
with Discover Financial Services (�DFS�); and an after-tax gain of approximately $570 million related to the Company�s sale of Retail Asset Management, including Van Kampen Investments, Inc. (�Van Kampen�), to Invesco. Institutional Securities .����Income
from continuing operations before income taxes was $4,338 million in 2010 compared with $1,088 million in 2009. Net revenues were $16,366 million in 2010 compared with $12,853 million in 2009. Investment banking revenues decreased 4%, reflecting
lower revenues from equity underwriting and lower advisory fees from merger, acquisition and restructuring transactions, partially offset by higher revenues from fixed income underwriting. Investment banking revenues in 2010�were also impacted
by the deconsolidation of the majority of the�Company�s�Japanese�investment banking�business as a result of the closing of the transaction between the Company and MUFG to form a joint venture in Japan (the �MUFG
Transaction�) (see �Other Matters�Japan Securities Joint Venture� herein).�Equity sales and trading revenues increased 31% to $4,840 million in 2010 from $3,690 million in 2009. Equity sales and trading revenues reflected
negative revenue of approximately $121 million in 2010 due to the tightening of the Company�s credit spreads resulting 49 Table of Contents from the increase in the fair value of certain of the Company�s long-term and short-term borrowings, primarily structured notes, for which the fair value option was elected, compared with
negative revenues of approximately $1,738 million in 2009. Lower results in the cash and derivatives businesses in 2010 reflected solid customer flows offset by a challenging trading environment. Fixed income sales and trading revenues in 2010
increased 21% to $5,867 million in 2010 from $4,854 million in 2009. Fixed income sales and trading revenues reflected negative revenues of approximately $703 million in 2010 due to the tightening of the Company�s credit spreads resulting from
the increase in the fair value of certain of the Company�s long-term and short-term borrowings, primarily structured notes, for which the fair value option was elected compared with negative revenues of approximately $3,321 million in 2009.
Interest rate and currency product revenues decreased 38% in 2010 reflecting lower trading results across most businesses. Results for 2010 primarily reflected solid customer flows in interest rate, credit and currency products, which were partly
offset by a challenging trading environment. Principal transaction net investment gains of $809�million were recognized in 2010 compared with net investment losses of $864 million in 2009. Non-interest expenses increased 2% to $12,028 million
in 2010 from $11,765 million in 2009. Compensation and benefits expenses decreased 2% in 2010. Global Wealth Management Group .����Income from continuing operations before income taxes was $1,156 million in 2010 compared with $559 million in 2009. Net revenues were $12,636
million compared with $9,390 million in 2009. Investment banking revenues increased 39% in 2010, primarily benefiting from a full year of MSSB and higher closed-end fund activity. Principal transactions trading revenues increased 8% in 2010,
primarily benefiting from a full year of MSSB, net gains related to investments associated with certain employee deferred compensation plans and gains on certain investments. Commission revenues increased 28% in 2010, primarily benefiting from a
full year of MSSB and higher client activity. Asset management, distribution and administration fees increased 39% in 2010 benefiting from a full year of MSSB and improved market conditions. Net interest increased 70% in 2010 primarily resulting
from an increase in interest income benefiting from a full year of MSSB, the Securities Available for Sale (�AFS�) portfolio and the change in classification of the bank deposit program, partially offset by increased funding costs (see
�Global Wealth Management Group�Asset Management, Distribution and Administration Fees� herein). Non-interest expenses were $11,480 million in 2010 compared with $8,831 million in 2009. Asset Management .����Income from continuing
operations before income taxes was $723 million in 2010 compared with a loss of $653 million in 2009. Net revenues were $2,723 million in 2010 compared with $1,337 million in 2009. The Company recorded principal transactions net investment gains of
$996 million in 2010 compared with losses of $173 million in 2009. Non-interest expenses were $2,000 million in 2010 compared with $1,990 million in 2009. Significant Items. Mortgage-Related Trading .����The Company recorded mortgage-related trading gains (losses) primarily related to commercial
mortgage-backed securities, commercial whole loan positions, U.S. subprime mortgage proprietary trading exposures and non-subprime residential mortgages of $1.2 billion, $(0.6) billion, $(2.6) billion and $(0.1) billion in 2010, 2009, fiscal 2008
and the one month ended December�31, 2008, respectively. 50 Table of Contents Real Estate Investments .����The Company recorded gains (losses) in the following
business segments related to real estate investments. These amounts exclude investments associated with certain deferred compensation and employee co-investment plans. | 2010 | 2009 | Fiscal 2008 | One Month Ended December�31, 2008 | |||||||||||||
| (dollars in billions) | ||||||||||||||||
| Institutional Securities | ||||||||||||||||
| Continuing operations(1) | $ | 0.2 | $ | (0.8 | ) | $ | (1.2 | ) | $ | (0.1 | ) | |||||
| Discontinued operations(2) | (1.2 | ) | � | � | � | |||||||||||
| Total Institutional Securities | (1.0 | ) | (0.8 | ) | (1.2 | ) | (0.1 | ) | ||||||||
| Asset Management: | ||||||||||||||||
| Continuing operations(3) | 0.5 | (0.5 | ) | (0.6 | ) | � | ||||||||||
| Discontinued operations(2) | � | (0.6 | ) | (0.5 | ) | � | ||||||||||
| Total Asset Management | 0.5 | (1.1 | ) | (1.1 | ) | � | ||||||||||
| Amounts applicable to noncontrolling interests | 0.5 | � | � | � | ||||||||||||
| Total | $ | (1.0 | ) | $ | (1.9 | ) | $ | (2.3 | ) | $ | (0.1 | ) | ||||
| (1) | Gains (losses) related to net realized and unrealized gains (losses) from the Company�s limited partnership investments in real estate funds and are reflected in Principal transactions�Investments in the consolidated statements of income. |
| (2) | On March�31, 2010, the Board of Directors authorized a plan of disposal by sale for Revel. The results of Revel, including the estimated loss from the planned disposal, are reported as discontinued operations for all periods presented within the Institutional Securities business segment. In the Asset Management business segment, amounts related to the disposition of Crescent Real Estate Equities Limited Partnership (�Crescent�), which was disposed in the fourth quarter of 2009 (see Note 1 to the consolidated financial statements). |
| (3) | Gains (losses) related to net realized and unrealized gains (losses) from real estate investments in the Company�s merchant banking business and are reflected in Principal transactions�Investments in the consolidated statements of income. |
Table of Contents Monoline Insurers .����Monoline insurers (�Monolines�) provide credit
enhancement to capital markets transactions. The current credit environment continues to affect the ability of such financial guarantors to provide enhancement to existing capital market transactions. The Company�s direct exposure to Monolines
is limited to bonds that are insured by Monolines and to derivative contracts with a Monoline as counterparty (principally an affiliate of MBIA Inc. (�MBIA�)). The Company�s exposure to Monolines at December�31, 2010 includes
$1.5 billion in insured municipal bond securities and $326 million of mortgage and asset-backed securities enhanced by financial guarantees. Excluding MBIA, derivative counterparty exposure includes gross exposures of approximately $440 million, net
of cumulative credit valuation adjustments and hedges. The positive net derivative counterparty exposure (the sum of net long positions for each individual counterparty) was insignificant at December 31, 2010. Positive net derivative counterparty
exposure is defined as potential loss to the Company over a period of time in an event of 100% default of a Monoline, assuming zero recovery. Amounts related to MBIA derivative counterparty exposure are not included in the above amounts since, at
December�31, 2010, the aggregate value of cumulative credit valuation adjustments and hedges exceeded the amount of gross exposure of $4.2 billion by $1.1 billion. The results for 2010 included losses�of $865 million related to�the
Company�s�Monoline�counterparty�credit exposures, principally MBIA, compared with losses of $232 million, $1.7 billion and $203 million in 2009, fiscal 2008 and the one month ended December�31, 2008, respectively. The
Company�s hedging program for Monoline counterparty exposure continues to become more costly and difficult to effect, and, as such, the losses in 2010 reflected those additional costs as well as volatility on those hedges caused by the
tightening of both MBIA and commercial mortgage-backed spreads. The Company proactively manages its Monoline exposure; however, as market conditions continue to evolve, significant additional losses could be incurred. The Company�s hedging
program includes the use of single name and index transactions that mitigate credit exposure to the Monolines as well as certain market risk components of existing underlying commercial mortgage-backed securities transactions with the Monolines and
is conducted as part of the Company�s overall market risk management. See �Qualitative and Quantitative Disclosure about Market Risk�Risk Management�Market Risk� in Part II, Item�7A herein. Settlement with DFS .����On June�30, 2007, the
Company completed the spin-off of its business segment DFS to its shareholders. On February�11, 2010, DFS paid the Company $775 million in complete satisfaction of its obligations to the Company regarding the sharing of proceeds from a lawsuit
against Visa and MasterCard. The payment was recorded as a gain in discontinued operations in the consolidated statement of income for 2010. Gain on Sale of Noncontrolling Interest .����In connection with the MUFG Transaction (see �Other Matters�Japan
Securities Joint Venture� herein), the Company recorded an after-tax gain of $731 million from the sale of a noncontrolling interest in its Japanese institutional securities business. This gain was recorded in Paid-in capital in the
Company�s consolidated statements of financial condition at December�31, 2010 and changes in total equity for 2010. Gain on Sale of Retail Asset Management .����On June�1, 2010, the Company completed the sale of Retail Asset Management,
including Van Kampen, to Invesco. The Company received $800 million in cash and approximately 30.9�million shares of Invesco stock upon sale, resulting in a cumulative after-tax gain of $682 million, of which $570 million was recorded in 2010.
The remaining gain, representing tax basis benefits, was recorded in the quarter ended December�31, 2009. The results of Retail Asset Management are reported as discontinued operations within the Asset Management business segment for all
periods presented through the date of divestiture. The Company recorded the 30.9�million shares as securities available for sale. In November 2010, the Company sold its investment in Invesco, resulting in a realized gain of approximately $102
million reported within Other revenues in the consolidated statement of income for 2010. Sale of Stake in CICC .����In December 2010, the Company completed the sale of its 34.3% stake in CICC for a pre-tax gain of approximately $668 million, which is included within
Other revenues in the consolidated statement of income for 2010. See Note 24 to the consolidated financial statements. 52 Table of Contents Corporate Lending .����The Company recorded the following amounts primarily
associated with loans and lending commitments carried at fair value within the Institutional Securities business segment: | 2010(1) | 2009(1) | Fiscal 2008(1) | One Month Ended December�31, 2008(1) | |||||||||||||
| (dollars in billions) | ||||||||||||||||
| Gains (losses) on loans and lending commitments | $ | 0.3 | $ | 4.0 | $ | (6.3 | ) | $ | (0.5 | ) | ||||||
| Gains (losses) on hedges | (0.7 | ) | (3.2 | ) | 3.0 | (0.1 | ) | |||||||||
| Total gains (losses) | $ | (0.4 | ) | $ | 0.8 | $ | (3.3 | ) | $ | (0.6 | ) | |||||
| (1) | Amounts include realized and unrealized gains (losses). |
Table of Contents Subsidiary Banks .����The Company recorded losses of approximately $70 million,
gains of approximately $140 million and losses of approximately $900 million in 2010, 2009 and fiscal 2008, respectively, related to securities portfolios in the Company�s domestic subsidiary banks, Morgan Stanley Bank, N.A. and Morgan Stanley
Private Bank, National Association (formerly, Morgan Stanley Trust FSB) (the �Subsidiary Banks�). ARS .����Under the terms of various agreements entered into with government agencies and the terms of the Company�s announced offer to repurchase, the Company agreed to
repurchase at par certain Auction Rate Securities (�ARS�) held by retail clients that were purchased through the Company. In addition, the Company agreed to reimburse retail clients who have sold certain ARS purchased through the Company
at a loss. Fiscal 2008 reflected charges of $532 million for the ARS repurchase program and writedowns of $108 million associated with ARS held in inventory. Sales of Subsidiaries and Other Items .����Results for fiscal 2008 included a pre-tax gain of $687 million related to the sale
of MSWM S.V. (see Note 19 to the consolidated financial statements). Business Segments. Substantially all of the Company�s operating revenues and operating expenses can be directly attributed to its business segments. Certain revenues and expenses have been allocated to each business
segment, generally in proportion to its respective revenues or other relevant measures. As a result of treating certain intersegment transactions as transactions with external parties, the Company includes an Intersegment Eliminations category to reconcile the business segment results to the
Company�s consolidated results. Income before taxes in Intersegment Eliminations primarily represents the effect of timing differences associated with the revenue and expense recognition of commissions paid by the Asset Management business
segment to the Global Wealth Management Group business segment associated with sales of certain products and the related compensation costs paid to the Global Wealth Management Group business segment�s global representatives. Intersegment
Eliminations also reflect the effect of fees paid by the Institutional Securities business segment to the Global Wealth Management Group business segment related to the bank deposit program. Losses from continuing operations before income taxes
recorded in Intersegment Eliminations were $15 million, $11 million, $17 million and $1 million in 2010, 2009, fiscal 2008 and the one month ended December�31, 2008, respectively. From�June�2009 until April�1, 2010, in the Global Wealth Management Group business segment, revenues in the bank
deposit program�were primarily included in Asset�management, distribution and administration fees. Prior to June 2009, these revenues were previously reported�in Interest�income. The change was the result of agreements that were
entered into in connection with the MSSB transaction. Beginning on April�1, 2010, revenues in the bank deposit program held at the Company�s depository institutions are recorded as Interest income, due to renegotiations of the revenue
sharing agreement as part of the Global Wealth Management Group business segment�s retail banking strategy. The Global Wealth Management Group business segment will continue to earn referral fees for deposits placed with Citi depository
institutions, and these fees will continue to be recorded in Asset management, distribution and administration fees until the legacy Smith Barney deposits are migrated to the Company�s depository institutions. Effective January�1, 2010, certain transfer pricing arrangements between
the Global Wealth Management Group business segment and the Institutional Securities business segment relating to Global Wealth Management Group business segment�s fixed income trading activities were modified to conform to agreements with Citi
in connection with MSSB. In addition, with an effective date of
January�1, 2010, the Global Wealth Management Group business segment sold approximately $3�billion of ARS to the Institutional Securities business segment at book value. 54 Table of Contents The Company changed the allocation methodology in the Institutional Securities business segment for funding
costs centrally managed by the Company�s Treasury Department between equity and fixed income sales and trading to more accurately reflect business activity. Effective January�1, 2010, funding costs were allocated 35% to equity sales and
trading and 65% to fixed income sales and trading. Prior to January�1, 2010, funding costs were allocated 20% and 80% to equity and fixed income sales and trading, respectively. The Company regularly evaluates the appropriateness of funding
cost allocations with respect to business activities and may, in the future, modify further the allocation percentages. Effective January�1, 2010, in the Institutional Securities business segment, Equity sales and trading revenues include Asset management, distribution
and administration fees as these fees relate to administrative services primarily provided to the Company�s prime brokerage clients and, therefore, closely align to equity sales and trading revenues. Prior periods have been adjusted to conform
to the current presentation. 55 Table of Contents INSTITUTIONAL SECURITIES INCOME STATEMENT INFORMATION | 2010 | 2009 | Fiscal 2008 | One Month Ended December�31, 2008 | |||||||||||||
| (dollars�in�millions) | ||||||||||||||||
| Revenues: | ||||||||||||||||
| Investment banking | $ | 4,295 | $ | 4,455 | $ | 3,630 | $ | 177 | ||||||||
| Principal transactions: | ||||||||||||||||
| Trading | 8,154 | 6,591 | 5,897 | (1,462 | ) | |||||||||||
| Investments | 809 | (864 | ) | (2,461 | ) | (158 | ) | |||||||||
| Commissions | 2,274 | 2,152 | 3,094 | 127 | ||||||||||||
| Asset management, distribution and administration fees | 104 | 98 | 142 | 10 | ||||||||||||
| Other | 996 | 545 | 2,722 | 91 | ||||||||||||
| Total non-interest revenues | 16,632 | 12,977 | 13,024 | (1,215 | ) | |||||||||||
| Interest income | 5,877 | 6,373 | 37,604 | 1,017 | ||||||||||||
| Interest expense | 6,143 | 6,497 | 35,860 | 1,124 | ||||||||||||
| Net interest | (266 | ) | (124 | ) | 1,744 | (107 | ) | |||||||||
| Net revenues | 16,366 | 12,853 | 14,768 | (1,322 | ) | |||||||||||
| Compensation and benefits | 7,081 | 7,212 | 7,084 | 280 | ||||||||||||
| Non-compensation expenses | 4,947 | 4,553 | 6,144 | 395 | ||||||||||||
| Total non-interest expenses | 12,028 | 11,765 | 13,228 | 675 | ||||||||||||
| Income (loss) from continuing operations before income taxes | 4,338 | 1,088 | 1,540 | (1,997 | ) | |||||||||||
| Provision for (benefit from) income taxes | 301 | (301 | ) | 149 | (726 | ) | ||||||||||
| Income (loss) from continuing operations | 4,037 | 1,389 | 1,391 | (1,271 | ) | |||||||||||
| Discontinued operations: | ||||||||||||||||
| Gain (loss) from discontinued operations | (1,175 | ) | 396 | 1,460 | (20 | ) | ||||||||||
| Provision for (benefit from) income taxes | 26 | 229 | 575 | (1 | ) | |||||||||||
| Net gain (loss) on discontinued operations | (1,201 | ) | 167 | 885 | (19 | ) | ||||||||||
| Net income (loss) | 2,836 | 1,556 | 2,276 | (1,290 | ) | |||||||||||
| Net income applicable to noncontrolling interests | 290 | 12 | 71 | 3 | ||||||||||||
| Net income (loss) applicable to Morgan Stanley | $ | 2,546 | $ | 1,544 | $ | 2,205 | $ | (1,293 | ) | |||||||
| Amounts applicable to Morgan Stanley: | ||||||||||||||||
| Income (loss) from continuing operations | $ | 3,747 | $ | 1,393 | $ | 1,358 | $ | (1,271 | ) | |||||||
| Net gain (loss) from discontinued operations | (1,201 | ) | 151 | 847 | (22 | ) | ||||||||||
| Net income (loss) applicable to Morgan Stanley | $ | 2,546 | $ | 1,544 | $ | 2,205 | $ | (1,293 | ) | |||||||
Table of Contents Supplemental Financial Information. Investment Banking. Investment banking revenues are composed of fees from advisory services and revenues from the underwriting of securities offerings and syndication of
loans, net of syndication expenses. Investment banking revenues
were as follows: | 2010 | 2009(1) | Fiscal 2008 | One Month Ended December�31, 2008 | |||||||||||||
| (dollars�in�millions) | ||||||||||||||||
| Advisory fees from merger, acquisition and restructuring transactions | $ | 1,470 | $ | 1,488 | $ | 1,740 | $ | 68 | ||||||||
| Equity underwriting revenues | 1,454 | 1,695 | 1,045 | 47 | ||||||||||||
| Fixed income underwriting revenues | 1,371 | 1,272 | 845 | 62 | ||||||||||||
| Total investment banking revenues | $ | 4,295 | $ | 4,455 | $ | 3,630 | $ | 177 | ||||||||
| (1) | All prior-period amounts have been reclassified to conform to the current period�s presentation. |
| 2010 | 2009(1) | Fiscal 2008(1) | One Month Ended December�31, 2008(1) | |||||||||||||
| (dollars�in�millions) | ||||||||||||||||
| Principal transactions�Trading | $ | 8,154 | $ | 6,591 | $ | 5,897 | $ | (1,462 | ) | |||||||
| Commissions | 2,274 | 2,152 | 3,094 | 127 | ||||||||||||
| Asset management, distribution and administration fees | 104 | 98 | 142 | 10 | ||||||||||||
| Net interest | (266 | ) | (124 | ) | 1,744 | (107 | ) | |||||||||
| Total sales and trading revenues | $ | 10,266 | $ | 8,717 | $ | 10,877 | $ | (1,432 | ) | |||||||
| (1) | All prior-period amounts have been reclassified to conform to the current period�s presentation. See �Business Segments� and �Other Matters�Dividend Income� herein for further information. |
| 57 | |
| 2010 | 2009(1) | Fiscal 2008(1) | One Month Ended December�31, 2008(1) | |||||||||||||
| (dollars�in�millions) | ||||||||||||||||
| Equity | $ | 4,840 | $ | 3,690 | $ | 9,881 | $ | (11 | ) | |||||||
| Fixed income | 5,867 | 4,854 | 4,115 | (858 | ) | |||||||||||
| Other(2) | (441 | ) | 173 | (3,119 | ) | (563 | ) | |||||||||
| Total sales and trading revenues | $ | 10,266 | $ | 8,717 | $ | 10,877 | $ | (1,432 | ) | |||||||
| (1) | All prior-period amounts have been reclassified to conform to the current period�s presentation. |
| (2) | Other sales and trading net revenues primarily included net gains (losses) from loans and lending commitments and related hedges associated with the Company�s lending and other corporate activities. Other sales and trading net revenues also included net losses associated with costs related to the amount of liquidity (�negative carry�) in the Subsidiary Banks. |
Table of Contents In 2010, equity sales and trading revenues also reflected unrealized gains of approximately $20 million
related to changes in the fair value of net derivative contracts attributable to the tightening of counterparties� credit default swap spreads compared with unrealized gains of approximately $198 million in 2009. The Company also recorded
unrealized gains of $31 million in 2010 related to changes in the fair value of net derivative contracts attributable to the widening of the Company�s credit default swap spreads compared with unrealized losses of approximately $154 million in
2009 from the tightening of the Company�s credit default swap spreads. The unrealized gains and losses on credit default swap spreads do not reflect any gains or losses on related hedging instruments. Fixed Income. Fixed income sales and trading
revenues increased 21% to $5,867 million in 2010 from $4,854 million in 2009. Results in 2010 included negative revenues of approximately $703 million due to the tightening of the Company�s credit spreads resulting from the increase in the fair
value of certain of the Company�s long-term and short-term borrowings, primarily structured notes, for which the fair value option was elected compared with negative revenues of approximately $3,321 million in 2009. Interest rate, credit and
currency product revenues decreased 38% in 2010, reflecting lower trading results across most businesses. Results for 2010 primarily reflected solid customer flows in interest rate, credit and currency products, which were partly offset by a
challenging trading environment. Interest rate, credit and currency product net revenues in 2010 were also negatively impacted by losses of $865 million from Monolines compared with losses of $232 million in 2009. Results in interest rate, credit
and currency products also included a gain of approximately $123 million related to a change in the fair value measurement methodology to use the OIS curve as an input to value substantially all collateralized interest rate derivative contracts (see
�Overview of 2010 Financial Results�Significant Items�OIS Fair Value Measurement� herein and Note 4 to the consolidated financial statements). Commodity net revenues decreased 27% in 2010, primarily due to low levels of client
activity and market volatility. Results in 2009 included a gain of approximately $319 million related to the sale of undivided participating interests in a portion of the Company�s claims against a derivative counterparty that filed for
bankruptcy protection (see Note 18 to the consolidated financial statements). In 2010, fixed income sales and trading revenues reflected net unrealized gains of $603�million related to changes in the fair value of net derivative contracts attributable to the tightening of
counterparties� credit default swap spreads compared with unrealized gains of approximately $3,462 million in 2009. The Company also recorded unrealized gains of $287 million in 2010 related to changes in the fair value of net derivative
contracts attributable to the widening of the Company�s credit default swap spreads compared with unrealized losses of approximately $1,938 million in 2009 from the tightening of the Company�s credit default swap spreads. The unrealized
gains and losses on credit default swap spreads do not reflect any gains or losses on related hedging instruments. Other. In addition to the equity and fixed income sales and trading revenues discussed above, sales and trading revenues included other trading revenues, consisting primarily
of certain activities associated with the Company�s corporate activities. In connection with its corporate lending activities, the Company provides to select clients loans or lending commitments (including bridge financing) that are generally
classified as either �event-driven� or �relationship-driven.� �Event-driven� loans and lending commitments refer to activities associated with a particular event or transaction, such as to support client merger,
acquisition or recapitalization transactions. �Relationship-driven� loans and lending commitments are generally made to expand business relationships with select clients. For further information about the Company�s corporate lending
activities, see Item�7A, �Quantitative and Qualitative Disclosures about Market Risk�Credit Risk� herein. The fair value measurement of loans and lending commitments takes into account fee income that is considered an attribute
of the contract. The valuation of these commitments could change in future periods depending on, among other things, the extent that they are renegotiated or repriced or if the associated acquisition transaction does not occur. Other sales and
trading also includes costs related to negative carry. In 2010,
other sales and trading net revenues reflected a net loss of $441 million compared with net gains of $173 million in 2009. Results in 2010 primarily included net losses of approximately $342 million (mark-to-market 59 Table of Contents valuations and realized gains of approximately $327 million offset by losses on related hedges of approximately $669 million) associated with loans and lending commitments and the costs related
to negative carry in the Subsidiary Banks. Results in 2009 included net gains of approximately $804 million (mark-to-market valuations and realized gains of approximately $4,042 million, partially offset by losses on related hedges of approximately
$3,238 million) associated with loans and lending commitments. Results in 2009 also included losses of $362 million, reflecting the improvement in the Company�s debt-related credit spreads on certain debt related to China Investment
Corporation�s (�CIC�) investment in the Company. Results in 2010 also included a gain of approximately $53 million related to the OIS curve fair value methodology referred to above (see �Overview of 2010 Financial
Results�Significant Items�OIS Fair Value Measurement� and Note 4 to the consolidated financial statements). Principal Transactions�Investments . The Company�s investments generally are held for
long-term appreciation and generally are subject to significant sales restrictions. Estimates of the fair value of the investments may involve significant judgment and may fluctuate significantly over time in light of business, market, economic and
financial conditions generally or in relation to specific transactions. Principal transaction net investment gains of $809 million were recognized in 2010 compared with net investment losses of $864�million in 2009. The results for 2010 reflected a gain of $313 million
on a principal investment held by a consolidated investment partnership, which was sold in 2010. The portion of the gain related to third-party investors amounted to $183 million and was recorded in the net income applicable to noncontrolling
interests in the consolidated statement of income. The results in 2010 also reflected gains on principal investments in real estate funds and investments associated with certain employee deferred compensation and co-investment plans compared with
losses on such investments in 2009. Other. Other revenues increased 83% in 2010, primarily reflecting a pre-tax gain of $668 million from the sale of the
Company�s investment in CICC. Results in 2009 included gains of approximately $465 million from the Company�s repurchase of its debt in the open market. Non-interest Expenses. Non-interest
expenses increased 2% in 2010, primarily due to higher non-compensation expenses, partially offset by lower compensation expense. Compensation and benefits expenses decreased 2% in 2010, primarily due to lower net revenues, excluding the impact of
negative revenues related to the Company�s debt-related credit spreads. Compensation and benefits expenses in 2010 included a charge of approximately $269 million related to the U.K. government�s payroll tax on discretionary above-base
compensation. Non-compensation expenses increased 9% in 2010. Brokerage and clearing expense increased 18% in 2010, primarily due to higher levels of business activity. Information processing and communications expense increased 12% in 2010,
primarily due to ongoing investments in technology. Marketing and business development expense increased 35% in 2010, primarily due to higher levels of business activity. Professional services expense increased 9% in 2010, primarily due to higher
technology consulting expenses and higher legal fees. Other expenses decreased 6% in 2010, primarily related to insurance recoveries reflected in 2010 and a loss provision in deferred compensation plans reflected in 2009. The decrease in 2010 was
partially offset by higher provisions for litigation and regulatory proceedings, including $102.7 million related to the Assurance of Discontinuance that was entered into on June�24, 2010 between the Company and the Office of the Attorney
General for the Commonwealth of Massachusetts (�Massachusetts OAG�) to resolve the Massachusetts OAG�s investigation of the Company�s financing, purchase and securitization of certain subprime residential mortgages. 2009 Compared with Fiscal 2008. Investment banking revenues increased 23% in 2009 from fiscal 2008, as
higher revenues from equity and fixed income underwriting transactions were partially offset by lower advisory revenues. Underwriting revenues of $2,967 million increased 57% from fiscal 2008, reflecting higher levels of market activity, as equity
underwriting revenues increased 62% to $1,695 million and fixed income underwriting revenues increased 51% to $1,272 million. Underwriting fees in 2009 reflected a significant increase in market activity�from 2008 levels, which 60 Table of Contents were affected by unprecedented market turmoil and challenging market conditions. In 2009, advisory fees from merger, acquisition and restructuring transactions were $1,488 million, a decrease of
14% from fiscal 2008, reflecting lower levels of market activity. Total sales and trading revenues decreased 20% in 2009 from fiscal 2008, reflecting lower�equity sales and trading revenues, partially offset by
higher other sales and trading�revenues and by higher fixed income sales and trading revenues. Equity sales and trading revenues decreased 63% to $3,690 million in 2009 from fiscal 2008. The decrease in 2009 was primarily due to a significant reduction in net revenues from derivative products and
equity cash products, reflecting lower levels of market volume and market volatility, reduced levels of client activity and lower average prime brokerage client balances. Equity sales and trading revenues reflected losses of $1,738 million due to
the tightening of the Company�s credit spreads during 2009 resulting from the increase in the fair value of certain of the Company�s long-term and short-term borrowings, primarily structured notes, for which the fair value option was
elected compared with a benefit of approximately $1,604 million in fiscal 2008 related to the�widening of the Company�s credit spreads. In 2009, equity sales and trading revenues also reflected unrealized gains of approximately $198 million related to changes in the fair value of net
derivative contracts attributable to the tightening of counterparties� credit default swap spreads compared with losses of $300 million in fiscal 2008 related to the widening of counterparties� credit default swap spreads. The Company also
recorded unrealized losses of approximately $154 million in 2009 related to changes in the fair value of net derivative contracts attributable to the tightening of the Company�s credit default swap spreads compared with gains of $125 million in
fiscal 2008 related to the widening of the Company�s credit default swap spreads. The unrealized losses and gains do not reflect any gains or losses on related hedging instruments. Fixed income sales and trading revenues increased 18% to $4,854 million in 2009 from fiscal 2008. Interest rate, currency and
credit products net revenues increased 127% in 2009, primarily due to strong investment grade and distressed debt trading results, partly offset by lower levels of client activity. Results in 2009 also included a gain of $319 million related to the
sale of undivided participating interests in a portion of the Company�s claims against a derivative counterparty that filed for bankruptcy protection. Commodity net revenues decreased 31% in 2009, primarily reflecting reduced levels of client
activity and unfavorable market conditions. In 2009, fixed income
sales and trading revenues reflected net unrealized gains of approximately $3,462 million related to changes in the fair value of net derivative contracts attributable to the tightening of counterparties� credit default swap spreads compared
with unrealized losses of approximately $6,560 million in fiscal 2008 related to the widening of counterparties� credit default swap spreads. The Company also recorded unrealized losses of approximately $1,938 million in 2009, related to
changes in the fair value of net derivative contracts attributable to the tightening of the Company�s credit default swap spreads compared with unrealized gains of approximately $1,968 million in fiscal 2008 related to the widening of the
Company�s credit default swap spreads. The unrealized losses and gains on credit default swap spreads do not reflect any gains or losses on related hedging instruments. In addition, fixed income sales and trading revenues in 2009 were negatively
impacted by losses of approximately $3,321 million from the tightening of the Company�s credit spreads resulting from the increase in the fair value of certain of the Company�s long-term and short-term borrowings, primarily structured
notes, for which the fair value option was elected. Fiscal 2008 reflected a benefit of approximately $3,524 million due to the widening of the Company�s credit spreads on such borrowings. In 2009, other sales and trading net revenues reflected net gains of $173�million compared with net losses of $3,119
million in fiscal 2008. Results for 2009 included net gains of $804 million (mark-to-market valuations and realized gains of $4,042 million, partially offset by losses on related hedges of $3,238 million) associated 61 Table of Contents with loans and lending commitments. Results for fiscal 2008 included net losses of $3,335 million (negative mark-to-market valuations and losses of $6,311 million, net of gains on related hedges
of $2,976 million) associated with loans and lending commitments largely related to certain �event-driven� lending to non-investment grade companies. Results in 2009 also included losses of $362 million, reflecting the improvement in the
Company�s debt-related credit spreads on certain debt related to CIC�s investment in the Company compared with gains of $387 million in fiscal 2008. In fiscal 2008, other sales and trading revenues also included writedowns of securities of approximately $1.2�billion in the Company�s
Subsidiary Banks and mark-to-market gains of approximately $1.4 billion on certain swaps previously designated as hedges of a portion of the Company�s long-term debt. These swaps were no longer considered hedges once the related debt was
repurchased by the Company. Principal transactions net investment
losses of $864 million were recognized in 2009 as compared with net investment losses of $2,461 million in fiscal 2008. The losses were primarily related to net realized and unrealized losses from the Company�s limited partnership investments
in real estate funds and investments associated with certain employee deferred compensation and co-investment plans. Other revenues decreased 80% in 2009 compared with fiscal 2008. During 2009, the Company recorded gains of approximately $465 million from the
Company�s repurchase of debt in the open market compared with approximately $2.1 billion in fiscal 2008 (see �Significant Items�Morgan Stanley Debt� herein for further discussion). Non-interest expenses decreased 11% in 2009, primarily due to lower
non-compensation expense. Compensation and benefits expense increased 2% from fiscal 2008. Non-compensation expenses decreased 26% in 2009, partly due to the Company�s initiatives to reduce costs. Occupancy and equipment expense decreased 12%
in 2009, primarily due to lower leasing costs associated with office facilities. Brokerage, clearing and exchange fees decreased 20% in 2009, primarily due to decreased trading activity. Marketing and business development expense decreased 43% in
2009, primarily due to lower levels of business activity. Professional services expense decreased 18% in 2009, primarily due to lower consulting and legal fees. Other expenses decreased 50% in 2009. In fiscal 2008, other expenses included $694
million related to the impairment of goodwill and intangible assets related to certain fixed income businesses. Excluding the fiscal 2008 impairment charges, other expenses decreased in 2009, primarily due to lower levels of business activity and
lower litigation expense. One Month Ended December�31,
2008 Compared with the One Month Ended December�31, 2007. Institutional Securities recorded losses before income taxes of $1,997 million in the one month ended December�31, 2008 compared with income before
income taxes of $938 million in the one month ended December�31, 2007. Net revenues were $(1,322) million in the one month ended December�31, 2008 compared with $2,314 million in the one month ended December�31, 2007. Net revenues in
the one month ended December�31, 2008 reflected sales and trading losses as compared with sales and trading revenues in the prior-year period. Non-interest expenses decreased 51% to $675 million, primarily due to lower compensation and benefits
expense, reflecting lower net revenues. Non-compensation expenses increased 4%. Investment banking revenues decreased 45% to $177 million in the one month ended December�31, 2008 from the prior-year period due to lower revenues from advisory fees and underwriting transactions,
reflecting lower levels of market activity. Advisory fees from merger, acquisition and restructuring transactions were $68 million, a decrease of 58% from the prior-year period. Underwriting revenues decreased 33% from the prior-year period to $109
million. Equity sales and trading losses were $11 million in the
one month ended December�31, 2008 compared with revenues of $935 million in the one month ended December�31, 2007. Results in the one month ended December�31, 2008 reflected lower revenues from equity cash and derivative products and
prime brokerage. 62 Table of Contents Equity sales and trading losses also included approximately $75 million of losses from the tightening of the Company�s credit spreads on certain long-term and short-term borrowings accounted
for at fair value. Fixed income sales and trading losses were $858 million in the one month ended December�31, 2008 compared with revenues of $944 million in the one month ended December�31, 2007. Results in the one month ended
December�31, 2008 reflected losses in interest rate, credit and currency products where continued dislocation�in the credit markets contributed to the losses. In addition, fixed income sales and trading included approximately $175 million
losses from the tightening of the Company�s credit spreads on certain long-term and short-term borrowings that are accounted for at fair value. Other sales and trading losses were approximately $563 million in the one month ended December�31, 2008 compared with revenues of $60 million in the
one month ended December�31, 2007. The one month ended December�31, 2008 included writedowns related to mortgage-related securities portfolios in the Company�s Subsidiary Banks, partially offset by mark-to-market gains on loans and
lending commitments and related hedges. Principal transactions
net investment losses of $158 million were recognized in the one month ended December�31, 2008 compared with net investment gains of $25 million in the one month ended December�31, 2007. The losses in the one month ended December�31,
2008 were primarily related to net realized and unrealized losses from the Company�s limited partnership investments in real estate funds and investments associated with certain employee deferred compensation and co-investment plans, and other
principal investments. 63 Table of Contents GLOBAL WEALTH MANAGEMENT GROUP INCOME STATEMENT INFORMATION | 2010 | 2009 | Fiscal 2008 | One Month Ended December�31, 2008 | |||||||||||||
| (dollars�in�millions) | ||||||||||||||||
| Revenues: | ||||||||||||||||
| Investment banking | $ | 827 | $ | 596 | $ | 427 | $ | 21 | ||||||||
| Principal transactions: | ||||||||||||||||
| Trading | 1,306 | 1,208 | 613 | 54 | ||||||||||||
| Investments | 19 | 3 | (54 | ) | (4 | ) | ||||||||||
| Commissions | 2,676 | 2,090 | 1,408 | 89 | ||||||||||||
| Asset management, distribution and administration fees | 6,349 | 4,583 | 2,726 | 183 | ||||||||||||
| Other | 337 | 249 | 965 | 15 | ||||||||||||
| Total non-interest revenues | 11,514 | 8,729 | 6,085 | 358 | ||||||||||||
| Interest income | 1,587 | 1,114 | 1,239 | 66 | ||||||||||||
| Interest expense | 465 | 453 | 305 | 15 | ||||||||||||
| Net interest | 1,122 | 661 | 934 | 51 | ||||||||||||
| Net revenues | 12,636 | 9,390 | 7,019 | 409 | ||||||||||||
| Compensation and benefits | 7,843 | 6,114 | 3,810 | 247 | ||||||||||||
| Non-compensation expenses | 3,637 | 2,717 | 2,055 | 44 | ||||||||||||
| Total non-interest expenses | 11,480 | 8,831 | 5,865 | 291 | ||||||||||||
| Income from continuing operations before income taxes | 1,156 | 559 | 1,154 | 118 | ||||||||||||
| Provision for income taxes | 336 | 178 | 440 | 45 | ||||||||||||
| Income from continuing operations | 820 | 381 | 714 | 73 | ||||||||||||
| Net income | 820 | 381 | 714 | 73 | ||||||||||||
| Net income applicable to noncontrolling interests | 301 | 98 | � | � | ||||||||||||
| Net income applicable to Morgan Stanley | $ | 519 | $ | 283 | $ | 714 | $ | 73 | ||||||||
Table of Contents Principal Transactions�Investments. Principal transaction net
investment gains were $19 million in 2010 compared with $3 million in 2009. The increase primarily reflected gains related to investments associated with certain employee deferred compensation plans compared with such investments in the prior-year
period. Commissions. Commission revenues primarily arise from agency transactions in listed and OTC equity securities and
sales of mutual funds, futures, insurance products and options. Commission revenues increased 28% in 2010, primarily benefiting from a full year of MSSB revenues and higher client activity. Asset Management, Distribution and Administration Fees. Asset management, distribution and
administration fees include revenues from individual investors electing a fee-based pricing arrangement and fees for investment management, account services and administration. The Company also receives shareholder servicing fees and fees for
services it provides in distributing certain open-ended mutual funds and other products. Mutual fund distribution fees are based on either the average daily fund net asset balances or average daily aggregate net fund sales and are affected by
changes in the overall level and mix of assets under management or supervision. Asset management, distribution and administration fees increased 39% in 2010, primarily benefiting from a full year of MSSB revenues and improved market conditions. From�June�2009 until
April�1, 2010, revenues in the bank deposit program�were primarily included in Asset�management, distribution and administration fees. Prior to June 2009, these revenues were reported�in Interest�income. The change was the
result of agreements that were entered into in connection with the MSSB transaction. Beginning on April�1, 2010, revenues in the bank deposit program held at the Company�s U.S. depository institutions were recorded as Interest income due
to renegotiations of the revenue sharing agreement as part of the Global Wealth Management Group business segment�s retail banking strategy. The Global Wealth Management Group business segment will continue to earn referral fees for deposits
placed with Citi depository institutions, and these fees will continue to be recorded in Asset management, distribution and administration fees until the legacy Smith Barney deposits are migrated to the Company�s U.S. depository institutions.
The referral fees for deposits were $381.7 million in 2010 and $659.5 million in 2009. Balances in the bank deposit program increased to $113.3 billion at December�31, 2010 from $112.5 billion at December�31, 2009. The unlimited FDIC program expired on December�31, 2009 for
deposits held by Citi depository institutions and June�30, 2010 for deposits held by the Company�s depository institutions. Deposits held by Company-affiliated FDIC-insured depository institutions were�$55 billion of the $113.3
billion deposits at December�31, 2010. Client assets in
fee-based accounts increased to $470 billion and represented 28% of total client assets at December�31, 2010 compared with $379 billion and 24% at December�31, 2009, respectively. Total client asset balances increased to $1,669 billion at
December�31, 2010 from $1,560 billion at December�31, 2009, primarily due to improved market conditions and an increase in net new assets.�Net new assets for 2010 were $22.9 billion. Client asset balances in households with assets
greater than $1 million increased to $1,229 billion at December�31, 2010 from $1,090 billion at December�31, 2009. Global fee-based asset flows increased to $32.7 billion at December�31, 2010 from $13.4 billion at December�31,
2009. Other. Other revenues
primarily include customer account service fees and other miscellaneous revenues. Other revenues were $337 million in 2010, an increase of 35% from $249 million in 2009. Other revenues in 2010 primarily benefited from a full year of MSSB revenues
and increases in proxy and other fee services. Net
Interest. Interest income and Interest expense are a function of the level and mix of total assets and liabilities, including customer bank deposits and margin loans and securities borrowed and securities loaned
transactions. Net interest increased 70% in 2010, primarily resulting from an increase in Interest income due to a full year of MSSB net interest, the securities available for sale portfolio (see �Other Matters�Securities Available for
Sale� herein) and the change in classification of the bank deposit program noted above, partially offset by increased funding costs. 65 Table of Contents Non-interest Expenses. Non-interest expenses increased 30% in 2010,
primarily due to higher costs related to a full year of MSSB operating expenses and the amortization of MSSB�s intangible assets. Compensation and benefits expense increased 28% in 2010, primarily due to a full year of MSSB operating expenses.
Non-compensation expenses increased 34% in 2010. In 2010, brokerage, clearing and exchange fees expense increased 38%, information processing and communications expense increased 41%, and other expenses increased 51%, primarily due to a full year of
MSSB operating expenses. In 2010, professional services expense increased 43%, primarily due to a full year of MSSB operating expenses and increased technology consulting costs related to the MSSB integration. 2009 Compared with Fiscal 2008. Investment banking revenues increased 40% in 2009 from fiscal 2008,
primarily due to the consolidation of the operating revenues of MSSB and higher equity underwriting activity, partially offset by lower underwriting activity across fixed income and unit trust products. Principal transactions trading revenues
increased 97% in 2009 from fiscal 2008, primarily due to the consolidation of the operating revenues of MSSB and higher revenues from municipal and corporate fixed income securities, partially offset by lower revenues from government securities. The
results in 2009 also reflected net gains related to investments associated with certain employee deferred compensation plans. Principal transactions net investment gains were $3 million in 2009 compared with net investment losses of $54 million in
fiscal 2008. The results in 2009 primarily reflected net gains related to investments associated with certain employee deferred compensation plans compared with losses on such plans in fiscal 2008. Commission revenues increased 48% in 2009 compared
with fiscal 2008, reflecting the operating results of MSSB, partially offset by lower client activity. Asset management, distribution and administration fees increased 68% in 2009 compared with fiscal 2008, primarily due to consolidating the
operating revenues of MSSB, fees associated with customer account balances in the bank deposit program and the change in classification of the bank deposit program noted above. Balances in the bank deposit program rose to $112.5 billion at
December�31, 2009 from $38.8 billion at December�31, 2008, primarily due to MSSB, which include balances held at Citi�s depository institutions. Deposits held by certain of the Company�s FDIC-insured depository institutions
were�$54 billion of the $112.5 billion deposits at December�31, 2009. Client assets in fee-based accounts increased 175% to $379 billion at December�31, 2009 and represented 24% of total client assets compared with 25% at
December�31, 2008. Total client asset balances increased to $1,560 billion at December�31, 2009 from $550 billion at December�31, 2008, primarily due to MSSB.�Client asset balances in households greater than $1 million increased
to $1,090 billion at December�31, 2009 from $351 billion at December�31, 2008. Other revenues decreased 74% in 2009 compared with fiscal 2008. The results in 2009 included the operating revenues of MSSB. Fiscal 2008 results included $743 million related to the sale of MSWM S.V., the
Spanish onshore mass affluent wealth management business, and the Global Wealth Management Group business segment�s share ($43 million) of the Company�s repurchase of debt (see �Overview of 2010 Financial Results�Morgan Stanley
Debt� herein for further discussion). Net interest revenues
decreased 29% in 2009 compared with fiscal 2008. The decrease was primarily due to the change in the classification of the bank deposit program noted above, a decline in customer margin loan balances and increased funding costs. Non-interest expenses increased 51% in 2009 and included the operating costs
of MSSB, the amortization of MSSB�s intangible assets, and a one-time expense of $124 million, primarily for replacement deferred compensation awards. The cost of these replacement awards was fully allocated to Citi within noncontrolling
interests. Compensation and benefits expense increased 60% in 2009, primarily reflecting MSSB and the replacement awards noted above. Non-compensation expenses increased 32%. Occupancy and equipment expense increased 91%, primarily due to the
consolidation of operating costs of MSSB and real estate abandonment charges. Information processing and communications expense increased 70%, and professional 66 Table of Contents services expense increased 54% in 2009, primarily due to the consolidation of operating results of MSSB. Other expenses decreased 7% in 2009, primarily due to the charge of $532 million for the
ARS repurchase program in fiscal 2008, partially offset by the consolidation of operating costs of MSSB and a charge related to an FDIC assessment on deposits. One Month Ended December�31, 2008 Compared with the One Month Ended December�31, 2007. The Global Wealth Management Group business segment recorded income
before�income taxes of $118 million in the one month ended December�31, 2008 compared with $103 million in the one month ended December�31, 2007. The one month ended December�31, 2008 included a reversal of a portion of
approximately $70 million of the accrual related to the ARS repurchase program. Net revenues were $409 million, a 24% decrease, primarily related to lower asset management, distribution and administration fees, lower commissions and lower investment
banking fees. Client assets in fee-based accounts decreased�31% to $138 billion and decreased as a percentage of total client assets to 25% from 27% at December�31, 2007. In addition, total client assets decreased to $550 billion,
down�27% from December�31, 2007, primarily due to weakened market conditions. Total non-interest expenses were $291 million in the one month ended December�31, 2008, a 33% decrease from the prior period. Compensation and benefits expense was $247 million, a 21% decrease from
the prior-year period, primarily reflecting lower revenues. Non-compensation costs decreased 65%, primarily due to a reversal of approximately $70 million of the accrual related to the ARS repurchase program. 67 Table of Contents ASSET MANAGEMENT INCOME STATEMENT INFORMATION | 2010 | 2009 | Fiscal 2008 | One Month Ended December�31, 2008 | |||||||||||||
| (dollars in millions) | ||||||||||||||||
| Revenues: | ||||||||||||||||
| Investment banking | $ | 20 | $ | 10 | $ | 26 | $ | 1 | ||||||||
| Principal transactions: | ||||||||||||||||
| Trading | (49 | ) | (68 | ) | (331 | ) | (82 | ) | ||||||||
| Investments | 996 | (173 | ) | (1,373 | ) | (43 | ) | |||||||||
| Commissions | � | � | � | 1 | ||||||||||||
| Asset management, distribution and administration fees | 1,668 | 1,605 | 2,139 | 112 | ||||||||||||
| Other | 164 | 46 | 160 | 3 | ||||||||||||
| Total non-interest revenues | 2,799 | 1,420 | 621 | (8 | ) | |||||||||||
| Interest income | 22 | 17 | 131 | 8 | ||||||||||||
| Interest expense | 98 | 100 | 205 | 9 | ||||||||||||
| Net interest | (76 | ) | (83 | ) | (74 | ) | (1 | ) | ||||||||
| Net revenues | 2,723 | 1,337 | 547 | (9 | ) | |||||||||||
| Compensation and benefits | 1,123 | 1,104 | 947 | 54 | ||||||||||||
| Non-compensation expenses | 877 | 886 | 1,023 | 51 | ||||||||||||
| Total non-interest expenses | 2,000 | 1,990 | 1,970 | 105 | ||||||||||||
| Income (loss) from continuing operations before income taxes | 723 | (653 | ) | (1,423 | ) | (114 | ) | |||||||||
| Provision for (benefit from) income taxes | 105 | (215 | ) | (567 | ) | (44 | ) | |||||||||
| Income (loss) from continuing operations | 618 | (438 | ) | (856 | ) | (70 | ) | |||||||||
| Discontinued operations: | ||||||||||||||||
| Gain (loss) from discontinued operations | 994 | (376 | ) | (383 | ) | 4 | ||||||||||
| Provision for (benefit from) income taxes | 335 | (277 | ) | (122 | ) | 2 | ||||||||||
| Net gain (loss) from discontinued operations | 659 | (99 | ) | (261 | ) | 2 | ||||||||||
| Net income (loss) | 1,277 | (537 | ) | (1,117 | ) | (68 | ) | |||||||||
| Net income (loss) applicable to noncontrolling interests | 408 | (50 | ) | � | � | |||||||||||
| Net income (loss) applicable to Morgan Stanley | $ | 869 | $ | (487 | ) | $ | (1,117 | ) | $ | (68 | ) | |||||
| Amounts applicable to Morgan Stanley: | ||||||||||||||||
| Income (loss) from continuing operations | $ | 210 | $ | (388 | ) | $ | (856 | ) | $ | (70 | ) | |||||
| Net gain (loss) from discontinued operations | 659 | (99 | ) | (261 | ) | 2 | ||||||||||
| Net income (loss) applicable to Morgan Stanley | $ | 869 | $ | (487 | ) | $ | (1,117 | ) | $ | (68 | ) | |||||
Table of Contents In the third quarter of 2010, the Company completed a disposal of a real estate property within the Asset
Management business segment. The results of operations are reported as discontinued operations through the date of disposal. Statistical Data. The results presented in the statistical tables below exclude the operations of Retail Asset Management, as those results are included in discontinued
operations through the date of sale (see Note 25 to the consolidated financial statements). Asset Management�s year-end and average assets under management or supervision were as follows: | Average For | ||||||||||||||||||||||||
| At December 31, | 2010 | 2009 | Fiscal 2008 | One�Month Ended December�31, 2008 | ||||||||||||||||||||
| 2010 | 2009 | |||||||||||||||||||||||
| (dollars in billions) | ||||||||||||||||||||||||
| Assets under management or supervision by asset class: | ||||||||||||||||||||||||
| Core asset management: | ||||||||||||||||||||||||
| Equity | $ | 92 | $ | 81 | $ | 81 | $ | 68 | $ | 102 | $ | 62 | ||||||||||||
| Fixed income�long-term | 59 | 54 | 58 | 52 | 71 | 56 | ||||||||||||||||||
| Money market | 53 | 59 | 53 | 65 | 107 | 81 | ||||||||||||||||||
| Alternatives(1) | 43 | 42 | 42 | 37 | 53 | 41 | ||||||||||||||||||
| Total core asset management | 247 | 236 | 234 | 222 | 333 | 240 | ||||||||||||||||||
| Merchant banking: | ||||||||||||||||||||||||
| Private equity | 5 | 4 | 5 | 4 | 3 | 4 | ||||||||||||||||||
| Infrastructure | 4 | 4 | 4 | 4 | 3 | 4 | ||||||||||||||||||
| Real estate | 16 | 15 | 15 | 21 | 37 | 34 | ||||||||||||||||||
| Total merchant banking | 25 | 23 | 24 | 29 | 43 | 42 | ||||||||||||||||||
| Total assets under management or supervision | 272 | 259 | 258 | 251 | 376 | 282 | ||||||||||||||||||
| Share of minority stake assets(2) | 7 | 7 | 7 | 6 | 7 | 6 | ||||||||||||||||||
| Total | $ | 279 | $ | 266 | $ | 265 | $ | 257 | $ | 383 | $ | 288 | ||||||||||||
| (1) | The alternatives asset class includes a range of investment products such as hedge funds, funds of hedge funds, funds of private equity funds and funds of real estate funds. |
| (2) | Amounts represent Asset Management�s proportional share of assets managed by entities in which it owns a minority stake. |
Table of Contents Activity in Asset Management�s assets under management or supervision during 2010, 2009, fiscal 2008
and the one month ended December�31, 2008 was as follows: | 2010 | 2009 | Fiscal 2008 | One Month Ended December�31, 2008 | |||||||||||||
| (dollars in billions) | ||||||||||||||||
| Balance at beginning of period | $ | 266 | $ | 290 | $ | 400 | $ | 287 | ||||||||
| Net flows by asset class: | ||||||||||||||||
| Core asset management: | ||||||||||||||||
| Equity | (1 | ) | (8 | ) | (9 | ) | � | |||||||||
| Fixed income�long-term | 1 | (6 | ) | (14 | ) | (3 | ) | |||||||||
| Money market | (6 | ) | (22 | ) | (19 | ) | � | |||||||||
| Alternatives(1) | (2 | ) | (3 | ) | 6 | � | ||||||||||
| Total core asset management | (8 | ) | (39 | ) | (36 | ) | (3 | ) | ||||||||
| Merchant banking: | ||||||||||||||||
| Private equity | � | � | 1 | � | ||||||||||||
| Infrastructure | � | � | 1 | � | ||||||||||||
| Real estate | 2 | (2 | ) | 1 | � | |||||||||||
| Total merchant banking | 2 | (2 | ) | 3 | � | |||||||||||
| Total net flows | (6 | ) | (41 | ) | (33 | ) | (3 | ) | ||||||||
| Net market appreciation (depreciation) | 19 | 16 | (80 | ) | 6 | |||||||||||
| Total net increase (decrease) | 13 | (25 | ) | (113 | ) | 3 | ||||||||||
| Acquisitions | � | � | 1 | � | ||||||||||||
| Net increase (decrease) in share of minority stake assets(2) | � | 1 | (1 | ) | � | |||||||||||
| Balance at end of period | $ | 279 | $ | 266 | $ | 287 | $ | 290 | ||||||||
| (1) | The alternatives asset class includes a range of investment products such as hedge funds, funds of hedge funds, funds of private equity funds and funds of real estate funds. |
| (2) | Amounts represent Asset Management�s proportional share of assets managed by entities in which it owns a minority stake. |
Table of Contents real estate funds sponsored by the Company and net investment gains in the merchant banking and core businesses, including certain investments associated with the Company�s employee deferred
compensation and co-investment plans. The results in 2009 primarily related to net investment losses associated with the Company�s real estate investments and losses related to certain investments associated with the Company�s employee
deferred compensation and co-investment plans, partially offset by net investment gains associated with the Company�s alternatives business. Asset Management, Distribution and Administration Fees. Asset management, distribution and administration fees
include revenues generated from the management and supervision of assets, performance-based fees relating to certain funds, and separately managed accounts and fees relating to the distribution of certain open-ended mutual funds. Asset management
fees arise from investment management services the Company provides to investment vehicles pursuant to various contractual arrangements. The Company receives fees primarily based upon mutual fund daily average net assets or based on monthly or
quarterly invested equity for other vehicles. Performance-based fees are earned on certain funds as a percentage of appreciation earned by those funds and, in certain cases, are based upon the achievement of performance criteria. These fees are
normally earned annually and are recognized on a monthly or quarterly basis. Asset management, distribution and administration fees increased 4% in 2010, primarily reflecting higher fund management and administration fees, partially offset by lower performance fees. The higher
fund management and administration fees reflected an increase in average assets under management. The Company�s assets under management increased $13 billion from December�31, 2009 to December�31, 2010 reflecting market appreciation,
partially offset by net customer outflows, primarily in the Company�s money market funds. The Company recorded net customer outflows of $5.7 billion in 2010 compared with net outflows of $41.1 billion in 2009. Other. Other revenues increased $118
million in 2010 compared with 2009. The results in 2010 included a pre-tax gain of approximately $96 million from the sale of the Company�s investment in Invesco (see Notes 5 and 19 to the consolidated financial statements). See
�Introduction�Overview of 2010 Financial Results� herein for further information. The increase in 2010 also reflected gains associated with the reduction of a lending facility to a real estate fund sponsored by the Company and higher
revenues associated with the Company�s minority stake investments in Avenue Capital Group, a New York-based investment manager, and Lansdowne Partners (�Lansdowne�), a London-based investment manager. These increases were partially
offset by impairment charges of $126 million related to FrontPoint (see Note 28 to the consolidated financial statements). Non-interest Expenses. Non-interest expenses increased 1% in 2010 compared with 2009. The results in 2010 primarily
reflected an increase in Compensation and benefits expense, partially offset by a decrease in Non-compensation expenses. Compensation and benefits expenses increased 2% in 2010 due to certain international tax equalization payments and principal
investment gains in the current year related to employee deferred compensation and co-investment plans. Non-compensation expenses for 2010 included intangible asset impairment charges of $67 million related to certain investment management
contracts. 2009 Compared with Fiscal 2008. Investment banking revenues decreased 62% in 2009 from fiscal 2008,
primarily reflecting lower revenues from real estate products. In
2009, the Company recognized Principal transaction�Trading losses of $68 million compared with losses of $331 million�in fiscal 2008. Trading results in 2009 included mark-to-market losses related to a lending facility to a real estate
fund sponsored by the Company and losses from hedges on certain investments and long-term debt. Losses in 2009 were partially offset by net gains of $164 million�related to securities issued by SIVs compared with losses of
$470�million�in fiscal 2008. 71 Table of Contents Principal transactions net investment losses of $173 million were recognized in 2009 compared with losses of
$1,373 million in fiscal 2008. The results in 2009 were primarily related to net investment losses associated with the Company�s real estate investments and losses related to certain investments associated with the Company�s employee
deferred compensation and co-investment plans. Losses in 2009 were partially offset by net investment gains associated with the Company�s alternatives business. The results in fiscal 2008 were primarily related to net investment losses
associated with the Company�s merchant banking business, including real estate and private equity investments, and losses related to certain investments associated with the Company�s employee deferred compensation and co-investment
plans.�Included in the net investment losses in fiscal 2008 were writedowns of approximately $250 million on Crescent prior to its consolidation. Asset management, distribution and administration fees decreased 25% in 2009 compared with fiscal 2008. The decrease in 2009 primarily reflected lower
fund management and administration fees, reflecting a decrease in average assets under management. Net flows in 2009 consisted of negative outflows across all asset classes. The Company�s decline in assets under management from
December�31, 2008 to December�31, 2009 included net customer outflows of $41.1 billion, primarily in the Company�s money market, long-term fixed income and equity funds. Other revenues decreased 71% in 2009 compared with fiscal 2008. The results in 2009 reflected lower revenues associated with
Lansdowne and lower revenues associated with the Company�s repurchase of debt. Non-interest expenses increased 1% in 2009 compared with fiscal 2008. The results in 2009 primarily reflected an increase in compensation and benefits expense. Compensation and benefits expense increased
17% in 2009, primarily reflecting higher net revenues. Non-compensation expenses decreased 13% in 2009. Brokerage, clearing and exchange fees decreased 44% in 2009, primarily due to lower fee sharing expenses. Marketing and business development
expense decreased 40% in 2009, primarily due to lower levels of business activity. Professional services expense decreased 20% in 2009, primarily due to lower consulting and legal fees. One Month Ended December�31, 2008 Compared with the One Month Ended December�31, 2007. Asset Management recorded losses from continuing operations before income
taxes of $114 million in the one month ended December�31, 2008 compared with losses before income taxes of $103 million in the one month ended December�31, 2007. Net revenues decreased 112% from the prior period. The decrease in the one
month ended December�31, 2008 reflected asset management, distribution and administration fees of $112 million compared with $210 million in the prior-year period. This decrease was partially offset by lower losses related to securities issued
by SIVs of $84 million compared with $119 million in the one month ended December�31, 2007. Assets under management or supervision within Asset Management of $290�billion were down $106 billion, or 27%, from $396 billion at
December�31, 2007, primarily reflecting decreases in equity and fixed income products resulting from market depreciation and�net outflows. Non-interest expenses decreased $76 million to $105 million, primarily due to lower Compensation and
benefits expense. Compensation and benefits expense decreased 53%, primarily reflecting lower revenues and reduced headcount. 72 Table of Contents Accounting Developments. Goodwill Impairment Test. In December 2010, the Financial Accounting Standards Board (the
�FASB�) issued accounting guidance that modifies Step 1 of the goodwill impairment test for reporting units with zero or negative carrying amounts. For those reporting units, an entity is required to perform Step 2 of the goodwill
impairment test if it is more likely than not that a goodwill impairment exists. In determining whether it is more likely than not that a goodwill impairment exists, an entity shall consider whether there are any adverse qualitative factors
indicating that an impairment may exist. The qualitative factors are consistent with the existing guidance. This guidance became effective for the Company on January�1, 2011. The Company does not believe the adoption of this accounting guidance
will have a material impact on the Company�s consolidated financial statements. Other Matters. Real Estate. The Company acts as the general partner for various real estate funds and also invests in certain of these funds as a limited partner. The Company�s
real estate investments at December�31, 2010 and December�31, 2009 are described below. Such amounts exclude investments associated with certain employee deferred compensation and co-investment plans. At December�31, 2010 and December�31, 2009, the consolidated
statements of financial condition include amounts representing real estate investment assets of consolidated subsidiaries of approximately $1.9 billion and $2.1 billion, respectively, net of noncontrolling interests of approximately $1.5 billion and
$0.6 billion, respectively. This net presentation is a non-GAAP financial measure that the Company considers to be a useful measure that the Company and investors use to assess the Company�s net exposure. The decrease, net of noncontrolling
interests, from December�31, 2009 to December�31, 2010 was primarily due to the $1.2 billion write-off in connection with the planned disposition of Revel. In addition, the Company has contractual capital commitments, guarantees, lending
facilities and counterparty arrangements with respect to real estate investments of $1.0 billion at December�31, 2010 (see Note 13 to the consolidated financial statements). In addition to the Company�s real estate investments, the Company
engages in various real estate-related activities, including origination of loans secured by commercial and residential properties. The Company also securitizes and trades in a wide range of commercial and residential real estate and real
estate-related whole loans, mortgages and other real estate. In connection with these activities, the Company provides representations and warranties that certain assets sold as whole loans or transferred to securitization transactions conform to
certain guidelines. The Company continues to monitor its real estate-related activities in order to manage its exposures and potential liability from these markets and businesses. See �Legal Proceedings�Residential Mortgage and Credit
Crisis Related Matters� in Part I, Item�3. A subsidiary
of the Company manages an open-ended real estate fund in Germany that suspended redemptions during the global financial crisis in October 2008.�In�October 2010, the subsidiary announced that it will liquidate the open-ended real estate
fund over a period of three years ending September�30, 2013 and distribute proceeds from the sale of real estate assets to its investors. The subsidiary will waive the transaction fees related to the sale of assets but will continue to charge
management fees. The Company does not intend to provide any support to the fund. See �Overview of 2010 Financial Results�Real Estate Investments� herein for further information. Securities Available for Sale. During the first quarter of 2010, the Company established a portfolio of debt securities in order to manage interest rate risk. The securities have been
classified as AFS in accordance with accounting guidance for investments in debt and equity securities and are included within the Global Wealth Management Group business segment. | 73 | |
| | 74 |
| 75 | |
| � | Financial instruments owned and Financial instruments sold, not yet purchased; |
| � | Securities available for sale; |
| � | Securities received as collateral and Obligation to return securities received as collateral; |
| � | Certain Commercial paper and other short-term borrowings, including structured notes; |
| � | Certain Deposits; |
| � | Certain Securities sold under agreements to repurchase; |
| � | Certain Other secured financings; and |
| � | Certain Long-term borrowings, including structured notes. |
Table of Contents The Company also reclassified approximately $0.9 billion of certain Corporate and other debt from Level 2 to
Level 3. The reclassifications were primarily related to corporate loans and were generally due to a reduction in market price quotations for these or comparable instruments, or a lack of available broker quotes, such that unobservable inputs had to
be utilized for the fair value measurement of these instruments. During 2010, the Company reclassified approximately $1.2 billion of certain Net derivative contracts from Level 3 to Level 2. These reclassifications were
related to certain tranched bespoke basket credit default swaps and single name credit default swaps for which unobservable inputs became insignificant. During 2010, the Company reclassified approximately $1 billion of certain Investments from Level 3 to Level 2. The reclassifications were primarily
related to principal investments for which external prices became observable. Assets and Liabilities Measured at Fair Value on a Non-recurring Basis. Certain of the Company�s assets were measured at fair value on a non-recurring basis,
primarily relating to loans, other investments, goodwill and intangible assets. The Company incurs losses or gains for any adjustments of these assets to fair value. A downturn in market conditions could result in impairment charges in future
periods. For assets and liabilities measured at fair value on a
non-recurring basis, fair value is determined by using various valuation approaches. The same hierarchy as described above, which maximizes the use of observable inputs and minimizes the use of unobservable inputs by generally requiring that the
observable inputs be used when available, is used in measuring fair value for these items. For further information on financial assets and liabilities that are measured at fair value on a non-recurring basis, see Note 4 to the consolidated financial statements. Fair Value Control Processes. The
Company employs control processes to validate the fair value of its financial instruments, including those derived from pricing models. These control processes are designed to assure that the values used for financial reporting are based on
observable inputs wherever possible. In the event that observable inputs are not available, the control processes are designed to assure that the valuation approach utilized is appropriate and consistently applied and that the assumptions are
reasonable. These control processes include reviews of the pricing model�s theoretical soundness and appropriateness by Company personnel with relevant expertise who are independent from the trading desks. Additionally, groups independent from
the�trading divisions within the Financial Control Group, Market Risk Department and Credit Risk Management Department participate in the review and validation of the fair values generated from pricing models, as appropriate. Where a pricing
model is used to determine fair value, recently executed comparable transactions and other observable market data are considered for purposes of validating assumptions underlying the model. Consistent with market practice, the Company has individually negotiated agreements with certain counterparties to exchange
collateral (�margining�) based on the level of fair values of the derivative contracts they have executed. Through this margining process, one party or each party to a derivative contract provides the other party with information about the
fair value of the derivative contract to calculate the amount of collateral required. This sharing of fair value information provides additional support of the Company�s recorded fair value for the relevant OTC derivative products. For certain
OTC derivative products, the Company, along with other market participants, contributes derivative pricing information to aggregation services that synthesize the data and make it accessible to subscribers. This information is then used to evaluate
the fair value of these OTC derivative products. For more information regarding the Company�s risk management practices, see �Quantitative and Qualitative Disclosures about Market Risk�Risk Management� in Part II, Item�7A
herein. Goodwill and Intangible Assets. Goodwill. The Company tests goodwill for
impairment on an annual basis and on an interim basis when certain events or circumstances exist. The Company tests for impairment at the reporting unit level, which is generally at the level of or one level below its business segments. Goodwill no
longer retains its association with a particular acquisition once it has been assigned to a reporting unit. As such, all of the activities of a reporting unit, whether 77 Table of Contents acquired or organically developed, are available to support the value of the goodwill. Goodwill impairment is determined by comparing the estimated fair value of a reporting unit with its
respective book value. If the estimated fair value exceeds the book value, goodwill at the reporting unit level is not deemed to be impaired. If the estimated fair value is below book value, however, further analysis is required to determine the
amount of the impairment. The estimated fair values of the reporting units are derived based on valuation techniques the Company believes market participants would use for each of the reporting units. The estimated fair values are generally
determined utilizing methodologies that incorporate price-to-book, price-to-earnings and assets under management multiples of certain comparable companies. Intangible Assets. Amortizable intangible assets are amortized over their estimated useful lives and reviewed for impairment
on an interim basis when certain events or circumstances exist. For amortizable intangible assets, an impairment exists when the carrying amount of the intangible asset exceeds its fair value. An impairment loss will be recognized only if the
carrying amount of the intangible asset is not recoverable and exceeds its fair value. The carrying amount of the intangible asset is not recoverable if it exceeds the sum of the expected undiscounted cash flows. Indefinite-lived intangible assets are not amortized but are reviewed
annually (or more frequently when certain events or circumstances exist) for impairment. For indefinite-lived intangible assets, an impairment exists when the carrying amount exceeds its fair value. See Note 4 to the consolidated financial statements for intangible asset
impairments recorded during 2010. For both goodwill and
intangible assets, to the extent an impairment loss is recognized, the loss establishes the new cost basis of the asset. Subsequent reversal of impairment losses is not permitted. For amortizable intangible assets, the new cost basis is amortized
over the remaining useful life of that asset. Adverse market or economic events could result in impairment charges in future periods. See Note 9 to the consolidated financial statements for further information on goodwill and intangible assets. Legal, Regulatory and Tax Contingencies. In the normal course of business, the Company has been named, from time to
time, as a defendant in various legal actions, including arbitrations, class actions and other litigation, arising in connection with its activities as a global diversified financial services institution. Certain of the actual or threatened legal actions include claims for
substantial compensatory and/or punitive damages or claims for indeterminate amounts of damages. In some cases, the entities that would otherwise be the primary defendants in such cases are bankrupt or in financial distress. The Company is also involved, from time to time, in other reviews,
investigations and proceedings (both formal and informal) by governmental and self-regulatory agencies regarding the Company�s business, including, among other matters, accounting and operational matters, certain of which may result in adverse
judgments, settlements, fines, penalties, injunctions or other relief. Accruals for litigation and regulatory proceedings are generally determined on a case-by-case basis. Where available information indicates that it is probable a liability had been incurred at the date of
the consolidated financial statements and the Company can reasonably estimate the amount of that loss, the Company accrues the estimated loss by a charge to income. In many proceedings, however, it is inherently difficult to determine whether any
loss is probable or even possible or to estimate the amount of any loss. For certain legal proceedings, the Company can estimate possible losses, additional losses, ranges of loss or ranges of additional loss in excess of amounts accrued. For
certain other legal proceedings, the Company cannot reasonably estimate such losses, particularly for proceedings that are in their early stages of development or where plaintiffs seek substantial or indeterminate damages. Numerous issues may need
to be resolved, including through potentially 78 Table of Contents lengthy discovery and determination of important factual matters, and by addressing novel or unsettled legal questions relevant to the proceedings in question, before a loss or additional loss or
range of loss or additional loss can be reasonably estimated for any proceeding. The Company is subject to the income and indirect tax laws of the U.S., its states and municipalities and those of the foreign jurisdictions in which the Company has significant business operations. These
tax laws are complex and subject to different interpretations by the taxpayer and the relevant governmental taxing authorities. The Company must make judgments and interpretations about the application of these inherently complex tax laws when
determining the provision for income taxes and the expense for indirect taxes and must also make estimates about when in the future certain items affect taxable income in the various tax jurisdictions. Disputes over interpretations of the tax laws
may be settled with the taxing authority upon examination or audit. The Company periodically evaluates the likelihood of assessments in each taxing jurisdiction resulting from current and subsequent years� examinations, and unrecognized tax
benefits are established as appropriate. The Company establishes a liability for unrecognized tax benefits related to potential losses that may arise from tax audits in accordance with the�guidance on accounting for unrecognized tax benefits.
Once established, unrecognized tax benefits are adjusted when there is more information available or when an event occurs requiring a change. Significant judgment is required in making these estimates, and the actual cost of a legal claim, tax assessment or regulatory fine/penalty may ultimately
be materially different from the recorded accruals and unrecognized tax benefits, if any. See Notes 13 and 22 to the consolidated financial statements for additional information on legal proceedings and tax examinations. Special Purpose Entities and Variable Interest Entities. The Company�s involvement with special purpose entities
(�SPE�) consists primarily of the following: | � | Transferring financial assets into SPEs; |
| � | Acting as an underwriter of beneficial interests issued by securitization vehicles; |
| � | Holding one or more classes of securities issued by, or making loans to or investments in, SPEs that hold debt, equity, real estate or other assets; |
| � | Purchasing and selling (in both a market-making and a proprietary-trading capacity) securities issued by SPEs/variable interest entities (�VIE�), whether such vehicles are sponsored by the Company or not; |
| � | Entering into derivative transactions with SPEs (whether or not sponsored by the Company); |
| � | Providing warehouse financing to collateralized debt obligations and collateralized loan obligations; |
| � | Entering into derivative agreements with non-SPEs whose value is derived from securities issued by SPEs; |
| � | Servicing assets held by SPEs or holding servicing rights related to assets held by SPEs that are serviced by others under subservicing arrangements; |
| � | Serving as an asset manager to various investment funds that may invest in securities that are backed, in whole or in part, by SPEs; and |
| � | Structuring and/or investing in other structured transactions designed to provide enhanced, tax-efficient yields to the Company or its clients. |
Table of Contents In most cases, these SPEs are deemed for accounting purposes to be VIEs. The Company applies accounting
guidance for consolidation of VIEs to certain entities in which equity investors do not have the characteristics of a controlling financial interest or do not have sufficient equity at risk for the entity to finance its activities without additional
subordinated financial support from other parties. Entities that previously met the criteria as qualifying SPEs that were not subject to consolidation prior to January�1, 2010 became subject to the consolidation requirements for VIEs on that
date. Excluding entities subject to the Deferral (as defined in Note 2 to the consolidated financial statements), effective January�1, 2010, the primary beneficiary of a VIE is the party that both (1)�has the power to direct the activities
of a VIE that most significantly affect the VIE�s economic performance and (2)�has an obligation to absorb losses or the right to receive benefits that in either case could potentially be significant to the VIE. The Company consolidates
entities of which it is the primary beneficiary. The Company
determines whether it is the primary beneficiary of a VIE upon its initial involvement with the VIE and reassesses whether it is the primary beneficiary on an ongoing basis as long as it has any continuing involvement with the VIE. This
determination is based upon an analysis of the design of the VIE, including the VIE�s structure and activities, the power to make significant economic decisions held by the Company and by other parties and the variable interests owned by the
Company and other parties. See Note 2 to the consolidated
financial statements for information on accounting guidance adopted on January�1, 2010 for transfers of financial assets. 80 Table of Contents Liquidity and Capital Resources. The Company�s senior management establishes the liquidity and capital
policies of the Company. Through various risk and control committees, the Company�s senior management reviews business performance relative to these policies, monitors the availability of alternative sources of financing, and oversees the
liquidity and interest rate and currency sensitivity of the Company�s asset and liability position. The Company�s Treasury Department, Firm Risk Committee (�FRC�), Asset and Liability Management Committee (�ALCO�) and
other control groups assist in evaluating, monitoring and controlling the impact that the Company�s business activities have on its consolidated statements of financial condition, liquidity and capital structure. Liquidity and capital matters
are reported regularly to the Board�s Risk Committee. The
Balance Sheet. The Company actively monitors and evaluates
the composition and size of its balance sheet. A substantial portion of the Company�s total assets consists of liquid marketable securities and short-term receivables arising principally from sales and trading activities in the Institutional
Securities business segment. The liquid nature of these assets provides the Company with flexibility in managing the size of its balance sheet. The Company�s total assets increased to $807,698 million at December�31, 2010 from $771,462
million at December�31, 2009. The increase in total assets was primarily due to higher interest bearing deposits with banks and financial instruments owned, partially offset by lower securities borrowed. The Company�s assets and liabilities are primarily related to
transactions attributable to sales and trading and securities financing activities. At December�31, 2010, securities financing assets and liabilities were $358 billion and $321 billion, respectively. At December�31, 2009, securities
financing assets and liabilities were $376 billion and $316 billion, respectively. Securities financing transactions include repurchase and resale agreements, securities borrowed and loaned transactions, securities received as collateral and
obligation to return securities received. Securities borrowed or purchased under agreements to resell and securities loaned or sold under agreements to repurchase are treated as collateralized financings (see Note 2 to the consolidated financial
statements). Securities sold under agreements to repurchase and Securities loaned were $177 billion at December�31, 2010 and averaged $211 billion during 2010, respectively. The period-end balance was lower than the annual average, primarily
due to the seasonal maturity of client financing activity on December�31, 2010. Securities purchased under agreements to resell and Securities borrowed were $287 billion at December�31, 2010 and averaged $306 billion during 2010,
respectively. Securities financing assets and liabilities also
include matched book transactions with minimal market, credit and/or liquidity risk. Matched book transactions accommodate customers, as well as obtain securities for the settlement and financing of inventory positions. The customer receivable
portion of the securities financing transactions includes customer margin loans, collateralized by customer owned securities, and customer cash, which is segregated according to regulatory requirements. The customer payable portion of the securities
financing transactions primarily includes customer payables to the Company�s prime brokerage clients. The Company�s risk exposure on these transactions is mitigated by collateral maintenance policies that limit the Company�s credit
exposure to customers. Included within securities financing assets were $17 billion and $14 billion at December�31, 2010 and December�31, 2009, respectively, recorded in accordance with accounting guidance for the transfer of financial
assets that represented equal and offsetting assets and liabilities for fully collateralized non-cash loan transactions. The Company uses the Tier 1 leverage ratio, risk-based capital ratios (see �Regulatory Requirements� herein), Tier 1 common ratio and the
balance sheet leverage ratio as indicators of capital adequacy when viewed in the context of the Company�s overall liquidity and capital policies. These ratios are commonly used measures to assess capital adequacy and frequently referred to by
investors. 81 Table of Contents The following table sets forth the Company�s total assets and leverage ratios at December�31, 2010
and December�31, 2009 and average balances during 2010: | Balance at | Average�Balance(1) | |||||||||||
| December�31, 2010 | December�31, 2009 | 2010 | ||||||||||
| (dollars in millions, except ratio data) | ||||||||||||
| Total assets | $ | 807,698 | $ | 771,462 | $ | 831,070 | ||||||
| Common equity(2) | $ | 47,614 | $ | 37,091 | $ | 42,399 | ||||||
| Preferred equity | 9,597 | 9,597 | 9,597 | |||||||||
| Morgan Stanley shareholders� equity | 57,211 | 46,688 | 51,996 | |||||||||
| Junior subordinated debentures issued to capital trusts | 4,817 | 10,594 | 8,346 | |||||||||
| Less: Goodwill and net intangible assets(3) | (6,947 | ) | (7,612 | ) | (7,310 | ) | ||||||
| Tangible Morgan Stanley shareholders� equity | $ | 55,081 | $ | 49,670 | $ | 53,032 | ||||||
| Common equity(2) | $ | 47,614 | $ | 37,091 | $ | 42,399 | ||||||
| Less: Goodwill and net intangible assets(3) | (6,947 | ) | (7,612 | ) | (7,310 | ) | ||||||
| Tangible common equity(4) | $ | 40,667 | $ | 29,479 | $ | 35,089 | ||||||
| Leverage ratio(5) | 14.7x | 15.5x | 15.7x | |||||||||
| Tier 1 common ratio(6) | 10.5 | % | 8.2 | % | N/M | |||||||
| N/M�Not | meaningful. |
| (1) | The Company calculates its average balances based upon weekly balances, except where weekly balances are unavailable, the month-end balances are used. |
| (2) | During 2010, the calculation of average Common equity was adjusted to reflect the common stock issuance corresponding to the redemption of the junior subordinated debentures underlying the CIC Equity Units. See �Redemption of CIC Equity Units and Issuance of Common Stock� herein for further information. |
| (3) | Goodwill and net intangible assets exclude mortgage servicing rights (net of disallowable mortgage servicing rights) of $141 million and $123 million at December�31, 2010 and December�31, 2009, respectively, and include only the Company�s share of MSSB�s goodwill and intangible assets. |
| (4) | Tangible common equity, a non-GAAP financial measure, equals common equity less goodwill and net intangible assets as defined above. The Company views tangible common equity as a useful measure to investors because it is a commonly utilized metric and reflects the common equity deployed in the Company�s businesses. |
| (5) | Leverage ratio, a non-GAAP financial measure, equals total assets divided by tangible Morgan Stanley shareholders� equity. The Company views the leverage ratio as a useful measure for investors to assess capital adequacy. |
| (6) | The Tier�1 common ratio, a non-GAAP financial measure, equals Tier�1 common equity divided by Risk Weighted Assets (�RWA�). The Company defines Tier�1 common equity as Tier 1 capital less qualifying perpetual preferred stock, qualifying trust preferred securities and other restricted core capital elements, adjusted for the portion of goodwill and non-servicing intangible assets associated with MSSB�s noncontrolling interests ( i.e ., Citi�s share of MSSB�s goodwill and intangibles). The Company views its definition of the Tier 1 common equity as a useful measure for investors as it reflects the actual ownership structure and economics of MSSB. This definition of Tier�1 common equity may evolve in the future as regulatory rules may be implemented based on a final proposal regarding noncontrolling interest (also referred to as minority interest) as initially presented in December 2009 in the Basel Committee on Banking Supervision Consultative Document Strengthening the resilience of the banking sector (�BCBS 164�). For a discussion of RWAs and Tier�1 capital, see �Regulatory Requirements� herein. The year-over-year increase in the Company�s Tier 1 Common ratio was primarily driven by�net income and the�issuance�of�approximately $5,579 million�of common stock�corresponding to the redemption of the junior subordinated debentures underlying the CIC Equity Units.�Please see �Redemption of CIC Equity Units and Issuance of Common Stock��herein for more information. |
Table of Contents At December�31, 2010, the aggregate outstanding principal amount of the Company�s senior
indebtedness was approximately $183 billion (including guaranteed obligations of the indebtedness of subsidiaries) compared with $179 billion at December�31, 2009. The increase in the amount of senior indebtedness was primarily due to new
issuances of notes, net of repayments, and an increase in other short-term borrowings, partially offset by maturities. Redemption of CIC Equity Units and Issuance of Common Stock. In December 2007, the Company sold Equity Units that included contracts to
purchase Company common stock to a wholly owned subsidiary of CIC (the �CIC Entity�) for approximately $5,579 million. On July�1, 2010, Moody�s Investor Services announced that it was lowering the equity credit assigned to such
Equity Units.�The terms of the Equity Units�permitted the�Company to redeem the junior subordinated debentures underlying the Equity Units upon the occurrence and continuation of such a change in equity credit (a �Rating Agency
Event�).�In response to this Rating Agency Event, the�Company redeemed the junior subordinated�debentures in August 2010 and the redemption proceeds were subsequently used by the CIC Entity to settle its obligation under the
purchase contracts. The settlement of the purchase contracts and delivery of 116,062,911 shares of Company common stock to the CIC Entity occurred in August 2010. Capital Management Policies. The Company�s senior management views capital as an important source of
financial strength. The Company actively manages its consolidated capital position based upon, among other things, business opportunities, risks, capital availability and rates of return together with internal capital policies, regulatory
requirements and rating agency guidelines and, therefore, in the future may expand or contract its capital base to address the changing needs of its businesses. The Company attempts to maintain total capital, on a consolidated basis, at least equal
to the sum of its operating subsidiaries� equity. At
December�31, 2010, the Company had approximately $1.6 billion remaining under its current share repurchase program out of the $6 billion authorized by the Board in December 2006. The share repurchase program is for capital management purposes
and considers, among other things, business segment capital needs as well as equity-based compensation and benefit plan requirements. Share repurchases by the Company are subject to regulatory approval. During 2010, the Company did not repurchase
common stock as part of its capital management share repurchase program (see also �Market for Registrant�s Common Equity, Related Stockholder Matters and Issuer Purchases of Equity Securities� in Part II, Item�5). The Board determines the declaration and payment of dividends on a quarterly
basis. In January 2011, the Company announced that its Board declared a quarterly dividend per common share of $0.05. The Company also announced that the Board declared a quarterly dividend of $255.56 per share of Series A Floating Rate
Non-Cumulative Preferred Stock (represented by depositary shares, each representing 1/1,000th interest in a share of preferred stock and each having a dividend of $0.25556); a quarterly dividend of $25.00 per share of Series B Non-Cumulative
Non-Voting Perpetual Convertible Preferred Stock and a quarterly dividend of $25.00 per share of Series C Non-Cumulative Non-Voting Perpetual Preferred Stock. Required Capital. Beginning with the quarter ended June�30, 2010, the Company�s capital estimation is based on the Required Capital framework, an internal capital
adequacy measure. This framework is a risk-based internal use of capital measure, which is compared with the Company�s regulatory Tier 1 capital to help ensure the Company maintains an amount of risk-based going concern capital after absorbing
potential losses from extreme stress events at a point in time. The difference between the Company�s Tier 1 capital and aggregate Required Capital is the Company�s Parent capital. Average Tier 1 capital, Required Capital and Parent capital
for 2010 was approximately $51.6 billion, $30.9 billion and $20.7 billion, respectively. The Company generally holds Parent capital for prospective regulatory requirements, including Basel III, organic growth, acquisitions and other capital needs. 83 Table of Contents Tier 1 capital and common equity attribution to the business segments is based on capital usage calculated
by Required Capital. In principle, each business segment is capitalized as if it were an independent operating entity with limited diversification benefit between the business segments. Required Capital is assessed at each business segment and
further attributed to product lines. This process is intended to align capital with the risks in each business segment in order to allow senior management to evaluate returns on a risk-adjusted basis. The Required Capital framework will evolve over
time in response to changes in the business and regulatory environment, including Basel III, and to incorporate enhancements in modeling techniques (see �Regulatory Requirements� herein for further information on Basel III). For a further discussion of the Company�s Tier 1 capital, see
�Regulatory Requirements� herein. The following table
presents the Company�s and business segments� average Tier 1 capital and average common equity for 2010. | 2010 | ||||||||
| Average Tier 1 Capital(1) | Average Common Equity(1) | |||||||
| (dollars�in�billions) | ||||||||
| Institutional Securities | $ | 26.0 | $ | 17.7 | ||||
| Global Wealth Management Group | 2.9 | 6.8 | ||||||
| Asset Management | 1.9 | 2.1 | ||||||
| Parent capital | 20.7 | 15.5 | ||||||
| Total from continuing operations | 51.5 | 42.1 | ||||||
| Discontinued operations | 0.1 | 0.3 | ||||||
| Total | $ | 51.6 | $ | 42.4 | ||||
| (1) | The computation of Average common equity and Tier 1 capital is determined using the Company�s Required Capital Framework. Business segment capital prior to 2010 was computed under a previous framework and has not been restated under the Required Capital Framework. As a result, the business segment Tier 1 Capital and average common equity prior to 2010 is not directly comparable. The Required Capital framework will evolve over time in response to changes in the business and regulatory environment and to incorporate enhancements in modeling techniques. |
Table of Contents Company�s business strategies. The principal elements of the Company�s liquidity and funding risk management framework are the Contingency Funding Plan and the Global Liquidity Reserve
that support the target liquidity profile (see �Contingency Funding Plan� and �Global Liquidity Reserve� herein). Contingency Funding Plan. The Contingency Funding Plan (�CFP�) is the Company�s primary liquidity and funding risk management tool. The CFP outlines the
Company�s response to liquidity stress in the markets and incorporates stress testing to identify potential liquidity risk. Liquidity stress tests model multiple scenarios related to idiosyncratic, systemic or a combination of both types of
events across various time horizons. Based on the results of stress testing, the CFP sets forth a course of action to effectively manage through a stressed liquidity event. The Company�s CFP incorporates a number of assumptions, including, but
not limited to, the following: | � | No government support; |
| � | No access to unsecured debt markets; |
| � | Repayment of all unsecured debt maturing within one year; |
| � | Higher haircuts and significantly lower availability of secured funding; |
| � | Additional collateral that would be required by trading counterparties and certain exchanges and clearing organizations related to multi-notch credit rating downgrades; |
| � | Discretionary unsecured debt buybacks; |
| � | Drawdowns on unfunded commitments provided to third parties; |
| � | Client cash withdrawals; |
| � | Limited access to the foreign exchange swap markets; |
| � | Return of securities borrowed on an uncollateralized basis; and |
| � | Maturity roll-off of outstanding letters of credit with no further issuance. |
Table of Contents Global Liquidity Reserve by Type of Investment The table below summarizes the Company�s Global Liquidity Reserve by
type of investment: | At December�31, 2010 | ||||
| (dollars�in�billions) | ||||
| Cash and cash equivalents | $ | 42 | ||
| Securities purchased under agreements to resell/Securities borrowed | 88 | |||
| Federal Reserve-eligible securities | 41 | |||
| Global Liquidity Reserve | $ | 171 | ||
| At December� 31, 2010 | At December� 31, 2009 | Average�Balance(1) | ||||||||||||||
| 2010 | 2009 | |||||||||||||||
| (dollars in billions) | ||||||||||||||||
| Parent | $ | 68 | $ | 64 | $ | 65 | $ | 61 | ||||||||
| Non-bank subsidiaries | 35 | 40 | 31 | 35 | ||||||||||||
| Bank subsidiaries | 68 | 59 | 63 | 58 | ||||||||||||
| Total | $ | 171 | $ | 163 | $ | 159 | $ | 154 | ||||||||
| (1) | The Company calculates the average global liquidity reserve based upon weekly amounts . |
Table of Contents The Company�s goal is to achieve an optimal mix of secured and unsecured funding while ensuring
continued growth in stable funding sources. The Institutional Securities business segment emphasizes the use of collateralized short-term borrowings to limit the growth of short-term unsecured funding, which is generally more subject to disruption
during periods of financial stress. The ability to fund less liquid assets on a secured basis may be impaired in a stress environment. To manage this risk, the Company obtains longer-term secured financing for less liquid assets and has minimal
reliance on overnight financing. In addition, the Company holds a portion of its Global Liquidity Reserve against a potential disruption to its secured financing capabilities.�This potential disruption may be in the form of additional margin or
reduced capacity to refinance maturing trades. The Company continues to extend the tenor of secured financing for less liquid collateral and seeks to build a sufficient buffer to offset the risks discussed above. Unsecured Financing. The Company views
long-term debt and deposits as stable sources of funding for core inventories and less liquid assets. Securities inventories not financed by secured funding sources and the majority of current assets are financed with a combination of short-term
funding, floating rate long-term debt or fixed rate long-term debt swapped to a floating rate and deposits. The Company uses derivative products (primarily interest rate, currency and equity swaps) to assist in asset and liability management and to
hedge interest rate risk (see Note 12 to the consolidated financial statements). Temporary Liquidity Guarantee Program (�TLGP�). In October 2008, the Secretary of the U.S. Treasury invoked the systemic risk exception of the FDIC Improvement Act
of 1991, and the FDIC announced the TLGP. Based on the Final Rule adopted on November�21, 2008, the TLGP provides a guarantee, through the earlier of maturity or June�30, 2012, of certain senior unsecured debt issued by participating
Eligible Entities (including the Company) between October�14, 2008 and June�30, 2009. At December�31, 2010 and December�31, 2009, the Company had $21.3 billion and $23.8 billion, respectively, of senior unsecured debt outstanding
under the TLGP. There have been no issuances under the TLGP since March�31, 2009. See Note 11 to the consolidated financial statements for further information on commercial paper and long-term borrowings. Short-Term Borrowings. The
Company�s unsecured short-term borrowings consist of commercial paper, bank loans, bank notes and structured notes with maturities of 12 months or less at issuance. The table below summarizes the Company�s short-term unsecured
borrowings: | At December� 31, 2010 | At December� 31, 2009 | |||||||
| (dollars�in�millions) | ||||||||
| Commercial paper | $ | 945 | $ | 783 | ||||
| Other short-term borrowings | 2,311 | 1,595 | ||||||
| Total | $ | 3,256 | $ | 2,378 | ||||
| At December� 31, 2010(1) | At December� 31, 2009(1) | |||||||
| (dollars�in�millions) | ||||||||
| Savings and demand deposits | $ | 59,856 | $ | 57,114 | ||||
| Time deposits(2) | 3,956 | 5,101 | ||||||
| Total | $ | 63,812 | $ | 62,215 | ||||
Table of Contents| (1) | Total deposits insured by the FDIC at December�31, 2010 and December�31, 2009 were $48 billion and $46 billion, respectively. |
| (2) | Certain time deposit accounts are carried at fair value under the fair value option (see Note 4 to the consolidated financial statements). |
| Parent | Subsidiaries | Total | ||||||||||
| (dollars�in�millions) | ||||||||||||
| Due in 2011 | $ | 24,953 | $ | 1,958 | $ | 26,911 | ||||||
| Due in 2012 | 37,175 | 690 | 37,865 | |||||||||
| Due in 2013 | 24,721 | 757 | 25,478 | |||||||||
| Due in 2014 | 16,704 | 999 | 17,703 | |||||||||
| Due in 2015 | 17,197 | 3,829 | 21,026 | |||||||||
| Thereafter | 62,218 | 1,256 | 63,474 | |||||||||
| Total | $ | 182,968 | $ | 9,489 | $ | 192,457 | ||||||
Table of Contents The rating agencies have stated that they currently incorporate various degrees of uplift from perceived
government support in the credit ratings of systemically important banks, including the credit ratings of the Company. The U.S. financial reform legislation has rating agencies reviewing their methodologies and may be seen as limiting the
possibility of extraordinary government support for the financial system in any future financial crises. This may lead to reduced uplift assumptions for U.S. banks and thereby place downward pressure on credit ratings. At the same time, the U.S.
financial reform legislation also has credit ratings positive features such as higher standards for capital and liquidity levels. The net result on credit ratings and the timing of any rating agency actions is currently uncertain (see �Other
Matters�Regulatory Outlook� herein). In connection with
certain OTC trading agreements and certain other agreements associated with the Institutional Securities business segment, the Company may be required to provide additional collateral or immediately settle any outstanding liability balances with
certain counterparties in the event of a credit rating downgrade. At December�31, 2010, the amount of additional collateral or termination payments that could be called by counterparties under the terms of such agreements in the event of a
one-notch downgrade of the Company�s long-term credit rating was $1,516 million. A total of $3,701 million in collateral or termination payments could be called in the event of a two-notch downgrade. Also, the Company is required to pledge additional collateral to certain
exchanges and clearing organizations in the event of a credit rating downgrade. At December�31, 2010, the increased collateral requirement at certain exchanges and clearing organizations was $173 million in the event of a one-notch downgrade of
the Company�s long-term credit rating. A total of $1,446 million of collateral is required in the event of a two-notch downgrade. The liquidity impact of additional collateral requirements is accounted for in the Company�s CFP. At January�31, 2011, the Company�s and Morgan Stanley Bank,
N.A.�s senior unsecured ratings were as set forth below: | Company | Morgan Stanley Bank, N.A. | |||||||||||
| Short-Term Debt | Long-Term Debt | Rating Outlook | Short-Term Debt | Long-Term Debt | Rating Outlook | |||||||
| Dominion Bond Rating Service Limited | R-1�(middle) | A�(high) | Negative | � | � | � | ||||||
| Fitch Ratings | F1 | A | Stable | F1 | A | Stable | ||||||
| Moody�s | P-1 | A2 | Negative | P-1 | A1 | Negative | ||||||
| Rating and Investment Information, Inc. | a-1 | A+ | Negative | � | � | � | ||||||
| Standard�& Poor�s | A-1 | A | Negative | A-1 | A+ | Negative | ||||||
Table of Contents condition at fair value. Any changes in the fair value of such retained interests are recognized in the consolidated statements of income. Retained interests in securitized financial assets were
approximately $5.4 billion and $2.0 billion at December�31, 2010 and December�31, 2009, respectively, substantially all of which were related to U.S. agency collateralized mortgage obligations, commercial mortgage loan and residential
mortgage loan securitization transactions. For further information about the Company�s securitization activities, see Notes 2 and 7 to the consolidated financial statements. The Company has entered into liquidity facilities with SPEs and other
counterparties, whereby the Company is required to make certain payments if losses or defaults occur. The Company often may have recourse to the underlying assets held by the SPEs in the event payments are required under such liquidity facilities
(see Note 13 to the consolidated financial statements). Asset Management Activities. As a general partner in certain private equity and real estate partnerships, the Company
receives distributions from the partnerships according to the provisions of the partnership agreements. The Company may, from time to time, be required to return all or a portion of such distributions to the limited partners in the event the limited
partners do not achieve a certain return as specified in various partnership agreements, subject to certain limitations. Guarantees. Accounting guidance for guarantees requires the Company to disclose information about its obligations
under certain guarantee arrangements. The FASB defines guarantees as contracts and indemnification agreements that contingently require a guarantor to make payments to the guaranteed party based on changes in an underlying measure (such as an
interest or foreign exchange rate, a security or commodity price, an index, or the occurrence or non-occurrence of a specified event) related to an asset, liability or equity security of a guaranteed party. The FASB also defines guarantees as
contracts that contingently require the guarantor to make payments to the guaranteed party based on another entity�s failure to perform under an agreement as well as indirect guarantees of the indebtedness of others. The table below summarizes certain information regarding the Company�s
obligations under guarantee arrangements at December�31, 2010: | Maximum Potential Payout/Notional | Carrying Amount (Asset)/ Liability | Collateral/ Recourse | ||||||||||||||||||||||||||
| Years to Maturity | ||||||||||||||||||||||||||||
| Type of Guarantee | Less�than�1 | 1-3 | 3-5 | Over�5 | Total | |||||||||||||||||||||||
| (dollars in millions) | ||||||||||||||||||||||||||||
| Credit derivative contracts(1) | $ | 306,459 | $ | 848,018 | $ | 671,941 | $ | 467,833 | $ | 2,294,251 | $ | 25,232 | $ | � | ||||||||||||||
| Other credit contracts | 61 | 1,416 | 822 | 3,856 | 6,155 | (1,198 | ) | � | ||||||||||||||||||||
| Non-credit derivative contracts(1)(2) | 681,836 | 461,082 | 205,306 | 258,534 | 1,606,758 | 72,001 | � | |||||||||||||||||||||
| Standby letters of credit and other financial guarantees issued(3)(4) | 1,085 | 2,132 | 354 | 5,633 | 9,204 | 27 | 5,616 | |||||||||||||||||||||
| Market value guarantees | � | � | 180 | 644 | 824 | 44 | 116 | |||||||||||||||||||||
| Liquidity facilities | 4,884 | 338 | 187 | 71 | 5,480 | � | 6,857 | |||||||||||||||||||||
| Whole loan sales guarantees | � | � | � | 24,777 | 24,777 | 55 | � | |||||||||||||||||||||
| Securitization representations and warranties | � | � | � | 94,314 | 94,314 | 25 | � | |||||||||||||||||||||
| General partner guarantees | 189 | 28 | 56 | 249 | 522 | 69 | � | |||||||||||||||||||||
| (1) | Carrying amount of derivative contracts are shown on a gross basis prior to cash collateral or counterparty netting. For further information on derivative contracts, see Note 12 to the consolidated financial statements. |
| (2) | Amounts include a guarantee to investors in undivided participating interests in claims the Company made against a derivative counterparty that filed for bankruptcy protection. To the extent, in the future, any portion of the claims is disallowed or reduced by the bankruptcy court in excess of a certain amount, then the Company must refund a portion of the purchase price plus interest. For further information, see Note 18 to the consolidated financial statements. |
| (3) | Approximately $2.2�billion of standby letters of credit are also reflected in the �Commitments� table in primary and secondary lending commitments. Standby letters of credit are recorded at fair value within Financial instruments owned or Financial instruments sold, not yet purchased in the consolidated statements of financial condition. |
Table of Contents| (4) | Amounts include guarantees issued by consolidated real estate funds sponsored by the Company of approximately $465�million. These guarantees relate to obligations of the fund�s investee entities, including guarantees related to capital expenditures and principal and interest debt payments. Accrued losses under these guarantees of approximately $161�million are reflected as a reduction of the carrying value of the related fund investments, which are reflected in Financial instruments owned�Investments on the consolidated statement of financial condition. |
| Years to Maturity | Total�at December�31, 2010 | |||||||||||||||||||
| Less than�1 | 1-3 | 3-5 | Over�5 | |||||||||||||||||
| (dollars in millions) | ||||||||||||||||||||
| Letters of credit and other financial guarantees obtained to satisfy collateral requirements | $ | 1,701 | $ | 8 | $ | 11 | $ | 1 | $ | 1,721 | ||||||||||
| Investment activities | 1,146 | 587 | 103 | 78 | 1,914 | |||||||||||||||
| Primary lending commitments�investment grade(1)(2) | 8,104 | 28,291 | 7,885 | 219 | 44,499 | |||||||||||||||
| Primary lending commitments�non-investment grade(1) | 990 | 5,448 | 5,361 | 2,134 | 13,933 | |||||||||||||||
| Secondary lending commitments(1) | 39 | 116 | 173 | 39 | 367 | |||||||||||||||
| Commitments for secured lending transactions | 346 | 621 | 2 | � | 969 | |||||||||||||||
| Forward starting reverse repurchase agreements(3) | 53,037 | � | � | � | 53,037 | |||||||||||||||
| Commercial and residential mortgage-related commitments | 1,131 | 10 | 68 | 634 | 1,843 | |||||||||||||||
| Underwriting commitments | 128 | � | � | � | 128 | |||||||||||||||
| Other commitments | 198 | 62 | 3 | � | 263 | |||||||||||||||
| Total | $ | 66,820 | $ | 35,143 | $ | 13,606 | $ | 3,105 | $ | 118,674 | ||||||||||
| (1) | These commitments are recorded at fair value within Financial instruments owned and Financial instruments sold, not yet purchased in the consolidated statements of financial condition (see Note 4 to the consolidated financial statements). |
| (2) | This amount includes commitments to asset-backed commercial paper conduits of $275 million at December�31, 2010, of which $138�million have maturities of less than one year and $137 million of which have maturities of one to three years. |
| (3) | The Company enters into forward starting securities purchased under agreements to resell (agreements that have a trade date at or prior to December�31, 2010 and settle subsequent to period-end) that are primarily secured by collateral from U.S. government agency securities and other sovereign government obligations. These agreements primarily settle within three business days and at December�31, 2010, $45.2�billion of the $53.0 billion settled within three business days. |
Table of Contents For further description of these commitments, see Note 13 to the consolidated financial statements and
�Quantitative and Qualitative Disclosures about Market Risk�Credit Risk� in Part II, Item�7A herein. In the normal course of business, the Company enters into various contractual obligations that may require future cash payments. Contractual obligations
include long-term borrowings, other secured financings, contractual interest payments, contractual payments on time deposits, operating leases, purchase obligations and expected contributions for pension and postretirement plans. The Company�s
future cash payments associated with certain of its obligations at December�31, 2010 are summarized below: | Payments Due in: | ||||||||||||||||||||
| At December�31, 2010 | 2011 | 2012-2013 | 2014-2015 | Thereafter | Total | |||||||||||||||
| (dollars in millions) | ||||||||||||||||||||
| Long-term borrowings(1) | $ | 26,911 | $ | 63,343 | $ | 38,729 | $ | 63,474 | $ | 192,457 | ||||||||||
| Other secured financings(1) | 3,207 | 634 | 591 | 2,966 | 7,398 | |||||||||||||||
| Contractual interest payments(2) | 6,305 | 10,388 | 7,852 | 23,346 | 47,891 | |||||||||||||||
| Contractual payments on time deposits(3) | 1,909 | 1,960 | 185 | � | 4,054 | |||||||||||||||
| Operating leases�office facilities(4) | 680 | 1,274 | 925 | 2,431 | 5,310 | |||||||||||||||
| Operating leases�equipment(4) | 313 | 313 | 152 | 203 | 981 | |||||||||||||||
| Purchase obligations(5) | 862 | 569 | 325 | 131 | 1,887 | |||||||||||||||
| Pension and postretirement plans�expected contribution(6) | 50 | � | � | � | 50 | |||||||||||||||
| Total(7) | $ | 40,237 | $ | 78,481 | $ | 48,759 | $ | 92,551 | $ | 260,028 | ||||||||||
| (1) | See Note 11 to the consolidated financial statements. Amounts presented for Other secured financings are financings with original maturities greater than one year. |
| (2) | Amounts represent estimated future contractual interest payments related to unsecured long-term borrowings and secured long-term financings based on applicable interest rates at December�31, 2010. Amounts include stated coupon rates, if any, on structured or index-linked notes. |
| (3) | Amounts represent contractual principal and interest payments related to time deposits primarily held at the Company�s Subsidiary Banks. |
| (4) | See Note 13 to the consolidated financial statements. |
| (5) | Purchase obligations for goods and services include payments for, among other things, consulting, outsourcing, advertising, sponsorship, computer and telecommunications maintenance agreements, certain license agreements related to MSSB, and certain transmission, transportation and storage contracts related to the commodities business. Purchase obligations at December�31, 2010 reflect the minimum contractual obligation under legally enforceable contracts with contract terms that are both fixed and determinable. These amounts exclude obligations for goods and services that already have been incurred and are reflected on the Company�s consolidated statements of financial condition. |
| (6) | See Note 21 to the consolidated financial statements. |
| (7) | Amounts exclude unrecognized tax benefits, as the timing and amount of future cash payments are not determinable at this time (see Note 22 to the consolidated financial statements for further information). |
Table of Contents impacted by the developments concerning Basel III described below. Starting July 2010, the Company has been reporting on a parallel basis under the current regulatory capital regime (Basel I) and
Basel II. During the parallel run period, the Company continues to be subject to Basel I but simultaneously calculates its risks under Basel II. The Company reports the capital ratios under both of these standards to the regulators. There will be at
least four quarters of parallel reporting before the Company enters the three-year transitional period to implement Basel II standards. Under provisions in the Dodd-Frank Act, the generally applicable capital standards, which are currently based on
Basel I standards, but may themselves change over time, would serve as a permanent floor to minimum capital requirements calculated under the Basel II standards the Company is currently required to implement, as well as future capital standards. Basel III contains new capital standards that raise the quality
of capital, strengthen counterparty credit risk capital requirements and introduces a leverage ratio as a supplemental measure to the risk-based ratio. Basel III also includes a new capital conservation buffer, which imposes a common equity
requirement above the new minimum that can be depleted under stress, subject to restrictions on capital distributions, and a new countercyclical buffer, which regulators can activate during periods of excessive credit growth in their jurisdiction.
The Basel III proposals complement an earlier proposal for revisions to Market Risk Framework that increases capital requirements for securitizations within the trading book. The U.S. regulators will require implementation of Basel III subject to an
extended phase-in period. Under the Basel Committee�s
proposed framework, based on a preliminary analysis of the guidelines published to date, the Company estimates its RWAs at December�31, 2010 could increase by approximately $240 billion, partially offset by a decrease of approximately $100
billion related to runoff and mitigation opportunities by the end of 2012. The net increase in RWAs is estimated to be $140 billion, or approximately 43%, primarily driven by�higher market risk for securitization, structured credit and
correlation products�and credit risk for counterparty exposures. These are preliminary estimates and they will likely change based on guidelines for implementation to be issued by the Federal Reserve. The proposed framework includes new standards to raise the quality of capital
which may impact the components of Tier 1 capital and Tier 1 common equity. The Company currently defines Tier 1 common equity as Tier 1 capital less qualifying perpetual preferred stock, qualifying restricted core capital elements (including junior
subordinated debt issued to trusts (�trust preferred securities�) and noncontrolling interest), adjusted for the portion of goodwill and non-servicing intangible assets associated with MSSB�s noncontrolling interests ( i.e .,
Citi�s share of MSSB�s goodwill and intangibles). This definition of Tier 1 common equity may evolve in the future as regulatory rules may be implemented based on a final proposal regarding noncontrolling interest as initially presented by
the Basel Committee. For the discussion of Tier 1 common equity, please see �The Balance Sheet� herein. Pursuant to provisions of the Dodd-Frank Act, over time, the trust preferred securities will no longer qualify as Tier 1 capital but will qualify only as Tier 2 capital. This change in regulatory capital
treatment will be phased in incrementally during a transition period that will start on January�1, 2013 and end on January�1, 2016. This provision of the Dodd-Frank Act accelerates the phasing in of the disqualification of the trust
preferred securities as provided for by Basel III. At December�31, 2010, the Company had $4.7 billion of trust preferred securities included in the qualifying restricted core capital elements. Effective March�31, 2011, the Federal Reserve
will institute a limit on restricted core capital elements that are included in Tier 1 capital. Amounts in excess of the stated limit will be included in Tier 2 capital. At December�31, 2010, the Company was in compliance with Basel I capital
requirements with ratios of Tier�1 capital to RWAs of 16.1% and total capital to RWAs of 16.5% (6% and 10% being well-capitalized for regulatory purposes, respectively). In addition, financial holding companies are also subject to a Tier 1
leverage ratio as defined by the Federal Reserve. The Company calculated its Tier 1 leverage ratio as Tier 1 capital divided by adjusted average total assets (which reflects adjustments for disallowed goodwill, certain intangible assets, deferred
tax assets and financial and non-financial equity investments). The adjusted average total assets are derived using weekly balances for the year. 93 Table of Contents The following table reconciles the Company�s total shareholders� equity to Tier 1 and Total
capital as defined by the regulations issued by the Federal Reserve and presents the Company�s consolidated capital ratios at December�31, 2010 and December�31, 2009: | At December� 31, 2010 | At December� 31, 2009 | |||||||
| (dollars�in�millions) | ||||||||
| Allowable capital | ||||||||
| Tier 1 capital: | ||||||||
| Common shareholders� equity | $ | 47,614 | $ | 37,091 | ||||
| Qualifying preferred stock | 9,597 | 9,597 | ||||||
| Qualifying mandatorily convertible trust preferred securities | � | 5,730 | ||||||
| Qualifying restricted core capital elements | 12,924 | 10,867 | ||||||
| Less: Goodwill | (6,739 | ) | (7,162 | ) | ||||
| Less: Non-servicing intangible assets | (4,526 | ) | (4,931 | ) | ||||
| Less: Net deferred tax assets | (3,984 | ) | (3,242 | ) | ||||
| Less: After-tax debt valuation adjustment | (20 | ) | (554 | ) | ||||
| Other deductions | (1,986 | ) | (726 | ) | ||||
| Total Tier 1 capital | 52,880 | 46,670 | ||||||
| Tier 2 capital: | ||||||||
| Other components of allowable capital: | ||||||||
| Qualifying subordinated debt | 2,412 | 3,127 | ||||||
| Other qualifying amounts | 82 | 158 | ||||||
| Other deductions | (897 | ) | � | |||||
| Total Tier 2 capital | 1,597 | 3,285 | ||||||
| Total allowable capital | $ | 54,477 | $ | 49,955 | ||||
| Total risk-weighted assets | $ | 329,560 | $ | 305,000 | ||||
| Capital ratios | ||||||||
| Total capital ratio | 16.5 | % | 16.4 | % | ||||
| Tier 1 capital ratio | 16.1 | % | 15.3 | % | ||||
| Tier 1 leverage ratio | 6.6 | % | 5.8 | % | ||||
Table of Contents At December�31, 2010, the Company calculated its RWAs in accordance with the regulatory capital
requirements of the Federal Reserve, which is consistent with guidelines described under Basel I. RWAs reflect both on and off-balance sheet risk of the Company. The risk capital calculations will evolve over time as the Company enhances its risk
management methodology and incorporates improvements in modeling techniques while maintaining compliance with the regulatory requirements and interpretations. Market RWAs reflect�capital charges attributable to the risk of loss resulting from adverse changes in market prices and other factors.�For a
further discussion of the Company�s�market risks and�Value-at-Risk (�VaR�) model, see �Quantitative and Qualitative Disclosures about Market Risk�Risk Management� in Part II, Item�7A herein. Market RWAs
incorporate two components: systematic risk and specific risk. Systematic and specific risk charges are computed using either the Company�s VaR model or Standardized Approach in accordance with regulatory requirements. Credit RWAs reflect capital charges attributable to the risk of loss arising
from a borrower or counterparty failing to meet its financial obligations. For a further discussion of the Company�s credit risks, see �Quantitative and Qualitative Disclosures about Market Risk�Credit Risk� in Part II,
Item�7A herein. Effects of Inflation and Changes in
Foreign Exchange Rates. The Company�s assets to a large
extent are liquid in nature and, therefore, are not significantly affected by inflation, although inflation may result in increases in the Company�s expenses, which may not be readily recoverable in the price of services offered. To the extent
inflation results in rising interest rates and has other adverse effects upon the securities markets and upon the value of financial instruments, it may adversely affect the Company�s financial position and profitability. A significant portion of the Company�s business is conducted in
currencies other than the U.S. dollar, and changes in foreign exchange rates relative to the U.S. dollar can therefore affect the value of non-U.S. dollar net assets, revenues and expenses. Potential exposures as a result of these fluctuations in
currencies are closely monitored, and, where cost-justified, strategies are adopted that are designed to reduce the impact of these fluctuations on the Company�s financial performance. These strategies may include the financing of non-U.S.
dollar assets with direct or swap-based borrowings in the same currency and the use of currency forward contracts or the spot market in various hedging transactions related to net assets, revenues, expenses or cash flows. 95 Table of Contents Item�7A.����Quantitative and Qualitative Disclosures
about Market Risk. Risk Management. Overview. Management believes effective risk management is vital to the success of the Company�s business activities. Accordingly,
the Company employs an enterprise risk management (�ERM�) framework to integrate the diverse roles of the risk departments into a holistic enterprise structure and to facilitate the incorporation of risk evaluation into decision-making
processes across the Company. The Company has policies and procedures in place to identify, assess, monitor and manage the significant risks involved in the activities of its Institutional Securities, Global Wealth Management Group and Asset
Management business segments and support functions as well as at the holding company level. Principal risks involved in the Company�s business activities include market, credit, capital and liquidity, operational, and compliance and legal risk. The cornerstone of the Company�s risk management philosophy
is the execution of risk-adjusted returns through prudent risk-taking that protects the Company�s capital base and franchise. Five key principles underlie this philosophy: comprehensiveness, independence, accountability, defined risk tolerance
and transparency. The fast-paced, complex, and constantly-evolving nature of global financial services requires that the Company maintain a risk management culture that is incisive, knowledgeable about specialized products and markets, and subject
to ongoing review and enhancement. To help ensure the efficacy of risk management, which is an essential component of the Company�s reputation, senior management requires thorough and frequent communication and the appropriate escalation of
risk matters. Risk Governance Structure. Risk management at the Company requires independent company-level oversight,
accountability of the Company�s business segments, and effective communication of risk matters to senior management and across the Company. The nature of the Company�s risks, coupled with its risk management philosophy, informs the
Company�s risk governance structure. The Company�s risk governance structure comprises the Board of Directors; the Risk Committee of the Board (�BRC�) and the Audit Committee of the Board (�BAC�); the Firm Risk
Committee (�FRC�); senior management oversight (including the Chief Executive Officer, Chief Risk Officer, Chief Financial Officer, Chief Legal Officer and Chief Compliance Officer); the Internal Audit Department and risk managers,
committees, and groups within and across the Company�s business segments. A risk governance structure composed of independent but complementary entities facilitates efficient and comprehensive supervision of the Company�s risk exposures
and processes. Morgan Stanley Board of
Directors. The Board has oversight for the Company�s ERM framework and is responsible for helping to ensure that the Company�s risks are managed in a sound manner. The Board has authorized the committees
within the ERM framework to help facilitate its risk oversight responsibilities. Risk Committee of the Board. The BRC, appointed by the Board, is composed of non-management directors. The BRC is responsible for assisting the Board in the oversight
of the Company�s risk governance structure; the Company�s risk management and risk assessment guidelines and policies regarding market, credit and liquidity, and funding risk; the Company�s risk tolerance; and the performance of the
Chief Risk Officer. The BRC reports to the full Board on a regular basis. Audit Committee of the Board. The BAC, appointed by the Board, is composed of independent directors (pursuant to the Company�s Corporate Governance Policies and
applicable New York Stock Exchange and Securities and Exchange Commission (�SEC�) rules) and is responsible for oversight of certain aspects of risk management, including review of the major operational, franchise, reputational, legal and
compliance risk exposures of the Company and the steps management has taken to monitor and control such exposure, as well as guidelines and policies that govern the process for risk assessment and risk management. The BAC reports to the full Board
on a regular basis. 96 Table of Contents Firm Risk Committee. The Board has also authorized the FRC, a
management committee appointed and chaired by the Chief Executive Officer, that includes the most senior officers of the Company, including the Chief Risk Officer, Chief Legal Officer and Chief Financial Officer. The FRC�s responsibilities
include oversight of the Company�s risk management principles, procedures and limits and the monitoring of capital levels and material market, credit, liquidity and funding, legal, compliance, operational, franchise and regulatory risk matters,
and other risks, as appropriate, and the steps management has taken to monitor and manage such risks. The FRC reports to the full Board, the BAC and the BRC through the Company�s Chief Risk Officer. Chief Risk Officer. The Chief Risk
Officer, who reports to the Chief Executive Officer and the BRC oversees compliance with Company risk limits; approves exceptions to the Company�s risk limits; reviews material market, credit and operational risks; and reviews results of risk
management processes with the Board, the BAC and the BRC, as appropriate. The Chief Risk Officer also coordinates with the Compensation, Management Development and Succession Committee of the Board to evaluate whether the Company�s compensation
arrangements encourage unnecessary or excessive risk-taking and whether risks arising from the Company�s compensation arrangements are reasonably likely to have a material adverse effect on the Company. Internal Audit Department. The Internal
Audit Department provides independent risk and control assessment and reports to the BAC and administratively to the Chief Legal Officer. The Internal Audit Department examines the Company�s operational and control environment and conducts
audits designed to cover all major risk categories. Independent Risk Management Functions. The independent risk management functions (Market Risk, Credit Risk,
Operational Risk and Corporate Treasury departments) are independent of the Company�s business units. These groups assist senior management and the FRC in monitoring and controlling the Company�s risk through a number of control processes.
Each function maintains its own risk governance structure with specified individuals and committees responsible for aspects of managing risk. Further discussion about the responsibilities of the risk management functions may be found below under
�Market Risk,� �Credit Risk,� and �Operational Risk� and �Management�s Discussion and Analysis of Financial Condition and Results of Operation�Liquidity and Capital Resources� in Part II, Item�7
herein. Control Groups. The
Company control groups include the Human Resources Department, the Legal and Compliance Division, the Operations Division, Global Technology and Data, the Tax Department and Finance. The Company control groups coordinate with the business segment
control groups to review the risk monitoring and risk management policies and procedures relating to, among other things, controls over financial reporting and disclosure; the business segment�s market, credit and operational risk profile;
sales practices; reputation; legal enforceability; and operational and technological risks. Participation by the senior officers of the Company and business segment control groups helps ensure that risk policies and procedures, exceptions to risk
limits, new products and business ventures, and transactions with risk elements undergo thorough review. Divisional Risk Committees. Each business segment has a risk committee that is responsible for helping to ensure that the business segment, as applicable, adheres to
established limits for market, credit, operational and other risks; implements risk measurement, monitoring, and management policies and procedures that are consistent with the risk framework established by the FRC; and reviews, on a periodic basis,
its aggregate risk exposures, risk exception experience, and the efficacy of its risk identification, measurement, monitoring and management policies and procedures, and related controls. Stress Value-at-Risk. During 2010, the Company continued to enhance its market and credit risk management framework to address the severe stresses observed in global markets
during the economic downturn. The Company expanded and improved its risk measurement processes, including stress tests and scenario analysis, and further refined its market and credit risk limit framework. Stress Value-at-Risk (�S-VaR�), a
proprietary methodology that 97 Table of Contents comprehensively measures the Company�s market and credit risks, was further refined and is now an important metric used in establishing the Company�s risk appetite and its capital
allocation framework. S-VaR simulates many stress scenarios based on more than 25 years of historical data and attempts to capture the different liquidities of various types of general and specific risks. Additionally, S-VaR captures event and
default risks that are particularly relevant for credit portfolios. Risk Management Process. The following is a discussion of the Company�s risk management policies and procedures for its principal risks (capital and liquidity risk is
discussed in �Management�s Discussion and Analysis of Financial Condition and Results of Operations�Liquidity and Capital Resources� in Part II, Item�7 herein). The discussion focuses on the Company�s securities
activities (primarily its institutional trading activities) and corporate lending and related activities. The Company believes that these activities generate a substantial portion of its principal risks. This discussion and the estimated amounts of
the Company�s risk exposure generated by the Company�s statistical analyses are forward-looking statements. However, the analyses used to assess such risks are not predictions of future events, and actual results may vary significantly
from such analyses due to events in the markets in which the Company operates and certain other factors described below. Market Risk. Market risk refers to the risk that a change in the level of one or more market prices, rates, indices, implied volatilities (the price volatility of the underlying instrument imputed from option prices),
correlations or other market factors, such as market liquidity, will result in losses for a position or portfolio. Generally, the Company incurs market risk as a result of trading, investing and client facilitation activities, principally within the
Institutional Securities business segment where the substantial majority of the Company�s VaR for market risk exposures is generated. In addition, the Company incurs trading related market risk within the Global Wealth Management Group. Asset
Management incurs principally Non-trading market risk primarily from capital investments in real estate funds and investments in private equity vehicles. Sound market risk management is an integral part of the Company�s culture. The various business units and trading desks are responsible for ensuring
that market risk exposures are well-managed and prudent. The control groups help ensure that these risks are measured and closely monitored and are made transparent to senior management. The Market Risk Department is responsible for ensuring
transparency of material market risks, monitoring compliance with established limits, and escalating risk concentrations to appropriate senior management. To execute these responsibilities, the Market Risk Department monitors the Company�s risk
against limits on aggregate risk exposures, performs a variety of risk analyses, routinely reports risk summaries, and maintains the Company�s VaR and scenario analysis systems. These limits are designed to control price and market liquidity
risk. Market risk is also monitored through various measures: statistically (using VaR and related analytical measures); by measures of position sensitivity; and through routine stress testing, which measures the impact on the value of existing
portfolios of specified changes in market factors, and scenario analyses conducted by the Market Risk Department in collaboration with the business units. The material risks identified by these processes are summarized in reports produced by the
Market Risk Department that are circulated to and discussed with senior management, the FRC, the BRC, and the Board of Directors. Sales and Trading and Related Activities. Primary Market Risk Exposures and Market Risk Management. During 2010, the Company had exposures to a wide range of
interest rates, equity prices, foreign exchange rates and commodity prices�and the associated implied volatilities and spreads�related to the global markets in which it conducts its trading activities. The Company is exposed to interest rate and credit spread risk as a result of
its market-making activities and other trading in interest rate sensitive financial instruments ( e.g ., risk arising from changes in the level or implied volatility of interest rates, the timing of mortgage prepayments, the shape of the yield
curve and credit spreads). 98 Table of Contents The activities from which those exposures arise and the markets in which the Company is active include, but are not limited to, the following: corporate and government debt across both developed
and emerging markets and asset-backed debt (including mortgage-related securities). The Company is exposed to equity price and implied volatility risk as a result of making markets in equity securities and derivatives and maintaining other positions (including positions in non-public
entities). Positions in non-public entities may include, but are not limited to, exposures to private equity, venture capital, private partnerships, real estate funds and other funds. Such positions are less liquid, have longer investment horizons
and are more difficult to hedge than listed equities. The Company
is exposed to foreign exchange rate and implied volatility risk as a result of making markets in foreign currencies and foreign currency derivatives, from maintaining foreign exchange positions and from holding non-U.S. dollar-denominated financial
instruments. The Company is exposed to commodity price and
implied volatility risk as a result of market-making activities and maintaining positions in physical commodities (such as crude and refined oil products, natural gas, electricity, and precious and base metals) and related derivatives. Commodity
exposures are subject to periods of high price volatility as a result of changes in supply and demand. These changes can be caused by weather conditions; physical production, transportation and storage issues; or geopolitical and other events that
affect the available supply and level of demand for these commodities. The Company manages its trading positions by employing a variety of risk mitigation strategies. These strategies include diversification of risk exposures and hedging. Hedging activities consist of the
purchase or sale of positions in related securities and financial instruments, including a variety of derivative products ( e.g ., futures, forwards, swaps and options). Hedging activities may not always provide effective mitigation against
trading losses due to differences in the terms, specific characteristics or other basis risks that may exist between the hedge instrument and the risk exposure that is being hedged. The Company manages the market risk associated with its trading
activities on a Company-wide basis, on a worldwide trading division level and on an individual product basis. The Company manages and monitors its market risk exposures in such a way as to maintain a portfolio that the Company believes is
well-diversified in the aggregate with respect to market risk factors and that reflects the Company�s aggregate risk tolerance as established by the Company�s senior management. Aggregate market risk limits have been approved for the Company across all divisions worldwide. Additional market risk limits
are assigned to trading desks and, as appropriate, products and regions. Trading division risk managers, desk risk managers, traders and the Market Risk Department monitor market risk measures against limits in accordance with policies set by senior
management. VaR. The Company
uses the statistical technique known as VaR as one of the tools used to measure, monitor and review the market risk exposures of its trading portfolios. The Market Risk Department calculates and distributes daily VaR-based risk measures to various
levels of management. VaR Methodology, Assumptions and
Limitations. The Company estimates VaR using a model based on historical simulation for major market risk factors and Monte Carlo simulation for name-specific risk in corporate shares, bonds, loans and related
derivatives. Historical simulation involves constructing a distribution of hypothetical daily changes in the value of trading portfolios based on two sets of inputs: historical observation of daily changes in key market indices or other market risk
factors; and information on the sensitivity of the portfolio values to these market risk factor changes. The Company�s VaR model uses four years of historical data to characterize potential changes in market risk factors. The Company�s
95%/one-day VaR corresponds to the unrealized loss in portfolio value that, based on historically observed market risk factor movements, would have been exceeded with a frequency of 5%, or five times in every 100 trading days, if the portfolio were
held constant for one day. 99 Table of Contents The Company�s VaR model generally takes into account linear and non-linear exposures to equity and
commodity price risk, interest rate risk, credit spread risk and foreign exchange rates as well as linear exposures to implied volatility risks. The VaR model also captures certain implied correlation risks associated with portfolio credit
derivatives as well as certain basis risks ( e.g ., corporate debt and related credit derivatives). Among their benefits, VaR models permit estimation of a portfolio�s aggregate market risk exposure, incorporating a range of varied market risks and portfolio assets. One key element of the VaR model
is that it reflects risk reduction due to portfolio diversification or hedging activities. However, VaR risk measures should be interpreted carefully in light of the methodology�s limitations, which include the following: past changes in market
risk factors may not always yield accurate predictions of the distributions and correlations of future market movements; changes in portfolio value in response to market movements (especially for complex derivative portfolios) may differ from the
responses calculated by a VaR model; VaR using a one-day time horizon does not fully capture the market risk of positions that cannot be liquidated or hedged within one day; the historical market risk factor data used for VaR estimation may provide
only limited insight into losses that could be incurred under market conditions that are unusual relative to the historical period used in estimating the VaR; and published VaR results reflect past trading positions while future risk depends on
future positions. VaR is most appropriate as a risk measure for trading positions in liquid financial markets and will understate the risk associated with severe events, such as periods of extreme illiquidity. The Company is aware of these and other
limitations and, therefore, uses VaR as only one component in its risk management oversight process. As explained above, this process also incorporates stress testing and scenario analyses and extensive risk monitoring, analysis, and control at the
trading desk, division and Company levels. The Company�s VaR
model evolves over time in response to changes in the composition of trading portfolios and to improvements in modeling techniques and systems capabilities. The Company is committed to continuous review and enhancement of VaR methodologies and
assumptions in order to capture evolving risks associated with changes in market structure and dynamics. As part of regular process improvement, additional systematic and name-specific risk factors may be added to improve the VaR model�s
ability to more accurately estimate risks to specific asset classes or industry sectors. Additionally, the Company continues to evaluate enhancements to the VaR model to make it more responsive to more recent market conditions while maintaining a
longer-term perspective. VaR for
2010. The table below presents the Company�s Trading, Non-trading and Aggregate VaR for each of the Company�s primary market risk exposures at December�31, 2010 and�December�31, 2009,
incorporating substantially all financial instruments generating market risk. A small proportion of trading positions generating market risk is not included in VaR, and the modeling of the risk characteristics of some positions relies upon
approximations that, under certain circumstances, could produce significantly different VaR results from those produced using more precise measures. The counterparty portfolio, which reflects adjustments, net of hedges, relating to counterparty credit risk and other market risks, was reclassified from
Non-trading VaR into Trading VaR at January�1, 2010. This reclassification reflects regulatory considerations surrounding the Company�s conversion to a financial holding company and the trading book nature of the Company�s
counterparty risk-hedging activities. Aggregate VaR was not affected by this change; however, this reclassification increased Trading VaR and decreased Non-trading VaR for the year ended December 31, 2009. Since the reported VaR statistics are estimates based on historical position
and market data, VaR should not be viewed as predictive of the Company�s future revenues or financial performance or of its ability to monitor and manage risk. There can be no assurance that the Company�s actual losses on a particular day
will not exceed the VaR amounts indicated below or that such losses will not occur more than five times in 100 trading days. VaR does not predict the magnitude of losses that, should they occur, may be significantly greater than the VaR amount. 100 Table of Contents The table below presents the Company�s 95%/one-day VaR: | Table 1: 95% Total VaR | 95% One-Day VaR for 2010 | 95% One-Day VaR for 2009 | ||||||||||||||||||||||||||||||
| Primary Market Risk Category | Period End | Average | High | Low | Period End | Average | High | Low | ||||||||||||||||||||||||
| (dollars in millions) | ||||||||||||||||||||||||||||||||
| Interest rate and credit spread | $ | 102 | $ | 129 | $ | 147 | $ | 100 | $ | 142 | $ | 128 | $ | 149 | $ | 106 | ||||||||||||||||
| Equity price | 30 | 28 | 52 | 19 | 23 | 21 | 36 | 14 | ||||||||||||||||||||||||
| Foreign exchange rate | 21 | 24 | 50 | 9 | 26 | 20 | 47 | 7 | ||||||||||||||||||||||||
| Commodity price | 30 | 28 | 36 | 21 | 24 | 24 | 38 | 18 | ||||||||||||||||||||||||
| Less: Diversification benefit(1) | (65 | ) | (70 | ) | (120 | ) | (32 | ) | (57 | ) | (55 | ) | (108 | ) | (34 | ) | ||||||||||||||||
| Total Trading VaR | $ | 118 | $ | 139 | $ | 165 | $ | 117 | $ | 158 | $ | 138 | $ | 162 | $ | 111 | ||||||||||||||||
| Total Non-trading VaR | $ | 77 | $ | 82 | $ | 137 | $ | 57 | $ | 67 | $ | 63 | $ | 89 | $ | 33 | ||||||||||||||||
| Aggregate VaR | $ | 146 | $ | 173 | $ | 217 | $ | 143 | $ | 187 | $ | 163 | $ | 205 | $ | 119 | ||||||||||||||||
| (1) | Diversification benefit equals the difference between Total VaR and the sum of the VaRs for the four risk categories. This benefit arises because the simulated one-day losses for each of the four primary market risk categories occur on different days; similar diversification benefits also are taken into account within each category. |
Table of Contents Table 2: 95% and 99% Average Trading VaR with Four-Year / One-Year Historical Time Series | Table 2: 95% and 99% Average Trading VaR with Four-Year / One-Year Historical Time Series | 95%�Average�One-Day�VaR for 2010 | 99%�Average�One-Day�VaR for 2010 | ||||||||||||||
| Primary Market Risk Category | Four-Year Factor�History | One-Year Factor�History | Four-Year Factor�History | One-Year Factor�History | ||||||||||||
| (dollars in millions) | ||||||||||||||||
| Interest rate and credit spread | $ | 129 | $ | 95 | $ | 264 | $ | 164 | ||||||||
| Equity price | 28 | 25 | 41 | 37 | ||||||||||||
| Foreign exchange rate | 24 | 24 | 42 | 38 | ||||||||||||
| Commodity price | 28 | 22 | 47 | 32 | ||||||||||||
| Less: Diversification benefit(1) | (70 | ) | (56 | ) | (120 | ) | (93 | ) | ||||||||
| Total Trading VaR | $ | 139 | $ | 110 | $ | 274 | $ | 178 | ||||||||
| (1) | Diversification benefit equals the difference between Total VaR and the sum of the VaRs for the four risk categories. This benefit arises because the simulated one-day losses for each of the four primary market risk categories occur on different days; similar diversification benefits also are taken into account within each category. |
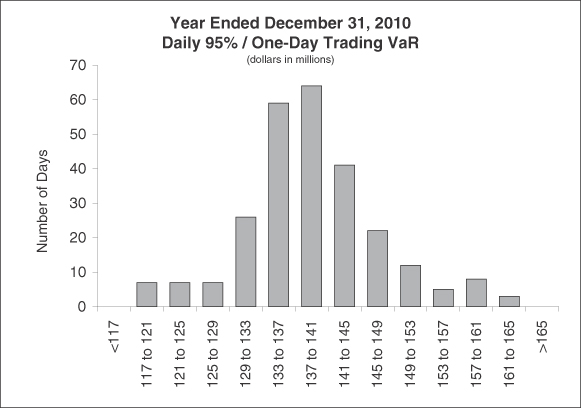 102 Table of Contents One method of evaluating the reasonableness of the Company�s VaR model as a measure of the
Company�s potential volatility of net revenues is to compare the VaR with actual trading revenues. Assuming no intra-day trading, for a 95%/one-day VaR, the expected number of times that trading losses should exceed VaR during the year is 13,
and, in general, if trading losses were to exceed VaR more than 21 times in a year, the accuracy of the VaR model could be questioned. Accordingly, the Company evaluates the reasonableness of its VaR model by comparing the potential declines in
portfolio values generated by the model with actual trading results. For days where losses exceed the 95% or 99% VaR statistic, the Company examines the drivers of trading losses to evaluate the VaR model�s accuracy relative to realized trading
results. The histogram below shows the distribution of daily net
trading revenues during 2010 for the Company�s trading businesses (these figures include revenues from the counterparty portfolio and also include net interest and non-agency commissions but exclude certain Non-trading revenues such as primary,
fee-based and prime brokerage revenues credited to the trading businesses). During 2010, the Company experienced net trading losses on 38 days, with zero excesses of the 95%/one-day Trading VaR.
102 Table of Contents One method of evaluating the reasonableness of the Company�s VaR model as a measure of the
Company�s potential volatility of net revenues is to compare the VaR with actual trading revenues. Assuming no intra-day trading, for a 95%/one-day VaR, the expected number of times that trading losses should exceed VaR during the year is 13,
and, in general, if trading losses were to exceed VaR more than 21 times in a year, the accuracy of the VaR model could be questioned. Accordingly, the Company evaluates the reasonableness of its VaR model by comparing the potential declines in
portfolio values generated by the model with actual trading results. For days where losses exceed the 95% or 99% VaR statistic, the Company examines the drivers of trading losses to evaluate the VaR model�s accuracy relative to realized trading
results. The histogram below shows the distribution of daily net
trading revenues during 2010 for the Company�s trading businesses (these figures include revenues from the counterparty portfolio and also include net interest and non-agency commissions but exclude certain Non-trading revenues such as primary,
fee-based and prime brokerage revenues credited to the trading businesses). During 2010, the Company experienced net trading losses on 38 days, with zero excesses of the 95%/one-day Trading VaR. 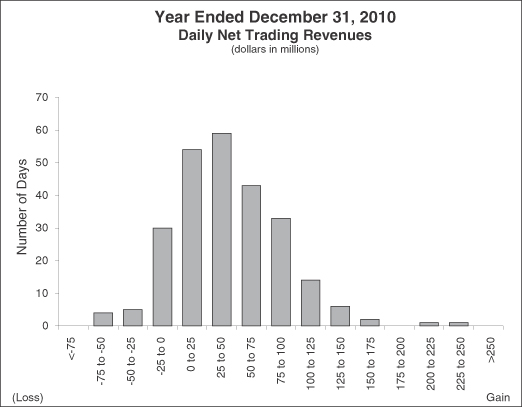 Non-trading Risks. Aggregate VaR currently incorporates certain Non-trading risks, such as the
interest rate risk generated by funding liabilities related to institutional trading positions and public company equity positions recorded as investments by the Company. Investments made by the Company that are not publicly traded are not reflected
in the Aggregate VaR results. VaR is one method of assessing the
risk of the Company�s Non-trading portfolio; however, due to a variety of factors ( e.g. , trading restrictions, illiquidity), sensitivity analysis may be a better approach to evaluating this risk. Reflected below is a sensitivity analysis
covering substantially all of the Company�s Non-trading risk. 103 Table of Contents Counterparty Exposure Related to the Company�s Own Spreads. The credit spread risk relating to the Company�s own mark-to-market
derivative counterparty exposure is managed separately from VaR. The credit spread risk sensitivity of this exposure corresponds to an increase in value of approximately $8 million for each +1 basis point widening in the Company�s credit spread
level for both December�31, 2010 and December�31, 2009. Funding Liabilities. The credit spread risk and interest rate risk associated with non-mark-to-market funding liabilities related to fixed and other Non-trading assets are
also excluded from VaR. At December�31, 2010 and December�31, 2009, non-mark-to-market funding liabilities related to fixed and other Non-trading assets were approximately $3.5 billion and $7.7 billion, respectively. The $4.2 billion
reduction reflects a decision by the Company to swap this amount of fixed-rate debt to a floating rate and is now included in the Non-trading VaR. The Company�s VaR does not capture the credit spread risk sensitivity of the Company�s mark-to-market funding liabilities, which corresponded to
an increase in value of approximately $14 million and $11 million for each +1 basis point widening in the Company�s credit spread level at December�31, 2010 and December�31, 2009, respectively. The increased credit spread sensitivity
is driven by greater issuances of structured notes. Interest Rate Risk Sensitivity on Income from Continuing Operations. The Company measures the interest rate risk of certain assets and
liabilities not included in Trading VaR by calculating the hypothetical sensitivity of Income from continuing operations (before income taxes) to potential changes in the level of interest rates over the next 12 months. This sensitivity analysis
includes positions that are mark-to-market as well as positions that are accounted for on an accrual basis. Given the currently low interest rate environment, the Company uses the following two interest rate scenarios to quantify the Company�s sensitivity: instantaneous parallel shocks of +100 basis points
and +200 basis points to all yield curves simultaneously. With respect to MSSB, the Company�s assessment of interest rate risk focuses on its economic investment in MSSB (the Company�s 51% share of MSSB�s income from continuing
operations before income taxes). These results can be seen in the table below.
Non-trading Risks. Aggregate VaR currently incorporates certain Non-trading risks, such as the
interest rate risk generated by funding liabilities related to institutional trading positions and public company equity positions recorded as investments by the Company. Investments made by the Company that are not publicly traded are not reflected
in the Aggregate VaR results. VaR is one method of assessing the
risk of the Company�s Non-trading portfolio; however, due to a variety of factors ( e.g. , trading restrictions, illiquidity), sensitivity analysis may be a better approach to evaluating this risk. Reflected below is a sensitivity analysis
covering substantially all of the Company�s Non-trading risk. 103 Table of Contents Counterparty Exposure Related to the Company�s Own Spreads. The credit spread risk relating to the Company�s own mark-to-market
derivative counterparty exposure is managed separately from VaR. The credit spread risk sensitivity of this exposure corresponds to an increase in value of approximately $8 million for each +1 basis point widening in the Company�s credit spread
level for both December�31, 2010 and December�31, 2009. Funding Liabilities. The credit spread risk and interest rate risk associated with non-mark-to-market funding liabilities related to fixed and other Non-trading assets are
also excluded from VaR. At December�31, 2010 and December�31, 2009, non-mark-to-market funding liabilities related to fixed and other Non-trading assets were approximately $3.5 billion and $7.7 billion, respectively. The $4.2 billion
reduction reflects a decision by the Company to swap this amount of fixed-rate debt to a floating rate and is now included in the Non-trading VaR. The Company�s VaR does not capture the credit spread risk sensitivity of the Company�s mark-to-market funding liabilities, which corresponded to
an increase in value of approximately $14 million and $11 million for each +1 basis point widening in the Company�s credit spread level at December�31, 2010 and December�31, 2009, respectively. The increased credit spread sensitivity
is driven by greater issuances of structured notes. Interest Rate Risk Sensitivity on Income from Continuing Operations. The Company measures the interest rate risk of certain assets and
liabilities not included in Trading VaR by calculating the hypothetical sensitivity of Income from continuing operations (before income taxes) to potential changes in the level of interest rates over the next 12 months. This sensitivity analysis
includes positions that are mark-to-market as well as positions that are accounted for on an accrual basis. Given the currently low interest rate environment, the Company uses the following two interest rate scenarios to quantify the Company�s sensitivity: instantaneous parallel shocks of +100 basis points
and +200 basis points to all yield curves simultaneously. With respect to MSSB, the Company�s assessment of interest rate risk focuses on its economic investment in MSSB (the Company�s 51% share of MSSB�s income from continuing
operations before income taxes). These results can be seen in the table below. | December�31, 2010 | ||||||||||
| +100�Basis�Points | +200�Basis�Points | |||||||||
| (dollars in millions) | ||||||||||
| Impact on income from continuing operations before income taxes | $ | 560 | $ | 1,084 | ||||||
| Impact on income from continuing operations before income taxes, excluding Citi�s interest in MSSB(1) | 343 | 664 | ||||||||
| (1) | Amounts reflect the exclusion of the portion of income from continuing operations before income and taxes associated with MSSB�s noncontrolling interest in the joint venture. |
Table of Contents conditions. Furthermore, the model does not reflect the Company�s expectations regarding the movement of interest rates in the near term nor the actual effect on Income from continuing
operations before income taxes if such changes were to occur. Investments. The Company makes investments in both public and private companies, primarily in its Institutional Securities and Asset Management business segments.
These investments are predominantly equity positions with long investment horizons, the majority of which are for business facilitation purposes. The market risk related to these investments is measured by estimating the potential reduction in net
revenues associated with a 10% decline in asset values as shown in the table below. | Investments | 10%�Sensitivity December�31,�2010 | |||
| (dollars�in�millions) | ||||
| Investments related to merchant banking activities: | ||||
| Real estate funds | $ | 108 | ||
| Private equity and infrastructure funds | 115 | |||
| Other investments: | ||||
| Mitsubishi UFJ Morgan Stanley Securities Co., Ltd. | $ | 179 | ||
| Asset Management hedge fund investments | 169 | |||
| Other firm investments | 344 | |||
Table of Contents See Note 8 to the consolidated financial statements for additional information on the credit quality of the
Company�s financing receivables. Institutional
Securities Activities. Corporate
Lending. In connection with certain of its Institutional Securities business segment activities, the Company provides loans or lending commitments (including bridge financing) to selected corporate clients. Such loans
and lending commitments can generally be classified as either �relationship-driven� or �event-driven.� �Relationship-driven� loans and lending commitments are generally made to expand business relationships with select clients. Commitments
associated with �relationship-driven� activities may not be indicative of the Company�s actual funding requirements, as the commitment may expire unused or the borrower may not fully utilize the commitment. The Company may hedge its
exposures in connection with �relationship-driven� transactions, and commitments may be subject to conditions, including financial covenants. �Event-driven� loans and lending commitments refer to activities associated with a particular event or transaction, such as to support client
merger, acquisition or recapitalization activities. Commitments associated with these �event-driven� activities may not be indicative of the Company�s actual funding requirements since funding is contingent upon a proposed transaction
being completed. In addition, the borrower may not fully utilize the commitment or the Company�s portion of the commitment may be reduced through the syndication process. The borrower�s ability to draw on the commitment is also subject to
certain terms and conditions, among other factors. The Company risk manages its exposures in connection with �event-driven� transactions through various means, including syndication, distribution and/or hedging. Securitizations. The Company may extend
short- or long-term funding to clients through loans and lending commitments that are secured by assets of the borrower and generally provide for over-collateralization, including commercial real estate, loans secured by loan pools, commercial and
industrial company loans, and secured lines of revolving credit. Credit risk with respect to these loans and lending commitments arises from the failure of a borrower to perform according to the terms of the loan agreement or a decline in the
underlying collateral value. Derivative
Contracts. In the normal course of business, the Company enters into a variety of derivative contracts related to financial instruments and commodities. The Company uses these instruments for trading and hedging
purposes, as well as for asset and liability management. These instruments generally represent future commitments to swap interest payment streams, exchange currencies, or purchase or sell commodities and other financial instruments on specific
terms at specified future dates. Many of these products have maturities that do not extend beyond one year, although swaps, options and equity warrants typically have longer maturities. The Company incurs credit risk as a dealer in OTC derivatives. Credit risk with respect to derivative instruments arises from
the failure of a counterparty to perform according to the terms of the contract. The Company�s exposure to credit risk at any point in time is represented by the fair value of the derivative contracts reported as assets, net of cash collateral
received. The fair value of derivatives represents the amount at which the derivative could be exchanged in an orderly transaction between market participants and is further described in Note 2 to the consolidated financial statements. Future
changes in interest rates, foreign currency exchange rates, or the fair values of the financial instruments, commodities or indices underlying these contracts ultimately may result in cash settlements exceeding fair value amounts recognized in the
consolidated statements of financial condition. In addition to measuring and managing credit exposures referenced to the current fair value of derivative instruments, the Company also measures and manages credit exposures referenced to potential
exposure. Potential exposure is an estimate of exposure, within a specified confidence level, that could be outstanding over time based on market movements. 106 Table of Contents Other. In addition to the activities noted above, there are other
credit risks managed by the Credit Risk Management Department and various business areas within the Institutional Securities business segment. The Company incurs credit risk through margin and collateral transactions with clearing houses, clearing
agencies, exchanges, banks, securities firms and other financial counterparties. Certain risk management activities as they pertain to establishing appropriate collateral amounts for the Company�s prime brokerage and securitized product
businesses are primarily monitored within those respective areas in that they determine the appropriate collateral level for each strategy or position. In addition, a collateral management group monitors collateral levels against requirements and
oversees the administration of the collateral function. Analyzing Credit Risk. Credit risk management takes place at the transaction, obligor and portfolio levels. In order
to protect the Company from losses resulting from these activities, the Credit Risk Management Department ensures lending transactions and derivative exposures are analyzed, that the creditworthiness of the Company�s counterparties and
borrowers is reviewed regularly and that credit exposure is actively monitored and managed. The Credit Risk Management Department assigns obligor credit ratings to the Company�s counterparties and borrowers, which reflect an assessment of an
obligor�s probability of default. Additionally, the Credit Risk Management Department evaluates the relative position of the Company�s particular obligation in the borrower�s capital structure and relative recovery prospects, as well
as collateral (if applicable) and other structural elements of the particular transaction. Risk Mitigation. The Company may seek to mitigate credit risk from its lending and derivatives transactions in multiple ways. At the transaction level, the Company
seeks to mitigate risk through management of key risk elements such as size, tenor, financial covenants, seniority and collateral. The Company actively hedges its lending and derivatives exposure through various financial instruments that may
include single name, portfolio and structured credit derivatives. Additionally, the Company may sell, assign or sub-participate funded loans and lending commitments to other financial institutions in the primary and secondary loan market. In
connection with its derivatives trading activities, the Company generally enters into master netting agreements and collateral arrangements with counterparties. These agreements provide the Company with the ability to offset a counterparty�s
rights and obligations, request additional collateral when necessary or liquidate the collateral in the event of counterparty default. Credit Exposure�Corporate Lending. The following tables present information about the Company�s corporate
funded loans and lending commitments carried at fair value at December�31, 2010 and December�31, 2009. The �total corporate lending exposure� column includes both lending commitments and funded loans. Fair value of corporate
lending exposure represents the fair value of loans that have been drawn by the borrower and lending commitments that were outstanding at December�31, 2010 and December�31, 2009. Lending commitments represent legally binding obligations to
provide funding to clients at December�31, 2010 and December�31, 2009 for both �relationship-driven� and �event-driven� lending transactions. As discussed above, these loans and lending commitments have varying terms,
may be senior or subordinated, may be secured or unsecured, are generally contingent upon representations, warranties and contractual conditions applicable to the borrower, and may be syndicated, traded or hedged by the Company. At December�31, 2010 and December�31, 2009, the aggregate amount of
investment grade loans was $3.9 billion and $6.5 billion, respectively, and the aggregate amount of non-investment grade loans was $6.8 billion and $9.5 billion, respectively. In connection with these corporate lending activities (which include
corporate funded loans and lending commitments), the Company had hedges (which include �single name,� �sector� and �index� hedges) with a notional amount of $21.0 billion and $25.8 billion related to the total corporate
lending exposure of $69.2 billion and $64.0 billion at December�31, 2010 and December�31, 2009, respectively. 107 Table of Contents The tables below show the Company�s credit exposure from its corporate lending positions and lending
commitments at December�31, 2010 and December�31, 2009. Since commitments associated with these business activities may expire unused, they do not necessarily reflect the actual future cash funding requirements: Corporate Lending Commitments and Funded Loans at
December�31, 2010 | Years to Maturity | Total Corporate Lending Exposure(2) | Corporate Lending Exposure�at Fair�Value(3) | Corporate Lending Commitments(4) | |||||||||||||||||||||||||
| Credit Rating(1) | Less�than�1 | 1-3 | 3-5 | Over 5 | ||||||||||||||||||||||||
| (dollars in millions) | ||||||||||||||||||||||||||||
| AAA | $ | 351 | $ | 342 | $ | 50 | $ | � | $ | 743 | $ | � | $ | 743 | ||||||||||||||
| AA | 3,220 | 5,435 | 671 | 70 | 9,396 | 131 | 9,265 | |||||||||||||||||||||
| A | 2,739 | 8,780 | 2,667 | 34 | 14,220 | 542 | 13,678 | |||||||||||||||||||||
| BBB | 2,793 | 16,170 | 4,816 | 237 | 24,016 | 3,203 | 20,813 | |||||||||||||||||||||
| Investment grade | 9,103 | 30,727 | 8,204 | 341 | 48,375 | 3,876 | 44,499 | |||||||||||||||||||||
| Non-investment�grade | 1,740 | 6,857 | 7,642 | 4,539 | 20,778 | 6,845 | 13,933 | |||||||||||||||||||||
| Total | $ | 10,843 | $ | 37,584 | $ | 15,846 | $ | 4,880 | $ | 69,153 | $ | 10,721 | $ | 58,432 | ||||||||||||||
| (1) | Obligor credit ratings are determined by the Credit Risk Management Department. |
| (2) | Total corporate lending exposure represents the Company�s potential loss assuming the fair value of funded loans and lending commitments was zero. |
| (3) | The Company�s corporate lending exposure carried at fair value includes $11.2 billion of funded loans and $0.5 billion of lending commitments recorded in Financial instruments owned and Financial instruments sold, not yet purchased, respectively, in the consolidated statements of financial condition at December�31, 2010. See Notes 8 and 13 to the consolidated financial statements for information on corporate loans and corporate lending commitments, respectively. |
| (4) | Amounts represent the notional amount of unfunded lending commitments less the amount of commitments reflected in the Company�s consolidated statements of financial condition. For syndications led by the Company,�lending commitments accepted by the borrower but not yet closed�are net of the amounts�agreed to by counterparties that will participate in the syndication. For syndications that the Company participates in and does not lead, lending commitments accepted by the borrower but not yet closed include only the amount that the Company expects it will be allocated from the lead syndicate bank. |
| Years to Maturity | Total Corporate Lending Exposure(2) | Corporate Lending Exposure�at Fair�Value(3) | Corporate Lending Commitments(4) | |||||||||||||||||||||||||
| Credit Rating(1) | Less�than�1 | 1-3 | 3-5 | Over 5 | ||||||||||||||||||||||||
| (dollars in millions) | ||||||||||||||||||||||||||||
| AAA | $ | 542 | $ | 233 | $ | � | $ | � | $ | 775 | $ | � | $ | 775 | ||||||||||||||
| AA | 3,141 | 4,354 | 275 | � | 7,770 | 80 | 7,690 | |||||||||||||||||||||
| A | 3,116 | 9,796 | 1,129 | 548 | 14,589 | 1,918 | 12,671 | |||||||||||||||||||||
| BBB | 4,272 | 16,191 | 3,496 | 164 | 24,123 | 4,548 | 19,575 | |||||||||||||||||||||
| Investment grade | 11,071 | 30,574 | 4,900 | 712 | 47,257 | 6,546 | 40,711 | |||||||||||||||||||||
| Non-investment�grade | 749 | 6,525 | 6,097 | 3,322 | 16,693 | 9,517 | 7,176 | |||||||||||||||||||||
| Total | $ | 11,820 | $ | 37,099 | $ | 10,997 | $ | 4,034 | $ | 63,950 | $ | 16,063 | $ | 47,887 | ||||||||||||||
| (1) | Obligor credit ratings are determined by the Credit Risk Management Department. |
| (2) | Total corporate lending exposure represents the Company�s potential loss assuming the fair value of funded loans and lending commitments was zero. |
| (3) | The Company�s corporate lending exposure carried at fair value includes $15.6 billion of funded loans and $0.4 billion of lending commitments recorded in Financial instruments owned and Financial instruments sold, not yet purchased, respectively, in the consolidated statements of financial condition at December�31, 2009. The Company�s corporate lending exposure carried at amortized cost includes $850 million of funded loans recorded in Loans in the consolidated statements of financial condition. |
| (4) | Amounts represent the notional amount of unfunded lending commitments less the amount of commitments reflected in the Company�s consolidated statements of financial condition. |
Table of Contents �Event-Driven� Loans and Lending Commitments at December�31, 2010 and December�31,
2009. Included in the total corporate lending exposure
amounts in the table above at December�31, 2010 is �event-driven� exposure of $5.4 billion composed of funded loans of $1.3 billion and lending commitments of $4.1 billion. Included in the $5.4 billion of �event-driven�
exposure at December�31, 2010 were $4.9 billion of loans and lending commitments to non-investment grade borrowers that were closed. Included in the total corporate lending exposure amounts in the table above at December�31, 2009 is �event-driven� exposure of $5.6 billion
composed of funded loans of $2.8 billion and lending commitments of $2.8 billion. Included in the $5.6 billion of �event-driven� exposure at December�31, 2009 were $3.7 billion of loans and lending commitments to non-investment grade
borrowers that were closed. Activity associated with the
corporate �event-driven� lending exposure during 2010 was as follows (dollars in millions): | �Event-driven� lending exposures at December�31, 2009 | $ | 5,621 | ||
| Closed commitments | 3,636 | |||
| Net reductions, primarily through distributions | (3,720 | ) | ||
| Mark-to-market adjustments | (128 | ) | ||
| �Event-driven� lending exposures at December�31, 2010 | $ | 5,409 | ||
| Years to Maturity | Cross-Maturity and Cash�Collateral Netting(3) | Net Exposure Post- Cash Collateral | Net Exposure Post- Collateral | |||||||||||||||||||||||||
| Credit Rating(2) | Less�than�1 | 1-3 | 3-5 | Over 5 | ||||||||||||||||||||||||
| (dollars in millions) | ||||||||||||||||||||||||||||
| AAA | $ | 802 | $ | 2,005 | $ | 1,242 | $ | 8,823 | $ | (5,906 | ) | $ | 6,966 | $ | 6,683 | |||||||||||||
| AA | 6,601 | 6,760 | 5,589 | 17,844 | (27,801 | ) | 8,993 | 7,877 | ||||||||||||||||||||
| A | 8,655 | 8,710 | 6,507 | 26,492 | (36,397 | ) | 13,967 | 12,383 | ||||||||||||||||||||
| BBB | 2,982 | 4,109 | 2,124 | 7,347 | (9,034 | ) | 7,528 | 6,001 | ||||||||||||||||||||
| Non-investment grade | 2,628 | 3,231 | 1,779 | 4,456 | (4,355 | ) | 7,739 | 5,348 | ||||||||||||||||||||
| Total | $ | 21,668 | $ | 24,815 | $ | 17,241 | $ | 64,962 | $ | (83,493 | ) | $ | 45,193 | $ | 38,292 | |||||||||||||
| (1) | Fair values shown represent the Company�s net exposure to counterparties related to the Company�s OTC derivative products. The table does not include listed derivatives and the effect of any related hedges utilized by the Company. The table also excludes fair values corresponding to other credit exposures, such as those arising from the Company�s lending activities. |
| (2) | Obligor credit ratings are determined by the Company�s Credit Risk Management Department. |
| (3) | Amounts represent the netting of receivable balances with payable balances for the same counterparty across maturity categories. Receivable and payable balances with the same counterparty in the same maturity category are netted within such maturity category, where appropriate. Cash collateral received is netted on a counterparty basis, provided legal right of offset exists. |
Table of Contents OTC Derivative Products�Financial Instruments Owned at December�31, 2009(1) | Years to Maturity | Cross- Maturity and�Cash Collateral Netting(3) | Net Exposure Post-Cash Collateral | Net Exposure Post- Collateral | |||||||||||||||||||||||||
| Credit Rating(2) | Less�than�1 | 1-3 | 3-5 | Over 5 | ||||||||||||||||||||||||
| (dollars in millions) | ||||||||||||||||||||||||||||
| AAA | $ | 852 | $ | 2,026 | $ | 3,876 | $ | 9,331 | $ | (6,616 | ) | $ | 9,469 | $ | 9,082 | |||||||||||||
| AA | 6,469 | 7,855 | 6,600 | 15,071 | (25,576 | ) | 10,419 | 8,614 | ||||||||||||||||||||
| A | 8,018 | 10,712 | 7,990 | 22,739 | (38,971 | ) | 10,488 | 9,252 | ||||||||||||||||||||
| BBB | 3,032 | 4,193 | 2,947 | 7,524 | (8,971 | ) | 8,725 | 5,902 | ||||||||||||||||||||
| Non-investment�grade | 2,773 | 3,331 | 2,113 | 4,431 | (4,534 | ) | 8,114 | 6,525 | ||||||||||||||||||||
| Total | $ | 21,144 | $ | 28,117 | $ | 23,526 | $ | 59,096 | $ | (84,668 | ) | $ | 47,215 | $ | 39,375 | |||||||||||||
| (1) | Fair values shown represent the Company�s net exposure to counterparties related to the Company�s OTC derivative products. The table does not include listed derivatives and the effect of any related hedges utilized by the Company. The table also excludes fair values corresponding to other credit exposures, such as those arising from the Company�s lending activities. |
| (2) | Obligor credit ratings are determined by the Company�s Credit Risk Management Department. |
| (3) | Amounts represent the netting of receivable balances with payable balances for the same counterparty across maturity categories. Receivable and payable balances with the same counterparty in the same maturity category are netted within such maturity category, where appropriate. Cash collateral received is netted on a counterparty basis, provided legal right of offset exists. |
| Years to Maturity | Cross- Maturity and Cash Collateral Netting(1) | Net Exposure Post- Cash Collateral | Net Exposure Post- Collateral | |||||||||||||||||||||||||
| Product Type | Less�than�1 | 1-3 | 3-5 | Over 5 | ||||||||||||||||||||||||
| (dollars in millions) | ||||||||||||||||||||||||||||
| Interest rate and currency swaps, interest rate options, credit derivatives and other fixed income securities contracts | $ | 10,308 | $ | 17,447 | $ | 15,571 | $ | 62,224 | $ | (73,708 | ) | $ | 31,842 | $ | 28,158 | |||||||||||||
| Foreign exchange forward contracts and options | 5,703 | 754 | 185 | 64 | (2,984 | ) | 3,722 | 3,051 | ||||||||||||||||||||
| Equity securities contracts (including equity swaps, warrants and options) | 2,416 | 1,201 | 247 | 1,604 | (2,587 | ) | 2,881 | 1,613 | ||||||||||||||||||||
| Commodity forwards, options and swaps | 3,241 | 5,413 | 1,238 | 1,070 | (4,214 | ) | 6,748 | 5,470 | ||||||||||||||||||||
| Total | $ | 21,668 | $ | 24,815 | $ | 17,241 | $ | 64,962 | $ | (83,493 | ) | $ | 45,193 | $ | 38,292 | |||||||||||||
| (1) | Amounts represent the netting of receivable balances with payable balances for the same counterparty across maturity and product categories. Receivable and payable balances with the same counterparty in the same maturity category are netted within the maturity category, where appropriate. Cash collateral received is netted on a counterparty basis, provided legal right of offset exists. |
Table of Contents OTC Derivative Products�Financial Instruments Sold, Not Yet Purchased, at
December�31, 2010(1) | Years to Maturity | Cross-Maturity and Cash Collateral Netting(2) | Total | ||||||||||||||||||||||
| Product Type | Less�than�1 | 1-3 | 3-5 | Over 5 | ||||||||||||||||||||
| (dollars in millions) | ||||||||||||||||||||||||
| Interest rate and currency swaps, interest rate options, credit derivatives and other fixed income securities contracts | $ | 8,195 | $ | 11,451 | $ | 13,965 | $ | 35,460 | $ | (44,955 | ) | $ | 24,116 | |||||||||||
| Foreign exchange forward contracts and options | 6,688 | 680 | 332 | 79 | (3,154 | ) | 4,625 | |||||||||||||||||
| Equity securities contracts (including equity swaps, warrants and options) | 4,768 | 2,886 | 1,362 | 1,161 | (5,675 | ) | 4,502 | |||||||||||||||||
| Commodity forwards, options and swaps | 4,495 | 4,556 | 1,559 | 838 | (5,442 | ) | 6,006 | |||||||||||||||||
| Total | $ | 24,146 | $ | 19,573 | $ | 17,218 | $ | 37,538 | $ | (59,226 | ) | $ | 39,249 | |||||||||||
| (1) | Since these amounts are liabilities of the Company, they do not result in credit exposures. |
| (2) | Amounts represent the netting of receivable balances with payable balances for the same counterparty across maturity and product categories. Receivable and payable balances with the same counterparty in the same maturity category are netted within the maturity category, where appropriate. Cash collateral paid is netted on a counterparty basis, provided legal right of offset exists. |
| Years to Maturity | Cross-�
Maturity and Cash Collateral Netting(1) | Net�
Exposure Post-Cash Collateral | Net�
Exposure Post- Collateral | |||||||||||||||||||||||||
| Product Type | Less�than�1 | 1-3 | 3-5 | Over 5 | ||||||||||||||||||||||||
| (dollars in millions) | ||||||||||||||||||||||||||||
| Interest rate and currency swaps, interest rate options, credit derivatives and other fixed income securities contracts | $ | 11,958 | $ | 19,556 | $ | 20,564 | $ | 57,240 | $ | (76,255 | ) | $ | 33,063 | $ | 29,444 | |||||||||||||
| Foreign exchange forward contracts and options | 3,859 | 916 | 201 | 40 | (1,994 | ) | 3,022 | 2,699 | ||||||||||||||||||||
| Equity securities contracts (including equity swaps, warrants and options) | 1,987 | 1,023 | 441 | 697 | (2,065 | ) | 2,083 | 1,109 | ||||||||||||||||||||
| Commodity forwards, options and swaps | 3,340 | 6,622 | 2,320 | 1,119 | (4,354 | ) | 9,047 | 6,123 | ||||||||||||||||||||
| Total | $ | 21,144 | $ | 28,117 | $ | 23,526 | $ | 59,096 | $ | (84,668 | ) | $ | 47,215 | $ | 39,375 | |||||||||||||
| (1) | Amounts represent the netting of receivable balances with payable balances for the same counterparty across maturity and product categories. Receivable and payable balances with the same counterparty in the same maturity category are netted within the maturity category, where appropriate. Cash collateral received is netted on a counterparty basis, provided legal right of offset exists. |
Table of Contents OTC Derivative Products�Financial Instruments Sold, Not Yet Purchased, at
December�31, 2009(1) | Years to Maturity | Cross-Maturity and Cash Collateral Netting(2) | Total | ||||||||||||||||||||||
| Product Type | Less�than�1 | 1-3 | 3-5 | Over 5 | ||||||||||||||||||||
| (dollars in millions) | ||||||||||||||||||||||||
| Interest rate and currency swaps, interest rate options, credit derivatives and other fixed income securities contracts | $ | 6,054 | $ | 11,442 | $ | 11,795 | $ | 32,133 | $ | (40,743 | ) | $ | 20,681 | |||||||||||
| Foreign exchange forward contracts and options | 3,665 | 647 | 201 | 72 | (1,705 | ) | 2,880 | |||||||||||||||||
| Equity securities contracts (including equity swaps, warrants and options) | 4,528 | 2,547 | 1,253 | 1,150 | (5,860 | ) | 3,618 | |||||||||||||||||
| Commodity forwards, options and swaps | 3,727 | 4,668 | 1,347 | 975 | (5,336 | ) | 5,381 | |||||||||||||||||
| Total | $ | 17,974 | $ | 19,304 | $ | 14,596 | $ | 34,330 | $ | (53,644 | ) | $ | 32,560 | |||||||||||
| (1) | Since these amounts are liabilities of the Company, they do not result in credit exposures. |
| (2) | Amounts represent the netting of receivable balances with payable balances for the same counterparty across maturity and product categories. Receivable and payable balances with the same counterparty in the same maturity category are netted within the maturity category, where appropriate. Cash collateral paid is netted on a counterparty basis, provided legal right of offset exists. |
| At December�31, 2010 | At December�31, 2009 | |||||||||||||||
| Product Type | Assets | Liabilities | Assets | Liabilities | ||||||||||||
| (dollars in millions) | ||||||||||||||||
| Interest rate and currency swaps, interest rate options, credit derivatives and other fixed income securities contracts | $ | 32,163 | $ | 24,743 | $ | 33,307 | $ | 20,911 | ||||||||
| Foreign exchange forward contracts and options | 3,722 | 4,625 | 3,022 | 2,824 | ||||||||||||
| Equity securities contracts (including equity swaps, warrants and options) | 7,865 | 10,939 | 3,619 | 7,371 | ||||||||||||
| Commodity forwards, options and swaps | 7,542 | 7,495 | 9,133 | 7,103 | ||||||||||||
| Total | $ | 51,292 | $ | 47,802 | $ | 49,081 | $ | 38,209 | ||||||||
Table of Contents The Company trades in a variety of derivatives and may either purchase or write protection on a single name
or portfolio of referenced entities. The Company is an active market-maker in the credit derivatives markets. As a market-maker, the Company works to earn a bid-offer spread on client flow business and manage any residual credit or correlation risk
on a portfolio basis.�Further, the Company uses credit derivatives to manage its exposure to residential and commercial mortgage loans and corporate lending exposures during the periods presented. The Company actively monitors its counterparty credit risk related to credit
derivatives. A majority of the Company�s counterparties are banks, broker-dealers, insurance and other financial institutions, and Monolines. Contracts with these counterparties do not include ratings-based termination events but do include
counterparty rating downgrades, which may result in additional collateral being required by the Company. For further information on the Company�s exposure to Monolines, see �Management�s Discussion and Analysis of Financial Condition
and Results of Operations�Significant Items�Monoline Insurers� in Part II, Item�7 herein. The master agreements with these Monoline counterparties are generally unsecured, and the few ratings-based triggers (if any) generally
provide the Company the ability to terminate only upon significant downgrade. As with all derivative contracts, the Company considers counterparty credit risk in the valuation of its positions and recognizes credit valuation adjustments as
appropriate within Principal transactions�Trading. The
following tables summarize the key characteristics of the Company�s credit derivative portfolio by counterparty at December�31, 2010 and December�31, 2009. The fair values shown are before the application of any counterparty or cash
collateral netting: | At December�31, 2010 | ||||||||||||||||
| Fair Values(1) | Notionals | |||||||||||||||
| Receivable | Payable | Beneficiary | Guarantor | |||||||||||||
| (dollars in millions) | ||||||||||||||||
| Banks and securities firms | $ | 96,551 | $ | 86,574 | $ | 2,037,326 | $ | 2,032,824 | ||||||||
| Insurance and other financial institutions | 10,954 | 8,679 | 277,714 | 257,180 | ||||||||||||
| Monolines(2) | 2,370 | � | 25,676 | � | ||||||||||||
| Non-financial entities | 259 | 373 | 2,920 | 4,247 | ||||||||||||
| Total | $ | 110,134 | $ | 95,626 | $ | 2,343,636 | $ | 2,294,251 | ||||||||
| (1) | The Company�s credit default swaps are classified in both Level 2 and Level 3 of the fair value hierarchy. Approximately 13% of receivable fair values and 8% of payable fair values represent Level 3 amounts. |
| (2) | Amounts do not include the effect of hedges of Monoline derivative counterparty exposure. |
| At December�31, 2009 | ||||||||||||||||
| Fair Values(1) | Notionals(2) | |||||||||||||||
| Receivable | Payable | Beneficiary | Guarantor | |||||||||||||
| (dollars in millions) | ||||||||||||||||
| Banks and securities firms | $ | 125,352 | $ | 115,855 | $ | 2,294,658 | $ | 2,213,761 | ||||||||
| Insurance and other financial institutions | 15,422 | 9,310 | 194,353 | 229,630 | ||||||||||||
| Monolines | 4,903 | � | 22,886 | � | ||||||||||||
| Non-financial entities | 387 | 69 | 3,990 | 3,634 | ||||||||||||
| Total | $ | 146,064 | $ | 125,234 | $ | 2,515,887 | $ | 2,447,025 | ||||||||
| (1) | The Company�s credit default swaps are classified in both Level 2 and Level 3 of the fair value hierarchy. Approximately 16% of receivable fair values and 11% of payable fair values represent Level 3 amounts. |
| (2) | As part of an industry-wide effort to reduce the total notional amount of outstanding offsetting credit derivative trades, the Company participated in novating certain credit default swap contracts with external counterparties to a central clearinghouse during 2009. |
Table of Contents loans and lending commitments as discussed above and current exposure arising from the Company�s OTC derivative contracts) was to emerging markets, and no one emerging market country
accounted for more than approximately�1% of the Company�s credit exposure. The Company defines emerging markets to include generally all countries where the economic, legal and political systems are transitional and in the process of developing into more transparent and
accountable systems that are consistent with advanced countries. The following tables show the Company�s percentage of credit exposure from its primary corporate loans and lending commitments and OTC derivative
products by country at December�31, 2010 and December�31, 2009: | Corporate Lending Exposure(1) | ||||||||
| At�December�
31, 2010 | At�December�
31, 2009 | |||||||
| Country | ||||||||
| United States | 65 | % | 65 | % | ||||
| United Kingdom | 7 | 7 | ||||||
| Germany | 6 | 6 | ||||||
| Netherlands | 2 | 2 | ||||||
| Canada | 2 | 2 | ||||||
| France | 2 | 2 | ||||||
| Switzerland | 2 | 2 | ||||||
| Cayman Islands | 2 | 2 | ||||||
| Luxembourg | 2 | 2 | ||||||
| Other | 10 | 10 | ||||||
| Total | 100 | % | 100 | % | ||||
| OTC Derivative Products(1)(2) | ||||||||
| At�December�
31, 2010 | At�December�
31, 2009 | |||||||
| Country | ||||||||
| United States | 35 | % | 31 | % | ||||
| Cayman Islands | 11 | 14 | ||||||
| United Kingdom | 9 | 8 | ||||||
| Italy | 7 | 7 | ||||||
| France | 4 | 3 | ||||||
| Germany | 3 | 4 | ||||||
| Japan | 3 | 2 | ||||||
| Luxembourg | 2 | 2 | ||||||
| Australia | 2 | 2 | ||||||
| Chile | 2 | 2 | ||||||
| Jersey | 2 | 3 | ||||||
| Austria | 2 | 2 | ||||||
| Netherlands | 2 | 1 | ||||||
| Canada | 2 | 2 | ||||||
| Switzerland | 2 | 1 | ||||||
| Other | 12 | 16 | ||||||
| Total | 100 | % | 100 | % | ||||
| (1) | Credit exposure amounts are based on the domicile of the counterparty. |
| (2) | Credit exposure amounts do not reflect the offsetting benefit of financial instruments that the Company utilizes to hedge credit exposure arising from OTC derivative products. |
Table of Contents Industry Exposure. The Company also monitors its credit exposure to
individual industries for credit exposure arising from corporate loans and lending commitments as discussed above and current exposure arising from the Company�s OTC derivative contracts. The following tables show the Company�s percentage of credit exposure from its primary corporate loans and lending
commitments and OTC derivative products by industry at December�31, 2010: | Corporate�Lending�Exposure | ||||
| At December
31, 2010 | ||||
| Industry | ||||
| Energy | 13 | % | ||
| Utilities | 11 | |||
| Financial institutions(1) | 10 | |||
| Chemicals, metals, mining and other materials | 8 | |||
| Technology | 7 | |||
| Media-related entities | 6 | |||
| Telecommunications services | 6 | |||
| Food, beverage and tobacco | 5 | |||
| Pharmaceutical and healthcare | 5 | |||
| Insurance | 4 | |||
| Capital goods | 4 | |||
| Real estate | 3 | |||
| Other | 18 | |||
| Total | 100 | % | ||
| OTC�Derivative�Products | ||||
| At December
31, 2010 | ||||
| Industry | ||||
| Financial institutions(1) | 31 | % | ||
| Banks | 13 | |||
| Sovereign governments | 11 | |||
| Insurance | 9 | |||
| Utilities | 8 | |||
| Regional governments | 6 | |||
| Energy | 5 | |||
| Chemicals, metals, mining and other materials | 3 | |||
| Pharmaceutical and healthcare | 3 | |||
| Other | 11 | |||
| Total | 100 | % | ||
| (1) | Percentage reflects credit exposures from special purpose entity vehicles, other diversified financial service entities and mutual and pension funds, exchanges and clearing houses, and private equity and real estate funds. |
Table of Contents considered in the review of margin loans are the amount of the loan, the intended purpose, the degree of leverage being employed in the account, and overall evaluation of the portfolio to ensure
proper diversification or, in the case of concentrated positions, appropriate liquidity of the underlying collateral or potential hedging strategies to reduce risk. Additionally, transactions relating to concentrated or restricted positions require
a review of any legal impediments to liquidation of the underlying collateral. Underlying collateral for margin loans is reviewed with respect to the liquidity of the proposed collateral positions, valuation of securities, historic trading range,
volatility analysis and an evaluation of industry concentrations. The Company, through agreements with Citi relating to the formation of MSSB, retains certain credit risk for margin and non-purpose loans that are held at
Citigroup Global Markets Inc. in its capacity as clearing broker for certain MSSB clients. The related loans are generally subject to the same oversight as similar margin and non-purpose loans held by the Company and its subsidiaries. Non-purpose securities-based lending�allows�clients
to borrow money against the value of qualifying securities�for any suitable purpose other than purchasing, trading, or carrying marketable securities or refinancing margin debt.�Similar to margin lending, non-purpose securities-based loans
are structured as demand facilities. This lending activity has primarily been conducted through the Portfolio Loan Account (�PLA�) product platform. The Company�establishes�approved lines�and advance rates against qualifying
securities and monitors�limits daily and, pursuant to such guidelines, requires customers to deposit additional collateral, or reduce�debt�positions, when necessary.�Factors considered in the review of�non-purpose
securities-based lending�are amount of the loan,�the degree of concentrated or restricted positions, and the overall evaluation of the portfolio to ensure proper diversification, or, in the case of concentrated positions, appropriate
liquidity of the underlying collateral or potential hedging strategies. Underlying collateral for�non-purpose securities-based loans is reviewed with respect to the liquidity of the proposed collateral positions, valuation of securities,
historic trading range, volatility analysis and an evaluation of industry concentrations. A new non-purpose lending platform, Tailored Lending (�TL�), was launched in February 2010 and predominantly provides securities-based lending to high net worth clients of MSSB. The TL platform
looks beyond the collateral security in its underwriting process to also incorporate a comprehensive analysis of the obligor�s financial profile and overall creditworthiness. Consequently, TL advance rates are generally higher than those
offered in the PLA product and TL facilities may be offered on a committed basis. The Global Wealth Management Group business segment also provides�structured credit facilities to high net worth individuals and their�small and medium-sized domestic businesses, with a suite of
products that includes working capital lines of credit, revolving lines of credit, standby letters of credit, term loans and�commercial real estate mortgages. Decisions to extend credit are based on an analysis�of the borrower, the
guarantor, the collateral, cash flow, liquidity, leverage and credit history. With respect to first mortgages and second mortgages, including HELOC loans, a loan evaluation process is adopted within a framework of credit underwriting policies and collateral valuation.�The
Company�s underwriting policy is designed to ensure that all borrowers pass an assessment of capacity and willingness to pay, which includes an analysis of applicable industry standard credit scoring models ( e.g. , FICO scores), debt
ratios and reserves of the borrower. Loan-to-collateral value ratios are determined based on independent third-party property appraisal/valuations, and security lien position is established through title/ownership reports. Historically, all
mortgages were originated to be sold or securitized. Eligible conforming loans are currently sold to the government-sponsored enterprises, while most non-conforming and HELOC loans will be held for investment in the Company�s portfolio. See Note 8 to the consolidated financial statements for
additional information about the Company�s financing receivables. 116 Table of Contents Operational Risk. Operational risk refers to the risk of financial or other loss, or potential
damage to a firm�s reputation, resulting from inadequate or failed internal processes, people, systems, or from external events ( e.g. , fraud, legal and compliance risks or damage to physical assets). The Company may incur operational
risk across the full scope of its business activities, including revenue generating activities ( e.g. , sales and trading) and control groups ( e.g. , information technology and trade processing). Legal and compliance risk is included in
the scope of operational risk and is discussed below under �Legal Risk.� The Company has established an operational risk management process to identify, measure, monitor and control risk across the Company. Effective operational risk management is essential to reducing the
impact of operational risk incidents and mitigating legal, regulatory and reputational risks. The framework is continually evolving to account for changes in the Company and in response to the changing regulatory and business environment landscape.
The Company has implemented operational risk data and assessment systems to monitor and analyze internal and external operational risk events, business environment and internal control factors and perform scenario analysis. The collected data
elements are incorporated in the operational risk capital model. The model encompasses both quantitative and qualitative elements. Internal loss data and scenario analysis results are direct inputs to the capital models while external operational
incidents, business environment internal control factors and metrics are indirect inputs to the model. Primary responsibility for the management of operational risk is with the business segments, the control groups and the business managers therein. The business managers generally maintain processes and
controls designed to identify, assess, manage, mitigate and report operational risk. Each business segment has a designated operational risk coordinator. The operational risk coordinator regularly reviews operational risk issues and reports to
senior management within each business. Each control group also has a designated operational risk coordinator and a forum for discussing operational risk matters with senior management. Oversight of operational risk is provided by regional risk
committees and senior management. In the event of a merger, joint venture, divestiture, reorganization, or creation of a new legal entity, a new product or a business activity, operational risks are considered, and any necessary changes in processes
or controls are implemented. The independent Operational Risk
Department (�ORD�) works with the business segments and control groups to help ensure a transparent, consistent and comprehensive program for managing operational risk within each area and across the Company globally. ORD is responsible
for facilitating, designing, implementing and monitoring the company-wide operational risk program. Business Continuity Management is responsible for identifying key risks and threats to the Company�s resiliency and planning to ensure a recovery strategy and required resources are in place for the
resumption of critical business functions following a disaster or other business interruption. Disaster recovery plans are in place for critical facilities and resources on a company-wide basis, and redundancies are built into the systems as deemed
appropriate. The key components of the Company�s disaster recovery plans include: crisis management; business recovery plans; applications/data recovery; work area recovery; and other elements addressing management, analysis, training and
testing. The Company maintains an information security program
that coordinates the management of information security risks and satisfies regulatory requirements. Information security policies are designed to protect the Company�s information assets against unauthorized disclosure, modification or misuse.
These policies cover a broad range of areas, including: application entitlements, data protection, incident response, Internet and electronic communications, remote access and portable devices. The Company has also established policies, procedures
and technologies to protect its computers and other assets from unauthorized access. The Company utilizes the services of external vendors in connection with the Company�s ongoing operations. These may include, for example, outsourced processing and support functions and consulting
and other professional services. The Company manages its exposures to the quality of these services through a variety of 117 Table of Contents means, including service level and other contractual agreements, service and quality reviews, and ongoing monitoring of the vendors� performance. It is anticipated that the use of these
services will continue and possibly increase in the future. The Supplier Risk Management program is responsible for the policies, procedures, organizations, governance and supporting technology to ensure adequate risk management controls between the
Company and its third-party suppliers as it relates to information security disaster recoverability, and other key areas. The program ensures Company compliance with regulatory requirements. Legal and Regulatory Risk. Legal risk includes the risk of exposure to fines, penalties, judgments, damages and/or settlements in connection with regulatory or legal actions as a
result of non-compliance with applicable legal and regulatory requirements and standards. Legal risk also includes contractual and commercial risk such as the risk that a counterparty�s performance obligations will be unenforceable. The Company
is generally subject to extensive regulation in the different jurisdictions in which it conducts its business (see also �Business�Supervision and Regulation� in Part I, Item�1 and �Risk Factors� in Part I,
Item�1A). The Company has established procedures based on legal and regulatory requirements on a worldwide basis that are designed to foster compliance with applicable statutory and regulatory requirements. The Company, principally through the
Legal and Compliance Division, also has established procedures that are designed to require that the Company�s policies relating to conduct, ethics and business practices are followed globally. In connection with its businesses, the Company has
and continuously develops various procedures addressing issues such as regulatory capital requirements, sales and trading practices, new products, potential conflicts of interest, structured transactions, use and safekeeping of customer funds and
securities, credit granting, money laundering, privacy and recordkeeping. In addition, the Company has established procedures to mitigate the risk that a counterparty�s performance obligations will be unenforceable, including consideration of
counterparty legal authority and capacity, adequacy of legal documentation, the permissibility of a transaction under applicable law and whether applicable bankruptcy or insolvency laws limit or alter contractual remedies. The legal and regulatory
focus on the financial services industry presents a continuing business challenge for the Company. 118 Table of Contents| Item�8. | Financial Statements and Supplementary Data. |
| /s/ Deloitte & Touche LLP |
| New York, New York |
| February�28, 2011 |
| December�31, 2010 | December�31, 2009 | |||||||
| Assets | ||||||||
| Cash and due from banks ($297 at December�31, 2010 related to consolidated variable interest entities generally not available to the Company) | $ | 7,341 | $ | 6,988 | ||||
| Interest bearing deposits with banks | 40,274 | 25,003 | ||||||
| Cash deposited with clearing organizations or segregated under federal and other regulations or requirements | 19,180 | 23,712 | ||||||
| Financial instruments owned, at fair value (approximately $130 billion and $101 billion were pledged to various parties at December�31, 2010 and December�31, 2009, respectively): | ||||||||
| U.S. government and agency securities | 48,446 | 62,215 | ||||||
| Other sovereign government obligations | 33,908 | 25,445 | ||||||
| Corporate and other debt ($3,816 at December�31, 2010 related to consolidated variable interest entities, generally not available to the Company) | 88,154 | 90,454 | ||||||
| Corporate equities ($625 at December�31, 2010 related to consolidated variable interest entities, generally not available to the Company) | 68,416 | 57,968 | ||||||
| Derivative and other contracts | 51,292 | 49,081 | ||||||
| Investments ($1,873 at December�31, 2010 related to consolidated variable interest entities, generally not available to the Company) | 9,752 | 9,286 | ||||||
| Physical commodities | 6,778 | 5,329 | ||||||
| Total financial instruments owned, at fair value | 306,746 | 299,778 | ||||||
| Securities available for sale, at fair value | 29,649 | � | ||||||
| Securities received as collateral, at fair value | 16,537 | 13,656 | ||||||
| Federal funds sold and securities purchased under agreements to resell | 148,253 | 143,208 | ||||||
| Securities borrowed | 138,730 | 167,501 | ||||||
| Receivables: | ||||||||
| Customers | 35,258 | 27,594 | ||||||
| Brokers, dealers and clearing organizations | 9,102 | 5,719 | ||||||
| Fees, interest and other | 9,790 | 11,164 | ||||||
| Loans (net of allowances of $82 at December�31, 2010 and $158 at December�31,�2009) | 10,576 | 7,259 | ||||||
| Other investments | 5,412 | 3,752 | ||||||
| Premises, equipment and software costs (net of accumulated depreciation of $4,476 and $3,734 at December�31, 2010 and December�31, 2009, respectively) ($321 at December�31, 2010 related to consolidated variable entities, generally not available to the Company) | 6,154 | 7,067 | ||||||
| Goodwill | 6,739 | 7,162 | ||||||
| Intangible assets (net of accumulated amortization of $605 and $275 at December�31, 2010 and December�31, 2009, respectively) (includes $157 and $137 at fair value at December�31, 2010 and December�31, 2009, respectively) | 4,667 | 5,054 | ||||||
| Other assets | 13,290 | 16,845 | ||||||
| Total assets | $ | 807,698 | $ | 771,462 | ||||
| | 120 |
| December�31, 2010 | December�31, 2009 | |||||||
| Liabilities and Equity | ||||||||
| Deposits (includes $3,027 and $4,967 at fair value at December�31, 2010 and December�31, 2009, respectively) | $ | 63,812 | $ | 62,215 | ||||
| Commercial paper and other short-term borrowings (includes $1,799 and $791 at fair value at December�31, 2010 and December�31, 2009, respectively) | 3,256 | 2,378 | ||||||
| Financial instruments sold, not yet purchased, at fair value: | ||||||||
| U.S. government and agency securities | 27,948 | 20,503 | ||||||
| Other sovereign government obligations | 22,250 | 18,244 | ||||||
| Corporate and other debt | 10,918 | 7,826 | ||||||
| Corporate equities | 19,838 | 22,601 | ||||||
| Derivative and other contracts | 47,802 | 38,209 | ||||||
| Total financial instruments sold, not yet purchased, at fair value | 128,756 | 107,383 | ||||||
| Obligation to return securities received as collateral, at fair value | 21,163 | 13,656 | ||||||
| Securities sold under agreements to repurchase (includes $849 at fair value at December�31, 2010) | 147,598 | 159,401 | ||||||
| Securities loaned | 29,094 | 26,246 | ||||||
| Other secured financings (includes $8,490 and $8,102 at fair value at December�31, 2010 and December�31, 2009, respectively) ($2,656 at December�31, 2010 related to consolidated variable interest entities and are non-recourse to the Company) | 10,453 | 8,102 | ||||||
| Payables: | ||||||||
| Customers | 123,249 | 117,058 | ||||||
| Brokers, dealers and clearing organizations | 3,363 | 5,423 | ||||||
| Interest and dividends | 2,572 | 2,597 | ||||||
| Other liabilities and accrued expenses | 16,518 | 20,849 | ||||||
| Long-term borrowings (includes $42,709 and $37,610 at fair value at December�31, 2010 and December�31, 2009, respectively) | 192,457 | 193,374 | ||||||
| 742,291 | 718,682 | |||||||
| Commitments and contingent liabilities (see Note 13) | ||||||||
| Equity | ||||||||
| Morgan Stanley shareholders� equity: | ||||||||
| Preferred stock | 9,597 | 9,597 | ||||||
| Common stock, $0.01 par value; | ||||||||
| Shares authorized: 3,500,000,000 at December�31, 2010 and December�31, 2009; Shares issued: 1,603,913,074 at December�31, 2010 and 1,487,850,163 at December�31, 2009; Shares outstanding: 1,512,022,095 at December�31, 2010 and 1,360,595,214 at December�31, 2009 | 16 | 15 | ||||||
| Paid-in capital | 13,521 | 8,619 | ||||||
| Retained earnings | 38,603 | 35,056 | ||||||
| Employee stock trust | 3,465 | 4,064 | ||||||
| Accumulated other comprehensive loss | (467 | ) | (560 | ) | ||||
| Common stock held in treasury, at cost, $0.01 par value; 91,890,979 shares at December�31, 2010 and 127,254,949 shares at December�31, 2009 | (4,059 | ) | (6,039 | ) | ||||
| Common stock issued to employee trust | (3,465 | ) | (4,064 | ) | ||||
| Total Morgan Stanley shareholders� equity | 57,211 | 46,688 | ||||||
| Noncontrolling interests | 8,196 | 6,092 | ||||||
| Total equity | 65,407 | 52,780 | ||||||
| Total liabilities and equity | $ | 807,698 | $ | 771,462 | ||||
| 121 | |
| 2010 | 2009 | Fiscal 2008 | One Month Ended December 31, 2008 | |||||||||||||
| Revenues: | ||||||||||||||||
| Investment banking | $ | 5,122 | $ | 5,020 | $ | 4,057 | $ | 196 | ||||||||
| Principal transactions: | ||||||||||||||||
| Trading | 9,406 | 7,722 | 6,170 | (1,491 | ) | |||||||||||
| Investments | 1,825 | (1,034 | ) | (3,888 | ) | (205 | ) | |||||||||
| Commissions | 4,947 | 4,233 | 4,443 | 213 | ||||||||||||
| Asset management, distribution and administration fees | 7,957 | 5,884 | 4,839 | 292 | ||||||||||||
| Other | 1,501 | 837 | 3,851 | 109 | ||||||||||||
| Total non-interest revenues | 30,758 | 22,662 | 19,472 | (886 | ) | |||||||||||
| Interest income | 7,278 | 7,477 | 38,931 | 1,089 | ||||||||||||
| Interest expense | 6,414 | 6,705 | 36,263 | 1,140 | ||||||||||||
| Net interest | 864 | 772 | 2,668 | (51 | ) | |||||||||||
| Net revenues | 31,622 | 23,434 | 22,140 | (937 | ) | |||||||||||
| Non-interest expenses: | ||||||||||||||||
| Compensation and benefits | 16,048 | 14,434 | 11,851 | 582 | ||||||||||||
| Occupancy and equipment | 1,570 | 1,542 | 1,324 | 123 | ||||||||||||
| Brokerage, clearing and exchange fees | 1,431 | 1,190 | 1,483 | 91 | ||||||||||||
| Information processing and communications | 1,665 | 1,372 | 1,194 | 95 | ||||||||||||
| Marketing and business development | 582 | 501 | 714 | 34 | ||||||||||||
| Professional services | 1,911 | 1,597 | 1,708 | 109 | ||||||||||||
| Other | 2,213 | 1,815 | 2,612 | 23 | ||||||||||||
| Total non-interest expenses | 25,420 | 22,451 | 20,886 | 1,057 | ||||||||||||
| Income (loss) from continuing operations before income taxes | 6,202 | 983 | 1,254 | (1,994 | ) | |||||||||||
| Provision for (benefit from) income taxes | 739 | (341 | ) | 16 | (725 | ) | ||||||||||
| Income (loss) from continuing operations | 5,463 | 1,324 | 1,238 | (1,269 | ) | |||||||||||
| Discontinued operations: | ||||||||||||||||
| Gain (loss) from discontinued operations | 606 | 33 | 1,004 | (14 | ) | |||||||||||
| Provision for (benefit from) income taxes | 367 | (49 | ) | 464 | 2 | |||||||||||
| Net gain (loss) from discontinued operations | 239 | 82 | 540 | (16 | ) | |||||||||||
| Net income (loss) | 5,702 | 1,406 | 1,778 | (1,285 | ) | |||||||||||
| Net income applicable to noncontrolling interests | 999 | 60 | 71 | 3 | ||||||||||||
| Net income (loss) applicable to Morgan Stanley | $ | 4,703 | $ | 1,346 | $ | 1,707 | $ | (1,288 | ) | |||||||
| Earnings (loss) applicable to Morgan Stanley common shareholders | $ | 3,594 | $ | (907 | ) | $ | 1,495 | $ | (1,624 | ) | ||||||
| Amounts applicable to Morgan Stanley: | ||||||||||||||||
| Income (loss) from continuing operations | $ | 4,464 | $ | 1,280 | $ | 1,205 | $ | (1,269 | ) | |||||||
| Net gain (loss) from discontinued operations | 239 | 66 | 502 | (19 | ) | |||||||||||
| Net income (loss) applicable to Morgan Stanley | $ | 4,703 | $ | 1,346 | $ | 1,707 | $ | (1,288 | ) | |||||||
| Earnings (loss) per basic common share: | ||||||||||||||||
| Income (loss) from continuing operations | $ | 2.48 | $ | (0.82 | ) | $ | 1.00 | $ | (1.60 | ) | ||||||
| Net gain (loss) from discontinued operations | 0.16 | 0.05 | 0.45 | (0.02 | ) | |||||||||||
| Earnings (loss) per basic common share | $ | 2.64 | $ | (0.77 | ) | $ | 1.45 | $ | (1.62 | ) | ||||||
| Earnings (loss) per diluted common share: | ||||||||||||||||
| Income (loss) from continuing operations | $ | 2.44 | $ | (0.82 | ) | $ | 0.95 | $ | (1.60 | ) | ||||||
| Net gain (loss) from discontinued operations | 0.19 | 0.05 | 0.44 | (0.02 | ) | |||||||||||
| Earnings (loss) per diluted common share | $ | 2.63 | $ | (0.77 | ) | $ | 1.39 | $ | (1.62 | ) | ||||||
| Average common shares outstanding: | ||||||||||||||||
| Basic | 1,361,670,938 | 1,185,414,871 | 1,028,180,275 | 1,002,058,928 | ||||||||||||
| Diluted | 1,411,268,971 | 1,185,414,871 | 1,073,496,349 | 1,002,058,928 | ||||||||||||
| | 122 |
| 2010 | 2009 | Fiscal 2008 | One�Month Ended December�31, 2008 | |||||||||||||
| Net income (loss) | $ | 5,702 | $ | 1,406 | $ | 1,778 | $ | (1,285 | ) | |||||||
| Other comprehensive income (loss), net of tax: | ||||||||||||||||
| Foreign currency translation adjustments(1) | 221 | 112 | (270 | ) | (96 | ) | ||||||||||
| Amortization of cash flow hedges(2) | 9 | 13 | 16 | 2 | ||||||||||||
| Net unrealized gain on securities available for sale(3) | 36 | � | � | � | ||||||||||||
| Pension, postretirement and other related adjustments(4) | (20 | ) | (273 | ) | 216 | (201 | ) | |||||||||
| Comprehensive income (loss) | $ | 5,948 | $ | 1,258 | $ | 1,740 | $ | (1,580 | ) | |||||||
| Net income applicable to noncontrolling interests | 999 | 60 | 71 | 3 | ||||||||||||
| Other comprehensive income (loss) applicable to noncontrolling interests | 153 | (8 | ) | (110 | ) | � | ||||||||||
| Comprehensive income (loss) applicable to Morgan Stanley | $ | 4,796 | $ | 1,206 | $ | 1,779 | $ | (1,583 | ) | |||||||
| (1) | Amounts are net of provision for (benefit from) income taxes of $(222) million, $(335) million, $388 million and $(52)�million for 2010, 2009, fiscal 2008 and the one month ended December�31, 2008, respectively. |
| (2) | Amounts are net of provision for income taxes of $6 million, $8 million, $11 million and $1 million for 2010, 2009, fiscal 2008 and the one month ended December�31, 2008, respectively. |
| (3) | Amounts are net of provision for income taxes of $25 million for 2010. |
| (4) | Amounts are net of provision for (benefit from) income taxes of $(10) million, $(161) million, $147 million and $(132) million for 2010, 2009, fiscal 2008 and the one month ended December�31, 2008, respectively. |
| 123 | |
| 2010 | 2009 | Fiscal 2008 | One Month Ended December�31, 2008 | |||||||||||||
| CASH FLOWS FROM OPERATING ACTIVITIES | ||||||||||||||||
| Net income (loss) | $ | 5,702 | $ | 1,406 | $ | 1,778 | $ | (1,285 | ) | |||||||
| Adjustments to reconcile net income (loss) to net cash provided by (used for) operating activities: | ||||||||||||||||
| Deferred income taxes | (129 | ) | (932 | ) | (1,224 | ) | (781 | ) | ||||||||
| Compensation payable in common stock and options | 1,260 | 1,265 | 1,838 | 77 | ||||||||||||
| Depreciation and amortization | 1,419 | 1,224 | 794 | 104 | ||||||||||||
| Gain on business dispositions | (570 | ) | (606 | ) | (2,232 | ) | � | |||||||||
| Gain on sale of stake in China International Capital Corporation Limited | (668 | ) | � | � | � | |||||||||||
| Gains on curtailments of postretirement plans | (54 | ) | � | � | � | |||||||||||
| Gains on sale of securities available for sale | (102 | ) | � | � | � | |||||||||||
| Gain on repurchase of long-term debt | � | (491 | ) | (2,252 | ) | (73 | ) | |||||||||
| Insurance reimbursement | (76 | ) | � | � | � | |||||||||||
| Loss on assets held for sale | 1,190 | � | � | � | ||||||||||||
| Impairment charges and other-than-temporary impairment charges | 201 | 823 | 1,238 | � | ||||||||||||
| Changes in assets and liabilities: | ||||||||||||||||
| Cash deposited with clearing organizations or segregated under federal and other regulations or requirements | 4,532 | 211 | 5,001 | 1,407 | ||||||||||||
| Financial instruments owned, net of financial instruments sold, not yet purchased | 19,169 | (26,130 | ) | 78,486 | 2,412 | |||||||||||
| Securities borrowed | 28,771 | (79,449 | ) | 154,209 | (2,267 | ) | ||||||||||
| Securities loaned | 2,848 | 11,666 | (95,602 | ) | (241 | ) | ||||||||||
| Receivables, loans and other assets | (9,568 | ) | (2,445 | ) | 54,531 | 1,479 | ||||||||||
| Payables and other liabilities | 761 | 818 | (114,531 | ) | 11,481 | |||||||||||
| Federal funds sold and securities purchased under agreements to resell | (5,045 | ) | (20,499 | ) | 51,822 | (16,290 | ) | |||||||||
| Securities sold under agreements to repurchase | (9,334 | ) | 67,188 | (60,439 | ) | (10,188 | ) | |||||||||
| Net cash provided by (used for) operating activities | 40,307 | (45,951 | ) | 73,417 | (14,165 | ) | ||||||||||
| CASH FLOWS FROM INVESTING ACTIVITIES | ||||||||||||||||
| Net proceeds from (payments for): | ||||||||||||||||
| Premises, equipment and software costs | (1,201 | ) | (2,877 | ) | (1,400 | ) | (107 | ) | ||||||||
| Business acquisitions, net of cash acquired | (1,042 | ) | (2,160 | ) | (174 | ) | � | |||||||||
| Business dispositions, net of cash disposed | 840 | 565 | 743 | � | ||||||||||||
| MUFG Transaction | 247 | � | � | � | ||||||||||||
| Sale of stake in China International Capital Corporation Limited | 989 | � | � | � | ||||||||||||
| Purchases of securities available for sale | (29,989 | ) | � | � | � | |||||||||||
| Sales and redemptions of securities available for sale | 999 | � | � | � | ||||||||||||
| Net cash used for investing activities | (29,157 | ) | (4,472 | ) | (831 | ) | (107 | ) | ||||||||
| CASH FLOWS FROM FINANCING ACTIVITIES | ||||||||||||||||
| Net proceeds from (payments for): | ||||||||||||||||
| Commercial paper and other short-term borrowings | 878 | (7,724 | ) | (24,012 | ) | (381 | ) | |||||||||
| Dividends related to noncontrolling interests | (332 | ) | � | � | � | |||||||||||
| Derivatives financing activities | (85 | ) | (85 | ) | 962 | (3,354 | ) | |||||||||
| Other secured financings | (751 | ) | (4,437 | ) | (15,246 | ) | 12 | |||||||||
| Deposits | 1,597 | 10,860 | 11,576 | 8,600 | ||||||||||||
| Net proceeds from: | ||||||||||||||||
| Excess tax benefits associated with stock-based awards | 5 | 102 | 47 | � | ||||||||||||
| Noncontrolling interests | � | � | 1,560 | � | ||||||||||||
| Issuance of preferred stock and common stock warrant | � | � | 18,997 | � | ||||||||||||
| Public offerings and other issuances of common stock | 5,581 | 6,255 | 397 | 4 | ||||||||||||
| Issuance of long-term borrowings | 32,523 | 43,960 | 42,331 | 13,590 | ||||||||||||
| Issuance of junior subordinated debentures related to China Investment Corporation | � | � | 5,579 | � | ||||||||||||
| Payments for: | ||||||||||||||||
| Long-term borrowings | (28,201 | ) | (33,175 | ) | (56,120 | ) | (5,694 | ) | ||||||||
| Series D Preferred Stock and Warrant | � | (10,950 | ) | � | � | |||||||||||
| Redemption of junior subordinated debentures related to China Investment Corporation | (5,579 | ) | � | � | � | |||||||||||
| Repurchases of common stock through capital management share repurchase program | � | � | (711 | ) | � | |||||||||||
| Repurchases of common stock for employee tax withholding | (317 | ) | (50 | ) | (1,117 | ) | (3 | ) | ||||||||
| Cash dividends | (1,156 | ) | (1,732 | ) | (1,227 | ) | � | |||||||||
| Net cash provided by (used for) financing activities | 4,163 | 3,024 | (16,984 | ) | 12,774 | |||||||||||
| Effect of exchange rate changes on cash and cash equivalents | 14 | 720 | (2,546 | ) | 1,514 | |||||||||||
| Effect of cash and cash equivalents related to variable interest entities | 297 | � | � | � | ||||||||||||
| Net increase (decrease) in cash and cash equivalents | 15,624 | (46,679 | ) | 53,056 | 16 | |||||||||||
| Cash and cash equivalents, at beginning of period | 31,991 | 78,670 | 25,598 | 78,654 | ||||||||||||
| Cash and cash equivalents, at end of period | $ | 47,615 | $ | 31,991 | $ | 78,654 | $ | 78,670 | ||||||||
| Cash and cash equivalents include: | ||||||||||||||||
| Cash and due from banks | $ | 7,341 | $ | 6,988 | $ | 11,276 | $ | 13,354 | ||||||||
| Interest bearing deposits with banks | 40,274 | 25,003 | 67,378 | 65,316 | ||||||||||||
| Cash and cash equivalents, at end of period | $ | 47,615 | $ | 31,991 | $ | 78,654 | $ | 78,670 | ||||||||
| | 124 |
| Preferred Stock | Common Stock | Paid-in Capital | Retained Earnings | Employee Stock Trust | Accumulated Other Comprehensive Income (Loss) | Common Stock Held in Treasury at Cost | Common Stock Issued to Employee Trust | Non- controlling Interests | Total Equity | |||||||||||||||||||||||||||||||
| BALANCE�AT�NOVEMBER�30, 2007 | $ | 1,100 | $ | 12 | $ | 1,902 | $ | 38,045 | $ | 5,569 | $ | (199 | ) | $ | (9,591 | ) | $ | (5,569 | ) | $ | 1,628 | $ | 32,897 | |||||||||||||||||
| Net income | � | � | � | 1,707 | � | � | � | � | 71 | 1,778 | ||||||||||||||||||||||||||||||
| Dividends | � | � | � | (1,227 | ) | � | � | � | � | (71 | ) | (1,298 | ) | |||||||||||||||||||||||||||
| Shares issued under employee plans and related tax effects | � | � | (1,142 | ) | � | (1,668 | ) | � | 3,493 | 1,668 | � | 2,351 | ||||||||||||||||||||||||||||
| Repurchases of common stock | � | � | � | � | � | � | (1,828 | ) | � | � | (1,828 | ) | ||||||||||||||||||||||||||||
| Issuance of preferred stock and common stock warrant | 18,055 | � | 957 | (15 | ) | � | � | � | � | � | 18,997 | |||||||||||||||||||||||||||||
| Net change in cash flow hedges | � | � | � | � | � | 16 | � | � | � | 16 | ||||||||||||||||||||||||||||||
| Pension adjustment | � | � | � | (15 | ) | � | 2 | � | � | � | (13 | ) | ||||||||||||||||||||||||||||
| Pension and postretirement adjustments | � | � | � | � | � | 216 | � | � | � | 216 | ||||||||||||||||||||||||||||||
| Tax adjustment | � | � | � | (92 | ) | � | � | � | � | � | (92 | ) | ||||||||||||||||||||||||||||
| Foreign currency translation adjustments | � | � | � | � | � | (160 | ) | � | � | (110 | ) | (270 | ) | |||||||||||||||||||||||||||
| Equity Units | � | � | (405 | ) | � | � | � | � | � | � | (405 | ) | ||||||||||||||||||||||||||||
| Reclassification of negative additional paid-in capital to retained earnings | � | � | 307 | (307 | ) | � | � | � | � | � | � | |||||||||||||||||||||||||||||
| Other decreases in noncontrolling interests | � | � | � | � | � | � | � | � | (813 | ) | (813 | ) | ||||||||||||||||||||||||||||
| BALANCE AT NOVEMBER�30, 2008 | 19,155 | 12 | 1,619 | 38,096 | 3,901 | (125 | ) | (7,926 | ) | (3,901 | ) | 705 | 51,536 | |||||||||||||||||||||||||||
| Net income (loss) | � | � | � | (1,288 | ) | � | � | � | � | 3 | (1,285 | ) | ||||||||||||||||||||||||||||
| Dividends | � | � | � | (641 | ) | � | � | � | � | (5 | ) | (646 | ) | |||||||||||||||||||||||||||
| Shares issued under employee plans and related tax effects | � | � | (1,160 | ) | � | 411 | � | 1,309 | (411 | ) | � | 149 | ||||||||||||||||||||||||||||
| Repurchases of common stock | � | � | � | � | � | � | (3 | ) | � | � | (3 | ) | ||||||||||||||||||||||||||||
| Preferred stock accretion | 13 | � | � | (13 | ) | � | � | � | � | � | � | |||||||||||||||||||||||||||||
| Net change in cash flow hedges | � | � | � | � | � | 2 | � | � | � | 2 | ||||||||||||||||||||||||||||||
| Pension and postretirement adjustments | � | � | � | � | � | (201 | ) | � | � | � | (201 | ) | ||||||||||||||||||||||||||||
| Foreign currency translation adjustments | � | � | � | � | � | (96 | ) | � | � | � | (96 | ) | ||||||||||||||||||||||||||||
| BALANCE AT DECEMBER 31, 2008 | 19,168 | 12 | 459 | 36,154 | 4,312 | (420 | ) | (6,620 | ) | (4,312 | ) | 703 | 49,456 | |||||||||||||||||||||||||||
| Net income | � | � | � | 1,346 | � | � | � | � | 60 | 1,406 | ||||||||||||||||||||||||||||||
| Dividends | � | � | � | (1,310 | ) | � | � | � | � | (23 | ) | (1,333 | ) | |||||||||||||||||||||||||||
| Shares issued under employee plans and related tax effects | � | � | 485 | � | (248 | ) | � | 631 | 248 | � | 1,116 | |||||||||||||||||||||||||||||
| Repurchases of common stock | � | � | � | � | � | � | (50 | ) | � | � | (50 | ) | ||||||||||||||||||||||||||||
| Morgan Stanley public offerings of common stock | � | 3 | 6,209 | � | � | � | � | � | � | 6,212 | ||||||||||||||||||||||||||||||
| Series C Preferred Stock extinguished and exchanged for common stock | (503 | ) | � | 705 | (202 | ) | � | � | � | � | � | � | ||||||||||||||||||||||||||||
| Series D Preferred Stock and Warrant | (9,068 | ) | � | (950 | ) | (932 | ) | � | � | � | � | � | (10,950 | ) | ||||||||||||||||||||||||||
| Gain on Morgan Stanley Smith Barney transaction | � | � | 1,711 | � | � | � | � | � | � | 1,711 | ||||||||||||||||||||||||||||||
| Net change in cash flow hedges | � | � | � | � | � | 13 | � | � | � | 13 | ||||||||||||||||||||||||||||||
| Pension and postretirement adjustments | � | � | � | � | � | (269 | ) | � | � | (4 | ) | (273 | ) | |||||||||||||||||||||||||||
| Foreign currency translation adjustments | � | � | � | � | � | 116 | � | � | (4 | ) | 112 | |||||||||||||||||||||||||||||
| Increase in noncontrolling interests related to Morgan Stanley Smith Barney transaction | � | � | � | � | � | � | � | � | 4,825 | 4,825 | ||||||||||||||||||||||||||||||
| Other increases in noncontrolling interests | � | � | � | � | � | � | � | � | 535 | 535 | ||||||||||||||||||||||||||||||
| BALANCE AT DECEMBER 31, 2009 | $ | 9,597 | $ | 15 | $ | 8,619 | $ | 35,056 | $ | 4,064 | $ | (560 | ) | $ | (6,039 | ) | $ | (4,064 | ) | $ | 6,092 | $ | 52,780 | |||||||||||||||||
| 125 | |
| Preferred Stock | Common Stock | Paid-in Capital | Retained Earnings | Employee Stock Trust | Accumulated Other Comprehensive Income (Loss) | Common Stock Held in Treasury at Cost | Common Stock Issued to Employee Trust | Non- controlling Interests | Total Equity | |||||||||||||||||||||||||||||||
| BALANCE�AT DECEMBER�31,�2009 | $ | 9,597 | $ | 15 | $ | 8,619 | $ | 35,056 | $ | 4,064 | $ | (560 | ) | $ | (6,039 | ) | $ | (4,064 | ) | $ | 6,092 | $ | 52,780 | |||||||||||||||||
| Net income | � | � | � | 4,703 | � | � | � | � | 999 | 5,702 | ||||||||||||||||||||||||||||||
| Dividends | � | � | � | (1,156 | ) | � | � | � | � | � | (1,156 | ) | ||||||||||||||||||||||||||||
| Shares issued under employee plans and related tax effects | � | � | (1,407 | ) | � | (599 | ) | � | 2,297 | 599 | � | 890 | ||||||||||||||||||||||||||||
| Repurchases of common stock | � | � | � | � | � | � | (317 | ) | � | � | (317 | ) | ||||||||||||||||||||||||||||
| Net change in cash flow hedges | � | � | � | � | � | 9 | � | � | � | 9 | ||||||||||||||||||||||||||||||
| Pension, postretirement and other related adjustments | � | � | � | � | � | (18 | ) | � | � | (2 | ) | (20 | ) | |||||||||||||||||||||||||||
| Foreign currency translation adjustments | � | � | � | � | � | 66 | � | � | 155 | 221 | ||||||||||||||||||||||||||||||
| Gain on MUFG Transaction | � | � | 731 | � | � | � | � | � | � | 731 | ||||||||||||||||||||||||||||||
| Change in net unrealized gains (losses) on securities available for sale | � | � | � | � | � | 36 | � | � | � | 36 | ||||||||||||||||||||||||||||||
| Redemption of China Investment Corporation equity units and issuance of common stock | � | 1 | 5,578 | � | � | � | � | � | � | 5,579 | ||||||||||||||||||||||||||||||
| Increase in noncontrolling interests related to MUFG Transaction | � | � | � | � | � | � | � | � | 1,130 | 1,130 | ||||||||||||||||||||||||||||||
| Decrease in noncontrolling interests related to dividends of noncontrolling interests | � | � | � | � | � | � | � | � | (332 | ) | (332 | ) | ||||||||||||||||||||||||||||
| Other increases in noncontrolling interests | � | � | � | � | � | � | � | � | 154 | 154 | ||||||||||||||||||||||||||||||
| BALANCE AT DECEMBER�31,�2010 | $ | 9,597 | $ | 16 | $ | 13,521 | $ | 38,603 | $ | 3,465 | $ | (467 | ) | $ | (4,059 | ) | $ | (3,465 | ) | $ | 8,196 | $ | 65,407 | |||||||||||||||||
| | 126 |
| 127 | |
| | 128 |
| 129 | |
| | 130 |
| � | Level 1�Valuations based on quoted prices in active markets for identical assets or liabilities that the Company has the ability to access. Valuation adjustments and block discounts are not applied to Level 1 |
| 131 | |
| instruments. Since valuations are based on quoted prices that are readily and regularly available in an active market, valuation of these products does not entail a significant degree of judgment. |
| � | Level 2�Valuations based on one or more quoted prices in markets that are not active or for which all significant inputs are observable, either directly or indirectly. |
| � | Level 3�Valuations based on inputs that are unobservable and significant to the overall fair value measurement. |
| | 132 |
| 133 | |
| | 134 |
| 135 | |
| | 136 |
| 137 | |
| | 138 |
| 139 | |
| | 140 |
| Total fair value of consideration transferred | $ | 6,087 | ||
| Total fair value of noncontrolling interest | 3,973 | |||
| Total fair value of Smith Barney(1) | 10,060 | |||
| Total fair value of net assets acquired | 4,852 | |||
| Acquisition-related goodwill(2) | $ | 5,208 | ||
| (1) | Total fair value of Smith Barney is inclusive of control premium. |
| (2) | Goodwill is recorded within the Global Wealth Management Group business segment. Approximately $964 million of goodwill is deductible for tax purposes. |
| 141 | |
| At May�31, 2009 | ||||
| (dollars�in�millions) | ||||
| Assets | ||||
| Cash and due from banks | $ | 920 | ||
| Financial instruments owned | 33 | |||
| Receivables | 1,667 | |||
| Intangible assets | 4,480 | |||
| Other assets | 881 | |||
| Total assets acquired | $ | 7,981 | ||
| Liabilities | ||||
| Financial instrument sold, not yet purchased | $ | 11 | ||
| Long-term borrowings | 2,320 | |||
| Other liabilities and accrued expenses | 798 | |||
| Total liabilities assumed | $ | 3,129 | ||
| Net assets acquired | $ | 4,852 | ||
| At�May�31,�2009 | Estimated�Useful�Life | |||||||
| (dollars�in�millions) | (in years) | |||||||
| Customer relationships | $ | 4,000 | 16 | |||||
| Research | 176 | 5 | ||||||
| Intangible lease asset | 24 | 1-10 | ||||||
| Total | $ | 4,200 | ||||||
| | 142 |
| Total fair value of consideration transferred | $ | 300 | ||
| Total fair value of noncontrolling interest | 289 | |||
| Total fair value of Citi Managed Futures | 589 | |||
| Total fair value of net assets acquired | 453 | |||
| Acquisition-related goodwill(1) | $ | 136 | ||
| (1) | Goodwill is recorded within the Global Wealth Management Group business segment. Approximately $4 million of goodwill is deductible for tax purposes. |
| At July�31, 2009 | ||||
| (dollars�in�millions) | ||||
| Assets | ||||
| Financial instruments owned | $ | 83 | ||
| Receivables | 86 | |||
| Intangible assets(1) | 275 | |||
| Other assets | 11 | |||
| Total assets acquired | $ | 455 | ||
| Liabilities | ||||
| Other liabilities and accrued expenses | $ | 2 | ||
| Total liabilities assumed | $ | 2 | ||
| Net assets acquired | $ | 453 | ||
| (1) | At July�31, 2009, amortizable intangible assets in the amount of $275 million primarily related to management contracts with an estimated useful life of five to nine years. |
| 143 | |
| 2009 | Fiscal 2008 | One Month Ended December�31, 2008 | ||||||||||
| (unaudited) | ||||||||||||
| Net revenues | $ | 26,240 | $ | 30,439 | $ | (275 | ) | |||||
| Total non-interest expenses | 24,901 | 28,407 | 1,592 | |||||||||
| Income (loss) from continuing operations before income taxes | 1,339 | 2,032 | (1,867 | ) | ||||||||
| Provision for (benefit from) income taxes | (272 | ) | 167 | (700 | ) | |||||||
| Income (loss) from continuing operations | 1,611 | 1,865 | (1,167 | ) | ||||||||
| Discontinued operations: | ||||||||||||
| Gain (loss) from discontinued operations | 33 | 1,004 | (14 | ) | ||||||||
| Provision for (benefit from) income taxes | (49 | ) | 464 | 2 | ||||||||
| Net gain (loss) from discontinued operations | 82 | 540 | (16 | ) | ||||||||
| Net income (loss) | 1,693 | 2,405 | (1,183 | ) | ||||||||
| Net income applicable to noncontrolling interests | 234 | 452 | 65 | |||||||||
| Net income (loss) applicable to Morgan Stanley | $ | 1,459 | $ | 1,953 | $ | (1,248 | ) | |||||
| Earnings (loss) applicable to Morgan Stanley common shareholders | $ | (794 | ) | $ | 1,727 | $ | (1,584 | ) | ||||
| Earnings (loss) per basic common share: | ||||||||||||
| Income (loss) from continuing operations | $ | (0.73 | ) | $ | 1.23 | $ | (1.56 | ) | ||||
| Net gain (loss) from discontinued operations | 0.06 | 0.45 | (0.02 | ) | ||||||||
| Earnings (loss) per basic common share | $ | (0.67 | ) | $ | 1.68 | $ | (1.58 | ) | ||||
| Earnings (loss) per diluted common share: | ||||||||||||
| Income (loss) from continuing operations | $ | (0.73 | ) | $ | 1.17 | $ | (1.56 | ) | ||||
| Net gain (loss) from discontinued operations | 0.06 | 0.44 | (0.02 | ) | ||||||||
| Earnings (loss) per diluted common share | $ | (0.67 | ) | $ | 1.61 | $ | (1.58 | ) | ||||
| | 144 |
| � | U.S. Treasury Securities .����U.S. treasury securities are valued using quoted market prices. Valuation adjustments are not applied. Accordingly, U.S. treasury securities are generally categorized in Level�1 of the fair value hierarchy. |
| � | U.S. Agency Securities .����U.S. agency securities are composed of three main categories consisting of agency-issued debt, agency mortgage pass-through pool securities and collateralized mortgage obligations. Non-callable agency-issued debt securities are generally valued using quoted market prices. Callable agency-issued debt securities are valued by benchmarking model-derived prices to quoted market prices and trade data for identical or comparable securities. The fair value of agency�mortgage pass-through pool securities is model-driven based on spreads of the comparable To-be-announced (�TBA�) security. Collateralized mortgage obligations are valued using indices, quoted market prices and trade data for identical or comparable securities. Actively traded non-callable agency-issued debt securities are generally categorized in Level 1 of the fair value hierarchy. Callable agency-issued debt securities, agency mortgage pass-through pool securities and collateralized mortgage obligations are generally categorized in Level 2 of the fair value hierarchy. |
| � | Foreign sovereign government obligations are valued using quoted prices in active markets when available. To the extent quoted prices are not available, fair value is determined based on a valuation model that has as inputs interest rate yield curves, cross-currency basis index spreads, and country credit spreads for structures similar to the bond in terms of issuer, maturity and seniority. These bonds are generally categorized in Level 1 or Level 2 of the fair value hierarchy. |
| � | State and Municipal Securities .����The fair value of state and municipal securities is determined using recently executed transactions, market price quotations and pricing models that factor in, where applicable, interest rates, bond or credit default swap spreads and volatility. These bonds are generally categorized in Level 2 of the fair value hierarchy. |
| � | Residential Mortgage-Backed Securities (�RMBS�), Commercial Mortgage-Backed Securities (�CMBS�) and other Asset-Backed Securities (�ABS�) .����RMBS, CMBS and other ABS may be valued based on price or spread data obtained from observed transactions or independent external parties such as vendors or brokers. When position-specific external price data are not observable, the fair value determination may require benchmarking to similar instruments and/or analyzing expected credit losses, default and recovery rates. In evaluating the fair value of each security, the Company considers security collateral-specific attributes, including payment priority, credit enhancement levels, type of collateral, delinquency rates and loss severity. In addition, for RMBS borrowers, Fair Isaac Corporation (�FICO�) scores and the level of documentation for the loan are also considered. Market standard models, such as Intex, Trepp or |
| 145 | |
| others, may be deployed to model the specific collateral composition and cash flow structure of each transaction. Key inputs to these models are market spreads, forecasted credit losses, default and prepayment rates for each asset category. Valuation levels of RMBS and CMBS indices are also used as an additional data point for benchmarking purposes or to price outright index positions. |
| � | Corporate Bonds .����The fair value of corporate bonds is determined using recently executed transactions, market price quotations (where observable), bond spreads or credit default swap spreads obtained from independent external parties such as vendors and brokers adjusted for any basis difference between cash and derivative instruments. The spread data used are for the same maturity as the bond. If the spread data do not reference the issuer, then data that reference a comparable issuer are used. When observable price quotations are not available, fair value is determined based on cash flow models with yield curves, bond or single name credit default swap spreads and recovery rates as significant inputs. Corporate bonds are generally categorized in Level 2 of the fair value hierarchy; in instances where prices, spreads or any of the other aforementioned key inputs are unobservable, they are categorized in Level 3 of the fair value hierarchy. |
| � | Collateralized Debt Obligations (�CDO�) .����The Company holds cash CDOs that typically reference a tranche of an underlying synthetic portfolio of single name credit default swaps. The collateral is usually ABS or other corporate bonds. Credit correlation, a primary input used to determine the fair value of a cash CDO, is usually unobservable and derived using a benchmarking technique. The other model inputs such as credit spreads, including collateral spreads, and interest rates are typically observable. CDOs are categorized in Level 2 of the fair value hierarchy when the credit correlation input is insignificant. In instances where the credit correlation input is deemed to be significant, these instruments are categorized in Level 3 of the fair value hierarchy. |
| � | Corporate Loans and Lending Commitments .����The fair value of corporate loans is determined using recently executed transactions, market price quotations (where observable), implied yields from comparable debt, and market observable credit default swap spread levels obtained from independent external parties such as vendors and brokers adjusted for any basis difference between cash and derivative instruments, along with proprietary valuation models and default recovery analysis where such transactions and quotations are unobservable. The fair value of�contingent corporate lending commitments is determined by using executed transactions on comparable loans and the anticipated market price based on pricing indications from syndicate banks and customers. The valuation of loans and lending commitments also takes into account fee income that is considered an attribute of the contract. Corporate loans and lending commitments are generally categorized in Level 2 of the fair value hierarchy; in instances where prices or significant spread inputs are unobservable, they are categorized in Level 3 of the fair value hierarchy. |
| � | Mortgage Loans .����Mortgage loans are valued using observable prices based on transactional data for identical or comparable instruments, when available. Where observable prices are not available, the Company estimates fair value based on benchmarking to prices and rates observed in the primary market for similar loan or borrower types or based on the present value of expected future cash flows using its best estimates of the key assumptions, including forecasted credit losses, prepayment rates, forward yield curves and discount rates commensurate with the risks involved or a methodology that utilizes the capital structure and credit spreads of recent comparable securitization transactions. Mortgage loans valued based on observable transactional data for identical or comparable instruments are categorized in Level 2 |
| | 146 |
| of the fair value hierarchy. Where observable prices are not available, due to the subjectivity involved in the comparability assessment related to mortgage loan vintage, geographical concentration, prepayment speed and projected loss assumptions, mortgage loans are classified in Level�3 of the fair value hierarchy. |
| � | Auction Rate Securities (�ARS�) .����The Company primarily holds investments in�Student Loan Auction Rate Securities (�SLARS�)�and Municipal Auction Rate Securities (�MARS�)�with interest rates that are reset through periodic auctions. SLARS are�ABS backed by pools of student loans. MARS are municipal bonds often wrapped by municipal bond insurance. ARS were historically traded and valued as floating rate notes, priced at par due to the auction mechanism. Beginning in fiscal 2008, uncertainties in the credit markets have resulted in auctions failing for certain types of ARS. Once the auctions failed, ARS could no longer be valued using observations of auction market prices. Accordingly, the fair value of ARS is�determined using independent external market data where available and an internally developed methodology to discount for the lack of liquidity and non-performance risk. |
| � | Exchange-Traded Equity Securities .����Exchange-traded equity securities are generally valued based on quoted prices from the exchange. To the extent these securities are actively traded, valuation adjustments are not applied, and they are categorized in Level 1 of the fair value hierarchy; otherwise, they are categorized in Level 2 or Level 3 of the fair value hierarchy. |
| � | Listed Derivative Contracts .����Listed derivatives that are actively traded are valued based on quoted prices from the exchange and are categorized in Level 1 of the fair value hierarchy. Listed derivatives that are not actively traded are valued using the same approaches as those applied to OTC derivatives; they are generally categorized in Level 2 of the fair value hierarchy. |
| � | OTC Derivative Contracts .����OTC derivative contracts include forward, swap and option contracts related to interest rates, foreign currencies, credit standing of reference entities, equity prices or commodity prices. |
| 147 | |
| � | Collateralized Interest Rate Derivative Contracts .����In the fourth quarter of 2010, the Company began using�the overnight indexed swap (�OIS�) curve�as an input to value substantially all�of its�collateralized interest rate derivative contracts. The Company believes using the OIS curve, which reflects the interest rate typically paid on cash collateral, more accurately reflects�the fair value of�collateralized interest rate derivative contracts.�The Company recognized a pre-tax�gain of�$176 million in net revenues upon application of the OIS curve within the Institutional Securities business segment. Previously, the Company discounted these collateralized interest rate�derivative contracts�based on London Interbank Offered Rates (�LIBOR�). |
| � | The Company�s investments include investments in private equity funds, real estate funds, hedge funds and direct equity investments. Direct equity investments are presented in the fair value hierarchy table as Principal investments and Other. Initially, the transaction price is generally considered by the Company as the exit price and is the Company�s best estimate of fair value. |
| | 148 |
| � | The Company trades various physical commodities, including crude oil and refined products, natural gas, base and precious metals and agricultural products. Fair value for physical commodities is determined using observable inputs, including broker quotations and published indices. Physical commodities are categorized in Level 2 of the fair value hierarchy. |
| � | Securities available for sale are composed of�U.S. government and agency securities, including U.S. Treasury securities, agency-issued debt, agency mortgage pass-through securities and collateralized mortgage obligations. Actively traded U.S. Treasury securities and non-callable agency-issued debt securities are generally categorized in Level 1 of the fair value hierarchy. Callable agency-issued debt securities, agency mortgage pass-through securities and collateralized mortgage obligations are generally categorized in Level 2 of the fair value hierarchy. For further information on securities available for sale, see Note 5. |
| � | Structured Notes .����The Company issues structured notes that have coupon or repayment terms linked to the performance of debt or equity securities, indices, currencies or commodities. Fair value of structured notes is determined using valuation models for the derivative and debt portions of the notes. These models incorporate observable inputs referencing identical or comparable securities, including prices that the notes are linked to, interest rate yield curves, option volatility and currency, commodity or equity rates. Independent, external and traded prices for the notes are also considered. The impact of the Company�s own credit spreads is also included based on the Company�s observed secondary bond market spreads. Most structured notes are categorized in Level 2 of the fair value hierarchy. |
| � | Time Deposits .����The fair value of certificates of deposit is determined using third-party quotations. These deposits are generally categorized in Level 2 of the fair value hierarchy. |
| 149 | |
| � | In 2010, the fair value option was elected for certain securities sold under agreements to repurchase. The fair value of a repurchase agreement is computed using a�standard cash flow discounting methodology. The inputs to the valuation include�contractual cash flows and collateral funding spreads,�which are estimated using�various benchmarks,�interest rate yield curves and�option volatilities. In instances where the unobservable inputs are deemed significant, repurchase agreements are categorized in Level 3 of the fair value hierarchy; otherwise, they are categorized in Level�2 of the fair value hierarchy. |
| | 150 |
| Quoted�Prices�in Active�Markets�for Identical Assets (Level 1) | Significant Observable Inputs (Level 2) | Significant Unobservable Inputs (Level�3) | Counterparty and Cash Collateral Netting | Balance�at December�31, 2010 | ||||||||||||||||
| (dollars in millions) | ||||||||||||||||||||
| Assets | ||||||||||||||||||||
| Financial instruments owned: | ||||||||||||||||||||
| U.S. government and agency securities: | ||||||||||||||||||||
| U.S. Treasury securities | $ | 19,226 | $ | � | $ | � | $ | � | $ | 19,226 | ||||||||||
| U.S. agency securities | 3,827 | 25,380 | 13 | � | 29,220 | |||||||||||||||
| Total U.S. government and agency securities | 23,053 | 25,380 | 13 | � | 48,446 | |||||||||||||||
| Other sovereign government obligations | 25,334 | 8,501 | 73 | � | 33,908 | |||||||||||||||
| Corporate and other debt: | ||||||||||||||||||||
| State and municipal securities | � | 3,229 | 110 | � | 3,339 | |||||||||||||||
| Residential mortgage-backed securities | � | 3,690 | 319 | � | 4,009 | |||||||||||||||
| Commercial mortgage-backed securities | � | 2,692 | 188 | � | 2,880 | |||||||||||||||
| Asset-backed securities | � | 2,322 | 13 | � | 2,335 | |||||||||||||||
| Corporate bonds | � | 39,569 | 1,368 | � | 40,937 | |||||||||||||||
| Collateralized debt obligations | � | 2,305 | 1,659 | � | 3,964 | |||||||||||||||
| Loans and lending commitments | � | 15,308 | 11,666 | � | 26,974 | |||||||||||||||
| Other debt | � | 3,523 | 193 | � | 3,716 | |||||||||||||||
| Total corporate and other debt | � | 72,638 | 15,516 | � | 88,154 | |||||||||||||||
| Corporate equities(1) | 65,009 | 2,923 | 484 | � | 68,416 | |||||||||||||||
| Derivative and other contracts: | ||||||||||||||||||||
| Interest rate contracts | 3,985 | 616,016 | 966 | � | 620,967 | |||||||||||||||
| Credit contracts | � | 95,818 | 14,316 | � | 110,134 | |||||||||||||||
| Foreign exchange contracts | 1 | 61,556 | 431 | � | 61,988 | |||||||||||||||
| Equity contracts | 2,176 | 36,612 | 1,058 | � | 39,846 | |||||||||||||||
| Commodity contracts | 5,464 | 57,528 | 1,160 | � | 64,152 | |||||||||||||||
| Other | � | 108 | 135 | � | 243 | |||||||||||||||
| Netting(2) | (8,551 | ) | (761,939 | ) | (7,168 | ) | (68,380 | ) | (846,038 | ) | ||||||||||
| Total derivative and other contracts | 3,075 | 105,699 | 10,898 | (68,380 | ) | 51,292 | ||||||||||||||
| Investments: | ||||||||||||||||||||
| Private equity funds | � | � | 1,986 | � | 1,986 | |||||||||||||||
| Real estate funds | � | 8 | 1,176 | � | 1,184 | |||||||||||||||
| Hedge funds | � | 736 | 901 | � | 1,637 | |||||||||||||||
| Principal investments | 286 | 486 | 3,131 | � | 3,903 | |||||||||||||||
| Other(3) | 403 | 79 | 560 | � | 1,042 | |||||||||||||||
| Total investments | 689 | 1,309 | 7,754 | � | 9,752 | |||||||||||||||
| Physical commodities | � | 6,778 | � | � | 6,778 | |||||||||||||||
| Total financial instruments owned | 117,160 | 223,228 | 34,738 | (68,380 | ) | 306,746 | ||||||||||||||
| Securities available for sale: | ||||||||||||||||||||
| U.S. government and agency securities | 20,792 | 8,857 | � | � | 29,649 | |||||||||||||||
| Securities received as collateral | 15,646 | 890 | 1 | � | 16,537 | |||||||||||||||
| Intangible assets(4) | � | � | 157 | � | 157 | |||||||||||||||
| Liabilities | ||||||||||||||||||||
| Deposits | $ | � | $ | 3,011 | $ | 16 | $ | � | $ | 3,027 | ||||||||||
| 151 | |
| Quoted�Prices�in Active�Markets�for Identical Assets (Level 1) | Significant Observable Inputs (Level 2) | Significant Unobservable Inputs (Level�3) | Counterparty and Cash Collateral Netting | Balance�at December�31, 2010 | ||||||||||||||||
| (dollars in millions) | ||||||||||||||||||||
| Commercial�paper and other short-term borrowings | � | 1,797 | 2 | � | 1,799 | |||||||||||||||
| Financial instruments sold, not yet purchased: | ||||||||||||||||||||
| U.S. government and agency securities: | ||||||||||||||||||||
| U.S. Treasury securities | 25,225 | � | � | � | 25,225 | |||||||||||||||
| U.S. agency securities | 2,656 | 67 | � | � | 2,723 | |||||||||||||||
| Total U.S. government and agency securities | 27,881 | 67 | � | � | 27,948 | |||||||||||||||
| Other sovereign government obligations | 19,708 | 2,542 | � | � | 22,250 | |||||||||||||||
| Corporate and other debt: | ||||||||||||||||||||
| State and municipal securities | � | 11 | � | � | 11 | |||||||||||||||
| Asset-backed securities | � | 12 | � | � | 12 | |||||||||||||||
| Corporate bonds | � | 9,100 | 44 | � | 9,144 | |||||||||||||||
| Collateralized debt obligations | � | 2 | � | � | 2 | |||||||||||||||
| Unfunded lending commitments | � | 464 | 263 | � | 727 | |||||||||||||||
| Other debt | � | 828 | 194 | � | 1,022 | |||||||||||||||
| Total corporate and other debt | � | 10,417 | 501 | � | 10,918 | |||||||||||||||
| Corporate equities(1) | 19,696 | 127 | 15 | � | 19,838 | |||||||||||||||
| Derivative and other contracts: | ||||||||||||||||||||
| Interest rate contracts | 3,883 | 591,378 | 542 | � | 595,803 | |||||||||||||||
| Credit contracts | � | 87,904 | 7,722 | � | 95,626 | |||||||||||||||
| Foreign exchange contracts | 2 | 64,301 | 385 | � | 64,688 | |||||||||||||||
| Equity contracts | 2,098 | 42,242 | 1,820 | � | 46,160 | |||||||||||||||
| Commodity contracts | 5,871 | 58,885 | 972 | � | 65,728 | |||||||||||||||
| Other | � | 520 | 1,048 | � | 1,568 | |||||||||||||||
| Netting(2) | (8,551 | ) | (761,939 | ) | (7,168 | ) | (44,113 | ) | (821,771 | ) | ||||||||||
| Total derivative and other contracts | 3,303 | 83,291 | 5,321 | (44,113 | ) | 47,802 | ||||||||||||||
| Total financial instruments sold, not yet purchased | 70,588 | 96,444 | 5,837 | (44,113 | ) | 128,756 | ||||||||||||||
| Obligation to return securities received as collateral | 20,272 | 890 | 1 | � | 21,163 | |||||||||||||||
| Securities sold under agreements to repurchase | � | 498 | 351 | � | 849 | |||||||||||||||
| Other secured financings | � | 7,474 | 1,016 | � | 8,490 | |||||||||||||||
| Long-term borrowings | � | 41,393 | 1,316 | � | 42,709 | |||||||||||||||
| (1) | The Company holds or sells short for trading purposes equity securities issued by entities in diverse industries and of varying size. |
| (2) | For positions with the same counterparty that cross over the levels of the fair value hierarchy, both counterparty netting and cash collateral netting are included in the column titled �Counterparty and Cash Collateral Netting.� For contracts with the same counterparty, counterparty netting among positions classified within the same level is included within that level. For further information on derivative instruments and hedging activities, see Note 12. |
| (3) | In June 2010, the Company voluntarily contributed $25 million to certain other investments in funds that it manages in connection with upcoming rule changes regarding net asset value disclosures for money market funds. Based on current liquidity and fund performance, the Company does not expect to provide additional voluntary support to non-consolidated funds that it manages. |
| (4) | Amount represents mortgage servicing rights (�MSR�) accounted for at fair value. See Note 7 for further information on MSRs. |
| | 152 |
| Quoted�Prices�in Active�Markets�for Identical Assets (Level 1) | Significant Observable Inputs (Level 2) | Significant Unobservable Inputs (Level�3) | Counterparty and Cash Collateral Netting | Balance�at December�31, 2009 | ||||||||||||||||
| (dollars in millions) | ||||||||||||||||||||
| Assets | ||||||||||||||||||||
| Financial instruments owned: | ||||||||||||||||||||
| U.S. government and agency securities: | ||||||||||||||||||||
| U.S. Treasury securities | $ | 15,394 | $ | � | $ | � | $ | � | $ | 15,394 | ||||||||||
| U.S. agency securities | 19,670 | 27,115 | 36 | � | 46,821 | |||||||||||||||
| Total U.S. government and agency securities | 35,064 | 27,115 | 36 | � | 62,215 | |||||||||||||||
| Other sovereign government obligations | 21,080 | 4,362 | 3 | � | 25,445 | |||||||||||||||
| Corporate and other debt: | ||||||||||||||||||||
| State and municipal securities | � | 3,234 | 713 | � | 3,947 | |||||||||||||||
| Residential mortgage-backed securities | � | 4,285 | 818 | � | 5,103 | |||||||||||||||
| Commercial mortgage-backed securities | � | 2,930 | 1,573 | � | 4,503 | |||||||||||||||
| Asset-backed securities | � | 4,797 | 591 | � | 5,388 | |||||||||||||||
| Corporate bonds | � | 37,363 | 1,038 | � | 38,401 | |||||||||||||||
| Collateralized debt obligations | � | 1,539 | 1,553 | � | 3,092 | |||||||||||||||
| Loans and lending commitments | � | 13,759 | 12,506 | � | 26,265 | |||||||||||||||
| Other debt | � | 2,093 | 1,662 | � | 3,755 | |||||||||||||||
| Total corporate and other debt | � | 70,000 | 20,454 | � | 90,454 | |||||||||||||||
| Corporate equities(1) | 49,732 | 7,700 | 536 | � | 57,968 | |||||||||||||||
| Derivative and other contracts: | ||||||||||||||||||||
| Interest rate contracts | 3,403 | 622,544 | 1,182 | � | 627,129 | |||||||||||||||
| Credit contracts | � | 124,143 | 21,921 | � | 146,064 | |||||||||||||||
| Foreign exchange contracts | 7 | 52,066 | 455 | � | 52,528 | |||||||||||||||
| Equity contracts | 2,126 | 38,608 | 631 | � | 41,365 | |||||||||||||||
| Commodity contracts | 6,291 | 56,984 | 1,341 | � | 64,616 | |||||||||||||||
| Other | � | 114 | 275 | � | 389 | |||||||||||||||
| Netting(2) | (9,517 | ) | (791,993 | ) | (11,256 | ) | (70,244 | ) | (883,010 | ) | ||||||||||
| Total derivative and other contracts | 2,310 | 102,466 | 14,549 | (70,244 | ) | 49,081 | ||||||||||||||
| Investments: | ||||||||||||||||||||
| Private equity funds | � | � | 1,296 | � | 1,296 | |||||||||||||||
| Real estate funds | � | 12 | 833 | � | 845 | |||||||||||||||
| Hedge funds | � | 713 | 1,708 | � | 2,421 | |||||||||||||||
| Principal investments | 438 | 5 | 3,195 | � | 3,638 | |||||||||||||||
| Other | 305 | 200 | 581 | � | 1,086 | |||||||||||||||
| Total investments | 743 | 930 | 7,613 | � | 9,286 | |||||||||||||||
| Physical commodities | � | 5,329 | � | � | 5,329 | |||||||||||||||
| Total financial instruments owned | 108,929 | 217,902 | 43,191 | (70,244 | ) | 299,778 | ||||||||||||||
| 153 | |
| Quoted�Prices�in Active�Markets�for Identical Assets (Level 1) | Significant Observable Inputs (Level 2) | Significant Unobservable Inputs (Level�3) | Counterparty and Cash Collateral Netting | Balance�at December�31, 2009 | ||||||||||||||||
| (dollars in millions) | ||||||||||||||||||||
| Securities received as collateral | 12,778 | 855 | 23 | � | 13,656 | |||||||||||||||
| Intangible assets(3) | � | � | 137 | � | 137 | |||||||||||||||
| Liabilities | ||||||||||||||||||||
| Deposits | $ | � | $ | 4,943 | $ | 24 | $ | � | $ | 4,967 | ||||||||||
| Commercial�paper and other short-term borrowings | � | 791 | � | � | 791 | |||||||||||||||
| Financial instruments sold, not yet purchased: | ||||||||||||||||||||
| U.S. government and agency securities: | ||||||||||||||||||||
| U.S. Treasury securities | 17,907 | 1 | � | � | 17,908 | |||||||||||||||
| U.S. agency securities | 2,573 | 22 | � | � | 2,595 | |||||||||||||||
| Total U.S. government and agency securities | 20,480 | 23 | � | � | 20,503 | |||||||||||||||
| Other sovereign government obligations | 16,747 | 1,497 | � | � | 18,244 | |||||||||||||||
| Corporate and other debt: | ||||||||||||||||||||
| State and municipal securities | � | 9 | � | � | 9 | |||||||||||||||
| Commercial mortgage-backed securities | � | 8 | � | � | 8 | |||||||||||||||
| Asset-backed securities | � | 63 | 4 | � | 67 | |||||||||||||||
| Corporate bonds | � | 5,812 | 29 | � | 5,841 | |||||||||||||||
| Collateralized debt obligations | � | � | 3 | � | 3 | |||||||||||||||
| Unfunded lending commitments | � | 732 | 252 | � | 984 | |||||||||||||||
| Other debt | � | 483 | 431 | � | 914 | |||||||||||||||
| Total corporate and other debt | � | 7,107 | 719 | � | 7,826 | |||||||||||||||
| Corporate equities(1) | 18,125 | 4,472 | 4 | � | 22,601 | |||||||||||||||
| Derivative and other contracts: | ||||||||||||||||||||
| Interest rate contracts | 3,255 | 595,416 | 795 | � | 599,466 | |||||||||||||||
| Credit contracts | � | 112,136 | 13,098 | � | 125,234 | |||||||||||||||
| Foreign exchange contracts | 7 | 51,266 | 201 | � | 51,474 | |||||||||||||||
| Equity contracts | 2,295 | 45,583 | 1,320 | � | 49,198 | |||||||||||||||
| Commodity contracts | 7,343 | 55,038 | 1,334 | � | 63,715 | |||||||||||||||
| Other | � | 411 | 711 | � | 1,122 | |||||||||||||||
| Netting(2) | (9,517 | ) | (791,993 | ) | (11,256 | ) | (39,234 | ) | (852,000 | ) | ||||||||||
| Total derivative and other contracts | 3,383 | 67,857 | 6,203 | (39,234 | ) | 38,209 | ||||||||||||||
| Total financial instruments sold, not yet purchased | 58,735 | 80,956 | 6,926 | (39,234 | ) | 107,383 | ||||||||||||||
| Obligation to return securities received as collateral | 12,778 | 855 | 23 | � | 13,656 | |||||||||||||||
| Other secured financings | � | 6,570 | 1,532 | � | 8,102 | |||||||||||||||
| Long-term borrowings | � | 30,745 | 6,865 | � | 37,610 | |||||||||||||||
| (1) | The Company holds or sells short for trading purposes, equity securities issued by entities in diverse industries and of varying size. |
| (2) | For positions with the same counterparty that cross over the levels of the fair value hierarchy, both counterparty netting and cash collateral netting are included in the column titled �Counterparty and Cash Collateral Netting.� For contracts with the same counterparty, counterparty netting among positions classified within the same level is included within that level. For further information on derivative instruments and hedging activities, see Note 12. |
| (3) | Amount represents MSRs accounted for at fair value. See Note 7 for further information on MSRs. |
| | 154 |
| Beginning Balance at December�31, 2009 | Total�Realized and�Unrealized Gains�(Losses)(1) | Purchases, Sales,�Other Settlements and Issuances,�net | Net�Transfers In and/or (Out) of Level 3 | Ending Balance�at December�31, 2010 | Unrealized Gains (Losses) for Level 3 Assets/ Liabilities Outstanding�at December�31, 2010(2) | |||||||||||||||||||
| (dollars in millions) | ||||||||||||||||||||||||
| Assets | ||||||||||||||||||||||||
| Financial instruments owned: | ||||||||||||||||||||||||
| U.S. agency securities | $ | 36 | $ | (1 | ) | $ | 13 | $ | (35 | ) | $ | 13 | $ | (1 | ) | |||||||||
| Other sovereign government obligations | 3 | 5 | 66 | (1 | ) | 73 | 5 | |||||||||||||||||
| Corporate and other debt: | ||||||||||||||||||||||||
| State and municipal securities | 713 | (11 | ) | (533 | ) | (59 | ) | 110 | (12 | ) | ||||||||||||||
| Residential mortgage-backed securities | 818 | 12 | (607 | ) | 96 | 319 | (2 | ) | ||||||||||||||||
| Commercial mortgage-backed securities | 1,573 | 35 | (1,054 | ) | (366 | ) | 188 | (61 | ) | |||||||||||||||
| Asset-backed securities | 591 | 10 | (436 | ) | (152 | ) | 13 | 7 | ||||||||||||||||
| Corporate bonds | 1,038 | (84 | ) | 403 | 11 | 1,368 | 41 | |||||||||||||||||
| Collateralized debt obligations | 1,553 | 368 | (259 | ) | (3 | ) | 1,659 | 189 | ||||||||||||||||
| Loans and lending commitments | 12,506 | 203 | (376 | ) | (667 | ) | 11,666 | 214 | ||||||||||||||||
| Other debt | 1,662 | 44 | (92 | ) | (1,421 | ) | 193 | 49 | ||||||||||||||||
| Total corporate and other debt | 20,454 | 577 | (2,954 | ) | (2,561 | ) | 15,516 | 425 | ||||||||||||||||
| Corporate equities | 536 | 118 | (189 | ) | 19 | 484 | 59 | |||||||||||||||||
| Net derivative and other contracts: | ||||||||||||||||||||||||
| Interest rate contracts | 387 | 238 | (178 | ) | (23 | ) | 424 | 260 | ||||||||||||||||
| Credit contracts | 8,824 | (1,179 | ) | 128 | (1,179 | ) | 6,594 | 58 | ||||||||||||||||
| Foreign exchange contracts | 254 | (77 | ) | 33 | (164 | ) | 46 | (109 | ) | |||||||||||||||
| 155 | |
| Beginning Balance at December�31, 2009 | Total�Realized and�Unrealized Gains�(Losses)(1) | Purchases, Sales,�Other Settlements and Issuances,�net | Net�Transfers In and/or (Out) of Level 3 | Ending Balance�at December�31, 2010 | Unrealized Gains (Losses) for Level 3 Assets/ Liabilities Outstanding�at December�31, 2010(2) | |||||||||||||||||||
| (dollars in millions) | ||||||||||||||||||||||||
| Equity contracts | (689 | ) | (131 | ) | (146 | ) | 204 | (762 | ) | (143 | ) | |||||||||||||
| Commodity contracts | 7 | 121 | 60 | � | 188 | 268 | ||||||||||||||||||
| Other | (437 | ) | (266 | ) | (220 | ) | 10 | (913 | ) | (284 | ) | |||||||||||||
| Total net derivative and other contracts(3) | 8,346 | (1,294 | ) | (323 | ) | (1,152 | ) | 5,577 | 50 | |||||||||||||||
| Investments: | ||||||||||||||||||||||||
| Private equity funds | 1,296 | 496 | 202 | (8 | ) | 1,986 | 462 | |||||||||||||||||
| Real estate funds | 833 | 251 | 89 | 3 | 1,176 | 399 | ||||||||||||||||||
| Hedge funds | 1,708 | (161 | ) | (327 | ) | (319 | ) | 901 | (160 | ) | ||||||||||||||
| Principal investments | 3,195 | 470 | 229 | (763 | ) | 3,131 | 412 | |||||||||||||||||
| Other | 581 | 109 | (129 | ) | (1 | ) | 560 | 49 | ||||||||||||||||
| Total�investments | 7,613 | 1,165 | 64 | (1,088 | ) | 7,754 | 1,162 | |||||||||||||||||
| Securities received as collateral | 23 | � | (22 | ) | � | 1 | � | |||||||||||||||||
| Intangible assets | 137 | 43 | (23 | ) | � | 157 | 23 | |||||||||||||||||
| Liabilities | ||||||||||||||||||||||||
| Deposits | $ | 24 | $ | � | $ | � | $ | (8 | ) | $ | 16 | $ | � | |||||||||||
| Commercial paper and other short-term borrowings | � | � | 2 | � | 2 | � | ||||||||||||||||||
| Financial instruments sold, not yet purchased: | ||||||||||||||||||||||||
| Corporate and other debt: | ||||||||||||||||||||||||
| Asset-backed securities | 4 | � | (4 | ) | � | � | � | |||||||||||||||||
| Corporate bonds | 29 | (15 | ) | 13 | (13 | ) | 44 | (9 | ) | |||||||||||||||
| Collateralized debt obligations | 3 | � | (3 | ) | � | � | � | |||||||||||||||||
| Unfunded lending commitments | 252 | (4 | ) | 7 | � | 263 | (2 | ) | ||||||||||||||||
| Other debt | 431 | 65 | (161 | ) | (11 | ) | 194 | 62 | ||||||||||||||||
| Total corporate and other debt | 719 | 46 | (148 | ) | (24 | ) | 501 | 51 | ||||||||||||||||
| Corporate equities | 4 | 17 | 54 | (26 | ) | 15 | 9 | |||||||||||||||||
| Obligation to return securities received as collateral | 23 | � | (22 | ) | � | 1 | � | |||||||||||||||||
| Securities sold under agreements to repurchase | � | (1 | ) | 350 | � | 351 | (1 | ) | ||||||||||||||||
| Other secured financings | 1,532 | (44 | ) | (612 | ) | 52 | 1,016 | (44 | ) | |||||||||||||||
| Long-term borrowings | 6,865 | 66 | (5,175 | ) | (308 | ) | 1,316 | (84 | ) | |||||||||||||||
| (1) | Total realized and unrealized gains (losses) are primarily included in Principal transactions�Trading in the consolidated statements of income except for $1,165 million related to Financial instruments owned�Investments, which is included in Principal transactions�Investments. |
| (2) | Amounts represent unrealized gains (losses) for 2010 related to assets and liabilities still outstanding at December�31, 2010. |
| (3) | Net derivative and other contracts represent Financial instruments owned�Derivative and other contracts, net of Financial instruments sold, not yet purchased�Derivative and other contracts. For further information on derivative instruments and hedging activities, see Note 12. |
| | 156 |
| 157 | |
| Beginning Balance at December�31, 2008 | Total�Realized and Unrealized Gains (Losses)(1) | Purchases, Sales,�Other Settlements and�Issuances, net | Net�Transfers In and/or (Out) of Level 3 | Ending Balance�at December�31, 2009 | Unrealized Gains (Losses) for Level 3 Assets/Liabilities Outstanding�at December�31, 2009(2) | |||||||||||||||||||
| (dollars in millions) | ||||||||||||||||||||||||
| Assets | ||||||||||||||||||||||||
| Financial instruments owned: | ||||||||||||||||||||||||
| U.S. agency securities | $ | 127 | $ | (2 | ) | $ | (56 | ) | $ | (33 | ) | $ | 36 | $ | � | |||||||||
| Other sovereign government obligations | 1 | (3 | ) | 1 | 4 | 3 | � | |||||||||||||||||
| Corporate and other debt: | ||||||||||||||||||||||||
| State and municipal securities | 2,065 | 2 | (413 | ) | (941 | ) | 713 | (26 | ) | |||||||||||||||
| Residential mortgage-backed securities | 1,197 | (79 | ) | (125 | ) | (175 | ) | 818 | (52 | ) | ||||||||||||||
| Commercial mortgage-backed securities | 3,017 | (654 | ) | (314 | ) | (476 | ) | 1,573 | (662 | ) | ||||||||||||||
| Asset-backed securities | 1,013 | 91 | (468 | ) | (45 | ) | 591 | (12 | ) | |||||||||||||||
| Corporate bonds | 2,753 | (184 | ) | (917 | ) | (614 | ) | 1,038 | 33 | |||||||||||||||
| Collateralized debt obligations | 946 | 630 | 30 | (53 | ) | 1,553 | 418 | |||||||||||||||||
| Loans and lending commitments | 20,180 | (1,225 | ) | (5,898 | ) | (551 | ) | 12,506 | (763 | ) | ||||||||||||||
| Other debt | 3,747 | 985 | (2,386 | ) | (684 | ) | 1,662 | 775 | ||||||||||||||||
| Total corporate and other debt | 34,918 | (434 | ) | (10,491 | ) | (3,539 | ) | 20,454 | (289 | ) | ||||||||||||||
| Corporate equities | 976 | 121 | (691 | ) | 130 | 536 | (227 | ) | ||||||||||||||||
| Net derivative and other contracts(3) | 23,382 | (4,316 | ) | (956 | ) | (9,764 | ) | 8,346 | (3,037 | ) | ||||||||||||||
| Investments | 9,698 | (1,418 | ) | 82 | (749 | ) | 7,613 | (1,317 | ) | |||||||||||||||
| Securities received as collateral | 30 | � | (7 | ) | � | 23 | � | |||||||||||||||||
| Intangible assets | 184 | (44 | ) | (3 | ) | � | 137 | (44 | ) | |||||||||||||||
| Liabilities | ||||||||||||||||||||||||
| Deposits | $ | � | $ | (2 | ) | $ | � | $ | 22 | $ | 24 | $ | (2 | ) | ||||||||||
| Financial instruments sold, not yet purchased: | ||||||||||||||||||||||||
| Other sovereign government obligations | � | � | (10 | ) | 10 | � | � | |||||||||||||||||
| Corporate and other debt: | ||||||||||||||||||||||||
| Commercial mortgage-backed securities | 13 | � | (13 | ) | � | � | � | |||||||||||||||||
| Asset-backed securities | 4 | � | � | � | 4 | � | ||||||||||||||||||
| Corporate bonds | 395 | (22 | ) | (291 | ) | (97 | ) | 29 | (30 | ) | ||||||||||||||
| Collateralized debt obligations | � | � | 3 | � | 3 | � | ||||||||||||||||||
| Unfunded lending commitments | 24 | (12 | ) | 216 | � | 252 | (12 | ) | ||||||||||||||||
| Other debt | 3,372 | (13 | ) | (2,291 | ) | (663 | ) | 431 | (196 | ) | ||||||||||||||
| Total corporate and other debt | 3,808 | (47 | ) | (2,376 | ) | (760 | ) | 719 | (238 | ) | ||||||||||||||
| Corporate equities | 27 | (6 | ) | (90 | ) | 61 | 4 | (1 | ) | |||||||||||||||
| Obligation to return securities received as collateral | 30 | � | (7 | ) | � | 23 | � | |||||||||||||||||
| Other secured financings | 6,148 | 396 | (3,757 | ) | (463 | ) | 1,532 | (50 | ) | |||||||||||||||
| Long-term borrowings | 5,473 | (450 | ) | 267 | 675 | 6,865 | (450 | ) | ||||||||||||||||
| | 158 |
| (1) | Total realized and unrealized gains (losses) are primarily included in Principal transactions�Trading in the consolidated statements of income except for $(1,418) million related to Financial instruments owned�Investments, which is included in Principal transactions�Investments. |
| (2) | Amounts represent unrealized gains (losses) for 2009 related to assets and liabilities still outstanding at December�31, 2009. |
| (3) | Net derivative and other contracts represent Financial instruments owned�Derivative and other contracts net of Financial instruments sold, not yet purchased�Derivative and other contracts. For further information on derivative instruments and hedging activities, see Note 12. |
| 159 | |
| Beginning Balance at November�30, 2007 | Total�Realized and Unrealized Gains (Losses)(1) | Purchases, Sales,�Other Settlements and�Issuances, net | Net Transfers In and/or (Out) of Level 3 | Ending Balance at November�30, 2008 | Unrealized Gains (Losses) for Level 3 Assets/Liabilities Outstanding�at November�30, 2008(2) | |||||||||||||||||||
| (dollars in millions) | ||||||||||||||||||||||||
| Assets | ||||||||||||||||||||||||
| Financial instruments owned: | ||||||||||||||||||||||||
| U.S. agency securities | $ | 660 | $ | 9 | $ | (367 | ) | $ | (96 | ) | $ | 206 | $ | (8 | ) | |||||||||
| Other sovereign government obligations | 29 | (6 | ) | (20 | ) | � | 3 | (2 | ) | |||||||||||||||
| Corporate and other debt | 37,058 | (12,835 | ) | 411 | 9,826 | 34,460 | (12,683 | ) | ||||||||||||||||
| Corporate equities | 1,236 | (537 | ) | (52 | ) | 260 | 907 | (351 | ) | |||||||||||||||
| Net derivative and other contracts(3) | 5,938 | 20,974 | (512 | ) | 1,224 | 27,624 | 20,499 | |||||||||||||||||
| Investments | 13,068 | (3,324 | ) | 2,151 | (2,163 | ) | 9,732 | (3,350 | ) | |||||||||||||||
| Securities received as collateral | 7 | � | 8 | � | 15 | � | ||||||||||||||||||
| Intangible assets | � | (220 | ) | 19 | 421 | 220 | (220 | ) | ||||||||||||||||
| Liabilities | ||||||||||||||||||||||||
| Financial instruments sold, not yet purchased: | ||||||||||||||||||||||||
| Corporate and other debt | $ | 1,122 | $ | 221 | $ | 2,865 | $ | 177 | $ | 3,943 | $ | 94 | ||||||||||||
| Corporate equities | 16 | (165 | ) | (271 | ) | 111 | 21 | 27 | ||||||||||||||||
| Obligation to return securities received as collateral | 7 | � | 8 | � | 15 | � | ||||||||||||||||||
| Other secured financings | 2,321 | 1,349 | 1,440 | 3,335 | 5,747 | 1,349 | ||||||||||||||||||
| Long-term borrowings | 398 | 226 | 5,428 | (183 | ) | 5,417 | 226 | |||||||||||||||||
| (1) | Total realized and unrealized gains (losses) are primarily included in Principal transactions�Trading in the consolidated statements of income except for $(3,324) million related to Financial instruments owned�Investments, which is included in Principal transactions�Investments. |
| (2) | Amounts represent unrealized gains (losses) for fiscal 2008 related to assets and liabilities still outstanding at November�30, 2008. |
| (3) | Net derivative and other contracts represent Financial instruments owned�Derivative and other contracts, net of Financial instruments sold, not yet purchased�Derivative and other contracts. |
| | 160 |
| 161 | |
| Beginning Balance at November�30, 2008 | Total Realized and Unrealized Gains (Losses)(1) | Purchases, Sales, Other Settlements and Issuances, net | Net�Transfers In and/or (Out) of Level 3 | Ending Balance�at December�31, 2008 | Unrealized Gains (Losses) for Level 3 Assets/ Liabilities Outstanding�at December�31, 2008(2) | |||||||||||||||||||
| (dollars in millions) | ||||||||||||||||||||||||
| Assets | ||||||||||||||||||||||||
| Financial instruments owned: | ||||||||||||||||||||||||
| U.S. agency securities | $ | 206 | $ | (3 | ) | $ | (76 | ) | $ | � | $ | 127 | $ | (5 | ) | |||||||||
| Other sovereign government obligations | 3 | � | (1 | ) | (1 | ) | 1 | � | ||||||||||||||||
| Corporate and other debt | 34,460 | (393 | ) | 1,036 | (185 | ) | 34,918 | (378 | ) | |||||||||||||||
| Corporate equities | 907 | (11 | ) | (3 | ) | 83 | 976 | (10 | ) | |||||||||||||||
| Net derivative and other contracts(3) | 27,624 | (2,040 | ) | (43 | ) | (2,159 | ) | 23,382 | (1,879 | ) | ||||||||||||||
| Investments | 9,732 | (169 | ) | 149 | (14 | ) | 9,698 | (158 | ) | |||||||||||||||
| Securities received as collateral | 15 | � | 15 | � | 30 | � | ||||||||||||||||||
| Intangible assets | 220 | (36 | ) | � | � | 184 | (36 | ) | ||||||||||||||||
| Liabilities | ||||||||||||||||||||||||
| Financial instruments sold, not yet purchased: | ||||||||||||||||||||||||
| Corporate and other debt | $ | 3,943 | $ | (43 | ) | $ | (140 | ) | $ | (38 | ) | $ | 3,808 | $ | (63 | ) | ||||||||
| Corporate equities | 21 | (20 | ) | (20 | ) | 6 | 27 | 1 | ||||||||||||||||
| Obligation to return securities received as collateral | 15 | � | 15 | � | 30 | � | ||||||||||||||||||
| Other secured financings | 5,747 | (219 | ) | 34 | 148 | 6,148 | (219 | ) | ||||||||||||||||
| Long-term borrowings | 5,417 | (52 | ) | 4 | � | 5,473 | (51 | ) | ||||||||||||||||
| (1) | Total realized and unrealized gains (losses) are primarily included in Principal transactions�Trading in the consolidated statements of income except for $(169) million related to Financial instruments owned�Investments, which is included in Principal transactions�Investments. |
| (2) | Amounts represent unrealized gains (losses) for the one month ended December�31, 2008 related to assets and liabilities still outstanding at December�31, 2008. |
| (3) | Net derivative and other contracts represent Financial instruments owned�Derivative and other contracts, net of Financial instruments sold, not yet purchased�Derivative and other contracts. For further information on derivative instruments and hedging activities, see Note 12. |
| | 162 |
| At December�31, 2010 | At December�31, 2009 | |||||||||||||||
| Fair�Value | Unfunded Commitment | Fair�Value | Unfunded Commitment | |||||||||||||
| (dollars in millions) | ||||||||||||||||
| Private equity funds | $ | 1,947 | $ | 1,047 | $ | 1,292 | $ | 1,251 | ||||||||
| Real estate funds | 1,154 | 500 | 823 | 674 | ||||||||||||
| Hedge funds(1): | ||||||||||||||||
| Long-short equity hedge funds | 1,046 | 4 | 1,597 | � | ||||||||||||
| Fixed income/credit-related hedge funds | 305 | � | 407 | � | ||||||||||||
| Event-driven hedge funds | 143 | � | 146 | � | ||||||||||||
| Multi-strategy hedge funds | 140 | � | 235 | � | ||||||||||||
| Total | $ | 4,735 | $ | 1,551 | $ | 4,500 | $ | 1,925 | ||||||||
| (1) | Fixed income/credit-related hedge funds, event-driven hedge funds and multi-strategy hedge funds are redeemable at least on a six-month period basis with a notice period of 90 days or less. At December�31, 2010, approximately 49% of the fair value amount of long-short equity hedge funds is redeemable at least quarterly, 24% is redeemable every six months and 27% of these funds have a redemption frequency of greater than six months. At December�31, 2009, approximately 36% of the fair value amount of long-short equity hedge funds is redeemable at least quarterly, 15% is redeemable every six months and 49% of these funds have a redemption frequency of greater than six months. The notice period for long-short equity hedge funds is primarily greater than 90 days. |
| 163 | |
| � | Long-short Equity Hedge Funds. Amount includes investments in hedge funds that invest, long or short, in equities. Equity value and growth hedge funds purchase stocks perceived to be undervalued and sell stocks perceived to be overvalued. Investments representing approximately 19% of the fair value of the investments in this category cannot be redeemed currently because the investments include certain initial period lock-up restrictions. The remaining restriction period for 100% of investments subject to lock-up restrictions ranged from one to three years at December�31, 2010. Investments representing approximately 29% of the fair value of the investments in long-short equity hedge funds cannot be redeemed currently because an exit restriction has been imposed by the hedge fund manager. The restriction period for 100% of investments subject to an exit restriction is expected to be less than a year at December�31, 2010. |
| � | Fixed Income/Credit-Related Hedge Funds. Amount includes investments in hedge funds that employ long-short, distressed or relative value strategies in order to benefit from investments in undervalued or overvalued securities that are primarily debt or credit related. At December�31, 2010, investments representing approximately 24% of the fair value of the investments in fixed income/credit-related hedge funds cannot be redeemed currently because the investments include certain initial period lock-up restrictions. The remaining restriction period for these investments was less than one year at December�31, 2010. |
| � | Event-Driven Hedge Funds. Amount includes investments in hedge funds that invest in event-driven situations such as mergers, hostile takeovers, reorganizations or leveraged buyouts. This may involve the simultaneous purchase of stock in companies being acquired and the sale of stock in its acquirer, hoping to profit from the spread between the current market price and the ultimate purchase price of the target company. At December�31, 2010, investments representing approximately 64% of the value of the investments in this category cannot be redeemed currently because the investments include certain initial period lock-up restrictions. The remaining restriction period for these investments was less than one year at December�31, 2010. |
| � | Multi-strategy Hedge Funds. Amount includes investments in hedge funds that pursue multiple strategies to realize short and long-term gains. Management of the hedge funds has the ability to overweight or underweight different strategies to best capitalize on current investment opportunities. At December�31, 2010, investments representing approximately 37% of the fair value of the investments in this category cannot be redeemed currently because the investments include certain initial period lock-up restrictions. The remaining restriction period for 71% of investments subject to lock-ups was two years or less at December�31, 2010. The remaining restriction period for the other 29% of investments subject to lock-up restrictions was estimated to be greater than three years at December�31, 2010. |
| | 164 |
| Principal Transactions- Trading | Interest Expense | (Losses)�
Gains Included�in Net Revenues | ||||||||||
| (dollars in millions) | ||||||||||||
| 2010 | ||||||||||||
| Deposits | $ | 2 | $ | (173 | ) | $ | (171 | ) | ||||
| Commercial paper and other short-term borrowings | (8 | ) | � | (8 | ) | |||||||
| Long-term borrowings | (872 | ) | (849 | ) | (1,721 | ) | ||||||
| Securities sold under agreements to repurchase | 9 | (1 | ) | 8 | ||||||||
| 2009 | ||||||||||||
| Deposits | $ | (81 | ) | $ | (321 | ) | $ | (402 | ) | |||
| Commercial paper and other short-term borrowings | (176 | ) | � | (176 | ) | |||||||
| Long-term borrowings | (7,660 | ) | (983 | ) | (8,643 | ) | ||||||
| Fiscal 2008 | ||||||||||||
| Deposits | $ | 14 | $ | � | $ | 14 | ||||||
| Commercial paper and other short-term borrowings | 1,238 | (2 | ) | 1,236 | ||||||||
| Long-term borrowings | 12,428 | (1,059 | ) | 11,369 | ||||||||
| One Month Ended December�31, 2008 | ||||||||||||
| Deposits | $ | (120 | ) | $ | (26 | ) | $ | (146 | ) | |||
| Commercial paper and other short-term borrowings | (81 | ) | � | (81 | ) | |||||||
| Long-term borrowings | (2,168 | ) | (80 | ) | (2,248 | ) | ||||||
| 2010 | 2009 | Fiscal 2008 | One
Month Ended December� 31, 2008 | |||||||||||||
| (dollars in millions) | ||||||||||||||||
| Short-term and long-term borrowings(1) | $ | (873 | ) | $ | (5,510 | ) | $ | 5,594 | $ | (241 | ) | |||||
| Loans(2) | 448 | 4,139 | (5,864 | ) | (498 | ) | ||||||||||
| Unfunded lending commitments(3) | (148 | ) | (8 | ) | 280 | 6 | ||||||||||
| (1) | The change in the fair value of structured notes includes an adjustment to reflect the credit quality of the Company based upon observations of the Company�s secondary bond market spreads. |
| (2) | Instrument specific credit gains or (losses) were determined by excluding the non-credit components of gains and losses, such as those due to changes in interest rates. |
| (3) | Losses were generally determined based on the differential between estimated expected client yields and contractual yields at each respective period end. |
| 165 | |
| At December� 31, 2010 | At December� 31, 2009 | |||||||
| (dollars in billions) | ||||||||
| Short-term and long-term borrowings(1) | $ | 0.6 | $ | 1.9 | ||||
| Loans(2) | 24.3 | 24.4 | ||||||
| Loans 90 or more days past due in non-accrual status or both(2)(3) | 21.2 | 21.0 | ||||||
| (1) | These amounts do not include structured notes where the repayment of the initial principal amount fluctuates based on changes in the reference price or index. |
| (2) | The majority of this difference between principal and fair value amounts emanates from the Company�s distressed debt trading business, which purchases distressed debt at amounts well below par. |
| (3) | The aggregate fair value of loans that were in non-accrual status, which includes all loans 90 or more days past due, was $2.2 billion and $3.9 billion at December�31, 2010 and December�31, 2009, respectively. The aggregate fair value of loans that were 90 or more days past due was $2.0 billion and $0.7 billion at December�31, 2010 and December�31, 2009, respectively. |
| Fair Value Measurements Using: | ||||||||||||||||||||
| Carrying�Value at� December�31, 2010 | Quoted�Prices�in Active�Markets�for Identical Assets (Level 1) | Significant Observable�Inputs (Level 2) | Significant Unobservable Inputs (Level 3) | Total Losses�for 2010(1) | ||||||||||||||||
| (dollars in millions) | ||||||||||||||||||||
| Loans(2) | $ | 680 | $ | � | $ | 151 | $ | 529 | $ | (12 | ) | |||||||||
| Other investments(3) | 88 | � | � | 88 | (19 | ) | ||||||||||||||
| Goodwill(4) | � | � | � | � | (27 | ) | ||||||||||||||
| Intangible assets(5) | 3 | � | � | 3 | (174 | ) | ||||||||||||||
| Total | $ | 771 | $ | � | $ | 151 | $ | 620 | $ | (232 | ) | |||||||||
| (1) | Losses related to Loans, impairments related to Other investments and losses related to Goodwill and certain Intangibles associated with the planned disposition of FrontPoint Partners LLC (�FrontPoint�) are included in Other revenues in the consolidated statements of income (see Notes 19 and 28 for further information on FrontPoint). Remaining losses were included in Other expenses in the consolidated statements of income. |
| (2) | Non-recurring change in fair value for loans held for investment was calculated based upon the fair value of the underlying collateral. The fair value of the collateral was determined using internal expected recovery models. The non-recurring change in fair value for mortgage loans held for sale is based upon a valuation model incorporating market observable inputs. |
| (3) | Losses recorded were determined primarily using discounted cash flow models. |
| (4) | Loss relates to FrontPoint, determined primarily using discounted cash flow models (see Note 28 for further information on FrontPoint). |
| (5) | Losses primarily related to investment management contracts, including contracts associated with FrontPoint, and were determined primarily using discounted cash flow models. |
| | 166 |
| Fair Value Measurements Using: | ||||||||||||||||||||
| Carrying�Value at� December�31, 2009 | Quoted�Prices�in Active�Markets�for Identical Assets (Level 1) | Significant Observable�Inputs (Level 2) | Significant Unobservable Inputs (Level 3) | Total Losses� for 2009(1) | ||||||||||||||||
| (dollars in millions) | ||||||||||||||||||||
| Loans(2) | $ | 739 | $ | � | $ | � | $ | 739 | $ | (269 | ) | |||||||||
| Other investments(3) | 66 | � | � | 66 | (39 | ) | ||||||||||||||
| Premises, equipment and software costs(3) | 8 | � | � | 8 | (5 | ) | ||||||||||||||
| Intangible assets(3) | 3 | � | � | 3 | (4 | ) | ||||||||||||||
| Total | $ | 816 | $ | � | $ | � | $ | 816 | $ | (317 | ) | |||||||||
| (1) | Losses are recorded within Other expenses in the consolidated statements of income except for fair value adjustments related to Loans and losses related to Other investments, which are included in Other revenues. |
| (2) | Losses for loans held for investment and held for sale were calculated based upon the fair value of the underlying collateral. The fair value of the collateral was determined using internal expected recovery models. |
| (3) | Losses recorded were determined primarily using discounted cash flow models. |
| Fair Value Measurements Using: | ||||||||||||||||||||
| Carrying�Value at�November�30, 2008 | Quoted�Prices�in Active�Markets�for Identical Assets (Level 1) | Significant Observable�Inputs (Level 2) | Significant Unobservable Inputs (Level 3) | Total Losses�for Fiscal�2008(1) | ||||||||||||||||
| (dollars in millions) | ||||||||||||||||||||
| Loans(2) | $ | 634 | $ | � | $ | 70 | $ | 564 | $ | (121 | ) | |||||||||
| Other investments(3) | 123 | � | � | 123 | (62 | ) | ||||||||||||||
| Premises, equipment and software costs(4) | 91 | � | � | 91 | (15 | ) | ||||||||||||||
| Goodwill(5) | � | � | � | � | (673 | ) | ||||||||||||||
| Intangible assets(6) | 198 | � | � | 198 | (46 | ) | ||||||||||||||
| Other assets(7) | 54 | � | � | 54 | (30 | ) | ||||||||||||||
| Total | $ | 1,100 | $ | � | $ | 70 | $ | 1,030 | $ | (947 | ) | |||||||||
| 167 | |
| (1) | Impairment losses are recorded within Other expenses in the consolidated statements of income except for impairment losses related to Loans and Other investments, which are included in Other revenues. |
| (2) | Impairment losses for loans held for investment were calculated based upon the fair value of the underlying collateral. The fair value of the collateral was determined using external indicative bids, if available, or internal expected recovery models. |
| (3) | Impairment losses recorded were determined primarily using discounted cash flow models. |
| (4) | The impairment charge relates to the fixed income business, which is a reporting unit within the Institutional Securities business segment. |
| (5) | The impairment charge relates to the fixed income business, which is a reporting unit within the Institutional Securities business segment. The fair value of the fixed income business was estimated by comparison with similar companies using their publicly traded price-to-book multiples as the basis for valuation. The impairment charge resulted from declines in the credit and mortgage markets in general, which caused significant declines in the stock market capitalization in the fourth quarter of fiscal 2008, and therefore, a decline in the fair value of the fixed income business. |
| (6) | Impairment losses of $21 million recorded within the Institutional Securities business segment primarily related to intellectual property rights. Impairment losses of $25 million recorded within the Asset Management business segment primarily related to management contract intangibles. |
| (7) | Buildings and property were written down to their fair value resulting in an impairment charge of $30 million. Fair values were generally determined using discounted cash flow models or third-party appraisals and valuations. The fair value was determined using a discounted cash flow model. These charges related to the Asset Management business segment. |
| | 168 |
| At December�31, 2010 | ||||||||||||||||||||
| Amortized Cost | Gross Unrealized Gains | Gross Unrealized Losses | Other-than- Temporary Impairment | Fair Value | ||||||||||||||||
| (dollars in millions) | ||||||||||||||||||||
| Debt securities available for sale: | ||||||||||||||||||||
| U.S. government and agency securities | $ | 29,586 | $ | 215 | $ | 152 | $ | � | $ | 29,649 | ||||||||||
| Less than 12 Months | 12 Months or Longer | Total | ||||||||||||||||||||||
| At December�31, 2010 | Fair�Value | Gross Unrealized Losses | Fair�Value | Gross Unrealized Losses | Fair�Value | Gross Unrealized Losses | ||||||||||||||||||
| (dollars in millions) | ||||||||||||||||||||||||
| Debt securities available for sale: | ||||||||||||||||||||||||
| U.S. government and agency securities | $ | 9,696 | $ | 152 | $ | � | $ | � | $ | 9,696 | $ | 152 | ||||||||||||
| Amortized�Cost | Fair�Value | Annualized Average�Yield | ||||||||||
| (dollars in millions) | ||||||||||||
| U.S. government and agency securities: | ||||||||||||
| Due within 1 year | $ | 6,913 | $ | 6,929 | 0.60 | % | ||||||
| After 1 year but through 5 years | 13,700 | 13,862 | 1.40 | % | ||||||||
| After 5 years | 8,973 | 8,858 | 1.64 | % | ||||||||
| Total | $ | 29,586 | $ | 29,649 | 1.28 | % | ||||||
| Gross realized gains(1)(2) | $ | 102 | ||
| Gross realized losses(2) | $ | � | ||
| Proceeds of sales of equity securities available for sale(1) | $ | 670 | ||
| (1) | Amounts relate to the Company�s sale of Invesco equity securities in the fourth quarter of 2010. See Note 1 for additional information. |
| (2) | Amounts are recognized in Other revenues in the consolidated statements of income. |
| 169 | |
| | 170 |
| At December�31, 2010 | At December�31, 2009 | |||||||
| (dollars in millions) | ||||||||
| Financial instruments owned: | ||||||||
| U.S. government and agency securities | $ | 11,513 | $ | 18,376 | ||||
| Other sovereign government obligations | 8,741 | 4,584 | ||||||
| Corporate and other debt | 12,333 | 13,111 | ||||||
| Corporate equities | 21,919 | 10,284 | ||||||
| Total | $ | 54,506 | $ | 46,355 | ||||
| 171 | |
| At December� 31, 2010 | At December� 31, 2009 | |||||||
| (dollars in millions) | ||||||||
| Cash deposited with clearing organizations or segregated under federal and other regulations or requirements | $ | 19,180 | $ | 23,712 | ||||
| Securities(1) | 18,935 | 11,296 | ||||||
| Total | $ | 38,115 | $ | 35,008 | ||||
| (1) | Securities deposited with clearing organizations or segregated under federal and other regulations or requirements are sourced from Federal funds sold and securities purchased under agreements to resell and Financial instruments owned in the consolidated statements of financial condition. |
| � | Interests purchased in connection with market-making and retained interests held as a result of securitization activities. |
| � | Guarantees issued and residual interests retained in connection with municipal bond securitizations. |
| � | Loans and investments made to VIEs that hold debt, equity, real estate or other assets. |
| � | Derivatives entered into with VIEs. |
| � | Structuring of credit-linked notes (�CLN�) or other asset-repackaged notes designed to meet the investment objectives of clients. |
| � | Other structured transactions designed to provide tax-efficient yields to the Company or its clients. |
| | 172 |
| 173 | |
| At December�31, 2010 | ||||||||||||||||||||
| Mortgage�
and Asset-Backed Securitizations | Collateralized Debt Obligations | Managed Real�Estate Partnerships | Other�Structured Financings | Other | ||||||||||||||||
| (dollars in millions) | ||||||||||||||||||||
| VIE assets | $ | 3,362 | $ | 129 | $ | 2,032 | $ | 643 | $ | 2,584 | ||||||||||
| VIE liabilities | $ | 2,544 | $ | 68 | $ | 108 | $ | 2,571 | $ | 1,219 | ||||||||||
| At December�31, 2009 | ||||||||||||||||
| Mortgage and Asset-Backed Securitizations | Credit and�Real Estate | Commodities Financing | Other Structured Financings | |||||||||||||
| (dollars in millions) | ||||||||||||||||
| VIE assets | $ | 2,715 | $ | 2,629 | $ | 1,509 | $ | 762 | ||||||||
| VIE liabilities | $ | 992 | $ | 687 | $ | 1,370 | $ | 73 | ||||||||
| | 174 |
| At December�31, 2010 | ||||||||||||||||||||
| Mortgage and Asset-Backed Securitizations | Collateralized Debt Obligations | Municipal Tender Option Bonds | Other Structured Financings | Other | ||||||||||||||||
| (dollars in millions) | ||||||||||||||||||||
| VIE assets that the Company does not consolidate (unpaid principal balance)(1) | $ | 172,711 | $ | 38,332 | $ | 7,431 | $ | 2,037 | $ | 11,262 | ||||||||||
| Maximum exposure to loss: | ||||||||||||||||||||
| Debt and equity interests(2) | $ | 8,129 | $ | 1,330 | $ | 78 | $ | 1,062 | $ | 2,678 | ||||||||||
| Derivative and other contracts | 113 | 942 | 4,709 | � | 2,079 | |||||||||||||||
| Commitments, guarantees and other | � | � | � | 791 | 446 | |||||||||||||||
| Total maximum exposure to loss | $ | 8,242 | $ | 2,272 | $ | 4,787 | $ | 1,853 | $ | 5,203 | ||||||||||
| Carrying value of exposure to loss�Assets: | ||||||||||||||||||||
| Debt and equity interests(2) | $ | 8,129 | $ | 1,330 | $ | 78 | $ | 779 | $ | 2,678 | ||||||||||
| Derivative and other contracts | 113 | 753 | � | � | 551 | |||||||||||||||
| Total carrying value of exposure to loss�Assets | $ | 8,242 | $ | 2,083 | $ | 78 | $ | 779 | $ | 3,229 | ||||||||||
| Carrying value of exposure to loss�Liabilities: | ||||||||||||||||||||
| Derivative and other contracts | $ | 15 | $ | 123 | $ | � | $ | � | $ | 23 | ||||||||||
| Commitments, guarantees and other | � | � | � | 44 | 261 | |||||||||||||||
| Total carrying value of exposure to loss�Liabilities | $ | 15 | $ | 123 | $ | � | $ | 44 | $ | 284 | ||||||||||
| (1) | Mortgage and asset-backed securitizations include VIE assets as follows: $34.9 billion of residential mortgages; $94.0 billion of commercial mortgages; $28.8 billion of U.S. agency collateralized mortgage obligations; and $15.0 billion of other consumer or commercial loans. |
| (2) | Mortgage and asset-backed securitizations include VIE debt and equity interests as follows: $1.9 billion of residential mortgages; $2.1 billion of commercial mortgages; $3.0 billion of U.S. agency collateralized mortgage obligations; and $1.1 billion of other consumer or commercial loans. |
| 175 | |
| At December�31, 2009 | ||||||||||||||||
| Mortgage and Asset-Backed Securitizations | Credit�and�Real Estate | Municipal Tender Option Bonds | Other Structured Financings | |||||||||||||
| (dollars in millions) | ||||||||||||||||
| VIE assets that the Company does not consolidate | $ | 720 | $ | 11,848 | $ | 339 | $ | 5,775 | ||||||||
| Maximum exposure to loss: | ||||||||||||||||
| Debt and equity interests | $ | 16 | $ | 2,330 | $ | 40 | $ | 861 | ||||||||
| Derivative and other contracts | 1 | 4,949 | � | � | ||||||||||||
| Commitments, guarantees and other | � | 200 | 31 | 623 | ||||||||||||
| Total maximum exposure to loss | $ | 17 | $ | 7,479 | $ | 71 | $ | 1,484 | ||||||||
| Carrying value of exposure to loss�Assets: | ||||||||||||||||
| Debt and equity interests | $ | 16 | $ | 2,330 | $ | 40 | $ | 682 | ||||||||
| Derivative and other contracts | 1 | 2,382 | � | � | ||||||||||||
| Total carrying value of exposure to loss�Assets | $ | 17 | $ | 4,712 | $ | 40 | $ | 682 | ||||||||
| Carrying value of exposure to loss�Liabilities: | ||||||||||||||||
| Derivative and other contracts | $ | � | $ | 484 | $ | � | $ | � | ||||||||
| Commitments, guarantees and other | � | � | � | 45 | ||||||||||||
| Total�carrying�value�of�exposure�to�loss�Liabilities | $ | � | $ | 484 | $ | � | $ | 45 | ||||||||
| | 176 |
| 177 | |
| | 178 |
| At December�31, 2010 | ||||||||||||||||
| Residential Mortgage Loans | Commercial Mortgage Loans | U.S. Agency Collateralized Mortgage Obligations | Credit- Linked Notes and�Other | |||||||||||||
| (dollars in millions) | ||||||||||||||||
| SPE assets (unpaid principal balance)(1) | $ | 48,947 | $ | 85,974 | $ | 29,748 | $ | 11,462 | ||||||||
| Retained interests (fair value): | ||||||||||||||||
| Investment grade | $ | 46 | $ | 64 | $ | 2,636 | $ | 8 | ||||||||
| Non-investment grade | 206 | 81 | � | 2,327 | ||||||||||||
| Total retained interests (fair value) | $ | 252 | $ | 145 | $ | 2,636 | $ | 2,335 | ||||||||
| Interests purchased in the secondary market (fair value): | ||||||||||||||||
| Investment grade | $ | 118 | $ | 643 | $ | 155 | $ | 21 | ||||||||
| Non-investment grade | 205 | 55 | � | 11 | ||||||||||||
| Total interests purchased in the secondary market (fair�value) | $ | 323 | $ | 698 | $ | 155 | $ | 32 | ||||||||
| Derivative assets (fair value) | $ | 75 | $ | 955 | $ | � | $ | 78 | ||||||||
| Derivative liabilities (fair value) | $ | 29 | $ | 80 | $ | � | $ | 314 | ||||||||
| (1) | Amounts include assets transferred by unrelated transferors. |
| At December�31, 2010 | ||||||||||||||||
| Level�1 | Level�2 | Level�3 | Total | |||||||||||||
| (dollars in millions) | ||||||||||||||||
| Retained interests (fair value): | ||||||||||||||||
| Investment grade | $ | � | $ | 2,732 | $ | 22 | $ | 2,754 | ||||||||
| Non-investment grade | � | 241 | 2,373 | 2,614 | ||||||||||||
| Total retained interests (fair value) | $ | � | $ | 2,973 | $ | 2,395 | $ | 5,368 | ||||||||
| Interests purchased in the secondary market (fair value): | ||||||||||||||||
| Investment grade | $ | � | $ | 929 | $ | 8 | $ | 937 | ||||||||
| Non-investment grade | � | 255 | 16 | 271 | ||||||||||||
| Total interests purchased in the secondary market (fair value) | $ | � | $ | 1,184 | $ | 24 | $ | 1,208 | ||||||||
| Derivative assets (fair value) | $ | � | $ | 887 | $ | 221 | $ | 1,108 | ||||||||
| Derivative liabilities (fair value) | $ | � | $ | 360 | $ | 63 | $ | 423 | ||||||||
| 179 | |
| At December�31, 2010 | ||||||||||||||||
| Commercial Mortgage Loans | Credit- Linked Notes | Equity- Linked Transactions | Other | |||||||||||||
| (dollars in millions) | ||||||||||||||||
| Assets | ||||||||||||||||
| Carrying value | $ | 128 | $ | 784 | $ | 1,618 | $ | 62 | ||||||||
| Other secured financings | ||||||||||||||||
| Carrying value | $ | 124 | $ | 781 | $ | 1,583 | $ | 61 | ||||||||
| At December�31, 2009 | ||||||||||||||||
| Residential Mortgage Loans | Commercial Mortgage Loans | Credit- Linked Notes | Other | |||||||||||||
| (dollars in millions) | ||||||||||||||||
| Assets | ||||||||||||||||
| Carrying value | $ | 151 | $ | 291 | $ | 1,012 | $ | 1,294 | ||||||||
| Other secured financings | ||||||||||||||||
| Carrying value | $ | 138 | $ | 269 | $ | 978 | $ | 1,294 | ||||||||
| | 180 |
| At December�31, 2010 | ||||||||||||||||
| Residential Mortgage Unconsolidated SPEs | Residential Mortgage Consolidated SPEs | Commercial Mortgage Unconsolidated SPEs | Commercial Mortgage Consolidated SPEs | |||||||||||||
| (dollars in millions) | ||||||||||||||||
| Assets serviced (unpaid principal balance) | $ | 10,616 | $ | 2,357 | $ | 7,108 | $ | 2,097 | ||||||||
| Amounts past due 90 days or greater (unpaid principal balance)(1) | $ | 3,861 | $ | 446 | $ | � | $ | � | ||||||||
| Percentage of amounts past due 90 days or greater(1) | 36.4 | % | 18.9 | % | � | � | ||||||||||
| Credit losses | $ | 1,098 | $ | 35 | $ | � | $ | � | ||||||||
| (1) | Amount includes loans that are at least 90 days contractually delinquent, loans for which the borrower has filed for bankruptcy, loans in foreclosure and real estate owned. |
| At December�31, 2009 | ||||||||||||
| Residential Mortgage QSPEs | Residential Mortgage Failed�Sales | Commercial Mortgage QSPEs | ||||||||||
| (dollars in millions) | ||||||||||||
| Assets serviced (unpaid principal balance) | $ | 18,902 | $ | 1,110 | $ | 10,901 | ||||||
| Amounts past due 90 days or greater (unpaid principal balance)(1) | $ | 7,297 | $ | 408 | $ | 5 | ||||||
| Percentage of amounts past due 90 days or greater(1) | 38.6 | % | 36.8 | % | � | |||||||
| (1) | Amount includes loans that are at least 90 days contractually delinquent, loans for which the borrower has filed for bankruptcy, loans in foreclosure and real estate owned. |
| 181 | |
| � | Commercial and Industrial . Commercial and industrial loans include commercial lending, corporate lending and commercial asset-backed lending products. Risk factors considered in determining the allowance for commercial and industrial loans include the borrower�s financial strength, seniority of the loan, collateral type, volatility of collateral value, debt cushion, covenants and (for unsecured loans) counterparty type. |
| � | Consumer . Consumer loans include unsecured loans and non-purpose securities-based lending that allows clients to borrow money against the value of qualifying securities for any suitable purpose other than purchasing, trading, or carrying marketable securities or refinancing margin debt. The allowance methodology for unsecured loans considers the specific attributes of the loan as well as borrower�s source of repayment. The allowance methodology for non-purpose securities-based lending considers the collateral type underlying the loan ( e.g. , diversified securities, concentrated securities, or restricted stock). |
| � | Real Estate�Residential . Residential real estate loans include home equity lines of credit and non-conforming loans. The allowance methodology for nonconforming residential mortgage loans considers several factors, including but not limited to loan-to-value ratio, a FICO score, home price index, and delinquency status. The methodology for home equity loans considers credit limits and utilization rates in addition to the factors considered for nonconforming residential mortgages. |
| � | Real Estate�Wholesale . Wholesale real estate loans include owner-occupied loans and income-producing loans. The principal risk factor for determining the allowance for wholesale real estate loans is the underlying collateral type, which is affected by the time period to liquidate the collateral and the volatility in collateral values. |
| Commercial and industrial | $ | 4,054 | ||
| Consumer loans | 3,974 | |||
| Residential real estate loans | 1,915 | |||
| Wholesale real estate loans | 468 | |||
| Total loans held for investment, net of allowance of $82 million | $ | 10,411 | ||
| | 182 |
| � | Pass . A credit exposure rated pass has a continued expectation of timely repayment, all obligations of the borrower are current, and the obligor complies with material terms and conditions of the lending agreement. |
| � | Special Mention . Extensions of credit that have potential weakness that deserve management�s close attention and if left uncorrected may, at some future date, result in the deterioration of the repayment prospects for the credit. These potential weaknesses may be due to circumstances such as the borrower experiencing negative operating trends, having an ill-proportioned balance sheet, experiencing problems with management or labor relations, experiencing pending litigation, or there are concerns about the condition or control over collateral. |
| � | Substandard . Obligor has a well-defined weakness that jeopardizes the repayment of the debt and has a high probability of payment default with the distinct possibility that the Company will sustain some loss if noted deficiencies are not corrected. Indicators of a substandard loan include that the obligor is experiencing current or anticipated unprofitable operations, inadequate fixed charge coverage, and inadequate liquidity to support operations or meet obligations when they come due or marginal capitalization. |
| � | Doubtful . Inherent weakness in the exposure makes the collection or repayment in full, based on existing facts, conditions and circumstances, highly improbable, but the amount of loss is uncertain. The obligor may demonstrate inadequate liquidity, sufficient capital or necessary resources to continue as a going concern or may be in default. |
| � | Loss . Extensions of credit classified as loss are considered uncollectible and are charged off. |
| 183 | |
| | 184 |
| Institutional Securities(1) | Global Wealth Management Group | Asset Management | Total | |||||||||||||
| (dollars in millions) | ||||||||||||||||
| Goodwill at December�31, 2008 | $ | 813 | $ | 272 | $ | 1,171 | $ | 2,256 | ||||||||
| Foreign currency translation adjustments and other | 13 | � | � | 13 | ||||||||||||
| Goodwill acquired during the year(2) | � | 5,346 | � | 5,346 | ||||||||||||
| Goodwill disposed of during the year(3) | (453 | ) | � | � | (453 | ) | ||||||||||
| Goodwill at December�31, 2009(4)(5) | $ | 373 | $ | 5,618 | $ | 1,171 | $ | 7,162 | ||||||||
| Foreign currency translation adjustments and other | 10 | (2 | ) | � | 8 | |||||||||||
| Goodwill disposed of during the year(6) | � | � | (404 | ) | (404 | ) | ||||||||||
| Impairment losses(7) | � | � | (27 | ) | (27 | ) | ||||||||||
| Goodwill at December�31, 2010(5) | $ | 383 | $ | 5,616 | $ | 740 | $ | 6,739 | ||||||||
| (1) | The amount of goodwill related to MSCI was $437 million at December�31, 2008. |
| (2) | Global Wealth Management Group business segment activity primarily represents goodwill acquired in connection with Smith Barney and Citi Managed Futures (see Note 3). |
| (3) | Institutional Securities business segment activity primarily represents goodwill disposed of in connection with MSCI (see Note 25). |
| (4) | The Asset Management business segment amount at December�31, 2009 included approximately $404�million related to Retail Asset Management. |
| (5) | The amount of the Company�s goodwill before accumulated impairments of $700 million and $673 million at December�31, 2010 and December�31, 2009, respectively, was $7,439 million and $7,835 million at December�31, 2010 and December�31, 2009, respectively. |
| (6) | The Asset Management activity represents goodwill disposed of in connection with the sale of Retail Asset Management (see Note 1). |
| (7) | The Asset Management activity represents impairment losses related to FrontPoint (see Note 28 for further information on FrontPoint). |
| 185 | |
| Institutional Securities(1) | Global Wealth Management Group | Asset Management(2) | Total | |||||||||||||
| (dollars in millions) | ||||||||||||||||
| Amortizable net intangible assets at December�31, 2008 | $ | 333 | $ | � | $ | 389 | $ | 722 | ||||||||
| Mortgage servicing rights (see Note 7) | 184 | � | � | 184 | ||||||||||||
| Net intangible assets at December�31, 2008 | $ | 517 | $ | � | $ | 389 | $ | 906 | ||||||||
| Amortizable net intangible assets at December�31, 2008 | $ | 333 | $ | � | $ | 389 | $ | 722 | ||||||||
| Foreign currency translation adjustments and other | � | � | (4 | ) | (4 | ) | ||||||||||
| Amortization expense(3) | (17 | ) | (183 | ) | (45 | ) | (245 | ) | ||||||||
| Impairment losses(4) | (4 | ) | � | (12 | ) | (16 | ) | |||||||||
| Intangible assets acquired during the year(5) | 2 | 4,475 | 1 | 4,478 | ||||||||||||
| Intangible assets disposed of during the year(6) | (153 | ) | � | (145 | ) | (298 | ) | |||||||||
| Amortizable net intangible assets at December�31, 2009 | 161 | 4,292 | 184 | 4,637 | ||||||||||||
| Mortgage servicing rights (see Note 7) | 135 | 2 | � | 137 | ||||||||||||
| Indefinite-lived intangible assets (see Note 3) | � | 280 | � | 280 | ||||||||||||
| Net intangible assets at December�31, 2009 | $ | 296 | $ | 4,574 | $ | 184 | $ | 5,054 | ||||||||
| Amortizable net intangible assets at December�31, 2009 | $ | 161 | $ | 4,292 | $ | 184 | $ | 4,637 | ||||||||
| Foreign currency translation adjustments and other | 6 | 1 | � | 7 | ||||||||||||
| Amortization expense | (23 | ) | (324 | ) | (9 | ) | (356 | ) | ||||||||
| Impairment losses(7) | (4 | ) | (4 | ) | (166 | ) | (174 | ) | ||||||||
| Intangible assets acquired during the year(8) | 122 | � | � | 122 | ||||||||||||
| Intangible assets disposed of during the year | � | (2 | ) | (4 | ) | (6 | ) | |||||||||
| Amortizable net intangible assets at December�31, 2010 | 262 | 3,963 | 5 | 4,230 | ||||||||||||
| Mortgage servicing rights (see Note 7) | 151 | 6 | � | 157 | ||||||||||||
| Indefinite-lived intangible assets (see Note 3) | � | 280 | � | 280 | ||||||||||||
| Net intangible assets at December�31, 2010 | $ | 413 | $ | 4,249 | $ | 5 | $ | 4,667 | ||||||||
| (1) | The amount of net intangible assets related to MSCI was $144 million at December�31, 2008. |
| (2) | The amount of intangible assets related to Crescent was $194 million at December�31, 2008. |
| (3) | Amortization expense for MSCI, Retail Asset Management and Crescent in 2009 is included in discontinued operations. |
| (4) | Impairment losses recorded within the Asset Management business segment related to the disposition of Crescent and are included in discontinued operations. |
| (5) | Global Wealth Management Group business segment activity primarily represents intangible assets acquired in connection with Smith Barney and Citi Managed Futures (see Note 3). |
| (6) | Institutional Securities business segment activity primarily represents intangible assets disposed of in connection with MSCI. Asset Management business segment activity represents intangible assets disposed of in connection with Crescent (see Note 25). |
| (7) | The Asset Management business segment activity represents losses primarily related to investment management contracts that were determined using discounted cash flow models. Impairment losses are recorded within Other expenses and Other revenues in the consolidated statements of income (see Note 19). |
| (8) | The Institutional Securities business segment activity primarily represents certain reinsurance licenses and a management contract. |
| | 186 |
| At December�31, 2010 | At December�31, 2009 | |||||||||||||||
| Gross Carrying Amount | Accumulated Amortization | Gross Carrying Amount | Accumulated Amortization | |||||||||||||
| (dollars in millions) | ||||||||||||||||
| Amortizable intangible assets: | ||||||||||||||||
| Trademarks | $ | 63 | $ | 13 | $ | 75 | $ | 10 | ||||||||
| Technology related | 3 | 2 | 10 | 3 | ||||||||||||
| Customer relationships | 4,059 | 415 | 4,061 | 159 | ||||||||||||
| Management contracts | 347 | 75 | 463 | 38 | ||||||||||||
| Research | 176 | 56 | 176 | 21 | ||||||||||||
| Intangible lease asset | 38 | 16 | 24 | 4 | ||||||||||||
| Other | 149 | 28 | 103 | 40 | ||||||||||||
| Total amortizable intangible assets | $ | 4,835 | $ | 605 | $ | 4,912 | $ | 275 | ||||||||
| At December�31, 2010(1) | At December�31, 2009(1) | |||||||
| (dollars in millions) | ||||||||
| Savings and demand deposits | $ | 59,856 | $ | 57,114 | ||||
| Time deposits(2) | 3,956 | 5,101 | ||||||
| Total | $ | 63,812 | $ | 62,215 | ||||
| (1) | Total deposits insured by the Federal Deposit Insurance Corporation (�FDIC�) at December�31, 2010 and December�31, 2009 were $48 billion and $46 billion, respectively. |
| (2) | Certain time deposit accounts are carried at fair value under the fair value option (see Note 4). |
| Year | ||||
| 2011(1) | $ | 61,633 | ||
| 2012 | 591 | |||
| 2013 | 1,360 | |||
| 2014 | 198 | |||
| 2015 | � | |||
| (1) | Amount includes approximately $60 billion of savings deposits, which have no stated maturity, and approximately $2 billion of time deposits. |
| 187 | |
| December�
31, 2010 | December�
31, 2009 | |||||||
| (dollars in millions) | ||||||||
| Commercial Paper: | ||||||||
| Balance at period-end | $ | 945 | $ | 783 | ||||
| Average balance(1) | $ | 866 | $ | 924 | ||||
| Weighted average interest rate on period-end balance | 2.5 | % | 0.8 | % | ||||
| Other Short-Term Borrowings(2)(3): | ||||||||
| Balance at period-end | $ | 2,311 | $ | 1,595 | ||||
| Average balance(1) | $ | 2,697 | $ | 2,453 | ||||
| (1) | Average balances are calculated based upon weekly balances. |
| (2) | These borrowings included bank loans, bank notes and structured notes with original maturities of 12 months or less. |
| (3) | Certain structured short-term borrowings are carried at fair value under the fair value option. See Note 4 for additional information. |
| Parent Company | Subsidiaries | At December� 31, 2010(3)(4)(5) | At December� 31, 2009(3) | |||||||||||||||||||||
| Fixed Rate | Variable Rate(1)(2) | Fixed Rate | Variable Rate(1)(2) | |||||||||||||||||||||
| Due in 2010 | $ | � | $ | � | $ | � | $ | � | $ | � | $ | 26,088 | ||||||||||||
| Due in 2011 | 14,395 | 10,558 | 161 | 1,797 | 26,911 | 26,810 | ||||||||||||||||||
| Due in 2012 | 15,310 | 21,865 | 37 | 653 | 37,865 | 38,039 | ||||||||||||||||||
| Due in 2013 | 6,269 | 18,452 | 63 | 694 | 25,478 | 25,020 | ||||||||||||||||||
| Due in 2014 | 11,178 | 5,526 | 15 | 984 | 17,703 | 16,866 | ||||||||||||||||||
| Due in 2015 | 13,087 | 4,110 | 73 | 3,756 | 21,026 | 13,175 | ||||||||||||||||||
| Thereafter | 39,371 | 22,847 | 317 | 939 | 63,474 | 47,376 | ||||||||||||||||||
| Total | $ | 99,610 | $ | 83,358 | $ | 666 | $ | 8,823 | $ | 192,457 | $ | 193,374 | ||||||||||||
| Weighted average coupon at period-end(6) | 5.1 | % | 1.0 | % | 6.2 | % | 4.2 | % | 3.8 | % | 3.9 | % | ||||||||||||
| (1) | Floating rate borrowings bear interest based on a variety of money market indices, including LIBOR and Federal Funds rates. |
| (2) | Amounts include borrowings that are equity-linked, credit-linked, commodity-linked or linked to some other index. |
| (3) | Amounts include long-term borrowings issued under the Temporary Liquidity Guarantee Program (�TLGP�). |
| (4) | Amounts include an increase of approximately $3.2 billion at December�31, 2010 to the carrying amount of certain of the Company�s long-term borrowings associated with fair value hedges. The increase to the carrying value associated with fair value hedges by year due was approximately $0.1 billion due in 2011, $0.2 billion due in 2012, $0.4 billion due in 2013, $0.4 billion due in 2014, $0.6 billion due in 2015 and $1.5 billion due thereafter. |
| (5) | Amounts include a decrease of approximately $0.6 billion at December�31, 2010 to the carrying amounts of certain of the Company�s long-term borrowings for which the fair value option was elected (see Note 4). |
| (6) | Weighted average coupon was calculated utilizing U.S. and non-U.S. dollar interest rates and excludes financial instruments for which the fair value option was elected. |
| | 188 |
| At December�31, | ||||||||
| 2010 | 2009 | |||||||
| (dollars in millions) | ||||||||
| Senior debt | $ | 183,514 | $ | 178,797 | ||||
| Subordinated debt | 4,126 | 3,983 | ||||||
| Junior subordinated debentures | 4,817 | 10,594 | ||||||
| Total | $ | 192,457 | $ | 193,374 | ||||
| 189 | |
| 2010 | 2009 | Fiscal 2008 | One�Month Ended December�31, 2008 | |||||||||||||
| Weighted average coupon of long-term borrowings at period-end(1) | 3.6 | % | 3.7 | % | 4.9 | % | 4.8 | % | ||||||||
| Effective average borrowing rate for long-term borrowings after swaps at period-end(1) | 2.4 | % | 2.3 | % | 4.0 | % | 3.8 | % | ||||||||
| (1) | Included in the weighted average and effective average calculations are non-U.S. dollar interest rates. |
| At December�31, 2010 | At December�31, 2009 | |||||||
| (dollars in millions) | ||||||||
| Secured financings with original maturities greater than one year | $ | 7,398 | $ | 5,396 | ||||
| Secured financings with original maturities one year or less(1) | 506 | 27 | ||||||
| Failed sales | 2,549 | 2,679 | ||||||
| Total(2) | $ | 10,453 | $ | 8,102 | ||||
| (1) | At December�31, 2010, amount included approximately $308 million of variable rate financings and approximately $198 million of fixed rate financings. |
| (2) | Amounts include $8,490 million at fair value at December�31, 2010 and $8,102 million at fair value at December�31, 2009. |
| | 190 |
| Fixed Rate | Variable Rate(1)(2) | At December�31, 2010 | At December�31, 2009 | |||||||||||||
| (dollars in millions) | ||||||||||||||||
| Due in 2010 | $ | � | $ | � | $ | � | $ | 75 | ||||||||
| Due in 2011 | 486 | 2,721 | 3,207 | 2,542 | ||||||||||||
| Due in 2012 | 38 | 62 | 100 | 4 | ||||||||||||
| Due in 2013 | 300 | 234 | 534 | 963 | ||||||||||||
| Due in 2014 | � | 14 | 14 | 53 | ||||||||||||
| Due in 2015 | � | 577 | 577 | � | ||||||||||||
| Thereafter | 470 | 2,496 | 2,966 | 1,759 | ||||||||||||
| Total | $ | 1,294 | $ | 6,104 | $ | 7,398 | $ | 5,396 | ||||||||
| Weighted average coupon rate at period-end(3) | 2.2 | % | 1.6 | % | 1.7 | % | 0.8 | % | ||||||||
| (1) | Variable rate borrowings bear interest based on a variety of indices, including LIBOR. |
| (2) | Amounts include borrowings that are equity-linked, credit-linked, commodity-linked or linked to some other index. |
| (3) | Weighted average coupon was calculated utilizing U.S. and non-U.S. dollar interest rates and excludes secured financings that are linked to non-interest indices. |
| At December�31, 2010 | At December�31, 2009 | |||||||
| (dollars in millions) | ||||||||
| Due in 2010 | $ | � | $ | 581 | ||||
| Due in 2011 | 50 | 500 | ||||||
| Due in 2012 | 182 | 316 | ||||||
| Due in 2013 | 1,687 | 488 | ||||||
| Due in 2014 | 382 | 306 | ||||||
| Due in 2015 | 23 | 42 | ||||||
| Thereafter | 225 | 446 | ||||||
| Total | $ | 2,549 | $ | 2,679 | ||||
| 191 | |
| At December�31, 2010 | At December�31, 2009 | |||||||||||||||
| Assets | Liabilities | Assets | Liabilities | |||||||||||||
| (dollars in millions) | ||||||||||||||||
| Exchange traded derivative products | $ | 6,099 | $ | 8,553 | $ | 1,866 | $ | 5,649 | ||||||||
| OTC derivative products | 45,193 | 39,249 | 47,215 | 32,560 | ||||||||||||
| Total | $ | 51,292 | $ | 47,802 | $ | 49,081 | $ | 38,209 | ||||||||
| Cross- Maturity and Cash Collateral Netting(3) | Net Exposure Post-Cash Collateral | Net Exposure Post- Collateral | ||||||||||||||||||||||||||
| Years to Maturity | ||||||||||||||||||||||||||||
| Credit Rating(2) | Less�than�1 | 1-3 | 3-5 | Over 5 | ||||||||||||||||||||||||
| (dollars in millions) | ||||||||||||||||||||||||||||
| AAA | $ | 802 | $ | 2,005 | $ | 1,242 | $ | 8,823 | $ | (5,906 | ) | $ | 6,966 | $ | 6,683 | |||||||||||||
| AA | 6,601 | 6,760 | 5,589 | 17,844 | (27,801 | ) | 8,993 | 7,877 | ||||||||||||||||||||
| A | 8,655 | 8,710 | 6,507 | 26,492 | (36,397 | ) | 13,967 | 12,383 | ||||||||||||||||||||
| BBB | 2,982 | 4,109 | 2,124 | 7,347 | (9,034 | ) | 7,528 | 6,001 | ||||||||||||||||||||
| Non-investment grade | 2,628 | 3,231 | 1,779 | 4,456 | (4,355 | ) | 7,739 | 5,348 | ||||||||||||||||||||
| Total | $ | 21,668 | $ | 24,815 | $ | 17,241 | $ | 64,962 | $ | (83,493 | ) | $ | 45,193 | $ | 38,292 | |||||||||||||
| (1) | Fair values shown represent the Company�s net exposure to counterparties related to the Company�s OTC derivative products. The table does not include listed derivatives and the effect of any related hedges utilized by the Company. The table also excludes fair values corresponding to other credit exposures, such as those arising from the Company�s lending activities. |
| (2) | Obligor credit ratings are determined by the Company�s Credit Risk Management Department. |
| (3) | Amounts represent the netting of receivable balances with payable balances for the same counterparty across maturity categories. Receivable and payable balances with the same counterparty in the same maturity category are netted within such maturity category, where appropriate. Cash collateral received is netted on a counterparty basis, provided legal right of offset exists. |
| | 192 |
| Years to Maturity | Cross-Maturity and Cash�Collateral Netting(3) | Net�Exposure Post-Cash Collateral | Net�Exposure Post-Collateral | |||||||||||||||||||||||||
| Credit Rating(2) | Less�than�1 | 1-3 | 3-5 | Over 5 | ||||||||||||||||||||||||
| (dollars in millions) | ||||||||||||||||||||||||||||
| AAA | $ | 852 | $ | 2,026 | $ | 3,876 | $ | 9,331 | $ | (6,616 | ) | $ | 9,469 | $ | 9,082 | |||||||||||||
| AA | 6,469 | 7,855 | 6,600 | 15,071 | (25,576 | ) | 10,419 | 8,614 | ||||||||||||||||||||
| A | 8,018 | 10,712 | 7,990 | 22,739 | (38,971 | ) | 10,488 | 9,252 | ||||||||||||||||||||
| BBB | 3,032 | 4,193 | 2,947 | 7,524 | (8,971 | ) | 8,725 | 5,902 | ||||||||||||||||||||
| Non-investment grade | 2,773 | 3,331 | 2,113 | 4,431 | (4,534 | ) | 8,114 | 6,525 | ||||||||||||||||||||
| Total | $ | 21,144 | $ | 28,117 | $ | 23,526 | $ | 59,096 | $ | (84,668 | ) | $ | 47,215 | $ | 39,375 | |||||||||||||
| (1) | Fair values shown represent the Company�s net exposure to counterparties related to the Company�s OTC derivative products. The table does not include listed derivatives and the effect of any related hedges utilized by the Company. The table also excludes fair values corresponding to other credit exposures, such as those arising from the Company�s lending activities. |
| (2) | Obligor credit ratings are determined by the Company�s Credit Risk Management Department. |
| (3) | Amounts represent the netting of receivable balances with payable balances for the same counterparty across maturity categories. Receivable and payable balances with the same counterparty in the same maturity category are netted within such maturity category, where appropriate. Cash collateral received is netted on a counterparty basis, provided legal right of offset exists. |
| 193 | |
| Assets at December 31, 2010 | Liabilities�at December 31, 2010 | |||||||||||||||
| Fair�Value | Notional | Fair�Value | Notional | |||||||||||||
| (dollars in millions) | ||||||||||||||||
| Derivatives designated as accounting hedges: | ||||||||||||||||
| Interest rate contracts | $ | 5,250 | $ | 68,212 | $ | 177 | $ | 7,989 | ||||||||
| Foreign exchange contracts | 64 | 5,119 | 420 | 14,408 | ||||||||||||
| Total derivatives designated as accounting hedges | 5,314 | 73,331 | 597 | 22,397 | ||||||||||||
| Derivatives not designated as accounting hedges(1): | ||||||||||||||||
| Interest rate contracts | 615,717 | 16,305,214 | 595,626 | 16,267,730 | ||||||||||||
| Credit contracts | 110,134 | 2,398,676 | 95,626 | 2,239,211 | ||||||||||||
| Foreign exchange contracts | 61,924 | 1,418,488 | 64,268 | 1,431,651 | ||||||||||||
| Equity contracts | 39,846 | 571,767 | 46,160 | 568,399 | ||||||||||||
| Commodity contracts | 64,152 | 420,534 | 65,728 | 414,535 | ||||||||||||
| Other | 243 | 6,635 | 1,568 | 16,910 | ||||||||||||
| Total derivatives not designated as accounting hedges | 892,016 | 21,121,314 | 868,976 | 20,938,436 | ||||||||||||
| Total derivatives | $ | 897,330 | $ | 21,194,645 | $ | 869,573 | $ | 20,960,833 | ||||||||
| Cash collateral netting | (61,856 | ) | � | (37,589 | ) | � | ||||||||||
| Counterparty netting | (784,182 | ) | � | (784,182 | ) | � | ||||||||||
| Total derivatives | $ | 51,292 | $ | 21,194,645 | $ | 47,802 | $ | 20,960,833 | ||||||||
| (1) | Notional amounts include net notionals related to long and short futures contracts of $71 billion and $76 billion, respectively. The variation margin on these futures contracts (excluded from the table above) of $387 million and $1 million is included in Receivables�Brokers, dealers and clearing organizations and Payables�Brokers, dealers and clearing organizations, respectively, on the consolidated statements of financial condition. |
| | 194 |
| Assets at December 31, 2009 | Liabilities�at December 31, 2009 | |||||||||||||||
| Fair�Value | Notional | Fair�Value | Notional | |||||||||||||
| (dollars in millions) | ||||||||||||||||
| Derivatives designated as accounting hedges: | ||||||||||||||||
| Interest rate contracts | $ | 4,343 | $ | 69,026 | $ | 175 | $ | 12,248 | ||||||||
| Foreign exchange contracts | 216 | 10,781 | 105 | 7,125 | ||||||||||||
| Total derivatives designated as accounting hedges | 4,559 | 79,807 | 280 | 19,373 | ||||||||||||
| Derivatives not designated as accounting hedges(1): | ||||||||||||||||
| Interest rate contracts | 622,786 | 16,285,375 | 599,291 | 16,123,706 | ||||||||||||
| Credit contracts | 146,064 | 2,557,917 | 125,234 | 2,404,995 | ||||||||||||
| Foreign exchange contracts | 52,312 | 1,174,815 | 51,369 | 1,107,989 | ||||||||||||
| Equity contracts | 41,366 | 476,510 | 49,198 | 492,681 | ||||||||||||
| Commodity contracts | 64,614 | 453,132 | 63,714 | 414,765 | ||||||||||||
| Other | 389 | 12,908 | 1,123 | 6,180 | ||||||||||||
| Total derivatives not designated as accounting hedges | 927,531 | 20,960,657 | 889,929 | 20,550,316 | ||||||||||||
| Total derivatives | $ | 932,090 | $ | 21,040,464 | $ | 890,209 | $ | 20,569,689 | ||||||||
| Cash collateral netting | (62,738 | ) | � | (31,729 | ) | � | ||||||||||
| Counterparty netting | (820,271 | ) | � | (820,271 | ) | � | ||||||||||
| Total derivatives | $ | 49,081 | $ | 21,040,464 | $ | 38,209 | $ | 20,569,689 | ||||||||
| (1) | Notional amounts include net notionals related to long and short futures contracts of $434 billion and $696 billion, respectively. The variation margin on these futures contracts (excluded from the table above) of $601 million and $27 million is included in Receivables�Brokers, dealers and clearing organizations and Payables�Brokers, dealers and clearing organizations, respectively, on the consolidated statements of financial condition. |
| Product Type | 2010 | 2009 | One�Month�Ended December�31,�2008 | |||||||||
| (dollars�in�millions) | ||||||||||||
| Gain (loss) recognized on derivatives | $ | 1,257 | $ | (2,696 | ) | $ | 1,237 | |||||
| Gain (loss) recognized on borrowings | (604 | ) | 3,013 | (1,231 | ) | |||||||
| Total | $ | 653 | $ | 317 | $ | 6 | ||||||
| 195 | |
| Losses Recognized in OCI�(effective�portion) | ||||||||||||
| Product Type | 2010 | 2009 | One�Month�Ended December�31,�2008 | |||||||||
| (dollars�in�millions) | ||||||||||||
| Foreign exchange contracts(1) | $ | (285 | ) | $ | (278 | ) | $ | (102 | ) | |||
| Debt instruments | � | (192 | ) | (18 | ) | |||||||
| Total | $ | (285 | ) | $ | (470 | ) | $ | (120 | ) | |||
| (1) | A gain of $5 million was recognized in income related to amounts excluded from hedge effectiveness testing during 2010. A loss of $6 million and a loss of $17 million were recognized in income related to amounts excluded from hedge effectiveness testing during 2009 and the one month ended December�31, 2008, respectively. In addition, the amount excluded from the assessment of hedge effectiveness for fiscal 2008 was not material. |
| Gains (Losses) Recognized in Income(1)(2) | ||||||||||||
| December 31, | One�Month�Ended December�31,�2008 | |||||||||||
| Product Type | 2010 | 2009 | ||||||||||
| (dollars�in�millions) | ||||||||||||
| Interest rate contracts | $ | 544 | $ | 3,515 | $ | 1,814 | ||||||
| Credit contracts | (533 | ) | (2,579 | ) | (1,017 | ) | ||||||
| Foreign exchange contracts | 146 | 469 | (2,176 | ) | ||||||||
| Equity contracts | (2,772 | ) | (9,125 | ) | 91 | |||||||
| Commodity contracts | 597 | 1,748 | 880 | |||||||||
| Other contracts | (160 | ) | 680 | (177 | ) | |||||||
| Total derivative instruments | $ | (2,178 | ) | $ | (5,292 | ) | $ | (585 | ) | |||
| (1) | Gains (losses) on derivative contracts not designated as hedges are primarily included in Principal transactions�Trading. |
| (2) | Gains (losses) associated with derivative contracts that have physically settled are excluded from the table above. Gains (losses) on these contracts are reflected with the associated cash instruments, which are also included in Principal transactions�Trading. |
| | 196 |
| Protection Sold | ||||||||||||||||||||||||
| Maximum Potential Payout/Notional | Fair
Value (Asset)/ Liability(1)(2) | |||||||||||||||||||||||
| Years to Maturity | ||||||||||||||||||||||||
| Credit Ratings of the Reference Obligation | Less�than�1 | 1-3 | 3-5 | Over 5 | Total | |||||||||||||||||||
| (dollars in millions) | ||||||||||||||||||||||||
| Single name credit default swaps: | ||||||||||||||||||||||||
| AAA | $ | 2,747 | $ | 7,232 | $ | 13,927 | $ | 22,648 | $ | 46,554 | $ | 3,193 | ||||||||||||
| AA | 13,364 | 44,700 | 35,030 | 33,538 | 126,632 | 4,260 | ||||||||||||||||||
| A | 47,756 | 131,464 | 79,900 | 50,227 | 309,347 | (940 | ) | |||||||||||||||||
| BBB | 74,961 | 191,046 | 115,460 | 76,544 | 458,011 | (2,816 | ) | |||||||||||||||||
| Non-investment grade | 70,691 | 173,778 | 84,605 | 59,532 | 388,606 | 6,984 | ||||||||||||||||||
| Total | 209,519 | 548,220 | 328,922 | 242,489 | 1,329,150 | 10,681 | ||||||||||||||||||
| Index and basket credit default swaps: | ||||||||||||||||||||||||
| AAA | 17,437 | 67,165 | 26,172 | 26,966 | 137,740 | (1,569 | ) | |||||||||||||||||
| AA | 974 | 3,012 | 695 | 18,236 | 22,917 | 305 | ||||||||||||||||||
| A | 447 | 9,432 | 44,104 | 4,902 | 58,885 | 2,291 | ||||||||||||||||||
| BBB | 24,311 | 80,314 | 176,252 | 69,218 | 350,095 | (278 | ) | |||||||||||||||||
| Non-investment grade | 53,771 | 139,875 | 95,796 | 106,022 | 395,464 | 13,802 | ||||||||||||||||||
| Total | 96,940 | 299,798 | 343,019 | 225,344 | 965,101 | 14,551 | ||||||||||||||||||
| Total credit default swaps sold | $ | 306,459 | $ | 848,018 | $ | 671,941 | $ | 467,833 | $ | 2,294,251 | $ | 25,232 | ||||||||||||
| Other credit contracts(3)(4) | $ | 61 | $ | 1,416 | $ | 822 | $ | 3,856 | $ | 6,155 | $ | (1,198 | ) | |||||||||||
| Total credit derivatives and other credit contracts | $ | 306,520 | $ | 849,434 | $ | 672,763 | $ | 471,689 | $ | 2,300,406 | $ | 24,034 | ||||||||||||
| 197 | |
| (1) | Fair value amounts are shown on a gross basis prior to cash collateral or counterparty netting. |
| (2) | Fair value amounts of certain credit default swaps where the Company sold protection have an asset carrying value because credit spreads of the underlying reference entity or entities tightened during the terms of the contracts. |
| (3) | Other credit contracts include CLNs, CDOs and credit default swaps that are considered hybrid instruments. |
| (4) | Fair value amount shown represents the fair value of the hybrid instruments. |
| Protection Sold | ||||||||||||||||||||||||
| Maximum Potential Payout/Notional | Fair
Value (Asset)/ Liability(1)(2) | |||||||||||||||||||||||
| Years to Maturity | ||||||||||||||||||||||||
| Credit Ratings of the Reference Obligation | Less�than�1 | 1-3 | 3-5 | Over 5 | Total | |||||||||||||||||||
| (dollars in millions) | ||||||||||||||||||||||||
| Single name credit default swaps: | ||||||||||||||||||||||||
| AAA | $ | 926 | $ | 2,733 | $ | 10,969 | $ | 30,542 | $ | 45,170 | $ | 846 | ||||||||||||
| AA | 13,355 | 31,475 | 38,360 | 39,424 | 122,614 | 1,355 | ||||||||||||||||||
| A | 35,164 | 101,909 | 100,489 | 50,432 | 287,994 | (3,115 | ) | |||||||||||||||||
| BBB | 57,979 | 161,309 | 151,143 | 80,216 | 450,647 | (6,753 | ) | |||||||||||||||||
| Non-investment grade | 58,408 | 180,311 | 123,972 | 63,871 | 426,562 | 25,870 | ||||||||||||||||||
| Total | 165,832 | 477,737 | 424,933 | 264,485 | 1,332,987 | 18,203 | ||||||||||||||||||
| Index and basket credit default swaps: | ||||||||||||||||||||||||
| AAA | 41,517 | 59,925 | 51,750 | 53,917 | 207,109 | (1,563 | ) | |||||||||||||||||
| AA | � | 1,113 | 4,082 | 17,120 | 22,315 | 1,794 | ||||||||||||||||||
| A | 198 | 3,604 | 25,425 | 5,666 | 34,893 | (377 | ) | |||||||||||||||||
| BBB | 12,866 | 65,484 | 183,799 | 93,906 | 356,055 | (2,101 | ) | |||||||||||||||||
| Non-investment grade | 40,941 | 160,331 | 160,127 | 132,267 | 493,666 | 27,665 | ||||||||||||||||||
| Total | 95,522 | 290,457 | 425,183 | 302,876 | 1,114,038 | 25,418 | ||||||||||||||||||
| Total credit default swaps sold | $ | 261,354 | $ | 768,194 | $ | 850,116 | $ | 567,361 | $ | 2,447,025 | $ | 43,621 | ||||||||||||
| Other credit contracts(3)(4) | $ | 160 | $ | 125 | $ | 361 | $ | 1,757 | $ | 2,403 | $ | 783 | ||||||||||||
| Total credit derivatives and other credit contracts | $ | 261,514 | $ | 768,319 | $ | 850,477 | $ | 569,118 | $ | 2,449,428 | $ | 44,404 | ||||||||||||
| (1) | Fair value amounts are shown on a gross basis prior to cash collateral or counterparty netting. |
| (2) | Fair value amounts of certain credit default swaps where the Company sold protection have an asset carrying value because credit spreads of the underlying reference entity or entities tightened during the terms of the contracts. |
| (3) | Other credit contracts include CLNs and credit default swaps that are considered hybrid instruments. |
| (4) | Fair value amount shown represents the fair value of the hybrid instruments. |
| | 198 |
| 199 | |
| Years to Maturity | Total at December�31, 2010 | |||||||||||||||||||
| Less than�1 | 1-3 | 3-5 | Over�5 | |||||||||||||||||
| (dollars in millions) | ||||||||||||||||||||
| Letters of credit and other financial guarantees obtained to satisfy collateral requirements | $ | 1,701 | $ | 8 | $ | 11 | $ | 1 | $ | 1,721 | ||||||||||
| Investment activities | 1,146 | 587 | 103 | 78 | 1,914 | |||||||||||||||
| Primary lending commitments�investment grade(1)(2) | 8,104 | 28,291 | 7,885 | 219 | 44,499 | |||||||||||||||
| Primary lending commitments�non-investment grade(1) | 990 | 5,448 | 5,361 | 2,134 | 13,933 | |||||||||||||||
| Secondary lending commitments(1) | 39 | 116 | 173 | 39 | 367 | |||||||||||||||
| Commitments for secured lending transactions | 346 | 621 | 2 | � | 969 | |||||||||||||||
| Forward starting reverse repurchase agreements(3) | 53,037 | � | � | � | 53,037 | |||||||||||||||
| Commercial and residential mortgage-related commitments | 1,131 | 10 | 68 | 634 | 1,843 | |||||||||||||||
| Underwriting commitments | 128 | � | � | � | 128 | |||||||||||||||
| Other commitments | 198 | 62 | 3 | � | 263 | |||||||||||||||
| Total | $ | 66,820 | $ | 35,143 | $ | 13,606 | $ | 3,105 | $ | 118,674 | ||||||||||
| (1) | These commitments are recorded at fair value within Financial instruments owned and Financial instruments sold, not yet purchased in the consolidated statements of financial condition (see Note 4). |
| (2) | This amount includes commitments to asset-backed commercial paper conduits of $275 million at December�31, 2010, of which $138�million have maturities of less than one year and $137 million of which have maturities of one to three years. |
| (3) | The Company enters into forward starting securities purchased under agreements to resell (agreements that have a trade date at or prior to December�31, 2010 and settle subsequent to period-end) that are primarily secured by collateral from U.S. government agency securities and other sovereign government obligations. These agreements primarily settle within three business days and at December�31, 2010, $45.2�billion of the $53.0 billion settled within three business days. |
| | 200 |
| Year Ended | Operating Premises Leases | |||
| 2011 | $ | 680 | ||
| 2012 | 671 | |||
| 2013 | 603 | |||
| 2014 | 529 | |||
| 2015 | 396 | |||
| Thereafter | 2,431 | |||
| 201 | |
| Year Ended | Operating Equipment Leases | |||
| 2011 | $ | 313 | ||
| 2012 | 188 | |||
| 2013 | 125 | |||
| 2014 | 82 | |||
| 2015 | 70 | |||
| Thereafter | 203 | |||
| Maximum Potential Payout/Notional | Carrying Amount (Asset)/ Liability | Collateral/ Recourse | ||||||||||||||||||||||||||
| Years to Maturity | Total | |||||||||||||||||||||||||||
| Type of Guarantee | Less�than�1 | 1-3 | 3-5 | Over�5 | ||||||||||||||||||||||||
| (dollars in millions) | ||||||||||||||||||||||||||||
| Credit derivative contracts(1) | $ | 306,459 | $ | 848,018 | $ | 671,941 | $ | 467,833 | $ | 2,294,251 | $ | 25,232 | $ | � | ||||||||||||||
| Other credit contracts | 61 | 1,416 | 822 | 3,856 | 6,155 | (1,198 | ) | � | ||||||||||||||||||||
| Non-credit derivative contracts(1)(2) | 681,836 | 461,082 | 205,306 | 258,534 | 1,606,758 | 72,001 | � | |||||||||||||||||||||
| Standby letters of credit and other financial guarantees issued(3)(4) | 1,085 | 2,132 | 354 | 5,633 | 9,204 | 27 | 5,616 | |||||||||||||||||||||
| Market value guarantees | � | � | 180 | 644 | 824 | 44 | 116 | |||||||||||||||||||||
| Liquidity facilities | 4,884 | 338 | 187 | 71 | 5,480 | � | 6,857 | |||||||||||||||||||||
| Whole loan sales guarantees | � | � | � | 24,777 | 24,777 | 55 | � | |||||||||||||||||||||
| Securitization representations and warranties | � | � | � | 94,314 | 94,314 | 25 | � | |||||||||||||||||||||
| General partner guarantees | 189 | 28 | 56 | 249 | 522 | 69 | � | |||||||||||||||||||||
| (1) | Carrying amount of derivative contracts are shown on a gross basis prior to cash collateral or counterparty netting. For further information on derivative contracts, see Note 12. |
| | 202 |
| (2) | Amounts include a guarantee to investors in undivided participating interests in claims the Company made against a derivative counterparty that filed for bankruptcy protection. To the extent, in the future, any portion of the claims is disallowed or reduced by the bankruptcy court in excess of a certain amount, then the Company must refund a portion of the purchase price plus interest. For further information, see Note 18. |
| (3) | Approximately $2.2�billion of standby letters of credit are also reflected in the �Commitments� table in primary and secondary lending commitments. Standby letters of credit are recorded at fair value within Financial instruments owned or Financial instruments sold, not yet purchased in the consolidated statements of financial condition. |
| (4) | Amounts include guarantees issued by consolidated real estate funds sponsored by the Company of approximately $465 million. These guarantees relate to obligations of the fund�s investee entities, including guarantees related to capital expenditures and principal and interest debt payments. Accrued losses under these guarantees of approximately $161 million are reflected as a reduction of the carrying value of the related fund investments, which are reflected in Financial instruments owned�Investments on the consolidated statement of financial condition. |
| 203 | |
| | 204 |
| � | Trust Preferred Securities .����The Company has established�Morgan Stanley Capital Trusts for the limited purpose of issuing�trust preferred securities to third parties and lending the proceeds to the Company in exchange for junior subordinated debentures. The Company has directly guaranteed the repayment of the trust preferred securities to the holders thereof to the extent that the Company has made payments to a Morgan Stanley Capital Trust on the junior subordinated debentures. In the event that the Company does not make payments to a Morgan Stanley Capital Trust, holders of such series of trust preferred securities would not be able to rely upon the guarantee for payment of those amounts. The Company has not recorded any liability in the consolidated financial statements for these guarantees and believes that the occurrence of any events ( i.e ., non-performance on the part of the paying agent) that would trigger payments under these contracts is remote. See Note 15 for details on the Company�s junior subordinated debentures. |
| � | Indemnities .����The Company provides standard indemnities to counterparties for certain contingent exposures and taxes, including U.S. and foreign withholding taxes, on interest and other payments made on derivatives, securities and stock lending transactions, certain annuity products and other financial arrangements. These indemnity payments could be required based on a change in the tax laws or change in interpretation of applicable tax rulings or a change in factual circumstances. Certain contracts contain provisions that enable the Company to terminate the agreement upon the occurrence of such events. The maximum potential amount of future payments that the Company could be required to make under these indemnifications cannot be estimated. |
| � | Exchange/Clearinghouse Member Guarantees .����The Company is a member of various U.S. and non-U.S. exchanges and clearinghouses that trade and clear securities and/or derivative contracts. Associated with its membership, the Company may be required to pay a proportionate share of the financial obligations of another member who may default on its obligations to the exchange or the clearinghouse. While the rules governing different exchange or clearinghouse memberships vary, in general the Company�s guarantee obligations would arise only if the exchange or clearinghouse had previously exhausted its resources. The maximum potential payout under these membership agreements cannot be estimated. The Company has not recorded any contingent liability in the consolidated financial statements for these agreements and believes that any potential requirement to make payments under these agreements is remote. |
| 205 | |
| � | Merger and Acquisition Guarantees .����The Company may, from time to time, in its role as investment banking advisor be required to provide guarantees in connection with certain European merger and acquisition transactions. If required by the regulating authorities, the Company provides a guarantee that the acquirer in the merger and acquisition transaction has or will have sufficient funds to complete the transaction and would then be required to make the acquisition payments in the event the acquirer�s funds are insufficient at the completion date of the transaction. These arrangements generally cover the time frame from the transaction offer date to its closing date and, therefore, are generally short term in nature. The maximum potential amount of future payments that the Company could be required to make cannot be estimated. The Company believes the likelihood of any payment by the Company under these arrangements is remote given the level of the Company�s due diligence associated with its role as investment banking advisor. |
| � | Guarantees on Morgan Stanley Stable Value Program .����On September�30, 2009, the Company entered into an agreement with the investment manager for the Stable Value Program (�SVP�), a fund within the Company�s 401(k) plan, and certain other third parties.�Under the agreement,�the Company�contributed $20 million to the�SVP on�October 15, 2009 and recorded the contribution in Compensation and benefits�expense. Additionally,�the�Company�may have a future obligation to make a�payment of $40 million to the SVP following the third anniversary of the agreement, after which the SVP would be wound down over a period of time.�The future obligation is contingent upon whether the market-to-book value ratio of the portion of the SVP that is subject to certain book-value stabilizing contracts has fallen below a�specific threshold and�the Company and the other parties to the agreement�all decline to make payments to restore the SVP to such threshold as of the third anniversary of the agreement.�The Company has not recorded a liability for this guarantee in the consolidated financial statements. |
| | 206 |
| 207 | |
| | 208 |
| December�31, 2010 | December�31, 2009 | |||||||||||||||
| Balance | Ratio | Balance | Ratio | |||||||||||||
| (dollars�in�millions) | ||||||||||||||||
| Tier 1 capital | $ | 52,880 | 16.1 | % | $ | 46,670 | 15.3 | % | ||||||||
| Total capital | 54,477 | 16.5 | % | 49,955 | 16.4 | % | ||||||||||
| RWAs | 329,560 | � | 305,000 | � | ||||||||||||
| Adjusted average assets | 802,283 | � | 804,456 | � | ||||||||||||
| Tier 1 leverage | � | 6.6 | % | � | 5.8 | % | ||||||||||
| December�31,�2010 | December�31,�2009 | |||||||||||||||
| Amount | Ratio | Amount | Ratio | |||||||||||||
| (dollars�in�millions) | ||||||||||||||||
| Total capital (to RWAs): | ||||||||||||||||
| Morgan Stanley Bank, N.A. | $ | 8,069 | 18.6 | % | $ | 8,880 | 18.4 | % | ||||||||
| Morgan Stanley Private Bank, N.A.(1) | $ | 911 | 37.3 | % | $ | 602 | 70.3 | % | ||||||||
| Tier I capital (to RWAs): | ||||||||||||||||
| Morgan Stanley Bank, N.A. | $ | 9,572 | 15.7 | % | $ | 7,360 | 15.3 | % | ||||||||
| Morgan Stanley Private Bank, N.A.(1) | $ | 911 | 37.3 | % | $ | 602 | 70.3 | % | ||||||||
| Leverage ratio: | ||||||||||||||||
| Morgan Stanley Bank, N.A. | $ | 9,572 | 12.1 | % | $ | 7,360 | 10.7 | % | ||||||||
| Morgan Stanley Private Bank, N.A.(1) | $ | 911 | 12.4 | % | $ | 602 | 8.9 | % | ||||||||
| (1) | Morgan Stanley Private Bank, National Association (formerly Morgan Stanley Trust) changed its charter to a National Association on July�1, 2010. |
| 209 | |
| | 210 |
| 2010 | 2009 | Fiscal 2008 | One�
Month Ended December� 31, 2008 | |||||||||||||
| Shares outstanding at beginning of period | 1,361 | 1,074 | 1,056 | 1,048 | ||||||||||||
| Public offerings and other issuances of common stock | 116 | 276 | � | � | ||||||||||||
| Net impact of stock option exercises and other share issuances | 46 | 13 | 57 | 26 | ||||||||||||
| Treasury stock purchases(1) | (11 | ) | (2 | ) | (65 | ) | � | |||||||||
| Shares outstanding at end of period | 1,512 | 1,361 | 1,048 | 1,074 | ||||||||||||
| (1) | Treasury stock purchases include repurchases of common stock for employee tax withholding. |
| 211 | |
| | 212 |
| Series | Dividend Rate (Annual) | Shares Outstanding at December�31, 2010 | Liquidation Preference per Share | Convertible to Morgan Stanley Shares | Carrying Value | |||||||||||||||||||
| At December�31, 2010 | At December�31, 2009 | |||||||||||||||||||||||
| (dollars in millions) | ||||||||||||||||||||||||
| A | N/A | 44,000 | $ | 25,000 | � | $ | 1,100 | $ | 1,100 | |||||||||||||||
| B | 10.0 | % | 7,839,209 | 1,000 | 310,464,033 | 8,089 | 8,089 | |||||||||||||||||
| C | 10.0 | % | 519,882 | 1,000 | � | 408 | 408 | |||||||||||||||||
| Total | $ | 9,597 | $ | 9,597 | ||||||||||||||||||||
| 213 | |
| | 214 |
| At December� 31, 2010 | At December� 31, 2009 | |||||||
| Foreign currency translation adjustments, net of tax | $ | 40 | $ | (26 | ) | |||
| Amortization expense related to terminated cash flow hedges, net of tax | (18 | ) | (27 | ) | ||||
| Pension, postretirement and other related adjustments, net of tax | (525 | ) | (507 | ) | ||||
| Net unrealized gain on securities available for sale, net of tax | 36 | � | ||||||
| Accumulated other comprehensive loss, net of tax | $ | (467 | ) | $ | (560 | ) | ||
| At December� 31, 2010 | At December� 31, 2009 | |||||||
| (dollars in millions) | ||||||||
| Net monetary investments in non-U.S. dollar functional currency subsidiaries | $ | 10,990 | $ | 9,325 | ||||
| Cumulative foreign currency translation adjustments resulting from net investments in subsidiaries with a non-U.S. dollar functional currency | $ | 544 | $ | 254 | ||||
| Cumulative foreign currency translation adjustments resulting from realized or unrealized losses on hedges, net of tax | (504 | ) | (280 | ) | ||||
| Total cumulative foreign currency translation adjustments, net of tax | $ | 40 | $ | (26 | ) | |||
| 215 | |
| Year�Ended�December�31, | ||||||||
| 2010 | 2009 | |||||||
| (dollars�in�millions) | ||||||||
| Net income applicable to Morgan Stanley | $ | 4,703 | $ | 1,346 | ||||
| Transfers from the noncontrolling interests: | ||||||||
| Increase in paid-in capital in connection with MSSB | � | 1,711 | ||||||
| Increase in paid-in capital in connection with the MUFG Transaction (see Note�24) | 731 | � | ||||||
| Net transfers from noncontrolling interests | 731 | 1,711 | ||||||
| Change from net income applicable to Morgan Stanley and transfers from noncontrolling interests | $ | 5,434 | $ | 3,057 | ||||
| | 216 |
| 2010 | 2009 | Fiscal 2008 | One Month Ended December�31, 2008 | |||||||||||||
| Basic EPS: | ||||||||||||||||
| Income (loss) from continuing operations | $ | 5,463 | $ | 1,324 | $ | 1,238 | $ | (1,269 | ) | |||||||
| Net gain (loss) from discontinued operations | 239 | 82 | 540 | (16 | ) | |||||||||||
| Net income (loss) | 5,702 | 1,406 | 1,778 | (1,285 | ) | |||||||||||
| Net income applicable to noncontrolling interests | 999 | 60 | 71 | 3 | ||||||||||||
| Net income (loss) applicable to Morgan Stanley | 4,703 | 1,346 | 1,707 | (1,288 | ) | |||||||||||
| Less: Preferred dividends (Series A Preferred Stock) | (45 | ) | (45 | ) | (53 | ) | (15 | ) | ||||||||
| Less: Preferred dividends (Series B Preferred Stock) | (784 | ) | (784 | ) | � | (200 | ) | |||||||||
| Less: Preferred dividends (Series C Preferred Stock) | (52 | ) | (68 | ) | � | (30 | ) | |||||||||
| Less: Partial redemption of Series C Preferred Stock | � | (202 | ) | � | � | |||||||||||
| Less: Preferred dividends (Series D Preferred Stock) | � | (212 | ) | (44 | ) | (63 | ) | |||||||||
| Less: Amortization�and acceleration of�issuance�discount for Series D�Preferred�Stock(1) | � | (932 | ) | (15 | ) | (13 | ) | |||||||||
| Less: Allocation of earnings to participating RSUs(2): | ||||||||||||||||
| From continuing operations | (108 | ) | (10 | ) | (69 | ) | (15 | ) | ||||||||
| From discontinued operations | (7 | ) | � | (25 | ) | � | ||||||||||
| Less: Allocation of undistributed earnings to Equity Units(1): | ||||||||||||||||
| From continuing operations | (101 | ) | � | (6 | ) | � | ||||||||||
| From discontinued operations | (12 | ) | � | � | � | |||||||||||
| Earnings (loss) applicable to Morgan Stanley common shareholders | $ | 3,594 | $ | (907 | ) | $ | 1,495 | $ | (1,624 | ) | ||||||
| Weighted average common shares outstanding | 1,362 | 1,185 | 1,028 | 1,002 | ||||||||||||
| Earnings (loss) per basic common share: | ||||||||||||||||
| Income (loss) from continuing operations | $ | 2.48 | $ | (0.82 | ) | $ | 1.00 | $ | (1.60 | ) | ||||||
| Net gain (loss) from discontinued operations | 0.16 | 0.05 | 0.45 | (0.02 | ) | |||||||||||
| Earnings (loss) per basic common share | $ | 2.64 | $ | (0.77 | ) | $ | 1.45 | $ | (1.62 | ) | ||||||
| Diluted EPS: | ||||||||||||||||
| Earnings (loss) applicable to Morgan Stanley common shareholders | $ | 3,594 | $ | (907 | ) | $ | 1,495 | $ | (1,624 | ) | ||||||
| Impact on income of assumed conversions: | ||||||||||||||||
| Assumed conversions of Equity Units(1)(3) | ||||||||||||||||
| From continuing operations | 75 | � | � | � | ||||||||||||
| 217 | |
| 2010 | 2009 | Fiscal 2008 | One Month Ended December�31, 2008 | |||||||||||||
| From discontinued operations | 41 | � | � | � | ||||||||||||
| Earnings (loss) applicable to common shareholders plus assumed conversions | 3,710 | (907 | ) | 1,495 | (1,624 | ) | ||||||||||
| Weighted average common shares outstanding | 1,362 | 1,185 | 1,028 | 1,002 | ||||||||||||
| Effect of dilutive securities: | ||||||||||||||||
| Stock options and RSUs(2) | 5 | � | 3 | � | ||||||||||||
| Equity Units(1)(3) | 44 | � | � | � | ||||||||||||
| Series B Preferred Stock | � | � | 42 | � | ||||||||||||
| Weighted average common shares outstanding and common stock equivalents | 1,411 | 1,185 | 1,073 | 1,002 | ||||||||||||
| Earnings (loss) per diluted common share: | ||||||||||||||||
| Income (loss) from continuing operations | $ | 2.44 | $ | (0.82 | ) | $ | 0.95 | $ | (1.60 | ) | ||||||
| Net gain (loss) from discontinued operations | 0.19 | 0.05 | 0.44 | (0.02 | ) | |||||||||||
| Earnings (loss) per diluted common share | $ | 2.63 | $ | (0.77 | ) | $ | 1.39 | $ | (1.62 | ) | ||||||
| (1) | See Note 15 for further information on Equity Units. |
| (2) | RSUs that are considered participating securities participate in all of the earnings of the Company in the computation of basic EPS, and therefore, such RSUs are not included as incremental shares in the diluted calculation. |
| (3) | Prior to the quarter ended June�30, 2010, the Company included the Equity Units in the diluted EPS calculation using the more dilutive of the two-class method or the treasury stock method.�The Equity Units participated in substantially all of the earnings of the Company ( i.e. , any earnings above $0.27 per quarter) in basic EPS (assuming a full distribution of earnings of the Company), and therefore, the Equity Units generally would not have been included as incremental shares in the diluted calculation under the treasury stock method.�Beginning in the quarter ended June�30, 2010, and prior to the redemption of the junior subordinated debentures underlying the Equity Units and issuance of common stock in the third quarter of 2010, the Company included the Equity Units in the diluted EPS calculation using the more dilutive of the two-class method or the if-converted method. See Note 2 on the Company�s method for calculating EPS. |
| Number of Antidilutive Securities Outstanding at End of Period: | 2010 | 2009 | Fiscal 2008 | One Month Ended December�31, 2008 | ||||||||||||
| (shares in millions) | ||||||||||||||||
| RSUs and PSUs | 38 | 62 | 50 | 72 | ||||||||||||
| Stock options | 67 | 82 | 81 | 99 | ||||||||||||
| Equity Units(1) | � | 116 | 116 | 116 | ||||||||||||
| Warrant issued to U.S. Treasury | � | � | 65 | 65 | ||||||||||||
| Series B Preferred Stock | 311 | 311 | � | 311 | ||||||||||||
| Total | 416 | 571 | 312 | 663 | ||||||||||||
| (1) | See Note 2 and Note 15 for additional information on the Equity Units regarding the change in methodology to the if-converted method and the redemption of the junior subordinated debentures underlying the Equity Units and issuance of common stock. |
| | 218 |
| 2010 | 2009 | Fiscal 2008(1) | One Month Ended�December�31, 2008 | |||||||||||||
| (dollars�in�millions) | ||||||||||||||||
| Interest income(2): | ||||||||||||||||
| Financial instruments owned(3) | $ | 3,931 | $ | 4,931 | $ | 9,217 | $ | 395 | ||||||||
| Securities available for sale | 215 | � | � | � | ||||||||||||
| Loans | 315 | 229 | 784 | 15 | ||||||||||||
| Interest bearing deposits with banks | 155 | 241 | � | 19 | ||||||||||||
| Federal funds sold and securities purchased under agreements to resell and Securities borrowed | 769 | 859 | � | 380 | ||||||||||||
| Other | 1,893 | 1,217 | 28,930 | 280 | ||||||||||||
| Total Interest income | $ | 7,278 | $ | 7,477 | $ | 38,931 | $ | 1,089 | ||||||||
| Interest expense(2): | ||||||||||||||||
| Commercial paper and other short-term borrowings | $ | 28 | $ | 51 | $ | 663 | $ | 33 | ||||||||
| Deposits | 310 | 782 | 740 | 53 | ||||||||||||
| Long-term debt | 4,592 | 4,898 | 7,793 | 579 | ||||||||||||
| Securities sold under agreements to repurchase and Securities loaned | 1,591 | 1,374 | � | 355 | ||||||||||||
| Other | (107 | ) | (400 | ) | 27,067 | 120 | ||||||||||
| Total Interest expense | $ | 6,414 | $ | 6,705 | $ | 36,263 | $ | 1,140 | ||||||||
| Net interest | $ | 864 | $ | 772 | $ | 2,668 | $ | (51 | ) | |||||||
| (1) | The Company considers its principal trading, investment banking, commissions, and interest income, along with the associated interest expense, as one integrated activity, and therefore, prior to December 2008, was unable to further breakout Interest income and Interest expense (see Note 1). |
| (2) | Interest income and expense are recorded within the consolidated statements of income depending on the nature of the instrument and related market conventions. When interest is included as a component of the instrument�s fair value, interest is included within Principal transactions�Trading revenues or Principal transactions�Investment revenues. Otherwise, it is included within Interest income or Interest expense. |
| (3) | Interest expense on Financial instruments sold, not yet purchased is reported as a reduction to Interest income. |
| 219 | |
| 2010 | 2009 | Fiscal 2008 | One Month Ended December�31, 2008 | |||||||||||||
| (dollars in millions) | ||||||||||||||||
| Gain on China International Capital Corporation Limited (see Note 24) | $ | 668 | $ | � | $ | � | $ | � | ||||||||
| Gain on sale of Invesco shares (see Note 1) | 102 | � | � | � | ||||||||||||
| FrontPoint impairment charges (see Note 28) | (126 | ) | � | � | � | |||||||||||
| Gain on repurchase of long-term debt (see Note 11) | � | 491 | 2,252 | 73 | ||||||||||||
| Morgan Stanley Wealth Management S.V., S.A.U.(1) | � | � | 743 | � | ||||||||||||
| Other | 857 | 346 | 856 | 36 | ||||||||||||
| Total | $ | 1,501 | $ | 837 | $ | 3,851 | $ | 109 | ||||||||
| (1) | In the second quarter of fiscal 2008, the Company sold Morgan Stanley Wealth Management S.V., S.A.U. (�MSWM S.V.�), its Spanish onshore mass affluent wealth management business. The results of MSWM S.V. are included within the Global Wealth Management Group business segment through the date of sale. |
| | 220 |
| 2010 | 2009 | Fiscal 2008 | One�
Month Ended December� 31, 2008 | |||||||||||||
| (dollars�in�millions) | ||||||||||||||||
| Deferred stock | $ | 1,075 | $ | 1,120 | $ | 1,659 | $ | 66 | ||||||||
| Stock options | 1 | 17 | 83 | 5 | ||||||||||||
| Performance-based stock units | 39 | � | � | � | ||||||||||||
| Employee Stock Purchase Plan(1) | � | 4 | 10 | � | ||||||||||||
| Total(2) | $ | 1,115 | $ | 1,141 | $ | 1,752 | $ | 71 | ||||||||
| (1) | The Company discontinued the Employee Stock Purchase Plan effective June�1, 2009. |
| (2) | Amounts for 2010, 2009 and fiscal 2008 include $222 million, $198 million and $90 million, respectively, primarily related to equity awards that were granted in 2011, 2010 and December 2008, respectively, to employees who are retirement-eligible under the award terms. Amounts for the one month ended December�31, 2008 include $2 million primarily related to equity awards that were granted in 2010 to employees who are retirement-eligible under the award terms. |
| 221 | |
| 2010 | ||||||||
| Number�of Shares | Weighted�Average Grant Date Fair Value | |||||||
| RSUs at beginning of period | 100 | $ | 40.88 | |||||
| Granted | 49 | 28.95 | ||||||
| Conversions to common stock | (33 | ) | 53.95 | |||||
| Canceled | (7 | ) | 30.48 | |||||
| RSUs at end of period(1) | 109 | $ | 32.10 | |||||
| (1) | At December�31, 2010, approximately 99�million RSUs with a weighted average grant date fair value of $32.62 were vested or expected to vest. |
| 2010 | ||||||||
| Number�of Shares | Weighted�Average Grant Date Fair Value | |||||||
| Unvested RSUs at beginning of period | 62 | $ | 37.78 | |||||
| Granted | 49 | 28.95 | ||||||
| Vested | (28 | ) | 43.75 | |||||
| Canceled | (7 | ) | 30.34 | |||||
| Unvested RSUs at end of period(1) | 76 | $ | 30.29 | |||||
| (1) | Unvested RSUs represent awards where recipients have yet to satisfy either the explicit vesting terms or retirement-eligibility requirements. At December�31, 2010, approximately 66�million unvested RSUs with a weighted average grant date fair value of $30.81 were expected to vest. |
| | 222 |
| 2010 | ||||||||
| Number�of Options | Weighted Average Exercise�Price | |||||||
| Options outstanding at beginning of period | 82 | $ | 51.29 | |||||
| Canceled | (15 | ) | $ | 55.52 | ||||
| Options outstanding at end of period(1) | 67 | $ | 50.35 | |||||
| Options exercisable at end of period | 67 | $ | 50.28 | |||||
| (1) | At December�31, 2010, 67�million awards with a weighted average exercise price of $50.32 were vested or expected to vest. |
| At December�31, 2010 | Options Outstanding | Options Exercisable | ||||||||||||||||||||||
| Range of Exercise Prices | Number Outstanding | Weighted�Average Exercise Price | Average Remaining�Life (Years) | Number Exercisable | Weighted�Average Exercise Price | Average Remaining Life� (Years) | ||||||||||||||||||
| $28.00 � $39.99 | 11 | $ | 36.22 | 2.0 | 11 | $ | 36.22 | 2.0 | ||||||||||||||||
| $40.00 � $49.99 | 33 | 47.26 | 2.3 | 33 | 47.26 | 2.3 | ||||||||||||||||||
| $50.00 � $59.99 | 11 | 55.45 | 0.3 | 11 | 55.45 | 0.3 | ||||||||||||||||||
| $60.00 � $76.99 | 12 | 66.72 | 5.9 | 12 | 66.72 | 5.8 | ||||||||||||||||||
| Total | 67 | 67 | ||||||||||||||||||||||
| 223 | |
| Grant Year | Risk-Free�Interest Rate | Expected�Stock Price Volatility | Expected�Dividend Yield | |||||||||
| 2010 | 1.5 | % | 89.9 | % | 0.7 | % | ||||||
| | 224 |
| Pensions | Postretirement | |||||||||||||||||||||||||||||||
| 2010 | 2009 | Fiscal 2008 | One�
Month Ended December� 31, 2008 | 2010 | 2009 | Fiscal 2008 | One�
Month Ended December� 31, 2008 | |||||||||||||||||||||||||
| (dollars�in�millions) | ||||||||||||||||||||||||||||||||
| Service cost, benefits earned during the period | $ | 99 | $ | 116 | $ | 102 | $ | 8 | $ | 7 | $ | 12 | $ | 8 | $ | 1 | ||||||||||||||||
| Interest cost on projected benefit obligation | 152 | 152 | 135 | 12 | 11 | 12 | 10 | 1 | ||||||||||||||||||||||||
| Expected return on plan assets | (128 | ) | (125 | ) | (128 | ) | (10 | ) | � | � | � | � | ||||||||||||||||||||
| Net amortization of prior service credits | (4 | ) | (9 | ) | (8 | ) | (1 | ) | (3 | ) | (1 | ) | (2 | ) | � | |||||||||||||||||
| Net amortization of actuarial loss | 24 | 41 | 31 | � | 1 | 3 | 1 | � | ||||||||||||||||||||||||
| Curtailment gain | (50 | ) | � | � | � | (4 | ) | � | � | � | ||||||||||||||||||||||
| Settlement loss | 3 | � | � | � | � | � | � | � | ||||||||||||||||||||||||
| Net periodic benefit expense | $ | 96 | $ | 175 | $ | 132 | $ | 9 | $ | 12 | $ | 26 | $ | 17 | $ | 2 | ||||||||||||||||
| 225 | |
| Pension | Postretirement | |||||||||||||||||||||||||||||||
| 2010 | 2009 | Fiscal 2008 | One�Month Ended December�31, 2008 | 2010 | 2009 | Fiscal 2008 | One�Month Ended December�31, 2008 | |||||||||||||||||||||||||
| (dollars�in�millions) | ||||||||||||||||||||||||||||||||
| Net loss (gain) | $ | 34 | $ | 509 | $ | (330 | ) | $ | 282 | $ | 2 | $ | (25 | ) | $ | (11 | ) | $ | 50 | |||||||||||||
| Prior service credit | � | (16 | ) | � | � | (54 | ) | � | � | � | ||||||||||||||||||||||
| Amortization of prior service credit | 54 | 9 | 8 | 1 | 7 | 1 | 2 | � | ||||||||||||||||||||||||
| Amortization of net loss | (27 | ) | (41 | ) | (31 | ) | � | (1 | ) | (3 | ) | (1 | ) | � | ||||||||||||||||||
| Total recognized in other comprehensive loss (income) | $ | 61 | $ | 461 | $ | (353 | ) | $ | 283 | $ | (46 | ) | $ | (27 | ) | $ | (10 | ) | $ | 50 | ||||||||||||
| Pensions | Postretirement | |||||||||||||||||||||||||||||||
| 2010 | 2009 | Fiscal 2008 | One�
Month Ended December� 31, 2008 | 2010 | 2009 | Fiscal 2008 | One�
Month Ended December� 31, 2008 | |||||||||||||||||||||||||
| Discount rate | 5.91 | % | 5.75 | % | 6.17 | % | 7.23 | % | 6.00%/5.35% | 5.78 | % | 6.34 | % | 7.47 | % | |||||||||||||||||
| Expected long-term rate of return on plan assets | 4.78 | 5.21 | 6.46 | 5.17 | N/A | N/A | N/A | N/A | ||||||||||||||||||||||||
| Rate of future compensation increases | 5.13 | 5.12 | 5.08 | 5.09 | N/A | N/A | N/A | N/A | ||||||||||||||||||||||||
| | 226 |
| Pension | Postretirement | |||||||
| (dollars�in�millions) | ||||||||
| Reconciliation of benefit obligation: | ||||||||
| Benefit obligation at December�31, 2008 | $ | 2,658 | $ | 215 | ||||
| Service cost(1) | 117 | 12 | ||||||
| Interest cost | 152 | 12 | ||||||
| Actuarial gain | (154 | ) | (25 | ) | ||||
| Plan amendments | (16 | ) | � | |||||
| Plan settlements | (2 | ) | � | |||||
| Benefits paid | (172 | ) | (11 | ) | ||||
| Transfers/divestitures(2) | 25 | � | ||||||
| Other, including foreign currency exchange rate changes | 22 | � | ||||||
| Benefit obligation at December�31, 2009 | $ | 2,630 | $ | 203 | ||||
| Service cost | 99 | 7 | ||||||
| Interest cost | 152 | 11 | ||||||
| Actuarial loss(3) | 264 | 2 | ||||||
| Plan amendments | (1 | ) | (54 | ) | ||||
| Plan curtailments | (82 | ) | � | |||||
| Plan settlements | (11 | ) | � | |||||
| Benefits paid | (100 | ) | (14 | ) | ||||
| Other, including foreign currency exchange rate changes | 2 | � | ||||||
| Benefit obligation at December�31, 2010 | $ | 2,953 | $ | 155 | ||||
| Reconciliation of fair value of plan assets: | ||||||||
| Fair value of plan assets at December�31, 2008 | $ | 2,739 | $ | � | ||||
| Actual return on plan assets | (538 | ) | � | |||||
| Employer contributions | 321 | 11 | ||||||
| Benefits paid | (172 | ) | (11 | ) | ||||
| Plan settlements | (2 | ) | � | |||||
| Transfers/divestitures(3) | 35 | � | ||||||
| Other, including foreign currency exchange rate changes | 23 | � | ||||||
| Fair value of plan assets at December�31, 2009 | $ | 2,406 | $ | � | ||||
| Actual return on plan assets | 276 | � | ||||||
| Employer contributions | 72 | 14 | ||||||
| Benefits paid | (100 | ) | (14 | ) | ||||
| Plan settlements | (11 | ) | � | |||||
| Other, including foreign currency exchange rate changes | (1 | ) | � | |||||
| Fair value of plan assets at December�31, 2010 | $ | 2,642 | $ | � | ||||
| (1) | Pension amounts included in discontinued operations were $1 million. |
| (2) | Transfers and divestitures primarily related to the impact of MSCI and the formation of MSSB. |
| (3) | Change in actuarial loss under benefit obligation is primarily attributed to a decrease in the discount rates at December�31, 2010. |
| 227 | |
| Pension | Postretirement | |||||||||||||||
| December�31, 2010 | December�31, 2009 | December�31, 2010 | December�31, 2009 | |||||||||||||
| (dollars�in�millions) | ||||||||||||||||
| Funded status: | ||||||||||||||||
| Unfunded status | $ | (311 | ) | $ | (224 | ) | $ | (155 | ) | $ | (203 | ) | ||||
| Amounts recognized in the consolidated statements of financial condition consist of: | ||||||||||||||||
| Assets | $ | 54 | $ | 107 | $ | � | $ | � | ||||||||
| Liabilities | (365 | ) | (331 | ) | (155 | ) | (203 | ) | ||||||||
| Net amount recognized | $ | (311 | ) | $ | (224 | ) | $ | (155 | ) | $ | (203 | ) | ||||
| Amounts recognized in accumulated other comprehensive loss consist of: | ||||||||||||||||
| Prior service credit | $ | (7 | ) | $ | (61 | ) | $ | (52 | ) | $ | (5 | ) | ||||
| Net loss | 851 | 844 | 34 | 33 | ||||||||||||
| Net loss (gain) recognized | $ | 844 | $ | 783 | $ | (18 | ) | $ | 28 | |||||||
| December�31, 2010 | December�31, 2009 | |||||||
| (dollars�in�millions) | ||||||||
| Projected benefit obligation | $ | 498 | $ | 385 | ||||
| Fair value of plan assets | 133 | 54 | ||||||
| December�31, 2010 | December�31, 2009 | |||||||
| (dollars�in�millions) | ||||||||
| Accumulated benefit obligation | $ | 400 | $ | 346 | ||||
| Fair value of plan assets | 72 | 45 | ||||||
| | 228 |
| Pension | Postretirement | |||||||||||||||
| December�31, 2010 | December�31, 2009 | December�31, 2010 | December�31, 2009 | |||||||||||||
| Discount rate | 5.44 | % | 5.91 | % | 5.41 | % | 6.00 | % | ||||||||
| Rate of future compensation increase | 2.43 | 5.13 | N/A | N/A | ||||||||||||
| December�31,�2010 | December�31,�2009 | |||||||
| Health care cost trend rate assumed for next year: | ||||||||
| Medical | 6.98%-7.84% | 7.00%-8.00% | ||||||
| Prescription | 9.53% | 10.00% | ||||||
| Rate to which the cost trend rate is assumed to decline (ultimate trend rate) | 4.50% | 4.50% | ||||||
| Year that the rate reaches the ultimate trend rate | 2029 | 2029 | ||||||
| One-Percentage Point Increase | One-Percentage Point (Decrease) | |||||||
| (dollars�in�millions) | ||||||||
| Effect on total postretirement service and interest cost | $ | 2 | $ | (1 | ) | |||
| Effect on postretirement benefit obligation | 19 | (16 | ) | |||||
| 229 | |
| � | Derivatives may be used only if they are deemed by the investment manager to be more attractive than a similar direct investment in the underlying cash market or if the vehicle is being used to manage risk of the portfolio. |
| � | Derivatives may not be used in a speculative manner or to leverage the portfolio under any circumstances. |
| � | Derivatives may not be used as short-term trading vehicles. The investment philosophy of the U.S. Qualified Plan is that investment activity is undertaken for long-term investment rather than short-term trading. |
| � | Derivatives may only be used in the management of the U.S. Qualified Plan�s portfolio when their possible effects can be quantified, shown to enhance the risk-return profile of the portfolio, and reported in a meaningful and understandable manner. |
| | 230 |
| Quoted�Prices�in Active�Markets�for Identical Assets (Level 1) | Significant Observable�Inputs (Level 2) | Significant Unobservable Inputs�(Level�3) | Total | |||||||||||||
| (dollars�in�millions) | ||||||||||||||||
| Assets: | ||||||||||||||||
| Investments: | ||||||||||||||||
| Cash and cash equivalents(1) | $ | 10 | $ | � | $ | � | $ | 10 | ||||||||
| U.S. government and agency securities: | ||||||||||||||||
| U.S. Treasury securities | 822 | � | � | 822 | ||||||||||||
| U.S. agency securities | 367 | 28 | � | 395 | ||||||||||||
| Total U.S. government and agency securities | 1,189 | 28 | � | 1,217 | ||||||||||||
| Other sovereign government obligations | 27 | 7 | � | 34 | ||||||||||||
| Corporate and other debt: | ||||||||||||||||
| State and municipal securities | � | 12 | � | 12 | ||||||||||||
| Asset-backed securities | � | 4 | � | 4 | ||||||||||||
| Corporate bonds | � | 392 | � | 392 | ||||||||||||
| Collateralized debt obligations | � | 13 | � | 13 | ||||||||||||
| Total corporate and other debt | � | 421 | � | 421 | ||||||||||||
| Corporate equities | 6 | � | � | 6 | ||||||||||||
| Derivative and other contracts(2) | � | 71 | � | 71 | ||||||||||||
| Derivative-related cash collateral | � | 98 | � | 98 | ||||||||||||
| Commingled trust funds(3) | � | 677 | � | 677 | ||||||||||||
| Foreign funds(4) | � | 206 | � | 206 | ||||||||||||
| Other investments | � | 25 | 23 | 48 | ||||||||||||
| Total investments | 1,232 | 1,533 | 23 | 2,788 | ||||||||||||
| Receivables: | ||||||||||||||||
| Securities purchased under agreements to resell(1) | � | 68 | � | 68 | ||||||||||||
| Other receivables(1) | � | 12 | � | 12 | ||||||||||||
| Total receivables | � | 80 | � | 80 | ||||||||||||
| Total assets | $ | 1,232 | $ | 1,613 | $ | 23 | $ | 2,868 | ||||||||
| Liabilities: | ||||||||||||||||
| Derivative and other contracts(5) | $ | 1 | $ | 156 | $ | � | $ | 157 | ||||||||
| Other liabilities(1) | � | 69 | � | 69 | ||||||||||||
| Total liabilities | 1 | 225 | � | 226 | ||||||||||||
| Net pension assets | $ | 1,231 | $ | 1,388 | $ | 23 | $ | 2,642 | ||||||||
| 231 | |
| (1) | Cash and cash equivalents, securities purchased under agreements to resell, other receivables and other liabilities are valued at cost, which approximates fair value. |
| (2) | Derivative and other contracts in an asset position include investments in interest rate swaps of $71 million. |
| (3) | Commingled trust funds include investments in cash funds and fixed income funds of $58 million and $619 million, respectively. |
| (4) | Foreign funds include investments in equity funds, bond funds and targeted cash flow funds of $19 million, $92 million and $95 million, respectively. |
| (5) | Derivative and other contracts in a liability position include investments in listed derivatives and interest rate swaps of $1 million and $156 million, respectively. |
| Quoted�Prices�in Active�Markets�for Identical Assets (Level 1) | Significant Observable�Inputs (Level 2) | Significant Unobservable Inputs�(Level�3) | Total | |||||||||||||
| (dollars�in�millions) | ||||||||||||||||
| Assets: | ||||||||||||||||
| Investments: | ||||||||||||||||
| Cash and cash equivalents(1) | $ | 9 | $ | � | $ | � | $ | 9 | ||||||||
| U.S. government and agency securities: | ||||||||||||||||
| U.S. Treasury securities | 720 | � | � | 720 | ||||||||||||
| U.S. agency securities | 12 | 318 | � | 330 | ||||||||||||
| Total U.S. government and agency securities | 732 | 318 | � | 1,050 | ||||||||||||
| Other sovereign government obligations | 10 | 7 | � | 17 | ||||||||||||
| Corporate and other debt: | ||||||||||||||||
| State and municipal securities | � | 5 | � | 5 | ||||||||||||
| Asset-backed securities | � | 6 | � | 6 | ||||||||||||
| Corporate bonds | � | 419 | � | 419 | ||||||||||||
| Collateralized debt obligations | � | 12 | � | 12 | ||||||||||||
| Total corporate and other debt | � | 442 | � | 442 | ||||||||||||
| Corporate equities | 44 | � | � | 44 | ||||||||||||
| Derivative and other contracts(2) | 2 | 32 | � | 34 | ||||||||||||
| Derivative-related cash collateral | � | 103 | � | 103 | ||||||||||||
| Commingled trust funds(3) | � | 647 | 12 | 659 | ||||||||||||
| Foreign funds(4) | � | 184 | � | 184 | ||||||||||||
| Other investments | � | 10 | 2 | 12 | ||||||||||||
| Total investments | 797 | 1,743 | 14 | 2,554 | ||||||||||||
| Receivables: | ||||||||||||||||
| Securities purchased under agreements to resell(1) | � | 29 | � | 29 | ||||||||||||
| Other receivables(1) | � | 43 | � | 43 | ||||||||||||
| Total receivables | � | 72 | � | 72 | ||||||||||||
| Total assets | $ | 797 | $ | 1,815 | $ | 14 | $ | 2,626 | ||||||||
| Liabilities: | ||||||||||||||||
| Derivative and other contracts(5) | $ | 15 | $ | 160 | $ | � | $ | 175 | ||||||||
| Other liabilities(1) | � | 45 | � | 45 | ||||||||||||
| Total liabilities | 15 | 205 | � | 220 | ||||||||||||
| Net pension assets | $ | 782 | $ | 1,610 | $ | 14 | $ | 2,406 | ||||||||
| | 232 |
| (1) | Cash and cash equivalents, securities purchased under agreements to resell, other receivables and other liabilities are valued at cost, which approximates fair value. |
| (2) | Derivative and other contracts in an asset position include investments in futures contracts and interest rate swaps of $2 million and $32 million, respectively. |
| (3) | Commingled trust funds include investments in cash funds, fixed income funds and equity funds of $74 million, $573 million and $12 million, respectively. |
| (4) | Foreign funds include investments in equity funds, bond funds and targeted cash flow funds of $15 million, $81 million and $88 million, respectively. |
| (5) | Derivative and other contracts in a liability position include investments in listed derivatives and interest rate swaps of $15 million and $160 million, respectively. |
| Beginning Balance at January�1, 2010 | Actual Return� on Plan Assets Related to Assets Still Held at December�31, 2010 | Actual Return on� Plan Assets�Related to Assets Sold during 2010 | Purchases, Sales, Other Settlements and Issuance, net | Net Transfers In�and/or� (Out) of Level 3 | Ending Balance at�December� 31, 2010 | |||||||||||||||||||
| (dollars�in�millions) | ||||||||||||||||||||||||
| Investments | ||||||||||||||||||||||||
| Commingled�trust funds | $ | 12 | $ | � | $ | � | $ | (12 | ) | $ | � | $ | � | |||||||||||
| Other�investments | 2 | � | � | 21 | � | 23 | ||||||||||||||||||
| Total investments | $ | 14 | $ | � | $ | � | $ | 9 | $ | � | $ | 23 | ||||||||||||
| Beginning Balance at January�1, 2009 | Actual Return�on Plan� Assets Related to Assets Still Held at December�31, 2009 | Actual Return on�Plan� Assets Related to Assets Sold during 2009 | Purchases, Sales, Other Settlements�and Issuance, net | Net�Transfers In�and/or�(Out) of Level 3 | Ending Balance at�December� 31, 2009 | |||||||||||||||||||
| (dollars�in�millions) | ||||||||||||||||||||||||
| Investments | ||||||||||||||||||||||||
| Commingled trust funds(1) | $ | 792 | $ | (195 | ) | $ | 19 | $ | 43 | $ | (647 | ) | $ | 12 | ||||||||||
| Other investments | 2 | � | � | � | � | 2 | ||||||||||||||||||
| Total investments | $ | 794 | $ | (195 | ) | $ | 19 | $ | 43 | $ | (647 | ) | $ | 14 | ||||||||||
| (1) | Net transfers out represents reclassification of commingled trust funds from Level 3 to Level 2 based on current accounting guidance for investments that are readily redeemable at their NAV. |
| 233 | |
| Pension | Postretirement | |||||||
| (dollars�in�millions) | ||||||||
| 2011 | $ | 114 | $ | 9 | ||||
| 2012 | 116 | 9 | ||||||
| 2013 | 118 | 9 | ||||||
| 2014 | 122 | 9 | ||||||
| 2015 | 123 | 9 | ||||||
| 2016�2020 | 672 | 49 | ||||||
| | 234 |
| 2010 | 2009 | Fiscal 2008 | One�Month�Ended December�31, 2008 | |||||||||||||
| (dollars�in�millions) | ||||||||||||||||
| Current: | ||||||||||||||||
| U.S. federal | $ | 213 | $ | 160 | $ | 445 | $ | 42 | ||||||||
| U.S. state and local | 162 | 45 | 78 | 8 | ||||||||||||
| Non-U.S. | 850 | 340 | 1,182 | 12 | ||||||||||||
| $ | 1,225 | $ | 545 | $ | 1,705 | $ | 62 | |||||||||
| Deferred: | ||||||||||||||||
| U.S. federal | $ | (863 | ) | $ | (455 | ) | $ | (1,396 | ) | $ | (670 | ) | ||||
| U.S. state and local | 340 | (360 | ) | (106 | ) | 31 | ||||||||||
| Non-U.S. | 37 | (71 | ) | (187 | ) | (148 | ) | |||||||||
| $ | (486 | ) | $ | (886 | ) | $ | (1,689 | ) | $ | (787 | ) | |||||
| Provision for (benefit from) income taxes from continuing operations | $ | 739 | $ | (341 | ) | $ | 16 | $ | (725 | ) | ||||||
| Provision for (benefit from) income taxes from discontinuing operations | $ | 367 | $ | (49 | ) | $ | 464 | $ | 2 | |||||||
| 2010 | 2009 | Fiscal 2008 | One Month Ended�December�31, 2008 | |||||||||||||
| U.S. federal statutory income tax rate | 35.0 | % | 35.0 | % | 35.0 | % | 35.0 | % | ||||||||
| U.S. state and local income taxes, net of U.S. federal income tax benefits | 6.1 | (21.0 | ) | (1.4 | ) | (1.3 | ) | |||||||||
| Lower tax rates applicable to non-U.S. earnings | (19.8 | ) | (26.7 | ) | (20.2 | ) | 1.2 | |||||||||
| Domestic tax credits | (3.6 | ) | (19.6 | ) | (18.0 | ) | 1.5 | |||||||||
| Tax exempt income | (1.7 | ) | (6.0 | ) | (14.3 | ) | 0.2 | |||||||||
| Goodwill | � | � | 18.4 | � | ||||||||||||
| Other | (4.1 | ) | 3.6 | 1.8 | (0.2 | ) | ||||||||||
| Effective income tax rate(1) | 11.9 | % | (34.7 | )% | 1.3 | % | 36.4 | % | ||||||||
| (1) | Results for 2010 included tax benefits of $382 million related to the reversal of U.S. deferred tax liabilities associated with prior-years� undistributed earnings of certain non-U.S. subsidiaries that were determined to be indefinitely reinvested abroad, $345 million associated with the remeasurement of net unrecognized tax benefits and related interest based on new information regarding the status of federal and state examinations, and $277 million associated with the planned repatriation of non-U.S. earnings at a cost lower than originally estimated. Excluding the benefits noted above, the effective tax rate from continuing operations in 2010 would have been 28%. The effective tax rate for 2009 includes a tax benefit of $331 million resulting from the cost of anticipated repatriation of non-U.S. earnings at lower than previously estimated tax rates. Excluding this benefit, the annual effective tax rate from continuing operations for 2009 would have been a benefit of 1%. |
| 235 | |
| December�31,�2010 | December�31,�2009 | |||||||
| (dollars�in�millions) | ||||||||
| Deferred tax assets: | ||||||||
| Tax credits and loss carryforward | $ | 6,219 | $ | 5,124 | ||||
| Employee compensation and benefit plans | 2,887 | 3,312 | ||||||
| Valuation and liability allowances | 331 | 378 | ||||||
| Valuation of inventory, investments and receivables | 205 | � | ||||||
| Deferred expenses | 54 | 52 | ||||||
| Other | 316 | 412 | ||||||
| Total deferred tax assets | 10,012 | 9,278 | ||||||
| Valuation allowance(1) | 655 | 105 | ||||||
| Deferred tax assets after valuation allowance | $ | 9,357 | $ | 9,173 | ||||
| Deferred tax liabilities: | ||||||||
| Non-U.S. operations | $ | 1,349 | $ | 635 | ||||
| Fixed assets | 180 | 322 | ||||||
| Prepaid commissions | 16 | 14 | ||||||
| Valuation of inventory, investments and receivables | � | 587 | ||||||
| Total deferred tax liabilities | $ | 1,545 | $ | 1,558 | ||||
| Net deferred tax assets | $ | 7,812 | $ | 7,615 | ||||
| (1) | The valuation allowance reduces the benefit of certain separate Company federal, state and foreign net operating loss carryforwards and book writedowns to the amount that will more likely than not be realized. |
| | 236 |
| 2010 | 2009 | Fiscal�2008 | One�Month�Ended December�31,�2008 | |||||||||||||
| (dollars in millions) | ||||||||||||||||
| U.S. | $ | 3,550 | $ | (1,451 | ) | $ | (2,862 | ) | $ | (1,119 | ) | |||||
| Non-U.S.(1) | 2,652 | 2,434 | 4,116 | (875 | ) | |||||||||||
| $ | 6,202 | $ | 983 | $ | 1,254 | $ | (1,994 | ) | ||||||||
| (1) | Non-U.S. income is defined as income generated from operations located outside the U.S. |
| 237 | |
| Unrecognized Tax Benefits | ||||
| Balance at December�31, 2008 | $ | 3,466 | ||
| Increase based on tax positions related to the current period | 688 | |||
| Increase based on tax positions related to prior periods | 33 | |||
| Decreases based on tax positions related to prior periods | (74 | ) | ||
| Decreases related to a lapse of applicable statute of limitations | (61 | ) | ||
| Balance at December�31, 2009 | $ | 4,052 | ||
| Increase based on tax positions related to the current period | 478 | |||
| Increase based on tax positions related to prior periods | 479 | |||
| Decreases based on tax positions related to prior periods | (881 | ) | ||
| Decreases related to settlements with taxing authorities | (356 | ) | ||
| Decreases related to a lapse of applicable statute of limitations | (61 | ) | ||
| Balance at December�31, 2010 | $ | 3,711 | ||
| | 238 |
| Jurisdiction | Tax�Year | |||
| United States | 1999 | |||
| New York State and City | 2007 | |||
| Hong Kong | 2004 | |||
| U.K. | 2007 | |||
| Japan | 2007 | |||
| 239 | |
| 2010 | Institutional Securities | Global�Wealth Management Group | Asset Management | Discover | Intersegment Eliminations | Total | ||||||||||||||||||
| (dollars in millions) | ||||||||||||||||||||||||
| Total non-interest revenues(1) | $ | 16,632 | $ | 11,514 | $ | 2,799 | $ | � | $ | (187 | ) | $ | 30,758 | |||||||||||
| Net interest | (266 | ) | 1,122 | (76 | ) | � | 84 | 864 | ||||||||||||||||
| Net revenues | $ | 16,366 | $ | 12,636 | $ | 2,723 | $ | � | $ | (103 | ) | $ | 31,622 | |||||||||||
| Income (loss) from continuing operations before�income taxes | $ | 4,338 | $ | 1,156 | $ | 723 | $ | � | $ | (15 | ) | $ | 6,202 | |||||||||||
| Provision for (benefit from) income taxes | 301 | 336 | 105 | � | (3 | ) | 739 | |||||||||||||||||
| Income (loss) from continuing operations | 4,037 | 820 | 618 | � | (12 | ) | 5,463 | |||||||||||||||||
| Discontinued operations(2): | ||||||||||||||||||||||||
| Gain (loss) from discontinued operations | (1,175 | ) | � | 994 | 775 | 12 | 606 | |||||||||||||||||
| Provision for income taxes | 26 | � | 335 | � | 6 | 367 | ||||||||||||||||||
| Net gain (loss) on discontinued operations(3) | (1,201 | ) | � | 659 | 775 | 6 | 239 | |||||||||||||||||
| Net income (loss) | 2,836 | 820 | 1,277 | 775 | (6 | ) | 5,702 | |||||||||||||||||
| Net income applicable to noncontrolling interests | 290 | 301 | 408 | � | � | 999 | ||||||||||||||||||
| Net income (loss) applicable to Morgan Stanley | $ | 2,546 | $ | 519 | $ | 869 | $ | 775 | $ | (6 | ) | $ | 4,703 | |||||||||||
| 2009 | Institutional Securities | Global�Wealth Management Group | Asset Management | Intersegment Eliminations | Total | |||||||||||||||
| (dollars in millions) | ||||||||||||||||||||
| Total non-interest revenues | $ | 12,977 | $ | 8,729 | $ | 1,420 | $ | (464 | ) | $ | 22,662 | |||||||||
| Net interest | (124 | ) | 661 | (83 | ) | 318 | 772 | |||||||||||||
| Net revenues | $ | 12,853 | $ | 9,390 | $ | 1,337 | $ | (146 | ) | $ | 23,434 | |||||||||
| Income (loss) from continuing operations before�income taxes | $ | 1,088 | $ | 559 | $ | (653 | ) | $ | (11 | ) | $ | 983 | ||||||||
| Provision for (benefit from) income taxes | (301 | ) | 178 | (215 | ) | (3 | ) | (341 | ) | |||||||||||
| Income (loss) from continuing operations | 1,389 | 381 | (438 | ) | (8 | ) | 1,324 | |||||||||||||
| Discontinued operations(2): | ||||||||||||||||||||
| Gain (loss) from discontinued operations | 396 | � | (376 | ) | 13 | 33 | ||||||||||||||
| Provision for (benefit from) income taxes | 229 | � | (277 | ) | (1 | ) | (49 | ) | ||||||||||||
| Net gain (loss) on discontinued operations(3) | 167 | � | (99 | ) | 14 | 82 | ||||||||||||||
| Net income (loss) | 1,556 | 381 | (537 | ) | 6 | 1,406 | ||||||||||||||
| Net income (loss) applicable to noncontrolling interests | 12 | 98 | (50 | ) | � | 60 | ||||||||||||||
| Net income (loss) applicable to Morgan Stanley | $ | 1,544 | $ | 283 | $ | (487 | ) | $ | 6 | $ | 1,346 | |||||||||
| | 240 |
| Fiscal 2008 | Institutional Securities | Global�Wealth Management Group | Asset Management | Discover | Intersegment Eliminations | Total | ||||||||||||||||||
| (dollars in millions) | ||||||||||||||||||||||||
| Total non-interest revenues | $ | 13,024 | $ | 6,085 | $ | 621 | $ | � | $ | (258 | ) | $ | 19,472 | |||||||||||
| Net interest | 1,744 | 934 | (74 | ) | � | 64 | 2,668 | |||||||||||||||||
| Net revenues | $ | 14,768 | $ | 7,019 | $ | 547 | $ | � | $ | (194 | ) | $ | 22,140 | |||||||||||
| Income (loss) from continuing operations before�income taxes(4) | $ | 1,540 | $ | 1,154 | $ | (1,423 | ) | $ | � | $ | (17 | ) | $ | 1,254 | ||||||||||
| Provision for (benefit from) income taxes | 149 | 440 | (567 | ) | � | (6 | ) | 16 | ||||||||||||||||
| Income (loss) from continuing operations | 1,391 | 714 | (856 | ) | � | (11 | ) | 1,238 | ||||||||||||||||
| Discontinued operations(2): | ||||||||||||||||||||||||
| Gain (loss) from discontinued operations | 1,460 | � | (383 | ) | (100 | ) | 27 | 1,004 | ||||||||||||||||
| Provision for (benefit from) income taxes | 575 | � | (122 | ) | � | 11 | 464 | |||||||||||||||||
| Net gain (loss) on discontinued operations(3) | 885 | � | (261 | ) | (100 | ) | 16 | 540 | ||||||||||||||||
| Net income (loss) | 2,276 | 714 | (1,117 | ) | (100 | ) | 5 | 1,778 | ||||||||||||||||
| Net income applicable to noncontrolling interests | 71 | � | � | � | � | 71 | ||||||||||||||||||
| Net income (loss) applicable to Morgan Stanley | $ | 2,205 | $ | 714 | $ | (1,117 | ) | $ | (100 | ) | $ | 5 | $ | 1,707 | ||||||||||
| One Month Ended December�31, 2008 | Institutional Securities | Global�Wealth Management Group | Asset Management | Intersegment Eliminations | Total | |||||||||||||||
| (dollars in millions) | ||||||||||||||||||||
| Total non-interest revenues | $ | (1,215 | ) | $ | 358 | $ | (8 | ) | $ | (21 | ) | $ | (886 | ) | ||||||
| Net interest | (107 | ) | 51 | (1 | ) | 6 | (51 | ) | ||||||||||||
| Net revenues | $ | (1,322 | ) | $ | 409 | $ | (9 | ) | $ | (15 | ) | $ | (937 | ) | ||||||
| Income (loss) from continuing operations before�income taxes | $ | (1,997 | ) | $ | 118 | $ | (114 | ) | $ | (1 | ) | $ | (1,994 | ) | ||||||
| Provision for (benefit from) income taxes | (726 | ) | 45 | (44 | ) | � | (725 | ) | ||||||||||||
| Income (loss) from continuing operations | (1,271 | ) | 73 | (70 | ) | (1 | ) | (1,269 | ) | |||||||||||
| Discontinued operations(2): | ||||||||||||||||||||
| Gain (loss) from discontinued operations | (20 | ) | � | 4 | 2 | (14 | ) | |||||||||||||
| Provision for (benefit from) income taxes | (1 | ) | � | 2 | 1 | 2 | ||||||||||||||
| Net gain (loss) from discontinued operations(3) | (19 | ) | � | 2 | 1 | (16 | ) | |||||||||||||
| Net income (loss) | (1,290 | ) | 73 | (68 | ) | � | (1,285 | ) | ||||||||||||
| Net income applicable to noncontrolling interests | 3 | � | � | � | 3 | |||||||||||||||
| Net income (loss) applicable to Morgan Stanley | $ | (1,293 | ) | $ | 73 | $ | (68 | ) | $ | � | $ | (1,288 | ) | |||||||
| 241 | |
| (1) | In the fourth quarter of 2010, the Company recognized a pre-tax gain of $176 million in net revenues upon application of the OIS curve within the Institutional Securities business segment (see Note 4). |
| (2) | See Note 1 for a discussion of discontinued operations. |
| (3) | Amounts for 2010 included a loss of $1.2 billion related to the planned disposition of Revel included within the Institutional Securities business segment, a gain of $775 million related to the legal settlement with DFS and a gain of approximately $570 million related to the Company�s sale of Retail Asset Management within the Asset Management business segment. Amounts for 2009 and fiscal 2008 included net gains of $499 million and $1,463 million, respectively, related to MSCI secondary offerings within the Institutional Securities business segment. |
| (4) | Income from continuing operations for the Institutional Securities business segment included correction of prior-period errors of $171 million ($120 million after-tax), $0.11 per diluted share, due to the reversal of valuation adjustments related to interest rate derivatives and a cumulative negative adjustment of $120 million ($84 million after-tax), $0.08 per diluted share, resulting from incorrect valuations of a London-based trader�s positions. The positive adjustment of $171 million related to fiscal 2006. The negative adjustment of $120 million increased income from continuing operations on a pre-tax basis by $45 million and $75 million in fiscal 2007 and fiscal 2008, respectively. The Company does not believe the adjustments, which were recorded in the period identified, were material to those consolidated financial statements after considering both the quantitative amount and qualitative factors as related to the affected financial statements. |
| Net Interest | Institutional Securities | Global�Wealth Management Group | Asset Management | Intersegment Eliminations | Total | |||||||||||||||
| (dollars in millions) | ||||||||||||||||||||
| 2010 | ||||||||||||||||||||
| Interest income | $ | 5,877 | $ | 1,587 | $ | 22 | $ | (208 | ) | $ | 7,278 | |||||||||
| Interest expense | 6,143 | 465 | 98 | (292 | ) | 6,414 | ||||||||||||||
| Net interest | $ | (266 | ) | $ | 1,122 | $ | (76 | ) | $ | 84 | $ | 864 | ||||||||
| 2009 | ||||||||||||||||||||
| Interest income | $ | 6,373 | $ | 1,114 | $ | 17 | $ | (27 | ) | $ | 7,477 | |||||||||
| Interest expense | 6,497 | 453 | 100 | (345 | ) | 6,705 | ||||||||||||||
| Net interest | $ | (124 | ) | $ | 661 | $ | (83 | ) | $ | 318 | $ | 772 | ||||||||
| Fiscal 2008 | ||||||||||||||||||||
| Interest income | $ | 37,604 | $ | 1,239 | $ | 131 | $ | (43 | ) | $ | 38,931 | |||||||||
| Interest expense | 35,860 | 305 | 205 | (107 | ) | 36,263 | ||||||||||||||
| Net interest | $ | 1,744 | $ | 934 | $ | (74 | ) | $ | 64 | $ | 2,668 | |||||||||
| One Month Ended December�31, 2008 | ||||||||||||||||||||
| Interest income | $ | 1,017 | $ | 66 | $ | 8 | $ | (2 | ) | $ | 1,089 | |||||||||
| Interest expense | 1,124 | 15 | 9 | (8 | ) | 1,140 | ||||||||||||||
| Net interest | $ | (107 | ) | $ | 51 | $ | (1 | ) | $ | 6 | $ | (51 | ) | |||||||
| Total Assets(1) | Institutional Securities | Global�Wealth Management Group | Asset Management | Total | ||||||||||||
| (dollars in millions) | ||||||||||||||||
| At December�31, 2010 | $ | 698,453 | $ | 101,058 | $ | 8,187 | $ | 807,698 | ||||||||
| At December�31, 2009 | $ | 719,232 | $ | 44,154 | $ | 8,076 | $ | 771,462 | ||||||||
| (1) | Corporate assets have been fully allocated to the Company�s business segments. |
| | 242 |
| � | Institutional Securities: advisory and equity underwriting�client location, debt underwriting�revenue recording location, sales�and trading�trading desk location. |
| � | Global Wealth Management Group: global representative coverage location. |
| � | Asset Management: client location, except for merchant banking business, which is based on asset location. |
| Net Revenues | 2010 | 2009(1) | Fiscal�2008(1) | One Month Ended December�31, 2008(1) | ||||||||||||
| (dollars�in�millions) | ||||||||||||||||
| Americas | $ | 21,674 | $ | 18,909 | $ | 10,768 | $ | (766 | ) | |||||||
| Europe, Middle East, and Africa | 5,628 | 2,529 | 8,977 | (215 | ) | |||||||||||
| Asia | 4,320 | 1,996 | 2,395 | 44 | ||||||||||||
| Net revenues | $ | 31,622 | $ | 23,434 | $ | 22,140 | $ | (937 | ) | |||||||
| Total Assets | At�December�31, 2010 | At�December�31, 2009 | ||||||
| (dollars�in�millions) | ||||||||
| Americas | $ | 582,928 | $ | 571,829 | ||||
| Europe, Middle East, and Africa | 153,656 | 143,072 | ||||||
| Asia | 71,114 | 56,561 | ||||||
| Total | $ | 807,698 | $ | 771,462 | ||||
| (1) | Certain reclassifications have been made to prior-period amounts to conform to the current year�s presentation. |
| 243 | |
| Percent Ownership | Book Value | |||||||||||
| December�31, 2010 | December�31, 2009 | |||||||||||
| (dollars in millions) | ||||||||||||
| Mitsubishi UFJ Morgan Stanley Securities Co., Ltd(1) | 40 | % | $ | 1,794 | $ | � | ||||||
| Lansdowne Partners(1)(2) | 19.8 | % | 284 | 292 | ||||||||
| Avenue Capital Group(1)(2) | (3 | ) | 275 | 234 | ||||||||
| China International Capital Corporation Limited | 34.3 | % | � | 269 | ||||||||
| (1) | Book value of these investees exceeds the Company�s share of net assets, reflecting intangible assets and equity method goodwill. |
| (2) | The Company�s ownership interest represents limited partnership interests. The Company is deemed to have significant influence in these limited partnerships, as the Company�s limited partnership interests were above the 3% to 5% threshold for interests that should be accounted for under the equity method. |
| (3) | The Company�s ownership interest represents limited partnerships interests in a number of different entities within the Avenue Capital Group. |
| | 244 |
| 2010 | 2009 | Fiscal 2008 | One�Month Ended December�31, 2008 | |||||||||||||
| (dollars�in�millions) | ||||||||||||||||
| Net revenues(1): | ||||||||||||||||
| Revel | $ | � | $ | (6 | ) | $ | (3 | ) | $ | � | ||||||
| Crescent | � | 161 | 34 | 78 | ||||||||||||
| Retail Asset Management | 1,221 | 628 | 707 | 50 | ||||||||||||
| MSCI | � | 651 | 1,884 | 34 | ||||||||||||
| CMB | 60 | (71 | ) | (28 | ) | (30 | ) | |||||||||
| Other | 3 | 5 | 1 | � | ||||||||||||
| $ | 1,284 | $ | 1,368 | $ | 2,595 | $ | 132 | |||||||||
| Pre-tax gain (loss) on discontinued operations(1): | ||||||||||||||||
| Revel(2) | $ | (1,208 | ) | $ | (15 | ) | $ | (52 | ) | $ | � | |||||
| Crescent(3) | 2 | (613 | ) | (515 | ) | (12 | ) | |||||||||
| Retail Asset Management(4) | 994 | 268 | 159 | 17 | ||||||||||||
| MSCI(5) | � | 537 | 1,579 | 13 | ||||||||||||
| DFS(6) | 775 | � | (100 | ) | � | |||||||||||
| CMB | 40 | (87 | ) | (65 | ) | (32 | ) | |||||||||
| Other | 3 | (57 | ) | (2 | ) | � | ||||||||||
| $ | 606 | $ | 33 | $ | 1,004 | $ | (14 | ) | ||||||||
| (1) | Amounts included eliminations of intersegment activity. |
| (2) | Amount included a loss of approximately $1.2 billion in 2010 in connection with the planned disposition of Revel. |
| (3) | Amount included a gain on disposition of approximately $126 million in 2009. |
| (4) | Amount included a pre-tax gain of approximately $853 million in 2010 in connection with the sale of Retail Asset Management. |
| (5) | Amounts included a pre-tax gain on MSCI secondary offerings of $499 million and $1,463 million in 2009 and fiscal 2008, respectively. |
| (6) | Amount relates to the legal settlement with DFS in 2010. |
| 245 | |
| December�31, 2010 | December�31, 2009 | |||||||
| Assets: | ||||||||
| Cash and due from banks | $ | 5,672 | $ | 13,262 | ||||
| Interest bearing deposits with banks | 3,718 | 3,537 | ||||||
| Financial instruments owned | 18,640 | 7,049 | ||||||
| Securities purchased under agreement to resell with affiliate | 49,631 | 48,048 | ||||||
| Advances to subsidiaries: | ||||||||
| Bank and bank holding company | 18,371 | 1,872 | ||||||
| Non-bank | 141,659 | 157,782 | ||||||
| Investment in subsidiaries, at equity: | ||||||||
| Bank and bank holding company | 6,129 | 5,206 | ||||||
| Non-bank | 43,607 | 35,425 | ||||||
| Other assets | 7,568 | 8,749 | ||||||
| Total assets | $ | 294,995 | $ | 280,930 | ||||
| Liabilities and Shareholders� Equity: | ||||||||
| Commercial paper and other short-term borrowings | $ | 1,353 | $ | 1,151 | ||||
| Financial instruments sold, not yet purchased | 1,323 | 1,588 | ||||||
| Payables to subsidiaries | 42,816 | 41,275 | ||||||
| Other liabilities and accrued expenses | 8,376 | 3,068 | ||||||
| Long-term borrowings | 183,916 | 187,160 | ||||||
| 237,784 | 234,242 | |||||||
| Commitments and contingent liabilities | ||||||||
| Shareholders� equity: | ||||||||
| Preferred stock | 9,597 | 9,597 | ||||||
| Common stock, $0.01 par value; | ||||||||
| Shares authorized: 3,500,000,000 in 2010 and 2009; | ||||||||
| Shares issued: 1,603,913,074 in 2010 and 1,487,850,163 in 2009; | ||||||||
| Shares outstanding: 1,512,022,095 in 2010 and 1,360,595,214 in 2009 | 16 | 15 | ||||||
| Paid-in capital | 13,521 | 8,619 | ||||||
| Retained earnings | 38,603 | 35,056 | ||||||
| Employee stock trust | 3,465 | 4,064 | ||||||
| Accumulated other comprehensive loss | (467 | ) | (560 | ) | ||||
| Common stock held in treasury, at cost, $0.01 par value; 91,890,979 shares in 2010 and 127,254,949 shares in 2009 | (4,059 | ) | (6,039 | ) | ||||
| Common stock issued to employee trust | (3,465 | ) | (4,064 | ) | ||||
| Total shareholders� equity | 57,211 | 46,688 | ||||||
| Total liabilities and shareholders� equity | $ | 294,995 | $ | 280,930 | ||||
| | 246 |
| 2010 | 2009 | Fiscal 2008 | One Month Ended December�31, 2008 | |||||||||||||
| Revenues: | ||||||||||||||||
| Dividends from non-bank subsidiary | $ | 2,537 | $ | 6,117 | $ | 4,209 | $ | 14 | ||||||||
| Undistributed gain (loss) from subsidiaries | 5,708 | (307 | ) | (6,844 | ) | (1,305 | ) | |||||||||
| Principal transactions | 628 | (5,592 | ) | 7,547 | 548 | |||||||||||
| Other | (36 | ) | 484 | 1,451 | 612 | |||||||||||
| Total non-interest revenues | 8,837 | 702 | 6,363 | (131 | ) | |||||||||||
| Interest income | 3,305 | 4,432 | 11,098 | 658 | ||||||||||||
| Interest expense | 5,351 | 6,153 | 12,167 | 1,164 | ||||||||||||
| Net interest | (2,046 | ) | (1,721 | ) | (1,069 | ) | (506 | ) | ||||||||
| Net revenues | 6,791 | (1,019 | ) | 5,294 | (637 | ) | ||||||||||
| Non-interest expenses: | ||||||||||||||||
| Non-interest expenses | 672 | 461 | 767 | 649 | ||||||||||||
| Income (loss) before income tax provision (benefit) | 6,119 | (1,480 | ) | 4,527 | (1,286 | ) | ||||||||||
| Provision for (benefit from) income taxes | 1,416 | (2,826 | ) | 2,820 | 2 | |||||||||||
| Net income (loss) | 4,703 | 1,346 | 1,707 | (1,288 | ) | |||||||||||
| Other comprehensive income (loss), net of tax: | ||||||||||||||||
| Foreign currency translation adjustments | 66 | 116 | (160 | ) | (96 | ) | ||||||||||
| Amortization of cash flow hedges | 9 | 13 | 16 | 2 | ||||||||||||
| Net unrealized gain on securities available for sale | 36 | � | � | � | ||||||||||||
| Pension, postretirement and other related adjustments | (18 | ) | (269 | ) | 216 | (201 | ) | |||||||||
| Comprehensive income (loss) | $ | 4,796 | $ | 1,206 | $ | 1,779 | $ | (1,583 | ) | |||||||
| Net income (loss) | $ | 4,703 | $ | 1,346 | $ | 1,707 | $ | (1,288 | ) | |||||||
| Earnings (loss) applicable to Morgan Stanley common shareholders | $ | 3,594 | $ | (907 | ) | $ | 1,495 | $ | (1,624 | ) | ||||||
| 247 | |
| 2010 | 2009 | Fiscal 2008 | One Month Ended December�31, 2008 | |||||||||||||
| Cash flows from operating activities: | ||||||||||||||||
| Net income (loss) | $ | 4,703 | $ | 1,346 | $ | 1,707 | $ | (1,288 | ) | |||||||
| Adjustments to reconcile net income (loss) to net cash provided by (used for) operating activities: | ||||||||||||||||
| Compensation payable in common stock and stock options | 1,260 | 1,265 | 1,838 | 77 | ||||||||||||
| Undistributed (gain) loss of subsidiaries | (5,708 | ) | 307 | 6,844 | 1,305 | |||||||||||
| Gain on business dispositions | � | (606 | ) | (1,464 | ) | � | ||||||||||
| Change in assets and liabilities: | ||||||||||||||||
| Financial instruments owned, net of financial instruments sold, not yet purchased | (11,848 | ) | 5,505 | (2,568 | ) | 467 | ||||||||||
| Other assets | 929 | (5,036 | ) | (1,584 | ) | (1,015 | ) | |||||||||
| Other liabilities and accrued expenses | 15,072 | (10,134 | ) | 25,417 | (4,024 | ) | ||||||||||
| Net cash provided by (used for) operating activities | 4,408 | (7,353 | ) | 30,190 | (4,478 | ) | ||||||||||
| Cash flows from investing activities: | ||||||||||||||||
| Advances to and investments in subsidiaries | (9,552 | ) | 13,375 | (25,651 | ) | (5,013 | ) | |||||||||
| Securities purchased under agreement to resell with affiliate | (1,545 | ) | (29,255 | ) | 48,137 | (12,794 | ) | |||||||||
| Business dispositions, net of cash disposed | � | 565 | 1,560 | � | ||||||||||||
| Net cash provided by (used for) investing activities | (11,097 | ) | (15,315 | ) | 24,046 | (17,807 | ) | |||||||||
| Cash flows from financing activities: | ||||||||||||||||
| Net proceeds from (payments for) short-term borrowings | 202 | (5,743 | ) | (14,224 | ) | 504 | ||||||||||
| Excess tax benefits associated with stock-based awards | 5 | 102 | 47 | � | ||||||||||||
| Net proceeds from: | ||||||||||||||||
| Issuance of preferred stock and common stock warrant | � | � | 18,997 | � | ||||||||||||
| Public offerings and other issuances of common stock | 5,581 | 6,255 | 397 | 4 | ||||||||||||
| Issuance of long-term borrowings | 26,683 | 30,112 | 35,420 | 9,846 | ||||||||||||
| Payments for: | ||||||||||||||||
| Series D Preferred Stock and Warrant | � | (10,950 | ) | � | � | |||||||||||
| Redemption of junior subordinated debentures related to China Investment Corporation | (5,579 | ) | � | � | � | |||||||||||
| Repurchase of common stock through capital management share repurchase program | � | � | (711 | ) | � | |||||||||||
| Repurchases of common stock for employee tax withholding | (317 | ) | (50 | ) | (1,117 | ) | (3 | ) | ||||||||
| Long-term borrowings | (25,322 | ) | (24,315 | ) | (44,412 | ) | (341 | ) | ||||||||
| Cash dividends | (1,156 | ) | (1,732 | ) | (1,227 | ) | � | |||||||||
| Net cash provided by (used for) financing activities | 97 | (6,321 | ) | (6,830 | ) | 10,010 | ||||||||||
| Effect of exchange rate changes on cash and cash equivalents | (817 | ) | 549 | (2,375 | ) | 2,259 | ||||||||||
| Net increase (decrease) in cash and cash equivalents | (7,409 | ) | (28,440 | ) | 45,031 | (10,016 | ) | |||||||||
| Cash and cash equivalents, at beginning of period | 16,799 | 45,239 | 10,224 | 55,255 | ||||||||||||
| Cash and cash equivalents, at end of period | $ | 9,390 | $ | 16,799 | $ | 55,255 | $ | 45,239 | ||||||||
| Cash and cash equivalents include: | ||||||||||||||||
| Cash and due from banks | $ | 5,672 | $ | 13,262 | $ | 16,118 | $ | 23,629 | ||||||||
| Interest bearing deposits with banks | 3,718 | 3,537 | 39,137 | 21,610 | ||||||||||||
| Cash and cash equivalents, at end of period | $ | 9,390 | $ | 16,799 | $ | 55,255 | $ | 45,239 | ||||||||
| | 248 |
| 249 | |
| 2010 Quarter | 2009 Quarter | |||||||||||||||||||||||||||||||
| First | Second | Third | Fourth | First | Second | Third | Fourth | |||||||||||||||||||||||||
| (dollars in millions, except per share data) | ||||||||||||||||||||||||||||||||
| Total non-interest revenues | $ | 8,704 | $ | 7,822 | $ | 6,677 | $ | 7,555 | $ | 3,003 | $ | 5,412 | $ | 7,972 | $ | 6,275 | ||||||||||||||||
| Net interest | 368 | 141 | 103 | 252 | (69 | ) | (216 | ) | 496 | 561 | ||||||||||||||||||||||
| Net revenues | 9,072 | 7,963 | 6,780 | 7,807 | 2,934 | 5,196 | 8,468 | 6,836 | ||||||||||||||||||||||||
| Total non-interest expenses | 6,557 | 6,260 | 5,979 | 6,624 | 3,517 | 5,776 | 6,975 | 6,183 | ||||||||||||||||||||||||
| Income (loss) from continuing operations before income taxes | 2,515 | 1,703 | 801 | 1,183 | (583 | ) | (580 | ) | 1,493 | 653 | ||||||||||||||||||||||
| Provision for (benefit from) income taxes | 436 | 240 | (23 | ) | 86 | (584 | ) | (318 | ) | 521 | 40 | |||||||||||||||||||||
| Income (loss) from continuing operations | 2,079 | 1,463 | 824 | 1,097 | 1 | (262 | ) | 972 | 613 | |||||||||||||||||||||||
| Discontinued operations(1): | ||||||||||||||||||||||||||||||||
| Gain (loss) from discontinued operations | (99 | ) | 866 | (148 | ) | (13 | ) | (303 | ) | 477 | (278 | ) | 137 | |||||||||||||||||||
| Provision for (benefit from) income taxes | (31 | ) | 345 | 35 | 18 | (112 | ) | 182 | (99 | ) | (20 | ) | ||||||||||||||||||||
| Net gain (loss) from discontinued operations | (68 | ) | 521 | (183 | ) | (31 | ) | (191 | ) | 295 | (179 | ) | 157 | |||||||||||||||||||
| Net income (loss) | 2,011 | 1,984 | 641 | 1,066 | (190 | ) | 33 | 793 | 770 | |||||||||||||||||||||||
| Net income (loss) applicable to noncontrolling interests | 235 | 24 | 510 | 230 | (13 | ) | (116 | ) | 36 | 153 | ||||||||||||||||||||||
| Net income (loss) applicable to Morgan Stanley | $ | 1,776 | $ | 1,960 | $ | 131 | $ | 836 | $ | (177 | ) | $ | 149 | $ | 757 | $ | 617 | |||||||||||||||
| Earnings (loss) applicable to Morgan Stanley common shareholders | $ | 1,411 | $ | 1,578 | $ | (91 | ) | $ | 600 | $ | (578 | ) | $ | (1,256 | ) | $ | 498 | $ | 376 | |||||||||||||
| Earnings (loss) per basic common share(2): | ||||||||||||||||||||||||||||||||
| Income (loss) from continuing operations | $ | 1.12 | $ | 0.84 | $ | 0.07 | $ | 0.44 | $ | (0.38 | ) | $ | (1.35 | ) | $ | 0.51 | $ | 0.18 | ||||||||||||||
| Net gain (loss) from discontinued operations | (0.05 | ) | 0.36 | (0.14 | ) | (0.02 | ) | (0.19 | ) | 0.25 | (0.12 | ) | 0.11 | |||||||||||||||||||
| Earnings (loss) per basic common share | $ | 1.07 | $ | 1.20 | $ | (0.07 | ) | $ | 0.42 | $ | (0.57 | ) | $ | (1.10 | ) | $ | 0.39 | $ | 0.29 | |||||||||||||
| Earnings (loss) per diluted common share(2): | ||||||||||||||||||||||||||||||||
| Income (loss) from continuing operations | $ | 1.03 | $ | 0.80 | $ | 0.05 | $ | 0.43 | $ | (0.38 | ) | $ | (1.35 | ) | $ | 0.50 | $ | 0.18 | ||||||||||||||
| Net gain (loss) from discontinued operations | (0.04 | ) | 0.29 | (0.12 | ) | (0.02 | ) | (0.19 | ) | 0.25 | (0.12 | ) | 0.11 | |||||||||||||||||||
| Earnings (loss) per diluted common share | $ | 0.99 | $ | 1.09 | $ | (0.07 | ) | $ | 0.41 | $ | (0.57 | ) | $ | (1.10 | ) | $ | 0.38 | $ | 0.29 | |||||||||||||
| Dividends declared to common shareholders | $ | 0.05 | $ | 0.05 | $ | 0.05 | $ | 0.05 | $ | � | $ | 0.07 | $ | 0.05 | $ | 0.05 | ||||||||||||||||
| Book value | $ | 27.65 | $ | 29.65 | $ | 31.25 | $ | 31.49 | $ | 27.10 | $ | 27.21 | $ | 27.05 | $ | 27.26 | ||||||||||||||||
| (1) | See Note 1 and Note 25 for more information on discontinued operations. |
| (2) | Summation of the quarters� earnings per common share may not equal the annual amounts due to the averaging effect of the number of shares and share equivalents throughout the year. |
| | 250 |
| 251 | |
| 2010 | ||||||||||||
| Average Weekly Balance | Interest | Average Rate | ||||||||||
| (dollars in millions) | ||||||||||||
| Assets | ||||||||||||
| Interest earning assets: | ||||||||||||
| Financial instruments owned(1): | ||||||||||||
| U.S. | $ | 145,449 | $ | 3,124 | 2.1 | % | ||||||
| Non-U.S. | 105,385 | 807 | 0.8 | |||||||||
| Securities available for sale: | ||||||||||||
| U.S. | 18,290 | 215 | 1.2 | |||||||||
| Loans: | ||||||||||||
| U.S. | 7,993 | 293 | 3.7 | |||||||||
| Non-U.S. | 219 | 22 | 10.0 | |||||||||
| Interest bearing deposits with banks: | ||||||||||||
| U.S. | 33,807 | 67 | 0.2 | |||||||||
| Non-U.S. | 20,897 | 88 | 0.4 | |||||||||
| Federal funds sold and securities purchased under agreements to resell and Securities borrowed: | ||||||||||||
| U.S. | 193,796 | 236 | 0.1 | |||||||||
| Non-U.S. | 111,982 | 533 | 0.5 | |||||||||
| Other: | ||||||||||||
| U.S. | 32,400 | 1,538 | 4.7 | |||||||||
| Non-U.S. | 18,091 | 355 | 2.0 | |||||||||
| Total | $ | 688,309 | $ | 7,278 | 1.1 | % | ||||||
| Non-interest earning assets | 142,761 | |||||||||||
| Total assets | $ | 831,070 | ||||||||||
| Liabilities and Equity | ||||||||||||
| Interest bearing liabilities: | ||||||||||||
| Commercial paper and other short-term borrowings: | ||||||||||||
| U.S. | $ | 1,599 | $ | 11 | 0.7 | % | ||||||
| Non-U.S. | 1,772 | 17 | 1.0 | |||||||||
| Deposits: | ||||||||||||
| U.S. | 62,759 | 310 | 0.5 | |||||||||
| Non-U.S. | 70 | � | � | |||||||||
| Long-term debt: | ||||||||||||
| U.S. | 186,374 | 4,586 | 2.5 | |||||||||
| Non-U.S. | 5,170 | 6 | 0.1 | |||||||||
| Financial instruments sold, not yet purchased(1): | ||||||||||||
| U.S. | 22,947 | � | � | |||||||||
| Non-U.S. | 58,741 | � | � | |||||||||
| Securities sold under agreements to repurchase and Securities loaned: | ||||||||||||
| U.S. | 116,090 | 725 | 0.6 | |||||||||
| Non-U.S. | 94,498 | 866 | 0.9 | |||||||||
| Other: | ||||||||||||
| U.S. | 97,585 | (497 | ) | (0.5 | ) | |||||||
| Non-U.S. | 23,852 | 390 | 1.6 | |||||||||
| Total | $ | 671,457 | $ | 6,414 | 1.0 | |||||||
| Non-interest bearing liabilities and equity | 159,613 | |||||||||||
| Total liabilities and equity | $ | 831,070 | ||||||||||
| Net interest income and net interest rate spread | $ | 864 | 0.1 | % | ||||||||
| | 252 |
| 2009 | ||||||||||||
| Average Weekly Balance(2) | Interest | Average Rate | ||||||||||
| (dollars in millions) | ||||||||||||
| Assets | ||||||||||||
| Interest earning assets: | ||||||||||||
| Financial instruments owned(1): | ||||||||||||
| U.S. | $ | 143,885 | $ | 4,024 | 2.8 | % | ||||||
| Non-U.S. | 77,531 | 907 | 1.2 | |||||||||
| Loans: | ||||||||||||
| U.S. | 6,339 | 207 | 3.3 | |||||||||
| Non-U.S. | 314 | 22 | 7.0 | |||||||||
| Interest bearing deposits with banks: | ||||||||||||
| U.S. | 44,523 | 149 | 0.3 | |||||||||
| Non-U.S. | 16,300 | 92 | 0.6 | |||||||||
| Federal funds sold and securities purchased under agreements to resell and Securities borrowed: | ||||||||||||
| U.S. | 176,904 | 237 | 0.1 | |||||||||
| Non-U.S. | 85,079 | 622 | 0.7 | |||||||||
| Other: | ||||||||||||
| U.S. | 27,691 | 1,224 | 4.4 | |||||||||
| Non-U.S. | 17,261 | (7 | ) | � | ||||||||
| Total | $ | 595,827 | $ | 7,477 | 1.2 | % | ||||||
| Non-interest earning assets | 145,719 | |||||||||||
| Total assets | $ | 741,546 | ||||||||||
| Liabilities and Equity | ||||||||||||
| Interest bearing liabilities: | ||||||||||||
| Commercial paper and other short-term borrowings: | ||||||||||||
| U.S. | $ | 2,101 | $ | 31 | 1.5 | % | ||||||
| Non-U.S. | 1,276 | 20 | 1.6 | |||||||||
| Deposits: | ||||||||||||
| U.S. | 61,164 | 782 | 1.3 | |||||||||
| Non-U.S. | 116 | � | � | |||||||||
| Long-term debt: | ||||||||||||
| U.S. | 181,280 | 4,882 | 2.7 | |||||||||
| Non-U.S. | 3,712 | 16 | 0.4 | |||||||||
| Financial instruments sold, not yet purchased(1): | ||||||||||||
| U.S. | 29,153 | � | � | |||||||||
| Non-U.S. | 40,440 | � | � | |||||||||
| Securities sold under agreements to repurchase and Securities loaned: | ||||||||||||
| U.S. | 115,653 | 749 | 0.6 | |||||||||
| Non-U.S. | 49,222 | 625 | 1.3 | |||||||||
| Other: | ||||||||||||
| U.S. | 84,015 | (598 | ) | (0.7 | ) | |||||||
| Non-U.S. | 29,437 | 198 | 0.7 | |||||||||
| Total | $ | 597,569 | $ | 6,705 | 1.1 | |||||||
| Non-interest bearing liabilities and equity | 143,977 | |||||||||||
| Total liabilities and equity | $ | 741,546 | ||||||||||
| Net interest income and net interest rate spread | $ | 772 | 0.1 | % | ||||||||
| 253 | |
| Fiscal 2008 | ||||||||||||
| Average Month-End Balance(2) | Interest | Average Rate | ||||||||||
| (dollars in millions) | ||||||||||||
| Assets | ||||||||||||
| Interest earning assets: | ||||||||||||
| Financial instruments owned(1) | $ | 288,639 | $ | 9,217 | 3.2 | % | ||||||
| Loans | 12,463 | 784 | 6.3 | |||||||||
| Other interest earning assets(3): | ||||||||||||
| Interest bearing deposits with banks | 80,273 | � | � | |||||||||
| Federal funds sold and securities purchased under agreements to resell | 134,452 | � | � | |||||||||
| Securities borrowed | 223,037 | � | � | |||||||||
| Receivables from customers | 58,903 | � | � | |||||||||
| Total other interest earning assets | 496,665 | 28,930 | 5.8 | |||||||||
| Total | $ | 797,767 | $ | 38,931 | 4.9 | % | ||||||
| Non-interest earning assets | 208,841 | |||||||||||
| Total assets | $ | 1,006,608 | ||||||||||
| Liabilities and Equity | ||||||||||||
| Interest bearing liabilities: | ||||||||||||
| Commercial paper and other short-term borrowings | $ | 21,249 | $ | 663 | 3.1 | % | ||||||
| Deposits | 35,311 | 740 | 2.1 | |||||||||
| Long-term debt | 194,028 | 7,793 | 4.0 | |||||||||
| Financial instruments sold, not yet purchased(1) | 80,166 | � | � | |||||||||
| Other interest bearing liabilities(3): | ||||||||||||
| Securities sold under agreements to repurchase | 168,659 | � | � | |||||||||
| Securities loaned | 58,754 | � | � | |||||||||
| Payables to customers | 238,088 | � | � | |||||||||
| Total other interest bearing liabilities | 465,501 | 27,067 | 5.8 | |||||||||
| Total | $ | 796,255 | $ | 36,263 | 4.6 | |||||||
| Non-interest bearing liabilities and equity | 210,353 | |||||||||||
| Total liabilities and equity | $ | 1,006,608 | ||||||||||
| Net interest income and net interest rate spread | $ | 2,668 | 0.3 | % | ||||||||
| | 254 |
| One�Month�Ended�December�31,�2008 | ||||||||||||
| Average Month-End Balance(2) | Interest | Annualized Average Rate | ||||||||||
| (dollars in millions) | ||||||||||||
| Assets | ||||||||||||
| Interest earning assets: | ||||||||||||
| Financial instruments owned(1): | ||||||||||||
| U.S. | $ | 122,842 | $ | 358 | 3.4 | % | ||||||
| Non-U.S. | 49,384 | 37 | 0.9 | |||||||||
| Loans: | ||||||||||||
| U.S. | 6,527 | 15 | 2.7 | |||||||||
| Non-U.S. | 5 | � | � | |||||||||
| Interest bearing deposits with banks: | ||||||||||||
| U.S. | 56,784 | 4 | 0.1 | |||||||||
| Non-U.S. | 18,053 | 15 | 1.0 | |||||||||
| Federal funds sold and securities purchased under agreements to resell and Securities borrowed: | ||||||||||||
| U.S. | 99,626 | 166 | 2.0 | |||||||||
| Non-U.S. | 65,568 | 214 | 3.8 | |||||||||
| Other: | ||||||||||||
| U.S. | 60,121 | 149 | 2.9 | |||||||||
| Non-U.S. | 18,698 | 131 | 8.3 | |||||||||
| Total | $ | 497,608 | $ | 1,089 | 2.6 | % | ||||||
| Non-interest earning assets | 170,292 | |||||||||||
| Total assets | $ | 667,900 | ||||||||||
| Liabilities and Equity | ||||||||||||
| Interest bearing liabilities: | ||||||||||||
| Commercial paper and other short-term borrowings: | ||||||||||||
| U.S. | $ | 7,210 | $ | 27 | 4.4 | % | ||||||
| Non-U.S. | 3,385 | 6 | 2.1 | |||||||||
| Deposits: | ||||||||||||
| U.S. | 47,082 | 53 | 1.3 | |||||||||
| Non-U.S. | 137 | � | � | |||||||||
| Long-term debt: | ||||||||||||
| U.S. | 169,117 | 570 | 4.0 | |||||||||
| Non-U.S. | 3,463 | 9 | 3.1 | |||||||||
| Financial instruments sold, not yet purchased(1): | ||||||||||||
| U.S. | 36,450 | � | � | |||||||||
| Non-U.S. | 10,028 | � | � | |||||||||
| Securities sold under agreements to repurchase and Securities loaned: | ||||||||||||
| U.S. | 76,223 | 99 | 1.5 | |||||||||
| Non-U.S. | 34,578 | 256 | 8.7 | |||||||||
| Other: | ||||||||||||
| U.S. | 90,993 | 14 | 0.2 | |||||||||
| Non-U.S. | 31,604 | 106 | 3.9 | |||||||||
| Total | $ | 510,270 | $ | 1,140 | 2.6 | |||||||
| Non-interest bearing liabilities and equity | 157,630 | |||||||||||
| Total liabilities and equity | $ | 667,900 | ||||||||||
| Net interest income and net interest rate spread | $ | (51 | ) | � | % | |||||||
| (1) | Interest expense on Financial instruments sold, not yet purchased, is reported as a reduction of Interest income. |
| (2) | The Company calculates its average balances based upon weekly amounts except where weekly balances are unavailable, month-end balances are used. |
| (3) | Amounts primarily relate to securities financing transactions, which include repurchase and resale agreements, securities borrowed and loaned transactions, customer receivables/payables and segregated customer cash. The Company considers its principal trading, investment banking, commissions, and interest and dividend income, along with the associated interest expense, as one integrated activity for each of the Company�s separate businesses, and therefore, prior to December 2008, was unable to further break out Interest income and Interest expense (see Note 1 to the consolidated financial statements). |
| 255 | |
| 2010 versus 2009 | ||||||||||||
| Increase�(Decrease)�due�to�Change�in: | ||||||||||||
| Volume | Rate | Net�Change | ||||||||||
| (dollars in millions) | ||||||||||||
| Interest earning assets: | ||||||||||||
| Financial instruments owned: | ||||||||||||
| U.S. | $ | 44 | $ | (944 | ) | $ | (900 | ) | ||||
| Non-U.S. | 326 | (426 | ) | (100 | ) | |||||||
| Securities available for sale: | ||||||||||||
| U.S. | 215 | � | 215 | |||||||||
| Loans: | ||||||||||||
| U.S. | 54 | 32 | 86 | |||||||||
| Non-U.S. | (7 | ) | 7 | � | ||||||||
| Interest bearing deposits with banks: | ||||||||||||
| U.S. | (36 | ) | (46 | ) | (82 | ) | ||||||
| Non-U.S. | 26 | (30 | ) | (4 | ) | |||||||
| Federal funds sold and securities purchased under agreements to resell and Securities borrowed: | ||||||||||||
| U.S. | 23 | (24 | ) | (1 | ) | |||||||
| Non-U.S. | 197 | (286 | ) | (89 | ) | |||||||
| Other: | ||||||||||||
| U.S. | 208 | 106 | 314 | |||||||||
| Non-U.S. | � | 362 | 362 | |||||||||
| Change in interest income | $ | 1,050 | $ | (1,249 | ) | $ | (199 | ) | ||||
| Interest bearing liabilities: | ||||||||||||
| Commercial paper and other short-term borrowings: | ||||||||||||
| U.S. | $ | (7 | ) | $ | (13 | ) | $ | (20 | ) | |||
| Non-U.S. | 8 | (11 | ) | (3 | ) | |||||||
| Deposits: | ||||||||||||
| U.S. | 20 | (492 | ) | (472 | ) | |||||||
| Long-term debt: | ||||||||||||
| U.S. | 137 | (433 | ) | (296 | ) | |||||||
| Non-U.S. | 6 | (16 | ) | (10 | ) | |||||||
| Securities sold under agreements to repurchase and Securities loaned: | ||||||||||||
| U.S. | 3 | (27 | ) | (24 | ) | |||||||
| Non-U.S. | 575 | (334 | ) | 241 | ||||||||
| Other: | ||||||||||||
| U.S. | (97 | ) | 198 | 101 | ||||||||
| Non-U.S. | (37 | ) | 229 | 192 | ||||||||
| Change in interest expense | $ | 608 | $ | (899 | ) | $ | (291 | ) | ||||
| Change in net interest income | $ | 442 | $ | (350 | ) | $ | 92 | |||||
| | 256 |
| 2009 versus Fiscal 2008 | ||||||||||||
| Increase�(Decrease)�due�to�Change�in: | ||||||||||||
| Volume | Rate | Net�Change | ||||||||||
| (dollars in millions) | ||||||||||||
| Interest earning assets: | ||||||||||||
| Financial instruments owned | $ | (2,147 | ) | $ | (2,139 | ) | $ | (4,286 | ) | |||
| Loans | (365 | ) | (190 | ) | (555 | ) | ||||||
| Other | (7,509 | ) | (19,104 | ) | (26,613 | ) | ||||||
| Change in interest income | $ | (10,021 | ) | $ | (21,433 | ) | $ | (31,454 | ) | |||
| Interest bearing liabilities: | ||||||||||||
| Commercial paper and other short-term borrowings | $ | (558 | ) | $ | (54 | ) | $ | (612 | ) | |||
| Deposits | 544 | (502 | ) | 42 | ||||||||
| Long-term debt | (363 | ) | (2,532 | ) | (2,895 | ) | ||||||
| Other | (9,809 | ) | (16,284 | ) | (26,093 | ) | ||||||
| Change in interest expense | $ | (10,186 | ) | $ | (19,372 | ) | $ | (29,558 | ) | |||
| Change in net interest income | $ | 165 | $ | (2,061 | ) | $ | (1,896 | ) | ||||
| Average Deposits(1) | ||||||||||||||||||||||||||||||||
| 2010 | 2009 | Fiscal 2008 | One Month Ended December�31, 2008 | |||||||||||||||||||||||||||||
| Average Amount(1) | Average Rate | Average Amount(1) | Average Rate | Average Amount(1) | Average Rate | Average Amount(1) | Average Rate | |||||||||||||||||||||||||
| (dollars in millions) | ||||||||||||||||||||||||||||||||
| Deposits(2): | ||||||||||||||||||||||||||||||||
| Savings deposits | $ | 58,053 | 0.2 | % | $ | 52,397 | 0.9 | % | $ | 33,756 | 2.0 | % | $ | 38,911 | 0.8 | % | ||||||||||||||||
| Time deposits | 4,776 | 3.7 | % | 8,883 | 3.7 | % | 1,555 | 4.0 | % | 8,308 | 3.9 | % | ||||||||||||||||||||
| Total | $ | 62,829 | 0.5 | % | $ | 61,280 | 1.3 | % | $ | 35,311 | 2.1 | % | $ | 47,219 | 1.3 | % | ||||||||||||||||
| (1) | The Company calculates its average balances based upon weekly amounts except where weekly balances are unavailable, month-end balances are used. |
| (2) | Deposits are primarily located in U.S. offices. |
| 2010 | 2009 | Fiscal�2008 | One�Month�Ended December�31,�2008 | |||||||||||||
| Net income to average assets | 0.6 | % | 0.2 | % | 0.2 | % | N/M | |||||||||
| Return on common equity(1) | 8.5 | % | N/M | 4.5 | % | N/M | ||||||||||
| Return on total equity(2) | 9.0 | % | 2.8 | % | 4.6 | % | N/M | |||||||||
| Dividend payout ratio(3) | 7.6 | % | N/M | 77.7 | % | N/M | ||||||||||
| Total average common equity to average assets | 5.1 | % | 4.6 | % | 3.3 | % | 4.6 | % | ||||||||
| Total average equity to average assets | 6.3 | % | 6.5 | % | 3.7 | % | 7.5 | % | ||||||||
| (1) | Based on net income applicable to common shareholders as a percentage of average common equity. |
| (2) | Based on net income as a percentage of average total equity. |
| (3) | Dividends declared per common share as a percentage of net income per diluted share. |
| 257 | |
| 2010 | 2009 | Fiscal�2008 | One�Month�Ended December�31,�2008 | |||||||||||||
| (dollars in millions) | ||||||||||||||||
| Securities sold under agreements to repurchase(1): | ||||||||||||||||
| Period-end balance | $ | 147,598 | $ | 159,401 | $ | 102,401 | $ | 92,213 | ||||||||
| Average balance(2)(3) | 178,673 | 142,197 | 168,659 | 97,307 | ||||||||||||
| Maximum balance at any month-end | 216,130 | 210,482 | 272,126 | 102,401 | ||||||||||||
| Securities loaned(1): | ||||||||||||||||
| Period-end balance | $ | 29,094 | $ | 26,246 | $ | 14,821 | $ | 14,580 | ||||||||
| Average balance(2) | 31,915 | 22,679 | 58,754 | 14,701 | ||||||||||||
| Maximum balance at any month-end | 33,454 | 26,867 | 110,446 | 14,821 | ||||||||||||
| Commercial paper: | ||||||||||||||||
| Period-end balance | $ | 945 | $ | 783 | $ | 6,744 | $ | 7,388 | ||||||||
| Average balance(2) | 866 | 924 | 12,397 | 7,066 | ||||||||||||
| Maximum balance at any month-end | 1,098 | 5,367 | 19,895 | 7,388 | ||||||||||||
| Weighted average interest rate during the period | 1.7 | % | 2.4 | % | 4.2 | % | 2.7 | % | ||||||||
| Weighted average interest rate on period-end balance | 2.5 | % | 0.8 | % | 2.6 | % | 2.3 | % | ||||||||
| (1) | The Company considers its principal trading, investment banking, commissions, and interest and dividend income, along with the associated interest expense, as one integrated activity for each of the Company�s separate businesses and, therefore, is unable to provide weighted average interest rates for Securities sold under repurchase agreements and Securities loaned. See Note 1 and Note 17 of the consolidated financial statements for further information. |
| (2) | The Company calculates its average balances based upon weekly amounts except where weekly balances are unavailable, month-end balances are used. |
| (3) | The period-end balance was lower than the annual average primarily due to the seasonal maturity of client financing activity on December�31, 2010. |
| | 258 |
| At December�31, 2010 | ||||||||||||||||
| Country | Banks | Governments | Other | Total | ||||||||||||
| France | $ | 39,009 | $ | 2,526 | $ | 3,219 | $ | 44,754 | ||||||||
| Germany | 8,928 | 6,435 | 2,332 | 17,695 | ||||||||||||
| Italy | 1,616 | 1,726 | 1,264 | 4,606 | ||||||||||||
| Luxembourg | 2,926 | 483 | 4,846 | 8,255 | ||||||||||||
| Netherlands | 3,769 | 61 | 8,078 | 11,908 | ||||||||||||
| United Kingdom | 7,591 | 1 | 8,711 | 16,303 | ||||||||||||
| Brazil | 915 | 707 | 7,001 | 8,623 | ||||||||||||
| Cayman Islands | 15 | 4 | 27,646 | 27,665 | ||||||||||||
| Japan | 12,564 | 1,444 | 5,133 | 19,141 | ||||||||||||
| Korea | 63 | 5,881 | 1,424 | 7,368 | ||||||||||||
| Australia | 1,578 | 186 | 1,282 | 3,046 | ||||||||||||
| At December�31, 2009 | ||||||||||||||||
| Country | Banks | Governments | Other | Total | ||||||||||||
| Denmark | $ | 787 | $ | 5,701 | $ | 647 | $ | 7,135 | ||||||||
| France | 9,702 | 2,175 | 13,452 | 25,329 | ||||||||||||
| Germany | 10,700 | 2,280 | 10,986 | 23,966 | ||||||||||||
| Ireland | 3,922 | 6 | 4,269 | 8,197 | ||||||||||||
| Italy | 1,395 | 2,391 | 1,761 | 5,547 | ||||||||||||
| Luxembourg | 4,264 | 1 | 5,946 | 10,211 | ||||||||||||
| Netherlands | 2,798 | 271 | 9,803 | 12,872 | ||||||||||||
| Spain | 1,660 | 316 | 4,211 | 6,187 | ||||||||||||
| Switzerland | 4,429 | � | 6,507 | 10,936 | ||||||||||||
| United Kingdom | 13,150 | 1 | 9,674 | 22,825 | ||||||||||||
| Cayman Islands | � | � | 35,993 | 35,993 | ||||||||||||
| Japan | 9,040 | 194 | 6,035 | 15,269 | ||||||||||||
| Canada | 2,163 | 262 | 4,554 | 6,979 | ||||||||||||
| 259 | |
| Item�9. | Changes in and Disagreements with Accountants on Accounting and Financial Disclosure. |
| Item�9A. | Controls and Procedures. |
| � | Pertain to the maintenance of records that, in reasonable detail, accurately and fairly reflect the transactions and dispositions of the assets of the Company; |
| � | Provide reasonable assurance that transactions are recorded as necessary to permit preparation of financial statements in accordance with generally accepted accounting principles, and that our receipts and expenditures are being made only in accordance with authorizations of the Company�s management and directors; and |
| � | Provide reasonable assurance regarding prevention or timely detection of unauthorized acquisition, use or disposition of our assets that could have a material effect on our financial statements. |
Table of Contents Report of Independent Registered Public Accounting Firm To the Board of Directors and Shareholders of Morgan Stanley: We have audited the internal control over financial reporting of Morgan
Stanley and subsidiaries (the �Company�) as of December�31, 2010, based on criteria established in Internal Control�Integrated Framework issued by the Committee of Sponsoring Organizations of the Treadway
Commission.�The Company�s management is responsible for maintaining effective internal control over financial reporting and for its assessment of the effectiveness of internal control over financial reporting, included in the accompanying
Management�s Report on Internal Control Over Financial Reporting.�Our responsibility is to express an opinion on the Company�s internal control over financial reporting based on our audit. We conducted our audit in accordance with the standards of the Public Company
Accounting Oversight Board (United States).�Those standards require that we plan and perform the audit to obtain reasonable assurance about whether effective internal control over financial reporting was maintained in all material
respects.�Our audit included obtaining an understanding of internal control over financial reporting, assessing the risk that a material weakness exists, testing and evaluating the design and operating effectiveness of internal control based on
the assessed risk, and performing such other procedures as we considered necessary in the circumstances.�We believe that our audit provides a reasonable basis for our opinion. A company�s internal control over financial reporting is a process
designed by, or under the supervision of, the company�s principal executive and principal financial officers, or persons performing similar functions, and effected by the company�s board of directors, management, and other personnel to
provide reasonable assurance regarding the reliability of financial reporting and the preparation of financial statements for external purposes in accordance with generally accepted accounting principles.�A company�s internal control over
financial reporting includes those policies and procedures that (1)�pertain to the maintenance of records that, in reasonable detail, accurately and fairly reflect the transactions and dispositions of the assets of the company; (2)�provide
reasonable assurance that transactions are recorded as necessary to permit preparation of financial statements in accordance with generally accepted accounting principles, and that receipts and expenditures of the company are being made only in
accordance with authorizations of management and directors of the company; and (3)�provide reasonable assurance regarding prevention or timely detection of unauthorized acquisition, use, or disposition of the company�s assets that could
have a material effect on the financial statements. Because of
the inherent limitations of internal control over financial reporting, including the possibility of collusion or improper management override of controls, material misstatements due to error or fraud may not be prevented or detected on a timely
basis.�Also, projections of any evaluation of the effectiveness of the internal control over financial reporting to future periods are subject to the risk that the controls may become inadequate because of changes in conditions, or that the
degree of compliance with the policies or procedures may deteriorate. In our opinion, the Company maintained, in all material respects, effective internal control over financial reporting as of December�31, 2010, based on the criteria established in Internal
Control�Integrated Framework issued by the Committee of Sponsoring Organizations of the Treadway Commission. We have also audited, in accordance with the standards of the Public Company Accounting Oversight Board (United States), the consolidated statements of
financial condition of the Company as of December�31, 2010, the consolidated statements of income, comprehensive income, cash flows, and changes in total equity for the year ended December�31, 2010 and our report dated February�28,
2011 expresses an unqualified opinion on those financial statements. /s/ Deloitte & Touche LLP New York, New York February�28, 2011 261 Table of Contents Changes in Internal Control Over Financial Reporting. No change in the Company�s internal control over financial reporting
(as such term is defined in Exchange Act Rule 13a-15(f)) occurred during the quarter ended December�31, 2010 that materially affected, or is reasonably likely to materially affect, the Company�s internal control over financial reporting. | Item�9B.����Other | Information. |
Table of Contents Part III | Item�10. | Directors, Executive Officers and Corporate Governance. |
| � | �Item 1�Election of Directors� |
| � | �Item 1�Election of Directors�Board Meetings and Committees� |
| Item�11. | Executive Compensation. |
| � | �Item 1�Election of Directors�Executive Compensation� |
| � | �Item 1�Election of Directors�Director Compensation� |
Table of Contents| Item�12. | Security Ownership of Certain Beneficial Owners and Management and Related Stockholder Matters. |
| (a) | (b) | (c) | ||||||||||
| Plan Category | Number�of�securities�to�be�issued upon exercise of outstanding�options,�warrants and rights | Weighted-average�exercise price�of�outstanding�options, warrants and rights | Number�of�securities remaining�available�for future issuance under equity compensation plans�(excluding�securities reflected�in�column�(a)) | |||||||||
| Equity compensation plans approved by security holders | 67,024,871 | $ | 50.3544 | 102,294,893 | (1) | |||||||
| Equity compensation plans not approved by security holders | � | � | 2,525,626 | (2) | ||||||||
| Total | 67,024,871 | $ | 50.3544 | 104,820,519 | (3) | |||||||
| (1) | Includes the following: |
| (a) | 39,201,616 shares available under the Employee Stock Purchase Plan (�ESPP�). Pursuant to this plan, which is qualified under Section�423 of the Internal Revenue Code, eligible employees may purchase shares of common stock at a discount to market price through regular payroll deduction. The Compensation, Management Development and Succession Committee (�CMDS Committee�) approved the discontinuation of the ESPP, effective June�1, 2009, such that no further contributions to the plan will be permitted following such date, until such time as the CMDS Committee determines to recommence contributions under the plan. |
| (b) | 52,299,480 shares available under the 2007 Equity Incentive Compensation Plan (�EICP�). Awards may consist of stock options, stock appreciation rights, restricted stock, restricted stock units to be settled by the delivery of shares of common stock (or the value thereof), performance-based units, other awards that are valued by reference to or otherwise based on the fair market value of common stock, and other equity-based or equity-related awards approved by the CMDS Committee. |
| (c) | 10,144,473 shares available under the Employee Equity Accumulation Plan (�EEAP�), which includes 586,711 shares available for awards of restricted stock and restricted stock units. Awards may consist of stock options, stock appreciation rights, restricted stock, restricted stock units to be settled by the delivery of shares of common stock (or the value thereof), other awards that are valued by reference to or otherwise based on the fair market value of common stock, and other equity-based or equity-related awards approved by the CMDS Committee. |
| (d) | 354,757 shares available under the Tax Deferred Equity Participation Plan (�TDEPP�). Awards consist of restricted stock units which are settled by the delivery of shares of common stock. |
| (e) | 294,568 shares available under the Directors� Equity Capital Accumulation Plan (�DECAP�). This plan provides for periodic awards of shares of common stock and stock units to non-employee directors and also allows non-employee directors to defer the fees they earn from services as a director in the form of stock units. |
| (2) | 22,957 shares available under the Branch Manager Compensation Plan (�BMCP�), 13,239 shares available under the Financial Advisor and Investment Representative Compensation Plan (�FAIRCP�), and 2,489,430 shares available under the Morgan Stanley 2009 Replacement Equity Incentive Compensation Plan for Morgan Stanley Smith Barney Employees (�REICP�). The material features of these plans are described below. |
| (3) | As of December�31, 2010, approximately 63�million shares were available under the Company�s plans that can be used for the purpose of granting annual employee equity awards (EICP, EEAP, TDEPP, BMCP and FAIRCP). Approximately 42�million shares were granted in January 2011 as part of 2010 employee incentive compensation (which, for the PSUs granted to senior executives, reflects the grant of the target number of units, although the senior executive may ultimately earn up to two times the target number, or nothing, based on the Company�s performance over the three-year performance period). |
Table of Contents BMCP. Branch managers in the Global Wealth Management Group are eligible to receive
awards under BMCP. Awards under BMCP may consist of cash awards, restricted stock and restricted stock units to be settled by the delivery of shares of common stock. FAIRCP. Financial advisors and investment representatives
in the Global Wealth Management Group are eligible to receive awards under FAIRCP. Awards under FAIRCP may consist of cash awards, restricted stock and restricted stock units to be settled by the delivery of shares of common stock. REICP. The REICP was adopted in connection with the MSSB joint
venture and without stockholder approval pursuant to the employment inducement award exception under the NYSE Corporate Governance Listing Standards. The equity awards granted pursuant to the REICP are limited to awards to induce certain Citi
employees to join the new MSSB joint venture by replacing the value of Citi awards that were forfeited in connection with the employees� transfer of employment to MSSB. Awards under the REICP may be made in the form of restricted stock units,
stock appreciation rights, stock options and restricted stock and other forms of stock-based awards. *���� *���� * Other information relating to security ownership of certain beneficial owners and management is set forth under the caption �Beneficial Ownership of Company Common Stock� in Morgan
Stanley�s Proxy Statement and such information is incorporated by reference herein. | Item�13. | Certain Relationships and Related Transactions, and Director Independence. |
| � | �Other Matters�Certain Transactions� |
| � | �Other Matters�Related Person Transactions Policy� |
| � | �Item 1�Election of Directors�Corporate Governance�Director Independence� |
| Item�14. | Principal Accountant Fees and Services. |
| � | �Item 2�Ratification of Appointment of Morgan Stanley�s Independent Auditor� (excluding the information under the subheading �Audit Committee Report�) |
Table of Contents Part IV | Item�15. | Exhibits and Financial Statement Schedules. |
| � | The consolidated financial statements required to be filed in this Annual Report on Form 10-K are included in Part II, Item 8 hereof. |
| � | An exhibit index has been filed as part of this report beginning on page E-1 and is incorporated herein by reference. |
Table of Contents Signatures Pursuant to the requirements of Section�13 or 15(d) of the Securities
Exchange Act of 1934, the Registrant has duly caused this report to be signed on its behalf by the undersigned, thereunto duly authorized, on February�28, 2011. | M ORGAN S TANLEY ( REGISTRANT ) | ||||
| By: | /s/����J AMES P. G ORMAN | |||
| (James P. Gorman) President and Chief Executive Officer | ||||
| Signature | Title | |
| /s/����J AMES P. G ORMAN (James P. Gorman) | President and Chief Executive Officer (Principal Executive Officer) | |
| /s/����R UTH P ORAT (Ruth Porat) | Executive Vice President and Chief Financial Officer (Principal Financial Officer) | |
| /s/����P AUL C. W IRTH (Paul C. Wirth) | Deputy Chief Financial Officer (Principal Accounting Officer) | |
| /s/����J OHN J. M ACK (John J. Mack) | Director (Chairman of the Board of Directors) | |
| /s/����R OY J. B OSTOCK (Roy J. Bostock) | Director | |
| /s/����E RSKINE B. B OWLES (Erskine B. Bowles) | Director | |
| /s/����H OWARD J. D AVIES (Howard J. Davies) | Director | |
| /s/����J AMES H. H ANCE , J R . (James H. Hance, Jr.) | Director | |
| /s/����N OBUYUKI H IRANO (Nobuyuki Hirano) | Director | |
| S-1 |
Table of Contents| Signature | Title | |
| /s/����C. R OBERT K IDDER (C. Robert Kidder) | Director | |
| /s/����D ONALD T. N ICOLAISEN (Donald T. Nicolaisen) | Director | |
| /s/����H UTHAM S. O LAYAN (Hutham S. Olayan) | Director | |
| /s/����J AMES W. O WENS (James W. Owens) | Director | |
| /s/����O. G RIFFITH S EXTON (O. Griffith Sexton) | Director | |
| /s/����L AURA D�A NDREA T YSON (Laura D�Andrea Tyson) | Director | |
| | S-2 |
Table of Contents Exhibit Index Certain of the following exhibits, as indicated
parenthetically, were previously filed as exhibits to registration statements filed by Morgan Stanley or its predecessor companies under the Securities Act or to reports or registration statements filed by Morgan Stanley or its predecessor companies
under the Exchange Act and are hereby incorporated by reference to such statements or reports. Morgan Stanley�s Exchange Act file number is 1-11758. The Exchange Act file number of Morgan Stanley Group Inc., a predecessor company
(�MSG�), was 1-9085. 1 | Exhibit No. | Description | |
| 3.1 | Amended and Restated Certificate of Incorporation of Morgan Stanley, as amended to date (Exhibit 3 to Morgan Stanley�s Quarterly Report on Form 10-Q for the quarter ended June 30, 2009). | |
| 3.2 | Amended and Restated Bylaws of Morgan Stanley, as amended to date (Exhibit 3.1 to Morgan Stanley�s Current Report on Form 8-K dated March 9, 2010). | |
| 4.1 | Indenture dated as of February�24, 1993 between Morgan Stanley and The Bank of New York, as trustee (Exhibit 4 to Morgan Stanley�s Registration Statement on Form S-3 (No. 33-57202)). | |
| 4.2 | Amended and Restated Senior Indenture dated as of May�1, 1999 between Morgan Stanley and The Bank of New York, as trustee (Exhibit 4-e to Morgan Stanley�s Registration Statement on Form S-3/A (No. 333-75289) as amended by Fourth Supplemental Senior Indenture dated as of October 8, 2007 (Exhibit 4.3 to Morgan Stanley�s Annual Report on Form 10-K for the fiscal year ended November 30, 2007). | |
| 4.3 | Senior Indenture dated as of November�1, 2004 between Morgan Stanley and The Bank of New York, as trustee (Exhibit 4-f to Morgan Stanley�s Registration Statement on Form S-3/A (No.�333-117752), as amended by First Supplemental Senior Indenture dated as of September 4, 2007 (Exhibit 4.5 to Morgan Stanley�s Annual Report on Form 10-K for the fiscal year ended November 30, 2007), Second Supplemental Senior Indenture dated as of January 4, 2008 (Exhibit 4.1 to Morgan Stanley�s Current Report on Form 8-K dated January 4, 2008), Third Supplemental Senior Indenture dated as of September 10, 2008 (Exhibit 4 to Morgan Stanley�s Quarterly Report on Form 10-Q for the quarter ended August 31, 2008), Fourth Supplemental Senior Indenture dated as of December 1, 2008 (Exhibit 4.1 to Morgan Stanley�s Current Report on Form 8-K dated December 1, 2008) and Fifth Supplemental Senior Indenture dated as of April 1, 2009 (Exhibit 4 to Morgan Stanley�s Quarterly Report on Form 10-Q for the quarter ended March 31, 2009). | |
| 4.4 | The Unit Agreement Without Holders� Obligations, dated as of August 29, 2008, between Morgan Stanley and The Bank of New York Mellon, as Unit Agent, as Trustee and Paying Agent under the Senior Indenture referred to therein and as Warrant Agent under the Warrant Agreement referred to therein (Exhibit 4.1 to Morgan Stanley�s Current Report on Form 8-K dated August 29, 2008). | |
| 4.5 | Amended and Restated Subordinated Indenture dated as of May�1, 1999 between Morgan Stanley and The Bank of New York, as trustee (Exhibit 4-f to Morgan Stanley�s Registration Statement on Form S-3/A (No. 333-75289)). | |
| 4.6 | Subordinated Indenture dated as of October�1, 2004 between Morgan Stanley and The Bank of New York, as trustee (Exhibit 4-g to Morgan Stanley�s Registration Statement on Form S-3/A (No.�333-117752)). | |
| (1) | For purposes of this Exhibit Index, references to �The Bank of New York� mean in some instances the entity successor to JPMorgan Chase Bank, N.A. or J.P. Morgan Trust Company, National Association; references to �JPMorgan Chase Bank, N.A.� mean the entity formerly known as The Chase Manhattan Bank, in some instances as the successor to Chemical Bank; references to �J.P. Morgan Trust Company, N.A.� mean the entity formerly known as Bank One Trust Company, N.A., as successor to The First National Bank of Chicago. |
| E-1 |
Table of Contents| Exhibit No. | Description | |
| 4.7 | Junior Subordinated Indenture dated as of March�1, 1998 between Morgan Stanley and The Bank of New York, as trustee (Exhibit 4.1 to Morgan Stanley�s Quarterly Report on Form 10-Q for the quarter ended February�28, 1998). | |
| 4.8 | Junior Subordinated Indenture dated as of October�1, 2004 between Morgan Stanley and The Bank of New York, as trustee (Exhibit 4-ww to Morgan Stanley�s Registration Statement on Form S-3/A (No.�333-117752)). | |
| 4.9 | Junior Subordinated Indenture dated as of October�12, 2006 between Morgan Stanley and The Bank of New York, as trustee (Exhibit 4.1 to Morgan Stanley�s Current Report on Form 8-K dated October�12, 2006). | |
| 4.10 | Deposit Agreement dated as of July�6, 2006 among Morgan Stanley, JPMorgan Chase Bank, N.A. and the holders from time to time of the depositary receipts described therein (Exhibit 4.3 to Morgan Stanley�s Quarterly Report on Form 10-Q for the quarter ended May�31, 2006). | |
| 4.11 | Depositary Receipt for Depositary Shares, representing Floating Rate Non-Cumulative Preferred Stock, Series A (included in Exhibit 4.10 hereto). | |
| 4.12 | Amended and Restated Trust Agreement of Morgan Stanley Capital Trust III dated as of February 27, 2003 among Morgan Stanley, as depositor, The Bank of New York, as property trustee, The Bank of New York (Delaware), as Delaware trustee, and the administrators named therein (Exhibit 4 to Morgan Stanley�s Quarterly Report on Form 10-Q for the quarter ended February 28, 2003). | |
| 4.13 | Amended and Restated Trust Agreement of Morgan Stanley Capital Trust IV dated as of April 21, 2003 among Morgan Stanley, as depositor, The Bank of New York, as property trustee, The Bank of New York (Delaware), as Delaware Trustee and the administrators named therein (Exhibit 4 to Morgan Stanley�s Quarterly Report on Form 10-Q for the quarter ended May 31, 2003). | |
| 4.14 | Amended and Restated Trust Agreement of Morgan Stanley Capital Trust V dated as of July 16, 2003 among Morgan Stanley, as depositor, The Bank of New York, as property trustee, The Bank of New York (Delaware), as Delaware trustee and the administrators named therein (Exhibit 4 to Morgan Stanley�s Quarterly Report on Form 10-Q for the quarter ended August 31, 2003). | |
| 4.15 | Amended and Restated Trust Agreement of Morgan Stanley Capital Trust VI dated as of January 26, 2006 among Morgan Stanley, as depositor, The Bank of New York, as property trustee, The Bank of New York (Delaware), as Delaware trustee and the administrators named therein (Exhibit 4 to Morgan Stanley�s Quarterly Report on Form 10-Q for the quarter ended February 28, 2006). | |
| 4.16 | Amended and Restated Trust Agreement of Morgan Stanley Capital Trust VII dated as of October 12, 2006 among Morgan Stanley, as depositor, The Bank of New York, as property trustee, The Bank of New York (Delaware), as Delaware trustee and the administrators named therein (Exhibit 4.3 to Morgan Stanley�s Current Report on Form 8-K dated October 12, 2006). | |
| 4.17 | Amended and Restated Trust Agreement of Morgan Stanley Capital Trust VIII dated as of April 26, 2007 among Morgan Stanley, as depositor, The Bank of New York, as property trustee, The Bank of New York (Delaware), as Delaware trustee and the administrators named therein (Exhibit 4.3 to Morgan Stanley�s Current Report on Form 8-K dated April 26, 2007). | |
| 4.18 | Instruments defining the Rights of Security Holders, Including Indentures�Except as set forth in Exhibits 4.1 through 4.17 above, the instruments defining the rights of holders of long-term debt securities of Morgan Stanley and its subsidiaries are omitted pursuant to Section (b)(4)(iii) of Item 601 of Regulation S-K. Morgan Stanley hereby agrees to furnish copies of these instruments to the SEC upon request. | |
| | E-2 |
| Exhibit No. | Description | |
| 10.1 | Amended and Restated Trust Agreement dated as of April 20, 2010 by and between Morgan Stanley and State Street Bank and Trust Company (Exhibit 10 to Morgan Stanley�s Quarterly Report on Form 10-Q for the quarter ended June 30, 2010). | |
| 10.2 | Amended and Restated Joint Venture Contribution and Formation Agreement dated as of May 29, 2009 by and among Citigroup Inc. and Morgan Stanley and Morgan Stanley Smith Barney Holdings LLC (Exhibit 10.1 to Morgan Stanley�s Current Report on Form 8-K dated May 29, 2009). | |
| 10.3 | Transaction Agreement dated as of October 19, 2009 between Morgan Stanley and Invesco Ltd. (Exhibit 10 to Morgan Stanley�s Quarterly Report on Form 10-Q for the quarter ended September 30, 2009). | |
| 10.4 | Letter Agreement dated as of May 28, 2010 between Morgan Stanley and Invesco Ltd. (Exhibit 2.1 to Morgan Stanley�s Current Report on Form 8-K dated May�28, 2010). | |
| 10.5� | Morgan Stanley 401(k) Plan (f/k/a the Morgan Stanley DPSP/START Plan) dated as of October 1, 2002 (Exhibit 10.17 to Morgan Stanley�s Annual Report on Form 10-K for the fiscal year ended November 30, 2002) as amended by Amendment (Exhibit 10.18 to Morgan Stanley�s Annual Report on Form 10-K for the fiscal year ended November 30, 2002), Amendment (Exhibit 10.18 to Morgan Stanley�s Annual Report on Form 10-K for the fiscal year ended November 30, 2003), Amendment (Exhibit 10.19 to Morgan Stanley�s Annual Report on Form 10-K for the fiscal year ended November 30, 2003), Amendment (Exhibit 10 to Morgan Stanley�s Quarterly Report on Form 10-Q for the quarter ended May 31, 2004), Amendment (Exhibit 10.16 to Morgan Stanley�s Annual Report on Form 10-K for the fiscal year ended November 30, 2004), Amendment (Exhibit 10.1 to Morgan Stanley�s Quarterly Report on Form 10-Q for the quarter ended February 28, 2005), Amendment (Exhibit 10.2 to Morgan Stanley�s Quarterly Report on Form 10-Q for the quarter ended February 28, 2005), Amendment (Exhibit 10.1 to Morgan Stanley�s Quarterly Report on Form 10-Q for the quarter ended May 31, 2005), Amendment (Exhibit 10.8 to Morgan Stanley�s Annual Report on Form 10-K for the fiscal year ended November 30, 2005), Amendment (Exhibit 10 to Morgan Stanley�s Quarterly Report on Form 10-Q for the quarter ended February 28, 2007), Amendment (Exhibit 10.2 to Morgan Stanley�s Quarterly Report on Form 10-Q for the quarter ended August 31, 2007), Amendment (Exhibit 10.6 to Morgan Stanley�s Annual Report on Form 10-K for the fiscal year ended November 30, 2007), Amendment (Exhibit 10.1 to Morgan Stanley�s Quarterly Report on Form 10-Q for the quarter ended August 31, 2008), Amendment (Exhibit 10.12 to Morgan Stanley�s Annual Report on Form 10-K for the fiscal year ended November 30, 2008), Amendment (Exhibit�10.1 to Morgan Stanley�s Quarterly Report on Form 10-Q for the quarter ended March�31, 2009), Amendment (Exhibit 10.2 to Morgan Stanley�s Quarterly Report on Form 10-Q for the quarter ended June�30, 2009) and Amendment (Exhibit 10.9 to Morgan Stanley�s Annual Report on Form 10-K for the year ended December 31, 2009). | |
| 10.6�* | Amendment to Morgan Stanley 401(k) Plan, dated as of December 23, 2010. | |
| 10.7� | Morgan Stanley 401(k) Savings Plan, dated as of July 1, 2009 (Exhibit 10.3 to Morgan Stanley�s Quarterly Report on Form 10-Q for the quarter ended June 30, 2009) as amended by Amendment (Exhibit 10.11 to Morgan Stanley�s Annual Report on Form 10-K for the year ended December 31, 2009). | |
| 10.8�* | Amendment to Morgan Stanley 401(k) Savings Plan, dated as of December 23, 2010. | |
| 10.9� | 1994 Omnibus Equity Plan as amended and restated (Exhibit 10.23 to Morgan Stanley�s Annual Report on Form 10-K for the fiscal year ended November 30, 2003) as amended by Amendment (Exhibit 10.11 to Morgan Stanley�s Annual Report on Form 10-K for the fiscal year ended November 30, 2006). | |
| E-3 |
Table of Contents| Exhibit No. | Description | |
| 10.10� | Tax Deferred Equity Participation Plan as amended and restated as of November 26, 2007 (Exhibit 10.9 to Morgan Stanley�s Annual Report on Form 10-K for the fiscal year ended November 30, 2007). | |
| 10.11� | Directors� Equity Capital Accumulation Plan as amended through November 16, 2009 (Exhibit 10.14 to Morgan Stanley�s Annual Report on Form 10-K for the year ended December 31, 2009). | |
| 10.12� | Select Employees� Capital Accumulation Program as amended and restated as of May 7, 2008 (Exhibit 10.1 to Morgan Stanley�s Quarterly Report on Form 10-Q for the quarter ended May 31, 2008). | |
| 10.13� | Form of Term Sheet under the Select Employees� Capital Accumulation Program (Exhibit 10.9 to Morgan Stanley�s Quarterly Report on Form 10-Q for the quarter ended February�29, 2008). | |
| 10.14� | Employees� Equity Accumulation Plan as amended and restated as of November 26, 2007 (Exhibit�10.12 to Morgan Stanley�s Annual Report on Form 10-K for the fiscal year ended November 30, 2007). | |
| 10.15� | Employee Stock Purchase Plan as amended and restated as of February 1, 2009 (Exhibit 10.20 to Morgan Stanley�s Annual Report on Form 10-K for the fiscal year ended November 30, 2008). | |
| 10.16� | Form of Agreement under the Morgan Stanley & Co. Incorporated Owners� and Select Earners� Plan (Exhibit 10.1 to MSG�s Annual Report on Form 10-K for the fiscal year ended January 31, 1993). | |
| 10.17� | Form of Agreement under the Officers� and Select Earners� Plan (Exhibit 10.2 to MSG�s Annual Report on Form 10-K for the fiscal year ended January 31, 1993). | |
| 10.18� | Morgan Stanley Supplemental Executive Retirement and Excess Plan, amended and restated effective December 31, 2008 (Exhibit 10.2 to Morgan Stanley�s Quarterly Report on Form 10-Q for the quarter ended March 31, 2009) as amended by Amendment (Exhibit 10.5 to Morgan Stanley�s Quarterly Report on Form 10-Q for the quarter ended June 30, 2009). | |
| 10.19�* | Amendment to Morgan Stanley Supplemental Executive Retirement and Excess Plan, dated as of December 23, 2010. | |
| 10.20� | 1995 Equity Incentive Compensation Plan (Annex A to MSG�s Proxy Statement for its 1996 Annual Meeting of Stockholders) as amended by Amendment (Exhibit 10.39 to Morgan Stanley�s Annual Report on Form 10-K for the fiscal year ended November 30, 2000), Amendment (Exhibit 10.5 to Morgan Stanley�s Quarterly Report on Form 10-Q for the quarter ended August 31, 2005), Amendment (Exhibit 10.3 to Morgan Stanley�s Quarterly Report on Form 10-Q for the quarter ended February 28, 2006), Amendment (Exhibit 10.24 to Morgan Stanley�s Annual Report on Form 10-K for the fiscal year ended November 30, 2006) and Amendment (Exhibit 10.22 to Morgan Stanley�s Annual Report on Form 10-K for the fiscal year ended November 30, 2007). | |
| 10.21� | Form of Equity Incentive Compensation Plan Award Certificate (Exhibit 10.1 to Morgan Stanley�s Quarterly Report on Form 10-Q for the quarter ended August 31, 2004). | |
| 10.22� | Form of Equity Incentive Compensation Plan Award Certificate (Exhibit 10.10 to Morgan Stanley�s Quarterly Report on Form 10-Q for the quarter ended August 31, 2005). | |
| 10.23� | Form of Chief Executive Officer Equity Award Certificate for Discretionary Retention Award of Stock Units and Stock Options (Exhibit 10.28 to Morgan Stanley�s Annual Report on Form 10-K for the fiscal year ended November 30, 2006). | |
| 10.24� | Form of Management Committee Equity Award Certificate for Discretionary Retention Award of Stock Units and Stock Options (Exhibit 10.30 to Morgan Stanley�s Annual Report on Form 10-K for the fiscal year ended November 30, 2006). | |
| | E-4 |
| Exhibit No. | Description | |
| 10.25� | 1988 Capital Accumulation Plan as amended (Exhibit 10.13 to MSG�s Annual Report on Form 10-K for the fiscal year ended January 31, 1993). | |
| 10.26� | Form of Deferred Compensation Agreement under the Pre-Tax Incentive Program (Exhibit 10.12 to MSG�s Annual Report on Form 10-K for the fiscal year ended January 31, 1994). | |
| 10.27� | Form of Deferred Compensation Agreement under the Pre-Tax Incentive Program 2 (Exhibit 10.12 to MSG�s Annual Report for the fiscal year ended November 30, 1996). | |
| 10.28� | Key Employee Private Equity Recognition Plan (Exhibit 10.43 to Morgan Stanley�s Annual Report on Form 10-K for the fiscal year ended November 30, 2000). | |
| 10.29� | Morgan Stanley Branch Manager Compensation Plan as amended and restated as of November 26, 2007 (Exhibit 10.33 to Morgan Stanley�s Annual Report on Form 10-K for the fiscal year ended November 30, 2007). | |
| 10.30� | Morgan Stanley Financial Advisor and Investment Representative Compensation Plan as amended and restated as of November 26, 2007 (Exhibit 10.34 to Morgan Stanley�s Annual Report on Form 10-K for the fiscal year ended November 30, 2007). | |
| 10.31� | Morgan Stanley UK Share Ownership Plan (Exhibit 4.1 to Morgan Stanley�s Registration Statement on Form S-8 (No. 333-146954)). | |
| 10.32� | Supplementary Deed of Participation for the Morgan Stanley UK Share Ownership Plan, dated as of November 5, 2009 (Exhibit 10.36 to Morgan Stanley�s Annual Report on Form 10-K for the year ended December 31, 2009). | |
| 10.33� | Aircraft Time Sharing Agreement dated as of March 10, 2009 by and between Morgan Stanley Management Services II, Inc. and John J. Mack (Exhibit 10.4 to Morgan Stanley�s Quarterly Report on Form 10-Q for the quarter ended March 31, 2009). | |
| 10.34� | Aircraft Time Sharing Agreement, dated as of January 1, 2010, by and between�Corporate Services�Support Corp.�and James P. Gorman (Exhibit 10.1 to Morgan Stanley�s Quarterly Report on Form 10-Q for the quarter ended March 31, 2010). | |
| 10.35� | Agreement between Morgan Stanley and James P. Gorman, dated August 16, 2005, and amendment to agreement dated December 17, 2008 (Exhibit 10.2 to Morgan Stanley�s Quarterly Report on Form 10-Q for the quarter ended March 31, 2010). | |
| 10.36� | Agreement between Morgan Stanley and Kenneth M. deRegt, dated February 14, 2008 (Exhibit 10.3 to Morgan Stanley�s Quarterly Report on Form 10-Q for the quarter ended March 31, 2010). | |
| 10.37� | Memorandum dated as of August 21, 2007 to Walid Chammah regarding Relocation from United States to London Office (Exhibit 10.7 to Morgan Stanley�s Quarterly Report on Form 10-Q for the quarter ended March 31, 2009). | |
| 10.38� | Memorandum dated as of February 16, 2006 to Colm Kelleher regarding Expatriate Relocation Policy and European Tax Equalisation Policy (Exhibit 10.6 to Morgan Stanley�s Quarterly Report on Form 10-Q for the quarter ended February�29, 2008). | |
| 10.39� | Form of Restrictive Covenant Agreement (Exhibit 10 to Morgan Stanley�s Current Report on Form�8-K dated November 22, 2005). | |
| 10.40� | Morgan Stanley Performance Formula and Provisions (Exhibit 10.3 to Morgan Stanley�s Quarterly Report on Form 10-Q for the quarter ended May 31, 2006). | |
| 10.41� | 2007 Equity Incentive Compensation Plan, as amended and restated as of March 19, 2010 (Exhibit 10.1 to Morgan Stanley�s Current Report on Form 8-K dated May 18, 2010). | |
| 10.42� | Morgan Stanley 2006 Notional Leveraged Co-Investment Plan, as amended and restated as of November 28, 2008 (Exhibit 10.47 to Morgan Stanley�s Annual Report on Form 10-K for the fiscal year ended November 30, 2008). | |
| E-5 |
Table of Contents| Exhibit No. | Description | |
| 10.43� | Form of Award Certificate under the 2006 Notional Leveraged Co-Investment Plan (Exhibit 10.7 to Morgan Stanley�s Quarterly Report on Form 10-Q for the quarter ended February�29, 2008). | |
| 10.44� | Morgan Stanley 2007 Notional Leveraged Co-Investment Plan, amended as of June 4, 2009 (Exhibit 10.6 to Morgan Stanley�s Quarterly Report on Form 10-Q for the quarter ended June 30, 2009). | |
| 10.45� | Form of Award Certificate under the 2007 Notional Leveraged Co-Investment Plan for Certain Management Committee Members (Exhibit 10.8 to Morgan Stanley�s Quarterly Report on Form�10-Q for the quarter ended February�29, 2008). | |
| 10.46� | Form of Award Certificate for Discretionary Retention Awards of Stock Units to Certain Management Committee Members (Exhibit 10.10 to Morgan Stanley�s Quarterly Report on Form�10-Q for the quarter ended February�29, 2008). | |
| 10.47� | Form of Award Certificate for Discretionary Retention Awards of Stock Units (Exhibit 10.8 to Morgan Stanley�s Quarterly Report on Form�10-Q for the quarter ended March 31, 2009). | |
| 10.48� | Form of Award Certificate for Discretionary Retention Awards of Stock Units (Exhibit 10.4 to Morgan Stanley�s Quarterly Report on Form�10-Q for the quarter ended March 31, 2010). | |
| 10.49� | Governmental Service Amendment to Outstanding Stock Option and Stock Unit Awards (replacing and superseding in its entirety Exhibit 10.3 to Morgan Stanley�s Quarterly Report on Form 10-Q for the quarter ended May�31, 2007) (Exhibit 10.41 to Morgan Stanley�s Annual Report on Form 10-K for the fiscal year ended November�30, 2007). | |
| 10.50� | Amendment to Outstanding Stock Option and Stock Unit Awards (Exhibit 10.53 to Morgan Stanley�s Annual Report on Form 10-K for the fiscal year ended November 30, 2008). | |
| 10.51� | Morgan Stanley Compensation Incentive Plan (Exhibit 10.54 to Morgan Stanley�s Annual Report on Form 10-K for the fiscal year ended November 30, 2008). | |
| 10.52� | Form of Award Certificate under the Morgan Stanley Compensation Incentive Plan (Exhibit 10.9 to Morgan Stanley�s Quarterly Report on Form�10-Q for the quarter ended March 31, 2009). | |
| 10.53� | Form of Award Certificate under the Morgan Stanley Compensation Incentive Plan (Exhibit 10.5 to Morgan Stanley�s Quarterly Report on Form�10-Q for the quarter ended March 31, 2010). | |
| 10.54� | Form of Executive Waiver (Exhibit 10.55 to Morgan Stanley�s Annual Report on Form 10-K for the fiscal year ended November 30, 2008). | |
| 10.55� | Form of Executive Letter Agreement (Exhibit 10.56 to Morgan Stanley�s Annual Report on Form�10-K for the fiscal year ended November 30, 2008). | |
| 10.56� | Morgan Stanley 2009 Replacement Equity Incentive Compensation Plan for Morgan Stanley Smith Barney Employees (Exhibit 4.2 to Morgan Stanley�s Registration Statement on Form S-8 (No.�333-159504)). | |
| 10.57� | Form of Award Certificate for Performance Stock Units (Exhibit 10.6 to Morgan Stanley�s Quarterly Report on Form�10-Q for the quarter ended March 31, 2010). | |
| 12* | Statement Re: Computation of Ratio of Earnings to Fixed Charges and Computation of Ratio of Earnings to Fixed Charges and Preferred Stock Dividends. | |
| 21* | Subsidiaries of Morgan Stanley. | |
| 23.1* | Consent of Deloitte & Touche LLP. | |
| 24 | Powers of Attorney (included on signature page). | |
| | E-6 |
| Exhibit No. | Description | |
| 31.1** | Rule 13a-14(a) Certification of Chief Executive Officer. | |
| 31.2** | Rule 13a-14(a) Certification of Chief Financial Officer. | |
| 32.1** | Section 1350 Certification of Chief Executive Officer. | |
| 32.2** | Section 1350 Certification of Chief Financial Officer. | |
| 101*** | Interactive data files pursuant to Rule 405 of Regulation S-T: (i)�the Consolidated Statements of Financial Condition�December 31, 2010 and December 31, 2009, (ii)�the Consolidated Statements of Income�Twelve Months Ended December 31, 2010, December 31, 2009 and November 30, 2008 and One Month Ended December 31, 2008, (iii)�the Consolidated Statements of Comprehensive Income�Twelve Months Ended December 31, 2010, December 31, 2009 and November 30, 2008 and One Month Ended December 31, 2008, (iv)�the Consolidated Statements of Cash Flows�Twelve Months Ended December 31, 2010, December 31, 2009 and November 30, 2008 and One Month Ended December 31, 2008, (v)�the Consolidated Statements of Changes in Total Equity�Twelve Months Ended December 31, 2010, December 31, 2009, November 30, 2008 and One Month Ended December 31, 2008, and (vi)�Notes to Consolidated Financial Statements. | |
| * | Filed herewith. |
| ** | Furnished herewith. |
| *** | As provided in Rule 406T of Regulation S-T, this information is furnished and not filed for purposes of Sections 11 and 12 of the Securities Act of 1933 and Section�18 of the Securities Exchange Act of 1934. |
| � | Management contract or compensatory plan or arrangement required to be filed as an exhibit to this Form 10-K pursuant to Item�15(b). |
| E-7 |
Table of Contents