UNITED STATES SECURITIES AND EXCHANGE COMMISSION
Washington, D.C. 20549
FORM 10-K
Annual Report Pursuant to Section 13 or 15(d) of the Securities Exchange Act of 1934
For the year ended December 31, 2009
Commission File Number 1-11758

(Exact name of Registrant as specified in its charter)
Delaware (State or other jurisdiction of incorporation or organization) | 1585 Broadway New York, NY 10036 (Address of principal executive offices, | 36-3145972 (I.R.S. Employer Identification No.) | (212) 761-4000 (Registrant's telephone number, | |||
Title of each class | Name of exchange on which registered | |
Securities registered pursuant to Section 12(b) of the Act: | ||
| Common Stock, $0.01 par value | New York Stock Exchange | |
Depositary Shares, each representing 1/1,000th interest in a share of Floating Rate Non-Cumulative Preferred Stock, Series A, $0.01 par value | New York Stock Exchange | |
| 6 1 / 4 % Capital Securities of Morgan Stanley Capital Trust III (and Registrant's guaranty with respect thereto) | New York Stock Exchange | |
| 6 1 / 4 % Capital Securities of Morgan Stanley Capital Trust IV (and Registrant's guaranty with respect thereto) | New York Stock Exchange | |
| 5 3 / 4 % Capital Securities of Morgan Stanley Capital Trust V (and Registrant's guaranty with respect thereto) | New York Stock Exchange | |
| 6.60% Capital Securities of Morgan Stanley Capital Trust VI (and Registrant's guaranty with respect thereto) | New York Stock Exchange | |
| 6.60% Capital Securities of Morgan Stanley Capital Trust VII (and Registrant's guaranty with respect thereto) | New York Stock Exchange | |
| 6.45% Capital Securities of Morgan Stanley Capital Trust VIII (and Registrant's guaranty with respect thereto) | New York Stock Exchange | |
| Exchangeable Notes due December 30, 2010; Exchangeable Notes due June 30, 2011 | NYSE Amex LLC | |
| BRIDGES SM due June 15, 2010 | NYSE Arca, Inc. | |
Capital Protected Notes due April 20, 2010; Capital Protected Notes due July 20, 2010 (2 issuances); Capital Protected Notes due August 30, 2010; Capital Protected Notes due October 30, 2010; Capital Protected Notes due January 30, 2011; Capital Protected Notes due February 20, 2011; Capital Protected Notes due March 30, 2011 (2 issuances); Capital Protected Notes due June 30, 2011; Capital Protected Notes due August 20, 2011; Capital Protected Notes due October 30, 2011; Capital Protected Notes due December 30, 2011; Capital Protected Notes due September 30, 2012 | NYSE Arca, Inc. | |
Capital Protected Notes due September 1, 2010 | The NASDAQ Stock Market LLC | |
| MPS SM due June 15, 2010; MPS due December 30, 2010; MPS due March 30, 2012 | NYSE Arca, Inc. | |
| MPS due December 30, 2010 | NYSE Amex LLC | |
| Stock Participation Notes due September 15, 2010; Stock Participation Notes due December 30, 2010 | NYSE Amex LLC | |
| Buffered PLUS SM due December 20, 2010; Buffered PLUS due March 20, 2011 | NYSE Arca, Inc. | |
| PROPELS SM due December 30, 2011 (3 issuances) | NYSE Arca, Inc. | |
Protected Absolute Return Barrier Notes due March 20, 2010; Protected Absolute Return Barrier Notes due July 20, 2010; Protected Absolute Return Barrier Notes due August 20, 2010; Protected Absolute Return Barrier Notes due March 20, 2011 | NYSE Arca, Inc. | |
| Strategic Total Return Securities due July 30, 2011 | NYSE Arca, Inc. | |
| Market Vectors ETNs due March 31, 2020 (2 issuances); Market Vectors ETNs due April 30, 2020 (2 issuances) | NYSE Arca, Inc. | |
Targeted Income Strategic Total Return Securities due March 30, 2010; Targeted Income Strategic Total Return Securities due July 30, 2011; Targeted Income Strategic Total Return Securities due January 15, 2012 | NYSE Arca, Inc. | |
Targeted Income Strategic Total Return Securities due October 30, 2011 | The NASDAQ Stock Market LLC | |
Indicate by check mark if Registrant is a well-known seasoned issuer, as defined in Rule 405 of the Securities Act. YES x NO ¨
Indicate by check mark if Registrant is not required to file reports pursuant to Section 13 or 15(d) of the Act. YES ¨ NO x
Indicate by check mark whether Registrant (1) has filed all reports required to be filed by Section 13 or 15(d) of the Securities Exchange Act of 1934 during the preceding 12 months (or for such shorter period that Registrant was required to file such reports), and (2) has been subject to such filing requirements for the past 90 days. YES x NO ¨
Indicate by check mark whether the Registrant has submitted electronically and posted on its corporate Web site, if any, every Interactive Data File required to be submitted and posted pursuant to Rule 405 of Regulation S-T (§ 232.405 of this chapter) during the preceding 12 months (or for such shorter period that the Registrant was required to submit and post such files). Yes x No ¨
Indicate by check mark if disclosure of delinquent filers pursuant to Item 405 of Regulation S-K is not contained herein, and will not be contained, to the best of Registrant's knowledge, in definitive proxy or information statements incorporated by reference in Part III of this Form 10-K or any amendment to this Form 10-K. x
Indicate by check mark whether the Registrant is a large accelerated filer, an accelerated filer, a non-accelerated filer, or a smaller reporting company. See the definitions of "large accelerated filer," "accelerated filer" and "smaller reporting company" in Rule 12b-2 of the Exchange Act. (Check one):
Large Accelerated Filer x Non-Accelerated Filer ¨ (Do not check if a smaller reporting company) | Accelerated Filer ¨ Smaller reporting company ¨ |
Indicate by check mark whether Registrant is a shell company (as defined in Exchange Act Rule 12b-2). YES ¨ NO x
As of June 30, 2009, the aggregate market value of the common stock of Registrant held by non-affiliates of Registrant was approximately $38,566,093,047. This calculation does not reflect a determination that persons are affiliates for any other purposes.
As of January 31, 2010, there were 1,398,087,044 shares of Registrant's common stock, $0.01 par value, outstanding.
Documents Incorporated By Reference: Portions of Registrant's definitive proxy statement for its 2010 annual meeting of shareholders are incorporated by reference in Part III of this Form 10-K.
ANNUAL REPORT ON FORM 10-K
for the year ended December 31, 2009
| Table of Contents | Page |
| Part I | ||||
Item 1. | Business | 1 | ||
Overview | 1 | |||
Available Information | 1 | |||
Business Segments | 2 | |||
Institutional Securities | 2 | |||
Global Wealth Management Group | 5 | |||
Asset Management | 6 | |||
Research | 7 | |||
Competition | 7 | |||
Supervision and Regulation | 8 | |||
Executive Officers of Morgan Stanley | 15 | |||
Item 1A. | Risk Factors | 17 | ||
Item 1B. | Unresolved Staff Comments | 25 | ||
Item 2. | Properties | 26 | ||
Item 3. | Legal Proceedings | 27 | ||
Item 4. | Submission of Matters to a Vote of Security Holders | 29 | ||
| Part II | ||||
Item 5. | Market for Registrant's Common Equity, Related Stockholder Matters and Issuer Purchases of Equity Securities | 30 | ||
Item 6. | Selected Financial Data | 33 | ||
Item 7. | Management's Discussion and Analysis of Financial Condition and Results of Operations | 35 | ||
Introduction | 35 | |||
Executive Summary | 37 | |||
Certain Factors Affecting Results of Operations | 44 | |||
Equity Capital-Related Transactions | 46 | |||
Business Segments | 47 | |||
Accounting Developments | 64 | |||
Regulatory Outlook | 64 | |||
Other Matters | 66 | |||
Critical Accounting Policies | 68 | |||
Liquidity and Capital Resources | 74 | |||
Item 7A. | Quantitative and Qualitative Disclosures about Market Risk | 89 | ||
Item 8. | Financial Statements and Supplementary Data | 112 | ||
Report of Independent Registered Public Accounting Firm | 112 | |||
Consolidated Statements of Financial Condition | 113 | |||
i

| Page | ||||
Consolidated Statements of Income | 115 | |||
Consolidated Statements of Comprehensive Income | 116 | |||
Consolidated Statements of Cash Flows | 117 | |||
Consolidated Statements of Changes in Total Equity | 118 | |||
Notes to Consolidated Financial Statements | 120 | |||
Financial Data Supplement (Unaudited) | 230 | |||
| Item 9. | Changes in and Disagreements with Accountants on Accounting and Financial Disclosure | 235 | ||
| Item 9A. | Controls and Procedures | 235 | ||
| Item 9B. | Other Information | 237 | ||
| Part III | ||||
| Item 10. | Directors, Executive Officers and Corporate Governance | 238 | ||
| Item 11. | Executive Compensation | 238 | ||
| Item 12. | Security Ownership of Certain Beneficial Owners and Management and Related Stockholder Matters | 239 | ||
| Item 13. | Certain Relationships and Related Transactions, and Director Independence | 239 | ||
| Item 14. | Principal Accountant Fees and Services | 239 | ||
| Part IV | ||||
| Item 15. | Exhibits and Financial Statement Schedules | 240 | ||
| Signatures | S-1 | |||
| Exhibit Index | E-1 | |||
ii
Forward-Looking Statements
We have included or incorporated by reference into this report, and from time to time may make in our public filings, press releases or other public statements, certain statements, including (without limitation) those under "Legal Proceedings" in Part I, Item 3, "Management's Discussion and Analysis of Financial Condition and Results of Operations" in Part II, Item 7 and "Quantitative and Qualitative Disclosures about Market Risk" in Part II, Item 7A, that may constitute "forward-looking statements" within the meaning of the safe harbor provisions of the Private Securities Litigation Reform Act of 1995. In addition, our management may make forward-looking statements to analysts, investors, representatives of the media and others. These forward-looking statements are not historical facts and represent only Morgan Stanley's beliefs regarding future events, many of which, by their nature, are inherently uncertain and beyond our control.
The nature of Morgan Stanley's business makes predicting the future trends of our revenues, expenses and net income difficult. The risks and uncertainties involved in our businesses could affect the matters referred to in such statements and it is possible that our actual results may differ from the anticipated results indicated in these forward-looking statements. Important factors that could cause actual results to differ from those in the forward-looking statements include (without limitation):
| • | the effect of political and economic conditions and geopolitical events; |
| • | the effect of market conditions, particularly in the global equity, fixed income and credit markets, including corporate and mortgage (commercial and residential) lending and commercial real estate investments; |
| • | the impact of current, pending and future legislation, regulation, and legal actions in the U.S. and worldwide; |
| • | the level and volatility of equity, fixed income and commodity prices and interest rates, currency values and other market indices; |
| • | the availability and cost of both credit and capital as well as the credit ratings assigned to Morgan Stanley's unsecured short-term and long-term debt; |
| • | investor sentiment and confidence in the financial markets; |
| • | our reputation; |
| • | the actions and initiatives of current and potential competitors; |
| • | technological changes; and |
| • | other risks and uncertainties detailed under "Competition" and "Supervision and Regulation" in Part I, Item 1, "Risk Factors" in Part I, Item 1A, and elsewhere throughout this report. |
Accordingly, you are cautioned not to place undue reliance on forward-looking statements, which speak only as of the date on which they are made. Morgan Stanley undertakes no obligation to update publicly or revise any forward-looking statements to reflect the impact of circumstances or events that arise after the dates they are made, whether as a result of new information, future events or otherwise except as required by applicable law. You should, however, consult further disclosures Morgan Stanley may make in future filings of its Annual Reports on Form 10-K, Quarterly Reports on Form 10-Q and Current Reports on Form 8-K and any amendments thereto or in future press releases or other public statements.
iii
Part I
Item 1. Business.
Overview.
Morgan Stanley is a global financial services firm that, through its subsidiaries and affiliates, provides its products and services to a large and diversified group of clients and customers, including corporations, governments, financial institutions and individuals. Morgan Stanley was originally incorporated under the laws of the State of Delaware in 1981, and its predecessor companies date back to 1924. Morgan Stanley is a financial holding company regulated by the Board of Governors of the Federal Reserve System (the "Fed") under the Bank Holding Company Act of 1956, as amended (the "BHC Act"). Morgan Stanley conducts its business from its headquarters in and around New York City, its regional offices and branches throughout the U.S. and its principal offices in London, Tokyo, Hong Kong and other world financial centers. At December 31, 2009, Morgan Stanley had 61,388* employees worldwide. Unless the context otherwise requires, the terms "Morgan Stanley," the "Company," "we," "us" and "our" mean Morgan Stanley and its consolidated subsidiaries.
On December 16, 2008, the Board of Directors of the Company approved a change in the Company's fiscal year end from November 30 to December 31 of each year, beginning January 1, 2009. As a result of the change, the Company had a one month transition reporting period in December 2008. Financial information concerning Morgan Stanley, its business segments and geographic regions for each of the 12 months ended December 31, 2009 ("2009"), November 30, 2008 ("fiscal 2008"), November 30, 2007 ("fiscal 2007") and the one month ended December 31, 2008 is included in the consolidated financial statements and the notes thereto in "Financial Statements and Supplementary Data" in Part II, Item 8.
Available Information.
Morgan Stanley files annual, quarterly and current reports, proxy statements and other information with the Securities and Exchange Commission (the "SEC"). You may read and copy any document we file with the SEC at the SEC's public reference room at 100 F Street, NE, Washington, DC 20549. Please call the SEC at 1-800-SEC-0330 for information on the public reference room. The SEC maintains an internet site that contains annual, quarterly and current reports, proxy and information statements and other information that issuers (including Morgan Stanley) file electronically with the SEC. Morgan Stanley's electronic SEC filings are available to the public at the SEC's internet site, www.sec.gov .
Morgan Stanley's internet site is www.morganstanley.com . You can access Morgan Stanley's Investor Relations webpage at www.morganstanley.com/about/ir . Morgan Stanley makes available free of charge, on or through its Investor Relations webpage, its proxy statements, Annual Reports on Form 10-K, Quarterly Reports on Form 10-Q, Current Reports on Form 8-K and any amendments to those reports filed or furnished pursuant to the Securities Exchange Act of 1934, as amended (the "Exchange Act"), as soon as reasonably practicable after such material is electronically filed with, or furnished to, the SEC. Morgan Stanley also makes available, through its Investor Relations webpage, via a link to the SEC's internet site, statements of beneficial ownership of Morgan Stanley's equity securities filed by its directors, officers, 10% or greater shareholders and others under Section 16 of the Exchange Act.
Morgan Stanley has a Corporate Governance webpage. You can access information about Morgan Stanley's corporate governance at www.morganstanley.com/about/company/governance . Morgan Stanley posts the following on its Corporate Governance webpage:
| • | Amended and Restated Certificate of Incorporation; |
| • | Amended and Restated Bylaws; |
| * | Worldwide employees includes headcount related to the Morgan Stanley Smith Barney joint venture. |
1
| • | Charters for its Audit Committee; Internal Audit Subcommittee; Compensation, Management Development and Succession Committee; Nominating and Governance Committee; and Risk Committee; |
| • | Corporate Governance Policies; |
| • | Policy Regarding Communication with the Board of Directors; |
| • | Policy Regarding Director Candidates Recommended by Shareholders; |
| • | Policy Regarding Corporate Political Contributions; |
| • | Policy Regarding Shareholder Rights Plan; |
| • | Code of Ethics and Business Conduct; |
| • | Code of Conduct; and |
| • | Integrity Hotline information. |
Morgan Stanley's Code of Ethics and Business Conduct applies to all directors, officers and employees, including its Chief Executive Officer, Chief Financial Officer and Finance Director and Controller. Morgan Stanley will post any amendments to the Code of Ethics and Business Conduct and any waivers that are required to be disclosed by the rules of either the SEC or the New York Stock Exchange LLC ("NYSE") on its internet site. You can request a copy of these documents, excluding exhibits, at no cost, by contacting Investor Relations, 1585 Broadway, New York, NY 10036 (212-761-4000). The information on Morgan Stanley's internet site is not incorporated by reference into this report.
Business Segments.
Morgan Stanley is a global financial services firm that maintains significant market positions in each of its business segments-Institutional Securities, Global Wealth Management Group and Asset Management. A summary of the activities of each of the business segments follows.
Institutional Securities includes capital raising; financial advisory services, including advice on mergers and acquisitions, restructurings, real estate and project finance; corporate lending; sales, trading, financing and market-making activities in equity and fixed income securities and related products, including foreign exchange and commodities; and investment activities.
Global Wealth Management Group , which includes the Company's 51% interest in Morgan Stanley Smith Barney Holdings LLC ("MSSB"), provides brokerage and investment advisory services to individual investors and small-to-medium sized businesses and institutions covering various investment alternatives; financial and wealth planning services; annuity and other insurance products; credit and other lending products; cash management services; retirement services; and trust and fiduciary services.
Asset Management provides global asset management products and services in equity, fixed income, alternative investments, which includes hedge funds and funds of funds, and merchant banking, which includes real estate, private equity and infrastructure, to institutional and retail clients through proprietary and third-party distribution channels. Asset Management also engages in investment activities.
Institutional Securities.
Morgan Stanley provides financial advisory and capital-raising services to a diverse group of corporate and other institutional clients globally, primarily through wholly owned subsidiaries that include Morgan Stanley & Co. Incorporated ("MS&Co."), Morgan Stanley & Co. International plc, Morgan Stanley Japan Securities Co., Ltd. and Morgan Stanley Asia Limited. These and other subsidiaries also conduct sales and trading activities worldwide, as principal and agent, and provide related financing services on behalf of institutional investors.
2
Investment Banking and Corporate Lending Activities.
Financial Advisory Services. Morgan Stanley provides corporate and other institutional clients globally with advisory services on key strategic matters, such as mergers and acquisitions, divestitures, joint ventures, corporate restructurings, recapitalizations, spin-offs, exchange offers and leveraged buyouts and takeover defenses as well as shareholder relations. Morgan Stanley also provides advice concerning rights offerings, dividend policy, valuations, foreign exchange exposure, financial risk management strategies and financial planning. In addition, Morgan Stanley furnishes advice and services regarding project financings and provides advisory services in connection with the purchase, sale, leasing and financing of real estate.
Capital Raising. Morgan Stanley manages and participates in public offerings and private placements of debt, equity and other securities worldwide. Morgan Stanley is a leading underwriter of common stock, preferred stock and other equity-related securities, including convertible securities and American Depositary Receipts ("ADRs"). Morgan Stanley is a leading underwriter of fixed income securities, including investment grade debt, non-investment grade instruments, mortgage-related and other asset-backed securities, tax-exempt securities and commercial paper and other short-term securities.
Corporate Lending. Morgan Stanley provides loans or lending commitments, including bridge financing, to selected corporate clients through subsidiaries, including Morgan Stanley Bank, N.A. These loans and commitments have varying terms, may be senior or subordinated and/or secured or unsecured, are generally contingent upon representations, warranties and contractual conditions applicable to the borrower and may be syndicated, hedged or traded by Morgan Stanley*. The borrowers may be rated investment grade or non-investment grade.
Sales and Trading Activities.
Morgan Stanley conducts sales, trading, financing and market-making activities on securities and futures exchanges and in over-the-counter ("OTC") markets around the world. Morgan Stanley's Institutional Securities sales and trading activities include Equity Trading; Interest Rates, Credit and Currencies; Commodities; and Clients and Services.
Equity Trading. Morgan Stanley acts as principal (including as a market maker) and agent in executing transactions globally in equity and equity-related products, including common stock, ADRs, global depositary receipts and exchange-traded funds.
Morgan Stanley's equity derivatives sales, trading and market-making activities cover equity-related products globally, including equity swaps, options, warrants and futures overlying individual securities, indices and baskets of securities and other equity-related products. Morgan Stanley also issues and makes a principal market in equity-linked products to institutional and individual investors.
Interest Rates, Credit and Currencies. Morgan Stanley trades, makes markets and takes long and short proprietary positions in fixed income securities and related products globally, including, among other products, investment and non-investment grade corporate debt, distressed debt, bank loans, U.S. and other sovereign securities, emerging market bonds and loans, convertible bonds, collateralized debt obligations, credit, currency and other fixed income-linked notes, and securities issued by structured investment vehicles, mortgage-related and other asset-backed securities and real estate-loan products, municipal securities, preferred stock and commercial paper, money-market and other short-term securities. Morgan Stanley is a primary dealer of U.S. Federal Government securities and a member of the selling groups that distribute various U.S. agency and other debt securities. Morgan Stanley is also a primary dealer or market maker of government securities in numerous European, Asian and emerging market countries.
| * | Revenues and expenses associated with the trading of syndicated loans are included in "Sales and Trading Activities." |
3
Morgan Stanley trades, makes markets and takes long and short proprietary positions globally in listed futures and OTC swaps, forwards, options and other derivatives referencing, among other things, interest rates, currencies, investment grade and non-investment grade corporate credits, loans, bonds, U.S. and other sovereign securities, emerging market bonds and loans, credit indexes, asset-backed security indexes, property indexes, mortgage-related and other asset-backed securities and real estate loan products.
Morgan Stanley trades, makes markets and takes long and short proprietary positions in major foreign currencies, such as the Japanese yen, euro, British pound, Swiss franc and Canadian dollar, as well as in emerging markets currencies. Morgan Stanley trades these currencies on a principal basis in the spot, forward, option and futures markets.
Through the use of repurchase and reverse repurchase agreements, Morgan Stanley acts as an intermediary between borrowers and lenders of short-term funds and provides funding for various inventory positions. Morgan Stanley also provides financing to customers for commercial and residential real estate loan products and other securitizable asset classes. In addition, Morgan Stanley engages in principal securities lending with clients, institutional lenders and other broker-dealers.
Morgan Stanley advises on investment and liability strategies and assists corporations in their debt repurchases and tax planning. Morgan Stanley structures debt securities, derivatives and other instruments with risk/return factors designed to suit client objectives, including using repackaged asset and other structured vehicles through which clients can restructure asset portfolios to provide liquidity or reconfigure risk profiles.
Commodities. Morgan Stanley trades as principal and maintains long and short proprietary trading positions in the spot, forward and futures markets in several commodities, including metals (base and precious), agricultural products, crude oil, oil products, natural gas, electric power, emission credits, coal, freight, liquefied natural gas and related products and indices. Morgan Stanley is a market-maker in exchange-traded options and futures and OTC options and swaps on commodities, and offers counterparties hedging programs relating to production, consumption, reserve/inventory management and structured transactions, including energy-contract securitizations. Morgan Stanley is an electricity power marketer in the U.S. and owns electricity generating facilities in the U.S. and Europe.
Morgan Stanley owns TransMontaigne Inc. and its subsidiaries, a group of companies operating in the refined petroleum products marketing and distribution business, and owns an interest in Heidmar Holdings LLC, which owns a group of companies that provide international marine transportation and U.S. marine logistics services.
Clients and Services. Morgan Stanley provides financing services, including prime brokerage, which offers, among other services, consolidated clearance, settlement, custody, financing and portfolio reporting services to clients trading multiple asset classes. In addition, Morgan Stanley's institutional distribution and sales activities are overseen and coordinated through Clients and Services.
Investments. Morgan Stanley from time to time makes investments that represent business facilitation or principal investing activities. Business facilitation investments are strategic investments undertaken by Morgan Stanley to facilitate core business activities. Principal investing activities are investments and capital commitments provided to public and private companies, funds and other entities generally for proprietary purposes to maximize total returns to Morgan Stanley.
Morgan Stanley sponsors and manages investment vehicles and separate accounts for clients seeking exposure to private equity, real estate-related and other alternative investments. Morgan Stanley may also invest in and provide capital to such investment vehicles. See also "Asset Management."
4
Operations and Information Technology.
Morgan Stanley's Operations and Information Technology departments provide the process and technology platform that supports Institutional Securities sales and trading activity, including post-execution trade processing and related internal controls over activity from trade entry through settlement and custody, such as asset servicing. This is done for proprietary and customer transactions in listed and OTC transactions in commodities, equity and fixed income securities, including both primary and secondary trading, as well as listed, OTC and structured derivatives in markets around the world. This activity is undertaken through Morgan Stanley's own facilities, through membership in various clearing and settlement organizations, and through agreements with unaffiliated third parties.
Global Wealth Management Group.
Morgan Stanley's Global Wealth Management Group, which includes the Company's 51% interest in MSSB, provides comprehensive financial services to clients through a network of over 18,000 global representatives in approximately 895 locations at year end. As of December 31, 2009, Morgan Stanley had $1,560 billion in client assets.
Clients.
Global Wealth Management Group professionals serve individual investors and small-to-medium size businesses and institutions with an emphasis on ultra high net worth, high net worth and affluent investors. Financial advisors are located in branches across the U.S., and provide solutions designed to accommodate individual investment objectives, risk tolerance and liquidity needs. Call centers are available to meet the needs of emerging affluent clients. Outside the U.S., Global Wealth Management Group offers financial services to clients in Europe, the Middle East, Asia, Australia and Latin America.
Products and Services.
Morgan Stanley's Global Wealth Management Group provides clients with a comprehensive array of financial solutions, including products and services from Morgan Stanley, Citigroup Inc. ("Citi") and third-party providers, such as insurance companies and mutual fund families. Global Wealth Management Group provides brokerage and investment advisory services covering various types of investments, including equities, options, futures, foreign currencies, precious metals, fixed income securities, mutual funds, structured products, alternative investments, unit investment trusts, managed futures, separately managed accounts and mutual fund asset allocation programs. Global Wealth Management Group also offers education savings programs, financial and wealth planning services and annuity and other insurance products.
In addition, Global Wealth Management Group offers its clients access to several cash management services through various affiliates, including cash sweeps, debit cards, electronic bill payments and check writing, as well as lending products, including securities based lending, mortgage loans and home equity lines of credit. Global Wealth Management Group also offers access to cash management and commercial credit solutions to qualified small and medium businesses in the U.S., and provides individual and corporate retirement solutions, including IRAs and 401(k) plans and U.S. stock plan services to corporate executives and businesses.
Global Wealth Management Group provides clients a variety of ways to establish a relationship and conduct business, including brokerage accounts with transaction-based pricing and investment advisory accounts with asset-based fee pricing.
Operations and Information Technology.
As a result of the MSSB joint venture, most of the operations and technology supporting the Global Wealth Management Group are provided either by Morgan Stanley's Operations and Information Technology departments or by Citi. Pursuant to contractual agreements, Morgan Stanley and Citi perform various
5
broker-dealer related functions, such as execution and clearing of brokerage transactions, margin lending and custody of client assets. For Morgan Stanley, these activities are undertaken through Morgan Stanley's own facilities, through memberships in various clearing and settlement organizations, and through agreements with unaffiliated third parties. Morgan Stanley and Citi provide certain other services and systems to support the Global Wealth Management Group, including through transition services agreements with MSSB.
Asset Management.
Morgan Stanley's Asset Management business segment is one of the largest global asset management organizations of any full-service financial services firm and offers individual and institutional clients a diverse array of equity, fixed income and alternative investments and merchant banking strategies. Currently, Morgan Stanley's asset management activities are principally conducted under the Morgan Stanley and Van Kampen brands. Portfolio managers located in the U.S., Europe, Japan, Singapore and India manage investment products ranging from money market funds to equity, taxable and tax-exempt fixed income funds and alternative investment and merchant banking products in developed and emerging markets. Morgan Stanley offers clients various investment styles, such as value, growth, core, fixed income and asset allocation; global investments; active and passive management; and diversified and concentrated portfolios.
Morgan Stanley offers a range of alternative investment and merchant banking products for institutional investors and high net worth individuals. Morgan Stanley's alternative investments platform includes hedge funds, funds of hedge funds, funds of private equity funds and portable alpha strategies, including FrontPoint Partners LLC, a leading provider of absolute return strategies. Morgan Stanley's alternative investments platform also includes minority stakes in Lansdowne Partners, Avenue Capital Group and Traxis Partners LP. Morgan Stanley's Merchant Banking Division includes Morgan Stanley's real estate investing business, private equity funds and infrastructure investing group. Morgan Stanley typically acts as general partner of, and investment adviser to, its alternative investment and merchant banking funds and typically commits to invest a minority of the capital of such funds with subscribing investors contributing the majority.
On October 19, 2009, as part of a restructuring of Morgan Stanley's Asset Management business segment, Morgan Stanley entered into a definitive agreement to sell substantially all of its retail asset management business, including Van Kampen Investments, Inc. ("Van Kampen"), to Invesco Ltd. ("Invesco"). This transaction allows Morgan Stanley's Asset Management business segment to focus on its institutional client base. Under the terms of the definitive agreement, Invesco will purchase substantially all of Morgan Stanley's retail asset management business, operating under both the Morgan Stanley and Van Kampen brands, in a stock and cash transaction. Morgan Stanley will receive a 9.4% minority interest in Invesco. The transaction, which has been approved by the Boards of Directors of both companies, is expected to close in mid-2010, subject to customary regulatory, client and fund shareholder approvals.
Institutional Investors.
Morgan Stanley provides asset management products and services to institutional investors worldwide, including corporations, pension plans, large intermediaries, private funds, non-profit organizations, foundations, endowments, sovereign wealth funds, governmental agencies, insurance companies and banks. Products and services are available to institutional investors primarily through separate accounts, U.S. mutual funds and other pooled vehicles. Morgan Stanley also sub-advises funds for various unaffiliated financial institutions and intermediaries. A global sales force and a team dedicated to covering the investment consultant industry serve institutional investors.
Individual Investors.
Morgan Stanley offers open-end and alternative investment funds and separately managed accounts to individual investors through affiliated and unaffiliated broker-dealers, banks, insurance companies and financial planners. Closed-end funds managed by Morgan Stanley or Van Kampen are available to individual investors through
6
affiliated and unaffiliated broker-dealers. A small number of unaffiliated broker-dealers account for a substantial portion of Van Kampen open-end fund sales. Morgan Stanley also sells mutual funds through numerous retirement plan platforms. Internationally, Morgan Stanley distributes traditional investment products to individuals outside the U.S. through non-proprietary distributors, and alternative investment products are distributed through affiliated broker-dealers.
Operations and Information Technology.
Morgan Stanley's Operations and Information Technology departments provide or oversee the process and technology platform required to support its asset management business. Support activities include transfer agency, mutual fund accounting and administration, transaction processing and certain fiduciary services, on behalf of institutional, retail and intermediary clients. These activities are undertaken through Morgan Stanley's own facilities, through membership in various clearing and settlement organizations, and through agreements with unaffiliated third parties.
Research.
Morgan Stanley's research department ("Research") coordinates globally across all of Morgan Stanley's businesses. Research consists of economists, strategists and industry analysts who engage in equity and fixed income research activities and produce reports and studies on the U.S. and global economy, financial markets, portfolio strategy, technical market analyses, individual companies and industry developments. Research examines worldwide trends covering numerous industries and individual companies, the majority of which are located outside of the U.S.; provides analysis and forecasts relating to economic and monetary developments that affect matters such as interest rates, foreign currencies, securities, derivatives and economic trends; and provides analytical support and publishes reports on asset-backed securities and the markets in which such securities are traded and data are disseminated to investors through third party distributors, proprietary internet sites such as Client Link and Morgan Stanley's sales forces.
Competition.
All aspects of Morgan Stanley's businesses are highly competitive and Morgan Stanley expects them to remain so. Morgan Stanley competes in the U.S. and globally for clients, market share and human talent in all aspects of its business segments. Morgan Stanley's competitive position depends on its reputation and the quality of its products, services and advice. Morgan Stanley's ability to sustain or improve its competitive position also depends substantially on its ability to continue to attract and retain qualified employees while managing compensation and other costs. Morgan Stanley competes with commercial banks, brokerage firms, insurance companies, sponsors of mutual funds, hedge funds, energy companies and other companies offering financial services in the U.S., globally and through the internet. Over time, certain sectors of the financial services industry have become more concentrated, as institutions involved in a broad range of financial services have been acquired by or merged into other firms or have declared bankruptcy. Such changes could result in Morgan Stanley's remaining competitors gaining greater capital and other resources, such as the ability to offer a broader range of products and services and geographic diversity.
Institutional Securities and Global Wealth Management Group.
Morgan Stanley's competitive position depends on innovation, execution capability and relative pricing. Morgan Stanley competes directly in the U.S. and globally with other securities and financial services firms and broker-dealers, and with others on a regional or product basis.
Morgan Stanley's ability to access capital at competitive rates (which is generally dependent on Morgan Stanley's credit ratings) and to commit capital efficiently, particularly in its capital-intensive underwriting and
7
sales, trading, financing and market-making activities, also affects its competitive position. Corporate clients may request that Morgan Stanley provide loans or lending commitments in connection with certain investment banking activities.
It is possible that competition may become even more intense as Morgan Stanley continues to compete with financial institutions that may be larger, or better capitalized, or may have a stronger local presence and longer operating history in certain areas. Many of these firms have greater capital than Morgan Stanley and have the ability to offer a wide range of products and services that may enhance their competitive position and could result in pricing pressure in our businesses. The complementary trends in the financial services industry of consolidation and globalization present, among other things, technological, risk management, regulatory and other infrastructure challenges that require effective resource allocation in order for Morgan Stanley to remain competitive.
Morgan Stanley has experienced intense price competition in some of its businesses in recent years. In particular, the ability to execute securities trades electronically on exchanges and through other automated trading markets has increased the pressure on trading commissions. The trend toward direct access to automated, electronic markets will likely continue. It is possible that Morgan Stanley will experience competitive pressures in these and other areas in the future as some of its competitors may seek to obtain market share by reducing prices.
Asset Management.
Competition in the asset management industry is affected by several factors, including Morgan Stanley's reputation, investment objectives, quality of investment professionals, performance of investment products relative to peers and an appropriate benchmark index, advertising and sales promotion efforts, fee levels, the effectiveness of and access to distribution channels, and the types and quality of products offered. Morgan Stanley's alternative investment products, such as private equity funds, real estate and hedge funds, compete with similar products offered by both alternative and traditional asset managers.
Supervision and Regulation.
As a major financial services firm, Morgan Stanley is subject to extensive regulation by U.S. federal and state regulatory agencies and securities exchanges and by regulators and exchanges in each of the major markets where it operates. Moreover, in response to the financial crisis, legislators and regulators, both in the U.S. and worldwide, are currently considering a wide range of proposals that, if enacted, could result in major changes to the way Morgan Stanley is regulated and conducts its business.
Regulatory Outlook.
It is likely that the year 2010 and subsequent years will see material changes in the way that major financial institutions are regulated both in the U.S. and worldwide. The reforms being discussed include several that contemplate comprehensive restructuring of the regulation of the financial services industry. Enactment of such measures likely would lead to stricter regulation of financial institutions generally, and heightened prudential requirements for systemically important firms in particular. Such measures could include taxation of financial transactions, liabilities and employee compensation as well as reforms of the OTC derivatives markets, such as mandated exchange trading and clearing, position limits, margin, capital and registration requirements. Other changes under discussion in the U.S. legislative arena include: breaking up firms that are considered "too big to fail" or mandating certain barriers between their activities in order to allow for an orderly resolution of failing financial institutions; curtailing the ability of firms that own Federal Deposit Insurance Corporation ("FDIC")-insured institutions to also engage in private equity, hedge fund and proprietary trading activities; requiring firms to maintain plans for their dissolution; requiring the financial industry to pay into a fund designed to help unwind failing firms; providing regulators with new means of limiting activities of financial firms; regulating
8
compensation in the financial services industry; enhancing corporate governance, especially regarding risk management; and creating a new agency, the "Consumer Financial Protection Agency," to protect U.S. consumers who buy financial products.
Reforms are being discussed concurrently in Washington, London, the European Union ("EU") and other major market centers in which Morgan Stanley operates, and attempts are being made to internationally coordinate the principles behind such changes through the G-20's expanded mandate for the Financial Stability Board and through the Basel Committee on Banking Supervision ("Basel Committee"), the International Association of Securities Commissioners and others. Among the internationally coordinated reforms are recent measures and proposals by the Basel Committee to raise the quality of capital, increase capital requirements for securitizations, trading book exposure and counterparty credit risk exposure, and globally introduce a leverage ratio, capital conservation measures and liquidity coverage requirements, among other measures. In both the EU and the U.S., moreover, changes to the institutional framework for financial regulation are being discussed or are underway.
Many of the market reforms, if enacted, may materially affect Morgan Stanley's business, financial condition, results of operations and cash flows for a particular future period. In particular, if systemic regulation were enacted, Morgan Stanley would likely be designated as a systemically important firm, and the consequences of systemic regulation, including a potential requirement for additional higher quality capital and liquidity and decreased leverage, could materially impact Morgan Stanley's business.
A substantial number of the financial reforms currently discussed in the U.S. and globally may become law, though it is difficult to predict which will become law, how such reforms will be implemented or the exact impact they will have on Morgan Stanley's business, financial condition, results of operations and cash flows for a particular future period. As most changes, if adopted, will require regulatory implementation, the full impact of these changes will not be known until a later stage.
Financial Holding Company.
Since September 2008, Morgan Stanley has operated as a financial holding company under the BHC Act.
U.S. Banking Institutions. Morgan Stanley Bank, N.A. ("MSBNA"), primarily a wholesale commercial bank, offers consumer lending and commercial lending services in addition to deposit products. As an FDIC-insured national bank, MSBNA is subject to supervision and regulation by the Office of the Comptroller of the Currency ("OCC").
Morgan Stanley Trust is a wholly owned subsidiary that conducts, through a subsidiary, certain mortgage lending activities primarily for customers of its affiliate retail broker Morgan Stanley Smith Barney LLC ("MSSB LLC"). Morgan Stanley Trust also conducts certain transfer agency, sub-accounting and other activities. It is an FDIC-insured federal savings bank whose activities are subject to comprehensive regulation and periodic examination by the Office of Thrift Supervision.
Morgan Stanley Trust National Association, a wholly owned subsidiary, is a non-depository national bank whose activities are limited to fiduciary and custody activities, primarily personal trust and prime brokerage custody services. It is subject to comprehensive regulation and periodic examination by the OCC. Morgan Stanley Trust National Association is not FDIC-insured.
Scope of Permitted Activities. As a financial holding company, Morgan Stanley is able to engage in any activity that is financial in nature or incidental to a financial activity. Unless otherwise required by the Fed, Morgan Stanley is permitted to commence any new financial activity, or acquire a company engaged in any financial activity, as long as it provides after–the–fact notice of such new activity or investment to the Fed. Morgan Stanley must obtain the prior approval of the Fed before acquiring more than five percent of any class of voting stock of a U.S. depository institution or bank holding company or commencing any activity that is complementary to a financial activity. Under some reform proposals, any non-banking acquisition of more than $25 billion in assets would require prior Fed approval, and regulators would be given new means to limit activities.
9
Morgan Stanley believes that most of the activities it conducted before becoming a financial holding company remain permissible. In addition, the BHC Act gives Morgan Stanley two years after becoming a financial holding company to conform its existing nonfinancial activities and investments to the requirements of the BHC Act with the possibility of three one-year extensions for a total grace period of up to five years. The BHC Act also grandfathers any "activities related to the trading, sale or investment in commodities and underlying physical properties," provided that Morgan Stanley conducted any of such activities as of September 30, 1997 and provided that certain other conditions that are within Morgan Stanley's reasonable control are satisfied. In addition, the BHC Act permits the Fed to determine by regulation or order that certain activities are complementary to a financial activity and do not pose a risk to safety and soundness.
It is possible that certain of Morgan Stanley's existing activities will not be deemed to be permissible financial activities, or incidental or complementary to such activities or otherwise grandfathered. If so, Morgan Stanley may be required to divest them before the end of the original two-year or subsequent one-year grace periods discussed above. Morgan Stanley does not believe that any such required divestment will have a material adverse impact on its financial condition or results of operations.
Consolidated Supervision. As a financial holding company, Morgan Stanley is subject to the comprehensive, consolidated supervision and regulation of the Fed. This means that Morgan Stanley is, among other things, subject to the Fed's risk-based and leverage capital requirements and information reporting requirements for bank holding companies. The Fed has the authority to conduct on-site examinations of Morgan Stanley and any of its affiliates, subject to coordinating with any state or federal functional regulator of any particular affiliate.
In order to maintain Morgan Stanley's status as a financial holding company, its depository institution subsidiaries must remain well capitalized and well managed. Reform proposals would also base such financial holding company status on maintaining a well capitalized and well managed standard at the Morgan Stanley holding company level. If designated a systemically important firm, Morgan Stanley would be required, pursuant to such reform proposals, to remain well capitalized and well managed at all times. Under current regulations implemented by the Fed, if any depository institution controlled by a financial holding company no longer meets certain capital or management standards, the Fed may impose corrective capital and/or managerial requirements on the parent financial holding company and place limitations on its ability to make acquisitions or otherwise conduct the broader financial activities permissible for financial holding companies. In addition, as a last resort if the deficiencies persist, the Fed may order a financial holding company to cease the conduct of or to divest those businesses engaged in activities other than those permissible for bank holding companies that are not financial holding companies. The regulations also provide that if any depository institution controlled by a financial holding company fails to maintain a satisfactory rating under the Community Reinvestment Act of 1977, the Fed must prohibit the financial holding company and its subsidiaries from engaging in any additional activities other than those permissible for bank holding companies that are not financial holding companies.
Capital Standards. The Basel Committee and the Fed are rethinking the scope, strength and nature of the capital requirements that should apply to global financial institutions like Morgan Stanley.
The Basel Committee has opened a broad-based consultation on capital, liquidity and leverage ratios that is expected to be complete by the end of 2010, with implementation for most measures by the end of 2012, and in some cases earlier. The results of this consultation, in the form eventually implemented into U.S. law by the Fed and other U.S. banking regulators, are expected, among other aspects, to increase requirements as to the quality of capital, with greater emphasis on common stock as the predominant form of capital, to enhance capital requirements for trading book exposures, securitizations and counterparty credit risk exposure, to institute capital conservation measures and liquidity coverage requirements, and to implement on a more global basis the leverage ratio concept, a version of which is currently applied only by U.S. regulators. The exact scope and scale of these capital changes are currently not known. Even under current standards, the Fed generally requires Morgan Stanley and its peer financial holding companies to maintain risk-based and leverage capital ratios substantially in excess of mandated minimum levels, depending upon general economic conditions and their particular condition, risk profile and growth plans.
10
Current U.S. risk–based capital and leverage guidelines require Morgan Stanley's capital–to–assets ratios to meet certain minimum standards. Under the guidelines, banking organizations are required to maintain a total capital ratio (total capital to risk–weighted assets) of at least 10% and a Tier 1 capital ratio of at least 6% in order to qualify as well capitalized and for the holding company parent to be able to qualify as a financial holding company.
Morgan Stanley currently calculates its capital ratios and risk-weighted assets in accordance with the capital adequacy standards for financial holding companies adopted by the Fed, which are based upon a framework described in the "International Convergence of Capital Measurement and Capital Standards," July 1988, as amended, also referred to as "Basel I." U.S. banking regulators are in the process of incorporating the Basel II Accord into the existing risk–based capital requirements and Morgan Stanley is working with its regulators accordingly to transition to these requirements.
The federal banking regulators also have established minimum leverage ratio guidelines. The Tier 1 leverage ratio is defined as Tier 1 capital divided by adjusted average total book assets (which reflects adjustments for disallowed goodwill, certain intangible assets and deferred tax assets). The adjusted average total assets are derived using weekly balances for each quarter. The minimum leverage ratio is 3% for bank holding companies that are considered "strong" under Fed guidelines or which have implemented the Fed's risk–based capital measure for market risk. Other bank holding companies must have a minimum leverage ratio of 4%.
Reform proposals affecting the scope, coverage, or calculation of capital, and increases in the amount of capital, including more restrictive leverage ratios, capital conservation measures and liquidity coverage requirements could adversely affect Morgan Stanley's ability to generate return on capital, to pay dividends, or could require Morgan Stanley to reduce business levels or to raise capital, including in ways that may adversely impact its shareholders or creditors.
See also "Management's Discussion and Analysis of Financial Condition and Results of Operation-Liquidity and Capital Resources-Regulatory Requirements" herein.
Dividends . In addition to certain dividend restrictions that apply by law to certain of Morgan Stanley's subsidiaries, as described below, the OCC, the Fed and the FDIC have authority to prohibit or to limit the payment of dividends by the banking organizations they supervise, including Morgan Stanley, Morgan Stanley Bank, N.A. and other Morgan Stanley depository institution subsidiaries, if, in the banking regulator's opinion, payment of a dividend would constitute an unsafe or unsound practice in light of the financial condition of the banking organization. It is Fed policy that bank holding companies should generally pay dividends on common stock only out of income available from the past year, and only if prospective earnings retention is consistent with the organization's expected future needs and financial condition. It is also Fed policy that bank holding companies should not maintain dividend levels that undermine the company's ability to be a source of strength to its banking subsidiaries.
Prompt Corrective Action . The Federal Deposit Insurance Corporation Improvement Act of 1991 provides a framework for regulation of depository institutions and their affiliates, including parent holding companies, by their federal banking regulators. Among other things, it requires the relevant federal banking regulator to take "prompt corrective action" with respect to a depository institution if that institution does not meet certain capital adequacy standards. Current regulations generally apply only to insured banks and thrifts such as Morgan Stanley Bank, N.A. or Morgan Stanley Trust, and not to their parent holding companies, such as Morgan Stanley. The Fed is, however, subject to limitations, authorized to take appropriate action at the holding company level. All pending proposals in the U.S. would broaden the Fed's or appropriate regulator's ability to take prompt corrective action against a systemically important financial institution.
Transactions with Affiliates . Morgan Stanley's domestic subsidiary banks are subject to Sections 23A and 23B of the Federal Reserve Act, which impose restrictions on any extensions of credit to, purchase of assets from, and certain other transactions with, any affiliates. These restrictions include limits on the total amount of credit exposure that they may have to any one affiliate and to all affiliates, as well as collateral requirements, and they require all such transactions to be made on market terms.
11
FDIC Regulation. An FDIC–insured depository institution is generally liable for any loss incurred or expected to be incurred by the FDIC in connection with the failure of an insured depository institution under common control by the same bank holding company. As FDIC-insured depository institutions, Morgan Stanley Bank, N.A. and Morgan Stanley Trust are exposed to each other's losses. In addition, both institutions are exposed to changes in the cost of FDIC insurance. In 2009, the FDIC levied a special assessment of 5% on each insured depository institution's assets, minus its Tier 1 capital, capped at 10% of its domestic deposits. In addition, the FDIC required insured institutions to prepay their estimated quarterly risk-based assessments for the fourth quarter of 2009 and for all of 2010, 2011 and 2012. The FDIC also adopted a uniform three-basis point increase in assessment rates effective on January 1, 2011. All measures were part of an effort to rebuild the Deposit Insurance Fund. In addition, by participating in the FDIC's Temporary Liquidity Guarantee Program, Morgan Stanley Bank, N.A. and Morgan Stanley Trust have temporarily become subject to an additional assessment on deposits in excess of $250,000 in certain transaction accounts. Some of the pending legislative proposals would further increase Morgan Stanley's FDIC assessments, which, if enacted, may materially affect Morgan Stanley's financial condition, results of operations and cash flows for a particular future period.
Anti-Money Laundering.
Morgan Stanley's Anti-Money Laundering ("AML") program is coordinated on an enterprise-wide basis. In the U.S., for example, the Bank Secrecy Act, as amended by the USA PATRIOT Act of 2001 (the "BSA/USA PATRIOT Act"), imposes significant obligations on financial institutions to detect and deter money laundering and terrorist financing activity, including requiring banks, bank holding company subsidiaries, broker-dealers, future commission merchants, and mutual funds to identify and verify customers that maintain accounts. The BSA/USA PATRIOT Act also mandates that financial institutions have policies, procedures and internal processes in place to monitor and report suspicious activity to appropriate law enforcement or regulatory authorities. Financial institutions subject to the BSA/USA PATRIOT Act also must designate a BSA/AML compliance officer, provide employees with training on money laundering prevention, and undergo an annual, independent audit to assess the effectiveness of its AML program. Outside the U.S., applicable laws, rules and regulations similarly subject designated types of financial institutions to AML program requirements. Morgan Stanley has implemented policies, procedures and internal controls that are designed to comply with AML program requirements. Morgan Stanley has also implemented policies, procedures, and internal controls that are designed to comply with the regulations and economic sanctions programs administered by the U.S. Department of the Treasury's Office of Foreign Assets Control ("OFAC"), which enforces economic and trade sanctions against targeted foreign countries, entities and individuals based on U.S. foreign policy and national security goals, and other multi-national organizations and governmental agencies worldwide.
Anti-Corruption.
Morgan Stanley is subject to the U.S. Foreign Corrupt Practices Act ("FCPA"), which prohibits offering, promising, giving, or authorizing others to give anything of value, directly or indirectly, to a non-U.S. government official in order to obtain or retain business or otherwise secure a business advantage. Morgan Stanley is also subject to applicable anti-corruption laws in the jurisdictions in which it operates. Morgan Stanley has implemented policies, procedures, and internal controls that are designed to comply with the FCPA and other applicable anti-corruption laws, rules, and regulations in the jurisdictions in which it operates.
Protection of Client Information.
Many aspects of Morgan Stanley's business are subject to legal requirements concerning the use and protection of certain customer information, including those adopted pursuant to the Gramm-Leach-Bliley Act and the Fair and Accurate Credit Transactions Act of 2003 in the U.S., the European Union Data Protection Directive in the EU and various laws in Asia, including the Japanese Personal Information (Protection) Law, the Hong Kong Personal Data (Protection) Ordinance and the Australian Privacy Act. Morgan Stanley has adopted measures designed to comply with these and related applicable requirements in all relevant jurisdictions.
12
Research.
Both U.S. and non-U.S. regulators continue to focus on research conflicts of interest. Research-related regulations have been implemented in many jurisdictions. New and revised requirements resulting from these regulations and the global research settlement with U.S. federal and state regulators (to which Morgan Stanley is a party) have necessitated the development or enhancement of corresponding policies and procedures.
Institutional Securities and Global Wealth Management Group.
Broker-Dealer Regulation. Morgan Stanley's primary U.S. broker-dealer subsidiaries, MS&Co. and MSSB LLC, are registered broker-dealers with the SEC and in all 50 states, the District of Columbia, Puerto Rico and the U.S. Virgin Islands, and are members of various self-regulatory organizations, including the Financial Industry Regulatory Authority, Inc. ("FINRA") and securities exchanges, including the NYSE. In addition, MS&Co. and MSSB LLC are registered investment advisers with the SEC. Broker-dealers are subject to laws and regulations covering all aspects of the securities business, including sales and trading practices, securities offerings, publication of research reports, use of customers' funds and securities, capital structure, record-keeping and retention and the conduct of their directors, officers, representatives and other associated persons. Broker-dealers are also regulated by securities administrators in those states where they do business. Violations of the laws and regulations governing a broker-dealer's actions could result in censures, fines, the issuance of cease-and-desist orders, revocation of licenses or registrations, the suspension or expulsion from the securities industry of such broker-dealer or its officers or employees, or other similar consequences by both federal and state securities administrators.
Margin lending by broker-dealers is regulated by the Fed's restrictions on lending in connection with customer and proprietary purchases and short sales of securities, as well as securities borrowing and lending activities. Broker-dealers are also subject to maintenance and other margin requirements imposed under FINRA and other self-regulatory organization rules. In many cases, Morgan Stanley's broker-dealer subsidiaries' margin policies are more stringent than these rules.
As registered U.S. broker-dealers, certain subsidiaries of Morgan Stanley are subject to the SEC's net capital rule and the net capital requirements of various exchanges and other regulatory authorities. Many non-U.S. regulatory authorities and exchanges also have rules relating to capital and, in some case, liquidity requirements that apply to Morgan Stanley's non-U.S. broker-dealer subsidiaries. These rules are generally designed to measure general financial integrity and/or liquidity and require that at least a minimum amount of net and/or more liquid assets be maintained by the subsidiary. See also "Consolidated Supervision" and "Capital Standards" above. Rules of FINRA and other self-regulatory organizations also impose limitations and requirements on the transfer of member organizations' assets.
Compliance with regulatory capital liquidity requirements may limit Morgan Stanley's operations requiring the intensive use of capital. Such requirements restrict Morgan Stanley's ability to withdraw capital from its broker-dealer subsidiaries, which in turn may limit its ability to pay dividends, repay debt or redeem or purchase shares of its own outstanding stock. Any change in such rules or the imposition of new rules affecting the scope, coverage, calculation or amount of capital liquidity requirements, or a significant operating loss or any unusually large charge against capital, could adversely affect Morgan Stanley's ability to pay dividends or to expand or maintain present business levels. In addition, such rules may require Morgan Stanley to make substantial capital liquidity infusions into one or more of its broker-dealer subsidiaries in order for such subsidiaries to comply with such rules.
MS&Co. and MSSB LLC are members of the Securities Investor Protection Corporation ("SIPC"), which provides protection for customers of broker-dealers against losses in the event of the liquidation of a broker-dealer. SIPC protects customers' securities accounts held by a member broker-dealer up to $500,000 for each eligible customer, subject to a limitation of $100,000 for claims for cash balances. To supplement this SIPC
13
coverage, MS&Co. has purchased additional protection for the benefit of its customers in the form of an annual policy issued by certain underwriters and various insurance companies that provides protection for all clients up to the remaining net equity securities balance in their accounts, subject to the firmwide cap of $1 billion.
Regulation of Certain Commodities Activities. The commodities activities in the Institutional Securities business segment are subject to extensive and evolving energy, commodities, environmental, health and safety and other governmental laws and regulations in the U.S. and abroad. Intensified scrutiny of certain energy markets by U.S. federal, state and local authorities in the U.S. and abroad and by the public has resulted in increased regulatory and legal enforcement and remedial proceedings involving energy companies, including those engaged in power generation and liquid hydrocarbons trading.
Terminal facilities and other assets relating to Morgan Stanley's commodities activities are also subject to environmental laws both in the U.S. and abroad. In addition, pipeline, transport and terminal operations are subject to state laws in connection with the cleanup of hazardous substances that may have been released at properties currently or previously owned or operated by us or locations to which we have sent wastes for disposal.
Additional Regulation of U.S. Entities. As registered futures commission merchants, MS&Co. and MSSB LLC are subject to net capital requirements of, and their activities are regulated by, the Commodity Futures Trading Commission (the "CFTC") and various commodity futures exchanges. Morgan Stanley's futures and options-on-futures businesses are also regulated by the National Futures Association (the "NFA"), a registered futures association, of which MS&Co. and certain of its affiliates are members. These regulatory requirements differ for clearing and non-clearing firms, and they address obligations related to, among other things, the registration of the futures commission merchant and certain of its associated persons, membership with the NFA, the segregation of customer funds and the holding apart of a secured amount, the receipt of an acknowledgement of certain written risk disclosure statements, the receipt of trading authorizations, the furnishing of daily confirmations and monthly statements, recordkeeping and reporting obligations, the supervision of accounts, and antifraud prohibitions. Among other things, the NFA has rules covering a wide variety of areas such as advertising, telephone solicitations, risk disclosure, discretionary trading, disclosure of fees, minimum capital requirements, reporting and proficiency testing. MS&Co. and MSSB LLC have affiliates that are registered as commodity trading advisers ("CTAs") and/or commodity pool operators ("CPOs"), or are operating under certain exemptions from such registration pursuant to CFTC Rules and other guidance. Under CFTC and NFA Rules, CTAs that manage accounts must distribute disclosure documents, and maintain specified records relating to their activities and clients. Under CFTC and NFA rules, CPOs have certain responsibilities with respect to each pool they operate. For each pool, a CPO must prepare and distribute a disclosure document; distribute periodic account statements; prepare and distribute audited annual financial reports; and keep specified records concerning the participants, transactions, and operations of each pool, as well as records regarding transactions of the CPO and its principals. Violations of the rules of the CFTC, the NFA or the commodity exchanges could result in remedial actions including fines, registration restrictions or terminations, trading prohibitions or revocations of commodity exchange memberships.
Non-U.S. Regulation. Morgan Stanley's businesses are also regulated extensively by non-U.S. regulators, including governments, securities exchanges, commodity exchanges, self-regulatory organizations, central banks and regulatory bodies, especially in those jurisdictions in which Morgan Stanley maintains an office. Certain Morgan Stanley subsidiaries are regulated as broker-dealers under the laws of the jurisdictions in which they operate. Subsidiaries engaged in banking and trust activities outside the U.S. are regulated by various government agencies in the particular jurisdiction where they are chartered, incorporated and/or conduct their business activity. For instance, the Financial Services Authority and several U.K. securities and futures exchanges, including the London Stock Exchange and Euronext.liffe, regulate Morgan Stanley's activities in the U.K.; the Deutsche Bôrse AG and the Bundesanstalt für Finanzdienstleistungsaufsicht (the Federal Financial Supervisory Authority) regulate its activities in the Federal Republic of Germany; Eidgenôssische Finanzmarktaufsicht regulates its activities in Switzerland; the Financial Services Agency, the Bank of Japan, the
14
Japanese Securities Dealers Association and several Japanese securities and futures exchanges, including the Tokyo Stock Exchange, the Osaka Securities Exchange and the Tokyo International Financial Futures Exchange, regulate its activities in Japan; the Hong Kong Securities and Futures Commission and the Hong Kong Exchanges and Clearing Limited regulate its operations in Hong Kong; and the Monetary Authority of Singapore and the Singapore Exchange Limited regulate its business in Singapore.
Asset Management.
Many of the subsidiaries engaged in Morgan Stanley's asset management activities are registered as investment advisers with the SEC and, in certain states, some employees or representatives of subsidiaries are registered as investment adviser representatives. Many aspects of Morgan Stanley's asset management activities are subject to federal and state laws and regulations primarily intended to benefit the investor or client. These laws and regulations generally grant supervisory agencies and bodies broad administrative powers, including the power to limit or restrict Morgan Stanley from carrying on its asset management activities in the event that it fails to comply with such laws and regulations. Sanctions that may be imposed for such failure include the suspension of individual employees, limitations on Morgan Stanley engaging in various asset management activities for specified periods of time or specified types of clients, the revocation of registrations, other censures and fines.
Morgan Stanley's Asset Management business is also regulated outside the U.S. For example, the Financial Services Authority regulates Morgan Stanley's business in the U.K.; the Financial Services Agency regulates Morgan Stanley's business in Japan; the Securities and Exchange Board of India regulates Morgan Stanley's business in India; and the Monetary Authority of Singapore regulates Morgan Stanley's business in Singapore.
For a discussion of certain risks relating to Morgan Stanley's regulatory environment, see "Risk Factors" herein.
Executive Officers of Morgan Stanley.
The executive officers of Morgan Stanley and their ages and titles as of February 26, 2010 are set forth below. Business experience for the past five years is provided in accordance with SEC rules.
John J. Mack (65). Chairman of the Board of Directors of Morgan Stanley (since June 2005). Chief Executive Officer (June 2005 to December 2009). Chairman of Pequot Capital Management (June 2005). Co-Chief Executive Officer of Credit Suisse Group (January 2003 to June 2004). President, Chief Executive Officer and Director of Credit Suisse First Boston (July 2001 to June 2004). President and Chief Operating Officer of Morgan Stanley (May 1997 to March 2001).
James P. Gorman (51). President and Chief Executive Officer and Director of Morgan Stanley (since January 2010) and Chairman of Morgan Stanley Smith Barney (since June 2009). Co-President (December 2007 to December 2009) and Co-Head of Strategic Planning (October 2007 to December 2009). President and Chief Operating Officer of the Global Wealth Management Group (February 2006 to April 2008). Head of Corporate Acquisitions Strategy and Research at Merrill Lynch & Co., Inc. ("Merrill Lynch") (July 2005 to August 2005) and President of the Global Private Client business at Merrill Lynch (December 2002 to July 2005).
Ruth Porat (52). Executive Vice President and Chief Financial Officer of Morgan Stanley (since January 2010). Vice Chairman of Investment Banking (September 2003 to December 2009). Global Head of Financial Institutions Group (September 2006 to December 2009) and Chairman of the Financial Sponsors Group (July 2004 to September 2006) within the Investment Banking Division.
Colm Kelleher (52). Executive Vice President and Co-President of Institutional Securities of Morgan Stanley (since January 2010). Chief Financial Officer and Co-Head of Strategic Planning (October 2007 to December 2009). Head of Global Capital Markets (February 2006 to October 2007). Co-Head of Fixed Income Europe (May 2004 to February 2006).
15
Paul J. Taubman (49). Executive Vice President and Co-President of Institutional Securities of Morgan Stanley (since January 2010). Global Head of Investment Banking (January 2008 to December 2009). Global Co-Head of Investment Banking (July 2007 to January 2008) Global Head of Mergers and Acquisitions Department (May 2005 to July 2007). Global Co-Head of Mergers and Acquisitions Department (December 2003 to May 2005).
Gregory J. Fleming (46). Executive Vice President and President of Asset Management and Research of Morgan Stanley (since February 2010). Senior Research Scholar at Yale Law School and Distinguished Visiting Fellow of the Center for the Study of Corporate Law at Yale Law School (January 2009 to December 2009). President of Merrill Lynch (February 2008 to January 2009). Co-President of Merrill Lynch (May 2007–February 2008). Executive Vice President and Co-President of the Global Markets and Investment Banking Group of Merrill Lynch (August 2003 to May 2007).
Charles D. Johnston (56). Executive Vice President of Morgan Stanley and President of Morgan Stanley Smith Barney (since January 2010). President of Morgan Stanley Smith Barney (June 2009 to January 2010). President, Global Wealth Management U.S. and Canada, at Citi Smith Barney (March 2008 to June 2009) President and Chief Executive Officer of Smith Barney (January 2005 to March 2008).
Walid Chammah (55). Executive Vice President of Morgan Stanley (since January 2010), Chairman and Chief Executive Officer of Morgan Stanley International (since January 2009). Co-President (December 2007 to December 2009). Head of Investment Banking (August 2005 to July 2007) and Head of Global Capital Markets (July 2002 to August 2005).
Thomas R. Nides (49). Chief Operating Officer of Morgan Stanley and Chief Administrative Officer and Secretary (September 2005 to December 2009). Worldwide President and Chief Executive Officer of Burson-Marsteller (November 2004 to August 2005). Chairman of the Securities Industry and Financial Markets Association since October 2009.
Gary G. Lynch (59). Vice Chairman (since May 2009) and Chief Legal Officer of Morgan Stanley (since October 2005). Global General Counsel (October 2001 to October 2005) of Credit Suisse First Boston. Executive Vice Chairman (July 2004 to October 2005) and Vice Chairman (December 2002 to July 2004) of Credit Suisse First Boston and member of the Executive Board (July 2004 to July 2005) of Credit Suisse Group. Partner at the law firm of Davis Polk & Wardwell (September 1989 to October 2001).
Kenneth M. deRegt (54). Executive Vice President and Chief Risk Officer of Morgan Stanley (since February 2008). Managing Director of Aetos Capital, LLC, an investment management firm (December 2002 to February 2008).
16
Item 1A. Risk Factors.
Liquidity and Funding Risk.
Liquidity and funding risk refers to the risk that Morgan Stanley will be unable to finance its operations due to a loss of access to the capital markets or difficulty in liquidating its assets. Liquidity and funding risk also encompasses the ability of Morgan Stanley to meet its financial obligations without experiencing significant business disruption or reputational damage that may threaten its viability as a going concern. For more information on how we monitor and manage liquidity and funding risk, see "Management's Discussion and Analysis of Financial Condition and Results of Operations-Liquidity and Capital Resources" in Part II, Item 7 herein.
Liquidity is essential to our businesses and we rely on external sources to finance a significant portion of our operations.
Liquidity is essential to our businesses. Our liquidity could be substantially affected negatively by our inability to raise funding in the long-term or short-term debt capital markets or the equity capital markets or our inability to access the secured lending markets. Factors that we cannot control, such as disruption of the financial markets or negative views about the financial services industry generally, could impair our ability to raise funding. In addition, our ability to raise funding could be impaired if lenders develop a negative perception of our long-term or short-term financial prospects. Such negative perceptions could be developed if we incur large trading losses, we are downgraded or put on (or remain on) negative watch by the rating agencies, we suffer a decline in the level of our business activity, regulatory authorities take significant action against us, or we discover significant employee misconduct or illegal activity, among other reasons. If we are unable to raise funding using the methods described above, we would likely need to finance or liquidate unencumbered assets, such as our investment and trading portfolios, to meet maturing liabilities. We may be unable to sell some of our assets, or we may have to sell assets at a discount from market value, either of which could adversely affect our results of operations and cash flows.
Our borrowing costs and access to the debt capital markets depend significantly on our credit ratings.
The cost and availability of unsecured financing generally are dependent on our short-term and long-term credit ratings. Factors that are important to the determination of our credit ratings include the level and quality of our earnings, as well as our capital adequacy, liquidity, risk appetite and management, asset quality and business mix.
Our debt ratings also can have a significant impact on certain trading revenues, particularly in those businesses where longer term counterparty performance is critical, such as OTC derivative transactions, including credit derivatives and interest rate swaps. In connection with certain OTC trading agreements and certain other agreements associated with the Institutional Securities business segment, we may be required to provide additional collateral to certain counterparties in the event of a credit ratings downgrade.
We are a holding company and depend on payments from our subsidiaries.
The parent holding company depends on dividends, distributions and other payments from its subsidiaries to fund dividend payments and to fund all payments on its obligations, including debt obligations. Regulatory and other legal restrictions may limit our ability to transfer funds freely, either to or from our subsidiaries. In particular, many of our subsidiaries, including our broker-dealer subsidiaries, are subject to laws, regulations and self-regulatory organization rules that authorize regulatory bodies to block or reduce the flow of funds to the parent holding company, or that prohibit such transfers altogether in certain circumstances. These laws, regulations and rules may hinder our ability to access funds that we may need to make payments on our obligations. Furthermore, as a bank holding company, we may become subject to a prohibition or to limitations on our ability to pay dividends. The OCC, the Fed and the FDIC have the authority, and under certain circumstances the duty, to prohibit or to limit the payment of dividends by the banking organizations they supervise, including us and our bank holding company subsidiaries.
17
Our liquidity and financial condition have in the past been, and in the future could be, adversely affected by U.S. and international markets and economic conditions.
Our ability to raise funding in the long-term or short-term debt capital markets or the equity markets, or to access secured lending markets, has in the past been, and could in the future be, adversely affected by conditions in the U.S. and international markets and economy. Global market and economic conditions have been particularly disrupted and volatile during the past two years, with volatility reaching unprecedented levels in the Fall of 2008 and into 2009. In particular, our cost and availability of funding have been, and may in the future be, adversely affected by illiquid credit markets and wider credit spreads. Renewed turbulence in the U.S. and international markets and economy could adversely affect our liquidity and financial condition and the willingness of certain counterparties and customers to do business with us.
Market Risk.
Market risk refers to the risk that a change in the level of one or more market prices of commodities or securities, rates, indices, implied volatilities (the price volatility of the underlying instrument imputed from option prices), correlations or other market factors, such as liquidity, will result in losses for a position or portfolio. For more information on how we monitor and manage market risk, see "Qualitative and Quantitative Disclosure about Market Risk-Risk Management-Market Risk" in Part II, Item 7A herein.
Our results of operations may be materially affected by market fluctuations and by economic and other factors.
The amount, duration and range of our market risk exposures have been increasing over the past several years, and may continue to do so. Our results of operations may be materially affected by market fluctuations due to economic and other factors. Results of operations in the past have been, and in the future may continue to be, materially affected by many factors of a global nature, including political, economic and market conditions; the availability and cost of capital; the liquidity of global markets; the level and volatility of equity prices, commodity prices and interest rates; currency values and other market indices; technological changes and events; the availability and cost of credit; inflation; natural disasters; acts of war or terrorism; investor sentiment and confidence in the financial markets; or a combination of these or other factors. In addition, legislative, legal and regulatory developments related to our businesses potentially could increase costs, thereby affecting results of operations. These factors also may have an impact on our ability to achieve our strategic objectives.
The results of our Institutional Securities business segment, particularly results relating to our involvement in primary and secondary markets for all types of financial products, are subject to substantial fluctuations due to a variety of factors, such as those enumerated above that we cannot control or predict with great certainty. These fluctuations impact results by causing variations in new business flows and in the fair value of securities and other financial products. Fluctuations also occur due to the level of global market activity, which, among other things, affects the size, number and timing of investment banking client assignments and transactions and the realization of returns from our principal investments. During periods of unfavorable market or economic conditions, the level of individual investor participation in the global markets, as well as the level of client assets, may also decrease, which would negatively impact the results of our Global Wealth Management Group business segment. In addition, fluctuations in global market activity could impact the flow of investment capital into or from assets under management or supervision and the way customers allocate capital among money market, equity, fixed income or other investment alternatives, which could negatively impact our Asset Management business segment.
We may experience further writedowns of our financial instruments and other losses related to volatile and illiquid market conditions .
Market volatility, illiquid market conditions and disruptions in the credit markets have made it extremely difficult to value certain of our securities. Subsequent valuations, in light of factors then prevailing, may result in significant changes in the values of these securities in future periods. In addition, at the time of any sales and
18
settlements of these securities, the price we ultimately realize will depend on the demand and liquidity in the market at that time and may be materially lower than their current fair value. Any of these factors could require us to take further writedowns in the value of our securities portfolio, which may have an adverse effect on our results of operations in future periods.
In addition, financial markets are susceptible to severe events evidenced by rapid depreciation in asset values accompanied by a reduction in asset liquidity. Under these extreme conditions, hedging and other risk management strategies may not be as effective at mitigating trading losses as they would be under more normal market conditions. Moreover, under these conditions market participants are particularly exposed to trading strategies employed by many market participants simultaneously and on a large scale, such as crowded trades. Morgan Stanley's risk management and monitoring processes seek to quantify and mitigate risk to more extreme market moves. Severe market events have historically been difficult to predict, however, and Morgan Stanley could realize significant losses if unprecedented extreme market events were to occur, such as conditions in the global financial markets and global economy that prevailed from 2008 into 2009.
Holding large and concentrated positions may expose us to losses.
Concentration of risk may reduce revenues or result in losses in our market-making, proprietary trading, investing, block trading, underwriting and lending businesses in the event of unfavorable market movements. We commit substantial amounts of capital to these businesses, which often results in our taking large positions in the securities of, or making large loans to, a particular issuer or issuers in a particular industry, country or region.
We have incurred, and may continue to incur, significant losses in the real estate sector.
We finance and acquire principal positions in a number of real estate and real estate-related products for our own account, for investment vehicles managed by affiliates in which we also may have a significant investment, for separate accounts managed by affiliates and for major participants in the commercial and residential real estate markets. We also originate loans secured by commercial and residential properties. Further, we securitize and trade in a wide range of commercial and residential real estate and real estate-related whole loans, mortgages and other real estate and commercial assets and products, including residential and commercial mortgage-backed securities. These businesses have been, and may continue to be, adversely affected by the downturn in the real estate sector.
Credit Risk.
Credit risk refers to the risk of loss arising from borrower or counterparty default when a borrower, counterparty or obligor does not meet its obligations. For more information on how we monitor and manage credit risk, see "Credit Risk" in Part II, Item 7A herein.
We are exposed to the risk that third parties that are indebted to us will not perform their obligations.
We incur significant "single name" credit risk exposure through the Institutional Securities business segment. This risk may arise from a variety of business activities, including but not limited to entering into swap or other derivative contracts under which counterparties have obligations to make payments to us; extending credit to clients through various lending commitments; providing short or long-term funding that is secured by physical or financial collateral whose value may at times be insufficient to fully cover the loan repayment amount; and posting margin and/or collateral to clearing houses, clearing agencies, exchanges, banks, securities firms and other financial counterparties. We incur credit risk in traded securities and loan pools whereby the value of these assets may fluctuate based on realized or expected defaults on the underlying obligations or loans.
We also incur "individual consumer" credit risk in the Global Wealth Management Group business segment lending to individual investors, including margin and non-purpose loans collateralized by securities, and residential mortgage loans.
19
The global economic downturn continues to impact our "single name" credit risk exposure. While we believe current valuations and reserves adequately address our perceived levels of risk, there is a possibility that continued difficult economic conditions may further negatively impact our clients and our current credit exposures. In addition, as a clearing member firm, we finance our customer positions and we could be held responsible for the defaults or misconduct of our customers. Although we regularly review our credit exposures, default risk may arise from events or circumstances that are difficult to detect or foresee.
Defaults by another large financial institution could adversely affect financial markets generally.
The commercial soundness of many financial institutions may be closely interrelated as a result of credit, trading, clearing or other relationships between the institutions. As a result, concerns about, or a default or threatened default by, one institution could lead to significant market-wide liquidity and credit problems, losses or defaults by other institutions. This is sometimes referred to as "systemic risk" and may adversely affect financial intermediaries, such as clearing agencies, clearing houses, banks, securities firms and exchanges, with which we interact on a daily basis, and therefore could adversely affect Morgan Stanley.
Operational Risk.
Operational risk refers to the risk of financial or other loss, or damage to a firm's reputation, resulting from inadequate or failed internal processes, people, resources, systems or from other internal or external events (e.g., internal or external fraud, legal and compliance risks, damage to physical assets, etc.). Morgan Stanley may incur operational risk across its full scope of business activities, including revenue-generating activities (e.g., sales and trading) and support functions (e.g., information technology and trade processing). Legal and compliance risk is included in the scope of operational risk and is discussed below under "Legal Risk." For more information on how we monitor and manage operational risk, see "Operational Risk" in Part II, Item 7A herein.
We are subject to operational risk that could adversely affect our businesses.
Our businesses are highly dependent on our ability to process, on a daily basis, a large number of transactions across numerous and diverse markets in many currencies. In general, the transactions we process are increasingly complex. We perform the functions required to operate our different businesses either by ourselves or through agreements with third parties. We rely on the ability of our employees, our internal systems and systems at technology centers operated by third parties to process a high volume of transactions.
We also face the risk of operational failure or termination of any of the clearing agents, exchanges, clearing houses or other financial intermediaries we use to facilitate our securities transactions. In the event of a breakdown or improper operation of our or a third party's systems or improper action by third parties or employees, we could suffer financial loss, an impairment to our liquidity, a disruption of our businesses, regulatory sanctions or damage to our reputation.
Despite the business contingency plans we have in place, our ability to conduct business may be adversely affected by a disruption in the infrastructure that supports our business and the communities where we are located. This may include a disruption involving physical site access, terrorist activities, disease pandemics, electrical, communications or other services used by Morgan Stanley, its employees or third parties with whom we conduct business.
Legal Risk.
Legal and compliance risk includes the risk of exposure to fines, penalties, judgments, damages and/or settlements in connection with regulatory or legal actions as a result of non-compliance with applicable legal or regulatory requirements or litigation. Legal risk also includes contractual and commercial risk such as the risk that a counterparty's performance obligations will be unenforceable. In today's environment of rapid and possibly transformational regulatory change, we also view regulatory change as a component of legal risk. For more information on how we monitor and manage legal risk, see "Risk Management-Legal Risk" in Part II, Item 7A herein.
20
The financial services industry is subject to extensive regulation, which is undergoing major changes.
As a major financial services firm, we are subject to extensive regulation by U.S. federal and state regulatory agencies and securities exchanges and by regulators and exchanges in each of the major markets where it operates. We also face the risk of investigations and proceedings by governmental and self-regulatory agencies in all countries in which we conduct our business. Interventions by authorities may result in adverse judgments, settlements, fines, penalties, injunctions or other relief. In addition to the monetary consequences, these measures could, for example, impact our ability to engage in, or impose limitations on, certain of our businesses. The number of these investigations and proceedings, as well as the amount of penalties and fines sought, has increased substantially in recent years with regard to many firms in the financial services industry, including us. Significant regulatory action against us could materially adversely affect our business, financial condition or results of operations or cause us significant reputational harm, which could seriously harm our business.
In response to the financial crisis, legislators and regulators, both in the U.S. and worldwide, are currently considering a wide range of proposals that, if enacted, could result in major changes to the way our global operations are regulated. Some of these major changes may take effect as early as 2010, and could materially impact the profitability of our businesses, the value of assets we hold, require changes to business practices or force us to discontinue businesses, and expose us to additional costs, taxes, liabilities and reputational risk.
We are a bank holding company that has elected to be treated as a financial holding company. As a financial holding company, we are subject to the comprehensive, consolidated supervision and regulation of the Fed, including risk-based capital requirements and leverage limits. Reform proposals could result in our becoming subject to stricter capital requirements and leverage limits, and could also affect the scope, coverage, or calculation of capital, all of which could adversely affect our ability to pay dividends, or could require us to reduce business levels or to raise capital, including in ways that may adversely impact our shareholders or creditors. Regulatory reform proposals could also result in the imposition of additional restrictions on our activities if we were to no longer meet certain capital requirements at the level of the financial holding company.
The financial services industry faces substantial litigation and is subject to regulatory investigations, and we may face damage to our reputation and legal liability.
We have been named, from time to time, as a defendant in various legal actions, including arbitrations, class actions, and other litigation, as well as investigations or proceedings brought by regulatory agencies, arising in connection with our activities as a global diversified financial services institution. Certain of the actual or threatened legal or regulatory actions include claims for substantial compensatory and/or punitive damages, claims for indeterminate amounts of damages, or may result in penalties, fines, or other results adverse to us. In some cases, the issuers that would otherwise be the primary defendants in such cases are bankrupt or in financial distress. Like any large corporation, we are also subject to risk from potential employee misconduct, including non-compliance with policies and improper use or disclosure of confidential information.
Substantial legal liability could materially adversely affect our business, financial condition or results of operations or cause us significant reputational harm, which could seriously harm our business. For more information regarding legal proceedings in which we are involved see "Legal Proceedings" in Part I, Item 3 herein.
Our business, financial condition and results of operations could be adversely affected by governmental fiscal and monetary policies.
We are affected by fiscal and monetary policies adopted by regulatory authorities and bodies of the U.S. and other governments. For example, the actions of the Fed and international central banking authorities directly impact our cost of funds for lending, capital raising and investment activities and may impact the value of financial instruments we hold. In addition, such changes in monetary policy may affect the credit quality of our customers. Changes in domestic and international monetary policy are beyond our control and difficult to predict.
21
Our commodities activities subject us to extensive regulation, potential catastrophic events and environmental risks and regulation that may expose us to significant costs and liabilities.
In connection with the commodities activities in our Institutional Securities business segment, we engage in the production, storage, transportation, marketing and trading of several commodities, including metals (base and precious), agricultural products, crude oil, oil products, natural gas, electric power, emission credits, coal, freight, liquefied natural gas and related products and indices. In addition, we own electricity generating facilities in the U.S. and Europe; we own TransMontaigne Inc. and its subsidiaries, a group of companies operating in the refined petroleum products marketing and distribution business; and we have an interest in Heidmar Holdings LLC, which owns a group of companies that provide international marine transportation and U.S. marine logistics services. As a result of these activities, we are subject to extensive and evolving energy, commodities, environmental, health and safety and other governmental laws and regulations. For example, liability may be incurred without regard to fault under certain environmental laws and regulations for the remediation of contaminated areas. Further, through these activities we are exposed to regulatory, physical and certain indirect risks associated with climate change. Our commodities business also exposes us to the risk of unforeseen and catastrophic events, including natural disasters, leaks, spills, explosions, release of toxic substances, fires, accidents on land and at sea, wars, and terrorist attacks that could result in personal injuries, loss of life, property damage, and suspension of operations.
Although we have attempted to mitigate our pollution and other environmental risks by, among other measures, adopting appropriate policies and procedures for power plant operations, monitoring the quality of petroleum storage facilities and transport vessels and implementing emergency response programs, these actions may not prove adequate to address every contingency. In addition, insurance covering some of these risks may not be available, and the proceeds, if any, from insurance recovery may not be adequate to cover liabilities with respect to particular incidents. As a result, our financial condition and results of operations may be adversely affected by these events.
We also expect the other laws and regulations affecting our commodities business to increase in both scope and complexity. During the past several years, intensified scrutiny of certain energy markets by federal, state and local authorities in the U.S. and abroad and the public has resulted in increased regulatory and legal enforcement, litigation and remedial proceedings involving companies engaged in the activities in which we are engaged. For example, the U.S. and the EU have increased their focus on the energy markets which has resulted in increased regulation of companies participating in the energy markets, including those engaged in power generation and liquid hydrocarbons trading. Regulatory reforms currently underway are likely to include significant regulation of OTC derivatives markets, which could include mandated exchange trading and clearing, position limits, margin, capital and registration requirements. We may incur substantial costs or loss of revenue in complying with current or future laws and regulations and our overall businesses and reputation may be adversely affected by the current legal environment. In addition, failure to comply with these laws and regulations may result in substantial civil and criminal fines and penalties.
A failure to deal with conflicts of interest appropriately could adversely affect our businesses.
As a global financial services firm that provides products and services to a large and diversified group of clients, including corporations, governments, financial institutions and individuals, we face potential conflicts of interest in the normal course of business. For example, potential conflicts can occur when there is a divergence of interests between Morgan Stanley and a client, among clients, or between an employee on the one hand and the Firm or a client on the other. We have policies, procedures and controls that are designed to address potential conflicts of interest. However, identifying and managing potential conflicts of interest can be complex and challenging, and can become the focus of media and regulatory scrutiny. Indeed, actions that merely appear to create a conflict can put our reputation at risk even if the likelihood of an actual conflict has been mitigated. It is possible that potential conflicts could give rise to litigation or enforcement actions, which may lead to our clients being less willing to enter into transactions in which a conflict may occur and could adversely affect our businesses.
22
Our regulators have the ability to scrutinize our activities for potential conflicts of interest, including through detailed examinations of specific transactions. In addition, our status as a bank holding company supervised by the Fed subjects us to direct Fed scrutiny with respect to transactions between Morgan Stanley's domestic subsidiary banks and their affiliates.
Competitive Environment.
We face strong competition from other financial services firms, which could lead to pricing pressures that could materially adversely affect our revenue and profitability.
The financial services industry and all of our businesses are intensely competitive, and we expect them to remain so. We compete with commercial banks, insurance companies, sponsors of mutual funds, hedge funds, energy companies and other companies offering financial services in the U.S., globally and through the internet. We compete on the basis of several factors, including transaction execution, capital or access to capital, products and services, innovation, reputation, risk appetite and price. Over time, certain sectors of the financial services industry have become more concentrated, as institutions involved in a broad range of financial services have been acquired by or merged into other firms or have declared bankruptcy. These developments could result in our competitors gaining greater capital and other resources, such as a broader range of products and services and geographic diversity. We may experience pricing pressures as a result of these factors and as some of our competitors seek to increase market share by reducing prices. For more information regarding the competitive environment in which we operate, see "Competition" in Part I, Item 1 herein.
Our ability to retain and attract qualified employees is critical to the success of our business and the failure to do so may materially adversely affect our performance.
Our people are our most important resource and competition for qualified employees is intense. In order to attract and retain qualified employees, we must compensate such employees at market levels. Typically, those levels have caused employee compensation to be our greatest expense as compensation is highly variable and changes based on business and individual performance and market conditions. If we are unable to continue to attract and retain qualified employees, or do so at rates necessary to maintain our competitive position, or if compensation costs required to attract and retain employees become more expensive, our performance, including our competitive position, could be materially adversely affected. The financial industry may experience more stringent regulation of employee compensation, or employee compensation may be made subject to special taxation, as has been proposed in the U.K. and France, which could have an adverse effect on our ability to hire or retain the most qualified employees.
Automated trading markets may adversely affect our business and may increase competition.
We have experienced intense price competition in some of our businesses in recent years. In particular, the ability to execute securities trades electronically on exchanges and through other automated trading markets has increased the pressure on trading commissions. The trend toward direct access to automated, electronic markets will likely continue. It is possible that we will experience competitive pressures in these and other areas in the future as some of our competitors may seek to obtain market share by reducing prices.
International Risk.
We are subject to numerous political, economic, legal, operational, franchise and other risks as a result of our international operations which could adversely impact our businesses in many ways.
We are subject to political, economic, legal, operational, franchise and other risks that are inherent in operating in many countries, including risks of possible nationalization, expropriation, price controls, capital controls, exchange controls and other restrictive governmental actions, as well as the outbreak of hostilities or political and governmental instability. In many countries, the laws and regulations applicable to the securities and financial
23
services industries are uncertain and evolving, and it may be difficult for us to determine the exact requirements of local laws in every market. Our inability to remain in compliance with local laws in a particular market could have a significant and negative effect not only on our business in that market but also on our reputation generally. We are also subject to the enhanced risk that transactions we structure might not be legally enforceable in all cases.
Various emerging market countries have experienced severe political, economic and financial disruptions, including significant devaluations of their currencies, capital and currency exchange controls, high rates of inflation and low or negative growth rates in their economies. Crime and corruption, as well as issues of security and personal safety, also exist in certain of these countries. These conditions could adversely impact our businesses and increase volatility in financial markets generally.
The emergence of a pandemic or other widespread health emergency, or concerns over the possibility of such an emergency, could create economic and financial disruptions in emerging markets and other areas throughout the world, and could lead to operational difficulties (including travel limitations) that could impair our ability to manage our businesses around the world.
As a U.S. company, we are required to comply with the economic sanctions and embargo programs administered by OFAC and similar multi-national bodies and governmental agencies worldwide and the FCPA. A violation of a sanction or embargo program or of the FCPA could subject us, and individual employees, to a regulatory enforcement action as well as significant civil and criminal penalties.
Acquisition Risk.
We may be unable to fully capture the expected value from acquisitions, joint ventures, minority stakes and strategic alliances.
In connection with past or future acquisitions, combinations, joint ventures or strategic alliances, we face numerous risks and uncertainties combining or integrating the relevant businesses and systems, including the need to combine accounting and data processing systems and management controls and to integrate relationships with clients and business partners. In the case of joint ventures and minority stakes, we are subject to additional risks and uncertainties because we may be dependent upon, and subject to liability, losses or reputational damage relating to, systems, controls and personnel that are not under our control. In addition, conflicts or disagreements between us and our joint venture partners may negatively impact the benefits to be achieved by the joint venture. There is no assurance that any of our acquisitions will be successfully integrated or yield all of the positive benefits anticipated. If we are not able to integrate successfully our past and future acquisitions, there is a risk that our results of operations, financial condition and cash flows may be materially and adversely affected.
Certain of our recent and planned business initiatives, including expansions of existing businesses, may bring us into contact, directly or indirectly, with individuals and entities that are not within our traditional client and counterparty base and may expose us to new asset classes and new markets. These business activities expose us to new and enhanced risks, greater regulatory scrutiny of these activities, increased credit-related, sovereign and operational risks, and reputational concerns regarding the manner in which these assets are being operated or held.
Risk Management.
Our hedging strategies and other risk management techniques may not be fully effective in mitigating our risk exposure in all market environments or against all types of risk.
We have devoted significant resources to develop our risk management policies and procedures and expect to continue to do so in the future. Nonetheless, our hedging strategies and other risk management techniques may not be fully effective in mitigating our risk exposure in all market environments or against all types of risk,
24
including risks that are unidentified or unanticipated. Some of our methods of managing risk are based upon our use of observed historical market behavior. As a result, these methods may not predict future risk exposures, which could be significantly greater than the historical measures indicate. Management of market, credit, liquidity, operational, legal and regulatory risks requires, among other things, policies and procedures to record properly and verify a large number of transactions and events, and these policies and procedures may not be fully effective. For more information on how we monitor and manage market and certain other risks, see "Quantitative and Qualitative Disclosures about Market Risk-Risk Management-Market Risk" in Part II, Item 7A herein.
For more information regarding the regulatory environment in which we operate, see also "Supervision and Regulation" in Part I, Item 1 herein.
Item 1B. Unresolved Staff Comments.
Morgan Stanley, like other well-known seasoned issuers, from time to time receives written comments from the staff of the SEC regarding its periodic or current reports under the Exchange Act. There are no comments that remain unresolved that Morgan Stanley received not less than 180 days before the end of the year to which this report relates that Morgan Stanley believes are material.
25
Item 2. Properties.
Morgan Stanley and its subsidiaries have offices, operations and data centers located around the world. Morgan Stanley's properties that are not owned are leased on terms and for durations that are reflective of commercial standards in the communities where these properties are located. Morgan Stanley believes the facilities it owns or occupies are adequate for the purposes for which they are currently used and are well maintained. Our principal offices consist of the following properties:
| Location | Owned/ Leased | Lease Expiration | Approximate Square Footage as of December 31, 2009 (A) | ||||
U.S. Locations | |||||||
1585 Broadway New York, New York ( Global Headquarters and Institutional Securities Headquarters ) | Owned | N/A | 894,600 square feet | ||||
2000 Westchester Avenue Purchase, New York ( Global Wealth Management Group Headquarters ) | Owned | N/A | 589,200 square feet | ||||
522 Fifth Avenue New York, New York ( Asset Management Headquarters ) | Owned | N/A | 581,250 square feet | ||||
New York, New York ( Several locations ) | Leased | 2010 – 2018 | 2,614,400 square feet | ||||
Brooklyn, New York ( Several locations ) | Leased | 2013 – 2016 | 638,300 square feet | ||||
Jersey City, New Jersey ( Several locations ) | Leased | 2010 – 2014 | 493,700 square feet | ||||
International Locations | |||||||
20 Bank Street ( London Headquarters ) | Leased | 2038 | 546,400 square feet | ||||
Canary Wharf ( Several locations ) | Leased (B) | 2036 | 625,700 square feet | ||||
1 Austin Road West Kowloon ( Hong Kong Headquarters ) | Leased | 2019 | 587,950 square feet | ||||
Sapporo's Yebisu Garden Place, Ebisu, Shibuya-ku ( Tokyo Headquarters ) | Leased | 2011 | (C) | 432,350 square feet | |||
| (A) | The indicated total aggregate square footage leased does not include space occupied by Morgan Stanley branch offices. |
| (B) | Morgan Stanley holds the freehold interest in the land and building. |
| (C) | Option to return half of the space from April 2010 and any amount of space up to the full space after April 2011. |
26
Item 3. Legal Proceedings.
In addition to the matters described below, in the normal course of business, the Company has been named, from time to time, as a defendant in various legal actions, including arbitrations, class actions and other litigation, arising in connection with its activities as a global diversified financial services institution. Certain of the actual or threatened legal actions include claims for substantial compensatory and/or punitive damages or claims for indeterminate amounts of damages. In some cases, the issuers that would otherwise be the primary defendants in such cases are bankrupt or in financial distress.
The Company is also involved, from time to time, in other reviews, investigations and proceedings (both formal and informal) by governmental and self-regulatory agencies regarding the Company's business including, among other matters, accounting and operational matters, certain of which may result in adverse judgments, settlements, fines, penalties, injunctions or other relief.
The Company contests liability and/or the amount of damages as appropriate in each pending matter. In view of the inherent difficulty of predicting the outcome of such matters, particularly in cases where claimants seek substantial or indeterminate damages or where investigations and proceedings are in the early stages, the Company cannot predict with certainty the loss or range of loss, if any, related to such matters, how or if such matters will be resolved, when they will ultimately be resolved, or what the eventual settlement, fine, penalty or other relief, if any, might be. Subject to the foregoing, the Company believes, based on current knowledge and after consultation with counsel, that the outcome of such pending matters will not have a material adverse effect on the consolidated financial condition of the Company, although the outcome of such matters could be material to the Company's operating results and cash flows for a particular future period depending on, among other things, the level of the Company's revenues or income for such period.
Residential Mortgage-Related Matters.
Regulatory and Governmental Matters. The Company is responding to subpoenas and requests for information from certain regulatory and governmental entities concerning the origination, purchase, securitization and servicing of subprime and non-subprime residential mortgages and related issues including collateralized debt obligations and credit default swaps backed by or referencing mortgage pass through certificates.
Class Actions. Beginning in December 2007, several purported class action complaints were filed in the U.S. District Court for the Southern District of New York (the "SDNY") asserting claims on behalf of participants in the Company's 401(k) plan and employee stock ownership plan against the Company and other parties, including certain present and former directors and officers, under the Employee Retirement Income Security Act of 1974 ("ERISA"). In February 2008, these actions were consolidated in a single proceeding, which is styled In re Morgan Stanley ERISA Litigation . The consolidated complaint relates in large part to the Company's subprime and other mortgage related losses, but also includes allegations regarding the Company's disclosures, internal controls, accounting and other matters. The consolidated complaint alleges, among other things, that the Company's stock was not a prudent investment and that risks associated with its stock and its financial condition were not adequately disclosed. On December 9, 2009, the court denied defendants' motion to dismiss the consolidated complaint.
On February 12, 2008, a plaintiff filed a purported class action, which was amended on November 24, 2008, naming the Company and certain present and former senior executives as defendants and asserting claims for violations of the securities laws. The amended complaint, which is styled Joel Stratte-McClure, et al. v. Morgan Stanley, et al. , is currently pending in the SDNY. Subject to certain exclusions, the amended complaint purports to assert claims on behalf of a purported class of persons and entities who purchased shares of the Company's common stock during the period June 20, 2007 to December 19, 2007 and who suffered damages as a result of such purchases. The allegations in the amended complaint relate in large part to the Company's subprime and other mortgage related losses, but also include allegations regarding the Company's disclosures, internal controls, accounting and other matters. On April 27, 2009, the Company filed a motion to dismiss the amended complaint.
27
On May 7, 2009, the Company was named as a defendant in a purported class action lawsuit brought under Sections 11 and 12 of the Securities Act of 1933, as amended (the "Securities Act"), alleging, among other things, that the registration statements and offering documents related to the offerings of approximately $17 billion of mortgage pass through certificates in 2006 and 2007 contained false and misleading information concerning the pools of residential loans that backed these securitizations. The plaintiffs are seeking, among other relief, class certification, unspecified compensatory and rescissionary damages, costs, interest and fees. This case, which was consolidated with an earlier lawsuit and is currently styled In re Morgan Stanley Mortgage Pass-Through Certificate Litig , is pending in the SDNY. On September 15, 2009, the lead plaintiff filed a consolidated amended complaint which defendants have moved to dismiss.
Beginning in 2007, the Company was named as a defendant in several putative class action lawsuits brought under Sections 11 and 12 of the Securities Act, related to its role as a member of the syndicates that underwrote offerings of securities and mortgage pass through certificates for certain non-Morgan Stanley related entities that have been exposed to subprime and other mortgage-related losses. The plaintiffs in these actions allege, among other things, that the registration statements and offering documents for the offerings at issue contained various material misstatements or omissions related to the extent to which the issuers were exposed to subprime and other mortgage-related risks and other matters and seek various forms of relief including class certification, unspecified compensatory and rescissionary damages, costs, interest and fees. The Company's exposure to potential losses in these cases may be impacted by various factors including, among other things, the financial condition of the entities that issued the securities and mortgage pass through certificates at issue, the principal amount of the offerings underwritten by the Company, the financial condition of co-defendants and the willingness and ability of the issuers to indemnify the underwriter defendants. Some of these cases relate to issuers that have filed for bankruptcy, including In Re Washington Mutual, Inc. Securities Litigation , In re: Lehman Brothers Equity/Debt Securities Litigation and In re IndyMac Mortgage-Backed Securities Litigation . In Re Washington Mutual, Inc. Securities Litigation is pending in the United States District Court for the Western District of Washington and relates to several offerings of debt and equity securities issued by Washington Mutual, Inc. during 2006 and 2007. The Company underwrote approximately $1.6 billion of the principal amount of the offerings at issue. On October 27, 2009, the court granted in part and denied in part defendants' motion to dismiss the amended complaint. In re: Lehman Brothers Equity/Debt Securities Litigation is pending in the SDNY and relates to several offerings of debt and equity securities issued by Lehman Brothers Holdings Inc. during 2007 and 2008. The Company underwrote over $200 million of the principal amount of the offerings at issue. The Company and other defendants have moved to dismiss these claims. In re IndyMac Mortgage-Backed Securities Litigation is pending in the SDNY and relates to the offerings of mortgage pass through certificates issued by seven trusts sponsored by affiliates of IndyMac Bancorp during 2006 and 2007. The Company underwrote over $2.4 billion of the principal amount of the offerings at issue. The Company and other defendants have moved to dismiss these claims.
Shareholder Derivative Matter. A shareholder derivative lawsuit was filed in the SDNY during November 2007 asserting claims related in large part to losses caused by certain subprime-related trading positions and related matters. The complaint in that lawsuit, which is styled Steve Staehr, Derivatively on Behalf of Morgan Stanley v. John J. Mack, et al. , was served on the Company on February 15, 2008. On July 16, 2008, the plaintiff filed an amended complaint, which defendants have moved to dismiss. The complaint seeks, among other relief, unspecified compensatory damages, restitution, and institution of certain corporate governance reforms.
Auction Rate Securities Matters.
On August 27, 2008, a shareholder derivative complaint, which was styled Louisiana Municipal Police Employees Retirement System v. Mack, et al. , was filed in the SDNY. On September 12, 2008, a second complaint, which was styled Thomas v. Mack, et al. , was filed in the SDNY. The complaints were substantially similar and named as defendants the members of the Company's Board of Directors as well as certain current and former officers. Morgan Stanley, on whose behalf the suits were purportedly brought, is named as a nominal defendant in each action. The complaints raised claims of breach of fiduciary duty, abuse of control, gross mismanagement, and violation of Section 10(b) and Rule 10b-5 of the Securities Exchange Act of 1934, as
28
amended, related to the Company's sale of auction rate securities ("ARS") over the period from June 20, 2007 to the present. Among other things, the complaints alleged that, over the relevant period, Morgan Stanley's public filings and statements were materially false and misleading in that they failed to disclose the illiquid nature of its ARS inventories and that Morgan Stanley's practices in the sale of ARS exposed it to significant liability for settlements and judgments. The complaints also alleged that during the relevant period certain defendants sold Morgan Stanley's stock while in possession of material non-public information. The complaints sought, among other things, unspecified compensatory damages, restitution from the defendants with respect to compensation, benefits and profits obtained, and the institution of certain reforms to Morgan Stanley's internal control functions. On November 24, 2008, the SDNY ordered the consolidation of the two actions. On February 2, 2009, plaintiffs filed a consolidated amended complaint, styled as In re Morgan Stanley & Co. Inc. Auction Rate Securities Derivative Litigation . On June 23, 2009, the SDNY granted defendants' motion to dismiss the consolidated complaint for failure by plaintiffs to make a pre-litigation demand on the Company's Board of Directors. In addition, the SDNY set a schedule for plaintiffs to make such a demand, for the Board of Directors to respond thereto, and for further proceedings before the SDNY, which may include a motion for leave to file an amended complaint.
Executive Compensation-Related Matter.
A shareholder derivative lawsuit was filed in the Supreme Court of the State of New York, County of New York, on February 11, 2010 asserting claims for waste, breach of the duty of loyalty and unjust enrichment related to the Company's executive compensation for the fiscal years ended November 30, 2006 and 2007 and the calendar year ended December 31, 2009. The complaint, which is styled Security and Fire Professionals of America Retirement Fund, et al. v. John J. Mack, et. al., names as defendants the Company's Board of Directors and certain present and former officers and directors. Morgan Stanley, on whose behalf the lawsuit is purportedly being brought, is named as a nominal defendant. The complaint alleges, among other things, that the total amount of the executive compensation paid for these years was disproportionately large in relation to the Company's performance. The complaint seeks, among other relief, unspecified compensatory damages, restitution and disgorgement of compensation, benefits and profits, and institution of certain corporate governance reforms.
China Matter.
As disclosed in February 2009, the Company uncovered actions initiated by an employee based in China in an overseas real estate subsidiary that appear to have violated the Foreign Corrupt Practices Act. The Company terminated the employee, reported the activity to appropriate authorities and is cooperating with investigations by the United States Department of Justice and the SEC.
Item 4. Submission of Matters to a Vote of Security Holders.
There were no matters submitted to a vote of security holders during the fourth quarter of the year ended December 31, 2009.
29
Part II
| Item 5. Market | for Registrant's Common Equity, Related Stockholder Matters and Issuer Purchases of Equity Securities. |
Morgan Stanley's common stock trades on the NYSE under the symbol "MS." As of February 22, 2010, Morgan Stanley had approximately 92,935 holders of record; however, Morgan Stanley believes the number of beneficial owners of common stock exceeds this number.
The table below sets forth, for each of the last eight quarters, the low and high sales prices per share of Morgan Stanley's common stock as reported by Bloomberg Financial Markets and the amount of any cash dividends per share of Morgan Stanley's common stock declared by Morgan Stanley's Board of Directors for such quarter.
| Low Sale Price | High Sale Price | Dividends(A) | |||||||
2009: | |||||||||
Fourth Quarter | $ | 28.75 | $ | 35.78 | $ | 0.05 | |||
Third Quarter | $ | 24.85 | $ | 33.33 | $ | 0.05 | |||
Second Quarter | $ | 20.69 | $ | 31.99 | $ | 0.05 | |||
First Quarter | $ | 13.10 | $ | 27.27 | $ | 0.05 | |||
Fiscal 2008: | |||||||||
Fourth Quarter | $ | 6.71 | $ | 44.50 | $ | 0.27 | |||
Third Quarter | $ | 29.60 | $ | 46.58 | $ | 0.27 | |||
Second Quarter | $ | 33.56 | $ | 51.80 | $ | 0.27 | |||
First Quarter | $ | 40.76 | $ | 55.39 | $ | 0.27 | |||
| (A) | On December 16, 2008, the Board of Directors of the Company approved a change in the Company's fiscal year end from November 30 to December 31 of each year, beginning January 1, 2009. As a result of this change, the Board of Directors declared a $0.016667 dividend per common share covering the period from December 1, 2008 through December 31, 2008. The total dividend of $0.066667 per common share covering the four month period from December 1, 2008 to March 31, 2009 was paid on May 15, 2009 to shareholders of record on April 30, 2009. |
30
The table below sets forth the information with respect to purchases made by or on behalf of Morgan Stanley of its common stock during the fourth quarter of the year ended December 31, 2009.
Issuer Purchases of Equity Securities
(dollars in millions, except per share amounts)
Period | Total Number of Shares Purchased | Average Price Paid Per Share | Total Number of Shares Purchased As Part of Publicly Announced Plans or Programs (C) | Approximate Dollar Value of Shares that May Yet Be Purchased Under the Plans or Programs | ||||||
Month #1 (October 1, 2009-October 31, 2009) | ||||||||||
Share Repurchase Program (A) | - | - | - | $ | 1,560 | |||||
Employee Transactions (B) | 99,543 | $ | 31.98 | - | - | |||||
Month #2 (November 1, 2009-November 30, 2009) | ||||||||||
Share Repurchase Program (A) | - | - | - | $ | 1,560 | |||||
Employee Transactions (B) | 103,633 | $ | 31.14 | - | - | |||||
Month #3 (December 1, 2009-December 31, 2009) | ||||||||||
Share Repurchase Program (A) | - | - | - | $ | 1,560 | |||||
Employee Transactions (B) | 198,857 | $ | 30.05 | - | - | |||||
Total | ||||||||||
Share Repurchase Program (A) | - | - | - | $ | 1,560 | |||||
Employee Transactions (B) | 402,033 | $ | 30.81 | - | - | |||||
| (A) | On December 19, 2006, the Company announced that its Board of Directors authorized the repurchase of up to $6 billion of the Company's outstanding stock under a share repurchase program (the "Share Repurchase Program"). The Share Repurchase Program is a program for capital management purposes that considers, among other things, business segment capital needs as well as equity-based compensation and benefit plan requirements. The Share Repurchase Program has no set expiration or termination date. Share repurchases by the Company are subject to regulatory approval. |
| (B) | Includes: (1) shares delivered or attested in satisfaction of the exercise price and/or tax withholding obligations by holders of employee and director stock options (granted under employee and director stock compensation plans) who exercised options; (2) shares withheld, delivered or attested (under the terms of grants under employee and director stock compensation plans) to offset tax withholding obligations that occur upon vesting and release of restricted shares; and (3) shares withheld, delivered and attested (under the terms of grants under employee and director stock compensation plans) to offset tax withholding obligations that occur upon the delivery of outstanding shares underlying restricted stock units. The Company's employee and director stock compensation plans provide that the value of the shares withheld, delivered or attested, shall be valued using the fair market value of the Company's common stock on the date the relevant transaction occurs, using a valuation methodology established by Morgan Stanley. |
| (C) | Share purchases under publicly announced programs are made pursuant to open-market purchases, Rule 10b5-1 plans or privately negotiated transactions (including with employee benefit plans) as market conditions warrant and at prices the Company deems appropriate. |
***
31
Stock performance graph. The following graph compares the cumulative total shareholder return (rounded to the nearest whole dollar) of the Company's common stock, the S&P 500 Stock Index ("S&P 500"), the S&P 500 Diversified Financials Index ("S5DIVF") and the S&P 500 Financials Index ("S5FINL") for the last five years. The Company included the S5FINL due to the broader range of financial services companies and related businesses reflected in such index, which is also used by many of the Company's peers. The graph assumes a $100 investment at the closing price on December 31, 2004 and reinvestment of dividends on the respective dividend payment dates without commissions. Historical prices are adjusted to reflect the spin-off of Discover Financial Services completed on June 30, 2007. This graph does not forecast future performance of the Company's common stock.
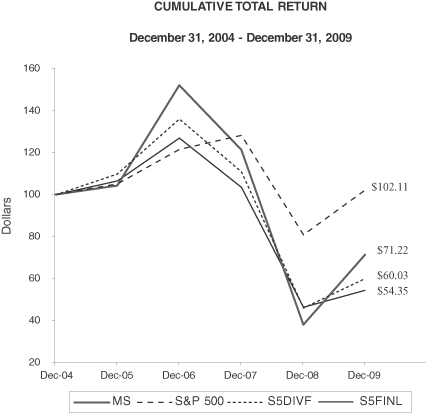
| MS | S&P 500 | S5DIVF | S5FINL | |||||||||
12/31/2004 | $ | 100.00 | $ | 100.00 | $ | 100.00 | $ | 100.00 | ||||
12/30/2005 | $ | 104.26 | $ | 104.91 | $ | 109.83 | $ | 106.50 | ||||
12/29/2006 | $ | 152.06 | $ | 121.46 | $ | 136.06 | $ | 126.96 | ||||
12/31/2007 | $ | 121.24 | $ | 128.13 | $ | 110.87 | $ | 103.47 | ||||
12/31/2008 | $ | 37.85 | $ | 80.74 | $ | 45.98 | $ | 46.32 | ||||
12/31/2009 | $ | 71.22 | $ | 102.11 | $ | 60.03 | $ | 54.35 | ||||
32
| Item 6. | Selected Financial Data. |
MORGAN STANLEY
SELECTED FINANCIAL DATA
(dollars in millions, except share and per share data)
| 2009(1)(2) | Fiscal Year 2008(3) | Fiscal Year 2007(3) | Fiscal Year 2006(3) | Fiscal Year 2005(3) | One Month Ended December 31, 2008(2)(3) | |||||||||||||||||
Income Statement Data: | ||||||||||||||||||||||
Revenues: | ||||||||||||||||||||||
Investment banking | $ | 5,019 | $ | 4,057 | $ | 6,316 | $ | 4,706 | $ | 3,795 | $ | 196 | ||||||||||
Principal transactions: | ||||||||||||||||||||||
Trading | 7,447 | 5,472 | 3,208 | 11,805 | 7,376 | (1,743 | ) | |||||||||||||||
Investments | (1,054 | ) | (3,925 | ) | 3,247 | 1,778 | 1,125 | (207 | ) | |||||||||||||
Commissions | 4,234 | 4,449 | 4,659 | 3,746 | 3,302 | 214 | ||||||||||||||||
Asset management, distribution and administration fees | 5,884 | 4,839 | 5,486 | 4,231 | 3,866 | 292 | ||||||||||||||||
Other | 838 | 3,852 | 776 | 209 | (102 | ) | 107 | |||||||||||||||
Total non-interest revenues | 22,368 | 18,744 | 23,692 | 26,475 | 19,362 | (1,141 | ) | |||||||||||||||
Interest and dividends | 7,702 | 39,679 | 60,069 | 42,774 | 25,985 | 1,297 | ||||||||||||||||
Interest expense | 6,712 | 36,312 | 57,283 | 40,909 | 23,558 | 1,124 | ||||||||||||||||
Net interest | 990 | 3,367 | 2,786 | 1,865 | 2,427 | 173 | ||||||||||||||||
Net revenues | 23,358 | 22,111 | 26,478 | 28,340 | 21,789 | (968 | ) | |||||||||||||||
Non-interest expenses: | ||||||||||||||||||||||
Compensation and benefits | 14,438 | 11,887 | 16,122 | 13,593 | 10,378 | 585 | ||||||||||||||||
Other | 8,063 | 9,087 | 7,580 | 6,353 | 6,071 | 474 | ||||||||||||||||
Total non-interest expenses | 22,501 | 20,974 | 23,702 | 19,946 | 16,449 | 1,059 | ||||||||||||||||
Income (loss) from continuing operations before income taxes and cumulative effect of accounting change, net | 857 | 1,137 | 2,776 | 8,394 | 5,340 | (2,027 | ) | |||||||||||||||
(Benefit from) provision for income taxes | (336 | ) | (21 | ) | 576 | 2,469 | 1,227 | (732 | ) | |||||||||||||
Income (loss) from continuing operations before cumulative effect of accounting change, net | 1,193 | 1,158 | 2,200 | 5,925 | 4,113 | (1,295 | ) | |||||||||||||||
Discontinued operations(4): | ||||||||||||||||||||||
Gain from discontinued operations | 160 | 1,121 | 1,682 | 2,351 | 1,227 | 18 | ||||||||||||||||
(Benefit from) provision for income taxes | (53 | ) | 501 | 633 | 789 | 449 | 8 | |||||||||||||||
Net gain from discontinued operations | 213 | 620 | 1,049 | 1,562 | 778 | 10 | ||||||||||||||||
Cumulative effect of accounting change, net | - | - | - | - | 49 | - | ||||||||||||||||
Net income (loss) | $ | 1,406 | $ | 1,778 | $ | 3,249 | $ | 7,487 | $ | 4,940 | $ | (1,285 | ) | |||||||||
Net income applicable to non-controlling interests | 60 | 71 | 40 | 15 | 2 | 3 | ||||||||||||||||
Net income (loss) applicable to Morgan Stanley | $ | 1,346 | $ | 1,707 | $ | 3,209 | $ | 7,472 | $ | 4,938 | $ | (1,288 | ) | |||||||||
(Loss) earnings applicable to Morgan Stanley common shareholders(5) | $ | (907 | ) | $ | 1,495 | $ | 2,976 | $ | 7,027 | $ | 4,773 | $ | (1,624 | ) | ||||||||
Amounts applicable to Morgan Stanley: | ||||||||||||||||||||||
Income (loss) from continuing operations | $ | 1,149 | $ | 1,125 | $ | 2,162 | $ | 5,913 | $ | 4,111 | $ | (1,295 | ) | |||||||||
Net gain from discontinued operations | 197 | 582 | 1,047 | 1,559 | 778 | 7 | ||||||||||||||||
Cumulative effect of accounting change, net | - | - | - | - | 49 | - | ||||||||||||||||
Net income (loss) applicable to Morgan Stanley | $ | 1,346 | $ | 1,707 | $ | 3,209 | $ | 7,472 | $ | 4,938 | $ | (1,288 | ) | |||||||||
33
| 2009(1)(2) | Fiscal Year 2008(3) | Fiscal Year 2007(3) | Fiscal Year 2006(3) | Fiscal Year 2005(3) | One Month Ended December 31, 2008(2)(3) | |||||||||||||||||||
Per Share Data: | ||||||||||||||||||||||||
(Loss) earnings per basic common share(6): | ||||||||||||||||||||||||
(Loss) income from continuing operations | $ | (0.93 | ) | $ | 0.92 | $ | 1.98 | $ | 5.50 | $ | 3.79 | $ | (1.63 | ) | ||||||||||
Net gain from discontinued operations | 0.16 | 0.53 | 0.99 | 1.46 | 0.71 | 0.01 | ||||||||||||||||||
Cumulative effect of accounting change, net | - | - | - | - | 0.05 | - | ||||||||||||||||||
(Loss) earnings per basic common share | $ | (0.77 | ) | $ | 1.45 | $ | 2.97 | $ | 6.96 | $ | 4.55 | $ | (1.62 | ) | ||||||||||
(Loss) earnings per diluted common share(6): | ||||||||||||||||||||||||
(Loss) income from continuing operations | $ | (0.93 | ) | $ | 0.88 | $ | 1.94 | $ | 5.42 | $ | 3.75 | $ | (1.63 | ) | ||||||||||
Net gain from discontinued operations | 0.16 | 0.51 | 0.96 | 1.43 | 0.70 | 0.01 | ||||||||||||||||||
Cumulative effect of accounting change, net | - | - | - | - | 0.05 | - | ||||||||||||||||||
(Loss) earnings per diluted common share | $ | (0.77 | ) | $ | 1.39 | $ | 2.90 | $ | 6.85 | $ | 4.50 | $ | (1.62 | ) | ||||||||||
Book value per common share(7) | $ | 27.26 | $ | 30.24 | $ | 28.56 | $ | 32.67 | $ | 27.59 | $ | 27.53 | ||||||||||||
Dividends declared per common share | $ | 0.17 | $ | 1.08 | $ | 1.08 | $ | 1.08 | $ | 1.08 | $ | 0.27 | ||||||||||||
Balance Sheet and Other Operating Data: | ||||||||||||||||||||||||
Total assets | $ | 771,462 | $ | 659,035 | $ | 1,045,409 | $ | 1,121,192 | $ | 898,835 | $ | 676,764 | ||||||||||||
Total capital(8) | 213,974 | 192,297 | 191,085 | 162,134 | 125,891 | 208,008 | ||||||||||||||||||
Long-term borrowings(8) | 167,286 | 141,466 | 159,816 | 126,770 | 96,709 | 159,255 | ||||||||||||||||||
Morgan Stanley shareholders' equity | 46,688 | 50,831 | 31,269 | 35,364 | 29,182 | 48,753 | ||||||||||||||||||
Return on average common shareholders' equity | N/M | 3.2 | % | 6.5 | % | 22.0 | % | 17.1 | % | N/M | ||||||||||||||
Average common and equivalent shares(5) | 1,185,414,871 | 1,028,180,275 | 1,001,878,651 | 1,010,254,255 | 1,049,896,047 | 1,002,058,928 | ||||||||||||||||||
| (1) | Information includes Morgan Stanley Smith Barney Holdings LLC ("MSSB") effective May 31, 2009 (see Note 3 to the consolidated financial statements). |
| (2) | On December 16, 2008, the Board of Directors of the Company (the "Board") approved a change in the Company's fiscal year end from November 30 to December 31 of each year. This change to the calendar year reporting cycle began January 1, 2009. As a result of the change, the Company had a one month transition period in December 2008. |
| (3) | Certain prior-period information has been reclassified to conform to the current year's presentation. |
| (4) | Amounts include operating results and gains on secondary offerings related to MSCI Inc. ("MSCI"), operating results and gains (losses) related to the disposition of Crescent Real Estate Equities Limited Partnership ("Crescent"), operating results of the retail asset management business being sold to Invesco Ltd. ("Invesco") ("Retail Asset Management"), and other discontinued operations. |
| (5) | Amounts shown are used to calculate earnings per basic common share. |
| (6) | For the calculation of basic and diluted earnings per common share ("EPS"), see Note 14 to the consolidated financial statements. |
| (7) | Book value per common share equals common shareholders' equity of $37,091 million at December 31, 2009, $31,676 million at November 30, 2008, $30,169 million at November 30, 2007, $34,264 million at November 30, 2006, $29,182 million at November 30, 2005 and $29,585 million at December 31, 2008, divided by common shares outstanding of 1,361 million at December 31, 2009, 1,048 million at November 30, 2008, 1,056 million at November 30, 2007, 1,049 million at November 30, 2006, 1,058 million at November 30, 2005 and 1,074 million at December 31, 2008. |
| (8) | These amounts exclude the current portion of long-term borrowings and include junior subordinated debt issued to capital trusts. At November 30, 2006 and November 30, 2005, capital units were included in total capital. |
34
| Item 7. | Management's Discussion and Analysis of Financial Condition and Results of Operations. |
Introduction.
Morgan Stanley (or the "Company"), a financial holding company, is a global financial services firm that maintains significant market positions in each of its business segments-Institutional Securities, Global Wealth Management Group and Asset Management. The Company, through its subsidiaries and affiliates, provides a wide variety of products and services to a large and diversified group of clients and customers, including corporations, governments, financial institutions and individuals. A summary of the activities of each of the business segments is as follows.
Institutional Securities includes capital raising; financial advisory services, including advice on mergers and acquisitions, restructurings, real estate and project finance; corporate lending; sales, trading, financing and market-making activities in equity and fixed income securities and related products, including foreign exchange and commodities; and investment activities.
Global Wealth Management Group , which includes the Company's 51% interest in MSSB (see Note 3 to the consolidated financial statements), provides brokerage and investment advisory services to individual investors and small-to-medium sized businesses and institutions covering various investment alternatives; financial and wealth planning services; annuity and other insurance products; credit and other lending products; cash management services; retirement services; and trust and fiduciary services.
Asset Management provides global asset management products and services in equity, fixed income, alternative investments, which includes hedge funds and funds of funds, and merchant banking, which includes real estate, private equity and infrastructure, to institutional and retail clients through proprietary and third-party distribution channels (see "Discontinued Operations-Retail Asset Management Business" herein). Asset Management also engages in investment activities.
Change in Fiscal Year-End.
On December 16, 2008, the Board approved a change in the Company's fiscal year-end from November 30 to December 31 of each year. This change to the calendar year reporting cycle began January 1, 2009. As a result of the change, the Company had a one-month transition period in December 2008.
The Company's results of operations for the 12 months ended December 31, 2009 ("2009"), November 30, 2008 ("fiscal 2008"), November 30, 2007 ("fiscal 2007") and the one month ended December 31, 2008 are discussed below.
Discontinued Operations.
Retail Asset Management Business. On October 19, 2009, as part of a restructuring of its Asset Management business segment, the Company entered into a definitive agreement to sell substantially all of Retail Asset Management, including Van Kampen Investments, Inc. ("Van Kampen") to Invesco. This transaction allows the Company's Asset Management business segment to focus on its institutional client base, including corporations, pension plans, large intermediaries, foundations and endowments, sovereign wealth funds and central banks, among others.
Under the terms of the definitive agreement, Invesco will purchase substantially all of Retail Asset Management, operating under both the Morgan Stanley and Van Kampen brands, in a stock and cash transaction. The Company will receive a 9.4% minority interest in Invesco. The transaction, which has been approved by the Boards of Directors of both companies, is expected to close in mid-2010, subject to customary regulatory, client and fund shareholder approvals. The results of Retail Asset Management are reported as discontinued operations for all periods presented.
35
MSCI. In May 2009, the Company divested all of its remaining ownership interest in MSCI. The results of MSCI are reported as discontinued operations for all periods presented.
Crescent. Discontinued operations in 2009, fiscal 2008 and the one month ended December 31, 2008 include operating results and gains (losses) related to the disposition of Crescent, a former real estate subsidiary of the Company. The Company completed the disposition of Crescent in the fourth quarter of 2009, whereby the Company transferred its ownership interest in Crescent to Crescent's primary creditor in exchange for full release of liability on the related loans. The results of Crescent were formerly included in the Asset Management business segment.
Discover. On June 30, 2007, the Company completed the spin-off (the "Discover Spin-off") of its business segment Discover Financial Services ("DFS") to its shareholders. The results of DFS are reported as discontinued operations for all periods presented through the date of the Discover Spin-off. The fiscal 2008 amount related to costs associated with a legal settlement between DFS, VISA and MasterCard. See "Other Matters-Settlement with DFS" herein for further information.
Quilter Holdings Ltd. The results of Quilter Holdings Ltd. ("Quilter"), Global Wealth Management Group's former mass affluent business in the United Kingdom ("U.K."), are also reported as discontinued operations for all periods presented through its sale to Citigroup Inc. ("Citi") on February 28, 2007. Citi subsequently contributed Quilter to the MSSB joint venture. The results of MSSB are included within the Global Wealth Management Group business segment's income from continuing operations effective May 31, 2009.
See Note 23 to the consolidated financial statements for further information on discontinued operations.
36
Executive Summary.
Financial Information.
| 2009(1) | Fiscal Year 2008(2) | Fiscal Year 2007(2) | One Month Ended December 31, 2008(2) | |||||||||||||
Net revenues (dollars in millions): | ||||||||||||||||
Institutional Securities | $ | 12,777 | $ | 14,738 | $ | 15,730 | $ | (1,353 | ) | |||||||
Global Wealth Management Group | 9,390 | 7,019 | 6,625 | 409 | ||||||||||||
Asset Management | 1,337 | 548 | 4,364 | (9 | ) | |||||||||||
Intersegment Eliminations | (146 | ) | (194 | ) | (241 | ) | (15 | ) | ||||||||
Consolidated net revenues | $ | 23,358 | $ | 22,111 | $ | 26,478 | $ | (968 | ) | |||||||
Consolidated net income (loss) (dollars in millions) | $ | 1,406 | $ | 1,778 | $ | 3,249 | $ | (1,285 | ) | |||||||
Net income applicable to non-controlling interest (dollars in millions) | 60 | 71 | 40 | 3 | ||||||||||||
Net income (loss) applicable to Morgan Stanley (dollars in millions) | $ | 1,346 | $ | 1,707 | $ | 3,209 | $ | (1,288 | ) | |||||||
Income (loss) from continuing operations applicable to Morgan Stanley (dollars in millions): | ||||||||||||||||
Institutional Securities | $ | 1,279 | $ | 1,277 | $ | 845 | $ | (1,297 | ) | |||||||
Global Wealth Management Group | 283 | 714 | 696 | 73 | ||||||||||||
Asset Management | (405 | ) | (855 | ) | 673 | (70 | ) | |||||||||
Intersegment Eliminations | (8 | ) | (11 | ) | (52 | ) | (1 | ) | ||||||||
Income (loss) from continuing operations applicable to Morgan Stanley | $ | 1,149 | $ | 1,125 | $ | 2,162 | $ | (1,295 | ) | |||||||
Amounts applicable to Morgan Stanley (dollars in millions): | ||||||||||||||||
Income (loss) from continuing operations applicable to Morgan Stanley | $ | 1,149 | $ | 1,125 | $ | 2,162 | $ | (1,295 | ) | |||||||
Gain from discontinued operations applicable to Morgan Stanley, after tax | 197 | 582 | 1,047 | 7 | ||||||||||||
Net income (loss) applicable to Morgan Stanley (dollars in millions) | $ | 1,346 | $ | 1,707 | $ | 3,209 | $ | (1,288 | ) | |||||||
(Loss) earnings applicable to Morgan Stanley common shareholders (dollars in millions) | $ | (907 | ) | $ | 1,495 | $ | 2,976 | $ | (1,624 | ) | ||||||
(Loss) earnings per basic common share: | ||||||||||||||||
(Loss) income from continuing operations | $ | (0.93 | ) | $ | 0.92 | $ | 1.98 | $ | (1.63 | ) | ||||||
Net gain from discontinued operations(3) | 0.16 | 0.53 | 0.99 | 0.01 | ||||||||||||
(Loss) earnings per basic common share(4) | $ | (0.77 | ) | $ | 1.45 | $ | 2.97 | $ | (1.62 | ) | ||||||
(Loss) earnings per diluted common share: | ||||||||||||||||
(Loss) income from continuing operations | $ | (0.93 | ) | $ | 0.88 | $ | 1.94 | $ | (1.63 | ) | ||||||
Net gain from discontinued operations(3) | 0.16 | 0.51 | 0.96 | 0.01 | ||||||||||||
(Loss) earnings per diluted common share(4) | $ | (0.77 | ) | $ | 1.39 | $ | 2.90 | $ | (1.62 | ) | ||||||
Regional net revenues (dollars in millions)(5): | ||||||||||||||||
Americas | $ | 18,904 | $ | 10,766 | $ | 10,771 | $ | (765 | ) | |||||||
Europe, Middle East and Africa | 2,459 | 8,949 | 9,927 | (246 | ) | |||||||||||
Asia | 1,995 | 2,396 | 5,780 | 43 | ||||||||||||
Consolidated net revenues | $ | 23,358 | $ | 22,111 | $ | 26,478 | $ | (968 | ) | |||||||
37
| 2009(1) | Fiscal Year 2008(2) | Fiscal Year 2007(2) | One Month Ended December 31, 2008(2) | |||||||||||||
| Statistical Data. | ||||||||||||||||
Average common equity (dollars in billions)(6): | ||||||||||||||||
Institutional Securities | $ | 18.1 | $ | 22.9 | $ | 23.2 | $ | 20.8 | ||||||||
Global Wealth Management Group | 4.6 | 1.5 | 1.7 | 1.3 | ||||||||||||
Asset Management | 2.2 | 3.0 | 2.8 | 2.4 | ||||||||||||
Unallocated capital | 8.1 | 4.9 | 2.9 | 4.9 | ||||||||||||
Total from continuing operations | 33.0 | 32.3 | 30.6 | 29.4 | ||||||||||||
Discontinued operations | 1.1 | 1.3 | 4.6 | 1.2 | ||||||||||||
Consolidated average common equity | $ | 34.1 | $ | 33.6 | $ | 35.2 | $ | 30.6 | ||||||||
Return on average common equity(6): | ||||||||||||||||
Consolidated | N/M | 3 | % | 7 | % | N/M | ||||||||||
Institutional Securities | 5 | % | 5 | % | 3 | % | N/M | |||||||||
Global Wealth Management Group | 5 | % | 48 | % | 41 | % | 60 | % | ||||||||
Asset Management | N/M | N/M | 24 | % | N/M | |||||||||||
Book value per common share(7) | $ | 27.26 | $ | 30.24 | $ | 28.56 | $ | 27.53 | ||||||||
Tangible common equity(8) | $ | 29,479 | N/A | N/A | $ | 26,607 | ||||||||||
Tangible book value per common share(9) | $ | 21.67 | N/A | N/A | $ | 24.76 | ||||||||||
Tangible common equity to risk-weighted assets ratio(10) | 9.7 | % | N/A | N/A | N/A | |||||||||||
Effective income tax rate from continuing operations(11) | (39.2 | )% | (1.8 | )% | 20.7 | % | 36.1 | % | ||||||||
Worldwide employees(12) | 61,388 | 45,733 | 48,041 | 45,295 | ||||||||||||
Average liquidity (dollars in billions)(13): | ||||||||||||||||
Parent company liquidity | $ | 61 | $ | 69 | $ | 49 | $ | 64 | ||||||||
Bank and other subsidiary liquidity | 93 | 69 | 36 | 78 | ||||||||||||
Total liquidity | $ | 154 | $ | 138 | $ | 85 | $ | 142 | ||||||||
Capital ratios at December 31, 2009(14): | ||||||||||||||||
Total capital ratio | 16.4 | % | N/A | N/A | N/A | |||||||||||
Tier 1 capital ratio | 15.3 | % | N/A | N/A | N/A | |||||||||||
Tier 1 leverage ratio | 5.8 | % | N/A | N/A | N/A | |||||||||||
Tier 1 common ratio | 8.2 | % | N/A | N/A | N/A | |||||||||||
Consolidated assets under management or supervision by asset class (dollars in billions)(15): | ||||||||||||||||
Equity(16) | $ | 315 | $ | 113 | $ | 215 | $ | 121 | ||||||||
Fixed income(16) | 195 | 175 | 208 | 168 | ||||||||||||
Alternatives(17) | 46 | 40 | 52 | 41 | ||||||||||||
Private equity | 4 | 4 | 4 | 4 | ||||||||||||
Infrastructure | 4 | 4 | 2 | 4 | ||||||||||||
Real estate | 15 | 34 | 36 | 35 | ||||||||||||
Subtotal | 579 | 370 | 517 | 373 | ||||||||||||
Other(16) | 59 | 39 | 61 | 40 | ||||||||||||
Total assets under management or supervision(18) | 638 | 409 | 578 | 413 | ||||||||||||
Share of non-controlling interest assets(19) | 7 | 6 | 7 | 6 | ||||||||||||
Total | $ | 645 | $ | 415 | $ | 585 | $ | 419 | ||||||||
38
| Statistical Data (Continued). | 2009(1) | Fiscal Year 2008(2) | Fiscal Year 2007(2) | One Month Ended December 31, 2008(2) | ||||||||||||
Institutional Securities: | ||||||||||||||||
Pre-tax profit margin(20) | 8 | % | 10 | % | 4 | % | N/M | |||||||||
Global Wealth Management Group: | ||||||||||||||||
Global representatives(21) | 18,135 | 8,426 | 8,429 | 8,356 | ||||||||||||
Annualized net revenue per global representative (dollars in thousands)(22) | $ | 666 | $ | 746 | $ | 811 | $ | 585 | ||||||||
Assets by client segment (dollars in billions): | ||||||||||||||||
$10 million or more | $ | 453 | $ | 152 | $ | 247 | $ | 155 | ||||||||
$1 million to $10 million | 637 | 197 | 275 | 196 | ||||||||||||
Subtotal $1 million or more | 1,090 | 349 | 522 | 351 | ||||||||||||
$100,000 to $1 million | 418 | 151 | 179 | 155 | ||||||||||||
Less than $100,000 | 52 | 22 | 23 | 22 | ||||||||||||
Corporate and other accounts(23) | - | 24 | 34 | 22 | ||||||||||||
Total client assets | $ | 1,560 | $ | 546 | $ | 758 | $ | 550 | ||||||||
Fee-based assets as a percentage of total client assets | 24 | % | 25 | % | 27 | % | 25 | % | ||||||||
Client assets per global representative (dollars in millions)(24) | $ | 86 | $ | 65 | $ | 90 | $ | 66 | ||||||||
Bank deposits (dollars in billions)(25) | $ | 112.5 | $ | 36.4 | $ | 26.2 | $ | 38.8 | ||||||||
Pre-tax profit margin(20) | 6 | % | 16 | % | 17 | % | 29 | % | ||||||||
Asset Management(15): | ||||||||||||||||
Assets under management or supervision (dollars in billions)(19) | $ | 266 | $ | 287 | $ | 400 | $ | 290 | ||||||||
Percent of fund assets in top half of Lipper rankings(26) | 55 | % | 39 | % | 49 | % | 55 | % | ||||||||
Pre-tax profit margin(20) | N/M | N/M | 24 | % | N/M | |||||||||||
| N/M | – Not Meaningful. |
| N/A | – Not Applicable. |
| (1) | Information includes MSSB effective from May 31, 2009 (see Note 3 to the consolidated financial statements). |
| (2) | Certain prior-period information has been reclassified to conform to the current period's presentation. |
| (3) | Amounts include operating results and gains on secondary offerings related to MSCI, operating results and gains (losses) related to the disposition of Crescent, operating results of Retail Asset Management and other discontinued operations. |
| (4) | For the calculation of basic and diluted EPS, see Note 14 to the consolidated financial statements. |
| (5) | Regional net revenues in Europe, Middle East and Africa were negatively impacted by the tightening of the Company's credit spreads resulting from the increase in fair value of certain of the Company's long-term and short-term borrowings, primarily structured notes, in 2009. Regional net revenues reflect the regional view of the Company's consolidated net revenues, on a managed basis, based on the following methodology: |
| Institutional Securities: advisory and equity underwriting-client location; debt underwriting-revenue recording location; sales and trading-trading desk location. Global Wealth Management Group: global representative location. Asset Management: client location, except for the merchant banking business, which is based on asset location. |
| (6) | The computation of average common equity for each business segment is based upon an economic capital framework that estimates the amount of equity capital required to support the businesses over a wide range of market environments while simultaneously satisfying regulatory, rating agency and investor requirements. Economic capital is assigned to each business segment based on a regulatory capital framework plus additional capital for stress losses. Economic capital requirements are met by regulatory Tier 1 equity (including Morgan Stanley shareholders' equity, certain preferred stock, eligible hybrid capital instruments, non-controlling interests and deductions of certain goodwill, intangible assets, net deferred tax assets and debt valuation adjustment ("DVA")), subject to regulatory limits. The economic capital framework will evolve over time in response to changes in the business and regulatory environment and to incorporate enhancements in modeling techniques. The effective tax rates used in the computation of business segment return on average common equity were determined on a separate entity basis. |
| (7) | Book value per common share equals common shareholders' equity of $37,091 million as of December 31, 2009, $31,676 million as of November 30, 2008, $30,169 million as of November 30, 2007 and $29,585 million as of December 31, 2008, divided by common shares outstanding of 1,361 million as of December 31, 2009, 1,048 million as of November 30, 2008, 1,056 million as of November 30, 2007 and 1,074 million as of December 31, 2008. |
| (8) | Tangible common equity equals common shareholders' equity less goodwill and intangible assets net of allowable mortgage servicing rights. The deduction for goodwill and intangible assets in 2009 includes only the Company's share of MSSB's goodwill and intangible assets. |
39
| (9) | Tangible book value per common share equals tangible common equity divided by period end common shares outstanding. |
| (10) | Tangible common equity to risk-weighted assets ("RWAs") ratio equals tangible common equity divided by total RWAs of $305,000 million at December 31, 2009. |
| (11) | The effective tax rate for 2009 includes a tax benefit of $331 million, or $0.28 per diluted share, resulting from the cost of anticipated repatriation of non-U.S. earnings at lower than previously estimated tax rates. Excluding this benefit, the annual effective tax rate for 2009 would have been a benefit of 1%. |
| (12) | Worldwide employees as of December 31, 2009 include additional worldwide employees of businesses contributed by Citi related to MSSB. |
| (13) | For a discussion of average liquidity, see "Liquidity and Capital Resources-Liquidity Management Policies-Liquidity Reserves" herein. |
| (14) | For a discussion of total capital ratio, Tier 1 capital ratio and Tier 1 leverage ratio, see "Liquidity and Capital Resources-Regulatory Requirements" herein. For a discussion of Tier 1 common ratio, see "Liquidity and Capital Resources-The Balance Sheet" herein. |
| (15) | Amount excludes certain asset management businesses following the decision to sell the Retail Asset Management business to Invesco. |
| (16) | Equity and fixed income amounts include assets under management or supervision associated with the Asset Management and Global Wealth Management Group business segments. Other amounts include assets under management or supervision associated with the Global Wealth Management Group business segment. |
| (17) | Amounts reported for Alternatives reflect the Company's invested equity in those funds and include a range of alternative investment products such as hedge funds, funds of hedge funds and funds of private equity funds. |
| (18) | Revenues and expenses associated with these assets are included in the Company's Asset Management and Global Wealth Management Group business segments. |
| (19) | Amounts include Asset Management's proportional share of assets managed by entities in which it owns a non-controlling interest. |
| (20) | Percentages represent income from continuing operations before income taxes as a percentage of net revenues. |
| (21) | Global representatives as of December 31, 2009 include additional global representatives of businesses contributed by Citi related to MSSB. |
| (22) | Annualized net revenue per global representative for 2009, fiscal 2008, fiscal 2007 and the one month ended December 31, 2008 equals Global Wealth Management Group's net revenues (excluding the sale of Morgan Stanley Wealth Management S.V., S.A.U. ("MSWM S.V.") for fiscal 2008) divided by the quarterly weighted average global representative headcount for 2009, fiscal 2008, fiscal 2007 and the one month ended December 31, 2008, respectively. |
| (23) | Beginning in 2009, amounts for Corporate and other accounts are presented in the appropriate client segment. |
| (24) | Client assets per global representative equal total period-end client assets divided by period-end global representative headcount. |
| (25) | Approximately $54 billion of the bank deposit balances as of December 31, 2009 are held at Company-affiliated depositories with the remainder held at Citi-affiliated depositories. These deposit balances are held at certain of the Company's Federal Deposit Insurance Corporation (the "FDIC") insured depository institutions for the benefit of retail clients through their accounts. |
| (26) | Source: Lipper, one-year performance excluding money market funds as of December 31, 2009, November 30, 2008, November 30, 2007 and December 31, 2008, respectively, excluding Retail Asset Management. |
Global Market and Economic Conditions in 2009.
During 2009, global market and economic conditions improved, and global capital markets recovered from the severe downturn that occurred during the Fall of 2008.
In the U.S., economic conditions improved, liquidity began to return to the fixed income markets, the initial public offering market reopened and the securitization market began to reopen, while the real estate markets continued to be adversely impacted. Major U.S. equity market indices ended 2009 higher as compared with the beginning of the year, primarily due to better than expected corporate earnings and investor confidence in an economic recovery. Government spending increased, while consumer spending, household balance sheets and business spending remained challenged. The unemployment rate increased to 10.0% at December 31, 2009 from 7.4% at December 31, 2008. The Federal Open Market Committee ("FOMC") kept its interest rates at historically low levels, and at December 31, 2009, the federal funds target rate was between zero and 0.25%, and the discount rate was 0.50%. During 2009, the interest rate on required reserve balances and on excess balances (balances held to satisfy reserve requirements and balances held in excess of required reserve requirements) was 0.25%. During 2009, the FOMC pursued a quantitative easing policy in which the FOMC purchased securities with the objective of improving conditions within the credit markets by increasing the money supply. In February 2010, the FOMC raised the discount rate by 0.25% to 0.75%.
In Europe, major European equity market indices ended 2009 higher as compared with the beginning of the year. Economic conditions, however, continued to be challenged by adverse economic developments that began in the Fall of 2008. The euro area unemployment rate increased to 10.0% at December 31, 2009 from 8.2% at December 2008. During the first half of 2009, the European Central Bank ("ECB") lowered its benchmark
40
interest rate by 1.50% to a record low of 1.00%, and during the second half of 2009, the ECB left its benchmark interest rate unchanged. During the first half of 2009, the Bank of England ("BOE") lowered its benchmark interest rate by 1.50% to 0.50%, and during the second half of 2009, the BOE left its benchmark interest rate unchanged. During 2009, the BOE pursued a quantitative easing policy in which the BOE purchased securities, including U.K. Government Gilts, with the objective of increasing the money supply.
In Asia, economic conditions continued to be challenged by adverse economic developments that began in the Fall of 2008, including a decline in exports in both China and Japan. Despite lower exports, China's economy continued to benefit from government spending for capital projects. Equity markets in both China and Japan ended 2009 higher, as compared with the beginning of the year. The Bank of Japan ("BOJ") pursued a quantitative easing policy in which the BOJ would purchase securities with the objective of increasing liquidity and reducing the reliance on short-term liquidity by providing longer term liquidity via Japanese government bond purchases.
Overview of 2009 Financial Results Compared with Fiscal 2008.
The Company recorded net income applicable to Morgan Stanley of $1,346 million in 2009, a 21% decrease from $1,707 million in fiscal 2008. Comparisons of the 2009 results with fiscal 2008 were impacted by seven months' results of MSSB, which closed on May 31, 2009.
Net revenues (total revenues less interest expense) increased 6% to $23,358 million in 2009. Net revenues included losses of approximately $5,510 million in 2009 related to the tightening of the Company's credit spreads on certain long-term and short-term borrowings accounted for at fair value compared with gains of $5,594 million in fiscal 2008 related to the widening of the Company's credit spreads on such borrowings. Net interest revenues were $990 million in 2009 as compared with $3,367 million in fiscal 2008. The decrease in 2009 was primarily due to a lower interest rate environment coupled with a lower average mix of interest-earning assets and interest-bearing liabilities, including lower client balances in the Company's prime brokerage business. Net revenues in 2009 also included a gain of $319 million related to the sale of undivided participating interests in a portion of the Company's claims against a derivative counterparty that filed for bankruptcy protection. Non-interest expenses increased 7% to $22,501 million in 2009, primarily due to higher compensation costs, partly offset by lower non-compensation costs. Compensation and benefits expense increased 21%, primarily reflecting the consolidation of MSSB. Non-compensation expenses decreased 11%, primarily due to the Company's initiatives to reduce costs, lower levels of business activity and non-cash charges of $725 million related to the impairment of goodwill and intangible assets in fiscal 2008, partially offset by additional operating costs and integration costs related to MSSB. Results included in discontinued operations for 2009 reflected the pre-tax net gain of $625 million related to the sale of the Company's remaining ownership interest in MSCI and the disposition of Crescent (see Note 23 to the consolidated financial statements). Diluted EPS were $(0.77) in 2009 compared with $1.39 in fiscal 2008. Diluted EPS from continuing operations were $(0.93) in 2009 compared with $0.88 in fiscal 2008. Due to the Company's repurchase of its Series D Fixed Rate Cumulative Perpetual Preferred Stock ("Series D Preferred Stock"), the Company incurred a negative adjustment of $850 million in its calculation of basic and diluted EPS (reduction to earnings (losses) applicable to the Company's common shareholders) for 2009 due to the accelerated amortization of the issuance discount on the Series D Preferred Stock.
The Company's effective income tax rate from continuing operations was a benefit of 39% in 2009. The Company recognized a tax benefit of $331 million in 2009, resulting from the cost of anticipated repatriation of non-U.S. earnings at lower than previously estimated tax rates. Excluding this benefit, the annual effective tax rate in 2009 would have been a benefit of 1%. The annual effective tax rate in 2009 is reflective of the geographic mix of earnings and includes tax benefits associated with the anticipated use of domestic tax credits and the utilization of state net operating losses.
The results for fiscal 2008 included a pre-tax gain of $687 million related to the sale of MSWM S.V., the Spanish onshore mass affluent wealth management business (see Note 17 to the consolidated financial statements).
41
The Company's effective income tax rate from continuing operations was a benefit of 2% in fiscal 2008. The annual effective tax rate in fiscal 2008 is reflective of the geographic mix of earnings and includes tax benefits associated with domestic tax credits and tax-exempt income and tax charges associated with nondeductible goodwill impairment charges.
Overview of 2009 Segment Results Compared with Fiscal 2008.
Institutional Securities. Institutional Securities recorded income from continuing operations before income taxes of $982 million in 2009, a 31% decrease from fiscal 2008.
Net revenues decreased 13% to $12,777 million in 2009, which reflected losses of approximately $5,421 million resulting from the tightening of the Company's credit spreads on certain long-term and short-term borrowings accounted for at fair value compared with gains of $5,515 million resulting from the widening of the Company's credit spreads on such borrowings in fiscal 2008. In addition, 2009 reflected higher net revenues from investment banking.
Investment banking revenues increased 23% to $4,454 million from fiscal 2008, primarily due to higher revenues from underwriting transactions, partially offset by lower advisory fees. Advisory fees from merger, acquisition and restructuring transactions were $1,488 million, a decrease of 14% from fiscal 2008. Underwriting revenues increased 57% from fiscal 2008 reflecting higher levels of market activity.
Equity sales and trading revenues decreased 66% to $3,353 million in 2009 from fiscal 2008. The decline in 2009 was primarily due to lower net revenues from derivative products and equity cash products, reflecting lower levels of market volume and market volatility, and lower average prime brokerage client balances. Equity sales and trading revenues were also negatively impacted by losses of $1,738 million in 2009 due to the tightening of the Company's credit spreads resulting from the increase in the fair value of certain of the Company's long-term and short-term borrowings accounted for at fair value compared with a benefit of approximately $1,604 million in fiscal 2008 due to the widening of the Company's credit spreads on such borrowings. Fixed income sales and trading revenues increased 30% to $5,017 million in 2009 from $3,862 million in fiscal 2008. Fixed income sales and trading revenues were negatively impacted by losses of approximately $3,321 million from the tightening of the Company's credit spreads resulting from the increase in the fair value of certain of the Company's long-term and short-term borrowings accounted for at fair value compared with a benefit of approximately $3,524 million in fiscal 2008 due to the widening of the Company's credit spreads on such borrowings. Results for 2009 also reflected lower revenues from commodities. Results in 2009 included a net gain of $319 million related to the sale of undivided participating interests in a portion of the Company's claims against a derivative counterparty that filed for bankruptcy protection.
In 2009, other sales and trading net revenues reflected net gains of $183 million compared with net losses of $3,109 million in fiscal 2008. Results for 2009 included net gains of $804 million (mark-to-market valuations and realized gains of $4,042 million, partially offset by losses on related hedges of $3,238 million) associated with loans and lending commitments compared with net losses of $3,335 million (negative mark-to-market valuations and losses of $6,311 million, net of gains on related hedges of $2,976 million) in fiscal 2008. Results in 2009 also included losses of $362 million, reflecting the improvement in the Company's debt-related credit spreads on certain debt related to China Investment Corporation Ltd.'s ("CIC") investment in the Company compared with gains of $387 million in fiscal 2008. Fiscal 2008 included losses related to mortgage-related securities portfolios in the Company's domestic subsidiary banks, Morgan Stanley Bank, N.A. and Morgan Stanley Trust (collectively, the "Subsidiary Banks"), and mark-to-market gains on certain swaps previously designated as hedges of a portion of the Company's long-term debt.
Principal transactions net investment losses aggregating $875 million were recognized in 2009 as compared with net investment losses aggregating $2,478 million in fiscal 2008.
42
Non-interest expenses decreased 11% to $11,795 million, primarily due to lower non-compensation costs. Non-compensation expenses decreased 26%, resulting from the Company's initiatives to reduce costs and a charge of approximately $694 million for the impairment of goodwill and intangible assets related to certain fixed income businesses recorded in fiscal 2008.
Global Wealth Management Group. Global Wealth Management Group recorded income from continuing operations before income taxes of $559 million compared with $1,154 million in fiscal 2008. The current year included seven months of operating results for MSSB, which closed on May 31, 2009. Fiscal 2008 included a pre-tax gain of $687 million related to the sale of MSWM S.V. Fiscal 2008 also included a charge of $532 million associated with the Auction Rate Securities ("ARS") repurchase program and $108 million associated with subsequent writedowns of some of these securities that were repurchased (see Note 11 to the consolidated financial statements).
Net revenues were $9,390 million, a 34% increase over fiscal 2008, primarily related to higher revenues from asset management, distribution and administration fees, higher commission revenues, higher revenues from principal transactions trading activities, higher investment banking revenues and the consolidation of MSSB, partially offset by lower net interest. Client assets in fee-based accounts increased 175% to $379 billion and decreased as a percentage of total client assets to 24% compared with 25% as of December 31, 2008. In addition, total client assets rose to $1,560 billion from $550 billion as of December 31, 2008, primarily due to the consolidation of MSSB.
Total non-interest expenses were $8,831 million, a 51% increase from fiscal 2008. Compensation and benefits expense increased 60% in 2009, primarily due to the consolidation of MSSB. Non-compensation costs increased 32%, primarily due to the operating costs of MSSB, the amortization of MSSB's intangible assets and integration costs for MSSB. As a result of the MSSB transaction, the number of global representatives increased 117% to 18,135 at December 31, 2009 from 8,356 at December 31, 2008.
Asset Management . Asset Management recorded a loss from continuing operations before income taxes of $673 million in 2009 compared with a loss from continuing operations before income taxes of $1,423 million in fiscal 2008. Net revenues of $1,337 million in 2009 increased 144% from fiscal 2008 due to higher revenues in the core businesses, which include traditional equity and fixed income funds, hedge funds and fund of funds, in addition to lower losses in the merchant banking business. The increase in 2009 primarily reflected lower principal investment losses, partially offset by lower asset management, distribution and administrative fees, primarily reflecting lower average assets under management. The results in 2009 also reflected losses related to certain real estate funds sponsored and consolidated by the Company. Assets under management or supervision within Asset Management were $266 billion at December 31, 2009, down from $290 billion at December 31, 2008, a decrease of 8%, reflecting net customer outflows of $41.1 billion, primarily in the Company's money market, long-term fixed income and equity funds. Non-interest expenses increased 2% from fiscal 2008 to $2,010 million. Compensation and benefits expense increased 17%, primarily due to higher net revenues.
Overview of the one month ended December 31, 2008 Financial Results.
The Company recorded a net loss applicable to Morgan Stanley of $1,288 million in the one month ended December 31, 2008 compared with net income of $626 million in the one month ended December 31, 2007. Net revenues (total revenues less interest expense) decreased to $(968) million, primarily due to sales and trading losses in the Institutional Securities business segment. Non-interest expenses decreased 47% to $1,059 million, primarily due to lower compensation costs. Compensation and benefits expense decreased 59%, primarily reflecting lower incentive-based compensation accruals due to lower net revenues in the Institutional Securities business segment. Diluted earnings (loss) per share in the one month ended December 31, 2008 were $(1.62) compared with $0.57 in the one month ended December 31, 2007.
The Company's effective tax rate from continuing operations was 36% in the one month ended December 31, 2008.
43
Certain Factors Affecting Results of Operations.
The Company's results of operations may be materially affected by market fluctuations and by economic factors. In addition, results of operations in the past have been, and in the future may continue to be, materially affected by many factors of a global nature, including the effect of political and economic conditions and geopolitical events; the effect of market conditions, particularly in the global equity, fixed income and credit markets, including corporate and mortgage (commercial and residential) lending and commercial real estate investments; the impact of current, pending and future legislation, regulation, and legal actions in the U.S. and worldwide; the level and volatility of equity, fixed income and commodity prices, and interest rates, currency values and other market indices; the availability and cost of both credit and capital as well as the credit ratings assigned to the Company's unsecured short-term and long-term debt; investor sentiment and confidence in the financial markets; the Company's reputation; the actions and initiatives of current and potential competitors; and technological changes. Such factors also may have an impact on the Company's ability to achieve its strategic objectives on a global basis. For a further discussion of these and other important factors that could affect the Company's business, see "Competition" and "Supervision and Regulation" in Part I, Item 1, and "Risk Factors" in Part I, Item 1A.
Results of Operations.
The following items significantly affected the Company's results of operations in 2009, fiscal 2008 and the one month ended December 31, 2008.
Morgan Stanley Debt. Net revenues reflected (losses) gains from the (tightening) widening of the Company's credit spreads on certain long-term and short-term borrowings, including structured notes and junior subordinated debentures, that are accounted for at fair value as follows:
| 2009 | Fiscal 2008 | One Month Ended December 31, 2008 | |||||||||
| (dollars in billions) | |||||||||||
Losses from the tightening of the Company's credit spreads | $ | (5.5 | ) | $ | - | $ | (0.2 | ) | |||
Gains from the widening of the Company's credit spreads | - | 5.6 | - | ||||||||
Total (losses) gains | $ | (5.5 | ) | $ | 5.6 | $ | (0.2 | ) | |||
In addition, in 2009, fiscal 2008 and the one month ended December 31, 2008, the Company recorded gains of approximately $491 million, $2.3 billion and $73 million, respectively, from repurchasing its debt in the open market. In fiscal 2008, the Company also recorded mark-to-market gains of approximately $1.4 billion on certain swaps previously designated as hedges of a portion of the Company's long-term debt. These swaps were no longer considered hedges once the related debt was repurchased by the Company ( i.e ., the swaps were "de-designated" as hedges). During the period the swaps were hedging the debt, changes in fair value of these instruments were generally offset by adjustments to the basis of the debt being hedged.
44
Real Estate Investments. The Company recorded losses in the following business segments related to real estate investments. These amounts exclude investments that benefit certain deferred compensation and employee co-investment plans.
| 2009 | Fiscal 2008 | One Month Ended December 31, 2008 | ||||||||||
| (dollars in billions) | ||||||||||||
Institutional Securities(1) | $ | (0.8 | ) | $ | (1.2 | ) | $ | (0.1 | ) | |||
Asset Management: | ||||||||||||
Continuing operations(2) | (0.5 | ) | (0.6 | ) | - | |||||||
Discontinued operations(3) | (0.6 | ) | (0.5 | ) | - | |||||||
Total Asset Management | (1.1 | ) | (1.1 | ) | - | |||||||
Total | $ | (1.9 | ) | $ | (2.3 | ) | $ | (0.1 | ) | |||
| (1) | Losses related to net realized and unrealized losses from the Company's limited partnership investments in real estate funds and are reflected in Principal transactions net investment revenues in the consolidated statements of income. |
| (2) | Losses related to net realized and unrealized losses from real estate investments in the Company's merchant banking business and are reflected in Principal transactions net investment revenues in the consolidated statements of income. In fiscal 2008, losses included writedowns on its investment in Crescent of approximately $250 million prior to the Company consolidating its assets and liabilities. These writedowns are reflected in Principal transactions-investments in the consolidated statements of income. |
| (3) | Amounts related to Crescent. |
See "Other Matters-Real Estate" herein for further information.
Corporate Lending . The Company recorded the following amounts primarily associated with loans and lending commitments carried at fair value within the Institutional Securities business segment:
| 2009(1) | Fiscal 2008(1) | One Month Ended December 31, 2008(1) | ||||||||||
| (dollars in billions) | ||||||||||||
Gains (losses) on loans and lending commitments | $ | 4.0 | $ | (6.3 | ) | $ | (0.5 | ) | ||||
(Losses) gains on hedges | (3.2 | ) | 3.0 | (0.1 | ) | |||||||
Total gains (losses) | $ | 0.8 | $ | (3.3 | ) | $ | (0.6 | ) | ||||
| (1) | Amounts include realized and unrealized gains (losses). |
Mortgage-Related Trading. The Company recognized mortgage-related trading losses relating to commercial mortgage-backed securities, commercial whole loan positions, U.S. subprime mortgage proprietary trading exposures and non-subprime residential mortgages of $0.6 billion, $2.6 billion and $0.1 billion in 2009, fiscal 2008 and the one month ended December 31, 2008, respectively.
Sale of Bankruptcy Claims . In 2009, the Company recorded a gain of $319 million related to the sale of undivided participating interests in a portion of the Company's claims against a derivative counterparty that filed for bankruptcy protection. For further information, see "Other Matters-Sale of Bankruptcy Claims" herein.
Monoline Insurers. Monoline insurers ("Monolines") provide credit enhancement to capital markets transactions. 2009 included losses of $231 million related to Monoline credit exposures as compared with losses of $1.7 billion in fiscal 2008 and losses of $203 million in the one month ended December 31, 2008. The current credit environment continued to affect the capacity of such financial guarantors. The Company's direct exposure to Monolines is limited to bonds that are insured by Monolines and to derivative contracts with a Monoline as counterparty (principally MBIA Inc.). The Company's exposure to Monolines as of December 31, 2009 consisted primarily of asset-backed securities bonds of approximately $458 million in the portfolio of the Company's
45
Subsidiary Banks that are collateralized primarily by first and second lien subprime mortgages enhanced by financial guarantees, approximately $2.0 billion in insured municipal bond securities and approximately $651 million in net counterparty exposure (gross exposure of approximately $5.4 billion net of cumulative credit valuation adjustments of approximately $2.8 billion and net of hedges). Net counterparty exposure is defined as potential loss to the Company over a period of time in an event of 100% default of a Monoline, assuming zero recovery. The Company's hedging program for Monoline risk includes the use of transactions that effectively mitigate certain market risk components of existing underlying transactions with the Monolines.
MSSB. During 2009, the Company recorded deal closing costs of $221 million and integration costs of $280 million. Deal closing costs include a one-time expense of $124 million primarily for replacement of deferred compensation awards for MSSB retirement-eligible employees. The costs of these replacement awards were fully allocated to Citi.
Structured Investment Vehicles. The Company recognized net gains of $164 million in 2009 and losses of $470 million and $84 million in fiscal 2008 and the one month ended December 31, 2008, respectively, related to securities issued by structured investment vehicles ("SIV"). The Company no longer has any SIV positions on the consolidated statements of financial condition as of December 31, 2009.
Income Tax Benefit. The Company recognized a tax benefit of $331 million in 2009 resulting from the cost of anticipated repatriation of non-U.S. earnings at lower than previously estimated tax rates.
Goodwill and Intangibles. Impairment charges related to goodwill and intangible assets were $16 million in 2009 and $725 million for fiscal 2008 (see Note 7 to the consolidated financial statements).
Subsidiary Banks . The Company recorded gains of approximately $140 million in 2009 and losses of approximately $900 million in fiscal 2008 related to mortgage-related securities portfolios of the Subsidiary Banks.
ARS. Under the terms of various agreements entered into with government agencies and the terms of the Company's announced offer to repurchase, the Company agreed to repurchase at par certain ARS held by retail clients that were purchased through the Company. In addition, the Company agreed to reimburse retail clients who have sold certain ARS purchased through the Company at a loss. Fiscal 2008 reflected charges of $532 million for the ARS repurchase program and writedowns of $108 million associated with ARS held in inventory (see Note 11 to the consolidated financial statements).
Sales of Subsidiaries and Other Items. Results for fiscal 2008 included a pre-tax gain of $687 million related to the sale of MSWM S.V.
Equity Capital-Related Transactions.
During fiscal 2008, the Company entered into several capital-related transactions. Such transactions included the sale of equity units (the "Equity Units") to a wholly owned subsidiary of CIC for approximately $5.6 billion and the issuance to Mitsubishi UFJ Financial Group, Inc. ("MUFG") of shares of Series B Non-Cumulative Non-Voting Perpetual Convertible Preferred Stock ("Series B Preferred Stock") and shares of Series C Non-Cumulative Non-Voting Perpetual Preferred Stock ("Series C Preferred Stock") for a total of $9 billion. In addition, the Company, as part of the Capital Purchase Program ("CPP"), issued to the U.S. Treasury 10,000,000 shares of Series D Preferred Stock and a warrant to purchase 65,245,759 shares of the Company's common stock (the "Warrant") for a purchase price of $10 billion.
In June 2009, the Company repurchased the 10,000,000 shares of Series D Preferred Stock from the U.S. Treasury at the liquidation preference amount plus accrued and unpaid dividends, for an aggregate repurchase price of $10,086 million. As a result of the Company's repurchase of the Series D Preferred Stock, the Company incurred a one-time negative adjustment of $850 million in its calculation of basic and diluted EPS (reduction to earnings (losses) applicable to the Company's common shareholders) for 2009 due to the accelerated amortization of the issuance discount on the Series D Preferred Stock.
46
In August 2009, under the terms of the CPP securities purchase agreement, the Company repurchased the Warrant from the U.S. Treasury for $950 million. The repurchase of the Series D Preferred Stock in the amount of $10.0 billion and the Warrant for $950 million reduced the Company's total equity by $10,950 million in 2009.
In addition, during 2009, the Company issued common stock for approximately $6.9 billion in two registered public offerings in May and June 2009. MUFG elected to participate in both offerings, and in one of the offerings, MUFG received $0.7 billion of common stock in exchange for 640,909 shares of the Company's Series C Preferred Stock.
See Note 13 to the consolidated financial statements for further discussion of these capital-related transactions.
Business Segments.
Substantially all of the Company's operating revenues and operating expenses can be directly attributed to its business segments. Certain revenues and expenses have been allocated to each business segment, generally in proportion to its respective revenues or other relevant measures.
As a result of treating certain intersegment transactions as transactions with external parties, the Company includes an Intersegment Eliminations category to reconcile the business segment results to the Company's consolidated results. Income before taxes in Intersegment Eliminations primarily represents the effect of timing differences associated with the revenue and expense recognition of commissions paid by the Asset Management business segment to the Global Wealth Management Group business segment associated with sales of certain products and the related compensation costs paid to the Global Wealth Management Group business segment's global representatives. Intersegment eliminations also reflect the effect of fees paid by the Institutional Securities business segment to the Global Wealth Management Group business segment related to the bank deposit program. Losses before income taxes recorded in Intersegment Eliminations were $11 million, $17 million, $84 million and $1 million in 2009, fiscal 2008, fiscal 2007 and the one month ended December 31, 2008, respectively.
47
INSTITUTIONAL SECURITIES
INCOME STATEMENT INFORMATION
| 2009 | Fiscal 2008 | Fiscal 2007 | One Month Ended December 31, 2008 | |||||||||||||
| (dollars in millions) | ||||||||||||||||
Revenues: | ||||||||||||||||
Investment banking | $ | 4,454 | $ | 3,630 | $ | 5,538 | $ | 177 | ||||||||
Principal transactions: | ||||||||||||||||
Trading | 6,315 | 5,199 | 2,741 | (1,714 | ) | |||||||||||
Investments | (875 | ) | (2,478 | ) | 1,458 | (158 | ) | |||||||||
Commissions | 2,153 | 3,100 | 3,261 | 128 | ||||||||||||
Asset management, distribution and administration fees | 99 | 142 | 104 | 11 | ||||||||||||
Other | 546 | 2,723 | 568 | 88 | ||||||||||||
Total non-interest revenues | 12,692 | 12,316 | 13,670 | (1,468 | ) | |||||||||||
Interest and dividends | 6,588 | 38,330 | 59,126 | 1,222 | ||||||||||||
Interest expense | 6,503 | 35,908 | 57,066 | 1,107 | ||||||||||||
Net interest | 85 | 2,422 | 2,060 | 115 | ||||||||||||
Net revenues | 12,777 | 14,738 | 15,730 | (1,353 | ) | |||||||||||
Compensation and benefits | 7,216 | 7,120 | 10,046 | 283 | ||||||||||||
Non-compensation expenses | 4,579 | 6,195 | 5,034 | 394 | ||||||||||||
Total non-interest expenses | 11,795 | 13,315 | 15,080 | 677 | ||||||||||||
Income (loss) from continuing operations before income taxes | 982 | 1,423 | 650 | (2,030 | ) | |||||||||||
(Benefit from) provision for income taxes | (293 | ) | 113 | (233 | ) | (733 | ) | |||||||||
Income (loss) from continuing operations | 1,275 | 1,310 | 883 | (1,297 | ) | |||||||||||
Discontinued operations: | ||||||||||||||||
Gain from discontinued operations | 503 | 1,578 | 160 | 12 | ||||||||||||
Provision for income taxes | 222 | 612 | 63 | 5 | ||||||||||||
Gain on discontinued operations | 281 | 966 | 97 | 7 | ||||||||||||
Net income (loss) | 1,556 | 2,276 | 980 | (1,290 | ) | |||||||||||
Net income applicable to non-controlling interests | 12 | 71 | 40 | 3 | ||||||||||||
Net income (loss) applicable to Morgan Stanley | $ | 1,544 | $ | 2,205 | $ | 940 | $ | (1,293 | ) | |||||||
Amounts attributable to Morgan Stanley common shareholders: | ||||||||||||||||
Income (loss) from continuing operations, net of tax | $ | 1,279 | $ | 1,277 | $ | 845 | $ | (1,297 | ) | |||||||
Gain from discontinued operations, net of tax | 265 | 928 | 95 | 4 | ||||||||||||
Net income (loss) applicable to Morgan Stanley | $ | 1,544 | $ | 2,205 | $ | 940 | $ | (1,293 | ) | |||||||
48
Other Financial Information.
Investment Banking.
Investment banking revenues were as follows:
| 2009 | Fiscal 2008 | Fiscal 2007 | One Month Ended December 31, 2008 | |||||||||
| (dollars in millions) | ||||||||||||
Advisory fees from merger, acquisition and restructuring transactions | $ | 1,488 | $ | 1,740 | $ | 2,541 | $ | 68 | ||||
Equity underwriting revenues | 1,694 | 1,045 | 1,570 | 47 | ||||||||
Fixed income underwriting revenues | 1,272 | 845 | 1,427 | 62 | ||||||||
Total investment banking revenues | $ | 4,454 | $ | 3,630 | $ | 5,538 | $ | 177 | ||||
Investment banking revenues are composed of fees from advisory services and revenues from the underwriting of securities offerings and syndication of loans.
Sales and Trading.
Sales and trading revenues were as follows:
| 2009 | Fiscal 2008 | Fiscal 2007 | One Month Ended December 31, 2008 | ||||||||||
| (dollars in millions) | |||||||||||||
Principal transactions-trading | $ | 6,315 | $ | 5,199 | $ | 2,741 | $ | (1,714 | ) | ||||
Commissions | 2,153 | 3,100 | 3,261 | 128 | |||||||||
Net interest | 85 | 2,422 | 2,060 | 115 | |||||||||
Total sales and trading revenues | $ | 8,553 | $ | 10,721 | $ | 8,062 | $ | (1,471 | ) | ||||
Sales and trading revenues are composed of principal transactions trading revenues, commissions and net interest revenues (expenses). In assessing the profitability of its sales and trading activities, the Company views principal trading, commissions and net interest revenues (expenses) in the aggregate. In addition, decisions relating to principal transactions are based on an overall review of aggregate revenues and costs associated with each transaction or series of transactions. This review includes, among other things, an assessment of the potential gain or loss associated with a transaction, including any associated commissions, dividends, the interest income or expense associated with financing or hedging the Company's positions, and other related expenses.
The components of the Company's sales and trading revenues are as follows:
Principal Transactions-Trading . Principal transactions-trading revenues include revenues from customers' purchases and sales of financial instruments in which the Company acts as principal and gains and losses on the Company's positions, as well as proprietary trading activities for its own account.
Commissions . Commission revenues primarily arise from agency transactions in listed and over-the-counter ("OTC") equity securities and options.
Net Interest . Interest and dividend revenues and interest expense are a function of the level and mix of total assets and liabilities, including financial instruments owned and financial instruments sold, not yet purchased, reverse repurchase and repurchase agreements, trading strategies, customer activity in the Company's prime brokerage business, and the prevailing level, term structure and volatility of interest rates. Certain reverse
49
repurchase and repurchase agreements and securities borrowed and securities loaned transactions may be entered into with different customers using the same underlying securities, thereby generating a spread between the interest revenue on the reverse repurchase agreements or securities borrowed transactions and the interest expense on the repurchase agreements or securities loaned transactions.
Sales and trading revenues by business were as follows:
| 2009 | Fiscal 2008(1) | Fiscal 2007(1) | One Month Ended December 31, 2008(1) | ||||||||||||
| (dollars in millions) | |||||||||||||||
Equity | $ | 3,353 | $ | 9,968 | $ | 9,040 | $ | (20 | ) | ||||||
Fixed income | 5,017 | 3,862 | 268 | (889 | ) | ||||||||||
Other(2) | 183 | (3,109 | ) | (1,246 | ) | (562 | ) | ||||||||
Total sales and trading revenues | $ | 8,553 | $ | 10,721 | $ | 8,062 | $ | (1,471 | ) | ||||||
| (1) | All prior-period amounts have been reclassified to conform to the current period's presentation. |
| (2) | Other sales and trading net revenues primarily include net gains (losses) from loans and lending commitments and related hedges associated with the Company's lending and other corporate activities. |
2009 Compared with Fiscal 2008
Investment Banking . Investment banking revenues increased 23% in 2009 from fiscal 2008, as higher revenues from equity and fixed income underwriting transactions were partially offset by lower advisory revenues. In 2009, advisory fees from merger, acquisition and restructuring transactions were $1,488 million, a decrease of 14% from fiscal 2008, reflecting lower levels of market activity. Underwriting revenues of $2,966 million increased 57% from fiscal 2008, reflecting higher levels of market activity, as equity underwriting revenues increased 62% to $1,694 million and fixed income underwriting revenues increased 51% to $1,272 million. Underwriting fees in 2009 reflected a significant increase in market activity from 2008 levels, which were affected by unprecedented market turmoil and challenging market conditions.
Sales and Trading Revenues . Total sales and trading revenues decreased 20% in 2009 from fiscal 2008, reflecting lower equity sales and trading revenues, partially offset by higher other sales and trading revenues and by higher fixed income sales and trading revenues.
Equity . Equity sales and trading revenues decreased 66% to $3,353 million in 2009 from fiscal 2008. The decrease in 2009 was primarily due to a significant reduction in net revenues from derivative products and equity cash products, reflecting lower levels of market volume and market volatility, reduced levels of client activity and lower average prime brokerage client balances. Equity sales and trading revenues reflected losses of $1,738 million due to the tightening of the Company's credit spreads during 2009 resulting from the increase in the fair value of certain of the Company's long-term and short-term borrowings, primarily structured notes, for which the fair value option was elected, compared with a benefit of approximately $1,604 million in fiscal 2008 related to the widening of the Company's credit spreads.
In 2009, equity sales and trading revenues also reflected unrealized gains of approximately $198 million related to changes in the fair value of net derivative contracts attributable to the tightening of the counterparties' credit default spreads compared with losses of $300 million in fiscal 2008 related to the widening of the counterparties' credit default spreads. The Company also recorded unrealized losses of approximately $154 million in 2009 related to changes in the fair value of net derivative contracts attributable to the tightening of the Company's credit default swap spreads compared with gains of $125 million in fiscal 2008 related to the widening of the Company's credit default swap spreads. The unrealized losses and gains do not reflect any gains or losses on related non-derivative hedging instruments.
50
Fixed Income . Fixed income sales and trading revenues increased $1,155 million to $5,017 million in 2009 from $3,862 million in fiscal 2008. Interest rate, currency and credit products net revenues increased 145% in 2009 primarily due to strong investment grade and distressed debt trading results, partly offset by lower levels of client activity. Results in 2009 also included a gain of $319 million related to the sale of undivided participating interests in a portion of the Company's claims against a derivative counterparty that filed for bankruptcy protection. Commodity net revenues decreased 31% in 2009, primarily reflecting reduced levels of client activity and unfavorable market conditions.
In 2009, fixed income sales and trading revenues reflected net unrealized gains of approximately $3,462 million related to changes in the fair value of net derivative contracts attributable to the tightening of the counterparties' credit default spreads compared with unrealized losses of approximately $6,560 million in fiscal 2008 related to the widening of the counterparties' credit default spreads. The Company also recorded unrealized losses of approximately $1,938 million in 2009, related to changes in the fair value of net derivative contracts attributable to the tightening of the Company's credit default swap spreads compared with unrealized gains of approximately $1,968 million in fiscal 2008 related to the widening of the Company's credit default swap spreads. The unrealized losses and gains on credit default spreads do not reflect any gains or losses on related non-derivative hedging instruments.
In addition, fixed income sales and trading revenues in 2009 were negatively impacted by losses of approximately $3,321 million from the tightening of the Company's credit spreads resulting from the increase in the fair value of certain of the Company's long-term and short-term borrowings, primarily structured notes, for which the fair value option was elected. Fiscal 2008 reflected a benefit of approximately $3,524 million due to the widening of the Company's credit spreads on such borrowings.
Other . In addition to the equity and fixed income sales and trading revenues discussed above, sales and trading revenues included other trading revenues, consisting primarily of certain activities associated with the Company's corporate lending activities. In connection with its corporate lending activities, the Company provides to select clients loans or lending commitments (including bridge financing) that are generally classified as either "event-driven" or "relationship-driven." "Event-driven" loans and lending commitments refer to activities associated with a particular event or transaction, such as to support client merger, acquisition or recapitalization transactions. "Relationship-driven" loans and lending commitments are generally made to expand business relationships with select clients. For further information about the Company's corporate lending activities, see Item 7A, "Quantitative and Qualitative Disclosures about Market Risk-Credit Risk" herein. The fair value measurement of loans and lending commitments takes into account certain fee income that is attributable to the contingent commitment contract.
In 2009, other sales and trading net revenues reflected net gains of $183 million compared with net losses of $3,109 million in fiscal 2008. Results for 2009 included net gains of $804 million (mark-to-market valuations and realized gains of $4,042 million, partially offset by losses on related hedges of $3,238 million) associated with loans and lending commitments. Results for fiscal 2008 included net losses of $3,335 million (negative mark-to-market valuations and losses of $6,311 million, net of gains on related hedges of $2,976 million) associated with loans and lending commitments largely related to certain "event-driven" lending to non-investment grade companies. The valuation of these commitments could change in future periods depending on, among other things, the extent that they are renegotiated or repriced or if the associated acquisition transaction does not occur. Results in 2009 also included losses of $362 million, reflecting the improvement in the Company's debt-related credit spreads on certain debt related to CIC's investment in the Company compared with gains of $387 million in fiscal 2008.
In fiscal 2008, other sales and trading revenues also included writedowns of securities of approximately $1.2 billion in the Company's Subsidiary Banks and mark-to-market gains of approximately $1,352 million on certain swaps previously designated as hedges of a portion of the Company's long-term debt. These swaps were no longer considered hedges once the related debt was repurchased by the Company ( i.e. , the swaps were "de-designated" as hedges). During the period in which the swaps were hedging the debt, changes in fair value of these instruments were generally offset by adjustments to the basis of the debt being hedged.
51
Principal Transactions-Investments. The Company's investments generally are held for long-term appreciation and generally are subject to significant sales restrictions. Estimates of the fair value of the investments may involve significant judgment and may fluctuate significantly over time in light of business, market, economic and financial conditions generally or in relation to specific transactions.
Principal transactions net investment losses of $875 million were recognized in 2009 as compared with net investment losses of $2,478 million in fiscal 2008. The losses were primarily related to net realized and unrealized losses from the Company's limited partnership investments in real estate funds and investments that benefit certain employee deferred compensation and co-investment plans.
Other. Other revenues decreased 80% in 2009 compared with fiscal 2008. During 2009, the Company recorded gains of approximately $465 million from the Company's repurchase of debt in the open market compared with approximately $2.1 billion in fiscal 2008 (see "Certain Factors Affecting Results of Operations-Morgan Stanley Debt" herein for further discussion).
Non-interest Expenses. Non-interest expenses decreased 11% in 2009, primarily due to lower non-compensation expense. Compensation and benefits expense increased 1% from fiscal 2008. Non-compensation expenses decreased 26% in 2009, partly due to the Company's initiatives to reduce costs. Occupancy and equipment expense decreased 11% in 2009, primarily due to lower leasing costs associated with office facilities. Brokerage, clearing and exchange fees decreased 20% in 2009, primarily due to decreased trading activity. Marketing and business development expense decreased 43% in 2009, primarily due to lower levels of business activity. Professional services expense decreased 18% in 2009, primarily due to lower consulting and legal fees. Other expenses decreased 50% in 2009. In fiscal 2008, other expenses included $694 million related to the impairment of goodwill and intangible assets related to certain fixed income businesses. Excluding the fiscal 2008 impairment charges, other expenses decreased in 2009, primarily due to lower levels of business activity and lower litigation expense.
Fiscal 2008 Compared with Fiscal 2007
Investment banking revenues decreased 34% in fiscal 2008, reflecting the unprecedented market turmoil that significantly reduced levels of market activity. Advisory fees from merger, acquisition and restructuring transactions were $1,740 million, a decrease of 32% from fiscal 2007. Advisory fees in fiscal 2008 reflected lower levels of activity due to the challenging market environment. Equity underwriting revenues decreased 33% to $1,045 million in fiscal 2008, reflecting significantly lower levels of market activity, particularly for initial public offerings. Fixed income underwriting revenues decreased 41% to $845 million in fiscal 2008. Fiscal 2008 revenues were impacted by significantly lower levels of market activity across most products, particularly loan syndications and securitized products.
Total sales and trading revenues increased 33% in fiscal 2008. Equity sales and trading revenues increased 10% to $9,968 million in fiscal 2008 and reflected higher net revenues from derivative products and slightly higher results in prime brokerage. Equity sales and trading revenues also benefited from the widening of the Company's credit spreads on financial instruments that are accounted for at fair value, including, but not limited to, those for which the fair value option was elected. As previously mentioned, equity sales and trading revenues in fiscal 2008 reflected approximately $1,604 million due to the widening of the Company's credit spreads. Revenues from derivative products reflected higher customer flows and high levels of volatility. Principal trading strategies reflected significantly lower revenues in fiscal 2008 as the Company exited select proprietary trading strategies. Although prime brokerage revenues increased in fiscal 2008, in the fourth quarter, the Company's prime brokerage business experienced significant outflows as clients withdrew their cash balances and reallocated positions. These outflows have had a negative impact on prime brokerage's operating results in fiscal 2008.
Fixed income sales and trading revenues increased to $3,862 million in fiscal 2008 from $268 million in fiscal 2007. Fiscal 2007 results included mortgage-related writedowns of $7.8 billion, reflecting the deterioration in the value of U.S. subprime trading positions, principally super senior derivative positions in collateralized debt obligations ("CDOs") entered into primarily by the Company's mortgage proprietary trading group. Fiscal 2008 results reflected lower losses in mortgage loan products, higher revenues from commodities, higher revenues
52
from foreign exchange products, partially offset by lower net revenues from the interest rate and credit businesses. Interest rate, currency and credit products revenues decreased 55% in fiscal 2008. Continued dislocation in the credit markets resulted in lower net revenues from credit products, including losses of $1,686 million related to exposure to Monolines and unfavorable positioning, partially offset by higher revenues from foreign exchange products and strong results in interest rate products. Interest rate, currency and credit products revenues for fiscal 2008 benefited by $171 million due to the reversal of prior-period valuation adjustments related to interest rate derivatives, partially offset by a cumulative negative adjustment of $120 million related to prior-period incorrect valuations of a London-based trader's positions (see Notes 21 and 26 to the consolidated financial statements for further information). Results in foreign exchange products were primarily due to higher levels of customer flows and market volatility. Mortgage-related losses of approximately $1.7 billion were primarily due to a broadening decline in the residential and commercial mortgage sector. The decline in the Company's mortgage loan product activities reflected the difficult credit market conditions in fiscal 2008. Commodity revenues increased 62%, primarily due to higher revenues from oil liquids and electricity and natural gas products, reflecting higher market volatility and strong customer flow. As previously mentioned, fixed income sales and trading revenues also benefited in fiscal 2008 by approximately $3,524 million from the widening of the Company's credit spreads.
In fiscal 2008, other sales and trading losses were approximately $3,109 million compared with $1,246 million in fiscal 2007. Fiscal 2008 reflected net losses of $3,335 million (negative mark-to-market valuations and losses of $6,311 million, net of gains on related hedges of $2,976 million) associated with loans and lending commitments largely related to certain "event-driven" lending to non-investment grade companies, writedowns of securities of approximately $1.2 billion in the Company's Subsidiary Banks and mark-to-market gains of approximately $1,352 million on certain swaps previously designated as hedges of a portion of the Company's long-term debt.
In fiscal 2007, other sales and trading losses primarily reflected approximately $700 million of mark-to-market valuations associated with loans and commitments largely related to "event-driven" lending to non-investment grade companies and the impairment charge related to securities in the Company's Subsidiary Banks.
Principal transactions net investment losses aggregating $2,478 million were recognized in fiscal 2008 as compared with net investment gains aggregating $1,458 million in fiscal 2007. The losses in fiscal 2008 were primarily related to net realized and unrealized losses from the Company's investments in passive limited partnership interests associated with the Company's real estate funds and investments that benefit certain employee deferred compensation and co-investment plans and other principal investments. Fiscal 2007's results primarily related to realized and unrealized net gains associated with certain of the Company's investments.
Other revenues increased 379% in fiscal 2008. The increase reflected revenues related to Institutional Securities' share (approximately $2,135 million) of the Company's repurchase of debt. Fiscal 2008 also included a gain associated with the sale of a controlling interest in a previously consolidated commodities subsidiary.
Non-interest expenses decreased 12% in fiscal 2008, primarily due to lower compensation expense. Compensation and benefits expense decreased 29%, primarily reflecting lower incentive-based compensation accruals due to a challenging market environment, partially offset by severance-related expenses of $653 million in fiscal 2008. Non-compensation expenses increased 23% in fiscal 2008. Fiscal 2008 results included a charge of approximately $694 million for the impairment of goodwill and intangible assets related to certain fixed income businesses (see Note 7 to the consolidated financial statements), and fiscal 2007's results included a reversal of the $360 million legal accrual related to the Company's favorable outcome from the Coleman (Parent) Holdings, Inc. ("Coleman") litigation. Occupancy and equipment expense increased 27%, primarily due to higher depreciation expense on property and equipment and higher costs associated with exiting certain property lease agreements. Information processing and communications expense increased 4% in fiscal 2008, primarily due to higher data processing costs and market data. Marketing and business development expense decreased 7%, primarily due to lower levels of business activity. Other expenses increased 151%, reflecting the previously mentioned charge of approximately $694 million for the impairment of goodwill and intangible assets and the $360 million reversal of the Coleman litigation reserve in fiscal 2007 as previously mentioned, partially offset by lower minority interest.
53
One Month Ended December 31, 2008 Compared with the One Month Ended December 31, 2007
Institutional Securities recorded losses before income taxes of $2,030 million in the one month ended December 31, 2008 compared with income before income taxes of $904 million in the one month ended December 31, 2007. Net revenues were $(1,353) million in the one month ended December 31, 2008 compared with $2,303 million in the one month ended December 31, 2007. Net revenues in the one month ended December 31, 2008 reflected sales and trading losses as compared with sales and trading revenues in the prior- year period. Non-interest expenses decreased 52% to $677 million, primarily due to lower compensation and benefits expense, reflecting lower net revenues. Non-compensation expenses decreased 3%.
Investment banking revenues decreased 45% to $177 million in the one month ended December 31, 2008 from the prior-year period due to lower revenues from advisory fees and underwriting transactions, reflecting lower levels of market activity. Advisory fees from merger, acquisition and restructuring transactions were $68 million, a decrease of 58% from the prior-year period. Underwriting revenues decreased 33% from the prior-year period to $109 million.
Equity sales and trading losses were $20 million in the one month ended December 31, 2008 compared with revenues of $922 million in the one month ended December 31, 2007. Results in the one month ended December 31, 2008 reflected lower revenues from equity cash and derivative products and prime brokerage. Equity sales and trading losses also included approximately $75 million of losses from the tightening of the Company's credit spreads on certain long-term and short-term borrowings accounted for at fair value. Fixed income sales and trading losses were $889 million in the one month ended December 31, 2008 compared with revenues of $938 million in the one month ended December 31, 2007. Results in the one month ended December 31, 2008 reflected losses in interest rate, credit and currency products where continued dislocation in the credit markets contributed to the losses. In addition, fixed income sales and trading included approximately $175 million losses from the tightening of the Company's credit spreads on certain long-term and short-term borrowings that are accounted for at fair value.
Other sales and trading losses were approximately $562 million in the one month ended December 31, 2008 compared with revenues of $63 million in the one month ended December 31, 2007. The one month ended December 31, 2008 included writedowns related to mortgage-related securities portfolios in the Company's Subsidiary Banks, partially offset by mark-to-market gains on loans and lending commitments and related hedges.
Principal transactions net investment losses of $158 million were recognized in the one month ended December 31, 2008 compared with net investment gains of $25 million in the one month ended December 31, 2007. The losses in the one month ended December 31, 2008 were primarily related to net realized and unrealized losses from the Company's limited partnership investments in real estate funds and investments that benefit certain employee deferred compensation and co-investment plans, and other principal investments.
54
GLOBAL WEALTH MANAGEMENT GROUP
INCOME STATEMENT INFORMATION
| 2009 | Fiscal 2008 | Fiscal 2007 | One Month Ended December 31, 2008 | |||||||||||
| (dollars in millions) | ||||||||||||||
Revenues: | ||||||||||||||
Investment banking | $ | 596 | $ | 427 | $ | 625 | $ | 21 | ||||||
Principal transactions: | ||||||||||||||
Trading | 1,209 | 613 | 598 | 54 | ||||||||||
Investments | 3 | (54 | ) | 29 | (4 | ) | ||||||||
Commissions | 2,090 | 1,408 | 1,433 | 89 | ||||||||||
Asset management, distribution and administration fees | 4,583 | 2,726 | 3,067 | 183 | ||||||||||
Other | 248 | 965 | 163 | 15 | ||||||||||
Total non-interest revenues | 8,729 | 6,085 | 5,915 | 358 | ||||||||||
Interest and dividends | 1,114 | 1,239 | 1,221 | 66 | ||||||||||
Interest expense | 453 | 305 | 511 | 15 | ||||||||||
Net interest | 661 | 934 | 710 | 51 | ||||||||||
Net revenues | 9,390 | 7,019 | 6,625 | 409 | ||||||||||
Compensation and benefits | 6,114 | 3,810 | 3,823 | 247 | ||||||||||
Non-compensation expenses | 2,717 | 2,055 | 1,647 | 44 | ||||||||||
Total non-interest expenses | 8,831 | 5,865 | 5,470 | 291 | ||||||||||
Income from continuing operations before income taxes | 559 | 1,154 | 1,155 | 118 | ||||||||||
Provision for income taxes | 178 | 440 | 459 | 45 | ||||||||||
Income from continuing operations | 381 | 714 | 696 | 73 | ||||||||||
Discontinued operations: | ||||||||||||||
Gain from discontinued operations | - | - | 174 | - | ||||||||||
Provision for income taxes | - | - | 61 | - | ||||||||||
Gain from discontinued operations | - | - | 113 | - | ||||||||||
Net income | 381 | 714 | 809 | 73 | ||||||||||
Net income applicable to non-controlling interests | 98 | - | 113 | - | ||||||||||
Net income applicable to Morgan Stanley | $ | 283 | $ | 714 | $ | 696 | $ | 73 | ||||||
On May 31, 2009, MSSB was formed (see Note 3 to the consolidated financial statements for further information). The Company owns 51% of MSSB, which is consolidated. As a result, the operating results for MSSB are included in the Global Wealth Management Group business segment since May 31, 2009. Net income applicable to non-controlling interests of $98 million in 2009 primarily represents Citi's interest in MSSB.
2009 Compared with Fiscal 2008
Investment Banking. Global Wealth Management Group investment banking includes revenues from the distribution of equity and fixed income securities, including initial public offerings, secondary offerings, closed-end funds and unit trusts. Investment banking revenues increased 40% in 2009 from fiscal 2008, primarily due to the consolidation of MSSB and higher equity underwriting activity, partially offset by lower underwriting activity across fixed income and unit trust products.
55
Principal Transactions-Trading. Principal transactions-trading include revenues from customers' purchases and sales of financial instruments in which the Company acts as principal and gains and losses on the Company's inventory positions held, primarily to facilitate customer transactions.
Principal transactions trading revenues increased 97% in 2009 from fiscal 2008, primarily due to the consolidation of the operating revenues of MSSB, and higher revenues from municipal and corporate fixed income securities, partially offset by lower revenues from government securities. The results in 2009 also reflected net gains associated with investments that benefit certain employee deferred compensation plans.
Principal Transactions-Investments. Principal transactions net investment gains were $3 million in 2009 compared with net investment losses of $54 million in fiscal 2008. The results in 2009 primarily reflected net gains associated with investments that benefit certain employee deferred compensation plans compared with losses on such plans in fiscal 2008.
Commissions. Commission revenues primarily arise from agency transactions in listed and OTC equity securities and sales of mutual funds, futures, insurance products and options. Commission revenues increased 48% in 2009 compared with fiscal 2008, reflecting the operating results of MSSB, partially offset by lower client activity.
Asset Management, Distribution and Administration Fees. Asset management, distribution and administration fees include revenues from individual investors electing a fee-based pricing arrangement and fees for investment management, account services and administration. The Company also receives shareholder servicing fees and fees for services it provides in distributing certain open-ended mutual funds and other products. Mutual fund distribution fees are based on either the average daily fund net asset balances or average daily aggregate net fund sales and are affected by changes in the overall level and mix of assets under management or supervision.
Asset management, distribution and administration fees increased 68% in 2009 compared with fiscal 2008, primarily due to consolidating the operating revenues of MSSB and fees associated with customer account balances in the bank deposit program. Beginning in June 2009, revenues in the bank deposit program are primarily included in Asset management, distribution and administration fees prospectively. These revenues were previously reported in Interest and dividends revenues. This change is the result of agreements that were entered into in connection with the MSSB transaction.
Balances in the bank deposit program rose to $112.5 billion as of December 31, 2009 from $38.8 billion as of December 31, 2008, primarily due to MSSB, which include balances held at Citi's depository institutions. Deposits held by certain of the Company's FDIC-insured depository institutions were $54 billion of the $112.5 billion deposits at December 31, 2009.
Client assets in fee-based accounts increased 175% to $379 billion as of December 31, 2009 and represented 24% of total client assets compared with 25% as of December 31, 2008. Total client asset balances increased to $1,560 billion as of December 31, 2009 from $550 billion as of December 31, 2008, primarily due to MSSB. Client asset balances in households greater than $1 million increased to $1,090 billion as of December 31, 2009 from $354 billion as of December 31, 2008.
Other. Other revenues primarily include customer account service fees and other miscellaneous revenues. Other revenues decreased 74% in 2009 compared with fiscal 2008. The results in 2009 included the operating revenues of MSSB. Fiscal 2008 results included $743 million related to the sale of MSWM S.V., the Spanish onshore mass affluent wealth management business, and Global Wealth Management Group's share ($43 million) of the Company's repurchase of debt (see "Certain Factors Affecting Results of Operations-Morgan Stanley Debt" herein for further discussion).
Net Interest. Interest and dividend revenues and interest expense are a function of the level and mix of total assets and liabilities, including customer bank deposits and margin loans and securities borrowed and securities
56
loaned transactions. Net interest revenues decreased 29% in 2009 compared with fiscal 2008. The decrease was primarily due to the change in classification of the bank deposit program noted above, a decline in customer margin loan balances and increased funding costs.
Non-interest Expenses. Non-interest expenses increased 51% in 2009 and included the operating costs of MSSB, the amortization of MSSB's intangible assets, and deal closing costs of $221 million and integration costs of $280 million for MSSB. Deal closing costs included a one-time expense of $124 million primarily for replacement deferred compensation awards. The cost of these replacement awards was fully allocated to Citi within non-controlling interests. Compensation and benefits expense increased 60% in 2009, primarily reflecting MSSB and the replacement awards noted above. Non-compensation expenses increased 32%. Occupancy and equipment expense increased 91%, primarily due to the operating costs of MSSB and real estate abandonment charges. Information processing and communications expense increased 70% and professional services expense increased 54% in 2009, primarily due to the operating results of MSSB. Other expenses decreased 7% in 2009, primarily due to the charge of $532 million for the ARS repurchase program in fiscal 2008 (see Note 11 to the consolidated financial statements), partially offset by operating costs of MSSB and a charge related to an FDIC assessment on deposits.
Fiscal 2008 Compared with Fiscal 2007
Investment banking revenues decreased 32% in fiscal 2008, primarily due to lower underwriting activity across equity and unit trust products, partially offset by an increase in fixed income underwriting activity. Principal transactions trading revenues increased 3% in fiscal 2008, primarily due to higher revenues from municipal, corporate and government fixed income securities, partially offset by $108 million in writedowns on $3.8 billion of ARS repurchased from clients and previously held on the Company's consolidated statement of financial condition and losses associated with investments that benefit certain employee deferred compensation plans. Principal transactions net investment losses were $54 million in fiscal 2008 compared with net investment gains of $29 million in fiscal 2007. The results in fiscal 2008 reflected net losses associated with investments that benefit certain employee deferred compensation plans. Commission revenues decreased 2% in fiscal 2008, reflecting lower client activity.
Asset management, distribution and administration fees decreased 11% in fiscal 2008. The decrease was driven by a change in the classification of sub-advisory fees due to modifications of certain customer agreements, the discontinuance of the Company's fee-based brokerage program in the fourth quarter of fiscal 2007 and asset depreciation. Client assets in fee-based accounts decreased 32% to $136 billion as of November 30, 2008 and represented 25% of total client assets versus 27% at November 30, 2007. Total client asset balances decreased to $546 billion as of November 30, 2008 from $758 billion as of November 30, 2007, primarily due to asset depreciation. Client asset balances in households greater than $1 million decreased to $349 billion as of November 30, 2008 from $522 billion at November 30, 2007.
Net interest revenues increased 32%, primarily due to increased customer account balances in the bank deposit program. Balances in the bank deposit program rose to $36.4 billion as of November 30, 2008 from $26.2 billion at November 30, 2007. Other revenues were $965 million in fiscal 2008 and $163 million in fiscal 2007. Fiscal 2008 included $743 million related to the sale of MSWM S.V. and Global Wealth Management Group's share ($43 million) of the Company's repurchase of debt.
Non-interest expenses increased 7% in fiscal 2008, primarily reflecting the charge of $532 million for the ARS repurchase program. Compensation and benefits expense remained flat in fiscal 2008, as severance-related expenses of $41 million and investment in the business were offset by lower incentive-based compensation accruals. Non-compensation expenses increased 25%. Occupancy and equipment expense increased 8%, primarily due to an increase in space costs and branch renovations. Professional services expense decreased 40%, primarily due to the change in the classification of sub-advisory fees due to modifications of certain customer agreements and lower legal costs. Other expenses increased 206%, primarily resulting from the charge of $532 million related to ARS as previously mentioned and higher litigation costs.
57
One Month Ended December 31, 2008 Compared with the One Month Ended December 31, 2007
Global Wealth Management Group recorded income before income taxes of $118 million in the one month ended December 31, 2008 compared with $103 million in the one month ended December 31, 2007. The one month ended December 31, 2008 included a reversal of a portion of approximately $70 million of the accrual related to the ARS repurchase program. Net revenues were $409 million, a 24% decrease, primarily related to lower asset management, distribution and administration fees, lower commissions and lower investment banking fees. Client assets in fee-based accounts decreased 31% to $138 billion and decreased as a percentage of total client assets to 25% from 27% at December 31, 2007. In addition, total client assets decreased to $550 billion, down 27% from December 31, 2007, primarily due to weakened market conditions.
Total non-interest expenses were $291 million in the one month ended December 31, 2008, a 33% decrease from the prior period. Compensation and benefits expense was $247 million, a 21% decrease from the prior-year period, primarily reflecting lower revenues. Non-compensation costs decreased 65%, primarily due to a reversal of approximately $70 million of the accrual related to the ARS repurchase program.
58
ASSET MANAGEMENT
INCOME STATEMENT INFORMATION
| 2009 | Fiscal 2008 | Fiscal 2007 | One Month Ended December 31, 2008 | |||||||||||||
| (dollars in millions) | ||||||||||||||||
Revenues: | ||||||||||||||||
Investment banking | $ | 10 | $ | 26 | $ | 212 | $ | 1 | ||||||||
Principal transactions: | ||||||||||||||||
Trading | (68 | ) | (331 | ) | (128 | ) | (82 | ) | ||||||||
Investments | (182 | ) | (1,393 | ) | 1,760 | (45 | ) | |||||||||
Commissions | - | - | 1 | 1 | ||||||||||||
Asset management, distribution and administration fees | 1,604 | 2,139 | 2,490 | 111 | ||||||||||||
Other | 47 | 160 | 58 | 4 | ||||||||||||
Total non-interest revenues | 1,411 | 601 | 4,393 | (10 | ) | |||||||||||
Interest and dividends | 27 | 153 | 65 | 11 | ||||||||||||
Interest expense | 101 | 206 | 94 | 10 | ||||||||||||
Net interest | (74 | ) | (53 | ) | (29 | ) | 1 | |||||||||
Net revenues | 1,337 | 548 | 4,364 | (9 | ) | |||||||||||
Compensation and benefits | 1,104 | 947 | 2,228 | 54 | ||||||||||||
Non-compensation expenses | 906 | 1,024 | 1,081 | 51 | ||||||||||||
Total non-interest expenses | 2,010 | 1,971 | 3,309 | 105 | ||||||||||||
(Loss) income from continuing operations before income taxes | (673 | ) | (1,423 | ) | 1,055 | (114 | ) | |||||||||
(Benefit from) provision for income taxes | (218 | ) | (568 | ) | 382 | (44 | ) | |||||||||
(Loss) income from continuing operations | (455 | ) | (855 | ) | 673 | (70 | ) | |||||||||
Discontinued operations: | ||||||||||||||||
(Loss) gain from discontinued operations | (357 | ) | (384 | ) | 412 | 4 | ||||||||||
(Benefit from) provision for income taxes | (275 | ) | (122 | ) | 159 | 2 | ||||||||||
(Loss) gain from discontinued operations | (82 | ) | (262 | ) | 253 | 2 | ||||||||||
Net income (loss) | (537 | ) | (1,117 | ) | 926 | (68 | ) | |||||||||
Net loss applicable to non-controlling interests | (50 | ) | - | - | - | |||||||||||
Net (loss) income applicable to Morgan Stanley | $ | (487 | ) | $ | (1,117 | ) | $ | 926 | $ | (68 | ) | |||||
Amounts attributable to Morgan Stanley common shareholders: | ||||||||||||||||
(Loss) income from continuing operations, net of tax | $ | (405 | ) | $ | (855 | ) | $ | 673 | $ | (70 | ) | |||||
(Loss) gain from discontinued operations, net of tax | (82 | ) | (262 | ) | 253 | 2 | ||||||||||
Net (loss) income applicable to Morgan Stanley | $ | (487 | ) | $ | (1,117 | ) | $ | 926 | $ | (68 | ) | |||||
59
Statistical Data.
The results presented in the statistical tables below exclude the operations of Retail Asset Management, as those results are included in discontinued operations for all periods presented (see Note 23 to the consolidated financial statements).
Asset Management's year-end and average assets under management or supervision were as follows:
| At December 31, 2009 | At December 31, 2008(1) | Average for | ||||||||||||||||
| 2009 | Fiscal 2008(1) | Fiscal 2007(1) | One Month Ended December 31, 2008(1) | |||||||||||||||
| (dollars in billions) | ||||||||||||||||||
Assets under management or supervision by asset class: | ||||||||||||||||||
Core asset management: | ||||||||||||||||||
Equity | $ | 81 | $ | 63 | $ | 68 | $ | 102 | $ | 117 | $ | 62 | ||||||
Fixed income-long term | 54 | 56 | 52 | 71 | 69 | 56 | ||||||||||||
Money market | 59 | 81 | 65 | 107 | 90 | 81 | ||||||||||||
Alternatives(2) | 42 | 41 | 37 | 53 | 46 | 41 | ||||||||||||
Total core asset management | 236 | 241 | 222 | 333 | 322 | 240 | ||||||||||||
Merchant banking: | ||||||||||||||||||
Private equity | 4 | 4 | 4 | 3 | 2 | 4 | ||||||||||||
Infrastructure | 4 | 4 | 4 | 3 | 1 | 4 | ||||||||||||
Real estate | 15 | 35 | 21 | 37 | 26 | 34 | ||||||||||||
Total merchant banking | 23 | 43 | 29 | 43 | 29 | 42 | ||||||||||||
Total assets under management or supervision | 259 | 284 | 251 | 376 | 351 | 282 | ||||||||||||
Share of non-controlling interest assets(3) | 7 | 6 | 6 | 7 | 6 | 6 | ||||||||||||
Total | $ | 266 | $ | 290 | $ | 257 | $ | 383 | $ | 357 | $ | 288 | ||||||
| (1) | Prior-period information has been reclassified to conform to the current period's presentation. |
| (2) | The alternatives asset class includes a range of investment products such as hedge funds, funds of hedge funds and funds of private equity funds. |
| (3) | Amounts represent Asset Management's proportional share of assets managed by entities in which it owns a non-controlling interest. |
60
Activity in Asset Management's assets under management or supervision during 2009, fiscal 2008, fiscal 2007 and the one month ended December 31, 2008 was as follows:
| 2009 | Fiscal 2008(1) | Fiscal 2007(1) | One Month Ended December 31, 2008(1) | |||||||||||||
| (dollars in billions) | ||||||||||||||||
Balance at beginning of period | $ | 290 | $ | 400 | $ | 314 | $ | 287 | ||||||||
Net flows by asset class: | ||||||||||||||||
Core asset management: | ||||||||||||||||
Equity | (8 | ) | (9 | ) | (9 | ) | - | |||||||||
Fixed income-long term | (6 | ) | (14 | ) | 5 | (3 | ) | |||||||||
Money market | (22 | ) | (19 | ) | 10 | - | ||||||||||
Alternatives(2) | (3 | ) | 6 | 11 | - | |||||||||||
Total core asset management | (39 | ) | (36 | ) | 17 | (3 | ) | |||||||||
Merchant banking: | ||||||||||||||||
Private equity | - | 1 | 1 | - | ||||||||||||
Infrastructure | - | 1 | 2 | - | ||||||||||||
Real estate | (2 | ) | 1 | 11 | - | |||||||||||
Total merchant banking | (2 | ) | 3 | 14 | - | |||||||||||
Total net flows | (41 | ) | (33 | ) | 31 | (3 | ) | |||||||||
Net market appreciation/(depreciation) | 16 | (80 | ) | 46 | 6 | |||||||||||
Total net (decrease)/increase | (25 | ) | (113 | ) | 77 | 3 | ||||||||||
Acquisitions | - | 1 | 6 | - | ||||||||||||
Net increase/(decrease) in share of non-controlling interest assets(3) | 1 | (1 | ) | 3 | - | |||||||||||
Balance at end of period | $ | 266 | $ | 287 | $ | 400 | $ | 290 | ||||||||
| (1) | Prior-period information has been reclassified to conform to the current period's presentation. |
| (2) | The alternatives asset class includes a range of investment products such as hedge funds, funds of hedge funds and funds of private equity funds. |
| (3) | Amounts represent Asset Management's proportional share of assets managed by entities in which it owns a non-controlling interest. |
2009 Compared with Fiscal 2008
Investment Banking. Asset Management generates investment banking revenues primarily from the placement of investments in real estate funds. Investment banking revenues decreased 62% in 2009 from fiscal 2008, primarily reflecting lower revenues from real estate products.
Principal Transactions-Trading. In 2009, the Company recognized losses of $68 million compared with losses of $331 million in fiscal 2008. Trading results in 2009 included mark-to-market losses related to a lending facility to a real estate fund sponsored by the Company and losses from hedges on certain investments and long-term debt. Losses in 2009 were partially offset by net gains of $164 million related to securities issued by SIVs compared with losses of $470 million in fiscal 2008.
Principal Transactions-Investments. Real estate and private equity investments generally are held for long-term appreciation and generally are subject to significant sales restrictions. Estimates of the fair value of the investments involve significant judgment and may fluctuate significantly over time in light of business, market, economic and financial conditions generally or in relation to specific transactions.
Principal transactions net investment losses of $182 million were recognized in 2009 compared with losses of $1,393 million in fiscal 2008. The results in 2009 were primarily related to net investment losses associated with
61
the Company's real estate investments and losses associated with certain investments for the benefit of the Company's employee deferred compensation and co-investment plans. Losses in 2009 were partially offset by net investment gains associated with the Company's alternatives business.
The results for 2009 also included operating losses of certain consolidated real estate funds sponsored by the Company. The Company consolidated the funds during 2009 after providing them with financial assistance and in light of the continued deterioration of equity in the funds. Earnings of these funds related to the limited partnership interests not owned by the Company are reported in Net income (loss) applicable to non-controlling interests on the consolidated statements of income.
The results in fiscal 2008 were primarily related to net investment losses associated with the Company's merchant banking business, including real estate and private equity investments, and losses associated with certain investments for the benefit of the Company's employee deferred compensation and co-investment plans. Included in the net investment losses in fiscal 2008 were writedowns of approximately $250 million on Crescent prior to its consolidation.
Asset Management, Distribution and Administration Fees. Asset management, distribution and administration fees include revenues generated from the management and supervision of assets, performance-based fees relating to certain funds, and separately managed accounts and fees relating to the distribution of certain open-ended mutual funds. Asset management fees arise from investment management services the Company provides to investment vehicles pursuant to various contractual arrangements. The Company receives fees primarily based upon mutual fund daily average net assets or based on monthly or quarterly invested equity for other vehicles. Performance-based fees are earned on certain funds as a percentage of appreciation earned by those funds and, in certain cases, are based upon the achievement of performance criteria. These fees are normally earned annually and are recognized on a monthly or quarterly basis.
Asset management, distribution and administration fees decreased 25% in 2009 compared with fiscal 2008. The decrease in 2009 primarily reflected lower fund management and administration fees reflecting a decrease in average assets under management.
Net flows in 2009 were associated with negative outflows across all asset classes. The Company's decline in assets under management from December 31, 2008 to December 31, 2009 included net customer outflows of $41.1 billion, primarily in the Company's money market, long-term fixed income and equity funds.
Other. Other revenues decreased 71% in 2009 compared with fiscal 2008. The results in 2009 reflected lower revenues associated with Lansdowne Partners ("Lansdowne"), a London-based investment manager, in which the Company has a non-controlling interest, and lower revenues associated with the Company's repurchase of debt (see "Certain Factors Affecting Results of Operations-Morgan Stanley Debt", herein).
Non-interest Expenses. Non-interest expenses increased 2% in 2009 compared with fiscal 2008. The results in 2009 primarily reflected an increase in compensation and benefits expense. Compensation and benefits expense increased 17% in 2009, primarily reflecting higher net revenues. Non-compensation expenses decreased 12% in 2009. Brokerage, clearing and exchange fees decreased 44% in 2009, primarily due to lower fee sharing expenses. Marketing and business development expense decreased 40% in 2009, primarily due to lower levels of business activity. Professional services expense decreased 20% in 2009, primarily due to lower consulting and legal fees.
Fiscal 2008 Compared with Fiscal 2007
Investment banking revenues decreased 88% in fiscal 2008, primarily reflecting lower revenues from real estate products.
62
In fiscal 2008, the Company recognized principal transactions trading losses of $331 million, which included $470 million related to SIVs included in the Company's consolidated statement of financial condition, compared with losses of $129 million related to SIVs in fiscal 2007. These losses in fiscal 2008 were partially offset by net gains from hedges on certain investments.
Principal transactions net investment losses aggregating $1,393 million were recognized in fiscal 2008 as compared with gains of $1,760 million in fiscal 2007. The results for fiscal 2008 are discussed above in "2009 Compared with Fiscal 2008-Principal Transactions-Investments." The results in fiscal 2007 were primarily driven by investments associated with the Company's real estate products and private equity portfolio, including employee deferred compensation plans and co-investment plans.
Asset management, distribution and administration fees decreased 14% in fiscal 2008. The decrease was primarily due to lower performance fees from alternative investment products, lower distribution fees, and lower fund management and administration fees, reflecting a decrease in average assets under management. Fiscal 2008 also reflected lower shareholder servicing fees related to the modification of certain sub-transfer agent agreements, which resulted in an offsetting reduction to professional services expense.
Other revenues increased 176% in fiscal 2008, primarily due to Asset Management's share ($74 million) of the Company's repurchase of debt (see "Certain Factors Affecting Results of Operations-Morgan Stanley Debt" herein for further discussion) and higher revenues associated with Lansdowne.
Non-interest expenses decreased 40% in fiscal 2008, primarily reflecting a decrease in compensation and benefits expense. Compensation and benefits expense decreased 58% in fiscal 2008, primarily due to a decrease in compensation costs reflecting lower net revenues and losses associated with principal investments for the benefit of the Company's employee deferred compensation and co-investment plans. The decrease in fiscal 2008 was partially offset by severance-related expenses. Non-compensation expenses decreased 5% in fiscal 2008. Occupancy and equipment expense increased 12%, primarily due to higher costs related to increased occupancy usage compared with fiscal 2007. Brokerage, clearing and exchange fees decreased 5%, primarily due to lower commission expenses. Professional services expense decreased 24%, primarily due to lower sub-advisory fees and sub-transfer agent fees, partially offset by an increase in consulting and legal fees. Other expenses increased 25%, primarily due to an intangible assets impairment charge of $25 million.
One Month Ended December 31, 2008 Compared with the One Month Ended December 31, 2007
Asset Management recorded losses from continuing operations before income taxes of $114 million in the one month ended December 31, 2008 compared with losses before income taxes of $103 million in the one month ended December 31, 2007. Net revenues decreased 112% from the prior-period. The decrease in the one month ended December 31, 2008 primarily reflected lower asset management, distribution and administration fees of $111 million, partially offset by lower losses related to securities issued by SIVs of $84 million, compared with $119 million in the one month ended December 31, 2007. Assets under management or supervision within Asset Management of $290 billion were down $106 billion, or 27%, from $396 billion as of December 31, 2007, primarily reflecting decreases in equity and fixed income products resulting from market depreciation and net outflows. Non-interest expenses decreased $75 million to $105 million primarily due to lower compensation and benefits expense. Compensation and benefits expense decreased 53%, primarily reflecting lower revenues and reduced headcount.
63
Accounting Developments.
Transfers of Financial Assets and Extinguishments of Liabilities and Consolidation of Variable Interest Entities.
In June 2009, the Financial Accounting Standards Board ("FASB") issued accounting guidance that changes the way entities account for securitizations and special-purpose entities ("SPEs"). The accounting guidance amends the accounting for transfers of financial assets and will require additional disclosures about transfers of financial assets, including securitization transactions, and where entities have continuing exposure to the risks related to transferred financial assets. It eliminates the concept of a qualifying special purpose entity ("QSPE") and changes the requirements for derecognizing financial assets.
The accounting guidance also amends the accounting for consolidation and changes how a reporting entity determines when an entity that is insufficiently capitalized or is not controlled through voting (or similar rights) should be consolidated. The determination of whether a reporting entity is required to consolidate another entity is based on, among other things, the other entity's purpose and design and the reporting entity's ability to direct the activities of the other entity that most significantly impact the other entity's economic performance. In February 2010, the FASB finalized a deferral of these accounting changes, effective January 1, 2010, for certain interests in investment companies or in entities qualifying for accounting purposes as investment companies. For the entities included in the deferral, the Company will continue to analyze consolidation under other existing authoritative guidance; these entities are not included in the impact noted below.
The adoption of this accounting guidance on January 1, 2010 did not have a material impact on the Company's consolidated statement of financial condition.
Regulatory Outlook.
It is likely that the year 2010 and subsequent years will see material changes in the way that major financial institutions are regulated both in the U.S. and worldwide. The reforms being discussed include several that contemplate comprehensive restructuring of the regulation of the financial services industry. Enactment of such measures likely would lead to stricter regulation of financial institutions generally, and heightened prudential requirements for systemically important firms in particular. Such measures could include taxation of financial transactions, liabilities and employee compensation as well as reforms of the OTC derivatives markets, such as mandated exchange trading and clearing, position limits, margin, capital and registration requirements. Other changes under discussion in the U.S. legislative arena include: breaking up firms that are considered "too big to fail" or mandating certain barriers between their activities in order to allow for an orderly resolution of failing financial institutions; curtailing the ability of firms that own FDIC-insured institutions to also engage in private equity, hedge fund and proprietary trading activities; requiring firms to maintain plans for their dissolution; requiring the financial industry to pay into a fund designed to help unwind failing firms; providing regulators with new means of limiting activities of financial firms; regulating compensation in the financial services industry; enhancing corporate governance, especially regarding risk management; and creating a new agency, the "Consumer Financial Protection Agency," to protect U.S. consumers who buy financial products.
Reforms are being discussed concurrently in Washington, London, the European Union ("EU") and other major market centers in which the Company operates, and attempts are being made to internationally coordinate the principles behind such changes through the G-20's expanded mandate for the Financial Stability Board and through the Basel Committee on Banking Supervision ("Basel Committee"), the International Association of Securities Commissioners and others. Among the internationally coordinated reforms are recent measures and proposals by the Basel Committee to raise the quality of capital, increase capital requirements for securitizations, trading book exposure and counterparty credit risk exposure, and globally introduce a leverage ratio, capital conservation measures and liquidity coverage requirements, among other measures. In both the EU and the U.S., moreover, changes to the institutional framework for financial regulation are being discussed or are underway.
Many of the market reforms, if enacted, may materially affect the Company's business, financial condition, results of operations and cash flows for a particular future period. In particular, if systemic regulation were
64
enacted, the Company would likely be designated as a systemically important firm, and the consequences of systemic regulation, including a potential requirement for additional higher quality capital and liquidity and decreased leverage, could materially impact the Company's business.
A substantial number of the financial reforms currently discussed in the U.S. and globally may become law, though it is difficult to predict which will become law, how such reforms will be implemented or the exact impact they will have on the Company's business, financial condition, results of operations and cash flows for a particular future period. As most changes, if adopted, will require regulatory implementation, the full impact of these changes will not be known until a later stage.
65
Other Matters.
Settlement with DFS.
On February 11, 2010, the Company and DFS entered into an agreement in which each party released the other party from claims related to the sharing of proceeds from the lawsuit against Visa and MasterCard. In addition, the Company and DFS entered into an agreement to provide that payments made by DFS to the Company in satisfaction of its obligations under the special dividend declared by DFS in June 2007, shall not exceed $775 million. Also on February 11, 2010, DFS paid the Company $775 million in complete satisfaction of its obligations to the Company under the special dividend. The payment will be included in discontinued operations in the Company's condensed consolidated statement of income for the first quarter of 2010.
Sale of Bankruptcy Claims.
During 2009, the Company entered into multiple participation agreements with certain investors whereby the Company sold undivided participating interests representing 81% (or $1,105 million) of its claims totaling $1,362 million, pursuant to International Swaps and Derivatives Association ("ISDA") master agreements, against a derivative counterparty that filed for bankruptcy protection. The Company received cash proceeds of $429 million and recorded a gain on sale of $319 million in 2009. The gain is reflected in the consolidated statement of income in Principal transactions-trading revenues within the Institutional Securities business segment.
As a result of the bankruptcy of the derivative counterparty, the Company, as contractually entitled, exercised remedies as the non-defaulting party and determined the value of the claims under the ISDA master agreements in a commercially reasonable manner. The Company filed its claims with the bankruptcy court. In connection with the sale of the undivided participating interests in a portion of the claims, the Company provided certain representations and warranties related to the allowance of the amount stated in the claims submitted to the bankruptcy court. The bankruptcy court will be evaluating all of the claims filed against the derivative counterparty. To the extent, in the future, any portion of the stated claims is disallowed or reduced by the bankruptcy court in excess of a certain amount, then the Company must refund a portion of the purchase price plus interest from the date of the participation agreements to the repayment date. The maximum amount that the Company could be required to refund is the total proceeds of $429 million plus interest. The Company recorded a liability for the fair value of this possible disallowance. The fair value was determined by assessing mid-market values of the underlying transactions, where possible, prevailing bid-offer spreads around the time of the bankruptcy filing, and applying valuation adjustments related to estimating unwind costs. The investors, however, bear full price risk associated with the allowed claims as it relates to the liquidation proceeds from the bankruptcy estate. The Company also agreed to service the claims and, as such, recorded a liability for the fair value of the servicing obligation. The Company will continue to measure these obligations at fair value with changes in fair value recorded in earnings. These obligations are reflected in the consolidated statement of financial condition as Financial instruments sold, not yet purchased-derivatives and other contracts.
Real Estate.
The Company acts as the general partner for various real estate funds and also invests in certain of these funds as a limited partner.
| | 66 |
The Company's real estate investments as of December 31, 2009 and December 31, 2008 are shown below. Such amounts exclude investments that benefit certain employee deferred compensation and co-investment plans:
| Statement of Financial Condition December 31, 2009 | Statement of Financial Condition December 31, 2008 | |||||
| (dollars in billions) | ||||||
Consolidated interests(1) | $ | 1.5 | $ | 3.8 | ||
Real estate funds(2) | 0.5 | 1.0 | ||||
Real estate bridge financing | - | 0.2 | ||||
Infrastructure fund | 0.2 | 0.1 | ||||
Total(3) | $ | 2.2 | $ | 5.1 | ||
| (1) | Consolidated statement of financial condition amounts represent investment assets of consolidated subsidiaries, net of non-controlling interests. The decrease from December 31, 2008 to December 31, 2009 was primarily due to the disposition of Crescent in the fourth quarter of 2009, whereby the Company transferred its ownership interest in Crescent to Crescent's primary creditor in exchange for full release of liability on the related loans. |
| (2) | In 2009, the Company consolidated certain real estate funds resulting in a transfer of investment assets of $0.2 billion, which is net of non-controlling interests of $0.6 billion, from real estate funds to consolidated interests. The results for 2009 for these newly consolidated subsidiaries, net of non-controlling interests, were not significant. The Company consolidated the funds during 2009 due to a reassessment of its primary beneficiary position with respect to the funds, reflecting the continued deterioration of equity in the funds combined with the Company's financial assistance provided to the funds. The limited partnership interests in the earnings of these funds are reported in Net income (loss) applicable to non-controlling interests on the consolidated statement of income. |
| (3) | In 2009, losses on consolidated interests were $0.8 billion, of which $0.6 billion were included in discontinued operations related to Crescent. Losses on real estate funds and real estate bridge financing were $0.9 billion and $0.2 billion, respectively, in 2009. In addition, the Company has contractual capital commitments, guarantees, lending facilities and counterparty arrangements with respect to these investments of $1.5 billion as of December 31, 2009 (see Note 11 to the consolidated financial statements). |
Defined Benefit Pension and Other Postretirement Plans.
Contributions. The Company made contributions of $321 million, $325 million, $130 million and $2 million to its U.S. and non-U.S. defined benefit pension plans in 2009, fiscal 2008, fiscal 2007 and the one month ended December 31, 2008, respectively. These contributions were funded with cash from operations.
The Company determines the amount of its pension contributions to its funded plans by considering several factors, including the level of plan assets relative to plan liabilities, the types of assets in which the plans are invested, expected plan liquidity needs and expected future contribution requirements. The Company's policy is to fund at least the amounts sufficient to meet minimum funding requirements under applicable employee benefit and tax laws (for example, in the U.S., the minimum required contribution under the Employee Retirement Income Security Act of 1974, or "ERISA"). As of December 31, 2009 and December 31, 2008, there were no minimum required ERISA contributions for the Company's U.S. pension plan that is qualified under Section 401(a) of the Internal Revenue Code. The contributions made to the U.S. pension plan of $278 million and $276 million were funded based on the service cost earned by the eligible employees plus a portion of the unfunded accumulated benefit obligation on a funding basis for 2009 and fiscal 2008, respectively. Liabilities for benefits payable under certain postretirement and unfunded supplementary plans are accrued by the Company and are funded when paid to the beneficiaries.
Expense. The Company recognizes the compensation cost of an employee's pension benefits (including prior-service cost) over the employee's estimated service period. This process involves making certain estimates and assumptions, including the discount rate and the expected long-term rate of return on plan assets. For fiscal 2008, as required under the alternative transition method set forth in current accounting guidance, the Company changed the measurement date to coincide with the Company's fiscal year-end date. Net periodic pension expense was $175 million, $132 million, $143 million and $9 million, while net periodic postretirement expense was $26 million, $17 million, $14 million and $2 million for 2009, fiscal 2008, fiscal 2007 and the one month ended December 31, 2008, respectively.
See Notes 2 and 19 to the consolidated financial statements for more information on the Company's defined benefit pension and postretirement plans, including the adoption of accounting guidance for defined benefit pension and other postretirement plans.
| 67 | |
Critical Accounting Policies.
The Company's consolidated financial statements are prepared in accordance with accounting principles generally accepted in the U.S., which require the Company to make estimates and assumptions (see Note 1 to the consolidated financial statements). The Company believes that of its significant accounting policies (see Note 2 to the consolidated financial statements), the following involve a higher degree of judgment and complexity.
Fair Value.
Financial Instruments Measured at Fair Value. A significant number of the Company's financial instruments are carried at fair value with changes in fair value recognized in earnings each period. The Company makes estimates regarding valuation of assets and liabilities measured at fair value in preparing the consolidated financial statements. These assets and liabilities include but are not limited to:
| • | Financial instruments owned and Financial instruments sold, not yet purchased; |
| • | Securities received as collateral and Obligation to return securities received as collateral; |
| • | Certain Commercial paper and other short-term borrowings, primarily structured notes; |
| • | Certain Deposits; |
| • | Other secured financings; and |
| • | Certain Long-term borrowings, primarily structured notes and certain junior subordinated debentures. |
Fair value is defined as the price that would be received to sell an asset or paid to transfer a liability ( i.e. , the "exit price") in an orderly transaction between market participants at the measurement date.
In determining fair value, the Company uses various valuation approaches. A hierarchy for inputs is used in measuring fair value that maximizes the use of observable prices and inputs and minimizes the use of unobservable prices and inputs by requiring that the relevant observable inputs be used when available. The hierarchy is broken down into three levels, wherein Level 1 uses observable prices in active markets, and Level 3 consists of valuation techniques that incorporate significant unobservable inputs and therefore require the greatest use of judgment. In periods of market disruption, the observability of prices and inputs may be reduced for many instruments. This condition could cause an instrument to be reclassified from Level 1 to Level 2 or Level 2 to Level 3. In addition, a continued downturn in market conditions could lead to declines in the valuation of many instruments. For further information on the fair value definition, Level 1, Level 2, Level 3 and related valuation techniques, see Notes 2 and 4 to the consolidated financial statements.
The Company's Level 3 assets before the impact of cash collateral and counterparty netting across the levels of the fair value hierarchy were $43.4 billion and $83.6 billion as of December 31, 2009 and December 31, 2008, respectively, and represented approximately 14% and 29% as of December 31, 2009 and December 31, 2008, respectively, of the assets measured at fair value (6% and 12% of total assets as of December 31, 2009 and December 31, 2008, respectively). Level 3 liabilities before the impact of cash collateral and counterparty netting across the levels of the fair value hierarchy were $15.4 billion and $29.8 billion as of December 31, 2009 and December 31, 2008, respectively, and represented approximately 9% and 17%, respectively, of the Company's liabilities measured at fair value.
During 2009, the Company reclassified approximately $6.8 billion of certain Corporate and other debt from Level 3 to Level 2. The reclassifications were primarily related to certain corporate loans and bonds, state and municipal securities, commercial mortgage-backed securities ("CMBS") and other debt. For certain corporate loans, more liquidity re-entered the market, and external prices and/or spread inputs for these instruments became observable. For corporate bonds and CMBS, the reclassifications were primarily due to an increase in market price quotations for these or comparable instruments, or available broker quotes, such that observable inputs
| | 68 |
were utilized for the fair value measurement of these instruments. For certain other debt, as the unobservable inputs became insignificant in the overall valuation, the fair value of these instruments became highly correlated with similar instruments in an observable market. For state and municipal securities, certain student loan auction rate securities ("SLARS") were reclassified from Level 3 to Level 2 as there was increased activity in the SLARS market and restructuring activity of the underlying trusts.
During 2009, the Company also reclassified approximately $3.3 billion of certain Corporate and other debt from Level 2 to Level 3. The reclassifications were primarily related to corporate loans and were generally due to a reduction in market price quotations for these or comparable instruments, or a lack of available broker quotes, such that unobservable inputs had to be utilized for the fair value measurement of these instruments. The key unobservable inputs are assumptions to establish comparability to other instruments with observable spread levels.
During 2009, the Company reclassified approximately $10.2 billion of certain Derivatives and other contracts from Level 3 to Level 2, primarily related to single name subprime and CMBS credit default swaps as well as tranche-indexed corporate credit default swaps. Certain single name subprime and CMBS credit default swaps were reclassified primarily because the values associated with the unobservable inputs, such as correlation, were no longer deemed significant to the fair value measurement of these derivative contracts due to market deterioration. Increased availability of transaction data, broker quotes and/or consensus pricing resulted in the reclassifications of certain tranche-indexed corporate credit default swaps. The Company reclassified approximately $0.4 billion of certain Derivatives and other contracts from Level 2 to Level 3 as certain inputs became unobservable.
Assets and Liabilities Measured at Fair Value on a Non-Recurring Basis. Certain of the Company's assets were measured at fair value on a non-recurring basis. The Company incurs impairment charges for any writedowns of these assets to fair value. A downturn in market conditions could result in impairment charges in future periods.
For assets and liabilities measured at fair value on a non-recurring basis, fair value is determined by using various valuation approaches. The same hierarchy as described above, which maximizes the use of observable inputs and minimizes the use of unobservable inputs by generally requiring that the observable inputs be used when available, is used in measuring fair value for these items.
For further information on financial assets and liabilities that are measured at fair value on a recurring and non-recurring basis, see Note 4 to the consolidated financial statements.
Fair Value Control Processes . The Company employs control processes to validate the fair value of its financial instruments, including those derived from pricing models. These control processes are designed to assure that the values used for financial reporting are based on observable inputs wherever possible. In the event that observable inputs are not available, the control processes are designed to assure that the valuation approach utilized is appropriate and consistently applied and that the assumptions are reasonable. These control processes include reviews of the pricing model's theoretical soundness and appropriateness by Company personnel with relevant expertise who are independent from the trading desks. Additionally, groups independent from the trading divisions within the Financial Control, Market Risk and Credit Risk Management Department ("Credit Risk Management") participate in the review and validation of the fair values generated from pricing models, as appropriate. Where a pricing model is used to determine fair value, recently executed comparable transactions and other observable market data are considered for purposes of validating assumptions underlying the model.
Consistent with market practice, the Company has individually negotiated agreements with certain counterparties to exchange collateral ("margining") based on the level of fair values of the derivative contracts they have executed. Through this margining process, one party or each party to a derivative contract provides the other party with information about the fair value of the derivative contract to calculate the amount of collateral required. This sharing of fair value information provides additional support of the Company's recorded fair value
| 69 | |
for the relevant OTC derivative products. For certain OTC derivative products, the Company, along with other market participants, contributes derivative pricing information to aggregation services that synthesize the data and make it accessible to subscribers. This information is then used to evaluate the fair value of these OTC derivative products. For more information regarding the Company's risk management practices, see "Quantitative and Qualitative Disclosures about Market Risk-Risk Management" in Part II, Item 7A, herein.
Goodwill and Intangible Assets.
Goodwill. The Company tests goodwill for impairment on an annual basis and on an interim basis when certain events or circumstances exist. The Company tests for impairment at the reporting unit level, which is generally one level below its business segments. Goodwill no longer retains its association with a particular acquisition once it has been assigned to a reporting unit. As such, all of the activities of a reporting unit, whether acquired or organically grown, are available to support the value of the goodwill. Goodwill impairment is determined by comparing the estimated fair value of a reporting unit with its respective book value. If the estimated fair value exceeds the book value, goodwill at the reporting unit level is not deemed to be impaired. If the estimated fair value is below book value, however, further analysis is required to determine the amount of the impairment. The estimated fair values of the reporting units are derived based on valuation techniques the Company believes market participants would use for each of the reporting units. The estimated fair values are generally determined utilizing methodologies that incorporate price-to-book, price-to-earnings and assets under management multiples of certain comparable companies.
The Company completed its annual goodwill impairment testing as of June 1, 2009 and 2008, which did not result in any goodwill impairment. During the quarter ended September 30, 2009, the Company changed the date of its annual goodwill impairment testing to July 1 as a result of the Company's change in its fiscal year-end from November 30 to December 31 of each year. The change to the annual goodwill impairment testing date was to move the impairment testing outside of the Company's normal second quarter-end reporting process to a date in the third quarter, consistent with the testing date prior to the change in the fiscal year-end. The Company believes that the resulting change in accounting principle related to the annual testing date will not delay, accelerate or avoid an impairment charge. Goodwill impairment tests performed as of July 1, 2009 concluded that no impairment charges were required as of that date. The Company determined that the change in accounting principle related to the annual testing date is preferable under the circumstances and did not result in adjustments to the Company's consolidated financial statements when applied retrospectively.
Intangible Assets . Amortizable intangible assets are amortized over their estimated useful lives and reviewed for impairment on an interim basis when certain events or circumstances exist. For amortizable intangible assets, an impairment exists when the carrying amount of the intangible asset exceeds its fair value. An impairment loss will be recognized only if the carrying amount of the intangible asset is not recoverable and exceeds its fair value. The carrying amount of the intangible asset is not recoverable if it exceeds the sum of the expected undiscounted cash flows.
Indefinite-lived intangible assets are not amortized but are reviewed annually (or more frequently when certain events or circumstances exist) for impairment. For indefinite-lived intangible assets, an impairment exists when the carrying amount exceeds its fair value.
See Note 4 to the consolidated financial statements for intangible asset impairments recorded during 2009.
For both goodwill and intangible assets, to the extent an impairment loss is recognized, the loss establishes the new cost basis of the asset. Subsequent reversal of impairment losses is not permitted. For amortizable intangible assets, the new cost basis is amortized over the remaining useful life of that asset.
See Note 7 to the consolidated financial statements for further information on goodwill and intangible assets. In addition, see Note 3 to the consolidated financial statements for information on the goodwill and intangible assets acquired on May 31, 2009 in connection with the consummation of the MSSB transaction and the goodwill and intangible assets acquired on July 31, 2009 in connection with the contribution of the managed futures business.
| | 70 |
Legal, Regulatory and Tax Contingencies.
In the normal course of business, the Company has been named, from time to time, as a defendant in various legal actions, including arbitrations, class actions and other litigation, arising in connection with its activities as a global diversified financial services institution. Certain of the actual or threatened legal actions include claims for substantial compensatory and/or punitive damages or claims for indeterminate amounts of damages. In some cases, the issuers that would otherwise be the primary defendants in such cases are bankrupt or in financial distress.
The Company is also involved, from time to time, in other reviews, investigations and proceedings (both formal and informal) by governmental and self-regulatory agencies regarding the Company's business, including, among other matters, accounting and operational matters, certain of which may result in adverse judgments, settlements, fines, penalties, injunctions or other relief.
Reserves for litigation and regulatory proceedings are generally determined on a case-by-case basis and represent an estimate of probable losses after considering, among other factors, the progress of each case, prior experience and the experience of others in similar cases, and the opinions and views of internal and external legal counsel. Given the inherent difficulty of predicting the outcome of such matters, particularly in cases where claimants seek substantial or indeterminate damages or where investigations and proceedings are in the early stages, the Company cannot predict with certainty the loss or range of loss, if any, related to such matters, how such matters will be resolved, when they will ultimately be resolved or what the eventual settlement, fine, penalty or other relief, if any, might be.
The Company is subject to the income and indirect tax laws of the U.S., its states and municipalities and those of the foreign jurisdictions in which the Company has significant business operations. These tax laws are complex and subject to different interpretations by the taxpayer and the relevant governmental taxing authorities. The Company must make judgments and interpretations about the application of these inherently complex tax laws when determining the provision for income taxes and the expense for indirect taxes and must also make estimates about when in the future certain items affect taxable income in the various tax jurisdictions. Disputes over interpretations of the tax laws may be settled with the taxing authority upon examination or audit. The Company regularly assesses the likelihood of assessments in each of the taxing jurisdictions resulting from current and subsequent years' examinations, and tax reserves are established as appropriate.
The Company establishes reserves for potential losses that may arise out of litigation and regulatory proceedings to the extent that such losses are probable and can be estimated in accordance with the requirements for accounting for contingencies. The Company establishes reserves for potential losses that may arise out of tax audits in accordance with accounting for income taxes. Once established, reserves are adjusted when there is more information available or when an event occurs requiring a change. Significant judgment is required in making these estimates, and the actual cost of a legal claim, tax assessment or regulatory fine/penalty may ultimately be materially different from the recorded reserves, if any.
See Notes 11 and 20 to the consolidated financial statements for additional information on legal proceedings and tax examinations.
Special Purpose Entities and Variable Interest Entities.
The Company's involvement with SPEs consists primarily of the following:
| • | Transferring financial assets into SPEs; |
| • | Acting as an underwriter of beneficial interests issued by securitization vehicles; |
| • | Holding one or more classes of securities issued by, or making loans to or investments in, SPEs that hold debt, equity, real estate or other assets; |
| 71 | |
| • | Purchasing and selling (in both a market-making and a proprietary-trading capacity) securities issued by SPEs/variable interest entities ("VIE"), whether such vehicles are sponsored by the Company or not; |
| • | Entering into derivative transactions with SPEs (whether or not sponsored by the Company); |
| • | Providing warehouse financing to collateralized debt obligations and collateralized loan obligations; |
| • | Entering into derivative agreements with non-SPEs whose value is derived from securities issued by SPEs; |
| • | Servicing assets held by SPEs or holding servicing rights related to assets held by SPEs that are serviced by others under subservicing arrangements; |
| • | Serving as an asset manager to various investment funds that may invest in securities that are backed, in whole or in part, by SPEs; and |
| • | Structuring and/or investing in other structured transactions designed to provide enhanced, tax-efficient yields to the Company or its clients. |
The Company engages in securitization activities related to commercial and residential mortgage loans, U.S. agency collateralized mortgage obligations, corporate bonds and loans, municipal bonds and other types of financial instruments. The Company's involvement with SPEs is discussed further in Note 6 to the consolidated financial statements.
In most cases, these SPEs are deemed for accounting purposes to be VIEs. Unless a VIE was determined to be a QSPE (see Note 1 to the consolidated financial statements) under the accounting guidance effective prior to January 1, 2010, the Company was required to perform an analysis of each VIE at the date upon which the Company became involved with it to determine whether the Company was the primary beneficiary of the VIE, in which case the Company had to consolidate the VIE. QSPEs were not consolidated under the accounting guidance effective prior to January 1, 2010. QSPEs are eliminated under the accounting guidance effective January 1, 2010.
In addition, the Company serves as an investment advisor to unconsolidated money market and other funds.
Under the accounting guidance effective prior to January 1, 2010, the Company was required to reassess whether it was the primary beneficiary of a VIE only upon the occurrence of certain reconsideration events. Under accounting guidance adopted on January 1, 2010, the Company is required to reassess whether it is the primary beneficiary on an ongoing basis and not only upon the occurrence of certain events.
If the Company's initial assessment resulted in a determination that it was not the primary beneficiary of a VIE, then under the accounting guidance effective prior to January 1, 2010, the Company reassessed this determination upon the occurrence of:
| • | Changes to the VIE's governing documents or contractual arrangements in a manner that reallocated the obligation to absorb the expected losses or the right to receive the expected residual returns of the VIE between the primary beneficiary at that time and the other variable interest holders, including the Company. |
| • | Acquisition by the Company of additional variable interests in the VIE. |
If the Company's initial assessment resulted in a determination that it was the primary beneficiary, then under the accounting guidance effective prior to January 1, 2010, the Company reassessed this determination upon the occurrence of:
| • | Changes to the VIE's governing documents or contractual arrangements in a manner that reallocated the obligation to absorb the expected losses or the right to receive the expected residual returns of the VIE between the primary beneficiary at that time and the other variable interest holders. |
| | 72 |
| • | A sale or disposition by the Company of all or part of its variable interests in the VIE to parties unrelated to the Company. |
| • | The issuance of new variable interests by the VIE to parties unrelated to the Company. |
The determination of whether an SPE met the accounting requirements of a QSPE required significant judgment, particularly in evaluating whether the permitted activities of the SPE were significantly limited and in determining whether derivatives held by the SPE were passive and nonexcessive. In addition, the analysis involved in determining whether an entity is a VIE, and in determining the primary beneficiary of a VIE, requires significant judgment (see Notes 1 and 6 to the consolidated financial statements).
See "Accounting Developments-Transfers of Financial Assets and Extinguishment of Liabilities and Consolidations of Variable Interest Entities" herein for information on accounting guidance adopted on January 1, 2010 for transfers of financial assets.
| 73 | |
Liquidity and Capital Resources.
The Company's senior management establishes the liquidity and capital policies of the Company. Through various risk and control committees, the Company's senior management reviews business performance relative to these policies, monitors the availability of alternative sources of financing, and oversees the liquidity and interest rate and currency sensitivity of the Company's asset and liability position. The Company's Treasury Department, Firm Risk Committee ("FRC"), Asset and Liability Management Committee ("ALCO") and other control groups assist in evaluating, monitoring and controlling the impact that the Company's business activities have on its consolidated statements of financial condition, liquidity and capital structure.
The Balance Sheet.
The Company actively monitors and evaluates the composition and size of its balance sheet. A substantial portion of the Company's total assets consists of liquid marketable securities and short-term receivables arising principally from Institutional Securities sales and trading activities. The liquid nature of these assets provides the Company with flexibility in managing the size of its balance sheet. The Company's total assets increased to $771,462 million at December 31, 2009 from $676,764 million at December 31, 2008.
Cash used for operating activities primarily related to financial instruments owned-U.S. government and agency securities, securities borrowed, Federal funds sold and securities purchased under agreements to resell. Cash provided by operating activities primarily related to securities loaned, securities sold under agreements to repurchase and financial instruments owned-derivative and other contracts.
Within the sales and trading related assets and liabilities are transactions attributable to securities financing activities. As of December 31, 2009, securities financing assets and liabilities were $376 billion and $316 billion, respectively. As of December 31, 2008, securities financing assets and liabilities were $269 billion and $236 billion, respectively. Securities financing transactions include repurchase and resale agreements, securities borrowed and loaned transactions, securities received as collateral and obligation to return securities received, customer receivables/payables and related segregated customer cash.
Securities financing assets and liabilities also include matched book transactions with minimal market, credit and/or liquidity risk. Matched book transactions accommodate customers, as well as obtain securities for the settlement and financing of inventory positions. The customer receivable portion of the securities financing transactions includes customer margin loans, collateralized by customer owned securities, and customer cash, which is segregated according to regulatory requirements. The customer payable portion of the securities financing transactions primarily includes customer payables to the Company's prime brokerage clients. The Company's risk exposure on these transactions is mitigated by collateral maintenance policies that limit the Company's credit exposure to customers. Included within securities financing assets was $14 billion and $5 billion as of December 31, 2009 and December 31, 2008, respectively, recorded in accordance with accounting guidance for the transfer of financial assets that represented equal and offsetting assets and liabilities for fully collateralized non-cash loan transactions.
The Company uses the Tier 1 leverage ratio, risk based capital ratios (see "Regulatory Requirements" herein), Tier 1 common ratio and the balance sheet leverage ratio as indicators of capital adequacy when viewed in the context of the Company's overall liquidity and capital policies.
| | 74 |
The following table sets forth the Company's total assets and leverage ratios as of December 31, 2009 and December 31, 2008 and average balances during 2009:
| Balance at | Average Balance(1) | |||||||||||
| December 31, 2009 | December 31, 2008 | 2009 | ||||||||||
| (dollars in millions, except ratio data) | ||||||||||||
Total assets | $ | 771,462 | $ | 676,764 | $ | 741,546 | ||||||
Common equity | $ | 37,091 | $ | 29,585 | $ | 34,068 | ||||||
Preferred equity | 9,597 | 19,168 | 13,991 | |||||||||
Morgan Stanley shareholders' equity | 46,688 | 48,753 | 48,059 | |||||||||
Junior subordinated debentures issued to capital trusts | 10,594 | 10,312 | 10,576 | |||||||||
Subtotal | 57,282 | 59,065 | 58,635 | |||||||||
Less: Goodwill and net intangible assets(2) | (7,612 | ) | (2,978 | ) | (5,947 | ) | ||||||
Tangible Morgan Stanley shareholders' equity | $ | 49,670 | $ | 56,087 | $ | 52,688 | ||||||
Common equity | $ | 37,091 | $ | 29,585 | $ | 34,068 | ||||||
Less: Goodwill and net intangible assets(2) | (7,612 | ) | (2,978 | ) | (5,947 | ) | ||||||
Tangible common equity(3) | $ | 29,479 | $ | 26,607 | $ | 28,121 | ||||||
Leverage ratio(4) | 15.5 | x | 12.1 | x | 14.1 | x | ||||||
Tier 1 common ratio(5) | 8.2 | % | N/A | N/A | ||||||||
N/A-The Company began calculating its risk weighted assets under Basel I as of March 31, 2009.
| (1) | The Company calculates its average balances based upon weekly amounts, except where weekly balances are unavailable, the month-end balances are used. |
| (2) | Goodwill and net intangible assets exclude mortgage servicing rights of $123 million (net of disallowable mortgage servicing rights in 2009) and $184 million as of December 31, 2009 and December 31, 2008, respectively. In 2009, amounts included only the Company's share of MSSB's goodwill and intangible assets. |
| (3) | Tangible common equity equals common equity less goodwill and net intangible assets as defined above. The Company views tangible common equity as a useful measure to investors because it is a commonly utilized metric and reflects the common equity deployed in the Company's businesses. |
| (4) | Leverage ratio equals total assets divided by tangible Morgan Stanley shareholders' equity. |
| (5) | The Tier 1 common ratio equals Tier 1 common equity divided by RWAs. The Company defines Tier 1 common equity as Tier 1 capital less qualifying perpetual preferred stock, qualifying trust preferred securities and qualifying restricted core capital elements, adjusted for the portion of goodwill and non-servicing assets associated with MSSB's non-controlling interests ( i.e. , Citi's share of MSSB's goodwill and intangibles). The Company views its definition of the Tier 1 common equity as a useful measure for investors as it reflects the actual ownership structure and economics of the joint venture. This definition of Tier 1 common equity differs from the Tier 1 common capital measure that was used by the federal bank regulatory agencies in the Supervisory Capital Assessment Program ("SCAP") conducted during the period February through April 2009. In SCAP, Tier 1 common capital was defined as Tier 1 capital less non-common elements, including qualifying perpetual preferred stock, qualifying minority interest in subsidiaries, and qualifying trust preferred securities. Accordingly, the SCAP measure would not be adjusted for the $4.5 billion portion of goodwill and non-servicing intangible assets associated with MSSB's non-controlling interests as though the Company had already acquired the remaining 49% interest in MSSB owned by Citi. For a discussion of RWAs and Tier 1 capital, see "Regulatory Requirements" herein. |
Balance Sheet and Funding Activity in 2009.
During 2009, the Company issued notes with a principal amount of approximately $44 billion, including non-U.S. dollar currency notes aggregating approximately $8 billion. In connection with the note issuances, the Company generally enters into certain transactions to obtain floating interest rates based primarily on short-term London Interbank Offered Rates ("LIBOR") trading levels. The weighted average maturity of the Company's long-term borrowings, based upon stated maturity dates, was approximately 5.6 years as of December 31, 2009. Subsequent to December 31, 2009 and through January 31, 2010, the Company's long-term borrowings (net of repayments) decreased by approximately $0.6 billion.
| 75 | |
As of December 31, 2009, the aggregate outstanding principal amount of the Company's senior indebtedness (as defined in the Company's senior debt indentures) was approximately $179 billion (including guaranteed obligations of the indebtedness of subsidiaries) compared with $172 billion as of December 31, 2008. The increase in the amount of senior indebtedness was primarily due to new issuances, partially offset by a decrease in commercial paper and other short-term borrowings.
Equity Capital-Related Transactions.
In June 2009, the Company repurchased the 10,000,000 shares of Series D Preferred Stock issued to the U.S. Treasury under the CPP at the liquidation preference amount plus accrued and unpaid dividends, for an aggregate repurchase price of $10,086 million.
In August 2009, under the terms of the CPP securities purchase agreement, the Company repurchased the Warrant from the U.S. Treasury for $950 million. The Warrant was previously issued to the U.S. Treasury for the purchase of 65,245,759 shares of the Company's common stock at an exercise price of $22.99 per share. The repayment of the Series D Preferred Stock in the amount of $10.0 billion, completed in June 2009, and the Warrant repurchase in the amount of $950 million reduced the Company's total equity by $10,950 million in 2009.
During 2009, the Company issued common stock for approximately $6.9 billion in two registered public offerings in May and June 2009. MUFG elected to participate in both offerings, and in one of the offerings, MUFG received $0.7 billion of common stock in exchange for 640,909 shares of the Company's Series C Preferred Stock.
See Note 13 to the consolidated financial statements for further discussion of these transactions.
Equity Capital Management Policies.
The Company's senior management views equity capital as an important source of financial strength. The Company actively manages its consolidated equity capital position based upon, among other things, business opportunities, capital availability and rates of return together with internal capital policies, regulatory requirements and rating agency guidelines and, therefore, in the future may expand or contract its equity capital base to address the changing needs of its businesses. The Company attempts to maintain total equity, on a consolidated basis, at least equal to the sum of its operating subsidiaries' equity.
As of December 31, 2009, the Company's equity capital (which includes shareholders' equity and junior subordinated debentures issued to capital trusts) was $57,282 million, a decrease of $1,783 million from December 31, 2008, primarily due to the repayment of the Series D Preferred Stock and the Warrant repurchase, partially offset by the Company's common stock offerings.
As of December 31, 2009, the Company had approximately $1.6 billion remaining under its current share repurchase program out of the $6 billion authorized by the Board in December 2006. The share repurchase program is for capital management purposes and considers, among other things, business segment capital needs as well as equity-based compensation and benefit plan requirements. Share repurchases by the Company are subject to regulatory approval. During 2009, the Company did not repurchase common stock as part of its capital management share repurchase program (see also "Market for Registrant's Common Equity, Related Stockholder Matters and Issuer Purchases of Equity Securities" in Part II, Item 5).
The Board determines the declaration and payment of dividends on a quarterly basis. In January 2010, the Company announced that its Board declared a quarterly dividend per common share of $0.05 (see Note 27 to the consolidated financial statements). The Company also announced that its Board declared a quarterly dividend of $255.56 per share of Series A Floating Rate Non-Cumulative Preferred Stock (represented by depositary shares, each representing 1/1,000th interest in a share of preferred stock and each having a dividend of $0.25556); a quarterly dividend of $25.00 per share of Series B Preferred Stock and a quarterly dividend of $25.00 per share of Series C Preferred Stock.
| | 76 |
Economic Capital.
The Company's economic capital framework estimates the amount of equity capital required to support the businesses over a wide range of market environments while simultaneously satisfying regulatory, rating agency and investor requirements. The framework continued to evolve over time in response to changes in the business and regulatory environment and to incorporate enhancements in modeling techniques.
Economic capital is assigned to each business segment and sub-allocated to product lines. Each business segment is capitalized as if it were an independent operating entity. This process is intended to align equity capital with the risks in each business in order to allow senior management to evaluate returns on a risk-adjusted basis (such as return on equity and shareholder value added).
Economic capital is based on regulatory capital plus additional capital for stress losses. The Company assesses stress loss capital across various dimensions of market, credit, business and operational risks. Economic capital requirements are met by regulatory Tier 1 capital. For a further discussion of the Company's Tier 1 capital, see "Regulatory Requirements" herein. The difference between the Company's Tier 1 capital and aggregate economic capital requirements denotes the Company's unallocated capital position.
The Company uses economic capital to allocate Tier 1 capital and common equity to its business segments. The following table presents the Company's allocated average Tier 1 capital and average common equity for 2009 and fiscal 2008:
| 2009 | Fiscal 2008 | |||||||||||
| Average Tier 1 Capital | Average Common Equity | Average Tier 1 Capital | Average Common Equity | |||||||||
| (dollars in billions) | ||||||||||||
Institutional Securities | $ | 23.6 | $ | 18.1 | $ | 25.8 | $ | 22.9 | ||||
Global Wealth Management Group | 2.7 | 4.6 | 1.7 | 1.5 | ||||||||
Asset Management | 2.5 | 2.2 | 3.0 | 3.0 | ||||||||
Unallocated capital | 18.3 | 8.1 | 6.6 | 4.9 | ||||||||
Total from continuing operations | 47.1 | 33.0 | 37.1 | 32.3 | ||||||||
Discontinued operations | 0.7 | 1.1 | 0.8 | 1.3 | ||||||||
Total | $ | 47.8 | $ | 34.1 | $ | 37.9 | $ | 33.6 | ||||
Average Tier 1 capital and common equity allocated to the Institutional Securities business segment decreased compared with fiscal 2008 driven by reductions in market and operational risk exposures. In addition, common equity allocated to the Institutional Securities business segment further decreased due to tightening of the Company's own credit spreads. Average Tier 1 capital and common equity allocated to the Global Wealth Management Group business segment increased from fiscal 2008 driven by higher operational risk associated with the addition of Smith Barney's business activities in connection with the MSSB transaction. Average common equity increases were also driven by the MSSB-related goodwill and intangibles. Average Tier 1 capital and common equity allocated to Asset Management decreased from fiscal 2008, primarily due to sales of the segment's investments.
The Company generally uses available unallocated capital for prospective regulatory requirements, organic growth, acquisitions and other capital needs while maintaining adequate capital ratios. For a discussion of risk-based capital ratios, see "Regulatory Requirements" herein.
Liquidity and Funding Management Policies.
The primary goal of the Company's liquidity management and funding activities is to ensure adequate funding over a wide range of market environments. Given the mix of the Company's business activities, funding requirements are fulfilled through a diversified range of secured and unsecured financing.
| 77 | |
The Company's liquidity and funding risk management policies are designed to mitigate the potential risk that the Company may be unable to access adequate financing to service its financial obligations without material franchise or business impact. The key objectives of the liquidity and funding risk management framework are to support the successful execution of the Company's business strategies while ensuring sufficient liquidity through the business cycle and during periods of stressed market conditions.
Liquidity Management Policies.
The principal elements of the Company's liquidity management framework are the Contingency Funding Plan ("CFP") and liquidity reserves. Comprehensive financing guidelines (secured funding, long-term funding strategy, surplus capacity, diversification and staggered maturities) support the Company's target liquidity profile.
Contingency Funding Plan. The CFP is the Company's primary liquidity risk management tool. The CFP models a potential, prolonged liquidity contraction over a one-year time period and sets forth a course of action to effectively manage a liquidity event. The CFP and liquidity risk exposures are evaluated on an ongoing basis and reported to the FRC, ALCO and other appropriate risk committees.
The Company's CFP model incorporates scenarios with a wide range of potential cash outflows during a range of liquidity stress events, including, but not limited to, the following: (i) repayment of all unsecured debt maturing within one year and no incremental unsecured debt issuance; (ii) maturity roll-off of outstanding letters of credit with no further issuance and replacement with cash collateral; (iii) return of unsecured securities borrowed and any cash raised against these securities; (iv) additional collateral that would be required by counterparties in the event of a multi-notch long-term credit ratings downgrade; (v) higher haircuts on or lower availability of secured funding; (vi) client cash withdrawals; (vii) drawdowns on unfunded commitments provided to third parties; and (viii) discretionary unsecured debt buybacks.
The CFP is produced on a parent and major subsidiary level to capture specific cash requirements and cash availability at various legal entities. The CFP assumes that the parent company does not have access to cash that may be held at certain subsidiaries due to regulatory, legal or tax constraints.
Liquidity Reserves. The Company seeks to maintain target liquidity reserves that are sized to cover daily funding needs and meet strategic liquidity targets as outlined in the CFP. These liquidity reserves are held in the form of cash deposits and pools of central bank eligible unencumbered securities. The parent company liquidity reserve is managed globally and consists of overnight cash deposits and unencumbered U.S. and European government bonds, agencies and agency pass-throughs. The Company believes that diversifying the form in which its liquidity reserves (cash and securities) are maintained enhances its ability to quickly and efficiently source funding in a stressed environment. The Company's funding requirements and target liquidity reserves may vary based on changes to the level and composition of its balance sheet, timing of specific transactions, client financing activity, market conditions and seasonal factors.
On December 31, 2009, the parent liquidity reserve was $64 billion, and the total Company liquidity reserve was $163 billion. The average parent liquidity reserve was $61 billion, and the average total Company liquidity reserve was $154 billion for 2009.
Capital Covenants.
In October 2006 and April 2007, the Company executed replacement capital covenants in connection with offerings by Morgan Stanley Capital Trust VII and Morgan Stanley Capital Trust VIII (the "Capital Securities"). Under the terms of the replacement capital covenants, the Company has agreed, for the benefit of certain specified holders of debt, to limitations on its ability to redeem or repurchase any of the Capital Securities for specified periods of time. For a complete description of the Capital Securities and the terms of the replacement capital covenants, see the Company's Current Reports on Form 8-K dated October 12, 2006 and April 26, 2007.
| | 78 |
Funding Management Policies.
The Company's funding management policies are designed to provide for financings that are executed in a manner that reduces the risk of disruption to the Company's operations. The Company pursues a strategy of diversification of secured and unsecured funding sources (by product, by investor and by region) and attempts to ensure that the tenor of the Company's liabilities equals or exceeds the expected holding period of the assets being financed. Maturities of financings are designed to manage exposure to refinancing risk in any one period.
The Company funds its balance sheet on a global basis through diverse sources. These sources may include the Company's equity capital, long-term debt, repurchase agreements, securities lending, deposits, commercial paper, letters of credit and lines of credit. The Company has active financing programs for both standard and structured products in the U.S., European and Asian markets, targeting global investors and currencies such as the U.S. dollar, euro, British pound, Australian dollar and Japanese yen.
Secured Financing. A substantial portion of the Company's total assets consists of liquid marketable securities and short-term receivables arising principally from its Institutional Securities sales and trading activities. The liquid nature of these assets provides the Company with flexibility in financing these assets with collateralized borrowings.
The Company's goal is to achieve an optimal mix of secured and unsecured funding through appropriate use of collateralized borrowings. The Institutional Securities business segment emphasizes the use of collateralized short-term borrowings to limit the growth of short-term unsecured funding, which is generally more subject to disruption during periods of financial stress. As part of this effort, the Institutional Securities business segment continually seeks to expand its global secured borrowing capacity.
In addition, the Company, through several of its subsidiaries, maintains committed credit facilities to support various businesses, including the collateralized commercial and residential mortgage whole loan, derivative contracts, warehouse lending, emerging market loan, structured product, corporate loan, investment banking and prime brokerage businesses.
The Company also had the ability to access liquidity from the Board of Governors of the Federal Reserve System (the "Fed") against collateral through a number of lending facilities. The Primary Dealer Credit Facility ("PDCF") and the Primary Credit Facility were available to provide daily access to funding for primary dealers and depository institutions, respectively. The Term Securities Lending Facility ("TSLF") and the Term Auction Facility were available to primary dealers and depository institutions, respectively, and allowed for the borrowing of longer term funding on a regular basis that was available at auction on pre-announced dates. The PDCF and TSLF expired on February 1, 2010.
Unsecured Financing. The Company views long-term debt and deposits as stable sources of funding for core inventories and illiquid assets. Securities inventories not financed by secured funding sources and the majority of current assets are financed with a combination of short-term funding, floating rate long-term debt or fixed rate long-term debt swapped to a floating rate and deposits. The Company uses derivative products (primarily interest rate, currency and equity swaps) to assist in asset and liability management and to hedge interest rate risk (see Note 11 to the consolidated financial statements).
Temporary Liquidity Guarantee Program ("TLGP"). In October 2008, the Secretary of the U.S. Treasury invoked the systemic risk exception of the FDIC Improvement Act of 1991, and the FDIC announced the TLGP.
Based on the Final Rule adopted on November 21, 2008, the TLGP provides a guarantee, through the earlier of maturity or June 30, 2012, of certain senior unsecured debt issued by participating Eligible Entities (including the Company) between October 14, 2008 and June 30, 2009. Effective March 23, 2009, the FDIC adopted an Interim Rule that extends the expiration of the FDIC guarantee on debt issued by certain issuers (including the Company) on or after April 1, 2009 to December 31, 2012. The maximum amount of FDIC-guaranteed debt a participating
| 79 | |
Eligible Entity (including the Company) may have outstanding is 125% of the entity's senior unsecured debt that was outstanding as of September 30, 2008 that was scheduled to mature on or before June 30, 2009. The ability of certain Eligible Entities (including the Company) to issue guaranteed debt under this program, under the Interim Rule described above, expired on October 31, 2009.
At December 31, 2009, the Company had $23.8 billion of senior unsecured debt outstanding under the TLGP. At December 31, 2008, the Company had commercial paper and long-term debt outstanding of $6.4 billion and $9.8 billion, respectively, under the TLGP. The weighted average rate at which the Company issued commercial paper and long-term debt, including TLGP fees, under the TLGP as of December 31, 2008 was 2.28% and 3.70%, respectively. The weighted average rate at which the Company issued long-term debt under TLGP in the first quarter of 2009, including TLGP fees was 2.80%. The Company did not issue any commercial paper under the program in the first quarter of 2009. The Company is unable to determine the benefit to operating results, if any, of issuing debt under the TLGP as there are no appropriate benchmarks due to the disruption in the debt capital markets at that time. There have been no issuances under the TLGP since March 31, 2009. See Note 9 to the consolidated financial statements for further information on commercial paper and long-term borrowings.
Short-Term Borrowings. The Company's unsecured short-term borrowings may consist of commercial paper, bank loans, bank notes and structured notes with maturities of 12 months or less at issuance.
The table below summarizes the Company's short-term unsecured borrowings:
| At December 31, 2009 | At December 31, 2008 | |||||
| (dollars in millions) | ||||||
Commercial paper | $ | 783 | $ | 7,388 | ||
Other short-term borrowings | 1,595 | 2,714 | ||||
Total | $ | 2,378 | $ | 10,102 | ||
Commercial Paper Funding Facility. During 2009, the Company had the ability to access the Commercial Paper Funding Facility ("CPFF") which provided a liquidity backstop to U.S. issuers of commercial paper through a special purpose vehicle that purchased three-month unsecured and asset-backed commercial paper directly from eligible issuers. The CPFF program expired on February 1, 2010. As of December 31, 2009, the Company had no commercial paper outstanding under the CPFF program. As of December 31, 2008, the Company had $4.3 billion outstanding under the CPFF program.
Deposits. The Company's bank subsidiaries' funding sources include bank deposit sweeps, repurchase agreements, federal funds purchased, certificates of deposit, money market deposit accounts, commercial paper and Federal Home Loan Bank advances.
Deposits were as follows:
| At December 31, 2009(1) | At December 31, 2008(1) | |||||
| (dollars in millions) | ||||||
Savings and demand deposits | $ | 57,114 | $ | 41,226 | ||
Time deposits(2) | 5,101 | 10,129 | ||||
Total | $ | 62,215 | $ | 51,355 | ||
| (1) | Total deposits insured by the FDIC at December 31, 2009 and December 31, 2008 were $46 billion and $47 billion, respectively. |
| (2) | Certain time deposit accounts are carried at fair value under the fair value option (see Note 4 to the consolidated financial statements). |
| | 80 |
On November 12, 2009, the FDIC Board of Directors adopted a final rule amending the assessment regulations to require insured depository institutions to prepay their estimated quarterly regular risk-based assessments for the fourth quarter of 2009, and for all of 2010, 2011 and 2012 (the prepayment period) on December 30, 2009, at the same time that institutions pay their regular quarterly deposit insurance assessments for the third quarter of 2009. The prepaid assessment is recorded as a prepaid expense (asset) as of December 30, 2009. As of December 31, 2009, and each quarter thereafter, the Company will record an expense (charge to earnings) for its regular quarterly assessment for the quarter and an offsetting credit to the prepaid assessment until the asset is exhausted.
On October 3, 2008, under the Emergency Economic Stabilization Act of 2008, the FDIC temporarily raised the basic limit on federal deposit insurance coverage from $100,000 to $250,000 per depositor. This increased coverage lasts through December 31, 2013 and is in effect for the Company's two U.S. depository institutions.
Additionally, under the Final Rule extending the Transaction Account Guarantee Program, the FDIC provides unlimited deposit insurance through June 30, 2010 for certain transaction accounts at FDIC-insured participating institutions. The Company has elected for its FDIC-insured subsidiaries to participate in the extension of the Transaction Account Guarantee Program.
Long-Term Borrowings. The Company uses a variety of long-term debt funding sources to generate liquidity, taking into consideration the results of the CFP requirements. In addition, the issuance of long-term debt allows the Company to reduce reliance on short-term credit sensitive instruments ( e.g. , commercial paper and other unsecured short-term borrowings). Financing transactions are generally structured to ensure staggered maturities, thereby mitigating refinancing risk, and to maximize investor diversification through sales to global institutional and retail clients. Availability and cost of financing to the Company can vary depending on market conditions, the volume of certain trading and lending activities, the Company's credit ratings and the overall availability of credit.
During 2009, the Company's long-term financing strategy was driven, in part, by its continued focus on improving its balance sheet strength (evaluated through enhanced capital and liquidity positions). As a result, for 2009, a principal amount of approximately $44 billion of unsecured debt was issued, including $30 billion of publicly issued senior unsecured notes not guaranteed by the FDIC.
The Company may from time to time engage in various transactions in the credit markets (including, for example, debt repurchases) that it believes are in the best interests of the Company and its investors. Maturities and debt repurchases during 2009 were approximately $33 billion in aggregate.
Long-term borrowings as of December 31, 2009 consisted of the following (dollars in millions):
| U.S. Dollar | Non-U.S. Dollar | At December 31, 2009 | |||||||
Due in 2010 | $ | 19,973 | $ | 6,115 | $ | 26,088 | |||
Due in 2011 | 17,386 | 9,424 | 26,810 | ||||||
Due in 2012 | 21,815 | 16,224 | 38,039 | ||||||
Due in 2013 | 3,378 | 21,642 | 25,020 | ||||||
Due in 2014 | 10,657 | 6,209 | 16,866 | ||||||
Thereafter | 39,181 | 21,370 | 60,551 | ||||||
Total | $ | 112,390 | $ | 80,984 | $ | 193,374 | |||
See Note 9 to the consolidated financial statements for further information on long-term borrowings.
Credit Ratings.
The Company relies on external sources to finance a significant portion of its day-to-day operations. The cost and availability of financing generally are dependent on the Company's short-term and long-term credit ratings. In
| 81 | |
addition, the Company's debt ratings can have a significant impact on certain trading revenues, particularly in those businesses where longer term counterparty performance is critical, such as OTC derivative transactions, including credit derivatives and interest rate swaps. Factors that are important to the determination of the Company's credit ratings include the level and quality of earnings, capital adequacy, liquidity, risk appetite and management, asset quality, business mix and perceived levels of government support.
In connection with certain OTC trading agreements and certain other agreements associated with the Institutional Securities business segment, the Company may be required to provide additional collateral or immediately settle any outstanding liability balances with certain counterparties in the event of a credit rating downgrade. As of December 31, 2009, the amount of additional collateral or termination payments that could be called by counterparties under the terms of such agreements in the event of a one-notch downgrade of the Company's long-term credit rating was approximately $1,405 million. A total of approximately $2,523 million in collateral or termination payments could be called in the event of a two-notch downgrade. A total of approximately $3,417 million in collateral or termination payments could be called in the event of a three-notch downgrade.
As of January 31, 2010, the Company's and Morgan Stanley Bank, N.A.'s senior unsecured ratings were as set forth below:
| Company | Morgan Stanley Bank, N.A. | |||||||||||
| Short-Term Debt | Long-Term Debt | Rating Outlook | Short-Term Debt | Long-Term Debt | Rating Outlook | |||||||
Dominion Bond Rating Service Limited | R-1 (middle) | A (high) | Negative | - | - | - | ||||||
Fitch Ratings | F1 | A | Stable | F1 | A+ | Stable | ||||||
Moody's Investors Service | P-1 | A2 | Negative | P-1 | A1 | Negative | ||||||
Rating and Investment Information, Inc. | a-1 | A+ | Negative | - | - | - | ||||||
Standard & Poor's | A-1 | A | Negative | A-1 | A+ | Negative | ||||||
Off-Balance Sheet Arrangements with Unconsolidated Entities.
The Company enters into various arrangements with unconsolidated entities, including variable interest entities, primarily in connection with its Institutional Securities business segment.
Institutional Securities Activities . The Company utilizes SPEs primarily in connection with securitization activities. The Company engages in securitization activities related to commercial and residential mortgage loans, U.S. agency collateralized mortgage obligations, corporate bonds and loans, municipal bonds and other types of financial assets. The Company may retain interests in the securitized financial assets as one or more tranches of the securitization. These retained interests are included in the consolidated statements of financial condition at fair value. Any changes in the fair value of such retained interests are recognized in the consolidated statements of income. Retained interests in securitized financial assets were approximately $2.0 billion and $1.2 billion at December 31, 2009 and December 31, 2008, respectively, substantially all of which were related to U.S. agency collateralized mortgage obligations, commercial mortgage loan and residential mortgage loan securitization transactions. For further information about the Company's securitization activities, see Notes 2 and 6 to the consolidated financial statements.
The Company has entered into liquidity facilities with SPEs and other counterparties, whereby the Company is required to make certain payments if losses or defaults occur. The Company often may have recourse to the underlying assets held by the SPEs in the event payments are required under such liquidity facilities (see Note 11 to the consolidated financial statements).
Guarantees. Accounting guidance for guarantees requires the Company to disclose information about its obligations under certain guarantee arrangements. The FASB defines guarantees as contracts and indemnification agreements that contingently require a guarantor to make payments to the guaranteed party based on changes in
| | 82 |
an underlying measure (such as an interest or foreign exchange rate, a security or commodity price, an index, or the occurrence or non-occurrence of a specified event) related to an asset, liability or equity security of a guaranteed party. The FASB also defines guarantees as contracts that contingently require the guarantor to make payments to the guaranteed party based on another entity's failure to perform under an agreement as well as indirect guarantees of the indebtedness of others.
The table below summarizes certain information regarding the Company's obligations under guarantee arrangements as of December 31, 2009:
Type of Guarantee | Maximum Potential Payout/Notional | Carrying Amount (Asset)/ Liability | Collateral/ Recourse | |||||||||||||||||||
| Years to Maturity | ||||||||||||||||||||||
| Less than 1 | 1-3 | 3-5 | Over 5 | Total | ||||||||||||||||||
| (dollars in millions) | ||||||||||||||||||||||
Credit derivative contracts(1) | $ | 261,354 | $ | 768,194 | $ | 850,116 | $ | 567,361 | $ | 2,447,025 | $ | 43,621 | $ | - | ||||||||
Other credit contracts | - | 51 | 24 | 1,089 | 1,164 | 1,118 | - | |||||||||||||||
Credit-linked notes | 160 | 74 | 337 | 668 | 1,239 | (335 | ) | - | ||||||||||||||
Non-credit derivative contracts(1)(2) | 637,688 | 340,280 | 142,700 | 232,210 | 1,352,878 | 70,314 | - | |||||||||||||||
Standby letters of credit and other financial guarantees issued(3)(4) | 982 | 3,134 | 1,126 | 4,886 | 10,128 | 976 | 5,324 | |||||||||||||||
Market value guarantees | - | - | - | 775 | 775 | 45 | 126 | |||||||||||||||
Liquidity facilities | 4,402 | - | 307 | 143 | 4,852 | 24 | 6,264 | |||||||||||||||
Whole loan sales guarantees | - | - | - | 42,380 | 42,380 | 81 | - | |||||||||||||||
General partner guarantees | 195 | 55 | 101 | 131 | 482 | 95 | - | |||||||||||||||
| (1) | Carrying amounts of derivative contracts are shown on a gross basis prior to cash collateral or counterparty netting. For further information on derivative contracts, see Note 10 to the consolidated financial statements. |
| (2) | Amounts include a guarantee to investors in undivided participating interests in claims the Company made against a derivative counterparty that filed for bankruptcy protection. To the extent, in the future, any portion of the claims is disallowed or reduced by the bankruptcy court in excess of a certain amount, then the Company must refund a portion of the purchase price plus interest. For further information, see Note 16 to the consolidated financial statements. |
| (3) | Approximately $2.0 billion of standby letters of credit are also reflected in the "Commitments" table in primary and secondary lending commitments. Standby letters of credit are recorded at fair value within Financial instruments owned or Financial instruments sold, not yet purchased in the consolidated statements of financial condition. |
| (4) | Amounts include guarantees issued by consolidated real estate funds sponsored by the Company of approximately $2.0 billion. These guarantees relate to obligations of the fund's investee entities, including guarantees related to capital expenditures and principal and interest debt payments. Accrued losses under these guarantees of approximately $1.1 billion are reflected as a reduction of the carrying value of the related fund investments, which are reflected in Financial instruments owned-investments on the consolidated statement of financial condition. |
| 83 | |
The table below summarizes certain information regarding the Company's obligations under guarantee arrangements as of December 31, 2008:
Type of Guarantee | Maximum Potential Payout/Notional | Carrying Amount (Asset)/ Liability | Collateral/ Recourse | |||||||||||||||||||
| Years to Maturity | ||||||||||||||||||||||
| Less than 1 | 1-3 | 3-5 | Over 5 | Total | ||||||||||||||||||
| (dollars in millions) | ||||||||||||||||||||||
Credit derivative contracts(1) | $ | 225,742 | $ | 778,266 | $ | 1,593,218 | $ | 989,207 | $ | 3,586,433 | $ | 427,338 | $ | - | ||||||||
Other credit contracts | 53 | 43 | 188 | 3,014 | 3,298 | 3,379 | - | |||||||||||||||
Credit-linked notes | 207 | 486 | 326 | 640 | 1,659 | (242 | ) | - | ||||||||||||||
Non-credit derivative contracts(1) | 684,432 | 385,734 | 195,419 | 274,652 | 1,540,237 | 145,609 | - | |||||||||||||||
Standby letters of credit and other financial guarantees issued | 779 | 1,964 | 1,817 | 4,418 | 8,978 | 78 | 4,787 | |||||||||||||||
Market value guarantees | - | - | - | 645 | 645 | 36 | 134 | |||||||||||||||
Liquidity facilities | 3,152 | 698 | 188 | 376 | 4,414 | 25 | 3,741 | |||||||||||||||
Whole loan sales guarantees | - | - | - | 42,045 | 42,045 | - | - | |||||||||||||||
General partner guarantees | 54 | 198 | 33 | 150 | 435 | 29 | - | |||||||||||||||
Auction rate security guarantees | 1,747 | - | - | - | 1,747 | 40 | - | |||||||||||||||
| (1) | Carrying amounts of derivative contracts are shown on a gross basis prior to cash collateral or counterparty netting. For further information on derivative contracts, see Note 10 to the consolidated financial statements. |
In the ordinary course of business, the Company guarantees the debt and/or certain trading obligations (including obligations associated with derivatives, foreign exchange contracts and the settlement of physical commodities) of certain subsidiaries. These guarantees generally are entity or product specific and are required by investors or trading counterparties. The activities of the subsidiaries covered by these guarantees (including any related debt or trading obligations) are included in the Company's consolidated financial statements.
See Note 11 to the consolidated financial statements for information on trust preferred securities, indemnities, exchange/clearinghouse member guarantees, general partner guarantees, securitized asset guarantees and other guarantees.
| | 84 |
Commitments and Contractual Obligations.
The Company's commitments associated with outstanding letters of credit and other financial guarantees obtained to satisfy collateral requirements, investment activities, corporate lending and financing arrangements, mortgage lending and margin lending as of December 31, 2009 are summarized below by period of expiration. Since commitments associated with these instruments may expire unused, the amounts shown do not necessarily reflect the actual future cash funding requirements:
| Years to Maturity | Total at December 31, 2009 | ||||||||||||||
| Less than 1 | 1-3 | 3-5 | Over 5 | ||||||||||||
| (dollars in millions) | |||||||||||||||
Letters of credit and other financial guarantees obtained to satisfy collateral requirements | $ | 1,043 | $ | 1 | $ | 1 | $ | 52 | $ | 1,097 | |||||
Investment activities | 1,013 | 883 | 199 | 83 | 2,178 | ||||||||||
Primary lending commitments-investment grade(1)(2) | 10,146 | 26,378 | 4,033 | 154 | 40,711 | ||||||||||
Primary lending commitments-non-investment grade(1) | 344 | 4,193 | 2,515 | 124 | 7,176 | ||||||||||
Secondary lending commitments(1) | 18 | 107 | 121 | 97 | 343 | ||||||||||
Commitments for secured lending transactions | 683 | 1,415 | 114 | - | 2,212 | ||||||||||
Forward starting reverse repurchase agreements(3) | 30,104 | 101 | - | - | 30,205 | ||||||||||
Commercial and residential mortgage-related commitments(1) | 1,485 | - | - | - | 1,485 | ||||||||||
Other commitments(4) | 289 | 1 | 150 | - | 440 | ||||||||||
Total | $ | 45,125 | $ | 33,079 | $ | 7,133 | $ | 510 | $ | 85,847 | |||||
| (1) | These commitments are recorded at fair value within Financial instruments owned and Financial instruments sold, not yet purchased in the consolidated statements of financial condition (see Note 4 to the consolidated financial statements). |
| (2) | This amount includes commitments to asset-backed commercial paper conduits of $276 million as of December 31, 2009, of which $268 million have maturities of less than one year and $8 million of which have maturities of one to three years. |
| (3) | The Company enters into forward starting securities purchased under agreements to resell (agreements that have a trade date as of or prior to December 31, 2009 and settle subsequent to period-end). These agreements primarily settle within three business days and as of December 31, 2009, $26.6 billion of the $30.2 billion settled within three business days. |
| (4) | Amount includes a $200 million lending facility to a real estate fund sponsored by the Company. |
For further description of these commitments, see Note 11 to the consolidated financial statements and "Quantitative and Qualitative Disclosures about Market Risk-Credit Risk" in Part II, Item 7A.
In the normal course of business, the Company enters into various contractual obligations that may require future cash payments. Contractual obligations include long-term borrowings, contractual interest payments, operating leases and purchase obligations. The Company's future cash payments associated with its obligations as of December 31, 2009 are summarized below:
At December 31, 2009 | Payments Due in: | ||||||||||||||
| 2010 | 2011-2012 | 2013-2014 | Thereafter | Total | |||||||||||
| (dollars in millions) | |||||||||||||||
Long-term borrowings(1) | $ | 26,088 | $ | 64,849 | $ | 41,886 | $ | 60,551 | $ | 193,374 | |||||
Contractual interest payments(2) | 6,344 | 10,071 | 7,279 | 18,015 | 41,709 | ||||||||||
Operating leases-office facilities(3) | 683 | 1,242 | 906 | 2,701 | 5,532 | ||||||||||
Operating leases-equipment(3) | 514 | 279 | 109 | 136 | 1,038 | ||||||||||
Purchase obligations(4) | 408 | 271 | 119 | 98 | 896 | ||||||||||
Pension and postretirement plans-expected contribution(5) | 275 | - | - | - | 275 | ||||||||||
Total(6) | $ | 34,312 | $ | 76,712 | $ | 50,299 | $ | 81,501 | $ | 242,824 | |||||
| (1) | See Note 9 to the consolidated financial statements. |
| 85 | |
| (2) | Amounts represent estimated future contractual interest payments related to unsecured long-term borrowings and secured long-term financings based on applicable interest rates as of December 31, 2009. Includes stated coupon rates, if any, on structured or index-linked notes. |
| (3) | See Note 11 to the consolidated financial statements. |
| (4) | Purchase obligations for goods and services include payments for, among other things, consulting, outsourcing, advertising, sponsorship, computer and telecommunications maintenance agreements, and certain license agreements related to MSSB. Purchase obligations as of December 31, 2009 reflect the minimum contractual obligation under legally enforceable contracts with contract terms that are both fixed and determinable. These amounts exclude obligations for goods and services that already have been incurred and are reflected on the Company's consolidated statement of financial condition. |
| (5) | See Note 19 to the consolidated financial statements. |
| (6) | Amounts exclude unrecognized tax benefits, as the timing and amount of future cash payments are not determinable at this time (see Note 20 to the consolidated financial statements for further information). |
Regulatory Requirements.
In September 2008, the Company became a financial holding company under the Bank Holding Company Act subject to the regulation and oversight of the Fed. The Fed establishes capital requirements for the Company, including well-capitalized standards, and evaluates the Company's compliance with such capital requirements (see "Supervision and Regulation-Financial Holding Company" in Part I, Item 1). The Office of the Comptroller of the Currency and the Office of Thrift Supervision establish similar capital requirements and standards for the Company's national banks and federal savings bank, respectively.
The Company calculates its capital ratios and RWAs in accordance with the capital adequacy standards for financial holding companies adopted by the Fed. These standards are based upon a framework described in the "International Convergence of Capital Measurement and Capital Standards," July 1988, as amended, also referred to as Basel I. In December 2007, the U.S. banking regulators published a final Basel II Accord that requires internationally active banking organizations, as well as certain of its U.S. bank subsidiaries, to implement Basel II standards over the next several years. The Company will be required to implement these Basel II standards as a result of becoming a financial holding company.
As of December 31, 2009, the Company was in compliance with Basel I capital requirements with ratios of Tier 1 capital to RWAs of 15.3% and total capital to RWAs of 16.4% (6% and 10% being well-capitalized for regulatory purposes, respectively). In addition, financial holding companies are also subject to a Tier 1 leverage ratio as defined by the Fed. The Company calculated its Tier 1 leverage ratio as Tier 1 capital divided by adjusted average total assets (which reflects adjustments for disallowed goodwill, certain intangible assets and deferred tax assets). The adjusted average total assets are derived using weekly balances for the calendar quarter. This ratio as of December 31, 2009 was 5.8%.
| | 86 |
The following table reconciles the Company's total shareholders' equity to Tier 1 and Total Capital as defined by the regulations issued by the Fed and presents the Company's consolidated capital ratios at December 31, 2009 (dollars in millions):
| At December 31, 2009 | ||||
| (dollars in millions) | ||||
Allowable capital | ||||
Tier 1 capital: | ||||
Common shareholders' equity | $ | 37,091 | ||
Qualifying preferred stock | 9,597 | |||
Qualifying mandatorily convertible trust preferred securities | 5,730 | |||
Qualifying restricted core capital elements | 10,867 | |||
Less: Goodwill | (7,162 | ) | ||
Less: Non-servicing intangible assets | (4,931 | ) | ||
Less: Net deferred tax assets | (3,242 | ) | ||
Less: Debt valuation adjustment | (554 | ) | ||
Other deductions | (726 | ) | ||
Total Tier 1 capital | 46,670 | |||
Tier 2 capital: | ||||
Other components of allowable capital: | ||||
Qualifying subordinated debt | 3,127 | |||
Other qualifying amounts | 158 | |||
Total Tier 2 capital | 3,285 | |||
Total allowable capital | $ | 49,955 | ||
Total risk-weighted assets | $ | 305,000 | ||
Capital ratios | ||||
Total capital ratio | 16.4 | % | ||
Tier 1 capital ratio | 15.3 | % | ||
Total allowable capital is composed of Tier 1 and Tier 2 capital. Tier 1 capital consists predominately of common shareholders' equity as well as qualifying preferred stock, trust preferred securities mandatorily convertible to common equity and qualifying restricted core capital elements (including other junior subordinated debt issued to trusts and non-controlling interests) less goodwill, non-servicing intangible assets (excluding allowable mortgage servicing rights), net deferred tax assets (recoverable in excess of one year) and DVA. DVA represents the cumulative change in fair value of certain of the Company's borrowings (for which the fair value option was elected) that was attributable to changes in the Company's own instrument-specific credit spreads and is included in retained earnings. For a further discussion of fair value, see Note 4 to the consolidated financial statements. Tier 2 capital consists principally of qualifying subordinated debt.
As of December 31, 2009, the Company calculated its RWAs in accordance with the regulatory capital requirements of the Fed, which is consistent with guidelines described under Basel I. RWAs reflect both on and off-balance sheet risk of the Company. The risk capital calculations will evolve over time as the Company enhances its risk management methodology and incorporates improvements in modeling techniques while maintaining compliance with the regulatory requirements and interpretations.
Market RWAs reflect capital charges attributable to the risk of loss resulting from adverse changes in market prices and other factors. For a further discussion of the Company's market risks and Value-at-Risk ("VaR") model, see "Quantitative and Qualitative Disclosures about Market Risk-Risk Management" in Part II, Item 7A herein. Market RWAs incorporate three components: systematic risk, specific risk, and incremental default risk
| 87 | |
("IDR"). Systematic and specific risk charges are computed using either a Standardized Approach (applying a fixed percentage to the fair value of the assets) or the Company's VaR model. Capital charges related to IDR are calculated using an IDR model that estimates the loss due to sudden default events affecting traded financial instruments at a 99.9% confidence level. The Company received permission from the Fed for the use of its market risk models through calendar year 2009 while undergoing the Fed's review. Based on the final outcome of that review, the capital ratios may be lower or higher in 2010.
Credit RWAs reflect capital charges attributable to the risk of loss arising from a borrower or counterparty failing to meet its financial obligations. For a further discussion of the Company's credit risks, see "Quantitative and Qualitative Disclosures about Market Risk-Credit Risk" in Part II, Item 7A, herein. Credit RWAs are determined using Basel I regulatory capital guidelines for U.S. banking organizations issued by the Fed.
Effects of Inflation and Changes in Foreign Exchange Rates.
The Company's assets to a large extent are liquid in nature and, therefore, are not significantly affected by inflation, although inflation may result in increases in the Company's expenses, which may not be readily recoverable in the price of services offered. To the extent inflation results in rising interest rates and has other adverse effects upon the securities markets and upon the value of financial instruments, it may adversely affect the Company's financial position and profitability.
A significant portion of the Company's business is conducted in currencies other than the U.S. dollar, and changes in foreign exchange rates relative to the U.S. dollar can therefore affect the value of non-U.S. dollar net assets, revenues and expenses. Potential exposures as a result of these fluctuations in currencies are closely monitored, and, where cost-justified, strategies are adopted that are designed to reduce the impact of these fluctuations on the Company's financial performance. These strategies may include the financing of non-U.S. dollar assets with direct or swap-based borrowings in the same currency and the use of currency forward contracts or the spot market in various hedging transactions related to net assets, revenues, expenses or cash flows.
| | 88 |
Item 7A. Quantitative and Qualitative Disclosures about Market Risk.
Risk Management.
Risk Management Policy and Control Structure.
Risk is an inherent part of the Company's business and activities. The Company has policies and procedures in place for measuring, monitoring and managing each of the various types of significant risks involved in the activities of its Institutional Securities, Global Wealth Management Group and Asset Management business segments and support functions as well as at the holding company level. The Company's ability to properly and effectively identify, assess, monitor and manage each of the various types of risk involved in its activities is critical to its soundness and profitability. The Company's portfolio of business activities helps reduce the impact that volatility in any particular area or related areas may have on its net revenues as a whole. The Company seeks to identify, assess, monitor and manage, in accordance with defined policies and procedures, the following principal risks involved in the Company's business activities: market, credit, capital and liquidity, operational and compliance and legal risk. Capital and liquidity risk is discussed in "Management's Discussion and Analysis of Financial Condition and Results of Operations-Liquidity and Capital Resources" in Part II, Item 7. The Company's currency exposure relating to its net monetary investments in non-U.S. dollar functional currency subsidiaries is discussed in Note 13 to the consolidated financial statements.
The cornerstone of the Company's risk management philosophy is the execution of risk-adjusted returns through prudent risk-taking that protects the Company's capital base and franchise. The Company's risk management philosophy is based on the following principles: comprehensiveness, independence, accountability, defined risk tolerance and transparency. Given the importance of effective risk management to the Company's reputation, senior management requires thorough and frequent communication and appropriate escalation of risk matters.
Risk management at the Company requires independent Company-level oversight, accountability of the Company's business segments, constant communication, judgment, and knowledge of specialized products and markets. The Company's senior management takes an active role in the identification, assessment and management of various risks at both the Company and business segments level. In recognition of the increasingly varied and complex nature of the global financial services business, the Company's risk management philosophy, with its attendant policies, procedures and methodologies, is evolutionary in nature and subject to ongoing review and modification.
The nature of the Company's risks, coupled with this risk management philosophy, informs the Company's risk governance structure. The Company's risk governance structure includes the Board; the Audit Committee and the Risk Committee of the Board; the FRC; senior management oversight, including the Chief Executive Officer, the Chief Risk Officer, the Chief Financial Officer, the Chief Legal Officer and the Chief Compliance Officer; the Internal Audit Department; independent risk management functions (including the Market Risk Department, Credit Risk Management, the Corporate Treasury Department and the Operational Risk Department) and Company control groups (including the Human Resources Department, the Legal and Compliance Division, the Tax Department and the Financial Control Group), and various other risk control managers, committees and groups located within and across the Company's business segments.
The Board has oversight for the Company's enterprise risk management framework and is responsible for helping to ensure that the Company's risks are managed in a sound manner. Historically, the Board had authorized the Audit Committee, which is comprised solely of independent directors, to oversee risk management. Effective January 1, 2010, the Board established another standing committee, the Risk Committee, which is comprised solely of non-management directors, to assist the Board in the oversight of (i) the Company's risk governance structure, (ii) the Company's risk management and risk assessment guidelines and policies regarding market, credit and liquidity and funding risk, (iii) the Company's risk tolerance and (iv) the
| 89 | |
performance of the Chief Risk Officer. The Audit Committee continues to review the major operational, franchise, reputational, legal and compliance risk exposures of the Company and the steps management has taken to monitor and control such exposure. The Risk Committee, Audit Committee and Chief Risk Officer report to the full Board on a regular basis.
The Board has also authorized the FRC, a management committee appointed and chaired by the Chief Executive Officer that includes the most senior officers of the Company, including the Chief Risk Officer, Chief Legal Officer and Chief Financial Officer, to oversee the Company's global risk management structure. The FRC's responsibilities include oversight of the Company's risk management principles, procedures and limits, and the monitoring of capital levels and material market, credit, liquidity and funding, legal, operational, franchise and regulatory risk matters and other risks, as appropriate, and the steps management has taken to monitor and manage such risks. The FRC reports to the full Board, the Audit Committee and the Risk Committee through the Company's Chief Risk Officer.
The Chief Risk Officer, a member of the FRC who reports to the Chief Executive Officer, oversees compliance with Company risk limits; approves certain excessions of Company risk limits; reviews material market, credit and operational risks; and reviews results of risk management processes with the Board, the Audit Committee and the Risk Committee, as appropriate.
The Internal Audit Department provides independent risk and control assessment and reports to the Audit Committee and administratively to the Chief Legal Officer. The Internal Audit Department examines the Company's operational and control environment and conducts audits designed to cover all major risk categories.
The risk management functions and the Company control groups are independent of the Company's business units, assist senior management and the FRC in monitoring and controlling the Company's risk through a number of control processes. The Company is committed to employing qualified personnel with appropriate expertise in each of its various administrative and business areas to implement effectively the Company's risk management and monitoring systems and processes.
Each business segment has a risk committee that is responsible for helping to ensure that the business segment, as applicable, adheres to established limits for market, credit, operational and other risks; implements risk measurement, monitoring, and management policies and procedures that are consistent with the risk framework established by the FRC; and reviews, on a periodic basis, its aggregate risk exposures, risk exception experience, and the efficacy of its risk identification, measurement, monitoring and management policies and procedures, and related controls.
Each of the Company's business segments also has designated operations officers, committees and groups to manage and monitor specific risks and report to the business segment risk committee. The Company control groups work with business segment control groups (including the Operations Division and Information Technology Division) to review the risk monitoring and risk management policies and procedures relating to, among other things, the business segment's market, credit and operational risk profile, sales practices, reputation, legal enforceability, and operational and technological risks. Participation by the senior officers of the Company and business segment control groups helps ensure that risk policies and procedures, exceptions to risk limits, new products and business ventures, and transactions with risk elements undergo a thorough review.
The following is a discussion of the Company's risk management policies and procedures for its principal risks (other than capital and liquidity risk). The discussion focuses on the Company's securities activities (primarily its institutional trading activities) and corporate lending and related activities. The Company believes that these activities generate a substantial portion of its principal risks. This discussion and the estimated amounts of the Company's market risk exposure generated by the Company's statistical analyses are forward-looking statements. However, the analyses used to assess such risks are not predictions of future events, and actual results may vary significantly from such analyses due to events in the markets in which the Company operates and certain other factors described below.
| | 90 |
Market Risk.
Market risk refers to the risk that a change in the level of one or more market prices, rates, indices, implied volatilities (the price volatility of the underlying instrument imputed from option prices), correlations or other market factors, such as market liquidity, will result in losses for a position or portfolio. Generally, the Company incurs market risk as a result of trading and client facilitation activities, principally within the Institutional Securities business where the substantial majority of the Company's VaR for market risk exposures is generated. In addition, the Company incurs trading-related market risk within the Global Wealth Management Group. Asset Management incurs non-trading market risk primarily from capital investments in real estate funds and investments in private equity vehicles.
Sound market risk management is an integral part of the Company's culture. The various business units and trading desks are responsible for ensuring that market risk exposures are well-managed and prudent. The control groups help ensure that these risks are measured and closely monitored and are made transparent to senior management. The Market Risk Department is responsible for ensuring transparency of material market risks, monitoring compliance with established limits, and escalating risk concentrations to appropriate senior management. To execute these responsibilities, the Market Risk Department monitors the Company's risk against limits on aggregate risk exposures, performs a variety of risk analyses, routinely reports risk summaries, and maintains the Company's VaR system. Limits are designed to control price and market liquidity risk. Market risk is monitored through various measures: statistically (using VaR and related analytical measures); by measures of position sensitivity; and through routine stress testing and scenario analyses conducted by the Market Risk Department in collaboration with the business units. The material risks identified by these processes are summarized in reports produced by the Market Risk Department that are circulated to and discussed with senior management, the Risk Committee and the Board.
Risk and Capital Management Initiatives.
During 2009, the Company continued to enhance its market risk management framework to address the severe stresses observed in global markets during the recent economic downturn (see "Executive Summary-Global Market and Economic Conditions in Fiscal 2009" Part II, Item 7, herein). The Company expanded and improved its risk measurement processes, including stress tests and scenario analysis, and refined its market risk limit framework. In conjunction with these risk measurement enhancements, a proprietary methodology called Stress VaR ("S-VaR") was developed to comprehensively measure the Company's market and credit risks. S-VaR simulates many stress scenarios based on more than 25 years of historical data and attempts to capture the different liquidities of various types of general and specific risks, as well as event and default risks particularly relevant for credit portfolios. S-VaR, while still evolving, is becoming an important metric for the Company's risk appetite assessment and its capital allocation framework.
Sales and Trading and Related Activities.
Primary Market Risk Exposures and Market Risk Management. During 2009, the Company had exposures to a wide range of interest rates, equity prices, foreign exchange rates and commodity prices-and the associated implied volatilities and spreads-related to the global markets in which it conducts its trading activities.
The Company is exposed to interest rate and credit spread risk as a result of its market-making activities and other trading in interest rate sensitive financial instruments ( e.g., risk arising from changes in the level or implied volatility of interest rates, the timing of mortgage prepayments, the shape of the yield curve and credit spreads). The activities from which those exposures arise and the markets in which the Company is active include, but are not limited to, the following: emerging market corporate and government debt, non-investment grade and distressed corporate debt, investment grade corporate debt and asset-backed debt (including mortgage-related securities).
The Company is exposed to equity price and implied volatility risk as a result of making markets in equity securities and derivatives and maintaining other positions (including positions in non-public entities). Positions in
| 91 | |
non-public entities may include, but are not limited to, exposures to private equity, venture capital, private partnerships, real estate funds and other funds. Such positions are less liquid, have longer investment horizons and are more difficult to hedge than listed equities.
The Company is exposed to foreign exchange rate and implied volatility risk as a result of making markets in foreign currencies and foreign currency derivatives, from maintaining foreign exchange positions and from holding non-U.S. dollar-denominated financial instruments. The Company is exposed to commodity price and implied volatility risk as a result of market-making activities and maintaining positions in physical commodities (such as crude and refined oil products, natural gas, electricity, and precious and base metals) and related derivatives. Commodity exposures are subject to periods of high price volatility as a result of changes in supply and demand. These changes can be caused by weather conditions; physical production, transportation and storage issues; or geopolitical and other events that affect the available supply and level of demand for these commodities.
The Company manages its trading positions by employing a variety of risk mitigation strategies. These strategies include diversification of risk exposures and hedging. Hedging activities consist of the purchase or sale of positions in related securities and financial instruments, including a variety of derivative products ( e.g. , futures, forwards, swaps and options). Hedging activities may not always provide effective mitigation against trading losses due to differences in the terms, specific characteristics or other basis risks that may exist between the hedge instrument and the risk exposure that is being hedged. The Company manages the market risk associated with its trading activities on a Company-wide basis, on a worldwide trading division level and on an individual product basis. The Company manages and monitors its market risk exposures in such a way as to maintain a portfolio that the Company believes is well-diversified in the aggregate with respect to market risk factors and that reflects the Company's aggregate risk tolerance as established by the Company's senior management.
Aggregate market risk limits have been approved for the Company and for its major trading divisions worldwide (equity and fixed income, which includes interest rate products, credit products, foreign exchange and commodities). Additional market risk limits are assigned to trading desks and, as appropriate, products and regions. Trading division risk managers, desk risk managers, traders and the Market Risk Department monitor market risk measures against limits in accordance with policies set by senior management.
The Market Risk Department independently reviews the Company's trading portfolios on a regular basis from a market risk perspective utilizing VaR and other quantitative and qualitative risk measures and analyses. The Company's trading businesses and the Market Risk Department also use, as appropriate, measures such as sensitivity to changes in interest rates, prices, implied volatilities and time decay to monitor and report market risk exposures.
Net exposure, defined as the potential loss to the Company over a period of time in the event of default of a referenced asset, assuming zero recovery, is one key risk measure the Company employs to standardize the aggregation of market risk exposures across cash and derivative products. Stress testing, which measures the impact on the value of existing portfolios of specified changes in market factors for certain products, is performed periodically and is reviewed by trading division risk managers, desk risk managers and the Market Risk Department.
VaR . The Company uses the statistical technique known as VaR as one of the tools used to measure, monitor and review the market risk exposures of its trading portfolios. The Market Risk Department calculates and distributes daily VaR-based risk measures to various levels of management.
VaR Methodology, Assumptions and Limitations . The Company estimates VaR using a model based on historical simulation for major market risk factors and Monte Carlo simulation for name-specific risk in certain equity and fixed income exposures. Historical simulation involves constructing a distribution of hypothetical daily changes in the value of trading portfolios based on two sets of inputs: historical observation of daily
| | 92 |
changes in key market indices or other market factors ("market risk factors"); and information on the sensitivity of the portfolio values to these market risk factor changes. The Company's VaR model uses four years of historical data to characterize potential changes in market risk factors. The Company's 95%/one-day VaR corresponds to the unrealized loss in portfolio value that, based on historically observed market risk factor movements, would have been exceeded with a frequency of 5%, or five times in every 100 trading days, if the portfolio were held constant for one day.
The Company's VaR model generally takes into account linear and non-linear exposures to price risk, interest rate risk and credit spread risk and linear exposures to implied volatility risks. Market risks that are incorporated in the VaR model include equity and commodity prices, interest rates, credit spreads, foreign exchange rates and associated implied volatilities. The VaR model also captures certain correlation risks associated with portfolio credit derivatives, as well as certain basis risks between corporate debt and related credit derivatives. As a supplement to the use of historical simulation for major market risk factors, the Company's VaR model uses Monte Carlo simulation to capture name-specific risk in equities and credit products ( i.e. , corporate bonds, loans and credit derivatives).
The Company's VaR models evolve over time in response to changes in the composition of trading portfolios and to improvements in modeling techniques and systems capabilities. The Company is committed to continuous review and enhancement of VaR methodologies and assumptions in order to capture evolving risks associated with changes in market structure and dynamics. As part of regular process improvement, additional systematic and name-specific risk factors may be added to improve the VaR model's ability to more accurately estimate risks to specific asset classes or industry sectors.
Among their benefits, VaR models permit estimation of a portfolio's aggregate market risk exposure, incorporating a range of varied market risks; reflect risk reduction due to portfolio diversification or hedging activities; and can cover a wide range of portfolio assets. However, VaR risk measures should be interpreted carefully in light of the methodology's limitations, which include the following: past changes in market risk factors may not always yield accurate predictions of the distributions and correlations of future market movements; changes in portfolio value in response to market movements (especially for complex derivative portfolios) may differ from the responses calculated by a VaR model; VaR using a one-day time horizon does not fully capture the market risk of positions that cannot be liquidated or hedged within one day; the historical market risk factor data used for VaR estimation may provide only limited insight into losses that could be incurred under market conditions that are unusual relative to the historical period used in estimating the VaR; and published VaR results reflect past trading positions while future risk depends on future positions. VaR is most appropriate as a risk measure for trading positions in liquid financial markets and will understate the risk associated with severe events, such as periods of extreme illiquidity. The Company is aware of these and other limitations and, therefore, uses VaR as only one component in its risk management oversight process. As explained above, this process also incorporates stress testing and scenario analyses and extensive risk monitoring, analysis, and control at the trading desk, division and Company levels.
VaR for 2009 . The table below presents the Company's Trading, Non-trading and Aggregate VaR for each of the Company's primary market risk exposures as of December 31, 2009, December 31, 2008 and November 30, 2008, incorporating substantially all financial instruments generating market risk that are managed by the Company's trading businesses. This measure of VaR incorporates most of the Company's trading-related market risks. However, a small proportion of trading positions generating market risk is not included in VaR, and the modeling of the risk characteristics of some positions relies upon approximations that, under certain circumstances, could produce significantly different VaR results from those produced using more precise measures.
Aggregate VaR also incorporates certain non-trading risks, including (a) the interest rate risk generated by funding liabilities related to institutional trading positions, (b) public company equity positions recorded as investments by the Company and (c) corporate loan exposures that are awaiting distribution to the market.
| 93 | |
Investments made by the Company that are not publicly traded are not reflected in the VaR results presented below. Aggregate VaR also excludes the credit spread risk generated by the Company's funding liabilities and the interest rate risk associated with approximately $7.7 billion of certain funding liabilities primarily related to fixed and other non-trading assets as of December 31, 2009 and December 31, 2008. The credit spread risk sensitivity of the Company's mark-to-market funding liabilities corresponded to an increase in value of approximately $11 million for each +1 basis point (or 1/100th of a percentage point) widening in the Company's credit spread level as of both December 31, 2009 and December 31, 2008.
Since the VaR statistics reported below are estimates based on historical position and market data, VaR should not be viewed as predictive of the Company's future revenues or financial performance or of its ability to monitor and manage risk. There can be no assurance that the Company's actual losses on a particular day will not exceed the VaR amounts indicated below or that such losses will not occur more than five times in 100 trading days. VaR does not predict the magnitude of losses which, should they occur, may be significantly greater than the VaR amount.
The table below presents the Company's 95%/one-day VaR:
| Table 1: 95% Total VaR | 95%/One-Day VaR for 2009 | 95%/One-Day VaR for Fiscal 2008 | 95%/One-Day VaR for the One Month Ended December 31, 2008 | |||||||||||||||||||||||||||||||||||||||||||||
Primary Market Risk Category | Dec. 31, 2009 | Average | High | Low | Nov. 30, 2008 | Average | High | Low | Dec. 31, 2008 | Average | High | Low | ||||||||||||||||||||||||||||||||||||
| (dollars in millions) | ||||||||||||||||||||||||||||||||||||||||||||||||
Interest rate and credit spread | $ | 109 | $ | 105 | $ | 122 | $ | 89 | $ | 98 | $ | 69 | $ | 101 | $ | 42 | $ | 109 | $ | 107 | $ | 121 | $ | 95 | ||||||||||||||||||||||||
Equity price | 23 | 21 | 36 | 14 | 23 | 35 | 53 | 17 | 15 | 18 | 27 | 14 | ||||||||||||||||||||||||||||||||||||
Foreign exchange rate | 25 | 20 | 47 | 7 | 14 | 25 | 40 | 12 | 11 | 13 | 16 | 11 | ||||||||||||||||||||||||||||||||||||
Commodity price | 24 | 24 | 38 | 18 | 23 | 35 | 44 | 22 | 36 | 31 | 37 | 24 | ||||||||||||||||||||||||||||||||||||
Less Diversification benefit(1) | (46 | ) | (51 | ) | (94 | ) | (31 | ) | (54 | ) | (66 | ) | (124 | ) | (15 | ) | (54 | ) | (56 | ) | (80 | ) | (42 | ) | ||||||||||||||||||||||||
Total Trading VaR | $ | 135 | $ | 119 | $ | 149 | $ | 97 | $ | 104 | $ | 98 | $ | 114 | $ | 78 | $ | 117 | $ | 113 | $ | 121 | $ | 102 | ||||||||||||||||||||||||
Total Non-trading VaR | $ | 100 | $ | 102 | $ | 129 | $ | 58 | $ | 67 | $ | 53 | $ | 96 | $ | 29 | $ | 68 | $ | 73 | $ | 81 | $ | 67 | ||||||||||||||||||||||||
Total Trading and Non-trading VaR | $ | 187 | $ | 165 | $ | 206 | $ | 119 | $ | 135 | $ | 115 | $ | 143 | $ | 82 | $ | 144 | $ | 143 | $ | 152 | $ | 131 | ||||||||||||||||||||||||
| (1) | Diversification benefit equals the difference between Total VaR and the sum of the VaRs for the four risk categories. This benefit arises because the simulated one-day losses for each of the four primary market risk categories occur on different days; similar diversification benefits also are taken into account within each category. |
The Company's Trading VaR at December 31, 2009 was $135 million compared with $117 million and $104 million at December 31, 2008 and November 30, 2008, respectively. Non-trading VaR at December 31, 2009 increased to $100 million from $68 million and $67 million at December 31, 2008 and November 30, 2008, respectively. Aggregate VaR at December 31, 2009 was $187 million compared with $144 million and $135 million at December 31, 2008 and November 30, 2008, respectively.
Average Trading VaR for 2009 increased to $119 million from $113 million for the one month ended December 31, 2008 and $98 million for fiscal 2008. Average Non-trading VaR for 2009 increased to $102 million from $73 million for the one month ended December 31, 2008 and $53 million for fiscal 2008. Average Total VaR for 2009 increased to $165 million from $143 million for the one month ended December 31, 2008 and $115 million for fiscal 2008.
The VaR increases for 2009 were primarily driven by increased exposure to interest rate and credit sensitive products across the trading and non-trading portfolios. The trading portfolio also experienced increases due to increased equity and foreign currency exposure. Additionally, the Company's VaR for 2009 was affected by higher market volatilities over the period, as explained below.
| | 94 |
VaR Statistics under Varying Assumptions.
VaR statistics are not readily comparable across firms because of differences in the breadth of products included in each firm's VaR model, in the statistical assumptions made when simulating changes in market factors, and in the methods used to approximate portfolio revaluations under the simulated market conditions. The extreme market volatilities in the latter part of 2008 had a significant impact on VaR in 2009. The impact varies depending on the factor history assumptions, the frequency with which the factor history is updated and the confidence level. As a result, VaR statistics are more reliable and relevant when used as indicators of trends in risk taking rather than as a basis for inferring differences in risk taking across firms.
Table 2 presents the VaR statistics that would result if the Company were to adopt alternative parameters for its calculations, such as the reported confidence level (95% versus 99%) for the VaR statistic or a shorter historical time series (four-year versus one-year) for market data upon which it bases its simulations. Both the average four-year VaR and the average one-year VaR for 2009 are sensitive to the high market volatilities experienced in the fourth quarter of 2008. However, we expect the one-year VaR to decline relative to the four-year VaR in the coming months, as the highly volatile period in the fourth quarter of 2008 will remain in the four-year VaR, but will no longer be a factor in the one-year VaR.
Table 2: Average 95% and 99% Trading VaR with Four-Year/One-Year Historical Time Series | Average 95%/One-Day VaR for 2009 | Average 99%/One-Day VaR for 2009 | ||||||||||||||
Primary Market Risk Category | Four-Year Factor History | One-Year Factor History | Four-Year Factor History | One-Year Factor History | ||||||||||||
| (dollars in millions) | ||||||||||||||||
Interest rate and credit spread | $ | 105 | $ | 134 | $ | 218 | $ | 248 | ||||||||
Equity price | 21 | 26 | 31 | 38 | ||||||||||||
Foreign exchange rate | 20 | 35 | 41 | 62 | ||||||||||||
Commodity price | 24 | 30 | 43 | 62 | ||||||||||||
Less: Diversification benefit(1) | (51 | ) | (63 | ) | (97 | ) | (138 | ) | ||||||||
Trading VaR | $ | 119 | $ | 162 | $ | 236 | $ | 272 | ||||||||
| (1) | Diversification benefit equals the difference between Total VaR and the sum of the VaRs for the four risk categories. This benefit arises because the simulated one-day losses for each of the four primary market risk categories occur on different days; similar diversification benefits also are taken into account within each category. |
| 95 | |
Distribution of VaR Statistics and Net Revenues for 2009.
As shown in Table 1, the Company's average 95%/one-day Trading VaR for 2009 was $119 million. The histogram below presents the distribution of the Company's daily 95%/one-day Trading VaR for 2009. The most frequently occurring value was between $112 million and $115 million, while for approximately 93% of trading days during the year VaR ranged between $103 million and $139 million.
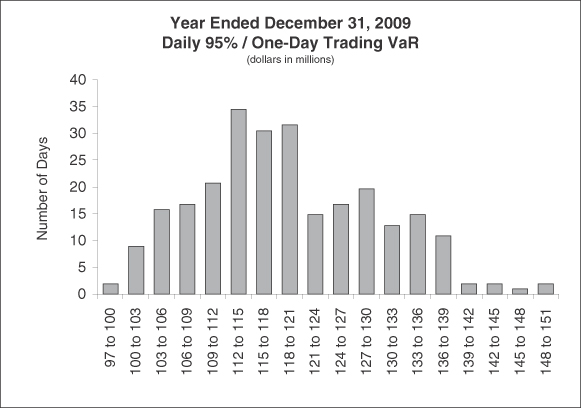
| | 96 |
As shown in Table 1, the Company's average 95%/one-day Trading VaR for the one month ended December 31, 2008 was $113 million. The histogram below presents the distribution of the Company's daily 95%/one-day Trading VaR for the one month ended December 31, 2008. The most frequently occurring value was between $115 million and $118 million, while for approximately 70% of trading days during the month VaR ranged between $109 million and $118 million.
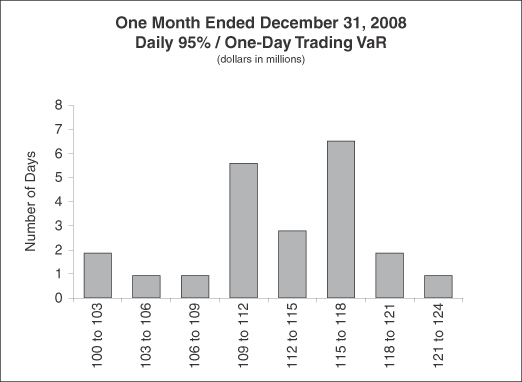
One method of evaluating the reasonableness of the Company's VaR model as a measure of the Company's potential volatility of net revenue is to compare the VaR with actual trading revenue. Assuming no intra-day trading, for a 95%/one-day VaR, the expected number of times that trading losses should exceed VaR during the year is 13, and, in general, if trading losses were to exceed VaR more than 21 times in a year, the accuracy of the VaR model could be questioned. Accordingly, the Company evaluates the reasonableness of its VaR model by comparing the potential declines in portfolio values generated by the model with actual trading results. For days where losses exceed the 95% or 99% VaR statistic, the Company examines the drivers of trading losses to evaluate the VaR model's accuracy relative to realized trading results.
The Company incurred daily trading losses in excess of the 95%/one-day Trading VaR on one day during 2009 and three days during the month ended December 31, 2008. The Company bases its VaR calculations on the long term (or unconditional) distribution with four years of observations and therefore evaluates its risk from an historical perspective. The Company is evaluating enhancements to the VaR model to make it more responsive to more recent market conditions, while maintaining a longer-term perspective.
| 97 | |
The histograms below show the distribution of daily net trading revenue during 2009 and the one month ended December 31, 2008, respectively, for the Company's trading businesses (including net interest and non-agency commissions but excluding certain non-trading revenues such as primary, fee-based and prime brokerage revenue credited to the trading businesses). During 2009 and the one month ended December 31, 2008, the Company experienced net trading losses on 38 days and 14 days, respectively. The loss days observed during December 2008 were driven predominately by increased levels of volatility realized in the market.
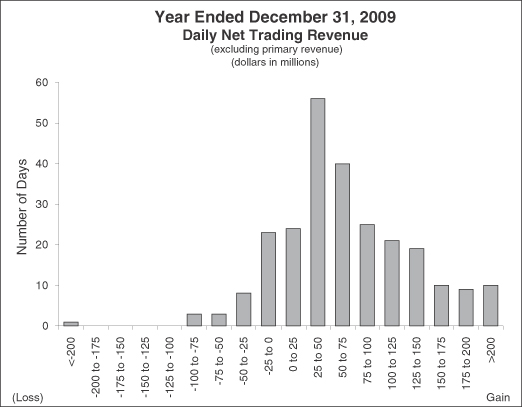
| | 98 |
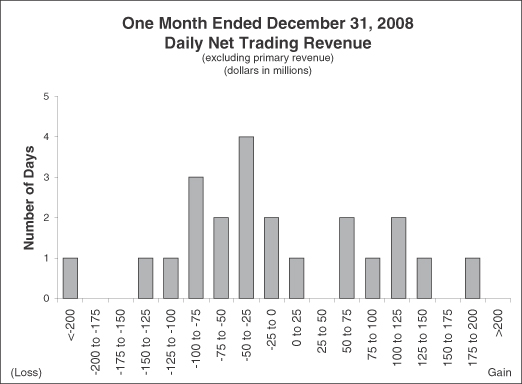
Credit Risk.
Credit risk refers to the risk of loss arising when a borrower, counterparty or issuer does not meet its financial obligations. The Company is exposed to two distinct types of credit risk in its businesses. The Company incurs "single name" credit risk exposure through the Institutional Securities business and to a lesser extent through its lending activities in its Global Wealth Management Group. This type of risk requires credit analysis of specific counterparties, both initially and on an ongoing basis. The Company also incurs "individual consumer" credit risk in the Global Wealth Management Group business segment lending to individual investors, including margin and non-purpose loans collateralized by securities and through single-family residential prime mortgage loans in jumbo or home equity lines of credit ("HELOC") form.
The Company has structured its credit risk management framework to reflect that each of its businesses generates unique credit risks, and Credit Risk Management establishes company-wide practices to evaluate, monitor and control credit risk exposure both within and across business segments. The Credit Limits Framework is one of the primary tools used to evaluate and manage credit risk levels across the Company and is calibrated within the Company's risk tolerance. The Credit Limits Framework includes single name limits and portfolio concentration limits by country, industry and product type. Credit Risk Management is responsible for ensuring transparency of material credit risks, ensuring compliance with established limits, approving material extensions of credit, and escalating risk concentrations to appropriate senior management. Credit risk exposure is managed by Credit Risk Management and through various risk committees, whose membership includes Credit Risk Management. Accordingly, Credit Risk Management also works closely with the Market Risk Department to monitor risk exposures, including margin loans, mortgage loans and credit sensitive, higher risk transactions.
| 99 | |
Institutional Securities Activities.
Corporate Lending . In connection with certain of its Institutional Securities business activities, the Company provides loans or lending commitments (including bridge financing) to selected clients. Such loans and lending commitments can generally be classified as either "relationship-driven" or "event-driven."
"Relationship-driven" loans and lending commitments are generally made to expand business relationships with select clients. The commitments associated with "relationship-driven" activities may not be indicative of the Company's actual funding requirements, as the commitment may expire unused or the borrower may not fully utilize the commitment. The borrowers of "relationship-driven" lending transactions may be investment grade or non-investment grade. The Company may hedge its exposures in connection with "relationship-driven" transactions.
"Event-driven" loans and lending commitments refer to activities associated with a particular event or transaction, such as to support client merger, acquisition or recapitalization transactions. The commitments associated with these "event-driven" activities may not be indicative of the Company's actual funding requirements since funding is contingent upon a proposed transaction being completed. In addition, the borrower may not fully utilize the commitment or the Company's portion of the commitment may be reduced through the syndication process. The borrower's ability to draw on the commitment is also subject to certain terms and conditions, among other factors. The borrowers of "event-driven" lending transactions may be investment grade or non-investment grade. The Company risk manages its exposures in connection with "event-driven" transactions through various means, including syndication, distribution and/or hedging.
Securitized Products. While new activity has been reduced from historical levels, the Company may extend short or long-term funding to clients through loans and lending commitments that are secured by assets of the borrower and generally provide for over-collateralization, including commercial real estate, loans secured by loan pools, corporate and operating company loans, and secured lines of revolving credit. Credit risk with respect to these loans and lending commitments arises from the failure of a borrower to perform according to the terms of the loan agreement or a decline in actual or underlying collateral value.
Derivative Contracts. In the normal course of business, the Company enters into a variety of derivative contracts related to financial instruments and commodities. The Company uses these instruments for trading and hedging purposes, as well as for asset and liability management. These instruments generally represent future commitments to swap interest payment streams, exchange currencies, or purchase or sell commodities and other financial instruments on specific terms at specified future dates. Many of these products have maturities that do not extend beyond one year, although swaps, options and equity warrants typically have longer maturities.
The Company incurs credit risk as a dealer in OTC derivatives. Credit risk with respect to derivative instruments arises from the failure of a counterparty to perform according to the terms of the contract. The Company's exposure to credit risk at any point in time is represented by the fair value of the derivative contracts reported as assets. The fair value of derivatives represents the amount at which the derivative could be exchanged in an orderly transaction between market participants and is further described in Note 2 to the consolidated financial statements. Future changes in interest rates, foreign currency exchange rates, or the fair values of the financial instruments, commodities or indices underlying these contracts ultimately may result in cash settlements exceeding fair value amounts recognized in the consolidated statements of financial condition.
Other. In addition to the activities noted above, there are other credit risks managed by Credit Risk Management and various business areas within Institutional Securities. The Company incurs credit risk through margin and collateral transactions with clearing houses, clearing agencies, exchanges, banks, securities firms and other financial counterparties. Certain risk management activities as they pertain to establishing appropriate collateral amounts for the Company's prime brokerage and securitized product businesses are primarily monitored within those respective areas in that they determine the appropriate collateral level for each strategy or position. In addition, a collateral management group monitors collateral levels against requirements and oversees the administration of the collateral function. In addition, certain businesses with heightened settlement risk monitor compliance with established settlement risk limits.
| | 100 |
Analyzing Credit Risk. Credit risk management takes place at the transaction, counterparty and portfolio levels. In order to protect the Company from losses resulting from these activities, Credit Risk Management analyzes all material lending and derivative transactions and ensures that the creditworthiness of the Company's counterparties and borrowers is reviewed regularly and that credit exposure is actively monitored and managed. Credit Risk Management assigns obligor credit ratings to the Company's counterparties and borrowers. These credit ratings are intended to assess a counterparty's probability of default and are derived using methodologies generally consistent with those employed by external rating agencies. Credit ratings of "BB+" or below are considered non-investment grade. Additionally, Credit Risk Management evaluates the relative position of the Company's particular obligation in the borrower's capital structure and relative recovery prospects, as well as collateral (if applicable) and other structural elements of the particular transaction.
Risk Mitigation. The Company may seek to mitigate credit risk from its lending and derivatives transactions in multiple ways. At the transaction level, the Company seeks to mitigate risk through management of key risk elements such as size, tenor, seniority and collateral. The Company actively hedges its lending and derivatives exposure through various financial instruments that may include single name, portfolio and structured credit derivatives. Additionally, the Company may sell, assign or sub-participate funded loans and lending commitments to other financial institutions in the primary and secondary loan market. In connection with its derivatives trading activities, the Company generally enters into master netting agreements and collateral arrangements with counterparties. These agreements provide the Company with the ability to offset a counterparty's rights and obligations, request additional collateral when necessary or liquidate the collateral in the event of counterparty default.
Credit Exposure-Corporate Lending. The following tables present information about the Company's corporate funded loans and lending commitments as of December 31, 2009 and December 31, 2008. The "total corporate lending exposure" column includes both lending commitments and funded loans. Fair value of corporate lending exposure represents the fair value of loans that have been drawn by the borrower and lending commitments that were outstanding as of December 31, 2009 and December 31, 2008. Lending commitments represent legally binding obligations to provide funding to clients as of December 31, 2009 and December 31, 2008 for both "relationship-driven" and "event-driven" lending transactions. As discussed above, these loans and lending commitments have varying terms, may be senior or subordinated, may be secured or unsecured, are generally contingent upon representations, warranties and contractual conditions applicable to the borrower, and may be syndicated, traded or hedged by the Company.
As of December 31, 2009 and December 31, 2008, the aggregate amount of investment grade loans was $6.5 billion and $7.4 billion, respectively, and the aggregate amount of non-investment grade loans was $9.5 billion and $9.4 billion, respectively. As of December 31, 2009 and December 31, 2008, the aggregate amount of lending commitments outstanding was $47.9 billion and $43.9 billion, respectively. In connection with these corporate lending activities (which include corporate funded loans and lending commitments), the Company had hedges (which include "single name," "sector" and "index" hedges) with a notional amount of $25.8 billion and $35.7 billion related to the total corporate lending exposure of $64.0 billion and $60.7 billion as of December 31, 2009 and December 31, 2008, respectively.
| 101 | |
The tables below show the Company's credit exposure from its corporate lending positions and lending commitments as of December 31, 2009 and December 31, 2008. Since commitments associated with these business activities may expire unused, they do not necessarily reflect the actual future cash funding requirements:
Corporate Lending Commitments and Funded Loans at December 31, 2009
| Years to Maturity | Total Corporate Lending Exposure(2) | Corporate Lending Exposure at Fair Value(3) | Corporate Lending Commitments(4) | ||||||||||||||||||
Credit Rating(1) | Less than 1 | 1-3 | 3-5 | Over 5 | |||||||||||||||||
| (dollars in millions) | |||||||||||||||||||||
AAA | $ | 542 | $ | 233 | $ | - | $ | - | $ | 775 | $ | - | $ | 775 | |||||||
AA | 3,141 | 4,354 | 275 | - | 7,770 | 80 | 7,690 | ||||||||||||||
A | 3,116 | 9,796 | 1,129 | 548 | 14,589 | 1,918 | 12,671 | ||||||||||||||
BBB | 4,272 | 16,191 | 3,496 | 164 | 24,123 | 4,548 | 19,575 | ||||||||||||||
Investment grade | 11,071 | 30,574 | 4,900 | 712 | 47,257 | 6,546 | 40,711 | ||||||||||||||
Non-investment grade | 749 | 6,525 | 6,097 | 3,322 | 16,693 | 9,517 | 7,176 | ||||||||||||||
Total | $ | 11,820 | $ | 37,099 | $ | 10,997 | $ | 4,034 | $ | 63,950 | $ | 16,063 | $ | 47,887 | |||||||
| (1) | Obligor credit ratings are determined by Credit Risk Management using methodologies generally consistent with those employed by external rating agencies. |
| (2) | Total corporate lending exposure represents the Company's potential loss assuming the fair value of funded loans and lending commitments were zero. |
| (3) | The Company's corporate lending exposure carried at fair value includes $15.6 billion of funded loans and $0.4 billion of lending commitments recorded in Financial instruments owned and Financial instruments sold, not yet purchased, respectively, in the consolidated statements of financial condition as of December 31, 2009. The Company's corporate lending exposure carried at amortized cost includes $850 million of funded loans recorded in Receivables-other loans in the consolidated statements of financial condition. |
| (4) | Amounts represent the notional amount of unfunded lending commitments less the amount of commitments reflected in the Company's consolidated statements of financial condition. |
Corporate Lending Commitments and Funded Loans at December 31, 2008
| Years to Maturity | Total Corporate Lending Exposure(2) | Corporate Lending Exposure at Fair Value(3) | Corporate Lending Commitments(4) | ||||||||||||||||||
Credit Rating(1) | Less than 1 | 1-3 | 3-5 | Over 5 | |||||||||||||||||
| (dollars in millions) | |||||||||||||||||||||
AAA | $ | 842 | $ | 114 | $ | 1,374 | $ | - | $ | 2,330 | $ | 67 | $ | 2,263 | |||||||
AA | 2,685 | 718 | 3,321 | 73 | 6,797 | 33 | 6,764 | ||||||||||||||
A | 4,899 | 5,321 | 5,892 | 69 | 16,181 | 2,291 | 13,890 | ||||||||||||||
BBB | 2,745 | 7,722 | 8,299 | 255 | 19,021 | 5,037 | 13,984 | ||||||||||||||
Investment grade | 11,171 | 13,875 | 18,886 | 397 | 44,329 | 7,428 | 36,901 | ||||||||||||||
Non-investment grade | 1,144 | 3,433 | 5,301 | 6,516 | 16,394 | 9,389 | 7,005 | ||||||||||||||
Total | $ | 12,315 | $ | 17,308 | $ | 24,187 | $ | 6,913 | $ | 60,723 | $ | 16,817 | $ | 43,906 | |||||||
| (1) | Obligor credit ratings are determined by Credit Risk Management using methodologies generally consistent with those employed by external rating agencies. |
| (2) | Total corporate lending exposure represents the Company's potential loss assuming the fair value of funded loans and lending commitments were zero. |
| (3) | The Company's corporate lending exposure at fair value includes $19.9 billion of funded loans and $3.1 billion of lending commitments recorded in Financial instruments owned and Financial instruments sold, not yet purchased, respectively, in the consolidated statements of financial condition as of December 31, 2008. |
| (4) | Amounts represent the notional amount of unfunded lending commitments less the amount of commitments reflected in the Company's consolidated statements of financial condition. |
| | 102 |
"Event-driven" Loans and Lending Commitments as of December 31, 2009 and December 31, 2008.
Included in the total corporate lending exposure amounts in the table above as of December 31, 2009 is "event-driven" exposure of $5.6 billion composed of funded loans of $2.8 billion and lending commitments of $2.8 billion. Included in the $5.6 billion of "event-driven" exposure as of December 31, 2009 were $3.7 billion of loans and lending commitments to non-investment grade borrowers that were closed.
Included in the total corporate lending exposure amounts in the table above as of December 31, 2008 is "event-driven" exposure of $9.3 billion composed of funded loans of $3.4 billion and lending commitments of $5.9 billion. Included in the $9.3 billion of "event-driven" exposure as of December 31, 2008 were $5.0 billion of loans and lending commitments to non-investment grade borrowers that were closed.
Activity associated with the corporate "event-driven" lending exposure during 2009 was as follows (dollars in millions):
"Event-driven" lending exposures at December 31, 2008 | $ | 9,327 | ||
Closed commitments | 3,259 | |||
Withdrawn commitments | (267 | ) | ||
Net reductions, primarily through distributions | (6,708 | ) | ||
Mark-to-market adjustments | 10 | |||
"Event-driven" lending exposures at December 31, 2009 | $ | 5,621 | ||
Credit Exposure-Derivatives. The tables below present a summary by counterparty credit rating and remaining contract maturity of the fair value of OTC derivatives in a gain position as of December 31, 2009 and December 31, 2008. Fair value is presented in the final column net of collateral received (principally cash and U.S. government and agency securities):
OTC Derivative Products-Financial Instruments Owned at December 31, 2009(1)
| Years to Maturity | Cross-Maturity and Cash Collateral Netting(3) | Net Exposure Post-Cash Collateral | Net Exposure Post- Collateral | |||||||||||||||||||
Credit Rating(2) | Less than 1 | 1-3 | 3-5 | Over 5 | ||||||||||||||||||
| (dollars in millions) | ||||||||||||||||||||||
AAA | $ | 852 | $ | 2,026 | $ | 3,876 | $ | 9,331 | $ | (6,616 | ) | $ | 9,469 | $ | 9,082 | |||||||
AA | 6,469 | 7,855 | 6,600 | 15,071 | (25,576 | ) | 10,419 | 8,614 | ||||||||||||||
A | 8,018 | 10,712 | 7,990 | 22,739 | (38,971 | ) | 10,488 | 9,252 | ||||||||||||||
BBB | 3,032 | 4,193 | 2,947 | 7,524 | (8,971 | ) | 8,725 | 5,902 | ||||||||||||||
Non-investment grade | 2,773 | 3,331 | 2,113 | 4,431 | (4,534 | ) | 8,114 | 6,525 | ||||||||||||||
Total | $ | 21,144 | $ | 28,117 | $ | 23,526 | $ | 59,096 | $ | (84,668 | ) | $ | 47,215 | $ | 39,375 | |||||||
| (1) | Fair values shown represent the Company's net exposure to counterparties related to the Company's OTC derivative products. The table does not include listed derivatives and the effect of any related hedges utilized by the Company. The table also excludes fair values corresponding to other credit exposures, such as those arising from the Company's lending activities. |
| (2) | Obligor credit ratings are determined by Credit Risk Management using methodologies generally consistent with those employed by external rating agencies. |
| (3) | Amounts represent the netting of receivable balances with payable balances for the same counterparty across maturity categories. Receivable and payable balances with the same counterparty in the same maturity category are netted within such maturity category, where appropriate. Cash collateral received is netted on a counterparty basis, provided legal right of offset exists. |
| 103 | |
OTC Derivative Products-Financial Instruments Owned at December 31, 2008(1)
| Years to Maturity | Cross-Maturity and Cash Collateral Netting(3) | Net Exposure Post-Cash Collateral | Net Exposure Post- Collateral | |||||||||||||||||||
Credit Rating(2) | Less than 1 | 1-3 | 3-5 | Over 5 | ||||||||||||||||||
| (dollars in millions) | ||||||||||||||||||||||
AAA | $ | 1,928 | $ | 3,588 | $ | 6,235 | $ | 16,623 | $ | (11,060 | ) | $ | 17,314 | $ | 15,849 | |||||||
AA | 10,447 | 13,133 | 16,589 | 40,423 | (63,498 | ) | 17,094 | 15,018 | ||||||||||||||
A | 7,150 | 7,514 | 7,805 | 21,752 | (31,025 | ) | 13,196 | 12,034 | ||||||||||||||
BBB | 4,666 | 7,414 | 4,980 | 8,614 | (6,571 | ) | 19,103 | 14,101 | ||||||||||||||
Non-investment grade | 8,219 | 8,163 | 5,416 | 7,341 | (12,597 | ) | 16,542 | 12,131 | ||||||||||||||
Total | $ | 32,410 | $ | 39,812 | $ | 41,025 | $ | 94,753 | $ | (124,751 | ) | $ | 83,249 | $ | 69,133 | |||||||
| (1) | Fair values shown represent the Company's net exposure to counterparties related to the Company's OTC derivative products. The table does not include listed derivatives and the effect of any related hedges utilized by the Company. The table also excludes fair values corresponding to other credit exposures, such as those arising from the Company's lending activities. |
| (2) | Obligor credit ratings are determined by Credit Risk Management using methodologies generally consistent with those employed by external rating agencies. |
| (3) | Amounts represent the netting of receivable balances with payable balances for the same counterparty across maturity categories. Receivable and payable balances with the same counterparty in the same maturity category are netted within such maturity category, where appropriate. Cash collateral received is netted on a counterparty basis, provided legal right of offset exists. |
The following tables summarize the fair values of the Company's OTC derivative products recorded in Financial instruments owned and Financial instruments sold, not yet purchased by product category and maturity as of December 31, 2009, including on a net basis, where applicable, reflecting the fair value of related non-cash collateral for financial instruments owned:
OTC Derivative Products-Financial Instruments Owned at December 31, 2009
| Years to Maturity | Cross-Maturity and Cash Collateral Netting(1) | Net Exposure Post-Cash Collateral | Net Exposure Post- Collateral | |||||||||||||||||||
Product Type | Less than 1 | 1-3 | 3-5 | Over 5 | ||||||||||||||||||
| (dollars in millions) | ||||||||||||||||||||||
Interest rate and currency swaps, interest rate options, credit derivatives and other fixed income securities contracts | $ | 11,958 | $ | 19,556 | $ | 20,564 | $ | 57,240 | $ | (76,255 | ) | $ | 33,063 | $ | 29,444 | |||||||
Foreign exchange forward contracts and options | 3,859 | 916 | 201 | 40 | (1,994 | ) | 3,022 | 2,699 | ||||||||||||||
Equity securities contracts (including equity swaps, warrants and options) | 1,987 | 1,023 | 441 | 697 | (2,065 | ) | 2,083 | 1,109 | ||||||||||||||
Commodity forwards, options and swaps | 3,340 | 6,622 | 2,320 | 1,119 | (4,354 | ) | 9,047 | 6,123 | ||||||||||||||
Total | $ | 21,144 | $ | 28,117 | $ | 23,526 | $ | 59,096 | $ | (84,668 | ) | $ | 47,215 | $ | 39,375 | |||||||
| (1) | Amounts represent the netting of receivable balances with payable balances for the same counterparty across maturity and product categories. Receivable and payable balances with the same counterparty in the same maturity category are netted within the maturity category, where appropriate. Cash collateral received is netted on a counterparty basis, provided legal right of offset exists. |
| | 104 |
OTC Derivative Products-Financial Instruments Sold, Not Yet Purchased at December 31, 2009(1)
| Years to Maturity | Cross-Maturity and Cash Collateral Netting(2) | Total | |||||||||||||||||
Product Type | Less than 1 | 1-3 | 3-5 | Over 5 | |||||||||||||||
| (dollars in millions) | |||||||||||||||||||
Interest rate and currency swaps, interest rate options, credit derivatives and other fixed income securities contracts | $ | 6,054 | $ | 11,442 | $ | 11,795 | $ | 32,133 | $ | (40,743 | ) | $ | 20,681 | ||||||
Foreign exchange forward contracts and options | 3,665 | 647 | 201 | 72 | (1,705 | ) | 2,880 | ||||||||||||
Equity securities contracts (including equity swaps, warrants and options) | 4,528 | 2,547 | 1,253 | 1,150 | (5,860 | ) | 3,618 | ||||||||||||
Commodity forwards, options and swaps | 3,727 | 4,668 | 1,347 | 975 | (5,336 | ) | 5,381 | ||||||||||||
Total | $ | 17,974 | $ | 19,304 | $ | 14,596 | $ | 34,330 | $ | (53,644 | ) | $ | 32,560 | ||||||
| (1) | Since these amounts are liabilities of the Company, they do not result in credit exposures. |
| (2) | Amounts represent the netting of receivable balances with payable balances for the same counterparty across maturity and product categories. Receivable and payable balances with the same counterparty in the same maturity category are netted within the maturity category, where appropriate. Cash collateral paid is netted on a counterparty basis, provided legal right of offset exists. |
The following tables summarize the fair values of the Company's OTC derivative products recorded in Financial instruments owned and Financial instruments sold, not yet purchased by product category and maturity as of December 31, 2008, including on a net basis, where applicable, reflecting the fair value of related non-cash collateral for financial instruments owned:
OTC Derivative Products-Financial Instruments Owned at December 31, 2008
| Years to Maturity | Cross-Maturity and Cash Collateral Netting(1) | Net Exposure Post-Cash Collateral | Net Exposure Post- Collateral | |||||||||||||||||||
Product Type | Less than 1 | 1-3 | 3-5 | Over 5 | ||||||||||||||||||
| (dollars in millions) | ||||||||||||||||||||||
Interest rate and currency swaps, interest rate options, credit derivatives and other fixed income securities contracts | $ | 8,914 | $ | 22,965 | $ | 36,497 | $ | 91,468 | $ | (107,667 | ) | $ | 52,177 | $ | 45,841 | |||||||
Foreign exchange forward contracts and options | 8,465 | 2,363 | 320 | 68 | (3,882 | ) | 7,334 | 6,409 | ||||||||||||||
Equity securities contracts (including equity swaps, warrants and options) | 4,333 | 2,059 | 606 | 1,088 | (4,991 | ) | 3,095 | 1,365 | ||||||||||||||
Commodity forwards, options and swaps | 10,698 | 12,425 | 3,602 | 2,129 | (8,211 | ) | 20,643 | 15,518 | ||||||||||||||
Total | $ | 32,410 | $ | 39,812 | $ | 41,025 | $ | 94,753 | $ | (124,751 | ) | $ | 83,249 | $ | 69,133 | |||||||
| (1) | Amounts represent the netting of receivable balances with payable balances for the same counterparty across maturity and product categories. Receivable and payable balances with the same counterparty in the same maturity category are netted within the maturity category, where appropriate. Cash collateral received is netted on a counterparty basis, provided legal right of offset exists. |
| 105 | |
OTC Derivative Products-Financial Instruments Sold, Not Yet Purchased at December 31, 2008(1)
| Years to Maturity | Cross-Maturity and Cash Collateral Netting(2) | Total | |||||||||||||||||
Product Type | Less than 1 | 1-3 | 3-5 | Over 5 | |||||||||||||||
| (dollars in millions) | |||||||||||||||||||
Interest rate and currency swaps, interest rate options, credit derivatives and other fixed income securities contracts | $ | 8,547 | $ | 17,356 | $ | 24,777 | $ | 55,237 | $ | (69,985 | ) | $ | 35,932 | ||||||
Foreign exchange forward contracts and options | 7,355 | 1,660 | 377 | 159 | (3,110 | ) | 6,441 | ||||||||||||
Equity securities contracts (including equity swaps, warrants and options) | 2,661 | 3,446 | 1,685 | 1,858 | (6,149 | ) | 3,501 | ||||||||||||
Commodity forwards, options and swaps | 7,764 | 10,283 | 2,321 | 1,082 | (8,302 | ) | 13,148 | ||||||||||||
Total | $ | 26,327 | $ | 32,745 | $ | 29,160 | $ | 58,336 | $ | (87,546 | ) | $ | 59,022 | ||||||
| (1) | Since these amounts are liabilities of the Company, they do not result in credit exposures. |
| (2) | Amounts represent the netting of receivable balances with payable balances for the same counterparty across maturity and product categories. Receivable and payable balances with the same counterparty in the same maturity category are netted within the maturity category, where appropriate. Cash collateral paid is netted on a counterparty basis, provided legal right of offset exists. |
The Company's derivatives (both listed and OTC), on a net of counterparty and cash collateral basis, as of December 31, 2009 and December 31, 2008 are summarized in the table below, showing the fair value of the related assets and liabilities by product category:
| At December 31, 2009 | At December 31, 2008 | |||||||||||
Product Type | Assets | Liabilities | Assets | Liabilities | ||||||||
| (dollars in millions) | ||||||||||||
Interest rate and currency swaps, interest rate options, credit derivatives and other fixed income securities contracts | $ | 33,307 | $ | 20,911 | $ | 52,391 | $ | 36,146 | ||||
Foreign exchange forward contracts and options | 3,022 | 2,824 | 7,334 | 6,425 | ||||||||
Equity securities contracts (including equity swaps, warrants and options) | 3,619 | 7,371 | 8,738 | 8,920 | ||||||||
Commodity forwards, options and swaps | 9,133 | 7,103 | 20,955 | 17,063 | ||||||||
Total | $ | 49,081 | $ | 38,209 | $ | 89,418 | $ | 68,554 | ||||
Each category of derivative products in the above tables includes a variety of instruments, which can differ substantially in their characteristics. Instruments in each category can be denominated in U.S. dollars or in one or more non-U.S. currencies.
The Company determines the fair values recorded in the above tables using various pricing models. For a discussion of fair value as it affects the consolidated financial statements, see "Management's Discussion and Analysis of Financial Condition and Results of Operations-Critical Accounting Policies" in Part II, Item 7, herein and Notes 1 and 4 to the consolidated financial statements.
Credit Derivatives. A credit derivative is a contract between a seller (guarantor) and buyer (beneficiary) of protection against the risk of a credit event occurring on a set of debt obligations issued by a specified reference entity. The beneficiary pays a periodic premium (typically quarterly) over the life of the contract and is protected for the period. If a credit event occurs, the guarantor is required to make payment to the beneficiary based on the terms of the credit derivative contract. Credit events include bankruptcy, dissolution or insolvency of the referenced entity, failure to pay, obligation acceleration, repudiation and payment moratorium. Debt restructurings are also considered a credit event in some cases. In certain transactions referenced to a portfolio of referenced entities or asset-backed securities, deductibles and caps may limit the guarantor's obligations.
| | 106 |
The Company trades in a variety of derivatives and may either purchase or write protection on a single name or portfolio of referenced entities. The Company is an active market-maker in the credit derivatives markets. As a market-maker, the Company works to earn a bid-offer spread on client flow business and manage any residual credit or correlation risk on a portfolio basis. The Company also trades and takes credit risk in credit default swap form on a proprietary basis. Further, the Company uses credit derivatives to manage its exposure to residential and commercial mortgage loans and corporate lending exposures during the periods presented.
The Company actively monitors its counterparty credit risk related to credit derivatives. A majority of the Company's counterparties are banks, broker-dealers, insurance, and other financial institutions and Monolines. Contracts with these counterparties do not include ratings-based termination events but do include counterparty rating downgrades, which may result in additional collateral being required by the Company. For further information on the Company's exposure to Monolines, see "Certain Factors Affecting Results of Operations-Monoline Insurers" herein. The master agreements with these Monoline counterparties are generally unsecured, and the few ratings-based triggers (if any) generally provide the Company the ability to terminate only upon significant downgrade. As with all derivative contracts, the Company considers counterparty credit risk in the valuation of its positions and recognizes credit valuation adjustments as appropriate.
The following table summarizes the key characteristics of the Company's credit derivative portfolio by counterparty as of December 31, 2009. The fair values shown are before the application of any counterparty or cash collateral netting:
| At December 31, 2009 | ||||||||||||
| Fair Values(1) | Notionals(2) | |||||||||||
| Receivable | Payable | Beneficiary | Guarantor | |||||||||
| (dollars in millions) | ||||||||||||
Banks and securities firms | $ | 125,352 | $ | 115,855 | $ | 2,294,658 | $ | 2,213,761 | ||||
Insurance and other financial institutions | 15,422 | 9,310 | 194,353 | 229,630 | ||||||||
Monolines | 4,903 | - | 22,886 | - | ||||||||
Non-financial entities | 387 | 69 | 3,990 | 3,634 | ||||||||
Total | $ | 146,064 | $ | 125,234 | $ | 2,515,887 | $ | 2,447,025 | ||||
| (1) | Amounts shown are presented before the application of any counterparty or cash collateral netting. The Company's credit default swaps are classified in both Level 2 and Level 3 of the fair value hierarchy. Approximately 16% of receivable fair values and 11% of payable fair values represent Level 3 amounts. |
| (2) | As part of an industry-wide effort to reduce the total notional amount of outstanding offsetting credit derivative trades, the Company participated in novating credit default swap contracts with external counterparties to a central clearinghouse during 2009. |
Country Exposure. As of December 31, 2009 and December 31, 2008, primarily based on the domicile of the counterparty, approximately 5% and 8%, respectively, of the Company's credit exposure (for credit exposure arising from corporate loans and lending commitments as discussed above and current exposure arising from the Company's OTC derivative contracts) was to emerging markets, and no one emerging market country accounted for more than 1% and 2%, respectively, of the Company's credit exposure.
The Company defines emerging markets to include generally all countries where the economic, legal and political systems are transitional and in the process of developing into more transparent and accountable systems that are consistent with advanced countries.
| 107 | |
The following tables show the Company's percentage of credit exposure from its primary corporate loans and lending commitments and OTC derivative products by country as of December 31, 2009 and December 31, 2008:
| Corporate Lending Exposure | ||||||
Country | At December 31, 2009 | At December 31, 2008 | ||||
United States | 65 | % | 68 | % | ||
United Kingdom | 7 | 7 | ||||
Germany | 6 | 5 | ||||
Other | 22 | 20 | ||||
Total | 100 | % | 100 | % | ||
| OTC Derivative Products | ||||||
Country | At December 31, 2009 | At December 31, 2008 | ||||
United States | 31 | % | 35 | % | ||
Cayman Islands | 14 | 10 | ||||
United Kingdom | 8 | 9 | ||||
Italy | 7 | 6 | ||||
Germany | 4 | 3 | ||||
France | 3 | 3 | ||||
Jersey | 3 | 3 | ||||
Ireland | 3 | 2 | ||||
Japan | 2 | 3 | ||||
Other | 25 | 26 | ||||
Total | 100 | % | 100 | % | ||
Industry Exposure. The Company also monitors its credit exposure to individual industries for credit exposure arising from corporate loans and lending commitments as discussed above and current exposure arising from the Company's OTC derivative contracts.
The following tables show the Company's percentage of credit exposure from its primary corporate loans and lending commitments and OTC derivative products by industry as of December 31, 2009 and December 31, 2008:
| Corporate Lending Exposure | ||||||
Industry | At December 31, 2009 | At December 31, 2008 | ||||
Utilities-related | 15 | % | 13 | % | ||
Consumer-related entities | 10 | 10 | ||||
Financial institutions | 9 | 10 | ||||
Telecommunications | 8 | 11 | ||||
Media-related entities | 8 | 7 | ||||
General industrials | 7 | 7 | ||||
Technology-related industries | 6 | 8 | ||||
Healthcare-related entities | 6 | 5 | ||||
Energy-related entities | 6 | 5 | ||||
Other | 25 | 24 | ||||
Total | 100 | % | 100 | % | ||
| | 108 |
| OTC Derivative Products | ||||||
Industry | At December 31, 2009 | At December 31, 2008 | ||||
Financial institutions | 41 | % | 38 | % | ||
Sovereign entities | 19 | 15 | ||||
Insurance | 9 | 13 | ||||
Utilities-related entities | 7 | 6 | ||||
Energy-related entities | 3 | 3 | ||||
Transportation-related entities | 3 | 11 | ||||
Other | 18 | 14 | ||||
Total | 100 | % | 100 | % | ||
Global Wealth Management Group Activities.
Margin Lending. Customer margin accounts, the primary source of retail credit exposure, are collateralized in accordance with internal and regulatory guidelines. The Company monitors required margin levels and established credit limits daily and, pursuant to such guidelines, requires customers to deposit additional collateral, or reduce positions, when necessary. Factors considered in the review of margin loans are the amount of the loan, the intended purpose, the degree of leverage being employed in the account, and overall evaluation of the portfolio to ensure proper diversification or, in the case of concentrated positions, appropriate liquidity of the underlying collateral or potential hedging strategies to reduce risk. Additionally, transactions relating to concentrated or restricted positions require a review of any legal impediments to liquidation of the underlying collateral. Underlying collateral for margin loans is reviewed with respect to the liquidity of the proposed collateral positions, valuation of securities, historic trading range, volatility analysis and an evaluation of industry concentrations. At December 31, 2009 and December 31, 2008, there were approximately $5.3 billion and $4.3 billion, respectively, of customer margin loans outstanding.
The Company, through agreements with Citi relating to the formation of MSSB, retains certain credit risk for margin and non-purpose loans that are held at Citigroup Global Markets Inc. in its capacity as clearing broker for certain MSSB clients. The related loans are generally subject to the same oversight as similar margin and non-purpose loans held by the Company and its subsidiaries.
Non-purpose Securities-Based Lending. Non-purpose securities-based lending allows clients to borrow money against the value of qualifying securities for any suitable purpose other than purchasing, trading, or carrying marketable securities or refinancing margin debt. The Company establishes approved lines and advance rates against qualifying securities and monitors limits daily and, pursuant to such guidelines, requires customers to deposit additional collateral, or reduce debt positions, when necessary. Factors considered in the review of non-purpose securities-based lending are amount of the loan, the degree of concentrated or restricted positions, and the overall evaluation of the portfolio to ensure proper diversification or, in the case of concentrated positions, appropriate liquidity of the underlying collateral or potential hedging strategies. Underlying collateral for non-purpose securities-based loans is reviewed with respect to the liquidity of the proposed collateral positions, valuation of securities, historic trading range, volatility analysis and an evaluation of industry concentrations.
Commercial Lending. The Global Wealth Management Group provides structured credit facilities to high net worth individuals and their small and medium-size domestic businesses, with a suite of products that includes working capital lines of credit, revolving lines of credit, standby letters of credit, term loans and commercial real estate mortgages. Clients are required to submit a credit application and financial statements to a centralized credit processing platform, and underwriting professionals recommend a lending structure following an analysis of the borrower, the guarantor, the collateral, cash flow, liquidity, leverage and credit history. For standard transactions, credit requests are approved via signature of independent credit professionals, and where transactions are of size and higher complexity, approval is secured through a formal loan committee chaired by independent credit professionals. The facility is risk rated and upon credit approval and loan closing is closely monitored through active account management and covenant compliance certificates.
| 109 | |
Consumer Lending Activities.
With respect to first mortgages and second mortgages, including HELOC ("mortgage lending"), a loan evaluation process is adopted within a framework of credit underwriting policies and collateral valuation. The Company's underwriting policy is designed to ensure that all borrowers pass an assessment of capacity and willingness to pay, which includes an analysis of applicable industry standard credit scoring models ( e.g., FICO scores), debt ratios and reserves of the borrower. Loan-to-collateral value ratios are determined based on independent third-party property appraisal/valuations, and security lien position is established through title/ownership reports. Historically all mortgages were originated to be sold or securitized. Eligible conforming loans are currently sold to the government-sponsored enterprises while most jumbo and HELOC loans will be held for investment in the Company's portfolio.
Operational Risk.
Operational risk refers to the risk of financial or other loss, or potential damage to a firm's reputation, resulting from inadequate or failed internal processes, people, systems or from external events ( e.g., external or internal fraud, legal and compliance risks, damage to physical assets). The Company may incur operational risk across the full scope of its business activities, including revenue generating activities ( e.g., sales and trading) and support functions ( e.g., information technology and facilities management). Legal and compliance risk is included in the scope of operational risk and is discussed below under "Legal Risk."
The goal of the Company's operational risk management framework is to establish company-wide operational risk standards related to risk measurement, monitoring and management. Operational risk policies establish a framework to reduce the likelihood and/or impact of operational incidents as well as to mitigate legal, regulatory and reputational risks. The framework continually responds to changing regulatory and business environment landscape. As a foundation for the Basel II Advanced Measurement Approach, an enhanced risk-based capital model has been developed for the calculation of capital related to operational risk. This model encompasses both quantitative and qualitative elements, including internal and external operational incidents, metrics, risk and control self-assessments, and scenario analysis.
The Operational Risk Oversight Committee, a company-wide committee, is chaired by the Company's Chief Risk Officer and assists the FRC in executing its responsibilities for oversight of operational risk, including evaluating assessments of risk exposure, reviewing the Company's significant operational risk exposures, recommending and overseeing company-wide remediation efforts, review and evaluation of current event risk issues, and establishing company-wide operational risk program standards related to risk measurement, monitoring and management.
The Company's Operational Risk Manager oversees, monitors, measures, analyzes and reports on operational risk across the Company. The Operational Risk Manager is independent of the business segments and is supported by the company-wide Operational Risk Department. The Operational Risk Manager is also responsible for facilitating, designing, implementing and monitoring the company-wide operational risk program. The Operational Risk Department works with the business segments and control groups to help ensure a transparent, consistent and comprehensive framework for managing operational risk within each area and across the Company globally.
Primary responsibility for the management of operational risk is with the business segments, the control groups and the business managers therein. The business managers, generally, maintain processes and controls designed to identify, assess, manage, mitigate and report operational risk. As new products and business activities are developed and processes are designed and modified, operational risks are considered. Each business segment has a designated operational risk coordinator. The operational risk coordinator regularly reviews operational risk issues and reports with senior management within each business. Each control group also has a designated operational risk coordinator, or equivalent, and a forum for discussing operational risk matters and/or reports with senior management. Oversight of operational risk is provided by business segment and regional risk committees and the Operational Risk Oversight Committee.
| | 110 |
Business Continuity Management is an ongoing program of analysis and planning that helps ensure a recovery strategy and required resources for the resumption of critical business functions following a disaster or other business interruption. Disaster recovery plans are in place for critical facilities and resources on a company-wide basis, and redundancies are built into the systems as deemed appropriate. The key components of the Company's disaster recovery plans include: crisis management; business recovery plans; applications/data recovery; work area recovery; and other elements addressing management, analysis, training and testing.
The Company maintains an information security program that coordinates the management of information security risks and satisfies regulatory requirements. Information security procedures are designed to protect the Company's information assets against unauthorized disclosure, modification or misuse. These procedures cover a broad range of areas, including: application entitlements, data protection, incident response, Internet and electronic communications, remote access and portable devices. The Company has also established policies, procedures and technologies to protect its computers and other assets from unauthorized access.
The Company utilizes the services of external vendors in connection with the Company's ongoing operations. These may include, for example, outsourced processing and support functions and consulting and other professional services. The Company manages its exposures to the quality of these services through a variety of means, including service level and other contractual agreements, service and quality reviews, and ongoing monitoring of the vendors' performance. It is anticipated that the use of these services will continue and possibly increase in the future.
Legal Risk.
Legal risk includes the risk of non-compliance with applicable legal and regulatory requirements and standards. Legal risk also includes contractual and commercial risk such as the risk that a counterparty's performance obligations will be unenforceable. The Company is generally subject to extensive regulation in the different jurisdictions in which it conducts its business (see "Business-Supervision and Regulation" in Part I, Item 1). The Company has established procedures based on legal and regulatory requirements on a worldwide basis that are designed to foster compliance with applicable statutory and regulatory requirements. The Company, principally through the Legal and Compliance Division, also has established procedures that are designed to require that the Company's policies relating to conduct, ethics and business practices are followed globally. In connection with its businesses, the Company has and continuously develops various procedures addressing issues such as regulatory capital requirements, sales and trading practices, new products, potential conflicts of interest, structured transactions, use and safekeeping of customer funds and securities, credit granting, money laundering, privacy and recordkeeping. In addition, the Company has established procedures to mitigate the risk that a counterparty's performance obligations will be unenforceable, including consideration of counterparty legal authority and capacity, adequacy of legal documentation, the permissibility of a transaction under applicable law and whether applicable bankruptcy or insolvency laws limit or alter contractual remedies. The legal and regulatory focus on the financial services industry presents a continuing business challenge for the Company.
| 111 | |
| Item 8. | Financial Statements and Supplementary Data. |
REPORT OF INDEPENDENT REGISTERED PUBLIC ACCOUNTING FIRM
To the Board of Directors and Shareholders of Morgan Stanley:
We have audited the accompanying consolidated statements of financial condition of Morgan Stanley and subsidiaries (the "Company") as of December 31, 2009 and 2008, and the consolidated statements of income, comprehensive income, cash flows, and changes in total equity for the calendar year ended December 31, 2009, the one month ended December 31, 2008 and the fiscal years ended November 30, 2008 and 2007. These consolidated financial statements are the responsibility of the Company's management. Our responsibility is to express an opinion on these consolidated financial statements based on our audits.
We conducted our audits in accordance with the standards of the Public Company Accounting Oversight Board (United States). Those standards require that we plan and perform the audit to obtain reasonable assurance about whether the financial statements are free of material misstatement. An audit includes examining, on a test basis, evidence supporting the amounts and disclosures in the financial statements. An audit also includes assessing the accounting principles used and significant estimates made by management, as well as evaluating the overall financial statement presentation. We believe that our audits provide a reasonable basis for our opinion.
In our opinion, such consolidated financial statements present fairly, in all material respects, the financial position of Morgan Stanley and subsidiaries as of December 31, 2009 and 2008, and the results of their operations and their cash flows for the calendar year ended December 31, 2009, the one month ended December 31, 2008 and the fiscal years ended November 30, 2008 and 2007, in conformity with accounting principles generally accepted in the United States of America.
As discussed in Note 1 to the consolidated financial statements, the Company changed its fiscal year end from November 30 to December 31.
As discussed in Note 1 to the consolidated financial statements, effective January 1, 2009, the Company adopted Financial Accounting Standards Board ("FASB") accounting guidance that addresses noncontrolling interests in consolidated financial statements.
As discussed in Note 2 to the consolidated financial statements, effective January 1, 2009, the Company adopted FASB accounting guidance that addresses the computation of Earnings Per Share under the two-class method for share-based payment transactions that are participating securities.
As discussed in Note 2 and Note 20 to the consolidated financial statements, the Company adopted FASB accounting guidance that addresses accounting for uncertainties in income taxes.
We have also audited, in accordance with the standards of the Public Company Accounting Oversight Board (United States), the Company's internal control over financial reporting as of December 31, 2009, based on the criteria established in Internal Control-Integrated Framework issued by the Committee of Sponsoring Organizations of the Treadway Commission and our report dated February 26, 2010, expresses an unqualified opinion on the Company's internal control over financial reporting.
| /s/ Deloitte & Touche LLP |
| New York, New York |
| February 26, 2010 |
| 112 |
MORGAN STANLEY
Consolidated Statements of Financial Condition
(dollars in millions, except share data)
| December 31, 2009 | December 31, 2008 | |||||
Assets | ||||||
Cash and due from banks | $ | 6,988 | $ | 13,354 | ||
Interest bearing deposits with banks | 25,003 | 65,316 | ||||
Cash deposited with clearing organizations or segregated under federal and other regulations or requirements | 23,712 | 24,039 | ||||
Financial instruments owned, at fair value (approximately $101 billion in 2009 and $73 billion in 2008 were pledged to various parties): | ||||||
U.S. government and agency securities | 62,215 | 28,012 | ||||
Other sovereign government obligations | 25,445 | 21,084 | ||||
Corporate and other debt | 90,454 | 87,294 | ||||
Corporate equities | 57,968 | 42,321 | ||||
Derivative and other contracts | 49,081 | 89,418 | ||||
Investments | 9,286 | 10,385 | ||||
Physical commodities | 5,329 | 2,126 | ||||
Total financial instruments owned, at fair value | 299,778 | 280,640 | ||||
Securities received as collateral, at fair value | 13,656 | 5,231 | ||||
Federal funds sold and securities purchased under agreements to resell | 143,208 | 122,709 | ||||
Securities borrowed | 167,501 | 88,052 | ||||
Receivables: | ||||||
Customers | 27,594 | 29,265 | ||||
Brokers, dealers and clearing organizations | 5,719 | 6,250 | ||||
Other loans | 7,259 | 6,547 | ||||
Fees, interest and other | 11,164 | 7,258 | ||||
Other investments | 3,752 | 3,709 | ||||
Premises, equipment and software costs (net of accumulated depreciation of $3,734 in 2009 and $3,073 in 2008) | 7,067 | 5,095 | ||||
Goodwill | 7,162 | 2,256 | ||||
Intangible assets (net of accumulated amortization of $275 in 2009 and $208 in 2008) (includes $137 and $184 at fair value in 2009 and 2008, respectively) | 5,054 | 906 | ||||
Other assets | 16,845 | 16,137 | ||||
Total assets | $ | 771,462 | $ | 676,764 | ||
See Notes to Consolidated Financial Statements.
| 113 | |
MORGAN STANLEY
Consolidated Statements of Financial Condition-(Continued)
(dollars in millions, except share data)
| December 31, 2009 | December 31, 2008 | |||||||
Liabilities and Equity | ||||||||
Commercial paper and other short-term borrowings (includes $791 and $1,246 at fair value in 2009 and 2008, respectively) | $ | 2,378 | $ | 10,102 | ||||
Deposits (includes $4,967 and $9,993 at fair value in 2009 and 2008, respectively) | 62,215 | 51,355 | ||||||
Financial instruments sold, not yet purchased, at fair value: | ||||||||
U.S. government and agency securities | 20,503 | 11,902 | ||||||
Other sovereign government obligations | 18,244 | 9,511 | ||||||
Corporate and other debt | 7,826 | 9,927 | ||||||
Corporate equities | 22,601 | 16,840 | ||||||
Derivative and other contracts | 38,209 | 68,554 | ||||||
Physical commodities | - | 33 | ||||||
Total financial instruments sold, not yet purchased, at fair value | 107,383 | 116,767 | ||||||
Obligation to return securities received as collateral, at fair value | 13,656 | 5,231 | ||||||
Securities sold under agreements to repurchase | 159,401 | 92,213 | ||||||
Securities loaned | 26,246 | 14,580 | ||||||
Other secured financings, at fair value | 8,102 | 12,539 | ||||||
Payables: | ||||||||
Customers | 117,058 | 123,617 | ||||||
Brokers, dealers and clearing organizations | 5,423 | 1,585 | ||||||
Interest and dividends | 2,597 | 3,305 | ||||||
Other liabilities and accrued expenses | 20,849 | 16,179 | ||||||
Long-term borrowings (includes $37,610 and $30,766 at fair value in 2009 and 2008, respectively) | 193,374 | 179,835 | ||||||
| 718,682 | 627,308 | |||||||
Commitments and contingencies | ||||||||
Equity | ||||||||
Morgan Stanley shareholders' equity: | ||||||||
Preferred stock | 9,597 | 19,168 | ||||||
Common stock, $0.01 par value; | ||||||||
Shares authorized: 3,500,000,000 in 2009 and 2008; | ||||||||
Shares issued: 1,487,850,163 in 2009 and 1,211,701,552 in 2008; | ||||||||
Shares outstanding: 1,360,595,214 in 2009 and 1,074,497,565 in 2008 | 15 | 12 | ||||||
Paid-in capital | 8,619 | 459 | ||||||
Retained earnings | 35,056 | 36,154 | ||||||
Employee stock trust | 4,064 | 4,312 | ||||||
Accumulated other comprehensive loss | (560 | ) | (420 | ) | ||||
Common stock held in treasury, at cost, $0.01 par value; 127,254,949 shares in 2009 and 137,203,987 shares in 2008 | (6,039 | ) | (6,620 | ) | ||||
Common stock issued to employee trust | (4,064 | ) | (4,312 | ) | ||||
Total Morgan Stanley shareholders' equity | 46,688 | 48,753 | ||||||
Non-controlling interests | 6,092 | 703 | ||||||
Total equity | 52,780 | 49,456 | ||||||
Total liabilities and equity | $ | 771,462 | $ | 676,764 | ||||
See Notes to Consolidated Financial Statements.
| | 114 |
MORGAN STANLEY
Consolidated Statements of Income
(dollars in millions, except share and per share data)
| 2009 | Fiscal Year 2008 | Fiscal Year 2007 | One Month Ended December 31, 2008 | ||||||||||||
Revenues: | |||||||||||||||
Investment banking | $ | 5,019 | $ | 4,057 | $ | 6,316 | $ | 196 | |||||||
Principal transactions: | |||||||||||||||
Trading | 7,447 | 5,472 | 3,208 | (1,743 | ) | ||||||||||
Investments | (1,054 | ) | (3,925 | ) | 3,247 | (207 | ) | ||||||||
Commissions | 4,234 | 4,449 | 4,659 | 214 | |||||||||||
Asset management, distribution and administration fees | 5,884 | 4,839 | 5,486 | 292 | |||||||||||
Other | 838 | 3,852 | 776 | 107 | |||||||||||
Total non-interest revenues | 22,368 | 18,744 | 23,692 | (1,141 | ) | ||||||||||
Interest and dividends | 7,702 | 39,679 | 60,069 | 1,297 | |||||||||||
Interest expense | 6,712 | 36,312 | 57,283 | 1,124 | |||||||||||
Net interest | 990 | 3,367 | 2,786 | 173 | |||||||||||
Net revenues | 23,358 | 22,111 | 26,478 | (968 | ) | ||||||||||
Non-interest expenses: | |||||||||||||||
Compensation and benefits | 14,438 | 11,887 | 16,122 | 585 | |||||||||||
Occupancy and equipment | 1,551 | 1,332 | 1,112 | 123 | |||||||||||
Brokerage, clearing and exchange fees | 1,190 | 1,483 | 1,493 | 91 | |||||||||||
Information processing and communications | 1,372 | 1,194 | 1,155 | 95 | |||||||||||
Marketing and business development | 503 | 719 | 752 | 34 | |||||||||||
Professional services | 1,603 | 1,715 | 2,039 | 109 | |||||||||||
Other | 1,844 | 2,644 | 1,029 | 22 | |||||||||||
Total non-interest expenses | 22,501 | 20,974 | 23,702 | 1,059 | |||||||||||
Income (loss) from continuing operations before income taxes | 857 | 1,137 | 2,776 | (2,027 | ) | ||||||||||
(Benefit from) provision for income taxes | (336 | ) | (21 | ) | 576 | (732 | ) | ||||||||
Income (loss) from continuing operations | 1,193 | 1,158 | 2,200 | (1,295 | ) | ||||||||||
Discontinued operations: | |||||||||||||||
Gain from discontinued operations | 160 | 1,121 | 1,682 | 18 | |||||||||||
(Benefit from) provision for income taxes | (53 | ) | 501 | 633 | 8 | ||||||||||
Net gain from discontinued operations | 213 | 620 | 1,049 | 10 | |||||||||||
Net income (loss) | $ | 1,406 | $ | 1,778 | $ | 3,249 | $ | (1,285 | ) | ||||||
Net income applicable to non-controlling interests | 60 | 71 | 40 | 3 | |||||||||||
Net income (loss) applicable to Morgan Stanley | $ | 1,346 | $ | 1,707 | $ | 3,209 | $ | (1,288 | ) | ||||||
(Loss) earnings applicable to Morgan Stanley common shareholders | $ | (907 | ) | $ | 1,495 | $ | 2,976 | $ | (1,624 | ) | |||||
Amounts applicable to Morgan Stanley: | |||||||||||||||
Income (loss) from continuing operations | $ | 1,149 | $ | 1,125 | $ | 2,162 | $ | (1,295 | ) | ||||||
Net gain from discontinued operations | 197 | 582 | 1,047 | 7 | |||||||||||
Net income (loss) applicable to Morgan Stanley | $ | 1,346 | $ | 1,707 | $ | 3,209 | $ | (1,288 | ) | ||||||
(Loss) earnings per basic common share: | |||||||||||||||
(Loss) income from continuing operations | $ | (0.93 | ) | $ | 0.92 | $ | 1.98 | $ | (1.63 | ) | |||||
Net gain from discontinued operations | 0.16 | 0.53 | 0.99 | 0.01 | |||||||||||
(Loss) earnings per basic common share | $ | (0.77 | ) | $ | 1.45 | $ | 2.97 | $ | (1.62 | ) | |||||
(Loss) earnings per diluted common share: | |||||||||||||||
Income (loss) from continuing operations | $ | (0.93 | ) | $ | 0.88 | $ | 1.94 | $ | (1.63 | ) | |||||
Net gain from discontinued operations | 0.16 | 0.51 | 0.96 | 0.01 | |||||||||||
(Loss) earnings per diluted common share | $ | (0.77 | ) | $ | 1.39 | $ | 2.90 | $ | (1.62 | ) | |||||
Average common shares outstanding: | |||||||||||||||
Basic | 1,185,414,871 | 1,028,180,275 | 1,001,878,651 | 1,002,058,928 | |||||||||||
Diluted | 1,185,414,871 | 1,073,496,349 | 1,024,836,645 | 1,002,058,928 | |||||||||||
See Notes to Consolidated Financial Statements.
| 115 | |
MORGAN STANLEY
Consolidated Statements of Comprehensive Income
(dollars in millions)
| 2009 | Fiscal Year 2008 | Fiscal Year 2007 | One Month Ended December 31, 2008 | |||||||||||||
Net income (loss) | $ | 1,406 | $ | 1,778 | $ | 3,249 | $ | (1,285 | ) | |||||||
Other comprehensive income (loss), net of tax: | ||||||||||||||||
Foreign currency translation adjustments(1) | 112 | (270 | ) | 187 | (96 | ) | ||||||||||
Net change in cash flow hedges(2) | 13 | 16 | 19 | 2 | ||||||||||||
Minimum pension liability adjustment(3) | - | - | (40 | ) | - | |||||||||||
Net (loss) gain related to pension and postretirement adjustments(4) | (305 | ) | 203 | - | (200 | ) | ||||||||||
Prior service credit related to pension and postretirement adjustments(5) | 10 | - | - | - | ||||||||||||
Amortization of net loss related to pension and postretirement benefits(6) | 28 | 19 | - | - | ||||||||||||
Amortization of prior service credit related to pension and postretirement benefits(7) | (6 | ) | (6 | ) | - | (1 | ) | |||||||||
Comprehensive income (loss) | $ | 1,258 | $ | 1,740 | $ | 3,415 | $ | (1,580 | ) | |||||||
Net income applicable to non-controlling interests | 60 | 71 | 40 | 3 | ||||||||||||
Other comprehensive (loss) income applicable to non-controlling interests | (8 | ) | (110 | ) | 122 | - | ||||||||||
Comprehensive income (loss) applicable to Morgan Stanley | $ | 1,206 | $ | 1,779 | $ | 3,253 | $ | (1,583 | ) | |||||||
| (1) | Amounts are net of (benefit from) provision for income taxes of $(335) million, $388 million, $(132) million and $(52) million for 2009, fiscal 2008, fiscal 2007 and the one month ended December 31, 2008, respectively. |
| (2) | Amounts are net of provision for income taxes of $8 million, $11 million, $10 million and $1 million for 2009, fiscal 2008, fiscal 2007 and the one month ended December 31, 2008, respectively. |
| (3) | Amounts are net of income tax benefits of $(16) million for fiscal 2007. |
| (4) | Amount is net of (benefit from) provision for income taxes of $(179) million, $138 million and $(132) million for 2009, fiscal 2008 and the one month ended December 31, 2008, respectively. |
| (5) | Amount is net of provision for income taxes of $6 million. |
| (6) | Amount is net of provision for income taxes of $16 million and $13 million for 2009 and fiscal 2008, respectively. |
| (7) | Amount is net of income tax benefits of $(4) million for 2009 and fiscal 2008, respectively. |
See Notes to Consolidated Financial Statements.
| | 116 |
MORGAN STANLEY
Consolidated Statements of Cash Flows
(dollars in millions)
| 2009 | Fiscal Year 2008 | Fiscal Year 2007 | One Month Ended December 31, 2008 | |||||||||||||
CASH FLOWS FROM OPERATING ACTIVITIES | ||||||||||||||||
Net income (loss) | $ | 1,406 | $ | 1,778 | $ | 3,249 | $ | (1,285 | ) | |||||||
Adjustments to reconcile net income to net cash (used for) provided by operating activities: | ||||||||||||||||
Deferred income taxes | (932 | ) | (1,224 | ) | (1,669 | ) | (781 | ) | ||||||||
Compensation payable in common stock and options | 1,265 | 1,838 | 1,927 | 77 | ||||||||||||
Depreciation and amortization | 1,224 | 794 | 475 | 104 | ||||||||||||
Provision for consumer loan losses | - | - | 478 | - | ||||||||||||
Gains on business dispositions | (606 | ) | (2,232 | ) | (168 | ) | - | |||||||||
Gain on repurchase of long-term debt | (491 | ) | (2,252 | ) | - | (73 | ) | |||||||||
Insurance settlement | - | - | (38 | ) | - | |||||||||||
Impairment charges and other-than-temporary impairment charges | 823 | 1,238 | 437 | - | ||||||||||||
Changes in assets and liabilities: | ||||||||||||||||
Cash deposited with clearing organizations or segregated under federal and other regulations or requirements | 211 | 5,001 | (9,334 | ) | 1,407 | |||||||||||
Financial instruments owned, net of financial instruments sold, not yet purchased | (26,130 | ) | 78,486 | (25,361 | ) | 2,412 | ||||||||||
Securities borrowed | (79,449 | ) | 154,209 | 59,637 | (2,267 | ) | ||||||||||
Securities loaned | 11,666 | (95,602 | ) | (39,834 | ) | (241 | ) | |||||||||
Receivables and other assets | (2,445 | ) | 54,531 | (3,973 | ) | 1,479 | ||||||||||
Payables and other liabilities | 818 | (114,531 | ) | 71,092 | 11,481 | |||||||||||
Federal funds sold and securities purchased under agreements to resell | (20,499 | ) | 51,822 | 26,194 | (16,290 | ) | ||||||||||
Securities sold under agreements to repurchase | 67,188 | (60,439 | ) | (105,361 | ) | (10,188 | ) | |||||||||
Net cash (used for) provided by operating activities | (45,951 | ) | 73,417 | (22,249 | ) | (14,165 | ) | |||||||||
CASH FLOWS FROM INVESTING ACTIVITIES | ||||||||||||||||
Net (payments for) proceeds from: | ||||||||||||||||
Premises, equipment and software costs | (2,877 | ) | (1,400 | ) | (1,469 | ) | (107 | ) | ||||||||
Business acquisitions, net of cash acquired | (2,160 | ) | (174 | ) | (1,169 | ) | - | |||||||||
Business dispositions, net of cash disposed | 565 | 743 | 476 | - | ||||||||||||
Net principal disbursed on consumer loans | - | - | (4,776 | ) | - | |||||||||||
Sales of consumer loans | - | - | 5,301 | - | ||||||||||||
Purchases of securities available for sale | - | - | (14,073 | ) | - | |||||||||||
Sales of securities available for sale | - | - | 4,272 | - | ||||||||||||
Net cash provided by (used for) investing activities | (4,472 | ) | (831 | ) | (11,438 | ) | (107 | ) | ||||||||
CASH FLOWS FROM FINANCING ACTIVITIES | ||||||||||||||||
Net (payments for) proceeds from: | ||||||||||||||||
Short-term borrowings | (7,724 | ) | (24,012 | ) | 8,274 | (381 | ) | |||||||||
Derivatives financing activities | (85 | ) | 962 | (859 | ) | (3,354 | ) | |||||||||
Other secured financings | (4,437 | ) | (15,246 | ) | (24,231 | ) | 12 | |||||||||
Deposits | 10,860 | 11,576 | 23,099 | 8,600 | ||||||||||||
Excess tax benefits associated with stock-based awards | 102 | 47 | 281 | - | ||||||||||||
Net proceeds from: | ||||||||||||||||
Non-controlling interests | - | 1,560 | 265 | - | ||||||||||||
Morgan Stanley public offerings of common stock | 6,212 | - | - | - | ||||||||||||
Issuance of preferred stock and common stock warrant | - | 18,997 | - | - | ||||||||||||
Issuance of common stock | 43 | 397 | 927 | 4 | ||||||||||||
Issuance of long-term borrowings | 43,960 | 42,331 | 74,540 | 13,590 | ||||||||||||
Issuance of junior subordinated debentures related to China Investment Corporation | - | 5,579 | - | - | ||||||||||||
Payments for: | ||||||||||||||||
Long-term borrowings | (33,175 | ) | (56,120 | ) | (33,120 | ) | (5,694 | ) | ||||||||
Series D Preferred stock and warrant | (10,950 | ) | - | - | - | |||||||||||
Redemption of capital units | - | - | (66 | ) | - | |||||||||||
Repurchases of common stock through capital management share repurchase program | - | (711 | ) | (3,753 | ) | - | ||||||||||
Repurchases of common stock for employee tax withholding | (50 | ) | (1,117 | ) | (438 | ) | (3 | ) | ||||||||
Cash distribution in connection with the Discover Spin-off | - | - | (5,615 | ) | - | |||||||||||
Cash dividends | (1,732 | ) | (1,227 | ) | (1,219 | ) | - | |||||||||
Net cash (used for) provided by financing activities | 3,024 | (16,984 | ) | 38,085 | 12,774 | |||||||||||
Effect of exchange rate changes on cash and cash equivalents | 720 | (2,546 | ) | 594 | 1,514 | |||||||||||
Net (decrease) increase in cash and cash equivalents | (46,679 | ) | 53,056 | 4,992 | 16 | |||||||||||
Cash and cash equivalents, at beginning of period | 78,670 | 25,598 | 20,606 | 78,654 | ||||||||||||
Cash and cash equivalents, at end of period | $ | 31,991 | $ | 78,654 | $ | 25,598 | $ | 78,670 | ||||||||
Cash and cash equivalents include: | ||||||||||||||||
Cash and due from banks | $ | 6,988 | $ | 11,276 | $ | 7,248 | $ | 13,354 | ||||||||
Interest bearing deposits with banks | 25,003 | 67,378 | 18,350 | 65,316 | ||||||||||||
Cash and cash equivalents, at end of period | $ | 31,991 | $ | 78,654 | $ | 25,598 | $ | 78,670 | ||||||||
SUPPLEMENTAL DISCLOSURE OF CASH FLOW INFORMATION
Cash payments for interest were $7,605 million, $35,587 million, $59,955 million and $1,111 million for 2009, fiscal 2008, fiscal 2007 and the one month ended December 31, 2008, respectively.
Cash payments for income taxes were $1,028 million, $1,406 million, $3,404 million and $113 million for 2009, fiscal 2008, fiscal 2007 and the one month ended December 31, 2008, respectively.
See Notes to Consolidated Financial Statements.
| 117 | |
MORGAN STANLEY
Consolidated Statements of Changes in Total Equity
(dollars in millions)
| Preferred Stock | Common Stock | Paid-in Capital | Retained Earnings | Employee Stock Trust | Accumulated Other Comprehensive Income (Loss) | Common Stock Held in Treasury at Cost | Common Stock Issued to Employee Trust | Non- controlling Interests | Total Equity | |||||||||||||||||||||||||||||
BALANCE AT NOVEMBER 30, 2006 | $ | 1,100 | $ | 12 | $ | 2,213 | $ | 41,422 | $ | 4,315 | $ | (35 | ) | $ | (9,348 | ) | $ | (4,315 | ) | $ | 2,620 | $ | 37,984 | |||||||||||||||
Fair value adjustment | - | - | - | 186 | - | - | - | - | - | 186 | ||||||||||||||||||||||||||||
Net income | - | - | - | 3,209 | - | - | - | - | 40 | 3,249 | ||||||||||||||||||||||||||||
Dividends | - | - | - | (1,219 | ) | - | - | - | - | (57 | ) | (1,276 | ) | |||||||||||||||||||||||||
Shares issued under employee plans and related tax effects | - | - | 420 | 5 | 1,254 | - | 2,857 | (1,254 | ) | - | 3,282 | |||||||||||||||||||||||||||
Repurchases of common stock | - | - | - | - | - | - | (4,070 | ) | - | - | (4,070 | ) | ||||||||||||||||||||||||||
Net change in cash flow hedges | - | - | - | - | - | 19 | - | - | - | 19 | ||||||||||||||||||||||||||||
Minimum pension liability adjustment | - | - | - | - | - | (40 | ) | - | - | - | (40 | ) | ||||||||||||||||||||||||||
Pension adjustment | - | - | - | - | - | (208 | ) | - | - | - | (208 | ) | ||||||||||||||||||||||||||
Foreign currency translation adjustments | - | - | - | - | - | 65 | - | - | 122 | 187 | ||||||||||||||||||||||||||||
MSCI Inc. initial public offering | - | - | 239 | - | - | - | - | - | - | 239 | ||||||||||||||||||||||||||||
Discover Spin-off | - | - | (970 | ) | (5,558 | ) | - | - | 970 | - | - | (5,558 | ) | |||||||||||||||||||||||||
Other changes in non-controlling interests: | ||||||||||||||||||||||||||||||||||||||
Issuances of shares by subsidiaries | - | - | - | - | - | - | - | - | 219 | 219 | ||||||||||||||||||||||||||||
Acquisitions of subsidiaries | - | - | - | - | - | - | - | - | 741 | 741 | ||||||||||||||||||||||||||||
Repurchases of subsidiaries' shares by Morgan Stanley | - | - | - | - | - | - | - | - | (2,044 | ) | (2,044 | ) | ||||||||||||||||||||||||||
Decrease in non-controlling interests related to disposition of a subsidiary | - | - | - | - | - | - | - | - | (10 | ) | (10 | ) | ||||||||||||||||||||||||||
Other | - | - | - | - | - | - | - | - | (3 | ) | (3 | ) | ||||||||||||||||||||||||||
BALANCE AT NOVEMBER 30, 2007 | 1,100 | 12 | 1,902 | 38,045 | 5,569 | (199 | ) | (9,591 | ) | (5,569 | ) | 1,628 | 32,897 | |||||||||||||||||||||||||
Net income | - | - | - | 1,707 | - | - | - | - | 71 | 1,778 | ||||||||||||||||||||||||||||
Dividends | - | - | - | (1,227 | ) | - | - | - | - | (71 | ) | (1,298 | ) | |||||||||||||||||||||||||
Shares issued under employee plans and related tax effects | - | - | (1,142 | ) | - | (1,668 | ) | - | 3,493 | 1,668 | - | 2,351 | ||||||||||||||||||||||||||
Repurchases of common stock | - | - | - | - | - | - | (1,828 | ) | - | - | (1,828 | ) | ||||||||||||||||||||||||||
Issuance of preferred stock and common stock warrant | 18,055 | - | 957 | (15 | ) | - | - | - | - | - | 18,997 | |||||||||||||||||||||||||||
Net change in cash flow hedges | - | - | - | - | - | 16 | - | - | - | 16 | ||||||||||||||||||||||||||||
Pension adjustment | - | - | - | (15 | ) | - | 2 | - | - | - | (13 | ) | ||||||||||||||||||||||||||
Pension and postretirement adjustments | - | - | - | - | - | 216 | - | - | - | 216 | ||||||||||||||||||||||||||||
Tax adjustment | - | - | - | (92 | ) | - | - | - | - | - | (92 | ) | ||||||||||||||||||||||||||
Foreign currency translation adjustments | - | - | - | - | - | (160 | ) | - | - | (110 | ) | (270 | ) | |||||||||||||||||||||||||
Equity Units | - | - | (405 | ) | - | - | - | - | - | - | (405 | ) | ||||||||||||||||||||||||||
Reclassification of negative additional paid-in capital to retained earnings | - | - | 307 | (307 | ) | - | - | - | - | - | - | |||||||||||||||||||||||||||
Other changes in non-controlling interests: | ||||||||||||||||||||||||||||||||||||||
Sales of subsidiaries' shares by Morgan Stanley | - | - | - | - | - | - | - | - | 132 | 132 | ||||||||||||||||||||||||||||
Acquisitions of subsidiaries | - | - | - | - | - | - | - | - | 9 | 9 | ||||||||||||||||||||||||||||
Repurchases of subsidiaries' shares by Morgan Stanley | - | - | - | - | - | - | - | - | (445 | ) | (445 | ) | ||||||||||||||||||||||||||
Decrease in non-controlling interests related to disposition of a subsidiary | - | - | - | - | - | - | - | - | (514 | ) | (514 | ) | ||||||||||||||||||||||||||
Other | - | - | - | - | - | - | - | - | 5 | 5 | ||||||||||||||||||||||||||||
BALANCE AT NOVEMBER 30, 2008 | 19,155 | 12 | 1,619 | 38,096 | 3,901 | (125 | ) | (7,926 | ) | (3,901 | ) | 705 | 51,536 | |||||||||||||||||||||||||
Net (loss) income | - | - | - | (1,288 | ) | - | - | - | - | 3 | (1,285 | ) | ||||||||||||||||||||||||||
Dividends | - | - | - | (641 | ) | - | - | - | - | (5 | ) | (646 | ) | |||||||||||||||||||||||||
Shares issued under employee plans and related tax effects | - | - | (1,160 | ) | - | 411 | - | 1,309 | (411 | ) | - | 149 | ||||||||||||||||||||||||||
Repurchases of common stock | - | - | - | - | - | - | (3 | ) | - | - | (3 | ) | ||||||||||||||||||||||||||
Preferred stock accretion | 13 | - | - | (13 | ) | - | - | - | - | - | - | |||||||||||||||||||||||||||
Net change in cash flow hedges | - | - | - | - | - | 2 | - | - | - | 2 | ||||||||||||||||||||||||||||
Pension and postretirement adjustments | - | - | - | - | - | (201 | ) | - | - | - | (201 | ) | ||||||||||||||||||||||||||
Foreign currency translation adjustments | - | - | - | - | - | (96 | ) | - | - | - | (96 | ) | ||||||||||||||||||||||||||
BALANCE AT DECEMBER 31, 2008 | $ | 19,168 | $ | 12 | $ | 459 | $ | 36,154 | $ | 4,312 | $ | (420 | ) | $ | (6,620 | ) | $ | (4,312 | ) | $ | 703 | $ | 49,456 | |||||||||||||||
See Notes to Consolidated Financial Statements.
| | 118 |
MORGAN STANLEY
Consolidated Statements of Changes in Total Equity-(Continued)
(dollars in millions)
| Preferred Stock | Common Stock | Paid-in Capital | Retained Earnings | Employee Stock Trust | Accumulated Other Comprehensive Income (Loss) | Common Stock Held in Treasury at Cost | Common Stock Issued to Employee Trust | Non- controlling Interests | Total Equity | ||||||||||||||||||||||||||||||
BALANCE AT DECEMBER 31, 2008 | $ | 19,168 | $ | 12 | $ | 459 | $ | 36,154 | $ | 4,312 | $ | (420 | ) | $ | (6,620 | ) | $ | (4,312 | ) | $ | 703 | $ | 49,456 | ||||||||||||||||
Net income | - | - | - | 1,346 | - | - | - | - | 60 | 1,406 | |||||||||||||||||||||||||||||
Dividends | - | - | - | (1,310 | ) | - | - | - | - | (23 | ) | (1,333 | ) | ||||||||||||||||||||||||||
Shares issued under employee plans and related tax effects | - | - | 485 | - | (248 | ) | - | 631 | 248 | - | 1,116 | ||||||||||||||||||||||||||||
Repurchases of common stock | - | - | - | - | - | - | (50 | ) | - | - | (50 | ) | |||||||||||||||||||||||||||
Morgan Stanley public offerings of common stock | - | 3 | 6,209 | - | - | - | - | - | - | 6,212 | |||||||||||||||||||||||||||||
Series C Preferred Stock extinguished and exchanged for common stock | (503 | ) | - | 705 | (202 | ) | - | - | - | - | - | - | |||||||||||||||||||||||||||
Series D Preferred Stock and Warrant | (9,068 | ) | - | (950 | ) | (932 | ) | - | - | - | - | - | (10,950 | ) | |||||||||||||||||||||||||
Gain on Morgan Stanley Smith Barney transaction | - | - | 1,711 | - | - | - | - | - | - | 1,711 | |||||||||||||||||||||||||||||
Net change in cash flow hedges | - | - | - | - | - | 13 | - | - | - | 13 | |||||||||||||||||||||||||||||
Pension and postretirement adjustments | - | - | - | - | - | (269 | ) | - | - | (4 | ) | (273 | ) | ||||||||||||||||||||||||||
Foreign currency translation adjustments | - | - | - | - | - | 116 | - | - | (4 | ) | 112 | ||||||||||||||||||||||||||||
Increase in non-controlling interests related to Morgan Stanley Smith Barney transaction | - | - | - | - | - | - | - | - | 4,825 | 4,825 | |||||||||||||||||||||||||||||
Increase in non-controlling interests related to the consolidation of certain real estate funds sponsored by the Company | - | - | - | - | - | - | - | - | 724 | 724 | |||||||||||||||||||||||||||||
Decrease in non-controlling interests related to disposition of a subsidiary | - | - | - | - | - | - | - | - | (229 | ) | (229 | ) | |||||||||||||||||||||||||||
Other increases in non-controlling interests | - | - | - | - | - | - | - | - | 40 | 40 | |||||||||||||||||||||||||||||
BALANCE AT DECEMBER 31, 2009 | $ | 9,597 | $ | 15 | $ | 8,619 | $ | 35,056 | $ | 4,064 | $ | (560 | ) | $ | (6,039 | ) | $ | (4,064 | ) | $ | 6,092 | $ | 52,780 | ||||||||||||||||
See Notes to Consolidated Financial Statements.
| 119 | |
MORGAN STANLEY
NOTES TO CONSOLIDATED FINANCIAL STATEMENTS
1. Introduction and Basis of Presentation
The Company. Morgan Stanley (or the "Company"), a financial holding company, is a global financial services firm that maintains significant market positions in each of its business segments-Institutional Securities, Global Wealth Management Group and Asset Management.
A summary of the activities of each of the Company's business segments is as follows:
Institutional Securities includes capital raising; financial advisory services, including advice on mergers and acquisitions, restructurings, real estate and project finance; corporate lending; sales, trading, financing and market-making activities in equity and fixed income securities and related products, including foreign exchange and commodities; and investment activities.
Global Wealth Management Group , which includes the Company's 51% interest in Morgan Stanley Smith Barney Holdings LLC ("MSSB") (see Note 3), provides brokerage and investment advisory services to individual investors and small-to-medium sized businesses and institutions covering various investment alternatives; financial and wealth planning services; annuity and other insurance products; credit and other lending products; cash management services; retirement services; and trust and fiduciary services.
Asset Management provides global asset management products and services in equity, fixed income, alternative investments, which includes hedge funds and funds of funds, and merchant banking, which includes real estate, private equity and infrastructure, to institutional and retail clients through proprietary and third-party distribution channels. Asset Management also engages in investment activities.
Change in Fiscal Year-End.
On December 16, 2008, the Board of Directors of the Company approved a change in the Company's fiscal year- end from November 30 to December 31 of each year. This change to the calendar year reporting cycle began January 1, 2009. As a result of the change, the Company had a one-month transition period in December 2008.
Included in this report is the Company's consolidated statements of financial condition as of December 31, 2009 and December 31, 2008; the consolidated statements of income, comprehensive income, cash flows and changes in total equity for the 12 months ended December 31, 2009 ("2009"), November 30, 2008 ("fiscal 2008") and November 30, 2007 ("fiscal 2007") and the one month ended December 31, 2008.
Discontinued Operations.
Retail Asset Management Business. On October 19, 2009, as part of a restructuring of its Asset Management business segment, the Company entered into a definitive agreement to sell substantially all of its retail asset management business ("Retail Asset Management"), including Van Kampen Investments, Inc., ("Van Kampen"), to Invesco Ltd. ("Invesco"). This transaction allows the Company's Asset Management business segment to focus on its institutional client base, including corporations, pension plans, large intermediaries, foundations and endowments, sovereign wealth funds and central banks, among others.
Under the terms of the definitive agreement, Invesco will purchase substantially all of Retail Asset Management, operating under both the Morgan Stanley and Van Kampen brands, in a stock and cash transaction. The Company will receive a 9.4% minority interest in Invesco. The transaction, which has been approved by the Boards of Directors of both companies, is expected to close in mid-2010, subject to customary regulatory, client and fund shareholder approvals. The results of Retail Asset Management are reported as discontinued operations for all periods presented.
| | 120 |
MORGAN STANLEY
NOTES TO CONSOLIDATED FINANCIAL STATEMENTS-(Continued)
MSCI Inc . In May 2009, the Company divested all of its remaining ownership interest in MSCI Inc. ("MSCI"). The results of MSCI are reported as discontinued operations for all periods presented. The results of MSCI were formerly included within the Institutional Securities business segment.
Crescent. Discontinued operations in 2009, fiscal 2008 and the one month ended December 31, 2008 include operating results and gains (losses) related to the disposition of Crescent Real Estate Equities Limited Partnership ("Crescent"), a former real estate subsidiary of the Company. The Company completed the disposition of Crescent in the fourth quarter of 2009, whereby the Company transferred its ownership interest in Crescent to Crescent's primary creditor in exchange for full release of liability on the related loans. The results of Crescent were formerly included in the Asset Management business segment.
Discover. On June 30, 2007, the Company completed the spin-off (the "Discover Spin-off") of its business segment Discover Financial Services ("DFS") to its shareholders. The results of DFS are reported as discontinued operations for all periods presented through the date of the Discover Spin-off. Fiscal 2008 included costs related to a legal settlement between DFS, VISA and MasterCard. See Note 27 for further information regarding settlement with DFS.
Quilter Holdings Ltd. The results of Quilter Holdings Ltd. ("Quilter"), Global Wealth Management Group's former mass affluent business in the United Kingdom ("U.K."), are also reported as discontinued operations for all periods presented through its sale to Citigroup Inc. ("Citi") on February 28, 2007. Citi subsequently contributed Quilter to the MSSB joint venture. The results of MSSB are included within the Global Wealth Management Group business segment's income from continuing operations effective May 31, 2009.
See Note 23 for additional information on discontinued operations.
Basis of Financial Information. The consolidated financial statements for 2009, fiscal 2008, fiscal 2007 and the one month ended December 31, 2008 are prepared in accordance with accounting principles generally accepted in the U.S., which require the Company to make estimates and assumptions regarding the valuations of certain financial instruments, the valuation of goodwill, tax matters and other matters that affect the consolidated financial statements and related disclosures. The Company believes that the estimates utilized in the preparation of the consolidated financial statements are prudent and reasonable. Actual results could differ materially from these estimates.
All material intercompany balances and transactions have been eliminated.
Consolidation . The consolidated financial statements include the accounts of the Company, its wholly owned subsidiaries and other entities in which the Company has a controlling financial interest, including certain variable interest entities ("VIEs"). The Company adopted accounting guidance for non-controlling interests on January 1, 2009. Accordingly, for consolidated subsidiaries that are less than wholly owned, the third-party holdings of equity interests are referred to as non-controlling interests. The portion of net income attributable to non-controlling interests for such subsidiaries is presented as Net income (loss) applicable to non-controlling interests on the consolidated statements of income, and the portion of the shareholders' equity of such subsidiaries is presented as Non-controlling interests in the consolidated statements of financial condition and consolidated statements of changes in total equity.
For entities where (1) the total equity investment at risk is sufficient to enable the entity to finance its activities independently and (2) the equity holders bear the economic residual risks of the entity and have the right to make decisions about the entity's activities, the Company consolidates those entities it controls through a majority voting interest or otherwise. For entities that do not meet these criteria, commonly known as VIEs, the Company consolidates those entities where the Company is deemed to be the primary beneficiary when it absorbs a majority of the expected losses or a majority of the expected residual returns, or both, of such entities.
| 121 | |
MORGAN STANLEY
NOTES TO CONSOLIDATED FINANCIAL STATEMENTS-(Continued)
Notwithstanding the above, under accounting guidance prior to January 1, 2010, certain securitization vehicles, commonly known as qualifying special purpose entities ("QSPEs"), were not consolidated by the Company if they met certain criteria regarding the types of assets and derivatives they could hold, the types of sales they could engage in and the range of discretion they could exercise in connection with the assets they held (see Note 6).
For investments in entities in which the Company does not have a controlling financial interest but has significant influence over operating and financial decisions, the Company generally applies the equity method of accounting with net gains and losses recorded within Other revenues. Where the Company has elected to measure certain eligible investments at fair value in accordance with the fair value option, net gains and losses are recorded within Principal transactions-investments (see Note 4).
Equity and partnership interests held by entities qualifying for accounting purposes as investment companies are carried at fair value.
The Company's significant regulated U.S. and international subsidiaries include Morgan Stanley & Co. Incorporated ("MS&Co."), Morgan Stanley Smith Barney LLC, Morgan Stanley & Co. International plc ("MSIP"), Morgan Stanley Japan Securities Co., Ltd. ("MSJS"), Morgan Stanley Bank, N.A. and Morgan Stanley Investment Advisors Inc.
Income Statement Presentation . The Company, through its subsidiaries and affiliates, provides a wide variety of products and services to a large and diversified group of clients and customers, including corporations, governments, financial institutions and individuals. In connection with the delivery of the various products and services to clients, the Company manages its revenues and related expenses in the aggregate. As such, when assessing the performance of its businesses, the Company considers its principal trading, investment banking, commissions, and interest and dividend income, along with the associated interest expense, as one integrated activity for each of the Company's separate businesses.
The Company made an immaterial adjustment to eliminate $1,021 million of interest revenue and interest expense (approximate 2.6% average decrease in each line item) on certain intercompany transactions for fiscal 2008, which had not been eliminated in error. There was no impact on net interest, net revenue or net income on the consolidated statement of income.
2. Summary of Significant Accounting Policies.
Revenue Recognition.
Investment Banking. Underwriting revenues and advisory fees from mergers, acquisitions and restructuring transactions are recorded when services for the transactions are determined to be substantially completed, generally as set forth under the terms of the engagement. Transaction-related expenses, primarily consisting of legal, travel and other costs directly associated with the transaction, are deferred and recognized in the same period as the related investment banking transaction revenue. Underwriting revenues are presented net of related expenses. Non-reimbursed expenses associated with advisory transactions are recorded within Non-interest expenses.
Commissions. The Company generates commissions from executing and clearing customer transactions on stock, options and futures markets. Commission revenues are recognized in the accounts on trade date.
Asset Management, Distribution and Administration Fees. Asset management, distribution and administration fees are recognized over the relevant contract period. Sales commissions paid by the Company in connection with the sale of certain classes of shares of its open-end mutual fund products are accounted for as deferred commission assets. The Company periodically tests the deferred commission assets for recoverability based on cash flows expected to be received in future periods. In certain management fee arrangements, the Company is entitled to receive performance-based fees (also referred to as incentive fees) when the return on assets under management exceeds certain benchmark returns or other performance targets. In such arrangements, performance
| | 122 |
MORGAN STANLEY
NOTES TO CONSOLIDATED FINANCIAL STATEMENTS-(Continued)
fee revenue is accrued (or reversed) quarterly based on measuring account/fund performance to date versus the performance benchmark stated in the investment management agreement. Performance-based fees are recorded within Principal transactions-investment revenues or Asset management, distribution and administration fees depending on the nature of the arrangement.
Principal Transactions. See "Financial Instruments and Fair Value" below for principal transactions revenue recognition discussions.
Financial Instruments and Fair Value.
A significant portion of the Company's financial instruments is carried at fair value with changes in fair value recognized in earnings each period. A description of the Company's policies regarding fair value measurement and its application to these financial instruments follows.
Financial Instruments Measured at Fair Value. All of the instruments within Financial instruments owned and Financial instruments sold, not yet purchased, are measured at fair value, either through the fair value option election (discussed below) or as required by other accounting pronouncements. These financial instruments primarily represent the Company's trading and investment activities and include both cash and derivative products. In addition, Securities received as collateral and Obligation to return securities received as collateral are measured at fair value as required by other accounting pronouncements. Additionally, certain Commercial paper and other short-term borrowings (primarily structured notes), certain Deposits, Other secured financings and certain Long-term borrowings (primarily structured notes and certain junior subordinated debentures) are measured at fair value through the fair value option election.
Gains and losses on all of these instruments carried at fair value are reflected in Principal transactions-trading revenues, Principal transactions-investment revenues or Investment banking revenues in the consolidated statements of income, except for derivatives accounted for as hedges (see "Hedge Accounting" section herein and Note 10). Interest income and expense and dividend income are recorded within the consolidated statements of income depending on the nature of the instrument and related market conventions. When interest and dividends are included as a component of the instruments' fair value, interest and dividends are included within Principal transactions-trading revenues or Principal transactions-investment revenues. Otherwise, they are included within Interest and dividend income or Interest expense. The fair value of over-the-counter ("OTC") financial instruments, including derivative contracts related to financial instruments and commodities, is presented in the accompanying consolidated statements of financial condition on a net-by-counterparty basis, when appropriate. Additionally, the Company nets fair value of cash collateral paid or received against fair value amounts recognized for net derivative positions executed with the same counterparty under the same master netting arrangement.
Fair Value Option . The fair value option permits the irrevocable fair value option election on an instrument-by-instrument basis at initial recognition of an asset or liability or upon an event that gives rise to a new basis of accounting for that instrument. The Company applies the fair value option for eligible instruments, including certain loans and lending commitments, certain equity method investments, certain structured notes, certain junior subordinated debentures, certain time deposits and certain other secured financings.
Fair Value Measurement-Definition and Hierarchy . Fair value is defined as the price that would be received to sell an asset or paid to transfer a liability ( i.e. , the "exit price") in an orderly transaction between market participants at the measurement date.
In determining fair value, the Company uses various valuation approaches and establishes a hierarchy for inputs used in measuring fair value that maximizes the use of relevant observable inputs and minimizes the use of unobservable inputs by requiring that the most observable inputs be used when available. Observable inputs are
| 123 | |
MORGAN STANLEY
NOTES TO CONSOLIDATED FINANCIAL STATEMENTS-(Continued)
inputs that market participants would use in pricing the asset or liability developed based on market data obtained from sources independent of the Company. Unobservable inputs are inputs that reflect the Company's assumptions about the assumptions other market participants would use in pricing the asset or liability developed based on the best information available in the circumstances. The hierarchy is broken down into three levels based on the observability of inputs as follows:
| • | Level 1-Valuations based on quoted prices in active markets for identical assets or liabilities that the Company has the ability to access. Valuation adjustments and block discounts are not applied to Level 1 instruments. Since valuations are based on quoted prices that are readily and regularly available in an active market, valuation of these products does not entail a significant degree of judgment. |
| • | Level 2-Valuations based on one or more quoted prices in markets that are not active or for which all significant inputs are observable, either directly or indirectly. |
| • | Level 3-Valuations based on inputs that are unobservable and significant to the overall fair value measurement. |
The availability of observable inputs can vary from product to product and is affected by a wide variety of factors, including, for example, the type of product, whether the product is new and not yet established in the marketplace, the liquidity of markets and other characteristics particular to the transaction. To the extent that valuation is based on models or inputs that are less observable or unobservable in the market, the determination of fair value requires more judgment. Accordingly, the degree of judgment exercised by the Company in determining fair value is greatest for instruments categorized in Level 3.
The Company uses prices and inputs that are current as of the measurement date, including during periods of market dislocation. In periods of market dislocation, the observability of prices and inputs may be reduced for many instruments. This condition could cause an instrument to be reclassified from Level 1 to Level 2 or Level 2 to Level 3 (see Note 4). In addition, a downturn in market conditions could lead to further declines in the valuation of many instruments.
In certain cases, the inputs used to measure fair value may fall into different levels of the fair value hierarchy. In such cases, for disclosure purposes the level in the fair value hierarchy within which the fair value measurement falls in its entirety is determined based on the lowest level input that is significant to the fair value measurement in its entirety.
Valuation Techniques . Many cash and OTC contracts have bid and ask prices that can be observed in the marketplace. Bid prices reflect the highest price that a party is willing to pay for an asset. Ask prices represent the lowest price that a party is willing to accept for an asset. For financial instruments whose inputs are based on bid-ask prices, the Company does not require that the fair value estimate always be a predetermined point in the bid-ask range. The Company's policy is to allow for mid-market pricing and adjusting to the point within the bid-ask range that meets the Company's best estimate of fair value. For offsetting positions in the same financial instrument, the same price within the bid-ask spread is used to measure both the long and short positions.
Fair value for many cash and OTC contracts is derived using pricing models. Pricing models take into account the contract terms (including maturity) as well as multiple inputs, including, where applicable, commodity prices, equity prices, interest rate yield curves, credit curves, correlation, creditworthiness of the counterparty, option volatility and currency rates. Where appropriate, valuation adjustments are made to account for various factors such as liquidity risk (bid-ask adjustments), credit quality and model uncertainty. Credit valuation adjustments are applied to both cash instruments and OTC derivatives. For cash instruments, the impact of changes in the Company's own credit spreads is considered when measuring the fair value of liabilities and the impact of
| | 124 |
MORGAN STANLEY
NOTES TO CONSOLIDATED FINANCIAL STATEMENTS-(Continued)
changes in the counterparty's credit spreads is considered when measuring the fair value of assets. For OTC derivatives, the impact of changes in both the Company's and the counterparty's credit standing is considered when measuring fair value. In determining the expected exposure, the Company considers collateral held and legally enforceable master netting agreements that mitigate the Company's exposure to each counterparty. All valuation adjustments are subject to judgment, are applied on a consistent basis and are based upon observable inputs where available. The Company generally subjects all valuations and models to a review process initially and on a periodic basis thereafter.
Fair value is a market-based measure considered from the perspective of a market participant rather than an entity-specific measure. Therefore, even when market assumptions are not readily available, the Company's own assumptions are set to reflect those that the Company believes market participants would use in pricing the asset or liability at the measurement date.
See Note 4 for a description of valuation techniques applied to the major categories of financial instruments measured at fair value.
Assets and Liabilities Measured at Fair Value on a Non-Recurring Basis. Certain of the Company's assets are measured at fair value on a non-recurring basis. The Company incurs impairment charges for any writedowns of these assets to fair value. A downturn in market conditions could result in impairment charges in future periods.
For assets and liabilities measured at fair value on a non-recurring basis, fair value is determined by using various valuation approaches. The same hierarchy as described above, which maximizes the use of observable inputs and minimizes the use of unobservable inputs, by generally requiring that the observable inputs be used when available, is used in measuring fair value for these items.
For further information on financial assets and liabilities that are measured at fair value on a recurring and non-recurring basis, see Note 4.
Hedge Accounting.
The Company applies hedge accounting using various derivative financial instruments and non-U.S. dollar-denominated debt used to hedge interest rate and foreign exchange risk arising from assets and liabilities not held at fair value as part of asset and liability management. These derivative financial instruments are included within Financial instruments owned-derivative and other contracts or Financial instruments sold, not yet purchased-derivative and other contracts in the consolidated statements of financial condition.
The Company's hedges are designated and qualify for accounting purposes as one of the following types of hedges: hedges of changes in fair value of assets and liabilities due to the risk being hedged (fair value hedges), and hedges of net investments in foreign operations whose functional currency is different from the reporting currency of the parent company (net investment hedges).
For further information on derivative instruments and hedging activities, see Note 10.
Consolidated Statements of Cash Flows.
For purposes of the consolidated statements of cash flows, cash and cash equivalents consist of Cash and due from banks and Interest bearing deposits with banks, which are highly liquid investments with original maturities of three months or less and readily convertible to known amounts of cash. The Company's significant non-cash activities include assets acquired of $11.0 billion and assumed liabilities, in connection with business
| 125 | |
MORGAN STANLEY
NOTES TO CONSOLIDATED FINANCIAL STATEMENTS-(Continued)
acquisitions, of $3.2 billion in 2009. Fiscal 2008 and fiscal 2007 included assumed liabilities of $77 million and $7,704 million, respectively. During 2009, the Company consolidated certain real estate funds sponsored by the Company increasing assets by $600 million, liabilities of $18 million and Non-controlling interests of $582 million. In the fourth quarter of 2009, the Company disposed of Crescent, deconsolidating $2,766 million of assets and $2,947 million of liabilities (see Note 23). During fiscal 2008, the Company consolidated Crescent assets and liabilities of approximately $4,681 million and $3,881 million, respectively. In connection with the Discover Spin-off, net assets of approximately $5,558 million were distributed to shareholders in fiscal 2007 (see Note 23). At November 30, 2007, $8,086 million of securities were transferred from Securities available for sale to Financial instruments owned.
Securitization Activities.
The Company engages in securitization activities related to commercial and residential mortgage loans, corporate bonds and loans, U.S. agency collateralized mortgage obligations and other types of financial assets (see Note 6). Generally, such transfers of financial assets are accounted for as sales when the Company has relinquished control over the transferred assets. The gain or loss on sale of such financial assets depends, in part, on the previous carrying amount of the assets involved in the transfer allocated between the assets sold and the retained interests based upon their respective fair values at the date of sale. Transfers that are not accounted for as sales are treated as secured financings ("failed sales").
Premises, Equipment and Software Costs.
Premises and equipment consist of buildings, leasehold improvements, furniture, fixtures, computer and communications equipment, power plants, tugs, barges, terminals, pipelines and software (externally purchased and developed for internal use). Premises and equipment are stated at cost less accumulated depreciation and amortization. Depreciation and amortization are provided by the straight-line method over the estimated useful life of the asset. Estimated useful lives are generally as follows: buildings-39 years; furniture and fixtures-7 years; computer and communications equipment-3 to 8 years; power plants-15 years; tugs and barges-15 years; and terminals and pipelines-3 to 25 years. Estimated useful lives for software costs are generally 3 to 5 years.
Leasehold improvements are amortized over the lesser of the estimated useful life of the asset or, where applicable, the remaining term of the lease, but generally not exceeding: 25 years for building structural improvements and 15 years for other improvements.
Premises, equipment and software costs are tested for impairment whenever events or changes in circumstances suggest that an asset's carrying value may not be fully recoverable in accordance with current accounting guidance.
Income Taxes.
Income tax expense is provided for using the asset and liability method, under which deferred tax assets and liabilities are determined based upon the temporary differences between the financial statement and income tax bases of assets and liabilities using currently enacted tax rates.
Earnings per Common Share.
Basic earnings per common share ("EPS") is computed by dividing income available to Morgan Stanley common shareholders by the weighted average number of common shares outstanding for the period. Income available to Morgan Stanley common shareholders represents net income applicable to Morgan Stanley reduced by preferred stock dividends, amortization and the acceleration of discounts on preferred stock issued and allocations of earnings to participating securities. Common shares outstanding include common stock and vested restricted stock unit awards where recipients have satisfied either the explicit vesting terms or retirement eligibility requirements. Diluted EPS reflects the assumed conversion of all dilutive securities.
| | 126 |
MORGAN STANLEY
NOTES TO CONSOLIDATED FINANCIAL STATEMENTS-(Continued)
Effective October 13, 2008, as a result of the adjustment to Equity Units sold to a wholly owned subsidiary of China Investment Corporation Ltd. ("CIC") (see Note 13), the Company calculates EPS in accordance with accounting guidance for determining EPS for participating securities. The accounting guidance for participating securities and the two-class method of calculating EPS addresses the computation of EPS by companies that have issued securities other than common stock that contractually entitle the holder to participate in dividends and earnings of the company along with common shareholders according to a predetermined formula. The two-class method requires the Company to present EPS as if all of the earnings for the period are distributed to Morgan Stanley common shareholders and any participating securities, regardless of whether any actual dividends or distributions are made. The amount allocated to the participating securities is based upon the contractual terms of their respective contract and is reflected as a reduction to "Net income applicable to Morgan Stanley common shareholders" for both the Company's basic and diluted EPS calculations (see Note 14). The two-class method does not impact the Company's actual net income applicable to Morgan Stanley or other financial results. Unless contractually required by the terms of the participating securities, no losses are allocated to participating securities for purposes of the EPS calculation under the two-class method.
In June 2008, the Financial Accounting Standards Board (the "FASB") issued accounting guidance on whether share-based payment transactions are participating securities. This accounting guidance addresses whether instruments granted in share-based payment transactions are participating securities prior to vesting and, therefore, need to be included in the earnings allocation in computing EPS under the two-class method as described in the accounting guidance for calculating EPS. Under this accounting guidance, unvested share-based payment awards that contain non-forfeitable rights to dividends or dividend equivalents (whether paid or unpaid) are participating securities and shall be included in the computation of EPS pursuant to the two-class method. The accounting guidance on whether share-based payment transactions are participating securities became effective for the Company on January 1, 2009. All prior-period EPS data presented were adjusted retrospectively.
Stock-Based Compensation.
The Company accounts for stock-based compensation in accordance with the accounting guidance for equity-based awards. This accounting guidance requires measurement of compensation cost for equity-based awards at fair value and recognition of compensation cost over the service period, net of estimated forfeitures. The Company determines the fair value of restricted stock units based on the number of units granted and the grant date fair value of the Company's common stock, measured as the volume-weighted average price on the date of grant. The fair value of stock options is determined using the Black-Scholes valuation model and the single grant life method. Under the single grant life method, option awards with graded vesting are valued using a single weighted-average expected option life. Compensation expense for stock-based payment awards is recognized using the graded vesting attribution method. Until its discontinuation on June 1, 2009, the Company's Employee Stock Purchase Plan (the "ESPP") allowed employees to purchase shares of the Company's common stock at a 15% discount from market value. The Company expensed the 15% discount associated with the ESPP until its discontinuation.
For stock-based awards issued prior to the adoption of current accounting guidance, the Company's accounting policy for awards granted to retirement-eligible employees is to recognize compensation cost over the service period specified in the award terms. The Company accelerates any unrecognized compensation cost for such awards if and when a retirement-eligible employee leaves the Company.
The Company recognizes the expense for equity-based awards over the requisite service period. For anticipated year-end equity awards that are granted to employees expected to be retirement-eligible under the award terms, the Company accrues the estimated cost of these awards over the course of the current fiscal year. As such, the Company accrued the estimated cost of 2009 year-end awards granted to employees who were retirement- eligible under the award terms over 2009 rather than expensing the awards on the date of grant (which occurred
| 127 | |
MORGAN STANLEY
NOTES TO CONSOLIDATED FINANCIAL STATEMENTS-(Continued)
in January 2010). The Company believes that this method of recognition for retirement-eligible employees is preferable because it better reflects the period over which the compensation is earned.
Translation of Foreign Currencies.
Assets and liabilities of operations having non-U.S. dollar functional currencies are translated at year-end rates of exchange, and income statement accounts are translated at weighted average rates of exchange for the year. Gains or losses resulting from translating foreign currency financial statements, net of hedge gains or losses and related tax effects, are reflected in Accumulated other comprehensive income (loss), a separate component of Morgan Stanley Shareholders' equity on the consolidated statement of financial condition. Gains or losses resulting from remeasurement of foreign currency transactions are included in net income.
Goodwill and Intangible Assets.
Goodwill and indefinite-lived intangible assets are not amortized and are reviewed annually (or more frequently when certain events or circumstances exist) for impairment. Other intangible assets are amortized over their estimated useful lives and reviewed for impairment.
Securities Available for Sale.
Beginning in the second quarter of fiscal 2007, the Company purchased certain debt securities that were classified as "securities available for sale" in accordance with accounting guidance for certain investments in debt and equity securities. During fiscal 2007, the Company recorded an other-than-temporary impairment charge of $437 million in Principal transactions–trading revenues in the consolidated statement of income.
Deferred Compensation Arrangements.
Rabbi Trust. The Company maintains trusts, commonly referred to as rabbi trusts, in connection with certain deferred compensation plans. Assets of rabbi trusts are consolidated, and the value of the Company's stock held in rabbi trusts is classified in Morgan Stanley Shareholders' equity and generally accounted for in a manner similar to treasury stock. The Company has included its obligations under certain deferred compensation plans in Employee stock trust. Shares that the Company has issued to its rabbi trusts are recorded in Common stock issued to employee trust. Both Employee stock trust and Common stock issued to employee trust are components of Morgan Stanley Shareholders' equity. The Company recognizes the original amount of deferred compensation (fair value of the deferred stock award at the date of grant-see Note 18) as the basis for recognition in Employee stock trust and Common stock issued to employee trust. Changes in the fair value of amounts owed to employees are not recognized as the Company's deferred compensation plans do not permit diversification and must be settled by the delivery of a fixed number of shares of the Company's common stock.
Deferred Compensation Plans. The Company also maintains various deferred compensation plans for the benefit of certain employees that provide a return to the participating employees based upon the performance of various referenced investments. The Company often invests directly, as a principal, in such referenced investments related to its obligations to perform under the deferred compensation plans. Changes in value of such investments made by the Company are recorded primarily in Principal transactions-investments. Expenses associated with the related deferred compensation plans are recorded in Compensation and benefits.
Employee Loans.
At December 31, 2009 and December 31, 2008, the Company had $3.5 billion and $1.9 billion, respectively, of loans outstanding to certain employees. These loans are full-recourse, require periodic payment terms and have repayment terms ranging from 4 to 12 years.
Accounting Developments.
Accounting for Uncertainty in Income Taxes. In July 2006, the FASB issued accounting guidance which clarifies the accounting for uncertainty in income taxes recognized in a company's financial statements and prescribes a recognition threshold and measurement attribute for the financial statement recognition and measurement of a tax position taken or expected to be taken in an income tax return. It also provides guidance on
| | 128 |
MORGAN STANLEY
NOTES TO CONSOLIDATED FINANCIAL STATEMENTS-(Continued)
derecognition, classification, interest and penalties, accounting in interim periods, disclosure and transition. As a result of the adoption of this accounting guidance on December 1, 2007, the Company recorded a cumulative effect adjustment of approximately $92 million as a decrease to the opening balance of Retained earnings as of December 1, 2007 (see Note 20).
Employee Benefit Plans. In September 2006, the FASB issued accounting guidance for pension and other post retirement plans. In fiscal 2007, the Company adopted the requirement to recognize the overfunded or underfunded status of its defined benefit and postretirement plans as an asset or liability. In the first quarter of fiscal 2008, the Company recorded an after-tax charge of approximately $13 million ($21 million pre-tax) to Shareholders' equity upon early adoption of the requirement to use the fiscal year-end date as the measurement date (see Note 19).
Dividends on Share-Based Payment Awards. In June 2007, the Emerging Issues Task Force reached consensus on accounting for tax benefits of dividends on share-based payment awards to employees. The accounting guidance requires that the tax benefit related to dividend equivalents paid on restricted stock units that are expected to vest be recorded as an increase to additional paid-in capital. The Company adopted this guidance prospectively effective December 1, 2008. The Company previously accounted for this tax benefit as a reduction to its income tax provision. The adoption of the accounting guidance did not have a material impact on the Company's consolidated financial statements.
Business Combinations . In December 2007, the FASB issued accounting guidance that requires the acquiring entity in a business combination to recognize the full fair value of assets acquired and liabilities assumed in the transaction (whether a full or partial acquisition); establishes the acquisition-date fair value as the measurement objective for all assets acquired and liabilities assumed; requires expensing of most transaction and restructuring costs; and requires the acquirer to disclose to investors and other users all of the information needed to evaluate and understand the nature and financial effect of the business combination. The accounting guidance applies to all transactions or other events in which the Company obtains control of one or more businesses, including those sometimes referred to as "true mergers" or "mergers of equals" and combinations achieved without the transfer of consideration, for example, by contract alone or through the lapse of minority veto rights. The Company adopted the accounting guidance prospectively on January 1, 2009.
Transfers of Financial Assets and Repurchase Financing Transactions. In February 2008, the FASB issued implementation guidance for accounting for transfers of financial assets and repurchase financing transactions. Under this guidance, there is a presumption that an initial transfer of a financial asset and a repurchase financing are considered part of the same arrangement ( i.e ., a linked transaction) for purposes of evaluation. If certain criteria are met, however, the initial transfer and repurchase financing shall not be evaluated as a linked transaction and shall be evaluated separately. The adoption of the guidance on December 1, 2008 did not have a material impact on the Company's consolidated financial statements.
Determination of the Useful Life of Intangible Assets. In April 2008, the FASB issued guidance on the determination of the useful life of intangible assets. The guidance removes the requirement for an entity to consider, when determining the useful life of an acquired intangible asset, whether the intangible asset can be renewed without substantial cost or material modifications to the existing terms and conditions associated with the intangible asset. The guidance replaces the previous useful-life assessment criteria with a requirement that an entity shall consider its own experience in renewing similar arrangements. If the entity has no relevant experience, it would consider market participant assumptions regarding renewal. The adoption of the guidance on January 1, 2009 did not have a material impact on the Company's consolidated financial statements.
| 129 | |
MORGAN STANLEY
NOTES TO CONSOLIDATED FINANCIAL STATEMENTS-(Continued)
Instruments Indexed to an Entity's Own Stock. In June 2008, the FASB ratified the consensus reached for determining whether an equity-linked financial instrument (or embedded feature) is indexed to an entity's own stock. The accounting guidance applies to any freestanding financial instrument or embedded feature that has all of the characteristics of a derivative or freestanding instrument that is potentially settled in an entity's own stock with certain exceptions. To meet the definition of "indexed to own stock," an instrument's contingent exercise provisions must not be based on (a) an observable market, other than the market for the issuer's stock (if applicable), or (b) an observable index, other than an index calculated or measured solely by reference to the issuer's own operations, and the variables that could affect the settlement amount must be inputs to the fair value of a "fixed-for-fixed" forward or option on equity shares. The adoption of the guidance on January 1, 2009 did not change the classification or measurement of the Company's financial instruments.
Subsequent Events. In May 2009, the FASB issued accounting guidance to establish general standards of accounting for and disclosure of events that occur after the balance sheet date but before financial statements are issued or are available to be issued. The Company's adoption of this guidance in the quarter ended June 30, 2009 did not have a material impact on the Company's consolidated financial statements.
Fair Value Measurements. In October 2008, the FASB issued accounting guidance that clarifies the determination of fair value in a market that is not active and provides an example to illustrate key considerations in determining the fair value of a financial instrument when the market for that financial asset is not active. The adoption of the guidance in fiscal 2008 did not have a material impact on the Company's consolidated financial statements.
In April 2009, the FASB issued guidance on determining fair value when the volume and level of activity for the asset or liability have significantly decreased and identifying transactions that are not orderly. The guidance provides additional application guidance in determining fair values when there is no active market or where the price inputs being used represent distressed sales. It reaffirms the objective of fair value measurement-to reflect how much an asset would be sold for in an orderly transaction (as opposed to a distressed or forced transaction) at the date of the financial statements under current market conditions. Specifically, it reaffirms the need to use judgment to ascertain if a formerly active market has become inactive and in determining fair values when markets have become inactive. The adoption of the guidance in the second quarter of 2009 did not have a material impact on the Company's consolidated financial statements.
In August 2009, the FASB issued guidance about measuring liabilities at fair value. The adoption of the guidance on October 1, 2009 did not have a material impact on the Company's consolidated financial statements.
In September 2009, the FASB issued additional guidance about measuring the fair value of certain alternative investments, such as hedge funds, private equity funds, real estate funds and venture capital funds. The guidance allows companies to determine the fair value of such investments using net asset value ("NAV") as a practical expedient and also requires disclosures of the nature and risks of the investments by major category of alternative investments. The Company's adoption on December 31, 2009 did not have a material impact on the consolidated financial statements.
Transfers of Financial Assets and Extinguishments of Liabilities and Consolidation of Variable Interest Entities . In June 2009, the FASB issued accounting guidance which changes the way entities account for securitizations and special-purpose entities. The accounting guidance amends the accounting for transfers of financial assets and will require additional disclosures about transfers of financial assets, including securitization transactions, and where entities have continuing exposure to the risks related to transferred financial assets. It eliminates the concept of a QSPE and changes the requirements for derecognizing financial assets.
| | 130 |
MORGAN STANLEY
NOTES TO CONSOLIDATED FINANCIAL STATEMENTS-(Continued)
The accounting guidance also amends the accounting for consolidation and changes how a reporting entity determines when an entity that is insufficiently capitalized or is not controlled through voting (or similar rights) should be consolidated. The determination of whether a reporting entity is required to consolidate another entity is based on, among other things, the other entity's purpose and design and the reporting entity's ability to direct the activities of the other entity that most significantly impact the other entity's economic performance. In February 2010, the FASB finalized a deferral of these accounting changes, effective January 1, 2010, for certain interests in investment companies or in entities qualifying for accounting purposes as investment companies. For the entities included in the deferral, the Company will continue to analyze consolidation under other existing authoritative guidance; these entities are not included in the impact noted below.
The adoption of this accounting guidance on January 1, 2010 did not have a material impact on the Company's consolidated statement of financial condition.
3. Morgan Stanley Smith Barney Holdings LLC.
Smith Barney. On May 31, 2009 (the "Closing Date"), the Company and Citi consummated the combination of the Company's Global Wealth Management Group and the businesses of Citi's Smith Barney in the U.S., Quilter in the U.K., and Smith Barney Australia ("Smith Barney"). In addition to the Company's contribution of respective businesses to MSSB, the Company paid Citi $2,755 million in cash. The combined businesses operate as MSSB. Pursuant to the terms of the amended contribution agreement, dated as of May 29, 2009 ("amended contribution agreement"), certain businesses of Smith Barney and Morgan Stanley will be contributed to MSSB subsequent to May 31, 2009 (the "delayed contribution businesses"). Morgan Stanley and Citi will each own their delayed contribution businesses until they are transferred to MSSB and gains and losses from such businesses will be allocated to the Company's and Citi's respective share of MSSB's gains and losses.
The Company owns 51% and Citi owns 49% of MSSB, with the Company having appointed four directors to the MSSB board and Citi having appointed two directors. As part of the acquisition, the Company has the option (i) following the third anniversary of the Closing Date to purchase a portion of Citi's interest in MSSB representing 14% of the total outstanding MSSB interests, (ii) following the fourth anniversary of the Closing Date to purchase a portion of Citi's interest in MSSB representing an additional 15% of the total outstanding MSSB interests and (iii) following the fifth anniversary of the Closing Date to purchase the remainder of Citi's interest in MSSB. The Company may call all of Citi's interest in MSSB upon a change in control of Citi. Citi may put all of its interest in MSSB to the Company upon a change in control of the Company or following the later of the sixth anniversary of the Closing Date and the one-year anniversary of the Company's exercise of the call described in clause (ii) above. The purchase price for the call and put rights described above is the fair market value of the purchased interests determined pursuant to an appraisal process.
As of May 31, 2009, the Company included MSSB in its consolidated financial statements. The results of MSSB are included within the Global Wealth Management Group business segment. See Note 13 for further information on MSSB.
The Company accounted for the transaction using the acquisition method of accounting. The fair value of the total consideration transferred to Citi amounted to approximately $6,087 million and the preliminary fair value of Citi's equity in MSSB was approximately $3,973 million. The acquisition method of accounting prescribes the full goodwill method even in business combinations in which the acquirer holds less than 100% of the equity interests in the acquiree at acquisition date. Accordingly, the full fair value of Smith Barney was allocated to the fair value of assets acquired and liabilities assumed to derive the preliminary goodwill amount of approximately $5,210 million, which represents synergies of combining the two businesses. The Company is still finalizing the valuation of the intangible assets and the fair value of the Company's contributed businesses into MSSB. When finalized, the amount of total consideration transferred, non-controlling interest, intangible assets and acquisition-related goodwill could change.
| 131 | |
MORGAN STANLEY
NOTES TO CONSOLIDATED FINANCIAL STATEMENTS-(Continued)
The following table summarizes the preliminary allocation of the purchase price to the net assets of Smith Barney as of May 31, 2009 (dollars in millions).
Total fair value of consideration transferred | $ | 6,087 | |
Total fair value of non-controlling interest | 3,973 | ||
Total fair value of Smith Barney(1) | 10,060 | ||
Total fair value of net assets acquired | 4,850 | ||
Preliminary acquisition-related goodwill(2) | $ | 5,210 | |
| (1) | Total fair value of Smith Barney is inclusive of control premium. |
| (2) | Goodwill is recorded within the Global Wealth Management Group business segment. The Company is currently evaluating the amount of goodwill deductible for tax purposes. |
Condensed statement of assets acquired and liabilities assumed. The following table summarizes the preliminary fair values of the assets acquired and liabilities assumed as of the acquisition date. The allocation of the purchase price is preliminary and subject to further adjustment as the valuation of certain intangible assets is still in process.
| At May 31, 2009 | |||
| (dollars in millions) | |||
Assets | |||
Cash and due from banks | $ | 895 | |
Financial instruments owned | 22 | ||
Receivables | 1,891 | ||
Intangible assets | 4,480 | ||
Other assets | 719 | ||
Total assets acquired | $ | 8,007 | |
Liabilities | |||
Financial instrument sold, not yet purchased | $ | 76 | |
Long-term borrowings | 2,320 | ||
Other liabilities and accrued expenses | 761 | ||
Total liabilities assumed | $ | 3,157 | |
Net assets acquired | $ | 4,850 | |
In addition, the Company recorded a receivable of approximately $1.1 billion relating to the fair value of the Smith Barney delayed contribution businesses as of May 31, 2009 from Citi. Such amount is presented in the consolidated statements of financial condition as a reduction from Non-controlling interests.
Amortizable intangible assets included the following as of May 31, 2009:
| At May 31, 2009 | Estimated useful life | ||||
| (dollars in millions) | (in years) | ||||
Customer relationships | $ | 4,000 | 16 | ||
Research | 176 | 5 | |||
Intangible lease asset | 24 | 1-10 | |||
Total | $ | 4,200 | |||
The Company also recorded an indefinite-lived intangible asset of approximately $280 million related to the Smith Barney trade name.
| | 132 |
MORGAN STANLEY
NOTES TO CONSOLIDATED FINANCIAL STATEMENTS-(Continued)
Citi Managed Futures. Citi contributed its managed futures business and certain related proprietary trading positions to MSSB on July 31, 2009 ("Citi Managed Futures"). The Company paid Citi approximately $300 million in cash in connection with this transfer. As of July 31, 2009, Citi Managed Futures was wholly-owned and consolidated by MSSB, of which the Company owns 51% and Citi owns 49%.
The Company accounted for this transaction using the acquisition method of accounting. The fair value of the total consideration transferred to Citi was approximately $300 million and the preliminary increase in fair value of Citi's equity in MSSB was approximately $289 million. The acquisition method of accounting prescribes the full goodwill method even in business combinations in which the acquirer holds less than 100% of the equity interests in the acquiree at acquisition date. Accordingly, the full fair value of Citi Managed Futures was allocated to the fair value of the assets acquired and liabilities assumed to derive the preliminary goodwill amount of approximately $136 million, which represents business synergies of combining the Citi Managed Futures business with MSSB. The Company is still finalizing the valuation of the intangible assets. When finalized, the amount of intangible assets and acquisition-related goodwill could change.
The following table summarizes the preliminary allocation of the purchase price to the net assets of Citi Managed Futures as of July 31, 2009 (dollars in millions).
Total fair value of consideration transferred | $ | 300 | |
Total fair value of non-controlling interest | 289 | ||
Total fair value of Citi Managed Futures | 589 | ||
Total fair value of net assets acquired | 453 | ||
Preliminary acquisition-related goodwill(1) | $ | 136 | |
| (1) | Goodwill is recorded within the Global Wealth Management Group business segment. The Company is currently evaluating the amount of goodwill deductible for tax purposes. |
Condensed statement of assets acquired and liabilities assumed. The following table summarizes the preliminary fair values of the assets acquired and liabilities assumed as of the acquisition date. The allocation of the purchase price is preliminary and subject to further adjustment as the valuation of certain intangible assets is still in process.
| At July 31, 2009 | |||
| (dollars in millions) | |||
Assets | |||
Financial instruments owned | $ | 83 | |
Receivables | 86 | ||
Intangible assets | 275 | ||
Other assets | 11 | ||
Total assets acquired | $ | 455 | |
Liabilities | |||
Other liabilities and accrued expenses | $ | 2 | |
Total liabilities assumed | $ | 2 | |
Net assets acquired | $ | 453 | |
As of July 31, 2009, amortizable intangible assets in the amount of $275 million primarily related to management contracts with an estimated useful life of five to nine years.
| 133 | |
MORGAN STANLEY
NOTES TO CONSOLIDATED FINANCIAL STATEMENTS-(Continued)
Pro forma condensed combined financial information (unaudited).
The following unaudited pro forma condensed combined financial information presents the results of operations of the Company as they may have appeared if the closing of MSSB and Citi Managed Futures had been completed on January 1, 2009, December 1, 2007 and December 1, 2008 (dollars in millions, except share data).
| 2009 | Fiscal 2008 | One Month Ended December 31, 2008 | |||||||||
| (unaudited) | |||||||||||
Net revenues | $ | 26,164 | $ | 30,410 | $ | (306 | ) | ||||
Total non-interest expenses | 24,951 | 28,493 | 1,594 | ||||||||
Income (loss) from continuing operations before income taxes | 1,213 | 1,917 | (1,900 | ) | |||||||
(Benefit from) provision for income taxes | (267 | ) | 182 | (699 | ) | ||||||
Income (loss) from continuing operations | 1,480 | 1,735 | (1,201 | ) | |||||||
Discontinued operations: | |||||||||||
Gain from discontinued operations | 160 | 1,121 | 18 | ||||||||
(Benefit from) provision for income taxes | (53 | ) | 501 | 8 | |||||||
Net gain from discontinued operations | 213 | 620 | 10 | ||||||||
Net income (loss) | 1,693 | 2,355 | (1,191 | ) | |||||||
Net income applicable to non-controlling interests | 234 | 452 | 65 | ||||||||
Net income (loss) applicable to Morgan Stanley | $ | 1,459 | $ | 1,903 | $ | (1,256 | ) | ||||
(Loss) earnings applicable to Morgan Stanley common shareholders | $ | (794 | ) | $ | 1,677 | $ | (1,592 | ) | |||
(Loss) earnings per basic common share: | |||||||||||
(Loss) income from continuing operations | $ | (0.83 | ) | $ | 1.10 | $ | (1.60 | ) | |||
Gain on discontinued operations | 0.16 | 0.53 | 0.01 | ||||||||
(Loss) earnings per basic common share | $ | (0.67 | ) | $ | 1.63 | $ | (1.59 | ) | |||
(Loss) earnings per diluted common share: | |||||||||||
(Loss) income from continuing operations | $ | (0.83 | ) | $ | 1.05 | $ | (1.60 | ) | |||
Gain on discontinued operations | 0.16 | 0.51 | 0.01 | ||||||||
(Loss) earnings per diluted common share | $ | (0.67 | ) | $ | 1.56 | $ | (1.59 | ) | |||
The unaudited pro forma condensed combined financial information is presented for illustrative purposes only and does not indicate the actual financial results of the Company had the closing of Smith Barney and Citi Managed Futures been completed on January 1, 2009, December 1, 2007, and December 1, 2008, nor is it indicative of the results of operations in future periods. Included in the unaudited pro forma combined financial information for 2009, fiscal 2008, and the one month ended December 31, 2008 were pro forma adjustments to reflect the results of operations of both Smith Barney and Citi Managed Futures as well as the impact of amortizing certain acquisition accounting adjustments such as amortizable intangible assets. The pro forma condensed financial information does not indicate the impact of possible business model changes nor does it consider any potential impacts of current market conditions, expense efficiencies or other factors.
| | 134 |
MORGAN STANLEY
NOTES TO CONSOLIDATED FINANCIAL STATEMENTS-(Continued)
4. Fair Value Disclosures.
Fair Value Measurements.
A description of the valuation techniques applied to the Company's major categories of assets and liabilities measured at fair value on a recurring basis follows.
Financial Instruments Owned and Financial Instruments Sold, Not Yet Purchased
U.S. Government and Agency Securities
| • | U.S. Treasury Securities . U.S. treasury securities are valued using quoted market prices. Valuation adjustments are not applied. Accordingly, U.S. treasury securities are generally categorized in Level 1 of the fair value hierarchy. |
| • | U.S. Agency Securities . U.S. agency securities are comprised of two main categories consisting of agency issued debt and mortgage pass-throughs. Non-callable agency issued debt securities are generally valued using quoted market prices. Callable agency issued debt securities are valued by benchmarking model-derived prices to quoted market prices and trade data for identical or comparable securities. Mortgage pass-throughs include mortgage pass-throughs and forward settling mortgage pools. Fair value of mortgage pass-throughs are model driven with respect to spreads of the comparable To-be-announced ("TBA") security. Actively traded non-callable agency issued debt securities are categorized in Level 1 of the fair value hierarchy. Callable agency issued debt securities and mortgage pass-throughs are generally categorized in Level 2 of the fair value hierarchy. |
Other Sovereign Government Obligations
| • | Foreign sovereign government obligations are valued using quoted prices in active markets when available. To the extent quoted prices are not available, fair value is determined based on a valuation model that has as inputs interest rate yield curves, cross-currency basis index spreads, and country credit spreads for structures similar to the bond in terms of issuer, maturity and seniority. These bonds are generally categorized in Levels 1 or 2 of the fair value hierarchy. |
Corporate and Other Debt
| • | State and Municipal Securities . The fair value of state and municipal securities is estimated using recently executed transactions, market price quotations and pricing models that factor in, where applicable, interest rates, bond or credit default swap spreads and volatility. These bonds are generally categorized in Level 2 of the fair value hierarchy. |
| • | Residential Mortgage-Backed Securities ("RMBS"), Commercial Mortgage-Backed Securities ("CMBS"), and other Asset-Backed Securities ("ABS") . RMBS, CMBS and other ABS may be valued based on external price or spread data. When position-specific external price data are not observable, the valuation is based on prices of comparable bonds. Valuation levels of RMBS and CMBS indices are used as an additional data point for benchmarking purposes or to price outright index positions. |
Fair value for retained interests in securitized financial assets (in the form of one or more tranches of the securitization) is determined using observable prices or, in cases where observable prices are not available for certain retained interests, the Company estimates fair value based on the present value of expected future cash flows using its best estimates of the key assumptions, including forecasted credit losses, prepayment rates, forward yield curves and discount rates commensurate with the risks involved.
RMBS, CMBS and other ABS, including retained interests in these securitized financial assets, are categorized in Level 3 if external prices or spread inputs are unobservable or if the comparability assessment involves significant subjectivity related to property type differences, cash flows, performance and other inputs; otherwise, they are categorized in Level 2 of the fair value hierarchy.
| 135 | |
MORGAN STANLEY
NOTES TO CONSOLIDATED FINANCIAL STATEMENTS-(Continued)
| • | Corporate Bonds . The fair value of corporate bonds is estimated using recently executed transactions, market price quotations (where observable), bond spreads or credit default swap spreads adjusted for any basis difference between cash and derivative instruments. The spread data used are for the same maturity as the bond. If the spread data does not reference the issuer, then data that reference a comparable issuer are used. When observable price quotations are not available, fair value is determined based on cash flow models with yield curves, bond or single name credit default swap spreads and recovery rates as significant inputs. Corporate bonds are generally categorized in Level 2 of the fair value hierarchy; in instances where prices, spreads or any of the other aforementioned key inputs are unobservable, they are categorized in Level 3 of the fair value hierarchy. |
| • | Collateralized Debt Obligations ("CDOs") . The Company holds CDOs where the collateral primarily is synthetic and references either a basket credit default swap or CDO-squared (a CDO-squared is a special purpose vehicle that issues interests, or tranches, that are backed by tranches issued by other CDOs). The correlation input between reference credits within the collateral is unobservable and is benchmarked to standardized proxy baskets for which correlation data are available. The other model inputs such as credit spreads, interest rates and recovery rates are observable. CDOs are categorized in Level 2 of the fair value hierarchy when the correlation input is insignificant. In instances where the correlation input is deemed to be significant, these instruments are categorized in Level 3 of the fair value hierarchy. |
| • | Corporate Loans and Lending Commitments . The fair value of corporate loans is estimated using recently executed transactions, market price quotations (where observable), implied yields from comparable debt, and market observable credit default swap spread levels adjusted for any basis difference between cash and derivative instruments, along with proprietary valuation models and default recovery analysis where such transactions and quotations are unobservable. The fair value of contingent corporate lending commitments is estimated by using executed transactions on comparable loans and the anticipated market price based on pricing indications from syndicate banks and customers. The valuation of these commitments also takes into account certain fee income. Corporate loans and lending commitments are generally categorized in Level 2 of the fair value hierarchy; in instances where prices or significant spread inputs are unobservable, they are categorized in Level 3 of the fair value hierarchy. |
| • | Mortgage Loans . Mortgage loans are valued using prices based on trade data for identical or comparable instruments. Where observable prices are not available, the Company estimates fair value based on benchmarking to prices and rates observed in the primary market for similar loan or borrower types, or based on the present value of expected future cash flows using its best estimates of the key assumptions, including forecasted credit losses, prepayment rates, forward yield curves and discount rates commensurate with the risks involved. Due to the subjectivity involved in comparability assessment related to mortgage loan vintage, geographical concentration, prepayment speed and projected loss assumptions, the majority of loans are classified in Level 3 of the fair value hierarchy. |
| • | Auction Rate Securities ("ARS") . The Company primarily holds investments in Student Loan Auction Rate Securities ("SLARS") and Municipal Auction Rate Securities ("MARS") with interest rates that are reset through periodic auctions. SLARS are ABS backed by pools of student loans. MARS are municipal bonds often wrapped by municipal bond insurance. ARS were historically traded and valued as floating rate notes, priced at par due to the auction mechanism. Beginning in fiscal 2008, uncertainties in the credit markets have resulted in auctions failing for certain types of ARS. Once the auctions failed, ARS could no longer be valued using observations of auction market prices. Accordingly, the fair value of ARS is determined using independent external market data where available and an internally developed methodology to discount for the lack of liquidity and non-performance risk in the current market environment. |
Inputs that impact the valuation of SLARS are the underlying collateral types, level of seniority in the capital structure, amount of leverage in each structure, credit rating and liquidity considerations. Inputs
| | 136 |
MORGAN STANLEY
NOTES TO CONSOLIDATED FINANCIAL STATEMENTS-(Continued)
that impact the valuation of MARS are independent external market data, the maximum rate, quality of underlying issuers/insurers and evidence of issuer calls. MARS are generally categorized in Level 2 as the valuation technique relies on observable external data. The majority of SLARS are generally categorized in Level 3 of the fair value hierarchy.
Corporate Equities.
| • | Exchange-Traded Equity Securities . Exchange-traded equity securities are generally valued based on quoted prices from the exchange. To the extent these securities are actively traded, valuation adjustments are not applied and they are categorized in Level 1 of the fair value hierarchy; otherwise, they are categorized in Level 2. |
Derivative and Other Contracts.
| • | Listed Derivative Contracts . Listed derivatives that are actively traded are valued based on quoted prices from the exchange and are categorized in Level 1 of the fair value hierarchy. Listed derivatives that are not actively traded are valued using the same approaches as those applied to OTC derivatives; they are generally categorized in Level 2 of the fair value hierarchy. |
| • | OTC Derivative Contracts . OTC derivative contracts include forward, swap and option contracts related to interest rates, foreign currencies, credit standing of reference entities, equity prices or commodity prices. |
Depending on the product and the terms of the transaction, the fair value of OTC derivative products can be either observed or modeled using a series of techniques, and model inputs from comparable benchmarks, including closed-form analytic formulas, such as the Black-Scholes option-pricing model, and simulation models or a combination thereof. Many pricing models do not entail material subjectivity because the methodologies employed do not necessitate significant judgment, and the pricing inputs are observed from actively quoted markets, as is the case for generic interest rate swaps, certain option contracts and certain credit default swaps. In the case of more established derivative products, the pricing models used by the Company are widely accepted by the financial services industry. A substantial majority of OTC derivative products valued by the Company using pricing models fall into this category and are categorized within Level 2 of the fair value hierarchy.
Other derivative products, including complex products that have become illiquid, require more judgment in the implementation of the valuation technique applied due to the complexity of the valuation assumptions and the reduced observability of inputs. This includes derivative interests in certain mortgage-related CDO securities, basket credit default swaps, CDO-squared positions and certain types of ABS credit default swaps where direct trading activity or quotes are unobservable. These instruments involve significant unobservable inputs and are categorized in Level 3 of the fair value hierarchy.
Derivative interests in complex mortgage-related CDOs and credit default swaps, for which observability of external price data is extremely limited, are valued based on an evaluation of the market and model input parameters sourced from similar positions as indicated by primary and secondary market activity. Each position is evaluated independently taking into consideration the underlying collateral performance and pricing, behavior of the tranche under various cumulative loss and prepayment scenarios, deal structures ( e.g. , non-amortizing reference obligations, call features) and liquidity. While these factors may be supported by historical and actual external observations, the determination of their value as it relates to specific positions nevertheless requires significant judgment.
For basket credit default swaps and CDO-squared positions, the correlation input between reference credits is unobservable for each specific swap and is benchmarked to standardized proxy baskets for which correlation data are available. The other model inputs such as credit spread, interest rates and recovery rates are observable. In instances where the correlation input is deemed to be significant, these instruments are categorized in Level 3 of the fair value hierarchy.
| 137 | |
MORGAN STANLEY
NOTES TO CONSOLIDATED FINANCIAL STATEMENTS-(Continued)
The Company trades various derivative structures with commodity underlyings. Depending on the type of structure, the model inputs generally include interest rate yield curves, commodity underlier curves, implied volatility of the underlying commodities and, in some cases, the implied correlation between these inputs. The fair value of these products is estimated using executed trades and broker and consensus data to provide values for the aforementioned inputs. Where these inputs are unobservable, relationships to observable commodities and data points, based on historic and/or implied observations, are employed as a technique to estimate the model input values. Commodity derivatives are generally categorized in Level 2 of the fair value hierarchy; in instances where significant inputs are unobservable, they are categorized in Level 3 of the fair value hierarchy.
For further information on derivative instruments and hedging activities, see Note 10.
Investments.
| • | The Company's investments include direct private equity investments and investments in private equity funds, real estate funds and hedge funds. Initially, the transaction price is generally considered by the Company as the exit price and is the Company's best estimate of fair value. |
After initial recognition, in determining the fair value of internally and externally managed funds, the Company considers the net asset value of the fund provided by the fund manager to be the best estimate of fair value. For direct private equity investments and privately held investments within internally managed funds, fair value after initial recognition is based on an assessment of each underlying investment, considering rounds of financing and third-party transactions, discounted cash flow analyses and market-based information, including comparable company transactions, trading multiples and changes in market outlook, among other factors.
Investments in private equity and real estate funds are generally categorized in Level 3 of the fair value hierarchy. Investments in hedge funds that are redeemable at the measurement date or in the near future, are categorized in Level 2 of the fair value hierarchy; otherwise they are categorized in Level 3.
Physical Commodities.
| • | The Company trades various physical commodities, including crude oil and refined products, natural gas, base and precious metals and agricultural products. Fair value for physical commodities is determined using observable inputs, including broker quotations and published indices. Physical commodities are categorized in Level 2 of the fair value hierarchy. |
Commercial Paper and Other Short-term Borrowings/Long-Term Borrowings.
| • | Structured Notes . The Company issues structured notes that have coupons or repayment terms linked to the performance of debt or equity securities, indices, currencies or commodities. Fair value of structured notes is estimated using valuation models for the derivative and debt portions of the notes. These models incorporate observable inputs referencing identical or comparable securities, including prices that the notes are linked to, interest rate yield curves, option volatility, and currency, commodity or equity rates. Independent, external and traded prices for the notes are also considered. The impact of the Company's own credit spreads is also included based on the Company's observed secondary bond market spreads. Most structured notes are categorized in Level 2 of the fair value hierarchy. |
Deposits.
| • | Time Deposits . The fair value of certificates of deposit is estimated using third-party quotations. These deposits are generally categorized in Level 2 of the fair value hierarchy. |
The following fair value hierarchy tables present information about the Company's assets and liabilities measured at fair value on a recurring basis as of December 31, 2009 and December 31, 2008. See Note 2 for a discussion of the Company's policies regarding this fair value hierarchy.
| | 138 |
MORGAN STANLEY
NOTES TO CONSOLIDATED FINANCIAL STATEMENTS-(Continued)
Assets and Liabilities Measured at Fair Value on a Recurring Basis as of December 31, 2009
| Quoted Prices in Active Markets for Identical Assets (Level 1) | Significant Observable Inputs (Level 2) | Significant Unobservable Inputs (Level 3) | Counterparty and Cash Collateral Netting | Balance at December 31, 2009 | ||||||||||||
| (dollars in millions) | ||||||||||||||||
Assets | ||||||||||||||||
Financial instruments owned: | ||||||||||||||||
U.S. government and agency securities: | ||||||||||||||||
U.S. Treasury securities | $ | 15,394 | $ | - | $ | - | $ | - | $ | 15,394 | ||||||
U.S. agency securities | 19,670 | 27,115 | 36 | - | 46,821 | |||||||||||
Total U.S. government and agency securities | 35,064 | 27,115 | 36 | - | 62,215 | |||||||||||
Other sovereign government obligations | 21,080 | 4,362 | 3 | - | 25,445 | |||||||||||
Corporate and other debt: | ||||||||||||||||
State and municipal securities | - | 3,234 | 713 | - | 3,947 | |||||||||||
Residential mortgage-backed securities | - | 4,285 | 818 | - | 5,103 | |||||||||||
Commercial mortgage-backed securities | - | 2,930 | 1,573 | - | 4,503 | |||||||||||
Asset-backed securities | - | 4,797 | 591 | - | 5,388 | |||||||||||
Corporate bonds | - | 37,363 | 1,038 | - | 38,401 | |||||||||||
Collateralized debt obligations | - | 1,539 | 1,553 | - | 3,092 | |||||||||||
Loans and lending commitments | - | 13,759 | 12,506 | - | 26,265 | |||||||||||
Other debt | - | 2,093 | 1,662 | - | 3,755 | |||||||||||
Total corporate and other debt(1) | - | 70,000 | 20,454 | - | 90,454 | |||||||||||
Corporate equities(2) | 49,732 | 7,700 | 536 | - | 57,968 | |||||||||||
Derivative and other contracts(3) | 2,310 | 102,466 | 14,549 | (70,244 | ) | 49,081 | ||||||||||
Investments | 743 | 930 | 7,613 | - | 9,286 | |||||||||||
Physical commodities | - | 5,329 | - | - | 5,329 | |||||||||||
Total financial instruments owned | 108,929 | 217,902 | 43,191 | (70,244 | ) | 299,778 | ||||||||||
Securities received as collateral | 12,778 | 855 | 23 | - | 13,656 | |||||||||||
Intangible assets(4) | - | - | 137 | - | 137 | |||||||||||
Liabilities | ||||||||||||||||
Commercial paper and other short-term borrowings | $ | - | $ | 791 | $ | - | $ | - | $ | 791 | ||||||
Deposits | - | 4,943 | 24 | - | 4,967 | |||||||||||
Financial instruments sold, not yet purchased: | ||||||||||||||||
U.S. government and agency securities: | ||||||||||||||||
U.S. Treasury securities | 17,907 | 1 | - | - | 17,908 | |||||||||||
U.S. agency securities | 2,573 | 22 | - | - | 2,595 | |||||||||||
Total U.S. government and agency securities | 20,480 | 23 | - | - | 20,503 | |||||||||||
Other sovereign government obligations | 16,747 | 1,497 | - | - | 18,244 | |||||||||||
Corporate and other debt: | ||||||||||||||||
State and municipal securities | - | 9 | - | - | 9 | |||||||||||
Commercial mortgage-backed securities | - | 8 | - | - | 8 | |||||||||||
Asset-backed securities | - | 63 | 4 | - | 67 | |||||||||||
Corporate bonds | - | 5,812 | 29 | - | 5,841 | |||||||||||
Collateralized debt obligations | - | - | 3 | - | 3 | |||||||||||
Unfunded lending commitments | - | 732 | 252 | - | 984 | |||||||||||
Other debt | - | 483 | 431 | - | 914 | |||||||||||
Total corporate and other debt | - | 7,107 | 719 | - | 7,826 | |||||||||||
Corporate equities(2) | 18,125 | 4,472 | 4 | - | 22,601 | |||||||||||
Derivative and other contracts(3) | 3,383 | 67,847 | 6,203 | (39,224 | ) | 38,209 | ||||||||||
Total financial instruments sold, not yet purchased | 58,735 | 80,946 | 6,926 | (39,224 | ) | 107,383 | ||||||||||
Obligation to return securities received as collateral | 12,778 | 855 | 23 | - | 13,656 | |||||||||||
Other secured financings(1) | - | 6,570 | 1,532 | - | 8,102 | |||||||||||
Long-term borrowings | - | 30,745 | 6,865 | - | 37,610 | |||||||||||
| (1) | Approximately $3.0 billion of assets is included in Corporate and other debt and approximately $2.6 billion of related liabilities is included in Other secured financings related to consolidated VIEs or non-consolidated VIEs (in the cases where the assets were transferred by the Company to the VIE and the transfers were accounted for as secured financings). The Company cannot unilaterally |
| 139 | |
MORGAN STANLEY
NOTES TO CONSOLIDATED FINANCIAL STATEMENTS-(Continued)
remove the assets from the VIEs as these assets are not generally available to the Company. The related liabilities issued by these VIEs are non-recourse to the Company. Approximately $1.9 billion of these assets and approximately $1.3 billion of these liabilities are included in Level 3 of the fair value hierarchy. See Note 6 for additional information on consolidated and non-consolidated VIEs, including retained interests in these entities that the Company holds. |
| (2) | The Company holds or sells short for trading purposes, equity securities issued by entities in diverse industries and of varying size. |
| (3) | For positions with the same counterparty that cross over the levels of the fair value hierarchy, both counterparty netting and cash collateral netting are included in the column titled "Counterparty and Cash Collateral Netting." For contracts with the same counterparty, counterparty netting among positions classified within the same level is included within that level. For further information on derivative instruments and hedging activities, see Note 10. |
| (4) | Amount represents mortgage servicing rights ("MSRs") accounted for at fair value. See Note 6 for further information on MSRs. |
Assets and Liabilities Measured at Fair Value on a Recurring Basis as of December 31, 2008
| Quoted Prices in Active Markets for Identical Assets (Level 1) | Significant Observable Inputs (Level 2) | Significant Unobservable Inputs (Level 3) | Counterparty and Cash Collateral Netting | Balance at December 31, 2008 | ||||||||||||
| (dollars in millions) | ||||||||||||||||
Assets | ||||||||||||||||
Financial instruments owned: | ||||||||||||||||
U.S. government and agency securities | $ | 10,150 | $ | 17,735 | $ | 127 | $ | - | $ | 28,012 | ||||||
Other sovereign government obligations | 16,118 | 4,965 | 1 | - | 21,084 | |||||||||||
Corporate and other debt(1) | 99 | 52,277 | 34,918 | - | 87,294 | |||||||||||
Corporate equities | 37,807 | 3,538 | 976 | - | 42,321 | |||||||||||
Derivative and other contracts(2) | 1,069 | 156,224 | 37,711 | (105,586 | ) | 89,418 | ||||||||||
Investments | 417 | 270 | 9,698 | - | 10,385 | |||||||||||
Physical commodities | - | 2,126 | - | - | 2,126 | |||||||||||
Total financial instruments owned | 65,660 | 237,135 | 83,431 | (105,586 | ) | 280,640 | ||||||||||
Securities received as collateral | 4,623 | 578 | 30 | - | 5,231 | |||||||||||
Intangible assets(3) | - | - | 184 | - | 184 | |||||||||||
Liabilities | ||||||||||||||||
Commercial paper and other short-term borrowings | $ | - | $ | 1,246 | $ | - | $ | - | $ | 1,246 | ||||||
Deposits | - | 9,993 | - | - | 9,993 | |||||||||||
Financial instruments sold, not yet purchased: | ||||||||||||||||
U.S. government and agency securities | 11,133 | 769 | - | - | 11,902 | |||||||||||
Other sovereign government obligations | 7,303 | 2,208 | - | - | 9,511 | |||||||||||
Corporate and other debt | 17 | 6,102 | 3,808 | - | 9,927 | |||||||||||
Corporate equities | 15,064 | 1,749 | 27 | - | 16,840 | |||||||||||
Derivative and other contracts(2) | 3,886 | 118,432 | 14,329 | (68,093 | ) | 68,554 | ||||||||||
Physical commodities | - | 33 | - | - | 33 | |||||||||||
Total financial instruments sold, not yet purchased | 37,403 | 129,293 | 18,164 | (68,093 | ) | 116,767 | ||||||||||
Obligation to return securities received as collateral | 4,623 | 578 | 30 | - | 5,231 | |||||||||||
Other secured financings(1) | - | 6,391 | 6,148 | - | 12,539 | |||||||||||
Long-term borrowings | - | 25,293 | 5,473 | - | 30,766 | |||||||||||
| (1) | Approximately $8.9 billion of assets is included in Corporate and other debt and approximately $7.9 billion of related liabilities is included in Other secured financings related to consolidated VIEs or non-consolidated VIEs (in the cases where the assets were transferred by the Company to the VIE and the transfers were accounted for as secured financings). The Company cannot unilaterally remove the assets from the VIEs; these assets are not generally available to the Company. The related liabilities issued by these VIEs are non-recourse to the Company. Approximately $8.1 billion of these assets and approximately $5.9 billion of these liabilities are included in Level 3 of the fair value hierarchy. See Note 6 for additional information on consolidated and non-consolidated VIEs, including retained interests in these entities that the Company holds. |
| | 140 |
MORGAN STANLEY
NOTES TO CONSOLIDATED FINANCIAL STATEMENTS-(Continued)
| (2) | For positions with the same counterparty that cross over the levels of the fair value hierarchy, both counterparty netting and cash collateral netting are included in the column titled "Counterparty and Cash Collateral Netting." For contracts with the same counterparty, counterparty netting among positions classified within the same level is included within that level. For further information on derivative instruments and hedging activities, see Note 10. |
| (3) | Amount represents MSRs accounted for at fair value. See Note 6 for further information on MSRs. |
The following tables present additional information about Level 3 assets and liabilities measured at fair value on a recurring basis for 2009, fiscal 2008, fiscal 2007 and the one month ended December 31, 2008. Level 3 instruments may be hedged with instruments classified in Level 1 and Level 2. As a result, the realized and unrealized gains (losses) for assets and liabilities within the Level 3 category presented in the tables below do not reflect the related realized and unrealized gains (losses) on hedging instruments that have been classified by the Company within the Level 1 and/or Level 2 categories. Additionally, both observable and unobservable inputs may be used to determine the fair value of positions that the Company has classified within the Level 3 category. As a result, the unrealized gains (losses) during the period for assets and liabilities within the Level 3 category presented in the tables below may include changes in fair value during the period that were attributable to both observable ( e.g. , changes in market interest rates) and unobservable ( e.g. , changes in unobservable long-dated volatilities) inputs.
The following tables reflect gains (losses) for all assets and liabilities categorized as Level 3 for 2009, fiscal 2008, fiscal 2007 and the one month ended December 31, 2008, respectively. For assets and liabilities that were transferred into Level 3 during the period, gains (losses) are presented as if the assets or liabilities had been transferred into Level 3 as of the beginning of the period; similarly, for assets and liabilities that were transferred out of Level 3 during the period, gains (losses) are presented as if the assets or liabilities had been transferred out as of the beginning of the period.
| 141 | |
MORGAN STANLEY
NOTES TO CONSOLIDATED FINANCIAL STATEMENTS-(Continued)
Changes in Level 3 Assets and Liabilities Measured at Fair Value on a Recurring Basis for 2009
| Beginning Balance at December 31, 2008 | Total Realized and Unrealized Gains (Losses)(1) | Purchases, Sales, Other Settlements and Issuances, net | Net Transfers In and/or (Out) of Level 3 | Ending Balance at December 31, 2009 | Unrealized Gains (Losses) for Level 3 Assets/ Liabilities Outstanding at December 31, 2009(2) | |||||||||||||||||
| (dollars in millions) | ||||||||||||||||||||||
Assets | ||||||||||||||||||||||
Financial instruments owned: | ||||||||||||||||||||||
U.S. agency securities | $ | 127 | $ | (2 | ) | $ | (56 | ) | $ | (33 | ) | $ | 36 | $ | - | |||||||
Other sovereign government obligations | 1 | (3 | ) | 1 | 4 | 3 | - | |||||||||||||||
Corporate and other debt: | ||||||||||||||||||||||
State and municipal securities | 2,065 | 2 | (413 | ) | (941 | ) | 713 | (26 | ) | |||||||||||||
Residential mortgage-backed securities | 1,197 | (79 | ) | (125 | ) | (175 | ) | 818 | (52 | ) | ||||||||||||
Commercial mortgage-backed securities | 3,017 | (654 | ) | (314 | ) | (476 | ) | 1,573 | (662 | ) | ||||||||||||
Asset-backed securities | 1,013 | 91 | (468 | ) | (45 | ) | 591 | (12 | ) | |||||||||||||
Corporate bonds | 2,753 | (184 | ) | (917 | ) | (614 | ) | 1,038 | 33 | |||||||||||||
Collateralized debt obligations | 946 | 630 | 30 | (53 | ) | 1,553 | 418 | |||||||||||||||
Loans and lending commitments | 20,180 | (1,225 | ) | (5,898 | ) | (551 | ) | 12,506 | (763 | ) | ||||||||||||
Other debt | 3,747 | 985 | (2,386 | ) | (684 | ) | 1,662 | 775 | ||||||||||||||
Total corporate and other debt | 34,918 | (434 | ) | (10,491 | ) | (3,539 | ) | 20,454 | (289 | ) | ||||||||||||
Corporate equities | 976 | 121 | (691 | ) | 130 | 536 | (227 | ) | ||||||||||||||
Net derivative and other contracts(3) | 23,382 | (4,316 | ) | (956 | ) | (9,764 | ) | 8,346 | (3,037 | ) | ||||||||||||
Investments | 9,698 | (1,418 | ) | 82 | (749 | ) | 7,613 | (1,317 | ) | |||||||||||||
Securities received as collateral | 30 | - | (7 | ) | - | 23 | - | |||||||||||||||
Intangible assets | 184 | (44 | ) | (3 | ) | - | 137 | (44 | ) | |||||||||||||
Liabilities | ||||||||||||||||||||||
Deposits | $ | - | $ | (2 | ) | $ | - | $ | 22 | $ | 24 | $ | (2 | ) | ||||||||
Other sovereign government obligations | - | - | (10 | ) | 10 | - | - | |||||||||||||||
Financial instruments sold, not yet purchased: | ||||||||||||||||||||||
Corporate and other debt: | ||||||||||||||||||||||
Commercial mortgage-backed securities | 13 | - | (13 | ) | - | - | - | |||||||||||||||
Asset-backed securities | 4 | - | - | - | 4 | - | ||||||||||||||||
Corporate bonds | 395 | (22 | ) | (291 | ) | (97 | ) | 29 | (30 | ) | ||||||||||||
Collateralized debt obligations | - | - | 3 | - | 3 | - | ||||||||||||||||
Unfunded lending commitments | 24 | (12 | ) | 216 | - | 252 | (12 | ) | ||||||||||||||
Other debt | 3,372 | (13 | ) | (2,291 | ) | (663 | ) | 431 | (196 | ) | ||||||||||||
Total corporate and other debt | 3,808 | (47 | ) | (2,376 | ) | (760 | ) | 719 | (238 | ) | ||||||||||||
Corporate equities | 27 | (6 | ) | (90 | ) | 61 | 4 | (1 | ) | |||||||||||||
Obligation to return securities received as collateral | 30 | - | (7 | ) | - | 23 | - | |||||||||||||||
Other secured financings | 6,148 | 396 | (3,757 | ) | (463 | ) | 1,532 | (50 | ) | |||||||||||||
Long-term borrowings | 5,473 | (450 | ) | 267 | 675 | 6,865 | (450 | ) | ||||||||||||||
| (1) | Total realized and unrealized gains (losses) are primarily included in Principal transactions-trading in the consolidated statements of income except for $(1,418) million related to Financial instruments owned-investments, which is included in Principal transactions-investments. |
| | 142 |
MORGAN STANLEY
NOTES TO CONSOLIDATED FINANCIAL STATEMENTS-(Continued)
| (2) | Amounts represent unrealized gains (losses) for 2009 related to assets and liabilities still outstanding at December 31, 2009. |
| (3) | Net derivative and other contracts represent Financial instruments owned-derivative and other contracts net of Financial instruments sold, not yet purchased-derivative and other contracts. For further information on derivative instruments and hedging activities, see Note 10. |
Financial instruments owned-Corporate and other debt . The net losses in Level 3 Corporate and other debt were primarily driven by certain corporate loans and certain commercial mortgage-backed securities, partially offset by gains in certain other debt and collateralized debt obligations.
During 2009, the Company reclassified approximately $6.8 billion of certain Corporate and other debt from Level 3 to Level 2. The reclassifications were primarily related to certain corporate loans and bonds, state and municipal securities, CMBS and other debt. For certain corporate loans, more liquidity re-entered the market and external prices and/or spread inputs for these instruments became observable. For corporate bonds and CMBS, the reclassifications were primarily due to an increase in market price quotations for these or comparable instruments, or available broker quotes, such that observable inputs were utilized for the fair value measurement of these instruments. For certain other debt, as the unobservable inputs became insignificant in the overall valuation, the fair value of these instruments became highly correlated with similar instruments in an observable market. For state and municipal securities, certain SLARS were reclassified as there was increased activity in the SLARS market and restructuring activity of the underlying trusts.
During 2009, the Company also reclassified approximately $3.3 billion of certain Corporate and other debt from Level 2 to Level 3. The reclassifications were primarily related to certain corporate loans and were generally due to a reduction in market price quotations for these or comparable instruments, or a lack of available broker quotes, such that unobservable inputs had to be utilized for the fair value measurement of these instruments. The key unobservable inputs are assumptions to establish comparability to other instruments with observable spread levels.
Financial instruments owned-Net derivative and other contracts . The net losses in Net derivative and other contracts were primarily driven by tightening of credit spreads on underlying reference entities of single name and basket credit default swaps.
During 2009, the Company reclassified approximately $10.2 billion of certain Derivatives and other contracts from Level 3 to Level 2, primarily related to single name subprime and CMBS credit default swaps as well as tranched-indexed corporate credit default swaps. Certain single name subprime and CMBS credit default swaps were reclassified primarily because the values associated with the unobservable inputs, such as correlation, were no longer deemed significant to the fair value measurement of these derivative contracts due to market deterioration. Increased availability of transaction data, broker quotes and/or consensus pricing resulted in the reclassifications of certain tranche-indexed corporate credit default swaps. The Company reclassified approximately $0.4 billion of certain Derivatives and other contracts from Level 2 to Level 3 as certain inputs became unobservable.
Financial instruments owned-Investments . The net losses from investments were primarily related to investments associated with the Company's real estate products.
The Company reclassified investments in certain hedge funds from Level 3 to Level 2 because they were redeemable at the measurement date or in the near future.
| 143 | |
MORGAN STANLEY
NOTES TO CONSOLIDATED FINANCIAL STATEMENTS-(Continued)
Changes in Level 3 Assets and Liabilities Measured at Fair Value on a Recurring Basis for the Fiscal Year Ended November 30, 2008
| Beginning Balance | Total Realized and Unrealized Gains (Losses)(1) | Purchases, Sales, Other Settlements and Issuances, net | Net Transfers In and/or (Out) of Level 3 | Ending Balance | Unrealized Gains (Losses) for Level 3 Assets/ Liabilities Outstanding at November 30, 2008(2) | |||||||||||||||||
| (dollars in millions) | ||||||||||||||||||||||
Assets | ||||||||||||||||||||||
Financial instruments owned: | ||||||||||||||||||||||
U.S. government and agency securities | $ | 660 | $ | 9 | $ | (367 | ) | $ | (96 | ) | $ | 206 | $ | (8 | ) | |||||||
Other sovereign government obligations | 29 | (6 | ) | (20 | ) | - | 3 | (2 | ) | |||||||||||||
Corporate and other debt | 37,058 | (12,835 | ) | 411 | 9,826 | 34,460 | (12,683 | ) | ||||||||||||||
Corporate equities | 1,236 | (537 | ) | (52 | ) | 260 | 907 | (351 | ) | |||||||||||||
Net derivative and other contracts(3) | 5,938 | 20,974 | (512 | ) | 1,224 | 27,624 | 20,499 | |||||||||||||||
Investments | 13,068 | (3,324 | ) | 2,151 | (2,163 | ) | 9,732 | (3,350 | ) | |||||||||||||
Securities received as collateral | 7 | - | 8 | - | 15 | - | ||||||||||||||||
Intangible assets | - | (220 | ) | 19 | 421 | 220 | (220 | ) | ||||||||||||||
Liabilities | ||||||||||||||||||||||
Financial instruments sold, not yet purchased: | ||||||||||||||||||||||
Corporate and other debt | $ | 1,122 | $ | 221 | $ | 2,865 | $ | 177 | $ | 3,943 | $ | 94 | ||||||||||
Corporate equities | 16 | (165 | ) | (271 | ) | 111 | 21 | 27 | ||||||||||||||
Obligation to return securities received as collateral | 7 | - | 8 | - | 15 | - | ||||||||||||||||
Other secured financings | 2,321 | 1,349 | 1,440 | 3,335 | 5,747 | 1,349 | ||||||||||||||||
Long-term borrowings | 398 | 226 | 5,428 | (183 | ) | 5,417 | 226 | |||||||||||||||
| (1) | Total realized and unrealized gains (losses) are primarily included in Principal transactions-trading in the consolidated statements of income except for $(3,324) million related to Financial instruments owned-investments, which is included in Principal transactions-investments. |
| (2) | Amounts represent unrealized gains (losses) for fiscal 2008 related to assets and liabilities still outstanding at November 30, 2008. |
| (3) | Net derivative and other contracts represent Financial instruments owned-derivative and other contracts net of Financial instruments sold, not yet purchased-derivative and other contracts. |
Financial instruments owned-Corporate and other debt . The net losses in Level 3 Corporate and other debt were primarily driven by certain asset-backed securities, including residential and commercial mortgage loans, certain collateralized debt obligations (including collateralized bond obligations and collateralized loan obligations), certain commercial whole loans and by certain corporate loans and lending commitments.
During fiscal 2008, the Company reclassified approximately $17.3 billion of certain Corporate and other debt from Level 2 to Level 3. The reclassifications were primarily related to residential and commercial mortgage-backed securities, commercial whole loans and corporate loans. The reclassifications were due to a reduction in the volume of recently executed transactions and market price quotations for these instruments, or a lack of
| | 144 |
MORGAN STANLEY
NOTES TO CONSOLIDATED FINANCIAL STATEMENTS-(Continued)
available broker quotes, such that unobservable inputs had to be utilized for the valuation of these instruments. These unobservable inputs include, depending upon the position, assumptions to establish comparability to bonds, loans or swaps with observable price/spread levels, default recovery rates, forecasted credit losses and prepayment rates.
During fiscal 2008, the Company reclassified approximately $7.5 billion of certain Corporate and other debt from Level 3 to Level 2. These reclassifications primarily related to ABS and corporate loans as some liquidity re-entered the market for these specific positions and external prices and spread inputs for these instruments became observable.
Financial instruments owned-Net derivative and other contracts . The net gains in Level 3 Net derivative and other contracts were primarily driven by widening of credit spreads on underlying reference entities of certain basket default swaps, single name default swaps and tranche-indexed credit default swaps where the Company was long protection.
The Company reclassified certain Net derivative contracts from Level 2 to Level 3. The reclassifications were primarily related to tranche-indexed credit default swaps. The reclassifications were due to a reduction in the volume of recently executed transactions and market price quotations for these instruments, or a lack of available broker quotes, such that unobservable inputs had to be utilized for the fair value measurement. These unobservable inputs include assumptions of comparability to similar instruments with observable market levels and correlation.
Financial instruments owned-Investments . The net losses from investments were primarily related to investments associated with the Company's real estate products and private equity portfolio.
The Company reclassified investments from Level 3 to Level 2 because it was determined that certain significant inputs for the fair value measurement were observable.
Intangible assets . The Company reclassified MSRs from Level 2 to Level 3 as significant inputs to the valuation model became unobservable during the period.
Other secured financings. The Company reclassified Other secured financings from Level 2 to Level 3 because it was determined that certain significant inputs for the fair value measurement were unobservable.
Long-term borrowings. Amounts included in the Purchases, sales, other settlements and issuances, net column primarily relates to the issuance of junior subordinated debentures related to the CIC investment (see Note 13).
| 145 | |
MORGAN STANLEY
NOTES TO CONSOLIDATED FINANCIAL STATEMENTS-(Continued)
Changes in Level 3 Assets and Liabilities Measured at Fair Value on a Recurring Basis for the Fiscal Year Ended November 30, 2007
| Beginning Balance | Total Realized and Unrealized Gains (Losses)(1) | Purchases, Sales, Other Settlements and Issuances, net | Net Transfers In and/or (Out) of Level 3 | Ending Balance | Unrealized Gains (Losses) for Level 3 Assets/ Liabilities Outstanding at November 30, 2007(2) | ||||||||||||||||
| (dollars in millions) | |||||||||||||||||||||
Assets | |||||||||||||||||||||
Financial instruments owned: | |||||||||||||||||||||
U.S. government and agency securities | $ | 2 | $ | 134 | $ | 524 | $ | - | $ | 660 | $ | 49 | |||||||||
Other sovereign government obligations | 162 | 10 | (143 | ) | - | 29 | 2 | ||||||||||||||
Corporate and other debt | 33,941 | (5,999 | ) | 3,664 | 5,452 | 37,058 | (4,528 | ) | |||||||||||||
Corporate equities | 1,040 | 62 | (260 | ) | 394 | 1,236 | 515 | ||||||||||||||
Net derivative and other contracts(3) | 30 | 4,152 | 913 | 843 | 5,938 | (3,294 | ) | ||||||||||||||
Investments | 3,879 | 2,538 | 6,651 | - | 13,068 | 1,492 | |||||||||||||||
Securities received as collateral | 40 | - | (33 | ) | - | 7 | - | ||||||||||||||
Other assets(4) | 2,154 | 32 | (2,186 | ) | - | - | - | ||||||||||||||
Liabilities | |||||||||||||||||||||
Financial instruments sold, not yet purchased: | |||||||||||||||||||||
Corporate and other debt | $ | 185 | $ | (1,242 | ) | $ | (439 | ) | $ | 134 | $ | 1,122 | $ | (455 | ) | ||||||
Corporate equities | 9 | (58 | ) | (55 | ) | 4 | 16 | (27 | ) | ||||||||||||
Obligation to return securities received as collateral | 40 | - | (33 | ) | - | 7 | - | ||||||||||||||
Other secured financings | 4,724 | - | (2,403 | ) | - | 2,321 | - | ||||||||||||||
Long-term borrowings | 464 | (114 | ) | (185 | ) | 5 | 398 | (116 | ) | ||||||||||||
| (1) | Total realized and unrealized gains (losses) are included in Principal transactions-trading in the consolidated statements of income except for $2,538 million related to Financial instruments owned-investments, which is included in Principal transactions-investments and $32 million related to Other assets associated with DFS and included in discontinued operations. |
| (2) | Amounts represent unrealized gains (losses) for fiscal 2007 related to assets and liabilities still outstanding at November 30, 2007. |
| (3) | Net derivative and other contracts represent Financial instruments owned-derivative and other contracts net of Financial instruments sold, not yet purchased-derivative and other contracts. |
| (4) | Other assets were disposed of in connection with the Discover Spin-off. |
Financial instruments owned and Financial instruments sold, not yet purchased-Corporate and other debt . The net losses in Level 3 Corporate and other debt were primarily driven by certain asset-backed securities, including residential and commercial mortgage loans, and by corporate loans and lending commitments.
The Company reclassified certain Corporate and other debt from Level 2 to Level 3 because certain significant inputs for the fair value measurement became unobservable. These reclassifications included transfers in the fourth quarter of fiscal 2007 primarily related to the continued market and liquidity deterioration in the mortgage markets. The most material transfers into Level 3 were in commercial whole loans, residuals from residential securitizations and interest-only commercial mortgage and agency bonds.
| | 146 |
MORGAN STANLEY
NOTES TO CONSOLIDATED FINANCIAL STATEMENTS-(Continued)
Financial instruments owned-Net derivative and other contracts . The net gains in Level 3 Net derivative contracts were primarily driven by certain credit default swaps and other instruments associated with the Company's credit products and securitized products activities. The Company recorded offsetting net losses in Level 2 Net derivative contracts, which were primarily associated with the Company's credit products and securitized products activities.
The Company reclassified certain Net derivative contracts from Level 2 to Level 3 because certain significant inputs for the fair value measurement became unobservable. The most material transfers into Level 3 were commercial and residential credit default swaps.
Financial instruments owned-Investments. The net gains from Financial instruments owned-investments were primarily related to investments associated with the Company's real estate products and private equity portfolio.
Changes in Level 3 Assets and Liabilities Measured at Fair Value on a Recurring Basis for the One Month Ended December 31, 2008
| Beginning Balance at November 30, 2008 | Total Realized and Unrealized Gains (Losses)(1) | Purchases, Sales, Other Settlements and Issuances, net | Net Transfers In and/or (Out) of Level 3 | Ending Balance at December 31, 2008 | Unrealized Gains (Losses) for Level 3 Assets/ Liabilities Outstanding at December 31, 2008(2) | |||||||||||||||||
| (dollars in millions) | ||||||||||||||||||||||
Assets | ||||||||||||||||||||||
Financial instruments owned: | ||||||||||||||||||||||
U.S. government and agency securities | $ | 206 | $ | (3 | ) | $ | (76 | ) | $ | - | $ | 127 | $ | (5 | ) | |||||||
Other sovereign government obligations | 3 | - | (1 | ) | (1 | ) | 1 | - | ||||||||||||||
Corporate and other debt | 34,460 | (393 | ) | 1,036 | (185 | ) | 34,918 | (378 | ) | |||||||||||||
Corporate equities | 907 | (11 | ) | (3 | ) | 83 | 976 | (10 | ) | |||||||||||||
Net derivative and other contracts(3) | 27,624 | (2,040 | ) | (43 | ) | (2,159 | ) | 23,382 | (1,879 | ) | ||||||||||||
Investments | 9,732 | (169 | ) | 149 | (14 | ) | 9,698 | (158 | ) | |||||||||||||
Securities received as collateral | 15 | - | 15 | - | 30 | - | ||||||||||||||||
Intangible assets | 220 | (36 | ) | - | - | 184 | (36 | ) | ||||||||||||||
Liabilities | ||||||||||||||||||||||
Financial instruments sold, not yet purchased: | ||||||||||||||||||||||
Corporate and other debt | $ | 3,943 | $ | (43 | ) | $ | (140 | ) | $ | (38 | ) | $ | 3,808 | $ | (63 | ) | ||||||
Corporate equities | 21 | (20 | ) | (20 | ) | 6 | 27 | 1 | ||||||||||||||
Obligation to return securities received as collateral | 15 | - | 15 | - | 30 | - | ||||||||||||||||
Other secured financings | 5,747 | (219 | ) | 34 | 148 | 6,148 | (219 | ) | ||||||||||||||
Long-term borrowings | 5,417 | (52 | ) | 4 | - | 5,473 | (51 | ) | ||||||||||||||
| (1) | Total realized and unrealized gains (losses) are primarily included in Principal transactions-trading in the consolidated statements of income except for $(169) million related to Financial instruments owned-investments, which is included in Principal transactions-investments. |
| 147 | |
MORGAN STANLEY
NOTES TO CONSOLIDATED FINANCIAL STATEMENTS-(Continued)
| (2) | Amounts represent unrealized gains (losses) for the one month ended December 31, 2008 related to assets and liabilities still outstanding at December 31, 2008. |
| (3) | Net derivative and other contracts represent Financial instruments owned-derivative and other contracts net of Financial instruments sold, not yet purchased-derivative and other contracts. For further information on derivative instruments and hedging activities, see Note 10. |
Financial instruments owned-Net derivative and other contracts . The net losses in Net derivative and other contracts were primarily driven by tightening of credit spreads on underlying reference entities of certain basket credit default swaps, single name credit default swaps and corporate tranche-indexed credit default swaps.
The Company reclassified certain Net derivative contracts from Level 3 to Level 2. The reclassifications were primarily related to corporate tranche-indexed credit default swaps. The reclassifications were due to an increase in transaction data, available broker quotes and/or available consensus pricing, such that significant inputs for the fair value measurement were observable.
Fair Value of Investments that Calculate Net Asset Value.
The following table presents information about the Company's investments in private equity funds, real estate funds and hedge funds measured at fair value based on NAV as of December 31, 2009.
| Fair Value | Unfunded Commitment | |||||
| (dollars in millions) | ||||||
Private equity funds | $ | 1,728 | $ | 1,251 | ||
Real estate funds | 823 | 674 | ||||
Hedge funds(1): | ||||||
Long-short equity hedge funds | 1,597 | - | ||||
Fixed income/credit-related hedge funds | 407 | - | ||||
Event-driven hedge funds | 146 | - | ||||
Multi-strategy hedge funds | 235 | - | ||||
Total | $ | 4,936 | $ | 1,925 | ||
| (1) | Fixed income/credit-related hedge funds, event-driven hedge funds, and multi-strategy hedge funds are redeemable at least on a quarterly basis with a notice period of ninety days or less. Approximately 36% of the fair value amount of long-short equity hedge funds is redeemable at least quarterly, 15% is redeemable every six months and 49% of these funds have a redemption frequency of greater than six months. The notice period for long-short equity hedge funds is primarily ninety days or less. |
Private Equity Funds. Amount includes several private equity funds that pursue multiple strategies including leveraged buyouts, venture and infrastructure growth capital, distressed investments, and mezzanine capital. In addition, the funds may be structured with a focus on specific domestic or foreign geographic regions. These investments are generally not redeemable with the funds. Instead, the nature of the investments in this category is that distributions are received through the liquidation of the underlying assets of the fund. It is estimated that 32% of fair value of the funds will be liquidated within the next five years, another 29% of the fair value of the funds will be liquidated between five to ten years and the remaining 39% of the fair value of the funds have a remaining life of greater than ten years.
Real Estate Funds. Amount includes several real estate funds that invest in real estate assets such as commercial office buildings, retail properties, multi-family residential properties, developments, or hotels. In addition, the funds may be structured with a focus on specific geographic domestic or foreign regions. These investments are generally not redeemable with the funds. Distributions from each fund will be received as the underlying investments of the funds are liquidated. It is estimated that a majority of real estate funds have a remaining life of greater than 10 years.
| | 148 |
MORGAN STANLEY
NOTES TO CONSOLIDATED FINANCIAL STATEMENTS-(Continued)
Hedge Funds . Investments in hedge funds may be subject to initial period lock-up restrictions or gates. A hedge fund lock-up provision is a provision which provides that, during a certain initial period, an investor may not make a withdrawal from the fund. The purpose of a gate is to restrict the level of redemptions that an investor in a particular hedge fund can demand on any redemption date.
| • | Long-short Equity Hedge Funds. Amount includes investments in hedge funds that invest, long/short, in equities. Equity value and growth hedge funds purchase stocks perceived to be undervalued and sell stocks perceived to be overvalued. Investments representing approximately 38% of the fair value of the investments in this category cannot be redeemed currently because the investments include certain initial period lock-up restrictions. The remaining restriction period for 45% of investments subject to lock-up restrictions ranged from one to three years at December 31, 2009. The remaining restriction period for the other 55% of investments subject to lock-up restrictions was estimated to be greater than three years at December 31, 2009. Investments representing approximately 50% of the fair value of the investments in long-short equity hedge funds cannot be redeemed currently because an exit restriction has been imposed by the hedge fund manager. The restriction period for 86% of investments subject to an exit restriction is expected to be less than a year at December 31, 2009. |
| • | Fixed Income/Credit-Related Hedge Funds. Amount includes investments in hedge funds that invest in long-short, distressed, and relative value securities in order to benefit from undervalued or over-valued securities that are primarily debt or credit related. Investments representing approximately 95% of the fair value of the investments in fixed income/credit-related hedge funds cannot be redeemed currently because the investments include certain initial period lock-up restrictions. The remaining restriction period for these investments was three years or less at December 31, 2009. |
| • | Event-Driven Hedge Funds. Amount includes investments in hedge funds that invest in event-driven situations such as mergers, hostile takeovers, reorganizations, or leveraged buyouts. This may involve the simultaneous purchase of stock in companies being acquired, and the sale of stock in its acquirer, hoping to profit from the spread between the current market price and the ultimate purchase price of the target company. Investments representing approximately 100% of the value of the investments in this category cannot be redeemed currently because the investments include certain initial period lock-up restrictions. The remaining restriction period for these investments was three years or less at December 31, 2009. |
| • | Multi-strategy Hedge Funds. Amount includes investments in hedge funds that pursue multiple strategies to realize short and long-term gains. Management of the hedge funds has the ability to overweight or underweight different strategies to best capitalize on current investment opportunities. Investments representing approximately 44% of the fair value of the investments in this category cannot be redeemed currently because the investments include certain initial period lock-up restrictions. The remaining restriction period for 63% of investments subject to lock-ups was three years or less at December 31, 2009. In addition, investments representing approximately 27% of the fair value of the investments in this category cannot be redeemed currently because an exit restriction has been imposed by the hedge fund manager. The redemption restriction for all investments subject to an exit restriction has been in place for less than two years at December 31, 2009 and the time at which the redemption restriction may lapse cannot be estimated. |
| 149 | |
MORGAN STANLEY
NOTES TO CONSOLIDATED FINANCIAL STATEMENTS-(Continued)
Fair Value Option.
The Company elected the fair value option for certain eligible instruments that are risk managed on a fair value basis. The following tables present net gains (losses) due to changes in fair value for items measured at fair value pursuant to the fair value option election for 2009, fiscal 2008, fiscal 2007 and the one month ended December 31, 2008.
| Principal Transactions- Trading | Interest Expense | (Losses) Gains Included in Net Revenues | ||||||||||
| (dollars in millions) | ||||||||||||
2009 | ||||||||||||
Commercial paper and other short-term borrowings | $ | (176 | ) | $ | - | $ | (176 | ) | ||||
Deposits | (81 | ) | (321 | ) | (402 | ) | ||||||
Long-term borrowings | (7,351 | ) | (983 | ) | (8,334 | ) | ||||||
Fiscal 2008 | ||||||||||||
Commercial paper and other short-term borrowings | $ | 1,238 | $ | (2 | ) | $ | 1,236 | |||||
Deposits | 14 | - | 14 | |||||||||
Long-term borrowings | 10,924 | (1,059 | ) | 9,865 | ||||||||
Fiscal 2007 | ||||||||||||
Commercial paper and other short-term borrowings | $ | (326 | ) | $ | (5 | ) | $ | (331 | ) | |||
Deposits | (5 | ) | - | (5 | ) | |||||||
Long-term borrowings | (481 | ) | (366 | ) | (847 | ) | ||||||
One month ended December 31, 2008 | ||||||||||||
Commercial paper and other short-term borrowings | $ | (81 | ) | $ | - | $ | (81 | ) | ||||
Deposits | (120 | ) | (26 | ) | (146 | ) | ||||||
Long-term borrowings | (1,597 | ) | (80 | ) | (1,677 | ) | ||||||
In addition to the amounts in the above table, as discussed in Note 2, all of the instruments within Financial instruments owned or Financial instruments sold, not yet purchased are measured at fair value, either through the election of the fair value option, or as required by other accounting pronouncements.
The following table presents information on the Company's short-term and long-term borrowings (including structured notes and junior subordinated debentures), loans and unfunded lending commitments for which the fair value option was elected:
(Losses) Gains Due to Changes in Instrument Specific Credit Spreads
| 2009 | Fiscal 2008 | Fiscal 2007 | One Month Ended December 31, 2008 | |||||||||||||
| (dollars in millions) | ||||||||||||||||
Short-term and long-term borrowings(1) | $ | (5,510 | ) | $ | 5,594 | $ | 840 | $ | (241 | ) | ||||||
Loans(2) | 4,139 | (5,864 | ) | (2,258 | ) | (498 | ) | |||||||||
Unfunded lending commitments(3) | (8 | ) | 280 | (291 | ) | 6 | ||||||||||
| (1) | Gains (losses) were attributable to widening or (tightening), respectively, of the Company's credit spreads and were determined based upon observations of the Company's secondary bond market spreads. The remainder of changes in overall fair value of the short-term and long-term borrowings is attributable to changes in foreign currency exchange rates and interest rates and movements in the reference price or index for structured notes. |
| (2) | Instrument-specific credit gains or (losses) were determined by excluding the non-credit components of gains and losses, such as those due to changes in interest rates. |
| (3) | Gains (losses) were generally determined based on the differential between estimated expected client and contractual yields at each respective period end. |
| | 150 |
MORGAN STANLEY
NOTES TO CONSOLIDATED FINANCIAL STATEMENTS-(Continued)
Amount by Which Contractual Principal Amount Exceeds Fair Value
| At December 31, 2009 | At December 31, 2008 | |||||
| (dollars in billions) | ||||||
Short-term and long-term debt borrowings(1) | $ | 1.9 | $ | 5.7 | ||
Loans(2) | 24.4 | 31.0 | ||||
Loans 90 or more days past due(2)(3) | 21.0 | 19.8 | ||||
| (1) | These amounts do not include structured notes where the repayment of the initial principal amount fluctuates based on changes in the reference price or index. |
| (2) | The majority of this difference between principal and fair value amounts emanates from the Company's distressed debt trading business, which purchases distressed debt at amounts well below par. |
| (3) | The aggregate fair value of loans that were 90 or more days past due as of December 31, 2009 and December 31, 2008 was $1.9 billion and $2.0 billion, respectively. |
Assets and Liabilities Measured at Fair Value on a Non-Recurring Basis.
2009.
Certain assets were measured at fair value on a non-recurring basis and are not included in the tables above. These assets may include loans, equity method investments, premises and equipment, intangible assets and real estate investments.
The following tables present, by caption on the consolidated statement of financial position, the fair value hierarchy for those assets measured at fair value on a non-recurring basis for which the Company recognized an impairment charge for 2009 and fiscal 2008, respectively.
| Carrying Value at December 31, 2009 | Fair Value Measurements Using: | Total Losses for 2009(1) | ||||||||||||||
| Quoted Prices in Active Markets for Identical Assets (Level 1) | Significant Observable Inputs (Level 2) | Significant Unobservable Inputs (Level 3) | ||||||||||||||
| (dollars in millions) | ||||||||||||||||
Receivables-Other loans(2) | $ | 739 | $ | - | $ | - | $ | 739 | $ | (269 | ) | |||||
Other investments(3) | 66 | - | - | 66 | (39 | ) | ||||||||||
Premises, equipment and software costs(4) | 8 | - | - | 8 | (5 | ) | ||||||||||
Intangible assets(4) | 3 | - | - | 3 | (4 | ) | ||||||||||
Other assets(5) | 9 | - | - | 9 | (16 | ) | ||||||||||
Total | $ | 825 | $ | - | $ | - | $ | 825 | $ | (333 | ) | |||||
| (1) | Impairment losses are recorded within Other expenses in the consolidated statement of income except for impairment losses related to Receivables-other loans and Other investments, which are included in Other revenues. |
| (2) | Impairment losses for loans were calculated based upon the fair value of the underlying collateral. The fair value of the collateral was determined using internal expected recovery models. |
| (3) | Impairment losses recorded were determined primarily using discounted cash flow models. |
| (4) | Impairment losses related to the Institutional Securities business segment's fixed income business. |
| (5) | These impairment losses relate to buildings and properties held in the Asset Management business segment and are a result of the continued adverse impact of economic conditions on domestic real estate markets. Fair values were generally determined using discounted cash flow models or third-party appraisals and valuations. |
In addition to the impairment losses included in the table above, impairment losses of approximately $466 million (of which $45 million related to Other investments, $12 million related to Intangible assets, and $409 million related to Other assets) were included in discontinued operations related to Crescent (see Note 23).
| 151 | |
MORGAN STANLEY
NOTES TO CONSOLIDATED FINANCIAL STATEMENTS-(Continued)
Impairment losses of approximately $24 million were also included in discontinued operations related to premises and equipment of an entity sold by the Company in 2009.
There were no liabilities measured at fair value on a non-recurring basis during 2009.
There were no assets or liabilities measured at fair value on a non-recurring basis for which the Company recognized an impairment charge during the one month ended December 31, 2008.
Fiscal 2008.
| Carrying Value at November 30, 2008 | Fair Value Measurements Using: | Total Losses for Fiscal 2008(1) | ||||||||||||||
| Quoted Prices in Active Markets for Identical Assets (Level 1) | Significant Observable Inputs (Level 2) | Significant Unobservable Inputs (Level 3) | ||||||||||||||
| (dollars in millions) | ||||||||||||||||
Receivables-Other loans(2) | $ | 634 | $ | - | $ | 70 | $ | 564 | $ | (121 | ) | |||||
Other investments(3) | 164 | - | - | 164 | (62 | ) | ||||||||||
Premises, equipment and software costs(4) | 91 | - | - | 91 | (15 | ) | ||||||||||
Goodwill(5) | - | - | - | - | (673 | ) | ||||||||||
Intangible assets(6) | 219 | - | - | 219 | (46 | ) | ||||||||||
Other assets(7) | 777 | - | - | 777 | (44 | ) | ||||||||||
Total | $ | 1,885 | $ | - | $ | 70 | $ | 1,815 | $ | (961 | ) | |||||
| (1) | Impairment losses are recorded within Other expenses in the consolidated statement of income except for impairment losses related to Receivables-Other loans and Other investments, which are included in Other revenues. |
| (2) | Impairment losses for loans held for investment were calculated based upon the fair value of the underlying collateral. The fair value of the collateral was determined using external indicative bids, if available, or internal expected recovery models. |
| (3) | Impairment losses recorded were determined primarily using discounted cash flow models. |
| (4) | The impairment charge relates to the fixed income business, which is a reporting unit within the Institutional Securities business segment. |
| (5) | The impairment charge relates to the fixed income business, which is a reporting unit within the Institutional Securities business segment. The fair value of the fixed income business was estimated by comparison to similar companies using their publicly traded price-to-book multiples as the basis for valuation. The impairment charge resulted from declines in the credit and mortgage markets in general, which caused significant declines in the stock market capitalization in the fourth quarter of fiscal 2008, and hence, a decline in the fair value of the fixed income business (see Note 7). |
| (6) | Impairment losses of $21 million recorded within the Institutional Securities business segment primarily related to intellectual property rights. Impairment losses of $25 million recorded within the Asset Management business segment primarily related to management contract intangibles (see Note 7). |
| (7) | Buildings and property were written down to their fair value resulting in an impairment charge of $30 million. Fair values were generally determined using discounted cash flow models or third-party appraisals and valuations. A deferred commission asset associated with certain mutual fund sales commissions was written down to its fair value, resulting in an impairment of $14 million. The fair value was determined using a discounted cash flow model. These charges relate to the Asset Management business segment. |
In addition to the impairment losses included in the table above, impairment losses of approximately $277 million (of which, $34 million related to Other investments, $6 million related to Intangible assets and $237 million related to Other assets) were included in discontinued operations related to Crescent (see Note 23).
There were no liabilities measured at fair value on a non-recurring basis during fiscal 2008.
Financial Instruments Not Measured at Fair Value.
Some of the Company's financial instruments are not measured at fair value on a recurring basis but nevertheless are recorded at amounts that approximate fair value due to their liquid or short-term nature. Such financial assets and financial liabilities include: Cash and due from banks, Interest bearing deposits with banks, Cash deposited with clearing organizations or segregated under federal and other regulations or requirements, Federal funds sold
| | 152 |
MORGAN STANLEY
NOTES TO CONSOLIDATED FINANCIAL STATEMENTS-(Continued)
and Securities purchased under agreements to resell, Securities borrowed, Securities sold under agreements to repurchase, Securities loaned, Receivables-customers, Receivables-brokers, dealers and clearing organizations, Payables-customers, Payables-brokers, dealers and clearing organizations, certain Commercial paper and other short-term borrowings, and certain Deposits.
The Company's long-term borrowings are recorded at amortized amounts unless elected under the fair value option or designated as a hedged item in a fair value hedge. For long-term borrowings not measured at fair value, the fair value of the Company's long-term borrowings was estimated using either quoted market prices or discounted cash flow analyses based on the Company's current borrowing rates for similar types of borrowing arrangements. As of December 31, 2009, the carrying value of the Company's long-term borrowings was approximately $1.4 billion higher than fair value. As of December 31, 2008, the carrying value of the Company's long-term borrowings was approximately $25.6 billion higher than fair value.
5. Collateralized Transactions.
Securities purchased under agreements to resell ("reverse repurchase agreements") and Securities sold under agreements to repurchase ("repurchase agreements"), principally government and agency securities, are carried at the amounts at which the securities subsequently will be resold or reacquired as specified in the respective agreements; such amounts include accrued interest. Reverse repurchase agreements and repurchase agreements are presented on a net-by-counterparty basis, when appropriate. The Company's policy is generally to take possession of securities purchased under agreements to resell. Securities borrowed and Securities loaned are carried at the amounts of cash collateral advanced and received in connection with the transactions. Other secured financings include the liabilities related to transfers of financial assets that are accounted for as financings rather than sales, consolidated VIEs where the Company is deemed to be the primary beneficiary, and certain equity-referenced securities and loans where in all instances these liabilities are payable solely from the cash flows of the related assets accounted for as Financial instruments owned (see Note 6).
The Company pledges its financial instruments owned to collateralize repurchase agreements and other securities financings. Pledged financial instruments that can be sold or repledged by the secured party are identified as Financial instruments owned (pledged to various parties) in the consolidated statements of financial condition. The carrying value and classification of financial instruments owned by the Company that have been loaned or pledged to counterparties where those counterparties do not have the right to sell or repledge the collateral were as follows:
| At December 31, 2009 | At December 31, 2008 | |||||
| (dollars in millions) | ||||||
Financial instruments owned: | ||||||
U.S. government and agency securities | $ | 18,376 | $ | 9,134 | ||
Other sovereign government obligations | 4,584 | 2,570 | ||||
Corporate and other debt | 13,111 | 21,850 | ||||
Corporate equities | 10,284 | 4,388 | ||||
Total | $ | 46,355 | $ | 37,942 | ||
The Company enters into reverse repurchase agreements, repurchase agreements, securities borrowed and securities loaned transactions to, among other things, acquire securities to cover short positions and settle other securities obligations, to accommodate customers' needs and to finance the Company's inventory positions. The Company also engages in securities financing transactions for customers through margin lending. Under these
| 153 | |
MORGAN STANLEY
NOTES TO CONSOLIDATED FINANCIAL STATEMENTS-(Continued)
agreements and transactions, the Company either receives or provides collateral, including U.S. government and agency securities, other sovereign government obligations, corporate and other debt, and corporate equities. The Company receives collateral in the form of securities in connection with reverse repurchase agreements, securities borrowed and derivative transactions, and customer margin loans. In many cases, the Company is permitted to sell or repledge these securities held as collateral and use the securities to secure repurchase agreements, to enter into securities lending and derivative transactions or for delivery to counterparties to cover short positions. As of December 31, 2009 and December 31, 2008, the fair value of financial instruments received as collateral where the Company is permitted to sell or repledge the securities was $429 billion and $290 billion, respectively, and the fair value of the portion that had been sold or repledged was $311 billion and $214 billion, respectively.
The Company additionally receives securities as collateral in connection with certain securities for securities transactions in which the Company is the lender. In instances where the Company is permitted to sell or repledge these securities, the Company reports the fair value of the collateral received and the related obligation to return the collateral in the consolidated statements of financial condition. As of December 31, 2009 and December 31, 2008, $14 billion and $5 billion, respectively, were reported as Securities received as collateral and an Obligation to return securities received as collateral in the consolidated statements of financial condition. Collateral received in connection with these transactions that was subsequently repledged was approximately $13 billion and $4 billion as of December 31, 2009 and December 31, 2008, respectively.
The Company manages credit exposure arising from reverse repurchase agreements, repurchase agreements, securities borrowed and securities loaned transactions by, in appropriate circumstances, entering into master netting agreements and collateral arrangements with counterparties that provide the Company, in the event of a customer default, the right to liquidate collateral and the right to offset a counterparty's rights and obligations. The Company also monitors the fair value of the underlying securities as compared with the related receivable or payable, including accrued interest, and, as necessary, requests additional collateral to ensure such transactions are adequately collateralized. Where deemed appropriate, the Company's agreements with third parties specify its rights to request additional collateral. Customer receivables generated from margin lending activity are collateralized by customer-owned securities held by the Company. For these transactions, adherence to the Company's collateral policies significantly limits the Company's credit exposure in the event of customer default. The Company may request additional margin collateral from customers, if appropriate, and, if necessary, may sell securities that have not been paid for or purchase securities sold but not delivered from customers.
The Company is subject to concentration risk by holding large positions in certain types of securities, loans or commitments to purchase securities of a single issuer, including sovereign governments and other entities, issuers located in a particular country or geographic area, public and private issuers involving developing countries, or issuers engaged in a particular industry. Financial instruments owned by the Company include U.S. government and agency securities and securities issued by other sovereign governments (principally the U.K., Japan, South Korea and Brazil), which, in the aggregate, represented approximately 11% of the Company's total assets as of December 31, 2009. In addition, substantially all of the collateral held by the Company for resale agreements or bonds borrowed, which together represented approximately 30% of the Company's total assets as of December 31, 2009, consist of securities issued by the U.S. government, federal agencies or other sovereign government obligations. Positions taken and commitments made by the Company, including positions taken and underwriting and financing commitments made in connection with its private equity, principal investment and lending activities, often involve substantial amounts and significant exposure to individual issuers and businesses, including non-investment grade issuers. In addition, the Company may originate or purchase certain residential and commercial mortgage loans that could contain certain terms and features that may result in additional credit risk as compared with more traditional types of mortgages. Such terms and features may include loans made to borrowers subject to payment increases or loans with high loan-to-value ratios.
| | 154 |
MORGAN STANLEY
NOTES TO CONSOLIDATED FINANCIAL STATEMENTS-(Continued)
As of December 31, 2009 and December 31, 2008, cash and securities deposited with clearing organizations or segregated under federal and other regulations or requirements were as follows:
| December 31, 2009 | December 31, 2008 | |||||
| (dollars in millions) | ||||||
Cash deposited with clearing organizations or segregated under federal and other regulations or requirements | $ | 23,712 | $ | 24,039 | ||
Securities(1) | 11,296 | 38,670 | ||||
Total | $ | 35,008 | $ | 62,709 | ||
| (1) | Securities deposited with clearing organizations or segregated under federal and other regulations or requirements are sourced from Federal funds sold and securities purchased under agreements to resell and Financial instruments owned in the consolidated statements of financial condition. |
6. Securitization Activities and Variable Interest Entities.
Securitization Activities and Qualifying Special Purpose Entities.
Securitization Activities. In a securitization transaction, the Company transfers assets (generally commercial or residential mortgage loans or U.S. agency securities) to a special purpose entity (an "SPE"), sells to investors most of the beneficial interests, such as notes or certificates, issued by the SPE and in many cases retains other beneficial interests. In many securitization transactions involving commercial mortgage loans, the Company transfers a portion of the assets to the SPE with unrelated parties transferring the remaining assets.
The purchase of the transferred assets by the SPE is financed through the sale of these interests. In some of these transactions, primarily involving residential mortgage loans in the U.S. and Europe and commercial mortgage loans in Europe, the Company acts as servicer for some or all of the transferred loans. In many securitizations, particularly involving residential mortgage loans, the Company also enters into derivative transactions, primarily interest rate swaps or interest rate caps, with the SPE.
In most of these transactions, the SPE met the criteria to be a QSPE under the accounting guidance effective prior to January 1, 2010 for the transfer and servicing of financial assets. The Company did not consolidate QSPEs if they met certain criteria regarding the types of assets and derivatives they may hold, the activities in which they may engage and the range of discretion they may exercise in connection with the assets they hold. The determination of whether an SPE met the criteria to be a QSPE required considerable judgment, particularly in evaluating whether the permitted activities of the SPE were significantly limited and in determining whether derivatives held by the SPE were passive and not excessive.
The primary risk retained by the Company in connection with these transactions generally was limited to the beneficial interests issued by the SPE that were owned by the Company, with the risk highest on the most subordinate class of beneficial interests. Where the QSPE criteria were met, these beneficial interests generally were included in Financial instruments owned-corporate and other debt and were measured at fair value. The Company did not provide additional support in these transactions through contractual facilities, such as liquidity facilities, guarantees, or similar derivatives.
Although not obligated, the Company generally makes a market in the securities issued by SPEs in these transactions. As a market maker, the Company offers to buy these securities from, and sell these securities to, investors. Securities purchased through these market-making activities are not considered to be retained interests, although these beneficial interests generally are included in Financial instruments owned-corporate and other debt and are measured at fair value.
| 155 | |
MORGAN STANLEY
NOTES TO CONSOLIDATED FINANCIAL STATEMENTS-(Continued)
The Company enters into derivatives, generally interest rate swaps and interest rate caps with a senior payment priority in many securitization transactions. The risks associated with these and similar derivatives with SPEs are essentially the same as similar derivatives with non-SPE counterparties and are managed as part of the Company's overall exposure.
See Note 10 for further information on derivative instruments and hedging activities.
QSPEs . The following tables present information as of December 31, 2009 and December 31, 2008 regarding QSPEs to which the Company, acting as principal, had transferred assets and received sales treatment, and QSPEs sponsored by the Company to which the Company had not transferred assets (dollars in millions):
| At December 31, 2009 | ||||||||||||
| Residential Mortgage Loans | Commercial Mortgage Loans | U.S. Agency Collateralized Mortgage Obligations | Other | |||||||||
QSPE assets (unpaid principal balance)(1) | $ | 54,504 | $ | 115,223 | $ | 64,824 | $ | 2,753 | ||||
Retained interests (fair value): | ||||||||||||
Investment grade | $ | 55 | $ | 364 | $ | 1,090 | $ | - | ||||
Non-investment grade | 62 | 467 | - | - | ||||||||
Total retained interests (fair value) | $ | 117 | $ | 831 | $ | 1,090 | $ | - | ||||
Interests purchased in the secondary market (fair value): | ||||||||||||
Investment grade | $ | 139 | $ | 430 | $ | 18 | $ | 3 | ||||
Non-investment grade | 178 | 52 | - | 43 | ||||||||
Total interests purchased in the secondary market (fair value) | $ | 317 | $ | 482 | $ | 18 | $ | 46 | ||||
Derivatives (fair value) | $ | 192 | $ | 303 | $ | - | $ | 765 | ||||
Assets serviced (unpaid principal balance) | $ | 18,902 | $ | 10,901 | $ | - | $ | - | ||||
| (1) | Amounts include $56.6 billion of assets transferred to the QSPEs by unrelated transferors. |
| At December 31, 2008 | ||||||||||||
| Residential Mortgage Loans | Commercial Mortgage Loans | U.S. Agency Collateralized Mortgage Obligations | Other | |||||||||
QSPE assets (unpaid principal balance)(1) | $ | 65,344 | $ | 112,557 | $ | 73,136 | $ | 2,684 | ||||
Retained interests (fair value): | ||||||||||||
Investment grade | $ | 500 | $ | 482 | $ | 102 | $ | - | ||||
Non-investment grade | 33 | 100 | - | - | ||||||||
Total retained interests (fair value) | $ | 533 | $ | 582 | $ | 102 | $ | - | ||||
Interests purchased in the secondary market (fair value): | ||||||||||||
Investment grade | $ | 42 | $ | 156 | $ | 8 | $ | 23 | ||||
Non-investment grade | 49 | 14 | - | 12 | ||||||||
Total interests purchased in the secondary market (fair value) | $ | 91 | $ | 170 | $ | 8 | $ | 35 | ||||
Derivatives (fair value) | $ | 488 | $ | 515 | $ | - | $ | 1,156 | ||||
Assets serviced (unpaid principal balance) | $ | 23,211 | $ | 8,196 | $ | - | $ | - | ||||
| (1) | Amounts include $57.8 billion of assets transferred to the QSPEs by unrelated transferors. |
| | 156 |
MORGAN STANLEY
NOTES TO CONSOLIDATED FINANCIAL STATEMENTS-(Continued)
Transferred assets are carried at fair value prior to securitization, and any changes in fair value are recognized in the consolidated statements of income. The Company may act as underwriter of the beneficial interests issued by securitization vehicles. Underwriting net revenues are recognized in connection with these transactions. The Company may retain interests in the securitized financial assets as one or more tranches of the securitization. These retained interests are included in the consolidated statements of financial condition at fair value. Any changes in the fair value of such retained interests are recognized in the consolidated statements of income. Net gains at the time of securitization were $104 million in 2009. Net gains at the time of securitization were not material in fiscal 2008 and in the one month ended December 31, 2008.
During 2009 and fiscal 2008, the Company received proceeds from new securitization transactions of $8.6 billion and $7.1 billion, respectively. The Company did not receive any proceeds from new securitization transactions during the one month ended December 31, 2008. During 2009, fiscal 2008 and the one month ended December 31, 2008, the Company received proceeds from cash flows from retained interests in securitization transactions of $2.1 billion, $3.1 billion and $153 million, respectively.
The Company provides representations and warranties that certain assets transferred in securitization transactions conform to specific guidelines (see Note 11).
Mortgage Servicing Rights. The Company may retain servicing rights to certain mortgage loans that are sold through its securitization activities. These transactions create an asset referred to as MSRs, which totaled approximately $137 million and $184 million as of December 31, 2009 and December 31, 2008, respectively, and are included within Intangible assets and carried at fair value in the consolidated statements of financial condition.
SPE Mortgage Servicing Activities. The Company services residential mortgage loans in the U.S. and Europe and commercial mortgage loans in Europe owned by SPEs, including SPEs sponsored by the Company and SPEs not sponsored by the Company. Most of these SPEs met the requirements for QSPEs. The Company generally holds retained interests in Company-sponsored QSPEs. In some cases, as part of its market making activities, the Company may own some beneficial interests issued by both Company-sponsored and non-Company sponsored SPEs.
The Company provides no credit support as part of its servicing activities. The Company is required to make servicing advances to the extent that it believes that such advances will be reimbursed. Reimbursement of servicing advances is a senior obligation of the SPE, senior to the most senior beneficial interests outstanding. Outstanding advances are included in Other assets and are recorded at cost. Advances as of December 31, 2009 and December 31, 2008 totaled approximately $2.2 billion and $2.4 billion, respectively, net of reserves of $23 million as of December 31, 2009 and $10 million as of December 31, 2008.
The following tables present information about the Company's mortgage servicing activities for SPEs to which the Company transferred loans as of December 31, 2009 and December 31, 2008 (dollars in millions):
| At December 31, 2009 | |||||||||||
| Residential Mortgage QSPEs | Residential Mortgage Failed Sales | Commercial Mortgage QSPEs | |||||||||
Assets serviced (unpaid principal balance) | $ | 18,902 | $ | 1,110 | $ | 10,901 | |||||
Amounts past due 90 days or greater (unpaid principal balance)(1) | $ | 7,297 | $ | 408 | $ | 5 | |||||
Percentage of amounts past due 90 days or greater(1) | 38.6 | % | 36.8 | % | - | ||||||
Credit losses | $ | 2,859 | $ | 74 | $ | 2 | |||||
| (1) | Includes loans that are at least 90 days contractually delinquent, loans for which the borrower has filed for bankruptcy, loans in foreclosure and real estate owned. |
| 157 | |
MORGAN STANLEY
NOTES TO CONSOLIDATED FINANCIAL STATEMENTS-(Continued)
| At December 31, 2008 | ||||||||||||||
| Residential Mortgage QSPEs | Residential Mortgage Failed Sales | Commercial Mortgage QSPEs | Commercial Mortgage Consolidated SPEs | |||||||||||
Assets serviced (unpaid principal balance) | $ | 23,211 | $ | 890 | $ | 8,196 | $ | 2,349 | ||||||
Amounts past due 90 days or greater (unpaid principal balance)(1) | $ | 7,586 | $ | 308 | $ | - | $ | - | ||||||
Percentage of amounts past due 90 days or greater(1) | 32.7 | % | 34.6 | % | - | - | ||||||||
Credit losses | $ | 181 | $ | 11 | $ | - | $ | - | ||||||
| (1) | Includes loans that are at least 90 days contractually delinquent, loans for which the borrower has filed for bankruptcy, loans in foreclosure and real estate owned. |
The Company also serviced residential and commercial mortgage loans for SPEs sponsored by unrelated parties with unpaid principal balances totaling $20 billion and $25 billion as of December 31, 2009 and December 31, 2008, respectively.
Variable Interest Entities. Accounting guidance for consolidation of VIEs applied to certain entities in which equity investors do not have the characteristics of a controlling financial interest or do not have sufficient equity at risk for the entity to finance its activities without additional subordinated financial support from other parties. QSPEs were not subject to consolidation prior to January 1, 2010, but are subject to consolidation requirements for VIEs beginning on that date. Under the guidance effective prior to January 1, 2010, the primary beneficiary of a VIE was the party that absorbed a majority of the entity's expected losses, received a majority of its expected residual returns or both, as a result of holding variable interests. The Company consolidated entities of which it was the primary beneficiary. Under the guidance adopted on January 1, 2010, the primary beneficiary of a VIE is the party that both has the power to make decisions that most significantly affect the economic performance of the VIE and has the right to receive benefits or obligation to absorb losses that in either case could potentially be significant to the VIE.
The Company is involved with various entities in the normal course of business that may be deemed to be VIEs. The Company's variable interests in VIEs include debt and equity interests, commitments, guarantees and derivative instruments. The Company's involvement with VIEs arises primarily from:
| • | Interests purchased in connection with market making and retained interests held as a result of securitization activities. |
| • | Guarantees issued and residual interests retained in connection with municipal bond securitizations. |
| • | Loans and investments made to VIEs that hold debt, equity, real estate or other assets. |
| • | Derivatives entered into with VIEs. |
| • | Structuring of credit-linked notes ("CLNs") or other asset-repackaged notes designed to meet the investment objectives of clients. |
| • | Other structured transactions designed to provide tax-efficient yields to the Company or its clients. |
The Company determined whether it was the primary beneficiary of a VIE upon its initial involvement with the VIE. This determination was based upon an analysis of the design of the VIE, including the VIE's structure and activities and the variable interests owned by the Company.
| | 158 |
MORGAN STANLEY
NOTES TO CONSOLIDATED FINANCIAL STATEMENTS-(Continued)
Under the accounting guidance effective prior to January 1, 2010, the Company was required to reassess whether it was the primary beneficiary of a VIE only upon the occurrence of certain reconsideration events. Under the guidance adopted on January 1, 2010, the Company is required to reassess whether it is the primary beneficiary on an ongoing basis and not just upon the occurrence of certain events.
If the Company's initial assessment resulted in a determination that it was not the primary beneficiary of a VIE, then under the guidance effective prior to January 1, 2010, the Company reassessed this determination upon the occurrence of:
| • | Changes to the VIE's governing documents or contractual arrangements in a manner that reallocated the obligation to absorb the expected losses or the right to receive the expected residual returns of the VIE between the primary beneficiary at that time and the other variable interest holders, including the Company. |
| • | Acquisition by the Company of additional variable interests in the VIE. |
If the Company's initial assessment resulted in a determination that it was the primary beneficiary, then under the guidance effective prior to January 1, 2010, the Company reassessed this determination upon the occurrence of:
| • | Changes to the VIE's governing documents or contractual arrangements in a manner that reallocated the obligation to absorb the expected losses or the right to receive the expected residual returns of the VIE between the primary beneficiary at that time and the other variable interest holders. |
| • | A sale or disposition by the Company of all or part of its variable interests in the VIE to parties unrelated to the Company. |
| • | The issuance of new variable interests by the VIE to parties unrelated to the Company. |
Except for consolidated VIEs included in other structured financings in the tables below, the Company accounts for the assets held by the entities primarily in Financial instruments owned and the liabilities of the entities as Other secured financings in the consolidated statements of financial condition. The Company includes assets held by consolidated VIEs included in other structured financings in the tables below primarily in Receivables, Premises, equipment and software costs and Other assets and the liabilities primarily as Other liabilities and accrued expenses and Payables in the consolidated statements of financial condition. Except for consolidated VIEs included in other structured financings, the assets and liabilities are measured at fair value, with changes in fair value reflected in earnings.
The assets owned by many consolidated VIEs cannot be removed unilaterally by the Company and are not generally available to the Company. The related liabilities issued by many consolidated VIEs are non-recourse to the Company. In certain other consolidated VIEs, the Company has the unilateral right to remove assets or provides additional recourse through derivatives such as total return swaps, guarantees or other forms of involvement.
| 159 | |
MORGAN STANLEY
NOTES TO CONSOLIDATED FINANCIAL STATEMENTS-(Continued)
The following tables present information as of December 31, 2009 and December 31, 2008 about VIEs which the Company consolidates (dollars in millions):
| At December 31, 2009 | |||||||||||||||
| Mortgage and Asset-backed Securitizations | Credit and Real Estate | Commodities Financing | Other Structured Financings | Total | |||||||||||
VIE assets that the Company consolidates | $ | 2,715 | $ | 2,629 | $ | 1,509 | $ | 762 | $ | 7,615 | |||||
VIE liabilities | 992 | 687 | 1,370 | 73 | 3,122 | ||||||||||
Maximum exposure to loss: | |||||||||||||||
Debt and equity interests | $ | 1,719 | $ | 1,221 | $ | - | $ | 697 | $ | 3,637 | |||||
Derivatives and other contracts | 501 | 714 | 2,195 | - | 3,410 | ||||||||||
Commitments and guarantees | - | - | - | 164 | 164 | ||||||||||
Total maximum exposure to loss | $ | 2,220 | $ | 1,935 | $ | 2,195 | $ | 861 | $ | 7,211 | |||||
| At December 31, 2008 | |||||||||||||||
| Mortgage and Asset-backed Securitizations | Credit and Real Estate | Commodities Financing | Other Structured Financings | Total | |||||||||||
VIE assets that the Company consolidates | $ | 4,307 | $ | 4,121 | $ | 809 | $ | 1,664 | $ | 10,901 | |||||
VIE liabilities | 2,473 | 1,505 | 766 | 801 | 5,545 | ||||||||||
Maximum exposure to loss: | |||||||||||||||
Debt and equity interests | $ | 1,834 | $ | 2,605 | $ | - | $ | 882 | $ | 5,321 | |||||
Derivatives and other contracts | 517 | 2,348 | 1,307 | - | 4,172 | ||||||||||
Commitments and guarantees | - | - | - | 330 | 330 | ||||||||||
Total maximum exposure to loss | $ | 2,351 | $ | 4,953 | $ | 1,307 | $ | 1,212 | $ | 9,823 | |||||
| | 160 |
MORGAN STANLEY
NOTES TO CONSOLIDATED FINANCIAL STATEMENTS-(Continued)
The following tables present information about non-consolidated VIEs in which the Company had significant variable interests or served as the sponsor and had any variable interest as of December 31, 2009 and December 31, 2008 (dollars in millions):
| At December 31, 2009 | |||||||||||||||
| Mortgage and Asset-backed Securitizations | Credit and Real Estate | Municipal Tender Option Bond Trusts | Other Structured Financings | Total | |||||||||||
VIE assets that the Company does not consolidate | $ | 720 | $ | 11,848 | $ | 339 | $ | 5,775 | $ | 18,682 | |||||
Maximum exposure to loss: | |||||||||||||||
Debt and equity interests | $ | 16 | $ | 2,330 | $ | 40 | $ | 861 | $ | 3,247 | |||||
Derivatives and other contracts | 1 | 4,949 | - | - | 4,950 | ||||||||||
Commitments and guarantees | - | 200 | 31 | 623 | 854 | ||||||||||
Total maximum exposure to loss | $ | 17 | $ | 7,479 | $ | 71 | $ | 1,484 | $ | 9,051 | |||||
Carrying value of exposure to loss-Assets: | |||||||||||||||
Debt and equity interests | $ | 16 | $ | 2,330 | $ | 40 | $ | 682 | $ | 3,068 | |||||
Derivatives and other contracts | 1 | 2,382 | - | - | 2,383 | ||||||||||
Total carrying value of exposure to loss-Assets | $ | 17 | $ | 4,712 | $ | 40 | $ | 682 | $ | 5,451 | |||||
Carrying value of exposure to loss-Liabilities: | |||||||||||||||
Derivatives and other contracts | $ | - | $ | 484 | $ | - | $ | - | $ | 484 | |||||
Commitments and guarantees | - | - | - | 45 | 45 | ||||||||||
Total carrying value of exposure to loss-Liabilities | $ | - | $ | 484 | $ | - | $ | 45 | $ | 529 | |||||
| At December 31, 2008 | |||||||||||||||
| Mortgage and Asset-backed Securitizations | Credit and Real Estate | Municipal Tender Option Bond Trusts | Other Structured Financings | Total | |||||||||||
VIE assets that the Company does not consolidate | $ | 1,629 | $ | 18,456 | $ | 2,173 | $ | 8,068 | $ | 30,326 | |||||
Maximum exposure to loss: | |||||||||||||||
Debt and equity interests | $ | 38 | $ | 4,420 | $ | 1,145 | $ | 880 | $ | 6,483 | |||||
Derivatives and other contracts | - | 5,156 | - | - | 5,156 | ||||||||||
Commitments and guarantees | - | - | 320 | 564 | 884 | ||||||||||
Total maximum exposure to loss | $ | 38 | $ | 9,576 | $ | 1,465 | $ | 1,444 | $ | 12,523 | |||||
Carrying value of exposure to loss-Assets: | |||||||||||||||
Debt and equity interests | $ | 38 | $ | 4,420 | $ | 1,145 | $ | 703 | $ | 6,306 | |||||
Derivatives and other contracts | - | 2,044 | - | - | 2,044 | ||||||||||
Total carrying value of exposure to loss-Assets | $ | 38 | $ | 6,464 | $ | 1,145 | $ | 703 | $ | 8,350 | |||||
Carrying value of exposure to loss-Liabilities: | |||||||||||||||
Derivatives and other contracts | $ | - | $ | 590 | $ | - | $ | - | $ | 590 | |||||
Commitments and guarantees | - | - | - | 36 | 36 | ||||||||||
Total carrying value of exposure to loss-Liabilities | $ | - | $ | 590 | $ | - | $ | 36 | $ | 626 | |||||
| 161 | |
MORGAN STANLEY
NOTES TO CONSOLIDATED FINANCIAL STATEMENTS-(Continued)
The Company's maximum exposure to loss often differs from the carrying value of the VIE's assets. The maximum exposure to loss is dependent on the nature of the Company's variable interest in the VIEs and is limited to the notional amounts of certain liquidity facilities, other credit support, total return swaps, written put options, and the fair value of certain other derivatives and investments the Company has made in the VIEs. Liabilities issued by VIEs generally are non-recourse to the Company. Where notional amounts are utilized in quantifying maximum exposure related to derivatives, such amounts do not reflect fair value writedowns already recorded by the Company.
The Company's maximum exposure to loss does not include the offsetting benefit of any financial instruments that the Company may utilize to hedge these risks associated with the Company's variable interests.
Municipal Tender Option Bond Trusts. In a municipal tender option bond transaction, the Company, on behalf of a client, transfers a municipal bond to a trust. The trust issues short-term securities which the Company as the remarketing agent sells to investors. The client retains a residual interest. The short-term securities are supported by a liquidity facility pursuant to which the investors may put their short-term interests. In some programs, the Company provides this liquidity facility; in most programs, a third-party provider will provide such liquidity facility. The Company may purchase short-term securities in its role either as remarketing agent or liquidity provider. The client can generally terminate the transaction at any time. The liquidity provider can generally terminate the transaction upon the occurrence of certain events. When the transaction is terminated, the municipal bond is generally sold or returned to the client. Any losses suffered by the liquidity provider upon the sale of the bond are the responsibility of the client. This obligation generally is collateralized. In prior periods, the Company established trusts in connection with its proprietary trading activities and consolidated those trusts. As of December 31, 2009 and December 31, 2008, no proprietary trusts were outstanding.
Credit Protection Purchased Through CLNs. In a CLN transaction, the Company transfers assets (generally high quality securities or money market investments) to an SPE, enters into a derivative transaction in which the SPE writes protection on an unrelated reference asset or group of assets through a credit default swap, a total return swap or similar instrument, and sells to investors the securities issued by the SPE. In some transactions, the Company may also enter into interest rate or currency swaps with the SPE. Upon the occurrence of a credit event related to the reference asset, the SPE will sell the collateral securities in order to make the payment to the Company. The Company is generally exposed to price changes on the collateral securities in the event of a credit event and subsequent sale. These transactions are designed to transfer the credit risk on the reference asset to investors. In some transactions, the assets and liabilities of the SPE are recognized in the Company's consolidated financial statements. In other transactions, the transfer of the collateral securities is accounted for as a sale of assets and the SPE is not consolidated. The structure of the transaction determines the accounting treatment.
The derivatives in CLN transactions consist of total return swaps, credit default swaps or similar contracts in which the Company has purchased protection on a reference asset or group of assets. Payments by the SPE are collateralized. The risks associated with these and similar derivatives with SPEs are essentially the same as similar derivatives with non-SPE counterparties and are managed as part of the Company's overall exposure.
Other Structured Financings . The Company primarily invests in equity interests issued by entities that develop and own low income communities (including low income housing projects) and entities that construct and own facilities that will generate energy from renewable resources. The equity interests entitle the Company to its share of tax credits and tax losses generated by these projects. In addition, the Company has issued guarantees to investors in certain low-income housing funds. The guarantees are designed to return an investor's contribution to a fund and the investor's share of tax losses and tax credits expected to be generated by the fund. The Company is also involved with entities designed to provide tax-efficient yields to the Company or its clients.
| | 162 |
MORGAN STANLEY
NOTES TO CONSOLIDATED FINANCIAL STATEMENTS-(Continued)
Collateralized Loan and Debt Obligations. A collateralized loan obligation ("CLO") or a CDO is an SPE that purchases a pool of assets, consisting of corporate loans, corporate bonds, asset-backed securities or synthetic exposures on similar assets through derivatives and issues multiple tranches of debt and equity securities to investors. In the Asset Management business segment, the Company manages CLOs with assets of $2.2 billion and $2.1 billion as of December 31, 2009 and December 31, 2008, respectively, and receives a management fee for these services. The Company's maximum exposure to loss on these managed CLOs was immaterial as of December 31, 2009 and 2008. The Company's maximum exposure to loss on other CLOs and CDOs is $1.5 billion and $3.0 billion as of December 31, 2009 and December 31, 2008, respectively.
Equity-Linked Notes. In an equity-linked note transaction included in the tables above, the Company typically transfers to an SPE either (1) a note issued by the Company, the payments on which are linked to the performance of a specific equity security, equity index or other index or (2) debt securities issued by other companies and a derivative contract, the terms of which will relate to the performance of a specific equity security, equity index or other index. These transactions are designed to transfer to investors the risks related to the specific equity security, equity index or other index.
Asset Management Investment Funds. The tables above do not include certain investments made by the Company held by entities qualifying for accounting purposes as investment companies.
See Note 11 for information on a lending facility provided to a real estate fund sponsored by the Company. The Company provided this facility in response to the fund's increased liquidity needs resulting from the downturn in the global real estate markets.
Failed Sales.
In order to be treated as a sale of assets for accounting purposes, a transaction must meet all of the criteria stipulated in the accounting guidance for the transfer of financial assets. If the transfer fails to meet these criteria, that transfer is treated as a failed sale. In such case, the Company continues to recognize the assets in Financial instruments owned and the Company recognizes the associated liabilities in Other secured financings in the consolidated statements of financial condition.
The assets transferred to many unconsolidated VIEs in transactions accounted for as failed sales cannot be removed unilaterally by the Company and are not generally available to the Company. The related liabilities issued by many unconsolidated VIEs are non-recourse to the Company. In certain other failed sale transactions, the Company has the unilateral right to remove assets or provides additional recourse through derivatives such as total return swaps, guarantees or other forms of involvement.
The following tables present information about transfers of assets treated by the Company as secured financings as of December 31, 2009 and December 31, 2008:
| At December 31, 2009 | ||||||||||||
| Residential Mortgage Loans | Commercial Mortgage Loans | Credit- Linked Notes | Other | |||||||||
| (dollars in millions) | ||||||||||||
Assets | ||||||||||||
Unpaid principal amount | $ | 376 | $ | 324 | $ | 1,059 | $ | 1,332 | ||||
Fair value | 151 | 291 | 1,012 | 1,294 | ||||||||
Other secured financings | ||||||||||||
Unpaid principal amount | 267 | 271 | 1,025 | 1,332 | ||||||||
Fair value | 138 | 269 | 978 | 1,294 | ||||||||
| 163 | |
MORGAN STANLEY
NOTES TO CONSOLIDATED FINANCIAL STATEMENTS-(Continued)
| At December 31, 2008 | ||||||||||||
| Residential Mortgage Loans | Commercial Mortgage Loans | Credit- Linked Notes | Other | |||||||||
| (dollars in millions) | ||||||||||||
Assets | ||||||||||||
Unpaid principal amount | $ | 439 | $ | 2,573 | $ | 1,333 | $ | 2,028 | ||||
Fair value | 227 | 2,245 | 1,144 | 1,814 | ||||||||
Other secured financings | ||||||||||||
Unpaid principal amount | 258 | 2,512 | 1,293 | 2,008 | ||||||||
Fair value | 175 | 2,208 | 1,134 | 1,810 | ||||||||
7. Goodwill and Net Intangible Assets.
Goodwill and net intangible assets increased during 2009 primarily due to the acquisition of Smith Barney and Citi Managed Futures (see Note 3).
The Company tests goodwill for impairment on an annual basis and on an interim basis when certain events or circumstances exist. The Company tests for impairment at the reporting unit level, which is generally one level below its business segments. Goodwill impairment is determined by comparing the estimated fair value of a reporting unit with its respective book value. If the estimated fair value exceeds the book value, goodwill at the reporting unit level is not deemed to be impaired. If the estimated fair value is below book value, however, further analysis is required to determine the amount of the impairment.
The estimated fair values of the reporting units are generally determined utilizing methodologies that incorporate price-to-book, price-to-earnings and assets under management multiples of certain comparable companies.
The Company completed its annual goodwill impairment testing as of June 1, 2009 and June 1, 2008, which did not result in any goodwill impairment. During the quarter ended September 30, 2009, the Company changed the date of its annual goodwill impairment testing to July 1 as a result of the Company's change in its fiscal year-end from November 30 to December 31 of each year. The change to the annual goodwill impairment testing date was to move the impairment testing outside of the Company's normal second quarter-end reporting process to a date in the third quarter, consistent with the testing date prior to the change in the fiscal year-end. The Company believes that the resulting change in accounting principle related to the annual testing date will not delay, accelerate, or avoid an impairment charge. Goodwill impairment tests performed as of July 1, 2009 concluded that no impairment charges were required as of that date. The Company determined that the change in accounting principle related to the annual testing date is preferable under the circumstances and did not result in adjustments to the Company's consolidated financial statements when applied retrospectively.
Due to the financial market and economic events that occurred in the fourth quarter of fiscal 2008, the Company performed an interim impairment test for goodwill subsequent to its annual testing date of June 1, 2008. The interim impairment test resulted in a noncash goodwill impairment charge of approximately $673 million. The charge related to the fixed income business, which is a reporting unit within the Institutional Securities business segment. The fair value of the fixed income business was calculated by comparison with similar companies using their publicly traded price-to-book multiples as the basis for valuation. The impairment charge resulted from declines in the credit and mortgage markets in general, which caused significant declines in the stock market capitalization in the fourth quarter of fiscal 2008 and, hence, a decline in the fair value of the fixed income business.
| | 164 |
MORGAN STANLEY
NOTES TO CONSOLIDATED FINANCIAL STATEMENTS-(Continued)
Due to the continued deterioration in the financial markets, the Company performed an interim impairment test of goodwill in the one month ended December 31, 2008, which did not result in impairment.
Goodwill.
Changes in the carrying amount of the Company's goodwill, net of accumulated impairment losses for 2009, fiscal 2008 and the one month ended December 31, 2008 were as follows:
| Institutional Securities(1) | Global Wealth Management Group | Asset Management | Total | |||||||||||||
| (dollars in millions) | ||||||||||||||||
Goodwill at November 30, 2007 | $ | 1,555 | $ | 297 | $ | 1,172 | $ | 3,024 | ||||||||
Foreign currency translation adjustments and other | (108 | ) | 14 | (3 | ) | (97 | ) | |||||||||
Goodwill acquired during the year | 31 | - | 2 | 33 | ||||||||||||
Goodwill disposed of during the year(2) | (5 | ) | (39 | ) | - | (44 | ) | |||||||||
Impairment losses(3) | (673 | ) | - | - | (673 | ) | ||||||||||
Goodwill at November 30, 2008 | 800 | 272 | 1,171 | 2,243 | ||||||||||||
Foreign currency translation adjustments and other | 13 | - | - | 13 | ||||||||||||
Goodwill at December 31, 2008 | 813 | 272 | 1,171 | 2,256 | ||||||||||||
Foreign currency translation adjustments and other | 13 | - | - | 13 | ||||||||||||
Goodwill acquired during the year(4) | - | 5,346 | - | 5,346 | ||||||||||||
Goodwill disposed of during the year(5) | (453 | ) | - | - | (453 | ) | ||||||||||
Goodwill at December 31, 2009 (6)(7) | $ | 373 | $ | 5,618 | $ | 1,171 | $ | 7,162 | ||||||||
| (1) | The amount of goodwill related to MSCI was $437 million as of December 31, 2008 and November 30, 2008 and November 30, 2007. |
| (2) | Global Wealth Management Group activity primarily represents goodwill disposed of in connection with the Company's sale of Morgan Stanley Wealth Management S.V., S.A.U. (see Note 17). |
| (3) | Impairment losses are recorded within Other expenses in the consolidated statements of income. |
| (4) | Global Wealth Management Group business segment activity primarily represents goodwill acquired in connection with Smith Barney and Citi Managed Futures (see Note 3). |
| (5) | Institutional Securities business segment activity primarily represents goodwill disposed of in connection with MSCI (see Note 23). |
| (6) | The Asset Management business segment amount at December 31, 2009 included approximately $404 million related to Retail Asset Management. |
| (7) | The amount of the Company's goodwill before accumulated impairments of $673 million at December 31, 2009 was $7,835 million. |
| 165 | |
MORGAN STANLEY
NOTES TO CONSOLIDATED FINANCIAL STATEMENTS-(Continued)
Net Intangible Assets.
Changes in the carrying amount of the Company's intangible assets for 2009, fiscal 2008 and the one month ended December 31, 2008 were as follows:
| Institutional Securities(1) | Global Wealth Management Group | Asset Management(2) | Total | |||||||||||||
| (dollars in millions) | ||||||||||||||||
Amortizable net intangible assets at November 30, 2007 | $ | 386 | $ | - | $ | 233 | $ | 619 | ||||||||
Foreign currency translation adjustments and other | (21 | ) | - | - | (21 | ) | ||||||||||
Intangible assets acquired during the year(3) | 88 | - | 239 | 327 | ||||||||||||
Net intangible assets disposed of during the year(4) | (54 | ) | - | (11 | ) | (65 | ) | |||||||||
Amortization expense(5) | (44 | ) | - | (37 | ) | (81 | ) | |||||||||
Impairment losses(6)(7) | (21 | ) | - | (31 | ) | (52 | ) | |||||||||
Amortizable net intangible assets at November 30, 2008 | 334 | - | 393 | 727 | ||||||||||||
Mortgage servicing rights (see Note 6) | 220 | - | - | 220 | ||||||||||||
Net intangible assets at November 30, 2008 | $ | 554 | $ | - | $ | 393 | $ | 947 | ||||||||
Amortizable net intangible assets at November 30, 2008 | $ | 334 | $ | - | $ | 393 | $ | 727 | ||||||||
Foreign currency translation adjustments and other | 3 | - | - | 3 | ||||||||||||
Amortization expense(5) | (4 | ) | - | (4 | ) | (8 | ) | |||||||||
Amortizable net intangible assets at December 31, 2008 | $ | 333 | $ | - | $ | 389 | $ | 722 | ||||||||
Mortgage servicing rights (see Note 6) | 184 | - | - | 184 | ||||||||||||
Net intangible assets at December 31, 2008 | $ | 517 | $ | - | $ | 389 | $ | 906 | ||||||||
Amortizable net intangible assets at December 31, 2008 | $ | 333 | $ | - | $ | 389 | $ | 722 | ||||||||
Foreign currency translation adjustments and other | - | - | (4 | ) | (4 | ) | ||||||||||
Intangible assets acquired during the year(8) | 2 | 4,475 | 1 | 4,478 | ||||||||||||
Net intangible assets disposed of during the year(9) | (153 | ) | - | (145 | ) | (298 | ) | |||||||||
Amortization expense(5) | (17 | ) | (183 | ) | (45 | ) | (245 | ) | ||||||||
Impairment losses(10) | (4 | ) | - | (12 | ) | (16 | ) | |||||||||
Amortizable net intangible assets at December 31, 2009 | 161 | 4,292 | 184 | 4,637 | ||||||||||||
Mortgage servicing rights (see Note 6) | 135 | 2 | - | 137 | ||||||||||||
Indefinite-lived intangible asset(8) | - | 280 | - | 280 | ||||||||||||
Net intangible assets at December 31, 2009 | $ | 296 | $ | 4,574 | $ | 184 | $ | 5,054 | ||||||||
| (1) | The amount of net intangible assets related to MSCI was $144 million, $146 million and $174 million at December 31, 2008, November 30, 2008 and November 30, 2007, respectively. |
| (2) | The amount of intangible assets related to Crescent was $194 million and $197 million at December 31, 2008 and November 30, 2008, respectively. |
| (3) | Asset Management business segment activity primarily represents intangible assets related to the Company's consolidation of Crescent. |
| (4) | Institutional Securities business segment activity primarily represents intangible assets disposed of in connection with the Company's sale of a controlling interest in a previously consolidated commodities subsidiary. |
| (5) | Amortization expense for MSCI in 2009, fiscal 2008 and the one month ended December 31, 2008 is included in discontinued operations. Amortization expense for Retail Asset Management in 2009 and fiscal 2008 is included in discontinued operations. The amortization expense for Crescent in 2009 and fiscal 2008 is included in discontinued operations. |
| (6) | Impairment losses recorded within the Institutional Securities business segment primarily related to intellectual property rights. Impairment losses recorded within the Asset Management business segment primarily related to management contract intangibles. |
| (7) | Impairment losses are recorded within Other expenses in the consolidated statements of income. |
| | 166 |
MORGAN STANLEY
NOTES TO CONSOLIDATED FINANCIAL STATEMENTS-(Continued)
| (8) | Global Wealth Management Group business segment activity primarily represents intangible assets acquired in connection with Smith Barney and Citi Managed Futures (see Note 3). |
| (9) | Institutional Securities business segment activity primarily represents intangible assets disposed of in connection with MSCI, and Asset Management business segment activity represents intangible assets disposed of in connection with Crescent (see Note 23). |
| (10) | Impairment losses recorded within the Asset Management business segment related to the disposition of Crescent and are included in discontinued operations. |
Amortizable intangible assets were as follows:
| At December 31, 2009 | At December 31, 2008 | |||||||||||
| Gross Carrying Amount(1) | Accumulated Amortization(1) | Gross Carrying Amount | Accumulated Amortization | |||||||||
| (dollars in millions) | ||||||||||||
Amortizable intangible assets: | ||||||||||||
Trademarks | $ | 75 | $ | 10 | $ | 126 | $ | 28 | ||||
Technology related | 10 | 3 | 144 | 94 | ||||||||
Customer relationships | 4,061 | 159 | 276 | 40 | ||||||||
Management contracts | 463 | 38 | 206 | 19 | ||||||||
Research | 176 | 21 | - | - | ||||||||
Intangible lease asset | 24 | 4 | - | - | ||||||||
Other | 103 | 40 | 178 | 27 | ||||||||
Total amortizable intangible assets | $ | 4,912 | $ | 275 | $ | 930 | $ | 208 | ||||
| (1) | The balances for 2009 include the Company's share of MSSB's amortizable intangible assets. |
Amortization expense associated with intangible assets is estimated to be approximately $343 million per year over the next five years.
8. Deposits.
Deposits were as follows:
| At December 31, 2009(1) | At December 31, 2008(1) | |||||
| (dollars in millions) | ||||||
Savings and demand deposits | $ | 57,114 | $ | 41,226 | ||
Time deposits(2) | 5,101 | 10,129 | ||||
Total | $ | 62,215 | $ | 51,355 | ||
| (1) | Total deposits insured by the FDIC at December 31, 2009 and December 31, 2008 were $46 billion and $47 billion, respectively. |
| (2) | Certain time deposit accounts are carried at fair value under the fair value option (see Note 4). |
The weighted average interest rates of interest bearing deposits outstanding during 2009, fiscal 2008, fiscal 2007 and the one month ended December 31, 2008 were 1.3%, 2.1%, 4.0% and 1.3%, respectively.
| 167 | |
MORGAN STANLEY
NOTES TO CONSOLIDATED FINANCIAL STATEMENTS-(Continued)
As of December 31, 2009, interest bearing deposits maturing over the next five years were as follows (dollars in millions):
Year | |||
2010(1) | $ | 59,097 | |
2011 | 898 | ||
2012 | 586 | ||
2013 | 1,331 | ||
2014 | 192 | ||
| (1) | Amount includes approximately $57 billion of savings deposits, which have no stated maturity and approximately $2 billion of time deposits. |
As of December 31, 2009 and December 31, 2008, the Company had $110 million and $64 million, respectively, of time deposits in denominations of $100,000 or more.
9. Borrowings.
Commercial Paper and Other Short-Term Borrowings.
The table below summarizes certain information regarding commercial paper and other short-term borrowings:
| December 31, 2009(1) | December 31, 2008(2) | |||||||
| (dollars in millions) | ||||||||
Commercial Paper(3): | ||||||||
Balance at period-end | $ | 783 | $ | 7,388 | ||||
Average balance | $ | 924 | $ | 7,066 | ||||
Weighted average interest rate on period-end balance | 0.8 | % | 2.3 | % | ||||
Other Short-Term Borrowings(4)(5): | ||||||||
Balance at period-end | $ | 1,595 | $ | 2,714 | ||||
Average balance | $ | 2,453 | $ | 3,529 | ||||
| (1) | Average balances are calculated based upon weekly balances for 2009. |
| (2) | Average balances are calculated based upon month-end balances for the one month ended December 31, 2008. |
| (3) | Amounts at December 31, 2008 include commercial paper issued under the Temporary Liquidity Guarantee Program ("TLGP"). |
| (4) | These borrowings included bank loans, bank notes and structured notes with maturities of 12 months or less. |
| (5) | Certain structured short-term borrowings are carried at fair value under the fair value option. See Note 4 for additional information. |
Long-Term Borrowings.
Maturities and Terms. Long-term borrowings consisted of the following (dollars in millions):
| U.S. Dollar | Non-U.S. Dollar(1) | |||||||||||||||||||||||||||||
| Fixed Rate | Floating Rate(2) | Index Linked(3) | Fixed Rate | Floating Rate(2) | Index Linked(3) | At December 31, 2009(4)(5)(6) | At December 31, 2008(4) | |||||||||||||||||||||||
Due in 2009 | $ | - | $ | - | $ | - | $ | - | $ | - | $ | - | $ | - | $ | 20,580 | ||||||||||||||
Due in 2010 | 11,484 | 6,932 | 1,557 | 2,452 | 1,481 | 2,182 | 26,088 | 25,129 | ||||||||||||||||||||||
Due in 2011 | 11,054 | 4,422 | 1,910 | 4,928 | 788 | 3,708 | 26,810 | 24,915 | ||||||||||||||||||||||
Due in 2012 | 10,891 | 10,201 | 723 | 5,214 | 7,196 | 3,814 | 38,039 | 24,199 | ||||||||||||||||||||||
Due in 2013 | 2,820 | 19 | 539 | 3,837 | 7,684 | 10,121 | 25,020 | 21,665 | ||||||||||||||||||||||
Due in 2014 | 8,295 | 1,617 | 745 | 2,656 | 2,414 | 1,139 | 16,866 | 9,753 | ||||||||||||||||||||||
Thereafter | 29,875 | 6,007 | 3,299 | 11,674 | 6,219 | 3,477 | 60,551 | 53,594 | ||||||||||||||||||||||
Total | $ | 74,419 | $ | 29,198 | $ | 8,773 | $ | 30,761 | $ | 25,782 | $ | 24,441 | $ | 193,374 | $ | 179,835 | ||||||||||||||
Weighted average coupon at period-end | 5.2 | % | 1.2 | % | n/a | 4.6 | % | 1.1 | % | n/a | 3.7 | % | 4.8 | % | ||||||||||||||||
| | 168 |
MORGAN STANLEY
NOTES TO CONSOLIDATED FINANCIAL STATEMENTS-(Continued)
| (1) | Weighted average coupon was calculated utilizing non-U.S. dollar interest rates. |
| (2) | U.S. dollar contractual floating rate borrowings bear interest based on a variety of money market indices, including London Interbank Offered Rates ("LIBOR") and Federal Funds rates. Non-U.S. dollar contractual floating rate borrowings bear interest based primarily on Euribor floating rates. |
| (3) | Amounts include borrowings that are equity linked, credit linked, commodity linked or linked to some other index. |
| (4) | Amounts include long-term borrowings issued under the TLGP. |
| (5) | Amounts include an increase of approximately $2.0 billion as of December 31, 2009 to the carrying amount of certain of the Company's long-term borrowings associated with fair value hedges. The increase to the carrying value associated with fair value hedges by year due was approximately less than $0.1 billion due in 2010, $0.3 billion due in 2011, $0.3 billion due in 2012, $0.4 billion due in 2013, $0.1 billion due in 2014 and $0.9 billion due thereafter. |
| (6) | Amounts include a decrease of approximately $1.9 billion as of December 31, 2009 to the carrying amounts of certain of the Company's long-term borrowings for which the fair value option was elected (see Note 4). |
The Company's long-term borrowings included the following components:
| At December 31, | ||||||
| 2009 | 2008 | |||||
| (dollars in millions) | ||||||
Senior debt | $ | 178,797 | $ | 165,181 | ||
Subordinated debt | 3,983 | 4,342 | ||||
Junior subordinated debentures | 10,594 | 10,312 | ||||
Total | $ | 193,374 | $ | 179,835 | ||
During 2009, the Company issued notes with a principal amount of approximately $44 billion. The amount included non-U.S. dollar currency notes aggregating approximately $8 billion. These notes include the public issuance of approximately $30 billion of senior unsecured notes that were not guaranteed by the Federal Deposit Insurance Corporation ("FDIC"). During 2009, approximately $33 billion of notes were repaid.
During fiscal 2008, $56.1 billion of notes were repaid. Included in these repayments were approximately $12.1 billion of fixed rate and floating-rate long-term debt repurchases by the Company in the fourth quarter of fiscal 2008 resulting in a gain of approximately $2.3 billion. In connection with these repurchases, the Company de-designated certain swaps used to hedge the debt. These swaps were no longer considered hedges once the related debt was repurchased by the Company ( i.e ., the swaps were "de-designated" as hedges).
During the one month ended December 31, 2008, the Company issued notes with a principal amount of approximately $13 billion. The amount included non-U.S. dollar currency notes aggregating approximately $17 million. During the one month ended December 31, 2008, approximately $5.7 billion of notes were repaid.
Senior debt securities often are denominated in various non-U.S. dollar currencies and may be structured to provide a return that is equity-linked, credit-linked, commodity-linked or linked to some other index ( e.g., the consumer price index). Senior debt also may be structured to be callable by the Company or extendible at the option of holders of the senior debt securities. Debt containing provisions that effectively allow the holders to put or extend the notes aggregated $63 million as of December 31, 2009 and $160 million as of December 31, 2008. Subordinated debt and junior subordinated debentures generally are issued to meet the capital requirements of the Company or its regulated subsidiaries and primarily are U.S. dollar denominated.
Senior Debt-Structured Borrowings. The Company's index-linked, equity-linked or credit-linked borrowings include various structured instruments whose payments and redemption values are linked to the performance of a specific index ( e.g., Standard & Poor's 500), a basket of stocks, a specific equity security, a credit exposure or basket of credit exposures. To minimize the exposure resulting from movements in the underlying index, equity, credit or other position, the Company has entered into various swap contracts and purchased options that
| 169 | |
MORGAN STANLEY
NOTES TO CONSOLIDATED FINANCIAL STATEMENTS-(Continued)
effectively convert the borrowing costs into floating rates based upon LIBOR. These instruments are included in the preceding table at their redemption values based on the performance of the underlying indices, baskets of stocks, or specific equity securities, credit or other position or index. The Company carries either the entire structured borrowing at fair value or bifurcates the embedded derivative and carries it at fair value. The swaps and purchased options used to economically hedge the embedded features are derivatives and also are carried at fair value. Changes in fair value related to the notes and economic hedges are reported in Principal transactions-trading revenues.
Subordinated Debt and Junior Subordinated Debentures . Included in the Company's long-term borrowings are subordinated notes (including the Series F notes issued by MS&Co. discussed below) of $3,983 million having a contractual weighted average coupon of 4.78% at December 31, 2009 and $4,342 million having a weighted average coupon of 4.78% at December 31, 2008. Junior subordinated debentures outstanding by the Company were $10,594 million at December 31, 2009 and $10,312 million at December 31, 2008 having a contractual weighted average coupon of 6.17% at December 31, 2009 and 6.17% at December 31, 2008. Maturities of the subordinated and junior subordinated notes range from fiscal 2011 to fiscal 2046. Maturities of certain junior subordinated debentures can be extended to 2067 at the Company's option.
At December 31, 2009, MS&Co. had a $25 million 7.82% fixed rate subordinated Series F note outstanding. The note matures in fiscal 2016. The terms of the note contain restrictive covenants that require, among other things, MS&Co. to maintain specified levels of Consolidated Tangible Net Worth and Net Capital, each as defined therein.
Asset and Liability Management. In general, securities inventories not financed by secured funding sources and the majority of assets are financed with a combination of short-term funding, floating rate long-term debt or fixed rate long-term debt swapped to a floating rate. Fixed assets are generally financed with fixed rate long-term debt. The Company uses interest rate swaps to more closely match these borrowings to the duration, holding period and interest rate characteristics of the assets being funded and to manage interest rate risk. These swaps effectively convert certain of the Company's fixed rate borrowings into floating rate obligations. In addition, for non-U.S. dollar currency borrowings that are not used to fund assets in the same currency, the Company has entered into currency swaps that effectively convert the borrowings into U.S. dollar obligations. The Company's use of swaps for asset and liability management affected its effective average borrowing rate as follows:
| 2009 | Fiscal 2008 | Fiscal 2007 | One Month Ended December 31, 2008 | |||||||||
Weighted average coupon of long-term borrowings at period-end(1) | 3.7 | % | 4.9 | % | 5.0 | % | 4.8 | % | ||||
Effective average borrowing rate for long-term borrowings after swaps at period-end(1) | 2.3 | % | 4.0 | % | 5.1 | % | 3.8 | % |
| (1) | Included in the weighted average and effective average calculations are non-U.S. dollar interest rates. |
Subsequent to December 31, 2009 and through January 31, 2010, the Company's long-term borrowings (net of repayments) decreased by approximately $0.6 billion.
Other. The Company, through several of its subsidiaries, maintains funded and unfunded committed credit facilities to support various businesses, including the collateralized commercial and residential mortgage whole loan, derivative contracts, warehouse lending, emerging market loan, structured product, corporate loan, investment banking and prime brokerage businesses.
| | 170 |
MORGAN STANLEY
NOTES TO CONSOLIDATED FINANCIAL STATEMENTS-(Continued)
FDIC's Temporary Liquidity Guarantee Program.
At December 31, 2009, the Company had long-term debt outstanding of $23.8 billion under the TLGP. At December 31, 2008, the Company had commercial paper and long-term debt outstanding of $6.4 billion and $9.8 billion, respectively, under the TLGP. These borrowings are senior unsecured debt obligations of the Company and guaranteed by the FDIC under the TLGP. The FDIC has concluded that the guarantee is backed by the full faith and credit of the U.S. government.
10. Derivative Instruments and Hedging Activities.
The Company trades, makes markets and takes proprietary positions globally in listed futures, OTC swaps, forwards, options and other derivatives referencing, among other things, interest rates, currencies, investment grade and non-investment grade corporate credits, loans, bonds, U.S. and other sovereign securities, emerging market bonds and loans, credit indices, asset-backed security indices, property indices, mortgage-related and other asset-backed securities and real estate loan products. The Company uses these instruments for trading, foreign currency exposure management, and asset and liability management.
The Company manages its trading positions by employing a variety of risk mitigation strategies. These strategies include diversification of risk exposures and hedging. Hedging activities consist of the purchase or sale of positions in related securities and financial instruments, including a variety of derivative products ( e.g. , futures, forwards, swaps and options). The Company manages the market risk associated with its trading activities on a Company-wide basis, on a worldwide trading division level and on an individual product basis.
The Company incurs credit risk as a dealer in OTC derivatives. Credit risk with respect to derivative instruments arises from the failure of a counterparty to perform according to the terms of the contract. The Company's exposure to credit risk at any point in time is represented by the fair value of the derivative contracts reported as assets. The fair value of a derivative represents the amount at which the derivative could be exchanged in an orderly transaction between market participants, and is further described in Notes 2 and 4.
In connection with its derivative activities, the Company generally enters into master netting agreements and collateral arrangements with counterparties. These agreements provide the Company with the ability to offset a counterparty's rights and obligations, request additional collateral when necessary or liquidate the collateral in the event of counterparty default.
| 171 | |
MORGAN STANLEY
NOTES TO CONSOLIDATED FINANCIAL STATEMENTS-(Continued)
The tables below present a summary by counterparty credit rating and remaining contract maturity of the fair value of OTC derivatives in a gain position as of December 31, 2009 and December 31, 2008, respectively. Fair value is presented in the final column net of collateral received (principally cash and U.S. government and agency securities):
OTC Derivative Products-Financial Instruments Owned at December 31, 2009(1)
| Years to Maturity | Cross-Maturity and Cash Collateral Netting(3) | Net Exposure Post-Cash Collateral | Net Exposure Post- Collateral | |||||||||||||||||||
Credit Rating(2) | Less than 1 | 1-3 | 3-5 | Over 5 | ||||||||||||||||||
| (dollars in millions) | ||||||||||||||||||||||
AAA | $ | 852 | $ | 2,026 | $ | 3,876 | $ | 9,331 | $ | (6,616 | ) | $ | 9,469 | $ | 9,082 | |||||||
AA | 6,469 | 7,855 | 6,600 | 15,071 | (25,576 | ) | 10,419 | 8,614 | ||||||||||||||
A | 8,018 | 10,712 | 7,990 | 22,739 | (38,971 | ) | 10,488 | 9,252 | ||||||||||||||
BBB | 3,032 | 4,193 | 2,947 | 7,524 | (8,971 | ) | 8,725 | 5,902 | ||||||||||||||
Non-investment grade | 2,773 | 3,331 | 2,113 | 4,431 | (4,534 | ) | 8,114 | 6,525 | ||||||||||||||
Total | $ | 21,144 | $ | 28,117 | $ | 23,526 | $ | 59,096 | $ | (84,668 | ) | $ | 47,215 | $ | 39,375 | |||||||
| (1) | Fair values shown represent the Company's net exposure to counterparties related to the Company's OTC derivative products. The table does not include listed derivatives and the effect of any related hedges utilized by the Company. The table also excludes fair values corresponding to other credit exposures, such as those arising from the Company's lending activities. |
| (2) | Obligor credit ratings are determined by the Credit Risk Management Department using methodologies generally consistent with those employed by external rating agencies. |
| (3) | Amounts represent the netting of receivable balances with payable balances for the same counterparty across maturity categories. Receivable and payable balances with the same counterparty in the same maturity category are netted within such maturity category, where appropriate. Cash collateral received is netted on a counterparty basis, provided legal right of offset exists. |
OTC Derivative Products-Financial Instruments Owned at December 31, 2008(1)
Credit Rating(2) | Years to Maturity | Cross-Maturity and Cash Collateral Netting(3) | Net Exposure Post-Cash Collateral | Net Exposure Post- Collateral | ||||||||||||||||||
| Less than 1 | 1-3 | 3-5 | Over 5 | |||||||||||||||||||
| (dollars in millions) | ||||||||||||||||||||||
AAA | $ | 1,928 | $ | 3,588 | $ | 6,235 | $ | 16,623 | $ | (11,060 | ) | $ | 17,314 | $ | 15,849 | |||||||
AA | 10,447 | 13,133 | 16,589 | 40,423 | (63,498 | ) | 17,094 | 15,018 | ||||||||||||||
A | 7,150 | 7,514 | 7,805 | 21,752 | (31,025 | ) | 13,196 | 12,034 | ||||||||||||||
BBB | 4,666 | 7,414 | 4,980 | 8,614 | (6,571 | ) | 19,103 | 14,101 | ||||||||||||||
Non-investment grade | 8,219 | 8,163 | 5,416 | 7,341 | (12,597 | ) | 16,542 | 12,131 | ||||||||||||||
Total | $ | 32,410 | $ | 39,812 | $ | 41,025 | $ | 94,753 | $ | (124,751 | ) | $ | 83,249 | $ | 69,133 | |||||||
| (1) | Fair values shown represent the Company's net exposure to counterparties related to the Company's OTC derivative products. The table does not include listed derivatives and the effect of any related hedges utilized by the Company. The table also excludes fair values corresponding to other credit exposures, such as those arising from the Company's lending activities. |
| (2) | Obligor credit ratings are determined by the Credit Risk Management Department using methodologies generally consistent with those employed by external rating agencies. |
| (3) | Amounts represent the netting of receivable balances with payable balances for the same counterparty across maturity categories. Receivable and payable balances with the same counterparty in the same maturity category are netted within such maturity category, where appropriate. Cash collateral received is netted on a counterparty basis, provided legal right of offset exists. |
| | 172 |
MORGAN STANLEY
NOTES TO CONSOLIDATED FINANCIAL STATEMENTS-(Continued)
Hedge Accounting.
The Company applies hedge accounting using various derivative financial instruments and non-U.S. dollar-denominated debt used to hedge interest rate and foreign exchange risk arising from assets and liabilities not held at fair value as part of asset and liability management and foreign currency exposure management.
The Company's hedges are designated and qualify for accounting purposes as one of the following types of hedges: hedges of changes in fair value of assets and liabilities due to the risk being hedged (fair value hedges) and hedges of net investments in foreign operations whose functional currency is different from the reporting currency of the parent company (net investment hedges).
For all hedges where hedge accounting is being applied, effectiveness testing and other procedures to ensure the ongoing validity of the hedges are performed at least monthly.
Fair Value Hedges-Interest Rate Risk . The Company's designated fair value hedges consisted primarily of interest rate swaps designated as fair value hedges of changes in the benchmark interest rate of fixed rate senior long-term borrowings. The Company uses regression analysis to perform an ongoing prospective and retrospective assessment of the effectiveness of these hedging relationships ( i.e. , the Company applies the "long-haul" method of hedge accounting). A hedging relationship is deemed effective if the fair values of the hedging instrument (derivative) and the hedged item (debt liability) change inversely within a range of 80% to 125%. The Company considers the impact of valuation adjustments related to the Company's own credit spreads and counterparty credit spreads to determine whether they would cause the hedging relationship to be ineffective.
For qualifying fair value hedges of benchmark interest rates, the changes in the fair value of the derivative and the changes in the fair value of the hedged liability provide offset of one another and, together with any resulting ineffectiveness, are recorded in Interest expense. When a derivative is de-designated as a hedge, any basis adjustment remaining on the hedged liability is amortized to Interest expense over the remaining life of the liability using the effective interest method.
Net Investment Hedges . The Company may utilize forward foreign exchange contracts and non-U.S. dollar-denominated debt to manage the currency exposure relating to its net investments in non-U.S. dollar functional currency operations. No hedge ineffectiveness is recognized in earnings since the notional amounts of the hedging instruments equal the portion of the investments being hedged, and, where forward contracts are used, the currencies being exchanged are the functional currencies of the parent and investee; where debt instruments are used as hedges, they are denominated in the functional currency of the investee. The gain or loss from revaluing hedges of net investments in foreign operations at the spot rate is deferred and reported within Accumulated other comprehensive income (loss) in Equity, net of tax effects. The forward points on the hedging instruments are recorded in Interest and dividend revenues.
| 173 | |
MORGAN STANLEY
NOTES TO CONSOLIDATED FINANCIAL STATEMENTS-(Continued)
The following tables summarize the fair value of derivative instruments designated as accounting hedges and the fair value of derivative instruments not designated as accounting hedges by type of derivative contract on a gross basis as of December 31, 2009 and December 31, 2008. Fair values of derivative contracts in an asset position are included in Financial instruments owned-derivative and other contracts. Fair values of derivative contracts in a liability position are reflected in Financial instruments sold, not yet purchased-derivative and other contracts.
| Assets at December 31, 2009 | Liabilities at December 31, 2009 | |||||||||||||
| Fair Value | Notional | Fair Value | Notional | |||||||||||
| (dollars in millions) | ||||||||||||||
Derivatives designated as accounting hedges: | ||||||||||||||
Interest rate contracts | $ | 4,343 | $ | 69,026 | $ | 175 | $ | 12,248 | ||||||
Foreign exchange contracts | 216 | 10,781 | 105 | 7,125 | ||||||||||
Total derivatives designated as accounting hedges | 4,559 | 79,807 | 280 | 19,373 | ||||||||||
Derivatives not designated as accounting hedges(1): | ||||||||||||||
Interest rate contracts | 622,786 | 16,285,375 | 599,291 | 16,123,706 | ||||||||||
Credit contracts | 146,064 | 2,557,917 | 125,234 | 2,404,995 | ||||||||||
Foreign exchange contracts | 52,312 | 1,174,815 | 51,369 | 1,107,989 | ||||||||||
Equity contracts | 41,366 | 476,510 | 49,198 | 492,681 | ||||||||||
Commodity contracts | 64,614 | 453,132 | 63,714 | 414,765 | ||||||||||
Other | 389 | 12,908 | 1,123 | 6,180 | ||||||||||
Total derivatives not designated as accounting hedges | 927,531 | 20,960,657 | 889,929 | 20,550,316 | ||||||||||
Total derivatives | $ | 932,090 | $ | 21,040,464 | $ | 890,209 | $ | 20,569,689 | ||||||
Cash collateral netting | (62,738 | ) | - | (31,729 | ) | - | ||||||||
Counterparty netting | (820,271 | ) | - | (820,271 | ) | - | ||||||||
Total derivatives | $ | 49,081 | $ | 21,040,464 | $ | 38,209 | $ | 20,569,689 | ||||||
| (1) | Notional amounts include net notionals related to long and short futures contracts of $434 billion and $696 billion, respectively. The variation margin on these futures contracts (excluded from the table above) of $601 million and $27 million is included in Receivables-brokers, dealers and clearing organizations and Payables-brokers, dealers and clearing organizations, respectively, on the consolidated statements of financial condition. |
| | 174 |
MORGAN STANLEY
NOTES TO CONSOLIDATED FINANCIAL STATEMENTS-(Continued)
| Assets at December 31, 2008 | Liabilities at December 31, 2008 | |||||||||||||
| Fair Value | Notional | Fair Value | Notional | |||||||||||
| (dollars in millions) | ||||||||||||||
Derivatives designated as accounting hedges: | ||||||||||||||
Interest rate contracts | $ | 5,840 | $ | 60,980 | $ | 112 | $ | 3,631 | ||||||
Foreign exchange contracts | 422 | 4,796 | 162 | 4,303 | ||||||||||
Total derivatives designated as accounting hedges | 6,262 | 65,776 | 274 | 7,934 | ||||||||||
Debt instruments designated as net investment hedges(1) | - | - | 4,077 | 4,077 | ||||||||||
Total derivatives and non-derivatives designated as accounting hedges | 6,262 | 65,776 | 4,351 | 12,011 | ||||||||||
Derivatives not designated as accounting hedges(2): | ||||||||||||||
Interest rate contracts | 843,295 | 13,531,925 | 820,697 | 13,616,244 | ||||||||||
Credit contracts | 470,548 | 3,688,445 | 442,118 | 3,594,335 | ||||||||||
Foreign exchange contracts | 98,345 | 1,077,928 | 99,219 | 1,027,042 | ||||||||||
Equity contracts | 66,763 | 595,918 | 66,946 | 607,349 | ||||||||||
Commodity contracts | 116,213 | 883,441 | 112,836 | 639,555 | ||||||||||
Other | 1,520 | 17,797 | 2,804 | 25,131 | ||||||||||
Total derivatives not designated as accounting hedges | 1,596,684 | 19,795,454 | 1,544,620 | 19,509,656 | ||||||||||
Total derivatives | $ | 1,602,946 | $ | 19,861,230 | $ | 1,544,894 | $ | 19,517,590 | ||||||
Cash collateral netting | (88,134 | ) | - | (50,946 | ) | - | ||||||||
Counterparty netting | (1,425,394 | ) | - | (1,425,394 | ) | - | ||||||||
Total derivatives | $ | 89,418 | $ | 19,861,230 | $ | 68,554 | $ | 19,517,590 | ||||||
| (1) | The notional amount for foreign currency debt instruments designated as net investment hedges represents the principal amount at current exchange rates. |
| (2) | Notional amounts include net notionals related to long and short futures contracts of $247 billion and $717 billion, respectively. The variation margin on these futures contracts (excluded from the table above) of $1,927 million and $77 million is included in Receivables-brokers, dealers and clearing organizations and Payables-brokers, dealers and clearing organizations, respectively, on the consolidated statements of financial condition. |
The following tables summarize the gains or losses reported on derivative instruments designated and qualifying as accounting hedges for 2009 and the one month ended December 31, 2008, respectively.
Derivatives Designated as Fair Value Hedges.
The following table presents gains (losses) reported on derivative instruments and the related hedge item as well as the hedge ineffectiveness included in Interest expense in the consolidated statements of income from interest rate contracts:
| 2009 | One Month Ended December 31, 2008 | |||||||
| (dollars in millions) | ||||||||
(Loss) gain recognized on derivatives | $ | (2,696 | ) | $ | 1,237 | |||
Gain (loss) recognized on borrowings | 3,013 | (1,231 | ) | |||||
Total | $ | 317 | $ | 6 | ||||
In addition, a gain of $17 million during fiscal 2008 and a gain of $132 million during fiscal 2007 were recognized in income related to hedge ineffectiveness.
| 175 | |
MORGAN STANLEY
NOTES TO CONSOLIDATED FINANCIAL STATEMENTS-(Continued)
Derivatives Designated as Net Investment Hedges.
| Losses Recognized in OCI (effective portion)(1) | ||||||||
Product Type | 2009 | One Month Ended December 31, 2008 | ||||||
| (dollars in millions) | ||||||||
Foreign exchange contracts(2) | $ | (278 | ) | $ | (102 | ) | ||
Debt instruments | (192 | ) | (18 | ) | ||||
Total | $ | (470 | ) | $ | (120 | ) | ||
| (1) | No gains (losses) related to net investment hedges were reclassified from Other comprehensive income ("OCI") into income during 2009 and the one month ended December 31, 2008, respectively. |
| (2) | A loss of $6 million and a loss of $17 million were recognized in income related to amounts excluded from hedge effectiveness testing during 2009 and the one month ended December 31, 2008, respectively. In addition, the amount excluded from the assessment of hedge effectiveness for fiscal 2008 was not material. |
The table below summarizes gains (losses) on derivative instruments not designated as accounting hedges for 2009 and the one month ended December 31, 2008, respectively:
| Gains (Losses) Recognized in Income(1)(2) | ||||||||
Product Type | 2009 | One Month Ended December 31, 2008 | ||||||
| (dollars in millions) | ||||||||
Interest rate contracts | $ | 3,515 | $ | 1,814 | ||||
Credit contracts | (2,579 | ) | (1,017 | ) | ||||
Foreign exchange contracts | 469 | (2,176 | ) | |||||
Equity contracts | (9,125 | ) | 91 | |||||
Commodity contracts | 1,748 | 880 | ||||||
Other contracts | 680 | (177 | ) | |||||
Total derivative instruments | $ | (5,292 | ) | $ | (585 | ) | ||
| (1) | Gains (losses) on derivative contracts not designated as hedges are primarily included in Principal transactions-trading. |
| (2) | Gains (losses) associated with derivative contracts that have physically settled are excluded from the table above. Gains (losses) on these contracts are reflected with the associated cash instruments, which are also included in Principal transactions-trading. |
The Company also has certain embedded derivatives that have been bifurcated from the related structured borrowings. Such derivatives are classified in Long-term borrowings and had a net fair value of $110 million and $269 million, as of December 31, 2009 and December 31, 2008, respectively, and a notional of $3,442 million and $4,601 million, as of December 31, 2009 and December 31, 2008, respectively. The Company recognized losses of $76 million and $97 million related to changes in the fair value of its bifurcated embedded derivatives for 2009 and the one month ended December 31, 2008, respectively.
As of December 31, 2009 and December 31, 2008, the amount of payables associated with cash collateral received that was netted against derivative assets was $62.7 billion and $88.1 billion, respectively. The amount of receivables in respect of cash collateral paid that was netted against derivative liabilities was $31.7 billion and $50.9 billion, respectively. Cash collateral receivables and payables of $62 million and $227 million, respectively, as of December 31, 2009, and $1.3 billion and $92 million, respectively, as of December 31, 2008, were not offset against certain contracts that did not meet the definition of a derivative.
| | 176 |
MORGAN STANLEY
NOTES TO CONSOLIDATED FINANCIAL STATEMENTS-(Continued)
Credit-Risk-Related Contingencies.
In connection with certain OTC trading agreements, the Company may be required to provide additional collateral or immediately settle any outstanding liability balances with certain counterparties in the event of a credit ratings downgrade. As of December 31, 2009 and December 31, 2008, the aggregate fair value of derivative contracts that contain credit-risk-related contingent features that are in a net liability position totaled $23,052 million and $39,871 million, respectively, for which the Company has posted collateral of $20,607 million and $31,779 million, respectively, in the normal course of business. As of December 31, 2009 and December 31, 2008, the amount of additional collateral or termination payments that could be called by counterparties under the terms of such agreements in the event of a one-notch downgrade of the Company's long-term credit rating was approximately $717 million and $928 million, respectively. Additional collateral or termination payments of approximately $975 million and $1,898 million could be called by counterparties in the event of a two-notch downgrade, as of December 31, 2009 and December 31, 2008, respectively. Of these amounts, $1,203 million and $1,738 million, as of December 31, 2009 and December 31, 2008, respectively, related to bilateral arrangements between the Company and other parties where upon the downgrade of one party, the downgraded party must deliver incremental collateral to the other party. These bilateral downgrade arrangements are a risk management tool used extensively by the Company as credit exposures are reduced if counterparties are downgraded.
| 177 | |
MORGAN STANLEY
NOTES TO CONSOLIDATED FINANCIAL STATEMENTS-(Continued)
Credit Derivatives and Other Credit Contracts.
The Company enters into credit derivatives, principally through credit default swaps, under which it provides counterparties protection against the risk of default on a set of debt obligations issued by a specified reference entity or entities. A majority of the Company's counterparties are banks, broker-dealers, insurance and other financial institutions, and monoline insurers. The table below summarizes certain information regarding protection sold through credit default swaps and credit-linked notes as of December 31, 2009:
| Protection Sold | |||||||||||||||||||
| Maximum Potential Payout/Notional | Fair Value (Asset)/ Liability(1)(2) | ||||||||||||||||||
| Years to Maturity | |||||||||||||||||||
Credit Ratings of the Reference Obligation | Less than 1 | 1-3 | 3-5 | Over 5 | Total | ||||||||||||||
| (dollars in millions) | |||||||||||||||||||
Single name credit default swaps: | |||||||||||||||||||
AAA | $ | 926 | $ | 2,733 | $ | 10,969 | $ | 30,542 | $ | 45,170 | $ | 846 | |||||||
AA | 13,355 | 31,475 | 38,360 | 39,424 | 122,614 | 1,355 | |||||||||||||
A | 35,164 | 101,909 | 100,489 | 50,432 | 287,994 | (3,115 | ) | ||||||||||||
BBB | 57,979 | 161,309 | 151,143 | 80,216 | 450,647 | (6,753 | ) | ||||||||||||
Non-investment grade | 58,408 | 180,311 | 123,972 | 63,871 | 426,562 | 25,870 | |||||||||||||
Total | 165,832 | 477,737 | 424,933 | 264,485 | 1,332,987 | 18,203 | |||||||||||||
Index and basket credit default swaps: | |||||||||||||||||||
AAA | 41,517 | 59,925 | 51,750 | 53,917 | 207,109 | (1,563 | ) | ||||||||||||
AA | - | 1,113 | 4,082 | 17,120 | 22,315 | 1,794 | |||||||||||||
A | 198 | 3,604 | 25,425 | 5,666 | 34,893 | (377 | ) | ||||||||||||
BBB | 12,866 | 65,484 | 183,799 | 93,906 | 356,055 | (2,101 | ) | ||||||||||||
Non-investment grade | 40,941 | 160,331 | 160,127 | 132,267 | 493,666 | 27,665 | |||||||||||||
Total | 95,522 | 290,457 | 425,183 | 302,876 | 1,114,038 | 25,418 | |||||||||||||
Total credit default swaps sold | $ | 261,354 | $ | 768,194 | $ | 850,116 | $ | 567,361 | $ | 2,447,025 | $ | 43,621 | |||||||
Other credit contracts(3)(4) | $ | - | $ | 51 | $ | 24 | $ | 1,089 | $ | 1,164 | $ | 1,118 | |||||||
Credit-linked notes(4) | 160 | 74 | 337 | 668 | 1,239 | (335 | ) | ||||||||||||
Total credit derivatives and other credit contracts | $ | 261,514 | $ | 768,319 | $ | 850,477 | $ | 569,118 | $ | 2,449,428 | $ | 44,404 | |||||||
| (1) | Fair value amounts are shown on a gross basis prior to cash collateral or counterparty netting. |
| (2) | Fair value amounts of certain credit default swaps where the Company sold protection have an asset carrying value because credit spreads of the underlying reference entity or entities tightened during 2009. |
| (3) | Other credit contracts are credit default swaps that are considered hybrid instruments. |
| (4) | Fair value amount shown represents the fair value of the hybrid instruments. |
| | 178 |
MORGAN STANLEY
NOTES TO CONSOLIDATED FINANCIAL STATEMENTS-(Continued)
The table below summarizes certain information regarding protection sold through credit default swaps and credit-linked notes as of December 31, 2008:
| Protection Sold | |||||||||||||||||||
| Maximum Potential Payout/Notional | Fair Value (Asset)/ Liability(1) | ||||||||||||||||||
| Years to Maturity | |||||||||||||||||||
Credit Ratings of the Reference Obligation | Less than 1 | 1-3 | 3-5 | Over 5 | Total | ||||||||||||||
| (dollars in millions) | |||||||||||||||||||
Single name credit default swaps: | |||||||||||||||||||
AAA | $ | 1,946 | $ | 3,593 | $ | 12,766 | $ | 37,166 | $ | 55,471 | $ | 4,438 | |||||||
AA | 13,450 | 24,897 | 54,308 | 42,355 | 135,010 | 5,757 | |||||||||||||
A | 45,097 | 81,279 | 156,888 | 72,690 | 355,954 | 20,044 | |||||||||||||
BBB | 54,823 | 142,528 | 250,621 | 117,869 | 565,841 | 51,920 | |||||||||||||
Non-investment grade | 47,605 | 144,923 | 231,745 | 83,845 | 508,118 | 116,512 | |||||||||||||
Total | 162,921 | 397,220 | 706,328 | 353,925 | 1,620,394 | 198,671 | |||||||||||||
Index and basket credit default swaps: | |||||||||||||||||||
AAA | 2,989 | 24,821 | 68,390 | 146,105 | 242,305 | 10,936 | |||||||||||||
AA | 1,435 | 5,684 | 4,683 | 8,073 | 19,875 | 1,128 | |||||||||||||
A | 12,986 | 11,289 | 28,885 | 30,757 | 83,917 | 4,069 | |||||||||||||
BBB | 10,914 | 127,933 | 443,709 | 273,851 | 856,407 | 46,282 | |||||||||||||
Non-investment grade | 34,497 | 211,319 | 341,223 | 176,496 | 763,535 | 166,252 | |||||||||||||
Total | 62,821 | 381,046 | 886,890 | 635,282 | 1,966,039 | 228,667 | |||||||||||||
Total credit default swaps sold | $ | 225,742 | $ | 778,266 | $ | 1,593,218 | $ | 989,207 | $ | 3,586,433 | $ | 427,338 | |||||||
Other credit contracts(2)(3) | $ | 53 | $ | 43 | $ | 188 | $ | 3,014 | $ | 3,298 | $ | 3,379 | |||||||
Credit-linked notes(3) | 207 | 486 | 326 | 640 | 1,659 | (242 | ) | ||||||||||||
Total credit derivatives and other credit contracts | $ | 226,002 | $ | 778,795 | $ | 1,593,732 | $ | 992,861 | $ | 3,591,390 | $ | 430,475 | |||||||
| (1) | Fair value amounts are shown on a gross basis prior to cash collateral or counterparty netting. |
| (2) | Other credit contracts are credit default swaps that are considered hybrid instruments. |
| (3) | Fair value amount shown represents the fair value of the hybrid instruments. |
Single Name Credit Default Swaps. A credit default swap protects the buyer against the loss of principal on a bond or loan in case of a default by the issuer. The protection buyer pays a periodic premium (generally quarterly) over the life of the contract and is protected for the period. The Company in turn will have to perform under a credit default swap if a credit event as defined under the contract occurs. Typical credit events include bankruptcy, dissolution or insolvency of the referenced entity, failure to pay and restructuring of the obligations of the referenced entity. In order to provide an indication of the current payment status or performance risk of the credit default swaps, the external credit ratings, primarily Moody's credit ratings, of the underlying reference entity of the credit default swaps are disclosed.
Index and Basket Credit Default Swaps. Index and basket credit default swaps are credit default swaps that reference multiple names through underlying baskets or portfolios of single name credit default swaps. Generally, in the event of a default on one of the underlying names, the Company will have to pay a pro rata portion of the total notional amount of the credit default index or basket contract. In order to provide an indication of the current payment status or performance risk of these credit default swaps, the weighted average external credit ratings, primarily Moody's credit ratings, of the underlying reference entities comprising the basket or index were calculated and disclosed.
| 179 | |
MORGAN STANLEY
NOTES TO CONSOLIDATED FINANCIAL STATEMENTS-(Continued)
The Company also enters into index and basket credit default swaps where the credit protection provided is based upon the application of tranching techniques. In tranched transactions, the credit risk of an index or basket is separated into various portions of the capital structure, with different levels of subordination. The most junior tranches cover initial defaults, and once losses exceed the notional of the tranche, they are passed on to the next most senior tranche in the capital structure. As external credit ratings are not always available for tranched indices and baskets, credit ratings were determined based upon an internal methodology.
Credit Protection Sold Through CLNs. The Company has invested in CLNs, which are hybrid instruments containing embedded derivatives, in which credit protection has been sold to the issuer of the note. If there is a credit event of a reference entity underlying the CLN, the principal balance of the note may not be repaid in full to the Company.
Purchased Credit Protection. For single name credit default swaps and non-tranched index and basket credit default swaps, the Company has purchased protection with a notional amount of approximately $1.9 trillion and $2.7 trillion as of December 31, 2009 and December 31, 2008, respectively, compared with a notional amount of approximately $2.1 trillion and $3.0 trillion, as of December 31, 2009 and December 31, 2008, respectively, of credit protection sold with identical underlying reference obligations. In order to identify purchased protection with the same underlying reference obligations, the notional amount for individual reference obligations within non-tranched indices and baskets was determined on a pro rata basis and matched off against single name and non-tranched index and basket credit default swaps where credit protection was sold with identical underlying reference obligations. The Company may also purchase credit protection to economically hedge loans and lending commitments. In total, not considering whether the underlying reference obligations are identical, the Company has purchased credit protection of $2.5 trillion with a positive fair value of $65 billion compared with $2.4 trillion of credit protection sold with a negative fair value of $44 billion as of December 31, 2009. In total, not considering whether the underlying reference obligations are identical, the Company has purchased credit protection of $3.7 trillion with a positive fair value of $458 billion compared with $3.6 trillion of credit protection sold with a negative fair value of $430 billion as of December 31, 2008.
The purchase of credit protection does not represent the sole manner in which the Company risk manages its exposure to credit derivatives. The Company manages its exposure to these derivative contracts through a variety of risk mitigation strategies, which include managing the credit and correlation risk across single name, non-tranched indices and baskets, tranched indices and baskets, and cash positions. Aggregate market risk limits have been established for credit derivatives, and market risk measures are routinely monitored against these limits. The Company may also recover amounts on the underlying reference obligation delivered to the Company under credit default swaps where credit protection was sold.
| | 180 |
MORGAN STANLEY
NOTES TO CONSOLIDATED FINANCIAL STATEMENTS-(Continued)
11. Commitments, Guarantees and Contingencies.
Commitments.
The Company's commitments associated with outstanding letters of credit and other financial guarantees obtained to satisfy collateral requirements, investment activities, corporate lending and financing arrangements, mortgage lending and margin lending as of December 31, 2009 are summarized below by period of expiration. Since commitments associated with these instruments may expire unused, the amounts shown do not necessarily reflect the actual future cash funding requirements:
| Years to Maturity | Total at December 31, 2009 | ||||||||||||||
| Less than 1 | 1-3 | 3-5 | Over 5 | ||||||||||||
| (dollars in millions) | |||||||||||||||
Letters of credit and other financial guarantees obtained to satisfy collateral requirements | $ | 1,043 | $ | 1 | $ | 1 | $ | 52 | $ | 1,097 | |||||
Investment activities | 1,013 | 883 | 199 | 83 | 2,178 | ||||||||||
Primary lending commitments-Investment grade(1)(2) | 10,146 | 26,378 | 4,033 | 154 | 40,711 | ||||||||||
Primary lending commitments-Non-investment grade(1) | 344 | 4,193 | 2,515 | 124 | 7,176 | ||||||||||
Secondary lending commitments(1) | 18 | 107 | 121 | 97 | 343 | ||||||||||
Commitments for secured lending transactions | 683 | 1,415 | 114 | - | 2,212 | ||||||||||
Forward starting reverse repurchase agreements(3) | 30,104 | 101 | - | - | 30,205 | ||||||||||
Commercial and residential mortgage-related commitments(1) | 1,485 | - | - | - | 1,485 | ||||||||||
Other commitments(4) | 289 | 1 | 150 | - | 440 | ||||||||||
Total | $ | 45,125 | $ | 33,079 | $ | 7,133 | $ | 510 | $ | 85,847 | |||||
| (1) | These commitments are recorded at fair value within Financial instruments owned and Financial instruments sold, not yet purchased in the consolidated statements of financial condition (see Note 4 to the consolidated financial statements). |
| (2) | This amount includes commitments to asset-backed commercial paper conduits of $276 million as of December 31, 2009, of which $268 million have maturities of less than one year and $8 million of which have maturities of one to three years. |
| (3) | The Company enters into forward starting securities purchased under agreements to resell (agreements that have a trade date as of or prior to December 31, 2009 and settle subsequent to period-end.) These agreements primarily settle within three business days and as of December 31, 2009, $26.6 billion of the $30.2 billion settled within three business days. |
| (4) | Amount includes a $200 million lending facility to a real estate fund sponsored by the Company. |
Letters of Credit and Other Financial Guarantees Obtained to Satisfy Collateral Requirements . The Company has outstanding letters of credit and other financial guarantees issued by third-party banks to certain of the Company's counterparties. The Company is contingently liable for these letters of credit and other financial guarantees, which are primarily used to provide collateral for securities and commodities borrowed and to satisfy various margin requirements in lieu of depositing cash or securities with these counterparties.
Investment Activities. The Company enters into commitments associated with its real estate, private equity and principal investment activities, which include alternative products.
Lending Commitments. Primary lending commitments are those which are originated by the Company whereas secondary lending commitments are purchased from third parties in the market. The commitments include lending commitments that are made to investment grade and non-investment grade companies in connection with corporate lending and other business activities.
Commitments for Secured Lending Transactions. Secured lending commitments are extended by the Company to companies and are secured by real estate or other physical assets of the borrower. Loans made under these arrangements typically are at variable rates and generally provide for over-collateralization based upon the creditworthiness of the borrower.
| 181 | |
MORGAN STANLEY
NOTES TO CONSOLIDATED FINANCIAL STATEMENTS-(Continued)
Forward Starting Reverse Repurchase Agreements . The Company has entered into forward starting securities purchased under agreements to resell (agreements that have a trade date as of or prior to December 31, 2009 and December 31, 2008, respectively, and settle subsequent to period-end) that are primarily secured by collateral from U.S. government agency securities and other sovereign government obligations.
Commercial and Residential Mortgage-Related Commitments. The Company enters into forward purchase contracts involving residential mortgage loans, residential mortgage lending commitments to individuals and residential home equity lines of credit. In addition, the Company enters into commitments to originate commercial and residential mortgage loans.
Underwriting Commitments . The Company provides underwriting commitments in connection with its capital raising sources to a diverse group of corporate and other institutional clients.
Other Commitments . Other commitments include a binding contingent lending commitment on behalf of a client in connection with the Company's Institutional Securities business segment. Other commitments generally include commercial lending commitments to small businesses and commitments related to securities-based lending activities in connection with the Company's Global Wealth Management Group business segment.
The Company sponsors several nonconsolidated investment funds for third-party investors where the Company typically acts as general partner of, and investment adviser to, these funds and typically commits to invest a minority of the capital of such funds with subscribing third-party investors contributing the majority. The Company's employees, including its senior officers, as well as the Company's directors may participate on the same terms and conditions as other investors in certain of these funds that the Company forms primarily for client investment, except that the Company may waive or lower applicable fees and charges for its employees. The Company has contractual capital commitments, guarantees, lending facilities and counterparty arrangements with respect to these investment funds.
Premises and Equipment. The Company has non-cancelable operating leases covering premises and equipment (excluding commodities operating leases, shown separately). As of December 31, 2009, future minimum rental commitments under such leases (net of subleases, principally on office rentals) were as follows (dollars in millions):
Year Ended | Operating Premises Leases | ||
2010 | $ | 683 | |
2011 | 663 | ||
2012 | 579 | ||
2013 | 490 | ||
2014 | 416 | ||
Thereafter | 2,701 | ||
The total of minimum rentals to be received in the future under non-cancelable operating subleases as of December 31, 2009 was $112 million.
Occupancy lease agreements, in addition to base rentals, generally provide for rent and operating expense escalations resulting from increased assessments for real estate taxes and other charges. Total rent expense, net of sublease rental income, was $707 million, $619 million, $599 million and $56 million in 2009, fiscal 2008, fiscal 2007 and the one month ended December 31, 2008, respectively.
| | 182 |
MORGAN STANLEY
NOTES TO CONSOLIDATED FINANCIAL STATEMENTS-(Continued)
In connection with its commodities business, the Company enters into operating leases for both crude oil and refined products storage and for vessel charters. These operating leases are integral parts of the Company's commodities risk management business. As of December 31, 2009, future minimum rental commitments under such leases were as follows (dollars in millions):
Year Ended | Operating Equipment Leases | ||
2010 | $ | 514 | |
2011 | 165 | ||
2012 | 114 | ||
2013 | 73 | ||
2014 | 36 | ||
Thereafter | 136 | ||
Guarantees.
The table below summarizes certain information regarding the Company's obligations under guarantee arrangements as of December 31, 2009:
| Maximum Potential Payout/Notional | Carrying Amount (Asset)/ Liability | Collateral/ Recourse | ||||||||||||||||||||
| Years to Maturity | ||||||||||||||||||||||
Type of Guarantee | Less than 1 | 1-3 | 3-5 | Over 5 | Total | |||||||||||||||||
| (dollars in millions) | ||||||||||||||||||||||
Credit derivative contracts(1) | $ | 261,354 | $ | 768,194 | $ | 850,116 | $ | 567,361 | $ | 2,447,025 | $ | 43,621 | $ | - | ||||||||
Other credit contracts | - | 51 | 24 | 1,089 | 1,164 | 1,118 | - | |||||||||||||||
Credit-linked notes | 160 | 74 | 337 | 668 | 1,239 | (335 | ) | - | ||||||||||||||
Non-credit derivative contracts(1)(2) | 637,688 | 340,280 | 142,700 | 232,210 | 1,352,878 | 70,314 | - | |||||||||||||||
Standby letters of credit and other financial guarantees issued(3)(4) | 982 | 3,134 | 1,126 | 4,886 | 10,128 | 976 | 5,324 | |||||||||||||||
Market value guarantees | - | - | - | 775 | 775 | 45 | 126 | |||||||||||||||
Liquidity facilities | 4,402 | - | 307 | 143 | 4,852 | 24 | 6,264 | |||||||||||||||
Whole loan sales guarantees | - | - | - | 42,380 | 42,380 | 81 | - | |||||||||||||||
General partner guarantees | 195 | 55 | 101 | 131 | 482 | 95 | - | |||||||||||||||
| (1) | Carrying amount of derivative contracts are shown on a gross basis prior to cash collateral or counterparty netting. For further information on derivative contracts see Note 10. |
| (2) | Amounts include a guarantee to investors in undivided participating interests in claims the Company made against a derivative counterparty that filed for bankruptcy protection. To the extent, in the future, any portion of the claims is disallowed or reduced by the bankruptcy court in excess of a certain amount, then the Company must refund a portion of the purchase price plus interest. For further information see Note 16 to the consolidated financial statements. |
| (3) | Approximately $2.0 billion of standby letters of credit are also reflected in the "Commitments" table above in primary and secondary lending commitments. Standby letters of credit are recorded at fair value within Financial instruments owned or Financial instruments sold, not yet purchased in the consolidated statements of financial condition. |
| (4) | Amounts include guarantees issued by consolidated real estate funds sponsored by the Company of approximately $2.0 billion. These guarantees relate to obligations of the fund's investee entities, including guarantees related to capital expenditures and principal and interest debt payments. Accrued losses under these guarantees of approximately $1.1 billion are reflected as a reduction of the carrying value of the related fund investments, which are reflected in Financial instruments owned-investments on the consolidated statement of financial condition. |
| 183 | |
MORGAN STANLEY
NOTES TO CONSOLIDATED FINANCIAL STATEMENTS-(Continued)
The table below summarizes certain information regarding the Company's obligations under guarantee arrangements as of December 31, 2008:
| Maximum Potential Payout/Notional | Carrying Amount (Asset)/ Liability | Collateral/ Recourse | ||||||||||||||||||||
| Years to Maturity | ||||||||||||||||||||||
Type of Guarantee | Less than 1 | 1-3 | 3-5 | Over 5 | Total | |||||||||||||||||
| (dollars in millions) | ||||||||||||||||||||||
Credit derivative contracts(1) | $ | 225,742 | $ | 778,266 | $ | 1,593,218 | $ | 989,207 | $ | 3,586,433 | $ | 427,338 | $ | - | ||||||||
Other credit contracts | 53 | 43 | 188 | 3,014 | 3,298 | 3,379 | - | |||||||||||||||
Credit-linked notes | 207 | 486 | 326 | 640 | 1,659 | (242 | ) | - | ||||||||||||||
Non-credit derivative contracts(1) | 684,432 | 385,734 | 195,419 | 274,652 | 1,540,237 | 145,609 | - | |||||||||||||||
Standby letters of credit and other financial guarantees issued | 779 | 1,964 | 1,817 | 4,418 | 8,978 | 78 | 4,787 | |||||||||||||||
Market value guarantees | - | - | - | 645 | 645 | 36 | 134 | |||||||||||||||
Liquidity facilities | 3,152 | 698 | 188 | 376 | 4,414 | 25 | 3,741 | |||||||||||||||
Whole loan sales guarantees | - | - | - | 42,045 | 42,045 | - | - | |||||||||||||||
General partner guarantees | 54 | 198 | 33 | 150 | 435 | 29 | - | |||||||||||||||
Auction rate security guarantees | 1,747 | - | - | - | 1,747 | 40 | - | |||||||||||||||
| (1) | Carrying amount of derivative contracts are shown on a gross basis prior to cash collateral or counterparty netting. For further information on derivative contracts, see Note 10. |
The Company has obligations under certain guarantee arrangements, including contracts and indemnification agreements that contingently require a guarantor to make payments to the guaranteed party based on changes in an underlying measure (such as an interest or foreign exchange rate, security or commodity price, an index or the occurrence or non-occurrence of a specified event) related to an asset, liability or equity security of a guaranteed party. Also included as guarantees are contracts that contingently require the guarantor to make payments to the guaranteed party based on another entity's failure to perform under an agreement, as well as indirect guarantees of the indebtedness of others. The Company's use of guarantees is described below by type of guarantee:
Derivative Contracts. Certain derivative contracts meet the accounting definition of a guarantee, including certain written options, contingent forward contracts and credit default swaps (see Note 10 regarding credit derivatives in which the Company has sold credit protection to the counterparty). Although the Company's derivative arrangements do not specifically identify whether the derivative counterparty retains the underlying asset, liability or equity security, the Company has disclosed information regarding all derivative contracts that could meet the accounting definition of a guarantee. The maximum potential payout for certain derivative contracts, such as written interest rate caps and written foreign currency options, cannot be estimated, as increases in interest or foreign exchange rates in the future could possibly be unlimited. Therefore, in order to provide information regarding the maximum potential amount of future payments that the Company could be required to make under certain derivative contracts, the notional amount of the contracts has been disclosed. In certain situations, collateral may be held by the Company for those contracts that meet the definition of a guarantee. Generally, the Company sets collateral requirements by counterparty so that the collateral covers various transactions and products and is not allocated specifically to individual contracts. Also, the Company may recover amounts related to the underlying asset delivered to the Company under the derivative contract.
The Company records all derivative contracts at fair value. Aggregate market risk limits have been established, and market risk measures are routinely monitored against these limits. The Company also manages its exposure to these derivative contracts through a variety of risk mitigation strategies, including, but not limited to, entering into offsetting economic hedge positions. The Company believes that the notional amounts of the derivative contracts generally overstate its exposure.
| | 184 |
MORGAN STANLEY
NOTES TO CONSOLIDATED FINANCIAL STATEMENTS-(Continued)
Standby Letters of Credit and other Financial Guarantees Issued. In connection with its corporate lending business and other corporate activities, the Company provides standby letters of credit and other financial guarantees to counterparties. Such arrangements represent obligations to make payments to third parties if the counterparty fails to fulfill its obligation under a borrowing arrangement or other contractual obligation. A majority of the Company's standby letters of credit is provided on behalf of counterparties that are investment grade.
Market Value Guarantees. Market value guarantees are issued to guarantee timely payment of a specified return to investors in certain affordable housing tax credit funds. These guarantees are designed to return an investor's contribution to a fund and the investor's share of tax losses and tax credits expected to be generated by a fund. From time to time, the Company may also guarantee return of principal invested, potentially including a specified rate of return, to fund investors.
Liquidity Facilities. The Company has entered into liquidity facilities with SPEs and other counterparties, whereby the Company is required to make certain payments if losses or defaults occur. Primarily, the Company acts as liquidity provider to municipal bond securitization SPEs and for standalone municipal bonds in which the holders of beneficial interests issued by these SPEs or the holders of the individual bonds, respectively, have the right to tender their interests for purchase by the Company on specified dates at a specified price. The Company often may have recourse to the underlying assets held by the SPEs in the event payments are required under such liquidity facilities as well as make-whole or recourse provisions with the trust sponsors. Primarily all of the underlying assets in the SPEs are investment grade.
Whole loan sale guarantees. The Company provides representations and warranties that certain assets sold as whole loans conform to specified guidelines. The Company may be required to repurchase such assets or indemnify the purchaser against losses if the assets do not meet certain conforming guidelines. Due diligence is performed by the Company to ensure that asset guideline qualifications are met, and, to the extent the Company has acquired such assets from other parties, the Company seeks to obtain its own representations and warranties regarding the assets. The maximum potential amount of future payments the Company could be required to make would be equal to the current outstanding balances of assets transferred by the Company that are subject to its representations and warranties.
General Partner Guarantees. As a general partner in certain private equity and real estate partnerships, the Company receives distributions from the partnerships according to the provisions of the partnership agreements. The Company may, from time to time, be required to return all or a portion of such distributions to the limited partners in the event the limited partners do not achieve a certain return as specified in various partnership agreements, subject to certain limitations.
ARS Guarantees. Under the terms of various agreements entered into with government agencies and the terms of the Company's announced offer to repurchase, the Company agreed to repurchase at par certain ARS held by retail clients that were purchased through the Company. In addition, the Company agreed to reimburse retail clients who have sold certain ARS purchased through the Company at a loss. The Company's maximum exposure as it relates to these repurchase obligations was based on the Company's best estimate of the outstanding ARS eligible under the repurchase program. At December 31, 2008, the Company recorded a liability at fair value related to these ARS purchase obligations. The Company had no ARS purchase obligation at December 31, 2009.
Other Guarantees and Indemnities.
In the normal course of business, the Company provides guarantees and indemnifications in a variety of commercial transactions. These provisions generally are standard contractual terms. Certain of these guarantees and indemnifications are described below.
| • | Trust Preferred Securities . The Company has established Morgan Stanley Capital Trusts for the limited purpose of issuing trust preferred securities to third parties and lending the proceeds to the Company in |
| 185 | |
MORGAN STANLEY
NOTES TO CONSOLIDATED FINANCIAL STATEMENTS-(Continued)
exchange for junior subordinated debentures. The Company has directly guaranteed the repayment of the trust preferred securities to the holders thereof to the extent that the Company has made payments to a Morgan Stanley Capital Trust on the junior subordinated debentures. In the event that the Company does not make payments to a Morgan Stanley Capital Trust, holders of such series of trust preferred securities would not be able to rely upon the guarantee for payment of those amounts. The Company has not recorded any liability in the consolidated financial statements for these guarantees and believes that the occurrence of any events ( i.e. , non-performance on the part of the paying agent) that would trigger payments under these contracts is remote. See Note 13 for details on the Company's junior subordinated debentures. |
| • | Indemnities . The Company provides standard indemnities to counterparties for certain contingent exposures and taxes, including U.S. and foreign withholding taxes, on interest and other payments made on derivatives, securities and stock lending transactions, certain annuity products and other financial arrangements. These indemnity payments could be required based on a change in the tax laws or change in interpretation of applicable tax rulings or a change in factual circumstances. Certain contracts contain provisions that enable the Company to terminate the agreement upon the occurrence of such events. The maximum potential amount of future payments that the Company could be required to make under these indemnifications cannot be estimated. The Company has not recorded any contingent liability in the consolidated financial statements for these indemnifications and believes that the occurrence of any events that would trigger payments under these contracts is remote. |
| • | Exchange/Clearinghouse Member Guarantees . The Company is a member of various U.S. and non-U.S. exchanges and clearinghouses that trade and clear securities and/or derivative contracts. Associated with its membership, the Company may be required to pay a proportionate share of the financial obligations of another member who may default on its obligations to the exchange or the clearinghouse. While the rules governing different exchange or clearinghouse memberships vary, in general the Company's guarantee obligations would arise only if the exchange or clearinghouse had previously exhausted its resources. The maximum potential payout under these membership agreements cannot be estimated. The Company has not recorded any contingent liability in the consolidated financial statements for these agreements and believes that any potential requirement to make payments under these agreements is remote. |
| • | Guarantees on Securitized Assets. As part of the Company's Institutional Securities securitization and related activities, the Company provides representations and warranties that certain assets transferred in securitization transactions conform to specified guidelines. The Company may be required to repurchase such assets or indemnify the purchaser against losses if the assets do not meet certain conforming guidelines. Due diligence is performed by the Company to ensure that asset guideline qualifications are met, and, to the extent the Company has acquired such assets from other parties, the Company seeks to obtain its own representations and warranties regarding the assets. In many securitization transactions, some, but not all, of the original asset sellers provide the representations and warranties directly to the purchaser, and the Company makes representations and warranties only with respect to other assets. The maximum potential amount of future payments the Company could be required to make would be equal to the current outstanding balances of assets transferred by the Company that are subject to its representations and warranties. The Company has not provided any contingent liability in the consolidated financial statements for representations and warranties made in connection with securitization transactions, and it believes that the probability of any payments under those arrangements is remote. |
| • | Merger and Acquisition Guarantees . The Company may, from time to time, in its role as investment banking advisor be required to provide guarantees in connection with certain European merger and acquisition transactions. If required by the regulating authorities, the Company provides a guarantee that the acquirer in the merger and acquisition transaction has or will have sufficient funds to complete the transaction and would then be required to make the acquisition payments in the event the acquirer's funds are insufficient at the completion date of the transaction. These arrangements generally cover the time |
| | 186 |
MORGAN STANLEY
NOTES TO CONSOLIDATED FINANCIAL STATEMENTS-(Continued)
frame from the transaction offer date to its closing date and, therefore, are generally short term in nature. The maximum potential amount of future payments that the Company could be required to make cannot be estimated. The Company believes the likelihood of any payment by the Company under these arrangements is remote given the level of the Company's due diligence associated with its role as investment banking advisor. |
| • | Guarantees on Morgan Stanley Stable Value Program . On September 30, 2009, the Company entered into an agreement with the investment manager for the Stable Value Program ("SVP"), a fund within the Company's 401(k) plan, and certain other third parties. Under the agreement, the Company contributed $20 million to the SVP on October 15, 2009. The Company recorded the contribution in Compensation and benefits expense on the consolidated statement of income for 2009. Additionally, the Company may have a future obligation to make a payment of $40 million to the SVP following the third anniversary of the agreement, after which the SVP would be wound down over a period of time. The future obligation is contingent upon whether the market-to-book value ratio of the portion of the SVP that is subject to certain book-value stabilizing contracts has fallen below a specific threshold and the Company and the other parties to the agreement all decline to make payments to restore the SVP to such threshold as of the third anniversary of the agreement. The Company has not recorded a liability for this guarantee in the consolidated financial statements. |
In the ordinary course of business, the Company guarantees the debt and/or certain trading obligations (including obligations associated with derivatives, foreign exchange contracts and the settlement of physical commodities) of certain subsidiaries. These guarantees generally are entity or product specific and are required by investors or trading counterparties. The activities of the subsidiaries covered by these guarantees (including any related debt or trading obligations) are included in the Company's consolidated financial statements.
Contingencies.
Legal. In the normal course of business, the Company has been named, from time to time, as a defendant in various legal actions, including arbitrations, class actions and other litigation, arising in connection with its activities as a global diversified financial services institution. Certain of the actual or threatened legal actions include claims for substantial compensatory and/or punitive damages or claims for indeterminate amounts of damages. In some cases, the issuers that would otherwise be the primary defendants in such cases are bankrupt or are in financial distress.
The Company is also involved, from time to time, in other reviews, investigations and proceedings (both formal and informal) by governmental and self-regulatory agencies regarding the Company's business, including, among other matters, accounting and operational matters, certain of which may result in adverse judgments, settlements, fines, penalties, injunctions or other relief.
The Company contests liability and/or the amount of damages as appropriate in each pending matter. In view of the inherent difficulty of predicting the outcome of such matters, particularly in cases where claimants seek substantial or indeterminate damages or where investigations and proceedings are in the early stages, the Company cannot predict with certainty the loss or range of loss, if any, related to such matters; how or if such matters will be resolved; when they will ultimately be resolved; or what the eventual settlement, fine, penalty or other relief, if any, might be. Subject to the foregoing, the Company believes, based on current knowledge and after consultation with counsel, that the outcome of such pending matters will not have a material adverse effect on the consolidated statement of financial condition of the Company, although the outcome of such matters could be material to the Company's operating results and cash flows for a particular future period, depending on, among other things, the level of the Company's revenues, income or cash flows for such period. Legal reserves have been established in accordance with the requirements for accounting for contingencies. Once established, reserves are adjusted when there is more information available or when an event occurs requiring a change.
| 187 | |
MORGAN STANLEY
NOTES TO CONSOLIDATED FINANCIAL STATEMENTS-(Continued)
12. Regulatory Requirements.
Morgan Stanley. In September 2008, the Company became a financial holding company under the Bank Holding Company Act subject to the regulation and oversight of the Board of Governors of the Federal Reserve System (the "Fed"). The Fed establishes capital requirements for the Company, including well-capitalized standards, and evaluates the Company's compliance with such capital requirements. The Office of the Comptroller of the Currency and the Office of Thrift Supervision establish similar capital requirements and standards for the Company's national banks and federal savings bank, respectively.
The Company calculates its capital ratios and risk-weighted assets ("RWAs") in accordance with the capital adequacy standards for financial holding companies adopted by the Fed. These standards are based upon a framework described in the "International Convergence of Capital Measurement and Capital Standards," July 1988, as amended, also referred to as Basel I. In December 2007, the U.S. banking regulators published a final Basel II Accord that requires internationally active banking organizations, as well as certain of its U.S. bank subsidiaries, to implement Basel II standards over the next several years. The Company will be required to implement these Basel II standards as a result of becoming a financial holding company.
As of December 31, 2009, the Company was in compliance with Basel I capital requirements with ratios of Tier 1 capital to RWAs of 15.3% and total capital to RWAs of 16.4% (6% and 10% being well-capitalized for regulatory purposes, respectively). In addition, financial holding companies are also subject to a Tier 1 leverage ratio as defined by the Fed. The Company calculated its Tier 1 leverage ratio as Tier 1 capital divided by adjusted average total assets (which reflects adjustments for disallowed goodwill, certain intangible assets and deferred tax assets). The adjusted average total assets are derived using weekly balances for the calendar quarter. This ratio as of December 31, 2009 was 5.8%.
The following table summarizes the capital measures for the Company at December 31, 2009:
| December 31, 2009 | ||||||
| Balance | Ratio | |||||
| (dollars in millions) | ||||||
Tier 1 capital | $ | 46,670 | 15.3 | % | ||
Total capital | 49,955 | 16.4 | % | |||
RWAs | 305,000 | - | ||||
Adjusted average assets | 804,456 | - | ||||
Tier 1 leverage | - | 5.8 | % | |||
The Company's Significant U.S. Bank Operating Subsidiaries. The Company's domestic bank operating subsidiaries are subject to various regulatory capital requirements as administered by U.S. federal banking agencies. Failure to meet minimum capital requirements can initiate certain mandatory, and possibly additional, discretionary actions by regulators that, if undertaken, could have a direct material effect on the Company's U.S. bank operating subsidiaries' financial statements. Under capital adequacy guidelines and the regulatory framework for prompt corrective action, the Company's U.S. bank operating subsidiaries must meet specific capital guidelines that involve quantitative measures of the Company's U.S. bank operating subsidiaries' assets, liabilities and certain off-balance sheet items as calculated under regulatory accounting practices.
As of December 31, 2009, the Company's U.S. bank operating subsidiaries met all capital adequacy requirements to which they are subject.
As of December 31, 2009, the Company's U.S. bank operating subsidiaries exceeded all regulatorily mandated and targeted minimum regulatory capital requirements to be well-capitalized. There are no conditions or events that management believes have changed the Company's U.S. bank operating subsidiaries' category.
| | 188 |
MORGAN STANLEY
NOTES TO CONSOLIDATED FINANCIAL STATEMENTS-(Continued)
The table below sets forth the Company's significant U.S. bank operating subsidiaries' capital as of December 31, 2009.
At December 31, 2009 | Amount | Ratio | ||||
| (dollars in millions) | ||||||
Total Capital (to RWAs) : | ||||||
Morgan Stanley Bank, N.A. | $ | 8,880 | 18.4 | % | ||
Morgan Stanley Trust | $ | 591 | 69.8 | % | ||
Tier I Capital (to RWAs): | ||||||
Morgan Stanley Bank, N.A. | $ | 7,360 | 15.3 | % | ||
Morgan Stanley Trust | $ | 591 | 69.8 | % | ||
Leverage Ratio: | ||||||
Morgan Stanley Bank, N.A. | $ | 7,360 | 10.7 | % | ||
Morgan Stanley Trust | $ | 591 | 8.8 | % | ||
Under regulatory capital requirements adopted by the U.S. federal banking agencies, U.S. depository institutions, in order to be considered well-capitalized, must maintain a capital ratio of Tier 1 capital to RWAs of 6%, a ratio of total capital to RWAs of 10%, and a ratio of Tier 1 capital to average book assets (leverage ratio) of 5%. Each U.S. depository institution subsidiary of the Company must be well-capitalized in order for the Company to continue to qualify as a financial holding company and to continue to engage in the broadest range of financial activities permitted to financial holding companies. As of December 31, 2009, the Company's three U.S. depository institutions maintained capital at levels in excess of the universally mandated well-capitalized levels. These subsidiary depository institutions maintain capital at levels sufficiently in excess of the "well-capitalized" requirements to address any additional capital needs and requirements identified by the federal banking regulators.
MS&Co. and Other Broker-Dealers. MS&Co. is a registered broker-dealer and registered futures commission merchant and, accordingly, is subject to the minimum net capital requirements of the SEC, the Financial Industry Regulatory Authority and the Commodity Futures Trading Commission. MS&Co. has consistently operated with capital in excess of its regulatory capital requirements. MS&Co.'s net capital totaled $7,854 million and $9,216 million as of December 31, 2009 and December 31, 2008, respectively, which exceeded the amount required by $6,758 million and $8,366 million, respectively. Morgan Stanley Smith Barney LLC is a registered broker-dealer and registered futures commission merchant, introducing business to MS&Co. and Citi, and has operated with capital in excess of its regulatory capital requirements. MSIP, a London-based broker-dealer subsidiary, is subject to the capital requirements of the Financial Services Authority, and MSJS, a Tokyo-based broker-dealer subsidiary, is subject to the capital requirements of the Financial Services Agency. MSIP and MSJS have consistently operated in excess of their respective regulatory capital requirements.
MS&Co. is required to hold tentative net capital in excess of $1 billion and net capital in excess of $500 million in accordance with the market and credit risk standards of Appendix E of Rule 15c3-1. MS&Co. is also required to notify the SEC in the event that its tentative net capital is less than $5 billion. As of December 31, 2009, MS&Co. had tentative net capital in excess of the minimum and the notification requirements.
Other Regulated Subsidiaries. Certain other U.S. and non-U.S. subsidiaries are subject to various securities, commodities and banking regulations, and capital adequacy requirements promulgated by the regulatory and exchange authorities of the countries in which they operate. These subsidiaries have consistently operated in excess of their local capital adequacy requirements.
| 189 | |
MORGAN STANLEY
NOTES TO CONSOLIDATED FINANCIAL STATEMENTS-(Continued)
Morgan Stanley Derivative Products Inc. ("MSDP"), a derivative products subsidiary rated Aa2 by Moody's Investors Service, Inc. ("Moody's") and AAA by Standard & Poor's Ratings Services, a Division of the McGraw-Hill Companies Inc. ("S&P") , maintains certain operating restrictions that have been reviewed by Moody's and S&P. On December 21, 2009, MSDP was downgraded from a triple-A rating to Aa2 rating by Moody's but maintained its AAA rating by S&P. The downgrade did not significantly impact the Company's results of operations or financial condition. MSDP is operated such that creditors of the Company should not expect to have any claims on the assets of MSDP, unless and until the obligations to its own creditors are satisfied in full. Creditors of MSDP should not expect to have any claims on the assets of the Company or any of its affiliates, other than the respective assets of MSDP.
The regulatory capital requirements referred to above, and certain covenants contained in various agreements governing indebtedness of the Company, may restrict the Company's ability to withdraw capital from its subsidiaries. As of December 31, 2009 and December 31, 2008, approximately $14.7 billion and $13.6 billion, respectively, of net assets of consolidated subsidiaries may be restricted as to the payment of cash dividends and advances to the parent company.
13. Total Equity.
Morgan Stanley Shareholders' Equity.
Common Stock. Changes in shares of common stock outstanding for 2009, fiscal 2008 and the one month ended December 31, 2008 were as follows (share data in millions):
| 2009 | Fiscal 2008 | One Month Ended December 31, 2008 | ||||||
Shares outstanding at beginning of period | 1,074 | 1,056 | 1,048 | |||||
Public offerings of common stock | 276 | - | - | |||||
Net impact of stock option exercises and other share issuances | 13 | 57 | 26 | |||||
Treasury stock purchases(1) | (2 | ) | (65 | ) | - | |||
Shares outstanding at end of period | 1,361 | 1,048 | 1,074 | |||||
| (1) | Treasury stock purchases includes repurchases of common stock for employee tax withholding. |
Treasury Shares. In December 2006, the Company announced that its Board of Directors had authorized the repurchase of up to $6 billion of the Company's outstanding common stock. The share repurchase program considers, among other things, business segment capital needs, as well as equity-based compensation and benefit plan requirements. During 2009 and the one month ended December 31, 2008, the Company did not purchase any of its common stock as part of its share repurchase program. During fiscal 2008, the Company repurchased $711 million of the common stock as part of the share repurchase program at an average cost of $18.14 per share. As of December 31, 2009, the Company had approximately $1.6 billion remaining under its current share repurchase authorization. Share repurchases by the Company are subject to regulatory approval.
CIC Investment. In December 2007, the Company sold Equity Units that included contracts to purchase Company common stock (see "Stock Purchase Contracts" herein) to a wholly owned subsidiary of CIC for approximately $5,579 million. As a result of the transaction with Mitsubishi UFJ Financial Group, Inc. ("MUFG") described under "Stock Purchase Contracts" below, upon settlement of the Equity Units, CIC will be entitled to receive 116,062,911 shares of the Company's common stock, subject to anti-dilution adjustments. In
| | 190 |
MORGAN STANLEY
NOTES TO CONSOLIDATED FINANCIAL STATEMENTS-(Continued)
June 2009, to maintain its pro rata share in the Company's share capital, CIC participated in the Company's registered public offering of 85,890,277 shares by purchasing 45,290,576 shares of the Company's common stock. CIC is a passive financial investor and has no special rights of ownership nor a role in the management of the Company. A substantial portion of the investment proceeds from the offering of the Equity Units was treated as Tier 1 capital for regulatory capital purposes.
As described below, the Equity Units consist of interests in trust preferred securities issued by Morgan Stanley Capital Trust A ("Series A Trust"), Morgan Stanley Capital Trust B ("Series B Trust") or Morgan Stanley Capital Trust C ("Series C Trust") (each a "Morgan Stanley Capital Trust" and, collectively, the "Trusts") and stock purchase contracts issued by the Company. The only assets held by the Trusts are junior subordinated debentures issued by the parent company.
Equity Units.
Each Equity Unit has a stated amount of $1,000 per unit consisting of:
| (i) | an undivided beneficial ownership interest in a trust preferred security of Series A Trust, Series B Trust or Series C Trust with an initial liquidation amount of $1,000; and |
| (ii) | a stock purchase contract relating to the common stock, par value of $0.01 per share, of the Company. |
Junior Subordinated Debentures Issued to Support Trust Common and Trust Preferred Securities.
In the first quarter of fiscal 2008, the Company issued junior subordinated debt securities due no later than February 17, 2042 for a total of $5,579,173,000 in exchange for $5,579,143,000 in aggregate proceeds from the sale of the trust preferred securities by the Trusts and $30,000 in trust common securities issued equally by the Trusts. The Company elected to fair value the junior subordinated debentures pursuant to the fair value option accounting guidance. The common and trust preferred securities of the Trusts, totaling approximately $5,579 million, represent undivided beneficial ownership interests in the assets of the Trusts, have no stated maturity and must be redeemed upon the redemption or maturity of the corresponding series of junior subordinated debt securities-the sole assets of the respective Trusts. The Trusts will make quarterly distributions on the trust common and trust preferred securities at an annual rate of 6%.
The trust common securities, which are held by the Company, represent an interest in the Trusts and are recorded as an equity method investment in the Company's consolidated statement of financial condition. The Trusts are VIEs in accordance with current accounting guidance, and the Company does not consolidate its interests in the Trusts as it is not the primary beneficiary of any of the Trusts.
The Company has directly guaranteed the repayment of the trust preferred securities to the holders thereof to the extent that there are funds available in the Trusts. If the Company does not make payments on the junior subordinated debentures owned by a Morgan Stanley Capital Trust, such Morgan Stanley Capital Trust will not be able to pay any amounts payable in respect of the trust preferred securities issued by it and will not have funds legally available for that purpose. In that event, holders of such series of trust preferred securities would not be able to rely upon the guarantee for payment of those amounts. The guarantee will remain in place until the redemption price of all of the trust preferred securities is paid, the amounts payable with respect to the trust preferred securities upon liquidation of the Morgan Stanley Capital Trusts are paid or the junior subordinated debentures are distributed to the holders of all the trust preferred securities. The trust preferred securities held by the Equity Unit holders are pledged to the Company to collateralize the obligations of the Equity Unit holders under the related stock purchase contracts. The Equity Unit holders may substitute certain zero-coupon treasury securities in place of the trust preferred securities as collateral under the stock purchase contracts.
| 191 | |
MORGAN STANLEY
NOTES TO CONSOLIDATED FINANCIAL STATEMENTS-(Continued)
Stock Purchase Contracts.
Each stock purchase contract requires the holder to purchase, and the Company to sell, on the stock purchase date a number of newly issued or treasury shares of the Company's common stock, par value $0.01 per share, equal to the settlement rate.
On October 13, 2008, the Company sold to MUFG certain preferred stock for an aggregate purchase price of $9 billion (see below for further discussion). As a result of this transaction, and as contractually required by the terms of the securities purchase agreement for the sale of Equity Units to CIC, the threshold appreciation price of $57.6840 was reduced to the reference price of $48.07. As a result, the Company will issue 116,062,911 shares of common stock (subject to adjustment for certain anti-dilution provisions and participation in certain dividends as described below) upon settlement of the stock purchase contracts on August 17, 2010.
The initial quarterly distributions on the Series A, Series B and Series C trust preferred securities of 6%, combined with the contract adjustment payments on the stock purchase contracts of 3%, result in a 9% yield on the Equity Units. If the Company defers any of the contract adjustment payments on the stock purchase contracts, then it will accrue additional amounts on the deferred amounts at the annual rate of 9% until paid, to the extent permitted by law.
The present value of the future contract adjustment payments due under the stock purchase contracts was approximately $400 million and was recorded in Other liabilities and accrued expenses with a corresponding decrease recorded in Paid-in capital, a component of Morgan Stanley shareholders' equity in the Company's consolidated statement of financial condition in the first quarter of fiscal 2008. The other liability balance related to the stock purchase contracts accretes over the term of the stock purchase contract using the effective yield method with a corresponding charge to Interest expense. When the contract adjustment payments are made under the stock purchase contracts, they will reduce the other liability balance.
Earnings per Share.
Prior to October 13, 2008, the impact of the Equity Units was reflected in the Company's earnings per diluted common share using the treasury stock method. Under the treasury stock method, the number of shares of common stock included in the calculation of earnings per diluted common share was calculated as the excess, if any, of the number of shares expected to be issued upon settlement of the stock purchase contract based on the average market price for the last 20 days of the reporting period, less the number of shares that could be purchased by the Company with the proceeds to be received upon settlement of the contract at the average closing price for the reporting period.
Dilution of net income per share occurred (i) in reporting periods when the average closing price of common shares was over $57.6840 per share or (ii) in reporting periods when the average closing price of common shares for a reporting period was between $48.0700 and $57.6840 and was greater than the average market price for the last 20 days ending three days prior to the end of such reporting period.
Effective October 13, 2008, as a result of the adjustment to the Equity Units as described above, the Equity Units are deemed to be "participating securities" in that the Equity Units have the ability to participate in any dividends the Company declares on common shares above $0.27 per share during any quarterly reporting period via an increase in the number of common shares to be delivered upon settlement of the stock purchase contracts. The Equity Units are reflected, prospectively from October 13, 2008, in the Company's earnings per share calculation using the two-class method. During 2009, the one month ended December 31, 2008 and fiscal 2008, no dividends above $0.27 per share were declared during any quarterly reporting period.
The Equity Units do not share in any losses of the Company for purposes of calculating EPS. Therefore, if the Company incurs a loss in any reporting period, losses will not be allocated to the Equity Units in the EPS calculation.
| | 192 |
MORGAN STANLEY
NOTES TO CONSOLIDATED FINANCIAL STATEMENTS-(Continued)
See Note 2 for further discussion on the two-class method and Note 14 for the dilutive impact for 2009, fiscal 2008 and the one month ended December 31, 2008.
Common Equity Offerings. During 2009, the Company issued common stock for approximately $6.9 billion in two registered public offerings. MUFG elected to participate in both offerings, and in one of the offerings, MUFG received $0.7 billion of common stock in exchange for 640,909 shares of the Company's Series C Non-Cumulative Non-Voting Perpetual Preferred Stock ("Series C Preferred Stock").
Rabbi Trusts. The Company has established rabbi trusts (the "Rabbi Trusts") to provide common stock voting rights to certain employees who hold outstanding restricted stock units. The assets of the Rabbi Trusts are consolidated with those of the Company, and the value of the Company's stock held in the Rabbi Trusts is classified in Morgan Stanley shareholders' equity and generally accounted for in a manner similar to treasury stock.
Preferred Stock and Warrant .
The Company's preferred stock outstanding consisted of the following:
Series | Dividend Rate (Annual) | Shares Outstanding at December 31, 2009 | Liquidation Preference per Share | Convertible to Morgan Stanley Shares | Carrying Value | |||||||||||
| At December 31, 2009 | At December 31, 2008 | |||||||||||||||
| (dollars in millions) | ||||||||||||||||
A | N/A | 44,000 | $ | 25,000 | - | $ | 1,100 | $ | 1,100 | |||||||
B | 10.00 | % | 7,839,209 | 1,000 | 310,464,033 | 8,089 | 8,089 | |||||||||
C | 10.00 | %(1) | 519,882 | 1,000 | - | 408 | 911 | |||||||||
D | 5.00 | % | - | - | - | - | 9,068 | |||||||||
Total | $ | 9,597 | $ | 19,168 | ||||||||||||
| (1) | During 2009, 640,909 shares were redeemed with an aggregate price equal to the aggregate price exchanged by MUFG for approximately $0.7 billion of common stock resulting in a negative adjustment of approximately $202 million in calculating earnings per basic and diluted share (see Note 14). |
Series A Preferred Stock. In July 2006, the Company issued 44,000,000 Depositary Shares, in an aggregate of $1,100 million. Each Depositary Share represents 1/1,000th of a Share of Floating Rate Non-Cumulative Preferred Stock, Series A, $0.01 par value ("Series A Preferred Stock"). The Series A Preferred Stock is redeemable at the Company's option, in whole or in part, on or after July 15, 2011 at a redemption price of $25,000 per share (equivalent to $25 per Depositary Share). The Series A Preferred Stock also has a preference over the Company's common stock upon liquidation. Subsequent to December 31, 2009, the Company declared a quarterly dividend of $255.56 per share of Series A Preferred Stock that was paid on January 15, 2010 to preferred shareholders of record on December 31, 2009.
Series B and Series C Preferred Stock. On October 13, 2008, the Company issued to MUFG 7,839,209 shares of Series B Non-Cumulative Non-Voting Perpetual Convertible Preferred Stock ("Series B Preferred Stock") and 1,160,791 shares of Series C Preferred Stock for an aggregate purchase price of $9 billion. The Series B Preferred Stock is convertible at MUFG's option (at a conversion price of $25.25) into 310,464,033 shares of the Company's common shares, subject to certain anti-dilution adjustments. Subject to any applicable New York Stock Exchange stockholder approval requirements, one-half of the Series B Preferred Stock will mandatorily convert into the Company's common shares when, at any time on or after October 13, 2009, the market price of
| 193 | |
MORGAN STANLEY
NOTES TO CONSOLIDATED FINANCIAL STATEMENTS-(Continued)
the Company's common shares exceeds 150% of the then-applicable conversion price (initially $25.25) for twenty trading days within any period of thirty consecutive trading days beginning after October 13, 2009 (subject to certain ownership limits on MUFG and its affiliates). The remainder of the Series B Preferred Stock will mandatorily convert on the same basis on or after October 13, 2010.
The Series B Preferred Stock pays a non-cumulative dividend, as and if declared by the Board of Directors of the Company, in cash, at the rate of 10% per annum of the liquidation preference of $1,000 per share, except under certain circumstances (as set forth in the securities purchase agreement for the sale of the Series B Preferred Stock and the Series C Preferred Stock to MUFG). Subsequent to December 31, 2009, the Company declared a quarterly dividend of $25.00 per share of Series B Preferred Stock that was paid on January 15, 2010 to preferred shareholders of record on December 31, 2009.
The Series C Preferred Stock is redeemable by the Company, in whole or in part, on or after October 15, 2011 at a redemption price of $1,100 per share. Dividends on the Series C Preferred Stock are payable, on a non-cumulative basis, as and if declared by the Board of Directors of the Company, in cash, at the rate of 10% per annum of the liquidation preference of $1,000 per share. Subsequent to December 31, 2009, the Company declared a quarterly dividend of $25.00 per share of Series C Preferred Stock that was paid on January 15, 2010 to preferred shareholders of record on December 31, 2009.
The $9 billion in proceeds was allocated to the Series B Preferred Stock and the Series C Preferred Stock based on their relative fair values at issuance (approximately $8.1 billion was allocated to the Series B Preferred Stock and approximately $0.9 billion to the Series C Preferred Stock). Upon redemption by the Company, the excess of the redemption value of $1,100 per share over the carrying value of the Series C Preferred Stock ($0.9 billion allocated at inception or approximately $784 per share) will be charged to Retained earnings ( i.e., treated in a manner similar to the treatment of dividends paid). The amount charged to Retained earnings will be deducted from the numerator in calculating basic and diluted earnings per share during the related reporting period in which the Series C Preferred Stock is redeemed by the Company (See Note 14 for additional details).
Series D Preferred Stock and Warrant. On October 3, 2008, the Emergency Economic Stabilization Act of 2008 (initially introduced as TARP) was enacted. On October 14, 2008, the U.S. Treasury announced its intention to inject capital into nine large U.S. financial institutions, including the Company, under the Capital Purchase Program ("CPP"). The Company was part of the initial group of financial institutions participating in the CPP, and on October 26, 2008 entered into a Securities Purchase Agreement-Standard Terms with the U.S. Treasury pursuant to which, among other things, the Company sold to the U.S. Treasury for an aggregate purchase price of $10 billion, 10 million shares of Series D Fixed Rate Cumulative Perpetual Preferred Stock, par value $0.01 per share, of the Company ("Series D Preferred Stock") and warrant to purchase 65,245,759 shares of the Company's common stock, par value $0.01 per share (the "Warrant"), of the Company.
The $10 billion in proceeds was allocated to the Series D Preferred Stock and the Warrant based on their relative fair values at issuance (approximately $9 billion was allocated to the Series D Preferred Stock and approximately $1 billion to the Warrant). The difference between the initial value allocated to the Series D Preferred Stock of approximately $9 billion and the liquidation value of $10 billion was to be charged to Retained earnings over the first five years of the contract as an adjustment to the dividend yield using the effective yield method. The amount charged to Retained earnings was deducted from the numerator in calculating basic and diluted earnings per share during the related reporting period (see Note 14).
In June 2009, the Company repurchased the 10,000,000 shares of the Series D Preferred Stock from the U.S. Treasury, at the liquidation preference amount plus accrued and unpaid dividends, for an aggregate repurchase price of $10,086 million.
| | 194 |
MORGAN STANLEY
NOTES TO CONSOLIDATED FINANCIAL STATEMENTS-(Continued)
As a result of the Company's repurchase of the Series D Preferred Stock, the Company incurred a negative adjustment of $850 million in its calculation of basic and diluted EPS (reduction to earnings (losses) applicable to the Company's common shareholders) for 2009 due to the accelerated amortization of the issuance discount on the Series D Preferred Stock.
In August 2009, under the terms of the CPP securities purchase agreement, the Company repurchased the Warrant from the U.S. Treasury in the amount of $950 million. The repurchase of the Series D Preferred Stock, in the amount of $10.0 billion and the Warrant in the amount of $950 million, reduced the Company's total equity by $10,950 million in 2009.
The Company's preferred stock qualifies as Tier 1 capital in accordance with regulatory capital requirements (see Note 12).
Accumulated Other Comprehensive Loss. As of December 31, 2009 and December 31, 2008, the components of the Company's Accumulated other comprehensive loss are as follows (dollars in millions):
| At December 31, 2009 | At December 31, 2008 | |||||||
Foreign currency translation adjustments, net of tax | $ | (26 | ) | $ | (142 | ) | ||
Amortization expense related to terminated cash flow hedges, net of tax | (27 | ) | (40 | ) | ||||
Pension adjustment, net of tax | (507 | ) | (238 | ) | ||||
Accumulated other comprehensive loss, net of tax | $ | (560 | ) | $ | (420 | ) | ||
Cumulative Foreign Currency Translation Adjustments. Cumulative foreign currency translation adjustments include gains or losses resulting from translating foreign currency financial statements from their respective functional currencies to U.S. dollars, net of hedge gains or losses and related tax effects. The Company uses foreign currency contracts and designates certain non-U.S. dollar currency debt as hedges to manage the currency exposure relating to its net monetary investments in non-U.S. dollar functional currency subsidiaries. Increases or decreases in the value of the Company's net foreign investments generally are tax deferred for U.S. purposes, but the related hedge gains and losses are taxable currently. The Company attempts to protect its net book value from the effects of fluctuations in currency exchange rates on its net monetary investments in non-U.S. dollar subsidiaries by selling the appropriate non-U.S. dollar currency in the forward market. Under some circumstances, however, the Company may elect not to hedge its net monetary investments in certain foreign operations due to market conditions, including the availability of various currency contracts at acceptable costs. Information as of December 31, 2009 and December 31, 2008 relating to the hedging of the Company's net monetary investments in non-U.S. dollar functional currency subsidiaries and their effects on cumulative foreign currency translation adjustments is summarized below:
| At December 31, 2009 | At December 31, 2008 | |||||||
| (dollars in millions) | ||||||||
Net monetary investments in non-U.S. dollar functional currency subsidiaries | $ | 9,325 | $ | 7,903 | ||||
Cumulative foreign currency translation adjustments resulting from net investments in subsidiaries with a non-U.S. dollar functional currency | $ | 254 | $ | (339 | ) | |||
Cumulative foreign currency translation adjustments resulting from realized or unrealized losses on hedges, net of tax | (280 | ) | 197 | |||||
Total cumulative foreign currency translation adjustments, net of tax | $ | (26 | ) | $ | (142 | ) | ||
| 195 | |
MORGAN STANLEY
NOTES TO CONSOLIDATED FINANCIAL STATEMENTS-(Continued)
Non-controlling Interests.
Deconsolidation of Subsidiaries.
During 2009, the Company deconsolidated MSCI in connection with the Company's disposition of its remaining ownership interest in MSCI and recognized an after-tax gain of approximately $279 million. The Company did not retain any investments in MSCI upon deconsolidation. See Note 23 for further information on discontinued operations.
During fiscal 2008, the Company deconsolidated certain subsidiaries and recognized gains of approximately $70 million, included in Other revenues on the consolidated statements of income.
Changes in the Company's Ownership Interest in Subsidiaries.
The following table presents the effect on the Company's shareholders' equity from changes in ownership of subsidiaries resulting from transactions with non-controlling interests.
| 2009 | |||
| (dollars in millions) | |||
Net income applicable to Morgan Stanley | $ | 1,346 | |
Transfers from non-controlling interests: | |||
Increase in paid-in capital in connection with MSSB | 1,711 | ||
Net transfers from non-controlling interests | 1,711 | ||
Change from net income attributable to Morgan Stanley and transfers from non-controlling interests | $ | 3,057 | |
The increase in paid-in capital results from Citi's equity interest in MSSB, to which the Company had contributed certain businesses associated with the Company's Global Wealth Management Group. The excess of the preliminary net fair value received by the Company over the increase in non-controlling interest associated with Smith Barney is reflected as an increase in paid-in capital. See Note 3 for further information regarding the MSSB transaction.
The impact on the Company's shareholders' equity from transactions with non-controlling interests was not material for fiscal 2008, fiscal 2007 and the one month ended December 31, 2008.
During fiscal 2008, the Company recorded pre-tax gains of approximately $1.5 billion, in connection with sales of its shares in MSCI as part of secondary offerings. Such gains are included in discontinued operations (see Note 23). During fiscal 2007, the Company recorded $239 million as an addition to paid-in capital associated with the initial public offering ("IPO") of MSCI.
| | 196 |
MORGAN STANLEY
NOTES TO CONSOLIDATED FINANCIAL STATEMENTS-(Continued)
14. Earnings per Common Share.
Basic EPS is computed by dividing income available to Morgan Stanley common shareholders by the weighted average number of common shares outstanding for the period. Common shares outstanding include common stock and vested restricted stock unit awards where recipients have satisfied either the explicit vesting terms or retirement eligibility requirements. Diluted EPS reflects the assumed conversion of all dilutive securities. The Company calculates EPS using the two-class method (see Note 2) and determines whether instruments granted in share-based payment transactions are participating securities. The following table presents the calculation of basic and diluted EPS (in millions, except for per share data):
| 2009 | Fiscal 2008 | Fiscal 2007 | One Month Ended December 31, 2008 | |||||||||||||
Basic EPS: | ||||||||||||||||
Income (loss) from continuing operations | $ | 1,193 | $ | 1,158 | $ | 2,200 | $ | (1,295 | ) | |||||||
Net gain on discontinued operations | 213 | 620 | 1,049 | 10 | ||||||||||||
Net income (loss) | 1,406 | 1,778 | 3,249 | (1,285 | ) | |||||||||||
Net income applicable to non-controlling interests | 60 | 71 | 40 | 3 | ||||||||||||
Net income (loss) applicable to Morgan Stanley | 1,346 | 1,707 | 3,209 | (1,288 | ) | |||||||||||
Less: Preferred dividends (Series A Preferred Stock) | (45 | ) | (53 | ) | (68 | ) | (15 | ) | ||||||||
Less: Preferred dividends (Series B Preferred Stock) | (784 | ) | - | - | (200 | ) | ||||||||||
Less: Preferred dividends (Series C Preferred Stock) | (68 | ) | - | - | (30 | ) | ||||||||||
Less: Partial Redemption of Series C Preferred Stock | (202 | ) | - | - | - | |||||||||||
Less: Preferred dividends (Series D Preferred Stock) | (212 | ) | (44 | ) | - | (63 | ) | |||||||||
Less: Amortization and acceleration of issuance discount for Series D Preferred Stock (see Note 13) | (932 | ) | (15 | ) | - | (13 | ) | |||||||||
Less: Allocation of earnings to unvested restricted stock units(1) | (10 | ) | (94 | ) | (165 | ) | (15 | ) | ||||||||
Less: Allocation of undistributed earnings to Equity Units | - | (6 | ) | - | - | |||||||||||
Net (loss) income applicable to Morgan Stanley common shareholders | $ | (907 | ) | $ | 1,495 | $ | 2,976 | $ | (1,624 | ) | ||||||
Weighted average common shares outstanding | 1,185 | 1,028 | 1,002 | 1,002 | ||||||||||||
(Loss) earnings per basic common share: | ||||||||||||||||
Income (loss) from continuing operations | $ | (0.93 | ) | $ | 0.92 | $ | 1.98 | $ | (1.63 | ) | ||||||
Net gain on discontinued operations | 0.16 | 0.53 | 0.99 | 0.01 | ||||||||||||
(Loss) earnings per basic common share | $ | (0.77 | ) | $ | 1.45 | $ | 2.97 | $ | (1.62 | ) | ||||||
Diluted EPS: | ||||||||||||||||
(Loss) earnings applicable to Morgan Stanley common shareholders | $ | (907 | ) | $ | 1,495 | $ | 2,976 | $ | (1,624 | ) | ||||||
Weighted average common shares outstanding | 1,185 | 1,028 | 1,002 | 1,002 | ||||||||||||
Effect of dilutive securities: | ||||||||||||||||
Stock options and restricted stock units(1) | - | 3 | 23 | - | ||||||||||||
Series B Preferred Stock | - | 42 | - | - | ||||||||||||
Weighted average common shares outstanding and common stock equivalents | 1,185 | 1,073 | 1,025 | 1,002 | ||||||||||||
(Loss) earnings per diluted common share: | ||||||||||||||||
(Loss) income from continuing operations | $ | (0.93 | ) | $ | 0.88 | $ | 1.94 | $ | (1.63 | ) | ||||||
Net gain on discontinued operations | 0.16 | 0.51 | 0.96 | 0.01 | ||||||||||||
(Loss) earnings per diluted common share | $ | (0.77 | ) | $ | 1.39 | $ | 2.90 | $ | (1.62 | ) | ||||||
| (1) | Restricted stock units that are considered participating securities participate in all of the earnings of the Company in the computation of basic EPS, and therefore, such restricted stock units are not included as incremental shares in the diluted calculation. |
| 197 | |
MORGAN STANLEY
NOTES TO CONSOLIDATED FINANCIAL STATEMENTS-(Continued)
The following securities were considered antidilutive and, therefore, were excluded from the computation of diluted EPS:
Number of Antidilutive Securities Outstanding at End of Period: | 2009 | Fiscal 2008 | Fiscal 2007 | One Month Ended December 31, 2008 | ||||
| (shares in millions) | ||||||||
Restricted stock units | 62 | 50 | 59 | 72 | ||||
Stock options | 82 | 81 | 19 | 99 | ||||
Equity Units(1) | 116 | 116 | - | 116 | ||||
CPP Warrant | - | 65 | - | 65 | ||||
Series B Preferred Stock | 311 | - | - | 311 | ||||
Total | 571 | 312 | 78 | 663 | ||||
| (1) | The Equity Units participate in substantially all of the earnings of the Company ( i.e. , any earnings above $0.27 per quarter) in basic EPS (assuming a full distribution of earnings of the Company), and therefore, the Equity Units generally would not be included as incremental shares in the diluted calculation. |
15. Interest and Dividends and Interest Expense.
Details of Interest and dividends revenue and Interest expense were as follows (in millions):
| 2009 | Fiscal 2008 | One Month Ended December 31, 2008 | ||||||||
Interest and dividends(1): | ||||||||||
Financial instruments owned(2) | $ | 5,155 | $ | 9,961 | $ | 603 | ||||
Receivables from other loans | 229 | 784 | 15 | |||||||
Interest bearing deposits with banks(3) | 241 | - | 19 | |||||||
Federal funds sold and securities purchased under agreements to resell and securities borrowed(3) | 859 | - | 380 | |||||||
Other(3) | 1,218 | 28,934 | 280 | |||||||
Total Interest and dividends revenue | $ | 7,702 | $ | 39,679 | $ | 1,297 | ||||
Interest expense(1): | ||||||||||
Commercial paper and other short-term borrowings | $ | 51 | $ | 663 | $ | 33 | ||||
Deposits | 782 | 740 | 53 | |||||||
Long-term debt | 4,898 | 7,793 | 579 | |||||||
Securities sold under agreements to repurchase and securities loaned(3) | 1,374 | - | 355 | |||||||
Other(3) | (393 | ) | 27,116 | 104 | ||||||
Total Interest expense | $ | 6,712 | $ | 36,312 | $ | 1,124 | ||||
Net Interest and dividends revenue | $ | 990 | $ | 3,367 | $ | 173 | ||||
| (1) | Interest income and expense and dividend income are recorded within the consolidated statements of income depending on the nature of the instrument and related market conventions. When interest and dividends are included as a component of the instrument's fair value, interest and dividends are included within Principal transactions-trading revenues or Principal transactions-investment revenues. Otherwise, they are included within Interest and dividends income or Interest expense. |
| (2) | Interest expense on Financial instruments sold, not yet purchased is reported as a reduction to Interest and dividends revenues. |
| (3) | The Company considers its principal trading, investment banking, commissions, and interest and dividend income, along with the associated interest expense, as one integrated activity for each of the Company's separate businesses, and therefore, prior to December 2008, was unable to further breakout Interest and dividends and Interest expense (see Note 1). |
| | 198 |
MORGAN STANLEY
NOTES TO CONSOLIDATED FINANCIAL STATEMENTS-(Continued)
16. Sale of Bankruptcy Claims Related to a Derivative Counterparty.
During 2009, the Company entered into multiple participation agreements with certain investors whereby the Company sold undivided participating interests representing 81% (or $1,105 million) of its claims totaling $1,362 million, pursuant to International Swaps and Derivatives Association ("ISDA") master agreements, against a derivative counterparty that filed for bankruptcy protection. The Company received cash proceeds of $429 million and recorded a gain on sale of $319 million in 2009. The gain is reflected in the consolidated statement of income in Principal transactions-trading revenues within the Institutional Securities business segment.
As a result of the bankruptcy of the derivative counterparty, the Company, as contractually entitled, exercised remedies as the non-defaulting party and determined the value of the claims under the ISDA master agreements in a commercially reasonable manner. The Company filed its claims with the bankruptcy court. In connection with the sale of the undivided participating interests in a portion of the claims, the Company provided certain representations and warranties related to the allowance of the amount stated in the claims submitted to the bankruptcy court. The bankruptcy court will be evaluating all of the claims filed against the derivative counterparty. To the extent, in the future, any portion of the stated claims is disallowed or reduced by the bankruptcy court in excess of a certain amount, then the Company must refund a portion of the purchase price plus interest from the date of the participation agreements to the repayment date. The maximum amount that the Company could be required to refund is the total proceeds of $429 million plus interest. The Company recorded a liability for the fair value of this possible disallowance. The fair value was determined by assessing mid-market values of the underlying transactions, where possible, prevailing bid-offer spreads around the time of the bankruptcy filing, and applying valuation adjustments related to estimating unwind costs. The investors, however, bear full price risk associated with the allowed claims as it relates to the liquidation proceeds from the bankruptcy estate. The Company also agreed to service the claims and, as such, recorded a liability for the fair value of the servicing obligation. The Company will continue to measure these obligations at fair value with changes in fair value recorded in earnings. These obligations are reflected in the consolidated statement of financial condition as Financial instruments sold, not yet purchased-derivatives and other contracts, in Note 4 as Level 3 instruments, and in Note 10 as Derivatives not designated as accounting hedges. The disallowance obligation is also reflected in Note 11 in the guarantees table.
17. Other Revenues.
Details of Other revenues were as follows:
| 2009 | Fiscal 2008 | One Month Ended December 31, 2008 | |||||||
| (dollars in millions) | |||||||||
Repurchase of long-term debt (see Note 9) | $ | 491 | $ | 2,252 | $ | 73 | |||
Morgan Stanley Wealth Management S.V., S.A.U(1) | - | 743 | - | ||||||
Other | 347 | 857 | 34 | ||||||
Total | $ | 838 | $ | 3,852 | $ | 107 | |||
| (1) | In the second quarter of fiscal 2008, the Company sold Morgan Stanley Wealth Management S.V., S.A.U. ("MSWM S.V."), its Spanish onshore mass affluent wealth management business. The Company recognized a pre-tax gain of approximately $687 million, net of transaction-related charges of approximately $50 million. The results of MSWM S.V. are included within the Global Wealth Management Group business segment through the date of sale. |
| 199 | |
MORGAN STANLEY
NOTES TO CONSOLIDATED FINANCIAL STATEMENTS-(Continued)
18. Employee Stock-Based Compensation Plans.
The accounting guidance for stock-based compensation requires measurement of compensation cost for equity-based awards at fair value and recognition of compensation cost over the service period, net of estimated forfeitures (see Note 2).
The components of the Company's stock-based compensation expense (net of cancellations) are presented below:
| 2009 | Fiscal 2008 | Fiscal 2007 | One Month Ended December 31, 2008 | |||||||||
| (dollars in millions) | ||||||||||||
Deferred stock | $ | 1,120 | $ | 1,659 | $ | 1,580 | $ | 66 | ||||
Stock options | 17 | 83 | 240 | 5 | ||||||||
Employee Stock Purchase Plan(1) | 4 | 10 | 9 | - | ||||||||
Total(2) | $ | 1,141 | $ | 1,752 | $ | 1,829 | $ | 71 | ||||
| (1) | The Company discontinued the Employee Stock Purchase Plan effective June 1, 2009. |
| (2) | Amounts for 2009 include $198 million primarily related to equity awards that were granted in 2010 to employees who are retirement-eligible under the award terms. Amounts for fiscal 2008 and fiscal 2007 include $90 million and $345 million of accrued stock-based compensation expense primarily related to year-end equity awards granted in December 2008 and December 2007, respectively, to employees who are retirement-eligible under the award terms. Amounts for the one month ended December 31, 2008 include $2 million primarily related to equity awards that were granted in 2010 to employees who are retirement-eligible under the award terms. |
The table above excludes stock-based compensation expense recorded in discontinued operations, which was approximately $11 million, $40 million, $30 million and $2 million for 2009, fiscal 2008, fiscal 2007 and the one month ended December 31, 2008, respectively. See Note 23 for additional information on discontinued operations.
The tax benefit for stock-based compensation expense related to deferred stock and stock options was $380 million, $557 million, $716 million and $23 million for 2009, fiscal 2008, fiscal 2007 and the one month ended December 31, 2008, respectively. The tax benefit for stock-based compensation expense included in discontinued operations in 2009, fiscal 2008, fiscal 2007 and the one month ended December 31, 2008 was approximately $3 million, $15 million, $12 million, and $1 million, respectively.
As of December 31, 2009 and December 31, 2008, the Company had approximately $762 million and $1,689 million, respectively, of unrecognized compensation cost related to unvested stock-based awards (excluding 2009 year-end awards granted in January 2010 to nonretirement-eligible employees, which will begin to be amortized in 2010). The unrecognized compensation cost relating to unvested stock-based awards expected to vest will primarily be recognized over the next two years.
In connection with awards under its equity-based compensation plans, the Company is authorized to issue shares of its common stock held in treasury or newly issued shares. As of December 31, 2009 and December 31, 2008, approximately 107 million and 82 million shares, respectively, were available for future grant under these plans.
The Company generally uses treasury shares to deliver shares to employees and has an ongoing repurchase authorization that includes repurchases in connection with awards granted under its equity-based compensation plans. Share repurchases by the Company are subject to regulatory approval. See Note 13 for additional information on the Company's share repurchase program.
| | 200 |
MORGAN STANLEY
NOTES TO CONSOLIDATED FINANCIAL STATEMENTS-(Continued)
As a result of the DFS Spin-off effective June 30, 2007, all outstanding options to purchase the Company's common stock held by employees of DFS were canceled and replaced with options to purchase DFS common stock. Outstanding options to purchase Morgan Stanley common stock held by directors and employees who remained with the Company after the DFS Spin-off were adjusted to preserve the intrinsic value of the awards immediately prior to the spin-off using an adjustment ratio based on the Morgan Stanley closing market stock price immediately prior to the spin-off date and the beginning market stock price at the date of the spin-off. Additional compensation cost recognized as a result of this modification was not material.
Similarly, restricted stock units awarded pursuant to equity incentive plans and held by employees of DFS were canceled and replaced with restricted units of DFS stock. Outstanding restricted stock units held by Morgan Stanley directors and employees who remained with the Company after the DFS Spin-off were adjusted by multiplying the number of shares by an adjustment ratio in order to account for the impact of the spin-off on the value of the Company's shares at the time the spin-off was completed. No additional compensation cost was recognized as a result of this modification. Cash paid to the holders of deferred shares in lieu of fractional shares was not material.
Deferred Stock Awards. The Company has made deferred stock awards pursuant to several equity-based compensation plans. The plans provide for the deferral of a portion of certain key employees' discretionary compensation with awards made in the form of restricted common stock or in the right to receive unrestricted shares of common stock in the future ("restricted stock units"). Awards under these plans are generally subject to vesting over time contingent upon continued employment and to restrictions on sale, transfer or assignment until the end of a specified period, generally two to three years from date of grant. All or a portion of an award may be canceled if employment is terminated before the end of the relevant restriction period. All or a portion of a vested award also may be canceled in certain limited situations, including termination for cause during the relevant restriction period. Recipients of deferred stock awards generally have voting rights and receive dividend equivalents.
The following table sets forth activity relating to the Company's vested and unvested restricted stock units (share data in millions):
| 2009 | One Month Ended December 31, 2008 | |||||||||||
| Number of Shares | Weighted Average Grant Date Fair Value | Number of Shares | Weighted Average Grant Date Fair Value | |||||||||
Restricted stock units at beginning of period | 101 | $ | 42.86 | 74 | $ | 50.57 | ||||||
Granted | 11 | 26.30 | 28 | 16.81 | ||||||||
Conversions to common stock | (5 | ) | 48.88 | - | - | |||||||
Canceled | (7 | ) | 38.77 | (1 | ) | 47.61 | ||||||
Restricted stock units at end of period(1) | 100 | $ | 40.88 | 101 | $ | 42.86 | ||||||
| (1) | As of December 31, 2009 and December 31, 2008, approximately 93 million and 92 million restricted stock units, respectively, with a weighted average grant date fair value of $41.56 and $43.36, respectively, were vested or expected to vest. |
The weighted average price for restricted stock units granted during fiscal 2008 and fiscal 2007 was $48.71 and $66.68 (adjusted to reflect the impact of the DFS Spin-off), respectively. As of December 31, 2009 and December 31, 2008, the weighted-average remaining term until delivery for the Company's outstanding restricted stock units was approximately 1.5 years and 2.2 years, respectively.
| 201 | |
MORGAN STANLEY
NOTES TO CONSOLIDATED FINANCIAL STATEMENTS-(Continued)
The total fair market value of restricted stock units converted to common stock during 2009, fiscal 2008, fiscal 2007 and the one month ended December 31, 2008 was $151 million, $3,209 million, $817 million and $8 million, respectively. The increased value of restricted stock units converting to common stock in fiscal 2008 compared to other fiscal years reflects the impact of a modification in fiscal 2008 to accelerate the conversion of certain restricted stock unit awards. Additional compensation cost recognized as a result of this modification was not material.
The following table sets forth activity relating to the Company's unvested restricted stock units (share data in millions):
| 2009 | One Month Ended December 31, 2008 | |||||||||||
| Number of Shares | Weighted Average Grant Date Fair Value | Number of Shares | Weighted Average Grant Date Fair Value | |||||||||
Unvested restricted stock units at beginning of period | 72 | $ | 41.03 | 50 | $ | 52.21 | ||||||
Granted | 11 | 26.30 | 28 | 16.81 | ||||||||
Vested | (14 | ) | 44.57 | (5 | ) | 20.49 | ||||||
Canceled | (7 | ) | 38.64 | (1 | ) | 47.61 | ||||||
Unvested restricted stock units at end of period(1) | 62 | $ | 37.78 | 72 | $ | 41.03 | ||||||
| (1) | Unvested restricted stock units represent awards where recipients have yet to satisfy either the explicit vesting terms or retirement-eligible requirements. As of December 31, 2009 and December 31, 2008, approximately 55 million and 63 million, respectively, unvested restricted stock units, with a weighted average grant date fair value of $38.48 and $41.52, respectively, were expected to vest. |
Stock Option Awards. The Company has granted stock option awards pursuant to several equity-based compensation plans. The plans provide for the deferral of a portion of certain key employees' discretionary compensation with awards made in the form of stock options generally having an exercise price not less than the fair value of the Company's common stock on the date of grant. Such stock option awards generally become exercisable over a three-year period and expire ten years from the date of grant, subject to accelerated expiration upon termination of employment. Stock option awards have vesting, restriction and cancellation provisions that are generally similar to those in deferred stock awards.
The weighted average fair value of options granted during fiscal 2007 was $18.55 (adjusted to reflect the impact of the DFS Spin-off), utilizing the following weighted average assumptions. No options were granted in 2009, fiscal 2008 or the one month ended December 31, 2008.
| Fiscal 2007 | |||
Risk-free interest rate | 4.4 | % | |
Expected option life in years | 6.0 | ||
Expected stock price volatility | 23.8 | % | |
Expected dividend yield | 1.4 | % |
The Company's expected option life has been determined based upon historical experience. The expected stock price volatility assumption was determined using the implied volatility of exchange-traded options, in accordance with accounting guidance for share-based payments.
| | 202 |
MORGAN STANLEY
NOTES TO CONSOLIDATED FINANCIAL STATEMENTS-(Continued)
The following table sets forth activity relating to the Company's stock options (option data in millions):
| 2009 | One Month Ended December 31, 2008 | |||||||||||
| Number of Options | Weighted Average Exercise Price | Number of Options | Weighted Average Exercise Price | |||||||||
Options outstanding at beginning of period | 99 | $ | 49.90 | 100 | $ | 49.88 | ||||||
Canceled | (17 | ) | 43.24 | (1 | ) | 47.15 | ||||||
Options outstanding at end of period(1) | 82 | $ | 51.29 | 99 | $ | 49.90 | ||||||
Options exercisable at end of period | 82 | $ | 51.24 | 86 | $ | 47.57 | ||||||
| (1) | As of December 31, 2009 and December 31, 2008, 82 million and 98 million, awards, respectively, with a weighted average exercise price of $51.28 and $49.66, respectively, were vested or expected to vest. |
The total intrinsic value of stock options exercised during fiscal 2008 and fiscal 2007 was $211 million and $707 million, respectively. There were no stock options exercised during 2009 or the one month ended December 31, 2008.
As of December 31, 2009, the intrinsic value of in-the-money exercisable stock options was not material. As of December 31, 2008, there were no exercisable in-the-money stock options.
The following tables present information relating to the Company's stock options outstanding as of December 31, 2009 and December 31, 2008 (number of options outstanding data in millions):
At December 31, 2009 | Options Outstanding | Options Exercisable | ||||||||||||
Range of Exercise Prices | Number Outstanding | Weighted Average Exercise Price | Average Remaining Life (Years) | Number Exercisable | Weighted Average Exercise Price | Average Remaining Life (Years) | ||||||||
$22.00 – $39.99 | 11 | $ | 36.22 | 3.0 | 11 | $ | 36.22 | 3.0 | ||||||
$40.00 – $49.99 | 34 | 47.25 | 3.3 | 34 | 47.25 | 3.3 | ||||||||
$50.00 – $59.99 | 20 | 53.79 | 0.8 | 20 | 53.79 | 0.8 | ||||||||
$60.00 – $69.99 | 16 | 66.65 | 5.7 | 16 | 66.65 | 5.7 | ||||||||
$70.00 – $91.99 | 1 | 80.25 | 1.1 | 1 | 81.04 | 0.6 | ||||||||
Total | 82 | 82 | ||||||||||||
At December 31, 2008 | Options Outstanding | Options Exercisable | ||||||||||||
Range of Exercise Prices | Number Outstanding | Weighted Average Exercise Price | Average Remaining Life (Years) | Number Exercisable | Weighted Average Exercise Price | Average Remaining Life (Years) | ||||||||
$22.00 – $39.99 | 19 | $ | 34.21 | 2.5 | 19 | $ | 34.21 | 2.5 | ||||||
$40.00 – $49.99 | 38 | 47.17 | 4.1 | 38 | 47.21 | 4.1 | ||||||||
$50.00 – $59.99 | 23 | 53.65 | 1.7 | 23 | 53.65 | 1.7 | ||||||||
$60.00 – $69.99 | 18 | 66.60 | 6.7 | 5 | 66.31 | 3.9 | ||||||||
$70.00 – $91.99 | 1 | 80.47 | 1.7 | 1 | 81.06 | 1.2 | ||||||||
Total | 99 | 86 | ||||||||||||
| 203 | |
MORGAN STANLEY
NOTES TO CONSOLIDATED FINANCIAL STATEMENTS-(Continued)
19. Employee Benefit Plans.
The Company sponsors various pension plans for the majority of its U.S. and non-U.S. employees. The Company provides certain other postretirement benefits, primarily health care and life insurance, to eligible U.S. employees. The Company also provides certain postemployment benefits to certain former employees or inactive employees prior to retirement.
For fiscal 2008, the Company adopted the measurement date provision as required under current accounting guidance under the alternative transition method, which requires the measurement date to coincide with the fiscal year-end date. The Company recorded an after-tax charge of approximately $13 million to equity ($21 million before tax) upon adoption of this requirement.
Pension and Other Postretirement Plans. Substantially all of the U.S. employees of the Company hired before July 1, 2007 and its U.S. affiliates are covered by a non-contributory, defined benefit pension plan that is qualified under Section 401(a) of the Internal Revenue Code (the "U.S. Qualified Plan"). Unfunded supplementary plans (the "Supplemental Plans") cover certain executives. In addition, certain of the Company's non-U.S. subsidiaries also have defined benefit pension plans covering substantially all of their employees. These pension plans generally provide pension benefits that are based on each employee's years of credited service and on compensation levels specified in the plans. The Company's policy is to fund at least the amounts sufficient to meet minimum funding requirements under applicable employee benefit and tax laws. Liabilities for benefits payable under the Supplemental Plans are accrued by the Company and are funded when paid to the beneficiaries. The Company's U.S. Qualified Plan was closed to new hires effective July 1, 2007. In lieu of a defined benefit pension plan, eligible employees (excluding legacy Smith Barney employees) who were first hired, rehired or transferred to a U.S. benefits eligible position on or after July 1, 2007 will receive a retirement contribution under the 401(k) plan. The amount of the retirement contribution is included in the Company's 401(k) cost and will be equal to between 2% and 5% of eligible pay up to the annual Internal Revenue Code Section 401(a)(17) limit based on years of service as of December 31.
The Company also has an unfunded postretirement benefit plan that provides medical and life insurance for eligible U.S. retirees and medical insurance for their dependents.
The following tables present information for the Company's pension and postretirement plans on an aggregate basis:
Net Periodic Benefit Expense.
The following table presents the components of the net periodic benefit expense:
| Pension | Postretirement | ||||||||||||||||||||||||||||||
| 2009 | Fiscal 2008 | Fiscal 2007 | One Month Ended December 31, 2008 | 2009 | Fiscal 2008 | Fiscal 2007 | One Month Ended December 31, 2008 | ||||||||||||||||||||||||
| (dollars in millions) | |||||||||||||||||||||||||||||||
Service cost | $ | 116 | $ | 102 | $ | 107 | $ | 8 | $ | 12 | $ | 8 | $ | 7 | $ | 1 | |||||||||||||||
Interest cost | 152 | 135 | 124 | 12 | 12 | 10 | 8 | 1 | |||||||||||||||||||||||
Expected return on plan assets | (125 | ) | (128 | ) | (123 | ) | (10 | ) | - | - | - | - | |||||||||||||||||||
Net amortization of prior service credit | (9 | ) | (8 | ) | (8 | ) | (1 | ) | (1 | ) | (2 | ) | (1 | ) | - | ||||||||||||||||
Net amortization of actuarial loss | 41 | 31 | 41 | - | 3 | 1 | - | - | |||||||||||||||||||||||
Special termination benefits | - | - | 2 | - | - | - | - | - | |||||||||||||||||||||||
Net periodic benefit expense | $ | 175 | $ | 132 | $ | 143 | $ | 9 | $ | 26 | $ | 17 | $ | 14 | $ | 2 | |||||||||||||||
| | 204 |
MORGAN STANLEY
NOTES TO CONSOLIDATED FINANCIAL STATEMENTS-(Continued)
Other changes in plan assets and benefit obligations recognized in other comprehensive loss (income) on a pre-tax basis in 2009, fiscal 2008 and the one month ended December 31, 2008 are as follows:
| Pension | Postretirement | |||||||||||||||||||||
| 2009 | Fiscal 2008 | One Month Ended December 31, 2008 | 2009 | Fiscal 2008 | One Month Ended December 31, 2008 | |||||||||||||||||
| (dollars in millions) | ||||||||||||||||||||||
Net loss (gain) | $ | 509 | $ | (330 | ) | $ | 282 | $ | (25 | ) | $ | (11 | ) | $ | 50 | |||||||
Prior service credit | (16 | ) | - | - | - | - | - | |||||||||||||||
Amortization of prior service credit | 9 | 8 | 1 | 1 | 2 | - | ||||||||||||||||
Amortization of net loss | (41 | ) | (31 | ) | - | (3 | ) | (1 | ) | - | ||||||||||||
Total recognized in other comprehensive loss (income) | $ | 461 | $ | (353 | ) | $ | 283 | $ | (27 | ) | $ | (10 | ) | $ | 50 | |||||||
The Company amortizes (as a component of pension and postretirement expense) unrecognized net gains and losses over the average future service of active participants (5 to 20 years depending upon the plan) to the extent that the gain/loss exceeds 10% of the greater of the projected benefit obligation or the market-related value of plan assets.
The following table presents the weighted average assumptions used to determine net periodic benefit costs for 2009, fiscal 2008, fiscal 2007 and the one month ended December 31, 2008:
| Pension | Postretirement | |||||||||||||||||||||||
| 2009 | Fiscal 2008 | Fiscal 2007 | One Month Ended December 31, 2008 | 2009 | Fiscal 2008 | Fiscal 2007 | One Month Ended December 31, 2008 | |||||||||||||||||
Discount rate | 5.75 | % | 6.17 | % | 5.79 | % | 7.23 | % | 5.78 | % | 6.34 | % | 5.97 | % | 7.47 | % | ||||||||
Expected long-term rate of return on plan assets | 5.21 | 6.46 | 6.65 | 5.17 | n/a | n/a | n/a | n/a | ||||||||||||||||
Rate of future compensation increases | 5.12 | 5.08 | 4.40 | 5.09 | n/a | n/a | n/a | n/a | ||||||||||||||||
The expected long-term rate of return on plan assets represents the Company's best estimate of the long-term return on plan assets. For the U.S. Qualified Plan, the expected long-term rate of return was estimated by computing a weighted average return of the underlying long-term expected returns on the plan's fixed income assets based on the investment managers' target allocations within this asset class. The expected long-term return on assets is a long-term assumption that generally is expected to remain the same from one year to the next unless there is a significant change in the target asset allocation, the fees and expenses paid by the plan or market conditions. To better align the duration of plan assets with the duration of plan liabilities, in fiscal 2007, the U.S. Qualified Plan's target asset allocation policy was changed from 45%/55% equity/fixed income to 30%/70% equity/fixed income. In late 2008, the U.S. Qualified Plan transitioned to 100% investment in fixed income securities and related derivative securities, including interest rate swap contracts. This asset allocation is expected to help protect the plan's funded status and limit volatility of the Company's contributions. Total U.S. Qualified Plan portfolio performance is assessed by comparing actual investment performance with changes in the estimated present value of the U.S. Qualified Plan's liability.
| 205 | |
MORGAN STANLEY
NOTES TO CONSOLIDATED FINANCIAL STATEMENTS-(Continued)
Benefit Obligations and Funded Status.
The following table provides a reconciliation of the changes in the benefit obligation and fair value of plan assets for 2009, fiscal 2008 and the one month ended December 31, 2008:
| Pension | Postretirement | |||||||
| (dollars in millions) | ||||||||
Reconciliation of benefit obligation : | ||||||||
Benefit obligation at November 30, 2007 | $ | 2,263 | $ | 162 | ||||
Adjustments due to change in the measurement date: | ||||||||
Service cost and interest cost | 40 | 3 | ||||||
Gap period benefits paid | (10 | ) | - | |||||
Service cost(1) | 104 | 8 | ||||||
Interest cost(2) | 136 | 10 | ||||||
Actuarial gain | (268 | ) | (11 | ) | ||||
Benefits paid | (122 | ) | (8 | ) | ||||
Other, including foreign currency exchange rate changes | (51 | ) | - | |||||
Benefit obligation at November 30, 2008 | $ | 2,092 | $ | 164 | ||||
Service cost | 8 | 1 | ||||||
Interest cost | 12 | 1 | ||||||
Actuarial loss | 551 | 50 | ||||||
Benefits paid | (12 | ) | (1 | ) | ||||
Other, including foreign currency exchange rate changes | 7 | - | ||||||
Benefit obligation at December 31, 2008 | $ | 2,658 | $ | 215 | ||||
Service cost(2) | 117 | 12 | ||||||
Interest cost | 152 | 12 | ||||||
Actuarial gain(3) | (154 | ) | (25 | ) | ||||
Plan amendments | (16 | ) | - | |||||
Plan settlements | (2 | ) | - | |||||
Benefits paid | (172 | ) | (11 | ) | ||||
Transfers / divestitures(4) | 25 | - | ||||||
Other, including foreign currency exchange rate changes | 22 | - | ||||||
Benefit obligation at December 31, 2009 | $ | 2,630 | $ | 203 | ||||
Reconciliation of fair value of plan assets: | ||||||||
Fair value of plan assets at November 30, 2007 | $ | 2,113 | $ | - | ||||
Adjustments due to change in the measurement date: | ||||||||
Gap period benefits paid, net of contributions | (9 | ) | - | |||||
Actual return on plan assets | 215 | - | ||||||
Employer contributions(2) | 326 | 8 | ||||||
Benefits paid | (122 | ) | (8 | ) | ||||
Other, including foreign currency exchange rate changes | (50 | ) | - | |||||
Fair value of plan assets at November 30, 2008 | $ | 2,473 | $ | - | ||||
Actual return on plan assets | 278 | - | ||||||
Employer contributions | 2 | 1 | ||||||
Benefits paid | (12 | ) | (1 | ) | ||||
Other, including foreign currency exchange rate changes | (2 | ) | - | |||||
Fair value of plan assets at December 31, 2008 | $ | 2,739 | $ | - | ||||
Actual return on plan assets | (538 | ) | - | |||||
Employer contributions | 321 | 11 | ||||||
Benefits paid | (172 | ) | (11 | ) | ||||
Plan settlements | (2 | ) | - | |||||
Transfers / divestitures(4) | 35 | - | ||||||
Other, including foreign currency exchange rate changes | 23 | - | ||||||
Fair value of plan assets at December 31, 2009 | $ | 2,406 | $ | - | ||||
| (1) | Pension amounts included in discontinued operations were $2 million. |
| | 206 |
MORGAN STANLEY
NOTES TO CONSOLIDATED FINANCIAL STATEMENTS-(Continued)
| (2) | Pension amounts included in discontinued operations were $1 million. |
| (3) | Change in actuarial gain under benefit obligation is primarily attributed to an increase in the discount rates as of December 31, 2009. |
| (4) | Transfers and divestitures primarily related to the impact of MSCI and the formation of MSSB. |
The following table presents a summary of the funded status as of December 31, 2009 and December 31, 2008:
| Pension | Postretirement | |||||||||||||||
| December 31, 2009 | December 31, 2008 | December 31, 2009 | December 31, 2008 | |||||||||||||
(dollars in millions) | ||||||||||||||||
Funded status: | ||||||||||||||||
Funded/(Unfunded status) | $ | (224 | ) | $ | 81 | $ | (203 | ) | $ | (215 | ) | |||||
Amounts recognized in the consolidated statements of financial condition consist of: | ||||||||||||||||
Assets | $ | 107 | $ | 426 | $ | - | $ | - | ||||||||
Liabilities | (331 | ) | (345 | ) | (203 | ) | (215 | ) | ||||||||
Net amount recognized | $ | (224 | ) | $ | 81 | $ | (203 | ) | $ | (215 | ) | |||||
Amounts recognized in accumulated other comprehensive loss consist of: | ||||||||||||||||
Prior service credit | $ | (61 | ) | $ | (55 | ) | $ | (5 | ) | $ | (6 | ) | ||||
Net loss | 844 | 382 | 33 | 61 | ||||||||||||
Net loss recognized | $ | 783 | $ | 327 | $ | 28 | $ | 55 | ||||||||
The estimated prior-service credit that will be amortized from Accumulated other comprehensive loss into net periodic benefit cost over 2010 is approximately $10 million for defined benefit pension plans and $1 million for postretirement plans. The estimated net loss that will be amortized from Accumulated other comprehensive loss into net periodic benefit cost over 2010 is approximately $25 million for defined benefit pension plans and $1 million for postretirement plans.
The accumulated benefit obligation for all defined benefit pension plans was $2,507 million and $2,532 million as of December 31, 2009 and December 31, 2008, respectively.
The following table contains information for pension plans with projected benefit obligations in excess of the fair value of plan assets as of period-end:
| December 31, 2009 | December 31, 2008 | |||||
| (dollars in millions) | ||||||
Projected benefit obligation | $ | 385 | $ | 390 | ||
Fair value of plan assets | 54 | 45 | ||||
The following table contains information for pension plans with accumulated benefit obligations in excess of the fair value of plan assets as of period-end:
| December 31, 2009 | December 31, 2008 | |||||
| (dollars in millions) | ||||||
Accumulated benefit obligation | $ | 346 | $ | 352 | ||
Fair value of plan assets | 45 | 45 | ||||
| 207 | |
MORGAN STANLEY
NOTES TO CONSOLIDATED FINANCIAL STATEMENTS-(Continued)
The following table presents the weighted average assumptions used to determine benefit obligations as of period-end:
| Pension | Postretirement | |||||||||||
| December 31, 2009 | December 31, 2008 | December 31, 2009 | December 31, 2008 | |||||||||
Discount rate | 5.91 | % | 5.75 | % | 6.00 | % | 5.78 | % | ||||
Rate of future compensation increases | 5.13 | 5.12 | n/a | n/a | ||||||||
The discount rate used to determine the benefit obligation for the U.S. Qualified Pension Plan and postretirement plan was selected by the Company, in consultation with its independent actuaries, using a pension discount yield curve based on the characteristics of the U.S. Qualified Plan and postretirement liabilities, each determined independently. The pension discount yield curve represents spot discount yields based on duration implicit in a representative broad based Aa corporate bond universe of high-quality fixed income investments. At December 31, 2009 and December 31, 2008, the Company's U.S. Qualified Plan represented 83% of the total liabilities of its U.S. pension and postretirement plans combined. The discount rate used to determine the benefit obligation for the defined benefit portion of its U.K. pension plans were selected by the Company using a pension discount yield curve based on the characteristics of the U.K. defined benefit pension liabilities. For all other non-U.S. pension plans, the Company set the assumed discount rates based on the nature of liabilities, local economic environments and available bond indices.
The following table presents assumed health care cost trend rates used to determine the postretirement benefit obligations as of period-end:
| December 31, 2009 | December 31, 2008 | |||||
Health care cost trend rate assumed for next year: | ||||||
Medical | 7.00%-8.00 | % | 7.25%-9.50 | % | ||
Prescription | 10.00 | % | 10.50 | % | ||
Rate to which the cost trend rate is assumed to decline (ultimate trend rate) | 4.50 | % | 5.00 | % | ||
Year that the rate reaches the ultimate trend rate | 2029 | 2018 |
Assumed health care cost trend rates can have a significant effect on the amounts reported for the Company's postretirement benefit plans. A one-percentage point change in assumed health care cost trend rates would have the following effects:
| One-Percentage Point Increase | One-Percentage Point (Decrease) | ||||||
| (dollars in millions) | |||||||
Effect on total postretirement service and interest cost | $ | 5 | $ | (4 | ) | ||
Effect on postretirement benefit obligation | 31 | (24 | ) | ||||
The Medicare Prescription Drug, Improvement and Modernization Act of 2003 (the "Act") was enacted in December 2003. For 2009 and fiscal 2008, Morgan Stanley elected not to apply for the Medicare Retiree Drug Subsidy or take any other action related to the Act since Medicare prescription drug coverage was deemed to have no material effect on the Company's retiree medical program. No impact of the Act has been reflected in the Company's consolidated statements of income.
Plan Assets. The U.S. Qualified Plan assets represent 89% of the Company's total pension plan assets. The U.S. Qualified Plan uses a combination of active and risk-controlled fixed income investment strategies. The fixed income asset allocation consists primarily of fixed income securities designed to approximate the expected
| | 208 |
MORGAN STANLEY
NOTES TO CONSOLIDATED FINANCIAL STATEMENTS-(Continued)
cash flows of the plan's liabilities in order to help reduce plan exposure to interest rate variation and to better align assets with obligations. The longer duration fixed income allocation is expected to help protect the plan's funded status and maintain the stability of plan contributions over the long run.
The allocation by investment manager of the Company's U.S. Qualified Plan is reviewed by the Morgan Stanley Retirement Plan Investment Committee on a regular basis. When the exposure to a given investment manager reaches a minimum or maximum allocation level, an asset allocation review process is initiated, and the portfolio will be automatically rebalanced back closer toward the target allocation unless the Investment Committee determines otherwise.
Derivative instruments are permitted in the U.S. Qualified Plan's portfolio only to the extent that they comply with all of the plan's policy guidelines and are consistent with the plan's risk and return objectives. In addition, any investment in derivatives must meet the following conditions:
| • | Derivatives may be used only if they are deemed by the investment manager to be more attractive than a similar direct investment in the underlying cash market or if the vehicle is being used to manage risk of the portfolio. |
| • | Derivatives may not be used in a speculative manner or to leverage the portfolio under any circumstances. |
| • | Derivatives may not be used as short-term trading vehicles. The investment philosophy of the U.S. Qualified Plan is that investment activity is undertaken for long-term investment rather than short-term trading. |
| • | Derivatives may only be used in the management of the U.S. Qualified Plan's portfolio when their possible effects can be quantified, shown to enhance the risk-return profile of the portfolio, and reported in a meaningful and understandable manner. |
As a fundamental operating principle, any restrictions on the underlying assets apply to a respective derivative product. This includes percentage allocations and credit quality. Derivatives will be used solely for the purpose of enhancing investment in the underlying assets and not to circumvent portfolio restrictions.
The plan assets are measured at fair value using valuation techniques that are consistent with the valuation techniques applied to the Company's major categories of assets and liabilities as described in Note 4. Quoted market prices in active markets are the best evidence of fair value and are used as the basis for the measurement, if available. If a quoted market price is available, the fair value is the product of the number of trading units multiplied by the market price. If a quoted market price is not available, the estimate of fair value is based on the valuation approaches that maximize use of observable inputs and minimize use of unobservable inputs.
The fair value of OTC derivative contracts is derived primarily using pricing models, which may require multiple market input parameters. Derivative contracts are presented on a gross basis prior to cash collateral or counterparty netting. Derivative contracts consist of investments in options and futures contracts, forward contracts and swaps.
Commingled trust funds are privately offered funds available to institutional clients that are regulated, supervised, and subject to periodic examination by a state or federal agency. The trust must be maintained for the collective investment or reinvestment of assets contributed to it from employee benefit plans maintained by more than one employer or a controlled group of corporations. The sponsor of the commingled trust funds values the funds' NAV based on the fair value of the underlying securities. The underlying securities of the commingled trust funds consist of mainly long duration fixed income instruments. Commingled trust funds are categorized in Level 2 of the fair value hierarchy to the extent that they are readily redeemable at their NAV or else they are categorized in Level 3 of the fair value hierarchy.
| 209 | |
MORGAN STANLEY
NOTES TO CONSOLIDATED FINANCIAL STATEMENTS-(Continued)
Foreign funds consist of investment in foreign corporate equity funds, foreign corporate bond funds and foreign target cash flow funds. Foreign corporate equity funds and foreign corporate bond funds invest in individual securities quoted on a recognized stock exchange or traded in a regulated market and certain bond funds that aim to produce returns as close as possible to certain FTSE indexes. Foreign target cash flow funds are designed to provide a series of fixed annual cash flows over 5 or 10 years achieved by investing in government bonds and derivatives. Foreign funds are categorized in Level 2 of the fair value hierarchy as they are readily redeemable at their NAV.
Other investments consist of investment in real estate and hedge funds. These funds are categorized in Level 2 of the fair value hierarchy to the extent that they are readily redeemable at their NAV or else they are categorized in Level 3 of the fair value hierarchy.
The following table presents the fair value of the net pension plan assets as of December 31, 2009:
| Quoted Prices in Active Markets for Identical Assets (Level 1) | Significant Observable Inputs (Level 2) | Significant Unobservable Inputs (Level 3) | Total | |||||||||
| (dollars in millions) | ||||||||||||
Assets | ||||||||||||
Investments | ||||||||||||
Cash and cash equivalents(1) | $ | 9 | $ | - | $ | - | $ | 9 | ||||
U.S. government and agency securities: | ||||||||||||
U.S. Treasury securities | 720 | - | - | 720 | ||||||||
U.S. agency securities | 12 | 318 | - | 330 | ||||||||
Total U.S. government and agency securities | 732 | 318 | - | 1,050 | ||||||||
Other sovereign government obligations | 10 | 7 | - | 17 | ||||||||
Corporate and other debt | ||||||||||||
State and municipal securities | - | 5 | - | 5 | ||||||||
Asset-backed securities | - | 6 | - | 6 | ||||||||
Corporate bonds | - | 419 | - | 419 | ||||||||
Collateralized debt obligations | - | 12 | - | 12 | ||||||||
Total corporate and other debt | - | 442 | - | 442 | ||||||||
Corporate equities | 44 | - | - | 44 | ||||||||
Derivative and other contracts(2) | 2 | 32 | - | 34 | ||||||||
Derivative-related cash collateral | - | 103 | - | 103 | ||||||||
Commingled trust funds(3) | - | 647 | 12 | 659 | ||||||||
Foreign funds(4) | - | 184 | - | 184 | ||||||||
Other investments | - | 10 | 2 | 12 | ||||||||
Total investments | 797 | 1,743 | 14 | 2,554 | ||||||||
Receivables: | ||||||||||||
Repurchase agreements(1) | - | 29 | - | 29 | ||||||||
Other receivables(1) | - | 43 | - | 43 | ||||||||
Total receivables | - | 72 | - | 72 | ||||||||
Total Assets | $ | 797 | $ | 1,815 | $ | 14 | $ | 2,626 | ||||
Liabilities | ||||||||||||
Derivative and other contracts(5) | $ | 15 | $ | 160 | $ | - | $ | 175 | ||||
Other liabilities(1) | - | 45 | - | 45 | ||||||||
Total liabilities | 15 | 205 | - | 220 | ||||||||
Net pension assets | $ | 782 | $ | 1,610 | $ | 14 | $ | 2,406 | ||||
| (1) | Cash and cash equivalents, repurchase agreements, other receivables and other liabilities are valued at cost, which approximates fair value. |
| | 210 |
MORGAN STANLEY
NOTES TO CONSOLIDATED FINANCIAL STATEMENTS-(Continued)
| (2) | Derivative and other contracts in an asset position include investments in futures contracts and interest rate swaps of $2 million and $32 million, respectively. |
| (3) | Commingled trust funds include investments in cash funds, fixed income funds and equity funds of $74 million, $573 million and $12 million, respectively. |
| (4) | Foreign funds include investments in equity funds, bond funds and targeted cashflow funds of $15 million, $81 million and $88 million, respectively. |
| (5) | Derivative and other contracts in a liability position include investments in listed derivatives and interest rate swaps of $15 million and $160 million, respectively. |
The following table presents changes in Level 3 pension assets and liabilities measured at fair value for 2009:
| Beginning Balance at January 1, 2009 | Actual Return on Plan Assets Related to Assets Still Held at December 31, 2009 | Actual Return on Plan Assets Related to Assets Sold during 2009 | Purchases, Sales, Other Settlements and Issuances, net | Net Transfers In and/or (Out) of Level 3 | Ending Balance at December 31, 2009 | |||||||||||||||
| (dollars in millions) | ||||||||||||||||||||
Investments | ||||||||||||||||||||
Commingled trust funds(1) | $ | 792 | $ | (195 | ) | $ | 19 | $ | 43 | $ | (647 | ) | $ | 12 | ||||||
Other investments | 2 | - | - | - | - | 2 | ||||||||||||||
Total investments | $ | 794 | $ | (195 | ) | $ | 19 | $ | 43 | $ | (647 | ) | $ | 14 | ||||||
| (1) | Net transfers out represents reclassification of commingled trust funds from Level 3 to Level 2 based on current accounting guidance for investments that are readily redeemable at their NAV. |
Cash Flows.
At December 31, 2009, the Company expects to contribute approximately $275 million to its pension and postretirement benefit plans in 2010 based upon the plans' current funded status and expected asset return assumptions for 2010, as applicable.
Expected benefit payments associated with the Company's pension and postretirement benefit plans for the next five years and in aggregate for the five years thereafter as of December 31, 2009 are as follows:
| Pension | Postretirement | |||||
| (dollars in millions) | ||||||
2010 | $ | 112 | $ | 8 | ||
2011 | 111 | 8 | ||||
2012 | 115 | 8 | ||||
2013 | 119 | 9 | ||||
2014 | 123 | 9 | ||||
2015-2019 | 692 | 52 | ||||
Morgan Stanley 401(k) Plan, Morgan Stanley 401(k) Savings Plan and Profit Sharing Awards. Eligible U.S. employees receive 401(k) matching contributions that are invested in the Company's common stock. Effective July 1, 2009, the Company introduced the Morgan Stanley 401(k) Savings Plan for legacy Smith Barney U.S. employees who were contributed to MSSB. Legacy Smith Barney U.S. employees with eligible pay less than or equal to $100,000 will receive a fixed contribution under the 401(k) Savings Plan. The amount of fixed contribution is included in the Company's 401(k) expense and equals between 1% and 2% of eligible pay based on years of service as of December 31. Additionally, certain eligible Smith Barney employees were granted a transition contribution and a one-time make-up Company match based on certain transition percentages of eligible pay and a comparison of the Company match under the Citi 401(k) Plan and Morgan Stanley 401(k) Savings Plan. The retirement contribution granted in lieu of a defined benefit pension plan, and the fixed
| 211 | |
MORGAN STANLEY
NOTES TO CONSOLIDATED FINANCIAL STATEMENTS-(Continued)
contribution, transition contribution and make-up Company match granted to legacy Smith Barney employees are included in the Company's 401(k) expense. The Company entered into an agreement with the investment manager for the SVP, a fund within the Company's 401(k) plan, and certain other third parties on September 30, 2009 (see Note 11 for further information). Under the agreement, the Company contributed $20 million to the SVP on October 15, 2009 and recorded the contribution in the Company's 401(k) expense. The Company also provides discretionary profit sharing to certain Non-U.S. employees. The pre-tax expense associated with the 401(k) plans and profit sharing for 2009, fiscal 2008, fiscal 2007 and the one month ended December 31, 2008 was $181 million, $106 million, $128 million and $8 million, respectively.
Defined Contribution Pension Plans. The Company maintains separate defined contribution pension plans that cover substantially all employees of certain non-U.S. subsidiaries. Under such plans, benefits are determined based on a fixed rate of base salary with certain vesting requirements. In 2009, fiscal 2008, fiscal 2007 and the one month ended December 31, 2008, the Company's expense related to these plans was $99 million, $128 million, $115 million and $9 million, respectively.
Other Postemployment Benefits. Postemployment benefits include, but are not limited to, salary continuation, severance benefits, disability-related benefits, and continuation of health care and life insurance coverage provided to former employees or inactive employees after employment but before retirement. The postemployment benefit obligations were not material as of December 31, 2009 and December 31, 2008.
20. Income Taxes.
The provision for (benefit from) income taxes from continuing operations consisted of:
| 2009 | Fiscal 2008 | Fiscal 2007 | One Month Ended December 31, 2008 | |||||||||||||
| (dollars in millions) | ||||||||||||||||
Current: | ||||||||||||||||
U.S. federal | $ | 160 | $ | 445 | $ | 302 | $ | 42 | ||||||||
U.S. state and local | 45 | 78 | 147 | 8 | ||||||||||||
Non-U.S. | 338 | 1,181 | 2,428 | 8 | ||||||||||||
| 543 | 1,704 | 2,877 | 58 | |||||||||||||
Deferred: | ||||||||||||||||
U.S. federal | (463 | ) | (1,413 | ) | (2,078 | ) | (671 | ) | ||||||||
U.S. state and local | (362 | ) | (109 | ) | (106 | ) | 30 | |||||||||
Non-U.S. | (54 | ) | (203 | ) | (117 | ) | (149 | ) | ||||||||
| (879 | ) | (1,725 | ) | (2,301 | ) | (790 | ) | |||||||||
(Benefit from) provision for income taxes from continuing operations | $ | (336 | ) | $ | (21 | ) | $ | 576 | $ | (732 | ) | |||||
(Benefit from) provision for income taxes from discontinued operations | $ | (53 | ) | $ | 501 | $ | 633 | $ | 8 | |||||||
| | 212 |
MORGAN STANLEY
NOTES TO CONSOLIDATED FINANCIAL STATEMENTS-(Continued)
The following table reconciles the provision for (benefit from) income taxes to the U.S. federal statutory income tax rate:
| 2009 | Fiscal 2008 | Fiscal 2007 | One Month Ended December 31, 2008 | |||||||||
U.S. federal statutory income tax rate | 35.0 | % | 35.0 | % | 35.0 | % | 35.0 | % | ||||
U.S. state and local income taxes, net of U.S. federal income tax benefits | (24.2 | ) | (1.7 | ) | 0.9 | (1.2 | ) | |||||
Lower tax rates applicable to non-U.S. earnings | (25.3 | ) | (21.7 | ) | (2.4 | ) | 1.0 | |||||
Goodwill | - | 20.2 | - | - | ||||||||
Domestic tax credits | (22.5 | ) | (19.9 | ) | (7.4 | ) | 1.4 | |||||
Tax exempt income | (6.9 | ) | (15.7 | ) | (4.0 | ) | 0.2 | |||||
Other | 4.7 | 2.0 | (1.4 | ) | (0.3 | ) | ||||||
Effective income tax rate(1) | (39.2 | )% | (1.8 | )% | 20.7 | % | 36.1 | % | ||||
| (1) | The effective tax rate for 2009 includes a tax benefit of $331 million, or $0.28 per diluted share, resulting from the cost of anticipated repatriation of non-U.S. earnings at lower than previously estimated tax rates. Excluding this benefit, the annual effective tax rate for 2009 would have been a benefit of 1%. |
As of December 31, 2009, the Company had approximately $4.0 billion of earnings attributable to foreign subsidiaries for which no provisions have been recorded for income tax that could occur upon repatriation. Except to the extent such earnings can be repatriated tax efficiently, they are permanently invested abroad. It is not practicable to determine the amount of income taxes payable in the event all such foreign earnings are repatriated.
Deferred income taxes reflect the net tax effects of temporary differences between the financial reporting and tax bases of assets and liabilities and are measured using the enacted tax rates and laws that will be in effect when such differences are expected to reverse. Significant components of the Company's deferred tax assets and liabilities as of December 31, 2009 and December 31, 2008 were as follows:
| December 31, 2009 | December 31, 2008 | |||||
| (dollars in millions) | ||||||
Deferred tax assets: | ||||||
Employee compensation and benefit plans | $ | 3,312 | $ | 2,390 | ||
Valuation and liability allowances | 378 | 536 | ||||
Deferred expenses | 52 | 60 | ||||
Tax credit and loss carryforward | 4,820 | 6,121 | ||||
Other | 81 | 395 | ||||
Total deferred tax assets | 8,643 | 9,502 | ||||
Valuation allowance(1) | 105 | 202 | ||||
Deferred tax assets after valuation allowance | $ | 8,538 | $ | 9,300 | ||
Deferred tax liabilities: | ||||||
Valuation of inventory, investments and receivables | $ | 587 | $ | 1,886 | ||
Prepaid commissions | 14 | 15 | ||||
Fixed assets | 322 | 262 | ||||
Total deferred tax liabilities | 923 | 2,163 | ||||
Net deferred tax assets | $ | 7,615 | $ | 7,137 | ||
| (1) | The valuation allowance reduces the benefit of certain separate Company federal, state and foreign net operating loss carryforwards and book writedowns to the amount that will more likely than not be realized. |
| 213 | |
MORGAN STANLEY
NOTES TO CONSOLIDATED FINANCIAL STATEMENTS-(Continued)
During 2009 and the one month ended December 31, 2008, the valuation allowance was decreased by $97 million and increased by $1 million, respectively, related to the ability to utilize certain separate federal, state and foreign net operating losses.
The Company had federal and state net operating loss carryforwards for which a deferred tax asset of $1,978 million and $4,080 million was recorded as of December 31, 2009 and December 31, 2008, respectively. These carryforwards are subject to annual limitations and will begin to expire in 2028. The deferred tax asset for federal net operating loss carryforwards did not include approximately $75 million related to excess tax benefits from the exercise or conversion of stock-based compensation awards which had not been realized as of December 31, 2008. These previously unrecognized tax benefits were realized and recorded in Paid-in capital as of December 31, 2009.
The Company had net operating loss carryforwards in Japan for which a deferred tax asset of $546 million was recorded as of December 31, 2009. These carryforwards are subject to annual limitations and will begin to expire in 2016.
The Company had a federal capital loss carryforward for which a related deferred tax asset of $234 million was recorded as of December 31, 2009. This carryforward is subject to annual limitations on utilization and will begin to expire in 2015.
The Company had tax credit carryforwards for which a related deferred tax asset of $2,062 million and $2,041 million was recorded as of December 31, 2009 and December 31, 2008, respectively. These carryforwards are subject to annual limitations on utilization and will begin to expire in 2016.
The Company believes the recognized net deferred tax asset of $7,615 million (after valuation allowance) is more likely than not to be realized based on expectations as to future taxable income in the jurisdictions in which it operates.
The Company recorded net income tax benefits (provision) to Paid-in capital related to employee stock compensation transactions of $33 million, $(131) million, $280 million and $(4) million in 2009, fiscal 2008, fiscal 2007 and the one month ended December 31, 2008, respectively. The $33 million net income tax benefit related to employee stock compensation transactions recorded to Paid-in capital in 2009 includes approximately $75 million of excess tax benefits that were realized in 2009 related to certain stock-based compensation awards exercised or converted in prior years.
Cash paid for income taxes was $1,028 million, $1,406 million, $3,404 million and $113 million in 2009, fiscal 2008, fiscal 2007 and the one month ended December 31, 2008, respectively. During fiscal 2008, the Company received a refund of $1,200 million for overpayment of estimated taxes remitted during fiscal 2007.
The following table presents the U.S. and non-U.S. components of income before income tax expense/(benefit) and extraordinary gain for the years ended in 2009, fiscal 2008, fiscal 2007 and the one month ended December 31, 2008, respectively:
| 2009 | Fiscal 2008 | Fiscal 2007 | One Month Ended December 31, 2008 | |||||||||||||
| (dollars in millions) | ||||||||||||||||
U.S. | $ | (1,490 | ) | $ | (2,914 | ) | $ | (5,520 | ) | $ | (1,120 | ) | ||||
Non-U.S. (1) | 2,347 | 4,051 | 8,296 | (907 | ) | |||||||||||
| $ | 857 | $ | 1,137 | $ | 2,776 | $ | (2,027 | ) | ||||||||
| (1) | Non-U.S. income is defined as income generated from operations located outside the U.S. |
| | 214 |
MORGAN STANLEY
NOTES TO CONSOLIDATED FINANCIAL STATEMENTS-(Continued)
The Company adopted accounting guidance which clarifies the accounting for uncertainty in income taxes recognized in a company's financial statements on December 31, 2007 and recorded a cumulative effect adjustment of approximately $92 million as a decrease to the opening balance of Retained earnings as of December 1, 2007.
The total amount of unrecognized tax benefits was approximately $4.1 billion and $3.5 billion as of December 31, 2009 and December 31, 2008, respectively. Of this total, approximately $2.1 billion and $1.9 billion, respectively, (net of federal benefit of state issues, competent authority and foreign tax credit offsets) represent the amount of unrecognized tax benefits that, if recognized, would favorably affect the effective tax rate in future periods.
The Company recognizes the accrual of interest related to unrecognized tax benefits in Provision for income taxes in the consolidated statements of income. The Company recognizes the accrual of penalties (if any) related to unrecognized tax benefits in Income before income taxes. For 2009, fiscal 2008 and the one month ended December 31, 2008, the Company recognized $53 million, $76 million and $7 million, respectively, of interest (net of federal and state income tax benefits) in the consolidated statements of income. Interest expense accrued as of December 31, 2009 and December 31, 2008 was approximately $367 million and $313 million, respectively, net of federal and state income tax benefits. The amount of penalties accrued was immaterial.
The following table presents a reconciliation of the beginning and ending amount of unrecognized tax benefits for 2009, fiscal 2008 and the one month ended December 31, 2008 (dollars in millions):
Unrecognized Tax Benefits | ||||
Balance at December 1, 2007 | $ | 2,722 | ||
Increases based on tax positions related to the current period | 856 | |||
Increases based on tax positions related to prior periods | 5 | |||
Decreases based on tax positions related to prior periods | (124 | ) | ||
Decreases related to a lapse of applicable statute of limitations | (34 | ) | ||
Balance at November 30, 2008 | $ | 3,425 | ||
Increases based on tax positions related to the current period | 41 | |||
Balance at December 31, 2008 | $ | 3,466 | ||
Increases based on tax positions related to the current period | 688 | |||
Increases based on tax positions related to prior periods | 33 | |||
Decreases based on tax positions related to prior periods | (74 | ) | ||
Decreases related to a lapse of applicable statute of limitations | (61 | ) | ||
Balance at December 31, 2009 | $ | 4,052 | ||
The Company is under continuous examination by the Internal Revenue Service (the "IRS") and other tax authorities in certain countries, such as Japan and the U.K., and states in which the Company has significant business operations, such as New York. During 2010, the IRS and the Japanese tax authorities are expected to conclude the field work portion of their examinations on issues covering tax years 1999-2005 and 2007-2008, respectively. Also during 2010, the Company expects to reach a conclusion with the U.K. tax authorities on issues through tax year 2007, including those in appeals. Additionally, during 2010, the Company may reach a conclusion with the New York State and New York City tax authorities on issues covering years 2002-2006. The Company regularly assesses the likelihood of additional assessments in each of the taxing jurisdictions resulting from these and subsequent years' examinations. The Company has established unrecognized tax benefits that the Company believes are adequate in relation to the potential for additional assessments. Once established, the
| 215 | |
MORGAN STANLEY
NOTES TO CONSOLIDATED FINANCIAL STATEMENTS-(Continued)
Company adjusts unrecognized tax benefits only when more information is available or when an event occurs necessitating a change. The Company believes that the resolution of tax matters will not have a material effect on the consolidated statements of financial condition of the Company, although a resolution could have a material impact on the Company's consolidated statements of income for a particular future period and on the Company's effective income tax rate for any period in which such resolution occurs.
It is reasonably possible that significant changes in the gross balance of unrecognized tax benefits may occur within the next twelve months. At this time, however, it is not possible to reasonably estimate the expected change to the total amount of unrecognized tax benefits and impact on the effective tax rate over the next twelve months.
The following are the major tax jurisdictions in which the Company and its affiliates operate and the earliest tax year subject to examination:
Jurisdiction | Tax Year | |
United States | 1999 | |
New York State and City | 2002 | |
Hong Kong | 2002 | |
U.K. | 2004 | |
Japan | 2004 |
21. Segment and Geographic Information.
The Company structures its segments primarily based upon the nature of the financial products and services provided to customers and the Company's management organization. The Company provides a wide range of financial products and services to its customers in each of its business segments: Institutional Securities, Global Wealth Management Group and Asset Management. For further discussion of the Company's business segments, see Note 1.
Revenues and expenses directly associated with each respective segment are included in determining its operating results. Other revenues and expenses that are not directly attributable to a particular segment are allocated based upon the Company's allocation methodologies, generally based on each segment's respective net revenues, non-interest expenses or other relevant measures.
As a result of treating certain intersegment transactions as transactions with external parties, the Company includes an Intersegment Eliminations category to reconcile the business segment results to the Company's consolidated results. Income before taxes in Intersegment Eliminations primarily represents the effect of timing differences associated with the revenue and expense recognition of commissions paid by the Asset Management business segment to the Global Wealth Management Group business segment associated with sales of certain products and the related compensation costs paid to the Global Wealth Management Group business segment's global representatives. Intersegment eliminations also reflect the effect of fees paid by the Institutional Securities business segment to the Global Wealth Management Group business segment related to the bank deposit program.
| | 216 |
MORGAN STANLEY
NOTES TO CONSOLIDATED FINANCIAL STATEMENTS-(Continued)
Selected financial information for the Company's segments is presented below:
2009 | Institutional Securities | Global Wealth Management Group | Asset Management | Intersegment Eliminations | Total | ||||||||||||||
| (dollars in millions) | |||||||||||||||||||
Total non-interest revenues | $ | 12,692 | $ | 8,729 | $ | 1,411 | $ | (464 | ) | $ | 22,368 | ||||||||
Net interest | 85 | 661 | (74 | ) | 318 | 990 | |||||||||||||
Net revenues | $ | 12,777 | $ | 9,390 | $ | 1,337 | $ | (146 | ) | $ | 23,358 | ||||||||
Income (loss) from continuing operations before income taxes | $ | 982 | $ | 559 | $ | (673 | ) | $ | (11 | ) | $ | 857 | |||||||
(Benefit from) provision for income taxes | (293 | ) | 178 | (218 | ) | (3 | ) | (336 | ) | ||||||||||
Income (loss) from continuing operations | 1,275 | 381 | (455 | ) | (8 | ) | 1,193 | ||||||||||||
Discontinued operations(1): | |||||||||||||||||||
Gain (loss) from discontinued operations | 503 | - | (357 | ) | 14 | 160 | |||||||||||||
Provision for (benefit from) income taxes | 222 | - | (275 | ) | - | (53 | ) | ||||||||||||
Gain (loss) on discontinued operations(2) | 281 | - | (82 | ) | 14 | 213 | |||||||||||||
Net income (loss) | 1,556 | 381 | (537 | ) | 6 | 1,406 | |||||||||||||
Net income (loss) applicable to non-controlling interests | 12 | 98 | (50 | ) | - | 60 | |||||||||||||
Net income (loss) applicable to Morgan Stanley | $ | 1,544 | $ | 283 | $ | (487 | ) | $ | 6 | $ | 1,346 | ||||||||
Fiscal 2008 | Institutional Securities | Global Wealth Management Group | Asset Management | Discover | Intersegment Eliminations | Total | ||||||||||||||||
| (dollars in millions) | ||||||||||||||||||||||
Total non-interest revenues | $ | 12,316 | $ | 6,085 | $ | 601 | $ | - | $ | (258 | ) | $ | 18,744 | |||||||||
Net interest | 2,422 | 934 | (53 | ) | - | 64 | 3,367 | |||||||||||||||
Net revenues | $ | 14,738 | $ | 7,019 | $ | 548 | $ | - | $ | (194 | ) | $ | 22,111 | |||||||||
Income (loss) from continuing operations before income taxes(3) | $ | 1,423 | $ | 1,154 | $ | (1,423 | ) | $ | - | $ | (17 | ) | $ | 1,137 | ||||||||
Provision for (benefit from) income taxes | 113 | 440 | (568 | ) | - | (6 | ) | (21 | ) | |||||||||||||
Income (loss) from continuing operations(3) | 1,310 | 714 | (855 | ) | - | (11 | ) | 1,158 | ||||||||||||||
Discontinued operations(1): | ||||||||||||||||||||||
Gain (loss) from discontinued operations | 1,578 | - | (384 | ) | (100 | ) | 27 | 1,121 | ||||||||||||||
Provision for (benefit from) income taxes | 612 | - | (122 | ) | - | 11 | 501 | |||||||||||||||
Gain (loss) on discontinued operations(2) | 966 | - | (262 | ) | (100 | ) | 16 | 620 | ||||||||||||||
Net income (loss) | 2,276 | 714 | (1,117 | ) | (100 | ) | 5 | 1,778 | ||||||||||||||
Net income applicable to non-controlling interests | 71 | - | - | - | - | 71 | ||||||||||||||||
Net income (loss) applicable to Morgan Stanley | $ | 2,205 | $ | 714 | $ | (1,117 | ) | $ | (100 | ) | $ | 5 | $ | 1,707 | ||||||||
| 217 | |
MORGAN STANLEY
NOTES TO CONSOLIDATED FINANCIAL STATEMENTS-(Continued)
Fiscal 2007 | Institutional Securities | Global Wealth Management Group | Asset Management | Discover | Intersegment Eliminations(4) | Total | |||||||||||||||
| (dollars in millions) | |||||||||||||||||||||
Total non-interest revenues | $ | 13,670 | $ | 5,915 | $ | 4,393 | $ | - | $ | (286 | ) | $ | 23,692 | ||||||||
Net interest | 2,060 | 710 | (29 | ) | - | 45 | 2,786 | ||||||||||||||
Net revenues | $ | 15,730 | $ | 6,625 | $ | 4,364 | $ | - | $ | (241 | ) | $ | 26,478 | ||||||||
Income from continuing operations before income taxes | $ | 650 | $ | 1,155 | $ | 1,055 | $ | - | $ | (84 | ) | $ | 2,776 | ||||||||
(Benefit from) provision for income taxes | (233 | ) | 459 | 382 | - | (32 | ) | 576 | |||||||||||||
Income from continuing operations | 883 | 696 | 673 | - | (52 | ) | 2,200 | ||||||||||||||
Discontinued operations(1): | |||||||||||||||||||||
Gain from discontinued operations | 160 | 174 | 412 | 850 | 86 | 1,682 | |||||||||||||||
Provision for income taxes | 63 | 61 | 159 | 317 | 33 | 633 | |||||||||||||||
Gain on discontinued operations(2) | 97 | 113 | 253 | 533 | 53 | 1,049 | |||||||||||||||
Net income | $ | 980 | $ | 809 | $ | 926 | $ | 533 | $ | 1 | $ | 3,249 | |||||||||
Net income applicable to non-controlling interests | 40 | - | - | - | - | 40 | |||||||||||||||
Net income applicable to Morgan Stanley | $ | 940 | $ | 809 | $ | 926 | $ | 533 | $ | 1 | $ | 3,209 | |||||||||
One Month Ended December 31, 2008 | Institutional Securities | Global Wealth Management Group | Asset Management | Intersegment Eliminations | Total | ||||||||||||||
| (dollars in millions) | |||||||||||||||||||
Total non-interest revenues | $ | (1,468 | ) | $ | 358 | $ | (10 | ) | $ | (21 | ) | $ | (1,141 | ) | |||||
Net interest | 115 | 51 | 1 | 6 | 173 | ||||||||||||||
Net revenues | $ | (1,353 | ) | $ | 409 | $ | (9 | ) | $ | (15 | ) | $ | (968 | ) | |||||
(Loss) income from continuing operations before income taxes | $ | (2,030 | ) | $ | 118 | $ | (114 | ) | $ | (1 | ) | $ | (2,027 | ) | |||||
(Benefit from) provision for income taxes | (733 | ) | 45 | (44 | ) | - | (732 | ) | |||||||||||
(Loss) income from continuing operations | $ | (1,297 | ) | $ | 73 | $ | (70 | ) | $ | (1 | ) | $ | (1,295 | ) | |||||
Discontinued operations(1): | |||||||||||||||||||
Gain from discontinued operations | 12 | - | 4 | 2 | 18 | ||||||||||||||
Provision for income taxes | 5 | - | 2 | 1 | 8 | ||||||||||||||
Gain on discontinued operations(2) | 7 | - | 2 | 1 | 10 | ||||||||||||||
Net (loss) income | $ | (1,290 | ) | $ | 73 | $ | (68 | ) | $ | - | $ | (1,285 | ) | ||||||
Net income applicable to non-controlling interests | 3 | - | - | - | 3 | ||||||||||||||
Net (loss) income applicable to Morgan Stanley | $ | (1,293 | ) | $ | 73 | $ | (68 | ) | $ | - | $ | (1,288 | ) | ||||||
| (1) | See Note 23 for a discussion of discontinued operations. |
| (2) | Amounts include net gains on discontinued operations applicable to Morgan Stanley of $265 million in 2009, $928 million in fiscal 2008, $95 million in fiscal 2007 and $4 million in the one month ended December 31, 2008 primarily related to MSCI that are included in the Institutional Securities business segment. Amounts also include net (loss) gain on discontinued operations applicable to Morgan Stanley of $(82) million in 2009, $(262) million in fiscal 2008 and $2 million in the one month ended December 31, 2008 related to Retail Asset Management and Crescent that are included in the Asset Management business segment and $253 million in fiscal 2007 related to Retail Asset Management. |
| | 218 |
MORGAN STANLEY
NOTES TO CONSOLIDATED FINANCIAL STATEMENTS-(Continued)
| (3) | Income from continuing operations for the Institutional Securities business segment includes correction of prior-period errors of $171 million ($120 million after-tax), $0.11 per diluted share, due to the reversal of valuation adjustments related to interest rate derivatives, and a cumulative negative adjustment of $120 million ($84 million after-tax), $0.08 per diluted share, resulting from incorrect valuations of a London-based trader's positions. The positive adjustment of $171 million related to fiscal 2006. The negative adjustment of $120 million increased income from continuing operations on a pre-tax basis by $45 million and $75 million in fiscal 2007 and fiscal 2008, respectively. The Company does not believe the adjustments, which were recorded in the period identified, were material to those consolidated financial statements after considering both the quantitative amount and qualitative factors as related to the affected financial statements. |
| (4) | The results of the Institutional Securities business segment for fiscal 2007 included a $25 million advisory fee related to the Discover Spin-off that was eliminated in consolidation. |
Net Interest | Institutional Securities | Global Wealth Management Group | Asset Management | Intersegment Eliminations | Total | ||||||||||||
| (dollars in millions) | |||||||||||||||||
2009 | |||||||||||||||||
Interest and dividends | $ | 6,588 | $ | 1,114 | $ | 27 | $ | (27 | ) | $ | 7,702 | ||||||
Interest expense | 6,503 | 453 | 101 | (345 | ) | 6,712 | |||||||||||
Net interest | $ | 85 | $ | 661 | $ | (74 | ) | $ | 318 | $ | 990 | ||||||
Fiscal 2008 | |||||||||||||||||
Interest and dividends | $ | 38,330 | $ | 1,239 | $ | 153 | $ | (43 | ) | $ | 39,679 | ||||||
Interest expense | 35,908 | 305 | 206 | (107 | ) | 36,312 | |||||||||||
Net interest | $ | 2,422 | $ | 934 | $ | (53 | ) | $ | 64 | $ | 3,367 | ||||||
Fiscal 2007 | |||||||||||||||||
Interest and dividends | $ | 59,126 | $ | 1,221 | $ | 65 | $ | (343 | ) | $ | 60,069 | ||||||
Interest expense | 57,066 | 511 | 94 | (388 | ) | 57,283 | |||||||||||
Net interest | $ | 2,060 | $ | 710 | $ | (29 | ) | $ | 45 | $ | 2,786 | ||||||
One Month Ended December 31, 2008 | |||||||||||||||||
Interest and dividends | $ | 1,222 | $ | 66 | $ | 11 | $ | (2 | ) | $ | 1,297 | ||||||
Interest expense | 1,107 | 15 | 10 | (8 | ) | 1,124 | |||||||||||
Net interest | $ | 115 | $ | 51 | $ | 1 | $ | 6 | $ | 173 | |||||||
Total Assets(1) | Institutional Securities | Global Wealth Management Group | Asset Management | Total | ||||||||
| (dollars in millions) | ||||||||||||
At December 31, 2009 | $ | 719,232 | $ | 44,154 | $ | 8,076 | $ | 771,462 | ||||
At December 31, 2008 | $ | 639,866 | $ | 24,273 | $ | 12,625 | $ | 676,764 | ||||
| (1) | Corporate assets have been fully allocated to the Company's business segments. |
The Company operates in both U.S. and non-U.S. markets. The Company's non-U.S. business activities are principally conducted through European and Asian locations. The following tables present selected income statement information and total assets of the Company's operations by geographic area. The selected income statement information and total assets disclosed in the following tables reflect the regional view of the Company's consolidated net revenues, income (loss) from continuing operations before income taxes, net income (loss) applicable to Morgan Stanley and total assets, on a managed basis, based on the following methodology:
| • | Institutional Securities: advisory and equity underwriting-client location, debt underwriting-revenue recording location, sales and trading-trading desk location. |
| 219 | |
MORGAN STANLEY
NOTES TO CONSOLIDATED FINANCIAL STATEMENTS-(Continued)
| • | Global Wealth Management Group: global representative coverage location. |
| • | Asset Management: client location, except for merchant banking business, which is based on asset location. |
Net Revenues | 2009 | Fiscal 2008(1) | Fiscal 2007(1) | One Month Ended December 31, 2008(1) | |||||||||
| (dollars in millions) | |||||||||||||
Americas | $ | 18,904 | $ | 10,766 | $ | 10,771 | $ | (765 | ) | ||||
Europe, Middle East and Africa | 2,459 | 8,949 | 9,927 | (246 | ) | ||||||||
Asia | 1,995 | 2,396 | 5,780 | 43 | |||||||||
Total | $ | 23,358 | $ | 22,111 | $ | 26,478 | $ | (968 | ) | ||||
Total Assets | At December 31, 2009 | At December 31, 2008 | ||||
| (dollars in millions) | ||||||
Americas | $ | 571,829 | $ | 481,979 | ||
Europe, Middle East and Africa | 143,072 | 140,594 | ||||
Asia | 56,561 | 54,191 | ||||
Total | $ | 771,462 | $ | 676,764 | ||
| (1) | Certain reclassifications have been made to prior-period amounts to conform to the current year's presentation. |
22. Joint Venture.
Japan Securities Joint Venture. On March 26, 2009, MUFG and the Company announced that they had signed a memorandum of understanding to form a securities joint venture between Mitsubishi UFJ Securities Co., Ltd. and MSJS.
On November 18, 2009, MUFG and the Company announced further plans to integrate their securities operations in Japan by executing the joint venture through two entities, Mitsubishi UFJ Morgan Stanley Securities Co., Ltd. and Morgan Stanley MUFG Securities Co., Ltd., rather than through a single company. The two joint venture companies will collaborate in a number of business and product areas, including offering the Company's global products and services to retail and middle market customers in Japan. The closing of this transaction is subject to the execution of the definitive agreements and regulatory approvals and other customary closing conditions.
In addition, on June 30, 2009, MUFG and the Company announced the creation of a loan marketing joint venture in the Americas and business referral arrangements in Asia, Europe, the Middle East and Africa. MUFG and the Company also entered into a referral agreement for commodities transactions executed outside of Japan and a transfer of personnel between MUFG and the Company for the sharing of best practices and expertise.
23. Discontinued Operations.
Retail Asset Management Business. On October 19, 2009, as part of a restructuring of its Asset Management business segment, the Company entered into a definitive agreement to sell substantially all of Retail Asset Management, including Van Kampen, to Invesco. This transaction allows the Company's Asset Management business segment to focus on its institutional client base, including corporations, pension plans, large intermediaries, foundations and endowments, sovereign wealth funds, and central banks, among others.
| | 220 |
MORGAN STANLEY
NOTES TO CONSOLIDATED FINANCIAL STATEMENTS-(Continued)
Under the terms of the definitive agreement, Invesco will purchase substantially all of Retail Asset Management, operating under both the Morgan Stanley and Van Kampen brands, in a stock and cash transaction. The Company will receive a 9.4% minority interest in Invesco. The transaction, which has been approved by the Boards of Directors of both companies, is expected to close in mid-2010, subject to customary regulatory, client and fund shareholder approvals. Total assets of Retail Asset Management included in the Company's consolidated statement of financial condition as of December 31, 2009 approximated $743 million. The results of Retail Asset Management are included in discontinued operations for all periods presented.
MSCI. On July 31, 2007, the Company announced that it would sell a minority interest in its subsidiary, MSCI in an IPO. In November 2007, MSCI completed its IPO of 16.1 million shares and received net proceeds of approximately $265 million, net of underwriting discounts, commissions and offering expenses. As the IPO was part of a broader corporate reorganization, contemplated by the Company at the IPO date, the increase in the carrying amount of the Company's investment in MSCI was recorded in Paid-in capital in the Company's consolidated statement of financial condition and the Company's consolidated statement of changes in total equity at November 30, 2007.
In fiscal 2008, the Company sold approximately 53 million of its MSCI shares in two secondary offerings for net proceeds of approximately $1,560 million. During the second quarter of 2009, the Company sold all of its remaining 28 million shares in MSCI in a secondary offering for net proceeds of approximately $573 million. The results of MSCI prior to the divestiture are included in discontinued operations for all periods presented. The results of MSCI were formerly included in the Institutional Securities business segment.
Crescent. Discontinued operations in 2009, fiscal 2008 and the one month ended December 31, 2008 include operating results and gains (losses) related to the disposition of Crescent, a former real estate subsidiary of the Company. The Company completed the disposition of Crescent in the fourth quarter of 2009, whereby the Company transferred its ownership interest in Crescent to Crescent's primary creditor in exchange for full release of liability on the related loans. The results of Crescent were formerly included in the Asset Management business segment. The Company did not consolidate Crescent prior to May 2008.
DFS. On June 30, 2007, the Company completed the Discover Spin-off. The Company distributed all of the outstanding shares of DFS common stock, par value $0.01 per share, to the Company's stockholders of record as of June 18, 2007. The results of DFS are included within discontinued operations for all periods through the date of the Discover Spin-off.
The net assets that were distributed to shareholders on the date of the Discover Spin-off were $5,558 million, which was recorded as a reduction to the Company's retained earnings.
The results of discontinued operations include interest expense that was allocated based upon borrowings that were specifically attributable to DFS' operations through intercompany transactions existing prior to the Discover Spin-off. For fiscal 2007, the amount of interest expense reclassified to discontinued operations was approximately $159 million.
During the fourth quarter of fiscal 2008, DFS announced the settlement of its lawsuit with Visa and MasterCard. At the time of the spin-off of DFS, the Company and DFS negotiated an agreement that entitled the Company to receive approximately $1.3 billion pre-tax in connection with this settlement; however, DFS contends that the Company is in breach of the agreement. The Company has filed a lawsuit to enforce this agreement and this revenue has not yet been included in the Company's results of operations. The results for discontinued operations in fiscal 2008 included costs related to the legal settlement between DFS, Visa and MasterCard. See Note 27 for further information regarding settlement with DFS.
| 221 | |
MORGAN STANLEY
NOTES TO CONSOLIDATED FINANCIAL STATEMENTS-(Continued)
Quilter. On February 28, 2007, the Company sold Quilter, its standalone U.K. mass affluent business that was formerly included within the Global Wealth Management Group business segment. The results of Quilter are included within discontinued operations for all periods presented through the date of sale. Citi subsequently contributed Quilter to the MSSB joint venture. The results of MSSB are included within the Global Wealth Management Group business segment's income from continuing operations effective May 31, 2009.
Summarized Financial Information for the Company's discontinued operations for 2009, fiscal 2008, fiscal 2007 and the one month ended December 31, 2008:
The table below provides information regarding amounts included in discontinued operations (dollars in millions):
| 2009 | Fiscal 2008 | Fiscal 2007 | One Month Ended December 31, 2008 | ||||||||||||
Net revenues: | |||||||||||||||
Crescent(1) | $ | 161 | $ | 34 | $ | - | $ | 78 | |||||||
Retail Asset Management | 628 | 707 | 1,129 | 50 | |||||||||||
MSCI | 651 | 1,884 | 372 | 34 | |||||||||||
DFS | - | - | 2,392 | - | |||||||||||
Other | 5 | - | - | - | |||||||||||
| $ | 1,445 | $ | 2,625 | $ | 3,893 | $ | 162 | ||||||||
Pre-tax (loss) gain on discontinued operations: | |||||||||||||||
Crescent(1) | $ | (613 | ) | $ | (515 | ) | $ | - | $ | (12 | ) | ||||
Retail Asset Management(2) | 268 | 159 | 499 | 17 | |||||||||||
MSCI(3) | 537 | 1,579 | 159 | 13 | |||||||||||
DFS | - | (100 | ) | 850 | - | ||||||||||
Quilter(4) | - | - | 174 | - | |||||||||||
Other | (32 | ) | (2 | ) | - | - | |||||||||
| $ | 160 | $ | 1,121 | $ | 1,682 | $ | 18 | ||||||||
| (1) | The Company did not consolidate Crescent prior to May 2008. Pre-tax loss includes gain on disposition of approximately $126 million ($77 million after-tax) in 2009. |
| (2) | Retail Asset Management amounts include eliminations of intersegment activity. |
| (3) | Amounts include pre-tax gain of approximately $499 million ($279 million after-tax) and $1,463 million ($895 million after-tax) in 2009 and fiscal 2008, respectively, relating to the secondary offerings. |
| (4) | Amount includes gain on disposition of approximately $168 million ($109 million after-tax) in fiscal 2007. |
| | 222 |
MORGAN STANLEY
NOTES TO CONSOLIDATED FINANCIAL STATEMENTS-(Continued)
24. Parent Company.
Parent Company Only
Condensed Statements of Financial Condition
(dollars in millions, except share data)
| December 31, 2009 | December 31, 2008 | |||||||
Assets: | ||||||||
Cash and due from banks | $ | 13,262 | $ | 23,629 | ||||
Interest bearing deposits with banks | 3,537 | 21,610 | ||||||
Financial instruments owned | 7,049 | 8,160 | ||||||
Securities purchased under agreement to resell with affiliate | 48,048 | 18,793 | ||||||
Advances to subsidiaries: | ||||||||
Bank and bank holding company | 1,872 | 3,036 | ||||||
Non-bank | 157,782 | 174,431 | ||||||
Investment in subsidiaries, at equity: | ||||||||
Bank and bank holding company | 5,206 | 6,328 | ||||||
Non-bank | 35,425 | 30,110 | ||||||
Other assets | 8,749 | 6,303 | ||||||
Total assets | $ | 280,930 | $ | 292,400 | ||||
Liabilities and Shareholders' Equity: | ||||||||
Commercial paper and other short-term borrowings | $ | 1,151 | $ | 6,894 | ||||
Financial instruments sold, not yet purchased | 1,588 | - | ||||||
Payables to subsidiaries | 41,275 | 52,327 | ||||||
Other liabilities and accrued expenses | 3,068 | 3,507 | ||||||
Long-term borrowings | 187,160 | 180,919 | ||||||
| 234,242 | 243,647 | |||||||
Commitments and contingencies | ||||||||
Shareholders' equity: | ||||||||
Preferred stock | 9,597 | 19,168 | ||||||
Common stock, $0.01 par value; | ||||||||
Shares authorized: 3,500,000,000 in 2009 and 2008; | ||||||||
Shares issued: 1,487,850,163 in 2009 and 1,211,701,552 in 2008; | ||||||||
Shares outstanding: 1,360,595,214 in 2009 and 1,074,497,565 in 2008 | 15 | 12 | ||||||
Paid-in capital | 8,619 | 459 | ||||||
Retained earnings | 35,056 | 36,154 | ||||||
Employee stock trust | 4,064 | 4,312 | ||||||
Accumulated other comprehensive loss | (560 | ) | (420 | ) | ||||
Common stock held in treasury, at cost, $0.01 par value; 127,254,949 shares in 2009 and 137,203,987 shares in 2008 | (6,039 | ) | (6,620 | ) | ||||
Common stock issued to employee trust | (4,064 | ) | (4,312 | ) | ||||
Total shareholders' equity | 46,688 | 48,753 | ||||||
Total liabilities and shareholders' equity | $ | 280,930 | $ | 292,400 | ||||
| 223 | |
MORGAN STANLEY
NOTES TO CONSOLIDATED FINANCIAL STATEMENTS-(Continued)
Parent Company Only
Condensed Statements of Income and Comprehensive Income
(dollars in millions)
| 2009 | Fiscal 2008 | Fiscal 2007 | One Month Ended December 31, 2008 | |||||||||||||
Revenues: | ||||||||||||||||
Dividends from bank subsidiary | $ | - | $ | - | $ | 6 | $ | - | ||||||||
Dividends from non-bank subsidiary | 6,117 | 4,209 | 6,969 | 14 | ||||||||||||
Undistributed loss of subsidiaries | (307 | ) | (6,844 | ) | (3,500 | ) | (1,305 | ) | ||||||||
Principal transactions | (5,592 | ) | 7,547 | 613 | 548 | |||||||||||
Other | 484 | 1,451 | (2 | ) | 612 | |||||||||||
Total non-interest revenues | 702 | 6,363 | 4,086 | (131 | ) | |||||||||||
Interest and dividends | 4,432 | 11,098 | 9,211 | 658 | ||||||||||||
Interest expense | 6,153 | 12,167 | 9,834 | 1,164 | ||||||||||||
Net interest | (1,721 | ) | (1,069 | ) | (623 | ) | (506 | ) | ||||||||
Net revenues | (1,019 | ) | 5,294 | 3,463 | (637 | ) | ||||||||||
Non-interest expenses: | ||||||||||||||||
Non-interest expenses | 461 | 767 | 427 | 649 | ||||||||||||
(Loss) income before income tax provision (benefit) | (1,480 | ) | 4,527 | 3,036 | (1,286 | ) | ||||||||||
(Benefit from) provision for income taxes | (2,826 | ) | 2,820 | (173 | ) | 2 | ||||||||||
Net income (loss) | 1,346 | 1,707 | 3,209 | (1,288 | ) | |||||||||||
Other comprehensive income (loss), net of tax: | ||||||||||||||||
Foreign currency translation adjustment | 116 | (160 | ) | 65 | (96 | ) | ||||||||||
Net change in cash flow hedges | 13 | 16 | 19 | 2 | ||||||||||||
Minimum pension liability adjustment | - | - | (40 | ) | - | |||||||||||
Net (loss) gain related to pension and other postretirement adjustments | (301 | ) | 203 | - | (200 | ) | ||||||||||
Prior service credit related to pension and postretirement benefits | 10 | - | - | - | ||||||||||||
Amortization of net loss related to pension and postretirement benefits | 28 | 19 | - | - | ||||||||||||
Amortization of prior service credit related to pension and postretirement benefits | (6 | ) | (6 | ) | - | (1 | ) | |||||||||
Comprehensive income (loss) | $ | 1,206 | $ | 1,779 | $ | 3,253 | $ | (1,583 | ) | |||||||
Net income (loss) | $ | 1,346 | $ | 1,707 | $ | 3,209 | $ | (1,288 | ) | |||||||
(Loss) earnings applicable to common shareholders | $ | (907 | ) | $ | 1,495 | $ | 2,976 | $ | (1,624 | ) | ||||||
| | 224 |
MORGAN STANLEY
NOTES TO CONSOLIDATED FINANCIAL STATEMENTS-(Continued)
Parent Company Only
Condensed Statements of Cash Flows
(dollars in millions)
| 2009 | Fiscal 2008 | Fiscal 2007 | One Month Ended December 31, 2008 | |||||||||||||
Cash flows from operating activities: | ||||||||||||||||
Net income (loss) | $ | 1,346 | $ | 1,707 | $ | 3,209 | $ | (1,288 | ) | |||||||
Adjustments to reconcile net income (loss) to net cash provided by operating activities: | ||||||||||||||||
Compensation payable in common stock and stock options | 1,265 | 1,878 | 1,941 | 150 | ||||||||||||
Undistributed loss of subsidiaries | 307 | 6,844 | 3,500 | 1,305 | ||||||||||||
Gains on business dispositions | (606 | ) | (1,464 | ) | - | - | ||||||||||
Change in assets and liabilities: | ||||||||||||||||
Financial instruments owned, net of financial instruments sold, not yet purchased | 5,505 | (2,568 | ) | 2,796 | 467 | |||||||||||
Other assets | (5,036 | ) | (1,584 | ) | 6,346 | (1,015 | ) | |||||||||
Other liabilities and accrued expenses | (10,134 | ) | 25,377 | (29,080 | ) | (4,097 | ) | |||||||||
Net cash (used in) provided by operating activities | (7,353 | ) | 30,190 | (11,288 | ) | (4,478 | ) | |||||||||
Cash flows from investing activities: | ||||||||||||||||
Advances to and investments in subsidiaries | 13,375 | (25,651 | ) | (12,376 | ) | (5,013 | ) | |||||||||
Securities purchased under agreement to resell with affiliate | (29,255 | ) | 48,137 | (13,784 | ) | (12,794 | ) | |||||||||
Business dispositions | 565 | 1,560 | - | - | ||||||||||||
Net cash (used in) provided by investing activities | (15,315 | ) | 24,046 | (26,160 | ) | (17,807 | ) | |||||||||
Cash flows from financing activities: | ||||||||||||||||
Net (payments for) proceeds from short-term borrowings | (5,743 | ) | (14,224 | ) | 6,360 | 504 | ||||||||||
MSCI Inc. initial public offering | - | - | 265 | - | ||||||||||||
Excess tax benefits associated with stock-based awards | 102 | 47 | 281 | - | ||||||||||||
Net proceeds from: | ||||||||||||||||
Morgan Stanley public offerings of common stock | 6,212 | - | - | - | ||||||||||||
Issuance of preferred stock and common stock warrant | - | 18,997 | - | - | ||||||||||||
Issuance of common stock | 43 | 397 | 927 | 4 | ||||||||||||
Issuance of long-term borrowings | 30,112 | 35,420 | 60,651 | 9,846 | ||||||||||||
Payments for: | ||||||||||||||||
Series D Preferred Stock and Warrant | (10,950 | ) | - | - | - | |||||||||||
Repurchases of common stock through capital management share repurchase program | - | (711 | ) | (3,753 | ) | - | ||||||||||
Repurchases of common stock for employee tax withholding | (50 | ) | (1,117 | ) | (438 | ) | (3 | ) | ||||||||
Repayments of long-term borrowings | (24,315 | ) | (44,412 | ) | (22,523 | ) | (341 | ) | ||||||||
Cash dividends | (1,732 | ) | (1,227 | ) | (1,219 | ) | - | |||||||||
Net cash (used for) provided by financing activities | (6,321 | ) | (6,830 | ) | 40,551 | 10,010 | ||||||||||
Effect of exchange rate changes on cash and cash equivalents | 549 | (2,375 | ) | 242 | 2,259 | |||||||||||
Net (decrease) increase in cash and cash equivalents | (28,440 | ) | 45,031 | 3,345 | (10,016 | ) | ||||||||||
Cash and cash equivalents, at beginning of period | 45,239 | 10,224 | 6,879 | 55,255 | ||||||||||||
Cash and cash equivalents, at end of period | $ | 16,799 | $ | 55,255 | $ | 10,224 | $ | 45,239 | ||||||||
Supplemental Disclosure of Cash Flow Information
Cash payments for interest were $6,758 million, $12,098 million, $9,595 million and $1,059 million for 2009, fiscal 2008, fiscal 2007 and the one month ended December 31, 2008, respectively.
Cash (refund) payments for income taxes were $325 million, $(688) million, $847 million and $2 million for 2009, fiscal 2008, fiscal 2007 and the one month ended December 31, 2008, respectively.
| 225 | |
MORGAN STANLEY
NOTES TO CONSOLIDATED FINANCIAL STATEMENTS-(Continued)
Parent Company Only
Notes To Condensed Financial Statements
Transactions with Subsidiaries.
The Company has transactions with its consolidated subsidiaries determined on an agreed-upon basis and has guaranteed certain unsecured lines of credit and contractual obligations of certain of its consolidated subsidiaries.
Guarantees.
In the normal course of its business, the Company guarantees certain of its subsidiaries' obligations under derivative and other financial arrangements. The Company records Financial instruments owned and Financial instruments sold, not yet purchased, which include derivative contracts, at fair value on its consolidated statements of financial condition.
The Company also, in the normal course of its business, provides standard indemnities to counterparties on behalf of its subsidiaries for taxes, including U.S. and foreign withholding taxes, on interest and other payments made on derivatives, securities and stock lending transactions and certain annuity products. These indemnity payments could be required based on a change in the tax laws or change in interpretation of applicable tax rulings. Certain contracts contain provisions that enable the Company to terminate the agreement upon the occurrence of such events. The maximum potential amount of future payments that the Company could be required to make under these indemnifications cannot be estimated. The Company has not recorded any contingent liability in the condensed financial statements for these indemnifications and believes that the occurrence of any events that would trigger payments under these contracts is remote.
The Company has issued guarantees on behalf of its subsidiaries to various U.S. and non-U.S. exchanges and clearinghouses that trade and clear securities and/or futures contracts. Under these guarantee arrangements, the Company may be required to pay the financial obligations of its subsidiaries related to business transacted on or with the exchanges and clearinghouses in the event of a subsidiary's default on its obligations to the exchange or the clearinghouse. The Company has not recorded any contingent liability in the condensed financial statements for these arrangements and believes that any potential requirements to make payments under these arrangements is remote.
The Company guarantees certain debt instruments and warrants issued by subsidiaries. The debt instruments totaled $5.4 billion and $5.9 billion and the warrants totaled $0.1 billion and $0.2 billion as of December 31, 2009 and December 31, 2008. In connection with subsidiary lease obligations, the Company has issued guarantees to various lessors. As of December 31, 2009 and December 31, 2008, the Company had $1.6 billion and $1.5 billion outstanding under subsidiary lease obligations, primarily in the U.K.
As of December 31, 2009, the Company had $138 million in guarantees related to Crescent.
| | 226 |
MORGAN STANLEY
NOTES TO CONSOLIDATED FINANCIAL STATEMENTS-(Continued)
25. Transition Period Financial Information.
| One Month Ended December 31, | |||||||
| 2008 | 2007 (Unaudited) | ||||||
(dollars in millions, except share and per share data) | |||||||
Income Statement Data: | |||||||
Net revenues | $ | (968 | ) | $ | 2,907 | ||
(Loss) income from continuing operations before income taxes | $ | (2,027 | ) | $ | 903 | ||
(Benefit from) provision for income taxes | (732 | ) | 303 | ||||
(Loss) income from continuing operations | (1,295 | ) | 600 | ||||
Discontinued operations: | |||||||
Gain from discontinued operations | 18 | 52 | |||||
Provision for income taxes | 8 | 21 | |||||
Gain on discontinued operations | 10 | 31 | |||||
Net (loss) income | $ | (1,285 | ) | $ | 631 | ||
Net income applicable to non-controlling interest | $ | 3 | $ | 5 | |||
Net (loss) income applicable to Morgan Stanley | $ | (1,288 | ) | $ | 626 | ||
Amounts attributable to Morgan Stanley common shareholders: | |||||||
(Loss) income from continuing operations, net of tax | $ | (1,295 | ) | $ | 596 | ||
Gain from discontinued operations, net of tax | 7 | 30 | |||||
Net (loss) income applicable to Morgan Stanley | $ | (1,288 | ) | $ | 626 | ||
Per Share Data: | |||||||
(Loss) earnings per basic common share: | |||||||
(Loss) income from continuing operations | $ | (1.63 | ) | $ | 0.55 | ||
Gain on discontinued operations | 0.01 | 0.03 | |||||
(Loss) earnings per basic common share | $ | (1.62 | ) | $ | 0.58 | ||
(Loss) earnings per diluted common share: | |||||||
(Loss) income from continuing operations | $ | (1.63 | ) | $ | 0.54 | ||
Gain on discontinued operations | 0.01 | 0.03 | |||||
(Loss) earnings per diluted common share | $ | (1.62 | ) | $ | 0.57 | ||
Average common shares outstanding: | |||||||
Basic | 1,002,058,928 | 1,001,916,565 | |||||
Diluted | 1,002,058,928 | 1,014,454,968 | |||||
Balance Sheet Data: | |||||||
Total assets | $ | 676,764 | $ | 1,097,021 | |||
Total capital | 208,008 | 198,210 | |||||
Long-term borrowings | 179,835 | 199,459 | |||||
Total Morgan Stanley shareholders' equity | 48,753 | 31,777 | |||||
Non-controlling interests | 703 | 1,571 | |||||
Total equity | 49,456 | 33,348 | |||||
| 227 | |
MORGAN STANLEY
NOTES TO CONSOLIDATED FINANCIAL STATEMENTS-(Continued)
26. Quarterly Results (unaudited).
| 2009 Quarter | 2008 Fiscal Quarter | ||||||||||||||||||||||||||||||||
| First | Second | Third | Fourth | First | Second(1) | Third | Fourth(2) | One Month Ended December 31, 2008 | |||||||||||||||||||||||||
| (dollars in millions, except per share data) | |||||||||||||||||||||||||||||||||
Total non-interest revenues | $ | 2,699 | $ | 5,638 | $ | 7,801 | $ | 6,230 | $ | 6,888 | $ | 5,326 | $ | 5,734 | $ | 796 | $ | (1,141 | ) | ||||||||||||||
Net interest | 197 | (443 | ) | 624 | 612 | 1,110 | 107 | 1,224 | 926 | 173 | |||||||||||||||||||||||
Net revenues | 2,896 | 5,195 | 8,425 | 6,842 | 7,998 | 5,433 | 6,958 | 1,722 | (968 | ) | |||||||||||||||||||||||
Total non-interest expenses | 3,530 | 5,784 | 6,983 | 6,204 | 5,869 | 4,815 | 5,737 | 4,553 | 1,059 | ||||||||||||||||||||||||
(Loss) income from continuing operations before income taxes | (634 | ) | (589 | ) | 1,442 | 638 | 2,129 | 618 | 1,221 | (2,831 | ) | (2,027 | ) | ||||||||||||||||||||
(Benefit from) provision for income taxes | (597 | ) | (321 | ) | 510 | 72 | 624 | 102 | 233 | (980 | ) | (732 | ) | ||||||||||||||||||||
(Loss) income from continuing operations | (37 | ) | (268 | ) | 932 | 566 | 1,505 | 516 | 988 | (1,851 | ) | (1,295 | ) | ||||||||||||||||||||
Discontinued operations(3): | |||||||||||||||||||||||||||||||||
(Loss) net gain from discontinued operations | (252 | ) | 485 | (226 | ) | 153 | 104 | 862 | 755 | (601 | ) | 18 | |||||||||||||||||||||
(Benefit from) provision for income taxes | (99 | ) | 184 | (87 | ) | (51 | ) | 41 | 337 | 296 | (174 | ) | 8 | ||||||||||||||||||||
Net (loss) gain on discontinued operations | (153 | ) | 301 | (139 | ) | 204 | 63 | 525 | 459 | (427 | ) | 10 | |||||||||||||||||||||
Net (loss) gain | (190 | ) | 33 | 793 | 770 | 1,568 | 1,041 | 1,447 | (2,278 | ) | (1,285 | ) | |||||||||||||||||||||
Net (loss) gain applicable to non-controlling interests | (13 | ) | (116 | ) | 36 | 153 | 17 | 16 | 20 | 18 | 3 | ||||||||||||||||||||||
Net (loss) gain applicable to Morgan Stanley | $ | (177 | ) | $ | 149 | $ | 757 | $ | 617 | $ | 1,551 | $ | 1,025 | $ | 1,427 | $ | (2,296 | ) | $ | (1,288 | ) | ||||||||||||
(Loss) earnings applicable to Morgan Stanley common shareholders(4) | $ | (578 | ) | $ | (1,256 | ) | $ | 498 | $ | 376 | $ | 1,440 | $ | 947 | $ | 1,331 | $ | (2,380 | ) | $ | (1,624 | ) | |||||||||||
(Loss) earnings per basic common share(5): | |||||||||||||||||||||||||||||||||
(Loss) income from continuing operations | $ | (0.41 | ) | $ | (1.36 | ) | $ | 0.48 | $ | 0.14 | $ | 1.36 | $ | 0.44 | $ | 0.87 | $ | (1.92 | ) | $ | (1.63 | ) | |||||||||||
(Loss) income gain on discontinued operations | (0.16 | ) | 0.26 | (0.09 | ) | 0.15 | 0.05 | 0.47 | 0.41 | (0.43 | ) | 0.01 | |||||||||||||||||||||
(Loss) earnings per basic common share | $ | (0.57 | ) | $ | (1.10 | ) | $ | 0.39 | $ | 0.29 | $ | 1.41 | $ | 0.91 | $ | 1.28 | $ | (2.35 | ) | $ | (1.62 | ) | |||||||||||
(Loss) earnings per diluted common share(5): | |||||||||||||||||||||||||||||||||
(Loss) income from continuing operations | $ | (0.41 | ) | $ | (1.36 | ) | $ | 0.48 | $ | 0.14 | $ | 1.35 | $ | 0.44 | $ | 0.87 | $ | (1.92 | ) | $ | (1.63 | ) | |||||||||||
Net (loss) gain on discontinued operations | (0.16 | ) | 0.26 | (0.10 | ) | 0.15 | 0.05 | 0.47 | 0.40 | (0.43 | ) | 0.01 | |||||||||||||||||||||
(Loss) earnings per diluted common share | $ | (0.57 | ) | $ | (1.10 | ) | $ | 0.38 | $ | 0.29 | $ | 1.40 | $ | 0.91 | $ | 1.27 | $ | (2.35 | ) | $ | (1.62 | ) | |||||||||||
Dividends declared to common shareholders | $ | 0.00 | $ | 0.07 | $ | 0.05 | $ | 0.05 | $ | 0.27 | $ | 0.27 | $ | 0.27 | $ | 0.27 | $ | 0.27 | |||||||||||||||
Book value | $ | 27.10 | $ | 27.21 | $ | 27.05 | $ | 27.26 | $ | 29.11 | $ | 30.11 | $ | 31.25 | $ | 30.24 | $ | 27.53 | |||||||||||||||
| (1) | Income from continuing operations includes correction of prior-period errors of $171 million ($120 million after-tax), $0.11 per diluted share, due to the reversal of valuation adjustments related to interest rate derivatives, and a cumulative negative adjustment of $120 million ($84 million after-tax), $0.08 per diluted share, resulting from incorrect valuations of a London-based trader's positions The positive adjustment of $171 million related to fiscal 2006. The negative adjustment of $120 million increased income from continuing operations on a pre-tax basis by $45 million and $75 million in fiscal 2007 and fiscal 2008, respectively. The Company does not believe the adjustments, which were recorded in the period identified, were material to those consolidated financial statements after considering both the quantitative amount and qualitative factors as related to the affected financial statements. These amounts are included in the Institutional Securities business segment (see Note 21). |
| | 228 |
MORGAN STANLEY
NOTES TO CONSOLIDATED FINANCIAL STATEMENTS-(Continued)
| (2) | Results for the Company in the fourth quarter of fiscal 2008 included gains of approximately $3.0 billion from the widening of the Company's credit spreads on certain long-term and short-term borrowings, gains of approximately $2.3 billion from the repurchase of the Company's debt, net losses of approximately $1.7 billion associated with loans and lending commitments, mortgage-related writedowns of $1.2 billion, mark-to-market gains of approximately $1.4 billion after the de-designation of hedges against certain of the Company's debt and charges of $725 million related to the impairment of goodwill and intangible assets. |
| (3) | See Note 23 for a discussion of discontinued operations. |
| (4) | No losses were allocated to the Equity Units in the first and second quarter of 2009, the fourth quarter of fiscal 2008 and the one month ended December 31, 2008 (see Note 2 and Note 14). |
| (5) | Summation of the quarters' earnings per common share may not equal the annual amounts due to the averaging effect of the number of shares and share equivalents throughout the year. |
27. Subsequent Events.
Settlement with DFS. On February 11, 2010, the Company and DFS entered into an agreement in which each party released the other party from claims related to the sharing of proceeds from the lawsuit against Visa and MasterCard. In addition, the Company and DFS entered into an agreement to provide that payments made by DFS to the Company in satisfaction of its obligations under the special dividend declared by DFS in June 2007, shall not exceed $775 million. Also on February 11, 2010, DFS paid the Company $775 million in complete satisfaction of its obligations to the Company under the special dividend. The payment will be included in discontinued operations in the Company's condensed consolidated statement of income for the first quarter of 2010.
Common Dividend. On January 20, 2010, the Company announced that its Board of Directors declared a quarterly dividend per common share of $0.05. The dividend is payable on February 12, 2010 to common shareholders of record on January 29, 2010.
The Company has evaluated its subsequent events through the filing date of this Form 10-K Report.
| 229 | |
FINANCIAL DATA SUPPLEMENT (Unaudited)
Average Balances and Interest Rates and Net Interest Revenue
| Year Ended December 31, 2009 | ||||||||||
| Average Weekly Balance | Interest | Average Rate | ||||||||
| (dollars in millions) | ||||||||||
Assets | ||||||||||
Interest earning assets: | ||||||||||
Financial instruments owned(1): | ||||||||||
U.S | $ | 143,885 | $ | 4,183 | 2.9 | % | ||||
Non-U.S | 77,531 | 972 | 1.3 | % | ||||||
Receivables from other loans: | ||||||||||
U.S | 6,339 | 207 | 3.3 | % | ||||||
Non-U.S | 314 | 22 | 7.0 | % | ||||||
Interest bearing deposits with banks: | ||||||||||
U.S | 44,523 | 149 | 0.3 | % | ||||||
Non-U.S | 16,300 | 92 | 0.6 | % | ||||||
Federal funds sold and securities purchased under agreements to resell and securities borrowed: | ||||||||||
U.S | 176,904 | 237 | 0.1 | % | ||||||
Non-U.S | 85,079 | 622 | 0.7 | % | ||||||
Other: | ||||||||||
U.S | 27,691 | 1,225 | 4.4 | % | ||||||
Non-U.S | 17,261 | (7 | ) | - | ||||||
Total interest earning assets | $ | 595,827 | $ | 7,702 | 1.3 | % | ||||
Non-interest earning assets | 145,719 | |||||||||
Total assets | $ | 741,546 | ||||||||
Liabilities and Equity | ||||||||||
Interest bearing liabilities: | ||||||||||
Commercial paper and other short-term borrowings: | ||||||||||
U.S | $ | 2,101 | $ | 31 | 1.5 | % | ||||
Non-U.S | 1,276 | 20 | 1.6 | % | ||||||
Deposits: | ||||||||||
U.S | 61,164 | 782 | 1.3 | % | ||||||
Non-U.S | 116 | - | - | |||||||
Long-term debt: | ||||||||||
U.S | 181,280 | 4,882 | 2.7 | % | ||||||
Non-U.S | 3,712 | 16 | 0.4 | % | ||||||
Financial instruments sold, not yet purchased(1): | ||||||||||
U.S | 29,153 | - | - | |||||||
Non-U.S | 40,440 | - | - | |||||||
Securities sold under agreements to repurchase and securities loaned: | ||||||||||
U.S | 115,653 | 749 | 0.6 | % | ||||||
Non-U.S | 49,222 | 625 | 1.3 | % | ||||||
Other: | ||||||||||
U.S | 84,015 | (590 | ) | (0.7 | )% | |||||
Non-U.S | 29,437 | 197 | 0.7 | % | ||||||
Total interest bearing liabilities | $ | 597,569 | $ | 6,712 | 1.1 | % | ||||
Non-interest bearing liabilities and equity | 143,977 | |||||||||
Total liabilities and equity | $ | 741,546 | ||||||||
Net interest revenues and net interest rate spread | $ | 990 | 0.2 | % | ||||||
230
| Fiscal 2008 | |||||||||
| Average Month-End Balance | Interest | Average Rate | |||||||
| (dollars in millions) | |||||||||
Assets | |||||||||
Interest earning assets: | |||||||||
Financial instruments owned(1) | $ | 288,639 | $ | 9,961 | 3.5 | % | |||
Receivables from other loans | 12,463 | 784 | 6.3 | % | |||||
Other interest earning assets(2): | |||||||||
Interest bearing deposits with banks | 80,273 | - | - | ||||||
Federal funds sold and securities purchased under resale agreements | 134,452 | - | - | ||||||
Securities borrowed | 223,037 | - | - | ||||||
Receivables from customers | 58,903 | - | - | ||||||
Total other interest earning assets | 496,665 | 28,934 | 5.8 | % | |||||
Total interest earning assets | $ | 797,767 | $ | 39,679 | 5.0 | % | |||
Non-interest earning assets | 208,841 | ||||||||
Total assets | $ | 1,006,608 | |||||||
Liabilities and Equity | |||||||||
Interest bearing liabilities: | |||||||||
Commercial paper and other short-term borrowings | $ | 21,249 | $ | 663 | 3.1 | % | |||
Deposits | 35,311 | 740 | 2.1 | % | |||||
Long-term debt | 194,028 | 7,793 | 4.0 | % | |||||
Financial instruments sold, not yet purchased(1) | 80,166 | - | - | ||||||
Other interest bearing liabilities(2): | |||||||||
Securities sold under agreements to repurchase | 168,659 | - | - | ||||||
Securities loaned | 58,754 | - | - | ||||||
Payables to customers | 238,088 | - | - | ||||||
Total other interest bearing liabilities | 465,501 | 27,116 | 5.8 | % | |||||
Total interest bearing liabilities | $ | 796,255 | $ | 36,312 | 4.6 | % | |||
Non-interest bearing liabilities and equity | 210,353 | ||||||||
Total liabilities and equity | $ | 1,006,608 | |||||||
Net interest revenues and net interest rate spread | $ | 3,367 | 0.4 | % | |||||
231
| One Month Ended December 31, 2008 | |||||||||
| Average Month-End Balance | Interest | Annualized Average Rate | |||||||
| (dollars in millions) | |||||||||
Assets | |||||||||
Interest earning assets: | |||||||||
Financial instruments owned(1) | |||||||||
U.S | $ | 122,842 | $ | 565 | 5.4 | % | |||
Non-U.S | 49,384 | 38 | 0.9 | % | |||||
Receivables from other loans | |||||||||
U.S | 6,527 | 15 | 2.7 | % | |||||
Non-U.S | 5 | - | - | ||||||
Interest bearing deposits with banks | |||||||||
U.S | 56,784 | 4 | 0.1 | % | |||||
Non-U.S | 18,053 | 15 | 1.0 | % | |||||
Federal funds sold and securities purchased under agreements to resell and securities borrowed | |||||||||
U.S | 99,626 | 166 | 2.0 | % | |||||
Non-U.S | 65,568 | 214 | 3.8 | % | |||||
Other | |||||||||
U.S | 60,121 | 149 | 2.9 | % | |||||
Non-U.S | 18,698 | 131 | 8.3 | % | |||||
Total interest earning assets | 497,608 | $ | 1,297 | 3.1 | % | ||||
Non-interest earning assets | 170,292 | ||||||||
Total assets | $ | 667,900 | |||||||
Liabilities and Equity | |||||||||
Interest bearing liabilities: | |||||||||
Commercial paper and other short-term borrowings | |||||||||
U.S | $ | 7,210 | $ | 27 | 4.4 | % | |||
Non-U.S | 3,385 | 6 | 2.1 | % | |||||
Deposits | |||||||||
U.S | 47,082 | 53 | 1.3 | % | |||||
Non-U.S | 137 | - | 3.4 | % | |||||
Long-term debt | |||||||||
U.S | 169,117 | 570 | 4.0 | % | |||||
Non-U.S | 3,463 | 9 | 3.1 | % | |||||
Financial instruments sold, not yet purchased(1) | |||||||||
U.S | 36,450 | - | - | ||||||
Non-U.S | 10,028 | - | - | ||||||
Securities sold under agreements to repurchase and securities loaned | |||||||||
U.S | 76,223 | 99 | 1.5 | % | |||||
Non-U.S | 34,578 | 256 | 8.7 | % | |||||
Other | |||||||||
U.S | 90,993 | 14 | 0.2 | % | |||||
Non-U.S | 31,604 | 90 | 3.4 | % | |||||
Total interest bearing liabilities | 510,270 | $ | 1,124 | 2.6 | % | ||||
Non-interest bearing liabilities and equity | 157,630 | ||||||||
Total liabilities and equity | $ | 667,900 | |||||||
Net interest revenues and net interest rate spread | $ | 173 | 0.5 | % | |||||
| (1) | Interest expense on Financial instruments sold, not yet purchased is reported as a reduction of Interest and dividends revenues. |
232
| (2) | Amounts primarily relate to securities financing transactions, which include repurchase and resale agreements, securities borrowed and loaned transactions, customer receivables/payables and segregated customer cash. The Company considers its principal trading, investment banking, commissions, and interest and dividend income, along with the associated interest expense as one integrated activity for each of the Company's separate businesses and is therefore unable to further breakout Interest and dividends and Interest expense (see Note 1 to the consolidated financial statements). |
Rate/Volume Analysis
The following table sets forth an analysis of the effect on net interest income of volume and rate changes for 2009 versus fiscal 2008.
| 2009 versus Fiscal 2008 | ||||||||||||
| Increase (decrease) due to change in: | ||||||||||||
| Volume | Rate | Net change | ||||||||||
| (in millions) | ||||||||||||
Interest earning assets | ||||||||||||
Financial instruments owned | $ | (2,320 | ) | $ | (2,486 | ) | $ | (4,806 | ) | |||
Receivables from other loans | (365 | ) | (190 | ) | (555 | ) | ||||||
Other interest earning assets | (7,510 | ) | (19,106 | ) | (26,616 | ) | ||||||
Change in interest income | $ | (10,195 | ) | $ | (21,782 | ) | $ | (31,977 | ) | |||
Interest bearing liabilities | ||||||||||||
Commercial paper and other short-term borrowings | $ | (558 | ) | $ | (54 | ) | $ | (612 | ) | |||
Interest bearing deposits | 544 | (502 | ) | 42 | ||||||||
Long-term debt | (363 | ) | (2,532 | ) | (2,895 | ) | ||||||
Other interest bearing liabilities | (10,903 | ) | (15,232 | ) | (26,135 | ) | ||||||
Change in interest expense | $ | (11,280 | ) | $ | (18,320 | ) | $ | (29,600 | ) | |||
Change in net interest income | $ | 1,085 | $ | (3,462 | ) | $ | (2,377 | ) | ||||
Deposits
| Average Deposits(1) | ||||||||||||||||||||||||
| 2009 | Fiscal 2008 | Fiscal 2007 | One Month Ended December 31, 2008 | |||||||||||||||||||||
| Average Amount(1) | Average Rate | Average Amount(1) | Average Rate | Average Amount(1) | Average Rate | Average Amount(1) | Average Rate | |||||||||||||||||
| (in millions) | (%) | (in millions) | (%) | (in millions) | (%) | (in millions) | (%) | |||||||||||||||||
Interest bearing deposits(2): | ||||||||||||||||||||||||
Savings deposits | $ | 52,397 | 0.9 | % | $ | 33,756 | 2.0 | % | $ | 17,732 | 3.8 | % | $ | 38,911 | 0.8 | % | ||||||||
Time deposits | 8,883 | 3.7 | % | 1,555 | 4.0 | % | 4,280 | 4.9 | % | 8,308 | 3.9 | % | ||||||||||||
Total | $ | 61,280 | 1.3 | % | $ | 35,311 | 2.1 | % | $ | 22,012 | 4.0 | % | $ | 47,219 | 1.3 | % | ||||||||
| (1) | Average balances are calculated based upon weekly balances for 2009 and month-end balances for fiscal 2008, fiscal 2007, and the one month ended December 31, 2008. |
| (2) | Deposits are primarily located in U.S. offices. |
Ratios
| 2009 | Fiscal 2008 | Fiscal 2007 | One Month Ended December 31, 2008 | |||||||||
Net income to average assets | 0.2 | % | 0.2 | % | 0.3 | % | N/M | |||||
Return on common equity(1) | N/M | 4.5 | % | 8.4 | % | N/M | ||||||
Return on total equity(2) | 2.8 | % | 4.6 | % | 8.8 | % | N/M | |||||
Dividend payout ratio(3) | N/M | 77.7 | % | 37.2 | % | N/M | ||||||
Total average common equity to average assets | 4.6 | % | 3.3 | % | 2.9 | % | 4.6 | % | ||||
Total average equity to average assets | 6.5 | % | 3.7 | % | 3.0 | % | 7.5 | % |
| N/M-Not | meaningful |
| (1) | Based on net income applicable to common shareholders as a percentage of average common equity. |
233
| (2) | Based on net income as a percentage of average total equity. |
| (3) | Dividends declared per common share as a percentage of net income per diluted share. |
Short-term Borrowings
| 2009 | Fiscal 2008 | Fiscal 2007 | One Month Ended December 31, 2008 | |||||||||||||
| (dollars in millions) | ||||||||||||||||
Securities sold under repurchase agreements(1): | ||||||||||||||||
Period-end balance | $ | 159,401 | $ | 102,401 | $ | 162,840 | 92,213 | |||||||||
Average balance(2) | 142,197 | 168,659 | 274,959 | 97,307 | ||||||||||||
Maximum balance at any month-end | 210,482 | 272,126 | 335,522 | 102,401 | ||||||||||||
Securities loaned(1): | ||||||||||||||||
Period-end balance | $ | 26,246 | $ | 14,821 | $ | 110,423 | $ | 14,580 | ||||||||
Average balance(2) | 22,679 | 58,754 | 153,008 | 14,701 | ||||||||||||
Maximum balance at any month-end | 26,867 | 110,446 | 209,592 | 14,821 | ||||||||||||
Commercial paper: | ||||||||||||||||
Period-end balance | $ | 783 | $ | 6,744 | $ | 22,596 | $ | 7,388 | ||||||||
Average balance(2) | 924 | 12,397 | 25,362 | 7,066 | ||||||||||||
Maximum balance at any month-end | 5,367 | 19,895 | 31,442 | 7,388 | ||||||||||||
Weighted average interest rate during the period | 2.4 | % | 4.2 | % | 5.1 | % | 2.7 | % | ||||||||
Weighted average interest rate on period-end balance | 0.8 | % | 2.6 | % | 4.8 | % | 2.3 | % | ||||||||
| (1) | The Company considers its principal trading, investment banking, commissions, and interest and dividend income, along with the associated interest expense, as one integrated activity for each of the Company's separate businesses and is therefore unable to provide weighted average interest rates for Securities sold under repurchase agreements and Securities loaned. See Note 1 and Note 15 of the consolidated financial statements for further information. |
| (2) | Average balances are calculated based upon weekly balances for 2009 and month-end balances for fiscal 2008, fiscal 2007 and the one month ended December 31, 2008. |
Cross-border Outstandings
Cross-border outstandings are based upon the Federal Financial Institutions Examination Council's ("FFIEC") regulatory guidelines for reporting cross-border risk. Claims include cash, receivables, securities purchased under agreements to resell, securities borrowed and cash trading instruments, but exclude derivative instruments and commitments. Securities purchased under agreements to resell and securities borrowed are presented based on the domicile of the counterparty, without reduction for related securities collateral held.
The following table sets forth cross-border outstandings for each country in which cross-border outstandings exceed 1% of the Company's consolidated assets or 20% of the Company's total capital, whichever is less, as of December 31, 2009 in accordance with the FFIEC guidelines (dollars in millions):
Country | Banks | Governments | Other | Total | ||||||||
Denmark | $ | 796 | $ | 5,701 | $ | 647 | $ | 7,144 | ||||
France | 9,721 | 2,175 | 14,664 | 26,560 | ||||||||
Germany | 10,897 | 2,280 | 11,050 | 24,227 | ||||||||
Ireland | 3,922 | 6 | 4,514 | 8,442 | ||||||||
Italy | 1,399 | 2,391 | 1,761 | 5,551 | ||||||||
Luxembourg | 3,967 | 1 | 8,622 | 12,590 | ||||||||
Netherlands | 3,740 | 271 | 10,516 | 14,527 | ||||||||
Spain | 1,660 | 316 | 4,211 | 6,187 | ||||||||
Switzerland | 4,497 | - | 6,564 | 11,061 | ||||||||
United Kingdom | 13,151 | 1 | 9,674 | 22,826 | ||||||||
Cayman Islands | - | - | 36,034 | 36,034 | ||||||||
Japan | 11,159 | 194 | 6,374 | 17,727 | ||||||||
Korea | 531 | 3,098 | 8,899 | 12,528 | ||||||||
Canada | 2,163 | 262 | 4,554 | 6,979 | ||||||||
234
| Item 9. | Changes in and Disagreements with Accountants on Accounting and Financial Disclosure. |
None.
| Item 9A. | Controls and Procedures. |
Conclusion Regarding the Effectiveness of Disclosure Controls and Procedures.
Under the supervision and with the participation of our management, including our Chief Executive Officer and our Chief Financial Officer, we conducted an evaluation of our disclosure controls and procedures, as such term is defined under Exchange Act Rule 13a-15(e). Based on this evaluation, our Chief Executive Officer and our Chief Financial Officer concluded that our disclosure controls and procedures were effective as of the end of the period covered by this annual report.
Management's Report on Internal Control Over Financial Reporting.
Our management is responsible for establishing and maintaining adequate internal control over financial reporting. Morgan Stanley's internal control over financial reporting is designed to provide reasonable assurance regarding the reliability of financial reporting and the preparation of financial statements for external purposes in accordance with generally accepted accounting principles.
Our internal control over financial reporting includes those policies and procedures that:
| • | Pertain to the maintenance of records that, in reasonable detail, accurately and fairly reflect the transactions and dispositions of the assets of Morgan Stanley; |
| • | Provide reasonable assurance that transactions are recorded as necessary to permit preparation of financial statements in accordance with generally accepted accounting principles, and that our receipts and expenditures are being made only in accordance with authorizations of Morgan Stanley's management and directors; and |
| • | Provide reasonable assurance regarding prevention or timely detection of unauthorized acquisition, use or disposition of our assets that could have a material effect on our financial statements. |
Because of its inherent limitations, internal control over financial reporting may not prevent or detect misstatements. Also, projections of any evaluation of effectiveness to future periods are subject to the risk that controls may become inadequate because of changes in conditions, or that the degree of compliance with the policies or procedures may deteriorate.
Management assessed the effectiveness of Morgan Stanley's internal control over financial reporting as of December 31, 2009. In making this assessment, management used the criteria set forth by the Committee of Sponsoring Organizations of the Treadway Commission (COSO) in Internal Control-Integrated Framework . Based on management's assessment and those criteria, management believes that Morgan Stanley maintained effective internal control over financial reporting as of December 31, 2009.
Morgan Stanley's independent registered public accounting firm has audited and issued a report on Morgan Stanley's internal control over financial reporting, which appears below.
235
Report of Independent Registered Public Accounting Firm
To the Board of Directors and Shareholders of Morgan Stanley:
We have audited the internal control over financial reporting of Morgan Stanley and subsidiaries (the "Company") as of December 31, 2009, based on criteria established in Internal Control-Integrated Framework issued by the Committee of Sponsoring Organizations of the Treadway Commission. The Company's management is responsible for maintaining effective internal control over financial reporting and for its assessment of the effectiveness of internal control over financial reporting, included in the accompanying Management's Report on Internal Control Over Financial Reporting. Our responsibility is to express an opinion on the Company's internal control over financial reporting based on our audit.
We conducted our audit in accordance with the standards of the Public Company Accounting Oversight Board (United States). Those standards require that we plan and perform the audit to obtain reasonable assurance about whether effective internal control over financial reporting was maintained in all material respects. Our audit included obtaining an understanding of internal control over financial reporting, assessing the risk that a material weakness exists, testing and evaluating the design and operating effectiveness of internal control based on the assessed risk, and performing such other procedures as we considered necessary in the circumstances. We believe that our audit provides a reasonable basis for our opinion.
A company's internal control over financial reporting is a process designed by, or under the supervision of, the company's principal executive and principal financial officers, or persons performing similar functions, and effected by the company's board of directors, management, and other personnel to provide reasonable assurance regarding the reliability of financial reporting and the preparation of financial statements for external purposes in accordance with generally accepted accounting principles. A company's internal control over financial reporting includes those policies and procedures that (1) pertain to the maintenance of records that, in reasonable detail, accurately and fairly reflect the transactions and dispositions of the assets of the company; (2) provide reasonable assurance that transactions are recorded as necessary to permit preparation of financial statements in accordance with generally accepted accounting principles, and that receipts and expenditures of the company are being made only in accordance with authorizations of management and directors of the company; and (3) provide reasonable assurance regarding prevention or timely detection of unauthorized acquisition, use, or disposition of the company's assets that could have a material effect on the financial statements.
Because of the inherent limitations of internal control over financial reporting, including the possibility of collusion or improper management override of controls, material misstatements due to error or fraud may not be prevented or detected on a timely basis. Also, projections of any evaluation of the effectiveness of the internal control over financial reporting to future periods are subject to the risk that the controls may become inadequate because of changes in conditions, or that the degree of compliance with the policies or procedures may deteriorate.
In our opinion, the Company maintained, in all material respects, effective internal control over financial reporting as of December 31, 2009, based on the criteria established in Internal Control-Integrated Framework issued by the Committee of Sponsoring Organizations of the Treadway Commission.
We have also audited, in accordance with the standards of the Public Company Accounting Oversight Board (United States), the consolidated statement of financial condition of the Company as of December 31, 2009, the consolidated statements of income, comprehensive income, cash flows and changes in total equity for the year ended December 31, 2009 and our report dated February 26, 2010 expresses an unqualified opinion on those financial statements and includes explanatory paragraphs concerning the adoption of Financial Accounting Standards Board accounting guidance that addresses noncontrolling interests in consolidated financial statements and the computation of Earnings Per Share under the two-class method for share-based payment transactions that are participating securities and an explanatory paragraph, concerning the Company changing its fiscal year end from November 30 to December 31.
| /s/ Deloitte & Touche LLP |
New York, New York February 26, 2010 |
236
Changes in Internal Control Over Financial Reporting.
No change in Morgan Stanley's internal control over financial reporting (as such term is defined in Exchange Act Rule 13a-15(f)) occurred during the quarter ended December 31, 2009 that materially affected, or is reasonably likely to materially affect, Morgan Stanley's internal control over financial reporting.
| Item 9B. Other | Information. |
Not applicable.
237
Part III
| Item 10. | Directors, Executive Officers and Corporate Governance. |
Information relating to Morgan Stanley's directors and nominees under the following captions in Morgan Stanley's definitive proxy statement for its 2010 annual meeting of shareholders ("Morgan Stanley's Proxy Statement") is incorporated by reference herein.
| • | "Item 1-Election of Directors" |
| • | "Item 1-Election of Directors-Board Meetings and Committees" |
Information relating to Morgan Stanley's executive officers is contained in Part I, Item 1 of this report under "Executive Officers of Morgan Stanley."
Morgan Stanley's Code of Ethics and Business Conduct applies to all directors, officers and employees, including its Chief Executive Officer, Chief Financial Officer and Finance Director and Controller. You can find our Code of Ethics and Business Conduct on our internet site, www.morganstanley.com/about/company/governance/ms_coe_bc.html . We will post any amendments to the Code of Ethics and Business Conduct, and any waivers that are required to be disclosed by the rules of either the SEC or the NYSE, on our internet site.
| Item 11. | Executive Compensation. |
Information relating to director and executive officer compensation under the following captions in Morgan Stanley's Proxy Statement is incorporated by reference herein.
| • | "Item 1-Election of Directors-Executive Compensation" |
| • | "Item 1-Election of Directors-Director Compensation" |
238
| Item 12. | Security Ownership of Certain Beneficial Owners and Management and Related Stockholder Matters. |
Information relating to equity compensation plans and security ownership of certain beneficial owners and management is set forth under the captions "Equity Compensation Plan Information" and "Beneficial Ownership of Company Common Stock" in Morgan Stanley's Proxy Statement and such information is incorporated by reference herein.
| Item 13. | Certain Relationships and Related Transactions, and Director Independence. |
Information regarding certain relationships and related transactions under the following caption in Morgan Stanley's Proxy Statement is incorporated by reference herein.
| • | "Other Matters-Certain Transactions" |
Information regarding director independence under the following caption in Morgan Stanley's Proxy Statement is incorporated by reference herein.
| • | "Item 1-Election of Directors-Corporate Governance-Director Independence" |
| Item 14. | Principal Accountant Fees and Services. |
Information regarding principal accountant fees and services under the following caption in Morgan Stanley's Proxy Statement is incorporated by reference herein.
| • | "Item 2-Ratification of Appointment of Morgan Stanley's Independent Auditor" (excluding the information under the subheading "Audit Committee Report") |
239
Part IV
| Item 15. | Exhibits and Financial Statement Schedules. |
Documents filed as part of this report.
| • | An exhibit index has been filed as part of this report beginning on page E-1 and is incorporated herein by reference. |
240
Signatures
Pursuant to the requirements of Section 13 or 15(d) of the Securities Exchange Act of 1934, the Registrant has duly caused this report to be signed on its behalf by the undersigned, thereunto duly authorized, on February 26, 2010.
M ORGAN S TANLEY ( REGISTRANT ) | ||
| By: | /s/ J AMES P. G ORMAN | |
(James P. Gorman) President and Chief Executive Officer | ||
Pursuant to the requirements of the Securities Exchange Act of 1934, this report has been signed below by the following persons on behalf of the Registrant and in the capacities indicated on the 26th day of February, 2010.
Signature | Title | |
/s/ J AMES P. G ORMAN (James P. Gorman) | President and Chief Executive Officer (Principal Executive Officer) | |
/s/ R UTH P ORAT (Ruth Porat) | Executive Vice President and Chief Financial Officer (Principal Financial Officer) | |
/s/ P AUL C. W IRTH (Paul C. Wirth) | Finance Director and Controller (Principal Accounting Officer) | |
/s/ J OHN J. M ACK (John J. Mack) | Director (Chairman of the Board of Directors) | |
/s/ R OY J. B OSTOCK (Roy J. Bostock) | Director | |
/s/ E RSKINE B. B OWLES (Erskine B. Bowles) | Director | |
/s/ H OWARD J. D AVIES (Howard J. Davies) | Director | |
/s/ J AMES H. H ANCE , J R . (James H. Hance, Jr.) | Director | |
/s/ N OBUYUKI H IRANO (Nobuyuki Hirano) | Director | |
/s/ C. R OBERT K IDDER (C. Robert Kidder) | Director | |
/s/ D ONALD T. N ICOLAISEN (Donald T. Nicolaisen) | Director | |
| S-1 |
Signature | Title | |
/s/ C HARLES H. N OSKI (Charles H. Noski) | Director | |
/s/ H UTHAM S. O LAYAN (Hutham S. Olayan) | Director | |
/s/ C HARLES E. P HILLIPS , J R . (Charles E. Phillips, Jr.) | Director | |
/s/ O. G RIFFITH S EXTON (O. Griffith Sexton) | Director | |
/s/ L AURA D'A NDREA T YSON (Laura D'Andrea Tyson) | Director | |
| | S-2 |
SECURITIES AND EXCHANGE COMMISSION
Washington, D.C. 20549
EXHIBITS TO FORM 10-K
For the year ended December 31, 2009
Commission File No. 1-11758
Exhibit Index
Certain of the following exhibits, as indicated parenthetically, were previously filed as exhibits to registration statements filed by Morgan Stanley or its predecessor companies under the Securities Act or to reports or registration statements filed by Morgan Stanley or its predecessor companies under the Exchange Act and are hereby incorporated by reference to such statements or reports. Morgan Stanley's Exchange Act file number is 1-11758. The Exchange Act file number of Morgan Stanley Group Inc., a predecessor company ("MSG"), was 1-9085. 1
| Exhibit No. | Description | |
| 3.1 | Amended and Restated Certificate of Incorporation of Morgan Stanley, as amended to date (Exhibit 3 to Morgan Stanley's Quarterly Report on Form 10-Q for the quarter ended June 30, 2009). | |
| 3.2* | Amended and Restated Bylaws of Morgan Stanley, as amended to date. | |
| 4.1 | Indenture dated as of February 24, 1993 between Morgan Stanley and The Bank of New York, as trustee (Exhibit 4 to Morgan Stanley's Registration Statement on Form S-3 (No. 33-57202)). | |
| 4.2 | Amended and Restated Senior Indenture dated as of May 1, 1999 between Morgan Stanley and The Bank of New York, as trustee (Exhibit 4-e to Morgan Stanley's Registration Statement on Form S-3/A (No. 333-75289) as amended by Fourth Supplemental Senior Indenture dated as of October 8, 2007 (Exhibit 4.3 to Morgan Stanley's Annual Report on Form 10-K for the fiscal year ended November 30, 2007). | |
| 4.3 | Senior Indenture dated as of November 1, 2004 between Morgan Stanley and The Bank of New York, as trustee (Exhibit 4-f to Morgan Stanley's Registration Statement on Form S-3/A (No. 333-117752), as amended by First Supplemental Senior Indenture dated as of September 4, 2007 (Exhibit 4.5 to Morgan Stanley's Annual Report on Form 10-K for the fiscal year ended November 30, 2007), Second Supplemental Senior Indenture dated as of January 4, 2008 (Exhibit 4.1 to Morgan Stanley's Current Report on Form 8-K dated January 4, 2008), Third Supplemental Senior Indenture dated as of September 10, 2008 (Exhibit 4 to Morgan Stanley's Quarterly Report on Form 10-Q for the quarter ended August 31, 2008), Fourth Supplemental Senior Indenture dated as of December 1, 2008 (Exhibit 4.1 to Morgan Stanley's Current Report on Form 8-K dated December 1, 2008) and Fifth Supplemental Senior Indenture dated as of April 1, 2009 (Exhibit 4 to Morgan Stanley's Quarterly Report on Form 10-Q for the quarter ended March 31, 2009). | |
| 4.4 | The Unit Agreement Without Holders' Obligations, dated as of August 29, 2008, between Morgan Stanley and The Bank of New York Mellon, as Unit Agent, as Trustee and Paying Agent under the Senior Indenture referred to therein and as Warrant Agent under the Warrant Agreement referred to therein (Exhibit 4.1 to Morgan Stanley's Current Report on Form 8-K dated August 29, 2008). | |
| 4.5 | Amended and Restated Subordinated Indenture dated as of May 1, 1999 between Morgan Stanley and The Bank of New York, as trustee (Exhibit 4-f to Morgan Stanley's Registration Statement on Form S-3/A (No. 333-75289)). | |
| 4.6 | Subordinated Indenture dated as of October 1, 2004 between Morgan Stanley and The Bank of New York, as trustee (Exhibit 4-g to Morgan Stanley's Registration Statement on Form S-3/A (No. 333-117752)). | |
| 4.7 | Junior Subordinated Indenture dated as of March 1, 1998 between Morgan Stanley and The Bank of New York, as trustee (Exhibit 4.1 to Morgan Stanley's Quarterly Report on Form 10-Q for the quarter ended February 28, 1998). | |
| (1) | For purposes of this Exhibit Index, references to "The Bank of New York" mean in some instances the entity successor to JPMorgan Chase Bank, N.A. or J.P. Morgan Trust Company, National Association; references to "JPMorgan Chase Bank, N.A." mean the entity formerly known as The Chase Manhattan Bank, in some instances as the successor to Chemical Bank; references to "J.P. Morgan Trust Company, N.A." mean the entity formerly known as Bank One Trust Company, N.A., as successor to The First National Bank of Chicago. |
| E-1 |
| Exhibit |