UNITED STATES
SECURITIES AND EXCHANGE COMMISSION
Washington, D.C. 20549
FORM 10-K
(MARK ONE)
| ☒ | ANNUAL REPORT PURSUANT TO SECTION 13 OR 15(d) OF THE SECURITIES EXCHANGE ACT OF 1934 |
For the fiscal year ended August 31, 2016
or
| ☐ | TRANSITION REPORT PURSUANT TO SECTION 13 OR 15(d) OF THE SECURITIES EXCHANGE ACT OF 1934 |
Commission File Number 1-13419
Lindsay Corporation
(Exact name of registrant as specified in its charter)
| Delaware | 47-0554096 | |
(State or other jurisdiction of incorporation or organization) | (I.R.S. Employer Identification No.) | |
| 2222 North 111 th Street, Omaha, Nebraska | 68164 | |
| (Address of principal executive offices) | (Zip Code) | |
402-829-6800
Registrant's telephone number, including area code
Securities registered pursuant to Section 12(b) of the Act:
Title of each class | Name of each exchange on which registered | |
| Common Stock, $1.00 par value | New York Stock Exchange, Inc. (Symbol LNN) |
Indicate by check mark if the registrant is a well-known seasoned issuer, (as defined in Rule 405 of the Securities Act). Yes ☒ No ☐
Indicate by check mark if the registrant is not required to file reports pursuant to Section 13 or Section 15(d) of the Exchange Act. Yes ☐ No ☒
Indicate by check mark whether the registrant (1) has filed all reports required to be filed by Section 13 or 15(d) of the Securities Exchange Act of 1934 during the preceding 12 months (or for such shorter period that the registrant was required to file such reports), and (2) has been subject to such filing requirements for the past 90 days. Yes ☒ No ☐
Indicate by check mark whether the registrant has submitted electronically and posted on its corporate Web site, if any, every Interactive Data File required to be submitted and posted pursuant to Rule 405 of Regulation S-T (§232.405 of this chapter) during the preceding 12 months (or for such shorter period that the registrant was required to submit and post such files). Yes ☒ No ☐
Indicate by check mark if disclosure of delinquent filers pursuant to Item 405 of Regulation S-K is not contained herein, and will not be contained, to the best of registrant's knowledge, in definitive proxy or information statements incorporated by reference in Part III of this Form 10-K or any amendment to this Form 10-K ☐
Indicate by check mark whether the registrant is a large accelerated filer, an accelerated filer, a non-accelerated filer, or a smaller reporting company. See the definitions of "large accelerated filer," "accelerated filer" and "smaller reporting company" in Rule 12b-2 of the Exchange Act.
Large accelerated filer ☒ | Accelerated filer ☐ | Non-accelerated filer ☐ | Smaller reporting company ☐ | |||
| (Do not check if a smaller reporting company) |
Indicate by check mark whether the registrant is a shell company (as defined in Rule 12b-2 of the Exchange Act). Yes ☐ No
The aggregate market value of Common Stock of the registrant, all of which is voting, held by non-affiliates based on the closing sales price on the New York Stock Exchange, Inc. on February 29, 2016 was $760,846,532.
As of October 13, 2016, 10,630,124 shares of the registrant's Common Stock were outstanding.
DOCUMENTS INCORPORATED BY REFERENCE
Portions of the Proxy Statement pertaining to the Registrant's 2017 annual stockholders' meeting are incorporated herein by reference into Part III.
TABLE OF CONTENTS
| Page(s) | ||||||||
Part I | ||||||||
Item 1. | Business | 3 | ||||||
Item 1A. | Risk Factors | 11 | ||||||
Item 1B. | Unresolved Staff Comments | 15 | ||||||
Item 2. | Properties | 15 | ||||||
Item 3. | Legal Proceedings | 15 | ||||||
Item 4. | Mine Safety Disclosures | 15 | ||||||
Part II | ||||||||
| Item 5. | Market for Registrant's Common Equity, Related Stockholder Matters and Issuer Purchases of Equity Securities | 16 | ||||||
Item 6. | Selected Financial Data | 18 | ||||||
| Item 7. | Management's Discussion and Analysis of Financial Condition and Results of Operations | 19 | ||||||
Item 7A. | Quantitative and Qualitative Disclosures about Market Risk | 31 | ||||||
Item 8. | Financial Statements and Supplementary Data | 32 | ||||||
| Item 9. | Changes in and Disagreements with Accountants on Accounting and Financial Disclosure | 64 | ||||||
Item 9A. | Controls and Procedures | 64 | ||||||
Item 9B. | Other Information | 66 | ||||||
Part III | ||||||||
Item 10. | Directors, Executive Officers and Corporate Governance | 67 | ||||||
Item 11. | Executive Compensation | 69 | ||||||
| Item 12. | Security Ownership of Certain Beneficial Owners and Management and Related Stockholder Matters | 69 | ||||||
Item 13. | Certain Relationships and Related Transactions, and Director Independence | 69 | ||||||
Item 14. | Principal Accounting Fees and Services | 69 | ||||||
Part IV | ||||||||
Item 15. | Exhibits, Financial Statement Schedules | 70 | ||||||
SIGNATURES | 72 | |||||||
2
PART I
ITEM 1 - Business
INTRODUCTION
Lindsay Corporation, along with its subsidiaries (collectively called "Lindsay" or the "Company"), is a global leader in providing a variety of proprietary water management and road infrastructure products and services. The Company has been involved in the manufacture and distribution of agricultural irrigation equipment since 1955 and has grown from a regional company to an international water efficiency solutions and highway infrastructure firm with worldwide sales and distribution. Lindsay, a Delaware corporation, maintains its corporate offices in Omaha, Nebraska. The Company has operations which are categorized into two major reporting segments, Irrigation and Infrastructure.
Irrigation Segment – The Company's irrigation segment includes the manufacture and marketing of center pivot, lateral move, and hose reel irrigation systems which are used principally in the agricultural industry to increase or stabilize crop production while conserving water, energy and labor. The irrigation segment also manufactures and markets repair and replacement parts for its irrigation systems and controls. In addition, the irrigation segment also designs and manufactures water pumping stations and controls for the agriculture, golf, landscape and municipal markets and filtration solutions for groundwater, agriculture, industrial and heat transfer markets. The Company continues to strengthen irrigation product offerings through innovative technology such as Global Positioning System ("GPS") positioning and guidance, variable rate irrigation, wireless irrigation management, machine-to-machine ("M2M") communication technology solutions and smartphone applications. The Company's primary domestic irrigation manufacturing facilities are located in Lindsay, Nebraska; Hartland, Wisconsin; Olathe, Kansas; and Fresno, California. Internationally, the Company has production operations in Brazil, France, China, Turkey, and South Africa, as well as distribution and sales operations in the Netherlands, Australia, and New Zealand. The Company also exports equipment from the U.S. to other international markets.
Infrastructure Segment – The Company's infrastructure segment includes the manufacture and marketing of moveable barriers, specialty barriers, crash cushions and end terminals, road marking and road safety equipment, large diameter steel tubing, and railroad signals and structures. The infrastructure segment also provides outsourced manufacturing and production services. The principal infrastructure manufacturing facilities are located in Rio Vista, California; Milan, Italy; and Omaha, Nebraska.
PRODUCTS BY SEGMENT
IRRIGATION SEGMENT
Products - The Company manufactures and markets its center pivot, lateral move irrigation systems, and irrigation controls in the U.S. and internationally under its Zimmatic ® brand. The Company also manufactures and markets hose reel travelers under the Perrot ™ and Greenfield ® brands in Europe and South Africa. The Company also produces or markets chemical injection systems, variable rate irrigation systems, flow meters, weather stations, soil moisture sensors, and remote monitoring and control systems which it sells under its GrowSmart ® brand. In addition to whole systems, the Company manufactures and markets repair and replacement parts for its irrigation systems and controls. The Company also designs and manufactures water pumping stations and controls for the agriculture, golf, landscape, and municipal markets under its Watertronics ® brand and filtration solutions for groundwater, agriculture, industrial, and heat transfer markets, worldwide, under its LAKOS ® brand. Furthermore, the Company designs and manufactures innovative M2M communication technology solutions, data acquisition and management systems, and custom electronic equipment for critical applications under its Elecsys ™ brand.
The Company's irrigation systems are primarily of the standard center pivot type, with a small portion of its products consisting of the lateral move type. Both are automatic move systems consisting of sprinklers mounted on a water carrying pipeline which is supported approximately 11 feet off the ground by a truss system suspended between moving towers.
3
A standard center pivot in the U.S. is typically seven spans and approximately 1,300 feet long and is designed to circle within a quarter-section of land, which comprises 160 acres, wherein it irrigates approximately 125 to 130 acres. A center pivot or lateral move system can also be custom designed and can irrigate from 25 to 600+ acres.
A center pivot system represents a significant investment to a farmer. In a dry land conversion to center pivot irrigation, approximately one-half of the investment is for the pivot itself, and the remainder is attributable to installation of additional equipment such as wells, pumps, underground water pipes, electrical supply, and a concrete pad upon which the pivot is anchored. The Company's center pivot and lateral move irrigation systems can be enhanced with a family of integrated proprietary products such as water pumping stations, GPS monitoring, and other automated controls.
The Company also manufactures and distributes hose reel travelers. Hose reel travelers are typically deployed in smaller or irregular fields and usually are easy to operate, easy to move from field to field, and a smaller investment than a typical standard center pivot.
The Company also markets proprietary remote monitoring and automation technology that works on any brand of electronic pivot and drip irrigation systems and is sold on a subscription basis under the FieldNET ® product name. FieldNET ® technology enables growers to remotely monitor and operate irrigation equipment, saving time, and reducing water and energy consumption. The technology uses cellular or radio frequency communication systems to remotely acquire data relating to various conditions in an irrigated field, including operational status of the irrigation system, position of the irrigation system, water usage, weather and soil conditions, and similar data. The system can remotely control the irrigation system, altering the speed to vary water application amounts, and controlling pump station and diesel generator operation. Data management and control is achieved using applications running on either a personal computer-based internet browser or various mobile devices connected to the internet.
Other Types of Irrigation – Center pivot and lateral move irrigation systems compete with three other types of irrigation: flood, drip, and other mechanical devices such as hose reel travelers and solid set sprinklers. The bulk of worldwide irrigation is accomplished by the traditional method of flood irrigation. Flood irrigation is accomplished by either flooding an entire field, or by providing a water source (ditches or a pipe) along the side of a field, which is planed and slopes slightly away from the water source. The water is released to the crop rows through gates in the ditch or pipe, or through siphon tubes arching over the ditch wall into some of the crop rows. It runs down through the crop row until it reaches the far end of the row, at which time the water source is moved and another set of rows are flooded. Disadvantages or limitations of flood irrigation include that it cannot be used to irrigate uneven, hilly, or rolling terrain, it can be wasteful or inefficient and coverage can become inconsistently applied. In "drip" or "low flow" irrigation, perforated plastic pipe or tape is installed on the ground or buried underground at the root level. Several other types of mechanical devices, such as hose reel travelers, irrigate the remaining irrigated acres.
Center pivot, lateral move, and hose reel traveler irrigation offer significant advantages when compared with other types of irrigation. It requires less labor and monitoring; can be used on sandy ground, which, due to poor water retention ability, must have water applied frequently; can be used on uneven ground, thereby allowing previously unsuitable land to be brought into production; can be used for the application of fertilizers, insecticides, herbicides, or other chemicals (termed "fertigation" or "chemigation"); and conserves water and chemicals through precise control of the amount and timing of the application.
Markets - Water is an essential and critical requirement for crop production, and the extent, regularity, and frequency of water application can be a critical factor in crop quality and yield. The fundamental factors which govern the demand for center pivot and lateral move systems are essentially the same in both the U.S. and international markets. Demand for center pivot and lateral move systems is determined by whether the value of the increased crop production and cost savings attributable to center pivot or lateral move irrigation exceeds any increased costs associated with purchasing, installing, and operating the equipment. Thus, the decision to purchase a center pivot or lateral move system, in part, reflects the profitability of agricultural production, which is determined primarily by the prices of agricultural commodities and the costs of other farming inputs.
4
The current demand for center pivot systems has three sources: conversion to center pivot systems from less water-efficient, more labor-intensive types of irrigation; replacement of older center pivot systems, which are beyond their useful lives or are technologically obsolete; and conversion of dry land farming to irrigated farming. Demand for center pivots and lateral move irrigation equipment also depends upon the need for the particular operational characteristics and advantages of such systems in relation to alternative types of irrigation, primarily flood. More efficient use of the basic natural resources of land, water, and energy helps drive demand for center pivot and lateral move irrigation equipment. An increasing global population not only increases demand for agricultural output, but also places additional and competing demands on land, water, and energy. The Company expects demand for center pivots and lateral move systems to continue to increase relative to other irrigation methods because center pivot and lateral move systems are preferred where the soil is sandy; the terrain is not flat; the land area to be irrigated is sizeable; there is a shortage of reliable labor; water supply is restricted and conservation is preferred or critical; and/or fertigation or chemigation will be utilized.
United States Market – In the United States, the Company sells its branded irrigation systems, including Zimmatic ® , to over 200 independent dealers, who resell to their customer, the farmer. Dealers assess their customers' requirements, design the most efficient solution, assemble and erect the system in the field, and provide additional system components, primarily relating to water supply (wells, pumps, pipes) and electrical supply (on-site generation or hook-up to power lines). Lindsay dealers generally are established local agribusinesses, many of which also deal in related products, such as well drilling and water pump equipment, farm implements, grain handling and storage systems, and farm structures.
International Market – The Company sells center pivot and lateral move irrigation systems throughout the world. International sales accounted for approximately 38 percent and 39 percent of the Company's total irrigation segment revenues in fiscal 2016 and 2015, respectively. The Company sells direct to consumers, as well as through an international dealer network, and has production and sales operations in Brazil, France, China, Turkey, and South Africa, as well as distribution and sales operations in the Netherlands, Australia, and New Zealand serving the key South American, European, Chinese, African, Russian, Ukrainian, Middle East, Australian, and New Zealand markets. The Company also exports irrigation equipment from the U.S. to international markets.
The Company's international markets differ with respect to the need for irrigation, the ability to pay, demand, customer type, government support of agriculture, marketing and sales methods, equipment requirements, and the difficulty of on-site erection. The Company's industry position is such that it believes that it will likely be considered as a potential supplier for most major international agricultural development projects utilizing center pivot or lateral move irrigation systems.
Competition – Four primary manufacturers control a substantial majority of the U.S. center pivot irrigation system industry. The international irrigation market includes participation and competition by the leading U.S. manufacturers, as well as various regional manufacturers. The Company competes in certain product lines with several manufacturers, some of whom may have greater financial resources than the Company. The Company competes by continuously improving its products through ongoing research and development activities. The Company continues to strengthen irrigation product offerings through innovative technology such as GPS positioning and guidance, variable rate irrigation, wireless irrigation management, and smartphone applications, as well as through the acquisition of products and services that allow the Company to provide a more comprehensive solution to growers' needs. The Company's engineering and research expenses related to irrigation totaled approximately $11.6 million, $9.6 million, and $7.8 million for fiscal 2016, 2015, and 2014, respectively. Competition also occurs in areas of price and seasonal programs, product quality, durability, controls, product characteristics, retention and reputation of local dealers, customer service, and, at certain times of the year, the availability of systems and their delivery time. On balance, the Company believes it competes favorably with respect to these factors.
5
INFRASTRUCTURE SEGMENT
Products – The Company's Quickchange ® Moveable Barrier ™ system, commonly known as the Road Zipper System ™ , is composed of three parts: 1) T-shaped concrete and steel barriers that are connected to form a continuous wall; 2) a Barrier Transfer Machine ™ ("BTM ™ ") capable of moving the barrier laterally across the pavement; and 3) the variable length barriers necessary for accommodating curves. A barrier element is approximately 32 inches high, 12-24 inches wide, 3 feet long, and weighs 1,500 pounds. The barrier elements are interconnected by very heavy duty steel hinges to form a continuous barrier. The BTM ™ employs an inverted S-shaped conveyor mechanism that lifts the barrier, moving it laterally before setting it back on the roadway surface.
In permanent applications, the Road Zipper System ™ increases capacity and reduces congestion by varying the number of directional traffic lanes to match the traffic demand, and promotes safety by maintaining the physical separation of opposing lanes of traffic. Roadways with fixed medians have a set number of lanes in each direction and cannot be adjusted to traffic demands that may change over the course of a day, or to capacity reductions caused by traffic incidents or road repair and maintenance. Applications include high-volume highways where expansion may not be feasible due to lack of additional right-of-way, environmental concerns, or insufficient funding. The Road Zipper System ™ is particularly useful in busy commuter corridors and at choke points such as bridges and tunnels. Road Zipper Systems ™ can also be deployed at roadway or roadside construction sites to accelerate construction, improve traffic flow, and safeguard work crews and motorists by positively separating the work area and traffic. Examples of types of work completed with the help of a Road Zipper System ™ include highway reconstruction, paving and resurfacing, road widening, median and shoulder construction, and repairs to tunnels and bridges.
The Company offers a variety of equipment lease options for Road Zipper Systems ™ and BTM ™ equipment used in construction applications. The leases extend for periods of one month or more for equipment already existing in the Company's lease fleet. Longer lease periods may be required for specialty equipment that must be built for specific projects. Sales for a highway safety or road improvement project range from $2.0 to $20.0 million, making them significant capital investments.
Crash Cushions and End Terminals – The Company offers a complete line of redirective and non-redirective crash cushions which are used to enhance highway safety at locations such as toll booths, freeway off-ramps, medians and roadside barrier ends, bridge supports, utility poles, and other fixed roadway hazards. The Company's primary crash cushion products cover a full range of lengths, widths, speed capacities, and application accessories and include the following brand names: TAU ® ; Universal TAU-II ® ; TAU-II-R ™ ; TAU-B_NR ™ ; ABSORB 350 ® ; and Walt ™ . In addition to these products the Company also offers guardrail end terminal products such as the X-Tension ® and X-Lite ® systems. The crash cushions and end terminal products compete with other vendors in the world market. These systems are generally sold through a distribution channel that is domiciled in particular geographic areas.
Specialty Barriers – The Company also offers specialty barrier products such as the SAB ™ , ArmorGuard ™ , PaveGuard ™ , and DR46 ™ portable barrier and/or barrier gate systems. These products offer portability and flexibility in setting up and modifying barriers in work areas and provide quick-opening, high-containment gates for use in median or roadside barriers. The gates are generally used to create openings in barrier walls of various types for both construction and incident management purposes. The DR46 ™ is an energy-absorbing barrier that can help protect motorcyclists from impacting guardrail posts which is an area of focus by departments of transportation and government regulators for reducing the amount and severity of injuries.
Road Marking and Road Safety Equipment – The Company also offers preformed tape and a line of road safety accessory products. The preformed tape is used primarily in temporary applications such as markings for work zones, street crossings, and road center lines or boundaries. The road safety equipment consists of mostly plastic and rubber products used for delineation, slowing traffic, and signaling. The Company also manages an ISO 17025 certified testing laboratory that performs full-scale impact testing of highway safety products in accordance with the National Cooperative Highway Research Program ("NCHRP") Report 350, the Manual for
6
Assessing Safety Hardware ("MASH"), and the European Norms ("EN1317 Norms") for these types of products. The NCHRP Report 350 and MASH guidelines are procedures required by the U.S. Department of Transportation Federal Highway Administration ("FHWA") for the safety performance evaluation of highway features. The EN1317 Norms are being used to qualify roadway safety products for the European markets.
Other Products – The Company's Diversified Manufacturing, Rail and Tubing business manufactures and markets railroad signals and structures, and large diameter steel tubing, and provides outsourced manufacturing and production services for other companies. The Company's customer base includes certain large industrial companies and railroads. Each customer benefits from the Company's design and engineering capabilities as well as the Company's ability to provide a wide spectrum of manufacturing services, including welding, machining, painting, forming, galvanizing, and assembling hydraulic, electrical, and mechanical components.
Markets – The Company's primary infrastructure market includes moveable concrete barriers, delineation systems, crash cushions, and similar protective equipment. The U.S. roadway infrastructure market includes projects such as new roadway construction, bridges, tunnels, maintenance and resurfacing, and development of technologies for relief of roadway congestion. Much of the U.S. highway infrastructure market is driven by government (state and federal) spending programs. For example, the U.S. government funds highway and road improvements through the Federal Highway Trust Fund Program. This program provides funding to improve the nation's roadway system. Matching funding from the various states may be required as a condition of federal funding. In the long term, the Company believes that the federal program provides a solid platform for growth in the U.S. market, as it is generally acknowledged that additional funding will be required for infrastructure development and maintenance in the future.
The global market for the Company's infrastructure products continues to be driven by population growth and the need for improved road safety. International sales accounted for approximately 37 percent and 30 percent of the Company's total infrastructure segment revenues in fiscal 2016 and 2015, respectively. The international market is presently very different from country to country. The standardization in performance requirements and acceptance criteria for highway safety devices adopted by the European Committee for Standardization is expected to lead to greater uniformity and a larger installation program. Prevention programs put in place in various countries to lower highway traffic fatalities may also lead to greater demand. The Company distributes infrastructure products in Europe, South America, the Middle East, and Asia. The Company expects to continue expanding in international markets as populations grow and markets become more established.
Competition – The Company competes in certain product lines with several manufacturers, some of whom may have greater financial resources than the Company. The Company competes by continuously improving its products through ongoing research and development activities. The Company's engineering and research expenses related to infrastructure products totaled approximately $4.3 million, $3.3 million, and $3.3 million for fiscal 2016, 2015, and 2014, respectively. The Company competes with certain products and companies in its crash cushion business, but has limited competition in its moveable barrier line, as there is not another moveable barrier product today comparable to the Road Zipper System ™ . However, the Company's barrier product does compete with traditional "safety-shaped" concrete barriers and other safety barriers.
Distribution Methods and Channels – The Company has dedicated production and sales operations in the United States and Italy. Sales efforts consist of both direct sales and sales programs managed by its network of distributors and third-party representatives. The sales teams have responsibility for new business development and assisting distributors and dealers in soliciting large projects and new customers. The distributor and dealer networks have exclusive territories and are responsible for developing sales and providing service, including product maintenance, repair, and installation. The typical dealer sells an array of safety supplies, road signs, crash cushions, delineation equipment, and other highway products. Customers include departments of transportation, municipal transportation road agencies, roadway contractors, subcontractors, distributors, and dealers. Due to the project nature of the roadway construction and congestion management markets, the Company's customer base changes from year to year. Due to the limited life of projects, it is rare that a single customer will account for a significant amount of revenues in consecutive years. The customer base also varies
7
depending on the type of product sold. The Company's moveable barrier products are typically sold to transportation agencies or the contractors or suppliers serving those agencies. In contrast, distributors account for a majority of crash cushion sales since those products have lower price points and tend to have shorter lead times.
GENERAL
Certain information generally applicable to both of the Company's reportable segments is set forth below.
The following table describes the Company's total revenues for the past three fiscal years. United States export revenue is included in International, based on the region of destination.
| For the years ended August 31, | ||||||||||||||||||||||||
($ in millions) | 2016 | 2015 | 2014 | |||||||||||||||||||||
| Revenues | % of total | Revenues | % of total | Revenues | % of total | |||||||||||||||||||
United States | $ | 321.6 | 62 | $ | 350.3 | 63 | $ | 377.7 | 61 | |||||||||||||||
International | 194.9 | 38 | 209.9 | 37 | 240.2 | 39 | ||||||||||||||||||
|
|
|
|
|
|
|
|
|
|
|
| |||||||||||||
Total revenues | $ | 516.4 | 100 | $ | 560.2 | 100 | $ | 617.9 | 100 | |||||||||||||||
|
|
|
|
|
|
|
|
|
|
|
| |||||||||||||
SEASONALITY
Irrigation equipment sales are seasonal by nature. Farmers generally order systems to be delivered and installed before the growing season. Shipments to customers located in Northern Hemisphere countries usually peak during the Company's second and third fiscal quarters for the spring planting period. Sales of infrastructure products are traditionally higher during prime road construction seasons and lower in the winter. The primary construction season for Northern Hemisphere countries is from March until late September, which generally corresponds with the Company's third and fourth fiscal quarters.
CUSTOMERS
The Company is not dependent upon a single customer or upon a limited number of customers for a material part of either segment's business. The loss of any one customer would not have a material adverse effect on the Company's financial condition, results of operations, or cash flow.
ORDER BACKLOG
As of August 31, 2016, the Company had an order backlog of $50.7 million compared with $48.0 million at August 31, 2015. The Company's backlog can fluctuate from period to period due to the seasonality, cyclicality, timing, and execution of contracts. Backlog typically represents long-term projects as well as short lead-time orders, therefore it is generally not a good indication of the next quarter's revenues.
RAW MATERIALS AND COMPONENTS
Raw materials used by the Company include coil steel, angle steel, plate steel, zinc, tires, gearboxes, concrete, rebar, fasteners, and electrical and hydraulic components (motors, switches, cable, valves, hose, and stators). The Company has, on occasion, faced shortages of certain such materials. The Company believes it currently has ready access from assorted domestic and foreign suppliers to adequate supplies of raw materials and components.
CAPITAL EXPENDITURES
Capital expenditures for fiscal 2016, 2015, and 2014 were $11.5 million, $15.2 million, and $17.7 million, respectively. Capital expenditures for fiscal 2017 are estimated to be approximately $15.0 million to $20.0 million, largely focused on manufacturing capacity expansion and productivity improvements. The Company's management does maintain flexibility to modify the amount and timing of some of the planned expenditures in response to economic conditions.
PATENTS, TRADEMARKS, AND LICENSES
Lindsay's Zimmatic ® , Greenfield ® , GrowSmart ® , Perrot ™ , Road Zipper System ™ , Quickchange ® Moveable Barrier ™ , ABSORB 350 ® , FieldNET ® , TAU ® , Universal TAU-II ® , TAU-II-R ™ , TAU-B_NR ™ , X-Tension ® , X-
8
Lite ® CableGuard ™ , TESI ™ , SAB ™ , ArmourGuard ™ , PaveGuard ™ , DR46 ™ , U-MAD ™ , Watertronics ® , LAKOS ® , and other trademarks are registered or applied for in the major markets in which the Company sells its products. In addition, the Company owns multiple patents dealing with cellular communication techniques, cathodic protection measurement methods, and data compression and transmission. Lindsay follows a policy of applying for patents on all significant patentable inventions in markets deemed appropriate. Although the Company believes it is important to follow a patent protection policy, Lindsay's business is not dependent, to any material extent, on any single patent or group of patents.
EMPLOYEES
The number of persons employed by the Company and its wholly-owned subsidiaries at the fiscal years ended 2016, 2015, and 2014 was 1,366, 1,324, and 1,202, respectively. None of the Company's U.S. employees are represented by a union. Certain of the Company's non-U.S. employees are unionized due to local governmental regulations.
ENVIRONMENTAL AND HEALTH AND SAFETY MATTERS
The Company is subject to numerous laws and regulations that govern environmental and occupational health and safety matters. The Company believes that its operations are substantially in compliance with all such applicable laws and regulations, and that it holds all necessary permits in each jurisdiction in which its facilities are located. Environmental and health and safety regulations are subject to change and interpretation. In some cases, compliance with applicable regulations or standards may require the Company to make additional capital and operational expenditures. The Company, however, is not currently aware of any material expenditures required to comply with such regulations, other than information related to the environmental remediation activities described in Note 14, Commitments and Contingencies, to the Company's consolidated financial statements. The Company accrues for the anticipated cost of investigation and remediation when the obligation is probable and can be reasonably estimated. Any revisions to these estimates could be material to the operating results of any fiscal quarter or fiscal year, however the Company does not expect such additional expenses would have a material adverse effect on its liquidity or financial condition.
FINANCIAL INFORMATION ABOUT FOREIGN AND U.S. OPERATIONS
The Company's primary production facilities are located in the United States. The Company has smaller production and sales operations in Brazil, France, Italy, China, Turkey, and South Africa, as well as distribution and sales operations in the Netherlands, Australia, and New Zealand. Where the Company exports products from the United States to international markets, the Company generally ships against prepayment, an irrevocable letter of credit confirmed by a U.S. bank or another secured means of payment, or with credit insurance from a third party. For sales within both U.S. and foreign jurisdictions, prepayments or other forms of security may be required before credit is granted, however most local sales are made based on payment terms after a full credit review has been performed. Most of the Company's financial transactions are in U.S. dollars, although some export sales and sales from the Company's foreign subsidiaries are conducted in other currencies. Approximately 19 percent and 20 percent of total consolidated Company sales were conducted in currencies other than the U.S. dollar in fiscal 2016 and 2015, respectively. To reduce the uncertainty of foreign currency exchange rate movements on these sales and purchase commitments conducted in local currencies, the Company monitors its risk of foreign currency fluctuations and, at times, may enter into forward exchange or option contracts for transactions denominated in a currency other than U.S. dollars.
In addition to the transactional foreign currency exposures mentioned above, the Company also has translation exposure resulting from translating the financial statements of its international subsidiaries into U.S. dollars. In order to reduce this translation exposure, the Company, at times, utilizes foreign currency forward contracts to hedge its net investment exposure in its foreign operations. For information on the Company's foreign currency risks, see Item 7A of Part II of this report.
INFORMATION AVAILABLE ON THE LINDSAY WEBSITE
The Company makes available free of charge on its website homepage, under the tab "Investor Relations – SEC Filings", its Annual Report on Form 10-K, Quarterly Reports on Form 10-Q, Current Reports on Form 8-K,
9
Proxy Statements, and amendments to those reports filed or furnished pursuant to Section 13(a) or 15(d) of the Securities Exchange Act of 1934, as amended, as soon as reasonably practicable after the Company electronically files such material with, or furnishes it to, the Securities and Exchange Commission. The Company's internet address is http://www.lindsay.com; however, information posted on its website is not part of this Annual Report on Form 10-K. The following documents are also posted on the Company's website homepage, under the tabs "Investor Relations – Governance – Committees" and "Investor Relations – Governance – Ethics":
Audit Committee Charter
Compensation Committee Charter
Corporate Governance and Nominating Committee Charter
Code of Business Conduct and Ethics
Corporate Governance Principles
Code of Ethical Conduct
Employee Complaint Procedures for Accounting and Auditing Matters
Special Toll-Free Hotline Number and E-mail Address for Making Confidential or Anonymous Complaints
These documents are also available in print to any stockholder upon request, by sending a letter addressed to the Secretary of the Company.
10
ITEM 1A - Risk Factors
The following are certain of the more significant risks that may affect the Company's business, financial condition and results of operations.
The Company's irrigation revenues are highly dependent on the agricultural industry and weather conditions. The Company's irrigation revenues are cyclical and highly dependent upon the need for irrigated agricultural crop production which, in turn, depends upon many factors, including total worldwide crop production, the profitability of agricultural crop production, agricultural commodity prices, net farm income, availability of financing for farmers, governmental policies regarding the agricultural sector, water and energy conservation policies, the regularity of rainfall and regional climate change. As farm income decreases, farmers may postpone capital expenditures or seek less expensive irrigation alternatives.
Weather conditions, particularly leading up to the planting and early growing season, can significantly affect the purchasing decisions of consumers of irrigation equipment. Natural calamities such as regional floods, hurricanes or other storms, and droughts can have significant effects on seasonal irrigation demand. Drought conditions, which generally affect irrigation equipment demand positively over the long term, can adversely affect demand if water sources become unavailable or if governments impose water restriction policies to reduce overall water availability.
Changing worldwide demand for food and different types of biofuel could have an effect on the price of agricultural commodities and consequently the demand for irrigation equipment . Changing worldwide demand for farm outputs to meet the world's growing food and biofuel demands, driven in part by government policies and an expanding global population, are likely to result in fluctuating agricultural commodity prices, which affect demand for irrigation equipment. The primary benefit of many of the Company's irrigation products is to increase grain yields and the resulting revenue for farmers. As grain prices decline, the breakeven point of incremental production is more difficult to achieve, reducing or eliminating the profit and return on investment from the purchase of the Company's products. As a result, changes in grain prices can significantly affect the Company's sales levels in the U.S. and international markets.
A decline in oil prices or changes in government policies regarding biofuels could also negatively affect the biofuels market and/or reduce government revenues of oil-producing countries that purchase or subsidize the purchase of irrigation equipment. Biofuels production is a significant source of grain demand in the U.S. and certain international markets. While ethanol production levels are currently mandated within the U.S., potential mandate changes or price declines for ethanol could reduce the demand for grains. In addition, a number of ethanol producers in the U.S. are cooperatives partially owned by farmers. Reduced profit of ethanol production could reduce income for farmers which could, in turn, reduce the demand for irrigation equipment.
The Company's international sales are highly dependent on foreign market conditions and subject the Company to additional risk, restrictions, and compliance obligations. International revenues are primarily generated from Australia, New Zealand, Canada, Central and Western Europe, Mexico, the Middle East, Africa, China, Russia, Ukraine, and Central and South America. In addition to risks relating to general economic and potential instability in these countries, a number of countries are particularly susceptible to disruption from changing socioeconomic conditions as well as terrorism, sanctions, war and similar incidents. The collectability of receivables can also be difficult to estimate, particularly in areas of political instability or with governments with which the Company has limited experience or where there is a lack of transparency as to the current credit condition.
The Company's international sales efforts and profit margins are affected by international trade barriers, including governmental policies on tariffs, taxes, import or export licensing requirements and trade sanctions. For example, the Company could receive penalties or even be ordered to cease certain sales activities in the event that the Company makes sales in a sanctioned country in a manner that is not in compliance with authorizations or licenses granted to the Company or its affiliates by the U.S. Department of the Treasury Office of Foreign Assets Control.
11
The Company's international sales efforts must also comply with anti-corruption laws like the U.S. Foreign Corrupt Practices Act. These anti-corruption laws generally prohibit companies and their intermediaries (including, in the Company's case, dealers and sales representatives) from making improper payments or providing anything of value to improperly influence government officials or certain private individuals for the purpose of obtaining or retaining a business advantage. As part of the Company's irrigation and infrastructure sales efforts, the Company deals with and sells solutions to government entities and state-owned or state-backed business enterprises, the employees and representatives of which may be considered government officials for purposes of the U.S. Foreign Corrupt Practices Act. Further, some of the countries in which the Company does business lack fully developed legal systems and are perceived to have elevated levels of corruption. Although the Company has compliance and training programs in place designed to reduce the likelihood of potential violations of such laws, violations of these laws or other compliance requirements could occur and result in criminal or civil sanctions and have an adverse effect on the Company's reputation, business, financial condition and results of operations.
The Company's international sales and profit margins are subject to currency exchange risk. Most of the Company's international sales involve some level of export from the U.S., either of components or completed products. Policies and geopolitical events affecting exchange rates could adversely affect the international flow of agricultural and other commodities, which can cause a corresponding downturn in the demand for agricultural equipment in many areas of the world. Further, any strengthening of the U.S. dollar or any other currency of a country in which the Company manufactures its products (e.g., Brazilian real, South African rand, Turkish lira) and/or any weakening of local currencies can increase the cost of the Company's products in its foreign markets. Irrespective of any effect on the overall demand for agricultural equipment, the effect of these changes can make the Company's products less competitive relative to local producing competitors and, in extreme cases, can result in the Company's products not being cost-effective for customers. As a result, the Company's international sales and profit margins could decline.
The Company's profitability may be negatively affected by changes in the availability and price of certain parts, components, and raw materials. The Company requires access to various parts, components, and raw materials at competitive prices in order to manufacture its products. Changes in the availability and price of these parts, components, and raw materials (including steel and zinc), which have changed significantly and rapidly at times and are affected by factors like demand and freight costs, can significantly increase the costs of production. Due to price competition in the market for irrigation equipment and certain infrastructure products, the Company may not be able to recoup increases in these costs through price increases for its products, which would result in reduced profitability. Whether increased operating costs can be passed through to the customer depends on a number of factors, including farm income and the price of competing products. Further, the Company relies on a limited number of suppliers for certain raw materials, parts and components in the manufacturing process. Disruptions or delays in supply or significant price increases from these suppliers could adversely affect the Company's operations and profitability. Such disruptions, terminations or cost increases could result in cost inefficiencies, delayed sales or reduced sales.
The Company's infrastructure revenues are highly dependent on government funding of transportation projects and subject to compliance with government regulations. The demand for the Company's infrastructure products depends to a large degree on the amount of government spending authorized to improve road and highway systems. For example, the U.S. government funds highway and road improvements through the Federal Highway Trust Fund Program and matching funding from states may be required as a condition of federal funding. If highway funding is reduced or delayed, it may reduce demand for the Company's infrastructure products.
In addition, the Company's road safety products are required to meet certain standards as outlined by the various governments worldwide. The Federal Highway Administration ("FHWA") has begun to implement updated Manual for Assessing Safety Hardware ("MASH") standards. In addition, state departments of transportation have the ability to require compliance with MASH standards prior to FHWA mandating such practices. MASH was previously optional and most road safety products in the market have not been approved under these
12
standards. The Company is incurring, and will continue to incur, research and development and testing expense to comply with these standards. The implementation of the new standards and/or any delay in the Company's development of infrastructure products that comply with the new standards could affect the Company's competitive position in the market which could have a significant effect on the sales and profitability from its road safety product line.
Compliance with applicable environmental and health and safety regulations or standards may require additional capital and operational expenditures. The Company is subject to numerous laws and regulations which govern environmental and occupational health and safety matters. The Company believes that its operations are substantially in compliance with all such applicable laws and regulations and that it holds all necessary permits in each jurisdiction in which its facilities are located. Environmental and health and safety regulations are subject to change and interpretation. Compliance with applicable regulations or standards may require the Company to make additional capital and operational expenditures.
The Company's Lindsay, Nebraska site was added to the list of priority superfund sites of the U.S. Environmental Protection Agency (the "EPA") in 1989. The Company and its environmental consultants have developed a remedial alternative work plan, under which the Company continues to work with the EPA to define and implement steps to better contain and remediate the remaining contamination. Although the Company has accrued reasonably estimable costs associated with remediation of the site, the estimate of costs and their timing could change as a result of a number of factors, including (1) input from the EPA and the Nebraska Department of Environmental Quality (the "NDEQ") on the proposed remediation plan and any changes which they may subsequently require, (2) refinement of cost estimates and length of time required to complete remediation and post-remediation operations and maintenance, (3) effectiveness of the technology chosen in remediation of the site as well as changes in technology that may be available in the future, and (4) unforeseen circumstances existing at the site. As a result of these factors, the actual amount of costs incurred by the Company in connection with the remediation of contamination of its Lindsay, Nebraska site could exceed the amounts accrued for this expense at this time. The Company's ongoing remediation activities at its Lindsay, Nebraska facility are described in Note 14, Commitments and Contingencies, to the Company's consolidated financial statements.
The Company is exposed to risks from legal proceedings. From time to time, the Company may be involved in various legal proceedings and other various claims that arise in the ordinary course of its business, which may include commercial, employment, product liability, tort, and other litigation. Current and future litigation, governmental proceedings and investigations, audits, indemnification claims or other claims that the Company faces may result in substantial costs and expenses and significantly divert the attention of its management regardless of the outcome. In addition, these matters could lead to increased costs or interruptions of its normal business operations. Litigation, governmental proceedings and investigations, audits, indemnification claims or other claims involve uncertainties and the eventual outcome of any such matter could adversely affect the Company's business, results of operations or cash flows.
Increasing insurance claims and expenses could lower profitability and increase business risk. The nature of the Company's business subjects the Company to potential liability for claims alleging property damage and personal injury or death arising from the use of or exposure to its products, especially infrastructure products that are installed along roadways. While the Company's liability insurance coverage is consistent with commercial norms in the industries in which the Company operates, an unusually large liability claim or a string of claims could potentially exceed the Company's available insurance coverage. In addition, the availability of, and the Company's ability to collect on, insurance coverage can be subject to factors beyond the Company's control. For example, any accident, incident, or lawsuit involving other companies operating in the infrastructure market could significantly affect the cost and availability of insurance to the Company in the future, even if the Company is not involved in any such accident, incident, or lawsuit. If any of the Company's third-party insurers fail, cancel, or refuse coverage, or otherwise are unable to provide the Company with adequate insurance coverage, then the Company's overall risk exposure and operational expenses would increase and the management of the Company's business operations would be disrupted.
13
Further, as insurance policies expire, increased premiums for renewed or new coverage may increase the Company's insurance expense and/or require that the Company increase its self-insured retention or deductibles. The Company maintains primary coverage and excess coverage policies. If the number of claims or the dollar amounts of any such claims rise in any policy year, the Company could suffer additional costs associated with accessing its excess coverage policies. Also, an increase in the loss amounts attributable to such claims could expose the Company to uninsured damages if the Company was unable or elected not to insure against certain claims because of increased premiums or other reasons.
Changes in interest rates could reduce demand for the Company's products. Interest rates globally remain at historically low levels. In some international markets, the Company has begun to see these rates rise and it is expected that global rates will continue to increase, potentially quickly in the U.S., as the economy improves. Rising interest rates could have a dampening effect on overall economic activity and/or the financial condition of the Company's customers, either or both of which could negatively affect customer demand for the Company's products and customers' ability to repay obligations to the Company. An increase in interest rates could also make it more difficult for customers to cost-effectively fund the purchase of new equipment, which could adversely affect the Company's sales.
The Company's consolidated financial results are reported in U.S. dollars while certain assets and other reported items are denominated in the currencies of other countries, creating currency translation risk. The reporting currency for the Company's consolidated financial statements is the U.S. dollar. Certain of the Company's assets, liabilities, expenses and revenues are denominated in other countries' currencies. Those assets, liabilities, expenses and revenues are translated into U.S. dollars at the applicable exchange rates to prepare the Company's consolidated financial statements. Therefore, increases or decreases in exchange rates between the U.S. dollar and those other currencies affect the value of those items as reflected in the Company's consolidated financial statements. Substantial fluctuations in the value of the U.S. dollar compared to other currencies could have a significant effect on the Company's results.
Security breaches and other disruptions to the Company's information technology infrastructure could interfere with its operations and could compromise the Company's and its customers' and suppliers' information, exposing the Company to liability that could cause its business and reputation to suffer. In the ordinary course of business, the Company relies upon information technology networks and systems to process, transmit and store electronic information, and to manage or support a variety of business functions, including supply chain, manufacturing, distribution, invoicing and collection of payments. The Company uses information technology systems to record, process and summarize financial information and results of operations for internal reporting purposes and to comply with regulatory financial reporting, legal and tax requirements. Additionally, the Company collects and stores sensitive data, including intellectual property, proprietary business information and the proprietary business information of customers and suppliers, as well as personally identifiable information of customers and employees, in data centers and on information technology networks. The secure operation of these networks and the processing and maintenance of this information is critical to the Company's business operations and strategy. Despite security measures and business continuity plans, the Company's information technology networks and infrastructure may be vulnerable to damage, disruptions or shutdowns due to attacks by hackers or breaches due to employee error or malfeasance or other disruptions during the process of upgrading or replacing computer software or hardware, power outages, computer viruses, telecommunication or utility failures or natural disasters or other catastrophic events. The occurrence of any of these events could compromise the Company's networks, and the information stored there could be accessed, publicly disclosed, lost or stolen. Any such access, disclosure or other loss of information could result in legal claims or proceedings, liability or regulatory penalties under laws protecting the privacy of personal information, disrupt operations, and damage the Company's reputation, which could adversely affect the Company's business.
14
ITEM 1B - Unresolved Staff Comments
None.
ITEM 2 - Properties
The Company's facilities are well-maintained, in good operating condition, and suitable for present purposes. These facilities, together with both short-term and long-term planned capital expenditures, are expected to meet the Company's manufacturing needs in the foreseeable future. The Company does not anticipate any difficulty in retaining occupancy of any leased facilities, either by renewing leases prior to expiration or by replacing them with equivalent leased facilities. The following are the Company's significant properties.
Segment | Geographic location (s) | Own/ lease | Lease expiration | Square feet | Property description | |||||||
Corporate | Omaha, Nebraska | Lease | 2019 | 30,000 | Corporate headquarters | |||||||
Irrigation | Lindsay, Nebraska | Own | N/A | 300,000 | Principal U.S. manufacturing plant consists of eight separate buildings located on 122 acres | |||||||
Irrigation | Corlu, Turkey | Lease | 2024 | 280,000 | Manufacturing plant for irrigation products | |||||||
Irrigation | Fresno, California | Own | N/A | 94,000 | Manufacturing plant for filtration products | |||||||
Infrastructure | Omaha, Nebraska | Own | N/A | 83,000 | Manufacturing plant for infrastructure products | |||||||
Irrigation | Hartland, Wisconsin | Own | N/A | 73,000 | Manufacturing plant for water pumping stations and controls | |||||||
Irrigation | La Chapelle, France | Own | N/A | 72,000 | Manufacturing plant for irrigation products | |||||||
Irrigation | Bellville, South Africa | Lease | 2019 | 71,000 | Manufacturing plant for irrigation products | |||||||
Irrigation | Mogi Mirim, Sao Paulo, Brazil | Own | N/A | 67,000 | Manufacturing plant for irrigation products | |||||||
Irrigation | Olathe, Kansas | Own | N/A | 60,000 | Manufacturing plant for machine to machine products | |||||||
Irrigation | Tianjin, China | Lease | 2017 | 58,000 | Manufacturing plant for irrigation products | |||||||
Infrastructure | Milan, Italy | Own | N/A | 45,000 | Manufacturing plant for infrastructure products | |||||||
Infrastructure | Rio Vista, California | Own | N/A | 30,000 | Manufacturing plant for infrastructure products | |||||||
ITEM 3 - Legal Proceedings
In the ordinary course of its business operations, the Company is involved, from time to time, in commercial litigation, employment disputes, administrative proceedings, business disputes, and other legal proceedings. No such current proceedings, individually or in the aggregate, are expected to have a material effect on the business or financial condition of the Company. Such proceedings are exclusive of environmental remediation matters which are discussed in Note 14, Commitments and Contingencies, to the Company's consolidated financial statements. Any revisions to the estimates accrued for environmental remediation could be material to the operating results of any fiscal quarter or fiscal year, however the Company does not expect such additional expenses would have a material adverse effect on its liquidity or financial condition.
ITEM 4 - Mine Safety Disclosures
Not applicable
15
PART II
ITEM 5 - Market for the Registrant ' s Common Equity, Related Stockholder Matters and Issuer Purchases of Equity Securities
Holders
Lindsay Common Stock trades on the New York Stock Exchange, Inc. ("NYSE") under the ticker symbol LNN. As of October 13, 2016, there were approximately 182 stockholders of record.
Price Range of Common Stock
The following table sets forth for the periods indicated the range of the high and low stock prices and dividends paid per share:
| Fiscal 2016 Stock Price | Fiscal 2015 Stock Price | |||||||||||||||||||||||
| High | Low | Dividends | High | Low | Dividends | |||||||||||||||||||
First Quarter | $ | 77.34 | $ | 63.19 | $ | 0.28 | $ | 89.50 | $ | 73.01 | $ | 0.27 | ||||||||||||
Second Quarter | $ | 79.27 | $ | 62.99 | $ | 0.28 | $ | 90.30 | $ | 80.02 | $ | 0.27 | ||||||||||||
Third Quarter | $ | 79.22 | $ | 65.78 | $ | 0.28 | $ | 89.33 | $ | 74.20 | $ | 0.27 | ||||||||||||
Fourth Quarter | $ | 75.70 | $ | 65.80 | $ | 0.29 | $ | 91.93 | $ | 72.25 | $ | 0.28 | ||||||||||||
Year | $ | 79.27 | $ | 62.99 | $ | 1.13 | $ | 91.93 | $ | 72.25 | $ | 1.09 | ||||||||||||
Purchases of Equity Securities by the Issuer and Affiliated Purchases
On January 3, 2014, the Company announced that its Board of Directors authorized a share repurchase program of up to $150.0 million of common stock through January 2, 2016. On July 22, 2015, the Company announced that its Board of Directors increased its outstanding share repurchase authorization by $100.0 million with no expiration. Under the program, shares may be repurchased in privately negotiated and/or open market transactions as well as under formalized trading plans in accordance with the guidelines specified under Rule 10b5-1 of the Securities Exchange Act of 1934, as amended. During the twelve months ended August 31, 2016, the Company repurchased 688,790 shares for an aggregate purchase price of $48.3 million. During the twelve months ended August 31, 2015, the Company repurchased 1,198,089 shares of common stock for an aggregate purchase price of $96.9 million. There were no shares repurchased during the fourth quarter of fiscal 2016. The remaining amount available under the repurchase program was $63.7 million as of August 31, 2016.
Dividends
The Company paid a total of $12.2 million and $12.8 million in dividends during fiscal 2016 and 2015, respectively. The Company currently expects that cash dividends comparable to those paid historically will continue to be paid in the future, although there can be no assurance as to the payment of future dividends as such payment depends on results of operations, financial condition, business prospects, capital requirements, contractual restrictions, any potential indebtedness the Company may incur, restrictions imposed by applicable law, tax considerations, and other factors that the Board of Directors deems relevant.
16
Company Stock Performance
The following graph compares the cumulative five-year total return attained by stockholders on the Company's Common Stock relative to the cumulative total returns of the S&P Small Cap 600 Index and the S&P Small Cap 600 Construction, Farm Machinery and Heavy Truck index for the five-year period ended August 31, 2016. An investment of $100 (with the reinvestment of all dividends) is assumed to have been made in the Company's Common Stock and in each of the indexes on August 31, 2011 and the graph shows its relative performance through August 31, 2016.
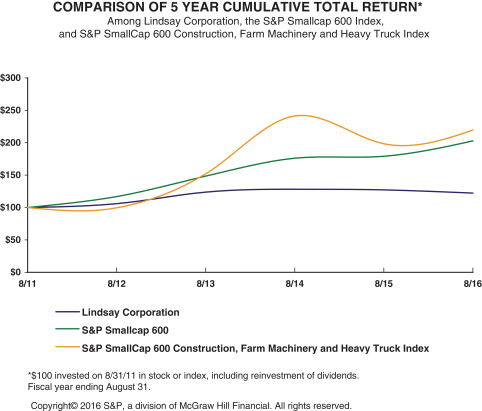
| 8/11 | 8/12 | 8/13 | 8/14 | 8/15 | 8/16 | |||||||||||||||||||
Lindsay Corporation | 100.00 | 105.72 | 123.69 | 127.96 | 127.06 | 121.88 | ||||||||||||||||||
S&P Smallcap 600 | 100.00 | 116.90 | 148.10 | 175.80 | 178.96 | 202.69 | ||||||||||||||||||
S&P SmallCap 600 Construction, Farm Machinery and Heavy Truck Index | 100.00 | 99.27 | 151.74 | 241.07 | 198.19 | 219.52 | ||||||||||||||||||
The stock price performance included in this graph is not necessarily indicative of future stock price performance.
17
ITEM 6 - Selected Financial Data
| For the years ended August 31, | ||||||||||||||||||||
($ in millions, except per share amounts) | 2016 | 2015 (1) | 2014 (2) | 2013 | 2012 | |||||||||||||||
| Operating revenues | $ | 516.4 | $ | 560.2 | $ | 617.9 | $ | 690.8 | $ | 551.3 | ||||||||||
| Gross profit | $ | 148.6 | $ | 156.3 | $ | 171.0 | $ | 194.8 | $ | 148.5 | ||||||||||
| Gross margin | 28.8% | 27.9% | 27.7% | 28.2% | 26.9% | |||||||||||||||
| Operating expenses | $ | 114.2 | $ | 105.6 | $ | 92.6 | $ | 87.8 | $ | 83.0 | ||||||||||
| Operating income | $ | 34.4 | $ | 50.7 | $ | 78.4 | $ | 107.0 | $ | 65.5 | ||||||||||
| Operating margin | 6.7% | 9.0% | 12.7% | 15.5% | 11.9% | |||||||||||||||
| Net earnings | $ | 20.3 | $ | 26.3 | $ | 51.5 | $ | 70.6 | $ | 43.3 | ||||||||||
| Net margin | 3.9% | 4.7% | 8.3% | 10.2% | 7.9% | |||||||||||||||
| Diluted net earnings per share | $ | 1.85 | $ | 2.22 | $ | 4.00 | $ | 5.47 | $ | 3.38 | ||||||||||
| Cash dividends per share | $ | 1.13 | $ | 1.09 | $ | 0.92 | $ | 0.48 | $ | 0.39 | ||||||||||
| Property, plant, and equipment, net | $ | 77.6 | $ | 78.7 | $ | 72.5 | $ | 65.1 | $ | 56.2 | ||||||||||
| Total assets | $ | 499.6 | $ | 536.5 | $ | 526.6 | $ | 512.3 | $ | 415.5 | ||||||||||
| Long-term debt, including current installments | $ | 117.2 | $ | 117.4 | $ | - | $ | - | $ | - | ||||||||||
| Total shareholders' equity | $ | 251.6 | $ | 288.6 | $ | 382.6 | $ | 380.6 | $ | 310.8 | ||||||||||
| Return on beginning shareholders' equity (3) | 7.0% | 6.9% | 13.5% | 22.7% | 15.7% | |||||||||||||||
| Diluted weighted average shares | 10,930 | 11,855 | 12,882 | 12,901 | 12,810 | |||||||||||||||
(1) Fiscal 2015 includes operating results of Elecsys Corporation acquired in the second quarter of fiscal 2015 and SPF Water Engineering, LLC acquired in the fourth quarter of fiscal 2015.
(2) Fiscal 2014 includes operating results of Claude Laval Corporation acquired near the end of fiscal 2013.
(3) Defined as net earnings divided by beginning-of-period shareholders' equity.
18
ITEM 7 - Management ' s Discussion and Analysis of Financial Condition and Results of Operations
Concerning Forward -Looking Statements - This Annual Report on Form 10-K, including Management's Discussion and Analysis of Financial Condition and Results of Operations, contains not only historical information, but also forward-looking statements within the meaning of Section 27A of the Securities Act of 1933, as amended, and Section 21E of the Securities Exchange Act of 1934, as amended. Statements that are not historical are forward-looking and reflect expectations for future Company performance. In addition, forward-looking statements may be made orally or in press releases, conferences, reports, on the Company's web site, or otherwise, in the future by or on behalf of the Company. When used by or on behalf of the Company, the words "expect," "anticipate," "estimate," "believe," "intend," "will," "plan," "predict," "project," "outlook," "could," "may," "should," and similar expressions generally identify forward-looking statements. For these statements throughout the Annual Report on Form 10-K, the Company claims the protection of the safe harbor for forward-looking statements contained in the Private Securities Litigation Reform Act of 1995. The entire sections entitled "Financial Overview and Outlook" and "Risk Factors" should be considered forward-looking statements.
Forward-looking statements involve a number of risks and uncertainties, including but not limited to those discussed in the "Risk Factors" section contained in Item 1A. Readers should not place undue reliance on any forward-looking statement and should recognize that the statements are predictions of future results or conditions, which may not occur as anticipated. Actual results or conditions could differ materially from those anticipated in the forward-looking statements and from historical results, due to the risks and uncertainties described herein, as well as others not now anticipated. The risks and uncertainties described herein are not exclusive and further information concerning the Company and its businesses, including factors that potentially could materially affect the Company's financial results, may emerge from time to time. Except as required by law, the Company assumes no obligation to update forward-looking statements to reflect actual results or changes in factors or assumptions affecting such forward-looking statements.
Company Overview
The Company manufactures and markets center pivot, lateral move, and hose reel irrigation systems. The Company also produces and markets irrigation controls, chemical injection systems, and remote monitoring and control systems. These products are used by farmers to increase or stabilize crop production while conserving water, energy, and labor. Through its acquisitions, the Company has been able to enhance its capabilities in providing innovative, turn-key solutions to customers through the integration of its proprietary pump stations, controls, and designs. The Company sells its irrigation products primarily to a world-wide independent dealer network, who resell to their customers, the farmers. The Company's primary production facilities are located in the United States. The Company has smaller production and sales operations in Brazil, France, China, Turkey, and South Africa, as well as distribution and sales operations in the Netherlands, Australia, and New Zealand. The Company also manufactures and markets, through distributors and direct sales to customers, various infrastructure products, including moveable barriers for traffic lane management, crash cushions, preformed reflective pavement tapes, and other road safety devices, through its production facilities in the United States and Italy, and has produced road safety products in irrigation manufacturing facilities in China and Brazil. In addition, the Company's infrastructure segment produces large diameter steel tubing, and railroad signals and structures, and provides outsourced manufacturing and production services for other companies.
For the business overall, the global, long-term drivers of water conservation, population growth, increasing importance of biofuels, and the need for safer, more efficient transportation solutions remain positive. Key factors which impact demand for the Company's irrigation products include total worldwide agricultural crop production, the profitability of agricultural crop production, agricultural commodity prices, net farm income, availability of financing for farmers, governmental policies regarding the agricultural sector, water and energy conservation policies, the regularity of rainfall, regional climate change, and foreign currency exchange rates. A key factor which impacts demand for the Company's infrastructure products is the amount of spending authorized by governments to improve road and highway systems. Much of the U.S. highway infrastructure market is driven by government spending programs. For example, the U.S. government funds highway and road improvements through the Federal Highway Trust Fund Program. This program provides funding to improve the
19
nation's roadway system. In December 2015, the U.S. government enacted a five-year, $305 billion highway-funding bill to fund highway and bridge projects, the first long-term national transportation spending bill in a decade. Matching funding from the various states may be required as a condition of federal funding.
The Company continues to have an ongoing, structured, acquisition process that it expects to generate additional growth opportunities throughout the world in irrigation/water solutions. Lindsay is committed to achieving earnings growth by global market expansion, improvements in margins, and strategic acquisitions. Since 2001, the Company has utilized acquisitions and greenfield efforts to expand its product lines and add to its operations in Europe, South America, South Africa, the Netherlands, Australia, New Zealand, China, and Turkey. The addition of those operations has allowed the Company to strengthen its market position in those regions.
New Accounting Standards Issued But Not Yet Adopted
See Note 2, New Accounting Pronouncements, to the Company's consolidated financial statements for information regarding recently issued accounting pronouncements.
Critical Accounting Policies and Estimates
In preparing the consolidated financial statements in conformity with U.S. generally accepted accounting principles ("GAAP"), management must make a variety of decisions which impact the reported amounts and the related disclosures. Such decisions include the selection of the appropriate accounting principles to be applied and the assumptions on which to base accounting estimates. In reaching such decisions, management applies judgment based on its understanding and analysis of the relevant facts and circumstances. Certain of the Company's accounting policies are critical, as these policies are most important to the presentation of the Company's consolidated results of operations and financial condition. They require the greatest use of judgments and estimates by management based on the Company's historical experience and management's knowledge and understanding of current facts and circumstances. Management periodically re-evaluates and adjusts the estimates that are used as circumstances change. Following are the accounting policies management considers critical to the Company's consolidated results of operations and financial condition:
Revenue Recognition
The Company's revenue recognition accounting policy is critical because it can significantly impact the Company's consolidated results of operations and financial condition. The Company's basic criteria necessary for revenue recognition are: 1) evidence of a sales arrangement exists; 2) delivery of goods has occurred; 3) the sales price to the buyer is fixed or determinable; and 4) collectability is reasonably assured. The Company recognizes revenue when these criteria have been met, and when title and risk of loss transfers to the customer. The Company generally has no post-delivery obligations to its independent dealers other than standard warranties. Revenues and gross profits on intercompany sales are eliminated in consolidation. Revenues from the sale of the Company's products are recognized based on the delivery terms in the sales contract. If an arrangement involves multiple deliverables, revenues from the arrangement are allocated to the separate units of accounting based on their relative selling price.
The Company offers a subscription-based service for wireless management and recognizes subscription revenue on a straight-line basis over the contract term. The Company leases certain infrastructure property held for lease to customers, such as moveable concrete barriers and Road Zipper Systems ™ . Revenues for the lease of infrastructure property held for lease are recognized on a straight-line basis over the lease term.
The costs related to revenues are recognized in the same period in which the specific revenues are recorded. Shipping and handling fees billed to customers are reported in revenue. Shipping and handling costs incurred by the Company are included in cost of sales. Customer rebates, cash discounts, and other sales incentives are recorded as a reduction of revenues at the time of the original sale. Estimates used in the recognition of operating revenues and cost of operating revenues include, but are not limited to, estimates for product warranties, product rebates, cash discounts, and fair value of separate units of accounting on multiple deliverables.
20
Inventories
The Company's accounting policy on inventories is critical because the valuation and costing of inventory is essential to the presentation of the Company's consolidated results of operations and financial condition. Inventories are stated at the lower of cost or market. Cost is determined by the last-in, first-out ("LIFO") method, the first-in, first-out ("FIFO") method, or the weighted average cost method for inventory depending on the operations at each specific location. At all locations, the Company reserves for obsolete, slow moving, and excess inventory by estimating the net realizable value based on the potential future use of such inventory.
Environmental Remediation Liabilities
The Company's accounting policy on environmental remediation is critical because it requires significant judgments and estimates by management, involves changing regulations and approaches to remediation plans, and any revisions could be material to the operating results of any fiscal quarter or fiscal year. The Company is subject to an array of environmental laws and regulations relating to the protection of the environment. In particular, the Company committed to remediate environmental contamination of the groundwater at, and land adjacent, to its Lindsay, Nebraska facility (the "site") with the EPA. The Company and its environmental consultants have developed a remedial alternative work plan, under which the Company continues to work with the EPA to define and implement steps to better contain and remediate the remaining contamination.
Environmental remediation liabilities include costs directly associated with site investigation and clean up, such as materials, external contractor costs, and incremental internal costs directly related to the remedy. Estimates used to record environmental remediation liabilities are based on the Company's best estimate of probable future costs based on site-specific facts and circumstances. Estimates of the cost for the likely remedy are developed using internal resources or by third-party environmental engineers or other service providers. The Company records the undiscounted environmental remediation liabilities that represent the points in the range of estimates that are most probable, or the minimum amount when no amount within the range is a better estimate than any other amount.
During the second quarter of fiscal 2016, the Company completed its testing for a feasibility study which clarified the extent of contamination, including the identification of a source of contamination near the manufacturing building that was not part of the area for which reserves were previously established. The Company, together with its third-party environmental experts, participated in a preliminary meeting with the EPA and the NDEQ during the third quarter of fiscal 2016 to review remediation alternatives and proposed plans for the site and submitted its remedial alternatives evaluation report to the EPA in August 2016. The proposed remediation plan is preliminary and has not been approved by the EPA or the NDEQ. Based on guidance from third-party environmental experts and the preliminary discussions held with the EPA, the Company anticipates that a definitive plan will not be agreed upon until fiscal 2017 or later.
The Company accrues the anticipated cost of environmental remediation when the obligation is probable and can be reasonably estimated. Although the Company has accrued reasonably estimable costs associated with remediation of the site, additional testing, environmental monitoring, and remediation could be required in the future as part of the Company's ongoing discussions with the EPA regarding the development and implementation of the remedial action plans. While any revisions could be material to the operating results of any fiscal quarter or fiscal year, the Company does not expect such additional expenses would have a material adverse effect on its liquidity or financial condition.
Trade Receivables and Allowances
Trade receivables are reported on the balance sheet, net of any doubtful accounts. Losses are recognized when it is probable that an asset has been impaired and the amount of the loss can be reasonably estimated. In estimating probable losses, the Company reviews specific accounts that are significant and past due, in bankruptcy, or otherwise identified at risk for potential credit loss. Collectability of these specific accounts are assessed based on facts and circumstances of that customer, and an allowance for credit losses is established based on the probability of default. In assessing the likelihood of collection of receivable, the Company considers, for
21
example, the Company's history of collections, the current status of discussions and repayment plans, collateral received, and other evidence and information regarding collection or default risk that is available in the market place. The allowance for credit losses attributable to the remaining accounts is established using probabilities of default and an estimate of associated losses based upon the aging of receivable balances, collection experience, economic condition, and credit risk quality. In evaluating the allowance expense as a percentage of sales, if the prior three-year average rate were to double, the result on the fiscal 2016 consolidated statement of operations would be additional expense of approximately $2.7 million.
As the Company's international business has grown, the exposure to potential losses in international markets has also increased. These exposures can be difficult to estimate, particularly in areas of political instability, or with governments with which the Company has limited experience, or where there is a lack of transparency as to the current credit condition of governmental units. As of August 31, 2016, the Company had $5.1 million in delinquent accounts receivable related to our business in China, and $1.5 million of accounts receivable and $2.0 million in performance bonds related to its contract in Iraq. The Company's allowance for all doubtful accounts related to outstanding receivables decreased to $8.3 million at August 31, 2016 from $9.7 million at August 31, 2015. The Company's evaluation of the adequacy of the allowance for credit losses is based on facts and circumstances available to the Company at the date the consolidated financial statements are issued, and considers any significant changes in circumstances occurring through the date that the financial statements are issued.
Valuation of Goodwill and Identifiable Intangible Assets
The Company's accounting policy on valuation of goodwill and identifiable intangible assets is critical because it requires significant judgments and estimates by management, and can significantly affect the Company's consolidated results of operations and financial condition. Goodwill represents the excess of the purchase price over the fair value of net assets acquired in a business combination. Acquired intangible assets are recognized separately from goodwill. Goodwill and intangible assets with indefinite useful lives are tested for impairment at least annually at August 31, and whenever triggering events or changes in circumstances indicate its carrying value may not be recoverable. Assessment of the potential impairment of goodwill and identifiable intangible assets is an integral part of the Company's normal ongoing review of operations. Testing for potential impairment of these assets is significantly dependent on numerous assumptions and reflects management's best estimates at a particular point in time. The dynamic economic environments in which the Company's businesses operate and key economic and business assumptions related to projected selling prices, market growth, inflation rates, and operating expense ratios, can significantly affect the outcome of impairment tests. Estimates based on these assumptions may differ significantly from actual results. Changes in factors and assumptions used in assessing potential impairments can have a significant impact on the existence and magnitude of impairments, as well as the time in which such impairments are recognized.
In testing goodwill for impairment, the Company has the option to first assess qualitative factors to determine whether the existence of events or circumstances leads to a determination that it is more likely than not (more than 50 percent) that the estimated fair value of a reporting unit is less than its carrying amount. A significant amount of judgment is involved in determining if an indicator of impairment has occurred. Such indicators include deterioration in general economic conditions, adverse changes in the markets in which an entity operates, increases in input costs that have negative effects on earnings and cash flows, or a trend of negative or declining cash flows over multiple periods, among others. If the Company elects to perform a qualitative assessment and determines that an impairment is more likely than not, the Company is then required to perform a quantitative impairment test, otherwise no further analysis is required. The Company also may elect not to perform the qualitative assessment and, instead, proceed directly to the quantitative impairment test. In fiscal 2016, in conjunction with the Company's annual review for impairment, the Company performed a qualitative analysis of goodwill for each of the Company's reporting units, which are the same as its operating segments, and did not identify any potential impairment.
In assessing other intangible assets not subject to amortization for impairment, the Company has the option to perform a qualitative assessment to determine whether the existence of events or circumstances leads to a
22
determination that it is more likely than not that the fair value of such an intangible asset is less than its carrying amount. If the Company determines that it is not more likely than not that the fair value of such an intangible asset is less than its carrying amount, then the Company is not required to perform any additional tests for assessing intangible assets for impairment. However, if the Company concludes otherwise, or elects not to perform the qualitative assessment, the Company is then required to perform a quantitative impairment test that involves a comparison of the estimated fair value of the intangible asset with its carrying value. If the carrying value of the intangible asset exceeds its fair value, an impairment loss is recognized in an amount equal to that excess. In fiscal 2016, the Company performed a qualitative analysis of other intangible assets not subject to amortization and concluded there were no indicators of impairment.
Financial Overview and Outlook
Net earnings for fiscal 2016 were $20.3 million or $1.85 per diluted share compared with $26.3 million or $2.22 per diluted share in the prior year. The decrease in earnings was primarily attributable to lower revenues, which declined 8 percent to $516.4 million from $560.2 million, and increased operating expenses. Irrigation revenues decreased 7 percent to $421.6 million and infrastructure revenues decreased 13 percent to $94.8 million.
The Company's irrigation revenues are highly dependent upon the need for irrigated agricultural crop production, which, in turn, depends upon many factors, including the following primary drivers:
| • | Agricultural commodity prices - As of August 2016, corn prices have decreased approximately 15 percent and soybean prices have increased approximately 9 percent from August 2015. Although there has been an increase in soybean prices from the previous year, both corn and soybean prices remain substantially lower than the peak prices observed during the last five years. Among other things, favorable growing conditions in the United States throughout the beginning of the 2016 growing season have led to estimates of record harvests which, combined with the current high stock of commodities, may continue to contribute to low prices for agricultural commodities. |
| • | Net farm income - As of August 2016, the U.S. Department of Agriculture (the "USDA") estimated U.S. 2016 net farm income to be $71.5 billion, down 11.5 percent from USDA's final U.S. 2015 net farm income of $80.7 billion. If realized, the 2016 net farm income would be the lowest since 2009. |
| • | Weather conditions – Demand for irrigation equipment is often positively affected by storm damage and prolonged periods of drought conditions as producers look for ways to reduce the risk of low crop production and crop failures. Conversely, demand for irrigation equipment can be negatively affected during periods of more predictable natural precipitation. |
| • | Governmental policies - A number of government laws and regulations can impact the Company's business, including: |
| • | The Agricultural Act of 2014 provides a degree of certainty to growers by adopting a five-year farm bill. This law continued many of the existing programs, including funding for the Environmental Quality Incentives Program, which provides financial assistance to farmers to implement conservation practices, and is frequently used to assist in the purchase of center pivot irrigation systems. |
| • | In December 2015, certain tax incentives such as the Section 179 income tax deductions and bonus depreciation that are intended to encourage equipment purchases were granted long-term extensions. These incentives could benefit equipment sales in the future. |
| • | Various U.S. and global trade sanctions, as well as market fluctuations and political hostility, could negatively affect irrigation equipment sales to certain geographic markets around the world. |
23
| • | On November 30, 2015, the EPA finalized requirements for the amount of ethanol and other renewable fuels blended into the overall U.S. fuel supply in 2016. The Company believes the requirement, while less than the original mandate, still provides for continued growth in demand for the current calendar year as the goal is to achieve 18 billion gallons of renewable fuels for 2016. Increased ethanol production is a driver of the demand for irrigation products. |
| • | Many international markets are affected by government policies such as subsidies and other agriculturally related incentives. While these policies can have a significant effect on individual markets, they typically do not have a material effect on the consolidated results of the Company. |
| • | Currency –The value of the U.S. dollar fluctuates in relation to the value of currencies in a number of countries to which the Company exports products and maintains local operations. The strengthening of the dollar increases the cost in the local currency of the products exported from the U.S. into these countries and, therefore, could negatively affect the Company's international sales and margins. In addition, the U.S. dollar value of sales made in any affected foreign currencies will decline as the value of the dollar rises in relation to these other currencies. |
U.S. irrigation revenues have contracted due to lower commodity prices and lower farm income, favorable growing conditions, and the lack of significant demand driven by storm damage. International markets remain active, but with some projects delayed due to lower commodity prices, the weakening of international currency, and various regional conflicts. The current political environment in Russia, Ukraine, and the Middle East may have a negative effect on international irrigation equipment revenues. The factors outlined throughout this section do not indicate a significant change in macro demand for irrigation segment revenues in fiscal 2017, although these factors could change before the Company reaches its primary selling season in calendar 2017.
The infrastructure business has improved its profit profile and generated growth in an environment of constrained government spending. In December 2015, the U.S. government enacted a five-year, $305 billion highway-funding bill to fund highway and bridge projects, the first long-term national transportation spending bill in a decade. In addition, the FHWA has mandated a change to highway safety product certification requirements. The change has required additional research and development spending and could have an impact on the competitive positioning of the Company's highway safety products. In spite of government spending uncertainty, opportunities exist for market share gains in each of the infrastructure product lines. Demand for the Company's transportation safety products continues to be driven by population growth and the need for improved road safety. These factors are unlikely to result in a significant change in demand in fiscal 2017.
As of August 31, 2016, the Company had an order backlog of $50.7 million compared with $48.0 million at August 31, 2015. The Company's backlog can fluctuate from period to period due to the seasonality, cyclicality, timing, and execution of contracts. Backlog typically represents long-term projects as well as short lead-time orders; therefore it is generally not a good indication of the next quarter's revenues.
The global drivers for the Company's markets of population growth, expanded food production and efficient water use and infrastructure expansion support the Company's long-term growth goals. The most significant opportunities for growth over the next several years are in international markets, where irrigation use is significantly less developed and demand is driven primarily by food security, water scarcity and population growth.
Results of Operations
The following "Fiscal 2016 Compared to Fiscal 2015" and the "Fiscal 2015 Compared to Fiscal 2014" sections present an analysis of the Company's consolidated operating results displayed in the Consolidated Statements of Operations and should be read together with the information in Note 17, Industry Segment Information, to the consolidated financial statements.
24
Fiscal 2016 Compared to Fiscal 2015
The following table provides highlights for fiscal 2016 compared with fiscal 2015:
| For the years ended August 31, | Percent increase (decrease) | |||||||||||
($ in thousands) | 2016 | 2015 | ||||||||||
Consolidated | ||||||||||||
Operating revenues | $ | 516,411 | $ | 560,181 | (8%) | |||||||
Cost of operating revenues | $ | 367,798 | $ | 403,860 | (9%) | |||||||
Gross profit | $ | 148,613 | $ | 156,321 | (5%) | |||||||
Gross margin | 28.8% | 27.9% | ||||||||||
Operating expenses (1) | $ | 114,238 | $ | 105,626 | 8% | |||||||
Operating income | $ | 34,375 | $ | 50,695 | (32%) | |||||||
Operating margin | 6.7% | 9.0% | ||||||||||
Other (expense) income, net | $ | (5,087) | $ | (3,944) | 29% | |||||||
Income tax expense | $ | 9,021 | $ | 20,442 | (56%) | |||||||
Effective income tax rate | 30.8% | 43.7% | ||||||||||
Net earnings | $ | 20,267 | $ | 26,309 | (23%) | |||||||
Irrigation segment (2) | ||||||||||||
Operating revenues | $ | 421,641 | $ | 451,205 | (7%) | |||||||
Operating income (3) | $ | 49,232 | $ | 52,065 | (5%) | |||||||
Operating margin (3) | 11.7% | 11.5% | ||||||||||
Infrastructure segment (2) | ||||||||||||
Operating revenues | $ | 94,770 | $ | 108,976 | (13%) | |||||||
Operating income (3) | $ | 18,535 | $ | 20,249 | (8%) | |||||||
Operating margin (3) | 19.6% | 18.6% | ||||||||||
(1) Includes $33.4 million and $21.6 million of unallocated general and administrative expenses for fiscal 2016 and fiscal 2015, respectively.
(2) See Note 17 for further details regarding segments.
(3) Excludes unallocated corporate general and administrative expenses.
Revenues
Operating revenues in fiscal 2016 decreased by 8 percent to $516.4 million compared with $560.2 million in fiscal 2015. The decrease is attributable to a $29.6 million decrease in irrigation segment revenues and a $14.2 million decrease in infrastructure segment revenues. The irrigation segment provided 82 percent of Company revenue in fiscal 2016 as compared to 81 percent in fiscal 2015.
U.S. irrigation revenues in fiscal 2016 of $262.2 million decreased $11.5 million or 4 percent from $273.7 million in fiscal 2015. The decrease in U.S. irrigation revenues is due to a decline in irrigation system unit volume reflecting lower market demand, and reduced market pricing from passing through lower steel costs. This decrease was offset somewhat by a modest increase in other irrigation component revenues, including pump stations and technology products, and the full year impact of the Elecsys and SPF acquisitions completed in fiscal 2015.
International irrigation revenues in fiscal 2016 of $159.4 million decreased $18.1 million or 10 percent from $177.5 million in fiscal 2015. Changes in foreign currency translation rates compared to the prior year reduced international irrigation revenues by $12.3 million for fiscal 2016. Excluding the impact of changes in foreign currency translation rates, international irrigation revenues declined by $5.8 million as lower market demand in Brazil and Australia more than offset improved unit volume in most other international markets.
Infrastructure segment revenues in fiscal 2016 of $94.8 million decreased by $14.2 million or 13 percent from $109.0 million in fiscal 2015. The decrease is primarily due to the completion of a large of Road Zipper System ™ project in the prior year and the negative impact of changes in foreign currency translation rates of
25
$2.2 million. In addition, increased Road Zipper System ™ lease revenue and road safety product sales in fiscal 2016 were partially offset by declines in tubing, rail, and contract manufacturing revenue.
Gross Profit
Gross profit was $148.6 million for fiscal 2016, a decrease of $7.7 million, or 5 percent, compared to fiscal 2015. The decrease in gross profit was due to the decline in sales partially offset by an increase in gross margin to 28.8 percent for fiscal 2016 from 27.9 percent for fiscal 2015. Gross margin in irrigation increased by slightly less than 1 percentage point due to higher margin sales mix from the full year impact of Elecsys Corporation and improvement in other irrigation component margins. Infrastructure gross margin increased by approximately 2.8 percentage points due to revenue growth and cost leverage in road safety products in both the U.S. and Europe.
Operating Expenses
The Company's operating expenses of $114.2 million for fiscal 2016 increased $8.6 million compared to fiscal 2015 operating expenses of $105.6 million. The increase in operating expenses is primarily due to $11.5 million of incremental environmental remediation expenses and $4.8 million of additional expenses from the full year impact of the Elecsys and SPF acquisitions, net of reductions of $5.0 million in bad debt expense, $1.9 million in acquisition and integration related costs in the prior year, and collection of previously reserved accounts receivable. Operating expenses were 22.1 percent of sales for fiscal 2016 compared to 18.9 percent of sales for fiscal 2015. Operating margin was 6.7 percent for fiscal 2016 as compared to 9.0 percent for fiscal 2015. The Company's operating income decreased to $34.4 million in fiscal 2016 compared to $50.7 million during fiscal 2015.
Income Taxes
The Company recorded income tax expense of $9.0 million and $20.4 million for fiscal 2016 and fiscal 2015, respectively. The effective income tax rate decreased to 30.8 percent in fiscal 2016 compared to 43.7 percent in fiscal 2015. The decrease in the annual effective income tax rate is due to a deferred income tax asset valuation allowance in the prior year that impacted the rate by 6.3 percent, and proportionately higher earnings from foreign operations in the current year with tax rates lower than in the U.S.
Net Earnings
Net earnings for fiscal 2016 were $20.3 million, or $1.85 per diluted share, compared to $26.3 million, or $2.22 per diluted share, for fiscal 2015.
26
Fiscal 2015 Compared to Fiscal 2014
The following table provides highlights for fiscal 2015 compared with fiscal 2014:
| For the years ended August 31, | Percent increase (decrease) | |||||||||||
($ in thousands) | 2015 | 2014 | ||||||||||
Consolidated | ||||||||||||
Operating revenues | $ | 560,181 | $ | 617,933 | (9%) | |||||||
Cost of operating revenues | $ | 403,860 | $ | 446,938 | (10%) | |||||||
Gross profit | $ | 156,321 | $ | 170,995 | (9%) | |||||||
Gross margin | 27.9% | 27.7% | ||||||||||
Operating expenses (1) | $ | 105,626 | $ | 92,637 | 14% | |||||||
Operating income | $ | 50,695 | $ | 78,358 | (35%) | |||||||
Operating margin | 9.0% | 12.7% | ||||||||||
Other (expense) income, net | $ | (3,944) | $ | 297 | (1428%) | |||||||
Income tax expense | $ | 20,442 | $ | 27,143 | (25%) | |||||||
Effective income tax rate | 43.7% | 34.5% | ||||||||||
Net earnings | $ | 26,309 | $ | 51,512 | (49%) | |||||||
Irrigation segment (2) | ||||||||||||
Operating revenues | $ | 451,205 | $ | 539,943 | (16%) | |||||||
Operating income (3) | $ | 52,065 | $ | 91,697 | (45%) | |||||||
Operating margin (3) | 11.5% | 17.0% | ||||||||||
Infrastructure segment (2) | ||||||||||||
Operating revenues | $ | 108,976 | $ | 77,990 | 40% | |||||||
Operating income (3) | $ | 20,249 | $ | 3,511 | 477% | |||||||
Operating margin (3) | 18.6% | 4.5% | ||||||||||
(1) Includes $21.6 million and $16.9 million of unallocated general and administrative expenses for fiscal 2015 and fiscal 2014, respectively.
(2) See Note 17 for further details regarding segments.
(3) Excludes unallocated corporate general and administrative expenses.
Revenues
Operating revenues in fiscal 2015 decreased by 9 percent to $560.2 million compared with $617.9 million in fiscal 2014. The decrease is attributable to an $88.7 million decrease in irrigation segment revenues offset in part by a $31.0 million increase in infrastructure segment revenues. The irrigation segment provided 81 percent of Company revenue in fiscal 2015 as compared to 87 percent in fiscal 2014.
U.S. irrigation revenues in fiscal 2015 of $273.7 million, which include $17.7 million from the newly acquired Elecsys Corporation, decreased $57.8 million or 17 percent from $331.5 million in fiscal 2014. The decrease in U.S. irrigation revenues is primarily due to a decline in the number of irrigation systems sold as compared to the prior year. Sustained low agricultural commodity prices, lower net farm income in 2015 and a lack of incremental storm damage compared to 2014 contributed to lower demand for U.S. irrigation equipment.
International irrigation revenues in fiscal 2015 of $177.5 million decreased $30.9 million or 15 percent from $208.4 million in fiscal 2014. Foreign currency translation compared to the prior year reduced international irrigation revenues by $18.0 million for fiscal 2015. Excluding the impact of foreign currency, revenues decreased most notably in the Middle East, Europe, Latin America, and China, partially offset by increases in Brazil, Australia, and Africa.
Infrastructure segment revenues in fiscal 2015 of $109.0 million increased by $31.0 million or 40 percent from $78.0 million in fiscal 2014. The increase in sales is primarily due to increases in sales of Road Zipper System ™ and road safety products.
27
Gross Profit
Gross profit was $156.3 million for fiscal 2015, a decrease of $14.7 million compared to fiscal 2014. The decrease in gross profit was primarily due to the decline in sales partially offset by an increase in gross margin to 27.9 percent for fiscal 2015 from 27.7 percent for fiscal 2014. Gross margin in irrigation declined by slightly more than 1 percentage point due primarily to pricing pressure and cost deleverage on lower volumes. Infrastructure gross margin increased by approximately 8 percentage points due to a mix shift to higher margin products and cost leverage on higher sales.
Operating Expenses
The Company's operating expenses of $105.6 million for fiscal 2015 increased $13.0 million compared to fiscal 2014 operating expenses of $92.6 million. The current year includes $6.4 million of Elecsys Corporation operating expenses, $5.0 million of bad debt expense, $2.0 million in incremental health benefit costs, $1.8 million of acquisition and integration expenses and a $1.5 million increase in estimated environmental expenses, partially offset by reductions in discretionary spending and personnel related expenses of $2.9 million. Operating expenses were 18.9 percent of sales for fiscal 2015 compared to 15.0 percent of sales for fiscal 2014. Operating margin was 9.0 percent for fiscal 2015 as compared to 12.7 percent for fiscal 2014. The Company's operating income decreased to $50.7 million in fiscal 2015 compared to $78.4 million during fiscal 2014.
Income Taxes
The Company recorded income tax expense of $20.4 million and $27.1 million for fiscal 2015 and fiscal 2014, respectively. The effective income tax rate increased to 43.7 percent in fiscal 2015 compared to 34.5 percent in fiscal 2014. The increase in the annual effective income tax rate primarily relates to a deferred income tax asset valuation allowance that contributed 6.3 percent to the increase, as well as the earnings mix among jurisdictions.
Net Earnings
Net earnings for fiscal 2015 were $26.3 million, or $2.22 per diluted share, compared to $51.5 million, or $4.00 per diluted share, for fiscal 2014.
Liquidity and Capital Resources
The Company's cash and cash equivalents totaled $101.2 million at August 31, 2016 compared with $139.1 million at August 31, 2015. The Company requires cash for financing its receivables and inventories, paying operating expenses and capital expenditures, and for dividends and share repurchases. The Company meets its liquidity needs and finances its capital expenditures from its available cash and funds provided by operations along with borrowings under the credit arrangements that are described below. The Company believes its current cash resources, projected operating cash flow, and remaining capacity under its continuing bank lines of credit are sufficient to cover all of its expected working capital needs, planned capital expenditures and dividends. The Company's Capital Allocation Plan outlined below could require the Company to incur additional debt depending on the size and timing of share repurchases and potential acquisitions.
The Company's total cash and cash equivalents held by foreign subsidiaries was approximately $34.6 million and $23.5 million as of August 31, 2016 and 2015, respectively. The Company considers earnings of foreign subsidiaries to be permanently reinvested, and would need to accrue and pay taxes if these funds were repatriated. The Company does not intend to repatriate the funds, and does not expect these funds to have a significant impact on the Company's overall liquidity.
Net working capital was $204.2 million at August 31, 2016 as compared with $227.1 million at August 31, 2015. Cash flows provided by operations totaled $33.1 million during the year ended August 31, 2016 compared to $48.7 million provided by operations during the same prior year period. Cash provided by operations decreased by $15.6 million compared to the prior year period primarily as a result of a $6.0 million decrease in net earnings and normal fluctuations in the changes between accounts receivable, other current liabilities and current taxes payable.
Cash flows used in investing activities totaled $9.9 million during the year ended August 31, 2016 compared to $79.6 million during the same prior year period. Net cash used in investing activities was higher in fiscal 2015
28
primarily due to the $67.2 million acquisition of Elecsys Corporation that occurred in the second quarter of fiscal 2015. Capital spending of $11.5 million in fiscal 2016 was lower than prior year capital spending of $15.2 million.
Cash flows used in financing activities totaled $61.3 million during the year ended August 31, 2016 compared to cash flows provided by financing activities of $3.9 million during the same prior year period. The $65.2 million increase in cash used by financing activities was primarily due to $115.0 million proceeds from the issuance of long-term debt in fiscal 2015, offset by a decrease in share repurchases of $48.5 million in fiscal 2016 compared to fiscal 2015.
Capital Allocation Plan
The Company's capital allocation plan is to continue investing in revenue and earnings growth, combined with a defined process for enhancing returns to stockholders. Priorities for the use of cash under the Company's capital allocation plan include:
| • | Investment in organic growth including capital expenditures and expansion of international markets, |
| • | Dividends to stockholders, along with expectations to increase dividends on an annual basis, |
| • | Synergistic water related acquisitions that provide attractive returns to stockholders, and |
| • | Opportunistic share repurchases taking into account cyclical and seasonal fluctuations. |
Capital Expenditures and Expansion of International Markets
In fiscal 2017, the Company expects capital expenditures of approximately $15.0 million to $20.0 million, largely focused on manufacturing capacity expansion and productivity improvements. The Company's management does maintain flexibility to modify the amount and timing of some of the planned expenditures in response to economic conditions.
Dividends
In fiscal 2016, the Company paid cash dividends of $1.13 per common share or $12.2 million to stockholders as compared to $1.09 per common share or $12.8 million in fiscal 2015.
Share Repurchases
On January 3, 2014, the Company announced that its Board of Directors authorized a share repurchase program of up to $150.0 million of common stock through January 2, 2016. On July 22, 2015, the Company announced that its Board of Directors increased its outstanding share repurchase authorization by $100.0 million with no expiration. Under the program, shares may be repurchased in privately negotiated and/or open market transactions as well as under formalized trading plans in accordance with the guidelines specified under Rule 10b5-1 of the Securities Exchange Act of 1934, as amended. During the twelve months ended August 31, 2016, the Company repurchased 688,790 shares for an aggregate purchase price of $48.3 million. During the twelve months ended August 31, 2015, the Company repurchased 1,198,089 shares of common stock for an aggregate purchase price of $96.9 million. The remaining amount available under the repurchase program was $63.7 million as of August 31, 2016.
Long-Term Borrowing Facilities
Senior Notes . On February 19, 2015, the Company issued $115.0 million in aggregate principal amount of Senior Notes, Series A (the "Senior Notes"). The entire principal of the Senior Notes is due and payable on February 19, 2030. Interest on the Senior Notes is payable semi-annually at a fixed annual rate of 3.82 percent and borrowings under the Senior Notes are unsecured. The Company intends to use the proceeds of the sale of the Senior Notes for general corporate purposes, including acquisitions and dividends.
Revolving Credit Facility . On February 18, 2015, the Company entered into a $50 million unsecured Amended and Restated Revolving Credit Facility (the "Revolving Credit Facility") with Wells Fargo Bank, National Association. The Revolving Credit Facility replaces a previous revolving credit facility from the same lender originally entered into on January 24, 2008 and last amended on January 22, 2014. The Company intends to use
29
borrowings under the Revolving Credit Facility for working capital purposes and to fund acquisitions. At August 31, 2016 and August 31, 2015, the Company had no outstanding borrowings under the Revolving Credit Facility. The amount of borrowings available at any time under the Revolving Credit Facility is reduced by the amount of standby letters of credit then outstanding. At August 31, 2016, the Company had the ability to borrow up to $43.9 million under this facility, after consideration of outstanding standby letters of credit of $6.1 million. Borrowings under the Revolving Credit Facility bear interest at a variable rate equal to LIBOR plus 90 basis points (1.42 percent at August 31, 2016), subject to adjustment as set forth in the loan documents for the Revolving Credit Facility. Interest is paid on a monthly to quarterly basis depending on loan type. The Company also pays an annual commitment fee of 0.25 percent on the unused portion of the Revolving Credit Facility. Borrowings under the Revolving Credit Facility have equal priority with borrowings under the Company's Senior Notes. Unpaid principal and interest on the Revolving Credit Facility is due by February 18, 2018.
Each of the credit arrangements described above include certain covenants relating primarily to the Company's financial condition. These financial covenants include a funded debt to EBITDA leverage ratio and an interest coverage ratio. Upon the occurrence of any event of default of these covenants, including a change in control of the Company, all amounts outstanding thereunder may be declared to be immediately due and payable. At August 31, 2016 and August 31, 2015, the Company was in compliance with all financial loan covenants contained in its credit arrangements in place as of each of those dates.
Series 2006A Bonds . Elecsys International Corporation, a wholly owned subsidiary of the Company, has outstanding $2.2 million in principal amount of industrial revenue bonds that were issued in 2006 (the "Series 2006A Bonds"). Principal and interest on the Series 2006A Bonds are payable monthly through maturity on September 1, 2026. The interest rate is adjustable based on the yield of the 5-year United States Treasury Notes, plus 0.45 percent (1.64 percent as of August 31, 2016). The obligations under the Series 2006A Bonds are secured by a first priority security interest in certain real estate.
Inflation
The Company is subject to the effects of changing prices. During fiscal 2016, the Company realized pricing volatility for purchases of certain commodities, in particular steel and zinc products, used in the production of its products. While the cost outlook for commodities used in the production of the Company's products is not certain, management believes it can manage these inflationary pressures by introducing appropriate sales price adjustments and by actively pursuing internal cost reduction efforts, while further refining the Company's inventory and raw materials risk management system. However, competitive market pressures may affect the Company's ability to pass price adjustments along to its customers.
Contractual Obligations, Commercial Commitments and Off-Balance Sheet Arrangements
In the normal course of business, the Company enters into contracts and commitments which obligate the Company to make future payments. The Company uses off-balance sheet arrangements, such as leases accounted for as operating leases, standby letters of credit and performance bonds, where sound business principles warrant their use. The table below sets forth the Company's significant future obligations by time period.
($ in thousands) Contractual obligations (1) | Total | Less than 1 year | 2-3 years | 4-5 years | More than 5 years | |||||||||||||||
Operating lease obligations | $ | 17,286 | $ | 3,921 | $ | 5,552 | $ | 3,442 | $ | 4,371 | ||||||||||
Pension benefit obligations | 7,426 | 557 | 1,074 | 1,046 | 4,749 | |||||||||||||||
Long-term debt | 117,173 | 197 | 406 | 422 | 116,148 | |||||||||||||||
Interest | 59,524 | 4,433 | 8,854 | 8,839 | 37,398 | |||||||||||||||
|
|
|
|
|
|
|
|
|
| |||||||||||
Total | $ | 201,409 | $ | 9,108 | $ | 15,886 | $ | 13,748 | $ | 162,666 | ||||||||||
|
|
|
|
|
|
|
|
|
| |||||||||||
(1) Total liabilities for unrecognized tax benefits as of August 31, 2016 were $1.3 million and are excluded from the table above. Unrecognized tax benefits are classified on the Company's consolidated balance sheets within other noncurrent liabilities.
30
In fiscal 2013, the Company entered into a $39 million contract with the government of Iraq for the delivery and installation of irrigation equipment, of which $35.8 million has been fulfilled. The Company has suspended installation services indefinitely until the political environment improves in Iraq. The Company has a $2.0 million performance bond securing its obligations under the contract. No amounts have been accrued for potential losses in the consolidated financial statements as of August 31, 2016 as the Company continues to evaluate its exposure to claims for uncompleted services.
The Company does not have any additional off-balance sheet arrangements that have or are reasonably likely to have a material current or future effect on the Company's financial condition, changes in financial condition, revenues or expenses, results of operations, liquidity, capital expenditures or capital resources.
ITEM 7A - Quantitative and Qualitative Disclosures about Market Risk
The Company uses certain financial derivatives to mitigate its exposure to volatility in interest rates and foreign currency exchange rates. The Company uses these derivative instruments to hedge exposures in the ordinary course of business and does not invest in derivative instruments for speculative purposes. The credit risk under these interest rate and foreign currency agreements is not considered to be significant. The Company attempts to manage market and credit risks associated with its derivative instruments by establishing and monitoring limits as to the types and degree of risk that may be undertaken, and by entering into transactions with counterparties that have investment grade credit ratings. As of August 31, 2016, the Company's derivative counterparty had investment grade credit ratings.
The Company has manufacturing operations in the United States, Brazil, France, Italy, China, Turkey, and South Africa. The Company has sold products throughout the world and purchases certain of its components from third-party international suppliers. Export sales made from the United States are principally U.S. dollar denominated. At times, export sales may be denominated in a currency other than the U.S. dollar. A majority of the Company's revenue generated from operations outside the United States is denominated in local currency. Accordingly, these sales are not typically subject to significant foreign currency transaction risk. The Company's most significant transactional foreign currency exposures are the Euro, the Brazilian real, the South African rand and the Chinese renminbi in relation to the U.S. dollar. Fluctuations in the value of foreign currencies create exposures, which can adversely affect the Company's results of operations. Based on the consolidated statement of operations for the year ended August 31, 2016, the Company estimates the potential decrease in operating income from a 10 percent adverse change in the underlying exchange rates, in U.S. dollar terms, would be approximately $0.6 million.
In order to reduce exposures related to changes in foreign currency exchange rates, the Company, at times, may enter into forward exchange or option contracts for transactions denominated in a currency other than the functional currency for certain of its operations. This activity primarily relates to economically hedging against foreign currency risk in purchasing inventory, sales of finished goods, intercompany transactions and future settlement of foreign denominated assets and liabilities. The Company had $8.2 million of U.S. dollar equivalent cash flow forward exchange contracts and option contracts outstanding as of August 31, 2016.
In order to reduce translation exposure resulting from translating the financial statements of its international subsidiaries into U.S. dollars, the Company, at times, utilizes Euro foreign currency forward contracts to hedge a portion of its Euro net investment exposure in its foreign operations. At August 31, 2016, the Company had outstanding Euro foreign currency forward contracts to sell 32.6 million Euro at fixed prices expected to settle during the first quarter of fiscal 2017. At August 31, 2016, the Company also had an outstanding foreign currency forward contract to sell 43.0 million South African rand at fixed prices to settle during the first quarter of fiscal 2017. Based on the net investments contracts outstanding at August 31, 2016, the Company estimates the potential decrease in fair value from a 10 percent adverse change in the underlying exchange rates would be approximately $3.2 million. This decrease in fair value would be reflected as a reduction to other comprehensive income offsetting the translation exposure or adjustment of the international subsidiaries.
31
ITEM 8 - Financial Statements and Supplementary Data
Report of Independent Registered Public Accounting Firm
The Board of Directors and Shareholders
Lindsay Corporation:
We have audited the accompanying consolidated balance sheets of Lindsay Corporation and subsidiaries as of August 31, 2016 and 2015, and the related consolidated statements of operations, comprehensive income, shareholders' equity, and cash flows for each of the years in the three-year period ended August 31, 2016. In connection with our audits of the consolidated financial statements, we also have audited financial statement schedule Item 15(a)(2) of this Form 10-K. These consolidated financial statements and financial statement schedule are the responsibility of the Company's management. Our responsibility is to express an opinion on these consolidated financial statements and financial statement schedule based on our audits.
We conducted our audits in accordance with the standards of the Public Company Accounting Oversight Board (United States). Those standards require that we plan and perform the audit to obtain reasonable assurance about whether the financial statements are free of material misstatement. An audit includes examining, on a test basis, evidence supporting the amounts and disclosures in the financial statements. An audit also includes assessing the accounting principles used and significant estimates made by management, as well as evaluating the overall financial statement presentation. We believe that our audits provide a reasonable basis for our opinion.
In our opinion, the consolidated financial statements referred to above present fairly, in all material respects, the financial position of Lindsay Corporation and subsidiaries as of August 31, 2016 and 2015, and the results of their operations and their cash flows for each of the years in the three-year period ended August 31, 2016, in conformity with U.S. generally accepted accounting principles. Also in our opinion, the related financial statement schedule, when considered in relation to the basic consolidated financial statements taken as a whole, presents fairly, in all material respects, the information set forth therein.
We also have audited, in accordance with the standards of the Public Company Accounting Oversight Board (United States), Lindsay Corporation's internal control over financial reporting as of August 31, 2016, based on criteria established in Internal Control – Integrated Framework (2013) issued by the Committee of Sponsoring Organizations of the Treadway Commission (COSO), and our report dated October 18, 2016 expressed an unqualified opinion on the effectiveness of the Company's internal control over financial reporting.
/s/ KPMG LLP
Omaha, Nebraska
October 18, 2016
32
Lindsay Corporation and Subsidiaries
CONSOLIDATED STATEMENTS OF OPERATIONS
| Years ended August 31, | ||||||||||||
(in thousands, except per share amounts) | 2016 | 2015 | 2014 | |||||||||
Operating revenues | $ | 516,411 | $ | 560,181 | $ | 617,933 | ||||||
Cost of operating revenues | 367,798 | 403,860 | 446,938 | |||||||||
|
|
|
|
|
| |||||||
Gross profit | 148,613 | 156,321 | 170,995 | |||||||||
|
|
|
|
|
| |||||||
Operating expenses: | ||||||||||||
Selling expense | 41,973 | 40,516 | 38,284 | |||||||||
General and administrative expense | 56,419 | 52,261 | 43,228 | |||||||||
Engineering and research expense | 15,846 | 12,849 | 11,125 | |||||||||
|
|
|
|
|
| |||||||
Total operating expenses | 114,238 | 105,626 | 92,637 | |||||||||
|
|
|
|
|
| |||||||
Operating income | 34,375 | 50,695 | 78,358 | |||||||||
Interest expense | (4,751) | (2,626) | (187) | |||||||||
Interest income | 645 | 631 | 729 | |||||||||
Other expense, net | (981) | (1,949) | (245) | |||||||||
|
|
|
|
|
| |||||||
Earnings before income taxes | 29,288 | 46,751 | 78,655 | |||||||||
Income tax expense | 9,021 | 20,442 | 27,143 | |||||||||
|
|
|
|
|
| |||||||
Net earnings | $ | 20,267 | $ | 26,309 | $ | 51,512 | ||||||
|
|
|
|
|
| |||||||
Earnings per share: | ||||||||||||
Basic | $ | 1.86 | $ | 2.23 | $ | 4.01 | ||||||
Diluted | $ | 1.85 | $ | 2.22 | $ | 4.00 | ||||||
Shares used in computing earnings per share: | ||||||||||||
Basic | 10,906 | 11,818 | 12,832 | |||||||||
Diluted | 10,930 | 11,855 | 12,882 | |||||||||
Cash dividends declared per share | $ | 1.13 | $ | 1.09 | $ | 0.92 | ||||||
See accompanying notes to consolidated financial statements.
33
Lindsay Corporation and Subsidiaries
CONSOLIDATED STATEMENTS OF COMPREHENSIVE INCOME
| Years ended August 31, | ||||||||||||
($ in thousands) | 2016 | 2015 | 2014 | |||||||||
Net earnings | $ | 20,267 | $ | 26,309 | $ | 51,512 | ||||||
|
|
|
|
|
| |||||||
Other comprehensive income (loss): | ||||||||||||
Defined benefit pension plan adjustment, net of tax | (258) | (26) | (210) | |||||||||
Foreign currency translation adjustment, net of hedging activities and tax | 1,394 | (13,081) | 325 | |||||||||
|
|
|
|
|
| |||||||
Total other comprehensive income (loss), net of tax expense (benefit) of $79, $1,450, and ($27) | 1,136 | (13,107) | 115 | |||||||||
|
|
|
|
|
| |||||||
Total comprehensive income | $ | 21,403 | $ | 13,202 | $ | 51,627 | ||||||
|
|
|
|
|
| |||||||
See accompanying notes to consolidated financial statements.
34
Lindsay Corporation and Subsidiaries
CONSOLIDATED BALANCE SHEETS
| August 31, 2016 | August 31, 2015 | |||||||
($ and shares in thousands, except par values) | ||||||||
ASSETS | ||||||||
Current assets: | ||||||||
Cash and cash equivalents | $ | 101,246 | $ | 139,093 | ||||
Restricted cash | 2,030 | 2,026 | ||||||
Receivables, net of allowance of $8,312 and $9,706, respectively | 80,610 | 74,063 | ||||||
Inventories, net | 74,750 | 74,930 | ||||||
Deferred income taxes | 15,349 | 15,807 | ||||||
Prepaid expenses | 3,671 | 5,197 | ||||||
Other current assets | 14,468 | 11,051 | ||||||
|
|
|
| |||||
Total current assets | 292,124 | 322,167 | ||||||
Property, plant, and equipment, net | 77,627 | 78,656 | ||||||
Intangible assets, net | 47,200 | 51,920 | ||||||
Goodwill | 76,803 | 76,801 | ||||||
Other noncurrent assets | 5,811 | 6,924 | ||||||
|
|
|
| |||||
Total assets | $ | 499,565 | $ | 536,468 | ||||
|
|
|
| |||||
LIABILITIES AND SHAREHOLDERS' EQUITY | ||||||||
Current liabilities: | ||||||||
Accounts payable | $ | 32,268 | $ | 38,814 | ||||
Current portion of long-term debt | 197 | 193 | ||||||
Other current liabilities | 55,405 | 56,105 | ||||||
|
|
|
| |||||
Total current liabilities | 87,870 | 95,112 | ||||||
Pension benefits liabilities | 6,869 | 6,569 | ||||||
Long-term debt | 116,976 | 117,173 | ||||||
Deferred income taxes | 13,263 | 18,971 | ||||||
Other noncurrent liabilities | 23,020 | 10,083 | ||||||
|
|
|
| |||||
Total liabilities | 247,998 | 247,908 | ||||||
|
|
|
| |||||
Shareholders' equity: | ||||||||
Preferred stock of $1 par value - authorized 2,000 shares; no shares issued and outstanding | - | - | ||||||
Common stock at $1 par value - authorized 25,000 shares; 18,713 and 18,684 shares issued at August 31, 2016 and 2015, respectively | 18,713 | 18,684 | ||||||
Capital in excess of stated value | 57,338 | 55,184 | ||||||
Retained earnings | 466,926 | 458,903 | ||||||
Less treasury stock - at cost, 8,083 and 7,394 shares at August 31, 2016 and 2015, respectively | (277,238) | (228,903) | ||||||
Accumulated other comprehensive loss, net | (14,172) | (15,308) | ||||||
|
|
|
| |||||
Total shareholders' equity | 251,567 | 288,560 | ||||||
|
|
|
| |||||
Total liabilities and shareholders' equity | $ | 499,565 | $ | 536,468 | ||||
|
|
|
| |||||
See accompanying notes to consolidated financial statements.
35
Lindsay Corporation and Subsidiaries
CONSOLIDATED STATEMENTS OF SHAREHOLDERS' EQUITY
(in thousands, except per share amounts)
| Shares of common stock | Shares of treasury stock | Common stock | Capital in excess of stated value | Retained earnings | Treasury stock | Accumulated other comprehensive (loss) income, net | Total shareholders' equity | ||||||||||||||||||||||||
Balance at August 31, 2013 | 18,571 | 5,698 | $ | 18,571 | $ | 49,764 | $ | 405,580 | $ | (90,961) | $ | (2,316) | $ | 380,638 | ||||||||||||||||||
|
|
|
|
|
|
|
|
|
|
|
|
|
|
|
| |||||||||||||||||
Comprehensive income: | ||||||||||||||||||||||||||||||||
Net earnings | 51,512 | 51,512 | ||||||||||||||||||||||||||||||
Other comprehensive income | 115 | 115 | ||||||||||||||||||||||||||||||
Total comprehensive income | 51,627 | |||||||||||||||||||||||||||||||
Cash dividends ($0.92) per share | (11,726) | (11,726) | ||||||||||||||||||||||||||||||
Repurchase of common stock | 498 | (41,059) | (41,059) | |||||||||||||||||||||||||||||
Issuance of common shares under share compensation plans | 65 | 65 | (1,639) | (1,574) | ||||||||||||||||||||||||||||
Excess tax benefits from share-based compensation | 722 | 722 | ||||||||||||||||||||||||||||||
Share-based compensation expense | 4,019 | 4,019 | ||||||||||||||||||||||||||||||
|
|
|
|
|
|
|
|
|
|
|
|
|
|
|
| |||||||||||||||||
Balance at August 31, 2014 | 18,636 | 6,196 | $ | 18,636 | $ | 52,866 | $ | 445,366 | $ | (132,020) | $ | (2,201) | $ | 382,647 | ||||||||||||||||||
|
|
|
|
|
|
|
|
|
|
|
|
|
|
|
| |||||||||||||||||
Comprehensive income: | ||||||||||||||||||||||||||||||||
Net earnings | 26,309 | 26,309 | ||||||||||||||||||||||||||||||
Other comprehensive loss | (13,107) | (13,107) | ||||||||||||||||||||||||||||||
Total comprehensive income | 13,202 | |||||||||||||||||||||||||||||||
Cash dividends ($1.09) per share | (12,772) | (12,772) | ||||||||||||||||||||||||||||||
Repurchase of common stock | 1,198 | (96,883) | (96,883) | |||||||||||||||||||||||||||||
Issuance of common shares under share compensation plans | 48 | 48 | (1,360) | (1,312) | ||||||||||||||||||||||||||||
Excess tax benefits from share-based compensation | 576 | 576 | ||||||||||||||||||||||||||||||
Share-based compensation expense | 3,102 | 3,102 | ||||||||||||||||||||||||||||||
|
|
|
|
|
|
|
|
|
|
|
|
|
|
|
| |||||||||||||||||
Balance at August 31, 2015 | 18,684 | 7,394 | $ | 18,684 | $ | 55,184 | $ | 458,903 | $ | (228,903) | $ | (15,308) | $ | 288,560 | ||||||||||||||||||
|
|
|
|
|
|
|
|
|
|
|
|
|
|
|
| |||||||||||||||||
Comprehensive income: | ||||||||||||||||||||||||||||||||
Net earnings | 20,267 | 20,267 | ||||||||||||||||||||||||||||||
Other comprehensive income | 1,136 | 1,136 | ||||||||||||||||||||||||||||||
Total comprehensive income | 21,403 | |||||||||||||||||||||||||||||||
Cash dividends ($1.13) per share | (12,244) | (12,244) | ||||||||||||||||||||||||||||||
Repurchase of common stock | 689 | (48,335) | (48,335) | |||||||||||||||||||||||||||||
Issuance of common shares under share compensation plans | 29 | 29 | (628) | (599) | ||||||||||||||||||||||||||||
Excess tax benefits from share-based compensation | (84) | (84) | ||||||||||||||||||||||||||||||
Share-based compensation expense | 2,866 | 2,866 | ||||||||||||||||||||||||||||||
|
|
|
|
|
|
|
|
|
|
|
|
|
|
|
| |||||||||||||||||
Balance at August 31, 2016 | 18,713 | 8,083 | $ | 18,713 | $ | 57,338 | $ | 466,926 | $ | (277,238) | $ | (14,172) | $ | 251,567 | ||||||||||||||||||
|
|
|
|
|
|
|
|
|
|
|
|
|
|
|
| |||||||||||||||||
See accompanying notes to consolidated financial statements.
36
Lindsay Corporation and Subsidiaries
CONSOLIDATED STATEMENTS OF CASH FLOWS
| Years ended August 31, | ||||||||||||
($ in thousands) | 2016 | 2015 | 2014 | |||||||||
CASH FLOWS FROM OPERATING ACTIVITIES: | ||||||||||||
Net earnings | $ | 20,267 | $ | 26,309 | $ | 51,512 | ||||||
Adjustments to reconcile net earnings to net cash provided by operating activities: | ||||||||||||
Depreciation and amortization | 16,881 | 16,412 | 14,793 | |||||||||
Asset write-down | - | 270 | - | |||||||||
Provision for uncollectible accounts receivable | (843) | 5,840 | 2,225 | |||||||||
Deferred income taxes | (5,755) | 278 | (8,195) | |||||||||
Share-based compensation expense | 3,060 | 3,332 | 4,207 | |||||||||
Other, net | 89 | 4,665 | (465) | |||||||||
Changes in assets and liabilities: | ||||||||||||
Receivables | (4,730) | 10,902 | 24,751 | |||||||||
Inventories | 1,330 | 915 | (2,724) | |||||||||
Other current assets | (1,047) | (3,984) | (3,092) | |||||||||
Accounts payable | (7,101) | (337) | (623) | |||||||||
Other current liabilities | (283) | (9,467) | 8,954 | |||||||||
Current taxes payable | (813) | (8,011) | 5,706 | |||||||||
Other noncurrent assets and liabilities | 12,017 | 1,558 | (5,251) | |||||||||
|
|
|
|
|
| |||||||
Net cash provided by operating activities | 33,072 | 48,682 | 91,798 | |||||||||
|
|
|
|
|
| |||||||
CASH FLOWS FROM INVESTING ACTIVITIES: | ||||||||||||
Purchases of property, plant, and equipment | (11,496) | (15,244) | (17,715) | |||||||||
Acquisition of business, net of cash acquired | - | (69,521) | - | |||||||||
Proceeds from settlement of net investment hedges | 3,381 | 7,473 | 1,245 | |||||||||
Payments for settlement of net investment hedges | (2,924) | (1,202) | (2,040) | |||||||||
Other investing activities, net | 1,141 | (1,091) | 34 | |||||||||
|
|
|
|
|
| |||||||
Net cash used in investing activities | (9,898) | (79,585) | (18,476) | |||||||||
|
|
|
|
|
| |||||||
CASH FLOWS FROM FINANCING ACTIVITIES: | ||||||||||||
Proceeds from exercise of stock options | 113 | 394 | 455 | |||||||||
Common stock withheld for payroll tax withholdings | (712) | (1,706) | (2,027) | |||||||||
Proceeds from issuance of long-term debt | - | 115,000 | - | |||||||||
Principal payments on long-term debt | (193) | (112) | - | |||||||||
Issuance costs related to debt | - | (620) | - | |||||||||
Excess tax benefits from share-based compensation | 53 | 611 | 762 | |||||||||
Repurchase of common shares | (48,335) | (96,883) | (41,059) | |||||||||
Dividends paid | (12,244) | (12,772) | (11,726) | |||||||||
|
|
|
|
|
| |||||||
Net cash (used in) provided by financing activities | (61,318) | 3,912 | (53,595) | |||||||||
|
|
|
|
|
| |||||||
Effect of exchange rate changes on cash and cash equivalents | 297 | (5,758) | 188 | |||||||||
|
|
|
|
|
| |||||||
Net change in cash and cash equivalents | (37,847) | (32,749) | 19,915 | |||||||||
Cash and cash equivalents, beginning of period | 139,093 | 171,842 | 151,927 | |||||||||
|
|
|
|
|
| |||||||
Cash and cash equivalents, end of period | $ | 101,246 | $ | 139,093 | $ | 171,842 | ||||||
|
|
|
|
|
| |||||||
SUPPLEMENTAL CASH FLOW INFORMATION | ||||||||||||
Income taxes paid | $ | 18,395 | $ | 26,917 | $ | 26,261 | ||||||
Interest paid | $ | 4,674 | $ | 2,448 | $ | 234 | ||||||
See accompanying notes to consolidated financial statements.
37
Lindsay Corporation and Subsidiaries
NOTES TO CONSOLIDATED FINANCIAL STATEMENTS
Note 1 – Description of Business and Significant Accounting Policies
Lindsay Corporation, along with its subsidiaries (collectively called "Lindsay" or the "Company"), is a global leader in providing a variety of proprietary water management and road infrastructure products and services. The Company has been involved in the manufacture and distribution of agricultural irrigation equipment since 1955 and has grown from a regional company to an international water efficiency solutions and highway infrastructure firm with worldwide sales and distribution. Lindsay, a Delaware corporation, maintains its corporate offices in Omaha, Nebraska. The Company has operations which are categorized into two major reporting segments.
Irrigation Segment – The Company's irrigation segment includes the manufacture and marketing of center pivot, lateral move, and hose reel irrigation systems which are used principally in the agricultural industry to increase or stabilize crop production while conserving water, energy and labor. The irrigation segment also manufactures and markets repair and replacement parts for its irrigation systems and controls. In addition, the irrigation segment also designs and manufactures water pumping stations and controls for the agriculture, golf, landscape and municipal markets and filtration solutions for groundwater, agriculture, industrial and heat transfer markets. The Company continues to strengthen irrigation product offerings through innovative technology such as Global Positioning System ("GPS") positioning and guidance, variable rate irrigation, wireless irrigation management, machine-to-machine ("M2M") communication technology solutions and smartphone applications. The Company's domestic irrigation manufacturing facilities are located in Lindsay, Nebraska; Hartland, Wisconsin; Olathe, Kansas and Fresno, California. Internationally, the Company has production operations in Brazil, France, China, Turkey and South Africa as well as distribution and sales operations in the Netherlands, Australia and New Zealand. The Company also exports equipment from the U.S. to other international markets.
Infrastructure Segment – The Company's infrastructure segment includes the manufacture and marketing of moveable barriers, specialty barriers, crash cushions and end terminals, road marking and road safety equipment, large diameter steel tubing, and railroad signals and structures. The infrastructure segment also provides outsourced manufacturing and production services. The principal infrastructure manufacturing facilities are located in Rio Vista, California; Milan, Italy; and Omaha, Nebraska.
Notes to the consolidated financial statements describe various elements of the financial statements and the accounting policies, estimates, and assumptions applied by management. While actual results could differ from those estimated at the time of preparation of the consolidated financial statements, management believes that the accounting policies, assumptions, and estimates applied promote the representational faithfulness, verifiability, neutrality, and transparency of the accounting information included in the consolidated financial statements. The significant accounting policies of the Company are as follows:
Principles of Consolidation
The consolidated financial statements include the accounts of the Company and its subsidiaries. All intercompany balances and transactions are eliminated in consolidation.
Reclassifications
Certain reclassifications have been made to prior financial statements to conform to the current-year presentation.
Use of Estimates
The preparation of financial statements in conformity with U.S. generally accepted accounting principles ("GAAP") requires management to make estimates and assumptions that affect the reported amounts of assets and liabilities and disclosure of contingent assets and liabilities at the date of the financial statements and the reported amounts of revenues and expenses during the reporting period. Actual results could differ from those estimates.
38
Revenue Recognition
The Company's basic criteria necessary for revenue recognition are: 1) evidence of a sales arrangement exists, 2) delivery of goods has occurred, 3) the sales price to the buyer is fixed or determinable, and 4) collectability is reasonably assured. The Company recognizes revenue when these criteria have been met and when title and risk of loss transfers to the customer. The Company generally has no post-delivery obligations to its independent dealers other than standard warranties. Revenues and gross profits on intercompany sales are eliminated in consolidation. Revenues from the sale of the Company's products are recognized based on the delivery terms in the sales contract. If an arrangement involves multiple deliverables, revenues from the arrangement are allocated to the separate units of accounting based on their relative selling price.
The Company offers a subscription-based service for wireless management and recognizes subscription revenue on a straight-line basis over the contract term. The Company leases certain infrastructure property held for lease to customers such as moveable concrete barriers and Road Zipper Systems ™ . Revenues for the lease of infrastructure property held for lease are recognized on a straight-line basis over the lease term.
The costs related to revenues are recognized in the same period in which the specific revenues are recorded. Shipping and handling fees billed to customers are reported in revenue. Shipping and handling costs incurred by the Company are included in cost of sales. Customer rebates, cash discounts and other sales incentives are recorded as a reduction of revenues at the time of the original sale. Estimates used in the recognition of operating revenues and cost of operating revenues include, but are not limited to, estimates for product warranties, product rebates, cash discounts and fair value of separate units of accounting on multiple deliverables.
Share-Based Compensation
The Company recognizes compensation expense for all share-based payment awards made to employees and directors based on estimated fair values on the date of grant. The Company uses the straight-line amortization method over the vesting period of the awards. The Company has historically issued shares upon exercise of stock options or vesting of restricted stock units or performance stock units from new stock issuances.
The value of the portion of the award that is ultimately expected to vest is recognized as expense in the Company's Consolidated Statement of Operations over the periods during which the employee or director is required to perform a service in exchange for the award.
The Company uses the Black-Scholes option-pricing model ("Black-Scholes model") as its valuation method for stock option awards. Under the Black-Scholes model, the fair value of stock option awards on the date of grant is estimated using an option-pricing model that is affected by the Company's stock price as well as assumptions regarding a number of highly complex and subjective variables. These variables include, but are not limited to, the Company's expected stock price volatility over the term of the awards and actual and projected employee stock option exercise behaviors. Restricted stock, restricted stock units, performance shares and performance stock units issued under the 2015 Long-Term Incentive Plan will have a grant-date fair value equal to the fair market value of the underlying stock on the grant date less present value of expected dividends.
Warranty Costs
The Company's provision for product warranty reflects management's best estimate of probable liability under its product warranties. At the time a sale is recognized, the company records the estimated future warranty costs. The Company generally determines its total future warranty liability by applying historical claims rate experience to the amount of equipment that has been sold and is still within the warranty period. In addition, the Company records provisions for known warranty claims. This provision is periodically adjusted to reflect actual experience.
Cash and Cash Equivalents
Cash equivalents consist of highly liquid investments with original maturities of three months or less.
39
Receivables and Allowances
Trade receivables are reported on the balance sheet net of any doubtful accounts. Losses are recognized when it is probable that an asset has been impaired and the amount of the loss can be reasonably estimated. In estimating probable losses, the Company reviews specific accounts that are significant and past due, in bankruptcy or otherwise identified as at risk for potential credit loss. Collectability of these specific accounts are assessed based on facts and circumstances of that customer, and an allowance for credit losses is established based on the probability of default. In assessing the likelihood of collection of receivable, the Company considers (for example) the Company's history of collections, the current status of discussions and repayment plans, collateral received, and other evidence and information regarding collection or default risk that is available in the market place. The allowance for credit losses attributable to the remaining accounts is established using probabilities of default and an estimate of associated losses based upon the aging of receivable balances, collection experience, economic condition and credit risk quality.
As the Company's international business has grown, the exposure to potential losses in international markets has also increased. These exposures can be difficult to estimate, particularly in areas of political instability or with governments with which the Company has limited experience or where there is a lack of transparency as to the current credit condition of governmental units. The Company's allowance for all doubtful accounts related to outstanding receivables decreased to $8.3 million at August 31, 2016 from $9.7 million at August 31, 2015. The Company's evaluation of the adequacy of the allowance for credit losses is based on facts and circumstances available to the Company at the date the consolidated financial statements are issued and considers any significant changes in circumstances occurring through the date that the financial statements are issued.
Inventories
Inventories are stated at the lower of cost or market. Cost is determined by the last-in, first-out ("LIFO") method, the first-in, first-out ("FIFO") method, or the weighted average cost method for inventory depending on the operations at each specific location. At all locations, the Company reserves for obsolete, slow moving, and excess inventory by estimating the net realizable value based on the potential future use of such inventory.
Property, Plant, and Equipment
Property, plant, equipment, and capitalized assets held for lease are stated at cost. The Company capitalizes major expenditures and charges to operating expenses the cost of current maintenance and repairs. Provisions for depreciation and amortization have been computed principally on the straight-line method for property, plant, and equipment. Rates used for depreciation are based principally on the following expected lives: buildings -- 15 to 30 years; equipment -- 3 to 7 years; leased barrier transfer machines -- 8 to 10 years; leased barriers -- 12 years; other -- 2 to 20 years and leasehold improvements – shorter of the economic life or term of the lease. All of the Company's long-lived asset groups are reviewed for impairment whenever events or changes in circumstances indicate that the carrying amount may not be recoverable. If the sum of the expected future cash flows is less than the carrying amount of the asset group, an impairment loss is recognized based upon the difference between the fair value of the asset and its carrying value. No impairments were recorded during the fiscal years ended August 31, 2016, 2015, and 2014. The cost and accumulated depreciation relating to assets retired or otherwise disposed of are eliminated from the respective accounts at the time of disposition. The resulting gain or loss is included in operating income in the consolidated statements of operations.
Valuation of Goodwill and Identifiable Intangible Assets
Goodwill represents the excess of the purchase price over the fair value of net assets acquired in a business combination. Acquired intangible assets are recognized separately from goodwill. Goodwill and intangible assets with indefinite useful lives are tested for impairment at least annually at August 31 and whenever triggering events or changes in circumstances indicate its carrying value may not be recoverable. Assessment of the potential impairment of goodwill and identifiable intangible assets is an integral part of the Company's normal ongoing review of operations. Testing for potential impairment of these assets is significantly dependent on numerous assumptions and reflects management's best estimates at a particular point in time. The dynamic economic environments in which the Company's businesses operate and key economic and business assumptions related to projected selling prices, market growth, inflation rates and operating expense ratios, can significantly
40
affect the outcome of impairment tests. Estimates based on these assumptions may differ significantly from actual results. Changes in factors and assumptions used in assessing potential impairments can have a significant impact on the existence and magnitude of impairments, as well as the time in which such impairments are recognized.
In testing goodwill for impairment, the Company has the option to first assess qualitative factors to determine whether the existence of events or circumstances leads to a determination that it is more likely than not (more than 50 percent) that the estimated fair value of a reporting unit is less than its carrying amount. A significant amount of judgment is involved in determining if an indicator of impairment has occurred. Such indicators include deterioration in general economic conditions, adverse changes in the markets in which an entity operates, increases in input costs that have negative effects on earnings and cash flows, or a trend of negative or declining cash flows over multiple periods, among others. If the Company elects to perform a qualitative assessment and determines that an impairment is more likely than not, the Company is then required to perform a quantitative impairment test, otherwise no further analysis is required. The Company also may elect not to perform the qualitative assessment and, instead, proceed directly to the quantitative impairment test. In fiscal 2016, in conjunction with the Company's annual review for impairment, the Company performed a qualitative analysis of goodwill for each of the Company's reporting units, which are the same as its operating segments, and did not identify any potential impairment.
In assessing other intangible assets not subject to amortization for impairment, the Company has the option to perform a qualitative assessment to determine whether the existence of events or circumstances leads to a determination that it is more likely than not that the fair value of such an intangible asset is less than its carrying amount. If the Company determines that it is not more likely than not that the fair value of such an intangible asset is less than its carrying amount, then the Company is not required to perform any additional tests for assessing intangible assets for impairment. However, if the Company concludes otherwise or elects not to perform the qualitative assessment, the Company is then required to perform a quantitative impairment test that involves a comparison of the estimated fair value of the intangible asset with its carrying value. If the carrying value of the intangible asset exceeds its fair value, an impairment loss is recognized in an amount equal to that excess. In fiscal 2016, the Company performed a qualitative analysis of other intangible assets not subject to amortization and concluded there were no indicators of impairment.
Income Taxes
Income taxes are accounted for utilizing the asset and liability method. Deferred tax assets and liabilities are recognized for the estimated future tax consequences attributable to differences between the financial statement carrying value of existing assets and liabilities and their respective tax bases. These expected future tax consequences are measured based on currently enacted tax rates. The effect of tax rate changes on deferred tax assets and liabilities is recognized in income during the period that includes the enactment date. In assessing the ability to realize deferred tax assets, management considers whether it is more likely than not that some portion or all of the deferred tax asset will not be realized. The Company's evaluation of the adequacy of any potential allowance is based on facts and circumstances available to the Company at the date the consolidated financial statements are issued and considers any significant changes in circumstances occurring through the date that the financial statements are issued.
Net Earnings per Share
Basic net earnings per share is computed using the weighted average number of common shares outstanding during the period. Diluted net earnings per share is computed using the weighted average number of common shares outstanding plus dilutive potential common shares outstanding during the period.
Employee stock options, non-vested shares and similar equity instruments granted by the Company are treated as potential common share equivalents outstanding in computing diluted net earnings per share. The Company's diluted common shares outstanding reported in each period includes the dilutive effect of restricted stock units, in-the-money options, and performance stock units for which threshold performance conditions have been satisfied and is calculated based on the average share price for each fiscal period using the treasury stock method. Under the treasury stock method, the amount the employee must pay for exercising stock options, the
41
amount of compensation cost for future service that the Company has not yet recognized, and the amount of excess tax benefits that would be recorded in additional paid-in-capital when exercised are assumed to be used to repurchase shares.
Derivative Instruments and Hedging Activities
The Company uses certain financial derivatives to mitigate its exposure to volatility in interest rates and foreign currency exchange rates. All derivative instruments are recorded on the balance sheet at their respective fair values. The Company uses these derivative instruments only to hedge exposures in the ordinary course of business and does not invest in derivative instruments for speculative purposes. On the date a derivative contract is entered into, the Company may elect to designate the derivative as a fair value hedge, a cash flow hedge, or the hedge of a net investment in a foreign operation.
The Company also formally assesses, both at the hedge's inception and on an ongoing basis, whether the derivative that is used in the hedging transaction is effective. For those instruments that are designated as a cash flow hedge and meet certain documentary and analytical requirements to qualify for hedge accounting treatment, changes in the fair value for the effective portion are reported in other comprehensive income ("OCI"), net of related income tax effects, and are reclassified to the income statement when the effects of the item being hedged are recognized in the income statement. Changes in fair value of derivative instruments that qualify as hedges of a net investment in foreign operations are recorded as a component of accumulated currency translation adjustment in accumulated other comprehensive income ("AOCI"), net of related income tax effects. Changes in the fair value of undesignated hedges are recognized currently in earnings. All changes in derivative fair values due to ineffectiveness are recognized currently in income.
The Company discontinues hedge accounting prospectively when it is determined that the derivative is no longer effective in offsetting changes in the cash flows of the hedged item, the derivative expires or is sold, terminated, or exercised, or management determines that designation of the derivative as a hedging instrument is no longer appropriate. In situations in which the Company does not elect hedge accounting or hedge accounting is discontinued and the derivative is retained, the Company carries or continues to carry the derivative at its fair value on the balance sheet and recognizes any subsequent changes in its fair value through earnings. The Company manages market and credit risks associated with its derivative instruments by establishing and monitoring limits as to the types and degree of risk that may be undertaken, and by entering into transactions with high-quality counterparties. As of August 31, 2016, the Company's derivative counterparty had investment grade credit ratings.
Fair Value Measurements
The Company's disclosure of the fair value of assets and liabilities is based on a three-level hierarchy for fair value measurements based upon the transparency of inputs to the valuation of an asset or liability as of the measurement date. Inputs refers broadly to the assumptions that market participants would use in pricing the asset or liability, including assumptions about risk. The categorization within the valuation hierarchy is based upon the lowest level of input that is significant to the fair value measurement. Financial assets and liabilities carried at fair value will be classified and disclosed in one of the following three categories:
| • | Level 1 – inputs to valuation techniques are quoted prices in active markets for identical assets or liabilities |
| • | Level 2 – inputs to the valuation techniques are other than quoted prices but are observable for the assets or liabilities, either directly or indirectly |
| • | Level 3 – inputs to the valuation techniques are unobservable for the assets or liabilities |
Treasury Stock
When the Company repurchases its outstanding stock, it records the repurchased shares at cost as a reduction to shareholders' equity. The weighted average cost method is utilized for share re-issuances. The difference between the cost and the re-issuance price is charged or credited to a "capital in excess of stated value – treasury stock" account to the extent that there is a sufficient balance to absorb the charge. If the treasury stock is sold for
42
an amount less than its cost and there is not a sufficient balance in the capital in excess of stated value – treasury stock account, the excess is charged to retained earnings.
Contingencies
The Company's accounting for contingencies covers a variety of business activities including contingencies for legal exposures and environmental exposures. The Company accrues these contingencies when its assessments indicate that it is probable that a liability has been incurred and an amount can be reasonably estimated. The Company's estimates are based on currently available facts and its estimates of the ultimate outcome or resolution. Actual results may differ from the Company's estimates resulting in an impact, positive or negative, on earnings.
Environmental Remediation Liabilities
Environmental remediation liabilities include costs directly associated with site investigation and clean up, such as materials, external contractor costs and incremental internal costs directly related to the remedy. The Company accrues the anticipated cost of environmental remediation when the obligation is probable and can be reasonably estimated. Estimates used to record environmental remediation liabilities are based on the Company's best estimate of probable future costs based on site-specific facts and circumstances. Estimates of the cost for the likely remedy are developed using internal resources or by third-party environmental engineers or other service providers. The Company records the undiscounted environmental remediation liabilities that represent the points in the range of estimates that are most probable or the minimum amount when no amount within the range is a better estimate than any other amount.
Translation of Foreign Currency
The Company's portion of the assets and liabilities related to foreign investments are translated into U.S. dollars at the exchange rates in effect at the balance sheet date. Revenue and expenses are translated at the average rates of exchange prevailing during the year. Unrealized gains or losses are reflected within common shareholders' equity as accumulated other comprehensive income or loss.
Note 2 – New Accounting Pronouncements
In May 2014, the Financial Accounting Standards Board (the "FASB") issued Accounting Standards Update ("ASU") No. 2014-09, Revenue from Contracts with Customers . In August 2015, the FASB issued ASU No. 2015-14, Revenue from Contracts with Customers: Deferral of the Effective Date . The standard provides a single model for revenue arising from contracts with customers and supersedes current revenue recognition guidance. The ASU requires an entity to recognize the amount of revenue to which it expects to be entitled for the transfer of goods or services. The ASU will replace existing revenue recognition guidance in U.S. GAAP and becomes effective in the first quarter of fiscal 2019. Early adoption is permitted only in fiscal 2018. The guidance permits companies to either apply the requirements retrospectively to all prior periods presented, or apply the requirements in the year of adoption, through a cumulative adjustment. The Company is currently evaluating the impact the adoption will have on its consolidated financial statements and related disclosures. The Company has not yet selected a transition method, nor has it determined the effect of the standard on its ongoing financial reporting.
In November 2015, the FASB issued ASU No. 2015-17, Income Taxes: Balance Sheet Classification of Deferred Taxes . The standard requires an entity to classify all deferred tax assets and liabilities as noncurrent. In addition, companies will no longer allocate valuation allowances between current and noncurrent because all deferred tax assets will be classified as noncurrent. The guidance allows companies to apply the update either on a retrospective or prospective basis. The Company does not expect this standard to have a material impact on its consolidated financial statements. The Company plans to adopt this standard in first quarter of fiscal 2017.
In February 2016, the FASB issued ASU No. 2016-02, Leases (Topic 842) . The standard replaces the current codification topic 840 with updated guidance on accounting for leases and requires a lessee to recognize assets and liabilities arising from an operating lease on the balance sheet. Previous U.S. GAAP did not require lease assets and liabilities to be recognized for most leases. Furthermore, companies are permitted to make an
43
accounting policy election to not recognize lease assets and liabilities for leases with a term of 12 months or less. For both finance leases and operating leases, the lease liability should be initially measured at the present value of the lease payments. The recognition, measurement and presentation of expenses and cash flows arising from a lease by a lessee will not significantly change under this new guidance. The effective date of ASU No. 2016-02 will be the first quarter of fiscal 2020 with early adoption permitted. The Company is currently evaluating the effect that adopting this standard will have on its consolidated financial statements.
In March 2016, the FASB issued ASU No. 2016-09, Improvements to Employee Share-Based Payment Accounting . The standard provides guidance for employee share-based compensation payments, including the income tax consequences, classification of awards as either equity or liabilities and the classification on the statement of cash flows. The ASU requires all excess tax benefits and tax deficiencies to be recognized as income tax benefits or expense in the income statement and to be classified along with other income tax cash flows as an operating activity on the statement of cash flows. The effective date of ASU No. 2016-09 will be the first quarter of fiscal 2018 with early adoption permitted, and the standard will be adopted on a prospective basis. The Company is currently evaluating the effect that adopting this new standard will have on its consolidated financial statements.
Note 3 - Acquisitions
In connection with business acquisitions, the Company records the estimated fair value of the identifiable assets acquired, liabilities assumed, goodwill, and any non-controlling interest in the acquired, all determined as of the date of acquisition. The Company incurred $1.8 million of acquisition and integration expenses in fiscal 2015, which were included in general and administrative expenses on the consolidated statement of operations.
Elecsys Corporation
On January 22, 2015, the Company completed a merger in which Elecsys Corporation, a provider of machine-to-machine ("M2M") technology solutions and custom electronic systems (formerly NASDAQ: ESYS) ("Elecsys"), was merged with a wholly-owned subsidiary of the Company. The Company paid $17.50 per share of Elecsys common stock outstanding (including cashing out of Elecsys equity compensation awards) for total merger cash consideration of $67.2 million, net of cash acquired of $3.4 million.
The Elecsys business capabilities will facilitate the Company's development of efficient solutions for irrigation and other water uses as well as adjacent product lines and technologies. As part of the integration of Elecsys with the Company's irrigation business, the Company closed the Digitec manufacturing facility in Milford, Nebraska and consolidated the electronics manufacturing operations with Elecsys.
44
The following table summarizes the merger consideration paid for Elecsys and the final allocation of fair value of the assets acquired and liabilities assumed at the acquisition date.
($ in thousands) | Amount | |||
Cash and cash equivalents | $ | 3,401 | ||
Receivables | 2,006 | |||
Inventories | 8,467 | |||
Other current assets | 1,527 | |||
Property and equipment | 6,457 | |||
Intangible assets | 24,490 | |||
Goodwill | 39,986 | |||
Other long-term assets | 41 | |||
Accounts payable and accrued liabilities | (2,862) | |||
Current and long-term debt | (2,478) | |||
Other long-term liabilities | (10,458) | |||
|
| |||
Total cash consideration | 70,577 | |||
Less cash acquired | (3,401) | |||
|
| |||
Total cash consideration, net of cash acquired | 67,176 | |||
Add current and long-term debt assumed | 2,478 | |||
|
| |||
Total purchase price | $ | 69,654 | ||
|
| |||
The acquired intangible assets include amortizable intangible assets of $17.1 million and indefinite-lived intangible assets of $7.4 million related to tradenames. The amortizable intangible assets have a weighted average useful life of approximately 11.5 years. The following table summarizes the identifiable intangible assets at fair value.
($ in thousands) | Weighted average useful life in years | Fair value of identifiable asset | ||||||
Intangible assets: | ||||||||
Customer relationships | 10.9 | $ | 11,820 | |||||
Tradenames | N/A | 7,430 | ||||||
Developed technology (proprietary) | 14.7 | 4,420 | ||||||
Non-compete agreements | 4.5 | 430 | ||||||
Backlog | 0.4 | 390 | ||||||
|
|
|
| |||||
Total intangible assets | 11.5 | $ | 24,490 | |||||
|
|
|
| |||||
Goodwill related to the acquisition of Elecsys primarily relates to intangible assets that do not qualify for separate recognition, including the experience and knowledge of Elecsys management, its assembled workforce, and its intellectual capital and specialization with M2M communication technology solutions, data acquisition and management systems, and custom electronic equipment. Goodwill recorded in connection with this acquisition is included in the irrigation reporting segment and is non-deductible for income tax purposes. Pro forma information related to this acquisition was not included because the impact on the Company's consolidated financial statements was not considered to be material.
SPF Water Engineering, LLC
On July 20, 2015, the Company completed the acquisition of SPF Water Engineering, LLC ("SPF") based in Boise, Idaho. SPF is a full-service water resource consulting firm offering water supply studies, well design and construction, water and wastewater system design, water rights consulting and more. The Company paid $2.5 million, which was financed with cash on hand, for total purchase consideration of $2.4 million net of cash
45
acquired of $0.1 million. The allocation of the purchase price for SPF was finalized in the first quarter of fiscal 2016 with no changes from the preliminary amounts reported in the Company's Annual Report on Form 10-K as of August 31, 2015.
The total purchase price for SPF has been allocated to the tangible and intangible assets acquired and liabilities assumed based on fair value assessments. The Company's allocation of purchase price for this acquisition consisted of current assets of $0.7 million, fixed assets of $0.1 million, finite-lived intangible assets of $1.0 million, goodwill of $0.9 million and current liabilities of $0.2 million. Goodwill resulting from this acquisition is largely attributable to the existing workforce and historical and projected profitability of the acquired business. The goodwill associated with SPF is included in the goodwill of the Company's irrigation segment. Pro forma information related to this acquisition was not included because the impact on the Company's consolidated financial statements was not considered to be material.
Note 4 – Net Earnings Per Share
The following table shows the computation of basic and diluted net earnings per share for fiscal 2016, 2015, and 2014:
| For the years ended August 31, | ||||||||||||
($ and shares in thousands, except per share amounts) | 2016 | 2015 | 2014 | |||||||||
Numerator: | ||||||||||||
Net earnings | $ | 20,267 | $ | 26,309 | $ | 51,512 | ||||||
Denominator: | ||||||||||||
Weighted average shares outstanding | 10,906 | 11,818 | 12,832 | |||||||||
Diluted effect of stock equivalents | 24 | 37 | 50 | |||||||||
|
|
|
|
|
| |||||||
Weighted average shares outstanding assuming dilution | 10,930 | 11,855 | 12,882 | |||||||||
|
|
|
|
|
| |||||||
Basic net earnings per share | $ | 1.86 | $ | 2.23 | $ | 4.01 | ||||||
Diluted net earnings per share | $ | 1.85 | $ | 2.22 | $ | 4.00 | ||||||
Certain stock options and restricted stock units were excluded from the computation of diluted net earnings per share because their effect would have been anti-dilutive. Performance stock units are excluded from the calculation of dilutive potential common shares until the threshold performance conditions have been satisfied. The following table shows the securities excluded from the computation of earnings per share because their effect would have been anti-dilutive:
| For the years ended August 31, | ||||||||||||
(Units and options in thousands) | 2016 | 2015 | 2014 | |||||||||
Restricted stock units | 5 | 3 | 3 | |||||||||
Stock options | 89 | 50 | 44 | |||||||||
Note 5 – Accumulated Other Comprehensive Loss
Accumulated other comprehensive loss is included in the accompanying consolidated balance sheets in the shareholders' equity section, and consists of the following components:
| August 31, | ||||||||
($ in thousands) | 2016 | 2015 | ||||||
Accumulated other comprehensive loss: | ||||||||
Defined benefit pension plan, net of tax benefit of $1,648 and $1,540 | $ | (2,781) | $ | (2,523) | ||||
Foreign currency translation, net of hedging activities, net of tax expense of $3,287 and $3,154 | (11,391) | (12,785) | ||||||
|
|
|
| |||||
Total accumulated other comprehensive loss | $ | (14,172) | $ | (15,308) | ||||
|
|
|
| |||||
46
The following is a roll-forward of the balances in accumulated other comprehensive income (loss), net of tax.
($ in thousands) | Defined benefit pension plan adjustment | Foreign currency translation adjustment | Accumulated other comprehensive loss | |||||||||
Balance at August 31, 2014 | $ | (2,497) | $ | 296 | $ | (2,201) | ||||||
Current-period change | (26) | (13,081) | (13,107) | |||||||||
|
|
|
|
|
| |||||||
Balance at August 31, 2015 | (2,523) | (12,785) | (15,308) | |||||||||
Current-period change | (258) | 1,394 | 1,136 | |||||||||
|
|
|
|
|
| |||||||
Balance at August 31, 2016 | $ | (2,781) | $ | (11,391) | $ | (14,172) | ||||||
|
|
|
|
|
| |||||||
Note 6 – Income Taxes
For financial reporting purposes earnings (losses) before income taxes include the following components:
| For the years ended August 31, | ||||||||||||
($ in thousands) | 2016 | 2015 | 2014 | |||||||||
United States | $ | 17,805 | $ | 49,668 | $ | 70,066 | ||||||
Foreign | 11,483 | (2,917) | 8,589 | |||||||||
|
|
|
|
|
| |||||||
| $ | 29,288 | $ | 46,751 | $ | 78,655 | |||||||
|
|
|
|
|
| |||||||
Significant components of the income tax provision are as follows:
| For the years ended August 31, | ||||||||||||
($ in thousands) | 2016 | 2015 | 2014 | |||||||||
Current: | ||||||||||||
Federal | $ | 10,570 | $ | 15,908 | $ | 29,015 | ||||||
State | 976 | 1,426 | 2,176 | |||||||||
Foreign | 3,230 | 2,830 | 4,147 | |||||||||
|
|
|
|
|
| |||||||
Total current | 14,776 | 20,164 | 35,338 | |||||||||
|
|
|
|
|
| |||||||
Deferred: | ||||||||||||
Federal | (5,456) | (406) | (6,936) | |||||||||
State | (268) | 45 | (346) | |||||||||
Foreign | (31) | 639 | (913) | |||||||||
|
|
|
|
|
| |||||||
Total deferred | (5,755) | 278 | (8,195) | |||||||||
|
|
|
|
|
| |||||||
Total income tax provision | $ | 9,021 | $ | 20,442 | $ | 27,143 | ||||||
|
|
|
|
|
| |||||||
47
Total income tax provision resulted in effective tax rates differing from that of the statutory United States federal income tax rates. The reasons for these differences are:
| For the years ended August 31, | ||||||||||||||||||||||||
($ in thousands) | 2016 | 2015 | 2014 | |||||||||||||||||||||
| Amount | % | Amount | % | Amount | % | |||||||||||||||||||
U.S. statutory rate | $ | 10,251 | 35.0 | $ | 16,363 | 35.0 | $ | 27,529 | 35.0 | |||||||||||||||
State and local taxes, net of federal tax benefit | 350 | 1.2 | 911 | 1.9 | 1,067 | 1.4 | ||||||||||||||||||
Foreign tax rate differences | (377) | (1.3) | 1,311 | 2.8 | (116) | (0.1) | ||||||||||||||||||
Domestic production activities deduction | (960) | (3.3) | (1,548) | (3.3) | (2,170) | (2.8) | ||||||||||||||||||
Deferred tax asset valuation allowance | - | - | 2,949 | 6.3 | - | - | ||||||||||||||||||
Other | (243) | (0.8) | 456 | 1.0 | 833 | 1.0 | ||||||||||||||||||
|
|
|
|
|
|
|
|
|
|
|
| |||||||||||||
Effective rate | $ | 9,021 | 30.8 | $ | 20,442 | 43.7 | $ | 27,143 | 34.5 | |||||||||||||||
|
|
|
|
|
|
|
|
|
|
|
| |||||||||||||
Deferred income taxes reflect the net tax effects of temporary differences between the carrying amounts of assets and liabilities for financial reporting purposes and the amounts used for income tax purposes. Significant components of the Company's deferred tax assets and liabilities are as follows:
| August 31, | ||||||||
($ in thousands) | 2016 | 2015 | ||||||
Deferred tax assets: | ||||||||
Deferred revenue | $ | 1,501 | $ | 1,411 | ||||
Net operating loss carry forwards | 1,174 | 1,703 | ||||||
Defined benefit pension plan | 2,917 | 2,754 | ||||||
Share-based compensation | 1,839 | 1,814 | ||||||
State tax credits | - | 87 | ||||||
Inventory | 1,758 | 1,883 | ||||||
Warranty | 2,708 | 2,672 | ||||||
Vacation | 356 | 181 | ||||||
Accrued expenses and allowances | 16,289 | 12,135 | ||||||
Other | 378 | 527 | ||||||
|
|
|
| |||||
Gross deferred tax assets | 28,920 | 25,167 | ||||||
Valuation allowance | (2,825) | (2,949) | ||||||
|
|
|
| |||||
Net deferred tax assets | $ | 26,095 | $ | 22,218 | ||||
|
|
|
| |||||
Deferred tax liabilities: | ||||||||
Intangible assets | (16,426) | (17,514) | ||||||
Property, plant, and equipment | (6,605) | (6,687) | ||||||
Inventory | (63) | (83) | ||||||
|
|
|
| |||||
Total deferred tax liabilities | (23,094) | (24,284) | ||||||
|
|
|
| |||||
Net deferred tax assets (liabilities) | $ | 3,001 | $ | (2,066) | ||||
|
|
|
| |||||
In assessing the ability to realize deferred tax assets, management considers whether it is more likely than not that some portion or all of the deferred tax assets will not be realized. The ultimate realization of deferred tax assets is dependent upon the generation of future taxable income during the periods in which those temporary differences become deductible. Management considers the scheduled reversal of deferred tax liabilities, projected future taxable income, and tax planning strategies in making this assessment. Because the Company has a recent
48
history of generating cumulative losses in a certain foreign tax jurisdiction, management did not consider projections of future taxable income as persuasive evidence for the recoverability of deferred tax assets in that jurisdiction. Therefore, the Company recorded a valuation allowance of $2.9 million as of August 31, 2015. The Company did not record an additional allowance in fiscal 2016.
The Company does not intend to repatriate earnings of its foreign subsidiaries and accordingly, has not provided a U.S. deferred income tax liability on these undistributed earnings that are indefinitely reinvested. The Company would recognize a deferred income tax liability if the Company were to determine that such earnings are no longer indefinitely reinvested. At August 31, 2016, undistributed earnings of the Company's foreign subsidiaries amounted to approximately $34.6 million. Determination of the estimated amount of unrecognized deferred tax liability on these undistributed earnings is not practicable.
The Company recognizes tax benefits only for tax positions that are more likely than not to be sustained upon examination by tax authorities. The amount recognized is measured as the largest amount of benefit that is greater than 50 percent likely to be realized upon settlement. Unrecognized tax benefits are tax benefits claimed in the Company's tax returns that do not meet these recognition and measurement standards.
A reconciliation of changes in pre-tax unrecognized tax benefits is as follows:
| August 31, | ||||||||
($ in thousands) | 2016 | 2015 | ||||||
Unrecognized tax benefits at September 1 | $ | 3,836 | $ | 3,611 | ||||
Increases for positions taken in current year | 33 | 57 | ||||||
Increases for positions taken in prior years | 153 | 547 | ||||||
Reduction resulting from lapse of applicable statute of limitations | (299) | (122) | ||||||
Decreases for positions taken in prior years | - | (257) | ||||||
Decreases for settlements with tax authorities | (2,463) | - | ||||||
|
|
|
| |||||
Unrecognized tax benefits at August 31 | $ | 1,260 | $ | 3,836 | ||||
|
|
|
| |||||
The net amount of unrecognized tax benefits at August 31, 2016 and 2015 that, if recognized, would impact the Company's effective tax rate was $1.3 million and $1.5 million, respectively. Recognition of these tax benefits would have a favorable impact on the Company's effective tax rate. The Company recognizes accrued interest and penalties related to unrecognized tax benefits in income tax expense. Total accrued pre-tax liabilities for interest and penalties included in the unrecognized tax benefits liability were $0.8 million and $1.2 million for the years ended August 31, 2016 and 2015, respectively.
While it is expected that the amount of unrecognized tax benefits will change in the next twelve months as a result of the expiration of statutes of limitations, the Company does not expect this change to have a significant impact on its results of operations or financial position.
The Company files income tax returns in the United States and in state, local, and foreign jurisdictions. The Company is no longer subject to examination by tax authorities in most jurisdictions for years prior to 2013. During fiscal 2016, the U.S. Internal Revenue Service completed its audit for fiscal 2011.
49
Note 7 - Inventories
| August 31, | ||||||||
($ in thousands) | 2016 | 2015 | ||||||
Raw materials and supplies | $ | 26,599 | $ | 29,427 | ||||
Work in process | 5,742 | 7,318 | ||||||
Finished goods and purchased parts | 47,805 | 44,269 | ||||||
|
|
|
| |||||
Total inventory value before LIFO adjustment | 80,146 | 81,014 | ||||||
Less adjustment to LIFO value | (5,396) | (6,084) | ||||||
|
|
|
| |||||
Inventories, net | $ | 74,750 | $ | 74,930 | ||||
|
|
|
| |||||
Note 8 – Property, Plant, and Equipment
| August 31, | ||||||||
($ in thousands) | 2016 | 2015 | ||||||
Operating property, plant, and equipment: | ||||||||
Land | $ | 4,817 | $ | 4,721 | ||||
Buildings | 48,417 | 44,032 | ||||||
Machinery and equipment | 73,185 | 70,605 | ||||||
Furniture and fixtures | 24,787 | 29,649 | ||||||
Construction in progress | 8,316 | 9,135 | ||||||
|
|
|
| |||||
Total operating property, plant, and equipment | 159,522 | 158,142 | ||||||
Accumulated depreciation | (90,210) | (88,750) | ||||||
|
|
|
| |||||
Total operating property, plant, and equipment, net | $ | 69,312 | $ | 69,392 | ||||
Property held for lease: | ||||||||
Machines | 6,868 | 5,769 | ||||||
Barriers | 16,306 | 17,687 | ||||||
|
|
|
| |||||
Total property held for lease | $ | 23,174 | $ | 23,456 | ||||
Accumulated depreciation | (14,859) | (14,192) | ||||||
|
|
|
| |||||
Total property held for lease, net | $ | 8,315 | $ | 9,264 | ||||
|
|
|
| |||||
Property, plant, and equipment, net | $ | 77,627 | $ | 78,656 | ||||
|
|
|
| |||||
Depreciation expense was $12.2 million, $11.7 million, and $10.8 million for fiscal 2016, 2015, and 2014, respectively.
Note 9 – Goodwill and Other Intangible Assets
The carrying amount of goodwill by reportable segment for the year ended August 31, 2016 and 2015 is as follows:
($ in thousands) | Irrigation | Infrastructure | Total | |||||||||
Balance as of August 31, 2014 | $ | 20,293 | $ | 16,728 | $ | 37,021 | ||||||
Acquisition of Elecsys | 39,986 | - | 39,986 | |||||||||
Acquisition of SPF | 893 | - | 893 | |||||||||
Foreign currency translation | (267) | (832) | (1,099) | |||||||||
|
|
|
|
|
| |||||||
Balance as of August 31, 2015 | $ | 60,905 | $ | 15,896 | $ | 76,801 | ||||||
Foreign currency translation | 37 | (35) | 2 | |||||||||
|
|
|
|
|
| |||||||
Balance as of August 31, 2016 | $ | 60,942 | $ | 15,861 | $ | 76,803 | ||||||
|
|
|
|
|
| |||||||
50
The components of the Company's identifiable intangible assets at August 31, 2016 and 2015 are included in the table below.
| August 31, | ||||||||||||||||||||||||
| 2016 | 2015 | |||||||||||||||||||||||
($ in thousands) | Weighted average years | Gross carrying amount | Accumulated amortization | Weighted average years | Gross carrying amount | Accumulated amortization | ||||||||||||||||||
Amortizable intangible assets: | ||||||||||||||||||||||||
Patents and developed technology | 6.1 | $ | 33,732 | $ | (18,893) | 7.3 | $ | 33,741 | $ | (16,473) | ||||||||||||||
Customer relationships | 6.0 | 19,952 | (8,747) | 8.0 | 19,958 | (6,884) | ||||||||||||||||||
Non-compete agreements | 2.2 | 2,350 | (1,450) | 5.8 | 2,343 | (1,044) | ||||||||||||||||||
Other | 9.5 | 239 | (97) | 0.3 | 1,010 | (852) | ||||||||||||||||||
Unamortizable intangible assets: | ||||||||||||||||||||||||
Tradenames | N/A | 20,114 | - | N/A | 20,121 | - | ||||||||||||||||||
|
|
|
|
|
|
|
|
|
|
|
| |||||||||||||
Total | 5.7 | $ | 76,387 | $ | (29,187) | 6.7 | $ | 77,173 | $ | (25,253) | ||||||||||||||
|
|
|
|
|
|
|
|
|
|
|
| |||||||||||||
Amortization expense for amortizable intangible assets was $4.7 million, $4.7 million, and $4.0 million for fiscal 2016, 2015, and 2014, respectively.
Future estimated amortization of intangible assets for the next five years is as follows:
Fiscal years | $ in thousands | |||
2017 | $ | 4,450 | ||
2018 | 4,200 | |||
2019 | 3,549 | |||
2020 | 3,142 | |||
2021 | 2,421 | |||
Thereafter | 9,324 | |||
|
| |||
| $ | 27,086 | |||
|
| |||
The Company updated its impairment evaluation of goodwill and intangible assets with indefinite useful lives at August 31, 2016. No impairment losses were indicated as a result of the annual impairment testing for fiscal 2016, 2015, and 2014.
Note 10 – Other Current Liabilities
| August 31, | ||||||||
($ in thousands) | 2016 | 2015 | ||||||
Other current liabilities: | ||||||||
Compensation and benefits | $ | 19,044 | $ | 16,168 | ||||
Deferred revenues | 7,594 | 6,146 | ||||||
Warranties | 7,443 | 7,271 | ||||||
Dealer related liabilities | 4,978 | 5,328 | ||||||
Tax related liabilities | 4,210 | 8,435 | ||||||
Customer deposits | 3,399 | 3,161 | ||||||
Other | 8,737 | 9,596 | ||||||
|
|
|
| |||||
Total other current liabilities | $ | 55,405 | $ | 56,105 | ||||
|
|
|
| |||||
51
Note 11 – Credit Arrangements
Senior Notes . On February 19, 2015, the Company issued $115.0 million in aggregate principal amount of Senior Notes, Series A (the "Senior Notes"). The entire principal of the Senior Notes is due and payable on February 19, 2030. Interest on the Senior Notes is payable semi-annually at a fixed annual rate of 3.82 percent and borrowings under the Senior Notes are unsecured. The Company intends to use the proceeds of the sale of the Senior Notes for general corporate purposes, including acquisitions and dividends.
Revolving Credit Facility . On February 18, 2015, the Company entered into a $50 million unsecured Amended and Restated Revolving Credit Facility (the "Revolving Credit Facility") with Wells Fargo Bank, National Association. The Revolving Credit Facility replaces a previous revolving credit facility from the same lender originally entered into on January 24, 2008 and last amended on January 22, 2014. The Company intends to use borrowings under the Revolving Credit Facility for working capital purposes and to fund acquisitions. At August 31, 2016 and August 31, 2015, the Company had no outstanding borrowings under the Revolving Credit Facility. The amount of borrowings available at any time under the Revolving Credit Facility is reduced by the amount of standby letters of credit then outstanding. At August 31, 2016, the Company had the ability to borrow up to $43.9 million under this facility, after consideration of outstanding standby letters of credit of $6.1 million. Borrowings under the Revolving Credit Facility bear interest at a variable rate equal to LIBOR plus 90 basis points (1.42 percent at August 31, 2016), subject to adjustment as set forth in the loan documents for the Revolving Credit Facility. Interest is paid on a monthly to quarterly basis depending on loan type. The Company also pays an annual commitment fee of 0.25 percent on the unused portion of the Revolving Credit Facility. Borrowings under the Revolving Credit Facility have equal priority with borrowings under the Company's Senior Notes. Unpaid principal and interest on the Revolving Credit Facility is due by February 18, 2018.
Each of the credit arrangements described above include certain covenants relating primarily to the Company's financial condition. These financial covenants include a funded debt to EBITDA leverage ratio and an interest coverage ratio. Upon the occurrence of any event of default of these covenants, including a change in control of the Company, all amounts outstanding thereunder may be declared to be immediately due and payable. At August 31, 2016 and August 31, 2015, the Company was in compliance with all financial loan covenants contained in its credit arrangements in place as of each of those dates.
Series 2006A Bonds . Elecsys International Corporation, a wholly owned subsidiary of the Company, has outstanding $2.2 million in principal amount of industrial revenue bonds that were issued in 2006 (the "Series 2006A Bonds"). Principal and interest on the Series 2006A Bonds are payable monthly through maturity on September 1, 2026. The interest rate is adjustable based on the yield of the 5-year United States Treasury Notes, plus 0.45 percent (1.64 percent as of August 31, 2016). The obligations under the Series 2006A Bonds are secured by a first priority security interest in certain real estate.
Long-term debt consists of the following:
| August 31, | ||||||||
($ in thousands) | 2016 | 2015 | ||||||
Senior Notes | $ | 115,000 | $ | 115,000 | ||||
Revolving Credit Facility | - | - | ||||||
Series 2006A Bonds | 2,173 | 2,366 | ||||||
|
|
|
| |||||
Total debt | 117,173 | 117,366 | ||||||
Less current portion | (197) | (193) | ||||||
|
|
|
| |||||
Total long-term debt | $ | 116,976 | $ | 117,173 | ||||
|
|
|
| |||||
52
Principal payments due on the debt are as follows:
Due within | $ in thousands | |||
1 year | $ | 197 | ||
2 years | 201 | |||
3 years | 205 | |||
4 years | 209 | |||
5 years | 213 | |||
Thereafter | 116,148 | |||
|
| |||
| $ | 117,173 | |||
|
| |||
Note 12 – Financial Derivatives
Fair values of derivative instruments are as follows:
| August 31, | ||||||||||
($ in thousands) | Balance sheet location | 2016 | 2015 | |||||||
Derivatives designated as hedging instruments: | ||||||||||
Foreign currency forward contracts | Other current assets | $ | 40 | $ | 217 | |||||
Foreign currency forward contracts | Other current liabilities | (385) | (352) | |||||||
|
|
|
| |||||||
| Total derivatives designated as hedging instruments | $ | (345) | $ | (135) | ||||||
|
|
|
| |||||||
Derivatives not designated as hedging instruments: | ||||||||||
Foreign currency forward contracts | Other current assets | $ | 33 | $ | 495 | |||||
Foreign currency forward contracts | Other current liabilities | (210) | (61) | |||||||
|
|
|
| |||||||
| Total derivatives not designated as hedging instruments | $ | (177) | $ | 434 | ||||||
|
|
|
| |||||||
Accumulated other comprehensive income included realized and unrealized after-tax gains of $5.6 million, $5.4 million, and $2.0 million at August 31, 2016, 2015, and 2014, respectively, related to derivative contracts designated as hedging instruments.
Net Investment Hedging Relationships
The amount of loss recognized in OCI on derivatives is as follows:
| For the years ended August 31, | ||||||||||||
($ in thousands) | 2016 | 2015 | 2014 | |||||||||
| Foreign currency forward contracts, net of tax expense of $52, $2,083, and $16 | $ | (204) | $ | (3,420) | $ | (53) | ||||||
During fiscal 2016, 2015, and 2014, the Company settled Euro foreign currency forward contracts resulting in after-tax net gains (losses) of $0.3 million, $3.8 million, and ($0.5 million), respectively, which were included in OCI as part of a currency translation adjustment. There were no amounts recorded in the consolidated statement of operations related to ineffectiveness of Euro foreign currency forward contracts for the years ended August 31, 2016, 2015, and 2014.
At August 31, 2016 and 2015, the Company had outstanding Euro foreign currency forward contracts to sell 32.6 million Euro and 29.1 million Euro, respectively, at fixed prices to settle during the next fiscal quarter. At August 31, 2016 and 2015, the Company also had an outstanding foreign currency forward contract to sell 43.0 million South African rand at fixed prices to settle during the next fiscal quarter. The Company's foreign currency forward contracts qualify as hedges of a net investment in foreign operations.
53
Derivatives Not Designated as Hedging Instruments
In order to reduce exposures related to changes in foreign currency exchange rates, the Company, at times, may enter into forward exchange or option contracts for transactions denominated in a currency other than the functional currency for certain of the Company's operations. This activity primarily relates to economically hedging against foreign currency risk in purchasing inventory, sales of finished goods, and future settlement of foreign denominated assets and liabilities. The Company may choose whether or not to designate these contracts as hedges. For those contracts not designated, changes in fair value are recognized currently in the income statement. At August 31, 2016 and 2015, the Company had $8.2 million and $9.5 million, respectively, of U.S. dollar equivalent of foreign currency forward contracts outstanding.
Note 13 – Fair Value Measurements
The following table presents the Company's financial assets and liabilities measured at fair value based upon the level within the fair value hierarchy in which the fair value measurements fall, as of August 31, 2016 and 2015, respectively:
| August 31, 2016 | ||||||||||||||||
($ in thousands) | Level 1 | Level 2 | Level 3 | Total | ||||||||||||
Cash and cash equivalents | $ | 101,246 | $ | - | $ | - | $ | 101,246 | ||||||||
Derivative assets | - | 73 | - | 73 | ||||||||||||
Derivative liabilities | - | (595) | - | (595) | ||||||||||||
| August 31, 2015 | ||||||||||||||||
($ in thousands) | Level 1 | Level 2 | Level 3 | Total | ||||||||||||
Cash and cash equivalents | $ | 139,093 | $ | - | $ | - | $ | 139,093 | ||||||||
Derivative assets | - | 712 | - | 712 | ||||||||||||
Derivative liabilities | - | (413) | - | (413) | ||||||||||||
The carrying value of long-term debt (including current portion) was $117.2 million and $117.4 million at August 31, 2016 and 2015, respectively. The fair value of this debt was estimated to be $116.5 million and $114.9 million as of August 31, 2016 and 2015, based on current market rates as of the respective year-ends.
Note 14 – Commitments and Contingencies
In the ordinary course of its business operations, the Company enters into arrangements that obligate it to make future payments under contracts such as lease agreements. Additionally, the Company is involved, from time to time, in commercial litigation, employment disputes, administrative proceedings, business disputes and other legal proceedings. The Company has established accruals for certain proceedings based on an assessment of probability of loss. The Company believes that any potential loss in excess of the amounts accrued would not have a material effect on the business or its consolidated financial statements. Such proceedings are exclusive of environmental remediation matters which are discussed separately below.
Environmental Remediation
In 1992, the Company entered into a consent decree with the U.S. Environmental Protection Agency (the "EPA") in which the Company committed to remediate environmental contamination of the groundwater that was discovered from 1982 through 1990 at and adjacent to its Lindsay, Nebraska facility (the "site"). The site was added to the EPA's list of priority superfund sites in 1989. Between 1993 and 1995, remediation plans for the site were approved by the EPA and fully implemented by the Company. Since 1998, the primary remaining contamination at the site has been the presence of volatile organic compounds in the soil and groundwater. To date, the remediation process has consisted primarily of drilling wells into the aquifer and pumping water to the surface to allow these contaminants to be removed by aeration.
In fiscal 2012, the Company undertook an investigation to assess further potential site remediation and containment actions. In connection with the receipt of preliminary results of this investigation and other
54
evaluations, the Company estimated that it would incur $7.2 million in remediation of source area contamination and operating costs and accrued that undiscounted amount. In addition to this source area, the Company determined that volatile organic compounds also existed under one of the manufacturing buildings on the site. Due to the location, the Company had not yet determined the extent of these compounds or the extent to which they were contributing to groundwater contamination. Based on the uncertainty of the remediation actions that might be required with respect to this affected area, the Company believed that meaningful estimates of costs or range of costs could not be made and accordingly were not accrued.
In December 2014, the EPA requested that the Company prepare a feasibility study related to the site, including the area covered by the building, which resulted in a revision to the Company's remediation timeline. In the first quarter of fiscal 2015, the Company accrued $1.5 million of incremental operating costs to reflect its updated timeline.
The Company began soil and groundwater testing in preparation for developing this feasibility study during the first quarter of fiscal 2016. During the second quarter of fiscal 2016, the Company completed its testing which clarified the extent of contamination, including the identification of a source of contamination near the manufacturing building that was not part of the area for which reserves were previously established. The Company, with the assistance of third-party environmental experts, developed and evaluated remediation alternatives, a proposed remediation plan, and estimated costs. Based on these estimates of future remediation and operating costs, the Company accrued an additional $13.0 million in the second quarter of fiscal 2016 and included the related expenses in general and administrative expenses in the consolidated statement of operations.
The current estimated aggregate accrued cost of $19.0 million is based on consideration of several remediation options that would use different technologies, each of which the Company believes could be successful in meeting the long-term regulatory requirements of the site. The Company participated in a preliminary meeting with the EPA and the Nebraska Department of Environmental Quality (the "NDEQ") during the third quarter of fiscal 2016 to review remediation alternatives and proposed plans for the site and submitted its remedial alternatives evaluation report to the EPA in August 2016. The proposed remediation plan is preliminary and has not been approved by the EPA or the NDEQ. Based on guidance from third-party environmental experts and the preliminary discussions with the EPA, the Company anticipates that a definitive plan will not be agreed upon until fiscal 2017 or later.
The Company accrues the anticipated cost of investigation and remediation when the obligation is probable and can be reasonably estimated. While the Company believes the current accrual is a good faith estimate of the long-term cost of remediation at this site based on preliminary analysis available at this time, the estimate of costs and their timing could change as a result of a number of factors, including (1) EPA and NDEQ input on the proposed remediation plan and any changes which they may subsequently require, (2) refinement of cost estimates and length of time required to complete remediation and post-remediation operations and maintenance, (3) effectiveness of the technology chosen in remediation of the site as well as changes in technology that may be available in the future, and (4) unforeseen circumstances existing at the site. As a result of these factors, the actual amount of costs incurred by the Company in connection with the remediation of contamination of its Lindsay, Nebraska site could exceed the amounts accrued for this expense at this time. While any revisions could be material to the operating results of any fiscal quarter or fiscal year, the Company does not expect such additional expenses would have a material adverse effect on its liquidity or financial condition.
The following table summarizes the undiscounted environmental remediation liability classifications included in the balance sheet as of August 31, 2016 and 2015:
| ($ in thousands) | August 31, | |||||||
Balance sheet location | 2016 | 2015 | ||||||
Other current liabilities | $ | 722 | $ | 1,431 | ||||
Other noncurrent liabilities | 18,255 | 6,100 | ||||||
|
|
|
| |||||
Total environmental remediation liabilities | $ | 18,977 | $ | 7,531 | ||||
|
|
|
| |||||
55
Leases
The Company leases land, buildings, machinery, equipment, and computer equipment under various non-cancelable operating lease agreements. At August 31, 2016, future minimum lease payments under non-cancelable operating leases were as follows:
Fiscal years | $ in thousands | |||
2017 | $ | 3,921 | ||
2018 | 3,069 | |||
2019 | 2,483 | |||
2020 | 1,780 | |||
2021 | 1,662 | |||
Thereafter | 4,371 | |||
|
| |||
| $ | 17,286 | |||
|
| |||
Lease expense was $5.0 million, $4.5 million, and $4.0 million for fiscal 2016, 2015, and 2014, respectively.
Note 15 – Retirement Plans
The Company has defined contribution profit-sharing plans covering substantially all of its full-time U.S. employees. Participants may voluntarily contribute a percentage of compensation, but not in excess of the maximum allowed under the Internal Revenue Code. The plans provide for a matching contribution by the Company. The Company's total contributions charged to expense under the plans were $1.5 million, $1.2 million, and $1.2 million for the years ended August 31, 2016, 2015, and 2014, respectively.
A supplementary non-qualified, non-funded retirement plan for six former executives is also maintained. Plan benefits are based on the executive's average total compensation during the three highest compensation years of employment. This unfunded supplemental retirement plan is not subject to the minimum funding requirements of ERISA. The Company has purchased life insurance policies on certain former executives named in this supplemental retirement plan to provide funding for this liability.
As of August 31, 2016 and 2015, the funded status of the supplemental retirement plan was recorded in the consolidated balance sheets. The Company utilizes an August 31 measurement date for plan obligations related to the supplemental retirement plan. As this is an unfunded retirement plan, the funded status is equal to the benefit obligation.
The funded status of the plan and the net amount recognized in the accompanying balance sheets as of August 31 is as follows:
| August 31, | ||||||||
($ in thousands) | 2016 | 2015 | ||||||
Change in benefit obligation: | ||||||||
Benefit obligation at beginning of year | $ | 7,126 | $ | 7,157 | ||||
Interest cost | 281 | 275 | ||||||
Actuarial loss | 576 | 251 | ||||||
Benefits paid | (557) | (557) | ||||||
|
|
|
| |||||
Benefit obligation at end of year | $ | 7,426 | $ | 7,126 | ||||
|
|
|
| |||||
56
Amounts recognized in the statement of financial position consist of:
| August 31, | ||||||||
($ in thousands) | 2016 | 2015 | ||||||
Other current liabilities | $ | 557 | $ | 557 | ||||
Pension benefit liabilities | 6,869 | 6,569 | ||||||
|
|
|
| |||||
Net amount recognized | $ | 7,426 | $ | 7,126 | ||||
|
|
|
| |||||
The before-tax amounts recognized in accumulated other comprehensive loss consists of:
| August 31, | ||||||||
($ in thousands) | 2016 | 2015 | ||||||
Net actuarial loss | $ | (4,429) | $ | (4,063) | ||||
For the years ended August 31, 2016 and 2015, the Company assumed a discount rate of 3.30 percent and 4.10 percent, respectively, for the determination of the liability. The assumptions used to determine benefit obligations and costs are selected based on current and expected market conditions. The discount rate is based on a hypothetical portfolio of long-term corporate bonds with cash flows approximating the timing of expected benefit payments.
For the years ended August 31, 2016, 2015, and 2014, the Company assumed a discount rate of 4.10 percent, 4.00 percent, and 4.75 percent, respectively, for the determination of the net periodic benefit cost. The components of the net periodic benefit cost for the supplemental retirement plan are as follows:
| For the years ended August 31, | ||||||||||||
($ in thousands) | 2016 | 2015 | 2014 | |||||||||
Interest cost | $ | 281 | $ | 275 | $ | 314 | ||||||
Net amortization and deferral | 209 | 209 | 181 | |||||||||
|
|
|
|
|
| |||||||
Total | $ | 490 | $ | 484 | $ | 495 | ||||||
|
|
|
|
|
| |||||||
The estimated actuarial loss for the supplemental retirement plan that will be amortized, on a pre-tax basis, from accumulated other comprehensive loss into net periodic benefit cost during fiscal 2017 will be $0.2 million.
The Company's future annual contributions to the supplemental retirement plan will be equal to expected net benefit payments since the plan is unfunded. The following net benefit payments are expected to be paid:
Fiscal years | $ in thousands | |||
2017 | $ | 557 | ||
2018 | 540 | |||
2019 | 534 | |||
2020 | 527 | |||
2021 | 519 | |||
Thereafter | 4,749 | |||
|
| |||
| $ | 7,426 | |||
|
| |||
Note 16 - Warranties
Product Warranties
The Company generally warrants its products against certain manufacturing and other defects. These product warranties are provided for specific periods and/or usage of the product. The accrued product warranty costs are for a combination of specifically identified items and other incurred, but not identified, items based primarily on historical experience of actual warranty claims. This reserve is classified within other current liabilities.
57
The following tables provide the changes in the Company's product warranties:
| For the years ended August 31, | ||||||||
($ in thousands) | 2016 | 2015 | ||||||
Product warranty accrual balance, beginning of period | $ | 7,271 | $ | 9,331 | ||||
Liabilities accrued for warranties during the period | 5,912 | 4,223 | ||||||
Warranty claims paid during the period | (5,244) | (4,856) | ||||||
Changes in estimates | (496) | (1,427) | ||||||
|
|
|
| |||||
Product warranty accrual balance, end of period | $ | 7,443 | $ | 7,271 | ||||
|
|
|
| |||||
Warranty costs were $5.4 million, $2.8 million, and $6.4 million for fiscal 2016, 2015, and 2014, respectively.
Note 17 – Industry Segment Information
The Company manages its business activities in two reportable segments: Irrigation and Infrastructure. The accounting policies of the two reportable segments are the same as those described in Note 1, Description of Business and Significant Accounting Policies. The Company evaluates the performance of its reportable segments based on segment sales, gross profit, and operating income, with operating income for segment purposes excluding unallocated corporate general and administrative expenses, interest income, interest expense, other income and expenses, and income taxes. Operating income for segment purposes does include general and administrative expenses, selling expenses, engineering and research expenses and other overhead charges directly attributable to the segment. There are no inter-segment sales.
Irrigation
This reporting segment includes the manufacture and marketing of center pivot, lateral move, and hose reel irrigation systems as well as various water pumping stations, controls, filtration solutions and M2M technology. The irrigation reporting segment consists of three operating segments that have similar economic characteristics and meet the aggregation criteria, including similar products, production processes, type or class of customer and methods for distribution.
Infrastructure
This reporting segment includes the manufacture and marketing of moveable barriers, specialty barriers, crash cushions and end terminals, and road marking and road safety equipment; the manufacturing and selling of large diameter steel tubing and railroad signals and structures; and providing outsourced manufacturing and production services. The infrastructure reporting segment consists of one operating segment.
The Company has no single major customer representing 10 percent or more of its total revenues during fiscal 2016, 2015, or 2014.
58
Summarized financial information concerning the Company's reportable segments is shown in the following tables:
($ in thousands) | 2016 | 2015 | 2014 | |||||||||
Operating revenues: | ||||||||||||
Irrigation | $ | 421,641 | $ | 451,205 | $ | 539,943 | ||||||
Infrastructure | 94,770 | 108,976 | 77,990 | |||||||||
|
|
|
|
|
| |||||||
Total operating revenues | $ | 516,411 | $ | 560,181 | $ | 617,933 | ||||||
|
|
|
|
|
| |||||||
Operating income: | ||||||||||||
Irrigation | $ | 49,232 | $ | 52,065 | $ | 91,697 | ||||||
Infrastructure | 18,535 | 20,249 | 3,511 | |||||||||
|
|
|
|
|
| |||||||
Segment operating income | 67,767 | 72,314 | 95,208 | |||||||||
Unallocated general and administrative expenses | (33,392) | (21,619) | (16,850) | |||||||||
Interest and other income (expense), net | (5,087) | (3,944) | 297 | |||||||||
|
|
|
|
|
| |||||||
Earnings before income taxes | $ | 29,288 | $ | 46,751 | $ | 78,655 | ||||||
|
|
|
|
|
| |||||||
Total capital expenditures: | ||||||||||||
Irrigation | $ | 8,375 | $ | 12,406 | $ | 14,778 | ||||||
Infrastructure | 2,977 | 2,671 | 2,181 | |||||||||
Corporate | 144 | 167 | 756 | |||||||||
|
|
|
|
|
| |||||||
| $ | 11,496 | $ | 15,244 | $ | 17,715 | |||||||
|
|
|
|
|
| |||||||
Total depreciation and amortization: | ||||||||||||
Irrigation | $ | 11,774 | $ | 11,000 | $ | 9,125 | ||||||
Infrastructure | 4,648 | 4,966 | 5,299 | |||||||||
Corporate | 459 | 446 | 369 | |||||||||
|
|
|
|
|
| |||||||
| $ | 16,881 | $ | 16,412 | $ | 14,793 | |||||||
|
|
|
|
|
| |||||||
Total assets: | ||||||||||||
Irrigation | $ | 341,972 | $ | 328,036 | $ | 280,031 | ||||||
Infrastructure | 83,531 | 81,494 | 96,488 | |||||||||
Corporate | 74,061 | 126,938 | 150,033 | |||||||||
|
|
|
|
|
| |||||||
| $ | 499,565 | $ | 536,468 | $ | 526,551 | |||||||
|
|
|
|
|
| |||||||
Summarized financial information concerning the Company's geographical areas is shown in the following tables.
| For the years ended August 31, | ||||||||||||||||||||||||
($ in thousands) | 2016 | 2015 | 2014 | |||||||||||||||||||||
| Revenues | % of total | Revenues | % of total | Revenues | % of total | |||||||||||||||||||
United States | $ | 321,554 | 62 | $ | 350,290 | 63 | $ | 377,652 | 61 | |||||||||||||||
International | 194,857 | 38 | 209,891 | 37 | 240,281 | 39 | ||||||||||||||||||
|
|
|
|
|
|
|
|
|
|
|
| |||||||||||||
Total revenues | $ | 516,411 | 100 | $ | 560,181 | 100 | $ | 617,933 | 100 | |||||||||||||||
|
|
|
|
|
|
|
|
|
|
|
| |||||||||||||
59
| For the years ended August 31, | ||||||||||||||||||||||||
($ in thousands) | 2016 | 2015 | 2014 | |||||||||||||||||||||
| Long-lived tangible assets | % of total | Long-lived tangible assets | % of total | Long-lived tangible assets | % of total | |||||||||||||||||||
United States | $ | 58,098 | 75 | $ | 61,332 | 78 | $ | 55,378 | 76 | |||||||||||||||
International | 19,529 | 25 | 17,324 | 22 | 17,079 | 24 | ||||||||||||||||||
|
|
|
|
|
|
|
|
|
|
|
| |||||||||||||
Total long-lived assets | $ | 77,627 | 100 | $ | 78,656 | 100 | $ | 72,457 | 100 | |||||||||||||||
|
|
|
|
|
|
|
|
|
|
|
| |||||||||||||
Note 18 – Share-Based Compensation
Share-Based Compensation Program
Share-based compensation is designed to reward employees for their long-term contributions to the Company and provide incentives for them to remain with the Company. The number and frequency of share grants are based on competitive practices, operating results of the Company, and individual performance. As of August 31, 2016, the Company's share-based compensation plan was the 2015 Long-Term Incentive Plan (the "2015 Plan"). The 2015 Plan was approved by the shareholders of the Company, and became effective on January 26, 2015, and replaced the Company's 2010 Long Term Incentive Plan. At August 31, 2016, the Company had share-based awards outstanding under its 2010 and 2015 Long-Term Incentive Plans.
The 2015 Plan provides for awards of stock options, restricted shares, restricted stock units, stock appreciation rights, performance shares and performance stock units to employees and non-employee directors of the Company. The maximum number of shares as to which stock awards may be granted under the 2015 Plan is 626,968 shares, exclusive of any forfeitures from the 2010 Long Term Incentive Plan. At August 31, 2016, 555,034 shares of common stock (including forfeitures from prior plans) remained available for issuance under the 2015 Plan. All stock awards will be counted against the 2015 Plan in a 1 to 1 ratio. If options, restricted stock units or performance stock units awarded under the 2010 Plan terminate without being fully vested or exercised, those shares will be available again for grant under the 2015 Plan. The 2015 Plan also limits the total awards that may be made to any individual.
Share-Based Compensation Information
The following table summarizes share-based compensation expense for fiscal 2016, 2015, and 2014:
| For the years ended August 31, | ||||||||||||
($ in thousands) | 2016 | 2015 | 2014 | |||||||||
Share-based compensation expense included in cost of operating revenues | $ | 207 | $ | 161 | $ | 205 | ||||||
Research and development | 140 | 121 | 135 | |||||||||
Sales and marketing | 455 | 523 | 570 | |||||||||
General and administrative | 2,258 | 2,527 | 3,297 | |||||||||
|
|
|
|
|
| |||||||
Share-based compensation expense included in operating expenses | 2,853 | 3,171 | 4,002 | |||||||||
|
|
|
|
|
| |||||||
Total share-based compensation expense | 3,060 | 3,332 | 4,207 | |||||||||
Tax benefit | (1,138) | (1,240) | (1,594) | |||||||||
|
|
|
|
|
| |||||||
Share-based compensation expense, net of tax | $ | 1,922 | $ | 2,092 | $ | 2,613 | ||||||
|
|
|
|
|
| |||||||
As of August 31, 2016, there was $4.1 million pre-tax of total unrecognized compensation cost related to non-vested share-based compensation arrangements which is expected to be recognized over a weighted average period of 2.0 years.
Stock Options – Stock option awards have an exercise price equal to the closing price on the date of grant, expire no later than ten years from the date of grant and vest over a four-year period at 25 percent per year. The
60
fair value of stock option awards is estimated using the Black-Scholes option pricing model. The table below shows the annual weighted average assumptions used for valuation purposes.
| Grant year | ||||||||
| Fiscal 2016 | Fiscal 2015 | |||||||
Risk-free interest rate | 1.8% | 2.0% | ||||||
Dividend yield | 1.7% | 1.3% | ||||||
Expected life (years) | 7 | 7 | ||||||
Volatility | 46.3% | 53.6% | ||||||
Weighted average grant-date fair value of options granted | $ | 27.88 | $ | 40.66 | ||||
The risk-free rate is based on the U.S. Treasury yield curve in effect at the time of grant; the dividend yield is calculated as the ratio of dividends paid per share of common stock to the stock price on the date of grant; the expected life is based on historical and expected exercise behavior; and volatility is based on the historical volatility of the Company's stock price over the expected life of the option.
The following table summarizes information about stock options outstanding as of and for the years ended August 31, 2016, 2015, and 2014:
| Number of stock options | Average exercise price | Average remaining contractual term (years) | Aggregate intrinsic value (thousands) | |||||||||||||
Stock options outstanding at August 31, 2014 | 86,623 | $ | 63.80 | 7.3 | $ | 1,211 | ||||||||||
Granted | 25,332 | $ | 83.53 | |||||||||||||
Exercised | (9,859) | $ | 39.99 | $ | 425 | |||||||||||
Forfeited / cancelled | (5,720) | $ | 76.91 | |||||||||||||
|
| |||||||||||||||
Stock options outstanding at August 31, 2015 | 96,376 | $ | 70.65 | 7.3 | $ | 710 | ||||||||||
|
| |||||||||||||||
Granted | 39,999 | $ | 67.68 | |||||||||||||
Exercised | (4,456) | $ | 25.47 | $ | 181 | |||||||||||
Forfeited / cancelled | (4,633) | $ | 72.14 | |||||||||||||
|
| |||||||||||||||
Stock options outstanding at August 31, 2016 | 127,286 | $ | 71.24 | 7.4 | $ | 521 | ||||||||||
|
| |||||||||||||||
Exercisable at August 31, 2014 | 30,130 | $ | 49.55 | 5.3 | $ | 851 | ||||||||||
Exercisable at August 31, 2015 | 39,449 | $ | 61.47 | 6.1 | $ | 583 | ||||||||||
Exercisable at August 31, 2016 | 57,250 | $ | 68.57 | 6.1 | $ | 362 | ||||||||||
There were 23,164, 19,178, and 13,793 outstanding stock options that vested during fiscal 2016, 2015, and 2014, respectively. Additional information regarding stock option exercises is summarized in the table below.
| For the years ended August 31, | ||||||||||||
($ in thousands) | 2016 | 2015 | 2014 | |||||||||
Intrinsic value of stock options exercised | $ | 181 | $ | 425 | $ | 853 | ||||||
Cash received from stock option exercises | $ | 113 | $ | 394 | $ | 455 | ||||||
Tax benefit realized from stock option exercises | $ | 67 | $ | 158 | $ | 317 | ||||||
Aggregate grant-date fair value of stock options vested | $ | 37.70 | $ | 36.71 | $ | 34.89 | ||||||
Restricted stock units - The restricted stock units have a grant-date fair value equal to the fair market value of the underlying stock on the grant date less present value of expected dividends. The restricted stock units granted to employees vest over a three-year period at approximately 33 percent per year. The restricted stock units granted to non-employee directors generally vest over a nine-month period.
61
The following table summarizes information about restricted stock units as of and for the years ended August 31, 2016, 2015, and 2014:
| Number of restricted stock units | Weighted average grant- date fair value | |||||||
Restricted stock units outstanding at August 31, 2014 | 59,153 | $ | 73.04 | |||||
Granted | 34,291 | 80.94 | ||||||
Vested | (32,349) | 72.28 | ||||||
Forfeited / Cancelled | (4,123) | 77.55 | ||||||
|
|
|
| |||||
Restricted stock units outstanding at August 31, 2015 | 56,972 | $ | 78.54 | |||||
|
|
|
| |||||
Granted | 48,022 | 64.36 | ||||||
Vested | (30,634) | 78.68 | ||||||
Forfeited / Cancelled | (7,306) | 70.41 | ||||||
|
|
|
| |||||
Restricted stock units outstanding at August 31, 2016 | 67,054 | $ | 69.11 | |||||
|
|
|
| |||||
Restricted stock units are generally settled with the issuance of shares with the exception of certain restricted stock units awarded to internationally-based employees that are settled in cash. At August 31, 2016, 2015, and 2014, outstanding restricted stock units included 6,155, 5,504, and 5,289 units, respectively, that will be settled in cash. The fair value of restricted stock units that vested during the period was $2.4 million and $2.3 million for each of the years ended August 31, 2016 and 2015, respectively.
Performance stock units - The performance stock units have a grant-date fair value equal to the fair market value of the underlying stock on the grant date less present value of expected dividends. The performance stock units granted to employees cliff vest after a three-year period and a specified number of shares of common stock will be awarded under the terms of the performance stock units, if performance measures relating to revenue growth and a return on net assets are achieved.
The table below summarizes the status of the Company's performance stock units as of and for the year ended August 31, 2016, 2015, and 2014:
| Number of performance stock units | Weighted average grant- date fair value | |||||||
Performance stock units outstanding at August 31, 2014 | 40,752 | $ | 67.81 | |||||
Granted | 12,328 | 80.33 | ||||||
Vested | (15,786) | 57.09 | ||||||
Forfeited / cancelled | (3,438) | 76.44 | ||||||
|
|
|
| |||||
Performance stock units outstanding at August 31, 2015 | 33,856 | $ | 76.50 | |||||
|
|
|
| |||||
Granted | 16,466 | 64.37 | ||||||
Vested | (7,665) | 74.31 | ||||||
Forfeited / cancelled | (4,509) | 72.28 | ||||||
|
|
|
| |||||
Performance stock units outstanding at August 31, 2016 | 38,148 | $ | 72.20 | |||||
|
|
|
| |||||
In connection with the performance stock units, the performance goals are based upon revenue growth and a return on net assets during the performance period. The awards actually earned will range from zero to two hundred percent of the targeted number of performance stock units and will be paid in shares of common stock. Shares earned will be distributed upon vesting on the first day of November following the end of the three-year performance period. The Company is accruing compensation expense based on the estimated number of shares expected to be issued utilizing the most current information available to the Company at the date of the financial statements. If defined performance goals are not met, no compensation cost will be recognized and any
62
previously recognized compensation expense will be reversed. In fiscal 2016 and fiscal 2015, performance stock units that vested represented 7,665 and 27,473, respectively, of actual shares of common stock issued. The fair value of performance stock units that vested during the period was $0.6 million and $1.6 million for the years ended August 31, 2016 and 2015, respectively.
Note 19 – Share Repurchases
On January 3, 2014, the Company announced that its Board of Directors authorized a share repurchase program of up to $150.0 million of common stock through January 2, 2016. On July 22, 2015, the Company announced that its Board of Directors increased its outstanding share repurchase authorization by $100.0 million with no expiration. Under the program, shares may be repurchased in privately negotiated and/or open market transactions as well as under formalized trading plans in accordance with the guidelines specified under Rule 10b5-1 of the Securities Exchange Act of 1934, as amended. During the twelve months ended August 31, 2016, the Company repurchased 688,790 shares for an aggregate purchase price of $48.3 million. During the twelve months ended August 31, 2015, the Company repurchased 1,198,089 shares of common stock for an aggregate purchase price of $96.9 million. The remaining amount available under the repurchase program was $63.7 million as of August 31, 2016.
Note 20 – Quarterly Results of Operations (Unaudited)
($ in thousands, except per share amounts) | First Quarter | Second Quarter (1) | Third Quarter | Fourth Quarter (2) | ||||||||||||
Year ended August 31, 2016 | ||||||||||||||||
Operating revenues | $ | 121,622 | $ | 120,573 | $ | 141,319 | $ | 132,897 | ||||||||
Cost of operating revenues | $ | 87,208 | $ | 88,128 | $ | 99,511 | $ | 92,951 | ||||||||
Earnings (loss) before income taxes | $ | 10,396 | $ | (6,193) | $ | 14,065 | $ | 11,020 | ||||||||
Net earnings (loss) | $ | 6,944 | $ | (4,129) | $ | 9,644 | $ | 7,808 | ||||||||
Diluted net earnings (loss) per share | $ | 0.62 | $ | (0.37) | $ | 0.90 | $ | 0.73 | ||||||||
Year ended August 31, 2015 | ||||||||||||||||
Operating revenues | $ | 134,845 | $ | 141,089 | $ | 160,707 | $ | 123,540 | ||||||||
Cost of operating revenues | $ | 97,931 | $ | 101,533 | $ | 114,321 | $ | 90,075 | ||||||||
Earnings before income taxes | $ | 11,661 | $ | 14,138 | $ | 20,423 | $ | 529 | ||||||||
Net earnings (loss) | $ | 7,568 | $ | 8,995 | $ | 12,927 | $ | (3,181) | ||||||||
Diluted net earnings (loss) per share | $ | 0.62 | $ | 0.75 | $ | 1.10 | $ | (0.28) | ||||||||
(1) The second quarter 2016 results were affected by an environmental charge reducing net earnings by $8.5 million.
(2) The fourth quarter 2015 results were affected by a bad debt reserve of $5.0 million on accounts receivable and a reserve of $2.9 million against foreign deferred income tax assets.
63
ITEM 9 - Changes in and Disagreements with Accountants on Accounting and Financial Disclosure
Not applicable.
ITEM 9A - Controls and Procedures
Evaluation of Disclosure Controls and Procedures
As of the end of the period covered by this report, the Company carried out an evaluation, under the supervision and with the participation of the Company's management, including the Company's Chief Executive Officer and Chief Financial Officer, of the effectiveness of the design and operation of the Company's disclosure controls and procedures, as defined in Exchange Act Rules 13a-15(e) and 15d-15(e) and internal control over financial reporting, as defined in Exchange Act Rules 13a-15(f) and 15d-15(f). Based upon that evaluation, the Company's Chief Executive Officer and Chief Financial Officer concluded that the Company's disclosure controls and procedures are effective in enabling the Company to record, process, summarize and report information required to be included in the Company's periodic SEC filings within the required time period.
Management's Report on Internal Control over Financial Reporting
Management is responsible for establishing and maintaining adequate internal control over financial reporting for the Company. The Company's internal control system was designed to provide reasonable assurance to the Company's management and board of directors regarding the preparation and fair presentation of published financial statements.
Management has assessed the effectiveness of the Company's internal control over financial reporting as of August 31, 2016, based on the criteria for effective internal control described in Internal Control – Integrated Framework (2013) issued by the Committee of Sponsoring Organizations of the Treadway Commission. Based on its assessment, management concluded that the Company's internal control over financial reporting was effective as of August 31, 2016.
The Audit Committee has engaged KPMG LLP, the independent registered public accounting firm that audited the consolidated financial statements included in this Annual Report on Form 10-K, to attest to and report on management's evaluation of the Company's internal control over financial reporting. The report of KPMG LLP is included herein.
64
Report of Independent Registered Public Accounting Firm
The Board of Directors and Shareholders
Lindsay Corporation:
We have audited Lindsay Corporation's internal control over financial reporting as of August 31, 2016, based on criteria established in Internal Control – Integrated Framework (2013) issued by the Committee of Sponsoring Organizations of the Treadway Commission (COSO). Lindsay Corporation's management is responsible for maintaining effective internal control over financial reporting and for its assessment of the effectiveness of internal control over financial reporting, included in the accompanying Management's Report on Internal Control over Financial Reporting. Our responsibility is to express an opinion on the Company's internal control over financial reporting based on our audit.
We conducted our audit in accordance with the standards of the Public Company Accounting Oversight Board (United States). Those standards require that we plan and perform the audit to obtain reasonable assurance about whether effective internal control over financial reporting was maintained in all material respects. Our audit included obtaining an understanding of internal control over financial reporting, assessing the risk that a material weakness exists, and testing and evaluating the design and operating effectiveness of internal control based on the assessed risk. Our audit also included performing such other procedures as we considered necessary in the circumstances. We believe that our audit provides a reasonable basis for our opinion.
A company's internal control over financial reporting is a process designed to provide reasonable assurance regarding the reliability of financial reporting and the preparation of financial statements for external purposes in accordance with generally accepted accounting principles. A company's internal control over financial reporting includes those policies and procedures that (1) pertain to the maintenance of records that, in reasonable detail, accurately and fairly reflect the transactions and dispositions of the assets of the company; (2) provide reasonable assurance that transactions are recorded as necessary to permit preparation of financial statements in accordance with generally accepted accounting principles, and that receipts and expenditures of the company are being made only in accordance with authorizations of management and directors of the company; and (3) provide reasonable assurance regarding prevention or timely detection of unauthorized acquisition, use, or disposition of the company's assets that could have a material effect on the financial statements.
Because of its inherent limitations, internal control over financial reporting may not prevent or detect misstatements. Also, projections of any evaluation of effectiveness to future periods are subject to the risk that controls may become inadequate because of changes in conditions, or that the degree of compliance with the policies or procedures may deteriorate.
In our opinion, Lindsay Corporation maintained, in all material respects, effective internal control over financial reporting as of August 31, 2016, based on criteria established in Internal Control – Integrated Framework (2013) issued by the Committee of Sponsoring Organizations of the Treadway Commission (COSO).
We also have audited, in accordance with the standards of the Public Company Accounting Oversight Board (United States), the consolidated balance sheets of Lindsay Corporation and subsidiaries as of August 31, 2016 and 2015, and the related consolidated statements of operations, comprehensive income, shareholders' equity, and cash flows for each of the years in the three-year period ended August 31, 2016, and the related financial statement schedule and our report dated October 18, 2016 expressed an unqualified opinion on those consolidated financial statements and related financial statement schedule.
/s/ KPMG LLP
Omaha, Nebraska
October 18, 2016
65
Changes in Internal Control over Financial Reporting
There were no changes in the Company's internal controls over financial reporting that occurred during the year ended August 31, 2016, that have materially affected, or are reasonably likely to materially affect, the Company's internal control over financial reporting.
ITEM 9B - Other Information
None.
66
PART III
ITEM 10 - Directors, Executive Officers and Corporate Governance
The Company will file with the Securities and Exchange Commission a definitive Proxy Statement for its 2017 Annual Meeting of Stockholders (the "Proxy Statement") not later than 120 days after the close of its fiscal year ended August 31, 2016. Information about the Board of Directors required by Items 401 and 407 of Regulation S-K is incorporated by reference to the discussion responsive thereto under the captions "Board of Directors and Committees" and "Corporate Governance" in the Proxy Statement.
The executive officers and significant employees of the Company, their ages, positions and business experience are set forth below. All executive officers of the Company are appointed by the Board of Directors annually and have employment agreements. There are no family relationships between any director or executive officer. There are no arrangements or understandings between any executive officer and any other person pursuant to which they were selected as an officer.
| Age | Position | |||
Richard W. Parod | 63 | President and Chief Executive Officer | ||
Eric R. Arneson* | 42 | Vice President, General Counsel and Secretary | ||
David B. Downing | 61 | Executive Vice President | ||
C. Mike Harris* | 50 | President – Industrial Water Solutions Business | ||
Brian L. Ketcham | 55 | Vice President and Chief Financial Officer | ||
Mark A. Roth* | 41 | Vice President – Corporate Development and Treasurer | ||
Reuben P. Srinivasan* | 53 | Vice President – Human Resources | ||
Randy A. Wood | 44 | President – Agricultural Irrigation Division | ||
Lori L. Zarkowski* | 41 | Chief Accounting Officer |
* The employee is not an executive officer of the Registrant.
Mr. Richard W. Parod is President and Chief Executive Officer ("CEO") of the Company, and has held such positions since April 2000. Prior to that time and since 1997, Mr. Parod was Vice President and General Manager of the Irrigation Division of The Toro Company. Mr. Parod was employed by James Hardie Irrigation from 1993 through 1997, becoming President in 1994. Mr. Parod has been a Director since April 2000, when he began his employment with the Company.
Mr. Eric R. Arneson is Vice President, General Counsel and Secretary of the Company and has held such positions since April 2008, when he joined the Company. Prior to that time and since January 1999, Mr. Arneson practiced law with the law firm of Kutak Rock LLP, and was most recently a partner of the firm.
Mr. David B. Downing is Executive Vice President of the Company and has held such position since May 2016. Between October 2013 and May 2016, Mr. Downing served as President – Agricultural Irrigation Division of the Company. Between March 2008 and October 2013, Mr. Downing served as President – International operations of the Company. Between March 2009 and June 2011, Mr. Downing served as both Chief Financial Officer and President – International Operations of the Company. Previously he was Senior Vice President-Finance, Chief Financial Officer, Treasurer and Secretary of the Company and held such positions from August 2004, when he joined the Company, to March 2008. Prior to August 2004, Mr. Downing served as the President of FPM L.L.C., a heat-treating company based in Elk Grove Village, Illinois, after joining that company in January 2001 as Vice President and Chief Financial Officer. Previously, Mr. Downing served as Vice President and Controller for Thermo-King, which manufactured transport refrigeration equipment.
Mr. C. Mike Harris is President – Industrial Water Solutions Business of the Company and has held such position since November 2013. Prior to joining Lindsay and since February 2013, he served as Vice President of Sales and Field Operation at Johnson Controls, Inc., a global diversified technology and industrial company. From May
67
2010 to February 2013, Mr. Harris served as Vice President and Managing Director of Asia Pacific at Johnson Controls, Inc. From February 2005 to April 2010, Mr. Harris served as Vice President and General Manager of Energy Services for Johnson Controls, Inc. Prior to 2005 and since 2002, Mr. Harris served in several Vice President positions' at Johnson Controls, Inc. Prior to joining Johnson Controls, Inc., Mr. Harris held various leadership positions in the energy services, commodity trading and utility industries.
Mr. Brian L. Ketcham is Vice President and Chief Financial Officer of the Company, and has held such positions since April 2016. Prior to joining Lindsay and since 2001, Mr. Ketcham served in various finance roles at Valmont Industries, Inc., most recently as Vice President and Group Controller of the Engineered Support Structures segment. Prior to joining Valmont, Mr. Ketcham held various positions with Consolidated Container Company LLC and KPMG LLP.
Mr. Mark A. Roth is Vice President – Corporate Development and Treasurer of the Company. Mr. Roth joined Lindsay in January 2004, as Director of Corporate Development and was promoted to Vice President – Corporate Development in March 2007, adding Treasurer to his role in April 2008. From March 2001 through 2004 when he joined the Company, Mr. Roth was an Associate with McCarthy Group, Inc., a Midwest-based investment bank and private equity fund. From January 1998 through February 2001, Mr. Roth was a Senior Credit Analyst at US Bancorp.
Mr. Reuben P. Srinivasan is Vice President – Human Resources and joined the Company in January 2013. Mr. Srinivasan was formerly Director (Global), Human Resources at Trimble Navigation Limited, a provider of advanced location-based solutions based in Sunnyvale, California, from 2006 to 2013. From 1997 through 2006, Mr. Srinivasan held positions of increasing responsibility with Volkswagen Group of America, the last six years of which were as Manager of Human Resources with the Audi brand.
Mr. Randy A. Wood is President – Agricultural Irrigation Division of the Company and has held such position since May 2016. Between October 2013 and May 2016, Mr. Wood served as President – International Irrigation of the Company. Between February 2012 and October 2013, Mr. Wood served as Vice President – Americas / ANZ Sales and Marketing. Previously he was Vice President – North America Irrigation Sales of the Company and held such position from March 2008, when he joined the Company. Prior to March 2008, Mr. Wood spent 11 years with Case Corporation / CNH Global including roles as the Senior Director of Marketing, Case IH Tractors, and Senior Director of Sales and Marketing, Parts and Service.
Ms. Lori L. Zarkowski is Chief Accounting Officer of the Company, and has held such position since August 2011. Ms. Zarkowski joined Lindsay in June 2007 as Corporate Reporting Manager and was promoted to Corporate Controller in April 2008. Prior to joining the Company and since 1997, Ms. Zarkowski was most recently an Audit Senior Manager with Deloitte & Touche LLP.
Section 16(a) Beneficial Ownership Reporting Compliance - Item 405 of Regulation S-K calls for disclosure of any known late filing or failure by an insider to file a report required by Section 16 of the Securities Exchange Act. The information required by Item 405 is incorporated by reference to the discussion responsive thereto under the caption "Section 16(a) Beneficial Ownership Reporting Compliance" in the Proxy Statement.
Code of Ethics – Item 406 of Regulation S-K calls for disclosure of whether the Company has adopted a code of ethics applicable to the principal executive officer, principal financial officer, principal accounting officer or controller, or persons performing similar functions. The Company has adopted a code of ethics applicable to the Company's principal executive officer and senior financial officers known as the Code of Ethical Conduct (Principal Executive Officer and Senior Financial Officers). The Code of Ethical Conduct (Principal Executive Officer and Senior Financial Officers) is available on the Company's website. In the event that the Company amends or waives any of the provisions of the Code of Ethical Conduct applicable to the principal executive officer and senior financial officers, the Company intends to disclose the same on the Company's website at www.lindsay.com. No waivers were provided for the fiscal year ended August 31, 2016.
68
ITEM 11 - Executive Compensation
The information required by this Item is incorporated by reference to the discussion responsive thereto under the captions "Executive Compensation," "Compensation Discussion and Analysis," "Pension Benefits," "Nonqualified Deferred Compensation," "Report of the Compensation Committee on Executive Compensation," "Compensation of Directors," and "Compensation Committee Interlocks and Insider Participation" in the Proxy Statement.
ITEM 12 - Security Ownership of Certain Beneficial Owners and Management and Related Stockholder Matters
The information required by this Item relating to security ownership of certain beneficial owners and management is incorporated by reference to the discussion responsive thereto under the caption "Voting Securities and Beneficial Ownership Thereof by Principal Stockholders, Directors and Officers" in the Proxy Statement.
Equity Compensation Plan Information - The following equity compensation plan information summarizes plans and securities approved by security holders as of August 31, 2016 (there were no equity compensation plans not approved by security holders as of August 31, 2016):
| (a) | (b) | (c) | ||||||||||
Plan category
| Number of securities to be issued upon exercise of outstanding options, warrants, and rights | Weighted-average exercise price of outstanding options, warrants, and rights | Number of securities remaining available for future issuance under equity compensation plans (excluding securities reflected in column (a)) | |||||||||
Equity compensation plans approved by security holders (1) (2) | 226,333 | $ | 71.24 | 555,034 | ||||||||
|
|
|
|
|
| |||||||
Total | 226,333 | $ | 71.24 | 555,034 | ||||||||
|
|
|
|
|
| |||||||
(1) Plans approved by stockholders include the Company's 2010 and 2015 Long-Term Incentive Plans. While certain share-based awards remain outstanding under the Company's 2010 Long-Term Incentive Plan, no future equity compensation awards may be granted under such plan.
(2) Column (a) includes (i) 38,148 shares that could be issued under performance stock units ("PSU") outstanding at August 31, 2016, and (ii) 60,899 shares that could be issued under restricted stock units ("RSU") outstanding at August 31, 2016. The PSUs are earned and Common Stock issued if certain predetermined performance criteria are met. Actual shares issued may be equal to, less than or greater than (but not more than 200 percent of) the number of outstanding PSUs included in column (a), depending on actual performance. The RSUs vest and are payable in Common Stock after the expiration of the time periods set forth in the related agreements. Column (b) does not take these PSU and RSU awards into account because they do not have an exercise price.
ITEM 13 - Certain Relationships and Related Transactions, and Director Independence
The information required by this Item is incorporated by reference to the discussion responsive thereto under the captions "Corporate Governance" and "Corporate Governance – Related Party Transactions " in the Proxy Statement.
ITEM 14 - Principal Accounting Fees and Services
The information required by this Item is incorporated by reference to the discussion responsive thereto under the caption "Ratification of Appointment of Independent Registered Public Accounting Firm" in the Proxy Statement.
69
PART IV
ITEM 15 - Exhibits, Financial Statement Schedules
(a)(1) Financial Statements
The following financial statements of Lindsay Corporation and Subsidiaries are included in Part II Item 8.
| Page | ||||
Report of Independent Registered Public Accounting Firm | 32 | |||
Consolidated Statements of Operations for the years ended August 31, 2016, 2015, and 2014 | 33 | |||
Consolidated Statements of Comprehensive Income for the years ended August 31, 2016, 2015, and 2014 | 34 | |||
Consolidated Balance Sheets as of August 31, 2016 and 2015 | 35 | |||
Consolidated Statements of Shareholders' Equity for the years ended August 31, 2016, 2015, and 2014 | 36 | |||
Consolidated Statements of Cash Flows for the years ended August 31, 2016, 2015, and 2014 | 37 | |||
Notes to Consolidated Financial Statements | 38-63 | |||
Valuation and Qualifying Accounts – Years ended August 31, 2016, 2015, and 2014 | 71 | |||
Financial statements and schedules other than those listed are omitted for the reason that they are not required, are not applicable or that equivalent information has been included in the financial statements or notes thereto.
70
(a)(2) Exhibit
Lindsay Corporation and Subsidiaries
VALUATION AND QUALIFYING ACCOUNTS
Years ended August 31, 2016, 2015, and 2014
| Additions | ||||||||||||||||||||
(in thousands) | Balance at beginning of period | Charges to costs and expenses | Charged to other accounts | Deductions | Balance at end of period | |||||||||||||||
Year ended August 31, 2016: | ||||||||||||||||||||
Deducted in the balance sheet from the | ||||||||||||||||||||
assets to which they apply: | ||||||||||||||||||||
Allowance for doubtful accounts (1) | $ | 9,706 | $ | 800 | $ | - | $ | 2,194 | $ | 8,312 | ||||||||||
Allowance for inventory obsolescence (2) | 4,405 | 1,262 | (30) | 980 | 4,656 | |||||||||||||||
Deferred tax asset valuation allowance (3) | 2,949 | - | - | 124 | 2,825 | |||||||||||||||
Year ended August 31, 2015: | ||||||||||||||||||||
Deducted in the balance sheet from the | ||||||||||||||||||||
assets to which they apply: | ||||||||||||||||||||
Allowance for doubtful accounts (1) | $ | 4,857 | $ | 5,840 | $ | - | $ | 991 | $ | 9,706 | ||||||||||
Allowance for inventory obsolescence (2) | 2,858 | 3,302 | (147) | 1,608 | 4,405 | |||||||||||||||
Deferred tax asset valuation allowance (3) | - | 2,949 | - | - | 2,949 | |||||||||||||||
Year ended August 31, 2014: | ||||||||||||||||||||
Deducted in the balance sheet from the | ||||||||||||||||||||
assets to which they apply: | ||||||||||||||||||||
Allowance for doubtful accounts (1) | $ | 2,853 | $ | 2,225 | $ | - | $ | 221 | $ | 4,857 | ||||||||||
Allowance for inventory obsolescence (2) | 3,089 | 698 | 11 | 940 | 2,858 | |||||||||||||||
Deferred tax asset valuation allowance (3) | - | - | - | - | - | |||||||||||||||
(1) Deductions consist of uncollectible items written off, less recoveries of items previously written off.
(2) Deductions consist of obsolete items sold or scrapped.
(3) Deductions consist of foreign exchange rate fluctuations.
(a)(3) Exhibits. The list of the Exhibits in the Exhibit Index is incorporated into this item by reference.
71
SIGNATURES
Pursuant to the requirements of Section 13 or 15(d) of the Securities Exchange Act of 1934, the registrant has duly caused this report to be signed on its behalf by the undersigned, thereunto duly authorized on this 18 th day of October, 2016.
| LINDSAY CORPORATION | ||||
| By: | /s/ BRIAN L. KETCHAM | |||
| Name: | Brian L. Ketcham | |||
| Title: | Vice President and Chief Financial Officer | |||
Pursuant to the requirements of the Securities Exchange Act of 1934, this report has been signed below by the following persons on behalf of the registrant and in the capacities indicated on this 18 th day of October, 2016.
/s/ RICHARD W. PAROD | Director, President and Chief Executive Officer | |||
| Richard W. Parod | (Principal Executive Officer) | |||
/s/ BRIAN L. KETCHAM | Vice President and Chief Financial Officer | |||
| Brian L. Ketcham | (Principal Financial Officer and Principal Accounting Officer) | |||
/s/ MICHAEL C. NAHL (1) | Chairman of the Board of Directors | |||
| Michael C. Nahl | ||||
/s/ ROBERT E. BRUNNER (1) | Director | |||
| Robert E. Brunner | ||||
/s/ MICHAEL N. CHRISTODOLOU (1) | Director | |||
| Michael N. Christodolou | ||||
/s/ W. THOMAS JAGODINSKI (1) | Director | |||
| W. Thomas Jagodinski | ||||
/s/ DAVID B. RAYBURN (1) | Director | |||
| David B. Rayburn | ||||
/s/ MICHAEL D.WALTER (1) | Director | |||
| Michael D. Walter | ||||
/s/ WILLIAM F. WELSH II (1) | Director | |||
| William F. Welsh II | ||||
(1) By: /s/ RICHARD W. PAROD | ||||
| Richard W. Parod, Attorney -In -Fact | ||||
72
EXHIBIT INDEX
Exhibit | Description | |
| 2.1 | Agreement and Plan of Merger, dated November 4, 2014, by and between Lindsay Corporation, Matterhorn Merger Sub, Inc. and Elecsys Corporation, incorporated by reference to Exhibit 2.1 of the Company's Current Report on Form 8-K filed on November 4, 2014. | |
| 3.1 | Restated Certificate of Incorporation of the Company, incorporated by reference to Exhibit 3.1 to the Company's Current Report on Form 8-K filed on December 14, 2006. | |
| 3.2 | Amended and Restated By-Laws of the Company, incorporated by reference to Exhibit 3.1 to the Company's Current Report on Form 8-K filed on May 5, 2014. | |
| 4.1 | Specimen Form of Common Stock Certificate incorporated by reference to Exhibit 4(a) to the Company's Quarterly Report on Form 10-Q for the fiscal quarter ended November 30, 2006. | |
| 10.1 | Lindsay Corporation 2015 Long-Term Incentive Plan and forms of award agreements, incorporated by reference to Exhibit 10.2 to the Company's Quarterly Report on Form 10-Q for the fiscal quarter ended November 30, 2015.† | |
| 10.2 | Lindsay Corporation 2010 Long-Term Incentive Plan and forms of award agreements, incorporated by reference to Exhibit 10.2 to the Company's Quarterly Report on Form 10-Q for the fiscal quarter ended November 30, 2011.† | |
| 10.3 | Lindsay Corporation Management Incentive Umbrella Plan, incorporated by reference to Exhibit 10.2 to the Company's Quarterly Report on Form 10-Q for the fiscal quarter ended February 28, 2014.† | |
| 10.4** | Lindsay Corporation Management Incentive Plan (MIP), 2016 Plan Year, incorporated by reference to Exhibit 10.1 to the Company's Quarterly Report on Form 10-Q for the fiscal quarter ended November 30, 2015.† | |
| 10.5 | Form of Indemnification Agreement between the Company and its Officers and Directors, incorporated by reference to Exhibit 10.2 to the Company's Quarterly Report on Form 10-Q for the fiscal quarter ended November 30, 2008.† | |
| 10.6 | Employment Agreement between the Company and Richard W. Parod effective March 8, 2000, incorporated by reference to Exhibit 10(a) to the Company's Report on Form 10-Q for the fiscal quarter ended May 31, 2000.† | |
| 10.7 | First Amendment to Employment Agreement, dated May 2, 2003, between the Company and Richard W. Parod, incorporated by reference to Exhibit 10 (a) of Amendment No. 1 to the Company's Report on Form 10-Q for the fiscal quarter ended May 31, 2003.† | |
| 10.8 | Second Amendment to Employment Agreement, dated December 22, 2004, between the Company and Richard W. Parod, incorporated by reference to Exhibit 10(a) to the Company's Current Report on Form 8-K filed on December 27, 2004.† | |
| 10.9 | Third Amendment to Employment Agreement, dated March 20, 2007, between the Company and Richard W. Parod, incorporated by reference to Exhibit 10.1 to the Company's Current Report on Form 8-K filed on March 22, 2007.† | |
| 10.10 | Fourth Amendment to Employment Agreement, dated December 22, 2008, between the Company and Richard W. Parod, incorporated by reference to Exhibit 10.2 of the Company's Current Report on Form 8-K filed on January 30, 2009.† | |
| 10.11 | Fifth Amendment to Employment Agreement, dated January 26, 2009, between the Company and Richard W. Parod, incorporated by reference to Exhibit 10.1 of the Company's Current Report on Form 8-K filed on January 30, 2009.† | |
| 10.12 | Restated Sixth Amendment, effective February 25, 2010, by and between the Company and Richard W. Parod, incorporated by reference to Exhibit 10.2 of the Company's Quarterly Report on Form 10-Q for the fiscal quarter ended February 28, 2010.† | |
73
Exhibit | Description | |
| 10.13 | Seventh Amendment to Employment Agreement, dated January 31, 2011, between the Company and Richard W. Parod, incorporated by reference to Exhibit 10.1 of the Company's Current Report on Form 8-K filed on February 3, 2011.† | |
| 10.14 | Eighth Amendment to Employment Agreement, dated November 29, 2012, between the Company and Richard W. Parod, incorporated by reference to Exhibit 10.1 of the Company's Current Report on Form 8-K filed on December 4, 2012. † | |
| 10.15 | Ninth Amendment to Employment Agreement, dated January 26, 2015, between the Company and Richard W. Parod, incorporated by reference to Exhibit 10.1 of the Company's Current Report on Form 8-K filed on January 27, 2015. † | |
| 10.16 | Employment Agreement, dated May 5, 2011, between the Company and James Raabe, incorporated by reference to Exhibit 10.1 of the Company's Current Report on Form 8-K filed on May 10, 2011.† | |
| 10.17 | Employment Agreement dated February 19, 2009, by and between the Company and David B. Downing, incorporated by reference to Exhibit 10.1 of the Company's Current Report on Form 8-K filed on February 25, 2009.† | |
| 10.18 | Amended and Restated Revolving Credit Agreement, dated February 18, 2015, by and between the Company and Wells Fargo Bank, National Association, incorporated by reference to Exhibit 10.2 to the Company's Current Report on Form 8-K filed on February 20, 2015. | |
| 10.19 | Note Purchase Agreement, dated as of February 19, 2015, by and among the Company and the purchasers named therein, incorporated by reference to Exhibit 10.1 to the Company's Current Report on Form 8-K filed on February 20, 2015. | |
| 10.20 | Lindsay Corporation Policy on Payment of Directors Fees and Expenses, incorporated by reference to Exhibit 10.2 to the Company's Quarterly Report on Form 10-Q for the fiscal quarter ended November 30, 2013. | |
| 10.21 | Employment Agreement, dated May 9, 2016, between the Company and Randy A. Wood, incorporated by reference to Exhibit 10.1 to the Company's Quarterly Report on Form 10-Q for the fiscal quarter ended May 31, 2016.† | |
| 10.22 | Employment Agreement, dated April 5, 2016, between the Company and Brian L. Ketcham, incorporated by reference to Exhibit 10.1 of the Company's Current Report on Form 8-K filed on April 5, 2016.† | |
| 21* | Subsidiaries of the Company | |
| 23* | Consent of KPMG LLP | |
| 24* | The Power of Attorney authorizing Richard W. Parod to sign the Annual Report on Form 10-K for fiscal 2016 on behalf of non-management directors. | |
| 31.1* | Certification of Chief Executive Officer pursuant to Section 302 of the Sarbanes-Oxley Act of 2002 18 U.S.C. Section 1350. | |
| 31.2* | Certification of Chief Financial Officer pursuant to Section 302 of the Sarbanes-Oxley Act of 2002 18 U.S.C. Section 1350. | |
| 32* | Certification of Chief Executive Officer and Chief Financial Officer pursuant to Section 906 of the Sarbanes-Oxley Act of 2002 18 U.S.C. Section 1350. | |
| 101* | Interactive Data Files. | |
† Management contract or compensatory plan or arrangement required to be filed as an exhibit hereto pursuant to Item 15(b) of Form 10-K.
* Filed herein.
** Certain confidential portions of this Exhibit were omitted by means of redacting a portion of the text. This Exhibit has been filed separately with the Secretary of the Commission with the redacted text pursuant to the Company's application requesting confidential treatment under Rule 24b-2 of the Securities Exchange Act of 1934.
74